Embed Size (px)
Citation preview
in
by Frank Braconi, Ph.D.
Chief Economist
WINTER 2011
MuNIcIpal EMployEE coMpENsaTIoN
NEW yoRK cITy
New York City ComptrollerJohn C. Liu
in
MuNIcIpal EMployEE coMpENsaTIoN
NEW yoRK cITyby
Frank Braconi, Ph.D. Chief Economist
1
3
9
17
28
INTRoducTIoN
JoHN c. lIuComptroller
First Deputy ComptrollerEric V. Eve
Deputy Comptroller for Accountancy & Budget
Simcha Felder
Assistant Comptroller for Budget & Chief Policy Officer
Ari Hoffnung
Executive Director, BudgetJonathan Rosenberg
Executive Director, Corporate GovernanceMichael Garland
Chief EconomistFrank Braconi, Ph.D.
Bureau Chief, Fiscal & Budget Studies Eng-Kai Tan
Bureau Chief, Financial AnalysisKirk Parks
Assistant Bureau Chief, Fiscal & Budget StudiesManny Kwan
Senior Advisor to the ComptrollerSharon Lee
Mercy Asare Kettly Bastien
Amitabha BasuMillicent Budhai-Robinson
Rosa Charles John Choe
Carmen Cruz Robert DeLaurentis
Andrew Elcock Peter E. Flynn
Jacqueline GoldMichele Griffin Michael Hecht
Farid HeydarpourDahong Huang
Amna KhanMabel LawPui Chi Law
Marcia MurphyPaula Murrien
Albert NgConnor Osetek
Andrew RosenthalSusan Scheer
Kenneth SylvesterMichelle Taylor
Orlando Vasquez
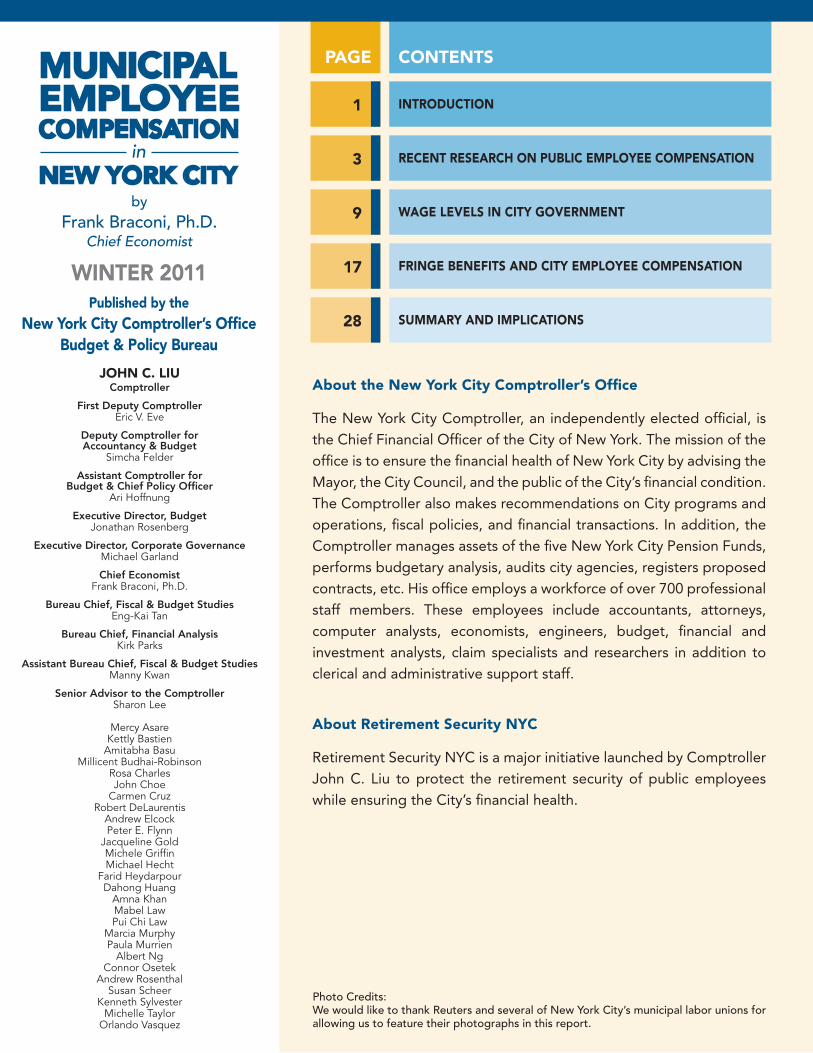
about the New york city comptroller’s office
The New York City Comptroller, an independently elected official, is the Chief Financial Officer of the City of New York. The mission of the office is to ensure the financial health of New York City by advising the Mayor, the City Council, and the public of the City’s financial condition. The Comptroller also makes recommendations on City programs and operations, fiscal policies, and financial transactions. In addition, the Comptroller manages assets of the five New York City Pension Funds, performs budgetary analysis, audits city agencies, registers proposed contracts, etc. His office employs a workforce of over 700 professional staff members. These employees include accountants, attorneys, computer analysts, economists, engineers, budget, financial and investment analysts, claim specialists and researchers in addition to clerical and administrative support staff.
about Retirement security Nyc
Retirement Security NYC is a major initiative launched by Comptroller John C. Liu to protect the retirement security of public employees while ensuring the City’s financial health.
coNTENTspagE
REcENT REsEaRcH oN publIc EMployEE coMpENsaTIoN
WagE lEvEls IN cITy govERNMENT
FRINgE bENEFITs aNd cITy EMployEE coMpENsaTIoN
suMMaRy aNd IMplIcaTIoNs
WINTER 2011published by the
New york city comptroller’s office budget & policy bureau
Photo Credits:We would like to thank Reuters and several of New York City’s municipal labor unions for allowing us to feature their photographs in this report.

1
Office of the New York City Comptroller, John C. Liu 1
In the aftermath of the disastrous recession of 2007-2009, state and local governments throughout the country have been forced to cut budgets, reduce services to the public, and increase their contributions to employee pension plans. In this environment, it is not surprising that renewed attention has been focused on public sector pay levels and benefits.
While some columnists and politicians have painted public sector employees as “the new fat cats” or the “new privileged class,” the public at large appears to see public sector compensation in a more nuanced light.1 For example, according to a poll published by Rasmussen Reports, 59 percent of Americans think that the average government worker earns more annually than the average taxpayer. About 51 percent of poll respondents think that government workers are paid too much, while 39 percent think they’re paid too little or about right.2 When asked how government workers are paid relative to comparable private sector workers, only 46 percent believe they are paid more, while 32 percent believe they are paid the same or less. Moreover, 71 percent believe that government workers should be paid the same as comparable workers in the private sector, and when asked whether they would support a plan to cut the pay of all non-military federal workers by 10 percent, more respondents opposed than favor the idea.3
The complexity of public opinion about government employee compensation befits an issue that affects over 17 percent of all workers and, either as taxpayers or service recipients, virtually all citizens. Compensation practices differ among the federal government, the various states, and the thousands of county and local governments across the country. Hundreds of occupational categories are involved, many of which have no direct private-sector equivalents. When compensation is defined to include wages, health insurance, sick time, vacation time, and retirement and other non-wage benefits, quantitative comparisons become exceedingly difficult to make.
1 Ben Smith and Maggie Haberman: “Pols Turn on Labor Unions,” Politico.com, June 6, 2010; Fred Barnes: “The New Fat Cats: The indefensible pensions of public sector employees,” The Weekly Standard, May 3, 2010.
2 Rasmussen Reports, December 15, 2009.
3 Rasmussen Reports, May 5, 2010; Rasmussen Reports, June 10, 2010.
INTRoducTIoN
Municipal Employee Compensation in New York City: Introduction
2 March, 2011
Nevertheless, the determination of appro-priate compensation for public employees is critical for governmental entities, and espe-cially for large and complex employers such as the City of New York. Employee compen-sation costs are the principal expense of lo-cal government; in Fiscal Year 2011, “per-sonal service” costs—wages and salaries, pensions, and employee fringe benefits—will constitute over 55 percent of the City’s budget, or more than $36.9 billion. Every one-percent increase in employee compen-sation costs the City—and ultimately its tax-payers—about $369 million. The City conse-quently has an overriding budgetary interest in controlling employee compensation costs, as well as an obligation to its taxpayers to use their tax dollars wisely and frugally.
However, the City’s compensation policies have another side. The City must provide services to the public effectively and efficiently, and as all employers know, the cheapest labor is often not the most cost-effective labor. The public would not be well served if it was provided with under qualified teachers, incompetent police officers or incapable firefighters. Employee compensation packages must be sufficient to allow municipal agencies to attract and retain the workers needed to fulfill their missions.
Furthermore, there are political and policy questions that only the public at large can answer through the democratic process. Would the public wish to see government emulate the private sector’s labor practices in all respects, including practices that may be legal but that could be considered arbitrary, harsh, or exploitative? Or rather, would the public prefer that government behave as a “model employer,” adhering to community standards of decency, fairness and equity? For example, most Americans believe that the pay differentials between corporate CEOs and rank-and-file workers have grown too large, and probably would not want to see those disparities replicated in public agencies that they finance with their tax dollars.4 Economic analysis can inform such questions about public employee compensation, but only voters can provide the answers.
4 See, for example, Benjamin I. Page and Lawrence R. Jacobs: Class War? What Americans Really Think About Economic Inequality. University of Chicago Press, 2009.
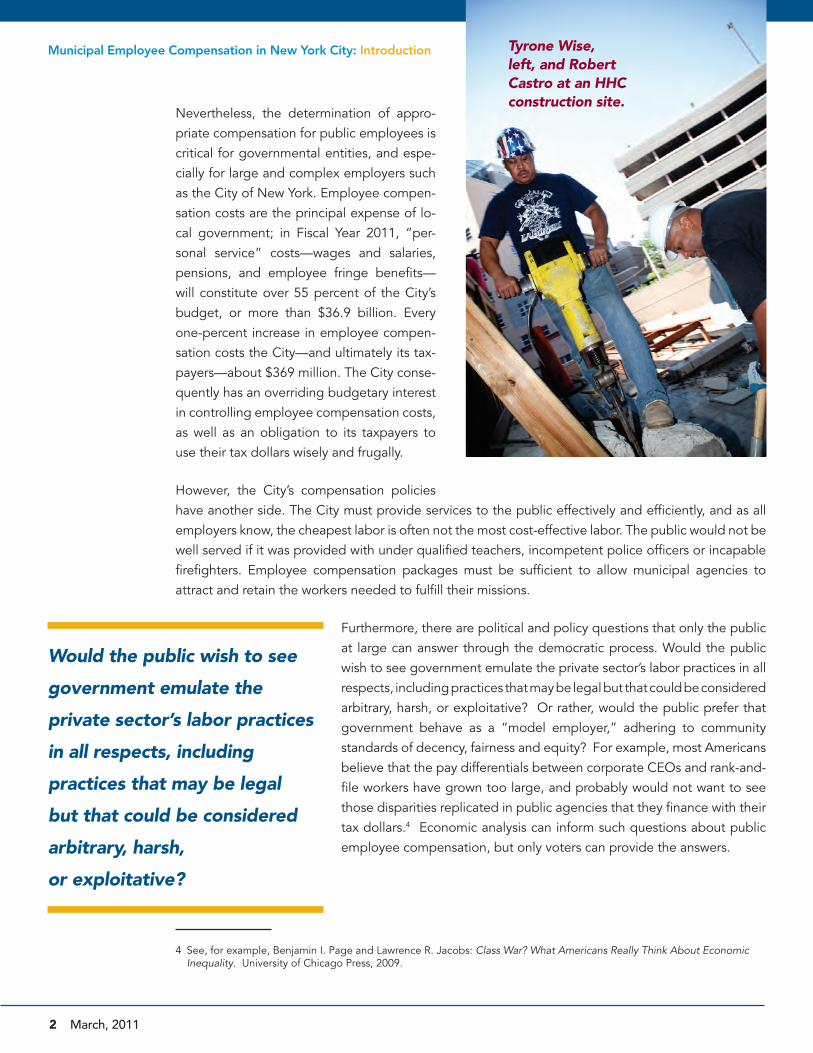
Tyrone Wise,left, and RobertCastro at an HHCconstruction site.
Would the public wish to see
government emulate the
private sector’s labor practices
in all respects, including
practices that may be legal
but that could be considered
arbitrary, harsh,
or exploitative?
Office of the New York City Comptroller, John C. Liu 3
2At the national level, a number of recent studies have addressed the issue of public employee compensation and have contributed to the public debate. Notable among them is a recent study prepared by Keith A. Bender and John S. Heywood of the University of Wisconsin for The Center for State and Local Government Excellence and The National Institute on Retirement Security.5 In general, their study found that, when relevant worker characteristics are controlled for, state government employees earn 11 percent less and local government employees earn 12 less than comparable private-sector workers. The authors estimated that when non-wage benefits are included, the compensation differential falls to 6.8 percent and 7.4 percent for state and local government workers, respectively. Andrew G. Biggs of the American Enterprise Institute and Jason Richwine of The Heritage Foundation have disputed those findings, arguing that Bender and Heywood did not adequately account for unfunded state and local pension liabilities and for the higher rates of union membership among government workers.6
A similar study was recently issued by the Center for Economic and Policy Research.7 CEPR economist John Schmitt found that, when relevant factors such as age and education are controlled for, state and local government workers earn 4 percent less, on average, than their private sector counterparts. The public-private wage differential is greater for men than for women, and greater for high-wage workers than for low-wage workers, who actually earn more in government occupations. The CEPR study did not attempt to factor in the value of pensions, health insurance, and other non-wage benefits.
Another recent study by Jeffrey Keefe of Rutgers University and published by The Economic Policy Institute (EPI), used a similar approach to those cited above but made a special effort to control for employer size and hours worked. The EPI study also adjusted for non-wage benefits using the Department of Labor’s Employer Costs for Employee Compensation survey. The study found that, on average, total compensation of state government workers is 7.6 percent less than that of comparable workers in private sector, and that of local government workers is 1.8 percent less.
5 Keith A. Bender and John S. Heywood: “Out of Balance: Comparing Public and Private Sector Compensation over 20 Years.” Center for State and Local Government Excellence and National Institute on Retirement Security, April 2010.
6 Andrew G. Biggs: “Are Government Workers Underpaid. No.” The American, June 9, 2010. Andrew G. Biggs: “Public-Private Pay Divide: Part II.” The American, June 16, 2010.
7 John Schmitt: “The Wage Penalty for State and Local Government Employees.” Center for Economic and Policy Re-search, May 2010.
REcENT REsEaRcH oN publIc EMployEE
coMpENsaTIoN
...the researchers also agree that lower-
education and/or lower-wage workers are
paid relatively better in the public sector,
and that more highly educated, high-wage
workers are paid relatively worse.
4 March, 2011
The findings of these recent policy institute researchers are roughly consistent with existing academic research. For example, in a 2002 paper George J. Borjas found that, when controlling for relevant factors, male and female state and local government employees earned approximately 10 percent less than their counterparts in the private sector.8 Borjas also found that the wage distribution was more “compressed” in the public sector and had become more so over time—in other words, low-skill workers typically earn more, and high-skill workers less, in the public sector compared to the private sector. This, he concluded, made it harder for the public sector to attract high-skill workers.
These recent studies all agree that the unadjusted average wages of public sector workers are higher than the average wages of private sector workers, and that the primary cause of the difference is the higher average educational attainment (and to a lesser extent, higher age) of government workers. When wages are adjusted to account for education, age and other relevant demographic factors, the wages of federal civilian workers are close to or slightly above those of their private sector counterparts, and the wages of state and local workers appear to be 5
to 10 percent lower than comparable workers in the private sector. To the degree that they explore the issue, the researchers also agree that lower-education and/or lower-wage workers are paid relatively better in the public sector, and that more highly educated, high-wage workers are paid relatively worse. Researchers show less agreement on the degree to which consideration of non-wage benefits equalizes total compensation between public- and private-sector workers.
All of the studies cited above use either Census or Current Population Survey (CPS) data to determine wage levels and to adjust, using regression analysis, for certain demographic characteristics of workers. An alternative to that econometric approach uses occupational pay data to compare public and private sector compensation for specific occupations. Since particular occupations usually require a certain type of education, experience or skills (for example, those of attorneys, accountants or carpenters), comparing wages within job categories indirectly controls for certain worker traits. The shortcoming of the approach is that it is only applicable to occupations that are common to the public and private sectors. It does not address what, say, firefighters or police officers might earn if they applied their education and skills to a different career in the private sector.
The U.S. Bureau of Labor Statistics annually publishes results from the National Compensation Survey (NCS), which is a common source of occupation-by-occupation compensation data used by researchers and is often cited by the media. The most recent national NCS data were published in June 2010, covering the period December 2008-January 2010. According to NCS, the average annual wages of all full-time state and local government employees in the country was $48,151, compared to an average for all full-time private sector workers of $44,223. However, those broad averages mask a more complex picture of how pay scales differ within the public and private sectors.
8 George J. Borjas: “The Wage Structure and the Sorting of Workers Into the Public Sector.” National Bureau of Economic Research, Working Paper 9313. October 2002.
Municipal Employee Compensation in New York City: Recent Research on Public Employee Compensation
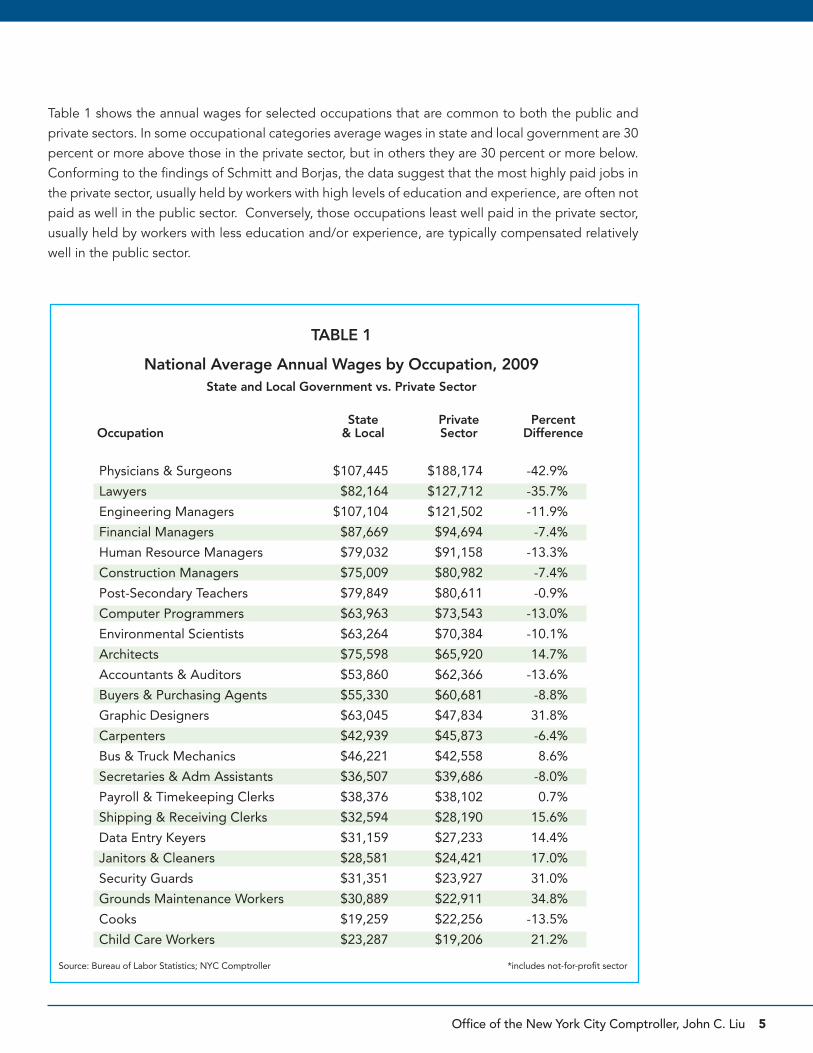
Table 1 shows the annual wages for selected occupations that are common to both the public and private sectors. In some occupational categories average wages in state and local government are 30 percent or more above those in the private sector, but in others they are 30 percent or more below. Conforming to the findings of Schmitt and Borjas, the data suggest that the most highly paid jobs in the private sector, usually held by workers with high levels of education and experience, are often not paid as well in the public sector. Conversely, those occupations least well paid in the private sector, usually held by workers with less education and/or experience, are typically compensated relatively well in the public sector.
Office of the New York City Comptroller, John C. Liu 5
Physicians & Surgeons $107,445 $188,174 -42.9%
Lawyers $82,164 $127,712 -35.7%
Engineering Managers $107,104 $121,502 -11.9%
Financial Managers $87,669 $94,694 -7.4%
Human Resource Managers $79,032 $91,158 -13.3%
Construction Managers $75,009 $80,982 -7.4%
Post-Secondary Teachers $79,849 $80,611 -0.9%
Computer Programmers $63,963 $73,543 -13.0%
Environmental Scientists $63,264 $70,384 -10.1%
Architects $75,598 $65,920 14.7%
Accountants & Auditors $53,860 $62,366 -13.6%
Buyers & Purchasing Agents $55,330 $60,681 -8.8%
Graphic Designers $63,045 $47,834 31.8%
Carpenters $42,939 $45,873 -6.4%
Bus & Truck Mechanics $46,221 $42,558 8.6%
Secretaries & Adm Assistants $36,507 $39,686 -8.0%
Payroll & Timekeeping Clerks $38,376 $38,102 0.7%
Shipping & Receiving Clerks $32,594 $28,190 15.6%
Data Entry Keyers $31,159 $27,233 14.4%
Janitors & Cleaners $28,581 $24,421 17.0%
Security Guards $31,351 $23,927 31.0%
Grounds Maintenance Workers $30,889 $22,911 34.8%
Cooks $19,259 $22,256 -13.5%
Child Care Workers $23,287 $19,206 21.2%
TABLE 1
National Average Annual Wages by Occupation, 2009State and Local Government vs. Private Sector
Source: Bureau of Labor Statistics; NYC Comptroller *includes not-for-profit sector
State Private PercentOccupation & Local Sector Difference
6 March, 2011
NCS data have sometimes been used to draw conclusions about public-private pay differentials in New York State and New York City. For example, a 2005 Citizens Budget Commission report9 used a regional subset of NCS data to determine whether wage differentials for state and city employees offset the more generous pension benefits the study found those workers to enjoy.
For the purposes of evaluating New York City’s employee compensation policies, the CBC approach has two significant drawbacks. Most obviously, the data pertain to state and local governments in the entire New York-Newark-Bridgeport, NY-NJ-CT-PA Combined Statistical Area. So, while it improves on the national data by adjusting for regional wage levels, it still includes state workers from four states, county workers from 26 counties, and local workers from hundreds of towns and municipalities. We estimate that employees of the City of New York (including those working for local public authorities) represent less than 40 percent of that sample.
A second problem is the basis of comparison. In the CBC
study, state and local workers are compared to all private sector workers. However, workers within the private sector, even within specific occupations, are themselves segmented in several ways, most dramatically by firm size. Labor economists have consistently found that large firms pay their employees substantially more than small firms pay their employees to do similar jobs.10
9 “The Case for Redesigning Retirement Benefits for New York’s Public Employees.” Citizens Budget Commission. April, 2005.
10 Richard A. Lester: “Pay Differentials by Size of Establishment,” Industrial Relations 7, October 1967; Stanley H. Masters, “An Interindustry Analysis of Wages and Plant Size,” Review of Economics and Statistics, Vol. 51, No. 3, August 1969; Wesley Mellow, “Employer Size and Wages,” Review of Economics and Statistics, Vol. 64, No. 3, August 1982; Andrew Weiss and Henry J. Landau, “Wages, Hiring Standards, and Firm Size,” Journal of Labor Economics, Vol. 2, Nov. 4, October 1984; Charles Brown and James Medoff, “The Employer Size-Wage Effect,” Journal of Political Economy, Vol. 97, no. 5, October 1989; Martin E. Personick and Carl B. Barsky, “White-collar pay levels linked to corporate work force size,” Monthly Labor Review, May 1982.
Municipal Employee Compensation in New York City: Recent Research on Public Employee Compensation
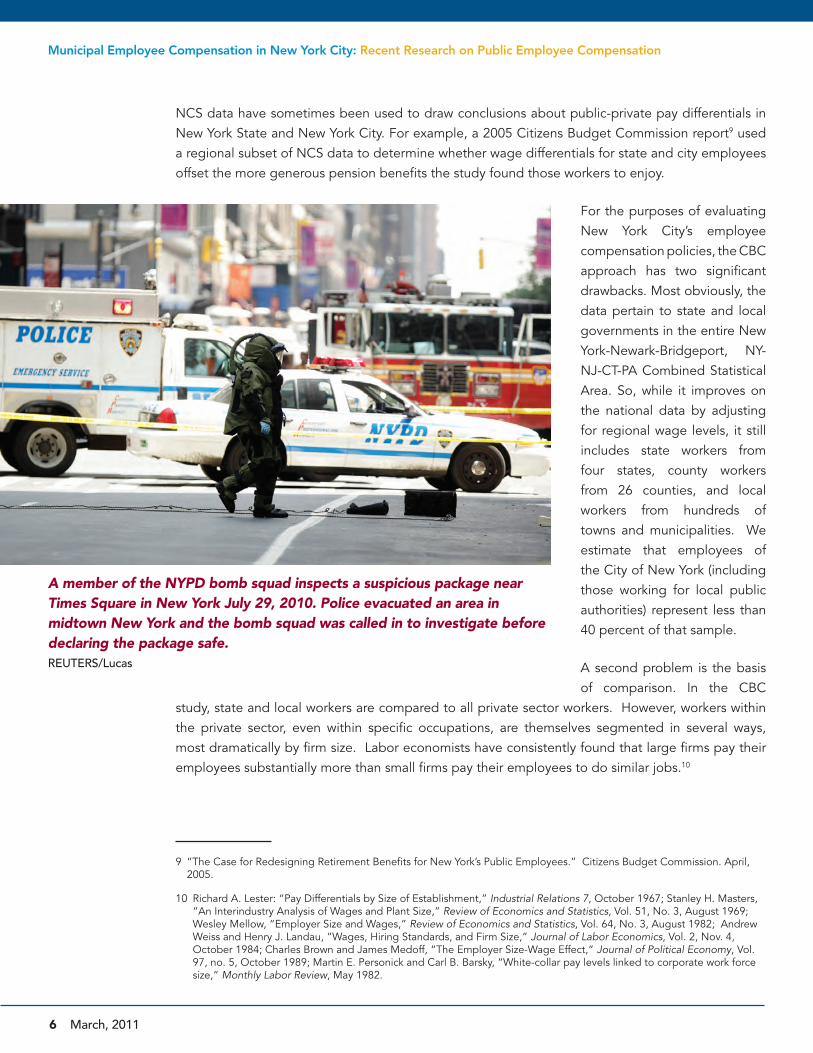
A member of the NYPD bomb squad inspects a suspicious package near Times Square in New York July 29, 2010. Police evacuated an area in midtown New York and the bomb squad was called in to investigate before declaring the package safe.REUTERS/Lucas
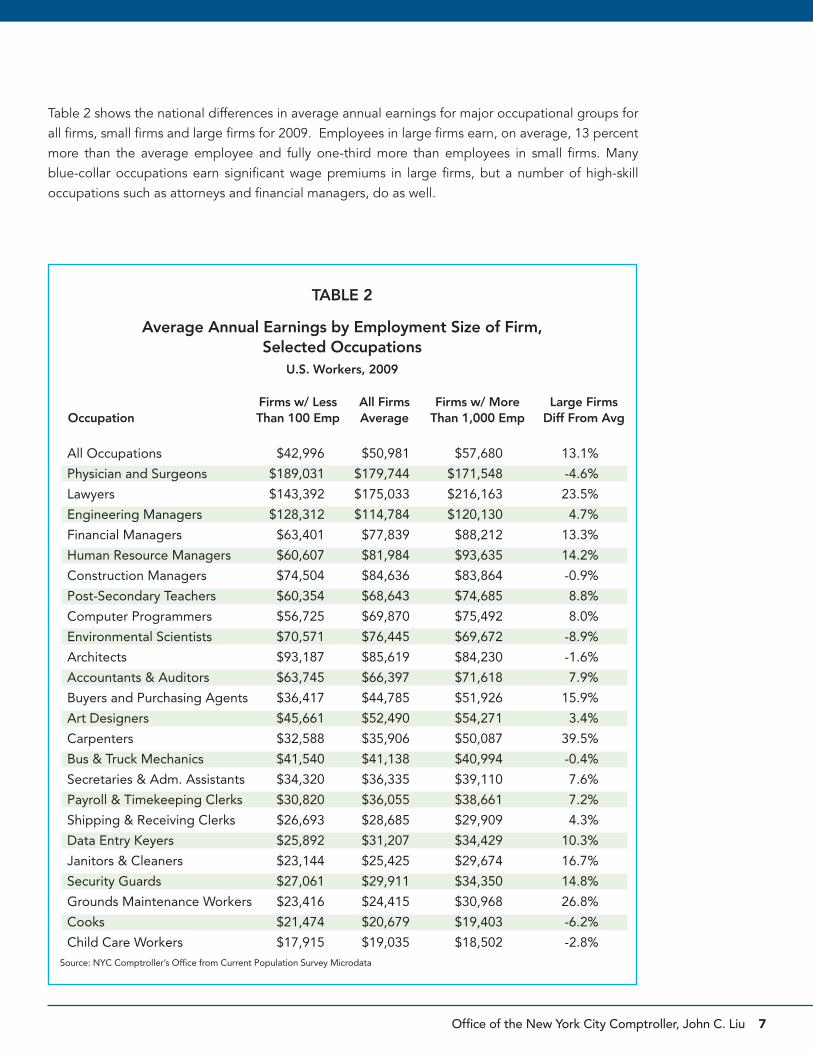
Table 2 shows the national differences in average annual earnings for major occupational groups for all firms, small firms and large firms for 2009. Employees in large firms earn, on average, 13 percent more than the average employee and fully one-third more than employees in small firms. Many blue-collar occupations earn significant wage premiums in large firms, but a number of high-skill occupations such as attorneys and financial managers, do as well.
Office of the New York City Comptroller, John C. Liu 7
TABLE 2
Average Annual Earnings by Employment Size of Firm, Selected Occupations
U.S. Workers, 2009
Firms w/ Less All Firms Firms w/ More Large FirmsOccupation Than 100 Emp Average Than 1,000 Emp Diff From Avg
All Occupations $42,996 $50,981 $57,680 13.1%
Physician and Surgeons $189,031 $179,744 $171,548 -4.6%
Lawyers $143,392 $175,033 $216,163 23.5%
Engineering Managers $128,312 $114,784 $120,130 4.7%
Financial Managers $63,401 $77,839 $88,212 13.3%
Human Resource Managers $60,607 $81,984 $93,635 14.2%
Construction Managers $74,504 $84,636 $83,864 -0.9%
Post-Secondary Teachers $60,354 $68,643 $74,685 8.8%
Computer Programmers $56,725 $69,870 $75,492 8.0%
Environmental Scientists $70,571 $76,445 $69,672 -8.9%
Architects $93,187 $85,619 $84,230 -1.6%
Accountants & Auditors $63,745 $66,397 $71,618 7.9%
Buyers and Purchasing Agents $36,417 $44,785 $51,926 15.9%
Art Designers $45,661 $52,490 $54,271 3.4%
Carpenters $32,588 $35,906 $50,087 39.5%
Bus & Truck Mechanics $41,540 $41,138 $40,994 -0.4%
Secretaries & Adm. Assistants $34,320 $36,335 $39,110 7.6%
Payroll & Timekeeping Clerks $30,820 $36,055 $38,661 7.2%
Shipping & Receiving Clerks $26,693 $28,685 $29,909 4.3%
Data Entry Keyers $25,892 $31,207 $34,429 10.3%
Janitors & Cleaners $23,144 $25,425 $29,674 16.7%
Security Guards $27,061 $29,911 $34,350 14.8%
Grounds Maintenance Workers $23,416 $24,415 $30,968 26.8%
Cooks $21,474 $20,679 $19,403 -6.2%
Child Care Workers $17,915 $19,035 $18,502 -2.8%Source: NYC Comptroller’s Office from Current Population Survey Microdata
8 March, 2011
Municipal Employee Compensation in New York City: Recent Research on Public Employee Compensation
The reason for those differences is somewhat of a puzzle. Presumably, large firms would not want to pay wages higher than necessary to acquire and retain the workforce they need. A higher level of unionization in large firms accounts for some of the large-firm premium, but significant differences exist even controlling for unionization. Conventional economic theory suggests that large firms are either hiring “higher-quality” workers within occupational categories, or that working in small firms offers non-pecuniary benefits that large firms must offset with higher wage offers. Less
conventional theories focus on the “internal labor markets” of large firms and the techniques of employee motivation and control that must be employed by large organizations. Whatever the true combination of reasons, economic logic says that large firms pay wage premiums because it is
efficient for them to do so.
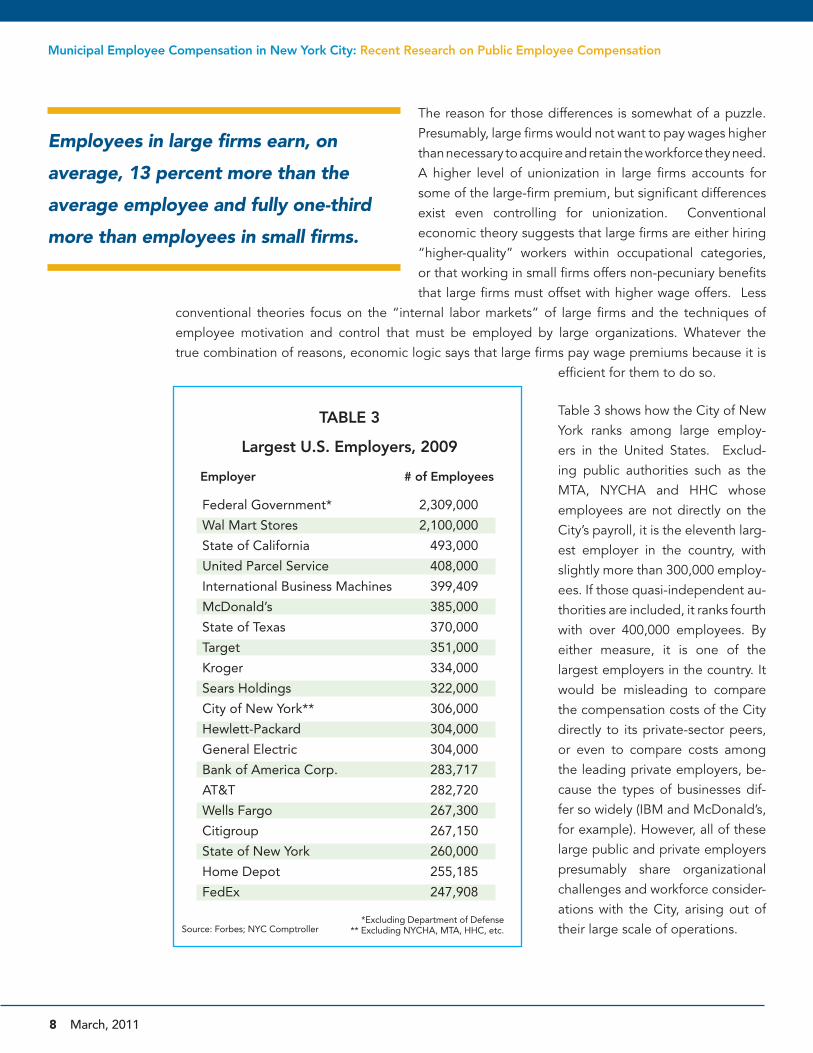
Table 3 shows how the City of New York ranks among large employ-ers in the United States. Exclud-ing public authorities such as the MTA, NYCHA and HHC whose employees are not directly on the City’s payroll, it is the eleventh larg-est employer in the country, with slightly more than 300,000 employ-ees. If those quasi-independent au-thorities are included, it ranks fourth with over 400,000 employees. By either measure, it is one of the largest employers in the country. It would be misleading to compare the compensation costs of the City directly to its private-sector peers, or even to compare costs among the leading private employers, be-cause the types of businesses dif-fer so widely (IBM and McDonald’s, for example). However, all of these large public and private employers presumably share organizational challenges and workforce consider-ations with the City, arising out of their large scale of operations.
Federal Government* 2,309,000
Wal Mart Stores 2,100,000
State of California 493,000
United Parcel Service 408,000
International Business Machines 399,409
McDonald’s 385,000
State of Texas 370,000
Target 351,000
Kroger 334,000
Sears Holdings 322,000
City of New York** 306,000
Hewlett-Packard 304,000
General Electric 304,000
Bank of America Corp. 283,717
AT&T 282,720
Wells Fargo 267,300
Citigroup 267,150
State of New York 260,000
Home Depot 255,185
FedEx 247,908
TABLE 3
Largest U.S. Employers, 2009
Employer # of Employees
Source: Forbes; NYC Comptroller*Excluding Department of Defense
** Excluding NYCHA, MTA, HHC, etc.
Employees in large firms earn, on
average, 13 percent more than the
average employee and fully one-third
more than employees in small firms.
Office of the New York City Comptroller, John C. Liu 9
3In an effort to inform the discussion of public sector compensation policies, the Comptroller’s Office recently performed a new analysis of the City’s wage and salary levels.
summary Wage comparisons
Our analysis used microdata from the Census Bureau’s American Community Survey (ACS) for 2006-2008. The ACS is a self-reported survey that provides similar data to the CPS, which has been used in other research described earlier. A major advantage of the ACS is that it has a much larger sample size that the CPS; when three years of data were pooled, it provided a sample of 98,705 individuals who worked in New York City during that period. Of that sample, 11,334 respondents reported that they worked for local government and 72,445 reported that they worked for private employers (including private not-for-profit employers). The statistically weighted proportions were close to what was expected based on other employment data. Unless otherwise specified, the data
on City employment includes people who worked in public authorities and independent agencies, as well as employees who work directly for the City on its regular payroll.
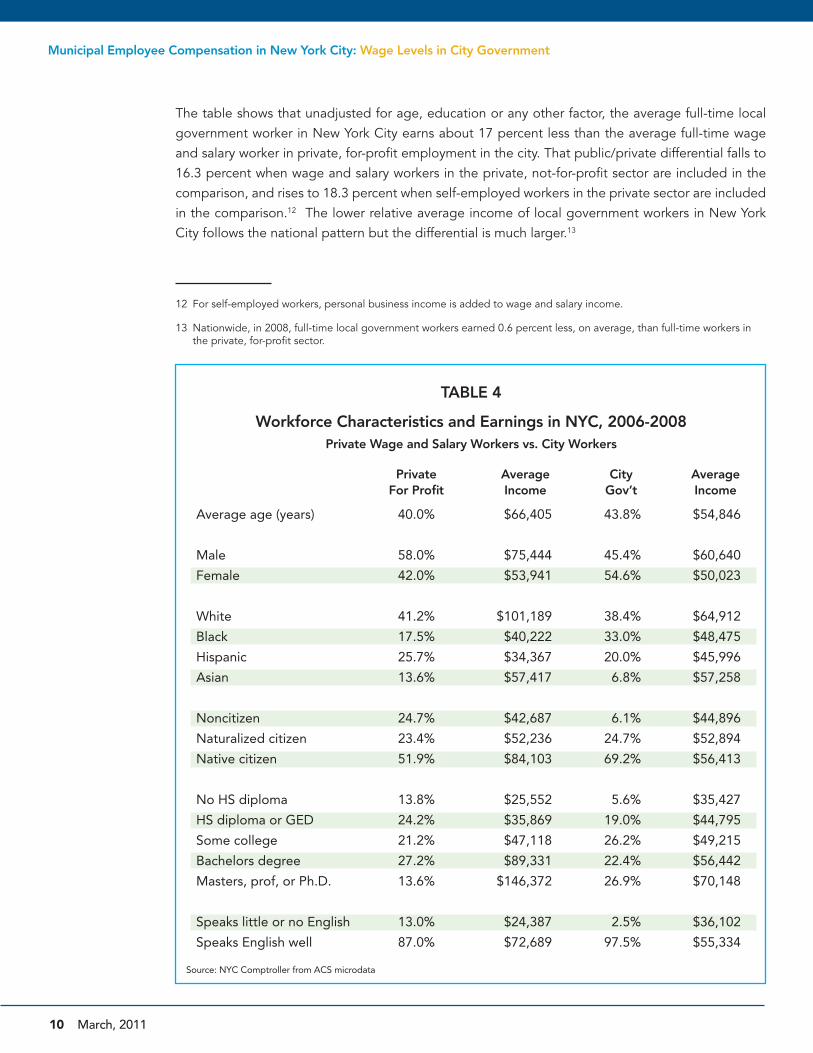
Table 4 shows summary statistics for wage and salary private sector workers working for for-profit firms, and for workers in city government, during the period 2006 to 2008.11 Both ACS subsamples apply only to workers who are employed full time and work in New York City. The average annual wage or salary income is presented for each demographic and skill classification.
11 The sorting criteria for “City Government Workers” was that the respondent reported that he/she worked for local gov-ernment and their place of employment was New York City.
WagE lEvEls IN cITy govERNMENT
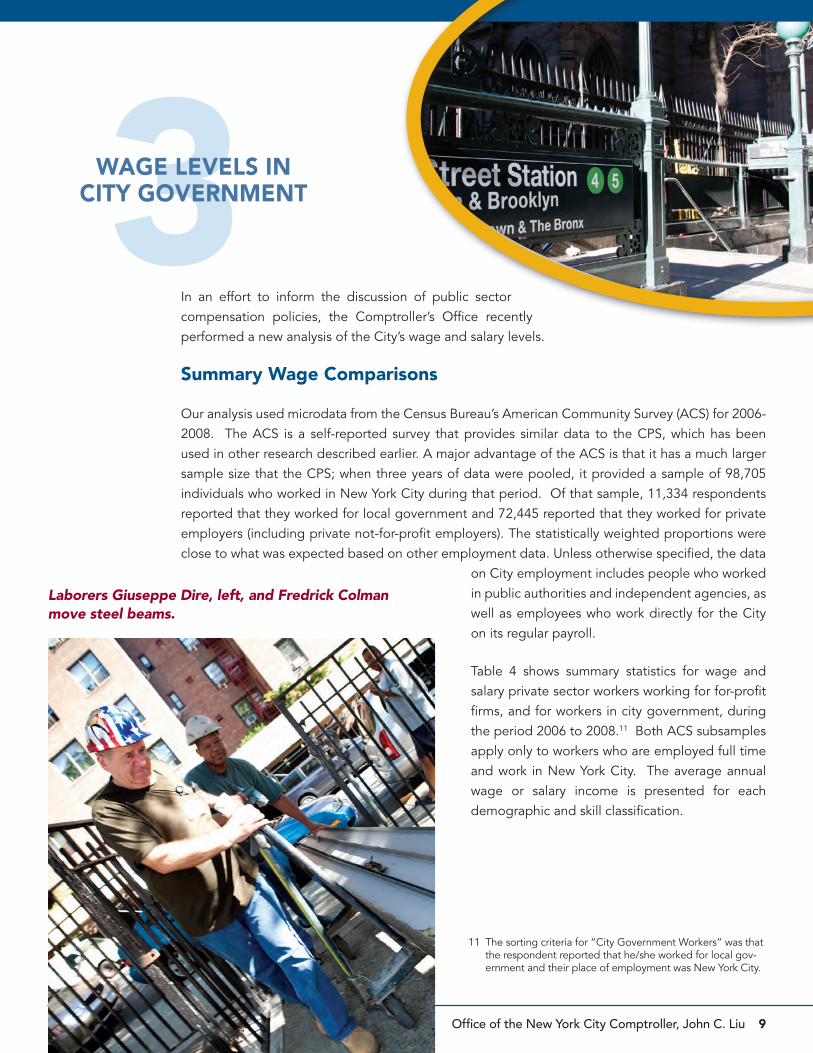
Laborers Giuseppe Dire, left, and Fredrick Colman move steel beams.
10 March, 2011
The table shows that unadjusted for age, education or any other factor, the average full-time local government worker in New York City earns about 17 percent less than the average full-time wage and salary worker in private, for-profit employment in the city. That public/private differential falls to 16.3 percent when wage and salary workers in the private, not-for-profit sector are included in the comparison, and rises to 18.3 percent when self-employed workers in the private sector are included in the comparison.12 The lower relative average income of local government workers in New York City follows the national pattern but the differential is much larger.13
12 For self-employed workers, personal business income is added to wage and salary income.
13 Nationwide, in 2008, full-time local government workers earned 0.6 percent less, on average, than full-time workers in the private, for-profit sector.
Municipal Employee Compensation in New York City: Wage Levels in City Government
Source: NYC Comptroller from ACS microdata
TABLE 4
Workforce Characteristics and Earnings in NYC, 2006-2008Private Wage and Salary Workers vs. City Workers
Private Average City Average For Profit Income Gov’t Income
Average age (years) 40.0% $66,405 43.8% $54,846
Male 58.0% $75,444 45.4% $60,640
Female 42.0% $53,941 54.6% $50,023
White 41.2% $101,189 38.4% $64,912
Black 17.5% $40,222 33.0% $48,475
Hispanic 25.7% $34,367 20.0% $45,996
Asian 13.6% $57,417 6.8% $57,258
Noncitizen 24.7% $42,687 6.1% $44,896
Naturalized citizen 23.4% $52,236 24.7% $52,894
Native citizen 51.9% $84,103 69.2% $56,413
No HS diploma 13.8% $25,552 5.6% $35,427
HS diploma or GED 24.2% $35,869 19.0% $44,795
Some college 21.2% $47,118 26.2% $49,215
Bachelors degree 27.2% $89,331 22.4% $56,442
Masters, prof, or Ph.D. 13.6% $146,372 26.9% $70,148
Speaks little or no English 13.0% $24,387 2.5% $36,102
Speaks English well 87.0% $72,689 97.5% $55,334
Office of the New York City Comptroller, John C. Liu 11
The City’s workforce is predominantly female; however, when public school teachers are excluded, the ratio is about 50-50. The average earnings of male City workers are about 80 percent of the earnings of men in the private sector, whereas the earnings of female City workers are much closer to their private sector counterparts.
The proportion of African Americans in the City’s workforce is almost twice as high as it is in the private, for-profit sector and African Americans also earn more, on average, in City government employment. Hispanics and Asians are underrepresented in City employment relative to their numbers in the private sector. Non-Hispanic whites are only slightly underrepresented in City government, but on average, earn 36 percent less than their for-profit counterparts.
Table 4 also reveals large differences in the educational profile of the city’s private, for-profit workforce and its municipal government workforce. About 49 percent of the City’s labor force has a Bachelors or higher degree, compared to 41 percent of
Office of the New York City Comptroller, John C. Liu 11
CHART 1
Average Private Sector vs. City Government WagesNYC Workers, 2006-2008
0 $50,000 $100,000 $150,000 $200,000 $250,000
Janitors & Building Cleaners
Security Guards
Bus Drivers
Secretaries & Adm Asst.
Bus & Truck Mechanics
Electricians
Paralegals & Legal Asst.
Computer Support Specialists
Registered Nurses
Carpenters
Human Resource Specialists
Civil Engineers
Construction Managers
Computer Programmers
Accountants & Auditors
Urban Planners
Physicians & Surgeons
Lawyers
Source: NYC Comptrollers Office from ACS microdata
0 50,000 100,000 150,000 200,000 250,000
Lawyers
Physicians&Surgeons
UrbanPlanners
Accountants&Auditors
ComputerProgrammers
ConstrucAonManagers
CivilEngineers
HumanResourceSpecialists
Carpenters
RegisteredNurses
ComputerSupportSpecialists
Paralegals&LegalAssists
Electricians
Bus&TruckMechanics
Secretaries&AdmAssists
BusDrivers
SecurityGuards
Janitors&BuildingCleaners
CityGovernment
For‐profitSector
Occupation
...unadjusted for age,
education or any other
factor, the average full-
time local government
worker in New York
City earns about 17
percent less than the
average full-time wage
and salary worker
in private, for-profit
employment in the city.
12 March, 2011
the private, for-profit workforce. Conversely, workers without a high school diploma are much more likely to be employed in the private sector. Conforming to the pattern found by other research, workers with less education tend to earn higher wages in City government employment than they do in the private sector, whereas highly-educated workers earn less. City workers with a Masters degree, professional degree, or doctorate earn, on average, 48 percent of what they do in private, for-profit employment.
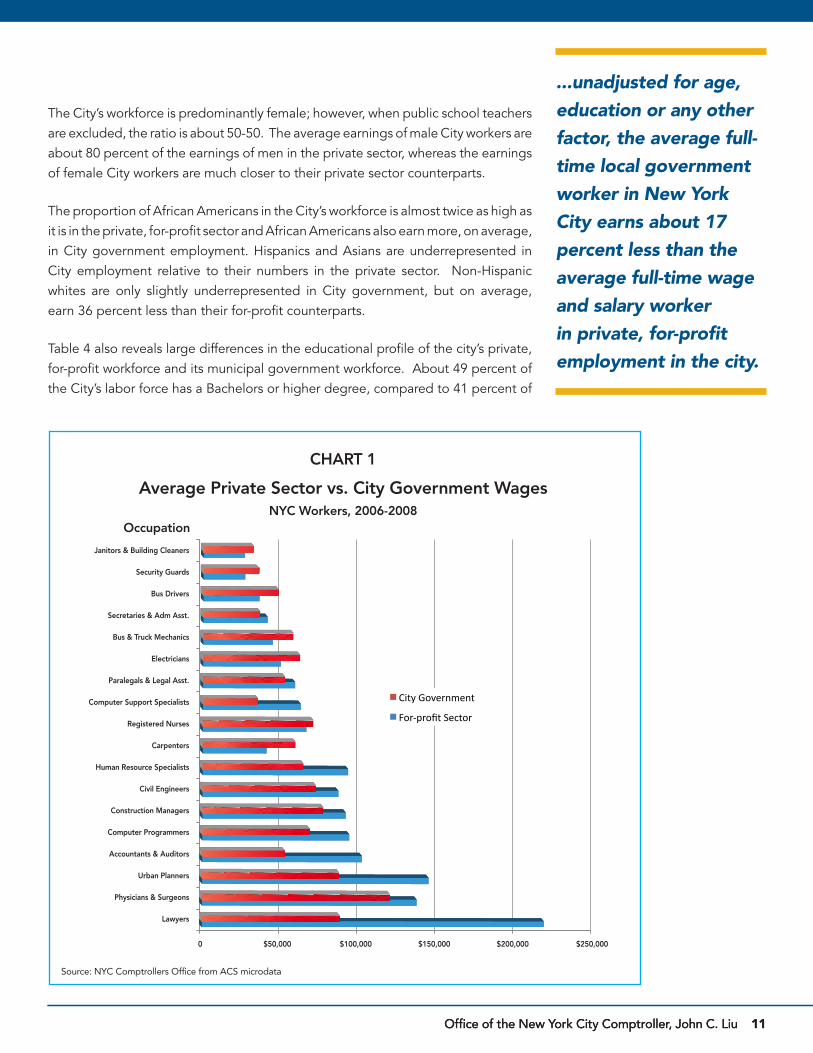
Chart 1 shows the average annual pay in New York City government for specific occupations, compared to the average pay levels in the city’s for-profit sector. The reader should keep in mind that these data are not directly comparable to those shown in Table 1. In particular, both occupations and incomes are self-reported, and the private-sector data in Table 1 include the not-for-profit sector.
Nevertheless, the chart reveals a similar pattern of occupational pay differences between the public and private sectors. The most highly-educated, highly-paid workers in City government earn relatively less than they do in the private sector, and workers at the lower end of the pay scale earn more. In fact, the pattern seems to be even more exaggerated in the city than it is nationally. For example, lawyers in city employment earn only 40 percent, on average, of what their for-profit counterparts earn. Accountants and auditors in city government earn about 52 percent as much as their private-sector counterparts, and computer programmers earn 73 percent as much. Conversely, carpenters in New York City government earn 46 percent more than their for-profit peers, and bus and truck mechanics earn 30 percent more.
Regression analysis of city Wage levelsThe category averages shown in Table 4 do not give a true sense of the wage differentials for City employees, however, because cross effects are not taken into account. For example, African Americans may earn more in city government not because they are paid more generously than in the private sector, but because more of those with higher education gravitate towards public service. In order to control for the combined effects of various worker characteristics it is standard practice to use multivariate regression analysis. The “coefficients” of the estimated regression equation can then be interpreted as a measure of the “pure” effect of a certain characteristic, holding all other characteristics, or variables, constant.
The Comptroller’s Office estimated conventional wage regressions for five educational groupings of workers: with no high school diploma, with a high school diploma or GED, with some college but no 4-year degree, with a BA, and with a graduate or professional degree. The dependent variable was the natural log of annual earnings. Control variables included estimated years
Municipal Employee Compensation in New York City: Wage Levels in City Government
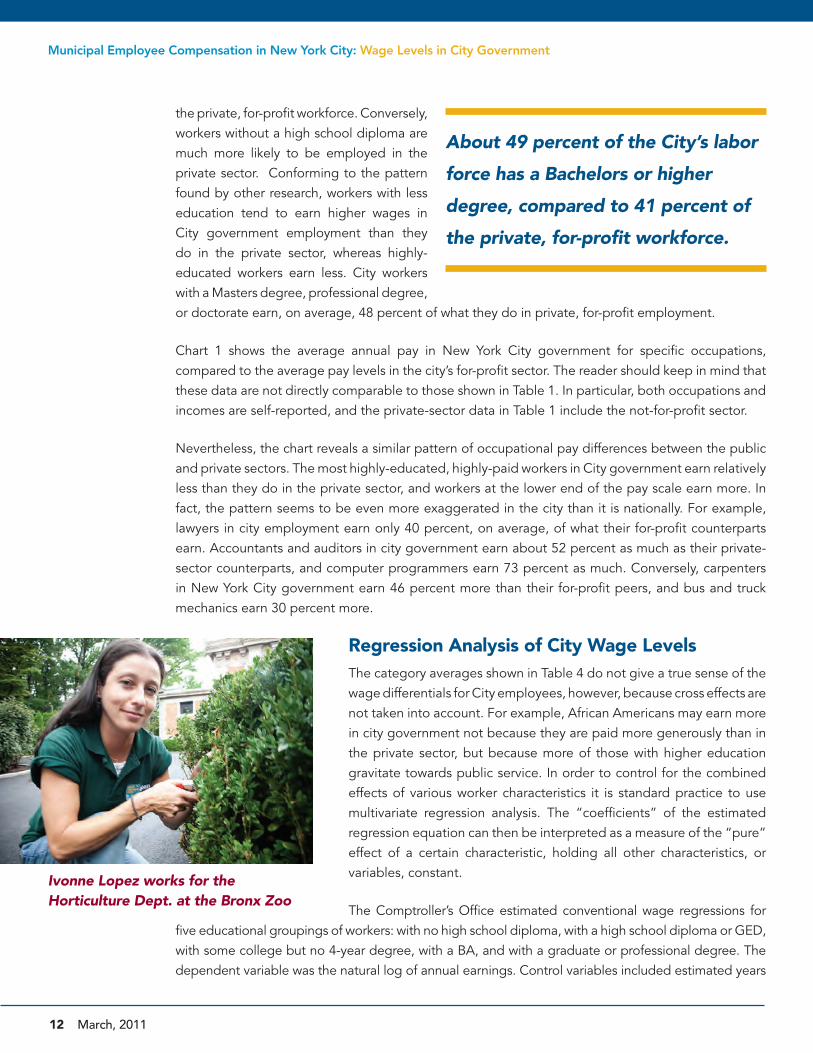
Ivonne Lopez works for the Horticulture Dept. at the Bronx Zoo
About 49 percent of the City’s labor
force has a Bachelors or higher
degree, compared to 41 percent of
the private, for-profit workforce.
Office of the New York City Comptroller, John C. Liu 13
of work experience, experience squared, and usual weekly hours worked, as well as binary variables for female, non-Hispanic black, Hispanic, Asian, mixed race, citizenship, and ability to speak English well. Binary variables representing four categories of City employees were also included: police officers, firefighters, elementary and secondary school teachers, and all other City employees. The samples included all full-time private, for-profit wage and salary workers employed in New York City plus all City workers as defined previously. Private self-employed workers and not-for-profit workers were excluded, as well those who worked for state and federal government agencies.
Our regressions differed somewhat from those presented in the studies discussed earlier. We did not include a control variable for marital status, believing that earnings influence marital status and hence the variable is “endogenous.” Similarly, we did not include a separate variable for union status, believing that union membership is an inherent characteristic of many jobs in the private and public sectors and should not be separately controlled for.
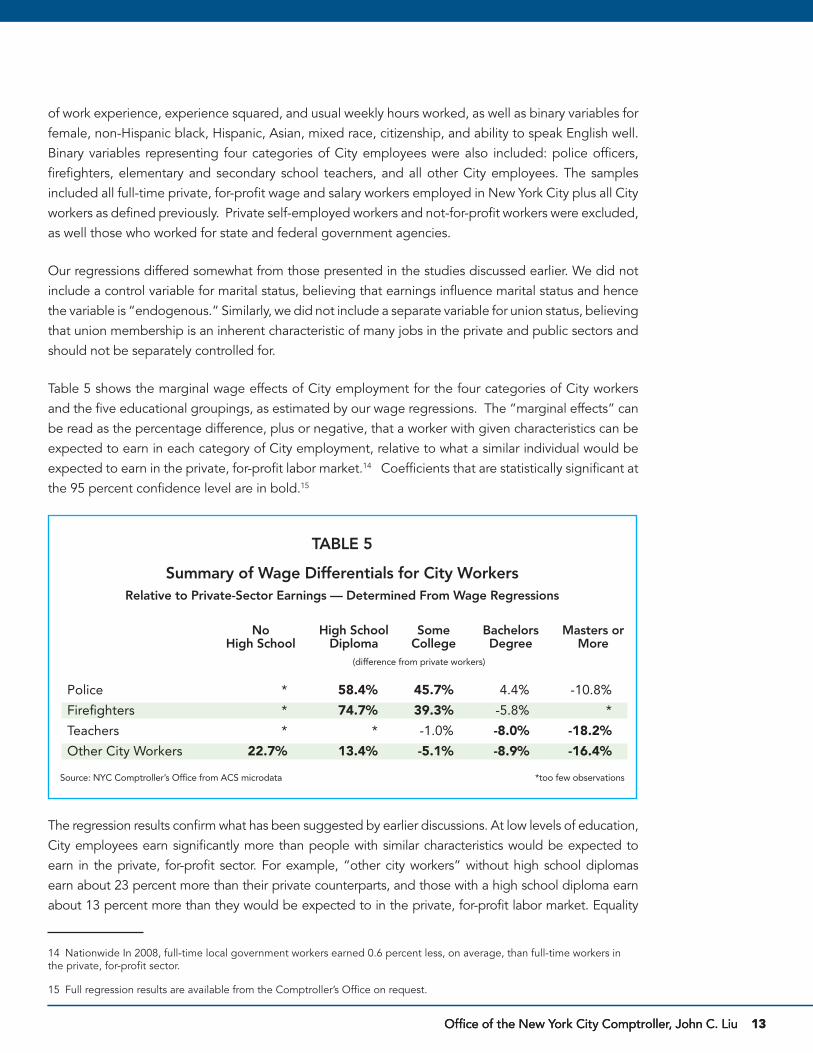
Table 5 shows the marginal wage effects of City employment for the four categories of City workers and the five educational groupings, as estimated by our wage regressions. The “marginal effects” can be read as the percentage difference, plus or negative, that a worker with given characteristics can be expected to earn in each category of City employment, relative to what a similar individual would be expected to earn in the private, for-profit labor market.14 Coefficients that are statistically significant at the 95 percent confidence level are in bold.15
The regression results confirm what has been suggested by earlier discussions. At low levels of education, City employees earn significantly more than people with similar characteristics would be expected to earn in the private, for-profit sector. For example, “other city workers” without high school diplomas earn about 23 percent more than their private counterparts, and those with a high school diploma earn about 13 percent more than they would be expected to in the private, for-profit labor market. Equality
14 Nationwide In 2008, full-time local government workers earned 0.6 percent less, on average, than full-time workers in the private, for-profit sector.
15 Full regression results are available from the Comptroller’s Office on request.
Office of the New York City Comptroller, John C. Liu 13
Source: NYC Comptroller’s Office from ACS microdata
TABLE 5
Summary of Wage Differentials for City WorkersRelative to Private-Sector Earnings — Determined From Wage Regressions
No High School Some Bachelors Masters or High School Diploma College Degree More (difference from private workers)
Police * 58.4% 45.7% 4.4% -10.8%
Firefighters * 74.7% 39.3% -5.8% *
Teachers * * -1.0% -8.0% -18.2%
Other City Workers 22.7% 13.4% -5.1% -8.9% -16.4%
*too few observations
14 March, 2011
between the public and private spheres (except for police and firefighters) is attained approximately at the Associate Degree level of education. Civilian City workers with BA degrees, and City workers with graduate or professional degrees, earn about 9 percent and 16 percent less, respectively, than they would in the private sector.
The same pattern is evident for police and firefighters, except that those without four-year college degrees earn substantial premiums over their private sector
counterparts. The samples for those categories include officers and supervisors, as well as detectives, investigators and inspectors. Police with no more than a high school diploma earn about 58 percent more than they would be expected to earn in the private, for-profit labor market, and those with some college earn about 46 percent more.16 Similar differentials are found for firefighters. However, police with graduate or professional degrees earn somewhat less than people with similar profiles earn in the private sector. About 41 percent of uniformed police report that they have a bachelor’s degree or more advanced degree.
In effect, the current pay scales for New York City police and firefighters approximately track the earnings trajectory of male college graduates in the city’s private, for-profit labor market. Police officers and firefighters who do not have college degrees enjoy a significant wage premium over what they would be expected to earn, on average, in the private sector.17 Firefighters who have college degrees, and police with graduate degrees or professional degrees earn, on average, less than statistically similar individuals do in the private sector.
The estimated wage differentials should not be interpreted to indicate that the City is paying a particular class of worker “too much” or “too little.” Determining whether a public agency’s compensation level is economically appropriate requires a complicated calculation that must take into account a host of factors such as recruitment costs, turnover rates and costs, and the quality and performance of the workforce, as well as relative compensation levels and working conditions in the private sector and in competing jurisdictions. Moreover, an element of subjective value judgment will always enter the picture. In the case of public safety employees, the difficulty is compounded because no private sector occupations are directly comparable to that of a New York City police officer or firefighter, and hence no private sector wage rates can serve as a benchmark for public employee compensation. Individuals recruited by those departments may have skills and qualities that are statistically unobservable but nevertheless important to the performance of their jobs.18 Furthermore, economic theory suggests that the physical risks and other adverse working conditions of those jobs will require a “compensating differential” to attract the desired supply of labor.
16 The NYPD’s current recruitment standards require at least 60 eligible college credits or a high school diploma or its equivalent and two or more years of honorable full-time U.S. military service. The FDNY requires a high school diploma or its equivalent and college, military, or private-sector work experience.
17 To verify these results, we checked the average reported income of City police and firefighters by age in the ACS data with payroll data from the City’s City Human Resource Data Management System. Average pay according to CHRMS was about 20 percent higher than reported in the HVS survey.
18 For example, candidates to become NYC police officers or firefighters must pass qualifying physical tests.
Municipal Employee Compensation in New York City: Wage Levels in City Government
In effect, the current pay scales for
New York City police and firefighters
approximately track the earnings
trajectory of male college graduates in the
city’s private, for-profit labor market.
Office of the New York City Comptroller, John C. Liu 15
In the case of public school teachers the compensating differential is ambiguous. Most non-pedagogical workers would probably consider the daily routine of an elementary or secondary school teacher quite demanding, but at the same time, would consider their traditionally shorter work year an attractive occupational feature. New York City public school teachers generally work about 185 days per year, compared to about 230 for similarly-educated professional workers in the private sector, a difference of about 20 percent.
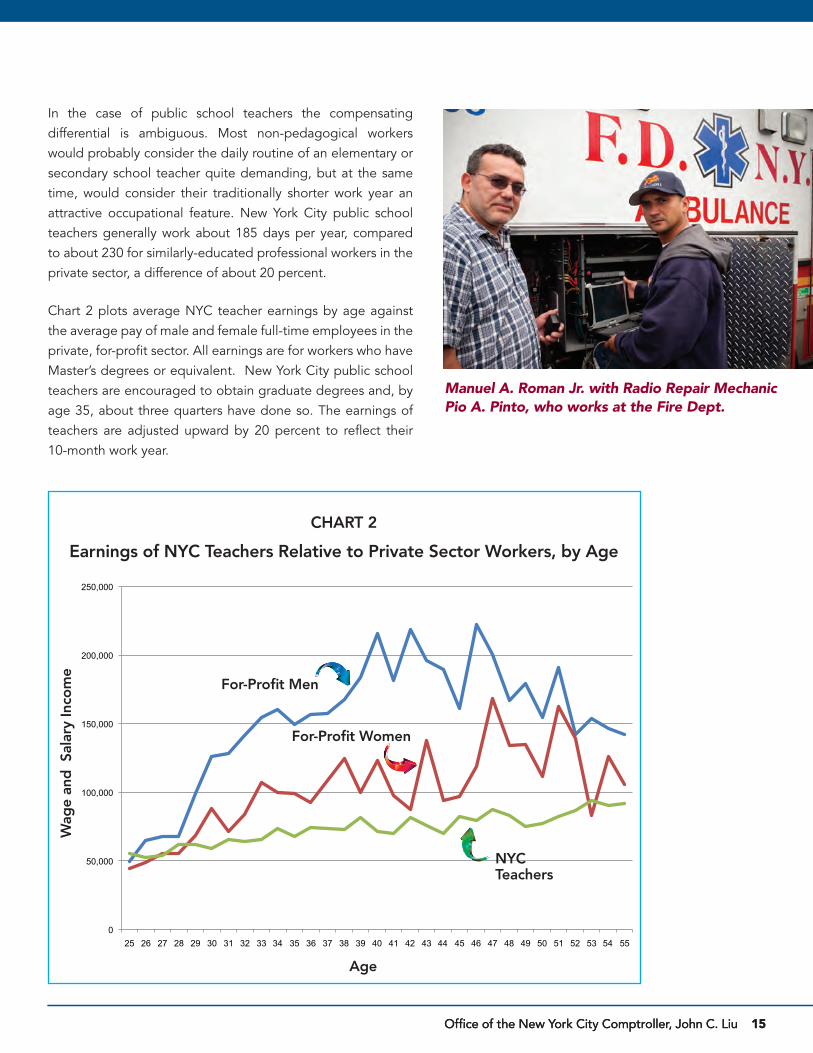
Chart 2 plots average NYC teacher earnings by age against the average pay of male and female full-time employees in the private, for-profit sector. All earnings are for workers who have Master’s degrees or equivalent. New York City public school teachers are encouraged to obtain graduate degrees and, by age 35, about three quarters have done so. The earnings of teachers are adjusted upward by 20 percent to reflect their 10-month work year.
Office of the New York City Comptroller, John C. Liu 15
Manuel A. Roman Jr. with Radio Repair Mechanic Pio A. Pinto, who works at the Fire Dept.
0
50,000
100,000
150,000
200,000
250,000
25 26 27 28 29 30 31 32 33 34 35 36 37 38 39 40 41 42 43 44 45 46 47 48 49 50 51 52 53 54 55
Wag
e &
Sal
ary
Inco
me
Age
For-Profit Men
For-Profit Women
NYC Teachers
0
50,000
100,000
150,000
200,000
250,000
25 26 27 28 29 30 31 32 33 34 35 36 37 38 39 40 41 42 43 44 45 46 47 48 49 50 51 52 53 54 55
Wag
e an
d S
alar
y In
com
e
Age
CHART 2
Earnings of NYC Teachers Relative to Private Sector Workers, by Age
For-Profit Men
For-Profit Women
NYC Teachers
16 March, 2011
The chart shows that even after adjusting for the shorter work year, public school teachers earn less than their similarly-educated counterparts in the private, for-profit sector. On average, male public school teachers earn about 55 percent of what their male, for-profit sector counterparts earn and female teachers earn about 80 percent of what similarly-educated women earn in the for-profit sector. The pay gap is smallest (and for women, non-existent) until about age 30, and largest during the peak-earning ages of 31 to 50. The pay gap appears to narrow again beyond age 50.
As in the case of teachers, the issue of work weeks and hours significantly affects estimates of the pay differential between public and private sector workers. For example, in Table 5, a regression estimate of -8.9 percent for “other city workers” (primarily non-pedagogical civilian workers) with a college degree is presented, with 95 percent confidence that the true value lies between -4.9 percent and -12.7 percent. However, when self-reported “usual weekly hours worked” is omitted as a regression variable, the point estimate rises to -17.8 percent, with a 95 percent confidence interval of -14.1 to -21.2 percent.
The differences occur because local government workers generally report fewer hours worked in a usual work week than private, for-profit workers do. For-profit workers with a college degree report a usual work week of 45.3 hours, on average, compared to their local government counterparts, who report a usual work week of 40.4 hours on average. The differences are smaller among workers with less education.
Differences in how workers respond to the survey question may account for some of the hours differential. For instance, many more government workers report 35-hour work weeks, possibly because unionized and/or civil service workers are more conscious of contractually or administratively mandated lunch hours within the 8-hour work day. However, more for-profit workers report extremely long work weeks (say, exceeding 48 hours) so typical hours worked by public and private sector workers do appear to differ substantially.
Some of the difference may be attributable to greater union and administrative protections in the public sector against unreasonable employer expectations of long work hours. Most likely, however, economic incentives also play a role. Municipal employees, working in an environment in which profit-sharing and year-end bonuses do not exist and pay raises and promotions based on merit are relatively rare, may perceive less of a financial return to working extra-long work weeks. Uniformed employees such as police officers and firefighters, who are compensated directly for overtime hours, report longer usual work weeks than civilian City workers.
Municipal Employee Compensation in New York City: Wage Levels in City Government
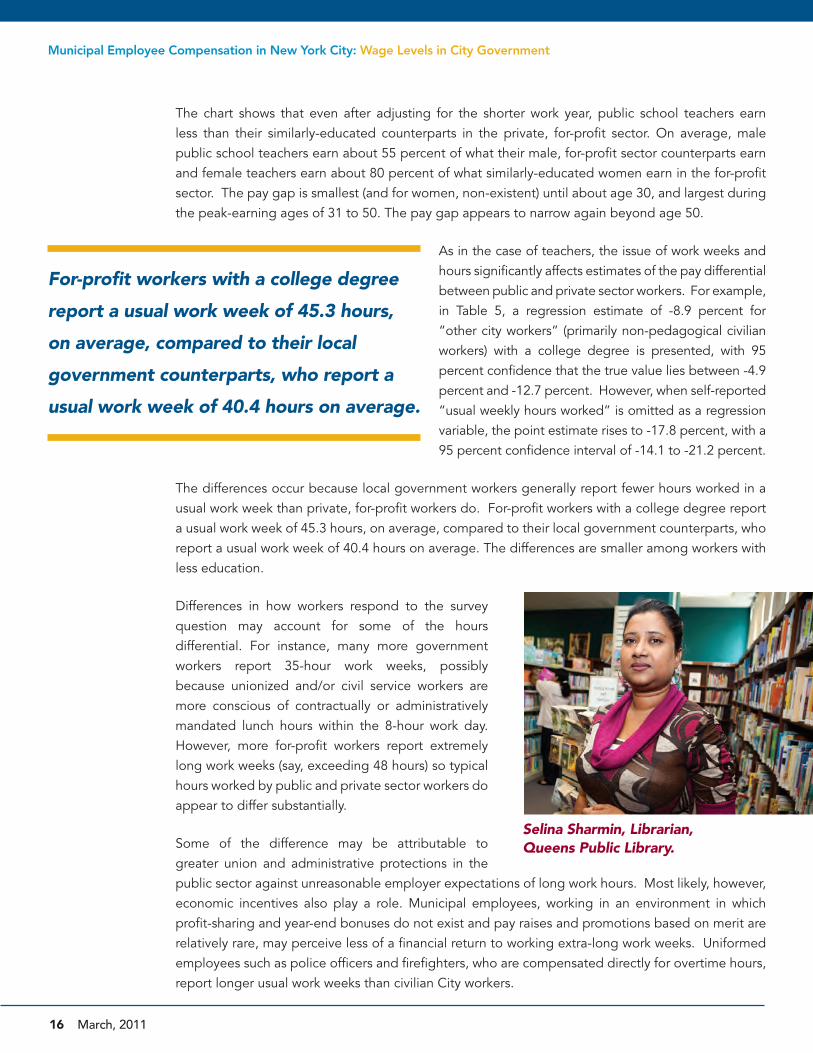
Selina Sharmin, Librarian, Queens Public Library.
For-profit workers with a college degree
report a usual work week of 45.3 hours,
on average, compared to their local
government counterparts, who report a
usual work week of 40.4 hours on average.
Office of the New York City Comptroller, John C. Liu 17
Selina Sharmin, Librarian, Queens Public Library.
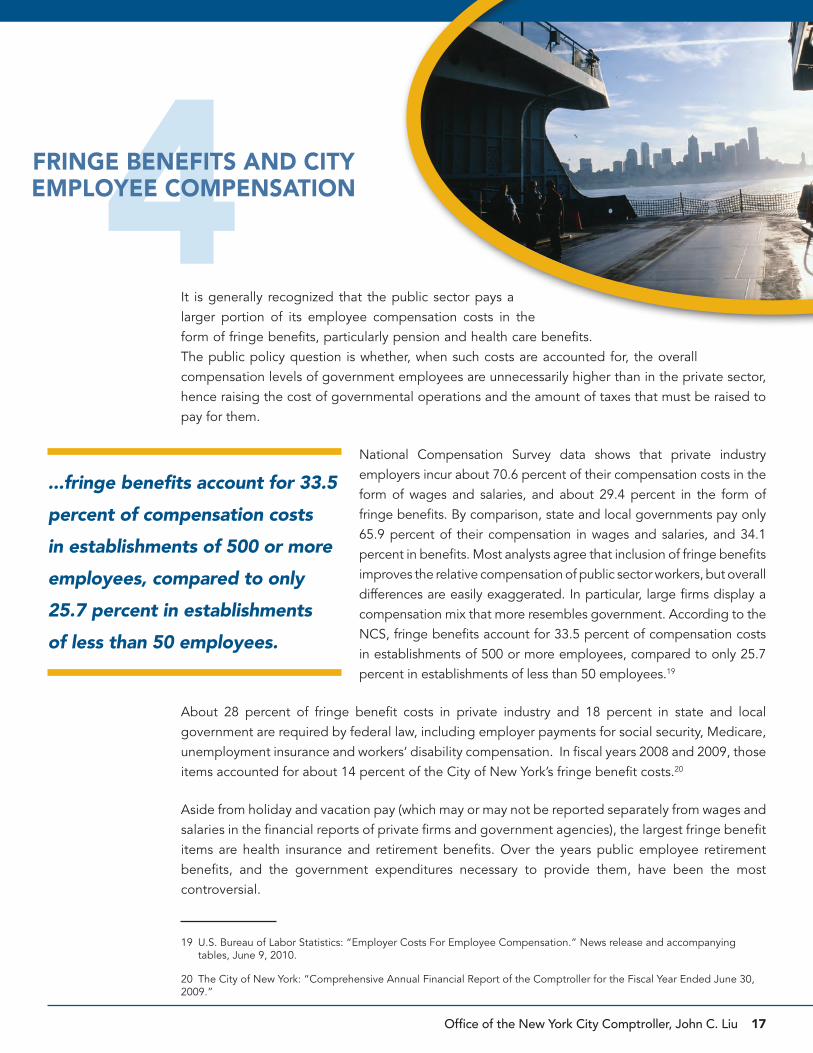
4It is generally recognized that the public sector pays a larger portion of its employee compensation costs in the form of fringe benefits, particularly pension and health care benefits. The public policy question is whether, when such costs are accounted for, the overall compensation levels of government employees are unnecessarily higher than in the private sector, hence raising the cost of governmental operations and the amount of taxes that must be raised to pay for them.
National Compensation Survey data shows that private industry employers incur about 70.6 percent of their compensation costs in the form of wages and salaries, and about 29.4 percent in the form of fringe benefits. By comparison, state and local governments pay only 65.9 percent of their compensation in wages and salaries, and 34.1 percent in benefits. Most analysts agree that inclusion of fringe benefits improves the relative compensation of public sector workers, but overall differences are easily exaggerated. In particular, large firms display a compensation mix that more resembles government. According to the NCS, fringe benefits account for 33.5 percent of compensation costs in establishments of 500 or more employees, compared to only 25.7 percent in establishments of less than 50 employees.19
About 28 percent of fringe benefit costs in private industry and 18 percent in state and local government are required by federal law, including employer payments for social security, Medicare, unemployment insurance and workers’ disability compensation. In fiscal years 2008 and 2009, those items accounted for about 14 percent of the City of New York’s fringe benefit costs.20
Aside from holiday and vacation pay (which may or may not be reported separately from wages and salaries in the financial reports of private firms and government agencies), the largest fringe benefit items are health insurance and retirement benefits. Over the years public employee retirement benefits, and the government expenditures necessary to provide them, have been the most controversial.
19 U.S. Bureau of Labor Statistics: “Employer Costs For Employee Compensation.” News release and accompanying tables, June 9, 2010.
20 The City of New York: “Comprehensive Annual Financial Report of the Comptroller for the Fiscal Year Ended June 30, 2009.”
FRINgE bENEFITs aNd cITy EMployEE coMpENsaTIoN
...fringe benefits account for 33.5
percent of compensation costs
in establishments of 500 or more
employees, compared to only
25.7 percent in establishments
of less than 50 employees.
18 March, 2011
Municipal Employee Compensation in New York City: Fringe Benefits and City Employee Compensation
The compensation value of city pension benefits
Some researchers have attempted to calculate the value of private- and public-sector employee benefits by looking at the aggregate contributions made by firms and governments into employee retirements funds or accounts. That approach has the advantage of putting complex retirement plans on a common basis (cash value) but also has a major shortcoming: employer contributions fluctuate with the returns realized on pension trust funds. Moreover, all plans are not “fully funded” at any given time and private and public plans are regulated differently with regard to funding.21
An additional shortcoming to the “top down” approach for evaluating the value of private and public retirement benefits, with respect to New York City, is that the City has a variety of retirement plans that apply to different classes of employees. The City maintains five separate pension funds for: general city employees and some uniformed employees (NYCERS), police (NYC Police Pension Fund), firefighters (NYC Fire Department Pension Fund), teachers (Teachers’ Retirement System), and other school system employees (NYC Board of Education Retirement System). Each of these retirement systems has different rules and provides different benefits to members, and even within them, there are different “tiers” or classes of membership.
The most important characteristic of the City’s retirement benefits, which is shared by all of the separate pension funds, is that they are “defined benefit plans.” Defined benefit plans (DB) provide a guaranteed (as long as the plan is solvent) level of annual retirement benefits, determined by a formula that depends on years of service and final or average earnings. In contrast, in “defined contribution plans” (DC) the amount to be contributed by the employer and employee is predetermined, but the retirement benefits ultimately realized by the employee depend on the performance of the investments that, within certain limits, the employee herself usually chooses.
The United States has seen a long-term shift toward defined contribution plans. In 1975, there were 27.2 million active participants
in private defined benefit plans, but that number declined to 19.4 million by 2007. Conversely the number of active participants in private defined contribution plans increased from 11.2 million to 66.9 million over that time.22 Many analysts believe that the Employee Retirement Income Security Act
21 Private retirement plans are regulated primarily by the Employee Retirement Income Security Act (ERISA), while public retirement plans are generally regulated by the statutes of the individual states.
22 Employee Benefits Security Administration: “Private Pension Plan Bulletin Historical Tables and Graphs.” July 2010.
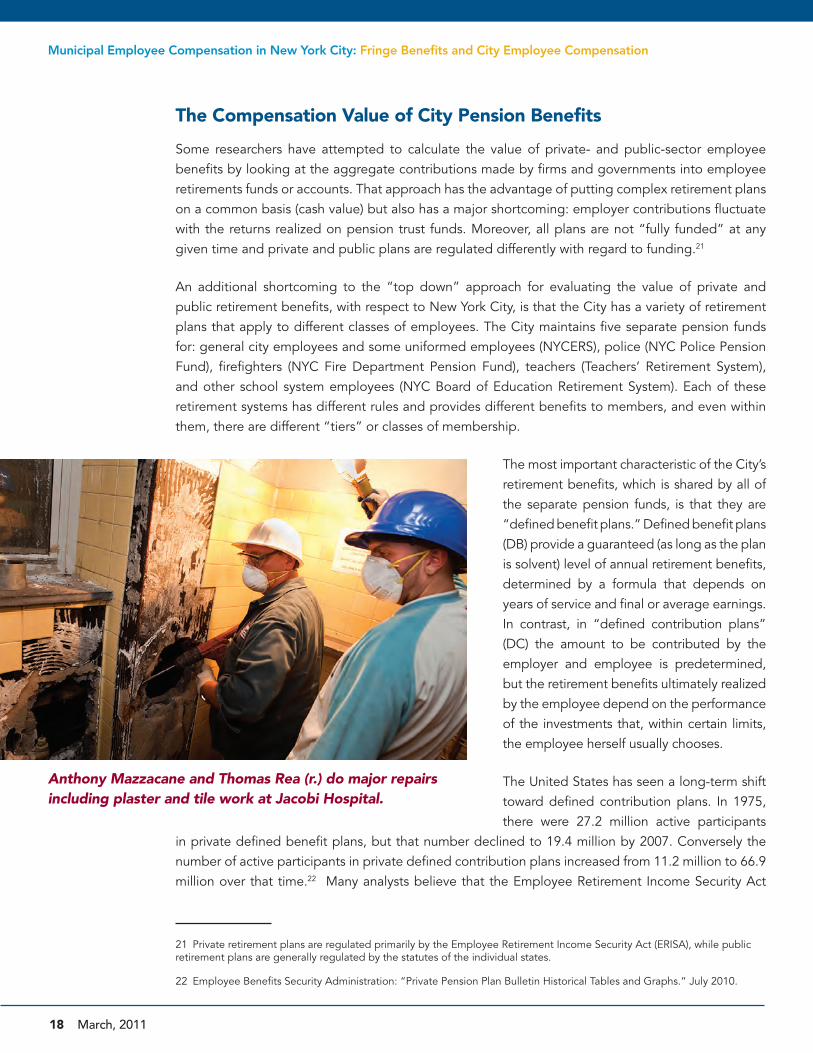
Anthony Mazzacane and Thomas Rea (r.) do major repairs including plaster and tile work at Jacobi Hospital.

Office of the New York City Comptroller, John C. Liu 19
of 1974 (ERISA) hastened the shift toward defined contribution plans by making traditional “DB” plans more expensive to employers and “DC” plans more appealing to employees.
That City employees have defined benefit retirement plans, or that they have retirement plans at all, is sometimes pointed to as evidence that they enjoy more generous fringe
benefits than their counterparts in the private sector. This is true in the sense that many workers in the private sector have no access to an employer-sponsored retirement plan. In 2010, 24 percent of full-time employees in private industry did not have access to an employer-sponsored retirement plan and only 59 percent participated in one. This compares to nearly universal access for full-time state and local government employees in general and for City of New York employees in particular. However, access to retirement plans is close to universal among large private employers as well. In 2010, 85 percent of workers in private establishments with 500 or more employees (including part-time workers) had access to an employer-sponsored retirement plan, compared to just 47 percent of workers in establishments with fewer than 50 employees.23 A Comptroller’s Office review of the financial statements of the large private employers shown in Table 3 did not find any which do not sponsor a defined benefit plan, a defined contribution plan, or both.
The type of plan offered also varies with employment size. Among the 120 private 401(k) plan sponsors with 50,000 or more participants, 71 also sponsor other types of retirement plans. More than half of all participants in defined benefit plans are in the 130 plans that have 50,000 or more participants. Even among large employers, however, the trend is away from DB plans and towards DC plans or hybrid plans. According to a 2007 report by Mercer Human Resources Consulting, one-fifth of Fortune 200 companies had frozen their defined benefit plans or closed them to new hires.24
It is actuarially possible to design defined contribution plans that produce expected benefits equal to any chosen defined benefit plan. It depends, ultimately, on the level of employer and employee contributions to each, and on the investment returns that can be plausibly anticipated. In fact, many employees prefer DC plans because they usually control the investment decisions, are immune to employer insolvency, and
23 U.S. Bureau of Labor Statistics:”Employee Benefits in the United States, March 2010.” News release, July 2010.
24 Mercer Human Resources Consulting: “Pension plans: Frozen, but not forgotten.” February, 2007.
Public employee at the Brooklyn Central Laundry
In 2010, 24 percent of full-time employees
in private industry did not have access to
an employer-sponsored retirement plan
and only 59 percent participated in one.
This compares to nearly universal access
for full-time state and local government
employees in general and for City of New
York employees in particular.
20 March, 2011
Municipal Employee Compensation in New York City: Fringe Benefits and City Employee Compensation
are portable from employer to employer. Employers prefer them primarily because they shift investment risk to the employee and can be easily modified or discontinued. From a compensation viewpoint, employees should be indifferent as to whether they receive retirement benefits through
a DB or DC plan, providing that the employer’s contributions are set at a level sufficient to both equalize the expected benefits and provide for a premium to account for the added risk.
It does not necessarily follow, however, that because private firms are shifting toward defined contribution plans, government agencies should as well. Because unexpectedly poor pension fund returns pose different risks for private firms — lower earnings, loss of shareholder wealth, possible bankruptcy — they may, and probably should, be more willing than public agencies to pay a premium for shifting retirement plan risk to employees. The risks to government entities are less severe, so they may not be willing to pay as much of a premium to shed those risks.
The City now offers different classes of workers defined contribution retirement options, but continues to provide defined benefit plans to virtually all its full-time workforce. Most civilian employees and some uniformed employees (Sanitation, Corrections) participate in the New York City Employees’ Retirement System (NYCERS). As of June 30, 2008, NYCERS had 230,431 active members.
Since 1995, the basic defined benefit retirement plans offered to City workers through NYCERS provide annual retirement allowances equal to 1.67 percent of final salary multiplied by years of credited service for employees with less than 20 years of credited service, and 2.0 percent of final salary multiplied by years of credited service for employees with between 20 and 30 years of credited service.25 Thus, an employee retiring at age 62 with 30 years of service would receive 60 percent of his or her final salary. In calendar year 2007, the annual retirement allowance paid by NYCERS to employees with 30 to 34.9 years of service was $45,406, or 66 percent of their salary base.26
25 For a more detailed description of the retirement plans the City offers to its employees, see the Comprehensive Annual Financial Reports of the respective pension funds.
26 New York City Employees’ Retirement System: “2008 Comprehensive Annual Financial Report.” Most of those employ-ees had retired under earlier, more generous retirement plans.
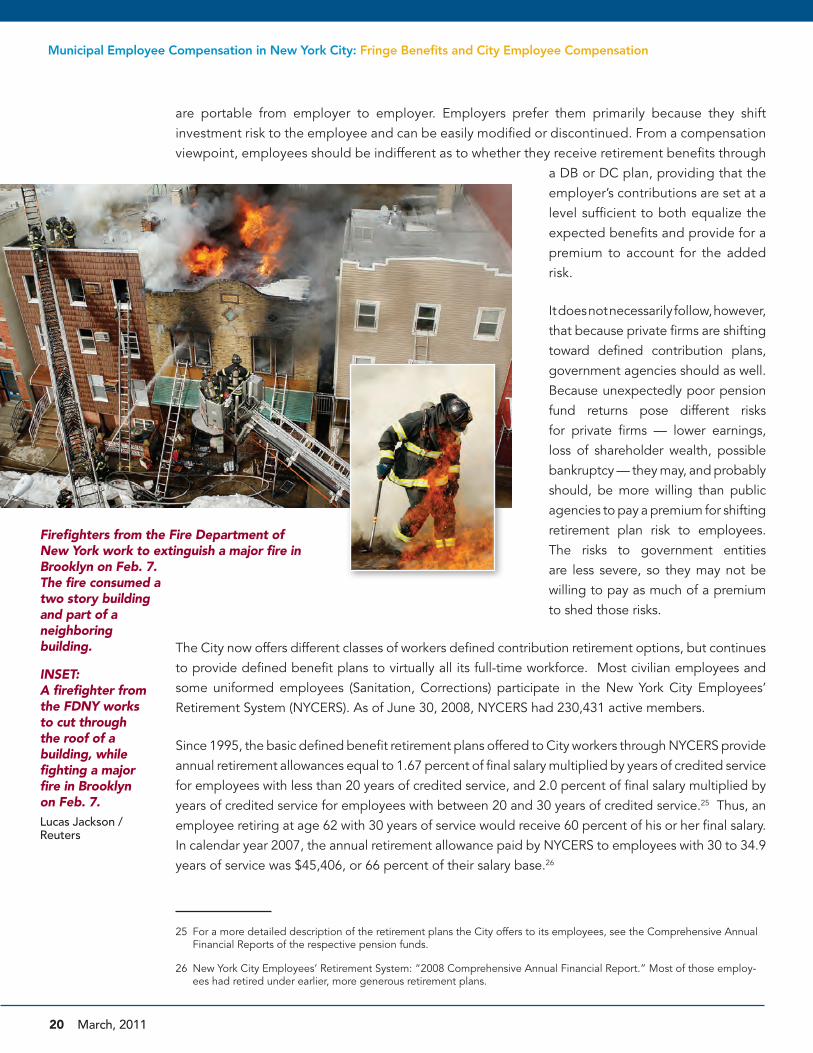
Firefighters from the Fire Department of New York work to extinguish a major fire in Brooklyn on Feb. 7. The fire consumed a two story building and part of a neighboring building.
INSET: A firefighter from the FDNY works to cut through the roof of a building, while fighting a major fire in Brooklyn on Feb. 7.Lucas Jackson / Reuters
Office of the New York City Comptroller, John C. Liu 21
Since retirement plans among large private employers vary so much, it would be impractical to compare these NYCERS retirement benefits to each of them. However, a yardstick can be obtained by looking at several of the large technology companies, including Microsoft and IBM, which provide straightforward defined contribution plans to new employees,27 with a 100 percent company match up to 6 percent of salary.28 If an employee began working at age 32 at an initial salary of $40,000, contributed 6 percent of his or her salary to the plan, and experienced 3 percent annual salary growth and an 8 percent return29 on their portfolio, the annual annuity value of their retirement benefit would be equal to about 65 percent of their final salary after 30 years of service.
Such a DC plan, then, is roughly comparable to the NYCERS defined benefit plan in terms of the value of retirement benefits, if an 8 percent annual rate of return is achieved on the investment portfolio. However, many current City workers participate in NYCERS’ Tier IV, 62/5 plan, and are required to contribute only 3.0 percent of their salaries to the plan, and after 10 years are not required to make any contributions. Thus, with respect to employee contributions, many active City civilian workers are treated more favorably than their equivalents in large corporate DC plans. New City hires are enrolled in the Tier IV, 57/5 plan, which requires a 4.85 percent employee contribution for the first ten years and 1.85 percent thereafter.
The New York City Teachers’ Retirement Fund currently has about 113,000 active members, of whom 96 percent are Tier IV members. The current teachers’ retirement plan is similar to the 57/5 NYCERS plan described above; the employee contributes 4.85 percent of gross wages for the first 27 years of membership, after which the employee contribution drops to 1.85 percent. Annual benefits after 30 years of service are equal to about 60 percent of final average salary, and full benefits can be received at age 55 provided the employee has completed 27 years of service. As with the case of NYCERS, the employee contribution rates are slightly lower than for a large corporate DC plan (if the employee contributes a full 6 percent of salary). The primary advantage of the plan to the employee is the implicit guarantee that investment returns will average approximately 8 percent.
The situation is more complicated with respect to uniformed services pensions. Those pensions are more substantial than those offered to civilian employees and there are no analogous private occupations to compare them to. On the other hand, their basic structure is similar to those offered by other police and fire departments around the country, and by the U.S. military services.
27 IBM formerly had a defined benefit plan, but it has been closed to new employees since 1994.
28 Both Microsoft and IBM also offer stock option plans to employees.
29 The average expected return anticipated by 100 large corporate pension funds was 8.1 percent in 2009. Milliman, Inc.: “Milliman 2010 Pension Funding Study.” April 2010.
Because unexpectedly poor pension
fund returns pose different risks
for private firms — lower earnings,
loss of shareholder wealth, possible
bankruptcy — they may, and
probably should, be more willing
than public agencies to pay a
premium for shifting retirement plan
risk to employees.

22 March, 2011
Municipal Employee Compensation in New York City: Fringe Benefits and City Employee Compensation
New York City police and firefighters are typically eligible to retire after 20 years of service, regardless of age, and to begin collecting benefits immediately upon retirement. The annual benefit is equal to 50 percent of final salary30 for the first 20 years of service, plus 1.67 percent of final salary for each additional year of service above 20, multiplied by years of credited service.31 That is similar to the formula that applies to most NYCERS pensions. In fact, the basic formula of half-pay after twenty years of service for New York City police officers dates back to the 19th Century. The most significant difference between the NYPD and FDNY pension plans and other City pension plans is the ability to begin receiving benefits immediately after reaching 20 years of service, regardless of age. Other city employees are not eligible to receive retirement benefits until age 50, 55, 57 or 62, depending on the plan they are in. The early retirement provisions of the NYPD and FDNY plans is what encourages City police and firefighters to leave City employment after 20 years, often to seek additional income from second careers.
30 Averaged over the final three years of service.
31 Police officers who begin their service after June 2009 are eligible for full retirement benefits after 22 years of service.
Ave
rag
e O
vert
ime
Ho
urs
Years of Service
CHART 3
Average Annual Overtime Hours Worked by Years of ServiceNYPD & FDNY, FY 2009
0
50
100
150
200
250
300
350
400
1 2 3 4 5 6 7 8 9 10 11 12 13 14 15 16 17 18 19 20 21 22 23 24 25 26 27 28 29 30 31 32 33 34 35 36
NYPD
FDNY
Office of the New York City Comptroller, John C. Liu 23
Critics of the of police and fire pensions often charge that members about to retire are able to raise the salary base by which their pension benefits are determined by working unusual amounts of overtime hours in their final years. Chart 3 uses payroll data from the City Human Resources Data System to examine the validity of this charge. The chart plots average overtime hours worked by uniformed employees of the NYPD and FDNY by years of service time in FY 2010.
Chart 3 shows only a small increase in average overtime hours worked by police or firefighters at or before the 20 years of service threshold is reached. Uniformed police with 15-17 years of service worked an average of 251 overtime hours in FY 2010, while those with 18-20 years of service worked an average of 281 hours, a difference of about 11 percent. For firefighters, the difference was smaller; 253 compared to 239 overtime hours, or 6 percent. These differences translate into about $2,000 in additional salary base for retirement-eligible police and $1,000 additional for retirement-eligible firefighters. In both departments, however, there is a fairly clear positive correlation between years of service and overtime hours throughout careers, so even the small differences noted here may result from factors unrelated to retirement eligibility.
There are two other pension issues that materially affect the present value of total compensation for police and firefighters, which generally do not pertain to civilian employees. One is the issue of “variable supplement fund payments” to certain public safety retirees, and the other is disability retirements.
Certain categories of public safety employees, the largest groups of which being NYPD and FDNY, are eligible for annual “Variable Supplement Fund” payments that supplement regular pensions. These payments were originally established in the late 1960s, when the municipal pension funds were moving away from entirely fixed-income investment portfolios toward riskier portfolios containing both fixed-income and equity investments. Nine variable supplement funds were established to receive the “excess” of the parent funds’ earnings attributable to the riskier investments, and to distribute those excess annual earnings to pensioners as a supplement to their regular pension payments.32 In 1988 state legislation established fixed and guaranteed “variable supplements” that reached a maximum statutory level of $12,000 in 2007. Generally speaking, all police and firefighters retiring with a regular service retirement after 20 or more years receive these annual payments (corrections officers’ variable supplements become guaranteed in 2019 under existing law). So, for example, a police officer retiring after 20 years service with a final salary of $100,000 would receive $50,000 in regular pension benefits plus $12,000 in VSF payments, bringing his or her total retirement benefits to $62,000, or 62 percent of final salary. However, these payments are not inflation indexed, so they
32 New York City Police Officers’ VSF; New York City Police Superior Officers’ VSF; New York City Fire Department Firefight-ers’ VSF; New York City Fire Department Fire Officers’ VSF; New York City Housing Police Officers’ VSF; New York City Housing Police Superior Officers’ VSF; New York City Transit Police Officers’ VSF; New York City Transit Police Superior Officers’ VSF; New York City Corrections Officers’ VSF.
Uniformed police with 15-17 years of
service worked an average of 251 overtime
hours in FY 2010, while those with 18-20
years of service worked an average of 281
hours, a difference of about 11 percent.
24 March, 2011
Municipal Employee Compensation in New York City: Fringe Benefits and City Employee Compensation
would normally decline as a proportion retirement income over time. Anyone retiring with a disability retirement or terminating and deferring retirement until they would have reached 20 years of service is not eligible for VSF payments.
Critics of the City’s pension system have long pointed to disability pensions for uniformed personnel as prone to abuse.33 Police and firefighters are eligible for ordinary disability pensions when medical conditions unrelated to their work prevent them from any longer performing their jobs. Police officers who suffer a disabling injury in the line of duty are eligible for a disability allowance equal to 2 percent of final salary times years of service projected at full escalation date, less 50 percent of their Social Security Disability Benefit attributable to City service less 100 percent of their Workers Compensation benefit.34 For firefighters, line-of-duty disability benefits provide a pension equal to 75 percent of final salary plus an increment based on years of service in excess of a 20-years or 25-years minimum. About 26 percent of police and 50 percent of fire fund pensioners receive accidental disability benefits.35 The rates of accidental disability pensions have gone up in the years since 9/11, especially in the Fire Department, which is attributable primarily to an increase in respiratory diseases.
The general discussion above does not do justice to the complexity and variety of the various City retirement plans, tiers, and options, but it should be sufficient to underscore that sweeping judgments about the generosity of City pension plans are hazardous. Nevertheless, it would be desirable to have
an overall measure of the degree to which retirement benefits add to the effective compensation of City employees, relative to their private-sector counterparts.
Some analysts have attempted to measure the value of fringe benefits in the private and public sectors using annual employer contributions to pension plans. As previously noted, the problem with that approach is that employer contributions to pension funds may vary dramatically from year to year, based on the financial condition of the employer, the past investment returns of the fund, and the overall funding status of the plan. However, there are several actuarial concepts that approximate the percentage of payroll that would be needed to fund each
employee’s prospective benefits earned within the current year. In particular, there is a concept known as the “entry-age normal” rate (EAN). Entry age normal is an actuarial cost method designed
33 “City Pension ‘Funds’ Are Headed For Bankruptcy,” New York Times, January 11, 1914; “Finally Cracking Down,” New York Post, August 7, 2010.
34 Tier III formula.
35 By comparison, 3.4 percent of NYCERS pension beneficiaries are accidental disability recipients.
...for a 25 year-old male entering
the NYCERS pension system (Tier IV,
non-physically taxing) the City’s EAN
rate is 4.33 percent; for a 25 year-
old female, the rate is 4.92 percent.
Office of the New York City Comptroller, John C. Liu 25
to estimate a member’s total plan benefit over the course of his or her career. It can be used to design an employer’s contribution rate that produces contributions equal to a fixed percentage of an employee’s salary throughout their job tenure.
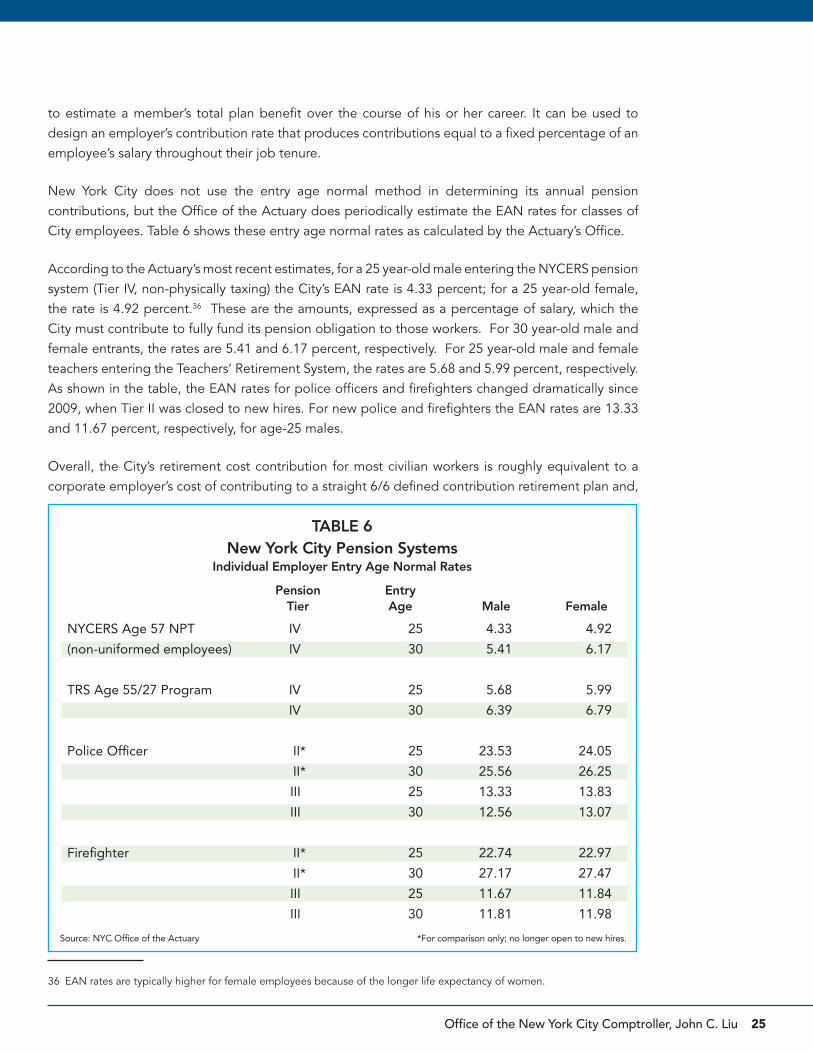
New York City does not use the entry age normal method in determining its annual pension contributions, but the Office of the Actuary does periodically estimate the EAN rates for classes of City employees. Table 6 shows these entry age normal rates as calculated by the Actuary’s Office.
According to the Actuary’s most recent estimates, for a 25 year-old male entering the NYCERS pension system (Tier IV, non-physically taxing) the City’s EAN rate is 4.33 percent; for a 25 year-old female, the rate is 4.92 percent.36 These are the amounts, expressed as a percentage of salary, which the City must contribute to fully fund its pension obligation to those workers. For 30 year-old male and female entrants, the rates are 5.41 and 6.17 percent, respectively. For 25 year-old male and female teachers entering the Teachers’ Retirement System, the rates are 5.68 and 5.99 percent, respectively. As shown in the table, the EAN rates for police officers and firefighters changed dramatically since 2009, when Tier II was closed to new hires. For new police and firefighters the EAN rates are 13.33 and 11.67 percent, respectively, for age-25 males.
Overall, the City’s retirement cost contribution for most civilian workers is roughly equivalent to a corporate employer’s cost of contributing to a straight 6/6 defined contribution retirement plan and,
36 EAN rates are typically higher for female employees because of the longer life expectancy of women.
Source: NYC Office of the Actuary
TABLE 6New York City Pension Systems
Individual Employer Entry Age Normal Rates
Pension Entry Tier Age Male Female
NYCERS Age 57 NPT IV 25 4.33 4.92
(non-uniformed employees) IV 30 5.41 6.17
TRS Age 55/27 Program IV 25 5.68 5.99
IV 30 6.39 6.79
Police Officer II* 25 23.53 24.05
II* 30 25.56 26.25
III 25 13.33 13.83
III 30 12.56 13.07
Firefighter II* 25 22.74 22.97
II* 30 27.17 27.47
III 25 11.67 11.84
III 30 11.81 11.98
*For comparison only; no longer open to new hires.
26 March, 2011
Municipal Employee Compensation in New York City: Fringe Benefits and City Employee Compensation
as previously noted, the eventual retirement benefits for the workers are comparable.37 Consequently, inclusion of pension benefits does not fundamentally change the findings of the previous section. Civilian employees with high school diplomas or some college enjoy some compensation premiums over comparable private-sector workers, while civilian City workers with 4-year college degrees or graduate and professional degrees earn less than their private-sector counterparts. Inclusion of retirement benefits increases the pay premium of all but the most highly-educated police and firefighters relative to private-sector workers with similar demographic profiles.
The compensation value of city Health benefits
Since 1966 the City has provided basic health and hospital coverage to its employees, their families and eligible retirees. The City has approximately 414,000 active employees and retirees enrolled in its health care plans.38 Compared to pensions, the value of health care benefits provided to active City workers are much easier to estimate. In general, pursuant to state law, the City is required
to “pay the entire cost of health insurance coverage for eligible active employees, retirees and their dependents, at an amount not to exceed one hundred percent of the full cost of H.I.P.-H.M.O. on a category basis.”39 Among the active workforce with City-provided insurance, approximately 94 percent select either GHI-CBP/Empire BlueCross BlueShield or HIP Prime HMO for health coverage, both of which require no additional employee contribution for the premium cost. DC-37 members have access to the Med-Team plan, which also carries no premium for employees.
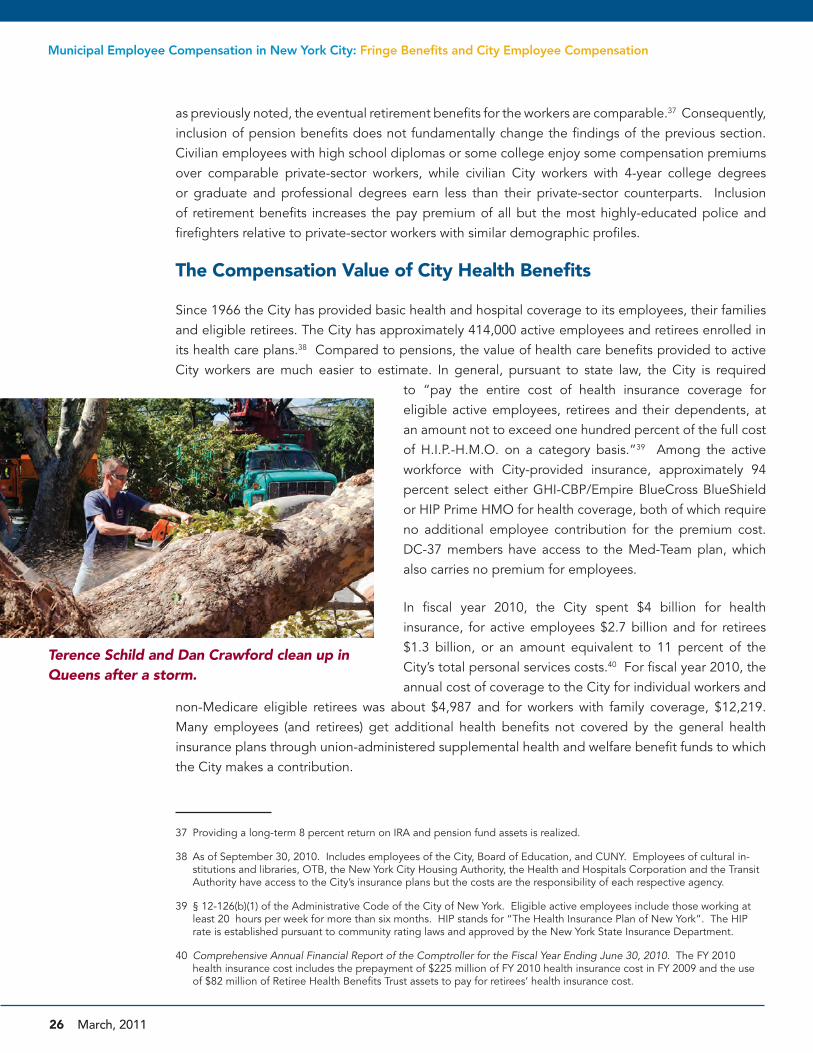
In fiscal year 2010, the City spent $4 billion for health insurance, for active employees $2.7 billion and for retirees $1.3 billion, or an amount equivalent to 11 percent of the City’s total personal services costs.40 For fiscal year 2010, the annual cost of coverage to the City for individual workers and
non-Medicare eligible retirees was about $4,987 and for workers with family coverage, $12,219. Many employees (and retirees) get additional health benefits not covered by the general health insurance plans through union-administered supplemental health and welfare benefit funds to which the City makes a contribution.
37 Providing a long-term 8 percent return on IRA and pension fund assets is realized.
38 As of September 30, 2010. Includes employees of the City, Board of Education, and CUNY. Employees of cultural in-stitutions and libraries, OTB, the New York City Housing Authority, the Health and Hospitals Corporation and the Transit Authority have access to the City’s insurance plans but the costs are the responsibility of each respective agency.
39 § 12-126(b)(1) of the Administrative Code of the City of New York. Eligible active employees include those working at least 20 hours per week for more than six months. HIP stands for “The Health Insurance Plan of New York”. The HIP rate is established pursuant to community rating laws and approved by the New York State Insurance Department.
40 Comprehensive Annual Financial Report of the Comptroller for the Fiscal Year Ending June 30, 2010. The FY 2010 health insurance cost includes the prepayment of $225 million of FY 2010 health insurance cost in FY 2009 and the use of $82 million of Retiree Health Benefits Trust assets to pay for retirees’ health insurance cost.
Terence Schild and Dan Crawford clean up in Queens after a storm.

Office of the New York City Comptroller, John C. Liu 27
Nationally, about 86 percent of full-time workers in private industry have access to employer-sponsored health insurance coverage, and about 64 percent participate. On average, private employers pay about 80 percent of the health insurance premiums of single-coverage workers and 70 percent of the premiums of family-coverage workers.41 Applying those percentages to the City’s insurance costs, City workers who receive individual health coverage benefit by about $1,000 annually because the City pays 100 percent of the their basic insurance cost. Employees with family coverage enjoy a benefit of about $3,700 annually, relative to the private sector average.
Expressed as a percentage of compensation, the benefit differs depending on the pay level of the employee and their family circumstances. For an employee earning a salary of $30,000 and receiving family coverage, the City’s full-insurance “premium” amounts to approximately 12 percent of wages. For a single-coverage manager earning $100,000 or more, the benefit would amount to less than 1 percent of salary.
For all eligible employees retiring before the age of 65, the City pays the full cost of medical insurance benefits, which are identical to those available to active employees.42 For a civilian employee retiring at the age of 62, the cost of this benefit, spread over the employee’s entire tenure with the City, can be relatively modest. However, for teachers retiring at age 55, or police or firefighters retiring in their early forties, the employer cost can be significant. Unfortunately, there are no accurate estimates, analogous to the EANR, of the normal cost of this benefit.
Once an eligible City retiree reaches age 65 and is covered by Medicare, the City pays the full cost of his or her Medicare Part B premium, and that for their spouse. In 2011, this benefit had a value of $115 per person per month. Also, the City pays the premium for supplemental Medicare coverage for the retiree and spouse. In FY 2011, this cost can be as high as $166 per person per month. The annual cost of these benefits thus can be as high as $6,500 for a retiree and spouse (at FY 2011 costs). Although there are no EANR estimates for this benefit, it is easy to see that if it accrued as a constant percentage of salary during the employee’s years of service, it would add materially to the compensation of a typical City employee.
41 Bureau of Labor Statistics: “Employee Benefits in the United States.” Economic News Release, July 28, 2009.
42 Generally, this benefit vests after 10 years of credited service.
A New York City police honor guard carries a flag on September 11, 2010 that was found at Ground Zero nine years ago to begin the ceremony commemorating the 9/11 attack on the World Trade Center in New York.REUTERS/Peter Foley/Pool
On average, private employers
pay about 80 percent of the health
insurance premiums of single-coverage
workers and 70 percent of the
premiums of family-coverage workers.
Office of the New York City Comptroller, John C. Liu 28
5The wages of City of New York employees are not, on average, higher than their private sector counterparts. In fact, although the City’s employees are older and more educated than workers in the private sector, they earn less in salaries and wages than the average worker in the city’s private, for-profit firms. That adverse pay differential is unusual for state and local governments in the United States.
When the wages and salaries of City workers are adjusted to account for educational attainment, age, gender and other demographic characteristics, the situation is more complex. Our analysis indicates that less-educated, lower-paid City civilian workers are paid a premium over the wages they could be expected to earn in the private for-profit sector. For example, City workers with a high school diploma but no college training earn an estimated 13 percent more than workers with similar demographic characteristics do in the private sector. However, City’s workers with higher levels of education and experience appear to be paid significantly less than their private sector counterparts. City civilian employees with graduate or professional degrees are paid an estimated 16 percent less than workers with similar characteristics are paid in the private, for-profit sector. Relative to the earnings distribution in the private sector, the City’s wage distribution is “compressed,” meaning that there is a smaller gap between the lowest-paid and higher-paid workers.
Both male and female public school teachers are also paid less than they might be expected to earn in the private sector, although the difference is somewhat mitigated by teachers’ shorter work-year. Because male workers in the for-profit sector earn significantly more than women, adjusted for education and other characteristics, the public-private wage gap for male public-school teachers is larger than for female teachers.
The salaries of police and firefighters roughly track the lifetime earnings of male college graduates in the city’s private, for-profit sector. Consequently, those who meet only the minimum educational standards for those uniformed department appointments earn a significant premium over what they could expect to make, on average, in the private sector. Conversely, firefighters who possess college degrees, and police officers and firefighters who hold graduate or professional degrees, earn less than they might realize from private sector jobs.
suMMaRy aNd IMplIcaTIoNs
29 March, 2011
Municipal Employee Compensation in New York City: Summary and Implications
New York City is one of the largest employers in the country. Economists have consistently found that large private firms pay substantial wage premiums to their workers, relative to wages paid in small firms. Although our data do not allow for a direct econometric comparison of City wages to wages in comparably large firms, if an adjustment of approximately 13 percent (the average wage difference between large firms and all firms across all occupations) is factored into the analysis, the
assessments of relative pay levels shifts considerably. The City appears to pay its less-educated civilian personnel about what a similar workforce is paid in the corporate sector, and pays its more highly educated personnel, who are typically managerial, technical or professional workers, substantially less.
When fringe benefits such as pensions and health insurance are considered, City workers fare better. Many large private employers once offered defined benefit pension plans to their employees that were comparable to, or even more generous than, those currently offered to City employees. Those large defined benefit plans in the corporate sector are, however, rapidly being replaced by defined contribution plans or hybrid plans, in which the investment risk is being shifted to the employees. If investment returns in future years match or exceed the rate that the City’s pension funds anticipate, retirement benefits in large corporate DC plans will be comparable in value to the pensions provided to City civilian workers. If, on the other hand, investment
returns fall far short of expectations, the guaranteed benefits of the City’s DB plans will have been proven, in retrospect, to be a very valuable fringe benefit. Plausible estimates of the value of the pension and health benefits available to most City civilian workers, however, do not change the overall picture of relative City-private sector compensation.
Pension benefits, however, do have a material effect on the relative compensation rates of uniformed City personnel, particularly police and firefighters. The annual value of their pension benefits raises their effective compensation by about 25 percent (using Entry Age Normal rates). Those benefits have been significantly reduced for new police officers and firefighters.
Our research concludes that, whether salaries alone or total compensation including fringe benefits is considered, it is difficult to generalize about the relative pay of City workers. Their relative compensation differs widely depending on their age, occupation, level of education and the function of municipal government in which they are employed. Determination of the relative pay also depends on the reference group to which they are compared, as the private sector itself has many subsectors and “tiers.”
If investment returns in future years
match or exceed the rate that the City’s
pension funds anticipate, retirement
benefits in large corporate DC plans will
be comparable in value to the pensions
provided to City civilian workers. If, on
the other hand, investment returns fall
far short of expectations, the guaranteed
benefits of the City’s DB plans will have
been proven, in retrospect, to be a very
valuable fringe benefit.
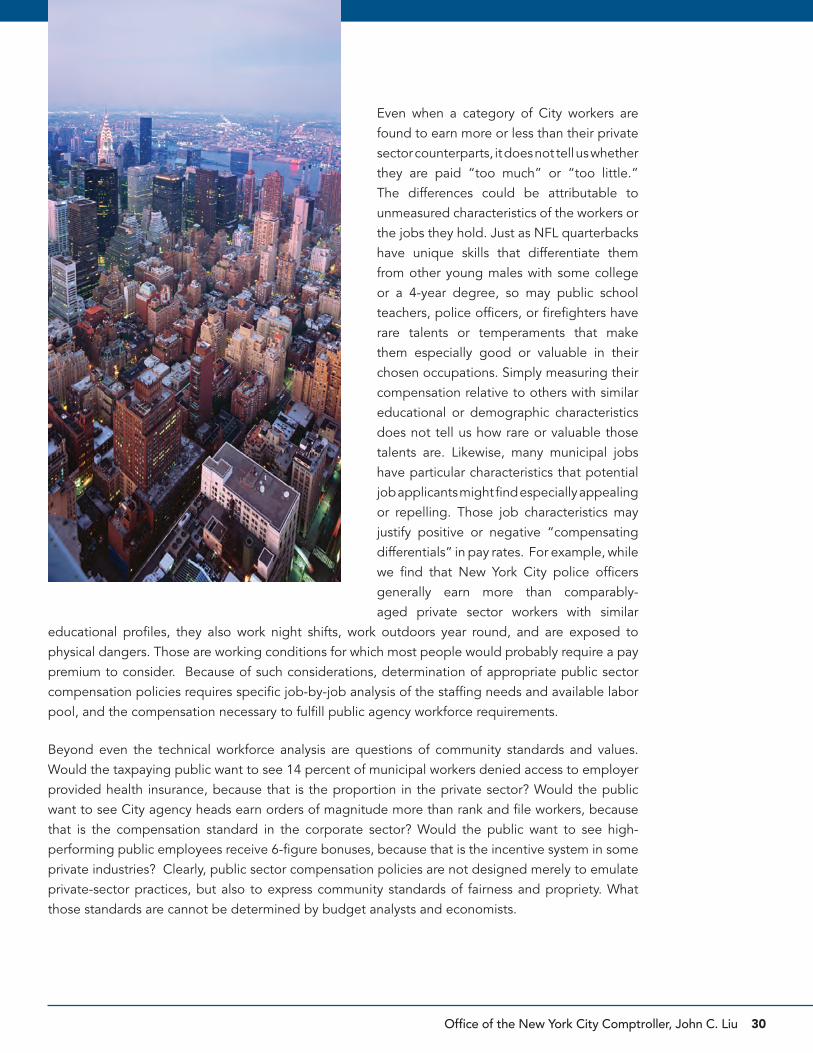
Office of the New York City Comptroller, John C. Liu 30
Even when a category of City workers are found to earn more or less than their private sector counterparts, it does not tell us whether they are paid “too much” or “too little.” The differences could be attributable to unmeasured characteristics of the workers or the jobs they hold. Just as NFL quarterbacks have unique skills that differentiate them from other young males with some college or a 4-year degree, so may public school teachers, police officers, or firefighters have rare talents or temperaments that make them especially good or valuable in their chosen occupations. Simply measuring their compensation relative to others with similar educational or demographic characteristics does not tell us how rare or valuable those talents are. Likewise, many municipal jobs have particular characteristics that potential job applicants might find especially appealing or repelling. Those job characteristics may justify positive or negative “compensating differentials” in pay rates. For example, while we find that New York City police officers generally earn more than comparably-aged private sector workers with similar
educational profiles, they also work night shifts, work outdoors year round, and are exposed to physical dangers. Those are working conditions for which most people would probably require a pay premium to consider. Because of such considerations, determination of appropriate public sector compensation policies requires specific job-by-job analysis of the staffing needs and available labor pool, and the compensation necessary to fulfill public agency workforce requirements.
Beyond even the technical workforce analysis are questions of community standards and values. Would the taxpaying public want to see 14 percent of municipal workers denied access to employer provided health insurance, because that is the proportion in the private sector? Would the public want to see City agency heads earn orders of magnitude more than rank and file workers, because that is the compensation standard in the corporate sector? Would the public want to see high-performing public employees receive 6-figure bonuses, because that is the incentive system in some private industries? Clearly, public sector compensation policies are not designed merely to emulate private-sector practices, but also to express community standards of fairness and propriety. What those standards are cannot be determined by budget analysts and economists.
RETIREMENT SECURITY NYC
Comptroller of the City of New York
1 Centre Street, New York, NY 10007
comptroller.nyc.gov
New York City ComptrollerJohn C. Liu