Embed Size (px)
Citation preview
Municipal fleets and plug-in vehicles in Indianapolis
Will St.ClairVice President Vision Fleet
Manuel MendezProject Manager Indianapolis Office of Audit and Performance
June 17, 2015
Copyr
ight
© 2
014 b
y V
isio
n F
leet
Capital, L
LC
. A
ll rights
reserv
ed.
PRELIMINARY DRAFT
Introductions
Works at Vision Fleet – Indy’s
partner for the Freedom Fleet
Partners with public fleets
considering EV/AFVs
Will St. Clair
Operational lead for Indianapolis
Freedom Fleet project
Manages day to day operations of
Freedom Fleet
Manuel Mendez
Project Manager
Indianapolis Office of Audit and Performance
Vice President
Vision Fleet
Copyr
ight
© 2
014 b
y V
isio
n F
leet
Capital, L
LC
. A
ll rights
reserv
ed.
PRELIMINARY DRAFT
Agenda
• Introduction to Indianapolis’s “Freedom Fleet”
• Case for change: Electric vehicle economics
• Barriers to EV adoption and Indy’s solutions
• So what? What does this mean for me?
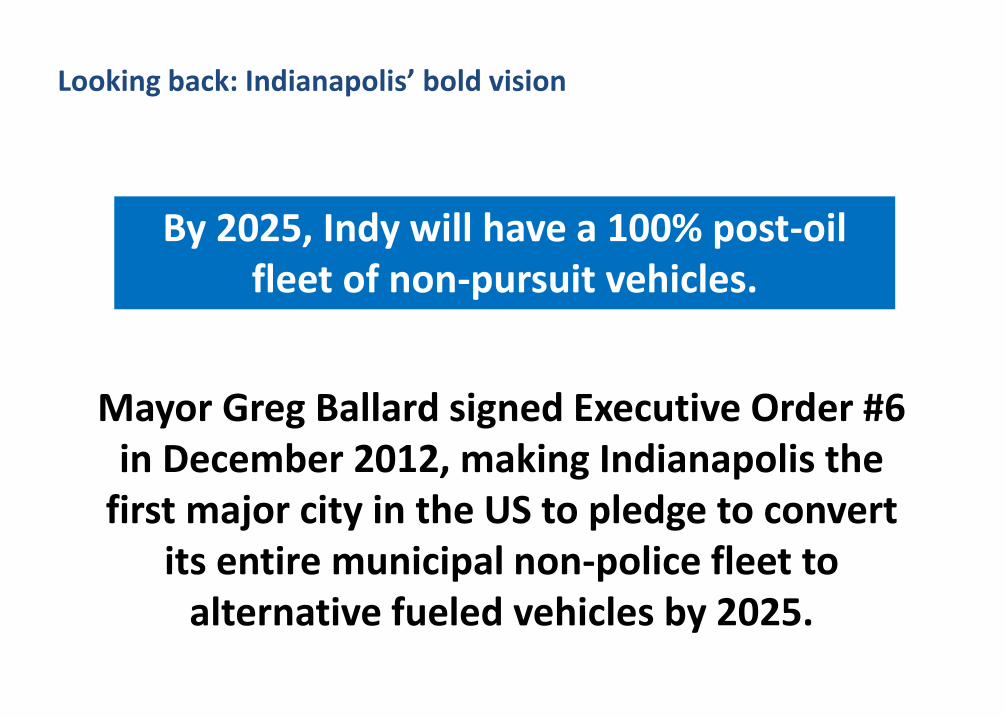
By 2025, Indy will have a 100% post-oil fleet of non-pursuit vehicles.
Mayor Greg Ballard signed Executive Order #6 in December 2012, making Indianapolis the
first major city in the US to pledge to convert its entire municipal non-police fleet to
alternative fueled vehicles by 2025.
Looking back: Indianapolis’ bold vision
Copyr
ight
© 2
014 b
y V
isio
n F
leet
Capital, L
LC
. A
ll rights
reserv
ed.
PRELIMINARY DRAFT
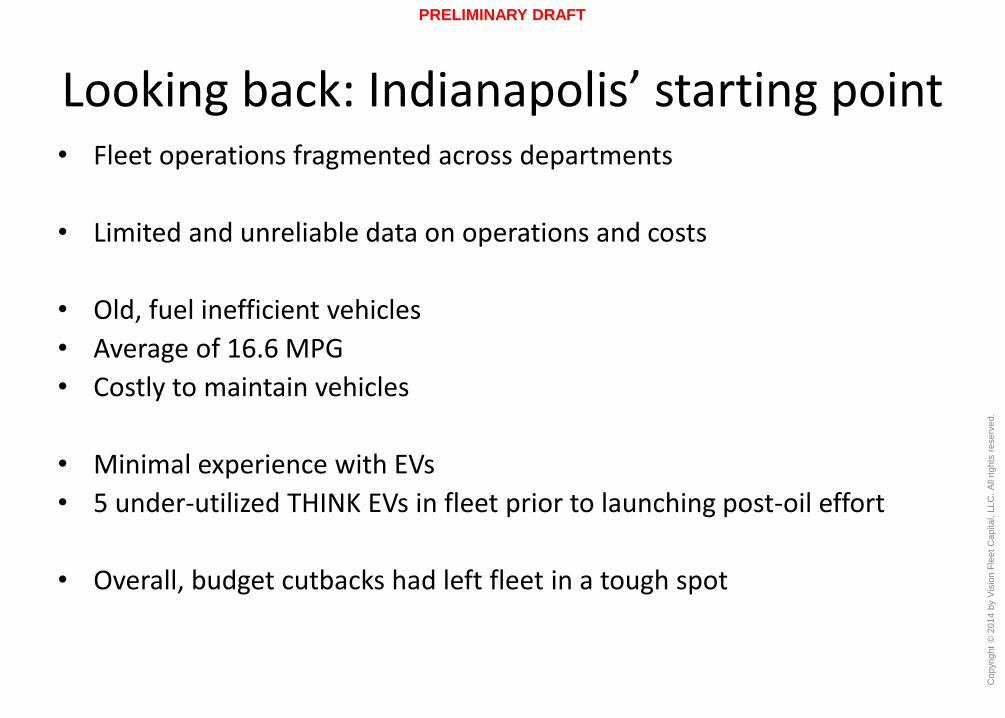
Looking back: Indianapolis’ starting point• Fleet operations fragmented across departments
• Limited and unreliable data on operations and costs
• Old, fuel inefficient vehicles
• Average of 16.6 MPG
• Costly to maintain vehicles
• Minimal experience with EVs
• 5 under-utilized THINK EVs in fleet prior to launching post-oil effort
• Overall, budget cutbacks had left fleet in a tough spot
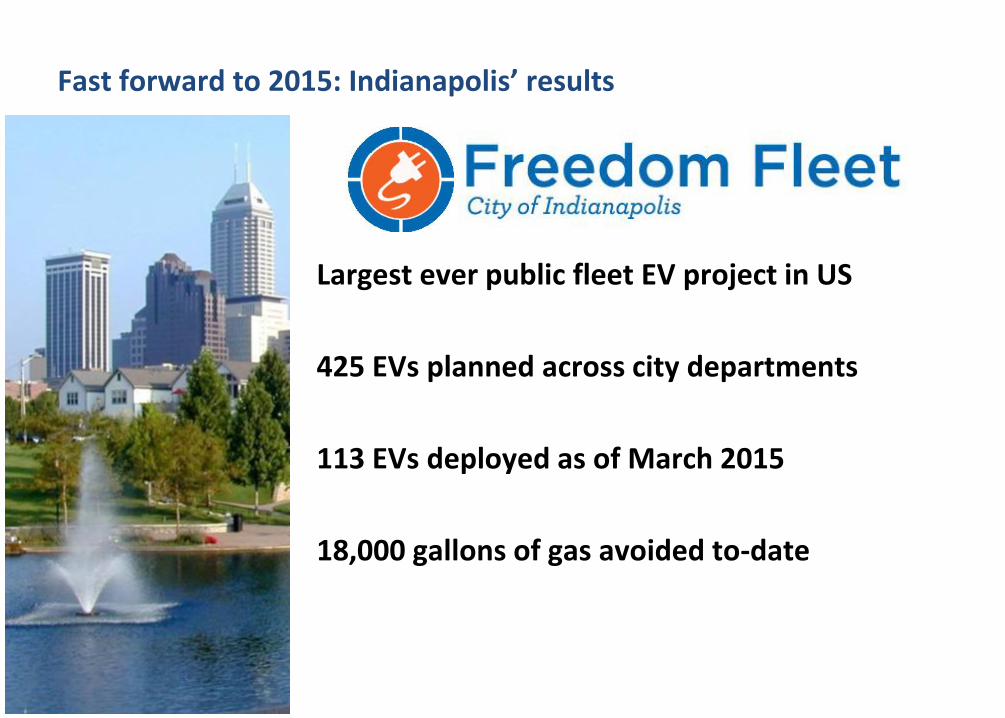
Fast forward to 2015: Indianapolis’ results
Largest ever public fleet EV project in US
425 EVs planned across city departments
113 EVs deployed as of March 2015
18,000 gallons of gas avoided to-date
Copyr
ight
© 2
014 b
y V
isio
n F
leet
Capital, L
LC
. A
ll rights
reserv
ed.
PRELIMINARY DRAFT
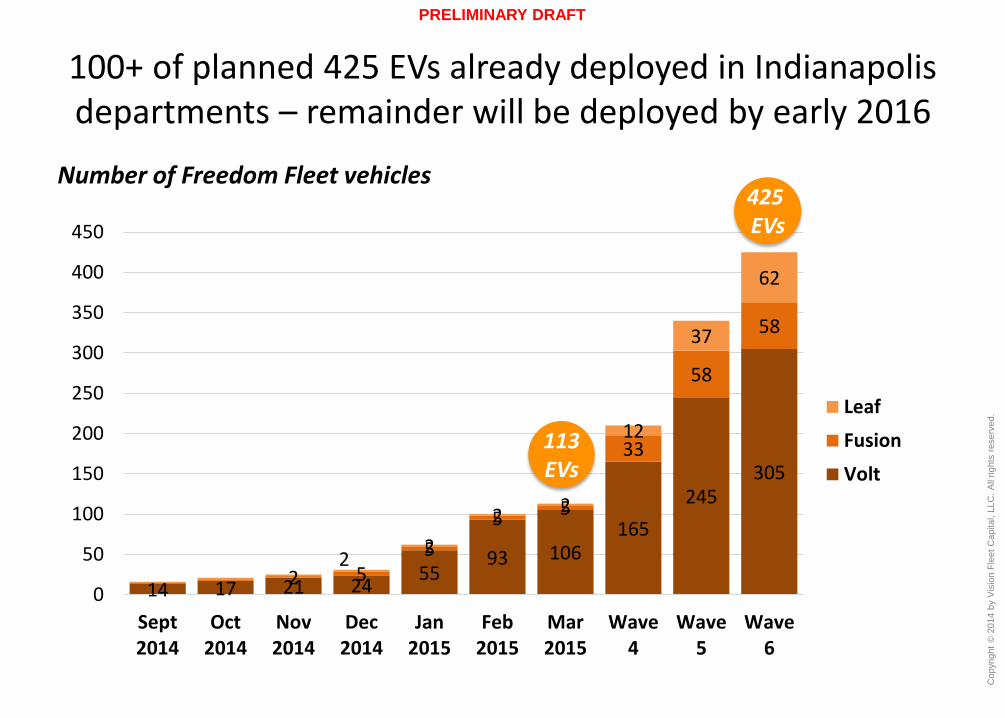
100+ of planned 425 EVs already deployed in Indianapolis departments – remainder will be deployed by early 2016
14 17 21 2455
93 106165
245305
2 55
5 5
33
58
58
22
2 2
12
37
62
0
50
100
150
200
250
300
350
400
450
Sept2014
Oct2014
Nov2014
Dec2014
Jan2015
Feb2015
Mar2015
Wave4
Wave5
Wave6
Leaf
Fusion
Volt
425 EVs
Number of Freedom Fleet vehicles
113EVs
Copyr
ight
© 2
014 b
y V
isio
n F
leet
Capital, L
LC
. A
ll rights
reserv
ed.
PRELIMINARY DRAFT
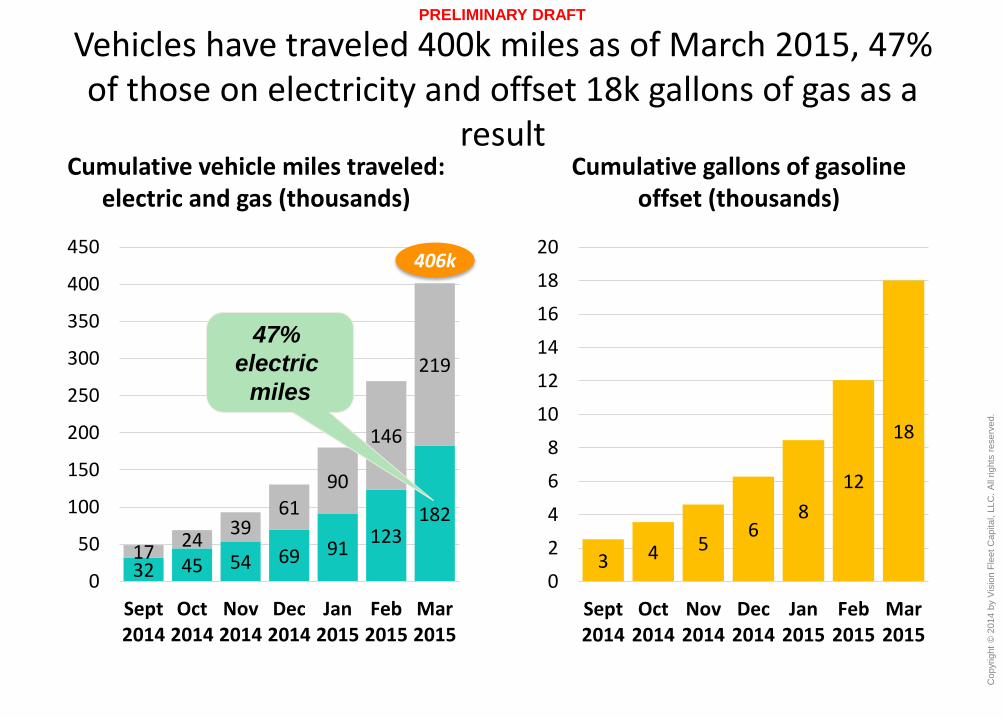
Vehicles have traveled 400k miles as of March 2015, 47% of those on electricity and offset 18k gallons of gas as a
result
3 4 56
8
12
18
0
2
4
6
8
10
12
14
16
18
20
Sept2014
Oct2014
Nov2014
Dec2014
Jan2015
Feb2015
Mar2015
Cumulative gallons of gasoline offset (thousands)
32 45 54 69 91123
182
1724
3961
90
146
219
0
50
100
150
200
250
300
350
400
450
Sept2014
Oct2014
Nov2014
Dec2014
Jan2015
Feb2015
Mar2015
Cumulative vehicle miles traveled: electric and gas (thousands)
47%
electric
miles
406k
Copyr
ight
© 2
014 b
y V
isio
n F
leet
Capital, L
LC
. A
ll rights
reserv
ed.
PRELIMINARY DRAFT
Why is tracking and monitoring so critical for PHEVs?
Copyr
ight
© 2
014 b
y V
isio
n F
leet
Capital, L
LC
. A
ll rights
reserv
ed.
PRELIMINARY DRAFT
Agenda
• Introduction to Indianapolis’s “Freedom Fleet”
• Case for change: Electric vehicle economics
• Barriers to EV adoption and Indy’s solutions
• So what? What does this mean for me?
Copyr
ight
© 2
014 b
y V
isio
n F
leet
Capital, L
LC
. A
ll rights
reserv
ed.
PRELIMINARY DRAFT
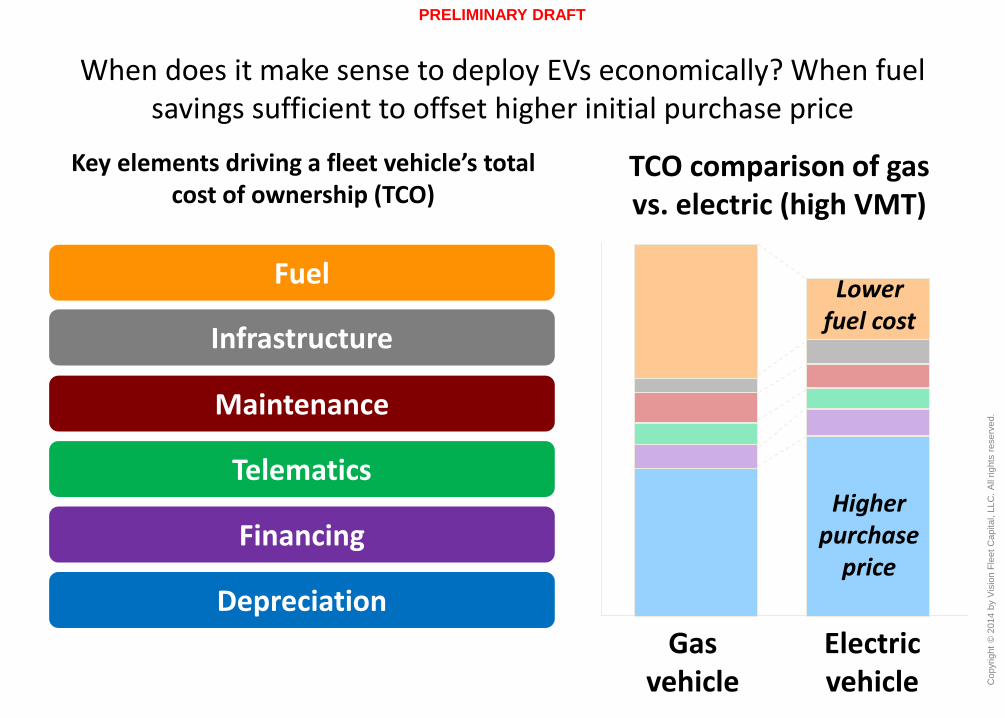
When does it make sense to deploy EVs economically? When fuel savings sufficient to offset higher initial purchase price
Key elements driving a fleet vehicle’s total cost of ownership (TCO)
TCO comparison of gas vs. electric (high VMT)
Depreciation
Fuel
Maintenance
Financing
Telematics
Infrastructure
Gas vehicle
Electric vehicle
Higher purchase
price
Lower fuel cost
Copyr
ight
© 2
014 b
y V
isio
n F
leet
Capital, L
LC
. A
ll rights
reserv
ed.
PRELIMINARY DRAFT
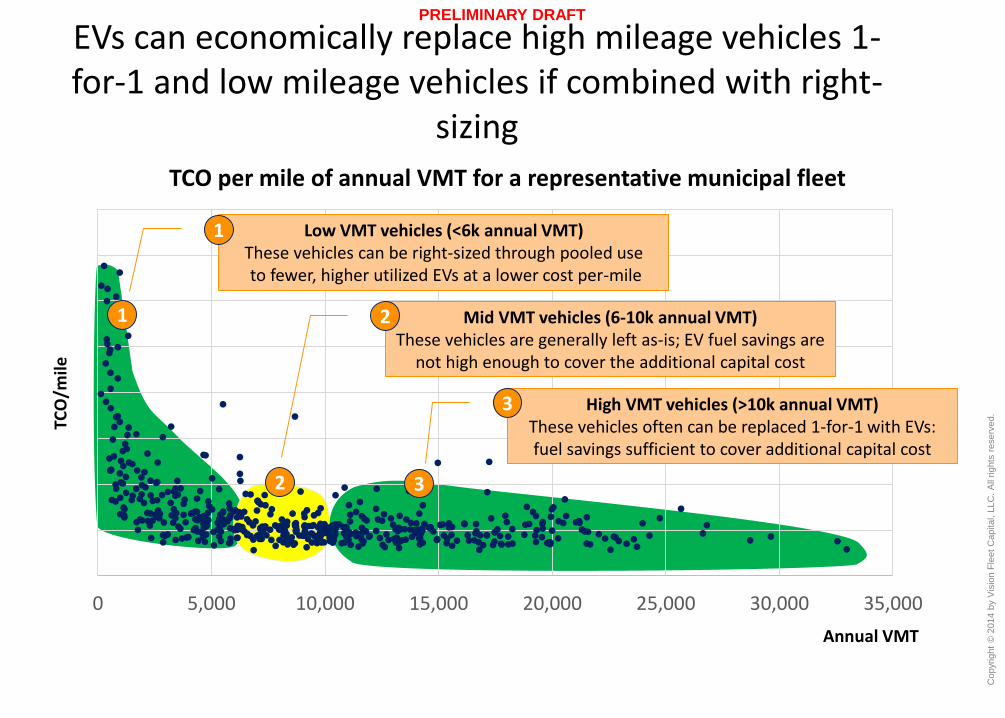
0 5,000 10,000 15,000 20,000 25,000 30,000 35,000
TCO per mile of annual VMT for a representative municipal fleet
EVs can economically replace high mileage vehicles 1-for-1 and low mileage vehicles if combined with right-
sizing
Annual VMT
TCO
/mile
High VMT vehicles (>10k annual VMT)These vehicles often can be replaced 1-for-1 with EVs: fuel savings sufficient to cover additional capital cost
Low VMT vehicles (<6k annual VMT)These vehicles can be right-sized through pooled useto fewer, higher utilized EVs at a lower cost per-mile
1
2 3
Mid VMT vehicles (6-10k annual VMT) These vehicles are generally left as-is; EV fuel savings are
not high enough to cover the additional capital cost
1
2
3
Copyr
ight
© 2
014 b
y V
isio
n F
leet
Capital, L
LC
. A
ll rights
reserv
ed.
PRELIMINARY DRAFT
Agenda
• Introduction to Indianapolis’s “Freedom Fleet”
• Case for change: Electric vehicle economics
• Barriers to EV adoption and Indy’s solutions
• So what? What does this mean for me?
Copyr
ight
© 2
014 b
y V
isio
n F
leet
Capital, L
LC
. A
ll rights
reserv
ed.
PRELIMINARY DRAFT
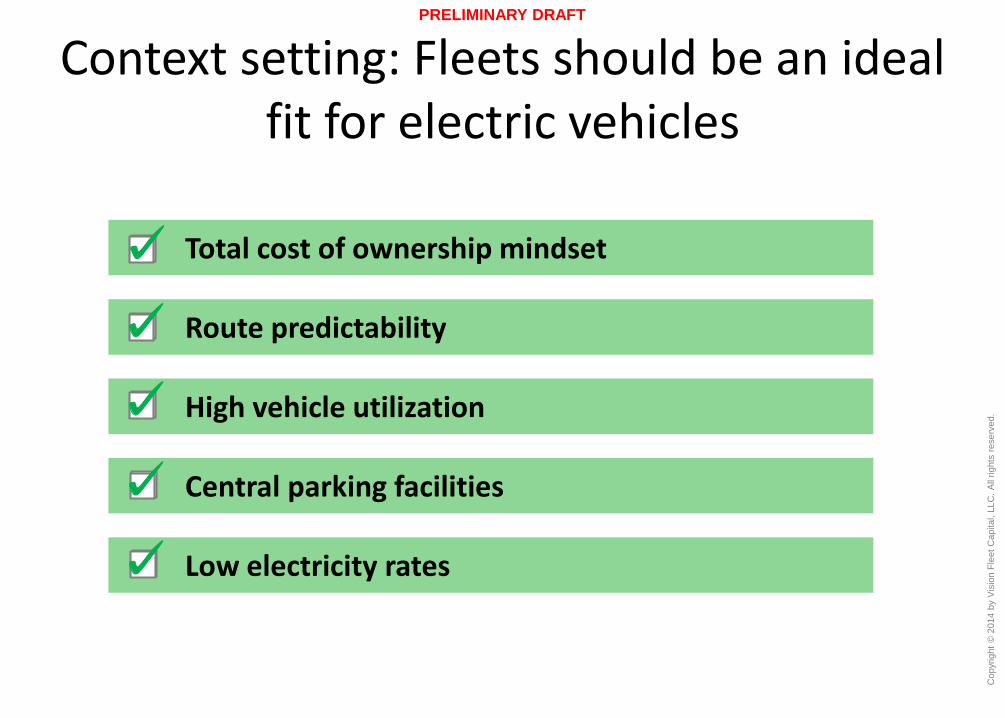
Context setting: Fleets should be an ideal fit for electric vehicles
Total cost of ownership mindset
Route predictability
High vehicle utilization
Central parking facilities
Low electricity rates
Copyr
ight
© 2
014 b
y V
isio
n F
leet
Capital, L
LC
. A
ll rights
reserv
ed.
PRELIMINARY DRAFT
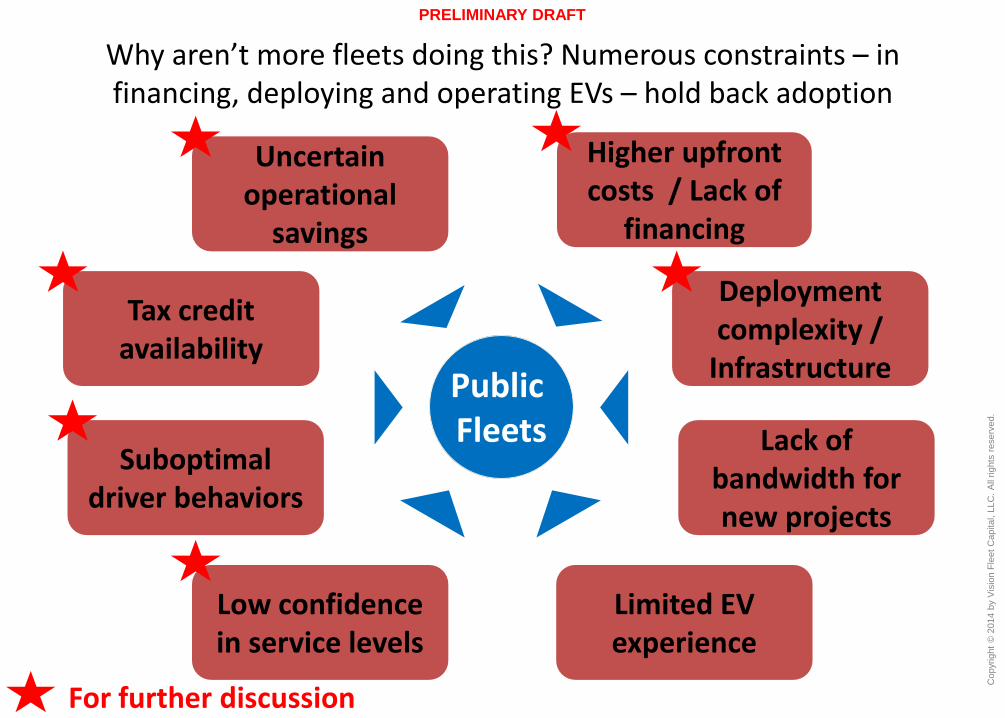
Higher upfront costs / Lack of
financing
Uncertain operational
savings
Suboptimal driver behaviors
Deployment complexity /
Infrastructure
Limited EV experience
Lack of bandwidth for new projects
Tax credit availability
Low confidence in service levels
Public Fleets
Why aren’t more fleets doing this? Numerous constraints – in financing, deploying and operating EVs – hold back adoption
For further discussion
Copyr
ight
© 2
014 b
y V
isio
n F
leet
Capital, L
LC
. A
ll rights
reserv
ed.
PRELIMINARY DRAFT
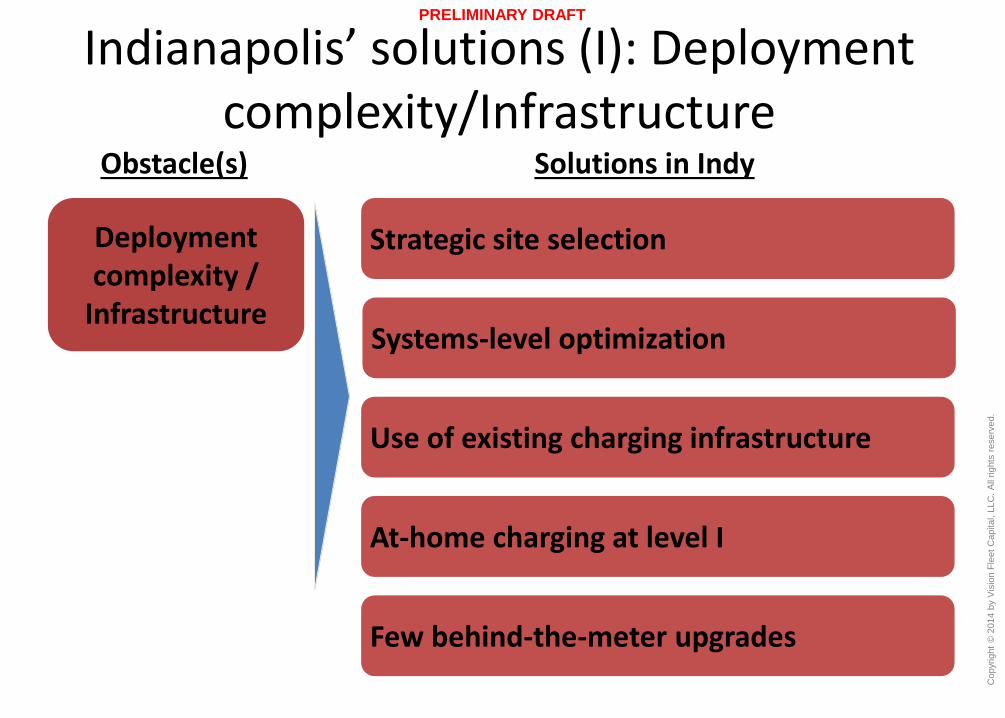
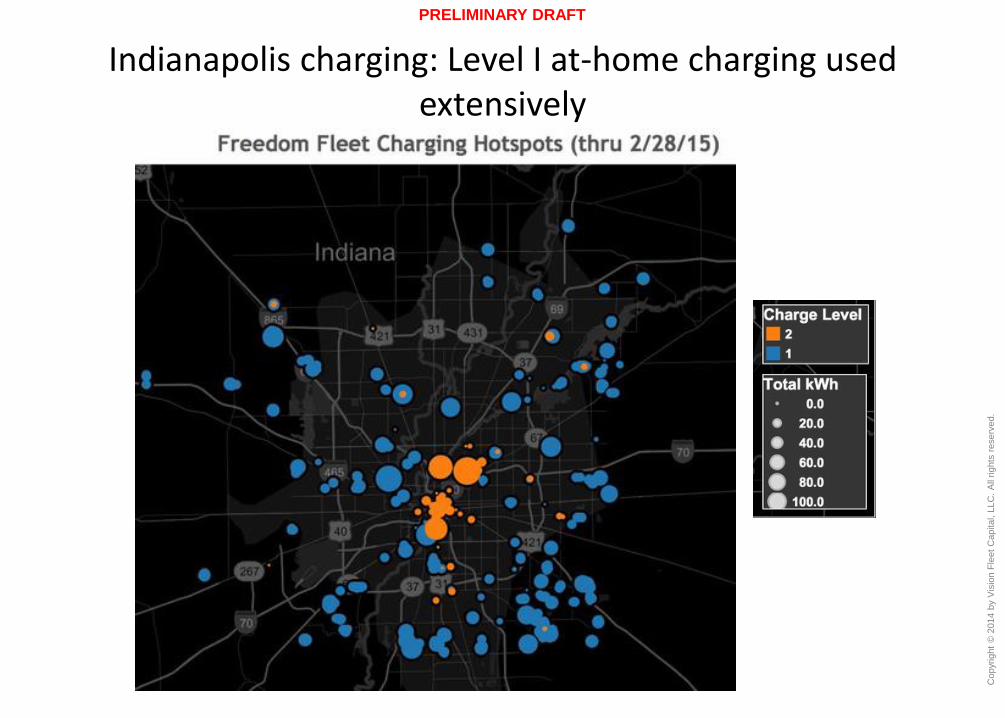
Indianapolis’ solutions (I): Deployment complexity/Infrastructure
Deployment complexity /
Infrastructure
Obstacle(s) Solutions in Indy
Strategic site selection
Systems-level optimization
Use of existing charging infrastructure
At-home charging at level I
Few behind-the-meter upgrades
Copyr
ight
© 2
014 b
y V
isio
n F
leet
Capital, L
LC
. A
ll rights
reserv
ed.
PRELIMINARY DRAFT
Indianapolis charging: Level I at-home charging used extensively
Copyr
ight
© 2
014 b
y V
isio
n F
leet
Capital, L
LC
. A
ll rights
reserv
ed.
PRELIMINARY DRAFT
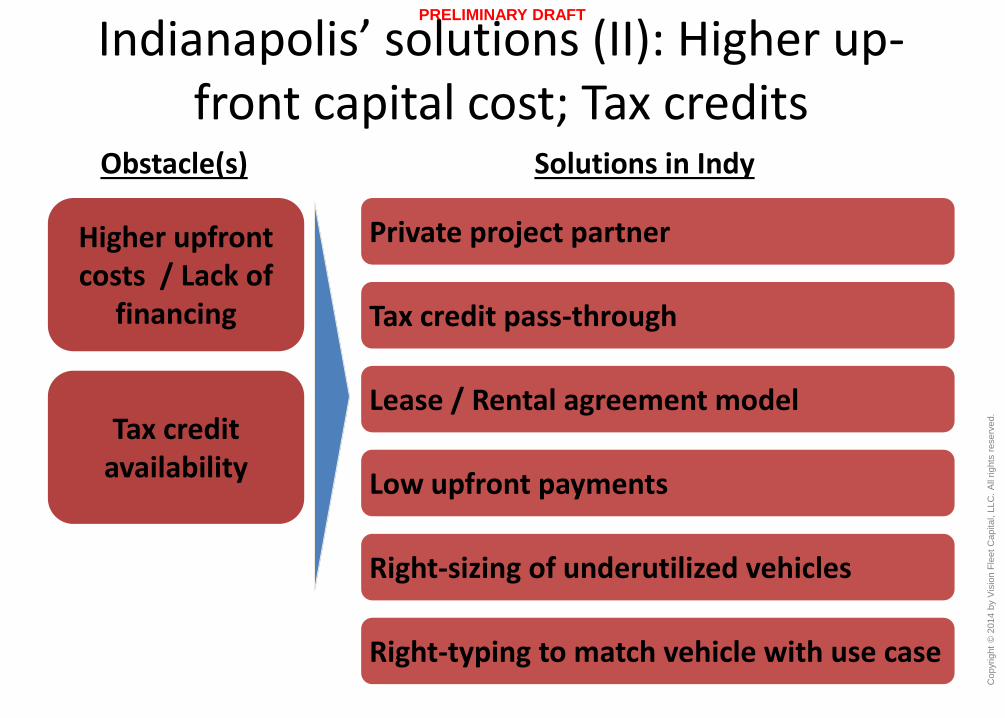
Indianapolis’ solutions (II): Higher up-front capital cost; Tax credits
Higher upfront costs / Lack of
financing
Obstacle(s) Solutions in Indy
Private project partner
Tax credit pass-through
Lease / Rental agreement model
Low upfront payments
Right-sizing of underutilized vehicles
Right-typing to match vehicle with use case
Tax credit availability
PRELIMINARY DRAFT
0
10
20
30
40
50
60
70
80
90
Q1 Q2 Q3 Q4 Q1 Q2 Q3 Q4 Q1 Q2 Q3 Q4 Q1 Q2 Q3 Q4 Q1 Q2 Q3 Q4 Q1 Q2 Q3 Q4
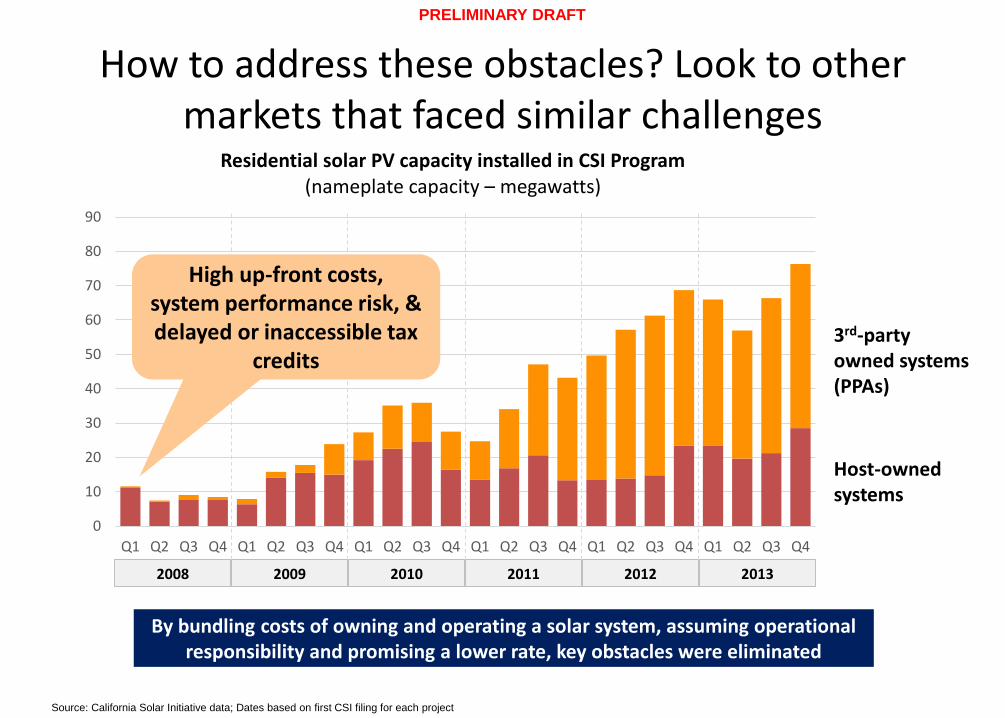
Residential solar PV capacity installed in CSI Program (nameplate capacity – megawatts)
3rd-party owned systems(PPAs)
Host-owned systems
Source: California Solar Initiative data; Dates based on first CSI filing for each project
2008 2009 2010 2011 2012 2013
High up-front costs, system performance risk, & delayed or inaccessible tax
credits
By bundling costs of owning and operating a solar system, assuming operational responsibility and promising a lower rate, key obstacles were eliminated
How to address these obstacles? Look to other markets that faced similar challenges
Copyr
ight
© 2
014 b
y V
isio
n F
leet
Capital, L
LC
. A
ll rights
reserv
ed.
PRELIMINARY DRAFT
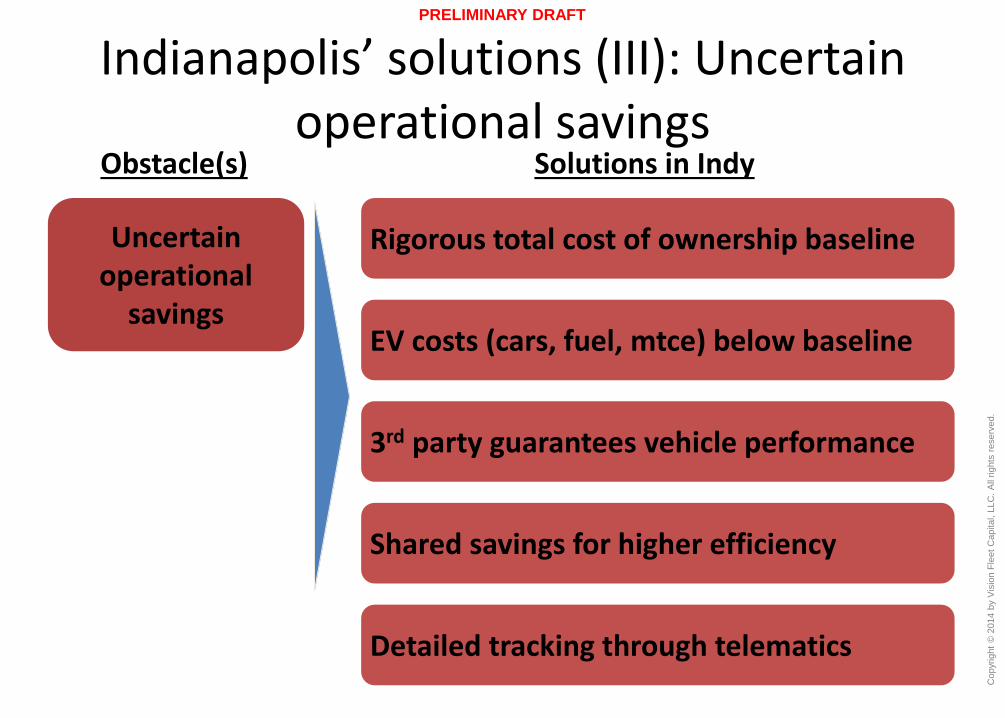
Indianapolis’ solutions (III): Uncertain operational savings
Uncertain operational
savings
Obstacle(s) Solutions in Indy
Rigorous total cost of ownership baseline
EV costs (cars, fuel, mtce) below baseline
3rd party guarantees vehicle performance
Shared savings for higher efficiency
Detailed tracking through telematics
Copyr
ight
© 2
014 b
y V
isio
n F
leet
Capital, L
LC
. A
ll rights
reserv
ed.
PRELIMINARY DRAFT
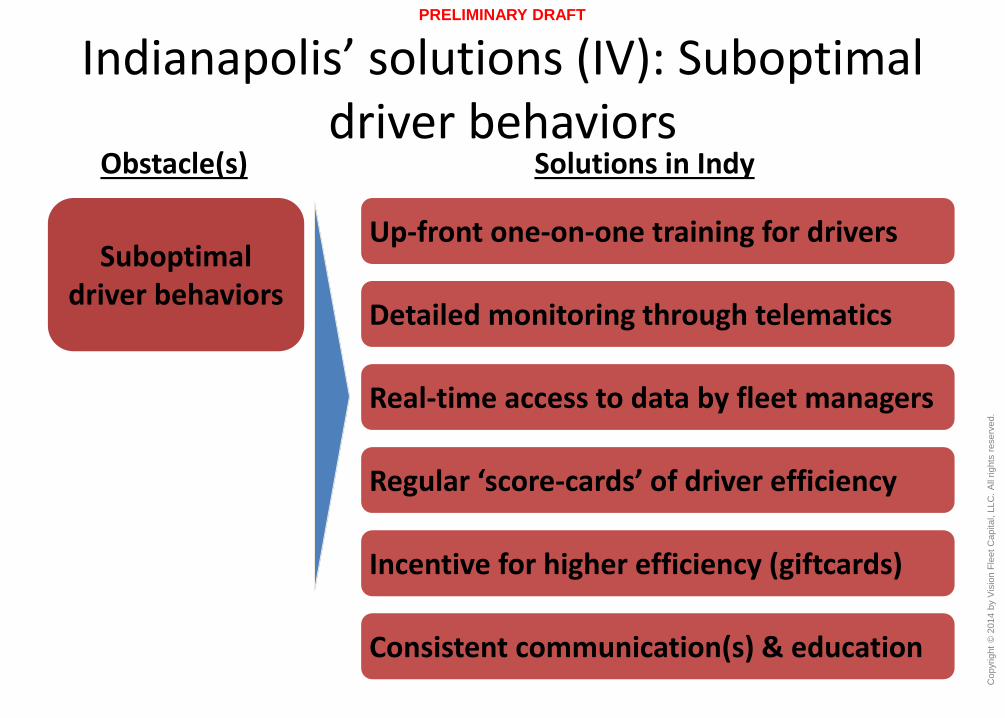
Indianapolis’ solutions (IV): Suboptimal driver behaviors
Suboptimal driver behaviors
Obstacle(s) Solutions in Indy
Up-front one-on-one training for drivers
Detailed monitoring through telematics
Real-time access to data by fleet managers
Regular ‘score-cards’ of driver efficiency
Incentive for higher efficiency (giftcards)
Consistent communication(s) & education
PRELIMINARY DRAFT
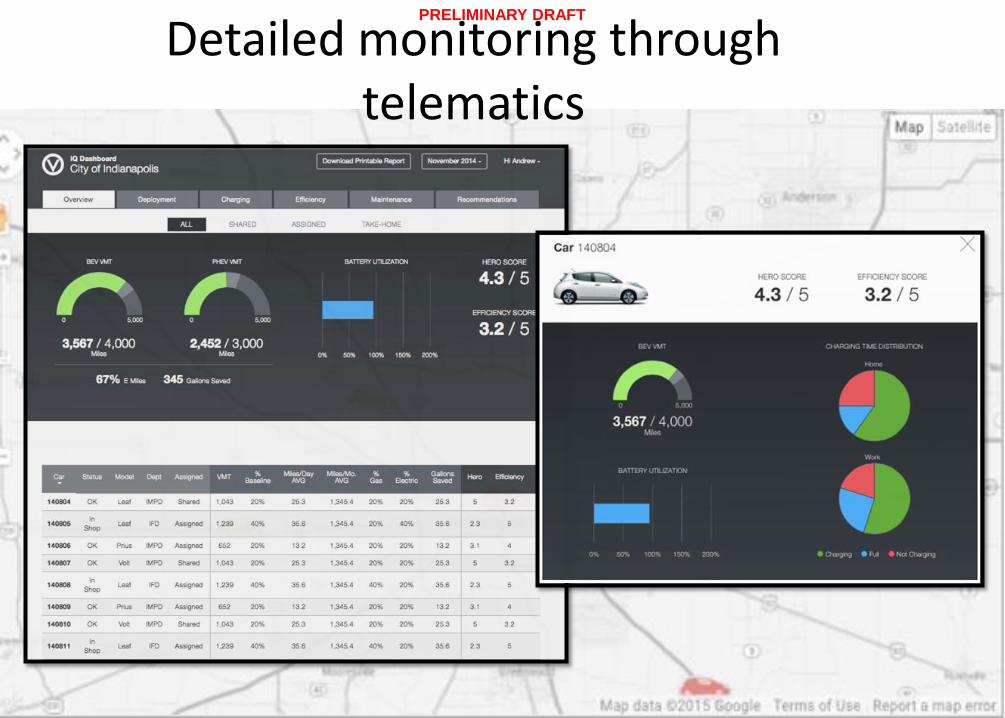
Detailed monitoring through telematics
Copyr
ight
© 2
014 b
y V
isio
n F
leet
Capital, L
LC
. A
ll rights
reserv
ed.
PRELIMINARY DRAFT
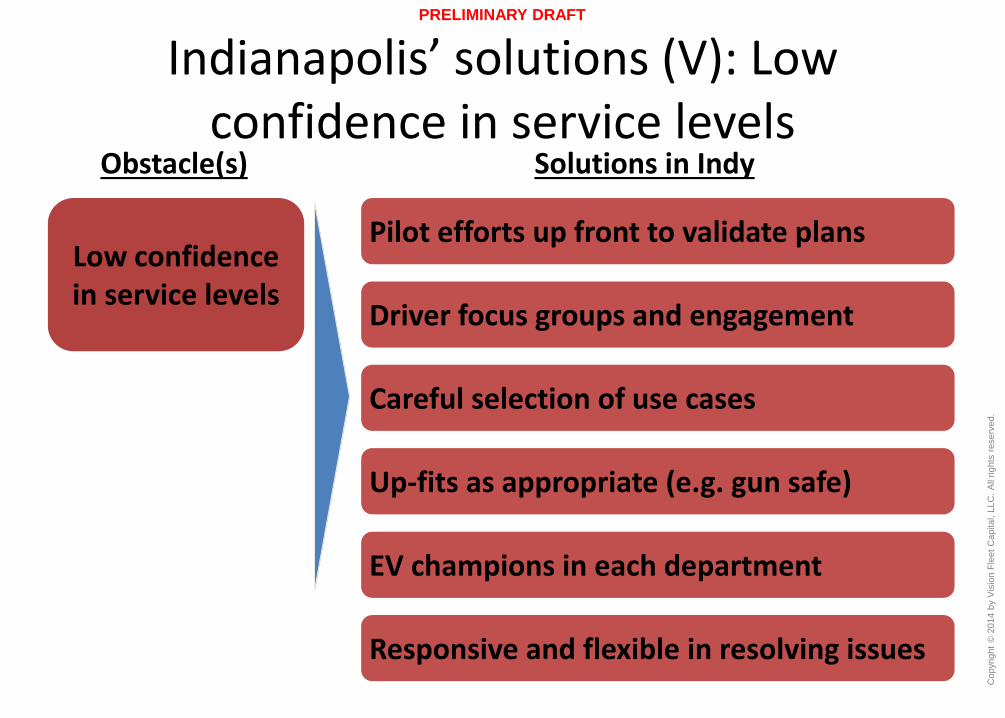
Indianapolis’ solutions (V): Low confidence in service levels
Low confidence in service levels
Obstacle(s) Solutions in Indy
Pilot efforts up front to validate plans
Driver focus groups and engagement
Careful selection of use cases
Up-fits as appropriate (e.g. gun safe)
EV champions in each department
Responsive and flexible in resolving issues
Copyr
ight
© 2
014 b
y V
isio
n F
leet
Capital, L
LC
. A
ll rights
reserv
ed.
PRELIMINARY DRAFT
Agenda
• Introduction to Indianapolis’s “Freedom Fleet”
• Case for change: Electric vehicle economics
• Barriers to EV adoption and Indy’s solutions
• So what? What does this mean for me?
Copyr
ight
© 2
014 b
y V
isio
n F
leet
Capital, L
LC
. A
ll rights
reserv
ed.
PRELIMINARY DRAFT
Summarizing it all: Learnings from Indianapolis
• New technology requires a new approach
• Difficult to achieve bold goals acting alone – find capable partners
• Comprehensive strategy needed – can’t just hope for success
• Data and monitoring is critical to delivering expected value
• Technology is proven – good, battle-tested EV options available
• Potential financial benefits are substantial when done right