Embed Size (px)
Citation preview

Polysaccharide Fouling in Reverse Osmosis
and Forward Osmosis Desalination
and Its Alleviation
Zhangwang Xie
This thesis is presented for the degree of
Doctor of Philosophy
in Environmental Engineering
Murdoch University
2015

DECLARATION
i
Declaration
I declare that, except where specific reference is made in the text to the work
conducted by other authors, this thesis is my own account of my research and
contains as its main content work that has not previously been submitted for a
degree at any university.
Name: Zhangwang Xie Signature: _______________
Date: 30/07/2015 Date: ________________
ACKNOWLEDGEMENT
ii
Acknowledgement
I would like to acknowledge my supervisors Dr. Dan Li, Prof. Goen Ho, Dr.
Lucy Skillman and Dr. Ralf Cord-Ruwisch for their long-term supervision.
I would like to thank Prof. Goen Ho. Without his help, I would not have
attended Murdoch University. I would also like to thank him for the time he
dedicated to supervising, both in group settings and individually.
I would like to acknowledge my principal supervisor Dr. Dan Li for her
consistent care and concern about my research progress. I am grateful for her
help during writing papers and the thesis.
I would like to express my appreciation to Dr. Lucy Skillman. I appreciate her
support in providing necessary equipment and chemicals for my experiments
and helping me with writings.
I am thankful to Dr. Ralf Cord-Ruwisch. The discussions between us generated
some amazing ideas.
Many thanks are owed to Maedeh, Veena and Rabbani for their encouragement
and support.
The financial support of Murdoch University and National Center of Excellence
in Desalination made this research possible.

ABSTRACT
3
Abstract
Membrane separation processes, including forward osmosis (FO) and reverse
osmosis (RO), for application in water desalination are plagued by membrane
fouling. In particular, membrane biofouling is unpredictable in its nature and
affected by numerous factors. One of the major contributors to biofouling is the
extracellular polymeric substances (EPS) produced by bacteria, especially the
polysaccharides that form a large part of EPS.
The objectives of this study are to understand the polysaccharide fouling
mechanisms based on a comparison of polysaccharide fouling in FO and RO
and to find suitable alleviating agents for polysaccharide fouling mitigation.
Three major tasks were conducted in this study. Firstly, polysaccharide fouling
in FO and RO were compared under identical solution chemistry and
operational conditions to understand the respective fouling mechanisms in FO
and RO. Secondly, some alleviating agents for mitigation of polysaccharide
fouling in FO and RO were tested to demonstrate the fouling alleviation
mechanism. Thirdly, a model of hydraulic resistances was developed to
illustrate membrane fouling mechanisms based on analysis of the contribution
of hydraulic resistances to permeate flux decline.
Major findings are:
1) Commercial polysaccharides and polysaccharides isolated from naturally
adherent bacteria behaved differently in membrane fouling, which showed
that alginate was not a typical model and it is important to select a proper
model for polysaccharide fouling.
2) Under identical conditions, membrane fouling by both commercial and
isolated polysaccharides was more severe in RO than FO, indicating the
importance of pressure source in membrane fouling.

ABSTRACT
iv
3) RO fouling was likely dominated by foulant – foulant interaction which was
greatly affected by calcium ions, while FO fouling could be largely
governed by foulant – membrane interaction, which was greatly influenced
by solution viscosity.
4) Sodium nitroprusside (SNP) at a proper dose was found to be able to reduce
membrane fouling, which could be explained by the electrostatic repulsion
between polysaccharides and SNP.
5) Presence of calcium ions played a crucial role in polysaccharide fouling and
its alleviation, with its presence leading to significant increase in cake
resistance in RO fouling and reducing alleviation efficiency.

SYMBOLS AND ABBREVIATIONS
3
Symbols and abbreviations
A Water permeability coefficient of the membrane (m/(s·Pa))
Am Effective membrane area (m2)
ASW Artificial seawater
B Solute permeability coefficient of the membrane (m/s)
BEOP Bioflim-enhanced osmotic pressure
BSA Bovine serum albumin
C Concentration of solute (mol/L or M)
Ccp Solution concentration of the salt on the membrane surface
(mol/L or M)
Cf Initial conductivity of the feed solution (μs)
CD Charge density
CECP Cake-enhanced concentration polarization
CEOP Cake-enhanced osmotic pressure
Cp Conductivity of permeate (μs)
Cpolymer Concentration of the polymer (g/L)
CTA Cellulose triacetate
DI Deionized (water)
DICP Dilutive internal concentration polarization
DS Draw solution
ECP External concentration polarization
EDTA Ethylenediaminetetraacetic acid
EPS extracellular polymeric substances
FO Forward osmosis

SYMBOLS AND ABBREVIATIONS
vi
FS Feed solution
HA Humic acid
i Van’t Hoff factor
ICP Internal concentration polarization
IEP Isoelectric point
J, Jw Water permeate flux (LMH or m/s)
Js Solute flux (mole/(m2·h))
Jw0 Water permeate flux at time 0 (LMH or m/s)
Jwt, Jt Water permeate flux at time t (LMH or m/s)
(Jt/J0)baseline Normalized flux value in the absence of alleviating agents at
time t (h)
(Jt/J0)alleviation Normalized flux value in the presence of alleviating agents at
time t (h)
KFCN Potassium ferricyanide
M2+
Divalent cations
MWs Molecular weights (kDa)
n Van’t Hoff coefficient
NaDDC Sodium dichloroisocyanurate
P Pressure on the solution side (Pa)
PASP Polyaspartic acid
PA TFC Polyamide thin film composite
P0 Pressure on t the permeate side (Pa)
∆P, ∆Pm Trans-membrane pressure difference (Pa)
R Rejection coefficient
Rb Blockage resistance (m-1
)

SYMBOLS AND ABBREVIATIONS
vii
Rc Cake resistance (m-1
)
Rcp Concentration polarization resistance (m-1
)
Rcpt Concentration polarization resistance at time t (m-1
)
Rct Cake resistance at time t (m-1
)
Rg Universal gas constant (Rg=0.0831 L·bar/(mol·K))
Rif irreversible fouling resistance (m-1
)
Rm Membrane resistance (m-1
)
RO Reverse osmosis
Rrf reversible fouling resistance (m-1
)
Rt Total hydraulic resistance (m-1
)
SAD Surface area difference
SAMs Self-assembled monolayers
SNP Sodium nitroprusside
t Time for collecting the permeate (s)
T Absolute temperature (K)
TRP Thermo-responsive polymer
V Volume of the collected permeate (L)
W0 Weight of the empty tube (g)
W1 Weight of the tube with the dried polymer (g)
Wd Weight of the fouled membrane after a fouling test (g)
Wi Weight of the dried membrane after the baseline test (g)
Wfoulant Weight of polysaccharide deposited on the membrane surface
after 24 h fouling test (g)
µ Viscosity of the permeate (Pa·s)
µDI Water viscosity (Pa·s)

SYMBOLS AND ABBREVIATIONS
viii
π Osmotic pressure of solution (Pa)
πcp Osmotic pressure of salt on the membrane surface (Pa)
πfeed Osmotic pressure of the feed solution (Pa)
∆π Trans-membrane osmotic pressure difference (Pa)
ψ Alleviation efficiency (%)

TABLE OF CONTENTS
ix
Contents Declaration ....................................................................................................................... i
Acknowledgement .......................................................................................................... ii
Abstract .......................................................................................................................... iii
Symbols and abbreviations ............................................................................................. v
Chapter 1. Introduction ................................................................................................... 1
1.1 Background .................................................................................................... 1
1.1.2 Research questions ................................................................................... 2
1.2 Research objectives ........................................................................................ 2
1.3 Thesis structure .............................................................................................. 3
Chapter 2. Literature Review .......................................................................................... 4
2.1 Introduction to membrane desalination ...................................................... 4
2.1.1 Reverse osmosis ....................................................................................... 4
2.1.2 Forward osmosis ...................................................................................... 5
2.2 Membrane fouling ......................................................................................... 6
2.2.1 Membrane biofouling by extracellular polymeric substances ................. 7
2.2.2 Mechanism to biofouling: Foulant – membrane interactions and foulant
– foulant interactions ............................................................................................. 10
2.3 Overview of reverse osmosis fouling .......................................................... 11
2.3.1 The influential factors of foulant – membrane interactions ................... 12
2.3.2 The influential factors of foulant – foulant interactions ........................ 15
2.3.3 Subsequential effect of foulant adsorption on membrane fouling ......... 17
2.3.4 Hydraulic resistances ............................................................................. 17
2.4 Overview of forward osmosis fouling ......................................................... 19
2.4.1 Factors in the feed solution side that affect forward osmosis fouling ... 19
2.4.2 The draw solution plays an important role in forward osmosis fouling 21
2.5 Comparison of fouling in reverse osmosis and forward osmosis ............. 24
2.6 Membrane fouling control .......................................................................... 26
2.6.1 Membrane fouling mitigation by chemical compounds during the RO
process……………………………………………………………………..……..26
2.6.2 Other strategies for membrane fouling control ...................................... 29

TABLE OF CONTENTS
x
2.7 Concluding remarks .................................................................................... 31
Chapter 3. Materials and Methods ................................................................................ 33
3.1 Membrane .................................................................................................... 33
3.2 Polysaccharides ............................................................................................ 33
3.3 Alleviating agents ......................................................................................... 35
3.4 Chemicals and feed solutions ...................................................................... 36
3.5 Polymer preparation ................................................................................... 37
3.6 Bench-scale reverse osmosis and forward osmosis systems ..................... 39
3.7 Fouling and Alleviation tests ....................................................................... 42
3.8 Characterization and Calculation .............................................................. 43
3.8.1 Water flux and permeability of membrane ............................................ 43
3.8.2 Rejection coefficient by membrane ....................................................... 44
3.8.3 Determination of polymer solution concentration ................................. 45
3.8.4 Foulant Deposit Weight ......................................................................... 45
3.8.5 Hydraulic Resistance ............................................................................. 46
3.8.6 Fouling alleviation efficiency ................................................................ 46
Chapter 4. Polysaccharide fouling in reverse osmosis and forward osmosis ................ 48
4.1 A novel approach for maintaining a constant osmotic pressure in forward
osmosis ..................................................................................................................... 48
4.2 Polysaccharide fouling in reverse osmosis ................................................. 50
4.2.1 Effect of polysaccharide concentration on fouling ................................ 50
4.2.2 Comparison of fouling in reverse osmosis by model polysaccharides and
polysaccharide isolated from naturally adherent bacteria in a seawater desalination
plant……………………………………………………………………………….54
4.2.3 Effect of applied pressure on polysaccharide fouling in reverse
osmosis……………………………………………………………………………55
4.2.4 Effect of calcium ions on membrane fouling in reverse osmosis under
the applied hydraulic pressure of 500 psi .............................................................. 56
4.3 Polysaccharide fouling in forward osmosis ............................................... 57
4.3.1 Effect of feed solution on polysaccharide fouling in forward osmosis .. 57
4.3.2 Comparison of forward osmosis fouling by model polysaccharides and
polysaccharides isolated from naturally adherent bacteria in a seawater
desalination plant .................................................................................................. 61
4.4 Comparison of fouling in reverse osmosis and forward osmosis ............. 62

TABLE OF CONTENTS
xi
4.4.1 Comparison of membrane fouling in reverse osmosis and forward
osmosis by model polysaccharides ....................................................................... 62
4.4.2 Comparison of membrane fouling in reverse osmosis and forward
osmosis by polysaccharides isolated from naturally adherent bacteria in a
seawater desalination plant ................................................................................... 65
4.5 Summary ...................................................................................................... 66
Chapter 5. Alleviation of polysaccharide fouling in reverse osmosis and forward
osmosis .......................................................................................................................... 68
5.1 Alleviation of polysaccharide fouling in reverse osmosis ......................... 68
5.1.1 Effect of alleviating agent type on polysaccharide fouling alleviation in
reverse osmosis ..................................................................................................... 68
5.1.2 Effect of calcium ions on polysaccharide fouling and its alleviation by
sodium nitroprusside/potassium ferricyanide in reverse osmosis ......................... 72
5.1.3 Effect of alleviating agent concentration on polysaccharide fouling
alleviation in reverse osmosis ............................................................................... 76
5.1.4 Effect of applied hydraulic pressure on alleviation of polysaccharide
fouling using sodium nitroprusside in the presence of calcium ions .................... 77
5.2 Alleviation of polysaccharide fouling in forward osmosis........................ 80
5.2.1 Effect of alleviating agent type on alleviation of polysaccharide fouling
in forward osmosis ................................................................................................ 80
5.2.2 Effect of sodium nitroprusside concentration on alleviation of
polysaccharide fouling in forward osmosis........................................................... 82
5.3 Comparison of efficiency of sodium nitroprusside in alleviating
polysaccharide fouling between forward osmosis and reverse osmosis ............. 84
5.4 Summary ...................................................................................................... 86
Chapter 6. Modeling hydraulic resistances to permeate flux in RO membrane
separation ...................................................................................................................... 88
6.1 Description of the model of hydraulic resistances .................................... 88
6.2 Concentration polarization in the control experiment ............................. 93
6.3 Comparison of coupled effect of concentration polarization and cake
formation on the increase in hydraulic resistance to the permeate flux and sum
of their individual effects ........................................................................................ 95
6.4 Contribution of membrane and non-membrane resistances to permeate
flux during polysaccharide fouling tests ............................................................... 97
6.5 Effect of applied pressure on hydraulic resistance ................................... 98
6.6 Effect of calcium ions on hydraulic resistance .......................................... 99

TABLE OF CONTENTS
xii
6.7 Indication .................................................................................................... 101
6.8 Summary .................................................................................................... 101
Chapter 7. Conclusions and recommendations for future research ............................. 103
7.1 Conclusions ................................................................................................. 103
7.2 Recommendations for future research .................................................... 104
References ................................................................................................................... 106

CHAPTER 1
1
Chapter 1. Introduction
1.1 Background
1.1.1 Problem statements
Membrane desalination is widely applied to supply potable water. In particular,
reverse osmosis (RO) desalination using hydraulic pressure as driving force
dominates the worldwide desalination capacity installed [1]. Forward osmosis
(FO) using an osmotic pressure gradient as driving force has attracted an
increasing attention. However, comparison between FO and RO could only be
conducted based on the corrected normalized flux due to the continuously
diminished driving force in FO resulting from the continuous dilution of the
draw solution [2, 3]. A new protocol maintaining a constant driving force in FO
is necessary for a straightforward comparison with RO.
To date, biofouling remains a significant challenge in reverse osmosis (RO) and
forward osmosis (FO). It is complex due to the synergistic effect of bacteria and
the extracellular polymeric substances (EPS) they produce. EPS majorly
composed of polysaccharides has been found to play an important role in
biofouling [4], and polysaccharides are widely considered to be the major
contributor. In previous studies [3, 5-9], alginate was commonly used as the
model polysaccharide to study polysaccharide fouling in RO and FO, despite it
being not a typical representative for polysaccharides. In addition,
understanding on membrane fouling by polysaccharides isolated from bacteria
naturally adherent in a seawater desalination plant remains superficial. It is also
of importance how polysaccharides contribute to increase in hydraulic
resistance.
There were studies aimed for biofouling control. Several methods have been
developed including use of chemicals, pretreatment and use of spacers. In
particular, some studies using chemicals, such as sodium nitroprusside (SNP),

CHAPTER 1
2
were mostly focused on removal of biomass [10-17]. It is still unknown
whether SNP can effectively alleviate polysaccharide fouling.
1.1.2 Research questions
Several research questions are presented:
1. How can a constant driving force in forward osmosis (FO) be maintained to
better compare with reverse osmosis (RO)?
2. What are the differences in fouling behaviors between commercial
polysaccharides and polysaccharides isolated from bacteria naturally
adherent in a seawater desalination plant? Is there a better model
polysaccharide compared to alginate?
3. How much do polysaccharides increase hydraulic resistance?
4. Can sodium nitroprusside (SNP) effectively alleviate polysaccharide
fouling?
1.2 Research objectives
This study aimed to compare membrane fouling by different kinds of
polysaccharides in forward osmosis (FO) and reverse osmosis (RO), and
investigate polysaccharide fouling control using alleviating agents such that:
1. There is a straightforward comparison of polysaccharide fouling between
FO and RO.
2. A better understanding on fouling behaviors of commercial
polysaccharides and naturally produced polysaccharides in FO and RO can
be achieved.
3. It is clear about the contribution of the hydraulic resistances to membrane
fouling.
4. Polysaccharide fouling can be effectively mitigated by alleviating agents.

CHAPTER 1
3
1.3 Thesis structure
This thesis consists of seven chapters and their brief descriptions are described
as follows:
Chapter 1: Chapter One gives a brief background on the topic, lists the
objectives of the research and outlines the thesis structure.
Chapter 2: Chapter Two reviews the recent literature in regard to investigation
and comparison of membrane biofouling, especially by extracellular
polysaccharides, in reverse osmosis (RO) and forward osmosis (FO), and
methods for membrane biofouling control.
Chapter 3: Chapter Three describes some laboratory-scale systems and
necessary experimental tests, as well as calculations conducted to verify the
hypothesis.
Chapter 4: Chapter Four investigates and compares membrane fouling in RO
and FO by commercial polysaccharides and polysaccharides isolated from
naturally adherent bacteria in a seawater desalination plant, and discusses the
experimental results.
Chapter 5: Chapter Five investigates alleviation of polysaccharide fouling in
RO and FO using potential chemical compounds.
Chapter 6: Chapter Six describes a model of resistance in series developed to
demonstrate the contribution of hydraulic resistances to permeate flux in the
RO process.
Chapter 7: Chapter Seven contains the overall conclusion of this study as well
as implications from the obtained results.

CHAPTER 2
4
Chapter 2. Literature Review
2.1 Introduction to membrane desalination
With increasing water demand for increased human consumption, industries
and agriculture, water supplies have become an unprecedented challenge for the
world. While most of water covering the earth is seawater, amounting to 97% of
the total water on earth, only less than 1% of the total water is naturally available
fresh water. Therefore, the production of potable water has become a global
concern, and solutions such as water desalination have been developed rapidly.
Desalination refers to the process of removing salt from water to produce fresh
water. In 2009, the total global desalination capacity has grown to around 50
million m3 per day, and predicted to increase up to approximately 95 million m
3
per day by 2015 [18].
Desalination can be majorly divided into two categories, thermal desalination
and membrane desalination. While thermal desalination remains primary
technology of choice in the Middle East, membrane desalination processes have
been rapidly developed [19]. Currently, membrane desalination has surpassed
thermal desalination in new plant installation [19].
2.1.1 Reverse osmosis
In the last four decades, reverse osmosis (RO) membrane desalination has been
widely considered as the primary choice for new desalination plant installations.
RO desalination is conducted when the applied hydraulic pressure is greater
than the osmotic pressure of the feed solution (Fig.2.1 a). The positive
difference in pressure drives the water to permeate through the membrane,
while the salts are retained and concentrated on the membrane surface.
The RO membranes are able to reject monovalent ions, such as sodium ions. To
date, seawater RO membranes have achieved high salt rejection coefficient
higher than 99%, some even achieved as high as 99.7 ~ 99.8% [19, 20].

CHAPTER 2
5
Therefore, RO membrane desalination has the advantages as to high quality and
capacity of drinking water production. Today, RO desalination accounts for
61.1% of the worldwide desalination capacity installed [1].
(a) Reverse osmosis (b) Forward osmosis
Fig.2.1 Diagrams of (a) reverse osmosis (RO) and (b) forward osmosis (FO)
2.1.2 Forward osmosis
Forward osmosis (FO) is a membrane separation process in which water flows
from a low-osmotic-pressure feed solution (FS) to a high-osmotic-pressure
draw solution (DS) across a semi-permeable membrane (Fig.2.1 b) [21, 22]. FO
has become an increasingly interesting area of research and shown attractive
potential in the field of desalination [23, 24]. Rather than the high hydraulic
pressure required by pressure-driven membrane process, such as reverse
osmosis (RO), the FO process instead utilizes an osmotic pressure gradient as
driving force for separation; and could theoretically reduce energy consumption
in desalination [25]. Although a high-osmotic-pressure DS is required and
further separation of draw solute from water may be necessary in FO, FO has
considerable advantages compared with pressure-driven processes, with regards
to lower energy input [25], lower fouling propensity, easier fouling removal [2]
and higher water recovery [26]. For example, previous study used fertilizer as
the draw solute for low energy forward osmosis desalination and made fertilizer
solution for fertigation [27]. In this case, the FO desalination process consumed

CHAPTER 2
6
much less energy as there was no need to separate draw solute, the fertilizer,
from water after the FO process.
2.2 Membrane fouling
Membrane fouling is a major obstacle to the development of membrane
separation technologies. Membrane fouling occurs when the foulants in the feed
solution are rejected by the membrane surface as the water in the feed solution
permeates through the semi-permeable membrane, and block the membrane
pores or accumulate on the membrane surface forming a cake layer, which
increases concentration polarization and hydraulic resistance [3, 28, 29].
Membrane fouling causes flux reduction, increases energy consumption,
reduces membrane lifespan, and increases operation cost [19, 28, 30]. Generally,
membrane fouling is roughly categorized into four types based on the properties
of the rejected contaminants [31]:
1) Inorganic fouling caused by scaling or salt precipitation of sparingly soluble
salts);
2) Organic fouling resulted from mostly natural or effluent organic matters;
3) Colloidal fouling by accumulation of a colloidal cake layer on the
membrane surface;
4) Biofouling caused by formation of biofilm.
In particular, biofouling caused by biofilm formation is more complex than
fouling by any individual foulant, because biofilm consists of bacteria as well
as bacteria produced extracellular polymeric substances (EPS), which provides
structure for the biofilm and protects bacteria from environmental stresses [32].
Bacteria themselves play a key role in biofouling by growth and division. The
polysaccharides produced by bacteria contribute greatly to biofouling by
accumulation on the membrane surface, leading to increased hydraulic
resistance and flux decline. Therefore, it is of great importance to improve the
understanding of the contribution of EPS to membrane biofouling and develop
effective control methods for membrane fouling.
CHAPTER 2
7
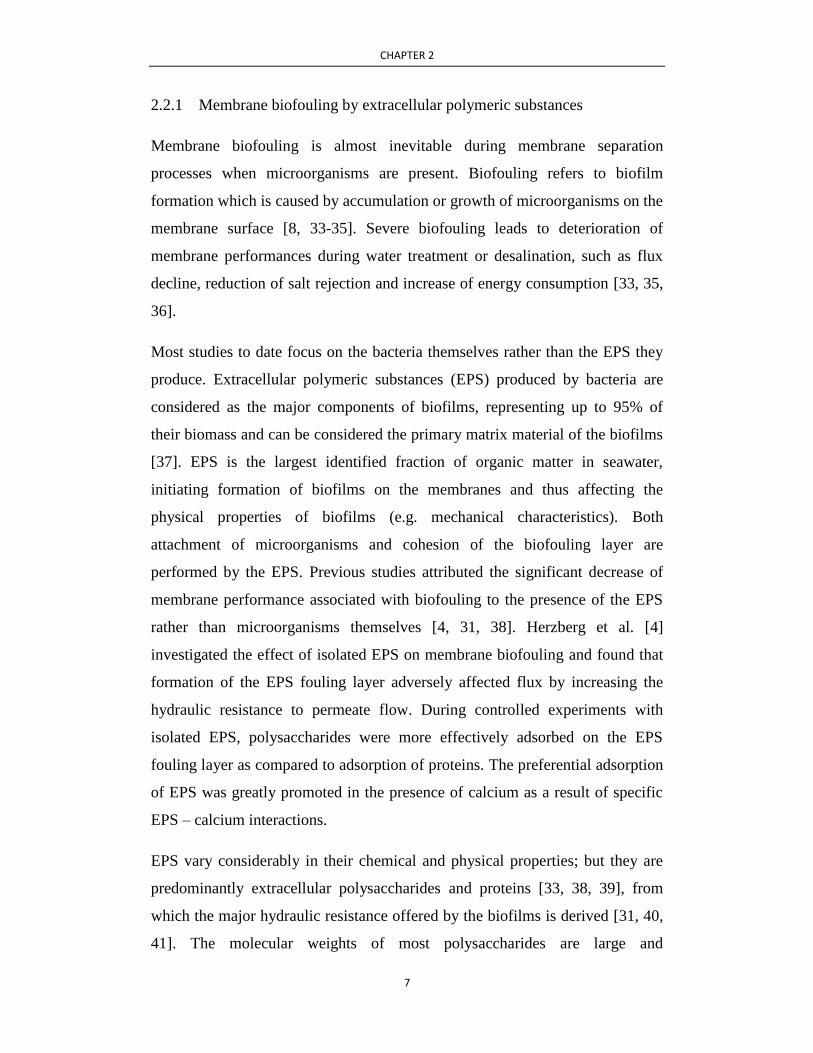
2.2.1 Membrane biofouling by extracellular polymeric substances
Membrane biofouling is almost inevitable during membrane separation
processes when microorganisms are present. Biofouling refers to biofilm
formation which is caused by accumulation or growth of microorganisms on the
membrane surface [8, 33-35]. Severe biofouling leads to deterioration of
membrane performances during water treatment or desalination, such as flux
decline, reduction of salt rejection and increase of energy consumption [33, 35,
36].
Most studies to date focus on the bacteria themselves rather than the EPS they
produce. Extracellular polymeric substances (EPS) produced by bacteria are
considered as the major components of biofilms, representing up to 95% of
their biomass and can be considered the primary matrix material of the biofilms
[37]. EPS is the largest identified fraction of organic matter in seawater,
initiating formation of biofilms on the membranes and thus affecting the
physical properties of biofilms (e.g. mechanical characteristics). Both
attachment of microorganisms and cohesion of the biofouling layer are
performed by the EPS. Previous studies attributed the significant decrease of
membrane performance associated with biofouling to the presence of the EPS
rather than microorganisms themselves [4, 31, 38]. Herzberg et al. [4]
investigated the effect of isolated EPS on membrane biofouling and found that
formation of the EPS fouling layer adversely affected flux by increasing the
hydraulic resistance to permeate flow. During controlled experiments with
isolated EPS, polysaccharides were more effectively adsorbed on the EPS
fouling layer as compared to adsorption of proteins. The preferential adsorption
of EPS was greatly promoted in the presence of calcium as a result of specific
EPS – calcium interactions.
EPS vary considerably in their chemical and physical properties; but they are
predominantly extracellular polysaccharides and proteins [33, 38, 39], from
which the major hydraulic resistance offered by the biofilms is derived [31, 40,
41]. The molecular weights of most polysaccharides are large and

CHAPTER 2
8
polysaccharide solutions would be accordingly viscous [42-44]. The
heterogeneous components of EPS contain three main functional groups:
carboxylic acids (COOH), phenolicalcohols (OH), and methoxycarbonyls (C =
O) [38, 45]. The ionization of these groups results in electrostatic attraction and
expansion of the biopolymers in the presence of other counter ions. The
physiochemical characteristics of EPS, such as charges, conformation and
hydrophobicity, which have great impacts on their fouling potential, could be
affected by membrane properties, feed water chemistry (e.g. ionic strength and
multivalent ions) and operating conditions (e.g. temperature, applied pressure
and cross-flow velocity) [8, 38, 46, 47].
Membrane properties also play a crucial role in membrane biofouling.
Membrane characteristics, such as roughness, surface charge and membrane
hydrophilicity, affect the interaction between membrane and foulant in the feed
solution. It has been reported that rougher membrane surface can promote
attachment of foulants or bacteria onto the membrane [48]. Membrane with the
same surface charge as that on EPS molecules can reduce deposition of EPS
onto the membrane by electrostatic repulsion between the charges [49].
Hydrophilic membranes were found to suffer less fouling [50].
In addition to membrane properties, solution chemistry greatly affects
membrane fouling. It is well known hat seawater and wastewater contain a
large amount of free ions. Ionic strength has a large impact on EPS fouling, for
example, EPS fouling increases at higher ionic strength. Higher ionic strength
could cause compression of electrical double layer (i.e., enhanced charge
screening due to greater counter ion concentration), reducing electrostatic
repulsion between EPS molecules and promoting deposition of EPS on
membrane surface [46]. The deposited foulant layer in turn increase the
osmotic pressure on the membrane surface by preventing back diffusion of ions
[3, 29, 51-53].
The presence of divalent ions plays an important role on the interaction
between adjacent negatively charged EPS macromolecules [54], and the

CHAPTER 2
9
interaction between them and the membrane. Divalent cations such as Ca2+
ions
and Mg2+
ions can form complexes with negatively charged functional groups,
such as carboxylic groups (–COO-) of macromolecules, and neutralize the
negative charges on the macromolecules or bind them together via ion bridging.
Membrane surface charges can be screened due to such charge neutralization
effect. The consequently weakened electrostatic repulsion between foulants and
membrane, as well as the formation of macrocomplexes, such as polysaccharide
– Ca – membrane and polysaccharide – Ca – polysaccharide (Fig.2.2), through
ions interaction, promote the deposition of EPS on the membrane surface
reducing permeate flux especially at high calcium concentrations [5, 43, 46, 47,
55].
Fig.2.2 Schematic crosslinking of polysaccahrides by calcium ions [56]
Membrane fouling by EPS is dependent on operating conditions, including
operational temperature, initial flux and cross-flow velocity. Temperature can
affect the extent of EPS fouling perhaps through its impact on the viscosity of
EPS inclusion feed water and permeate. In particular, temperature shows
greater impact on FO process through the influence on osmotic pressure of
draw solution. Elevated temperature results in reduced solution viscosity of
both feed solution and water permeate/draw solution, and increased osmotic
pressure of the solutions [57-59], resulting in increased permeate flux,
according to the following equations [57, 60, 61]:
π=iCRgT (2.1)
J=Δπ/(μ·Rt) (2.2)

CHAPTER 2
10
where π is the solution osmotic pressure (bar), i is the Van’t Hoff factor , C is
the concentration of the solute (mol/L or M), Rg is the universal gas constant
(Rg=0.0831 L·bar/(mol·K)), T is the absolute temperature (K), J is the water
flux (LMH or m/s)), Δπ is the trans-membrane osmotic pressure difference (Pa),
μ is the viscosity of water permeate (Pa·s), and Rt is the total hydraulic
resistance (m-1
).
It has been widely reported [32, 43, 62] that the initial flux obtained had a
significant influence on membrane fouling. Faster buildup of foulants or
biofilm was observed at higher initial flux, resulting in greater flux decline [32,
62]. Water flux resulting from applied pressure generates a convective drag
force [43], which drives the EPS towards the membrane, thus leading to the
attachment of EPS onto the membrane surface. Cross-flow velocity affects
membrane fouling by generating a shear force which reduces the buildup of
foulants and fouling layer on the membrane surface. In particular, in low
fouling FO process, higher cross-flow velocity could be used as an effective
way to control membrane fouling [3, 21, 32, 62, 63].
In summary, membrane fouling by EPS is complex. It is affected not only by
membrane properties, but also by solution chemistry. Moreover, operating
conditions play an important role in EPS fouling. In addition, the combined
effect of these factors shows even greater impact on EPS fouling.
2.2.2 Mechanism to biofouling: Foulant – membrane interactions and foulant
– foulant interactions
Two major stages can be considered in membrane fouling: foulant – membrane
interactions and foulant – foulant interactions. The foulants in the feed solution
firstly interact with the membrane material through functional groups and
accumulate on the membrane surface under the convective flux. Afterwards, the
foulants in the feed solution interact with the foulants that deposited on the
membrane surface, and form macromolecules. This also applies in membrane
biofouling [35]. Biofouling takes place by adhesion of microorganisms to the

CHAPTER 2
11
membrane surface followed by growth of biofilm through growth/division and
cohesion between the adhered microorganisms and the suspended
microorganisms in the feed solution. Adhesive interactions between
microorganisms, and microorganisms and membrane surfaces usually result
from the sticky nature of the EPS, which help the cell to anchor on the
membrane surface [35].
Foulant – membrane interactions are affected by membrane properties (i.e.
roughness and charges), foulant properties (i.e. charges) and solution chemistry
(i.e. ionic strength and divalent ions), while foulant – foulant interactions are
also affected by operational conditions (i.e. initial flux and cross flow).
Specifically, divalent cations (M2+
) play a critical role in membrane fouling by
EPS. They may promote not only foulant – membrane interactions through
forming bridges between EPS macromolecules and the membrane surface, but
also foulant – foulant interactions, forming bridges between EPS
macromolecules. The resultant bridging between EPS and membrane surface
promotes further deposition of EPS onto the membrane surface. Further
accumulation of EPS due to the formation of EPS–M–EPS complexes, as
divalent ions bridge EPS in the feed solution and the EPS deposited on the
membrane surface, lead to increased fouling resistance and permeate flux
decline.
2.3 Overview of reverse osmosis fouling
Despite the fact that reverse osmosis (RO) desalination has been widely used
for water supply, membrane fouling, especially biofouling, remains one of the
most difficult challenges in RO separation processes. RO membranes suffer
from biofouling caused by a large diversity of bacteria including
Mycobacterium, Flavobacterium, Pseudomonas and other species [33, 64]. EPS
produced by such bacteria also contribute to biofouling by providing support to
bacteria, enabling bacteria to anchor on the membrane surface, and protecting
bacteria from dispersal by chemical agents. A number of studies have been
conducted to investigate RO membrane fouling by EPS, with some focusing on

CHAPTER 2
12
the effect of physical and chemical factors and demonstration of the
mechanisms that govern RO membrane fouling by EPS, especially by
polysaccharides [6, 8, 47, 65, 66].
Under the effect of hydrodynamic forces resulting from convective and
diffusive natures of water flow, the EPS are carried to the membrane surface [6,
31, 38]. Membrane fouling by EPS then occurs in two stages – adhesion of the
foulants and cohesion of the foulants. The membrane – foulant interactions and
foulant – foulant interactions in association with adhesion and cohesion of the
foulants are affected by a number of factors described below.
2.3.1 The influential factors of foulant – membrane interactions
The interactions between foulants in the feed solution and membrane can be
affected by a number of individual or synergistic factors:
1) Membrane properties and foulant characteristics.
2) Solution chemistry.
3) Hydrodynamic forces.
Membrane properties (i.e. roughness, charges and hydrophilicity) and foulant
characteristics (i.e. molecular size and charge) play a crucial role in membrane
fouling, especially on the initial attachment of foulants on the membrane
surface [50, 67, 68].
A major factor affecting the membrane – foulant interactions was the
membrane surface properties. For example, the membranes with higher
hydrophobicity and less surface charge exhibited stronger membrane – foulant
adhesion forces [68]. Li et al. [49] found that membrane fouling was dominated
by the electrostatic interactions between the organic compounds and the
membrane surface. Nguyen et al. [67] correlated initial flux decline rate with
membrane properties, such as membrane permeability and roughness, and
alginate – membrane interfacial free energy. The fouling layer’s porosity was

CHAPTER 2
13
found to be greatly influenced by the contact angle and surface area difference
(SAD) of the membrane, which also greatly affected fouling layer mass and
thickness, respectively. Contreras et al. [50] correlated alginate adsorption on
self-assembled monolayers (SAMs) with water contact angle, where –CH3 and
–OPh showed the highest adsorption, while the lowest adsorption was observed
on the most hydrophilic surfaces (–OH and –CONH2). Pedersen et al. [69]
correlated RO membrane fouling with polymer charge density (CD) and
membrane surface charge, and found that more severe fouling was found in the
presence of the lower CD polymers than that of the medium CD polymers.
Highly negatively charged membrane surfaces were more susceptible to
irreversible fouling.
In addition, specific interactions between functional groups on the foulant
molecules and the membrane surface promote the adherence of foulants to the
membrane surface [50]. Wu et al. [65] reported that –COOH on the SAMs of
the membrane resulted in greater initial attachment and adsorption of alginate
than other functional groups in the presence of calcium ions. Calcium ions
affect adherence of alginate to membrane surfaces. Addition of calcium ions
can lead to decrease in the free energy of adhesion between alginate and RO
membranes, increasing alginate adsorption [50]. The presence of calcium ions
can also reduce the negative charges on both the alginate and the membrane
surface, which results in the reduction in the repulsion between the them,
ultimately leading to adhesion of more alginate onto the membrane surface [66].
Calcium ions can make the polyamide composite RO membranes and alginate
more hydrophobic, and thus increased the rate of flux decline [5].
Feed solution chemistry, such as the foulant concentration, pH and ionic
strength, also affects adhesion of foulants to the membrane surface. During the
first stage of fouling, conditioning the RO membrane surface is mainly caused
by organic compounds and is dominated by their concentration in the feed
solution [70]. Foulant – membrane interactions are greatly affected by feed
solution pH through protonation and deprotonation of the functional groups on

CHAPTER 2
14
the foulant molecules and the membrane surface, which greatly affect the
adsorption of foulants on the membrane surface. Protonation occurs when pH is
above the isoelectric point (IEP). The increased pH may result in the decrease
in the zeta potential of the foulants and the membrane surface, making them
more negative, and cause strong electrostatic repulsion between them [71] and
less attachment of foulants on the membrane surface [8, 66]. Conversely, when
pH value is between the IEPs of foulants and the membrane surface, adsorption
of foulants on the membrane would be promoted [8, 66]. In some circumstances,
the effect of pH could be masked. Yu et al. [72] reported elevated pH resulted
in the reduction of electrostatic repulsion between the foulants and the
membrane surfaces at a low ionic strength, promoting accumulation of foulants
on the membrane surfaces; but negligible effect on membrane fouling at
seawater level ionic strength was observed. Higher ionic strength of the feed
solution showed great impact the adsorption of foulants on the membrane
surface. High ionic strength caused significant charge screening and
compression of electrostatic double layer for the foulants as well as the
membrane surfaces, enhancing the hydrophobic interactions between them and
leading to great fouling rate [8]. It was found that at high pH the zeta potential
of the membrane surface was less negative at lower ionic strength compared to
higher ionic strength, while at low pH the zeta potential of the membrane
surface was less positive at lower ionic strength [71]. This indicated the
increase in ionic strength showed negligible influence on the IEP of the
membrane surface, but caused electrical double layer compression or charge
screening by the increase in counter ions.
Adhesion of foulants on the membrane is also greatly affected by the
hydrodynamic forces, such as flux and cross-flow velocity. Initial flux decline
rate in the RO process of organic foulants was found to be increased with
elevated operating pressures [73]. The higher initial permeate flux or applied
pressure generated higher permeation drag, which accelerated foulant deposits
on the membrane and the initial permeate flux decline [74]. The shear rate
generated by the cross-flow velocity could also affect the loading rate of

CHAPTER 2
15
organic compounds, which were the main nutrients supply in the feed solution,
and adherence properties of EPS [70]. It was found that the increased shear rate
led to reduction in the deposition of alginate and calcium ions on the membrane
surface, lessening alginate fouling [8].
2.3.2 The influential factors of foulant – foulant interactions
After the deposition of the foulants onto the membrane surface, a thin layer of
the foulants forms. The deposited foulants change the physicochemical
characteristics of the surface, including surface roughness, surface
hydrophobicity and surface charges, which then affect adsorption of the
foulants in the aqueous feed solution [38]. The cohesion of foulants takes place
by the interactions between the deposited foulants on the membrane surface and
the foulants in the feed solution, which is dominated by the foulant
characteristics and affected by individual or synergistic factors, such as:
1) Solution chemistry.
2) Hydrodynamic forces.
Feed solution chemistry including pH, ionic strength and specific ions greatly
affects foulant characteristics, especially charge. As mentioned above, pH
affects foulant charges through protonation (below isoelectric point or IEP) and
deprotonation (above IEP) of the functional groups of the foulant molecules,
and therefore alters the electrostatic repulsion between the foulant molecules
[68, 71, 75].
The foulant charges are also affected by ionic strength. Higher ionic strength
results in charge screening of the foulant molecules or double layer
compression, accelerating the hydrophobic interactions among the neighbor
molecules. For example, during alginate fouling, increase in ionic strength
caused compression of electric double layer around charged alginate molecules,
which led to reduction in electrostatic repulsion between adjacent alginate
molecules in the feed solution [8, 75]. With the reduced interchain electrostatic
repulsion, alginate molecules become more coiled and the intermolecular

CHAPTER 2
16
adhesion between adjacent alginate molecules increased, leading to formation
of a thicker and more compact alginate fouling layer on the membrane surface
and increment of hydraulic resistance to the permeate flow through the
membrane, and thus flux decline [8, 75].
Specific counter ions in the feed solution, such as calcium ions, can act as a
bridge between the negatively charged functional groups of the foulant
molecules, promoting the formation of compact fouling layers. The impact of
calcium ions on membrane fouling by alginate has been widely studied [5, 8, 66,
75]. Severe alginate fouling was observed in the presence of calcium ions and
attributed to the complexation of calcium ions with the carboxylic groups of the
alginate molecules [5, 8, 65, 66, 75]. The bridging effect of calcium ions
between adjacent alginate molecules resulted in an egg-box-shaped gel network,
leading to dense and compact fouling layer [5, 8, 66, 75].
Hydrodynamic forces including initial flux (applied pressure) and shear force
generated from cross-flow velocity plays an important role in formation of
fouling layers. Higher fluxes under higher applied hydraulic pressure resulted in
an increased flux decline and fouling rate [8, 73, 76]. The elevated operating
pressure resulted in significant increase in steady-state permeate flux at the end
of filtration, which demonstrated a pressure-dependent permeate flux [73].
During alginate fouling, alginate fouling layer was more compressed at higher
initial flux (or trans-membrane pressure), leading to increase in hydraulic
resistance to permeate flow [8]. Shear force generated from the linear flow
velocity was found to affect EPS chemical composition, which led to changes
in EPS cohesion and elasticity [70]. EPS elasticity increased at higher shear rate,
likely to induce compactness of biofilm and enhance flux decline rate. Higher
shear rate could result in a lower amount of biomass at lower TOC
concentration probably through the combination of reduced CP, reduced cell
attachment rate, extended biomass detachment rate and lower substrate
concentration for biofilm growth. Mattaraj et al. [73] reported the increase in
cross-flow velocity did not have a significant effect on the initial flux, but

CHAPTER 2
17
enhanced flux for longer period of filtration, which was attributed to the
decrease in specific cake resistance.
2.3.3 Subsequential effect of foulant adsorption on membrane fouling
As foulants in the feed solution accumulate on the membrane surface, fouling
layers form and accelerate the flux decline rate largely through the increase of
cake resistance, and cake- and biofilm-enhanced osmotic pressure (CEOP and
BEOP).
In 2002, Hoek et al. [77] for the first time proposed the model combining cake
filtration theory and the CEOP effect. The CEOP effect occurs when the
formation of fouling layer on the membrane surface hinders the back-diffusion
of salt to the feed solution which results in increase of salt concentration near
the membrane surface. It was found to be more significant in thicker fouling
layer than thinner fouling layers that formed on the seawater membranes [6],
and strongly enhanced by the flux [76]. Herzberg and Elimelech [31] proposed
a BEOP effect governing the decline in RO membrane performance through
increase in both trans-membrane osmotic pressure and hydraulic resistance.
During biofouling, bacterial cells enhanced osmotic pressure on the membrane
surface through the effect of BEOP and the EPS contributed to the flux decline
by increasing the hydraulic resistance to permeate flow [4, 31].
2.3.4 Hydraulic resistances
Hydraulic resistance is an alternative way to describe the extent of fouling.
Generally, total hydraulic resistance consists of membrane resistance (Rm),
resistance due to blockage (Rb), resistance due to concentration polarization
(Rcp) and resistance due to cake formation (Rc) [78]. In the reverse osmosis (RO)
process, the membranes e.g. polyamide thin film composite (BW30), have
small pore sizes, with a 180 Da molecular weight cut-off [79]. As a result, the
effect of pore blockage by EPS is considered negligible in RO, and so is the
resistance which results from blockage.

CHAPTER 2
18
However, the fouling mechanism is often complicated because of the interplay
between the accumulated salt during concentration polarization and the growing
foulant layer or cake formation on the membrane surface which increases cake
resistance [76]. Concentration polarization is a universal phenomenon in
membrane separation process when the feed solution contains salt solutes. A
build-up of solutes forms on the membrane surface as the salt solutes in the
feed solution are carried toward the membrane under the convective flux and
rejected by the membrane. Subsequently, concentration polarization increases
the osmotic pressure near the membrane surface and reduces the effective
driving force, which results in reduction in permeate flux. Cake formation
refers to the build-up of fouling layers by the accumulation or deposit of
foulants, such as polysaccharides, to the membrane surface from the bulk feed
solution. The fouling layers add cake resistance to the convective flow towards
the membrane and therefore reduce the permeate flux.
The presence of salt promotes the accumulation of polymer foulants by
compression of electrical double layers, whilst the accumulated polymer
enhances cake-enhanced osmotic pressure (CEOP) or cake-enhanced
concentration polarization (CECP), which occurs when the build-up of the cake
layer on the membrane surface hinders the back-diffusion of salt ions to the
bulk solution that leads to an elevated salt concentration near the membrane
surface [29, 31, 76]. Herzberg and Elimelech [31] attributed deterioration of
membrane performance to the elevated trans-membrane osmotic pressure,
which resulted from bacterial cells on the membrane hindering the back
diffusion of salt and increasing in hydraulic resistance of the EPS to the
permeate flow. Therefore, contribution of resistance due to concentration
polarization (Rcp) and resistance due to cake formation (Rc) to membrane
fouling vary during the membrane separation processes.
Some models of the resistance in series based on Darcy’s Law were developed
to quantify effect of hydraulic resistance on membrane fouling [67, 80-82].
Some literature subdivided non-membrane resistances based on the cleaning

CHAPTER 2
19
effect into the reversible fouling resistance (Rrf) and the irreversible fouling
resistance (Rif) [83]. Rare studies included Rcp in the total hydraulic resistance
and demonstrated the relationship between Rcp and elevated osmotic pressure
on the membrane surface. It would be interesting to develop a model to
illustrate the effect of concentration polarization on membrane fouling based on
analysis of hydraulic resistances.
2.4 Overview of forward osmosis fouling
Forward osmosis (FO) has been extensively studied due to its great application
potential in desalination [23, 24]. However, questions and challenges regarding
production efficiency in association with membrane property, draw solution
and membrane fouling remain. Despite a lower fouling propensity in FO
observed in previous studies [3, 9, 28, 43, 47, 52, 62], membrane fouling in FO
is a more complicated phenomenon compared to the pressure-driven membrane
processes. In addition to the factors affecting fouling in RO (membrane
property, feed solution chemistry and operating conditions) additional factors
derived from the draw solution side need to be considered in FO, which include
membrane substrate [43, 47, 84-87], draw solute type as well as draw solution
concentration [63, 88, 89] and draw solution temperature [57, 90, 91]. This
section will review two aspects of FO fouling: the active membrane layer on the
feed solution side; and effect on the draw solution side.
2.4.1 Factors in the feed solution side that affect forward osmosis fouling
Similar to RO fouling, forward osmosis (FO) fouling experiences two stages of
fouling: foulant – membrane interactions and foulant – foulant interactions. As
FO has a low fouling propensity, it is considered to be dominated by the
interaction between foulants and the membrane surface, which is associated
with membrane properties and solution chemistry.
CHAPTER 2
20
1) Membrane properties
Membrane properties, such as surface roughness, surface hydrophilicity and
surface charges, strongly affect the interactions of foulants with the membrane
surface. Smoother and more hydrophilic membrane are less likely to cause
foulant adhesion and accumulation on the membrane surface. A recent study by
Lu et al. [48] demonstrated that membrane surface roughness was the most
important factor in determining membrane fouling propensities using alginate
as the model polysaccharide. A greater fouling propensity was observed using
polyamide thin film composite (PA TFC) membranes compared to that of
cellulose triacetate (CTA) membranes, due to its greater surface roughness [92].
The PA TFC membrane surface was more susceptible than the CTA membrane
to alginate absorption as indicated by its slightly faster initial fouling rate [2].
Several studies [43, 47, 84-86] evaluated organic fouling behavior of CTA FO
membrane by operating in forward osmosis (FO) mode (active layer facing the
feed solution) and pressure retarded osmosis (PRO) mode (support layer facing
feed water) of the membrane by altering membrane orientation. The active layer
is more likely to prevent the adhesion and accumulation of foulants on the
membrane surface, especially under a higher hydrodynamic shear force, while
the support layer suffers more significant deposition of the foulants cannot
easily be removed by the hydrodynamic shear rate. The active layer is denser,
smoother and tighter than the support layer, and therefore less susceptible to
fouling.
2) Solution chemistry
Solution chemistry is of great importance in FO fouling, especially the
interactions between the foulants in the feed solution and the membrane surface.
Specifically, the presence of divalent cation ions (i.e. calcium ions) has great
influence on the foulant – membrane interactions in the FO process [47, 48, 63,
84, 93]. Calcium can interact with the negatively charged functional groups,
such as carboxyl groups on the foulant molecules and membrane surface. This

CHAPTER 2
21
leads to a reduction in the hydrophilicity of the membrane and the foulant, and
decreases the electrostatic repulsion between the foulants and the membrane. A
previous study [47] evaluated the effect of calcium ions on the interfacial free
energy of alginate adhesion to membrane, and found the presence of calcium
increased the negative value of alginate-membrane interfacial free energy of
adhesion, which indicated the presence of calcium ions resulted in greater
alginate – membrane attraction. Therefore, calcium ions facilitate bridging
between the foulant molecules and membrane surface, resulting in the
accelerated adsorption of foulants on the membrane surface.
2.4.2 The draw solution plays an important role in forward osmosis fouling
The forward osmosis (FO) process utilizes an osmotic pressure gradient of the
draw solution as driving force. Therefore, the type and concentration of draw
solution play an important role in the FO process. And FO fouling is greatly
influenced by draw solution through permeate flux, which is generated by the
osmotic pressure of draw solution, and interactions of foulants in the feed
solution with draw solutes, which reversely diffused from the draw solution to
the feed solution.
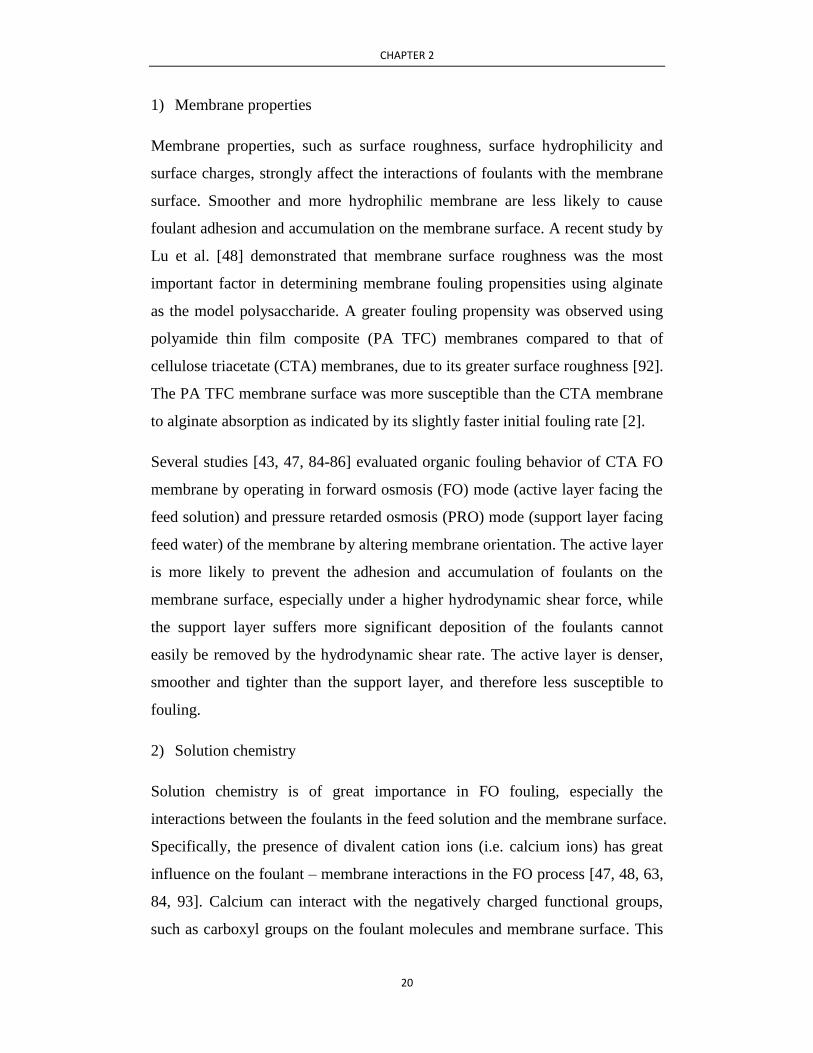
1) Draw solution affects FO fouling through initial flux
Generally, FO fouling is more severe at higher initial flux generated by a higher
osmotic pressure [63, 86, 88, 89]. Draw solutes of different types at the same
solution concentration have different osmotic pressures [63]. As a result, in
order to achieve the same initial flux, the draw solution concentration varied
according to the types of draw solutes [88, 89]. For example, Achilli and
co-workers [89] found that to achieve the same osmotic pressures, the required
mass concentrations of different solutes were different (Fig.2.3).
CHAPTER 2
22
Fig.2.3 Relationship between solution osmotic pressure and solution concentration of
different draw solutions [89].
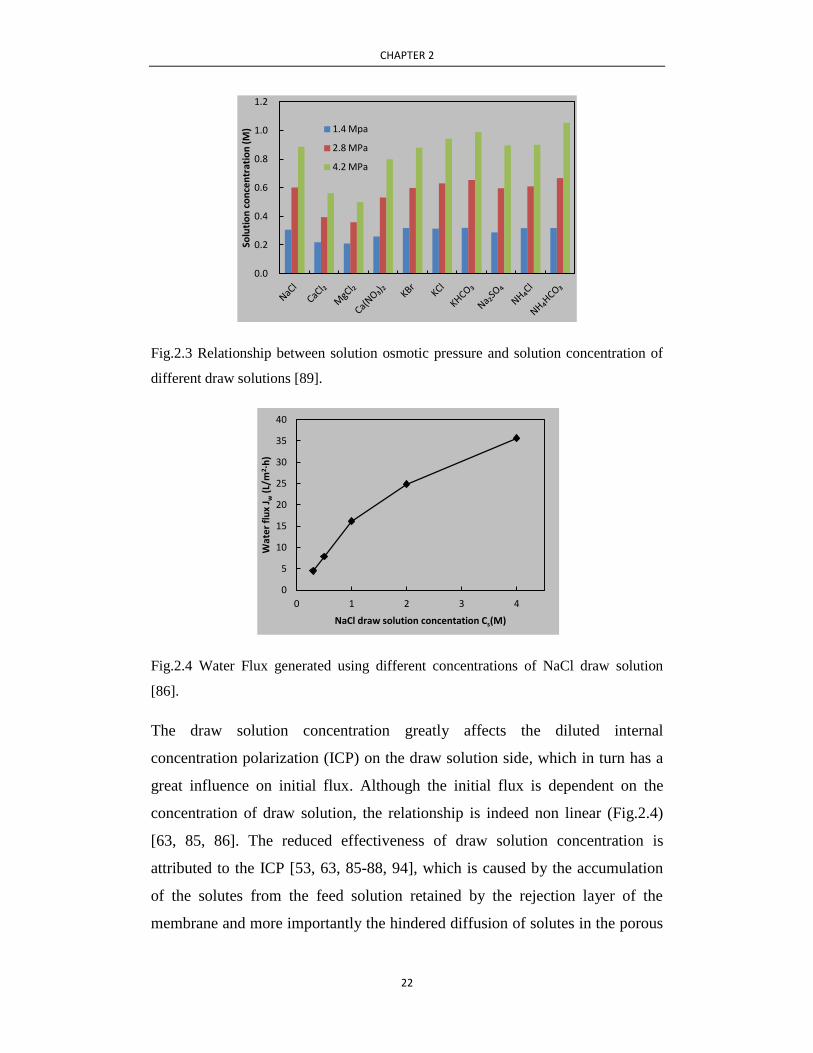
Fig.2.4 Water Flux generated using different concentrations of NaCl draw solution
[86].
The draw solution concentration greatly affects the diluted internal
concentration polarization (ICP) on the draw solution side, which in turn has a
great influence on initial flux. Although the initial flux is dependent on the
concentration of draw solution, the relationship is indeed non linear (Fig.2.4)
[63, 85, 86]. The reduced effectiveness of draw solution concentration is
attributed to the ICP [53, 63, 85-88, 94], which is caused by the accumulation
of the solutes from the feed solution retained by the rejection layer of the
membrane and more importantly the hindered diffusion of solutes in the porous
0.0
0.2
0.4
0.6
0.8
1.0
1.2
Solu
tio
n c
on
cen
trat
ion
(M
) 1.4 Mpa
2.8 MPa
4.2 MPa
0
5
10
15
20
25
30
35
40
0 1 2 3 4
Wat
er
flu
x J w
(L/
m2 ·
h)
NaCl draw solution concentation Cs(M)

CHAPTER 2
23
support layer from the draw solution [63, 85]. As a result of the accumulated
solutes on the two sides of the membrane rejection layer, the effective driving
force of the FO process (i.e. the difference in the concentration across the
membrane rejection layer) is much lower than the apparent driving force (i.e.
the difference between the draw solution concentration and feed solution
concentration). Therefore, at higher draw solution concentration, the ICP is
more severe due to the higher water flux level, and the water flux enhancement
with the increase in draw solution concentration becomes marginal [63, 85].
2) Draw solution affects FO fouling through reverse diffusion of draw solute
In FO, membrane fouling is greatly promoted by accelerated cake-enhanced
osmotic pressure (CEOP). The cake fouling layer in the feed solution hinders
reverse diffusion of draw solutes from the draw solution side and causes an
increase in osmotic pressure near the membrane surface [3, 51-53]. The reverse
diffusion of draw solutes is influenced largely by the type and concentration of
draw solution. Different types of draw solutes reversely diffuse at different
rates [88], change the feed solution composition and may potentially interact
with foulants in the feed solution. Greater FO membrane fouling can be
observed when divalent ions are used as draw solutes [63, 88].
The reverse diffusion rate (solute flux) is dependent on the water flux, as
described in the Equation (2.3) [48, 88, 95]:
Js = Jw
(2.3)
where Js is the solute flux (mole/(m2·h)), Jw is the water flux (LMH or m/s), A is
the water permeability coefficient of the membrane (m/(s·Pa)), B is the solute
permeability coefficient of the membrane (m/s), n is the van’t Hoff coefficient,
Rg is the universal gas constant (Rg=0.0831 L·bar/(mol·K)) and T is the
absolute temperature (K).
Therefore, decrease in the draw solution reduces the water flux and the solute
flux. In addition, the decrease in the draw solution results in reduction of ICP.
CHAPTER 2
24
However, most studies [2, 3, 9, 48, 62, 63] on FO fouling recirculated the
diluted draw solution to the draw solution bank, which prevented constant
operational conditions being attained. Thus, to better control the experimental
operation, it is necessary to explore better methods to maintain a constant draw
solution concentration.
2.5 Comparison of fouling in reverse osmosis and forward
osmosis
Rare studies have been carried out to compare polysaccharide fouling in
forward osmosis (FO) and reverse osmosis (RO) [2, 3]. In 2010, Lee and
co-workers [3] compared FO and RO fouling behaviors performed under
identical physicochemical conditions for the first time; in which 5.0 M NaCl
solution was used as draw solution in FO and alginate was used as one of model
foulants to represent common polysaccharide. Their results, based on
comparison of alginate fouling in FO and RO, elucidated that the key
mechanism of flux decline in FO was rather accelerated cake-enhanced osmotic
pressure (CEOP) due to reverse salt diffusion from the draw solution to the feed
solution hindered by the fouling layer than increased fouling layer resistance;
and the fouling layer was loose and able to be removed by physical cleaning in
FO, demonstrating the high reversibility of FO fouling. Meanwhile, Mi and
Elimelech explored fouling and cleaning mechanisms with the use of 4.0 M
NaCl solution as draw solution in FO and alginate as the model foulant by
comparing membrane separation performances in FO and RO [2].
Both of the studies used corrected normalized flux due to continuous decrease
in driving force resulting from the dilution of non-saturated NaCl draw solution
in FO. As the water was continuously driven from the feed solution side to the
draw solution side, the draw solution was correspondingly diluted. It was found
in both of the studies that alginate caused more severe or similar fouling and
permeate flux decline in FO compared to RO under identical experimental
conditions (Table.2.1) [2, 3].

CHAPTER 2
25
Table.2.1 Comparison of alginate fouling in RO and FO in two previous studies
Lee et al. [3] Mi and Elimelech [2]
RO FO RO FO
Initial flux 7.0 μm/s (25.2 L/m2∙h) 8.1 μm/s (29.2 L/m
2∙h)
Driving force 450 psi 5.0 M NaCl 400 psi 4.0 M NaCl
Flux after 500
min
~5.0 μm/s ~3.5 μm/s ~4.5 μm/s ~4.5 μm/s
Flux decline
after 500 min
~29% ~50% ~44% ~44%
As discussed in Section 2.3.2, dilution of draw solution causes reduction in
osmotic pressure of draw solution and affects internal concentration
polarization (ICP) in the supporting layer of the membrane. Therefore, the FO
performance test was recommended to be conducted with either a large volume
of draw solution or a control system to maintain constant draw solution
concentration [58], which may not be feasible. Thus it is important to develop a
new method to effectively maintain constant driving force in FO. For research,
the use of constantly saturated draw solution could be a promising method to
maintain constant driving force in FO, enabling a better comparison of
membrane fouling in FO and RO. Detailed information on design of constantly
saturated draw solution can be found in Section 3.5. It will be of interest to
compare membrane fouling in RO with that in FO under identical solution
chemistry (i.e. ionic strength, Ca2+
concentration and foulant concentration) and
operating conditions (i.e. temperature, initial flux, cross-flow velocity) except
that the pressure source in FO being osmotic pressure and hydraulic pressure in
RO, and elucidate polysaccharide fouling mechanisms under different pressure
sources.
Similar with fouling in the RO process, alginate was also commonly selected as
the only model to study membrane fouling by polysaccharides. However,
alginate is atypical to represent polysaccharides produced by most species of
bacteria. It is very important to investigate polysaccharide fouling mechanisms

CHAPTER 2
26
in FO and RO using different kinds of polysaccharides as foulants. Rare studies
[4, 38] have been conducted on membrane fouling by EPS isolated from
bacteria, demonstrating rather a synergistic fouling effect of polysaccharides
and proteins in the EPS than the effect of individual foulants. Therefore, a
better understanding on fouling behaviors of polysaccharides in both RO and
FO is essential.
2.6 Membrane fouling control
Although membrane fouling is an inevitable phenomenon during membrane
separation process, it can be controlled or alleviated by a number of strategies.
These strategies included operation under elevated cross-flow velocity, physical
washing, chemical cleaning, membrane modification, pre-treatment of feed and
use of spacers. Due to the inherent differences in the formation of fouling in
reverse osmosis (RO) and forward osmosis (FO) processes, fouling control
methods vary significantly. Mostly, operation under elevated cross-flow
velocity and physical washing are useful in the FO process, as FO process is a
low fouling process and fouling is reversible. However, neither method can
completely remove foulants from the membrane surface in RO because of the
compactness of the foulant layer under high hydraulic pressure [96-98]. As a
result, RO fouling mitigation was usually achieved by other methods, one of
which is chemical cleaning compounds. This section reviews mitigation of
membrane fouling by chemical compounds during the RO process and briefly
introduces other strategies for membrane fouling control in RO.
2.6.1 Membrane fouling mitigation by chemical compounds during the RO
process
Irreversible fouling is the strong attachment of foulants, which cannot be
removed by physical cleaning. However, control of irreversible membrane
fouling could be achieved by correct dosing of chemical compounds during the
fouling process. Table.2.2 summarizes the effect of commonly used chemical
CHAPTER 2
27
compounds for membrane fouling mitigation during the reverse osmosis (RO)
process.
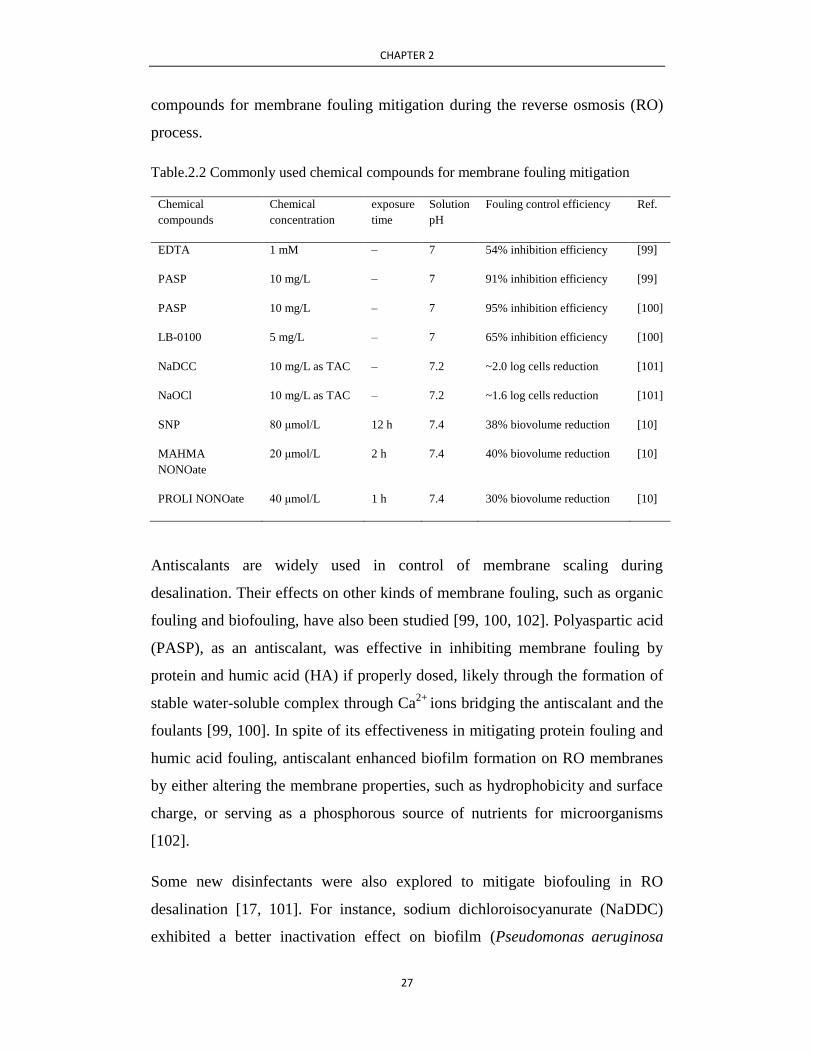
Table.2.2 Commonly used chemical compounds for membrane fouling mitigation
Chemical
compounds
Chemical
concentration
exposure
time
Solution
pH
Fouling control efficiency Ref.
EDTA 1 mM – 7 54% inhibition efficiency [99]
PASP 10 mg/L – 7 91% inhibition efficiency [99]
PASP 10 mg/L – 7 95% inhibition efficiency [100]
LB-0100 5 mg/L – 7 65% inhibition efficiency [100]
NaDCC 10 mg/L as TAC – 7.2 ~2.0 log cells reduction [101]
NaOCl 10 mg/L as TAC – 7.2 ~1.6 log cells reduction [101]
SNP 80 μmol/L 12 h 7.4 38% biovolume reduction [10]
MAHMA
NONOate
20 μmol/L 2 h 7.4 40% biovolume reduction [10]
PROLI NONOate 40 μmol/L 1 h 7.4 30% biovolume reduction [10]
Antiscalants are widely used in control of membrane scaling during
desalination. Their effects on other kinds of membrane fouling, such as organic
fouling and biofouling, have also been studied [99, 100, 102]. Polyaspartic acid
(PASP), as an antiscalant, was effective in inhibiting membrane fouling by
protein and humic acid (HA) if properly dosed, likely through the formation of
stable water-soluble complex through Ca2+
ions bridging the antiscalant and the
foulants [99, 100]. In spite of its effectiveness in mitigating protein fouling and
humic acid fouling, antiscalant enhanced biofilm formation on RO membranes
by either altering the membrane properties, such as hydrophobicity and surface
charge, or serving as a phosphorous source of nutrients for microorganisms
[102].
Some new disinfectants were also explored to mitigate biofouling in RO
desalination [17, 101]. For instance, sodium dichloroisocyanurate (NaDDC)
exhibited a better inactivation effect on biofilm (Pseudomonas aeruginosa

CHAPTER 2
28
PAO1 GFP) than chlorine under the same total available chlorine concentration,
showing promises for biofouling control in the RO process [101]. Vanillin was
found to be able to suppress biofilm formation on the membrane, revealed by
the reduction in average thickness, total biomass and the total protein content of
the biofilm [17].
Nitric oxide (NO) donor compounds are able to alleviate bacterial adhesion,
induce dispersal of biofilm on the membrane surface and reduce biofouling
[10-16]. The addition of NO at low, nontoxic concentrations led to the dispersal
of microbial biofilm. For example, NO donors at picomolar and low nanomolar
levels resulted in reduction of total biofilm surface, with an average reduction
rate of 63% [14]. NO at a flux of 30 pmol/(cm2·s) led to reduction in adhesion
of Staphylococcus aureus, Staphylococcus epidermidis, and Escherichia coli,
with a reduction rate of 96%, 48% and 88%, respectively [12]. However these
bacteria species are not typical in seawater environments. One kind of NO
donor, SNP, at the low, sublethal concentrations of 25 to 500 nM induced
dispersal of Pseudomonas aeruginosa biofilm [13]. Various NO donors
dispersed not only single species biofilms of some microorganisms, but have
also been effective at removing multi-species biofilms from water treatment and
purification systems such as membrane bioreactor and reverse osmosis [10, 14].
Optimal efficiency of biofilm dispersal could be achieved by optimizing NO
donor concentration and exposure times. NO donors with short half-lives would
disperse biofilms at short exposure times [10]. Biofilm dispersal involved a
reduction of both EPS and bacteria cells. For example, a 29% reduction in EPS
was observed corresponded to a 38% reduction in live cells in the samples that
were treated with the NO donor, MAHMA NONOate, probably due to the
lower live cell numbers resulting in a lower production of EPS [10]. A study on
NO treatment for the control of RO membrane biofouling revealed that a 92%
reduction in the rate of RO membrane biofouling (pressure rise over a given
period) was achieved with NO treatment by adding 40 μM PROLI NONOate at
24-h intervals [16]. It was also observed that PROLI NONOate treatment

CHAPTER 2
29
reduced polysaccharides, proteins and microbial cells, with a reduction rate of
48%, 66% and 29%, respectively [16]. However, biofilm dispersal could be less
effective when alginate is produced. NO induced dispersal of PAO1 biofilm
was found to be inhibited, which could be due to inactivation of NO by the
thickly coated alginate layer on the cells preventing NO from initiating the
cascade of events resulting in dispersal of biofilm [11]. Although alginate was
considered to protect bacteria from induced dispersal, effect of NO on alginate
fouling in the absence of cell is still unknown. It is of great interest to
investigate the effect of NO on control of membrane fouling by EPS, such as
alginate.
2.6.2 Other strategies for membrane fouling control
1) Chemical cleaning after fouling runs
Generally, irreversible membrane fouling can also be mostly removed by short
time (i.e. 30 min) chemical cleaning after the membrane fouling runs using
chemical solutions in the absence of foulants. Aqueous solutions with low
concentration of chemical compounds, such as ethylenediaminetetraacetic acid
(EDTA) [5, 96, 98], NaCl [98], SDS [98] and thermo-responsive polymer (TRP)
[97], have been found to be effective during fouled membrane cleaning.
2) Operation under elevated cross-flow velocity
Operating at higher cross-flow velocity can reduce membrane fouling in FO by
generating a greater shear force, which reduces external concentration
polarization (ECP) [21, 32, 63] and hinders foulant accumulation on the
membrane surface [3, 62].
3) Physical washing
Based on foulant strength of attachment to the membrane surface, membrane
fouling can be divided into reversible and irreversible fouling [103]. Reversible
fouling can be removed using physical cleaning. When the fouling layer is
loose and sparse, the fouling layer can be broken into small patches and

CHAPTER 2
30
removed by backwashing or cross flow. As FO is a low fouling process with
low fouling propensity, physical cleaning, for example, periodic rinses with
water at a same or an elevated cross-flow velocity, is commonly used an
effective strategy to mitigate FO fouling [2, 9, 34, 47, 104-106].
4) Use of spacer
Spacers placed alongside the membrane are able to create turbulence, reduce
external concentration polarization (ECP) and membrane fouling [28, 62, 94,
107-109]. In FO, a spacer in the draw solution side also effectively reduced
dilutive internal concentration polarization (DICP) [107]. Inserting a spacer in
the feed channel improves mass transfer in the boundary layer near the
membrane surface [62]. Using thicker spacer greatly reduced flux decline
during FO biofouling [36]. Modifying the polymer of the feed spacer with
organo-selenium led to reduction of biomass concentration and biofilm
thickness [108]. Altman’s study [110] indicated that spacers had a more
significant influence on alleviating permeate flux decline, but had greater
bacteria concentrations.
5) Pretreatment
Pretreatment is a practical method for reduction of fouling during membrane
separation processes, such as RO, especially spiral-wound design membrane
systems which allow only one-way flow through the system and cannot be
recovered by backwashing. Pretreatment is normally designed to remove some
constituents, such as sediment, micro-pollutants and microbes, which would
otherwise increase fouling resistance and reduce mass transport [33, 111]. In
general, a RO membrane pretreatment system consists of one or more the of
operations [111], such as coagulation/flocculation [112, 113], ion exchange
[114, 115] and filtration (i.e. MF and UF) [115-117]. Since FO is a low fouling
membrane process, it’s unnecessary to carry out pretreatment prior to FO.
Instead, due to its low fouling propensity and high reversibility, FO can be used
as an advanced pretreatment strategy prior to other desalination processes [22,
28, 118, 119].

CHAPTER 2
31
6) Modification of membrane surface
Membrane biofouling can be mitigated by modification of membrane surface
properties, such as roughness, surface charge and membrane hydrophilicity. As
the more severe fouling mostly occurs on rougher membrane surfaces,
smoothing membrane surfaces can reduce the adhesion of microorganisms and
biofouling. Roughness of membrane surface can be reduced using physical
coating with polymers or surfactants [80, 120-127]. Since most EPS produced
by bacteria are negatively charged in the aqueous solution, correctly altering the
charge on membrane surface can increase the electrostatic repulsion between
the membrane and EPS, and consequently reduce membrane fouling [80, 122,
128, 129]. Increasing membrane hydrophilicity is another method to decrease
deposition of foulants on the membrane surface [80, 120-122, 124, 125,
127-130].
As FO is a low fouling process, rare studies were performed to reduce
membrane fouling in the FO process by modification of membrane through
improvement of fouling resistance to organic fouling or biofouling [127, 128,
130]. Sometimes, the improvement of membrane anti-fouling properties was
achieved at the cost membrane performance, such as permeate flux [80, 120,
121, 126, 131, 132] and salt rejection [80, 121].
2.7 Concluding remarks
Polysaccharides are considered to play a major role during membrane
biofouling in membrane desalination. Previous studies [3, 5, 43, 47, 57, 130]
commonly selected alginate as a model polysaccharide during the study of
polysaccharide fouling although it is atypical of the bacterial polysaccharides
produced by most species of bacteria in a seawater environment [84]. This
means that there is a scope for better understanding the contribution that
polysaccharides have on membrane fouling with regards to the best models to
use and the major factors that influence fouling propensity. These could be
achieved by investigation of polysaccharide fouling behaviors using

CHAPTER 2
32
polysaccharides isolated from bacteria naturally adherent in a seawater
desalination plant.
To date, only a few studies compared polysaccharide fouling in forward
osmosis (FO) and reverse osmosis (RO), where a constant driving force cannot
be achieved in FO because of the continuous dilution of draw solution. The
constant driving force can be achieved by using constantly saturated draw
solution in FO, based on which a series of study including better comparison of
membrane performance between FO and RO can be carried on.
Control of membrane biofouling mostly focused on the removal of bacteria in
terms of biovolume using chemical compounds. There is interest in using the
chemical compounds to remove the polysaccharides produced by bacteria.

CHAPTER 3
3
Chapter 3. Materials and Methods
3.1 Membrane
A commercial forward osmosis (FO) pouch membrane, supplied by Hydration
Technologies Inc. (HTI, Albany, USA), was used in both of forward osmosis
(FO) and reverse osmosis (RO) experiments. This type of membrane is made of
cellulose triacetate and cast onto a non-woven backing consisting of
polyethylene-coated polyester fibers. Prior to use, the membrane was cut into
pieces based on the dimension of the FO and RO cells, and stored in deionized
(DI) water overnight prior to use.
3.2 Polysaccharides
Alginate has been commonly selected as the model polysaccharide to
investigate fouling in reverse osmosis (RO) and forward osmosis (FO).
However, use of sole alginate as the model polysaccharide to study
polysaccharide fouling cannot yield sufficient information on fouling behavior
of polysaccharides. Moreover, as discussed in Section 2.1.1, alginate is not a
typical representative of bacteria polysaccharides in the seawater. It has been
reported [133] that most of the EPS were produced by prevalent bacteria, such
as Achromobacter and Xanthomonas in the desalination plants. Therefore,
xanthan, a more typical bacterial polysaccharide secreted by Xanthomonas, was
selected in fouling tests and compared with the most commonly tested model
polysaccharide, alginate.
The literature has revealed that alginate forms a gel layer with a network
structure on the membrane surface in the presence of calcium ions, due to the
preferential binding between calcium and carboxylate groups of alginate. A
third polysaccharide, pullulan which lacks carboxylic functional groups, was
also selected for comparison to provide a better understanding of the

CHAPTER 3
34
importance of selecting suitable polysaccharide models in FO and RO fouling
tests.
Therefore, three kinds of polysaccharides, alginate, xanthan and pullulan were
selected for the study of polysaccharide fouling in RO and FO in this study.
Their chemical molecular structures are shown in fig.3.1.
Alginate:
Pullulan:
Xanthan:
Fig.3.1 Chemical molecular structures of alginate, pullulan and xanthan
1) Alginate
Alginate is a commonly used model microbial polysaccharide in membrane
fouling research, and consists of a linear co polymer of (1,4)-linked
β-D-mannuronate and α-L-guluronate in varying proportions and combinations
[134]. Alginate is unusual compared to other polysaccharides as it is composed
solely of uronic acid residues with no neutral monosaccharides [134].

CHAPTER 3
35
2) Pullulan
Pullulan is a linear polysaccharide produced from starch by the fungus
Aureobasidiumpullulans. It consists of maltotriose units with three glucose
units connected by a α-1,4 glycosidic bond and consecutive maltotriose units
connected to each other by α-1, 6 glycosidic bond [135, 136].
3) Xanthan
Xanthan is a heteropolysaccharide produced by bacteria of the genus
Xanthomonas. Its molecule possesses pentasacchaide repeating units consisting
of D-glucose, D-mannose and glucuronic acid units linked through the β-1, 4
position, its linear backbone is similar to cellulose [137]. Typically its backbone
also contains carboxylic functional groups.
The above three polysaccharides were purchased from Sigma-Aldrich (USA).
All of them are macromolecules and do not have an exact but a range of
molecular weight. According to the manufacturer’s information, the molecular
weights (MWs) of sodium alginate, xanthan gum and pullulan are 200 kDa,
1,000 kDa ~ 50,000 kDa and 75 kDa, respectively.
3.3 Alleviating agents
Two kinds of alleviating agents, sodium nitroprusside (SNP) and potassium
ferricyanide (abbreviated KFCN in this study), were used to investigate
membrane fouling control. Their chemical molecular structures are presented in
Fig.3.2. SNP is an inorganic compound with the formula Na2[Fe(CN)5NO]. It
has five cyanide ligands (—CN) and one linear nitric oxide ligand (—NO).
Therefore, SNP is a well-characterized NO donor and it has a half-life of
approximately 2 min in aqueous solutions at neutral pH [16]. SNP used in this
study was ACS reagent grade (Sigma-Aldrich, AU).
KFCN is another inorganic compound with the formula K3[Fe(CN)6]. It has a
similar molecular structure as SNP. Compared with SNP, it has one more
cyanide ligands but no oxide ligand. It does not produce NO radical and can be

CHAPTER 3
36
considered as a control for NO radical. KFCN, was AR grade (Ajax finechem
Pty. Ltd, AU).
SNP:
KFCN:
Fig.3.2 Chemical molecular structures of SNP and KFCN.
3.4 Chemicals and feed solutions
Salts, NaCl and CaCl2, used to prepare feed and draw solutions were AR and
LR grade (Chem-Supply Pty. Ltd, AU), respectively. Artificial seawater (ASW)
was prepared using the following salts in addition to NaCl and CaCl2: MgCl2
and KCl were AR grade (Chem-Supply Pty. Ltd, AU); NaHCO3 and NaSiO3
were AR and LR grade (BDH chemicals Pty. Ltd, AU), respectively; KBr,
H3BO3 and SrCl2 were LR grades (AJAX chemicals, AU); NH4Cl was AR
grade (MERCK Pty. Ltd, AU); and NaF was AR grade (Ajax finechem Pty. Ltd,
AU).
The artificial seawater was prepared based on ZoBell's recipe (ZoBell, 1946),
shown in Table.3.1.

CHAPTER 3
37
Table.3.1 Ingredients of artificial seawater and their concentrations
Salt NaCl MgCl2 CaCl2 KCl NaHCO3 KBr
Concentration (g/L) 24.32 5.14 1.14 0.69 0.2 0.1
Salt H3BO3 SrCl2 NH4Cl NaF NaSiO3 FePO4
Concentration (g/L) 0.027 0.026 0.0064 0.003 0.002 0.001
3.5 Polymer preparation
Extracellular polysaccharides (EPS) were purified from four bacterial species
isolated from seawater in Western Australia. The strains were from raw
seawater (RSW 8, RSW 12 and RSW 14) and filtered seawater (FSW 6).
According to the research results of Nagaveena Nagajara, another PhD
candidate, these polymers were identified by several methods including 16S
sequencing [138]. RSW 8 was identified as a Marinomonas sepecies. This is
one genera in the Oceanospirillales family (order Oceanospirillales, class
Gammaproteobacteria). These species are evident in the RO membrane
biofouling community (at 0.8% of the total population). RSW 14 was identified
as Pseudomonas brenneri/moraviensis. FSW 6 was identified as a
Pseudomonas species. Pseudomonas species represented 9% of the total fouling
community.
Sugar analyses of the monosaccharides of some isolated polymers (FSW 6 and
RSW 14) as well as the commercial polysaccharides (alginate, xanthan and
pullulan) were conducted using chromatography following acid hydrolysis
[138]. The results of the sugar analyses are presented in Fig.3.3. Alginate is
majorly composed of glucuronic acid and galacturonic acid; pullulan is solely
glucose; and xanthan contains glucuronic acid, glucose and mannose; while
FSW 6 and RSW 14 are composed of more sugars.

CHAPTER 3
38
Fig.3.3 Sugar analysis of commercial polysaccharides and polysaccharides isolated
from bacteria [138].
The EPS were isolated from large volumes of liquid cultures. The cultures were
grown in commercially available media, Marine Broth or Marine Agar (Becton
Dickinson, USA), which is similar to seawater with some additional nutrients.
Another richer media, Trypticase Soy Broth (Becton Dickinson, USA), was
more effective for the RSW 8 strain.
The protocol used for EPS preparation was modified from a method in previous
study [139]. The bacteria were grown on the liquid media on an orbital shaker
at 160 rpm for >3 days. The cultures were then centrifuged at 14,000 rpm for 30
min; after which the supernatant was collected, followed by the addition of
Trichloroacetic acid [140], which was ACS reagent grade (Sigma-Aldrich,
USA), with a weight concentration of 20g/100mL to precipitate proteins in the
solution by centrifugation and decanting the supernatant. The collected
supernatant was then added to cold acetone with the volume ratio of 3:1
between acetone and supernatant to precipitate the polymers. The acetone/
supernatant mixture was stored at -20 ℃ to improve precipitation if necessary.
The precipitated polymers were collected again by centrifugation at 14,000 rpm
for 30 min. To remove all traces of acetone and salt, the polymers were
dissolved in a small amount of distilled water, and dialyzed in dialysis tubing
against water for 48 h.
0%
20%
40%
60%
80%
100% Glucuronic acid
Galacturonic acid
Sucrose (Glucose/Fructose) Ribose
Galactose
Glucose
Mannose

CHAPTER 3
39
3.6 Bench-scale reverse osmosis and forward osmosis systems
(a) RO system
(b) FO system
Fig.3.4 Schematic diagram of bench-scale (a) reverse osmosis (RO) and (b) forward
osmosis (FO) systems
The membrane fouling behaviors of polysaccharides were investigated in
bench-scale RO and FO cross-flow systems (Fig.3.4). Fig.3.4a shows a
schematic diagram of bench-scale RO system; in which a Sterlitech CF042

CHAPTER 3
40
cross-flow RO cell (9.207 cm in length, 4.572 cm in width, and 0.23 cm in
depth) with an effective membrane area of 42 cm2 was used. No spacer was
used in the RO cell. The membrane coupon was housed in the RO cell with the
active layer facing downwards against the feed solution. The feed solution was
transported by using a hydra-cell pump (B Line Pumps Pty. Ltd, AU). The
cross-flow velocity of the solution was monitored by a flow meter (GEC-Elliott
Process Instruments Ltd, Croydon, UK). The temperature of the feed solution
was maintained at 25 ± 1 °C by passing it through a coil in a refrigerated water
bath (Thermoline Scientific, Pty. Ltd, AU). The permeate produced during the
RO process was collected in a container on a digital balance (A & D
Australasia Pty. Ltd, AU); weight change was monitored and recorded by a
laboratory computer. In order to match the gradual increase in the feed solution
concentration which occurred in FO, the permeate in the RO process was not
recycled back to the feed [3].
Fig.3.4b shows a schematic diagram of the bench-scale FO system; a similar
system had been used in other studies [43]. The cross-flow FO cell had the
same dimensions as the RO cell, but with two symmetrical channels on both
sides of the membrane for co-current flows of feed and draw solutions.
Similarly, no spacer was used in the FO cell. For better comparison with RO
process, the membrane was placed with the active layer downwards against the
feed solution. Two Masterflex peristaltic pumps (Cole-Parmer, USA) were used
to transport and adjust the cross-flow of the feed and draw solutions. The
temperatures in both feed and draw solutions were controlled by passing them
through coils in a refrigerated water bath (Thermoline Scientific, Pty. Ltd, AU).
The draw solution tank was placed on a digital balance (A & D Australasia Pty.
Ltd, AU); weight change was continuously recorded by a laboratory computer.
We adopted a novel, new design for the FO test; that the draw solution tank
contained constantly saturated NaCl draw solution, as shown in Fig.3.5. This
enabled vastly superior comparisons of the FO and RO systems and is crucial to
the development of the new mathematical models to describe polysaccharide
membrane fouling. The input tube withdrew constantly saturated draw solution

CHAPTER 3
41
with a filter preventing solid salt entering the system. During the FO process,
saturated draw solution was diluted by water permeate and then returned to the
draw solution tank via the output tube. A separator made from polyethylene,
which has outstanding resistance to salt corrosion, was used to make sure the
diluted draw solution flowed down along the tank bottom, contacting the solid
salt at the bottom and then dissolved the salt to become saturated again (shown
as the arrow in Fig.3.5).
The draw solution was assumed to be constantly saturated. In the experiments,
the cross-flow velocity was 8.5 cm/s, equivalent to about 8.93 mL/s as the flow
rate of draw solution over 1.05 cm2 cross section area of the membrane cell. On
the other hand, the permeate flux is about 9.5 L/(m2·h) through the effective
membrane area 42 cm2, that is 0.011 mL/s of water was driven to the draw
solution. As a result in every second, only 0.011 mL water is added into 8.93
mL saturated draw solution. Such instant dilution could be negligible.
Moreover, the negligibly diluted draw solution constantly contacts solid salt.
Herein we assumed the solution to become saturated afterwards.
To evaluate FO using constantly saturated NaCl draw solution, the baseline
experiment (denoted as FO baseline-S) was carried out and compared with that
in RO (denoted as RO baseline) operated under the same conditions, including
temperature, initial water flux and cross-flow velocity and feed water chemistry
(see 2.3.1 for details). For comparison, another FO baseline test (denoted as FO
baseline-I) was conducted using the same FO setup (Fig.3.5 and Fig.3.4b)
without the addition of excess solid salt in the draw solution tank; but using
initially saturated NaCl solution as the draw solution. During FO, the draw
solution was continuously diluted by the water transported through the
membrane (permeate) from the feed to the draw solution.

CHAPTER 3
42
Fig.3.5 Schematic diagram of draw solution tank
3.7 Fouling and Alleviation tests
The operational conditions (i.e. temperature, initial water flux and cross-flow
velocity) and feed water composition (i.e. feed volume, ionic strength and
calcium concentration) during FO and RO fouling tests were kept identical for
comparing fouling behaviors. In a typical FO or RO fouling test, the cross-flow
velocity and temperature of solution were set at 8.5 cm/s and maintained at 25 ±
1 °C. In FO, the use of constantly saturated NaCl solution as draw solution
generated an initial flux of ~9.5 L/(m2·h). On the other side, to achieve a similar
initial flux, the hydraulic pressure of 400 psi (2757.9 kPa) was utilized in RO
fouling test. When effect of hydraulic pressure on membrane fouling in RO was
investigated, the pressure varied from 400 psi to 500 psi (3447.4 kPa). 10 L
feed solution, containing 1 mM Ca2+
ions when effect of Ca2+
ions on
membrane fouling was investigated, was adjusted to 50 mM total ionic strength
by adding NaCl [3]. The polysaccharide solution was firstly prepared by
dissolving 2 g polysaccharide compound in 200 mL water through vigorous
stirring without further purification prior to fouling tests. The concentration of
polysaccharides (e.g. alginate, xanthan or pullulan) tested in all FO and RO
experiments was 0.2 g/L or 0.5 g/L. The concentration of isolated polymer
solution was set at 0.2 g/L.

CHAPTER 3
43
Before RO or FO fouling test, the membrane was firstly compacted with DI
water for 2 h, followed by 2 h stabilization and equilibration with the use of
foulant-free electrolyte solution, which had 1 mM Ca2+
ions and 50 mM ionic
strength. After a stable permeate flux was observed, the foulant was added into
the feed solution. During the alleviation of polysaccharide fouling, the
alleviating agent (SNP or KFCN) was added to the feed water supplemented
with polysaccharide when the tests were initiated, and its concentration was set
at 0.1 mM or 1 mM. Unless specified, all the experiments lasted for 24 h.
Herein, the RO or FO baseline (control) test followed the same protocol as that
in the fouling experiments, except that there was no polysaccharide foulant in
the feed solution. The difference in flux decline between the baseline test
(control) and corresponding fouling test represents the permeate reduction
caused by polysaccharide fouling.
3.8 Characterization and Calculation
3.8.1 Water flux and permeability of membrane
Typically, good membrane presents high water permeability (A value) which
represents the water flux that the membrane can achieve under certain pressure.
It is dependent on the membrane material and structure.
Water permeability of the membrane (A value) was measured used the
following equation [81, 141]:
A= Jw /ΔP (3.1)
Where A is the water permeability coefficient of membrane [m/(s·Pa)], Jw is the
water flux (LMH), and ΔP is the transmembrane pressure difference (Pa).
It can be seen from the above equation that permeate flux is determined by A
and ΔP. Generally, the volume changes of permeate as a function of time are
used to calculate permeate fluxes; this was adopted in our study as well [80, 81,
129, 142]:

CHAPTER 3
44
Jt =
(3.2)
Where Jt is the water flux (LMH) at time t(h), Am is the effective membrane
area (m2, 0.0042 m
2 in this study), V is the volume of the collected permeate
(L), and t is the time for collecting the permeate (s).
In this study, the A value is 9 × 10-13
m/s·Pa based on flux versus applied
pressure using DI water as the feed solution, as can be seen in Fig.3.6.
As variation exists among different membranes, the normalized flux Jt/J0
calculated based on the ratio between Jt and J0, was also used to evaluate the
membrane fouling extent; J0 was obtained after the stabilization and
equilibration finished in the fouling test.
Fig.3.6 membrane permeability A value based on flux versus applied pressure
3.8.2 Rejection coefficient by membrane
A good membrane also presents high solute rejection coefficient (R) of salt
(NaCl in this study) [67]. Solute rejection coefficient by the membrane was
calculated using Equation (3.3) [29, 80, 124, 143]:
R=(1-
) × 100% (3.3)
y = 9×10-13x R² = 0.9999
5.0E-07
1.5E-06
2.5E-06
3.5E-06
1.5E+06 2.5E+06 3.5E+06
Flu
x (m
/s)
Applied pressure (Pa)
A=9×10-13m/s·Pa

CHAPTER 3
45
Where Cp and Cf were the conductivity of permeate and the initial conductivity
of the feed solution, respectively (μs). In this study, the lowest rejection
coefficient of NaCl by the membrane tested so far was 98.8%.
In this study, R based on Cp and Cf was measured before and after fouling tests
to check membrane’s intactness.
3.8.3 Determination of polymer solution concentration
Concentration of the collected polymer solutions was measured. The weight of
an empty little tube was measured and recorded as W0. 1 mL polymer solution
was extracted and put into the tube. The liquid was evaporated in Savant speed
vac concentrator (Thermo Fisher Scientific, Inc, AU) to dry the polymer for
over 4 h. After the polymer was dried, the weight of the tube with the dried
polymer was measured, and recorded as W1. The weight difference between W0
and W1 is the weight of the polymer. And the concentration of the polymer
(Cpolymer) was then calculated:
Cpolymer = (W1-W0) / mL (3.4)
The concentration of the polymer solution was obtained as an average
concentration of six samples.
3.8.4 Foulant Deposit Weight
The weight of polysaccharide deposited on the membrane surface after 24 h
fouling test, Wfoulant, was calculated based on Equation (3.5) :
Wfoulant = Wd – Wi (3.5)
where Wd is the weight of the fouled membrane after a fouling test, which was
dried at 54.0 °C in a Contherm Digital Series incubator (Thermo Fisher
Scientific, Inc, AU); whilst Wi is the weight of the dried membrane after the
baseline test.

CHAPTER 3
46
3.8.5 Hydraulic Resistance
Total hydraulic resistance (Rt) directly reflects the extent and causes of
membrane fouling. Total hydraulic resistance includes 4 kinds of resistances:
membrane resistance (Rm), blockage resistance (Rb), resistance caused by
concentration polarization (Rcp) and resistance caused by cake deposition (Rc).
During the membrane fouling tests in this study, as FO membrane with small
molecular weight cut-off was used, blockage of membrane (Rb) was not
included.
Rt = Rm + Rcp + Rc (3.6)
Total hydraulic resistance has a relationship with transmembrane pressure
difference, permeate viscosity and permeate flux, and can be calculated based
on the following equations [67, 80-82]:
Jw= ΔP/(μ·Rt) (3.7)
Rt=ΔP/(μ·Jw) (3.8)
where , the solution viscosity of the permeate (Pa·s), was measured with
Gilmont® Instruments falling-ball viscometer model GV-2200 (glass ball size
#3, GF-1332-P) (Thermoline Scientific Pty. Ltd, AU); Rt is the hydraulic
resistance (m-1
).
3.8.6 Fouling alleviation efficiency
The alleviation efficiency ψ was calculated based on the following equation [99,
100]:
ψ =
× 100% (3.9)
where (Jt/J0)baseline and (Jt/J0)alleviation are the normalized flux values in the
absence and presence of alleviating agents at time t (h), respectively. The value
of ψ is in the range of 0–100% when (J/J0)inhibition changes from (Jt/J0)baseline to 1.

CHAPTER 3
47
A negative value of ψ means that the addition of alleviating agent enhances
polysaccharide fouling.

CHAPTER 4
48
Chapter 4. Polysaccharide fouling in reverse osmosis
and forward osmosis
This chapter investigates and compares the membrane fouling by model
polysaccharides and polysaccharides isolated from naturally adherent bacteria
in a seawater desalination plant in forward osmosis (FO) and reverse osmosis
(RO). A constantly saturated draw solution was applied in FO to maintain a
constant driving force to compare with the applied hydraulic pressure in RO.
Three kinds of model polysaccharides (alginate, xanthan and pullulan) were
selected and four species of polysaccharides were isolated from naturally
adherent bacteria in a seawater desalination plant for membrane fouling tests in
FO and RO.
4.1 A novel approach for maintaining a constant osmotic
pressure in forward osmosis
Fig.4.1 Comparison of normalized flux versus operation time in forward osmosis (FO)
and reverse osmosis (RO) baseline experiments. RO test (RO baseline) was conducted
with a hydraulic pressure of 400 psi (2757.9 kPa); whilst FO test was carried out by
using constantly (FO baseline-S) or initially (FO baseline-I) saturated NaCl solutions
as draw solutions. All runs were performed under identical conditions: initial flux of
0.5
0.6
0.7
0.8
0.9
1
1.1
0
2
4
6
8
10
0 5 10 15 20 25
No
rmal
ize
d fl
ux
(Jt/
J o)
Pe
rme
ate
flu
x (L
MH
)
Time (h)
RO baseline FO baseline-S FO baseline-I Normalized RO baseline Normalized FO baseline-S Normalized FO baseline-I

CHAPTER 4
49
9.5 L/(m2·h); cross-flow velocity of 8.5 cm/s; solution temperature of 25 ± 1 °C; feed
solution consisting of 1 mM Ca2+
ions and 50 mM total ionic strength by adding NaCl.
In the baseline experiments above (Fig.4.1) the normalized flux versus
operation time obtained during the RO and FO are presented. Only NaCl and
CaCl2 were utilized as solutes in the feed solution in the absence of
polysaccharide foulants [3]. Either NaCl draw solution (FO) or a hydraulic
pressure of 400 psi (equivalent to 2757.9 kPa) (RO) was utilized to generate
sufficient driving force for water to permeate through the semipermeable FO
membrane. The initial flux was adjusted to 9.5 L/(m2·h) for the baseline and
subsequent polysaccharide fouling tests. The fluxes in RO baseline test
remained almost constant throughout the 24 h operation with a slight decrease
of ~5.6% (Fig.4.1). This is attributed to the continuous recycling of
concentrated feed solution back to the feed tank, subsequently increasing the
osmotic pressure of the feed solution during the experiment [3]. Further
membrane structure compaction under hydraulic pressure could also contribute
to the decline of normalized flux versus operation time in RO.
In order to better compare the polysaccharide fouling behaviors in our FO and
RO tests, we adopted a new protocol for carrying out FO fouling experiments.
Instead of using the common approach of a high concentration draw solution
e.g. 5.0 M NaCl [3], which is continuously diluted during separation, a
constantly saturated NaCl draw solution was used, outlined in Fig.3.5. The flux
observed using constantly saturated draw solution was stable (FO baseline-S in
Fig.4.1) and was only moderately reduced to 93.9% of the initial flux after 24 h.
It declined slightly as the osmotic pressure of feed solution increased when
using constantly saturated draw solution, due to the semipermeable FO
membrane allowing water to transport through from the feed to the draw
solution side but rejecting salts. Moreover, the reverse solute diffusion from the
constantly saturated draw solution to the feed solution could also contribute to
the higher osmotic pressure of the feed. As the osmotic pressure of the
continuously saturated NaCl draw solution remained unchanged, the increased

CHAPTER 4
50
osmotic pressure of the feed would eventually lead to lower transmembrane
osmotic pressure difference (Δπ) and in turn declined flux [3, 88, 95, 144, 145].
The slight decrease of flux using constantly saturated feed solution in the FO
process (Fig.4.1) strongly resembled the slight decline also observed in the RO
baseline test, which began at a similar initial flux of 9.5 L/(m2·h). By contrast,
when using only initially saturated NaCl draw solution (FO baseline-I in
Fig.4.1), a much larger flux decline (~25%) was observed over 24 h, due to the
gradual dilution of the draw solution and the increase of osmotic pressure of the
feed solution. Therefore, the utilization of constantly saturated NaCl solution,
which minimized membrane flux decline, enabled a much better direct
comparison between FO and RO operating conditions.
4.2 Polysaccharide fouling in reverse osmosis
4.2.1 Effect of polysaccharide concentration on fouling
0.55
0.60
0.65
0.70
0.75
0.80
0.85
0.90
0.95
1.00
1.05
0 5 10 15 20 25
No
rmal
ize
d fl
ux
(Jt/
J o)
Time (h)
(a)
NaCl+CaCl₂+alginate(0.2g/L)
NaCl+CaCl₂+alginate(0.5g/L)
NaCl+CaCl₂

CHAPTER 4
51
Fig.4.2 Effect of polysaccharide type and concentration on membrane fouling in
reverse osmosis (RO) process for 24 h: (a) alginate fouling; (b) xanthan fouling and (c)
pullulan fouling. A hydraulic pressure of 400 psi (2757.9 kPa) was applied. Other
experimental conditions included: initial flux of 9.5 L/(m2·h); cross-flow velocity of
8.5 cm/s; solution temperature of 25 ± 1 ℃; feed solution consisting of 1 mM Ca2+
ions
and 50 mM total ionic strength by adding NaCl; polysaccharide concentration of 0.2
g/L or 0.5 g/L.
The impact of polysaccharide concentration on membrane fouling in the RO
process was investigated (Fig.4.2). Alginate and xanthan at the concentration of
0.2 g/L caused significant flux decline after 24 h, accounting for ~25% and
~21%, respectively, while pullulan did not cause a significant flux decline. The
effect of polysaccharide concentration on membrane fouling varied according
to type of polysaccharide. With alginate, flux declined more as concentration
0.60
0.65
0.70
0.75
0.80
0.85
0.90
0.95
1.00
1.05
0 5 10 15 20 25
No
rmal
ize
d fl
ux
(Jt/
J o)
Time (h)
(b)
NaCl+CaCl₂+xanthan (0.2g/L)
NaCl+CaCl₂+xanthan (0.5g/L)
NaCl+CaCl₂
0.70
0.75
0.80
0.85
0.90
0.95
1.00
1.05
1.10
0 5 10 15 20 25
No
rmal
ize
d fl
ux
(Jt/
J o)
Time (h)
(c)
NaCl+CaCl₂+pullulan(0.2g/L)
NaCl+CaCl₂+pullulan (0.5g/L)
NaCl+CaCl₂

CHAPTER 4
52
was increased from 0.2 g/L to 0.5 g/L, while the difference in flux decline
between 0.20 and 0.5 g/L with xanthan was minimal.
The addition of alginate at 0.2 g/L caused ~25% flux decline after 24 h as
compared to the baseline experiment, indicating alginate caused severe
membrane fouling under the RO experimental conditions. Alginate is a
macromolecule with a large amount of carboxylic functional groups (shown in
Fig.3.1) [146] that Ca2+
ions can bind to them [7, 147]; and form bridges
between neighboring alginate macromolecules and subsequently form a
crosslinked gel network [43, 75, 98]. In the RO test, with a relatively high
hydraulic pressure utilized as the driving force, there is a dramatically increased
concentration of alginate macromolecules and Ca2+
ions on the membrane
surface [3], which results in formation of a densely crosslinked Ca-alginate gel
layer and an increase in membrane hydraulic resistance, reducing water fluxes
in the RO process. Membrane fouling by Ca-alginate gels was stated to be
irreversible [56]. At a concentration of 0.5 g/L, alginate caused a flux decline of
~33% after 24 h fouling test, which was about 8% lower than flux decline using
0.2 g/L alginate. Again, this could be attributed to the formation of Ca-alginate
gels. The difference in flux decline between 0 and 0.2 g/L (25%) was greater
than that between 0.20 and 0.5 g/L (8%), perhaps as Ca2+
concentration in the
feed solution decreased as Ca-alginate gels formed.
Flux decline during xanthan fouling tests (Fig.4.2b) showed 0.2 g/L xanthan
also caused significant flux decline (21%) after 24 h. Similar to alginate,
xanthan molecule also contains carboxylic functional groups. Therefore, there
could be interactions between the carboxylic groups and Ca2+
ions during RO
fouling, generating a crosslinked macromolecular network, increasing
membrane hydraulic resistance, and reducing water permeation. Further
increase in xanthan concentration from 0.2 g/L to 0.5 g/L had a negligible
impact on flux behavior. Compared to alginate, the density of carboxylic
functional groups along xanthan macromolecules is much lower (Fig.3.1),
possibly leading to less xanthan accumulation on the membrane surface

CHAPTER 4
53
forming a looser layer through bridging by Ca2+
ions. The loose Ca-xanthan
layer could be sloughed off by the cross flow. As a result, no additional xanthan
could accumulate even if concentration increased.
The normalized fluxes obtained using pullulan as foulant (Fig.4.2c) fluctuated
around 1 throughout the whole RO test irrespective of pullulan’s concentration
(0.20 or 0.5 g/L). This was an interesting finding and may suggest further clues
as to why some types of polysaccharides foul membranes and others do not.
Pullulan lacks carboxylic functional groups (Fig.4.2c) and cannot form densely
crosslinked macrocomplex layers. This may explain why no flux decline was
observed for pullulan even in the presence of Ca2+
ions. Surprisingly, the use of
pullulan even seems to slightly enhance permeate flux (Fig.4.2c). The gradual
increase in permeate flux for pullulan at 0.2 g/L (0 to 10 h) could be due to the
improved hydrophilicity and smoothness of the resulting membrane surface,
caused by the deposition of hydrophilic pullulan on the membrane during
filtration [148]. A similar phenomenon has also been reported in the literature
when utilizing hydrophilic polymer, e.g. polyvinyl alcohol, to modify
membrane surface [149]. After 10 h, the normalized flux slightly decreased,
likely due to enhanced osmotic pressure as some ions from the feed solution
were captured by pullulan on the membrane surface. This was supported by the
decreased salt rejection from 99.35% to 98.80%. As pullulan deposited on the
membrane surface under the effect of flux, it was likely to capture the ions from
the feed solution to the membrane. As a result, the osmotic pressure on the
membrane surface increased leading to decrease in flux which eventually
overcame the small increase in flux evident between 0 and 10 h. When a higher
concentration of pullulan was used (0.5 g/L), flux began increasing sooner (5.5
h), indicating more ions were captured at a higher concentration.

CHAPTER 4
54
4.2.2 Comparison of fouling in reverse osmosis by model polysaccharides and
polysaccharide isolated from naturally adherent bacteria in a seawater
desalination plant
Fig.4.3 Comparison of membrane fouling by model polysaccharides and
polysaccharide isolated from naturally adherent bacteria in a seawater desalination
plant. A hydraulic pressure of 400 psi (2757.9 kPa) was applied. Other experimental
conditions included: initial flux of 9.5 L/(m2·h); cross-flow velocity of 8.5 cm/s;
solution temperature of 25 ± 1 ℃; feed solution consisting of 1 mM Ca2+ ions and 50
mM total ionic strength by adding NaCl; all polysaccharide concentration of 0.2 g/L.
Membrane fouling in reverse osmosis (RO) by model polysaccharides (alginate,
xanthan and pullulan) and two polysaccharides isolated from adherent bacteria
in a desalination plant (RSW 8 and RSW 12) were compared over 4 h at a
concentration of 0.2 g/L (Fig.4.3). Alginate caused greatest flux decline and the
most severe fouling likely due to formation of Ca-alginate gels. Pullulan did not
cause flux decline. Both the naturally occurring polysaccharides, RSW 8 and
RSW 12, caused fouling, suggesting these polymers accumulated on membrane
surface. The findings are the first to compare the types of polysaccharides
which are naturally occurring with model polysaccharides and demonstrate they
do contribute to biofouling in RO and may explain a large proportion of the
flux decline observed in desalination plants worldwide. Alleviation of
biofouling may be achieved by the reduction of polymer accumulation on the
membrane surface.
0.8
0.9
1.0
1.1
0 1 2 3 4
No
rmal
ize
d fl
ux
(Jt/
J o)
Time(h)
NaCl+CaCl₂ NaCl+CaCl₂+alginate NaCl+CaCl₂+pullulan NaCl+CaCl₂+xanthan NaCl+CaCl₂+RSW8 NaCl+CaCl₂+RSW12

CHAPTER 4
55
However, the extent of fouling by the two isolated polymers also differed. RSW
12 caused more severe fouling than RSW 8, but its fouling extent was still
lower than that of alginate (Fig.4.3). This indicates that alginate is an atypical
model membrane fouling and this should be considered in experimental design.
4.2.3 Effect of applied pressure on polysaccharide fouling in reverse osmosis
Fig.4.4 Effect of applied pressure on membrane fouling by model polysaccharides for
24 h in reverse osmosis (RO). A hydraulic pressure of 400 psi (2757.9 kPa) or 500 psi
(3447.4 kPa) was applied. Accordingly, the initial fluxes were 9.5 L/(m2·h) and 13.0
L/(m2·h), respectively; Other experimental conditions included: cross-flow velocity of
8.5 cm/s; solution temperature of 25 ± 1 ℃; feed solution consisting of 1 mM Ca2+ ions
and 50 mM total ionic strength by adding NaCl; polysaccharide concentration of 0.2
g/L.
The effect of applied hydraulic pressure on polysaccharide fouling was
investigated by comparing 400 psi (2757.9 kPa) and 500 psi (3447.4 kPa). As
expected, the higher applied pressure resulted in greater initial permeate flux. In
the absence of polysaccharide, flux decline was not significantly different
between 400 and 500 psi. Normalized flux decline was greater for alginate and
xanthan under the higher applied pressure (Fig.4.4). This is supported by
previous studies [32, 46, 73] which suggest higher initial flux result in more
severe membrane fouling. As applied pressure increased from 400 psi to 500
psi, the normalized flux declined from 0.70 to 0.46 for alginate fouling and
0.0
0.2
0.4
0.6
0.8
1.0
0 5 10 15 20 25
No
rmal
ize
d fl
ux
(Jt/
J o)
Time (h)
400psi NaCl+CaCl₂ 500psi NaCl + CaCl₂ 400psi NaCl+CaCl₂+alginate 500psi NaCl + CaCl₂ + alginate 400psi NaCl+CaCl₂+xanthan 500psi NaCl + CaCl₂ + xanthan
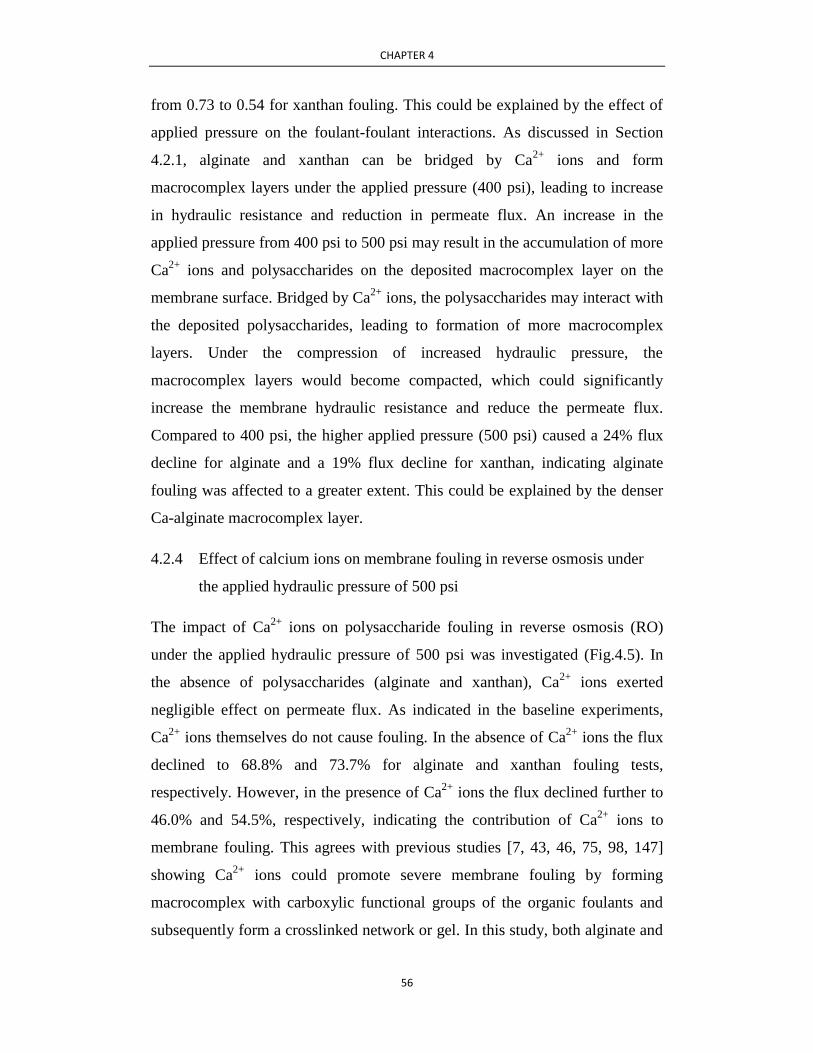
CHAPTER 4
56
from 0.73 to 0.54 for xanthan fouling. This could be explained by the effect of
applied pressure on the foulant-foulant interactions. As discussed in Section
4.2.1, alginate and xanthan can be bridged by Ca2+
ions and form
macrocomplex layers under the applied pressure (400 psi), leading to increase
in hydraulic resistance and reduction in permeate flux. An increase in the
applied pressure from 400 psi to 500 psi may result in the accumulation of more
Ca2+
ions and polysaccharides on the deposited macrocomplex layer on the
membrane surface. Bridged by Ca2+
ions, the polysaccharides may interact with
the deposited polysaccharides, leading to formation of more macrocomplex
layers. Under the compression of increased hydraulic pressure, the
macrocomplex layers would become compacted, which could significantly
increase the membrane hydraulic resistance and reduce the permeate flux.
Compared to 400 psi, the higher applied pressure (500 psi) caused a 24% flux
decline for alginate and a 19% flux decline for xanthan, indicating alginate
fouling was affected to a greater extent. This could be explained by the denser
Ca-alginate macrocomplex layer.
4.2.4 Effect of calcium ions on membrane fouling in reverse osmosis under
the applied hydraulic pressure of 500 psi
The impact of Ca2+
ions on polysaccharide fouling in reverse osmosis (RO)
under the applied hydraulic pressure of 500 psi was investigated (Fig.4.5). In
the absence of polysaccharides (alginate and xanthan), Ca2+
ions exerted
negligible effect on permeate flux. As indicated in the baseline experiments,
Ca2+
ions themselves do not cause fouling. In the absence of Ca2+
ions the flux
declined to 68.8% and 73.7% for alginate and xanthan fouling tests,
respectively. However, in the presence of Ca2+
ions the flux declined further to
46.0% and 54.5%, respectively, indicating the contribution of Ca2+
ions to
membrane fouling. This agrees with previous studies [7, 43, 46, 75, 98, 147]
showing Ca2+
ions could promote severe membrane fouling by forming
macrocomplex with carboxylic functional groups of the organic foulants and
subsequently form a crosslinked network or gel. In this study, both alginate and

CHAPTER 4
57
xanthan molecules contain carboxylic functional groups, and are able to form
macrocomplex in the presence of Ca2+
ions. Specifically, alginate formed
compact thin gels by interaction with Ca2+
ions, and resulted in more severe
fouling.
Fig.4.5 Effect of Ca2+
ions on membrane fouling in RO by model polysaccharides
under the applied hydraulic pressure of 500 psi for 24 h. A hydraulic pressure of 500
psi (3447.4 kPa) was applied. Other experimental conditions included: initial flux of
13.0 L/(m2·h); cross-flow velocity of 8.5 cm/s; solution temperature of 25 ± 1 ℃; feed
solution consisting of 50 mM total ionic strength in the absence or presence of 1 mM
Ca2+
ions; polysaccharide concentration of 0.2 g/L.
4.3 Polysaccharide fouling in forward osmosis
4.3.1 Effect of feed solution on polysaccharide fouling in forward osmosis
Initially, the effect of feed solution was investigated comparing polysaccharide
fouling in forward osmosis (FO) using alginate, xanthan and pullulan as
foulants and comparing artificial seawater (ASW) and DI feed solution (DI
water which included 1 mM Ca2+
ions and 50 mM total ionic strength). When
ASW feed solution was used, the initial permeate flux was at about 7.4 LMH;
while an initial flux of about 9.5 LMH could be achieved using DI feed solution
(graphs not shown).
0.0
0.2
0.4
0.6
0.8
1.0
1.2
Baseline Alginate Xanthan
NN
orm
aliz
ed
flu
x (J
t/J o
) af
ter
24
h NaCl
NaCl+CaCl₂

CHAPTER 4
58
Fig.4.6 Effect of feed solution on polysaccharide fouling in FO by alginate, xanthan
and pullulan. Constantly saturated NaCl solution was used as draw solution. Other
experimental conditions included: polysaccharide concentration of 0.2 g/L; initial flux
of 9.5 L/(m2·h) using DI water as feed solution containing 1 mM Ca
2+ ions and 50 mM
total ionic strength by adding NaCl, or 7.4 L/(m2·h) using ASW as feed solution;
cross-flow velocity of 8.5 cm/s; solution temperature of 25 ± 1 °C.
Fig.4.7 Viscosity of polysaccharide solutions e.g. alginate, xanthan, and pullulan (0.2
g/L).
0.6
0.7
0.8
0.9
1
1.1
DI ASW
No
rmal
ize
d fl
ux
(Jt/
J o)
Control Alginate Xanthan
8.0
9.0
10.0
11.0
12.0
13.0
14.0
Baseline Alginate Xanthan Pullulan
Solu
tio
n v
isco
sity
(1
0-4
Pa·
s)

CHAPTER 4
59
Fig.4.8 Relationship between the weight of polysaccharide deposit and normalized flux
after 24 h FO.
Using DI feed solution, pullulan caused only marginal fouling compared to the
baseline in FO. Interestingly, xanthan caused the most severe fouling with a
significant final flux decline of 14.5 % after 24 h; whilst only ~ 8.5% of flux
reduction is observed in the presence of alginate. Solution viscosity may be the
most critical factor governing the different fouling behaviors of polysaccharides
in FO. Viscosities of polysaccharide solutions follow the order of xanthan >
alginate > pullulan (Fig.4.7). This is consistent with previous studies that
indicate polysaccharides of larger MWs induce higher solution viscosities [42,
150]. The relationship between weight of polysaccharide deposit and
normalized flux after 24 h FO shows that the weight of xanthan foulant is
greatest, followed by alginate and then pullulan (Fig.4.8). This further supports
the argument that xanthan, which has largest MW (1000 kDa ~ 50,000 kDa)
and highest viscosity in solution, causes most severe flux reduction in the FO
test. The use of polysaccharides with high MW in the feed solution may reduce
the shear force generated by the cross-flow velocity and promote polymer
accumulation, resulting in greater fouling [73, 98]. In particular, as xanthan
accumulates on the membrane, its concentration near the surface increases and
consequently increases viscosity. Polymer deposition accumulates, making the
fouling more pronounced and reducing water permeation. After 20 h in FO,
relatively constant fluxes were observed in both alginate and xanthan fouling
Control
Alginate
Xanthan
Pullulan
-0.04
0.01
0.06
0.11
0.16
0.75 0.80 0.85 0.90 0.95 1.00
Wfo
ula
nt (
g)
Normalized flux (Jt/J0)

CHAPTER 4
60
tests, suggesting further accumulation of polysaccharide was limited by the
shear force [151].
By contrast, when ASW was used as feed solution, the three polysaccharides
behaved differently (Fig.4.6). Alginate casued the most fouling, xanthan had
negligible impact on fouling and pullulan slightly improved the membrane
performance. Compared to the DI feed solution, ASW contains a much higher
salt concentration, which generates high osmotic pressure on the feed solution
side and thus can significantly reduce permeate flux. As a high salt
concentration in the feed solution caused a severe flux decline, the additional
impact of polysaccharides was much reduced. This is consistent with the results
in previous study which also reported a great reduction in flux decline at
seawater-level ionic strengths [68]. Nevertheless, as ASW contains a large
amount of Ca2+
ions (10.37 mM, Table.3.1), alginate could form compact
Ca-alginate gels by crosslinking with Ca2+
ions. This may explain why alginate
still resulted in flux decline in FO fouling using ASW as feed solution, even
though the flux decline was only half that observed when DI feed solution was
used. The Mg2+
ions in ASW are also known to increase macrocomplexes by
alginate and may compete for biding sites on the carboxylic acid functional
groups of alginate. A previous study compared the effect of Mg2+
and Ca2+
ions
on alginate fouling in RO, and observed a dramatic flux decline in the presence
of Ca2+
ions but not Mg2+
ions [8]. In the presence of Ca2+
ions, compact
Ca-alginate gels formed on the membrane surface while no gel layers was
visible in the presence of Mg2+
ions. In our study, ASW feed solution
constained a higher concentration of Mg2+
(54.1 mM) than Ca2+
ions (10.37
mM) (See in Table.3.1), and may play a more significant role than in previous
studies. Although alginate caused moderate flux decline and membrane fouling,
the competition for binding sites between Ca2+
and Mg2+
ions may partially
explain why the extent of membrane fouling was reduced.
Unlike alginate, xanthan cannot form compact gels in the presence of Ca2+
or
Mg2+
ions. In DI feed solution with low ionic strength (50 mM), xanthan caused

CHAPTER 4
61
most severe fouling likely due to high viscosity in solution which could reduce
the shear force by the cross-flow velocity. By contrast, in the ASW feed
solution, the high osmotic pressure became the dominating contributor to the
flux decline and xanthan presented negligible impact on flux decline. While
alginate promoted flux decline and xanthan showed negligible impact in the
ASW feed solution, the presence of pullulan slightly improved membrane
performance with an increase in flux of 3.7%. As discussed in Section 4.2.1, the
accumulation of hydrophilic pullulan could improve hydrophilicity and
smoothness of the membrane surface, and thus improve membrane performance.
Similarly, using ASW feed solution, pullulan presented a positive effect on
membrane performance.
4.3.2 Comparison of forward osmosis fouling by model polysaccharides and
polysaccharides isolated from naturally adherent bacteria in a seawater
desalination plant
Fig.4.9 Comparison of forward osmosis (FO) fouling by model polysaccharides and
polysaccharides isolated from naturally adherent bacteria in a seawater desalination
plant. Three kinds of model polysaccharides, alginate, xanthan and pullulan, and three
species of polysaccharides isolated from naturally adherent bacteria, FSW 6, RSW 8
and RSW 14, were used as foulants. Constantly saturated NaCl solution was used as
draw solution. Other experimental conditions included: polysaccharide concentration
of 0.2 g/L; initial flux of 9.5 L/(m2·h); cross-flow velocity of 8.5 cm/s; solution
0.85
0.88
0.91
0.94
0.97
1.00
1.03
1.06
0 1 2 3 4
No
rmal
ize
d fl
ux
(Jt/
J o)
Time (h)
NaCl+CaCl₂ NaCl+CaCl₂+FSW6
NaCl+CaCl₂+RSW8 NaCl+CaCl₂+RSW14
NaCl+CaCl₂+alginate NaCl+CaCl₂+pullulan
NaCl+CaCl₂+xanthan

CHAPTER 4
62
temperature of 25 ± 1 °C; feed solution consisting of 1 mM Ca2+ ions and 50 mM total
ionic strength.
In FO, all three model polysaccharides caused some fouling, while the three
isolated polymers did not cause fouling (Fig.4.9). In these short-term fouling
tests (4 h), alginate caused the most severe fouling among the three model
polysaccharides. Again, this could be explained by the bridging and gel
formation by Ca2+
ions. Compared to xanthan and pullulan, alginate possessed
the most negatively charged carboxylic functional groups, which may have
enabled alginate to quickly accumulate on the membrane surface. By contrast,
pullulan molecules are neutral (Fig.3.1), perhaps explaining their minimum
fouling effect. Interestingly, all the isolated polymers did not cause fouling in
the FO process. FSW 6 and RSW 14 caused an increase in permeate flux,
compared to the baseline with model polysaccharides added, indicating some
polymers could improve membrane performance. The difference in flux
behaviors between model polysaccharide fouling and isolated polymer fouling
in FO once again demonstrates that alginate is an atypical polymer model in FO
fouling. It is important to select appropriate polysaccharide models for
membrane fouling research.
4.4 Comparison of fouling in reverse osmosis and forward
osmosis
4.4.1 Comparison of membrane fouling in reverse osmosis and forward
osmosis by model polysaccharides
The normalized flux declines in forward osmosis (FO) and reverse osmosis (RO)
polysaccharide fouling tests are compared after 24 h (Fig.4.10a), while the
weight of polysaccharide deposited on the membrane are presented in Fig.4.10b.
Deposit weight of both alginate and xanthan were higher in RO than FO
(Fig.4.10b). The deposit weight of pullulan was negligible in both FO and RO.
The results are consistent with the fluxes obtained in the polysaccharide fouling
tests (Fig.4.10a). Hence, the weight of foulant deposit is suggested as an

CHAPTER 4
63
indicator of membrane fouling in both FO and RO; if more deposit is present,
membrane fouling is more severe. The use of pullulan with negligible deposit
weight caused almost no fouling during separation.
This finding conflicts with some previous reports [2, 3]. For instance, Lee and
co-workers found higher flux decline for alginate in the FO process compared
to the RO process; which was attributed to cake-enhanced osmotic pressure
(CEOP) [3, 29, 31]. In their work, using continuously diluted 5 M NaCl as the
draw solution, the reverse diffusion of salt from the draw solution to feed
solution was hindered by the fouling layer, elevating osmotic pressure near the
active layer of the membrane surface and subsequently reducing the driving
force across the membrane. However, in this study, normalized flux decline
was 16% greater in RO than in the FO process (Fig.4.10a). This could be
explained by our newly developed FO separation protocol which uses
constantly saturated NaCl solution as a draw solution. Undoubtedly, the salt
reversely passes through the semi-permeable membrane from the draw solution
side to the feed solution side; which is trapped within the fouling (gel) layer.
However, due to the high osmotic pressure generated by the constantly
saturated NaCl solution, despite a build-up of salts near the membrane surface
and CEOP occurring, the substantial drop in the net osmotic pressure difference
is greatly minimized and flux decline in FO alginate fouling test is moderated.
Moreover, because of using the osmotic pressure gradient as driving force, it is
believed that alginate fouling (gel) layer formed on the membrane active
surface during the FO process is looser and thicker, compared with that
observed in the RO process. This loose and thick layer was found to be
reversible by changing cross-flow velocity [2, 3]. Therefore, some of the
alginate fouling layer, especially on the top is loose and sparse at the surface
and likely to be scraped away by shear force arising from flow. Thus, FO
fouling by alginate is largely governed by foulant – membrane interaction. By
contrast, this effect is not evident in the RO process, in which hydraulic
pressure works as the driving force and the Ca-alginate gel layer is irreversible
[56]. This is further supported by comparing the weight of alginate deposit on
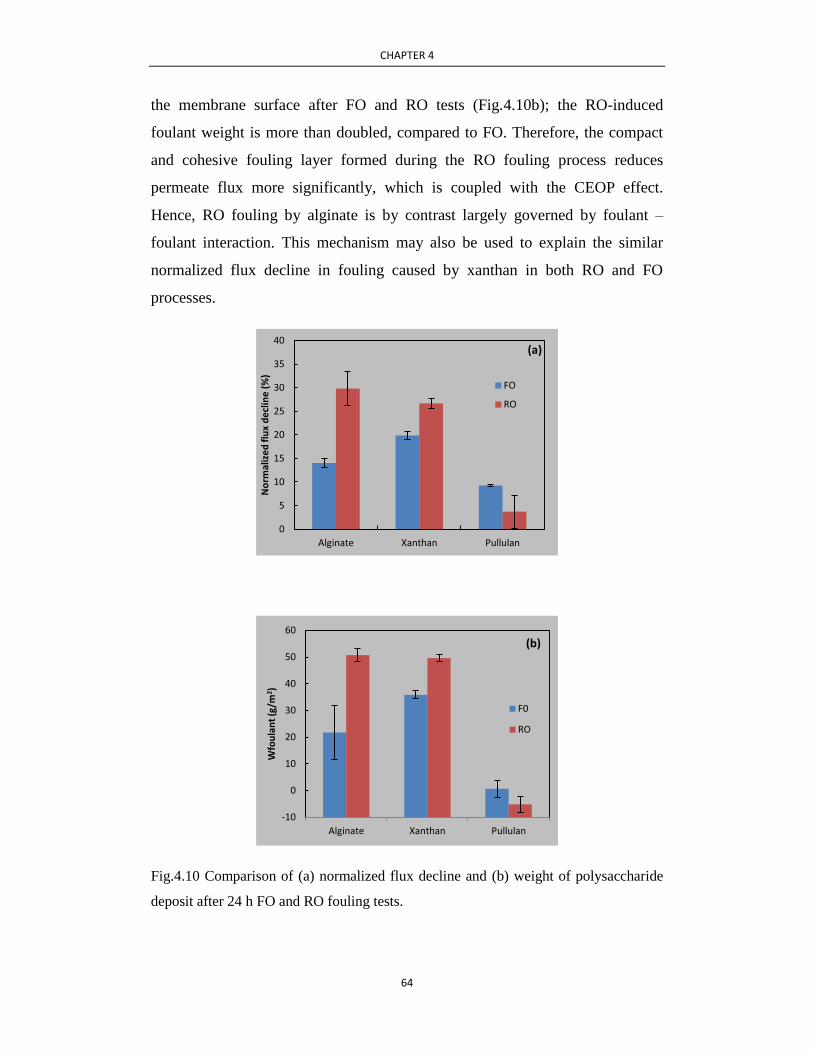
CHAPTER 4
64
the membrane surface after FO and RO tests (Fig.4.10b); the RO-induced
foulant weight is more than doubled, compared to FO. Therefore, the compact
and cohesive fouling layer formed during the RO fouling process reduces
permeate flux more significantly, which is coupled with the CEOP effect.
Hence, RO fouling by alginate is by contrast largely governed by foulant –
foulant interaction. This mechanism may also be used to explain the similar
normalized flux decline in fouling caused by xanthan in both RO and FO
processes.
Fig.4.10 Comparison of (a) normalized flux decline and (b) weight of polysaccharide
deposit after 24 h FO and RO fouling tests.
0
5
10
15
20
25
30
35
40
Alginate Xanthan Pullulan
No
rmal
ize
d fl
ux
de
clin
e (
%)
(a)
FO
RO
-10
0
10
20
30
40
50
60
Alginate Xanthan Pullulan
Wfo
ula
nt
(g/m
2 )
(b)
F0
RO

CHAPTER 4
65
Despite alginate frequently being selected as a representative model for organic
membrane fouling, our study suggests it is atypical of bacteria polysaccharides,
causing more severe fouling and the impact of ions in seawater such as Ca2+
ions may play a larger role in alginate fouling than other polysaccharides.
Therefore, alginate is not a suitable model for investigation of membrane
fouling, fouling alleviation or the development of antifouling membranes in the
field of desalination.
With our superior experimental set up using over saturated FO draw solution,
identical operational conditions and solution chemistry, we were able to better
compare fouling in FO and RO processes. We could directly determine the
effect of pressure type on membrane fouling in membrane separation processes.
Our experimental results revealed that more severe fouling occurred under
applied pressure (RO) than under equivalent osmotic pressure (FO) based on
the initial flux they generated. To the best of our knowledge, it is the first time
that pressure source alone has been proved to plays a key role in membrane
fouling during membrane separation processes.
4.4.2 Comparison of membrane fouling in reverse osmosis and forward
osmosis by polysaccharides isolated from naturally adherent bacteria in
a seawater desalination plant
Membrane fouling in forward osmosis (FO) and reverse osmosis (RO) using the
polysaccharide isolated from naturally adherent bacteria, RSW 8, as the foulant
were compared (Fig.4.11). The addition of RSW 8 caused fouling in RO but not
in FO. These results and those presented above (Fig.4.10a) suggest the fouling
behaviors of polymers in FO and RO under identical operating conditions and
feed water chemistry vary. The pressure source (applied hydraulic pressure or
osmotic pressure) also plays an important role in the extent of fouling in
membrane separation processes.
As the membrane fouling in both of FO and RO varies according type of
polysaccharide, it is very important to select representative polysaccharide

CHAPTER 4
66
foulant models for each process. This study provides the first insight into this
fundamental research area; and more work is continuing using mixtures of
different polysaccharides, which may better simulate fouling in the field.
Fig.4.11 Comparison of membrane fouling in reverse osmosis and forward osmosis by
polysaccharides isolated from naturally adherent bacteria RSW 8. RO fouling tests
were conducted with a hydraulic pressure of 400 psi; whilst FO tests were carried out
by using constantly saturated NaCl solutions as draw solutions. All runs were
performed under identical conditions: initial flux of 9.5 L/(m2·h); cross-flow velocity
of 8.5 cm/s; solution temperature of 25 ± 1 °C; feed solution consisting of 1 mM Ca2+
ions and 50 mM total ionic strength; polymer concentration of 0.2 g/L.
4.5 Summary
Investigation and comparison of polysaccharide fouling in forward osmosis (FO)
and reverse osmosis (RO) have been conducted by using model polysaccharides
(alginate, xanthan and pullulan) and polysaccharides (FSW 6, RSW 8, RSW 12
and RSW 14) isolated from naturally adherent bacteria in a seawater
desalination plant. The major findings are as follows:
Firstly, the use of constantly saturated draw solution maintained a constant
driving force in FO and enabled a better comparison of polysaccharide fouling
in FO and RO.
Secondly, some findings from RO fouling tests are:
0.7
0.8
0.9
1.0
0.0 0.5 1.0 1.5 2.0 2.5 3.0 3.5 4.0
No
rmal
ize
d fl
ux
(Jt/
J o)
Time (h)
RO:NaCl+CaCl₂
FO:NaCl+CaCl₂
RO:NaCl+CaCl₂+RSW 8
FO:NaCl+CaCl₂+RSW 8

CHAPTER 4
67
1) Both alginate and xanthan caused membrane fouling; while pullulan
enhanced permeate flux. As the polysaccharide concentration increased
from 0.2 g/L to 0.5 g/L, the membrane fouling was aggravated for alginate,
and negligible further fouling was observed for xanthan.
2) Comparison of model polysaccharides (alginate, xanthan and pulluan) and
polysaccharides (RSW 8 and RSW 12) showed that the polysaccharides
behaved differently in membrane fouling. The results also indicate alginate
is not a typical model for polysaccharide in membrane fouling. More work
is necessary to explore the most representative polysaccharides for
membrane fouling study.
3) Increased applied hydraulic pressure and addition of Ca2+
ions could cause
more severe alginate and xanthan fouling.
Thirdly, some findings from FO fouling tests are:
1) Using DI water feed solution in FO, solution viscosity could be the major
factor governing polysaccharide (alginate, xanthan and pullulan) fouling;
while using artificial seawater feed solution, osmotic pressure was the major
contributor to flux decline in polysaccharide fouling tests.
2) Comparison of FO fouling by model polysaccharides (alginate, xanthan and
pullulan) and polysaccharides (FSW 6, RSW 8 and RSW 14) isolated from
naturally adherent bacteria in a seawater desalination showed that all the
model polysaccharides caused flux decline, while all the isolated
polysaccharides improved permeate flux, indicating that some polymers
could improve membrane performance.
Fourthly, it was found from comparison of membrane fouling in RO and FO
that xanthan and alginate caused more severe fouling in RO than in FO, and
RSW 8 caused membrane fouling in RO but improve permeate flux in FO.
These results indicated that the pressure source alone plays an important role in
polysaccharide fouling during the membrane separation.

CHAPTER 5
68
Chapter 5. Alleviation of polysaccharide fouling in
reverse osmosis and forward osmosis
This chapter investigates and compares alleviation efficiency of sodium
nitroprusside (SNP) and potassium ferricyanide (KFCN) in alleviating
membrane fouling by alginate and xanthan in forward osmosis (FO) and reverse
osmosis (RO). In a typical experiment on polysaccharide fouling alleviation,
the alleviating agent was added with the polysaccharide foulant after 2 h
membrane compaction with DI water and 2 h membrane stabilization using
foulant-free electrolyte solution (DI water containing 1 mM Ca2+
ions and 50
mM ionic strength by adding NaCl). As mentioned in Section 3.3, SNP
molecule contains five cyanide ligands (-CN) and one linear nitric oxide ligand
(-NO) and can produce NO radical; while KFCN has six cyanide ligands but no
oxide ligand. Therefore, KFCN can be used to compare with SNP in regard to
production of NO radical and its effect in polysaccharide fouling alleviation.
Both SNP and KFCN are toxic when their cyanide ligands are released under
certain circumstances. However, effect of the two alleviating agents was tested
at a nontoxic or sublethal concentration in this study. In addition, the membrane
used in this study has a high rejection coefficient and can retain most of SNP
and KFCN from the feed solution. As a result, it is safe to use these agents to
mitigate membrane fouling.
5.1 Alleviation of polysaccharide fouling in reverse osmosis
5.1.1 Effect of alleviating agent type on polysaccharide fouling alleviation in
reverse osmosis
The alleviating efficiencies of sodium nitroprusside (SNP) and potassium
ferricyanide (KFCN) on polysaccharide fouling in reverse osmosis (RO) were
compared (Fig.5.1). In the baseline experiment that the feed solution contained

CHAPTER 5
69
only NaCl, permeate flux decreased nearly 4.5% after 24 h experiment
(Fig.5.1a). This was likely due to concentration of the feed water as the water in
the feed water continuously permeated through the membrane, subsequently
increasing the osmotic pressure of the feed water [3]. Negligible flux decline
was observed when SNP and KFCN at the concentration of 0.1 mM was added
to the NaCl feed solution (Fig.5.1a). This could be due to the enhancement of
osmotic pressure as the addition of SNP and KFCN increased the feed
concentration as well as the osmotic pressure. This is consistent with the change
in solution conductivity. When the feed solution contained only NaCl, its
solution conductivity was 3.345 ms; while the conductivities negligibly
increased to 3.375 ms and 3.445 ms, respectively, when SNP (0.1mM) and
KFCN (0.1mM) were added. The results indicate SNP and KFCN do not
significantly change permeate flux.
0.0
0.2
0.4
0.6
0.8
1.0
1.2
NaCl NaCl+alginate NaCl+xanthan
No
rmal
ize
d fl
ux
(Jt/
J o)
(a) Baseline
SNP
KFCN
0
5
10
15
20
25
30
35
NaCl+alginate NaCl+xanthan
Alle
viat
ion
eff
icie
ncy
(%)
(b)
SNP
KFCN

CHAPTER 5
70
Fig.5.1 Alleviating effect of SNP/KFCN on polysaccharide fouling: (a) normalized
flux after 24 h; (b) alleviation efficiency. A hydraulic pressure of 500 psi (3447.4 kPa)
was applied, generating an initial flux of 13.0 L/(m2·h). The concentration of
SNP/KFCN was 0.1 mM. Other experimental conditions included: polysaccharide
concentration of 0.2 g/L; cross-flow velocity of 8.5 cm/s; solution temperature of 25 ±
1 ℃; total ionic strength of 50 mM.
Alginate caused membrane fouling which resulted in 27% permeate flux
decline while xanthan caused 22% flux decline (Fig.5.1a). Such fouling
behavior can be attributed to accumulation of polysaccharide on the membrane
surface under high hydraulic pressure and cake-enhanced osmotic pressure.
Accumulation of polysaccharide occurs through two steps: the attachment of
polysaccharide on the membrane surface, followed by interaction between
polysaccharide on the membrane surface and polysaccharide in the feed water
[55, 152]. Polysaccharide in the feed water firstly interacts with the membrane
material through some chemical functional groups, such as carboxyl groups in
alginate and xanthan molecules. Polysaccharide in the feed water then interacts
with the polysaccharide deposited on the membrane surface. Under the
constantly high hydraulic pressure, the accumulation of polysaccharide can be
promoted, leading to an increase in total hydraulic resistance. Meanwhile,
accumulation of polysaccharide on the membrane surface can contribute to
cake-enhanced osmotic pressure by entrapping the dissolved solute in the feed
water and hindering the back diffusion of salt ions [3], which results in an
increase in osmotic pressure of the feed water near the membrane surface.
Therefore, the accumulation of polysaccharide increasing hydraulic resistance,
together with sequential enhanced osmotic pressure on the membrane surface,
resulted in significant flux decline.
When SNP and KFCN were present, both normalized fluxes for alginate and
xanthan fouling were improved (Fig.5.1a). The flux for alginate fouling was
68.8%, and improved to 76.9% and 70.8% by SNP and KFCN, respectively.
Similarly with xanthan as the polysaccharide foulant, flux decline was
improved from 73.7% to 80.6% by SNP and 81.3% by KFCN. As to fouling

CHAPTER 5
71
alleviation efficiency (ψ) SNP accounted for 26% improvement in alginate
fouling, KFCN 7% (Fig.5.1b). For xanthan fouling, 26% improvement was
achieved in the presence of SNP; 29% in the presence of KFCN. Both SNP and
KFCN can alleviate polysaccharide fouling (Fig.5.1). This could be explained
by rather the electrostatic repulsion between polysaccharides and alleviating
agents than reduced solution viscosity, as the addition of SNP and KFCN
increased viscosity of alginate solution and xanthan solution (Fig.5.2). Previous
studies [71, 100] attributed the reduction of BSA fouling in RO in the presence
of Ca2+
ions to the strong electrostatic repulsion as both BSA and
BSA-absorbed membrane surface bore negative charges. In this study, alginate
and xanthan contained negatively charged –COO- functional groups, while
SNP and KFCN were also negatively charged [Fe(CN)5NO]2-
and [Fe(CN)6]3-
,
respectively. As the alleviating agents and the polysaccharide foulants
accumulated on the membrane surface, strong electrostatic repulsion could
occur and significantly lead to less compact fouling layer on the membrane
surface, which would be washed off under the shear force of the cross-flow
velocity [32].
Fig.5.2 Viscosity of polysaccharide solutions in the absence and presence of alleviating
agents. The solution contains 50 mM NaCl, 0.2 g/L alginate or xanthan, and 0.1 mM
SNP or KFCN if added.
0
2
4
6
8
10
12
14
16
NaCl+alginate NaCl+xanthan
Solu
tio
n v
isco
sity
(×
10
-4P
a·s)
Baseline SNP KFCN
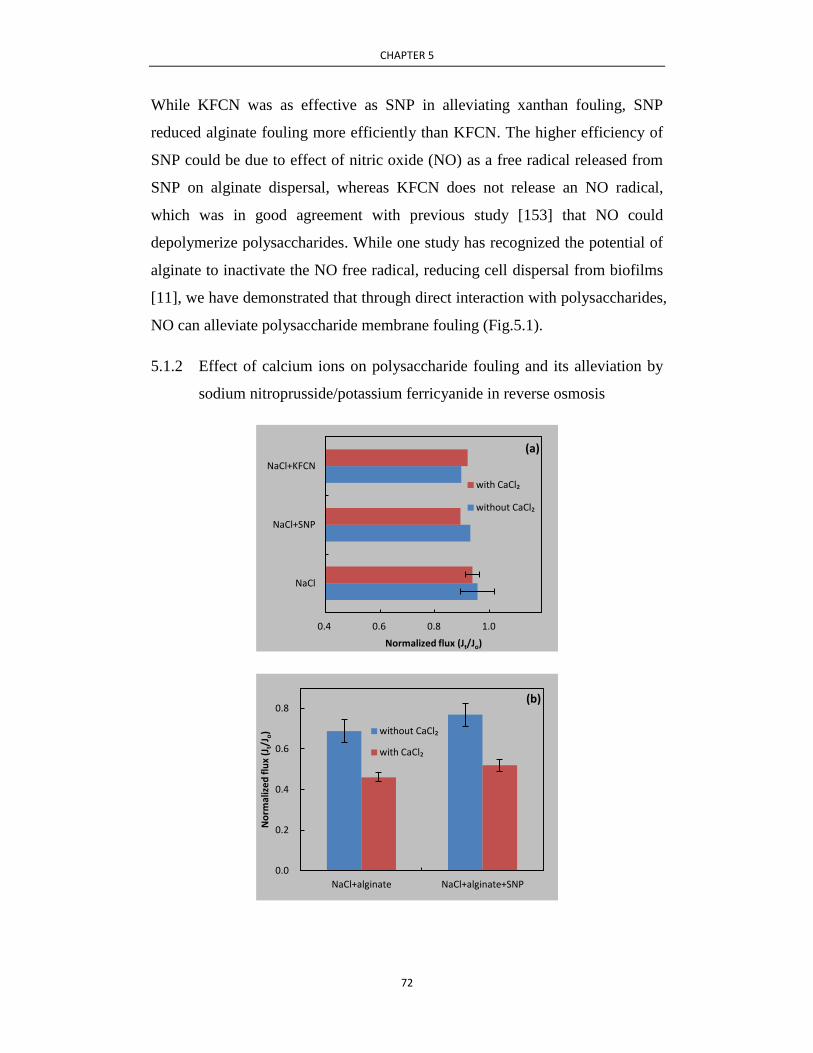
CHAPTER 5
72
While KFCN was as effective as SNP in alleviating xanthan fouling, SNP
reduced alginate fouling more efficiently than KFCN. The higher efficiency of
SNP could be due to effect of nitric oxide (NO) as a free radical released from
SNP on alginate dispersal, whereas KFCN does not release an NO radical,
which was in good agreement with previous study [153] that NO could
depolymerize polysaccharides. While one study has recognized the potential of
alginate to inactivate the NO free radical, reducing cell dispersal from biofilms
[11], we have demonstrated that through direct interaction with polysaccharides,
NO can alleviate polysaccharide membrane fouling (Fig.5.1).
5.1.2 Effect of calcium ions on polysaccharide fouling and its alleviation by
sodium nitroprusside/potassium ferricyanide in reverse osmosis
0.4 0.6 0.8 1.0
NaCl
NaCl+SNP
NaCl+KFCN
Normalized flux (Jt/Jo)
(a)
with CaCl₂
without CaCl₂
0.0
0.2
0.4
0.6
0.8
NaCl+alginate NaCl+alginate+SNP
No
rmal
ize
d fl
ux
(Jt/
J o)
(b)
without CaCl₂
with CaCl₂

CHAPTER 5
73
Fig.5.3 Effect of Ca2+
ions on alginate and xanthan fouling and their alleviation by
sodium nitroprusside (SNP) and potassium ferricyanide (KFCN) in reverse osmosis
(RO). (a) fouling by Ca2+ ions; (b) effect of Ca
2+ ions on alginate fouling and its
alleviation by SNP; (c) effect of Ca2+
ions on alginate fouling and its alleviation by
0.0
0.1
0.2
0.3
0.4
0.5
0.6
0.7
0.8
NaCl+alginate NaCl+alginate+KFCN
No
rmal
ize
d fl
ux
(Jt/
J o)
(c)
without CaCl₂
with CaCl₂
0.0
0.1
0.2
0.3
0.4
0.5
0.6
0.7
0.8
NaCl+xanthan NaCl+xanthan+SNP
No
rmal
ize
d fl
ux
(Jt/
J o)
(d)
without CaCl₂
with CaCl₂
0.0
0.1
0.2
0.3
0.4
0.5
0.6
0.7
0.8
NaCl+xanthan NaCl+xanthan+KFCN
No
rmal
ize
d fl
ux
(Jt/
J o)
(e)
without CaCl₂
with CaCl₂
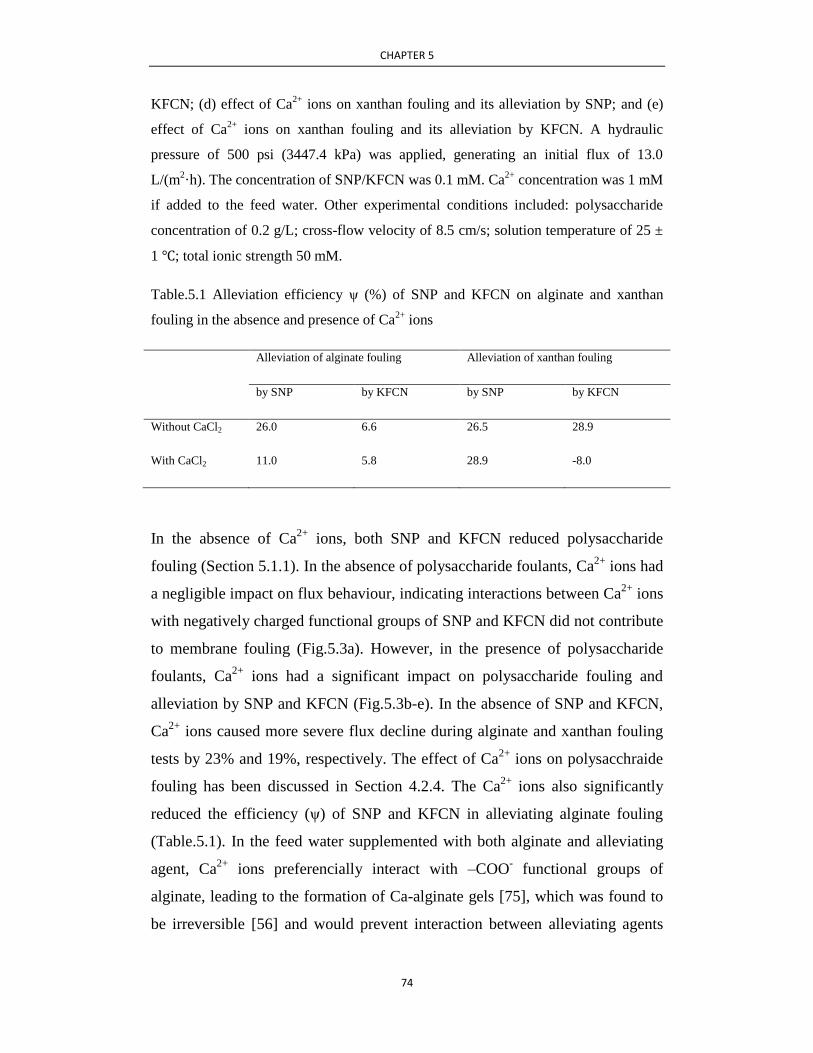
CHAPTER 5
74
KFCN; (d) effect of Ca2+
ions on xanthan fouling and its alleviation by SNP; and (e)
effect of Ca2+
ions on xanthan fouling and its alleviation by KFCN. A hydraulic
pressure of 500 psi (3447.4 kPa) was applied, generating an initial flux of 13.0
L/(m2·h). The concentration of SNP/KFCN was 0.1 mM. Ca
2+ concentration was 1 mM
if added to the feed water. Other experimental conditions included: polysaccharide
concentration of 0.2 g/L; cross-flow velocity of 8.5 cm/s; solution temperature of 25 ±
1 ℃; total ionic strength 50 mM.
Table.5.1 Alleviation efficiency ψ (%) of SNP and KFCN on alginate and xanthan
fouling in the absence and presence of Ca2+
ions
Alleviation of alginate fouling Alleviation of xanthan fouling
by SNP by KFCN by SNP by KFCN
Without CaCl2 26.0 6.6 26.5 28.9
With CaCl2 11.0 5.8 28.9 -8.0
In the absence of Ca2+
ions, both SNP and KFCN reduced polysaccharide
fouling (Section 5.1.1). In the absence of polysaccharide foulants, Ca2+
ions had
a negligible impact on flux behaviour, indicating interactions between Ca2+
ions
with negatively charged functional groups of SNP and KFCN did not contribute
to membrane fouling (Fig.5.3a). However, in the presence of polysaccharide
foulants, Ca2+
ions had a significant impact on polysaccharide fouling and
alleviation by SNP and KFCN (Fig.5.3b-e). In the absence of SNP and KFCN,
Ca2+
ions caused more severe flux decline during alginate and xanthan fouling
tests by 23% and 19%, respectively. The effect of Ca2+
ions on polysacchraide
fouling has been discussed in Section 4.2.4. The Ca2+
ions also significantly
reduced the efficiency (ψ) of SNP and KFCN in alleviating alginate fouling
(Table.5.1). In the feed water supplemented with both alginate and alleviating
agent, Ca2+
ions preferencially interact with –COO- functional groups of
alginate, leading to the formation of Ca-alginate gels [75], which was found to
be irreversible [56] and would prevent interaction between alleviating agents

CHAPTER 5
75
and alginate. As a result, the efficiency of SNP and KFCN in alginate fouling
greatly decreased in the presence of Ca2+
ions. Compared to KFCN in the
absence and presence of Ca2+
ions, SNP presented higher efficiency in
alleviating alginate fouling (Table.5.1). This further confirms that the NO
moiety released by SNP could alleviate alginate fouling.
On the other hand, Ca2+
ions showed great impact on alleviation of xanthan
fouling by KFCN that the alleviation efficiency (ψ) was found to be negative
(Table.5.1), indicating that xanthan fouling was aggravated by Ca2+
ions even in
the presence of KFCN. This phenomenon could be attributed to the interaction
among KFCN, Ca2+
ions and xanthan. Ca2+
ions could play an role in bridging
between negatively charged functional groups carboxylic functional
groups(-COO-) on xanthan molecules and –CN of KFCN, which led to
formation of xanthan-Ca-KFCN macrocomplexes network and significant
reduction of the eletrostatic repulsion between polysaccharides and alleviating
agents. Under high hydraulic pressure, the macrocomplexes would become
compact, which could significantly increase the hydraulic resistance and reduce
the permeate flux. In addition, the capture of KFCN by xanthan may add to
osmotic pressure near the membrane surface, which leads to further decline in
permeate flux. While KFCN showed negative efficiency in alleviating xanthan
fouling in the presence of Ca2+
ions, alleviation efficiency of SNP in xanthan
fouling maintained at a slightly higher level in the presence of Ca2+
ions
compared to that in the absence of Ca2+
ions.
Generally, the presence of Ca2+
ions aggravated polysaccharide fouling and
reduced the alleviation efficiency (ψ) of SNP and KFCN. SNP appeared to
alleviate polysaccharide fouling to a greater extent than KFCN, likely due to the
NO free radical spontaneously released.

CHAPTER 5
76
5.1.3 Effect of alleviating agent concentration on polysaccharide fouling
alleviation in reverse osmosis
Two concentrations of alleviating agents (SNP and KFCN) were used to
compare their effect on alginate and xanthan fouling in reverse osmosis (RO) in
the presence of Ca2+
ions (Fig.5.4). SNP showed more alginate and xanthan
fouling alleviation than KFCN, again likely due to the release of NO (Fig.5.4).
Alleviation of alginate fouling increased with increasing SNP/KFCN
concentration. The high concentration of SNP caused less xanthan fouling
alleviation than the low concentration, while KFCN did not appear to improve
permeate flux at all (Fig. 5.4).
Fig.5.4 Effect of alleviating agent concentration on alleviation of polysaccharide
fouling in RO in the presence of Ca2+ ions: (a) normalized flux after 24 h; (b)
alleviation efficiency. A hydraulic pressure of 500 psi (3447.4 kPa) was applied,
0.0
0.1
0.2
0.3
0.4
0.5
0.6
0.7
0.8
Alginate Xanthan
No
rmal
ize
d fl
ux
(Jt/
J o)
(a) Baseline SNP(0.1mM)
SNP(1mM) KFCN(0.1mM)
KFCN(1mM)
-20
-10
0
10
20
30
Alginate Xanthan
Alle
viat
ion
eff
icie
ncy
(%
)
(b)
SNP(0.1mM) SNP(1mM)
KFCN(0.1mM) KFCN(1mM)

CHAPTER 5
77
generating an initial flux of 13.0 L/(m2·h). The concentration of sodium
nitroprusside/potassium ferricyanide (SNP/KFCN) was 0.1 mM or 1 mM. Ca2+
concentration was 1 mM. Other experimental conditions included: polysaccharide
concentration of 0.2 g/L; cross-flow velocity of 8.5 cm/s; solution temperature of 25 ±
1 ℃; total ionic strength 50 mM.
During alleviation of alginate fouling, SNP and KFCN at high concentration (1
mM) could compete against carboxylic functional groups (-COO-) of alginate in
interaction with Ca2+
ions, to some degree prevent the interaction between Ca2+
ions and alginate and thus reduce the formation of Ca-alginate gels, leading to
decrease in total hydraulic resistance. The fact that the efficiency on alleviation
of alginate fouling is nonlinear with increased concentration of alleviating agent
could be attributed to the preferential interaction between carboxylic functional
groups (-COO-) of alginate and Ca
2+ ions rather than between functional groups
and SNP and KFCN.
Alleviation of xanthan fouling decreased with increased alleviating agent
concentration could be due to the over-dosage of SNP and KFCN. Compared to
alginate, xanthan has less –COO- functional groups and could interact with less
SNP and KFCN. The remaining SNP and KFCN in the feed water could react
with Ca2+
ions and be captured by xanthan fouling layer, resulting in an
increase in osmotic pressure of the feed water near the membrane surface. The
results indicate the importance of proper dosage of the compounds in
alleviating polysaccharide fouling.
5.1.4 Effect of applied hydraulic pressure on alleviation of polysaccharide
fouling using sodium nitroprusside in the presence of calcium ions
To understand the influence of applied hydraulic pressure on fouling alleviation,
alginate and xanthan were added in the presence of Ca2+
ions using sodium
nitroprusside (SNP) as the alleviating agent (0.1 mM) (Fig.5.5). Under the
applied hydraulic pressure of 400 psi and 500 psi, initial fluxes of ~9.5 and
~13.0 L/(m2·h) were respectively achieved. It has been widely reported that
membrane suffers more severe fouling with increased initial flux [32, 55, 154].

CHAPTER 5
78
In this study, with an applied hydraulic pressure of 500 psi alginate fouling
caused a 54% flux decline (Fig.5.5a); xanthan fouling caused 48% flux decline
(Fig.5.5b). When a lower applied hydraulic pressure of 400 psi was applied,
less membrane fouling was observed, with 30% (alginate) and 28% (xanthan)
flux declines observed (Fig.5.5a and b).
0.0
0.2
0.4
0.6
0.8
Baseline SNP
No
rmal
ize
d fl
ux
(Jt/
J o)
a.NaCl+CaCl2+alginate
500psi
400psi
0.0
0.2
0.4
0.6
0.8
Baseline SNP
No
rmal
ize
d fl
ux
(Jt/
J o)
b.NaCl+CaCl2+xanthan
500psi
400psi
0
5
10
15
20
25
30
Alginate fouling alleviation Xanthan fouling alleviation
Alle
viat
ion
eff
icie
ncy
(%
) c.alleviation efficiency of SNP
500psi
400psi

CHAPTER 5
79
Fig.5.5 Effect of applied pressure on alleviation of polysaccharide fouling using SNP
in the presence of Ca2+ ions: (a) alginate fouling in absence and presence of SNP; (b)
xanthan fouling in absence and presence of SNP; and (c) alleviation efficiency of SNP
on alginate and xanthin fouling. Hydraulic pressure of 400 psi (2757.9 kPa) and 500
psi (3447.4 kPa) were applied, generating an initial flux of 9.5 L/(m2·h) and 13.0
L/(m2·h), respectively. The concentration of SNP was 0.1 mM. Ca
2+ concentration was
1 mM. Other experimental conditions included: polysaccharide concentration of 0.2
g/L; cross-flow velocity of 8.5 cm/s; solution temperature of 25 ± 1 ℃; total ionic
strength 50 mM.
In addition to the increased membrane fouling evident at higher hydraulic
pressure, the alleviation of fouling by SNP was also more effective at higher
hydraulic pressure (Fig.5.5c). At 400 psi, xanthan fouling alleviation efficiency
(ψ) was calculated as ~5%, at 500 psi alleviation was 29%. The lower
alleviation efficiency under the lower applied hydraulic pressure could be
explained by the negligible interaction between SNP and xanthan. With the
reduced applied hydraulic pressure, the xanthan fouling layer became less
compact under less compression, and much less SNP could accumulate on the
membrane surface. As a result, the chances for the interaction between SNP and
xanthan were reduced significantly, and thus led to negligible alleviation of
xanthan fouling.
Applied hydraulic pressure had less impact on alleviation of alginate fouling by
SNP with alleviation of 8% (400 psi) and 11% (500 psi) (Fig.5.5c). This is
consistent with the findings in previous literature [99]. Yang [99] reported
higher flux decline under higher trans-membrane pressure during membrane
fouling by bovine serum albumin (BSA) in the absence and presence of
antiscalant polyaspartic acid (PASP), but the alleviation efficiency of PASP
under higher trans-membrane pressure was similar to that under lower
trans-membrane pressure. In this study, the similarity of ψ of SNP under
different applied hydraulic pressure could be due to the formation of
Ca-alginate gels. The fouling layer caused by formation of crosslinked

CHAPTER 5
80
Ca-alginate gel network is irreversible [56], and was therefore independent of
cross-flow velocity and nonresponsive to the hydraulic pressure variation.
5.2 Alleviation of polysaccharide fouling in forward osmosis
5.2.1 Effect of alleviating agent type on alleviation of polysaccharide fouling
in forward osmosis
Fig.5.6 Normalized flux after 24 h forward osmosis (FO) fouling tests by alginate and
xanthan in the absence and presence of alleviating agents, sodium nitroprusside (SNP)
and potassium ferricyanide (KFCN). Constantly saturated NaCl solution was used as
draw solution. Other experimental conditions included: polysaccharide concentration
of 0.2 g/L; initial flux of 9.5 L/(m2·h) using DI water containing 1 mM Ca
2+ ions and
50 mM total ionic strength; cross-flow velocity of 8.5 cm/s; solution temperature of 25
± 1 °C; feed solution using artificial seawater or DI water containing 1 mM Ca2+
ions
and 50 mM total ionic strength; alleviating agents’ (SNP and KFCN) concentration of
0.1 mM.
The effects of different alleviating agents were compared (Fig.5.6). Normalized
permeate flux after 24 h for alginate fouling in the absence of alleviating agents
was 0.86. Flux improved to nearly 0.90 in the presence of SNP, and 0.89 in the
presence of KFCN (Fig.5.6). For xanthan, the normalized flux was reduced to
0.80 after 24 h xanthan fouling, but alleviation was evident using SNP (0.91)
and KFCN (0.88) (Fig.5.6).
0.65
0.70
0.75
0.80
0.85
0.90
0.95
NaCl+CaCl₂+alginate NaCl+CaCl₂+xanthan
No
rmal
ize
d fl
ux
(Jt/
J o)
Baseline SNP(0.1mM) KFCN(0.1mM)

CHAPTER 5
81
As discussed in Section 4.3.1, solution viscosity could be the major factor
governing polysaccharide fouling in FO, and therefore xanthan solution with
higher viscosity caused more severe fouling compared to alginate solution.
Polysaccharide fouling could be alleviated by reducing feed solution viscosity
and thus the interaction between polysaccharides and membrane material.
However, as shown in Fig.5.7, the addition of alleviating agents into
polysaccharide solution slightly increased solution viscosity, indicating that
reduction of alginate fouling and xanthan fouling was not resulted from the
reduced viscosity. Alleviation of alginate fouling and xanthan fouling by SNP
and KFCN could be explained by the electrostatic repulsion between
polysaccharides (alginate and xanthan) and alleviating agents (SNP and KFCN).
As discussed in Section 5.1.1, alginate and xanthan molecules contain
negatively charged –COO- functional groups, and SNP and KFCN have
[Fe(CN)5NO]2-
and [Fe(CN)6]3-
, respectively. The negative charges on
polysaccharides and alleviating agents led to strong electrostatic repulsion
between them, reducing interaction between polysaccharides and membrane.
Therefore, less polysaccharide accumulated on the membrane surface in the
presence of the alleviating agents.
Fig.5.7 Viscosity of polysaccharide solutions in the absence and presence of
alleviating agents. The solution contains 1 mM Ca2+ ions, 50 mM ionic strength by
adding NaCl, 0.2 g/L alginate or xanthan, and 0.1 mM SNP or KFCN if added.
8
10
12
14
NaCl+CaCl₂+alginate NaCl+CaCl₂+xanthan
Solu
tio
n v
isco
sity
(×
10
-4P
a·s)
Baseline
SNP
KFCN

CHAPTER 5
82
Alleviation efficiency (ψ) of SNP and KFCN on alginate and xanthan fouling in
the presence of Ca2+
ions was presented in Table.5.2. As can be seen, 26.9%
and 18.3% of alleviation efficiency on alginate fouling were achieved by SNP
and KFCN, respectively. On the other hand, SNP and KFCN present high
alleviation efficiency during xanthan fouling, with 55.4% and 40.9%,
respectively. Compared to KFCN, SNP presented higher efficiency for both
alginate and xanthan fouling, which could be due to its –NO functional groups
dispersing polysaccharides and enhancing alleviation efficiency. The results
demonstrate that SNP could be a better alleviating agent to reduce
polysaccharide fouling.
Table.5.2 Alleviation efficiency ψ (%) of SNP and KFCN on alginate and xanthan
fouling in the presence of Ca2+ ions.
SNP (0.1 mM) KFCN (0.1 mM)
NaCl+CaCl2+alginate 26.9 18.3
NaCl+CaCl2+xanthan 55.4 40.9
5.2.2 Effect of sodium nitroprusside concentration on alleviation of
polysaccharide fouling in forward osmosis
0.4
0.6
0.8
1.0
NaCl+CaCl₂+alginate NaCl+CaCl₂+xanthan
No
rmal
ize
d fl
ux
(Jt/
J o)
(a) Baseline
SNP(0.01mM)
SNP(0.1mM)

CHAPTER 5
83
Fig.5.8 Effect of sodium nitroprusside (SNP) concentration on alleviation of
polysaccharide fouling in forward osmosis (FO) in the presence of Ca2+
ions: (a)
normalized flux after 24 h; (b) alleviation efficiency. Constantly saturated NaCl
solution was used as draw solution. Other experimental conditions included:
polysaccharide concentration of 0.2 g/L; initial flux of 9.5 L/(m2·h) using DI water
containing 1 mM Ca2+ ions and 50 mM total ionic strength; cross-flow velocity of 8.5
cm/s; solution temperature of 25 ± 1 °C; feed solution using DI water containing 1 mM
Ca2+
ions and 50 mM total ionic strength; SNP concentration of 0.1 mM and 0.01 mM.
In Section 5.2.2, SNP was found to be a better alleviating agent compared to
KFCN for both alginate and xanthan fouling. Therefore, SNP was selected as
the alleviating agent to investigate the effect of concentration (0.1 mM and 0.01
mM) on polysaccharide fouling alleviation in the presence of Ca2+
ions. As the
concentration of SNP increased from 0.01 mM to 0.1 mM, alleviation
efficiency (ψ) decreased for alginate fouling but increased for xanthan fouling
(Fig.5.8). The normalized flux after 24 h alginate fouling (0.86) was improved
to 0.96 when 0.01 mM SNP was added, equivalent to an alleviation efficiency
of 70.2% (Fig.5.8b). With increased SNP concentration (0.1 mM), the
normalized flux was 0.90, equivalent to an alleviation efficiency of 26.9%
(Fig.5.8b). The results show that high concentration of SNP could reduce their
effectiveness on fouling alleviation. With xanthan fouling, in the absence of
SNP, the normalized flux after 24 h was 0.80. SNP improved the flux to 0.88
0
10
20
30
40
50
60
70
80
NaCl+CaCl₂+alginate NaCl+CaCl₂+xanthan
Alle
viat
ion
eff
icie
ncy
(%
)
(b)
SNP(0.01mM)
SNP(0.1mM)

CHAPTER 5
84
(0.01 mM) and 0.91 (0.1 mM). Alleviation efficiency therefore increased with
concentration from 38.2% (0.01 mM) and 55.4% (0.1 mM).
The difference in the alleviating efficiency of SNP on alginate and xanthan
fouling could be explained by the different extents of fouling caused by alginate
and xanthan. In the absence of SNP, alginate caused less severe fouling
compared to xanthan. As a result, less SNP was needed to alleviate alginate
fouling. Over-dosage of SNP introduced more ions than necessary, which might
aggravate cake-enhanced osmotic pressure as the SNP captured by the alginate
deposited on the membrane surface or compression of electrical double layer
because of higher ionic strength. Compared to alginate, xanthan caused more
severe fouling, and thus needed more alleviating agents to reduce membrane
fouling. The experimental results indicate proper dosage of SNP based on
fouling extent by different kinds of polysaccharides can effectively reduce
membrane fouling.
5.3 Comparison of efficiency of sodium nitroprusside in
alleviating polysaccharide fouling between forward osmosis
and reverse osmosis
0.4
0.5
0.6
0.7
0.8
0.9
1.0
Baseline SNP(0.1mM)
No
rmal
ize
d fl
ux
(Jt/
J o)
a. NaCl+CaCl2+alginate
RO
FO

CHAPTER 5
85
Fig.5.9 Comparison of efficiency of sodium nitroprusside (SNP) in alleviating
polysaccharide fouling between forward osmosis (FO) and reverse osmosis (RO). (a)
alleviation of alginate fouling in FO and RO; (b) alleviation of xanthan fouling in FO
and RO; and (c) alleviation efficiency of SNP on alginate and xanthan fouling in FO
and RO. RO fouling tests were conducted with a hydraulic pressure of 400 psi; whilst
FO tests were carried out by using constantly saturated NaCl solutions as draw
solutions. All runs were performed under identical conditions: initial flux of 9.5
L/(m2·h); cross-flow velocity of 8.5 cm/s; solution temperature of 25 ± 1 °C; feed
solution consisting of 1 mM Ca2+ ions and 50 mM total ionic strength; polymer
concentration of 0.2 g/L; SNP concentration of 0.1 mM.
A direct comparison of polysaccharide fouling alleviation by SNP (0.1 mM) in
FO and RO is presented (Fig.5.9). All operational conditions were the same
including temperature, initial permeate flux, cross-flow velocity, and feed water
0.4
0.5
0.6
0.7
0.8
0.9
1.0
Baseline SNP(0.1mM)
No
rmal
ize
d fl
ux
(Jt/
J o)
b.NaCl+CaCl2+xanthan
RO
FO
0
10
20
30
40
50
60
NaCl+CaCl₂+alginate NaCl+CaCl₂+xanthan
Alle
viat
ion
eff
icie
ncy
(%
)
c.alleviation efficiency of SNP
RO
FO

CHAPTER 5
86
chemistry such as ionic strength, calcium concentration and polysaccharide
concentration. The only difference was applied pressure, with applied hydraulic
pressure in RO and chemical osmotic pressure in FO. In Section 4.4.1, it was
found that alginate and xanthan caused more severe fouling in RO than in FO.
Both alginate and xanthan fouling in both FO and RO processes were alleviated
by SNP (Fig.5.9), indicating the potential of SNP to alleviate polysaccharide
fouling at the correct dose. Normalized fluxes after 24 h alginate and xanthan
fouling in the presence of SNP were much higher in FO than in RO (Fig.5.9a
and b). SNP alleviated fouling to a greater extent in FO than in RO for both
alginate and xanthan (Fig.5.9c). For example, for alginate fouling, SNP
alleviation efficiency was 27.0% (FO) and 7.6% (RO) and with xanthan 55.4%
(FO) and 4.5% (RO). In RO, as hydraulic pressure was applied, membrane
fouling could be largely attributed to the foulant – foulant interaction; while
foulant – membrane interaction was likely the major mechanism governing FO
fouling. The addition of SNP in FO caused electrostatic repulsion between
membrane and the polysaccharides due to the negative charges on both SNP
and the polysaccharides, less accumulation of polysaccharides on the membrane
surface, and thus alleviated polysaccharide fouling. In RO, electrostatic
repulsion between SNP and polysaccharides became negligible as alginate and
xanthan formed compact macrocomplex networks or gels in the presence of
Ca2+
ions, which were promoted under hydraulic pressure in RO. Therefore, the
foulant – foulant interaction governing membrane fouling in RO was less
affected by SNP. The results demonstrate the importance of pressure resources
during the membrane separation processes.
5.4 Summary
Alleviation of polysaccharide (alginate and xanthan) fouling in reverse osmosis
(RO) and forward osmosis (FO) was investigated using sodium nitroprusside
(SNP) and potassium ferricyanide (KFCN) as alleviating agents.
Firstly, the findings in RO are as follows:

CHAPTER 5
87
1) SNP and KFCN both alleviated both alginate and xanthan fouling in the
absence of Ca2+
ions.
2) In the presence of Ca2+
ions, SNP (0.1mM) alleviated both alginate and
xanthan fouling; KFCN (0.1mM) alleviated alginate fouling but aggravated
xanthan fouling.
3) In the presence of Ca2+
ions, as the concentration of SNP and KFCN
increased from 0.1 to 1 mM, their efficiency increased in alleviating
alginate fouling, but decreased in alleviating xanthan fouling.
4) In the presence of Ca2+
ions, elevated applied hydraulic pressure improved
alleviation efficiency of SNP in alginate and xanthan fouling.
Secondly, the findings in FO in the presence of Ca2+
ions are as follows:
1) Both SNP and KFCN alleviated polysaccharide (alginate and xanthan)
fouling in FO, likely due to the electrostatic repulsion between them and the
polysaccharides.
2) The alleviation efficiency increased with SNP concentration for xanthan
fouling, but decreased for alginate fouling. The results indicate that it is
important to properly dose the alleviating agent for polysaccharide fouling
alleviation.
Thirdly, it was found that SNP (0.1 mM) presented higher efficiency in
alleviating polysaccharide (alginate and xanthan) fouling in the presence of
Ca2+
ions in FO than in RO, suggesting the pressure source plays an important
role in polysaccharide fouling alleviation.

CHAPTER 6
88
Chapter 6. Modeling hydraulic resistances to permeate
flux in RO membrane separation
In this chapter, we developed a resistance in series model to study the
contributions of membrane resistance and non-membrane resistance
(resistances due to concentration polarization and cake formation) to the
permeate flux decline during the RO separation process. The model was
verified by conducting experiments of RO membrane fouling by two model
polysaccharides, alginate and xanthan. Separate experiments were conducted to
determine membrane resistance, the effect of concentration polarization in the
absence of polymers, cake resistance in the absence of salts and the effect of
adding NaCl. Effects of calcium ions and applied hydraulic pressure were also
investigated. Based on resistance analysis data, the relationship between the
concentration polarization resistance and the elevated osmotic pressure was
demonstrated; the coupled effect of concentration polarization and cake
formation was illustrated; and some possible methods to improve membrane
permeate flux was suggested.
6.1 Description of the model of hydraulic resistances
Based on the different causes of fouling, some studies incorporated Rcp and Rc
into non-membrane resistances [73, 155]. Some studies that treated the
concentrated salt solution on the membrane surface as elevated osmotic
pressure did not incorporate Rcp in the total hydraulic resistance [76, 156];
while some used it as concentration polarization resistance rather than the
increase in the osmotic pressure [82, 155]. This study synthesizes both
characteristics (concentration polarization and the increase in the osmotic
pressure) and yields the relationship between them.

CHAPTER 6
89
The model is based on the following assumptions:
1) The membrane resistance is constant during the separation process. The
interaction between the membrane surface and foulants in the feed solution
is considered to contribute only to non-membrane resistances, without
affecting membrane resistance.
2) The effect of pore blockage by foulants is negligible as the pore sizes of the
membranes are small [79].
3) The osmotic pressure by polysaccharides in the feed solution is negligible
as it is extraordinarily small compared to that by salt in the feed solution.
The three kinds of resistances were calculated based on the following
equations.
Fig.6.1 Schematic diagram of the hydraulic resistance model for explaining the
calculation of different resistance components: (a) membrane resistance using DI water;
(b) concentration polarization resistance using salty water; (c) cake resistance using
polymer solution; (d) Combined concentration polarization resistance and cake
resistance using polymer inclusion salty water.

CHAPTER 6
90
1. Membrane resistance (Rm)
The membrane resistance (Rm) was obtained during the RO process using DI
water as the feed solution (shown in Fig.6.1a). The experiment started with
compaction of the membrane using DI water for 2 h. Afterwards, the baseline
experiment was conducted with DI water remaining the only component of the
feed solution. As no foulants such as ions and polymers existed in the feed, the
hydraulic resistance solely consisted of Rm.
Rm = Rt = ∆Pm/(µDI·Jw) = (P – P0)/(µDI·Jw) (6.1)
where Rm and Rt are the membrane resistance and total hydraulic resistance,
respectively (m-1
); ∆Pm is the trans-membrane pressure difference (Pa); µDI is
the water viscosity (Pa·s); Jw is the water permeate flux (m/s); P and P0 are the
pressures on the solution side and the permeate side, respectively (Pa), and the
value of P – P0 can be directly read from the pressure gauge.
2. Concentration polarization resistance (Rcp)
To measure concentration polarization resistance (Rcp), solution containing salt
ions was used as the feed solution (shown in Fig.6.1b). The experiment started
with compaction of the membrane using DI water for 2 h, followed by another
2 h stabilization and equilibration of membrane using background electrolyte
solution. Afterwards the fouling test was conducted and investigated. During
the membrane separation process, only water passed through the membrane.
The ions were rejected and concentrated on the membrane surface under the
hydraulic pressure, and forms a “salt layer”, and the “salt layer” can be
represented as either Rcp or elevated osmotic pressure (πcp). When the “salt
layer” is viewed as Rcp,
Rt = ∆Pm /(µDI·Jw) = (P – P0 – πfeed) /(µDI·Jw) (6.2)
Rcp= Rt – Rm = (P – P0 – πfeed) /(µDI·Jw) – Rm (6.3)

CHAPTER 6
91
where πfeed is the osmotic pressure of the feed solution (Pa), Rcp is concentration
polarization resistance (m-1
).
When the “salt layer” serves as πcp, the pressure difference between the two
sides of the membrane can be expressed in Eq. (6.4) and Jw can be calculated
using Eq. (6.5).
∆Pm = P – P0 – πcp (6.4)
Jw = (P – P0 –πcp) / (µDI·Rm) (6.5)
where πcp is the osmotic pressure of salt on the membrane surface (Pa).
Based on the calculation of Rcp in Eq. (6.3) and πcp in Eq. (6.5), the relationship
between them could be deduced, as shown in Eq. (6.6).
πcp – πfeed = µDI·Jw·Rcp (6.6)
Then, the concentration of the salt accumulated on the membrane surface can
be calculated based on the van’t Hoff equation [60, 61] as long as it is not
relatively high, as can be seen in Eq. (6.7).
Ccp=πcp /iRgT (6.7)
where i is the Van’t Hoff factor, Ccp is the solution concentration of the salt on
the membrane surface (mol/L or M), Rg is the universal gas constant
(Rg=0.0831 L·bar/(mol·K)), and T is the absolute temperature (K).
3. Cake resistance (Rc)
Similar to the calculation of Rcp, calculation of Rc was carried out using
polymer solution as the feed solution (shown in Fig.6.1c). The experiment
started with compaction of the membrane using DI water for 2 h. Then
polysaccharides were added to the DI water and the fouling test was conducted
and investigated. During the fouling tests, the polymers were rejected and
accumulated on the membrane surface, forming a cake layer and increasing
hydraulic resistance.

CHAPTER 6
92
Rc= Rt – Rm = (P – P0 – πfeed) /(µDI·Jw) – Rm (6.8)
where the Rc is the cake resistance (m-1
). The concentration (0.2g/L) of the
polymer feed solution was very low in this study, and thus the solution’s
osmotic pressure calculated based on Eq. (6.7), is considered negligible as
compared to the applied pressure.
4. Combined concentration polarization resistance (Rcp) and cake resistance
(Rc)
When the feed contains salt ions and polymer (shown in Fig.6.1d), both of them
contribute to the total hydraulic resistance. The experiment started with
compaction of the membrane using DI water for 2 h, followed by another 2 h
stabilization and equilibration of membrane using background electrolyte
solution. Afterwards the polysaccharides were added to the electrolyte solution,
and the fouling test was conducted and investigated. The existence of salt ions
and polymer may affect each other, and the coupled effect of both may lead to a
significant increase in the total hydraulic resistance. The non-membrane
resistances Rcp + Rc could be calculated based on the fact that Rm is constant
and only water is considered to pass through the membrane.
In this case,
Jw= ∆Pm /(µDI· Rt) = (P– P0 – πfeed) /[µDI·(Rm + Rcp + Rc)] (6.9)
(Rcp + Rc) = (P – P0 – πfeed) /(µDI·Jw) – Rm (6.10)
The total flux decline can be described as 1 – Jwt/Jw0, where Jw0 and Jwt are the
fluxes at time 0 and time t. As time 0 represented the starting point of the
fouling test, both Rcp and Rc equal 0, and therefore Jw0 is calculated using Eq.
(6.11).
Jw0 = (P– P0 – πfeed) /µDI·Rm (6.11)
At time t,
Jwt = (P– P0 – πfeed) /[µDI·(Rm + Rcpt + Rct)] (6.12)

CHAPTER 6
93
where Rcpt and Rct are resistances due to concentration polarization and cake
formation, respectively, at time t.
Based on Eq. (6.11) and (6.12), the normalized flux and the total flux decline at
time t can be represented by.
Jwt/Jw0 = Rm /(Rm + Rcpt + Rct) (6.13)
1 – Jwt/Jw0 = (Rcpt + Rct)/(Rm + Rcpt + Rct) (6.14)
Eq. (6.14) demonstrates the relationship between flux and the hydraulic
resistances. The ratio of membrane resistance Rm to Rt represents the
normalized flux whist the flux decline can be represented using the ratio of the
non-membrane resistance Rcpt + Rct to Rt.
6.2 Concentration polarization in the control experiment
Fig.6.2 Osmotic pressure and concentration of the salt on the membrane surface during
the baseline experiment in the absence of polymer. A hydraulic pressure of 400 psi
(2757.9 kPa) was applied to generate an initial flux of 9.5 L/(m2·h). The feed solution
contained 1 mM Ca2+ ions and its ionic strength was adjusted to be 50 mM by adding
NaCl. The cross-flow velocity and the temperature of feed solution were adjusted to be
8.5 cm/s and 25 ± 1 ℃.
The osmotic pressure (πcp) and concentration of the salt (Ccp) on the membrane
surface when the feed solution solely contained 50mM salt (NaCl+CaCl2) were
40
50
60
70
80
90
100
200
250
300
350
400
450
0 3 6 9 12 15 18
Ccp
(mM
)
πcp
(kP
a)
Time (h)
πcp Ccp

CHAPTER 6
94
calculated based on Eq. (6.5) and (6.7) and their trends over time were shown in
Fig.6.2. πcp and Ccp increased under the hydraulic pressure over time, indicating
the promotion of concentration polarization. Within the first 8 h, concentration
polarization reflected by πcp and Ccp increased slowly and fluctuated. This
phenomenon was also observed in previous study [157]. Then πcp and Ccp
increased sharply from 8 to 12 h, and tended to be more stable afterwards. After
18 h, Ccp reached about 85 mM, with an increase of about 70% in concentration
compared to the initial feed concentration, and correspondingly an increase of
174.1 kPa in πcp (from 247.9 kPa when the experiment commenced to 422.0
kPa after 18 h), which is insignificant as compared to the applied hydraulic
pressure (2757.9 kPa). This indicates that salt at a low concentration in feed
solution could slightly reduce the effectiveness of applied hydraulic pressure
and cause concentration polarization resistance to permeate flux. On one hand,
continuous transport of the salt solutes from the bulk feed solution towards the
membrane surface under the convective flux generated by the applied hydraulic
pressure and rejection of the salt solutes by the membrane might cause
accumulation of salt onto the membrane surface, increasing the osmotic
pressure and concentration polarization resistance near the membrane surface.
This was supported by the salt rejection decreasing from 99.53% to 99.05%. On
the other hand, the accumulation of salt solutes on the membrane surface was
hindered by the shear force generated by the cross-flow velocity [8], as the
cross flow continuously swept some salt solutes away from the membrane
surface. Therefore, the accumulated salt caused an increase in osmotic pressure
and concentration polarization near the membrane surface, yet the increase was
slight.

CHAPTER 6
95
6.3 Comparison of coupled effect of concentration polarization
and cake formation on the increase in hydraulic resistance to
the permeate flux and sum of their individual effects
Fig.6.3 Comparison between the hydraulic resistances due to coupled effect and sum of
the individual effects of concentration polarization and cake formation: Plot A,
resistance caused by alginate fouling in the absence of salt; Plot B, resistance caused
by salts in the absence of alginate; Plot C, resistance caused by fouling in the presence
of both salt and alginate; and Plot A+B, sum of Plot A and Plot B. A hydraulic
pressure of 400 psi (2757.9 kPa) was applied to generate an initial flux of 9.5 L/(m2·h).
The feed solution contained either salt (1 mM Ca2+
ions and its ionic strength was
adjusted to be 50 mM by adding NaCl) or alginate (0.2 g/L), or both. The cross-flow
velocity and the temperature of polysaccharide solution were adjusted to be 8.5 cm/s
and 25 ± 1 ℃.
The hydraulic resistances due to coupled effect of concentration polarization
(Rcp) and cake formation (Rc) and the sum of their individual effects were
compared (Fig.6.3). In the absence of salt (See Plot A), alginate caused an
increase of about 19×1013
m-1
in Rc (Alginate) after 18 h fouling test; while the
feed solution containing the salt in the absence of alginate (see Plot B) caused
an increase in resistance due to Rcp (NaCl+CaCl2) by about 6×10¹³
m-1
after 18
h. The sum of the two caused an increase in hydraulic resistance by 25×1013
m-1
(shown as Plot A+B). When the feed solution contained both salt and alginate
-0.05
0
0.05
0.1
0.15
0.2
0.25
0.3
0.35
0.4
0.45
0.5
0 3 6 9 12 15 18
Hyd
rau
lic r
esi
stan
ce (×
10
15m
-1)
Time (h)
A:Rc(Alginate)
B:Rcp(NaCl+CaCl₂)
C:Rcp+Rc(NaCl+CaCl₂+Alginate)
A+B

CHAPTER 6
96
(Plot C), an increase of about 39×1013
m-1
in hydraulic resistance
(Rcp+Rc(NaCl+CaCl2+alginate)) after 18 h fouling test was observed, which
was much higher than 25×1013
m-1
as shown in Plot A+B. The results
demonstrate that coupled effect of concentration polarization and cake
formation on the increase in hydraulic resistance to the permeate flux is much
greater than the sum of their individual effects. This could be explained by the
interaction between the salt and alginate when both of them existed in the feed
solution. First of all, calcium ions in the solution could interact with the
carboxylic functional groups on the alginate molecules and the negatively
charged membrane, which promoted accumulation of alginate [5, 8, 65, 66, 75].
In addition, calcium ions could serve as a linkage between adjacent alginate
molecules, resulting in coagulation and complexation of alginate and hence
formation of a macromolecule gel network [5, 8, 66, 75], which was
compressed under the hydraulic pressure and became compact. Thus, the
hydraulic resistance due to cake formation (Rc(NaCl+CaCl2+alginate)) was
significantly increased in the presence of salt. In return, the compact alginate
gel layer prevented the back diffusion of salt from the membrane surface to the
bulk feed solution [3, 29, 51-53], leading to a great increase in salt
accumulation on the membrane surface, which greatly increased the
concentration and osmotic pressure of the salt solution near the membrane
surface. As a result, the hydraulic pressure due to concentration polarization
(Rcp(NaCl+CaCl2+alginate)) was greatly increased. Therefore, when both salt
and alginate were present in the feed solution, the resistances due to
concentration polarization and cake formation were increased significantly.
Thus, the value of the hydraulic resistance in the presence of both salt and
alginate (Rcp+Rc(NaCl+CaCl2+alginate)) became higher than the sum of the
individuals (Rcp (NaCl+CaCl2)+ Rc(Alginate)).

CHAPTER 6
97
6.4 Contribution of membrane and non-membrane resistances
to permeate flux during polysaccharide fouling tests
Fig.6.4 Ratios of membrane resistance (Rm) and non-membrane resistances (Rcp+Rc) to
total hydraulic resistance over time. A hydraulic pressure of 400 psi (2757.9 kPa) was
applied to generate an initial flux of 9.5 L/(m2·h). The feed solution contained 1 mM
Ca2+ ions and 0.2 g/L polysaccharide (alginate or xanthan) and its ionic strength was
adjusted to be 50 mM by adding NaCl, or both. The cross-flow velocity and the
temperature of polysaccharide solution were adjusted to be 8.5 cm/s and 25 ± 1 ℃.
The ratios of membrane (Rm) and non-membrane resistances (Rcp+Rc) to total
hydraulic resistance during the fouling tests using alginate and xanthan as
polysaccharides were presented in Fig.6.4. According to Eq (6.13), the
proportion of membrane resistance (Rm) represents the normalized flux; and
based on Eq (6.14), the ratio of the hydraulic resistances due to concentration
polarization and cake formation (non-membrane resistances) to total hydraulic
resistance represents the flux decline rate, in terms of the fact that the flux
decline is only caused by concentration polarization and cake formation. The
ratios of membrane resistances Rm/Rt during alginate fouling and xanthan
fouling decreased over time; correspondingly, non-membrane resistances
(Rcp+Rc)/Rt increased by 30% and 22% after 18 h for alginate and xanthin
fouling, respectively (Fig.6.4). During the fouling tests, (Rcp+Rc)/Rt was much
0%
20%
40%
60%
80%
100%
0 3 6 9 12 15 18
Rat
ios
of
me
mb
ran
e a
nd
no
n-
me
mb
ran
e h
ydra
ulic
re
sist
ance
s
Time (h)
(Rcp+Rc)/Rt: NaCl+CaCl₂+Alginate (Rcp+Rc)/Rt: NaCl+CaCl₂+Xanthan Rm/Rt: NaCl+CaCl₂+Alginate Rm/Rt: NaCl+CaCl₂+Xanthan

CHAPTER 6
98
lower than Rm/Rt, revealing that membrane resistance dominated the hydraulic
resistances and is the major limiting factor governing permeate flux.
(Rcp+Rc)/Rt during alginate fouling test is higher than that in xanthan fouling
test, likely due to different chemical molecule structures between alginate and
xanthin as well as their resultant fouling layer structures. On one hand, both
alginate and xanthan caused an increase in non-membrane resistances. This
could be attributed to formation of macromolecule fouling layers resulted from
the interaction between the carboxylic function groups on their molecules and
the calcium ions in the feed solution. The fouling layers increased the cake
resistance and better hindered the back diffusion of salt from the membrane
surface to the bulk feed solution that enhanced concentration polarization near
the membrane surface. On the other hand, the non-membrane resistances in the
alginate fouling test increased more significantly than that in the xanthan
fouling test. This could be ascribed to the compact gel layers formed during the
alginate fouling in the presence of calcium ions. Although xanthan was similar
with alginate in interaction with calcium ions, and formation of macromolecule
fouling layers, xanthan layers were not as compact as alginate gel layers and
therefore exhibited lower cake resistance and less significant resultant
cake-enhanced concentration polarization.
6.5 Effect of applied pressure on hydraulic resistance
Effect of applied hydraulic pressure on non-membrane resistances Rcp+Rc
during the fouling tests by alginate and xanthan was evaluated. The elevated
applied hydraulic pressure could result in higher initial flux, with an initial flux
of 12.6 L/(m2·h) under 500 psi hydraulic pressure. However, the elevated
hydraulic pressure also promoted the increase in non-membrane resistances
Rcp+Rc in both alginate and xanthan fouling tests (Fig.6.5). The values after 18
h fouling tests were 30% and 21% under 400 psi hydraulic pressure for alginate
fouling and xanthan fouling, respectively; and under 500 psi hydraulic pressure,
the non-membrane resistances after 18 h fouing test increased to 48% and 35%
for alginate fouling and xanthan fouling, respectively. Higher applied pressure

CHAPTER 6
99
generates higher initial flux, leading to faster accumulation of foulants
including both salts and polysaccharides onto the membrane surface. The
accumulated polysaccharides formed more compact fouling layer under higher
hydraulic pressure and caused an increase in resistance due to cake formation as
well as the resultant cake-enhanced concentration polarization. This is in good
agreement with the finding in previous study that cake-enhanced osmotic
pressure (CEOP) was significantly promoted by the flux [76].
Fig.6.5 Effect of applied hydraulic pressure on non-membrane hydraulic resistances.
Two hydraulic pressures 400 psi (2757.9 kPa) and 500 psi (3447.4 kPa) were applied
to generate an initial flux of 9.5 L/(m2·h) and 12.6 L/(m
2·h), respectively. The feed
solution contained 1 mM Ca2+ ions and 0.2 g/L polysaccharide (alginate or xanthan)
and its ionic strength was adjusted to be 50 mM by adding NaCl, or both. The
cross-flow velocity and the temperature of polysaccharide solution were adjusted to be
8.5 cm/s and 25 ± 1 ℃.
6.6 Effect of calcium ions on hydraulic resistance
Non-membrane hydraulic resistances during the fouling tests by alginate and
xanthan in the absence and presence of calcium ions increased over time
(Fig.6.6). Addition of calcium ions led to a significant increase in Rcp+Rc in
both alginate and xanthan fouling tests. In the absence of calcium ions, the
non-membrane resistances after 18 h fouling test was 22% and 20% for alginate
-10%
0%
10%
20%
30%
40%
50%
60%
70%
0 3 6 9 12 15 18
(Rcp
+Rc)
/Rt
Time (h)
400psi:NaCl+CaCl₂+alginate 400psi:NaCl+CaCl₂+xanthan
500psi:NaCl+CaCl₂+alginate 500psi:NaCl+CaCl₂+xanthan

CHAPTER 6
100
and xanthan fouling, respectively; while these values correspondingly increased
to 48% and 35%, respectively, in the presence of calcium ions. Effect of
calcium ions on membrane fouling has been widely studied [7, 56, 98]. Calcium
ions could interact with negatively charged functional groups on the
polysaccharide molecules and the membrane, and neutralize them and cause
more accumulation of polysaccharide onto membrane surface. Moreover,
calcium ions could serve as the linkage between adjacent polysaccharide
molecules leading to complexation and formation of calcium-polysaccharide
macromolecule networks [5, 8, 65, 66, 75]. In particular, calcium ions
interacted with alginate and formed calcium-alginate gels [5, 8, 66, 75]. Under
the applied pressure, the calcium-alginate gels became compact and dense, and
thus increased cake resistance and cake-enhanced concentration polarization.
Therefore, the non-membrane resistances were greatly increased.
Fig.6.6 Effect of calcium ions on non-membrane hydraulic resistances. A hydraulic
pressure of 500 psi (3447.4 kPa) was applied to generate an initial flux of 12.6
L/(m2·h). The feed solution contained 0.2 g/L polysaccharide (alginate or xanthan) and
its ionic strength was adjusted to be 50 mM by adding NaCl, or both. The cross-flow
velocity and the temperature of polysaccharide solution were adjusted to be 8.5 cm/s
and 25 ± 1 ℃. When studying the effect of calcium ions, 1 mM Ca2+
ions were added
to the feed solution after the stabilization of membrane.
-10%
0%
10%
20%
30%
40%
50%
60%
70%
0 3 6 9 12 15 18
(Rcp
+Rc)
/Rt
Time (h)
NaCl+alginate NaCl+xanthan
NaCl+CaCl₂+alginate NaCl+CaCl₂+xanthan

CHAPTER 6
101
6.7 Indication
Some important indications were drawn from the experimental work. First of
all, the fact that membrane resistance is the major factor governing permeate
flux indicates permeate flux could be greatly improved by reducing membrane
resistance through membrane fabrication and modification. Secondly, the
experimental results have shown that either individual polysaccharide or salt
itself did not cause significant resistance to permeate flux. The value of the
hydraulic resistance in the presence of both salt and alginate was higher than
the sum of their individuals. And the absence of calcium ions caused an
increase in the hydraulic resistance. These observations implicate that
separation of ions, especially calcium ions, from polysaccharides prior to RO
process could reduce membrane fouling and improve permeate flux. Thirdly,
reduction in the compactness of fouling layers could be another effective
method to reduce the non-membrane resistances during polysaccharide fouling.
Finally but not least, while elevated hydraulic pressure generated higher initial
flux, it also led to increase in non-membrane resistances during polysaccharide
fouling. This indicates the importance of applying optimal hydraulic pressure
for the RO separation process.
6.8 Summary
The membrane fouling was elucidated using the hydraulic analysis data. The
membrane resistance was the dominant hydraulic resistance to permeate flux,
accounting for over 50% within 18 h fouling tests. The value of the hydraulic
resistance in the presence of both salt and alginate was much higher than the
sum of that of individuals with either salt or polysaccharide in the feed solution.
This could be due to the interaction of salt and polysaccharide, that salt formed
linkage between adjacent polysaccharide molecules and built up a
macromolecular fouling layer, and the fouling layer in return prevented back
diffusion of salt from the membrane surface to the bulk feed solution. The
non-membrane resistances were enhanced under higher applied pressure and in

CHAPTER 6
102
the presence of calcium ions. The experimental results have important
implication for reducing membrane fouling and improving membrane
performance.

CHAPTER 7
103
Chapter 7. Conclusions and recommendations for
future research
7.1 Conclusions
This study compared membrane fouling by commercial and isolated
polysaccharides in forward osmosis (FO) and reverse osmosis (RO), and
polysaccharide fouling control by using alleviating agents.
For better comparison between the fouling in FO and RO, all the conditions
including feed solution chemistry (i.e. polysaccharide concentration, ionic
strength and calcium ions) and operating conditions (i.e. initial flux, cross-flow
velocity and temperature) were set identical (Chapter 3). In particular,
constantly saturated draw solution was used in FO to maintain a constant
osmotic pressure enabling direct comparison of fouling. Three types of model
polysaccharides, named alginate, xanthan and pullulan, as well as four types of
polysaccharides isolated from bacteria, FSW 6, RSW 8, RSW 12 and RSW 14
were used for membrane fouling tests (Chapter 4).
It was found that membrane fouling by both commercial and isolated
polysaccharides was more severe in RO than FO, demonstrating that applied
pressure had a greater influence on membrane fouling compared to equivalent
osmotic pressure. Interestingly, the isolated polysaccharides caused membrane
fouling in RO while they improved water flux in FO. The dominating
mechanism of polysaccharide fouling in FO was found to be different from that
in RO. In RO, molecular structure of polysaccharide played an important role in
membrane fouling, indicating foulant – foulant interaction governing
polysaccharide fouling in RO; while fouling behavior of polysaccharide in FO
is majorly affected by solution viscosity, indicating foulant – membrane
interaction governing membrane fouling in FO.

CHAPTER 7
104
Two kinds of alleviating agents, sodium nitroprusside (SNP) and potassium
ferricyanide (KFCN), were tested for alleviation of polysaccharide fouling in
FO and RO (Chapter 5). SNP was found to be a better alleviating agent
compared to KFCN based on its alleviating efficiency during alginate and
xanthan fouling. Alleviation of polysaccharide fouling could be explained by
rather the increased electrostatic repulsion between polysaccharides and
alleviating agents than reduced solution viscosity. In RO, calcium ions were
found to enhance the membrane fouling and reduced the alleviation efficiency;
and alleviation of polysaccharide fouling was found to be more effective at
higher applied pressure. Alleviation effect of SNP was more significant in FO
than that in RO. Over-dosage of alleviating agents could reduce alleviation
efficiency or even enhance membrane fouling.
A model of resistance in series was developed to demonstrate the contribution
of hydraulic resistance (membrane resistance, resistance due to concentration
polarization and resistance due to cake formation) to permeate flux decline in
RO (Chapter 6). The membrane resistance was found to be the dominant
resistance among the three resistances. The hydraulic resistances was slightly
increased by individual of either polysaccharide or salt, but greatly increased by
their synergistic effect, especially in the presence of calcium ions.
7.2 Recommendations for future research
Alginate is not a good model polysaccharide, as its fouling behavior was
different from that of both the commercial and isolated polysaccharides in both
RO and FO membrane fouling. It is recommend that further research should be
conducted on exploration of better polysaccharides to affirm a model to
represent the natural polymers for polysaccharide fouling.
Alleviation of polysaccharide fouling can be achieved by dosing a proper
concentration of SNP. However, it is necessary to test the permeate quality to
affirm the residue of SNP to ensure that SNP is used safely. It is also

CHAPTER 7
105
recommended that more economic alleviating agents should be tested in future
research.
The model of resistance in series in RO well demonstrated the membrane
fouling by different foulants. Future research on a model of resistance in FO
that includes ICP as a hydraulic resistance is recommended to better compare
membrane fouling in FO and RO.

REFERENCES
106
References
1. Peñate, B. and García-Rodríguez, L., Current trends and future prospects in the
design of seawater reverse osmosis desalination technology. Desalination,
2012. 284(0): p. 1-8.
2. Mi, B. and Elimelech, M., Organic fouling of forward osmosis membranes:
Fouling reversibility and cleaning without chemical reagents. Journal of
Membrane Science, 2010. 348(1–2): p. 337-345.
3. Lee, S., Boo, C., Elimelech, M., and Hong, S., Comparison of fouling behavior in
forward osmosis (FO) and reverse osmosis (RO). Journal of Membrane Science,
2010. 365(1–2): p. 34-39.
4. Herzberg, M., Kang, S., and Elimelech, M., Role of Extracellular Polymeric
Substances (EPS) in Biofouling of Reverse Osmosis Membranes. Environmental
Science & Technology, 2009. 43(12): p. 4393.
5. Jin, X., Huang, X., and Hoek, E.M.V., Role of Specific Ion Interactions in
Seawater RO Membrane Fouling by Alginic Acid. Environmental Science &
Technology, 2009. 43(10): p. 3580-3587.
6. Widjaya, A., Hoang, T., Stevens, G.W., and Kentish, S.E., A comparison of
commercial reverse osmosis membrane characteristics and performance
under alginate fouling conditions. Separation and Purification Technology,
2012. 89(0): p. 270-281.
7. Sioutopoulos, D.C., Goudoulas, T.Î., Kastrinakis, E.G., Nychas, S.G., and
Karabelas, A.J., Rheological and permeability characteristics of alginate
fouling layers developing on reverse osmosis membranes during desalination.
Journal of Membrane Science, 2013. 434(0): p. 74-84.
8. Lee, S., Ang, W.S., and Elimelech, M., Fouling of reverse osmosis membranes
by hydrophilic organic matter: implications for water reuse. Desalination,
2006. 187(1–3): p. 313-321.

REFERENCES
107
9. Kim, Y., Elimelech, M., Shon, H.K., and Hong, S., Combined organic and
colloidal fouling in forward osmosis: Fouling reversibility and the role of
applied pressure. Journal of Membrane Science, 2014. 460(0): p. 206-212.
10. Barnes, R., Bandi, R., Wong, W., Barraud, N., McDougald, D., Fane, A.,
Kjelleberg, S., and Rice, S., Optimal dosing regimen of nitric oxide donor
compounds for the reduction of Pseudomonas aeruginosa biofilm and isolates
from wastewater membranes. Biofouling, 2013. 29(2).
11. Barnes, R.J., Bandi, R.R., Chua, F., Low, J.H., Aung, T., Barraud, N., Fane, A.G.,
Kjelleberg, S., and Rice, S.A., The roles of Pseudomonas aeruginosa
extracellular polysaccharides in biofouling of reverse osmosis membranes and
nitric oxide induced dispersal. Journal of Membrane Science, 2014. 466(0): p.
161-172.
12. Charville, G.W., Hetrick, E.M., Geer, C.B., and Schoenfisch, M.H., Reduced
bacterial adhesion to fibrinogen-coated substrates via nitric oxide release.
Biomaterials, 2008. 29(30): p. 4039-4044.
13. Barraud, N., Hassett, D.J., Hwang, S.-H., Rice, S.A., Kjelleberg, S., and Webb,
J.S., Involvement of Nitric Oxide in Biofilm Dispersal of Pseudomonas
aeruginosa. Journal of Bacteriology, 2006. 188(21): p. 7344-7353.
14. Barraud, N., Storey, M.V., Moore, Z.P., Webb, J.S., Rice, S.A., and Kjelleberg, S.,
Nitric oxide‐mediated dispersal in single‐ and multi‐species biofilms of
clinically and industrially relevant microorganisms. Microbial biotechnology,
2009. 2(3): p. 370-378.
15. Xiong, Y. and Liu, Y., Biological control of microbial attachment: a promising
alternative for mitigating membrane biofouling. Applied Microbiology and
Biotechnology, 2010. 86(3): p. 825-37.
16. Barnes, R.J., Low, J.H., Bandi, R.R., Tay, M., Chua, F., Aung, T., Fane, A.G.,
Kjelleberg, S., and Rice, S.A., Nitric Oxide Treatment for the Control of Reverse
Osmosis Membrane Biofouling. Applied and Environmental Microbiology,
2015. 81(7): p. 2515-2524.

REFERENCES
108
17. Kappachery, S., Paul, D., Yoon, J., and Kweon, J.H., Vanillin, a potential agent
to prevent biofouling of reverse osmosis membrane. Biofouling, 2010. 26(6): p.
667-672.
18. Lee, K.P., Arnot, T.C., and Mattia, D., A review of reverse osmosis membrane
materials for desalination—Development to date and future potential. Journal
of Membrane Science, 2011. 370(1–2): p. 1-22.
19. Greenlee, L.F., Lawler, D.F., Freeman, B.D., Marrot, B., and Moulin, P., Reverse
osmosis desalination: Water sources, technology, and today's challenges.
Water Research, 2009. 43(9): p. 2317-2348.
20. Reverberi, F. and Gorenflo, A., Three year operational experience of a
spiral-wound SWRO system with a high fouling potential feed water.
Desalination, 2007. 203(1–3): p. 100-106.
21. Cath, T.Y., Childress, A.E., and Elimelech, M., Forward osmosis: Principles,
applications, and recent developments. Journal of Membrane Science, 2006.
281(1–2): p. 70-87.
22. Zhao, S., Zou, L., Tang, C.Y., and Mulcahy, D., Recent developments in forward
osmosis: Opportunities and challenges. Journal of Membrane Science, 2012.
396(0): p. 1-21.
23. McCutcheon, J.R., McGinnis, R.L., and Elimelech, M., A novel ammonia-carbon
dioxide forward (direct) osmosis desalination process. Desalination, 2005.
174(1): p. 1-11.
24. Li, Z.-Y., Yangali-Quintanilla, V., Valladares-Linares, R., Li, Q., Zhan, T., and
Amy, G., Flux patterns and membrane fouling propensity during desalination
of seawater by forward osmosis. Water Research, 2012. 46(1): p. 195-204.
25. McGinnis, R.L. and Elimelech, M., Energy requirements of ammonia–carbon
dioxide forward osmosis desalination. Desalination, 2007. 207(1–3): p.
370-382.

REFERENCES
109
26. Martinetti, C.R., Childress, A.E., and Cath, T.Y., High recovery of concentrated
RO brines using forward osmosis and membrane distillation. Journal of
Membrane Science, 2009. 331(1–2): p. 31-39.
27. Phuntsho, S., Shon, H.K., Hong, S., Lee, S., and Vigneswaran, S., A novel low
energy fertilizer driven forward osmosis desalination for direct fertigation:
Evaluating the performance of fertilizer draw solutions. Journal of Membrane
Science, 2011. 375(1–2): p. 172-181.
28. Shaffer, D.L., Werber, J.R., Jaramillo, H., Lin, S., and Elimelech, M., Forward
osmosis: Where are we now? Desalination, 2015. 356(0): p. 271-284.
29. Hoek, E.M.V. and Elimelech, M., Cake-Enhanced Concentration Polarization: A
New Fouling Mechanism for Salt-Rejecting Membranes. Environmental
Science & Technology, 2003. 37(24): p. 5581-5588.
30. Misdan, N., Lau, W.J., and Ismail, A.F., Seawater Reverse Osmosis (SWRO)
desalination by thin-film composite membrane—Current development,
challenges and future prospects. Desalination, 2012. 287(0): p. 228-237.
31. Herzberg, M. and Elimelech, M., Biofouling of reverse osmosis membranes:
Role of biofilm-enhanced osmotic pressure. Journal of Membrane Science,
2007. 295(1–2): p. 11-20.
32. Suwarno, S.R., Chen, X., Chong, T.H., McDougald, D., Cohen, Y., Rice, S.A., and
Fane, A.G., Biofouling in reverse osmosis processes: The roles of flux, crossflow
velocity and concentration polarization in biofilm development. Journal of
Membrane Science, 2014. 467(0): p. 116-125.
33. Matin, A., Khan, Z., Zaidi, S.M.J., and Boyce, M.C., Biofouling in reverse
osmosis membranes for seawater desalination: Phenomena and prevention.
Desalination, 2011. 281(0): p. 1-16.
34. Chun, Y., Zaviska, F., Cornelissen, E., and Zou, L., A case study of fouling
development and flux reversibility of treating actual lake water by forward
osmosis process. Desalination, 2015. 357(0): p. 55-64.

REFERENCES
110
35. Al-Juboori, R.A. and Yusaf, T., Biofouling in RO system: Mechanisms,
monitoring and controlling. Desalination, 2012. 302(0): p. 1-23.
36. Valladares Linares, R., Bucs, S.S., Li, Z., AbuGhdeeb, M., Amy, G., and
Vrouwenvelder, J.S., Impact of spacer thickness on biofouling in forward
osmosis. Water Research, 2014. 57(0): p. 223-233.
37. Skillman, L.C., Sutherland, I.W., and Jones, M.V., The role of
exopolysaccharides in dual species biofilm development. Journal of Applied
Microbiology, 1999. 85(S1): p. 13S-18S.
38. Ying, W., Siebdrath, N., Uhl, W., Gitis, V., and Herzberg, M., New insights on
early stages of RO membranes fouling during tertiary wastewater
desalination. Journal of Membrane Science, 2014. 466(0): p. 26-35.
39. Dogsa, I., Kriechbaum, M., Stopar, D., and Laggner, P., Structure of Bacterial
Extracellular Polymeric Substances at Different pH Values as Determined by
SAXS. Biophysical Journal, 2005. 89(4): p. 2711-2720.
40. Ye, Y., Le Clech, P., Chen, V., Fane, A.G., and Jefferson, B., Fouling mechanisms
of alginate solutions as model extracellular polymeric substances.
Desalination, 2005. 175(1): p. 7-20.
41. Jarusutthirak, C., Amy, G., and Croué , J.-P., Fouling characteristics of
wastewater effluent organic matter (EfOM) isolates on NF and UF membranes.
Desalination, 2002. 145(1–3): p. 247-255.
42. Ajroldi, G., Marchionni, G., and Pezzin, G., The viscosity–molecular weight
relationships for diolic perfluoropolyethers. Polymer, 1999. 40(14): p.
4163-4164.
43. Nataraj, S., Schomäcker, R., Kraume, M., Mishra, I.M., and Drews, A., Analyses
of polysaccharide fouling mechanisms during crossflow membrane filtration.
Journal of Membrane Science, 2008. 308(1–2): p. 152-161.
44. Freitas, F., Alves, V.D., Reis, M.A., Crespo, J.G., and Coelhoso, I.M., Microbial
polysaccharide-based membranes: Current and future applications. Journal of
Applied Polymer Science, 2014. 131(6): p. n/a-n/a.

REFERENCES
111
45. Tsuneda, S., Aikawa, H., Hayashi, H., Yuasa, A., and Hirata, A., Extracellular
polymeric substances responsible for bacterial adhesion onto solid surface. Vol.
223. 2003. 287-292.
46. Wang, Y.-N. and Tang, C.Y., Protein fouling of nanofiltration, reverse osmosis,
and ultrafiltration membranes—The role of hydrodynamic conditions, solution
chemistry, and membrane properties. Journal of Membrane Science, 2011.
376(1–2): p. 275-282.
47. Motsa, M.M., Mamba, B.B., D’Haese, A., Hoek, E.M.V., and Verliefde, A.R.D.,
Organic fouling in forward osmosis membranes: The role of feed solution
chemistry and membrane structural properties. Journal of Membrane Science,
2014. 460(0): p. 99-109.
48. Lu, X., Arias Chavez, L.H., Romero-Vargas Castrillón, S., Ma, J., and Elimelech,
M., Influence of Active Layer and Support Layer Surface Structures on Organic
Fouling Propensity of Thin-Film Composite Forward Osmosis Membranes.
Environmental Science & Technology, 2015. 49(3): p. 1436-1444.
49. Li, H., Yu, P., and Luo, Y., Fouling mechanisms and primary foulant
constituents in reverse osmosis membrane reclamation of a petrochemical
secondary effluent. Desalination and Water Treatment, 2014: p. 1-11.
50. Contreras, A.E., Steiner, Z., Miao, J., Kasher, R., and Li, Q., Studying the Role of
Common Membrane Surface Functionalities on Adsorption and Cleaning of
Organic Foulants Using QCM-D. Environmental Science & Technology, 2011.
45(15): p. 6309-6315.
51. Boo, C., Lee, S., Elimelech, M., Meng, Z., and Hong, S., Colloidal fouling in
forward osmosis: Role of reverse salt diffusion. Journal of Membrane Science,
2012. 390–391(0): p. 277-284.
52. Lay, W.C.L., Zhang, J., Tang, C., Wang, R., Liu, Y., and Fane, A.G., Factors
affecting flux performance of forward osmosis systems. Journal of Membrane
Science, 2012. 394–395(0): p. 151-168.

REFERENCES
112
53. Park, M., Lee, J., Boo, C., Hong, S., Snyder, S.A., and Kim, J.H., Modeling of
colloidal fouling in forward osmosis membrane: Effects of reverse draw
solution permeation. Desalination, 2013. 314(0): p. 115-123.
54. van den Brink, P., Zwijnenburg, A., Smith, G., Temmink, H., and van
Loosdrecht, M., Effect of free calcium concentration and ionic strength on
alginate fouling in cross-flow membrane filtration. Journal of Membrane
Science, 2009. 345(1–2): p. 207-216.
55. Tang, C.Y., Kwon, Y.-N., and Leckie, J.O., The role of foulant–foulant
electrostatic interaction on limiting flux for RO and NF membranes during
humic acid fouling—Theoretical basis, experimental evidence, and AFM
interaction force measurement. Journal of Membrane Science, 2009. 326(2): p.
526-532.
56. Alazmi, R., Nassehi, V., and Wakeman, R., Calcium cation interactions with
polysaccharides and proteins in wastewater UF membrane fouling.
Membrane Technology, 2010. 2010(1): p. 6-12.
57. Kim, Y., Lee, S., Shon, H.K., and Hong, S., Organic fouling mechanisms in
forward osmosis membrane process under elevated feed and draw solution
temperatures. Desalination, 2015. 355(0): p. 169-177.
58. Cath, T.Y., Elimelech, M., McCutcheon, J.R., McGinnis, R.L., Achilli, A.,
Anastasio, D., Brady, A.R., Childress, A.E., Farr, I.V., Hancock, N.T., Lampi, J.,
Nghiem, L.D., Xie, M., and Yip, N.Y., Standard Methodology for Evaluating
Membrane Performance in Osmotically Driven Membrane Processes.
Desalination, 2013. 312(0): p. 31-38.
59. Lutchmiah, K., Verliefde, A.R.D., Roest, K., Rietveld, L.C., and Cornelissen, E.R.,
Forward osmosis for application in wastewater treatment: A review. Water
Research, 2014. 58(0): p. 179-197.
60. Zhou, Z., Lee, J.Y., and Chung, T.-S., Thin film composite forward-osmosis
membranes with enhanced internal osmotic pressure for internal
concentration polarization reduction. Chemical Engineering Journal, 2014.
249(0): p. 236-245.

REFERENCES
113
61. Hau, N.T., Chen, S.-S., Nguyen, N.C., Huang, K.Z., Ngo, H.H., and Guo, W.,
Exploration of EDTA sodium salt as novel draw solution in forward osmosis
process for dewatering of high nutrient sludge. Journal of Membrane Science,
2014. 455(0): p. 305-311.
62. Boo, C., Elimelech, M., and Hong, S., Fouling control in a forward osmosis
process integrating seawater desalination and wastewater reclamation.
Journal of Membrane Science, 2013. 444(0): p. 148-156.
63. Zou, S., Gu, Y., Xiao, D., and Tang, C.Y., The role of physical and chemical
parameters on forward osmosis membrane fouling during algae separation.
Journal of Membrane Science, 2011. 366(1–2): p. 356-362.
64. Chen, C.L., Liu, W.T., Chong, M.L., Wong, M.T., Ong, S.L., Seah, H., and Ng,
W.J., Community structure of microbial biofilms associated with
membrane-based water purification processes as revealed using a polyphasic
approach. Applied Microbiology and Biotechnology, 2004. 63(4): p. 466-473.
65. Wu, J., Contreras, A.E., and Li, Q., Studying the impact of RO membrane
surface functional groups on alginate fouling in seawater desalination. Journal
of Membrane Science, 2014. 458(0): p. 120-127.
66. Hoang, T., Stevens, G.W., and Kentish, S.E., The influence of feed pH on the
performance of a reverse osmosis membrane during alginate fouling.
Desalination and Water Treatment, 2012. 50(1-3): p. 220-225.
67. Nguyen, T.-V., Pendergast, M.M., Phong, M.T., Jin, X., Peng, F., Lind, M.L., and
Hoek, E.M.V., Relating fouling behavior and cake layer formation of alginic
acid to the physiochemical properties of thin film composite and
nanocomposite seawater RO membranes. Desalination, 2014. 338(0): p. 1-9.
68. Yang, J., Lee, S., Yu, Y., Kuk, J., Hong, S., Lee, S., and Min, K., Role of
Foulant-Membrane Interactions in Organic Fouling of RO Membranes with
Respect to Membrane Properties. Separation Science and Technology, 2010.
45(7): p. 948-955.

REFERENCES
114
69. Pedersen, C.O., Masse, L., and Hjorth, M., The effect of residual cationic
polymers in swine wastewater on the fouling of reverse osmosis membranes.
Environmental Technology, 2014. 35(11): p. 1338-1344.
70. Ying, W., Gitis, V., Lee, J., and Herzberg, M., Effects of shear rate on biofouling
of reverse osmosis membrane during tertiary wastewater desalination.
Journal of Membrane Science, 2013. 427(0): p. 390-398.
71. Mo, H., Tay, K.G., and Ng, H.Y., Fouling of reverse osmosis membrane by
protein (BSA): Effects of pH, calcium, magnesium, ionic strength and
temperature. Journal of Membrane Science, 2008. 315(1–2): p. 28-35.
72. Yu, Y., Lee, S., and Hong, S., Effect of solution chemistry on organic fouling of
reverse osmosis membranes in seawater desalination. Journal of Membrane
Science, 2010. 351(1–2): p. 205-213.
73. Mattaraj, S., Phimpha, W., Hongthong, P., and Jiraratananon, R., Effect of
operating conditions and solution chemistry on model parameters in crossflow
reverse osmosis of natural organic matter. Desalination, 2010. 253(1–3): p.
38-45.
74. Li, Q., Xu, Z., and Pinnau, I., Fouling of reverse osmosis membranes by
biopolymers in wastewater secondary effluent: Role of membrane surface
properties and initial permeate flux. Journal of Membrane Science, 2007.
290(1–2): p. 173-181.
75. Lee, S. and Elimelech, M., Relating Organic Fouling of Reverse Osmosis
Membranes to Intermolecular Adhesion Forces. Environmental Science &
Technology, 2006. 40(3): p. 980-987.
76. Taheri, A.H., Sim, L.N., Chong, T.H., Krantz, W.B., and Fane, A.G., Prediction of
reverse osmosis fouling using the feed fouling monitor and salt tracer
response technique. Journal of Membrane Science, 2015. 475(0): p. 433-444.
77. Hoek, E.M.V., Kim, A.S., and Elimelech, M., Influence of crossflow membrane
filter geometry and shear rate on colloidal fouling in reverse osmosis and
nanofiltration separations. Environmental Engineering Science, 2002. 19(6): p.
357-372.

REFERENCES
115
78. Srisukphun, T., Chiemchaisri, C., Urase, T., and Yamamoto, K.,
Experimentation and modeling of foulant interaction and reverse osmosis
membrane fouling during textile wastewater reclamation. Separation and
Purification Technology, 2009. 68(1): p. 37-49.
79. Heo, J., Boateng, L.K., Flora, J.R.V., Lee, H., Her, N., Park, Y.-G., and Yoon, Y.,
Comparison of flux behavior and synthetic organic compound removal by
forward osmosis and reverse osmosis membranes. Journal of Membrane
Science, 2013. 443(0): p. 69-82.
80. Yu, S., Yao, G., Dong, B., Zhu, H., Peng, X., Liu, J., Liu, M., and Gao, C.,
Improving fouling resistance of thin-film composite polyamide reverse osmosis
membrane by coating natural hydrophilic polymer sericin. Separation and
Purification Technology, 2013. 118(0): p. 285-293.
81. Dreszer, C., Vrouwenvelder, J.S., Paulitsch-Fuchs, A.H., Zwijnenburg, A.,
Kruithof, J.C., and Flemming, H.C., Hydraulic resistance of biofilms. Journal of
Membrane Science, 2013. 429(0): p. 436-447.
82. Ochando-Pulido, J.M., Hodaifa, G., and Martínez-Ferez, A., Permeate
recirculation impact on concentration polarization and fouling on RO
purification of olive mill wastewater. Desalination, 2014. 343(0): p. 169-179.
83. Astudillo, C., Parra, J., González, S., and Cancino, B., A new parameter for
membrane cleaning evaluation. Separation and Purification Technology, 2010.
73(2): p. 286-293.
84. Parida, V. and Ng, H.Y., Forward osmosis organic fouling: Effects of organic
loading, calcium and membrane orientation. Desalination, 2013. 312(0): p.
88-98.
85. Tang, C.Y., She, Q., Lay, W.C.L., Wang, R., and Fane, A.G., Coupled effects of
internal concentration polarization and fouling on flux behavior of forward
osmosis membranes during humic acid filtration. Journal of Membrane
Science, 2010. 354(1–2): p. 123-133.

REFERENCES
116
86. Wang, L., Chu, H., and Dong, B., Effects on the purification of tannic acid and
natural dissolved organic matter by forward osmosis membrane. Journal of
Membrane Science, 2014. 455(0): p. 31-43.
87. Ma, N., Wei, J., Qi, S., Zhao, Y., Gao, Y., and Tang, C.Y., Nanocomposite
substrates for controlling internal concentration polarization in forward
osmosis membranes. Journal of Membrane Science, 2013. 441(0): p. 54-62.
88. She, Q., Jin, X., Li, Q., and Tang, C.Y., Relating reverse and forward solute
diffusion to membrane fouling in osmotically driven membrane processes.
Water Research, 2012. 46(7): p. 2478-2486.
89. Achilli, A., Cath, T.Y., and Childress, A.E., Selection of inorganic-based draw
solutions for forward osmosis applications. Journal of Membrane Science,
2010. 364(1–2): p. 233-241.
90. Wang, W., Zhang, Y., Esparra-Alvarado, M., Wang, X., Yang, H., and Xie, Y.,
Effects of pH and temperature on forward osmosis membrane flux using
rainwater as the makeup for cooling water dilution. Desalination, 2014.
351(0): p. 70-76.
91. Chanukya, B.S., Patil, S., and Rastogi, N.K., Influence of concentration
polarization on flux behavior in forward osmosis during desalination using
ammonium bicarbonate. Desalination, 2013. 312(0): p. 39-44.
92. Gu, Y., Wang, Y.-N., Wei, J., and Tang, C.Y., Organic fouling of thin-film
composite polyamide and cellulose triacetate forward osmosis membranes by
oppositely charged macromolecules. Water Research, 2013. 47(5): p.
1867-1874.
93. Emadzadeh, D., Lau, W.J., Matsuura, T., Hilal, N., and Ismail, A.F., The
potential of thin film nanocomposite membrane in reducing organic fouling in
forward osmosis process. Desalination, 2014. 348(0): p. 82-88.
94. Zou, S., Wang, Y.-N., Wicaksana, F., Aung, T., Wong, P.C.Y., Fane, A.G., and
Tang, C.Y., Direct microscopic observation of forward osmosis membrane
fouling by microalgae: Critical flux and the role of operational conditions.
Journal of Membrane Science, 2013. 436(0): p. 174-185.

REFERENCES
117
95. Phillip, W.A., Yong, J.S., and Elimelech, M., Reverse Draw Solute Permeation in
Forward Osmosis: Modeling and Experiments. Environmental Science &
Technology, 2010. 44(13): p. 5170-5176.
96. Varin, K.J., Lin, N.H., and Cohen, Y., Biofouling and cleaning effectiveness of
surface nanostructured reverse osmosis membranes. Journal of Membrane
Science, 2013. 446(0): p. 472-481.
97. Yu, S., Chen, Z., Liu, J., Yao, G., Liu, M., and Gao, C., Intensified cleaning of
organic-fouled reverse osmosis membranes by thermo-responsive polymer
(TRP). Journal of Membrane Science, 2012. 392–393(0): p. 181-191.
98. Ang, W.S., Tiraferri, A., Chen, K.L., and Elimelech, M., Fouling and cleaning of
RO membranes fouled by mixtures of organic foulants simulating wastewater
effluent. Journal of Membrane Science, 2011. 376(1–2): p. 196-206.
99. Yang, Q., Liu, Y., and Li, Y., Humic Acid Fouling Mitigation by Antiscalant in
Reverse Osmosis System. Environmental Science & Technology, 2010. 44(13):
p. 5153-5158.
100. Yang, Q., Liu, Y., and Li, Y., Control of protein (BSA) fouling in RO system by
antiscalants. Journal of Membrane Science, 2010. 364(1–2): p. 372-379.
101. Yu, J., Baek, Y., Yoon, H., and Yoon, J., New disinfectant to control biofouling
of polyamide reverse osmosis membrane. Journal of Membrane Science, 2013.
427(0): p. 30-36.
102. Sweity, A., Oren, Y., Ronen, Z., and Herzberg, M., The influence of antiscalants
on biofouling of RO membranes in seawater desalination. Water Research,
2013. 47(10): p. 3389-3398.
103. Choi, H., Zhang, K., Dionysiou, D.D., Oerther, D.B., and Sorial, G.A., Effect of
permeate flux and tangential flow on membrane fouling for wastewater
treatment. Separation and Purification Technology, 2005. 45(1): p. 68-78.
104. Mi, B. and Elimelech, M., Gypsum Scaling and Cleaning in Forward Osmosis:
Measurements and Mechanisms. Environmental Science & Technology, 2010.
44(6): p. 2022-2028.

REFERENCES
118
105. Mi, B. and Elimelech, M., Silica scaling and scaling reversibility in forward
osmosis. Desalination, 2013. 312(0): p. 75-81.
106. Phuntsho, S., Lotfi, F., Hong, S., Shaffer, D.L., Elimelech, M., and Shon, H.K.,
Membrane scaling and flux decline during fertiliser-drawn forward osmosis
desalination of brackish groundwater. Water Research, 2014. 57(0): p.
172-182.
107. Zhang, H., Cheng, S., and Yang, F., Use of a spacer to mitigate concentration
polarization during forward osmosis process. Desalination, 2014. 347(0): p.
112-119.
108. Vercellino, T., Tran, P., Reid, T., Hamood, A., and Morse, A., Evaluation of
polymerized organo-selenium feed spacers to inhibit S. aureus and E. coli
biofilm development in reverse osmosis systems. Desalination, 2013. 331(0): p.
1-5.
109. Park, M. and Kim, J.H., Numerical analysis of spacer impacts on forward
osmosis membrane process using concentration polarization index. Journal of
Membrane Science, 2013. 427(0): p. 10-20.
110. Altman, S.J., McGrath, L.K., Jones, H.D.T., Sanchez, A., Noek, R., Clem, P., Cook,
A., and Ho, C.K., Systematic analysis of micromixers to minimize biofouling on
reverse osmosis membranes. Water Research, 2010. 44(12): p. 3545-3554.
111. Henthorne, L. and Boysen, B., State-of-the-art of reverse osmosis desalination
pretreatment. Desalination, 2015. 356(0): p. 129-139.
112. Gabelich, C.J., Yun, T.I., Coffey, B.M., and Suffet, I.H.M., Effects of aluminum
sulfate and ferric chloride coagulant residuals on polyamide membrane
performance. Desalination, 2002. 150(1): p. 15-30.
113. Zhao, S., Huang, G., Cheng, G., Wang, Y., and Fu, H., Hardness, COD and
turbidity removals from produced water by electrocoagulation pretreatment
prior to Reverse Osmosis membranes. Desalination, 2014. 344(0): p. 454-462.

REFERENCES
119
114. Indarawis, K.A. and Boyer, T.H., Evaluation of ion exchange pretreatment
options to decrease fouling of a reverse osmosis membrane. Desalination and
Water Treatment, 2013. 52(25-27): p. 4603-4611.
115. Yang, C., Li, L., Shi, J., Long, C., and Li, A., Advanced treatment of textile dyeing
secondary effluent using magnetic anion exchange resin and its effect on
organic fouling in subsequent RO membrane. Journal of Hazardous Materials,
2015. 284(0): p. 50-57.
116. Corral, A.F., Yenal, U., Strickle, R., Yan, D., Holler, E., Hill, C., Ela, W.P., and
Arnold, R.G., Comparison of slow sand filtration and microfiltration as
pretreatments for inland desalination via reverse osmosis. Desalination, 2014.
334(1): p. 1-9.
117. Huang, H., Cho, H., Schwab, K., and Jacangelo, J.G., Effects of feedwater
pretreatment on the removal of organic microconstituents by a low fouling
reverse osmosis membrane. Desalination, 2011. 281(0): p. 446-454.
118. Zaviska, F. and Zou, L., Using modelling approach to validate a bench scale
forward osmosis pre-treatment process for desalination. Desalination, 2014.
350(0): p. 1-13.
119. Altaee, A. and Zaragoza, G., A conceptual design of low fouling and high
recovery FO–MSF desalination plant. Desalination, 2014. 343(0): p. 2-7.
120. Shafi, H.Z., Khan, Z., Yang, R., and Gleason, K.K., Surface modification of
reverse osmosis membranes with zwitterionic coating for improved resistance
to fouling. Desalination, 2015. 362(0): p. 93-103.
121. Rana, H.H., Saha, N.K., Jewrajka, S.K., and Reddy, A.V.R., Low fouling and
improved chlorine resistant thin film composite reverse osmosis membranes
by cerium(IV)/polyvinyl alcohol mediated surface modification. Desalination,
2015. 357(0): p. 93-103.
122. Zhou, C., Ye, D., Jia, H., Yu, S., Liu, M., and Gao, C., Surface mineralization of
commercial thin-film composite polyamide membrane by depositing barium
sulfate for improved reverse osmosis performance and antifouling property.
Desalination, 2014. 351(0): p. 228-235.
REFERENCES
120
123. Matin, A., Khan, Z., Gleason, K.K., Khaled, M., Zaidi, S.M.J., Khalil, A., Moni, P.,
and Yang, R., Surface-modified reverse osmosis membranes applying a
copolymer film to reduce adhesion of bacteria as a strategy for biofouling
control. Separation and Purification Technology, 2014. 124(0): p. 117-123.
124. Bera, A., Gol, R.M., Chatterjee, S., and Jewrajka, S.K., PEGylation and
incorporation of triazine ring into thin film composite reverse osmosis
membranes for enhancement of anti-organic and anti-biofouling properties.
Desalination, 2015. 360(0): p. 108-117.
125. Gol, R.M. and Jewrajka, S.K., Facile in situ PEGylation of polyamide thin film
composite membranes for improving fouling resistance. Journal of Membrane
Science, 2014. 455(0): p. 271-282.
126. Ben-Sasson, M., Lu, X., Bar-Zeev, E., Zodrow, K.R., Nejati, S., Qi, G., Giannelis,
E.P., and Elimelech, M., In situ formation of silver nanoparticles on thin-film
composite reverse osmosis membranes for biofouling mitigation. Water
Research, 2014. 62(0): p. 260-270.
127. Lu, X., Romero-Vargas Castrillón, S., Shaffer, D.L., Ma, J., and Elimelech, M., In
Situ Surface Chemical Modification of Thin-Film Composite Forward Osmosis
Membranes for Enhanced Organic Fouling Resistance. Environmental Science
& Technology, 2013. 47(21): p. 12219-12228.
128. Nguyen, A., Azari, S., and Zou, L., Coating zwitterionic amino acid l-DOPA to
increase fouling resistance of forward osmosis membrane. Desalination, 2013.
312(0): p. 82-87.
129. Cheng, Q., Zheng, Y., Yu, S., Zhu, H., Peng, X., Liu, J., Liu, J., Liu, M., and Gao, C.,
Surface modification of a commercial thin-film composite polyamide reverse
osmosis membrane through graft polymerization of N-isopropylacrylamide
followed by acrylic acid. Journal of Membrane Science, 2013. 447(0): p.
236-245.
130. Romero-Vargas Castrillón, S., Lu, X., Shaffer, D.L., and Elimelech, M., Amine
enrichment and poly(ethylene glycol) (PEG) surface modification of thin-film

REFERENCES
121
composite forward osmosis membranes for organic fouling control. Journal of
Membrane Science, 2014. 450(0): p. 331-339.
131. Karkhanechi, H., Takagi, R., and Matsuyama, H., Biofouling resistance of
reverse osmosis membrane modified with polydopamine. Desalination, 2014.
336(0): p. 87-96.
132. Low, D., Hamood, A., Reid, T., Mosley, T., Tran, P., Song, L., and Morse, A.,
Attachment of selenium to a reverse osmosis membrane to inhibit biofilm
formation of S. aureus. Journal of Membrane Science, 2011. 378(1–2): p.
171-178.
133. Nagaraja, N., Skillman, L., and Ho, G., Isolation and identification of key
bacterial species and extraction of their exopolysaccharides from a full scale
desalination plant in Western Australia. 2013.
134. Gacesa, P., Alginates. Carbohydrate Polymers, 1988. 8(3): p. 161-182.
135. Cheng, K.-C., Demirci, A., and Catchmark, J., Pullulan: biosynthesis, production,
and applications. Applied Microbiology and Biotechnology, 2011. 92(1): p.
29-44.
136. Israilides, C., Scanlon, B., Smith, A., Harding, S.E., and Jumel, K.,
Characterization of pullulans produced from agro-industrial wastes.
Carbohydrate Polymers, 1994. 25(3): p. 203-209.
137. Lachke, A., Xanthan — A versatile gum. Resonance, 2004. 9(10): p. 25-33.
138. Nagajara, N., Investigation of biofouling in seawater reverse osmosis
desalination by bacterial extracellular polysaccharides and their control.
unpublished doctoral thesis, Murdoch University, 2016.
139. Liu, S.-B., Chen, X.-L., He, H.-L., Zhang, X.-Y., Xie, B.-B., Yu, Y., Chen, B., Zhou,
B.-C., and Zhang, Y.-Z., Structure and Ecological Roles of a Novel
Exopolysaccharide from the Arctic Sea Ice Bacterium Pseudoalteromonas sp.
Strain SM20310. Applied and Environmental Microbiology, 2013. 79(1): p.
224-230.

REFERENCES
122
140. Pan, D. and Mei, X., Antioxidant activity of an exopolysaccharide purified from
Lactococcus lactis subsp. lactis 12. Carbohydrate Polymers, 2010. 80(3): p.
908-914.
141. Barello, M., Manca, D., Patel, R., and Mujtaba, I.M., Neural network based
correlation for estimating water permeability constant in RO desalination
process under fouling. Desalination, 2014. 345(0): p. 101-111.
142. Zhang, Y., Wang, Z., Lin, W., Sun, H., Wu, L., and Chen, S., A facile method for
polyamide membrane modification by poly(sulfobetaine methacrylate) to
improve fouling resistance. Journal of Membrane Science, 2013. 446(0): p.
164-170.
143. Ahmad, A., Waheed, S., Khan, S.M., e-Gul, S., Shafiq, M., Farooq, M.,
Sanaullah, K., and Jamil, T., Effect of silica on the properties of cellulose
acetate/polyethylene glycol membranes for reverse osmosis. Desalination,
2015. 355(0): p. 1-10.
144. Hancock, N.T. and Cath, T.Y., Solute Coupled Diffusion in Osmotically Driven
Membrane Processes. Environmental Science & Technology, 2009. 43(17): p.
6769-6775.
145. Xie, M., Nghiem, L.D., Price, W.E., and Elimelech, M., Comparison of the
removal of hydrophobic trace organic contaminants by forward osmosis and
reverse osmosis. Water Research, 2012. 46(8): p. 2683-2692.
146. Lee, K.Y. and Mooney, D.J., Alginate: Properties and biomedical applications.
Progress in Polymer Science, 2012. 37(1): p. 106-126.
147. Stokke, B.r.T., Draget, K.I., Smidsrà d, O., Yuguchi, Y., Urakawa, H., and
Kajiwara, K., Small-Angle X-ray Scattering and Rheological Characterization of
Alginate Gels. 1. Ca−Alginate Gels. Macromolecules, 2000. 33(5): p.
1853-1863.
148. Fricain, J.C., Schlaubitz, S., Le Visage, C., Arnault, I., Derkaoui, S.M., Siadous, R.,
Catros, S., Lalande, C., Bareille, R., Renard, M., Fabre, T., Cornet, S., Durand,
M., Léonard, A., Sahraoui, N., Letourneur, D., and Amédée, J., A
nano-hydroxyapatite – Pullulan/dextran polysaccharide composite

REFERENCES
123
macroporous material for bone tissue engineering. Biomaterials, 2013. 34(12):
p. 2947-2959.
149. Tang, C.Y., Kwon, Y.-N., and Leckie, J.O., Probing the nano- and micro-scales of
reverse osmosis membranes—A comprehensive characterization of
physiochemical properties of uncoated and coated membranes by XPS, TEM,
ATR-FTIR, and streaming potential measurements. Journal of Membrane
Science, 2007. 287(1): p. 146-156.
150. Kasaai, M.R., Intrinsic viscosity–molecular weight relationship and
hydrodynamic volume for pullulan. Journal of Applied Polymer Science, 2006.
100(6): p. 4325-4332.
151. Bacchin, P., Aimar, P., and Field, R.W., Critical and sustainable fluxes: Theory,
experiments and applications. Journal of Membrane Science, 2006. 281(1-2):
p. 42-69.
152. Tang, C.Y. and Leckie, J.O., Membrane Independent Limiting Flux for RO and
NF Membranes Fouled by Humic Acid. Environmental Science & Technology,
2007. 41(13): p. 4767-4773.
153. Duan, J. and Kasper, D.L., Oxidative depolymerization of polysaccharides by
reactive oxygen/nitrogen species. Glycobiology, 2011. 21(4): p. 401-409.
154. Baek, Y., Yu, J., Kim, S.-H., Lee, S., and Yoon, J., Effect of surface properties of
reverse osmosis membranes on biofouling occurrence under filtration
conditions. Journal of Membrane Science, 2011. 382(1–2): p. 91-99.
155. Xu, J., Chang, C.-Y., and Gao, C., Performance of a ceramic ultrafiltration
membrane system in pretreatment to seawater desalination. Separation and
Purification Technology, 2010. 75(2): p. 165-173.
156. Nam, J.-W., Park, J.-Y., Kim, J.-H., Kwon, S., Chon, K., Lee, E.-J., Kim, H.-S., and
Jang, A., The evaluation on concentration polarization for effective monitoring
of membrane fouling in seawater reverse osmosis membrane system. Journal
of Industrial and Engineering Chemistry, 2014. 20(4): p. 2354-2358.

REFERENCES
124
157. Zhao, Y., Song, L., and Ong, S.L., Fouling behavior and foulant characteristics
of reverse osmosis membranes for treated secondary effluent reclamation.
Journal of Membrane Science, 2010. 349(1–2): p. 65-74.