Embed Size (px)
Citation preview

MURJMission Undergraduate Research Journal
VOLUME 3 - JANUARY 2015
CALIFORNIA STATE UNIVERSITY NORTHRIDGE

Los Angeles Mission College
Title III STEM Program
Mission Undergraduate Research Journal
MURJVolume 3
January 2015
Published by
Los Angeles Mission College
Title III STEM program
LAMC Faculty Involved:
J. Michael Reynolds, M.S. and Stephen Brown, Ph.D.
STEM Director: Mike Fenton, Ph.D.
Editor: Stephen Brown, Ph.D.
Internship stipends were provided by the Title III STEM grant.
©2015 Los Angeles Mission College, STEM
http://lamission.edu/stem
STEM is funded by the U.S. Department of Education.

MURJ - VOLUME 32
Th e mission of the Mission Undergraduate Research Journal
(MURJ) is to encourage, recognize, and reward academic
activity outside the classroom, while providing an opportunity
for the conversation of research and ideas. MURJ strives to
encourage students to become interested in science research
by presenting the studied work and by off ering the means of
communicating knowledge between the STEM disciplines.
“I had a great time working and learning
at UCLA. Th is was a great opportunity to get
hold of. I would recommend this to
every Biology or Biochemistry major.
Th is was a great opportunity; I wish
I could do it again. Th is internship
is absolutely needed for someone
pursuing the biological fi eld. It will
help you determine whether you like
the research area of science or not.”
– Houman Tazhibi

LOS ANGELES MISSION COLLEGE 3
A Letter from the EditorDear Reader,
Los Angeles Mission College is proud to present the third edition of the Mission
Undergraduate Research Journal. In the past year, the STEM program at Los Angeles
Mission College has expanded its support and the number of students participating in this
dynamic program. As a result nearly twice as many students had the opportunity to spend
an entire summer working in primary research laboratories at California State University,
Northridge and the University of California at Los Angeles (UCLA) which provided them
with invaluable experience toward meeting their academic and career goals.
In this edition you will fi nd scientifi c articles written by the following student interns:
Viviana Asencion, Cindy Barrios, Karyll Capistrano, Sergio Gonzalez, Cesar M. Aliaga,
Sofi ya Pascual, Gabriel Robles, Luis Corona, Dezerey Escanuelas, Vanessa Garcia, Amy Heman,
Sahil Khullar, Dylan Martin, Heilly Salinas, Houman Tazhibi, Firmin Dingue Tchiengue, and
Jesus M. Lopez Baltazar. Th ese articles are accounts of active research in which each student
participated over a 10 week period, research that is still ongoing. Th ough the narrative of
each article basically presents an excerpt of a larger research goal, you will be very impressed
with the scope of research covered in such a short period of time as well as the quality of
presentation. Th is is especially remarkable since this is the fi rst experience working in a
research environment for each student intern.
Th ese opportunities would not have been possible without the generous support of
our collaborators – Drs. Maria De Bellard, Robert Espinoza, Ray Hong, Aida Metzenberg,
Michael Summers, Maria Elena Zavala, Gloria Melara, Vibhav Durgesh, and Behzad Bavarian
at CSU Northridge, and Drs. Ann Hirsch, Chentao Lin, Yunfeng Lu and graduate student
Huihui Zhou at UCLA. Without their willingness to take our student interns into their
laboratories to train and guide in the challenges of primary research, there would be no
intern program at all. And we must also acknowledge the fi nancial, administrative and
academic support of our STEM program, in particular the STEM director Mike Fenton as
well as the STEM staff and supporting STEM faculty, and our extraordinary graphic designer
Leonard Baptiste.
We will continue to off er such research opportunities for our students each summer with
whatever resources we have available. Th is is the fi rst year that I have had the honor of
serving as mentor for our summer interns and I have seen for myself how much the students
enjoy, value and learn from the experience. In fact, many of our interns have voluntarily
chosen to continue their research during the fall term in the labs that sponsored them,
even while continuing their studies at Mission College. We all look forward to seeing our
future students benefi t from the same opportunities to receive the experience, support, and
confi dence necessary to succeed in their academic as well as personal goals.
Sincerely,
Stephen T. Brown, Ph.D.
Vice Chair, Life Sciences Department
Los Angeles Mission College

MURJ - VOLUME 34
LOS ANGELES MISSION COLLEGE 5
Contents
Silencing of the Robo Receptor in Trunk Neural Crest Cells Allows Migration
to the Gut – Viviana Asencion .................................................................................................. 6
On the Verge of Developing Gene Th erapy for Neurofi bromatosis Type I
– Cindy K. Barrios....................................................................................................................12
Sigma Factor and Anti-sigma Factor Interactions of Nostoc Punctiforme
– Karyll Capistrano ..................................................................................................................17
Is the Survival of the Mediterranean House Gecko in New Environments Caused
by Evolution? – Dezerey Escanuelas .......................................................................................28
ZOG1 Gene Eff ects on Arabidopsis Cell Size – Vanessa Garcia .............................................33
Neurofi bromatosis Type 1: Th e Race to Treating Optic Gliomas – Amy Heman .................36
Advancing Research on Neurofi bromatosis Type 1 – Sahil Khullar .....................................43
Progress for Neurofi bromatosis Type 1 – Dylan Martin .......................................................52
Using Small Subunit Ribosomal RNA (18S) Gene Sequences to Identify
Wild Nematodes – Heilly Salinas ...........................................................................................58
STEM-HSI Web Portal – Sergio Gonzales ...............................................................................62
AIMS2014 Fluid Mechanics: Flow Visualization Study Around an Air Foil
– Cesar Moshe Aliaga, Sofi ya Pascual .......................................................................................66
Antifreeze as a Corrosion Inhibitor of Steel Rebar – Gabriel Robles ....................................68
Th e C.O. Gene of Arabidopsis Th aliana Functions as a Regulator of Flowering
in Response to Blue Light – Luis Corona ...............................................................................72
Cryptochrome 2 Interaction Kinase 1 (CIK1) in Arabidopsis – Houman Tazhibi .................77
Research of Novel Plant-Nodulating Bacteria – Firmin Dingue Tchiengue ...........................81
Eff ects of Fluorinated Microporous Active-Carbon in the Capacitance of Electrochemical
Double-Layer Capacitors (TSSRP) – Jesus M. Lopez Baltazar ...............................................91
COMPUTER SCIENCE/ENGINEERINGUCLA
BIOLOGY CSUN
MCBD UCLA
COMPUTER SCIENCE/ENGINEERINGCSUN

MURJ - VOLUME 36
Silencing Of Th e Robo Receptor In Trunk Neural Crest Cells
Allows Migration To Th e GutViviana Asencion
Sponsored by Dr. Maria De Bellard, Department of Biology
California State University, Northridge
INTRODUCTION
Neural crest cells are multipotent, migratory
cells that originate from the dorsal neural
tube during vertebrate development. Th ese
cells then migrate throughout the embryo,
giving rise to wide variety derivatives
including the peripheral nervous system,
craniofacial skeleton, pigment cells, and
endocrine organs (De Bellard et al., 2003).
In order to migrate, neural crest cells need
to change from non-motile epithelial cells
to highly motile mesenchymal cells. Th is is
possible through a process known as EMT,
epithelia to mesenchymal transition, and is
accompanied by changes in the expression of
transcription factors, cell adhesion molecules
and alterations in the cytoskeleton (Vernon
and LaBonne, 2004; Taneyhill et al., 2007;
Salvador et al., 2009; Th iery et al., 2009).
Many key molecules are known to be part
of the EMT process; however, Slit molecules
are very important proteins for signaling
the starting or preventing EMT. Th e Slit
ligands and Robo receptors are both present
at the beginning of neural crest EMT and
throughout migration (De Bellard et al., 2003;
Jia et al., 2005). Slit proteins (1, 2 and 3) are
known key players in axonal guidance as well
as guiding neural crest cells during migration
(Brose et al., 1999; De Bellard et al., 2003; Jia
et al., 2005; Kidd et al., 1999; Li et al., 1999).
But, most important is that Slits and their
Robo receptors have been found to play a role
in cancer metastasis (Schmid et al., 2007;
Singh et al., 2007; Prasad et al., 2008; Tseng et
al., 2010). Slit molecules have recently been
defi ned as true tumor suppressor molecules
(Dallot et al., 2002, 2003a; Dickinson et al.,
2010). Slit expression correlates with reduced
cell motility in cancer cells while reduced Slit
expression is associated with more aggressive
cancer types. Slit also regulates beta-catenin
expression, which is critical during cell
migration (Goivannone et al., 2012).
Th e main purpose of this research is to study
Slit Robo receptors in trunk neural crest
cells in chicken embryos and what is keeping
trunk neural crest cells from migrating to
the gut. Slit is found in higher counts than
Robo in vagal neural crest cells, which do
migrate to the gut. On the other hand, Robo
receptors are found in higher counts than Slit

LOS ANGELES MISSION COLLEGE 7
Figure 2 - Transverse cross-section of chicken embryo
in the trunk neural crest cells, which do not
migrate to the gut. Th e reason may be because
Slit that is present in the migration path
to the gut binds to the Robo receptors and
impairs migration. Th e study of the possible
functional role of Robo gain of function and
Robo loss of function mutations may help to
explain migration to the gut. Robo gain of
function mutations express the receptor which
will bind to Slit and migrations slows down or
stops. Robo loss of function mutations silence
the receptor which is therefore unable to bind
to Slit and migration takes place. Th e fi ndings
of this research can be applied to studying the
role of Slit-Robo in cancer cell metastasis.
Th e process of studying trunk neural crest
cells is complex and involves many diff erent
techniques including: Electroporations with
a GFP-Robo gain of function construct,
GFP-Robo loss of function construct, and
a GFP control construct; preparing embryo
whole mounts, sectioning embryos with a
vibratome, in vitro neural crest culture, cell
and neural tube transfection, and RT-PCR
analysis among others. My role in this lab
so far is to section the trunk of the embryo
embedded in 4% agarose using a vibratome.
Th ese 50 micrometer sections are studied
under a microscope and if signals of migration
from the neural tube to the gut are visible,
pictures are taken for the record. I have also
practiced electroporation with the GFP control
construct. In addition, I have taken pictures of
the whole embryos as well as sections to look
for signals of migration from the neural tube
to the gut.
RESULTS
In this study, we examine the potential role of
Robo receptors in the process of trunk neural
crest cells migration to the gut area. Robo
receptors are expressed in the trunk neural
crest cells, while Slit ligands are expressed
in the vagal neural crest cells. Vagal neural
crest cells, not trunk, enter and colonize the
developing gut to form the enteric nervous
system. We can see vagal and trunk areas in
Figure 1. In order to study migration of trunk
neural crest cells to the gut area, chicken
embryos of diff erent stages (HH16-17, HH19,
and HH20-21) were cross-sectioned to look
for the signal. Embryos were cross-sectioned
Figure 1 - Whole chicken embryo

MURJ - VOLUME 38
transversally as in Figure 2, in order to fi nd a
signal that would show the migration of the
trunk neural crest cells to the gut.
Before trunk neural crest cells start migration
at HH14, they express both ligands and
receptors. Later during peak neural crest cell
migration, HH16-17, pre-migratory neural
crest cells express Slit while the migrating
neural crest cells express Robo (De Bellard
et al., 2003; Jia et al., 2005). Slit expression
at the entrance of the gut is a repellant for
ventrally migrating trunk neural crest cells
(De Bellard et al, 2003). Th erefore, when
Slit molecules encounter Robo receptors
present in trunk neural crest cells, migration
slows down or stops. Th is study explores the
possibility that the RoboD2 loss of function
mutation will allow trunk neural crest cells to
migrate to the intestinal portal.
In Figure 3A, electroporation of neural crest
cells with GFP control shows that neural
crest cells do not necessarily migrate to the
gut. Robo receptors in trunk neural crest
cells cannot migrate to the gut due to the
Slit molecules express there. Slit molecules
express at the entrance of the gut area attach
to Robo receptors expressed in the trunk
neural crest cells and stops migration. In
Figure 3B, we clearly see trunk neural crest
cells that have migrated to the gut. Silencing
Robo receptors in trunk neural crest cells
allows migration to the developing gut.
Figure 4 (A, C, E, G) shows a cross-section
supporting the results in Figure 3A. Figure
4 (A, C, E, G) GFP control cross-sections
show no migration to the gut area because
Slit molecules at the entrance of the gut
stop migration by attaching to trunk neural
crest cell Robo receptors. Expression of
the RoboD2 loss of function mutation in
Figure 4 (B, D, F, H) cross-sections show the
migration of trunk neural crest cells to the gut
Figure 3 - (A) TGPF control image of a whole embryo at gut level. There is no migration of trunk neural crest cells to the gut.- (B) Dominant negative RoboD2 image of a whole embryo at gut level. There is migration of trunk cells to the gut.
Figure 4 - GFP control (A, C, E, G) There is no migration of trunk neural crest cells to the gut. Slit molecules express at the entrance of the gut attach to the Robo receptors expressed in the trunk neural crest cells stopping migration. - RoboD2 (B, D, F, H) Migrating trunk neural crest cells are present in the gut. RoboD2 Loss of function mutation allows trunk neural crest cells to migrate to the gut. Slit molecules are not able to attach to the Robo receptors because they are silent.

LOS ANGELES MISSION COLLEGE 9
supporting Figure 3B. Th e RoboD2 mutation
silences the Robo receptors in the trunk
neural crest cells so Slit molecules cannot
attach to the receptors making migration
possible. Figure 4G shows that neural crest
cells normally do not migrate to the gut.
Figure 4H shows the migration of the trunk
neural crest cells to the gut due to the loss of
Robo receptor function.
In conclusion, trunk neural crest cells
normally would not migrate to the gut, as we
see in Figure 5A with the GFP control. Th is
study shows that the RoboD2 loss of function
mutation silence the Robo receptors of the
trunk neural crest cells allowing migration
to the gut as show in Figure 5B, and that the
RoboG gain of function construct does not
allow migration at all from the neural crest
cells as show in Figure 5C.
DISCUSSION
Neural crest cell migration is a very complex
process because it encompasses many cell
functions. In this study we were able to
examine the role of Robo receptors expressed
in the trunk neural crest cells during the
migration process. Based on the results,
we can conclude that Robo receptors play
an important role in trunk neural crest
cell migration to the gut. Th ese fi ndings
demonstrate that Robo receptors can be
silenced in order to migrate to the gut where
Slit molecules are present. Slit molecules
are capable of stopping migration when
they contact Robo receptors. However, if
Robo receptors are mutated (Silence), then
Slit molecules are not capable of stopping
migration. Th ese results can also be used to
study cancer cell metastasis.
Figure 5 - (A)Trunk neural cells do not migrate to the gut in the control. When the Robo receptors are silent, trunk neural crest cells migrate to the gut as noticed in (B). In (C), trunk neural cells expressing RoboG gain of function did not migrate as far as in GFP control.

MURJ - VOLUME 310
MATERIALS AND METHODS
Electroporation with GFP and Harvesting
GFP (Green Fluorescence Protein) expression
plasmid was injected into chicken embryo
neural tubes using a mouth pipette and
immediately electroporated with 50-ms
pulses of 25 mV each. Embryos were
sealed with tape and re-incubated for 24
or 48 hours. After incubation, embryos
were harvested. Harvesting consisted of
the removal of the embryo from the egg.
Harvested embryos were placed overnight
in 4% paraformaldehyde (PFA) to fi x the
embryos. Embryos in PFA were extensively
washed in 0.01 M Phosphate Buff ered Saline
(1 x PBS) before trimming the membrane.
Electroporations and embryo harvesting
were carried out using a stereoscopic
dissecting microscope.
Mount of Embryos and Imaging
Electroporated, trimmed embryos were
embedded in 4% agarose. Once embedded,
the embryos were sectioned using a
vibratome. Fifty micrometer thick sections
were placed in 1 x PBS wells. Each well has
about 8-10 sections. Twenty microliters of
DAPI, a fl uorescent stain that colors the cell
nucleus blue, was added to each well before
mounting. Only sections from the trunk part
of the embryo were mounted. All sections
were photographed using a Zeiss
A-1 AxioImager.
ACKNOWLEDGMENTS
I would like to thank my PI Dr. De Bellard for
all her support, lab tech Blanca Ortega for all
the help she off ered me during the time I was
there, and students Nora, Ian, Hanna.
REFERENCES
Brose K, Bland KS, Wang KH, Arnott D,
Henzel W, Goodman CS, Tessier-Lavigne M,
Kidd T 1999. Slit proteins bind Robo receptors
and have an evolutionarily conserved role in
repulsive axon guidance. Cell 96:795-806.
Dallol A, Da Silva NF, Viacava P, Minna JD,
Bieche I, Maher ER, Latif F. 2002. SLIT2, a
human homologue of the Drosophila Slit2
gene, has tumor suppressor activity and is
frequently inactivated in lung and breast
cancers. Cancer Res 62:5874-5880.
Dallol A, Krex D, Hesson L, Eng C, Maher
ER, Latif F. 2003a. Frequent epigenetic
inactivation of the SLIT2 gene in gliomas.
Oncogene 22:4611-4616.
De Bellard, Rao Y, Bronner-Fraser M, 2003.
Dual Function of Slit2 in repulsion and
enhanced migration of trunk, but not vagal,
neural crest cells. J Cell Biol 162:269-279.
Dickinson RE, Dallol A, Bieche I, Krex
D, Morton D, Maher ER, Latif L. 2004.
Epigeneric inactivation of SLIT3 and SLIT1
genes in human cancers. Br J Cancer 91:
2071-2078.

LOS ANGELES MISSION COLLEGE 11
Giovannone D, Reyes M, Reyes M, Correa L,
Martinez D, Ra H, Gomez G, Kaiser J, Ma L,
Stein MP, DeBellard M. 2012. Slit aff ect the
timely migration of neural crest cells via robo
receptor. Dev Dynamics 241:1274-1288.
Jia L, Cheng L, Raper J, 2005. Slit/Robo
signaling is necessary to confi ne early neural
crest cells to the ventral migratory pathway in
the trunk. Dev Biol 282:411-421.
Kidd T, Bland KS, Goodman CS, 1999. Slit is
the midline repellent for the robo receptor in
Drosophila. Cell 96:785-794.
Li HS, Chen JH, Wu W, Fagaly T, Zhou L,
Yaun W, Dupuis S, Juang ZH, Nash W, Gick C,
Ornitz DM, Wu JY, Rao Y. 1999. Vertebrate
Slit, a secreted ligand for the transmembrane
protein round about, is a repellent for
olfactory bulb axons Cell 96:807-818
Prasad A, Paruchuri V, Preet A, LAtif F, Ganju
TK. 2008. Slit-2 induces a tumor-suppressive
eff ect by regulating beta-catenin in breast
cancer cells. J Biol Chem 283:26624-26633.
Salvador SM, Vernon A, LaBonne C. 2009.
Th e role of snail family transcription factors
in neural crest development and tumor
progression. Dev Biol 331:438.
Schmid BC, Rezniczek GA, Fabjani G, Yoneda
T, Leodolter S, Zeilliger R. 2007. Th e neural
guidance cue Slit2 induces targeted migration
and may play a role in brain metastasis of
breast cancer cells. Breast Cancer Res Treat
106:333-342.
Singh Rk, Indra D, Mitra S, Mondal RK, Basu
PS, Roy A, Roychowdhury S, Panda CK. 2007.
Deletions in chromosome 4 diff erentially
associated with the development of cervical
cancer: evidence of slit2 as a candidate tumor
suppressor gene. Hum Genet 122:71-81.
Taneyhill LA, Coles EG, Bronner-Fraser M.
2007. Snail2 directly represses cadherin6B
during epithelia-to-mesenchymal transitions
of the neural crest. Development 134:
1481-1490.
Th iery JP, Duband JL, Delouvee A. 1982.
Pathwaysand mechanisms of avian trunk
neural crest cells migration and localization.
Dev Biol 93:324-343.
Tseng RC, Lee SH, Hsu HS, Chen BH, Tsai WC,
Tzao C, Wang YC. 2010. SLIT2 attenuation
during lung cancer progression deregulates
beta-catenin and E-cadherin and associates
with poor prognosis. Cancer Res 70:543-551.
Vernon AE, LaBonne C. 2004. Tumor
metastasis: a new twist on epithelia-
mesenchymal transitions. Curr Bio 14:
R719-R721.

MURJ - VOLUME 312
On Th e Verge Of Developing Gene Th erapy For
Neurofi bromatosis Type ICindy K. Barrios
Sponsored by Dr. Aida Metzenberg, Department of Biology
California State University, Northridge
INTRODUCTION
Neurofi bromatosis type 1 (NF1), also known
as von Recklinghausen disease or Watson
syndrome, is a common autosomal dominant
genetically inherited disorder aff ecting about
1 in 2,700 newborns. Aff ected individuals
have a dysfunctional Neurofi bromin
(neurofi bromatosis- related protein NF-
1) due to mutations within the Nf1 gene
located on chromosome 17. NF-1 is a
protein that regulates cell division in normal
cells, but mutation within the Nf1gene
induces tumor growth. A faulty NF-1 causes
tumors to grow uncontrollably along the
central nervous system, aff ecting the ability
of the nerves to function correctly. Th is
malfunction could lead to symptoms such as
scoliosis (curvature of the spine), learning
disabilities, optic pathway gliomas (vision
disorder), and epilepsy. Some individuals
with NF1 may be prone to have few clinical
characteristics of NF1, while others may
develop severe manifestations. Th e age of
onset is unpredictable, and the disease is not
signifi cantly increased in any ethnic group
or gender (Szudek et al., 2003). Children
carrying the faulty NF1 allele have a 70%
risk of developing optic pathway gliomas
(Listernick et al., 2007). Childhood optic
pathway gliomas are usually benign (non-
cancerous) and slow growing. Optic pathway
gliomas occur along the nerves that send
messages from the eye to the brain also
called the optic pathway (Marsden, 2014).
Irreversible nerve damage, due to NF1, may
lead to a decrease in visual acuity, abnormal
pupillary function, and optic nerve atrophy
(Westphal & Lamszus, 2011). Th ere is no
cure for optic pathway gliomas; however,
tumors that cause pain or loss of function
may be either removed surgically or treated
with chemotherapy. Th e research described in
this report focuses on developing a non-viral
gene therapy mode for the prevention of optic
pathway gliomas.
A recent investigation regarding gene
therapy for NF1 is from Andrea Cosco, who
emphasized his master’s thesis on the eff ect
of NF1, specifi cally children aff ected with
optic pathway gliomas. During his research,
Cosco successfully created a construct, which
in theory would be able to slow down the
proliferation and growth of benign tumors.

LOS ANGELES MISSION COLLEGE 13
Figure 4 - pEPito Nf1-GDR construct ranging from 23 ng/µL to 207 ng/µL in a 200 µL total volume (135,760 ng total weight)
He used a non-viral mammalian expression
vector pEPito and inserted a GRD domain
of the NF1 gene to further be utilized for
gene therapy (GRD is the region in which a
majority of mutations in the NF1 gene are
found to occur). However, due to the effi cacy
of the blood brain barrier, his construct is
not capable of traveling to the optic nerve
for it to treat optic pathway gliomas. Th e
objective of my research was to amplify
the construct (pEPito NF1-GRD) through
the transformation of competent bacterial
cells and plasmid mini preparations. Th e
amplifi ed construct can then be modifi ed for
gene therapy treatment specifi cally for those
with optic pathway gliomas by including a
lactotransferrin gene, which has being shown
to successfully cross the blood brain barrier
(Ji, et al., 2005).
RESULTS
Before adding the lactotransferrin gene to
the construct (pEPito NF1-GRD), we fi rst
needed to amplify the construct in order
to generate enough to further use for gene
therapy of optic pathway gliomas. Competent
Top 10 E. Coli cells were prepared, aliquoted
into 200 μL portions and stored at -70 °C
in 15% glycerol (Figure 1). Th e competent
cells were then tested using a control plasmid
(pUC19). Once we verifi ed the competency
of the competent cells, by the growth of
colonies, we then proceeded to transform
the cells with the plasmid of interest (pEPito
Nf1-GRD). Figure 2 shows some of the plates
used for transformation. Plate A contained
Figure 1 - 200 µL aliquots of competent cells to be used for transformation
Figure 2 - Plates of Transformed BacteriaPlate A -10 µL of pEPito NF1-GRD transformed cells Plate B -100 µL of pEPito NF1-GRD transformed cellsPlate C - remaining 890 µL to 900 µL of pEPito NF1- GRD transformed cells. Each plate was LB agar plus 0.5 µg/mL ampicillin.
Figure 3 - Nano Drop profi le of purifi ed plasmid obtained from a plasmid miniprep
A
B C

MURJ - VOLUME 314
10 μL of pEPito NF1-GRD transformed cells.
Plate B contained 100 μL of pEPito NF1-
GRD transformed cells. Plate C contained
the remaining 890 μL to 900 μL of pEPito
NF1-GRD transformed cells. Isolated
colonies from the plates were grown and
plasmid DNA purifi ed by “plasmid miniprep.”
Figure 3 shows the purifi ed Nano Drop
curve of a plasmid miniprep and the 260/280
ratio of 2.03 represents the pureness of
the construct. Th en, we stored the plasmid
DNA at -20 °C to be later used for adding the
lactotransferrin gene. At the beginning of the
investigation, there had been produced one vial
of 22 ng/μL in a 150 μL total volume (13,300
ng total weight) of the construct pEPito Nf1-
GRD; by the end of the summer investigation
we increased the amount of the construct to
fourteen vials ranging from 23 ng/μL to 207
ng/μL in 200 μL aliquots (135,760 ng total
weight). Figure 4 shows the vials produced by
the end of the summer internship.
DISCUSSION
Neurofi bromatosis Type 1 is a common
genetic inherited disorder that aff ects 1 in
2,700 newborns. A faulty neurofi bromin
gene causes uncontrollable growth of tumors
along the central nervous system leading to
optic pathway glioma. Th ere is no cure for
optic pathway glioma; thus, in theory, gene
therapy can become a treatment for patients
with optic pathway glioma. A construct
pEPito NF1-GRD was design by Andrea Cosco
for gene therapy; however, this construct
cannot cross the blood brain barrier to treat
the optic glioma. Th erefore, the construct
pEPito NF1-GRD must fi rst be inserted with
a lactotransferrin gene, which has being
shown to successfully cross the blood brain
barrier. In this research, we were successful
at amplifying the construct to fourteen vials
ranging from 23 ng/μL to 207 ng/μL in a 200
μL aliquots (135,760 ng total weight). From
this point, the lactotransferrin DNA needs
to be inserted into the pEPito NF1 GRD
construct and its effi ciency analyzed using a
live model organism such as mice or zebrafi sh
in order to show conclusive evidence for our
construct’s effi cacy.
MATERIALS AND METHODS
Preparation of Competent Cells
Five milliliters of Luria Broth (LB) was
inoculated with a single, isolated colony of
Top 10 Escherichia coli (E. coli) Miller Fisher
Biotech. Th is was incubated at 37 °C, in a
shaker at 250 rpm for 16 hours. At the 16th
hour, 1 mL of overnight growth was diluted in
50 mL LB and incubated at 37 °C, in a shaker
at 250 rpm until the absorbance at 600 nm
(A600
) reached approximately 0.6 absorbance.
Th e culture was then centrifuged at 4 °C and
5,098 x g for 10 minutes. Th e pellet was
resuspended in 5.0 mL cold 0.1 M CaCl2, and
placed on ice for 15 minutes. Th e culture was
centrifuged again at 4 °C and 5,098 x g for 10
minutes. Th e supernatant was discarded and
the pellet was resuspended in 1 mL cold 0.1 M
CaCl2. Fifty microliters of sterile H
2O and 450
μL of sterile 50% glycerol was added and the
cells were aliquoted and stored at -70 °C.
LOS ANGELES MISSION COLLEGE 15
Transformation
Two microliters of plasmid DNA at 10.0 pg/μL
was added to 100 μL of competent cells (see
above). Th e tube was placed on ice for 30
minutes, then heat shocked in a 42 °C water
bath for exactly 45 seconds, and immediately
placed on ice for 2 minutes. Nine hundred
microliters of Super Optimal Broth with
Catabolite Repression (SOC medium) (2%
tryptone, 0.5% yeast extract, 10 mM NaCl, 2.5
mM KCl, 10 mM MgCl2, and 20 mM glucose)
was added to each tube and then placed in a
shaker at 37 °C at 225 rpm for 45 minutes.
Cells were plated on three LB agar plus 0.05
μg/mL ampicillin plates and incubated at 37
°C for 12 hours.
Plasmid Miniprep
Colonies were inoculated into 5.0 mL of
Luria broth (LB) and 2 μL/mL of ampicillin;
and placed in a shaker at 37 °C at 250 rpm
for 16 hours. One and one half milliliters
of overnight culture was centrifuged for 25
seconds at 20,800 x g at room temperature.
All but 100 μl of supernatant were discarded,
and the remaining 100 μL were vortexed
until the cells were completely resuspended.
Th ree hundred microliters of TENS (10.0 mM
(Tris-HCl pH 8.0, 1.0 mM EDTA pH 8.0, 0.1 M
NaOH, 0.5% SDS) was added and the mixture
was vortexed on high for 5 seconds. One
hundred fi fty microliters of 3M Na Acetate
(pH 5.2) was added and the sample was
vortexed for 5 seconds and centrifuged for 4
minutes at 20,800 x g at room temperature.
Approximately 450 μL of supernatant was
transferred to a new tube. Th e sample was
mixed with 0.9 mL of 95% ethanol previously
cooled to -20 °C and centrifuged for 2 minutes
at 20,800 x g at room temperature. Without
disturbing the pellet, the supernatant was
gently removed and the pellet washed twice
with 70% ethanol. Th e pellet was then
resuspended in 200 μL TE (10 mM Tris-HCl
pH 8.0, 1 mM EDTA pH 8.0).
ACKNOWLEDGMENTS
I would like to express my very great
appreciation to Dr. Aida Metzenberg, Chair
Department of Biology CSUN, for allowing
me to work within her lab. I would like to
off er my special thanks to Dr. Mike Fenton,
STEM Director, for the opportunity to partake
in this wonderful learning experience. I am
particularly grateful to Dr. Stephen Brown
for his valuable and constructive suggestions
during the planning and development of
this research work. I want to thank Anamica
Sood and Osvaldo Larios for their patience,
dedication and constant advice. In addition,
I want to thank Amy and Dylan for being
wonderful lab partners during our internship.
Lastly, I would like to thank the STEM
program and its faculty for allowing me to
work in a research environment. I will carry
this research experience with me and continue
to pursue a career in the biological
science fi eld.

MURJ - VOLUME 316
REFERENCES
Cosco, Andrea. Filling in the Gaps in
Neurofi bromatosis Type 1. California State
University Northridge [Accessed July
15, 2014]
Ji, B. (2005, May 25). Pharmacokinetics and
brain uptake of lactoferrin in rats. Retrieved
September 5, 2014, from http://www.nirs.
go.jp/seika/brain_e/e_seika/pdf/Ki_Life_
Sciences.pdf
Listernick, R. et al., 2007. Optic pathway
gliomas in neurofi bromatosis-1: controversies
and recommendations. Annals of Neurology,
61(3), pp.189–198. Available at: http://
www.ncbi.nlm.nih.gov/pubmed/17387725
[Accessed July 15, 2014].
Marsden, T. (2014, January 1). Optic
pathway glioma. Retrieved August 11, 2014,
from www.royalmarsden.nhs.uk/cancer-
information/children/optic-pathway-glioma
Neurofi bromatosis type I. (2014, July
12). In Wikipedia, Th e Free Encyclopedia.
Available at: http://en.wikipedia.org/w/
index.php?title=Neurofi bromatosis_type_I&o
ldid=616706669 [Accessed July 15, 2014].
Szudek, J., Evans, D.G. & Friedman, J.M.,
2003. Patterns of associations of clinical
features in neurofi bromatosis 1 (NF1).
Human genetics, 112(3), pp.289–97.
Available at: http://www.ncbi.nlm.nih.gov/
pubmed/12596053 [Accessed July 15, 2014].
Westphal, M. & Lamszus, K., 2011. Th e
neurobiology of gliomas: from cell biology to
the development of therapeutic approaches.
Nature Reviews Neuroscience, 12(9), pp.495–
508. Available at: http://www.ncbi.nlm.nih.
gov/pubmed/21811295 [Accessed July
15, 2014].

LOS ANGELES MISSION COLLEGE 17
Sigma Factor And Anti-Sigma Factor Interactions Of Nostoc Punctiforme
Karyll Capistrano Sponsored by Dr. Michael Summers, Department of Biology
California State University, Northridge
INTRODUCTION
Nostoc punctiforme is a species of
Cyanobacteria whose vegetative cells can
diff erentiate into a variety of cell types as a
result of diff erent environmental stresses.
Cell types that occur include heterocysts that
are able to fi x nitrogen in response to a lack of
nitrogen, hormogonia that allow for motility,
and spore-like akinetes that can withstand
strong temperatures. Within bacteria,
initiation of RNA synthesis occurs with the
help of a protein called a sigma factor. A
sigma factor is a subunit of RNA polymerase
that begins initiation of gene transcription
at promoter regions recognized by the sigma
factor. Within N. punctiforme, there are 13
diff erent sigma factors. Sigma factor A is the
house keeping sigma factor responsible for
regular cell function. Th e function of the rest
of the 12 sigma factors is unknown. To fi nd
out the function of these 12 sigma factors
including what genes they regulate or how
they are controlled, the sigma factors can be
exposed to anti-sigma factors. Anti-sigma
factors are endogenous proteins that bind
to sigma factors and inhibit transcription,
and can sometimes control sigma factors.
In this experiment, 7 sigma factors will be
analyzed to confi rm their solubility and ability
to interact with anti-sigma factor 0876 to
determine if any of the sigma factors are
complementary to anti-sigma 0876. Th is
experiment involves a GST Pulldown Assay
with anti-sigma factor 0876 being tagged
with GST (glutathione S-transferase), which
has a high affi nity for glutathione, and the
sigma factors being His-tagged (attached to
6 histidine residues). Th e GST lysates will
be attached to glutathione beads, and will
serve as “the bait” for the sigma factors to
attach to. Th e His-tagged protein lysates will
serve as “the pond.” Th e beads with attached
GST lysate proteins will be incubated in E.
coli extracts containing His-tagged proteins.
Th e sigma factors will then be run on two
SDS protein gels, with one gel being used for
regular protein staining to see if the soluble
protein is present while the other will be used
for a western blot to confi rm if there is any
interaction between each sigma factor and
anti-sigma 0876.
MURJ - VOLUME 318
RESULTS
To allow for interaction between the sigma
factors and anti-sigma 0876, expression of
soluble protein of the sigma factors needed to
be achieved. Seven sigma factor genes were
cloned into the pET28a expression vector
and expressed in E. coli cells as a His-tagged
protein (Table 1). Protein expression from
the 7 sigma factor-His-tagged plasmids is
shown in Figure 1. Th e supernatant (referred
to as SOLUBLE) after 5 hours of induction
(T5) of the sigma factors 0307, 0996, 1499,
3293, and 5797 resulted in bands not present
before induction (T0), confi rming the
presence of the induced protein in soluble
form. However, only sigma factor 3293
resulted in the correct band size while 0307,
0996, 1499, and 5797 resulted in larger band
Table 1 - The Nostoc punctiforme genes and their gene product Sigma factors that each pET28a vector expressed.
Figure 1 - First protein induction with 0.4 mM IPTG of the 7 sigma factor-His-tagged plasmids: A. Sigma factors 0307 and 1337; B. Sigma factors 0996 and 3293; C. Sigma factors 1499 and 1771; D. Sigma factor 5797; T0 refers to time zero of induction; T5 refers to 5 hours post-induction; S refers to soluble protein, and T refers to total protein; LAD refers to the protein molecular weight ladder. A band present in the T5 SOLUBLE (S) sample that was not observed at T0 indicated the desired protein was present. The molecular weight of the corresponding band was compared to the expected MW (indicated at the bottom of the gel) to confi rm expression of the sigma factor. Bands indicating successful induction are identifi ed by a red arrow.
N. punctiforme genes Sigma Factor product 0307 SigE 0996 SigC 1337 SigJ 1499 SigB-a 1771 SigB-b 3293 SigB-c 5797 SigD
sizes. Th ese sigma factors were induced again
a second time. An increase of the percent of
the SDS-PAGE gel from 10% polyacrylamide
to 12% was done to increase band intensity
and spacing between the bands. Th ere was no
induction of sigma factors 1337 and 1771 as
shown by no diff erence between the T0 and
T5 samples.

LOS ANGELES MISSION COLLEGE 19
A second induction of the sigma factors 0307,
0996, 1499, and 5797 resulted in soluble
protein, while 1337 and 1771 resulted in no
soluble protein (Figure 2). Induction times
of T0 and T5 were run again, along with
Figure 2 - Second protein induction with 0.4 mM IPTG of the sigma factor-His-tagged plasmids for samples from the 1st induction that were soluble but had a large molecular weight, along with the 2 sigma factors that failed to express soluble protein: A. Sigma factor 0307; B. Sigma Factor 0996; C. Sigma factor 1499; D. Sigma factor 5797; E. Sigma factor 1337.; F. Sigma factor 1771; T0 refers to time zero of induction; T5 refers to 5 hours post-induction; S refers to soluble protein, and T refers to total protein; LAD refers to the protein molecular weight ladder. A band present in the T5 SOLUBLE (S) sample that was not observed at T0 indicated the desired protein was present. The molecular weight of the corresponding band was compared to the expected MW (indicated at the bottom of the gel) to confi rm expression of the sigma factor. Bands indicating successful induction are identifi ed by a red arrow.
induction time after 2.5 hours (T2.5) to see
if soluble proteins were induced at this time.
Th ese proteins were all run on 12% SDS-
PAGE gels with the same settings as with the
previous gels.

MURJ - VOLUME 320
For both protein 1337 and 1771 (Figures 2E
and 2F), no presence of soluble protein at
T2.5 and T5 confi rms no induction of protein
as had been seen in the fi rst induction. To
achieve soluble expression, induction at a
colder temperature was done to see if this
would have any eff ect (Figure 3).
A third induction of 1337 and 1771 at a colder
temperature resulted in no soluble protein
(Figure 3). Another method of making these
insoluble proteins soluble is needed.
Th e expression of both the GST-tagged anti-
sigma factor 0876 (GST-0876) and the GST-
only plasmid pGEX5X-1 resulted in a band
in soluble form at T5 only, with a molecular
weight of ~26 kDa consistent with the
molecular weight of GST (data not shown).
Both the GST and GST-protein lysates were
tested before a GST pulldown assay was done
by fi nding an amount or dilution of lysate that
Figure 3 - Protein induction with 0.4 mM IPTG at a colder temperature of 18 °C for the 2 sigma factor-His-tagged plasmids that were not successfully induced after two attempts: A. Sigma factor 1337; B. Sigma factor 1771. T0 refers to time zero of induction. T5 refers to 5 hours post-induction. T O/N indicates induction overnight; S refers to soluble protein, and T refers to total protein; LAD refers to the protein molecular weight ladder. A band present in the T O/N SOLUBLE (S) sample that was not observed at T0 indicates the desired protein was present. The molecular weight of the corresponding band was compared to the expected MW (indicated at the bottom of the gel) to confi rm expression of the sigma factor. Bands indicating successful induction are identifi ed by a red arrow.
would provide 500 ng of protein to attach to
10 μL of packed glutathione-agarose beads.
Th is was necessary to avoid non-specifi c or
false-negative interactions which could result
if there were too much or not enough GST
bait proteins.
Both the GST-0876 and GST-only lysates
were each bound to 10 μL of glutathione-
agarose beads at two diff erent dilutions with
TGEM (0.1) (1/10 and 1/100), and another
at full concentration with 40 μL of GST lysate
without TGEM (0.1). After rolling incubation
for ~2 hours in the refrigerator to allow for
the lysate to interact with the beads, the
packed beads of GST-0876 and GST-only
were loaded onto two separate SDS-PAGE
gels, stained for 1 hour and destained for
~15 minutes. Th e GST-0876 SDS-PAGE gel
resulted in no bands indicating that the GST-
0876 lysate did not bind to the beads (data

LOS ANGELES MISSION COLLEGE 21
not shown). However, bands around ~26 kDa
did appear on the GST-only SDS-PAGE gel
(Figure 4).
Th e GST-0876 lysate was incubated with
agarose beads a second time for ~2 hours
with a higher volume of lysate (300 μL) at full
concentration to increase the chances of bead
interaction (Figure 5).
After attachment of the GST protein lysates
to the glutathione-agarose beads, and washing
away non-specifi c binding with TGEM (1.0)
and TGEM (0.1), the beads with attached
proteins serving as “the bait,” were incubated
with His-tagged protein lysates (“the pond”)
that had been confi rmed to have induced
soluble protein. Th ese beads were then loaded
onto 2 SDS-PAGE gels. One gel was stained
Figure 4 - SDS-PAGE gel of GST-tagged pGEX5X-1 lysate (GST-only) bound to glutathione-agarose beads: “Full” indicates full concentration of 40 µL of GST-only lysate without TGEM (0.1), “1/10” indicates dilution of 5 µL of GST-only lysate with 45 µL TGEM (0.1), and “1/100” indicates dilution of 5 µL of GST-only lysate with 495 µL TGEM (0.1). Bands present at ~26 kDa confi rmed that the GST-tagged pGEX5X-1 lysate was successfully bound to the agarose beads.
Figure 5 - SDS-PAGE gel of GST-tagged pGEX5X-1::0876 (GST-0876) bound to glutathione-agarose beads: “Full” indicates full concentration of 300 µL of GST-0876 lysate without TGEM (0.1). The two bands present at ~26 kDa confi rmed that the GST-tagged anti-sigma factor 0876 lysate was successfully bound to the agarose beads.
to confi rm the GST-only and GST-0876
protein bound to the His-tagged proteins.
However, the amount of His-tagged protein
that attached to the bait may not have been
enough to stain, requiring a western blot
for better confi rmation of interaction. Th e
second gel was used for chromogenic western
blot analysis to confi rm that the His-tagged
protein bound to the GST lysates. Th e SDS-
PAGE gel GST interaction with His-tagged
proteins 0996 and 3293 after protein staining
is shown in Figure 6. Th e western blot of
0996 and 3293 resulted in two faint green
bands of His-0996 and His-3293 (data not
shown). Th is weak signal could be due to too
little protein being loaded or poor transfer
effi ciency as indicated in the One-Hour
Western Detection System user manual.

MURJ - VOLUME 322
Another GST pulldown assay was done with
two other His-tagged proteins, 0307 and
1499. Th e same procedures were done as
with His-tagged proteins 0996 and 3293
except a chemiluminescent western blot was
done instead of chromogenic western blot
to see if this method would result in greater
sensitivity. Th e SDS-PAGE gel GST interaction
with His-tagged proteins 0307 and 1499 after
protein staining is shown in Figure 7. Th e
western blot of 0307 and 1499 resulted in
three bands of His-0307 but no bands resulted
for His-1499 (Figure 8).
Figure 6 - SDS-PAGE gel of His-tagged proteins 0996 and 3293 interacting with GST-only and GST-0876: +3a is GST-0876 bound to 0996. +4a is GST-only bound to 0996. -1 is GST-0876 not bound to any sigma factor. -2 is GST-only not bound to any sigma factor. +4b is GST-only bound to 3293. +3b is GST-0876 bound to 3293. With bands at ~26 kDa, interaction of GST lysates was confi rmed. The His-tagged proteins with no beads and GST are shown on the ends of the gel.
Figure 7 - SDS-PAGE gel of His-tagged proteins 0307 and 1499 interaction with GST-only and GST-0876: +3a is GST-0876 bound to 0307. +4a is GST-only bound to 0307. -1 is GST-0876 not bound to any sigma factor. -2 is GST-only not bound to any sigma factor. +4b is GST-only bound to 1499. +3b is GST-0876 bound to 1499. With bands at ~26 kDa, interaction of GST lysates was confi rmed. The His-tagged proteins with no beads and GST are shown on the ends of the gel.
Figure 8 - Film of western blot membrane of His-tagged proteins 0307 and 1499 interaction with GST-only and GST-0876: +3a is GST-0876 bound to 0307. +4a is GST-only bound to 0307. -1 is GST-0876 not bound to any sigma factor. -2 is GST-only not bound to any sigma factor. +4b is GST-only bound to 1499. +3b is GST-0876 bound to 1499. The three bands that resulted indicate that His-tagged protein 0307 interacted with GST-only and GST-0876. No bands resulted for His-tagged protein 1499.

LOS ANGELES MISSION COLLEGE 23
DISCUSSION
Th e western blot of sigma factors 0996, 3293,
and 1499 resulted in no bands indicating no
interaction between the His-tagged sigma
factors with anti-sigma 0876. Although the
western blot of sigma factor 0307 resulted in
bands indicating interaction with anti-sigma
0876, a second GST pulldown assay should
be done to confi rm their interaction. As seen
with the fi nal results, the chemiluminescent
western blot was more eff ective in showing
bands on the fi lm compared to the
nitrocellulose membrane of the chromogenic
western blot. Diff erent concentrations of
IPTG (0.4 mM, 0.8 mM, and 1.0 mM) used
for induction of GST-0876 were run on SDS-
PAGE gels to see if concentration of IPTG had
any eff ect on induction of soluble protein
(data not shown). Th e bands that resulted
showed that diff erent concentrations resulted
in same band intensity indicating IPTG
concentration didn’t aff ect induction. Due
to the many variables that could aff ect the
interaction between the glutathione-agarose
beads, His-tagged sigma factors, and GST-
0876, including washing of the beads and
loading of SDS-PAGE gels, another method of
observing interaction between sigma factors
and anti-sigma factors of N. punctiforme is
currently being done in the laboratory.
MATERIALS AND METHODS
PREPARATION OF GST LYSATES FOR ATTACHMENT TO GLUTATHIONE BEADS
(Th e Bait)
Preparation of Starting Culture
Transformed both protein-of-interest-GST
plasmid pGEX5X-1::0876 and GST-only
plasmid pGEX5X-1 into CaCl2 competent
Escherichia coli Rosetta strain and plated
onto Luria Broth (LB) ampicillin 100 μg/mL
(Ap100) agar plates and grew overnight at 37 °C.
Th e next day in the late afternoon, 2 single
colonies for each plasmid were inoculated into
2 test tubes per plasmid, each containing 5 mL
LB Ap100 with a fi nal concentration of ~20
mM of glucose added and incubated rolling
overnight at 37 °C.
Protein Induction and Lysate Preparation
One half milliliter of the overnight culture
was cryopreserved with an equal volume of
cryo solution and mixed thoroughly, and
placed in -80 °C freezer to be used to inoculate
a larger scale prep for future use if the strain
ended up working. Th e remaining overnight
culture was inoculated into 50 mL LB Ap100
in a 125 mL Erlenmeyer fl ask and grown at
37 °C on a shaker until the optical density
(OD) at 600 nm was ~0.6 on the spectrometer.
One thousand microliters of the uninduced
culture was removed and put into a 1.5 mL
microfuge tube, centrifuged for 2 minutes
at max speed (17.0 x g), and all media was
removed (dumped out, re-centrifuged for 20
seconds at same speed, then removed the
rest of the LB with a pipette). Th e remaining
pellet of cells, which serves as the uninduced

MURJ - VOLUME 324
control at time zero (T0) was frozen at -80 °C
to be later run on a sodium dodecyl sulfate
polyacrylamide gel electrophoresis (SDS-
PAGE) protein gel. Th e rest of the overnight
culture fl ask was induced by adding isopropyl-
ß-D-thiogalactopyranoside (IPTG) to a fi nal
concentration of 0.4 mM (200 μL of 100 mM
stock per 50 mL culture) and transferred to
a room temperature water bath shaker at
23 °C with heat off . Six hundred microliters
of culture was removed after 5 hours of
induction (T5), and the pellet was frozen at
-80 °C for later gel analysis along with the
T0 culture.
Th e remaining 50 mL T5 induced culture was
centrifuged at 12,000 x g at room temperature
in a falcon tube for 15 minutes. Th e
supernatant was completely removed and the
remaining pellet was frozen at -80 °C for later
use after confi rmation that the T5 lysates
do contain the induced protein of interest in
soluble form.
SDS-PAGE
Ice cold Tris-buff ered saline (TBS) was added
to each E. coli pellet; 150 μL to T0 and 300 μL
to T5. Th e pellets were sonicated on ice with
a micro-tip probe (~1/8 inch diameter tip) for
10 cycles each with rest on ice in between, 30
seconds per cycle at 6% amp for T0 and 12%
amp for T5. Fifteen microliter samples of
lysed cells for T0 and T5 were each removed
and mixed with 5 μL of 4X SDS-PAGE loading
buff er (TOTAL). Th e remaining lysed cells
were centrifuged at max speed (17.0 x g)
in a refrigerated microcentrifuge at 4 °C
for 15 minutes. Fifteen microliters of the
supernatant containing the soluble proteins
(SOLUBLE) from T0 and T5 were mixed with
5 μL 4X SDS-PAGE loading buff er. Th e TOTAL
and SOLUBLE samples were heated at 95 °C
for 5 minutes and immediately placed on ice.
Twenty microliters of each sample and 5 μL
of PageRuler Unstained Broad Range (BR)
protein ladder were loaded into the wells of a
12% SDS-PAGE gel and run for ~45 minutes
at 200 volts in 1X SDS-PAGE running buff er.
Th e gel was rinsed with deionized water for 15
minutes to completely remove the remaining
4X SDS dye. Th e gel was stained with GelCode
Blue Safe Protein Stain (Pierce) for 1 hour and
destained for ~15 minutes as described by
the manufacturer.
Lysate Preparation after SDS-PAGE Induction Confi rmation
Each of the T0 and T5 pellets in the 50 mL
falcon tubes from -80 °C were suspended in
10 ml of ice cold TGEM (0.1) (20 mM Tris-
HCl pH 7.8, 20% Glycerol, 1 mM EDTA, 5 mM
MgCl2, 0.1 M NaCl), 100 μL of HALT protease
inhibitor (Th ermo Scientifi c), 100 μL of 0.1 M
dithiothreitol (DTT), and 10mg of lysozyme,
and the cells were resuspended by vortexing.
Cells were lysed twice by refrigerated French
press, each at 16,000 psi. Fifteen microliters
of TOTAL was taken and mixed with 5 μL of
4X SDS loading buff er. Th e remaining lysed
cells were centrifuged at 12,000 x g at 4 °C for
15 minutes in the 50 mL falcon tubes. Fifteen
microliters of SOLUBLE was taken and mixed
with 5 μL of 4X SDS loading buff er. Both
TOTAL and SOLUBLE were run on 12% SDS-

LOS ANGELES MISSION COLLEGE 25
PAGE gel as previously described above to
check for induction. Two hundred microliters
of the remaining supernatant containing
the soluble proteins were aliquoted into 20
microfuge tubes and stored in a -80 °C freezer
for future use.
PREPARATION OF HIS-TAGGED PROTEIN LYSATES (Th e Pond)
Th e optimization of soluble protein expression
followed the same protocol used in producing
the GST lysates described above except for the
diff erences indicated below:
Transformation and Protein Induction
CaCl2 competent E. coli DH5-alpha (DH5a)
cells were transformed with pET28a (His-
tagged vector), plated onto LB kanamycin 30
μg/mL (Km30) agar plates and grown at 37 °C
overnight. Th e next day in the late afternoon,
2 single colonies were inoculated into 2 test
tubes, each containing 5 mL LB Km30 with
a fi nal concentration of ~20 mM of glucose
added and incubated rolling overnight at 37
°C. Protein induction was done with the same
procedure as with the GST-tagged protein.
Preparation of Glutathione-Agarose Beads for Pulldown Assay
Forty microliters of 50% slurry solution (50%
ethanol solution and 50% agarose beads with
glutathione attached) containing 10 μL of
agarose beads was pelleted in microfuge tubes
at room temperature for 2 minutes at 800 x
g. Th e liquid was then aspirated with a 25 Ga
needle. Ten times the packed bead volume
of TGEM (0.1) was added, mixed, and the
supernatant aspirated as before to wash the
beads. Th is wash was repeated 3 more times
for a total of 4 washes. Th e washed beads
were suspended in a 25% slurry by adding
3 times the bead volume of TGEM (0.1) and
aliquoted 40 μL of the slurry into separate
reaction tubes which were placed in
the refrigerator.
Normalization of GST-Binding to beads
GST and GST-protein lysates stored at -80 °C
were thawed on ice and microcentrifuged at
max speed (17.0 x g) for 20 minutes and the
clear supernatant was put into pre-chilled
microtubes on ice. Each lysate was diluted
1/10 and 1/100 in TGEM 0.1:
a. 1/10: 5 μL cleared lysate + 45 μL of cold
TGEM 0.1
b. 1/100: 5 μL cleared lysate + 495 μL of cold
TGEM 0.1
Forty microliters each of undiluted lysate,
the 1/10 dilution, and the 1/100 dilution
were added into 40 μL of washed beads (25%
slurry; 10 μL packed beads) and incubated in
the refrigerator on a rolling machine at 5 rpm
for ~2 hours to maximize bead interaction
with lysate. Microfuge tubes were centrifuged
at 800 x g for 2 minutes at 4 °C, and the
supernatant removed. Th e beads were washed
2 times with 130 μL ice cold TGEM (1.0) (20
mM Tris-HCl pH 7.8, 20% Glycerol, 1 mM
EDTA, 5 mM MgCl2, 1.0 M NaCl), and another
2 times with TGEM (0.1), centrifuging and
aspirating between washes as done before.
Washed pelleted beads were mixed with 10 μL
of 4X SDS buff er, heated for 5 minutes at 95
°C, cooled to room temperature, and 20 μL of

MURJ - VOLUME 326
each sample and 5 μL of Unstained BR protein
ladder were loaded into the wells of a 12%
SDS-PAGE gel. Th e gel was run, stained, and
washed as done with the previous gels.
GST Pulldown Assay
Th e GST-only and GST-0876 lysates that were
confi rmed to successfully bind to the agarose
beads were thawed on ice from the -80 °C
freezer and centrifuged in the same manner
as done with the normalization step. Each
lysate was diluted or kept at full concentration
to the amount that was determined to result
in ~500 ng of GST-protein attached to 10 μL
of agarose beads. Forty microliters of the
proper dilution of GST lysate was added to 10
μL of washed packed beads into a total of 8
microtubes with 2 tubes per GST
lysate mixture:
Tube 1 (duplicates): GST-protein fusion lysate
(GST-0876)
Tube 2 (duplicates): GST-only lysate from
pGEX5X-1 without an insert (GST-only)
Tube 3 (duplicates): GST-protein fusion lysate
(GST-0876)
Tube 4 (duplicates): GST-only lysate from
pGEX5X-1 without an insert (GST-only)
Th e microtubes were incubated on a rolling
machine in the refrigerator as done with
the normalization of beads. Th e His-tagged
lysates were prepared while GST lysates were
incubated. Th e His-tagged protein lysates
that had induced soluble protein were thawed
from the -80 °C freezer on ice and centrifuged
as done with the GST lysates to retrieve
cleared His-lysate. Th e GST lysates+beads
were washed and aspirated as done with
normalization. Approximately 150-300 μL
of the cleared His-lysate was added to Tubes
3 and 4 and incubated in refrigerator as done
with the GST lysates:
Tube 1 (duplicates): added nothing;
kept on ice
Tube 2 (duplicates): added nothing;
kept on ice
Tube 3 (duplicates): added cleared His-lysate
Tube 4 (duplicates): added cleared His-lysate
All the tubes were then washed 4X with ice
cold TGEM (0.1). Ten microliters of 4X SDS
loading dye was added to the packed beads
and heated at 95 °C for 5 minutes. Th e
beads were left at room temperature to avoid
clumping together. Th e beads were run on
two 12% SDS-PAGE gels the same way as done
with prior gels. One gel was loaded with 5 μL
of PageRuler Unstained Broad Range protein
ladder and the other gel was loaded with 5 μL
of PageRuler Plus Prestained protein ladder.
Fifteen microliters of each His-tagged cleared
lysate with no beads were loaded onto the gels
as well. One SDS-PAGE gel was stained with
GelCode Blue Safe Protein Stain (Pierce) for
1 hour and destained for ~15 minutes. Th e
second SDS-PAGE gel was western blotted
using GenScript One-Hour Detection System
kits as described by the manufacturer. Th e
One-Hour Western Standard Kit with TMB
(Mouse) L00205T was used for chromogenic
western blot analysis. Th e One-Hour Western
Standard Kit (Mouse) L00205C was used for
chemiluminescent western blot.

LOS ANGELES MISSION COLLEGE 27
ACKNOWLEDGEMENTS
I would like to thank my sponsor Dr. Michael
Summers for allowing me the opportunity to
work in his laboratory. I would also like to
thank all the members of Dr. Summers’ lab
for welcoming me and helping me during the
research process, especially Jenevieve Polin
for taking the time to teach and explain to
me the laboratory procedures and concepts
during my internship. I would like to thank
Dr. Stephen Brown for guiding my fellow
interns and myself during the duration of our
internship with advice and encouragement.
Of course, a special thank you to the STEM
program at Los Angeles Mission College for
allowing this wonderful opportunity to have
been possible. Th ank you all very much.
REFERENCES
GenScript One-Hour Western Detection
System User Manual. (2010). Web.
Hayworth, Douglas. “GST-tagged Proteins-
Production and Purifi cation”. <http://
www.piercenet.com/method/gst-tagged-
proteins>. Web.
Mahmood, Tahrin and Yang, Ping-Chang.
“Western Blot: Technique, Th eory, and
Trouble Shooting”. (2012). Web.
Snider, Jared. “Pull-Down Assays”. <http://
www.piercenet.com/method/pull-down-
assays>. Web.

MURJ - VOLUME 328
Is Th e Survival Of Th e Mediterranean House Gecko In New Environments Caused By Evolution?
Dezerey Escanuelas Sponsored by Dr. Robert Espinoza, Department of Biology
California State University, Northridge
INTRODUCTION
Hemidactylus turcicus is a non-native species
of gecko found in the United States. It
is commonly called the Mediterranean
house gecko because it originates from the
Mediterranean region. Th e fi rst sighting of
the Mediterranean house gecko in the United
States was in the state of Florida in 1915(1).
It is believed that this species was brought
over in ships and is now being transported
throughout the country by traveling with
people(2). Today, the geckos tend to stay
where people are because they use the heat
of outdoor lights at night for warmth and
eat the insects that are drawn to the lights.
Th erefore, they often spread around homes
of people and end up fi nding their way into
objects that people end up taking with them
when they travel to diff erent regions in
the country.
Th e Mediterranean house gecko population
has been spreading quickly throughout the
country for nearly 100 years. Since their fi rst
sightings in Florida in 1915, they have now
been found in places as far west as California.
With the spread reaching across the country,
the geckos have been found living in diverse
environments with diff erent conditions such
as subtropical, Mediterranean, and desert
climates. Th is is signifi cant because normally
a species will only survive in the particular
type of climate they are adapted to. Since
the geckos have been found in such diverse
climate conditions, the question arises as
to how they are surviving. In order for this
species to survive in a new environment,
evolution or adaption will have taken place.
Th is study focuses on whether the
Mediterranean house geckos have evolved
over time through evolution or adapted
quickly into their environments. Evolution
is a process of species adapting over time
through generations. Th is happens when a
species develops genetic traits that help it
survive in a new environment. Adaption is
a process that occurs much faster and only
requires one generation to make changes
in response to their new environments(3).
Adaptation involves physiological changes
to take place in order for the organism to
respond to the changes it is experiencing in
its new environment. By collecting a group
LOS ANGELES MISSION COLLEGE 29
of geckos from diff erent habitats throughout
the country and placing them in equal
environments, it can be determined which
factor played a role in the survival of these
geckos in diff erent regions. Experiments
will be conducted observing each individual
gecko’s abilities in diff erent climate
conditions. Th e experiments involve putting
the geckos into hot and cold temperatures
and observing their activity. Some may have
diff erent abilities in specifi c temperatures
based on the region from where they were
collected. If all the geckos have similar
abilities under certain temperatures, then
they will prove to have a very large capacity to
adapt when it comes to climates. If the geckos
from diff erent regions have diff erent results,
then this will indicate that they have evolved
to fi t their specifi c environment.
RESULTS
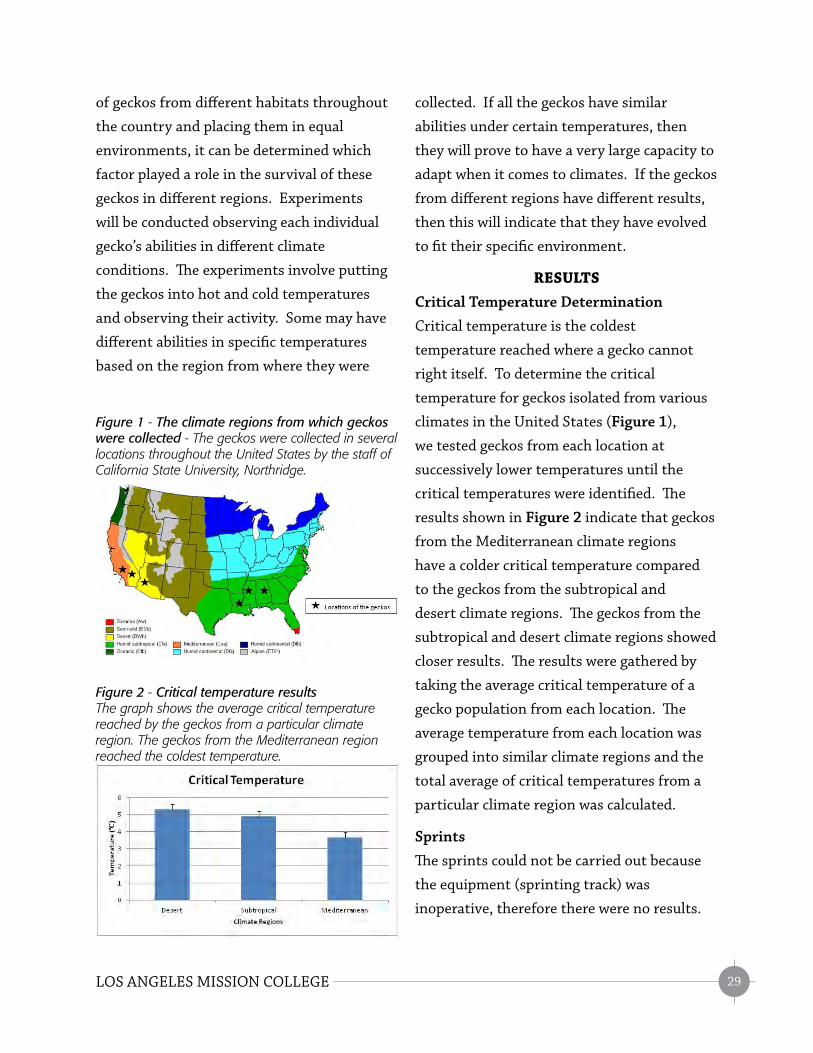
Critical Temperature Determination
Critical temperature is the coldest
temperature reached where a gecko cannot
right itself. To determine the critical
temperature for geckos isolated from various
climates in the United States (Figure 1),
we tested geckos from each location at
successively lower temperatures until the
critical temperatures were identifi ed. Th e
results shown in Figure 2 indicate that geckos
from the Mediterranean climate regions
have a colder critical temperature compared
to the geckos from the subtropical and
desert climate regions. Th e geckos from the
subtropical and desert climate regions showed
closer results. Th e results were gathered by
taking the average critical temperature of a
gecko population from each location. Th e
average temperature from each location was
grouped into similar climate regions and the
total average of critical temperatures from a
particular climate region was calculated.
Sprints
Th e sprints could not be carried out because
the equipment (sprinting track) was
inoperative, therefore there were no results.
Figure 1 - The climate regions from which geckos were collected - The geckos were collected in several locations throughout the United States by the staff of California State University, Northridge.
Figure 2 - Critical temperature resultsThe graph shows the average critical temperature reached by the geckos from a particular climate region. The geckos from the Mediterranean region reached the coldest temperature.

MURJ - VOLUME 330
will be weighed for evaporative water loss.
It is predicted that geckos that live in hotter
regions will retain more water in their bodies
after exposure to higher temperatures than
geckos from colder regions.
MATERIALS AND METHODS
Geckos
Several Mediterranean House geckos were
collected from diff erent regions in the United
States such as the states Arizona, Alabama
California, Louisiana, and Missouri. Th ey
were kept in the same living conditions for
several weeks to ensure that the results of the
geckos’ abilities will be based on the response
to the same environment. Th is will determine
DISCUSSION
To determine whether evolution or adaption
took place, additional tests will need to be
done on specimens from diff erent locations
throughout the United States. Th e tests
on critical temperature will still continue
with more gecko specimens collected from
new locations in the same climate regions
(Mediterranean, subtropical, and desert).
Th ere are more climate regions in the
United Sates that specimens have not been
tested from. Eventually those specimens
will be observed, which will add data to
report on that will support or disprove the
determination of evolution taking place.
Th ere were no results to report on the
sprinting experiment because the track
the geckos were going to sprint on was
getting repaired throughout the summer.
Based on the results of the geckos’ critical
temperatures, the geckos from the
Mediterranean region are predicted to
perform faster than the geckos from the
subtropical and desert regions when the track
is set to colder temperatures.
Further experiments will also be done in order
to analyze how the geckos respond to hotter
temperatures. Th e amount of water within
the geckos’ bodies will be observed when they
are put into hotter temperatures. Similar to
the other experiments, the geckos will be
grouped by region. In order to ensure the
safety of the gecko and avoid dehydration, at a
certain high temperature the gecko will begin
to pant and that is the point where the gecko
will be fi nished with the test. Th e geckos
Figure 3a - Equal living environment - There were a total of 118 cages in the lab. Each contained 1 gecko.

LOS ANGELES MISSION COLLEGE 31
sitting 1 inch from a metal pan sitting on ice
in a cooling box. Th e ice took up half the box
and was set at approximately 5 ˚C. After every
0.5 ˚C temperature drop in the gecko’s body
temperature, the gecko was fl ipped over on its
back. If the gecko was able to turn over then
the experiment continued, leaving the gecko
in the cooling box until it drops another 0.5
˚C. If the gecko did not fl ip over, then that
temperature is recorded as its
critical temperature.
whether genetic or physiological changes took
place, as seen in Figure 3a. Th erefore, each
gecko was placed in the same size cage and
given the same substrate, water bowl, and
shelter in a pot, as seen in Figure 3b. Th ey
were all fed the same amount of crickets, had
their cages moistened with water every other
day, and had a heat pad placed under
their cages.
Critical Temperature Determination
Th e goal was to fi nd the coldest temperature
that will cause the gecko to be unable to right
itself (cannot fl ip over after being turned on
its back) which was considered its critical
temperature. Th e experiments did not go
below that temperature because the gecko
could reach its lethal temperature. Th e geckos
were put into a refrigerator that had the
temperature set to a cold temperature, which
was 10˚C, to ensure that all the geckos are
set at the same body temperature. Th ey were
left at this temperature for 30 minutes. Th e
geckos were then placed onto a metal mesh
Figure 3b - Equal living conditions - All the geckos received the same set up in their cages. Each cage was labeled with the location it came from.
Figure 4 - 10 ˚C Body temperature - The geckos were put into mesh bags for ventilation and to prevent them from running out of the refrigerator and getting lost.
Figure 5 - Cooling box - The geckos had a band placed around their waist connected to the thermometer to determine its body temperature. The mesh was also monitored and indicated the cooling box temperature. A barrier was needed to keep the gecko from running out and into the ice inside the box.

MURJ - VOLUME 332
Sprints
Th e goal was to compare the performance
of two geckos at certain temperatures. Two
geckos from diff erent regions were put onto
a track and they had to sprint across. Th e
track had several lasers at certain distances
that calculated the time the gecko passed
that mark on the track. Th ese numbers were
used to calculate how fast the gecko ran using
the time and distance at that mark. Th is
was conducted at night because that is when
geckos are most active. Th e experiment was
conducted with the track set at hot and cold
temperatures, which was done by changing
the temperature of the water running at the
bottom of the track.
Figure 6 - Righting themselves - When the gecko was turned over, a brush was used to tickle the gecko to create a response and coax the gecko to fl ip itself over and right itself. When they remained lying on their back and only moved their arms and fi ngers, the test was done.
ACKNOWLEDGEMENTS
I would like to thank my sponsor Dr. Robert
Espinoza for allowing me to work in his lab
and teaching me so much about herpetology.
It was defi nitely a memorable experience
and I learned so much from everyone I
met in the lab. I would also like to thank
Matthew Dickson for teaching me about the
experiments and allowing me to take part
in his research. I want to give thanks to Dr.
Stephen Brown for mentoring us and giving
advice on how to write our papers. I especially
want to give thanks to Dr. Mike Fenton
and the STEM program for providing the
opportunity to experience what it feels like to
work in a research lab.
REFERENCES
1. “Nonnatives - Mediterranean Gecko.”
Florida Fish and Wildlife Conservation
Commission. N.p., n.d. Web.
2. Gorin, Jerry. “Natural History Museum
Enlists Local Citizens to Discover New
Species.” Southern California Public Radio. N.p.,
n.d. Web.
3. Miguel. “Diff erence Between Adaptation
and Evolution.” Diff erence Between. N.p.,
n.d. Web.
4. Map Source for Figure 1: (http://
holapicasso.pbworks.com/w/page/18713750/
4%20Th e%20climates%20in%20the%20USA)

LOS ANGELES MISSION COLLEGE 33
ZOG1 Gene Eff ects On Arabidopsis Cell Size
Vanessa Garcia Sponsored by Dr. Maria Elena Zavala, Department of Biology
California State University, Northridge
INTRODUCTION
Plants have long been used by researchers to
study diff erent genes, and the eff ects those
genes have on the development of the plant.
Scientists use model organisms, organisms
that have been extensively studied, to make
new discoveries about other organisms.
Arabidopsis thaliana is a small fl owering plant
that is widely used as a model organism
in plant biology because it has a rapid life
cycle, produces many seeds and is easy to
cultivate1. Arabidopsis was also the fi rst plant
to have its entire genome sequenced. Th is
has allowed researchers to manipulate the
genes in the plant and study the changes in
morphology on a molecular level. Cytokinins
are a class of plant growth substances that
promote cell division and diff erentiation, in
plant roots and shoots. ZOG1 is a type of
cytokinin that is naturally produced in the
plant. To study the ZOG1 gene in Arabidopsis,
we created transgenic Arabidopsis plants that
expressed wild-type ZOG1 at higher levels.
Th e plant was then grown for 4 weeks. Th e
roots were collected and stained so they
could be examined and photographed under
a fl uorescence microscope. Measurements
of cells from the endodermis, cortex, and
epidermis were taken starting at every
100 μm from the tip of the root. In this
experiment, four cell lines were studied: C24
- the wild type of Arabidopsis, J571 - the wild
type with GFP (a marker protein that glows
green under fl uorescence light), J571+1 -
containing higher levels of ZOG1, GFP, and
YFP (a marker protein that glows yellow under
fl uorescence light), and J571+2 - containing
higher levels of ZOG1 and GFP with no YFP.
Th e area of cells from the endodermis, cortex,
and epidermis will be calculated to determine
the eff ects of higher levels of ZOG1 on the
plant. Cell size is expected to increase in
transgenic plants with higher levels of ZOG1.
RESULTS
In Figure 1, you can see pictures of the root
tip for each transgenic line. Figure 1A shows
C24, the wild type, and how the cells normally
look for Arabidopsis. Figure 1B shows J571,
which is essentially the wild type also, but
with added GFP. GFP does not aff ect cell size,
so the cells look very similar to C24. Figure
1C shows J571+1, containing the ZOG1
gene. Here, you can see that the cells look

MURJ - VOLUME 334
diff erent from the wild type. Th ey are longer in all 3 layers of cells. Figure 1D shows J571+2,
also containing the ZOG1 gene. J571+2 also looks diff erent than the wild type. J571+2 looks
more similar to J571+1, which is good because it indicates that the ZOG1 transgene is having
an eff ect in the plant. Th ese preliminary results show that the ZOG1 transgene is aff ecting the
root cell morphology of the plant.
Figure 1 - Images of the root tips for each of the following transgenic lines taken at 400X.A - C24, B - J571, C - J571+1, D - J571+2
A B
C D

LOS ANGELES MISSION COLLEGE 35
DISCUSSION
To determine how much of an eff ect
overexpression of the ZOG1 gene has on
Arabidopsis plants, the area of a cell from each
cell layer at every 100 microns needs to be
calculated. Th e area is calculated by taking
the length and multiplying it by the width
of the cell. In order to have a good average,
a minimum of 6 measurements needs to be
taken for every 100 microns. Once an average
is obtained, a graph will be made with the
averages for all transgenic lines. Th e graph
will be able to show if the ZOG1 transgene
had a signifi cant or minor eff ect on the plant.
MATERIALS AND METHODS
Growth of Plant Roots
Seeds of each cell line were sterilized by
adding a few seeds from each cell line into
microcentrifuge tubes. One milliliter of 95%
ethanol was added to the seeds and left for 5
minutes. Th e ethanol was drained and rinsed
out with 1.0 mL of deionized water which
was discarded. Four milliliters of 1:3 bleach
with 5 μL of Tween was mixed. One milliliter
of the bleach/Tween solution was added to
the seeds and left for 5 minutes and then
removed. Seeds were then rinsed with 1.0 mL
of deionized water 4 times. Seeds were then
planted in a 1% agarose gel plate and stored
in a 4 degree Celsius refrigerator for 4-7 days.
Plates were then transferred to a growth
chamber and subjected to 8 hours of light
and 16 hours of darkness per day. Roots were
allowed to grow for 4 weeks.
Staining Roots
Roots were stained with a staining solution
made with 9.9 mL of deionized water and
100 μL of stock 1.0 mg/mL propidium iodide.
Two and one half milliliters of the solution
was added to small dishes. Th ree to four
roots were placed in the staining solution
and left for 15 minutes. Two to three roots
were placed on a slide and examined under a
fl uorescence microscope.
Measurements
Th e photographs of the roots were measured
using the computer software ImageJ.
Measurements of the 3 layers of cells were
taken starting at 100 μm from the root tip
and at every 100 μm until 1000 μm.
Photographs
Photographs were taken using a fl uorescence
microscope at 400X. Five pictures were taken
of the root starting at the tip and going up
along the root. Pictures were taken of the
endodermis (innermost cell layer), cortex
(middle cell layer), and epidermal (outermost
cell layer) layers of cells.
ACKNOWLEDGMENTS
Special thanks to Dr. Maria Elena Zavala,
Sokuntheavy So, Dr. Stephen Brown and the
STEM Department at LAMC.
REFERENCES
1. “About Arabidopsis.” Th e Arabidopsis
Information Resource. 2014. Online.

MURJ - VOLUME 336
Neurofi bromatosis Type 1: Th e Race To Treating Optic Gliomas
Amy Heman Sponsored by Dr. Aida Metzenberg, Department of Biology
California State University, Northridge
INTRODUCTION
Neurofi bromatosis Type 1 (NF1) was fi rst
discovered in 1882 by Friedrich Daniel
von Recklinghausen. NF1 is an autosomal
dominant trait that is passed from parent
to child. An infl icted individual is born with
one mutated copy of the NF1 gene which is
located on chromosome 17. NF1 can also
be present with no family history of the
disorder when there is a new mutation in the
NF1 gene[1]. Mutation of this gene results in
various conditions and no one with the same
exact mutation will have the same symptoms.
NF1 causes changes in skin pigmentation
which are known as café au lait spots, and
growth of tumors along nerves in the skin,
brain, and other parts of the body[2]. Th e NF1
gene codes for the protein neurofi bromin
which helps regulate the activity of the RAS
protein that is responsible for promoting cell
division[3]. When the NF1 gene is mutated
the RAS protein is no longer able to bind to
the mutated neurofi bromin and its activity
goes unregulated. With the RAS protein
unregulated, cells divide uncontrollably
resulting in tumor development. Th is
uncontrolled division leads to the formation
of tumors that can be malignant or benign.
Approximately one in every 3,000 individuals
are aff ected with Neurofi bromatosis Type
1[3]. Although NF1 causes changes in skin
pigmentation and growth of tumors along
nerves in the skin, brain, and other parts
of the body, our research will focus only on
tumors forming on the optic nerve. Th ese
tumors are called optic gliomas and can lead
to reduced vision or total vision loss. Th is
research will continue prior work which
includes the insertion of the pEPito vector,
which is a non-viral mammalian plasmid
vector into the NF1-GRD domain. Th e NF1-
GRD domain was specifi cally targeted in our
research because this region of the gene is
where most mutations occur and where the
protein neurofi bromin normally enhances the
de-phosphorylation of GTP-RAS using
neurofi bromin’s GTPase activating protein
(GAP) domain. Th e de-phosphorylation of
GTP-RAS turns into GDP-RAS which helps
control and shut off cell division. Our goal
was to amplify the amount of NF1-GRD
construct through transformation. Once
completed, we then can proceed to the
insertion of the lactoferrin gene, which will
allow the construct to cross the blood-brain
barrier. Th e lactoferrin gene has already been
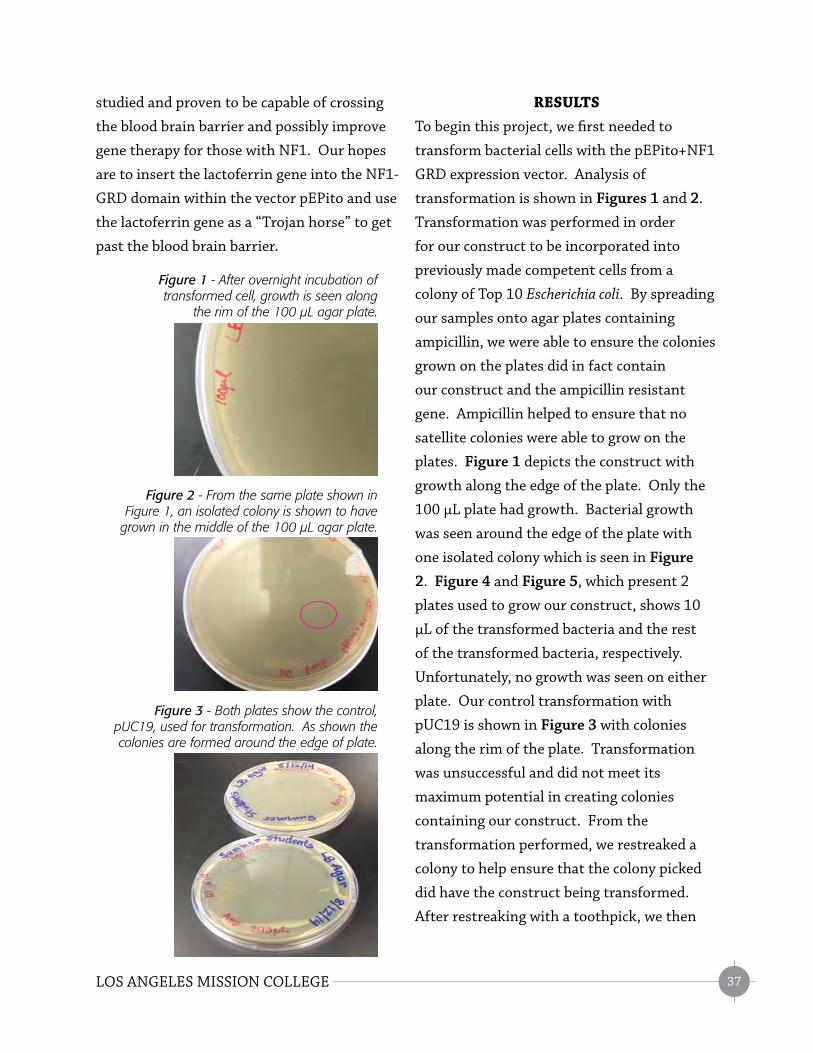
LOS ANGELES MISSION COLLEGE 37
RESULTS
To begin this project, we fi rst needed to
transform bacterial cells with the pEPito+NF1
GRD expression vector. Analysis of
transformation is shown in Figures 1 and 2.
Transformation was performed in order
for our construct to be incorporated into
previously made competent cells from a
colony of Top 10 Escherichia coli. By spreading
our samples onto agar plates containing
ampicillin, we were able to ensure the colonies
grown on the plates did in fact contain
our construct and the ampicillin resistant
gene. Ampicillin helped to ensure that no
satellite colonies were able to grow on the
plates. Figure 1 depicts the construct with
growth along the edge of the plate. Only the
100 μL plate had growth. Bacterial growth
was seen around the edge of the plate with
one isolated colony which is seen in Figure
2. Figure 4 and Figure 5, which present 2
plates used to grow our construct, shows 10
μL of the transformed bacteria and the rest
of the transformed bacteria, respectively.
Unfortunately, no growth was seen on either
plate. Our control transformation with
pUC19 is shown in Figure 3 with colonies
along the rim of the plate. Transformation
was unsuccessful and did not meet its
maximum potential in creating colonies
containing our construct. From the
transformation performed, we restreaked a
colony to help ensure that the colony picked
did have the construct being transformed.
After restreaking with a toothpick, we then
studied and proven to be capable of crossing
the blood brain barrier and possibly improve
gene therapy for those with NF1. Our hopes
are to insert the lactoferrin gene into the NF1-
GRD domain within the vector pEPito and use
the lactoferrin gene as a “Trojan horse” to get
past the blood brain barrier.
Figure 1 - After overnight incubation of transformed cell, growth is seen along
the rim of the 100 µL agar plate.
Figure 2 - From the same plate shown in Figure 1, an isolated colony is shown to have
grown in the middle of the 100 µL agar plate.
Figure 3 - Both plates show the control, pUC19, used for transformation. As shown the colonies are formed around the edge of plate.

MURJ - VOLUME 338
inoculated the colony by placing the toothpick
in 5 mL of LB containing 50 μg/mL ampicillin.
Th e restreak containing the pEPito+NF1 GRD
construct is shown in Figure 6 was successful.
Many colonies of our construct are shown on
the plate in a zig zag pattern. Restreaking
confi rmed that the colony growing on
the LB agar plate during transformation
contained the construct as the colony grew
and contained the ampicillin resistant gene
needed to thrive. Th is colony was used for a
plasmid miniprep.
After performing a plasmid miniprep from
a colony containing the pEPito+NF1 GRD
construct, we were then able to nanodrop
our samples to determine their DNA
concentrations. By nanodropping our samples
on the Th ermo Scientifi c NanoDrop 2000
which used pedestal measurements, we were
able to conserve our sample and only use 2
μL of sample to determine its concentration.
Pedestal measurements allowed for delivery
of our sample on the eye of the machine that
only required a couple of microliters. Other
techniques such as using a cuvette would
have caused more of our sample to be lost in
the process during these readings. Nanodrop
readings were consistently close to 135.9
ngμl as shown in Figure 7. Th e purity of the
DNA samples was revealed by a A260
/A280
ratio
between 1.80 and 1.90. Th e A260
/A280
reading
was 1.84 signifying that the sample attained
from the miniprep was pure and at a high
concentration that could be used for
further testing.
Figure 4 (above) & Figure 5 (below) - Both plates contained the construct pEPIto+NF1, however as shown no colonies were grown after overnight incubation on the designated 10 µL and rest plates.
Figure 6 - Restreaking of a colony obtained by transformation was done on an agar plate containing Ampicillin.
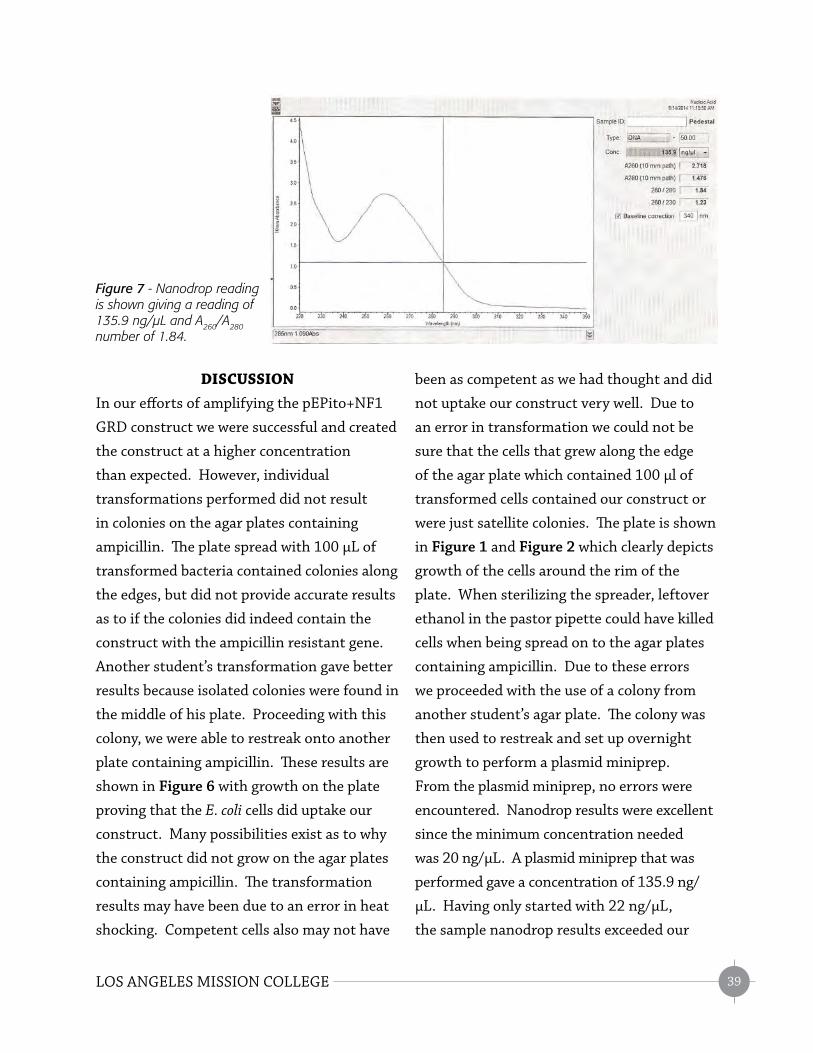
LOS ANGELES MISSION COLLEGE 39
DISCUSSION
In our eff orts of amplifying the pEPito+NF1
GRD construct we were successful and created
the construct at a higher concentration
than expected. However, individual
transformations performed did not result
in colonies on the agar plates containing
ampicillin. Th e plate spread with 100 μL of
transformed bacteria contained colonies along
the edges, but did not provide accurate results
as to if the colonies did indeed contain the
construct with the ampicillin resistant gene.
Another student’s transformation gave better
results because isolated colonies were found in
the middle of his plate. Proceeding with this
colony, we were able to restreak onto another
plate containing ampicillin. Th ese results are
shown in Figure 6 with growth on the plate
proving that the E. coli cells did uptake our
construct. Many possibilities exist as to why
the construct did not grow on the agar plates
containing ampicillin. Th e transformation
results may have been due to an error in heat
shocking. Competent cells also may not have
been as competent as we had thought and did
not uptake our construct very well. Due to
an error in transformation we could not be
sure that the cells that grew along the edge
of the agar plate which contained 100 μl of
transformed cells contained our construct or
were just satellite colonies. Th e plate is shown
in Figure 1 and Figure 2 which clearly depicts
growth of the cells around the rim of the
plate. When sterilizing the spreader, leftover
ethanol in the pastor pipette could have killed
cells when being spread on to the agar plates
containing ampicillin. Due to these errors
we proceeded with the use of a colony from
another student’s agar plate. Th e colony was
then used to restreak and set up overnight
growth to perform a plasmid miniprep.
From the plasmid miniprep, no errors were
encountered. Nanodrop results were excellent
since the minimum concentration needed
was 20 ng/μL. A plasmid miniprep that was
performed gave a concentration of 135.9 ng/
μL. Having only started with 22 ng/μL,
the sample nanodrop results exceeded our
Figure 7 - Nanodrop reading is shown giving a reading of 135.9 ng/µL and A260/A280 number of 1.84.

MURJ - VOLUME 340
expectations. Th e A260
/A280
signifi es how
pure the DNA we retrieved was. Th is number
typically needs to be between 1.80 and 1.90.
Th e sample used from the mini prep gave a
A260
/A280
reading of 1.84 signifying that the
DNA was pure. If this ratio was lower than
1.80 it would have indicated that there were
contaminants such as the presence of protein,
phenol or other contaminants that absorb
strongly at or near 280 nm. Th e A260
/A230
reading was 1.23, however this number should
have been between 2.0 and 2.2. A low reading
indicated that there may be a presence of
contaminants which absorb at 230 nm[4].
Th is research was conducted over the course
of 11 weeks. While working on this project
many challenges were encountered, especially
when trying to create competent cells which
were important in helping the cells uptake
the pEPito+NF1 GRD construct. At the end
of the 11 weeks we were able to successfully
perform transformations and retrieve the
construct back through minipreps at a higher
concentration than before. Research for NF1
needs to be continued as the lactoferrin gene
still needs to be inserted in order for the
vector to get passed the blood brain barrier.
Future researchers will be able to use our
research in performing this task and move
forward to culture and tissue experiments
with zebrafi sh. Th e use of zebrafi sh will help
track how the vector is incorporating itself
within the organism. Th e vector will now be
within the brain and capable of helping to
treat optic gliomas caused by NF1.
MATERIALS AND METHODS
Competent Cells
A colony of Top 10 Escherichia coli was
transferred to 5 mL of Luria Broth (LB) and
incubated in a shaker at 37 degrees Celsius
and 250 rpm overnight. One milliliter of
overnight growth was transferred to an
Erlenmeyer fl ask containing 50 mL of fresh
LB and placed in the shaker at 250 rpm and
37 degrees Celsius, checking for absorbance
at 600 nm with a spectrophotometer
approximately every 2 hours. Once the
absorbance (A600
) reached 0.6 to 0.7 the cells
were centrifuged at 5,098 x g at 4 degrees
Celsius for 10 minutes. Th e supernatant was
poured off and the pellet resuspended in cold
0.1 M CaCl2 keeping the cells on ice for 15
minutes. Th e cells were then centrifuged at
5,098 x g for 10 minutes at 4 degrees Celsius.
Th e supernatant was poured off and the pellet
was then resuspended in 1 mL 0.1 M CaCl2.
Competent cells were stored in 15% glycerol.
Four hundred fi fty microliters of 50% glycerol
was diluted by adding 50 microliters of diH2O
to 1 mL 0.1 CaCl2 to get a fi nal concentration
of 15% percent glycerol. Competent cells
were stored in 15% glycerol in aliquots of 200
microliters at -70 degrees Celsius until needed
for transformation.
Transformation
Two microliters of plasmid DNA was placed
on the side of a tube and washed down with
100 μL of competent cells (see above). Th e
cells were then placed on ice for 30 minutes
and heat shocked for 45 seconds at 42 degrees
Celsius. Nine hundred microliters of room

LOS ANGELES MISSION COLLEGE 41
temperature SOC medium (0.5% yeast extract,
2% Tryptone, 10 mM NaCl, 2.5 mM KCl,
10 mM MgCl2, 10 mM MgSO
4, diH
2O, 1 M
glucose stored in 4 degrees Celsius) was added
to both the control, pUC19 and our construct.
Th e tubes were placed in the shaker at 37
degrees Celsius for 45 minutes at 225 rpm.
On LB agar plates previously made, used
sterile metal spreader to spread 25 microliters
of ampicillin (0.05 g/mL) to 6 plates.
Ampicillin was allowed to diff use into the
plates for 10 minutes. After the transformed
cells were fi nished shaking for 45 minutes,
various volumes were spread on plates and
incubated at 37 degrees Celsius overnight.
Plasmid Minipreps
Colonies were inoculated into 5 mL of LB
and 5 μL of ampicillin. Tubes were then
incubated in a shaker at 37 degrees Celsius
and 225 rpm overnight. One and one half
milliliters of each overnight culture was
transferred to a microcentrifuge tube and
spun for 10 seconds at 20,800 x g. One
hundred microliters of supernatant was left
with the pellet and vortexed to resuspend
the cells. Th ree hundred microliters of TENS
Buff er (1 mM EDTA pH 8.0, 0.1 M NaOH,
0.5% SDS, 10 mM Tris-HCl pH 8.0) and 150
microliters of 3 M Na Acetate were added
and the cells were mixed by vortexing. Each
sample was centrifuged for 4 minutes at
20,800 x g at room temperature, and 450
microliters of supernatant was transferred to
a new microcentrifuge tube. Samples were
mixed with 0.9 mL cold 95% ethanol which
was stored at -20 degrees Celsius until needed.
Th e samples were centrifuged for 2 minutes
at 20,800 x g at room temperature to pellet
plasmid DNA. Th e supernatant was discarded
and the pellet washed twice with room
temperature 70% ethanol. Th e pellet was then
air dried and resuspended in 200 microliters
of TE (10 mM Tris-HCl pH 8.0, 1 mM EDTA).
DNA concentrations were determined by
Nanodrop. Samples were ultimately stored at
-20 degrees Celsius for future use.
ACKNOWLEDGEMENTS
I cannot express enough thanks to Dr.
Aida Metzenberg who was the principal
investigator. Without her continued support
and mentoring, this research would not have
been possible. She opened her heart to us and
with her guidance we were able to develop the
necessary skills needed to work in a genetic
laboratory setting.
A special thanks to Anamica Sood who day
in and day out allowed us to grow in the lab.
As we learned basic laboratory techniques
her passion for research was clearly shown.
Without her hard work this research would
not have been as successful as it was.
I would especially like to thank Andrea Cosco
whose three years of hard work towards his
master’s degree provided valuable research
in helping treat NF1. His creation of the
construct, pEPito+NF1 GRD, made this entire
research possible and I am grateful he allowed
us to continue his research.
MURJ - VOLUME 342
I wish to thank my fellow interns, Cindy
Barrios, Dylan Martin, and Sahil Khullar.
Over the course of our research, we shared
the same yearning for our experiments to
work. Th rough the ups and downs, we were
fi nally successful. Th anks for making this
experience memorable.
Last, but not least, I would like to thank Dr.
Brown for his continual support and guidance
throughout this internship. Without his
wisdom and mentoring, this research would
not have been as polished and concise as it
was. He was not only someone we could refer
to when in doubt, but he encouraged us to
persevere with our research when results
were stagnant.
REFERENCES
[1] “Neurofi bromatosis Type 1.” Genetics
Home Reference.N.p., n.d. Web. 16 July 2014.
[2] “Diagnosis of NF1.” Th e Children’s
Tumor Foundation Home. N.p., n.d. Web. 15
July 2014.
[3] University of Utah Health Sciences.
Genetis Science Learning Center, n.d. Web. 16
July 2014.
[4] T009 ‐ TECHNICAL BULLETIN NanoDrop
1000 & 800. N.p.: n.p., n.d. Print.

LOS ANGELES MISSION COLLEGE 43
Advancing Research On Neurofi bromatosis Type 1
Sahil Khullar Sponsored by Dr. Aida Metzenberg, Department of Biology
California State University, Northridge
INTRODUCTION
Neurofi bromatosis Type 1 (NF1) is a disorder
that allows for the excessive growth of
benign tumors known as neurofi bromas.
Th ese tumors primarily aff ect the peripheral
nervous system. Th ey are also notable for
their impairment of one’s vision.
Th e gene responsible for this disorder lies
on chromosome 17 of the human genome,
which encodes the protein neurofi bromin,
a tumor suppressor. Neurofi bromin is
responsible for the timely shutting off of
another protein, known respectively as RAS.
RAS acts as a promoter or stimulant of cell
division. Th e disorder arises when the NF1
gene mutates. Th e mutation of the gene
causes the formation of a shortened version
of the neurofi bromin protein which fails to
aptly bind to the RAS protein and shut it off .
Th e failure of neurofi bromin to bind with
RAS means that RAS is no longer controlled;
its activity is limitless. Consequentially, cells
exhibit uncontrolled growth, which causes the
formation of tumors known
as neurofi bromas.
Th e NF1 disorder is an autosomal dominant
disorder that is obtained in two ways. Th e
fi rst is by inheritance. Since NF1 is an
autosomal dominant disorder, only one
copy of the gene suffi ces for the phenotypic
expression of the genetic mutation; a child of
a heterozygote for the mutation has a 50%
chance of inheriting the disorder. Th e second
way of getting the NF1 disorder is by having a
mutation occur during the embryonic stage of
development. NF1 disorder commonly occurs
by mutation due to the rather large size of its
gene. Th e gene’s enormity instills it with a
higher probability for mutation. If a mutation
occurs in this gene within a sperm cell, an
individual produced from this cell will have a
50% chance of passing the disorder to his or
her off spring.
Th e disorder is most commonly physically
characterized by noticeable café-au-lait
spots on the surface of the skin. Th ese
spots are usually of a diff erent pigment
than surrounding skin and get bolder as the
carrier gets older; they are also present at
birth. Symptoms of the disorder range widely:
“high blood pressure, bone defects, scoliosis
(curvature of the spine), learning disabilities,

MURJ - VOLUME 344
lisch nodules (benign growths on the iris of
the eye), and optic gliomas (benign tumors on
the optic nerve that connects the eye to the
brain)” (Learn.Genetics). Unfortunately, no
current cure exists for the disorder.
In an eff ort to fi nd a cure for the disorder,
I am furthering the work done by Andrea
Cosco. Th e construct he made was created
by inserting a normal NF1-GRD domain
within a nonviral mammalian vector, namely
pEPito. Th e GRD domain is the site on the
neurofi bromin gene on chromosome 17
where most mutations are found to occur. It
is believed that by inserting the pEPito plus
NF1-GRD construct into those aff ected by the
NF1 disorder, cells will begin to express the
normal neurofi bromin gene. In theory, this
will reduce the symptoms of the disorder.
Before the construct can be used it must be
amplifi ed, hence the goal of this research.
Th e goal of producing a larger volume of the
construct is to have a larger, more signifi cant
volume available for future experimentation.
Without larger available amounts of the
construct, further research regarding this
form of gene therapy is impossible.
Th e amplifi cation will be done by creating
competent cells, transforming them, and
performing a miniprep. First, we will be
performing a transformation of the construct
into competent Escherichia coli cells. We will
then extract the copies of the construct found
in each E. coli cell by performing a
miniprep protocol.
RESULTS
Competent E. coli bacterial cells were
produced for the purpose of transforming
them with the pEPito-NF1-GRD construct.
Th e 200 microliter aliquots of competent
E. coli cells produced are shown in Figure 1.
Cells are stored in smaller quantities in
multiple aliquots due to their fragility.
Competent cells degrade the longer they are
left out of the -70 degrees Celsius freezer.
Two control plates were set up and run
alongside the sample plates. Two hundred
microliters of competent cells were pipetted
into each plate. Figure 2 indicates a
successful growth of transformed cells in the
control plates.
Figure 1 - 200 microliter aliquots of competent cells used for transformation.
Figure 2 - Control transformations Control plate: 25.0 mL LB Agar, Ampicillin (Agar 15.0 g/L, Luria Broth 25.0 g/L, Ampicillin 0.05 g/mL), 2.0 microliters plasmid DNA (10.0 pg/microliter), 100 microliters of Competent Cells. White dots are bacterial colonies containing plasmid DNA. The agar plate on the left contains 200 µL of transform control cells. The plate on the right contains the remaining amount of transformed control cells.

LOS ANGELES MISSION COLLEGE 45
Figure 3 shows that the E. coli did accept the
pEPito plus NF1-GRD construct in plates A, B,
and C. Plate C contains numerous compacted
colonies, not ideal for plasmid preparation or
plate spreading. Th e placement of ampicillin
on the sample plates further strengthens the
presumption that colonies found on the plate
are in fact those containing the construct
since the inserted construct contains a gene
conferring resistance to ampicillin. Due to
our belief that the colony observed is in fact
that of a transformed E. coli cell, we picked a
colony from plate B and streaked it onto a new
plate. Multiple other colonies were picked for
plasmid miniprep.
Results from the plasmid minipreps indicate
the successful transformation of E. coli cells.
Plasmid minipreps were performed twice;
hence, two microcentrifuge tubes containing
initial volumes of 1.5 mL of incubated culture
were tested. A DNA concentration above 20
ng/mL is considered a positive result.
Figure 4/Table 1 and Figure 5/Table 2
respectively, indicate the observed
concentration of amplifi ed plasmid in each
microcentrifuge tube.
Figure 3 - Transformations with pEPito+NF1-GRD. Sample plate: 25.0 mL LB Agar, Ampicillin (Agar 15.0 g/L, Luria Broth 25.0 g/L, Ampicillin 0.05 g/mL), 100 microliters of competent bacterial cells were transformed with 1.0 microliter of pEPito+NF1-GRD, (22 pg/microliter). A: 10 microliters of transformed cells. B: 100 microliters of transformed cells. C: Remaining amount of transformed cells.
A B C

MURJ - VOLUME 346
Figure 4 - Nanodrop reading of Tube 1. Results from Nanodrop machine indicating concentration of cloned pEPito+NF1-GRD construct. Average Plasmid Concentration: 24.05 ng/microliterAverage 260/280 Reading: 1.85
Nanodrop Reading Number Plasmid Concentration (ng/microliter)
260/280 Reading
1st Reading 22.40 1.81
2nd Reading 25.70 1.88
3rd Reading 20.90 1.85
Average Reading 24.05 1.85
Table 1 - Nanodrop Measurements of the concentration of pEPito+NF1-GRD construct duplicated in Tube 1

LOS ANGELES MISSION COLLEGE 47
Figure 5 - Nanodrop reading of Tube 2. Results from Nanodrop machine indicating concentration of cloned pEPito+NF1-GRD construct. Average Plasmid Concentration: 69.80 ng/microliter Average 260/280 Reading: 1.90

MURJ - VOLUME 348
Figure 6 shows streaks of bacterial colonies
on LB agar plates containing ampicillin. Plate
A is the fi rst streak, plate B is a restreak of a
colony on A. Th e presence of ampicillin in the
restreaked plates is designed to ensure that
the plasmid was successfully transformed into
the E. coli strain.
Neurofi bromatosis type 1 aff ects 1 in every
3,000 people. In an attempt to utilize gene
therapy as a potential for treatment, our
research plays a crucial role in pushing the
future goal in the right direction. Since
a small volume of the construct would be
insuffi cient to perform any further research,
our amplifi cation of the pEPito-NF1-GRD
plasmid is an essential step toward attaining a
cure of neurofi bromatosis.
We were able to attain positive results with
respect to plasmid amplifi cation in our
research. By successfully producing a greater
amount of the construct, further research
in fi eld of gene therapy for the disorder is
now possible. As shown in the results, two
tubes with concentrations of 69.80 ng/mL
and 24.05 ng/mL were produced as per the
nanodrop readings respectively.
Figure 6 - Restreaking bacterial colonies. A bacterial colony was picked and then streaked on a new LB agar plate with ampicillin. After incubating plate A overnight, a colony from plate A was picked and streaked on plate B which also contained ampicillin.
Nanodrop Reading Number Plasmid Concentration (ng/microliter)
260/280 Reading
1st Reading 70.40 1.91
2nd Reading 65.20 1.91
3rd Reading 69.20 1.89
Average Reading 69.80 1.90
Table 2 - Nanodrop Measurements of the concentration of pEPito+NF1-GRD construct duplicated in Tube 2
A
B

LOS ANGELES MISSION COLLEGE 49
DISCUSSION
Despite obtaining conclusive results, there
were potential sources of error in the research.
Although it is likely that the transformed
and then extracted plasmid is believed to be
the construct, there is still a possibility that
it could be a diff erent amplifi ed plasmid.
Moreover, although ampicillin was used in the
plates, it could have been degraded and hence
did not weed out satellite bacterial colonies.
Th e fact that the picked colonies successfully
grew on new plates indicates that they are in
fact colonies of E. coli cells that accepted the
construct. However, a source of error could be
found in an earlier step. When colonies were
initially grown on the fi rst set of Agar plates,
ampicillin was not spread on the edges of the
plate. Hence, any colonies found on the edge
of the plate may or may not be colonies of the
desired bacteria depending on the manner in
which the ampicillin diff used into the
agar plates.
In the fi rst step of creating competent
cells, cells were shaken until they reached
an absorbance of 0.6 to 0.7, making them
competent. Competent cells were eventually
transformed with the construct. By running
a control of plasmid DNA alongside our
construct, we verifi ed the validity of our
results. Seeing that our technique did yield
colonies for the control, we were confi dent
that a bacterial colony formed on sample
plates was representative of a successful
transformation. Th e last step of carrying out
plasmid minipreps confi rms that we were able
to successfully transform bacteria with the
construct and eventually extract amplifi ed
copies of the construct from the E. coli cells.
With respect to use of the construct in
humans, we understand that although the
construct is currently unable to pass the blood
brain barrier in humans, by creating a greater
quantity of it through transformation, further
research on how to transport the construct
into the human brain is now possible. Th e
respective concentrations of the two tubes
being over 20 nanograms per microliter
indicates a successful amplifi cation of the
construct that can be used for performing
research on gene therapy.
Th e next step in research is to fi nd a way for
the construct to penetrate the blood brain
barrier in humans in order to reach the optic
chiasm. It is hypothesized that this could
be achieved by attaching a lactotransferrin
protein to the construct. Th is protein
codes for a gene that is permitted beyond
the blood brain barrier. Th e insertion of
this macromolecule may be the key to gene
therapy with this construct.

MURJ - VOLUME 350
MATERIAL AND METHODS
Preparation of Competent Cells
Fifty milliliters of Luria Broth was added to
an inoculated 1mL of E. coli TOP10 overnight
culture and incubated in a shaker at 37
degrees Celsius and 250 rpm for 2 hours. Th e
absorbance of the culture was verifi ed to be
between 0.6 and 0.7 at 600 nm. Th e culture
was then centrifuged at 5,098 x g for 10
minutes at 4 degrees Celsius. Th e supernatant
was discarded and the pellet resuspended in
5 mL of 0.1 M calcium chloride. Th e tube was
placed on ice for 15 minutes and centrifuged
again at 5,098 x g for 10 minutes at 4 degrees
Celsius. Th e supernatant was discarded and
the pellet resuspended in 1 mL of 0.1 M
cold calcium chloride. Four hundred fi fty
microliters of 50% glycerol and 50 microliters
of distilled water were added to the tube.
Finally, using a micropipette set at 200
microliters, the solution was aliquoted into
multiple microcentrifuge tubes.
Transformations
One microliter of plasmid DNA was added
to 100 microliters of competent cells and
placed on ice for 30 minutes. Th e cells were
heat shocked in a 42 degree Celsius water
bath for 45 seconds and placed on ice for 2
minutes. Nine hundred microliters of SOC
Medium (0.5% Yeast Extract, 2% tryptone,
10 mM NaCl, 2.5 mM KCl, 10 mM MgCl2,
10 mM MgSO4, 20 mM Glucose) was added
to each tube which were placed into a shaker
at 37 degrees Celsius and 225 rpm for 45
minutes. Diff erent volumes of the culture (10
microliters, 100 microliters, and the rest of
the solution in the tube) were spread on LB
agar plates with 0.05 mg/mL ampicillin and
incubated overnight at 37 °C.
Plasmid Miniprep
Bacterial colonies were inoculated into 2 ml
of LB with 0.05 mg/mL ampicillin and shaken
overnight at 37 °C and 225 rpm. One and
one half milliliters of overnight culture was
centrifuged at 14,000 rpm (20,800 x g) for 10
seconds at room temperature. After decanting
the supernatant, the pellet was resuspended
in 100 microliters of leftover supernatant
by vortexing. Th ree hundred microliters of
TENS buff er 10 mM Tris-HCl PH 8.0, 1 mM
EDTA, 0.1 M NaOH, 0.5% SDS) was added
to each pellet and then vortexed on high for
5 seconds. One hundred fi fty microliters
of 3 M Na Acetate, pH 5.2 was added and
then vortexed on high for 5 seconds. Th e
samples were centrifuged for 4 minutes at
20,800 x g, forming a pellet of cell debris
and chromosomal DNA. Four hundred fi fty
microliters of the supernatant was transferred
to a new tube and 0.9 mL of precooled to -20
degrees celsius 95% EtOH was added and
mixed with the supernatant. Th e samples
were then centrifuged at 14,000 rpm (20,800
x g) for 2 minutes at room temperature and
the supernatant was discarded. Th e pellets
were washed twice with 500 microliters of
70% EtOH and each pellet resuspended in 200
microliters of TE (10 mM Tris-HCl PH 8.0, 1
mM EDTA PH 8.0).

LOS ANGELES MISSION COLLEGE 51
ACKNOWLEDGEMENTS
I thank Dr. Aida Metzenberg for sponsoring
me and encouraging me to perform research
in the fi eld of genetics. I thank Anamica Sood
for her admirable guidance in the lab. I thank
Dr. Stephen Brown for his generous guidance
along the way. I thank my parents and sisters
for their relentless support. I thank my dear
grandmother, who recently passed away, for
always encouraging me. Without any of you,
none of this would have been possible.
REFERENCES
“Neurofi bromatosis Type 1.” Learn.Genetics.
Genetic Science Learning Center, n.d. Web.
June-July 2014. <http://learn.genetics.utah.
edu/content/disorders/singlegene/nf1/>.
“NF1.” Genetics Home Reference. N.p., n.d.
Web. June-July 2014. <http://ghr.nlm.nih.
gov/condition/neurofi bromatosis-type-1>.

MURJ - VOLUME 352
Progress For Neurofi bromatosis Type 1
Dylan Martin Sponsored by Dr. Aida Metzenberg, Department of Biology
California State University, Northridge
INTRODUCTION
Neurofi bromatosis Type 1 (NF1) is a
dominant autosomal disorder which aff ects
about 1 in 3,000 to 4,000 people worldwide.
It is caused by a mutation in the NF1 gene
located on chromosome 17. In about 50% of
cases, the disorder is inherited by an aff ected
parent. Th e remaining cases result from
new mutations in the NF1 gene and occur
in people with no history of the disorder
in their family. Th e disorder is also highly
variable. Some people may show just a few
signs of NF1, while others have more severe
symptoms. Additionally, it seems to aff ect
both genders and ethnic groups equally
(Szudek et al., 2003). One of the most
common symptoms, which appear between
birth and 2 years of age, is the café-au-lait
spots. Other common symptoms include
freckles in between fi ngers, armpits and groin,
Lisch nodules, and neurofi bromas; which are
benign tumors, ranging from few to many,
growing cutaneous or subcutaneously. In
severe cases, NF1 suff erers could develop
learning disabilities, bone deformities,
and optic gliomas which could aff ect vision
(Murphy, 2013).
A normal functioning NF1 gene produces a
protein called neurofi bromin. Th is acts as
a tumor suppressor and negative regulator
to another protein called RAS. RAS is a
G protein that functions in intracellular
signaling, which ultimately turns on genes
involved in activities such as; cell growth,
diff erentiation, cell adhesion, apoptosis, and
cell migration. G Proteins, like RAS, have on
and off switches; when RAS is bound to GTP,
it is switched on, and when bound to GDP, is
off . Neurofi bromin aids RAS in the hydrolysis
of GTP to GDP and thereby inactivates it.
However, when the NF1 gene is mutated,
the neurofi bromin is shortened and cannot
bind to RAS. Th erefore, cells divide and grow
unregulated, which results in the formation of
tumors (King et al., 2003).
NF1 is generally not deadly unless tumors
become malignant, which is rare. As of today,
there is no cure for NF1. Th e problem is that
NF1 is a complex disorder with little research
conducted on it. Th e NF1 gene is a large
gene but most mutations occur in the NF1-
GRD region of it. Th e focus of the research
I am involved in is to try to produce a DNA
construct that can be introduced into patients

LOS ANGELES MISSION COLLEGE 53
Figure 1 - Colony growth on LB agar with ampicillin with the pUC19 vector
Figure 2 - The control plate containing some transformed cells with pUC19
with neurofi bromatosis where it can express
normal NF1 protein to counter balance the
faulty NF1 genes, specifi cally in the NF1-
GRD domain. Th e goal is to acquire a DNA
concentration of 20 ng/μL or higher. Th is will
be achieved by using a plasmid named pEPito
that will contain a normal functioning NF1
gene. Th e idea is that with this increase, more
normal functioning neurofi bromin will be
produced, which will turn off the over-active
RAS-GTP, thus slowing down or eliminating
tumor growth.
RESULTS
Th ere were three main steps involved in
carrying out this research on NF1. Th ey were
making competent cells, transformation and
plasmid miniprep. Th e competent cells are
E. coli cells that have been treated in a way
so that they take up the construct, pEPito,
easier. If the competent cells are no good the
experiment cannot move forward. So before
moving on to transformation the competent
cells were tested. Using the plasmid, pUC19,
colonies of transformed cells were observed,
meaning the competent cells worked, as
illustrated in Figure 1.
Now that the competent cells were confi rmed
to be working, it was time to move onto
transforming them with pEPito containing
NF1-GRD and simultaneously do a
transformation with the pUC19 plasmid as a
control. During this procedure colonies grew
for both the control and the construct, pEPito.
But almost all the colonies grew on the sides
of the plates where there was no ampicillin
Figure 3 - E. Coli cells with the construct, pEPito, growing on the sides

MURJ - VOLUME 354
(the plate is shown in Figure 3; however, the
bacterial growth at the sides of the agar is
diffi cult to see in this image). Figure 2 shows
the control plate and Figure 3, the plate
with pEPito.
Next, a colony selected from the sample plate
was restreaked onto another plate treated
with ampicillin. Th is served as another
control that assured the cells were carrying
pEPito. As seen in Figure 4, the restreaking
was a success.
Lastly, a plasmid miniprep was done to
retrieve the multiplied pEPito with NF1-
GRD within the bacteria. Th e DNA collected
was nanodropped in order to obtain the
concentration of the DNA which is measured
in ng/μL (nanograms per microliter). A value
of 50.00 ng/μL was determined as shown
in Figure 5. Th is concentration is of good
quality and meets the goal of this research.
Th is can now be used for further research
purposes and possible gene therapy.
DISCUSSION
Over the span of 10 weeks, research
was conducted on the disorder called
Neurofi bromatosis type 1. Since NF1 is a
genetic disorder, the research focused on
working with a vector named pEPito and
transforming E. coli cells, which would carry
the normal version of the NF1 gene. Th e goal
was to successfully reproduce pEPito with
NF1-GRD so that it could possibly be used
for gene therapy. Before the E. coli cells could
take up the construct, they needed to become
competent to do so. Th is involved treating
them with various solutions as well as heat
shocking them to break down their cell walls.
Once this was achieved, accepting foreign
DNA such as a plasmid was made easier. For
the E. coli cells that took up the plasmid and
thus were “transformed,” they essentially
cloned the gene of interest each time they
grew, which was roughly every 20 minutes.
Now, all that was left was to extract the DNA
from these cells. Th e fi nal step, which is
called “plasmid miniprep,” destroys the cells
Figure 4 - Transformed colonies containing pEPito restreaked onto a plate Figure 5 - A recording of the DNA
concentration from the nano drop
LOS ANGELES MISSION COLLEGE 55
leaving only the DNA behind. Th e DNA was
collected and the concentration of the DNA
was measured using a Nanodrop device. Any
sample that is 20 ng/μL and below is not
useful. However, when the sample was tested
the concentration was 50.00 ng/μL, which is
quite good. Th is same can now be used for
potential gene therapy or training.
Th roughout the research there were some
errors, doubts, and frustration. For starters,
lab-made competent cells like the ones made
during this research are of less quality than
commercially produced competent cells.
Couple this with the fact that transformation
can be hit or miss, which means some of
the time colonies do not grow on the plates.
Another issue was the technique of handling
of delicate materials. Initially, non-useable
materials and results were obtained due to
mistakes. So time was taken to work out the
kinks such as practicing and going through
the entire process of transformation and
doing minipreps using the control plasmid,
pUC19. Once confi dence was gained, work
resumed using the vector pEPito and the gene
of interest. A week before the fi nal week of
this internship none of the plates grew any
transformed colonies. So, it was decided to
make new competent cells, SOC medium, as
well as a few other solutions. Th e decision
proved to be wise because colonies did grow
and were usable to carry out the rest of the
research. In the end, plenty of pEPito with
the healthy NF1-GRD was reproduced. Th is
can now be used for potential gene therapy,
training and practice, as well as further
research for another student to carry out.
MATERIALS AND METHODS
Competent Cell Preparation
Th ree test tubes containing 5 mL of Luria
broth (LB) were each inoculated with a colony
of Escherichia coli (Top10 strain) using a sterile
toothpick and placed into a shaker at 37 °C
and 250 rpm for 18 hours. One milliliter of
the overnight growth (inoculant from the
test tubes) was added to a fl ask containing
50 mL of LB and the fl ask was placed in a
shaker set at 37 °C and 250 rpm for 2 hours.
Th e absorbance at 600 nm was checked
periodically with a spectrophotometer until a
reading of 0.6-0.7 was achieved. Th e contents
of the fl ask were then centrifuged at 4 °C and
5,098 x g for 10 minutes. Th e supernantant
was discarded and the bacterial pellet was
resuspended in 5 mL of cold 0.1 M CaCl2. Th e
tube was vortexed briefl y then left on ice for
15 minutes. Th e tube was centrifuged again
at 4 °C and 5,098 x g for 10 minutes. Th e
supernatant was discarded and the pellet was
resuspended in 1 mL of cold 0.1 M CaCl2.
Th en, 450 μL of 50% glycerol and 50 μL of DI
water were added to the falcon tube. Finally,
200 μL aliquots and a single 100 μL aliquot
were made and stored at -70 °C.

MURJ - VOLUME 356
Transformation
Competent cells were removed from the -70
°C freezer and placed into the bucket of ice to
thaw. Approximately 50 ng of plasmid DNA
was added on the inside of a sterile tube and
washed down with 100 μL of the competent
cells. Th e tube was placed on ice for 30
minutes and then the cells were heat shocked
in a 42 °C water bath for exactly 45 seconds.
Th e tubes were immediately placed on ice for
2 minutes after which 900 μL of SOC medium
(0.5% yeast extract, 2% Tryptone, 10 mM
NaCl, 2.5 mM KCl, 10 mM MgCl2, 10 mM
MgSO4, diH
2O, 1 M glucose) was added to
each tube. Th e tubes were placed in a shaker
to shake at 37 °C and 225 rpm for 45 minutes.
Ten microliters of the transformed cells was
spread on an LB agar plate to which 25 μL of
0.05 g/mL ampicillin had been spread on the
agar surface, that plate was allowed to sit for
10 minutes. Th is was repeated on two more
plates with 100 μL of transformed cells and the
remainder of the transformed cells. Th e plates
were then incubated at 37 °C for 18 hours.
Plasmid Minipreps
A transformed colony was chosen from a plate
grown the night before and added to a test
tube with 5 mL of LB and 5 μL of 0.05 g/mL
ampicillin. Th e tube was then placed at 37
°C and 225 rpm to shake overnight. Th e
following day 1.5 mL of the overnight growth
was added to a microcentrifuge tube and
spun at room temperature at 14,000 rpm in
a microcentrifuge for 10 seconds to pellet
the cells. Next, the supernatant was gently
removed leaving about 100 μL of medium
with the pellet. Th e tube with the pellet was
vortexed thoroughly to resuspend the cells.
Th en, 300 μL of TENS buff er (10 mM Tris-HCl
pH 8.0, 1 mM EDTA, 0.1 M NaOH, 0.5% SDS)
was added to the tube and vortexed on high
for 5 seconds. One hundred fi fty microliters
of 3M sodium acetate pH 5.2 was added to the
tube as well and vortexed on high 5 seconds.
Th e tube was placed into a microcentrifuge
and spun at room temperature for 4 minutes
at 14,000 rpm to obtain another pellet. Th en,
the supernatant (~450 μL) was transferred to
a fresh tube. Next, 0.9 mL of 95% ethanol (-20
°C) was added to the tube and mixed well. Th e
tube was centrifuged for 2 minutes at 14,000
rpm at room temperature. Th e supernatant
was discarded and the pellet was washed twice
with 500 μL of 70% ethanol and then left to
air dry for 30 minutes. Finally, the pellet was
resuspended in 200 μL of TE (10 mM Tris-
HCl pH 8.0, 1 mM EDTA pH 8.0). Th e DNA
concentration was then determined using
a Nanodrop 2000 unit as described by
the manufacturer.

LOS ANGELES MISSION COLLEGE 57
ACKNOWLEDGEMENTS
I would fi rst like to thank my sponsor Dr. Aida
Metzenberg for helping make this opportunity
possible and for allowing me to use her lab
during this research. I really enjoyed getting
to know her as well as learning from her. I
would also like to thank Andrea Cosco for
providing the construct, pEPito. Additionally,
I would like to thank Anamica Sood, Cindy
Barrios, Amy Heman, and Sahil Khullar. I had
such a great time working with you all. Lastly,
I would like to send a big thanks to Professor
Stephen Brown, Professor Mike Fenton,
Professor Michael Reynolds, and the rest of
the people at STEM who helped make this
internship a reality.
REFERENCES
King, N., Hittinger, C.T. & Carroll, S.B., 2003.
Evolution of key cell signaling and adhesion
protein families predates animal origins.
Science (New York, N.Y.), 301(5631), pp.361–
3. Available at: http://www.ncbi.nlm.nih.gov/
pubmed/12869759 [Accessed August
22, 2014].
Murphy, B.M., 2013. Plexiform
Neurofi bromas. CHEST Journal, 144(2),
p.708. Available at: http://journal.
publications.chestnet.org/article.
aspx?doi=10.1378/chest.13-0046 [Accessed
August 23, 2014].
Szudek, J., Evans, D.G. & Friedman, J.M., 2003.
Patterns of associations of clinical features in
neurofi bromatosis 1 (NF1). Human genetics,
112(3), pp.289–97. Available at: http://www.
ncbi.nlm.nih.gov/pubmed/12596053 [Accessed
August 22, 2014].

MURJ - VOLUME 358
Using Small Subunit Ribosomal RNA (18S) Gene Sequences To
Identify Wild Nematodes Heilly Salinas
Sponsored by Dr. Ray Hong, Department of Biology
California State University, Northridge
INTRODUCTION
Past research has shown a strong necromenic
association between scarab beetles and
Diplogastrid nematodes. Necromenic
nematodes use the beetle as transportation
and food. Nematodes live inside the beetles
in dauer stage, a form of hibernation until
they are able to feed off the carcass. Th e
relationship between the beetles and
nematodes has contributed to entomology.
Scarab beetles have only shown to yield
non-parasitic nematodes that are not
harmful, such as Pristionchus pacifi cus.
Entomopathogenic worms are very rare to
fi nd on these beetles. Entomopathogenic
nematodes are parasitic and kill the beetles in
order to eat. Our interests are on the family
Pristionchus because they are not harmful to
lab settings and are easy to maintain which
allows researchers to study their ecology.
Pristionchus are hermaphrodites and are
able to reproduce in abundance within
hours. Paul de Ley identifi ed 600 species of
nematodes by using 18S rDNA sequencing.
Th e small ribosomal subunit RNA gene (18S)
has allowed us to identify the species of
nematodes. In this lab we collected scarab
beetles and waited for nematodes to emerge
and used 18S rRNA gene sequences to identify
the diff erent species.
RESULTS
During this beetle season, 721 scarab beetles
were collected and dissected. All of the beetles
were placed in an NGM plate (see Materials
and Methods) with cholesterol to allow the
nematodes to emerge (Figure 1). Once the
nematodes were identifi ed on the beetle plate,
they were transferred onto another plate to
maintain them (Figure 2).
Figure 1 - Half of a beetle on an NGM plate with cholesterol

LOS ANGELES MISSION COLLEGE 59
Figure 2 - Nematode plate 3 days after being transferred from beetle plate as shown on Figure 1
Figure 3 - 1.5 % agarose gel of PCR reactions for various nematodes. All lanes showed successful PCR amplifi cation. 1 kb refers to one kilobase DNA ladder.
Out of the 721 beetles, 74 nematodes
emerged. Even though more beetles were
used this year for this purpose, the infestation
rate (percent of beetles from which nematodes
emerged) was relatively low compared to
last year. Last year, the infestation rate
was about 11% and this year it was about
10%. We were able to identify the nematode
strains by PCR amplifi cation and sequencing
the 18S ribosomal RNA gene. After PCR
amplifi cation, the reactions were run on
a 1.5% agarose gel to detect a 900 bp PCR
product. As shown in Figure 3, the presence
of a 900 bp band confi rmed the desired PCR
Figure 4a - This pie chart shows the trend of species that were obtained last summer, 2013. Sample size was 188 beetles and 13 strains.
Figure 4b - This year’s trend is shown on this pie chart. Sample size was 721 and 72 strains.
product was present and therefore was ready
for purifi cation. PCR amplifi cations for two
of the nematodes were unsuccessful and
therefore could not be sequenced.
Th e majority of nematodes obtained from
each beetle were either P. maupasi or P.
pacifi cus. On one of the beetle plates two
strains were found, P. pacifi cus and P. maupasi.
Th is summer, we were able to analyze a variety
of nematode strains (Figures 4a and 4b). Th e
diff erent species were maintained and frozen
for future references.
8%
38%
23%
23%
8%
Nematodes 2013
Diplogasteroides magnus
Oscheius
Rhabditolamaimus
Pristionchus pacificus
Pristionchus maupasi
n=13

MURJ - VOLUME 360
DISCUSSION
Th e single worm lysis stopped working
towards the end of the experiment. Th e
proteinase K primer seemed to lose its quality
from thawing and freezing repeatedly. We
also found that adding mineral oil to the lysis
tampered with the results. Sometimes during
pipetting the DNA to the PCR mix, mineral
oil would go along with the DNA and lower
the concentration. To optimize results for
higher concentrations, a few changes were
made to the DNA Clean and Concentrator
protocol. Instead of using regular DI water,
we used heated nanopure water at 75 °C and
diluted 10 μL twice. A higher infestation rate
was expected but it stayed consistent at about
10%. Th e infestation rate has been consistent
for the past 4 years. Th e rate fl uctuated
between 10% and 12% regardless of the
sample size. Overall, the experiment
went well.
MATERIALS AND METHODS
Beetle Collection
Scarab beetles were collected in eppendorf
tubes with gloves. Beetles are found around
urban lights close to greenery. Th e eppendorf
tubes were labeled with place and date and
stored in refrigerator.
Beetle Dissection
To cut the beetles in half, scissors, forceps and
5% sodium hypochlorite solution (to disinfect
materials) were used. Half of the beetle was
placed on a 1.5 cm NGM agar plate (NaCl,
Bacto-tryptone, KH2PO
4, K
2HPO
4, Bacto-agar,
5 mg/ml Cholesterol), then parafi lmed. Th e
other half was placed back in an eppendorf
tube then put in -20 °C.
Wild Nematode Culture
Once a nematode was identifi ed on beetle
plate about 5 nematodes were picked onto two
3 cm NGM plates. One unseeded NGM plate
labeled 16S, parafi lmed, and one seeded plate
with OP50 E. coli labeled 18S. After a couple
days, on a seeded 3cm NGM plate, a drop of
bleach was placed on one side of OP50 lawn
with at least 5 nematodes. Next day, eggs
hatched and J2 larvae emerged to OP50 lawn.
Larvaes were picked onto new seeded plate.
Isolation of Genomic DNA
Five worms were picked into 10 μL of single
worm lysis with Proteinase K in PCR tubes
and place in the PCR machine @ 65 °C for 1
hour, @ 95 °C for 10 minutes, and cool. After
the cycles, 70 μL of diH2O was added to the
tubes and stored at -20 °C. Use 2 μL for PCR.
LOS ANGELES MISSION COLLEGE 61
18S SSU RNA PCR
Primers:
RH5401 SSU18A AAAGATTAAGCCATGCATG
RH5402 SSU26R CATTCTTGGCAAATGCTTTCG
RH5403 SSU9R AGCTGGAATTACCGCGGCTG
APEX 2X Taq. PCR mix, pink (with dNTP,
buff er and Taq)
(1X)
APEX 2x 12.5 μL
10 mM RH5401 1.5 μL
10 mM RH5402 1.5 μL
Nano pure H2O 7.5 μL
Worm gDNA 2 μL
______________________________________
25 μL per tube
PCR:
94°C 3 min
94°C 45 sec
58°C 45 sec 35X
72°C 1 min 15 sec
72°C 5 min
20°C indefi nitely
Samples were run on 1.5% gel/1X TBE buff er
with 1 kb gene ladder.
DNA Purifi cation
PCR product was cleaned using ZymoResearch
cat. DNA Clean and Concentrator-25 kit. For
optimal results, diH2O was heated to 75 °C
on a heat block. Clean PCR product was sent
to Laragen for sequencing using RH5403 as
primer. For every reaction, 5 μL (minimum
concentration 20 ng/μL) were added in a PCR
strip and 2.5 μL of 5 mM RH5403 primer per
reaction in one of the tubes.
ACKNOWLEDGEMENTS
I would like to thank Mike Fenton, Stephen
Brown and STEM for allowing me to partake
in this great opportunity. I learned many new
things and it changed the way I view science.
Research is very challenging and rewarding,
all at the same time. I now have a greater
appreciation for science and research. I would
also like to thank Dr. Ray Hong and the whole
lab staff for being extremely helpful and
welcoming. Th ey made my experience that
much better; I really felt a part of the team.
It was such a pleasure working alongside
Snehacom Koneru in this experiment. I want
to thank her for teaching me everything I
needed to know. Th e knowledge I obtained in
this lab will defi nitely help me in my future. I
have a great appreciation for the lab staff and
professor Fenton, again thank you.
REFERENCES
“A Quick Tour Of Nematode Diversity and the
Backbone of Nematode Phylogeny.” Paul De
Ley, Department of Nematology, University of
Riverside, USA.

MURJ - VOLUME 362
STEM-HSI Web Portal Sergio Gonzalez, Paulo Osuna, Edwin Salazar, Felix Villa
Sponsored by Dr. Gloria Melara, Department of Computer Science
California State University, Northridge
INTRODUCTION
STEM-Hispanic Serving Institution (HSI)
grants are funded by the United States
Department of Education under Title III
STEM/Part F-HSI. Th e grants fund various
Science, Technology, Engineering and
Math projects in colleges and universities
throughout the country, but there has
never been a way for grant directors to
communicate with each other in a centralized
way. In order for ideas to be shared amongst
grantees, a communication channel between
them is needed. It is challenging for STEM
directors to obtain the objectives and the
strategies used by other grantees. Th us the
creation of a system that categorized STEM
grantee objectives into type of projects,
successful strategies and assessed versions of
successes and failures would provide valuable
information for all STEM grantees and
minimize redundancies collectively within the
programs. Additionally, successful objectives
and strategies can be collected as a group to
assess the overall productivity of all the STEM
programs. Th is information can be posted on
the Department of Education’s web site and
can be used to illustrate the productivity of
the grantees as a whole.
Th e purpose of the STEM-HSI web portal is
to serve as a form of communication between
STEM-HSI grantees. It would allow other
grantees and its directors to view grant
objectives and goals of the other grantees.
Th e grantees would be able to input their text
through a form built into the portal. Th e
portal will be viewed as a web page, web pages,
by the regular user, in which they would be
able to access educational institutions and
view the data that the schools have decided to
share with the public. Users can use a search
function that allows them to do quick look
ups by school name, or by data keywords and/
or sentences, they seek to information on.
Th ere would be a login function for directors
of programs and their staff which would have
a diff erent interface than the one a regular
looker sees.
TECHNOLOGIES REVIEWED AND SELECTION
Th e STEM-HSI web portal site was originally
slated to be created using node.js framework.
Going under that model, research was
performed on how node.js can be used to
create a dynamic web platform. Preliminary
results showed that node.js is a very fast and
capable platform, provided that there is ample
support for it. Further investigation yielded

LOS ANGELES MISSION COLLEGE 63
little support information towards confi guring
the node.js-based server into a server that
would meet the needs of the request. After
investigating the server platform that the
web portal would be hosted on, it was found
that node.js would not be natively supported.
At that point, research was redirected towards
platforms that would be natively hosted
with the new restrictions, which led to the
decision of using the Drupal Content
Management System.
Th e Drupal CMS, which is module-based,
was already supported on the chosen hosting
platform. Th rough research about Drupal,
it was clear that it would be able to meet the
needs of the web portal not only immediately,
but also as the project grew in scope, adding
to scalability by the ease of implementing new
features. Due to the ease in implementation,
it was chosen as the platform to host the HSI
Web Portal.
Furthermore, Drupal is a free and open source
framework that was released in 2001 and
has since cultivated an immense developer
community. Today, Drupal is a powerful
framework which is used to support such
websites as Whitehouse.gov. Th e capability
that Drupal allows developers, to implement
a sophisticated programming interface on
a simple module based framework, is what
makes it such a powerful tool.
PORTAL FUNCTIONS
At the beginning of the project stakeholders
requested a list of functions to be included
in the web portal that would improve the
communications between grantees. Th e
original list included the following functions:
Search, multi-campus/multi-user login and
login management, data input, feedback,
customizable image carousel, chat room, chat
archive, pinpoint school locations map, and
video chat.
Due to time constraints and the time
involved in researching and testing the
diff erent technologies, the STEM-HSI Web
Portal was partially completed during the
summer 2014. Th e functions implemented in
this summer include:
Search: Th e search module allows users to
search for specifi c content, or data, entered
into the site. You can use the function
to search for keywords or users, and the
module has a built in Taxonomy/Query as
well as an advanced search which allows
you to use exclusionary searches including
signs, characters, and symbols.
Login: Th is module serves a vital role in
allowing individual users the access to the
system by identifying and authenticating
them through a credentials process. It
allows them to control the backend of their
personalized webpage.

MURJ - VOLUME 364
Data input: A customized form was created
to allow authenticated users the access to
input data into their own webpage, as well
as adding images and other multimedia.
Specifi cally, the form contains the status of
a project, the project’s owning institution,
the institution type, the project’s objective,
and its methodology and results. Th is
form is searchable and can be archived for
later use.
Feedback: Th e ability to give feedback or
post comments to archived projects is also
possible. To give feedback, a text box form
allows an authenticated user to post his
comments in reply to their, or someone
else’s, project form. Th e comments are
posted with the user’s login name. A
notifi cation email is also sent to the
project’s form owner alerting them of new
posted feedback.
Figure 1 - STEM-HSI Portal home page
Read more
User login
Username *
Password *
Create new account
Request new password
Log in
Who's online
HSI STEM Spring 2014Initial MeetingCalifornia State University, Northridge
HSI STEM spring meeting and introduction of the new members of the HSI STEMprogram. At this event the new members of the AIMS program were introduced to thefaculty and staff, as well as current students in the program. Current program goalswere also highlighted and future goals were also presented. Group pictures were takenas well.
Tell me more
HOME COLORADO FLORIDA NEW MEXICO TEXAS FEEDBACK FAQCALIFORNIA

LOS ANGELES MISSION COLLEGE 65
Image carousel: Th e main portal page, which
may be viewed by anyone, includes an
announcement carousel. Th is carousel is
important because it will give HSI program
administrators the forum to present
important news, events, or project updates.
DISCUSSION
Currently the website is hosted by the CSUN
server at http://www.ecs.csun.edu/hsi. Th e
updated version of the STEM-HSI Web Portal
will include a full functioning chat module
that will allow logged in users to have a
conversation in a private one-on-one room, or
with multiple users logged into a public chat
room. Th e chat function will make a copy, and
retain the conversation for future use. It will
also have an improved integrated map that
will pinpoint the school locations for those
schools who input their data.
A linked website that shows grantees
how to use the HSI portal website will be
implemented as well. Th e linked website will
provide grantees with a menu containing
categorized information about the site’s
overview, navigation, and its features.
Additionally, bug reports and troubleshooting
issues will be addressed here. Finally, help
videos will also be made available.
ACKNOWLEDGEMENTS
I would like to thank Dr. Gloria Melara and
Dr. Mike Fenton for allowing me to work on
this project. It was a great learning experience
and the hands on training that the CSUN
team and I received will defi nitely help us
in our future endeavors. Th e project would
have never been possible without the rest of
the team: Edwin Salazar, Paulo Osuna, and
Felix Villa, thank you. Lastly, I would like to
thank Title III STEM-HSI and the Department
of Education for providing funding and the
project for us to work on.

MURJ - VOLUME 366
Flow Visualization Study Around an Air Foil Cesar Aliaga, Elifalet Garcia, and Sofiya Pascual
INTRODUCTIONHydrogen bubble flow visualization is a simple but powerful technique used to study flow patterns around various items of interest. Here, we utilize this technique to visualize the flow patterns around an air foil and identify the Laminar Separation Bubble (LSB) for various flight velocities at a given angle of attack.
The Air Foil:The Air Foil we are studying is interesting for a few reasons, with the most notable being its widespread use in Unmanned Aircraft Systems (UAS). Due to the increasing use and presence of drones and other UAS, our work takes on another layer of importance.
Hydrogen Bubble Electrolysis:Although Hydrogen Bubble Electrolysis is generally considered outmoded as a flow visualization technique, our use of it is justified for two reasons. Firstly, due to time constraints, it would be unreasonable to learn how to use more sophisticated flow visualization techniques. Secondly, the ease of using hydrogen bubble electrolysis as a flow visualization technique is well suited for use as an “introduction” to fluids and laboratory practices.
Some of our initial runs. We used background subtraction to clean up the image, and increased the contrast to better see the flow behavior.
METHODS Materials• UAS Airfoil• Relay• Tungsten wire, .001 in diameter• Basler acA2000-50gm Camera• National Instruments Labview• Water Tunnel Model 505
The experiments ran were straightforward, with the objective being to capture images of the point of LSB for analysis. To accomplish this, we used Labview to interface with the Basler camera, which captured images of flow behavior around the airfoil. We employed a relay to prevent hydrogen bubble quality deterioration, to prevent the bubbles from becoming too large and floating upward, and to pace separation between bubble segments. Most of the work we did lay in finding an adequate lighting setup that would better enable us to capture quality images. The difficulty in this stems from the near-transparency of hydrogen bubbles in water.
• First runs were concerned solely with finding the setup that would provide optimal bubble quality (small bubbles that would not tend to float upwards). We found that a thinner wire helps immensely when trying to produce smaller bubbles. A voltage in the range of 60-90 volts produces denser “lines”, as seen below, while still being able to stay relatively leveled. The runs below show the final results of these calibration runs.
First trials
Airfoil Water Tunnel Model 505
AIMOur research was intended to provide a groundwork for future researchers interested in studying similar UAS airfoils. We set out to capture good quality images which would illuminate some of the behavior of this airfoil. Future researchers should take our research and refine it, creating a more rigorous and precise study of the properties of this airfoil under more diverse conditions.
AIMS2014 FLUID MECHANICS

LOS ANGELES MISSION COLLEGE 67
LSB Distances and the Reynolds Number at this State
Run043 Typical Photo
RESULTSThe behavior of the airfoil under various velocities turns out, unsurprisingly, to be very unpredictable. As illustrated in the Water Flow vs Average Distance Of Bubble Separation graph, going from 5 Hz setting on the variable frequency drive, to 6 Hz caused a sudden increase in the LSB distance, measured from the leading edge, then decreasing from 6 Hz to 8 Hz and then staying constant until 15 Hz. However, what complicates these results is the two very different averages for the LSB distance at 15 Hz. This may be attributed to movement of either the camera or the airfoil, but for this to be justified the experiment must be ran again for confirmation. Another key point of this experiment was the Reynolds Values, maximum occurring at 5080 (Run044 and Run043) and the minimum value at 3786 (Run040).
After these trial runs, we began our real experiment, which were runs 039-044. In these runs, we kept the airfoil at an angle of 12º while varying the velocity of the water (range of .32 m/s to .47 m/s). Once we captured ~500 images per run, we analyzed every image to find the pixel location of the separation bubble, as well as any interesting details like flow recirculation or varying LSB, like seen on Run 043-Image 8411
Varying LSB:The occurrence of varying LSB did not happen very often, but there are some notable runs where this did occur. Why this occurred is unknown and was random.Flow Recirculation:Is erratic, unpredictable, and does not appear to be periodic. No obvious correlation to water velocity observed. The phenomena is unknown but very intriguing.
CONCLUSIONS1 Although the purpose of our work was to provide a very
basic data set for future research into UAS airfoils, the program we participated in was meant to be an opportunity to learn and experience a research environment firsthand. In this, it was very successful because some of the tools learned was how to setup an experiment from scratch. Gather data and be able to analyze this data using fluid dynamics equations and software.
ACKNOWLEDGEMENTSWe would like to thank Dr. Durgesh for being our supervisor and mentor for this summer research event. If it was not for him and his guidance we would have not known how to approach the setup and analysis. We would also like to thank Dr. Ryan for being our director, AIMS, and STEM at LAMC for allowing us to be part of this great opportunity and experience.
RESULTS
Run039, LSB Distance Vs Time
Run Water Flow (hz) Reynolds Value Average Distance Of Bubble Separation (pixels) Standard Deviation Average Length of AirFoil39 5 3387 299 7.48 94940 8 3786 281 8.94 94841 12 4148 282 12.97 94442 15 4789 283 24.70 95343 15 5080 298 21.02 95244 6 5080 316 16.46 946
Total Average 293 9490.1524
AirFoil Length (m)0.15240.15240.15240.15240.1524

MURJ - VOLUME 368
Antifreeze As A Corrosion Inhibitor Of Steel Rebar
Gabriel Robles Sponsored by Dr. Behzad Bavarian, Department of
Manufacturing Systems Engineering and Management
California State University, Northridge
INTRODUCTION
For many centuries concrete has been
the basis of major city structures such as
buildings, bridges and streets. Concrete
is the material of choice because it has the
capacity to hold relatively heavy loads (high
compression strength); however, it does not
attain the same strength when pulled apart
(weak tensile strength). Steel rebar is used
to reinforcement concrete and together they
make a suitable combination of materials for
heavy duty structures. Steel rebar is made by
melting together scrap metals (such as iron)
and mixing it with a specifi c concentration
of carbon in order to achieve the properties
necessary within the rebar material.
Properties such as the hardness and ductility
are determined by the rate at which the rebar
was cooled.
Unfortunately, when the rebar begins to
rust it decreases its tensile properties and it
expands. According to Dr. Behzad Bavarian
from the CSUN Department of Manufacturing
Systems Engineering and Management, steel
rebar can expand up to six times its original
size after completely corroding. When steel
rebar begins to expand, it can put settled
concrete under tensile forces, which has the
potential to crack and weaken the concrete.
Other factors which directly impact the
concrete’s durability are elements within the
environment. Elements such as chloride (Cl-)
and carbon dioxide (CO2) can cause concrete
to decay. One example of concrete decay
is known as concrete carbonation, which
is the reaction between the calcium (Ca) in
the concrete reacting with carbon dioxide
(CO2) while in the presence of an electrolyte
environment to produce calcium carbonate
(CaCO2). Th is decay weakens and cracks the
concrete, which allows for corrosive elements
such as water (H2O) and oxygen (O
2) to reach
the steel rebar and corrode the exposed metal.
Figure 1 - Corrosion of 1018 steel sample at 100x

LOS ANGELES MISSION COLLEGE 69
One solution to help protect against corrosion
in the rebar is a Migrating Corrosion Inhibitor
(MCI), which is a chemical solution that is
applied on a concrete surface. Over time,
the MCI solution migrates down through
the cracks and imperfections of the concrete
and eventually reaches the steel rebar. Th e
inhibitor creates a hydrophobic layer over the
surface of the steel rebar which prevents the
steel from reacting with corrosive elements.
However, the protective barrier is not
permanent and periodic applications of the
MCI solution may be necessary.
Due to the long process of the MCI treatment,
the eff ectiveness of another inhibitor (antifreeze)
was tested and compared to the corrosion rate of
the steel in a corrosive environment.
MATERIALS AND METHODS
Preparation of 1018 Steel 1018 Sample and Electrochemical Cell
Steel cross sectional area samples were
measured and prepared for corrosion testing.
Th e samples were grinded with 400 grit
sandpaper and 600 grit sandpaper, and then
polished with a one micron powder buff er to
remove any previous corrosion.
Beakers were used to prepare two
electrochemical cells, each with a diff erent
electrolyte. One beaker was fi lled with salt
water as the electrolyte and the other beaker
was fi lled with antifreeze as the electrolyte.
Each electrochemical cell had two electrodes
(one working electrode and one reference
electrode). Th e working electrode was
connected to the steel sample being tested
and the reference electrode was the saturated
calomel electrode (SCE).
Experiment
Steel samples were placed into an
electrochemical cell and the experiment was
performed with two diff erent electrolytes; salt
water (corrosive environment) and antifreeze
(corrosive inhibitor). Th e samples were tested
using the EG&G VersaStat machine.
RESULTS AND DISCUSSION
According to Table 1, the 1018 steel sample
tested in antifreeze had a dramatic decrease
in the mpy corrosion rate compared to the
corrosion rate of 1018 steel in salt water.
Antifreezes’ eff ectiveness is evident by the
862x decrease in mpy. Figure 2 shows the
1018 steel alloy in antifreeze decreasing in
corrosion density as time progressed whereas
the corrosion density of the 1018 steel
sample in salt water increased. Th e dramatic
diff erence in corrosion rates implies that the
antifreeze is an eff ective corrosion inhibitor
which creates a passive coating that interrupts
the electrochemical reaction which slows
down the corrosion rate. Th is decrease in
corrosion rate may be the diff erence between
a steel beam lasting ten years to fi fty years.
Table 1 - Milli-inch per year (mpy) and inhibiter effectiveness of 1018 steel

MURJ - VOLUME 370
However, sample preparation is critical and if
not done properly, results may vary.
Corrosion and corrosion related issues are
expensive problems which can be avoided if
proper maintenance of the steel structures
is addressed sooner than later. Chemical
solutions such as corrosion inhibitors have
proven to be eff ective and are vital to the
durability of steel designs. Continuing
corrosion research is important and essential for
a society highly reliant on metal materials and
could be used for future research in corrosion.
According to Table 1, the 1018 steel sample
tested in antifreeze had a dramatic decrease
in the mpy corrosion rate compared to the
corrosion rate of 1018 steel in salt water.
Antifreezes’ eff ectiveness is evident by the
862x decrease in mpy. Figure 2 shows the
1018 steel alloy in antifreeze decreasing in
corrosion density as time progressed, whereas
the corrosion density of the 1018 steel
sample in salt water increased. Th e dramatic
diff erence in corrosion rates implies that
the antifreeze creates a passive coating that
interrupts the electrochemical reaction which
slows down the corrosion rate. Th is decrease
in corrosion rate may be the diff erence between
a steel beam lasting ten years to fi fty years.
Corrosion and corrosion related issues are
expensive problems which can be decreased
if proper maintenance of the steel structures
is addressed early. Th erefore, solutions
such as corrosion inhibitors are vital to the
maintenance and durability of steel structures
and designs.
ACKNOWLEDGEMENTS
Figure 2 - Overlay of corrosion rate in salt water and antifreeze for 1018 steel

LOS ANGELES MISSION COLLEGE 71
I would like to thank Marina Sangkavichai and
the LAMC STEM staff for all their support
and for providing me with this internship
opportunity. I would also like to thank Dr.
Behzad Bavarian and Yashar Ikder for all their
help and guidance in the lab. Th is experience
has helped me realize what it takes to be part
of a research project and the dedication which
it demands. Th ank you once again to those
who made this experience possible.
REFERENCES
D. Callister Jr, Materials Science and
Engineering An Introduction, J. Wiley & Sons,
NY, 8th Ed. 2010
Bavarian, Behzad, and Lisa Reiner.
“IMPROVING DURABILITY OF REINFORCED
CONCRETE STRUCTURES USING
MIGRATING CORROSION INHIBITORS.”
Corrosion 2004 (2004): n. pag. Print.
Jones, Denny A. “Principles and Prevention of
Corrosion.” (1996): n. pag. Print.
Esmaeilpoursaee, Amirreza. An Analysis
of the Factors Infl uencing Electrochemical
Measurements of the Condition of Reinforcing
Steel in Concrete Structures. Waterloo, Ont.: U
of Waterloo, 2007. Print.

MURJ - VOLUME 372
Th e C.O. Gene Of Arabidopsis Th aliana Functions As A Regulator Of Flowering In Response To Blue Light
Luis Corona Sponsored by Dr. Chentao Lin, Department of Molecular, Cell and Developmental Biology
University of California, Los Angeles
INTRODUCTION
Plants contain multiple photoreceptors to
control light responses, which in turn aff ects
growth and development. However, it is still
unclear how diff erent photoreceptors jointly
regulate a plant’s developmental processes.
An example of a plant’s physiological response
would be its fl owering time. Cryptochromes
are blue light-sensing receptors found in
plants which regulate photoresponses and
circadian clocks in plants and animals[2].
Th e Arabidopsis thaliana genome encodes
at least two cryptochromes, cryptochrome
1 (CRY1) and cryptochrome 2 (CRY2).
Cryptochrome 1 primarily mediates blue light
control of cell elongation. Cryptochrome
2 on the other hand mediates fl owering
signals[4]. In Arabidopsis thaliana, the
photoexcited cryptochrome 2 interacts with
the transcription factor CRYTOCHROME-
INTERACTING basic helix-loop-helix 1 (CIB1)
to activate transcription and fl oral initiation[1].
Specifi cally CIB1 activates transcription of
the fl owering integrator gene Flowering
Locus T (FT)[3].
Th e coaction of CIB1 protein expression has
been shown to be regulated by blue light.
Arabidopsis is a type of plant that is specifi cally
aff ected by blue light. When exposed to blue
light CIB1 is highly expressed in plants, and
in the absence of blue light levels of the CIB1
protein decrease[2]. Proteasomes are protein
degradation units within cells that can digest
a variety of proteins into short polypeptides
and amino acids, eliminating the protein’s
function. Proteasome 26S is the cause of
high levels of CIB1 degradation and blue
light actually hinders CIB1 degradation[1]. In
addition, under blue light, transcription factor
CIB1 triggers fl oral commencement[3]. Our
team has chosen to work with Arabidopsis due
to the fact that its genome has been entirely
sequenced, so biochemical techniques such as
western blots and polymerase chain reactions
are much easier to work with. Primarily,
we want to understand how blue-light
photoreceptor cryptochromes regulate cell
elongation and fl owering times. Th e coaction
mechanism of diff erent photoreceptors is the
fi eld of interest.

LOS ANGELES MISSION COLLEGE 73
Genes are sequences of DNA that encode for
the production of particular proteins. Th e
current research done in the Lin laboratory
at UCLA involves the study of gene
expression in Arabidopsis thaliana. Another
aspect being covered for the Arabidopsis is
its genetic mechanisms. If more than one
gene is responsible, we plan to identify the
specifi c genes and investigate how they work
together. Polymerase chain reactions are
the biochemical techniques that have been
employed to better understand Arabidopsis
gene expression. Th e goal of this project is
to introduce PCR products of the C.O. gene
into mature Arabidopsis thaliana plants so that
when they begin pollinating, they will express
this recombinant DNA and we can determine
how this aff ects fl owering.
RESULTS AND DISCUSSION
PCR is a biological technique used to generate
millions of copies of targeted sequences of
DNA. Th e goal of the project carried out in
this laboratory was to insert the C.O. gene
into a personalized vector called pDT7G and
transfer that vector from Escherichia coli to
Agrobacterium tumefaciens in order to infect
the mature Arabidopsis plant. Once the
host cell has been transformed with pDT7G
containing the C.O. gene, the recombinant
DNA will then be duplicated in the host cell’s
genome allowing the targeted gene to be
translated and copied.
Th e C.O. gene in Arabidopsis is in control of
the fl owering of the plant: when activated C.O.
initiates the fl oral stage, then afterwards the
pollinating stage of Arabidopsis. Transfer of
the C.O. gene to the Arabidopsis should initiate
a faster triggering of its fl oral stage.
Two gels with DNA were run for the C.O.
gene transfer experiment. Th e fi rst gel was
for purifying the PCR product and separating
pDT7G from a DNA insert it already
contained. An image of actual results was
not obtained, but the results were similar to
those shown in Figure 1. Th e DNA bands
corresponding to the PCR product and cut
vector were then identifi ed, excised and the
DNA purifi ed from the gel fragments. Th e
purifi ed pDT7G vector and PCR product
were then ligated and used to transform E.
coli cells which were spread on a Luria Broth
Kanamycin (LBK) plate which was incubated
overnight at 37 °C. Th e plate showed colonies
indicating successful growth (Figure 2).
Figure 1 - Electrophoresis of PCR product and plasmid vector. An image of the actual gel was not available. The gel shown here is a sample that is similar to the actual gel. Lane 1-DNA ladder, Lane 2-empty, Lane 3-PCR of C.O. gene, Lane 4-restriction enzyme cut pDT7G with insert to be removed.
Figure 2 - Kanamycin-resistant bacterial colonies. E. coli bacteria transformed with a ligation of the C.O. gene with pDT7G.

MURJ - VOLUME 374
Ten colonies were directly analyzed by PCR
to identify clones that had the highest
concentration of the C.O./pDT7G construct
(Figure 3).
Th e next step was to transform agrobacteria
with DNA from the PCR reaction with the
highest concentration. Out of the 8 positive
reactions, the sample shown in lane 2 had
the highest concentration of the PCR product
as seen under fl uorescent light (Figure 3).
Th is PCR sample was then used to transform
agrobacteria by electroshock treatment. After
electroshock treatment with the PCR sample,
the agrobacteria were spread on a Luria Broth
Kanamycin-Rifampicin (LBKR) plate. Figure
4 shows successful growth of colonies with
Kanamycin and Rifampicin resistance.
Agrobacteria clones positive for the C.O. gene
were identifi ed by PCR as described earlier
(data not shown). Positive agrobacteria clones
were then inoculated into 650 mL of the
LBKR medium and incubated in a shaker at
room temperature for a day. Th is particular
solution was then used for fl oral dipping the
genetically modifi ed CRY1-LUC/CRY2-LUC
Arabidopsis plants, ultimately causing the C.O.
gene transformation. Th e C.O. gene would
later recombine with the genomic DNA of
the seeds.
Agrobacteria gene transformation was
successful, since the seedlings generated
from the dipped plants showed traces of the
C.O. gene weeks later (data not shown). My
mentor now plans to observe what other
genes are working together with the C.O. gene
in order to have caused faster fl owering of the
plant. She will do this by utilizing a variety
of biochemical techniques to observe the
expression of targeted genes. Future tests can
only be done once the seeds become
mature plants.
Figure 4 - Kanamycin-Rifampicin-resistant agrobacteria. The agrobacteria colonies on this plate were transformed with PCR product obtained from E. coli clone lane number 2.
Figure 3 - PCR results from Kanamycin resistant bacteria. Under ultraviolet light, results from clone 2 showed a higher concentration of C.O. gene DNA. DNA from clone 2 was then used to transform agrobacteria.
LOS ANGELES MISSION COLLEGE 75
MATERIALS AND METHODS
Plasmid Vector
Th e plasmid vector used was a modifi ed
version of a vector made by Xu Wang called
pDT7. Th e modifi ed vector was named
pDT7G, an acronym for Dual Transgene Ti
vector 7 with Gypsy. Th e C.O. gene was cloned
into the SpeI site of the pDT7G vector.
PCR
Th e thermocycler utilized for the PCR
reactions was an Eppendorf Mastercycler
gradient. First, the PCR reactions were heated
at a temperature of 98 °C for 40 seconds.
Afterwards, the reactions were treated 30
seconds at 55 °C and fi nally for a minute at
a temperature of 72 °C. Th is sequence was
repeated 60 times.
Each PCR reaction had 12.9 μL of ddH20, 1 μL
of DNA template, 1 μL each of the Forward
and Reverse primers, 2 μL of dNTP for the
reaction system, 0.1 μL of the DreamTaq
DNA polymerase enzyme and 2 μL of
10X Dream Taq buff er. Th e C.O. forward
primer was 5’- TGACCTCGAG/ACTAGT/
ATGTTGAAACAAGAGAGTAA which contains
an SpeI site added near the 5’ end. Th e
C.O. reverse primer was 5’- GTCGCACCAT/
ACTAGT/ GAATGAAGGAACAATCC which
contains an SpeI site added near the 5’ end.
Th e apparatus utilized for DNA gel making
was the BIO-RAD DNA gel maker. Each well
consisted of 4 μL of double distilled water
and 1 μL of 6X loading buff er. Finally, 1 μL
of DNA PCR products were then run on a 1%
agarose gel with 1X TAE. Th e gel then ran
for approximately 20 minutes. Desired PCR
products were excised from an agarose gel
and then purifi ed using GeneJet Purifi cation
columns as described by the manufacturer.
DNA Cloning
Ligation of the C.O. gene and the pDT7G
vector was accomplished using the In-Fusion
enzyme as described by the manufacturer
(Clontech). E. coli was placed in ice to thaw for
30 minutes. After 30 minutes, the cells were
heat shocked at 42 °C for 1 minute and then
iced for 2 minutes. Five hunderd micriliters
of prepared L.B. medium (Tryptone 10 g/L,
Yeast extract 5 g/L and NaCl 10 g/L) was
then mixed with 40 μL of the transformed E.
coli and 4 μL of already prepared In-Fusion
solution. Th e sample was then incubated at
37 °C in a shaker for one hour after which
it was centrifuged at 27 °C in an Eppendorf
5415 R for 5 minutes at 4,000 rpm to pellet
the bacteria to the bottom of the tube. Th e
pelleted bacteria were then carefully spread on
a Luria Broth Kanamycin plate (Kanamycin
50 μg/μL).
Transformation of Agrobacteria
Th e transformation of agrobacteria was
accomplished by electroshock treatment.
Th e electroshock treatment was for only 1
minute at 120 volts. After the electroshock
treatment, the special electro-microtest tube
was centrifuged for 5 minutes at 10,000 rpm
at room temperature. Th e LBKR plate utilized
had antibiotic concentrations of 50 μg/μL
for Kanamycin and 50 ug/μL for Rifampicin.
After the centrifugation, the bacterial pellet

MURJ - VOLUME 376
was carefully mixed into the LBKR plate which
was then incubated at 28 °C for 24 hours.
Transformation of Arabidopsis Seeds
Transformed agrobacteria were grown in 500
mL of L.B. medium containing 5% sucrose,
50 μg/μL kanamycin, 50 ug/μL rifampicin to
which 150 mL of 0.03% silwet L-77 surfactant
(300 μL/1L) was added. Th e culture was
incubated at 27 °C for 24 hours. Th e seed-
bearing pods of mature CRY1-LUC/CRY2-LUC
Arabidopsis plants were then dipped in this
culture for 47 seconds. Th e plants were then
allowed to dry for 2 hours after which they
were placed in the greenhouse.
ACKNOWLEDGEMENTS
Special thanks to UCLA’s Dr. Chentao Lin
for having allowed me to participate during
the 2014 summer in his Arabidopsis’s blue-
light photoreceptor research. Also, thanks to
scholar Mingdi Bian for accepting to be my P.I.
and supervisor. I also wanted to give special
thanks to my college’s STEM program and
its head Dr. Mike Fenton. None of my work
and improvement would have been possible
without our mentor Dr. Stephen Brown. Final
thanks goes to undergraduate student Jessica
Ding for being a great lab partner.
REFERENCES
1. Liu B., Liu H., Zhong D., Lin C.,(2010).
Searching for a photocycle of the
cryptochrome photoreceptors. Science Direct,
13: 578-586.
2. Liu H., Wang Q., Liu Y., Zhao X., Imaizumi
T., Somers D., Tobin E., Lin C., (2013,
September 4). Arabidopsis CRY 2 and ZTL
mediate blue-light regulation of the
transcription factor CIB1 by distinct
mechanisms. Proceedings of the National
Academy of Sciences, 110 (43): 17582-17587.
3. Liu Y., Li X., Li K., Liu H., Lin C., (2013).
Multiple bHLH Proteins form Heterodimers
to Mediate CRY2-Dependent Regulation of
Flowering-Time in Arabidopsis. PLOS Genetics,
9 (10): e1003861.
4. Yu X., Liu H., Klejnot J., Lin C., (2010). Th e
Cryptochrome Blue Light Receptors. American
Society of Plant Biologists, 1-27. doi:10.1199/
tab.0135

LOS ANGELES MISSION COLLEGE 77
Cryptochrome 2 Interaction Kinase 1 (Cik1) In Arabidopsis
Houman Tazhibi Sponsored by Dr. Chentao Lin, Department of Molecular, Cell and Developmental Biology
University of California, Los Angeles
INTRODUCTION
Arabidopsis thaliana has been under intense
research particularly because it is the
fi rst plant to have its genome completely
sequenced. Because its genome has been
completely sequenced, researchers have
been able to use it as a model organism to
analyze gene expression. Arabidopsis possess
certain nuclear proteins called cryptochromes
that are of great importance to its life
cycle[1]. Th ese nuclear proteins are blue and
ultraviolet light receptors that are very much
structurally related to DNA photolyases,
light-driven repair enzymes[2]. Th ough
crypotochromes lack the repair activity that
DNA photolyases possess, they regulate gene
expression and thus infl uence morphogenesis
in Arabidopsis[2]. Some phenotypes found to
be aff ected by cryptochromes are: hypocotyl
(stem) elongation, fl owering, leaf growth,
the circadian clock and much more[3].
Arabidopsis possesses two genes that encode
cryptochrome proteins that this laboratory is
interested in: CRY1, and CRY2[3].
In particular, we seek to understand the signal
transduction pathways, genes, and proteins
that come into play during the plant’s life
cycle when reacting to specifi c wavelengths of
light. Currently, I am a part of an experiment
involved in studying Cryptochrome 2
Interaction Kinase 1 or CIK1. It is known that
Cryptochrome 2 interacts with a particular
kinase and is active after it is phosphorylated,
but the kinase responsible for its
phosphorylation is unclear. Understanding
the process of CIK1 and what functions it
performs that concern CRY2 will help unlock
more answers to signal transduction pathways
dealing with cryptochromes. Th rough
diff erent molecular biology techniques like
western blotting, and PCR we will attempt to
pinpoint diff erent genes that express CIK1
and truly understand the functionality and
purpose of CIK1.
RESULTS AND DISCUSSION
At the start of the experiment Arabidopsis
thaliana seedlings were grown. When the
seedlings were fully grown and ready we
infected them with Agrobacterium tumefaciens
carrying a specially made vector. Th e vector
was called pActin2::Flag-CIK1Nano, where
Actin 2 is the promoter in the vector and
fl ag is an epitope tag used for antibody
signaling and Nano stands for Nanoluc
luciferase reporter dossier. Nanoluc or (Nluc)

MURJ - VOLUME 378
is a luciferase or a bioluminescence enzyme
that was derived from a deep-sea shrimp[4].
Luciferase was used to analyze transcriptional
activity within our transgenic seedlings. Th e
vector contains specifi c genes needed for
CIK1 protein expression. After the seedlings
were infected we collected leaves from 9
mature seedlings and prepared them to run
a western blot, a technique used to detect
protein expression. During the treatment of
the leaf samples specifi c antibodies were used.
Antibodies are substances used to attach to
a specifi c area of a protein and when labeled
broadcast a signal so it can be detected in
a western blot. Th e primary antibody used
was called anti-Flag. Th e anti-Flag antibody
specifi cally binds to the fl ag epitope on CIK1.
Often the primary antibody signal is weak, so
a secondary antibody was used called mouse
anti-Flag. Th e sole purpose of the secondary
antibody is to amplify the signal of the
primary antibody. Once the treatment was
done the samples were used to run a
western blot.
Figure 1 shows a western blot that explains
the experimental results. Lane 1 contains
the prestained protein ladder and lanes
2-10 contain seedling samples called 2 nano
cik1 cry1 cry2. Cry1 Cry2 indicates the
seedlings’ background, meaning they already
are transgenic for the CRY1 and CRY2 genes.
Notice in lanes 2-10 only lanes 2, 3, 4, and
7 show protein expression ranging from
100 to 130 kDa in size. Th is means that
these specifi c seedlings infected with the A.
tumefaciens are positive transgenic lines that
express CIK1 in addition to CRY1 and CRY2.
Lanes 5, 6, 8, 9 and 10 show no signs of CIK1
protein expression. Th rough the developed
fi lm from the western blot it is now known
which particular Arabidopsis thaliana seedlings
contain the CIK1 transgene. Th is is important
to know because further experimentation can
be done to reveal and understand the signal-
transduction pathways that involve CIK1. It
will also help to understand the role of CIK1
in seedling morphogenesis. Th e function and
structure of CIK1 is still unknown.
Figure 2 shows two Arabidopsis thaliana
seedlings that were treated diff erently. Th e
picture labeled CIK10X was a seedling that
produced excessive amounts of CIK1 protein.
Figure 1 - Western blot of 2 nano cik1 cry1 cry2 transgenic seedling samples, in lanes 2 -10. CIK1 transgene expression is seen as a band between 100 kDa and 130 kDa.
Figure 2 - Comparison between two Arabidopsis thaliana seedlings. The left seedling produced transgenic CIK1 protein and the seedling on the right is the wild-type.

LOS ANGELES MISSION COLLEGE 79
Th e picture labeled Col4 was a wild-type
seedling. One can see that the seedling that
produced CIK1 had limp, weak, and curly
leaves and the wild-type seedling had fi rm and
strong leaves. Th is shows that too much CIK1
proves to be detrimental to the seedling. Th is
experiment was fairly new, so no conclusions
were made about the pathways and functions
of Cyptochrome-Interacting-Kinase 1
within the 10 weeks of my internship. Th e
experiment about CIK1 is still ongoing in Dr.
Lin’s laboratory.
MATERIALS AND METHODS
WESTERN BLOT
SDS-PAGE
Medium sized Arabidopsis thaliana leaf
samples were placed into liquid nitrogen.
Once the leaves were fully frozen, they were
then ground into a fi ne powder. Th e next
step required Non-Grinding (NG) Buff er to be
added to the ground Arabidopsis leaf samples.
Th e NG Buff er solution contained 10 mL of
0.1 M EDTA at a pH of 8.0, 5 mL of 0.12 M
Tris-HCL at a pH of 6.8, 2.0 g of 4% SDS, 5 mL
of 2-meracptoethanol, 2.5 mL of 5% glycerol,
and 0.0025 g of 0.005% bromophenol blue.
Th e NG buff er liquefi ed the Arabidopsis leaf
powder so it can be used in the next step.
Just enough NG buff er was added to dissolve
the leaf powder.
Western Blot Transfer
After the electrophoresis, the gel was
transferred to a PVDF membrane. Th e
membrane was then placed in to a Wet/Tank
Blotting system and electrophoresis was done
for 90 minutes at 80 V. Ponceau Stain (made
from Ponceau powder and ddH20) was used
afterwards to check transfer to the membrane.
Treatment with Primary Antibody and Secondary Antibody
Th e membrane was washed with PBST (8 g of
NaCl, 0.2 g of KCl, 1.44 g of Na2HPO
4, 0.24
g of KH2PO
4, 2 mL of Tween-20 and 1 liter
ddH20). Th e membrane was then blocked with
5% powdered milk/PBST for 1-2 hours and
washed with PBST two times. Th e membrane
was then incubated with the primary antibody
(Anti-Flag antibody; 5 microliters and PBST)
for 1-2 hours and then washed with PBST 3
times for 10 minutes. Th is mouse antibody
binds to the protein in question. In this case,
it is a particular kinase that interacts with
cryptochrome. Afterwards, the membrane
was treated with the secondary antibody for
1-2 hours.
Plasmid Extraction
Plasmid extraction was done using a kit called
GeneJet Plasmid Miniprep kit as described by
the manufacturer (Th ermo Scientifi c). ddH20
heated to 70 degrees Celsius was used to elute
the DNA instead of elution buff er.
PCR
PCR reactions contained 1 μL of template
DNA, 5 units of DreamTaq, 0.2 μM of
each primer and 0.2 mM dNTPs. Th e
remaining components were as indicated
by the manufacturer (DreamTaq –
Th ermo Scientifi c). Th e primer sequences
were as follows: CRY2 forward primer
(5’-ATGAAGATGGACAAAAAGACTATAG-’3)

MURJ - VOLUME 380
and CRY2 reverse primer
(5’-TCATTTGCAACCATTTTTTC-’3). Once
the reactions were assembled, they were
placed into a thermal cycler. Th e program
cycle was specifi c to DreamTaq. Th e cycle
was at 95 degrees Celsius for 30 seconds, 55
degrees Celsius for 30 seconds, 72 degrees
Celsius for 2 minutes. Th is was done for 34
cycles. Th e PCR products were then analyzed
by agarose gel electrophoresis (1% agarose,
1X TAE).
ACKNOWLEDGEMENTS
During my time in Dr. Chentao Lin’s lab, I
indeed learned a lot about the type of research
done and the research fi eld in general. Of
course, I did meet some challenges. Th is
opportunity of working in a UCLA laboratory
was defi nitely outside of my comfort zone,
but I managed to conquer my fear in trying
new things. Th e second challenge I met
was understanding the biology that was
involved in the research. Th at was the
most diffi cult of all. Overall, I am glad I
participated in the internship provided by the
Los Angeles Mission College STEM program
and Dr. Chentao Lin. It has given me a new
perspective about the research fi eld and I
recommend it to everyone looking to pursue a
fi eld in biology or chemistry.
I would like to thank Dr. Chentao Lin for
granting me the opportunity to work in his
lab. I would like to also thank Dr. Qing Liu
for allowing me to participate in her work.
She was my lab supervisor during my time
working in Dr. Lin’s laboratory. She helped
me and oversaw my work in the lab. She,
also, helped me understand the diffi cult
biology that was in practice in her research.
Lastly, I would like to thank everyone in the
STEM program and its faculty for helping
me achieving this wonderful goal. I would
like to especially thank Dr. Stephen Brown.
He helped all of the summer interns with
diff erent challenges they faced during their
internship. Th is opportunity helped me
dive into an imperative part of my major
that I have never seen before and found
very fascinating. Th is opportunity helped to
reinforce my decision in choosing biology as
my major. Th ank you everyone for time and
assistance in this wonderful journey.
REFERENCES
1. Meyerowitz, Elliot M. “Prehistory and
History of Arabidopsis Research.” Prehistory
and History of Arabidopsis Research. Plant
Physiology, 2001. Web. 16 July 2014.
2. Lin, Chentao, and Takeshi Todo. “Th e
Cryptochromes.” Protein Family Review (2005):
n. pag. Web.
3. Lin, Chentao, and Dror Stalitin.
“CRYPTOCHROME STRUCTURE AND
SIGNAL TRANSDUCTION.” (2003): 469-
89. Web.
4. “Th e NanoLuc Luciferase Reporter Dossier.”
Reportergene. N.p., 22 Jan. 2013. Web. 13
Sept. 2014.

LOS ANGELES MISSION COLLEGE 81
Research Of Novel Plant-Nodulating Bacteria
Firmin Dingue Tchiengue Sponsored by Dr. Ann Hirsch, Department of Molecular, Cell and Developmental Biology
University of California, Los Angeles
INTRODUCTION
Plants, especially green plants, are one of the
most important living organisms on planet
Earth. Without them, there probably would
not be life on Earth. Th at is due to the fact
that green plants perform photosynthesis that
removes carbon dioxide from the atmosphere
and replenishes it with oxygen that other
living organisms need to live. Plants are
found in all the biomes around earth and they
require 16 chemical elements to survive and
growth. Th ree of those 16 are non-mineral,
and are oxygen, hydrogen and carbon. Among
the 13 mineral elements they need to thrive,
nitrogen is the most important. Plants utilize
the macronutrient nitrogen to make their
DNA, their proteins and their chlorophyll.
Nitrogen is also used by plants for rapid
growth, better seed and fruit production and
better forage crops and quality of leaf. Plants
get their nitrogen from the soil. However,
the soil is most of the time very poor in
nitrogen because plants extensively use it for
growth and survival. Nevertheless, not all
plants get their nitrogen from the soil. A very
interesting species of plants get their nitrogen
indirectly from the air/atmosphere, where
nitrogen is abundant (air is 78% nitrogen gas).
Th ese species of plants are called legumes.
A legume is a dicot plant of the Fabaceae/
Leguminosae family. Legumes have their
fruits or seeds contained in capsules called
pods. Certain legumes, such as soybean,
peanut, pea, siratro and alfalfa, are
edible plants and therefore mainly grown
agriculturally. Because of their special
nitrogen fi xing quality, legumes are also
grown as soil-fertilizers. Legumes are able
to fi x nitrogen from the air, thanks to their
symbiotic relationship with certain bacteria
called Rhizobia. Th e rhizobia are found in
areas of the root systems of the legumes called
nodules. Due to obvious and drastic climate
changes, lands are becoming arid and less
plant-friendly, like deserts. However, desert
plants have very interesting characteristics
and incredible resistance to the harsh
environmental conditions they live in. Th ose
characteristics and resistance are due to their
adaptations to the weather conditions and
the soil they live on. Soils contain bacteria;
some are benefi cial to plants and animals,
others are pathogens. We actually didn’t
check this, although it would have been
interesting. Th e soil we have used as an
inoculum came from the rhizosphere of Larrea
tridentate, a dominant shrub in the Mojave
desert (not a legume). We were curious to

MURJ - VOLUME 382
know whether a legume could survive and
grow in a desert environment, establishing
a symbiosis with the bacteria in desert soils,
and thus being able to acquire nitrogen. We
were also interested in creating a catalogue
of all the organisms in our soil samples using
eDNA (environmental DNA). We therefore
performed a metagenomic experiment
on our soil samples and we chose soy as
an experimental legume and set up a trap
experiment. A trap experiment is basically an
exercise where germinating seeds of a selected
plant are implanted in sterile growth pots and
inoculated with extract of a soil sample that is
then studied to see whether that soil contains
bacteria that engage in symbiosis with the
selected plant and enhance its growth. Our
research could contribute to the discovery
of potential new Plant Growth Promoting
Bacteria (PGPB).
RESULTS AND DISCUSSION
Metagenomic Experiment
In order to see whether the eDNA of the
soil sample was extracted successfully, 10
μl of the solution collected after the eDNA
isolation step was run on 1% agarose gel
electrophoresis. We discovered that the eDNA
of the author’s soil sample was successfully
isolated (Figure 1). Using the High Mass
DNA ladder and his reading protocol, the 2
bands of eDNA in lanes 8 and 9 (Incubated
and non-Incubated), corresponded at the band
6 on the ladder and had the size of 10,000 bp.
Th erefore, according the protocol to determine
the mass, the eDNA sample collected had the
mass of 200 ng and the molality of 20 g/μL.
After we found that we had indeed collected
the eDNA of our soil sample, we continued by
running PCR to amplify our samples. Th en
we ran the PCR products on an agarose gel.
Figure 2 depicts the result of the gel. DNA
bands in lane 6 through 9 were used for the
continuation of the experiment. Th e bands
were about 1.6 kb in size.
Figure 1 - eDNA Isolation Gel resultLane 1: 1 kb High DNA Mass Maker; Lane 2: Non-Incubated sample of Alex (lab partner); Lane 3: Incubated sample of Alex (lab Partner); Lane 5: Non-Incubated sample of Spencer (Lab Partner); Lane 6: Incubated sample of Spencer (lab Partner); Lane 8: Non-Incubated sample of Author; Lane 9: Incubated sample of Author.
Figure 2 - PCR products Gel resultLane 1: 1 kb High DNA Mass Maker; Lanes 2, 3: Non-Incubated sample of Alex; Lanes 4, 5: Incubated sample of Alex; Lane 6, 7: Non-Incubated sample of Author; Lane 8, 9: Incubated sample of Author; Lane 10, 11: Non-Incubated sample of Spencer; Lane 12: Incubated sample of Spencer.
L1 L2 L3 L4 L5 L6 L7 L8 L9 L10 L11 L12
10k6k4k3k
1k
L1 L2 L3 L4 L5 L6 L7 L8 L9 L10 L11 L12
4k2k
1k

LOS ANGELES MISSION COLLEGE 83
We then extracted the PCR products from
the gel and proceeded in purifying it. Th en
using competent cells, we selectively cloned
our eDNA fragments and later extracted and
collected the plasmids from our transformed
bacteria. We then performed Restriction
Enzyme reaction (RER) to see whether our
eDNA fragments were properly inserted. We
then ran the RER products on agarose gel
(Figure 3). We found out that our eDNA
fragments were properly inserted in certain
white colonies.
After collecting and purifying our eDNA
fragment from the RER gel, we added it
to a sequencing reaction cocktail and the
mixture was put in PCR machine. We then
removed the sequencing products from the
thermocycler, cleaned it and then took it to
UCLA School of Medicine DNA Sequencing
Room. Th e sequencing results were received
via email from the DNA sequencing Core
facility and were analyzed using the Database
16S Ribosomal RNA sequences (Bacteria and
Archaea) in the Basic Local Alignment Search
Tool (BLAST). BLAST program is a trademark
of the National Library of Medicine. Th e DNA
sequencing machine was unable to produce
a good sequence of our sample. Th erefore it
was impossible to determine a catalogue of
bacteria in the soil sample. Since all the steps
until the RER were positively conclusive, due
to the fact that very small amount of DNA
was used, DNA sample might have been lost
in pipetting or mixing during the sequencing
reaction and the sequencing reaction
purifi cation. Th erefore, in the future, we
will be very careful while adding our reaction
components, making sure there is nothing left
in the pipet tip. We also will be cautious while
mixing our reactions by making sure that after
mixing there is no liquid on or in the pipet tip.
Despite that fact we were not able to create
a catalogue of bacteria in our soil sample, we
found out that there were nodule-inducing
bacteria in the soil sample used. Th is is
proven by the presence of nodules on the
roots of the alfalfa plants from the trap
experiment of Spencer (laboratory partner).
After nodules collection and DNA sequencing,
it was discovered that the nodules were
created either by Bacillus aerius strain 24K,
or by Bacillus stratosphericus 41KF2a or by
Bacillus aerophilus 28K. Nine hundred twenty-
seven nucleotides sequenced matched the
DNA sequences of the above bacteria to 98%.
Th e above Bacillus strains were extracted
for the fi rst time from cryogenic tubes
that served to gather samples of air at high
altitudes. Th e air samples were collected using
a balloon that was send to the sky on January
Figure 3 - RER Gel Result. Lane 1: 1 kb High DNA Mass Maker; Lane 2, 4: White colonies plasmid.
L1 L2 L3 L4 L5 L6 L7 L8 L9 L10 L11 L12
10k6k4k3k2k
1k

MURJ - VOLUME 384
Figure 5 - Soy Growth pots 9 days after transplantation of seed and watering on the bench at the green house (growth location). From left to right, front to back: Pot (N-, Soil+); Pot (N-, Soil+); Pot (N-, Soil+); Pot (H2O, Soil-); Pot (N-, Soil-); Pot (N-, Soil+); Pot (N-, Soil+); Pot (N+, Soil-).
Figure 6 - Apparition of fi rst leaf. On July 21 (12 days after implantation), the fi rst leaf was observed in pot (N-, Soil+) on the right.
20, 2001 from the National Scientifi c Balloon
Facility of the Tata Institute of Fundamental
Research at Hyderabad, India. Bacillus aerius
strain 24K was gathered at 24 km altitude,
Bacillus stratosphericus 41KF2a was collected
at 41 km altitude and Bacillus aerophilus 28K
was obtained at 28 km altitude.
Trap Experiment
In our trap experiment, we set up a completely
sterilized environment and inoculated
sterilized germinating soybean seeds with
Mojave Desert soil. Th e seeds after being
sterilized were incubated in sterile H2O
(Figure 4). In this experiment, we wanted to
fi nd out whether our soil sample contained
bacteria able to have symbiosis relationship
with a legume and help the legume to fi x
nitrogen from the air.
Th e seed were incubated overnight before
being place on LB to germinate. After we
transplanted the germinating seeds in the
pots, we took the pots to the UCLA green
house (Figure 5). Despite the fact we
transplanted Germinating soybean seeds, very
few of them continued to develop.
Th e fi rst seed emerging from the pot was
observed after 12 days of watering (Figure 6).
Soybeans seeds that were used for this
experiment were from an inbred line and it
seemed like they were not good or they were
not strong enough to survive the sterilization
process. In the future, a new line of wild
type soy beans will be used, or seeds will
be sterilized with a less concentrate bleach
solution and for a less amount of time.
We regularly observed and watered our plants.
Figure 7 depicts how the pots looked and the
grow level of the seeds on the 28th day of
the experiment.
After 34 days in the experiment, 4 experimental
pots still did not have plants. By consequences,
those pots were then discarded and the
experiment continued with the 4 remaining
Figure 4 - Soybean seeds being incubated in sterile H2O

LOS ANGELES MISSION COLLEGE 85
pots. Th e 4 remaining pots were constituted
of 1 experimental pot ( N-,Soil+), and the 3
control pots ( pot(H2O, Soil-), pot(N-, Soil-)
and pot(N+, Soil-)) (Figure 8).
We fi nally terminated our soy experiment on
September, 04, 2014. Th e experiment lasted
a total of 57 days. Figure 9 shows how the
plants in the 4 remaining pots looked before
they were harvested.
After we carefully removed the plants from
their pots, we cleaned the plants’ roots to
remove all the Vermiculite and Perlite. In
the control Pot (Soil-, N-) (Figure 10) we had
4 plants. We observed that the leaves of all
the plants were lightly green but they were
greener than the leaves of the plants in the
pot (soil, N-). Dry brown spots were observed
on the surroundings of the leaves. Th e roots
were long with a couple of principal roots
and a bunch of secondary roots. Th e heights
of the shoot/cotyledon of those plants were
respectively, front left to right on Figure 10,
7.80 cm, 6.60 cm, 14.30 cm and 8.25 cm. Th eir
dry weights were, also respectively from left
to right, 0.5028 g, 0.2018 g, 0.6198 g, 0.2666 g.
No nodules were observed on the roots of
all plants.
In the control Pot (Soil-, N+), we had only one
plant (Figure 11). Th e leaves were very green.
Th ey were greener and looked healthier than
all the other plants. It had one principal root
with few secondary roots. Th e height of the
cotyledon was 10.30 cm and it was dry weight
was 0.4442 g. No nodules were observed.
Figure 7 - Growth Pots Status on day 28 of the experiment. From left to right, front to back- Pot (N-, Soil+); Pot (N-, Soil+); Pot (N-, Soil+); Pot (H2O, Soil-); Pot (N-, Soil-); Pot (N-, Soil+); Pot (N-, Soil+); Pot N+, Soil-).
Figure 8 - Day 34-The 4 remaining Pots. Front only, from left to right- Pot (N-, Soil+); Pot (H2O, Soil-); Pot (N-, Soil-); Pot (N-, Soil+)
Figure 9 - Status of the 4 Remaining Growth Pots on the day of harvesting/last day of the experiment. Front only, from left to right- Pot (N-, Soil+); Pot (H2O, Soil-); Pot (N-, Soil-); Pot (N-, Soil+)
Figure 10 - Specimens Collected in control Pot (Soil-, N-)

MURJ - VOLUME 386
In the control Pot (Soil-, H2O) (Figure 12),
only one plant appeared and its leaves were
light green. Certain leaves had yellow spots
or are completely yellow. Th e plant had two
principal roots with many secondary roots.
Th e height of the cotyledon was 8.00 cm and
its dry weight was 0.3884 g. No nodules
were observed.
In experimental Pot (Soil+, N-) (Figure 13),
only one plant was present. Its leaves were
light green/almost yellow. A lot of dry brown
spots were observed on the surroundings of
the leaves. Th e plant had three principal roots
with few secondary roots. Th e height of the
cotyledon was 5.51 cm and its dry weight was
0.2330 g. We also did not see nodules on the
roots of this specimen.
Because of the absence of nodules on the roots
of the plant collected from the experimental
pot, the trap experiment ended at the plants
harvesting stage. Despite the fact that the soy
seeds germinated on the plate, most of them
did not continue their development after
transplantation. It was surprising to see the
control pot (soil-, N-) producing more plants
than the other pots, especially more than the
control pot (soil-, N+). It was later discovered
that the control pot (soil-, N-) had been
contaminated. Students were watering their
plants with a water-hose over that pot and
were therefore spilling water with nitrogen
and others nutrients in it. After the discovery
of the contamination, the pots were moved
to an area away from others’ experiments to
avoid any further watering contamination.
In the future, the location and settlement
of the experiment will be chosen more
carefully, taking into account the surrounding
experiments. A poster reading “DO NOT
SPILL TAP WATER IN THOSE POTS” can also
be put in the middle of the pots.
Metagenomic experiments and trap
experiments are two very good approaches to
discover what type of bacteria a soil sample
contains. Th e major diff erence is that with
one of these techniques, it is impossible to
Figure 11 - Specimen in control Pot (Soil-, N+) Figure 12 - Specimen in control Pot (Soil-, H2O)
Figure 13 - Specimen in control Pot (Soil-, H2O)

LOS ANGELES MISSION COLLEGE 87
go back and use the bacteria discovered. In
a metagenomic experiment, transformed
colonies containing diff erent and maybe
unique plasmids are used for sequencing.
Th erefore, after discovering which bacteria
were in those colonies, it is not possible to
cultivate exactly the same colonies. While
with the trap experiment, the bacteria in
nodules are plated and the sequencing is
done from bacteria colonies. So, when an
interesting or novel bacterium is found after
sequencing, it is possible to go to the plate
and grow that specifi c colony for
further experimentations.
MATERIALS AND METHODS
METAGENOMIC EXPERIMENT
eDNA Isolation: Th e soil sample used in this
experiment came from the Mojave Desert.
Th e Mojave Desert is located in California,
USA (northeast of Los Angeles, CA and close
to Nevada, USA). Th e soil samples were
collected in March 2014 and stored at 4 °C.
Two 0.25 g of soil sample were measured.
One sample was incubated at 30 °C overnight
(“Incubated Soil”) and the eDNA isolation of
the other was performed immediately (“Non-
Incubated Soil”). eDNA of both samples
was isolated using the DNA Isolation Kit
PowerSoil (MO BIO Laboratories) according to
the protocol of the manufacturer. Both eDNA
samples were stored at -20 °C.
Agarose Gel Electrophoresis: One half gram
of Agarose was added to 50.00 mL of 1X TAE
buff er. Th e mixture was then microwaved
several times at full power, avoiding boiling,
until it became completely homogeneous.
After the agarose-buff er mixture cooled down
for 10 minutes, 4 μL of ethidium bromide
were added. Two microliters of 6X loading dye
were added to 10 μL of each eDNA sample and
were mixed very well using pipet tips. Along
with 4 μL of 1 kb High DNA Mass Maker
loaded in the fi rst lane, 12 μL of each sample
was loaded on the gel which was run at 100
volts for 35 minutes.
Polymerase Chain Reaction (PCR): Two
microcentrifuge tubes were labeled respectively
Non-Incubated and Incubated and 25.03 μL
of a PCR stock solution was added in each of
them. A 25.03 μL of stock solution contained
2.5 μL of 10X Top Taq PCR buff er, 2.5 μL of 2
mM dNTPs, 5.0 μL of 5X Q solution, 1 μL of
fD1 primer, 1 μL of rD1 Primer, 12.9 μL of PCR
H2O and 0.13 μL of Top Taq DNA Polymerase.
fD1 primer had the sequence
5’-CCGAATTCGTCGACAACAGAGTTTGATCC
TGGCTCAG-3’ and rD1 primer had the sequence
5’- CCCGGGATCCAAGCTTAAGGAGGTGATCC
AGCC -3’. One microliter of Incubated and 1
μL of Non-Incubated eDNA was respectively
added to the labeled microcentrifuge tubes.
Th e tubes were then centrifuge at 12,000 rpm
to mix well all the reagents. Th en, they were
put in the thermocycler/PCR machine and
the HIRSCH Program was run. Th e HIRSCH
program was set as follows:
5’ @ 95 ºC
30” @ 95 ºC|
30” @ 50 ºC| x 30
60” @ 72 ºC|
hold @ 4 ºC

MURJ - VOLUME 388
Running the PCR Products: Th e PCR
products were subjected to 1% agarose gel
electrophoresis; 4 μL of 6X Orange dye were
added to each sample. Th e 4 μL of 1 kb
High DNA Mass Ladder were loaded with
the samples. A volume of 12.5 μL of each
sample was loaded twice. Th e electrophoresis
machine was set at 100 volts and ran for
35 minutes.
Purifi cation of PCR Products Using Gel
Extraction Kit: Bands in wells 6 and 7 (Non
Incubated bands) were cut together, as well
as bands in wells 8 and 9 (incubated bands),
using a sharp razor and were put in two
microcentrifuge tubes. Th ey were respectively
labeled Non-incubated and Incubated and
were stored at -20 °C overnight. Invitrogen
PureLink Quick Gel Extraction Kit by life
technologies was used for the dissolution
of the gel and purifi cation of the eDNA as
described by the manufacturer.
DNA Cloning and Transformation reaction:
Escherichia coli (E.coli) were used as competent
cells. Th e 2 μL of purifi ed eDNA was
cloned and transformed, according to the
manufacturer protocol, using TOPO® Cloning
Kit by Life technologies. A mixture of 300
μL of DMSO and 12mg of X-gal were added
to the cloning reaction. Th e reaction was
plated on LB plus ampicillin. Th e ampicillin
concentration was 100 μL/mL. Th e plate
produced blue and white colonies. Th en, two
white colonies (colonies with clone inside)
were each inoculated in 5 mL of LB and placed
in a 37 °C shaker overnight at 200 rpm.
Plasmid Isolation/Collection: Th e plasmid
isolation was performed using Invitrogen
Purelink™ Quick Plasmid Miniprep Kit
(by life Technologies) according to the
manufacturer’s protocol.
Restriction Enzyme Reactions (RER): Five
microliters of plasmid was added to a 15 μL
of a solution containing 2 μL of EcoRI buff er,
12.5 μL of sterile H2O and 0.5 μL of EcoRI.
Reaction was incubated at 37 °C for an hour,
then, 12 μL was run on 1% agarose. Th e DNA
fragment was collected from the gel, purifi ed
as above.
Sequencing Reactions: Five microliters of
plasmid purifi ed in the previous step was
added to cocktail containing 2 μL of 5X
Sequencing buff er, 1 μL of 10 μM F1 primer,
1 μL of sequencing H2O and 1 μL of Big Dye.
Th e reaction was put in the PCR machine and
the program called “Ann Hirsch Protocol/
BigDyeSeq/55°C-40 Cycles” was run. Th e
program ran for approximately 4 hours,
9 minutes.
Cleaning/Purifying Sequencing Reaction
samples and DNA Sequencing: A Dye Ex™
2.0 Spin Column was vortexed at medium
at speed and the bottom of the column was
opened. Th e Dye Ex™ 2.0 was introduced
in a 2 mL collection tube and centrifuged at
3,000 rpm for 3 minutes. Th e fl ow-through
was discarded and the Dye Ex™ 2.0 was placed
in a clean 2 mL microcentrifuge tube. Th e
sequencing reaction was then loaded in the
center of the inclined gel inside the Dye Ex™

LOS ANGELES MISSION COLLEGE 89
2.0, holding the inclination away. Th en the
tube was centrifuged at 3,000 rpm for 3
minutes. Th e Dye Ex™ 2.0 was then discarded
and the purifi ed sample was collected in the
microcentrifuge. Th e purifi ed sequencing
reaction was taken to the DNA Sequencing
Room (room 30-125), on the 3rd fl oor of the
UCLA School of Medicine.
TRAP EXPERIMENT
Seed Sterilization: Soy seeds incubated in
70% Ethanol for 1 minute (min). Th en, they
were incubated in full strength bleach for 2
minutes and washed 5 times with sterile water
and incubated in sterile water overnight. All
the above steps were performed in a hood.
Germination: Th e seeds were then placed on
1% Luria Broth (LB) agar plates to germinate.
Th ey were incubated at 37 °C for 48 hours.
Growth Pot Preparation: Th e growth pots
were approximately 3 liters. Th ey were
washed with soap and water and autoclave
sterilized for 3 minutes (to avoid melting). A
mixture of 6 growth pots of vermiculite and
3 growth pots of perlite (2/3 vermiculite and
1/3 perlite) were sterilized in an autoclave
for 20 minutes. Th e growth pots were fi lled
with Ver-Per mixtures and feeder tubes were
inserted in the center of each pot (all pots
were prepared in a hood).
Seed Transplanting: Th e seeds that had
started to germinate were planted in the pots.
In a hood and using sterilized forceps, we
planted 6 to 8 seeds per pots.
Soil Preparation and Inoculation: Th e soil
sample used in this experiment came from
the Mojave Desert. Th e Mojave Desert is
located in California, USA (northeast of Los
Angeles, CA and close to Nevada, USA). Th e
soil samples were collected in March 2014
and stored at 4 degrees Celsius. Fifteen
microliters of soil was mixed with Millipore
water, forming a total volume of 50 mL, and
incubated at 30 °C overnight. Using a sterile
pipet, every pot was inoculated with 15 mL of
Mojave soil extract.
Experiment Location and Watering: Th e
surface of each pot was covered with plastic
beads to reduce contact with the exterior
environment. Th en they were transported to
the UCLA green house and watered through
the feeder tubes as follows: the fi ve pots
inoculated with soil (experimental samples
(Soil, N-)) were watered with Hoagland’s
medium without nitrogen (composition per
liter: 2 ml of 1 M magnesium sulfate, 1 mL
of 1 M potassium dihydrogen phosphate, 1
ml of iron ethylenediaminetetraacetic acid
stock (1 M FeEDTA), 1 ml of micronutrients
stock 5 mL of 1 M calcium chloride, 5
mL of 1 M potassium chloride, 984 ml
of Millipore purifi ed water); of the three
remaining pots (control pots), one was
watered with Hoagland’s medium without
nitrogen (No soil, N-), one (No soil, N+)
with Hoagland’s medium with nitrogen
(Hoagland’s medium with 5 mM potassium
nitrate), 1 mL of Micronutrients stock, 2
mL of 1 M magnesium sulfate, 984 mL of

MURJ - VOLUME 390
Millipore purifi ed water), and the last one
with sterilized water (no soil, H2O). Every pot
was watered with 300 mL of their respective
media (N-, N+, and sterilized H2O). Each pot
was watered as needed, typically twice per
week. Th e second week, the plants were fed
with 300 mL of their respective media and the
third week they were watered with 200 mL.
Plant Harvesting: Th e pots were brought back
to the laboratory and the plants were carefully
removed entirely with their roots, making
sure not to break them and not to cut roots
when possible. Th e roots of the plants were
then washed with tap water to remove all the
Perlite and Vermiculite. After the pictures
and height of the cotyledon were taken, the
plants were separately wrapped in paper towel
according to their pot of origin. Th en they
were incubated to dry at 67 °C overnight.
After incubation, their dry weight was taken.
ACKNOWLEDGEMENTS
I would like to thank Dr. Ann Hirsch for
giving me the opportunity to learn, work and
grow in her laboratory. I would like to thank
Dr. Maskit Maymon for all the teachings,
assistance, patience and advises. Th e
experience and knowledge I gained on your
sides is priceless. I would like to thank Title
III STEM program for providing and funding
internships like this for L.A. Mission College
students. I also would like to thank Professor
Stephen Brown for assisting me during all
the summer and in the writing of this paper.
Finally, but not least, I would thank to my
laboratory partners Alex Rahban and Spencer
Flynn for their support.
REFERENCES
1) Kaplan, D., Maymon M., Agapakis, C.M.
Lee, A., Wang, A., Prigge, B.A., Volkogon,
M. and Hirsch, A.M., “A survey of the
microbial community in the rhizosphere of
the dominant plant of the Negev Desert,
Zygophyllum dumosum Boiss., using
cultivation-dependent and ?independent
methods,” American Journal of Botany, 100 :
1713-1725 (2013)
2) Shivaji, S. “Bacillus aerius sp. nov.,
Bacillus aerophilus sp. nov., Bacillus
stratosphericus sp. nov. and Bacillus
altitudinis sp. nov., isolated from cryogenic
tubes used for collecting air samples from
high altitudes.” INTERNATIONAL JOURNAL
OF SYSTEMATIC AND EVOLUTIONARY
MICROBIOLOGY 56 (7): 1465–1473.(2006)
doi:10.1099/ijs.0.64029-0. ISSN 1466-5026
3) http://www.ncagr.gov/cyber/kidswrld/
plant/nutrient.htm

LOS ANGELES MISSION COLLEGE 91
Eff ects Of Fluorinated Microporous
Active-Carbon In Th e Capacitance Of
Electrochemical Double-Layer Capacitors Jesus M. Lopez Baltazar, Huihui Zhou[a], Yunfeng Lu[a]
[a] Department of Chemical and Biomolecular Engineering
University of California, Los Angeles
ABSTRACT – Carbon based electrochemical capacitors, also named supercapacitors, together with fuel cells
and batteries represent types of electrochemical energy storage devices. Compared with batteries and fuel cells,
supercapacitors deliver their stored energy in a few seconds, off ering higher power densities and long cycling life.
However, supercapacitors based on the electrochemical double-layer capacitance (EDLCs) have lower energy density
compared to batteries and fuel cells, which limits their application as energy storage devices. In this project, in order
to improve the energy density of EDLCs, fl uorination of the carbon-based electrodes was attempted to enhance the
wettability between electrode materials and the electrolyte and to fully utilize the carbon surface area, thus enhancing
the overall capacitance of carbon-based supercapacitors. Two types of commercialized active carbon (named as CAC
and SAC, respectively), used as electrode materials, were fl uorinated with HF by sonication at room temperature and
prepared for electrochemical tests. Although similar electrochemical responses were obtained from CAC and fl uorinated
CAC (F-CAC), the capacitance value for fl uorinated SAC (F-SAC) was found to be 121.42 Fg-1, which is slightly higher
than the capacitance value of 116.91 Fg-1 found for SAC, showing a trend of improvement in the capacitance value of
fl uorinated carbon-based EDLCs. Fluorination of the carbon materials CAC and SAC still needs further experimentation
to confi rm the possibility of promising features in the application of portable electronic devices and electric vehicles.
transmittance of energy in communication
devices and storage systems[11].
Electrochemical energy storage devices
(EESDs) could be of three diff erent types:
batteries, fuel cells, and electrochemical
capacitors. A common basic structure is
shared among EESDs. For instance, all EESDs
have at least two electrodes composed of
metal collectors and active material which is in
contact with an electrolyte solution separated
by a polymeric membrane denominated a
separator. Th e processes that provide certain
amounts of energy take place at the electrode/
electrolyte interface for these three types of
devices, but their nature diff ers in each device.
Redox reactions, for instance, take place
in batteries and fuel cells. Electrochemical
INTRODUCTION
Fossil fuels are currently the most common
type energy resources used to satisfy the high
demand for energy consumption in a variety
of mobile and stationary devices. Given
the limited nature of this natural organic
source of energy, fossil fuels are forecast to
be exhausted in the subsequent years, thus
highlighting the importance for the search
of new renewable energy sources that could
provide similar features possessed in fossil
fuels with reduced emissions of CO2. Th e
production of new environmentally-friendly
energy comprises the use of solar cells,
wind mills and hydroelectric turbines[3].
Nonetheless, electrochemical energy-storage
devices are the most suitable option for the

MURJ - VOLUME 392
capacitors, also known as supercapacitors,
store and deliver energy by the formation
of an electrical double layer formed in the
electrode/electrolyte interface due to the
orientation and position of electrolytic ions
when an external load is in contact with the
conducting electrodes[6, 13].
Supercapacitors can be classifi ed as
electrochemical double-layer capacitors
(EDLCs) and pseudocapacitors. Th e
diff erence between the last two lies in
the faradaic or redox processes that take
place in the outermost atomic layer of the
electrode surface of pseudocapacitors.
Energy storage and delivery in EDLCs rely
on pure electrostatic attractions between
the ions of the electrolyte solution and the
active material of the electrodes. During
the charging process, the electrodes of the
supercapacitor become electrically charged
due to the electromotive force provided by an
external source of energy, which generates
a potential diff erence between them[6].
Th e charge of the electrodes is of equal
magnitude, but diff erent sign. Th e negatively
charged electrode (negative electrode) and
the positively charged electrode (positive
electrode) generate a movement of the
electrolytic ions, attracting those of opposite
charge[2]. Figure 1 shows a representation
of the basic structure of an EDLC during the
charging process. Th e electrolytic ions are
retained on the surface area of the active
material of the electrode by coulombic forces
but do not react with it. Energy is therefore
stored on an electrolytic double layer that
forms on the electrode/electrolyte interfaces
of the supercapacitor. During the discharging
process, the electric potentials of the
electrodes are reversed in sign generating a
movement of the electrolytic ions towards the
opposite direction from their original location
attained in the charging process. Th is, in turn,
creates a parallel movement of electrons in the
outside connections, delivering energy in the
form of electric current.
Figure 1 - Representation of the basic structure of an EDLC used in this project during a charging cycle. The elements depicted in the image are the Aluminum metal collectors, fl uorinated microporous active carbon as the active material (black fi gures next to the metal collectors), the fi berglass used a separator and the electrolytic ions moving towards the oppositely charged electrodes. The formation of the double layer over the electrodes can be appreciated and is represented in the simplifi ed circuit diagram below the main image.

LOS ANGELES MISSION COLLEGE 93
Batteries are the most widely used type
of EESD due to the considerable amounts
of energy (with specifi c energy density
values as high as 180 kWh/g compared
with other EESDs) that they can store in a
relatively small volume[1]. Supercapacitors
off er complementary advantages that are
void of batteries and fuel cells. EDLCs can
deliver their stored energy in the order
of seconds, providing high specifi c power
densities as high as 104 kW/g compared
with other EESDs. Furthermore, they off er
long cycle life of over 105 cycles as they do
not have the disadvantage of cumulative
irreversible capacity and loss of material
often found in batteries and fuel cells due to
redox reactions[1]. Th e terms specifi c energy
density and specifi c power density refer,
respectively, to the amount of energy stored
per mass and the amount of energy delivered
per second for every unit of specifi c mass of
active material. Figure 2 shows a Ragone plot
comparing specifi c power and energy densities
of combustion fuels, conventional capacitors
and EESDs. Compared with conventional
Figure 2 - Ragone plot comparing specifi c energy and power densities of different energy sources[6]
electrostatic capacitors, supercapacitors have
the highest values of specifi c energy density
and the highest values of specifi c power
density compared to batteries and fuel cells[13].
Hence, supercapacitors represent a promising
choice for a variety of applications ranging
from back-up memory systems, and portable
electronic devices to hybrid electric and
electric vehicles. One of the most important
current applications of supercapacitors lies in
the startup ignition of vehicles where specifi c
amounts of energy need to be delivered in
short amounts of time[1, 8, 9].
Th e main challenge faced by supercapacitors is
their limited energy density values compared
with batteries and fuel cells, which limits
their application as energy-storage devices.
Th e amount of energy that can be stored in
a supercapacitor depends on several factors
such as the active material used, the molecular
composition of the electrolyte and the
electrode/electrolyte interface[2, 3].
Th eoretically, the stored energy in a
supercapacitor is given by:
where, E is the energy stored, C is the
total capacitance of the double layer and V
represents the working voltage run across
the electrodes. According to this formula, it
is possible to increase the energy density of
supercapacitors by generating an increasing
in their working voltage, capacitance, or
both. Th e working voltage of supercapacitors
depends largely on the molecular structure
of the active materials and electrolytes being

MURJ - VOLUME 394
used. Th e last two factors, however, are
linked with each other, which makes it hard
to change the electrolyte being used without
aff ecting the electrode material[3, 13].
Increasing the capacitance of EDLCs
represents a practical way of enhancing their
energy density[9]. According to:
C= ε0εSA d
the capacitance of EDLCs depend on the
dielectric constants of the vacuum and (ε0)
materials (εS) between the electrochemical
double layers (EDLs), the surface area of the
active material available for charge storage
(A) and the thickness (d) of the EDLs. Most
research done focuses on increasing the
surface are by using carbon-based electrodes
due to the favorable properties of carbon
such as high surface are, high electrical
conductivity, chemical stability in a wide
range of pH media, versatile forms, stability
in a wide range of temperatures, availability,
nontoxic nature, and low cost[1, 2, 3, 4, 5, 10].
With the advance in nanotechnology, new
carbon materials such as carbon nanotubes,
carbon fi bers, carbon foams, and nanoporous
carbons have been explored to improve the
performance of EDLCs[1, 3, 4, 12, 13]. Activated
carbons, however, are the most widely carbon-
based electrodes to increase the capacitance
of EDLCs due to their extremely high specifi c
surface area (up to 3000 m2/g) and small pore
size (with diameters < 2 nm) [1, 7]. Because
certain functional groups in carbon materials
restrain the contact of certain portions of
the surface area of the electrode with the
electrolyte, increasing the wettability of
these materials is imperative in increasing
the capacitance. Fluorination is an eff ective
method to modify the chemistry surface of
the active material, controlling the percentage
of specifi c surface area of active material
participating in electrolytic-ion-attraction
interactions[5, 9, 10, 11]. In this project, the
chemistry surface of microporous activated
carbon was altered with the introduction
of fl uorine atoms in the carbon’s functional
groups in an attempt to increase the
wettability of the active material with an
organic electrolyte in order to optimize the
eff ective surface area participating in charge
storage, thus enhancing the capacitance and
energy density of EDLCs.
EXPERIMENTAL
A. Synthesis of Materials
Two diff erent types of commercialized
activated carbon, named CAC and SAC
respectively, were used as the carbon sources.
Th e fl uorination was carried out by stirring
~2.000 mg of each sample with a mix acid
combination of ~20 ml of 40% HF (Sigma-
Aldrich, HF puriss, p.a., reag. ISO, reag. Ph,
Eur., ≥40%) and ~20.0 ml of HNO3 (Safe-
Cote, HNO3, Certifi ed ACS plus 15.8 N). Th e
mixture was treated with sonic waves at room
temperature overnight. Fluorinated CAC and
fl uorinated SAC were labeled as F-CAC and
F-SAC respectively.
B. Electrochemical Measurements
For each sample F-CAC and F-SAC, rubber-
type electrodes were synthesized by using

LOS ANGELES MISSION COLLEGE 95
the fl uorinated samples as the active
material, Carbon Black as the conductive
additive and polytetrafl uoroethylene (Sigma-
Aldrich, PTFE) as the binder. Th e electrode
comprised 80% wt. active material, 10% wt.
conductive additive, and 10% wt. binder.
Th e electrochemical test were carried out
by addition of 1.00 mg of the F-CAC and
F-SAC slurries to carbon coated aluminum
foil, and sealed by a coin-type cell in which
the electrolyte was tetrabutylammonium
tetrafl uoroborate (TBABF4) and the separator
was glass fi ber. Th e cyclic voltammetry (CV)
tests were conducted from 0.0 V to 2.7 V.
Th e galvanostatic charge/discharge tests
(GC) were conducted by running diff erent
constant currents of 0.3 A, 0.5 A, 1.0 A, 5.0 A,
10.0 A, 20.0 A, 40.0 A, and 60.0 A. Th e total
capacitance of the EDLC was calculated from
the GC tests by using the formula:
where I (mA) represents the current run
during the charge and discharge processes,
w (mg) represents 80% of the mass of active
material measured (only 80% of active
material contributes to the electrochemical
performance of the EDLC) ΔV (V) represents
the potential drop between the electrodes and
Δt(s) represents the time interval necessary
for the EDLC to drop from 2.7 V to 0.0 wV.
Because a double layer is formed, there are
two capacitor-like structures in series within
the same EDLC. From:
the total capacitance of the EDLC (Ctot) is
equal to the reciprocal of the addition of
the reciprocal of each one of the individual
capacitances of the layers. Assuming that C1
= C2, we know that
where Csl represents the capacitance of each
electrode/electrolyte interface[13].
RESULTS AND DISCUSSION
To evaluate the eff ect of fl uorination on the
surface of SAC and CAC, impedance tests, CV
tests and GC tests were conducted. Figure
3 shows the graphs of the impedance tests
obtained. Figure 3a denotes the impedance
test at a full range of frequencies. It can be
seen that F-CAC and F-SAC have greater
slopes compared to the slopes of CAC and
SAC. Th is result can be interpreted as an
increase in the dominance of charge-storage
phenomena over the non-fl uorinated CAC
and SAC samples, which implies that there
is more activity in the electrode/electrolyte
interface. Figure 3b shows the impedance
test at high frequencies. Th e beginning of the
semicircle indicates the resistance associated
with the materials of the EDLC. Th e end
of the semicircle refers to the equivalent
series resistance (ESR) or total impedance
of the EDLC including electrode resistance,
interfacial resistance between the electrode
ad the collector, ionic diff usion resistance
through pores, resistance of ions while
moving through separators, and electrolyte
resistance[4]. It can be noticed that the F-CAC
and F-SAC samples presented lower material

MURJ - VOLUME 396
Figure 3 - Impedance tests of samples at: a) full range frequencies, b) high frequencies
Figure 4 - Cyclic Voltammetry tests of: a) CAC, b) SAC, c) F-CAC, d) F-SAC
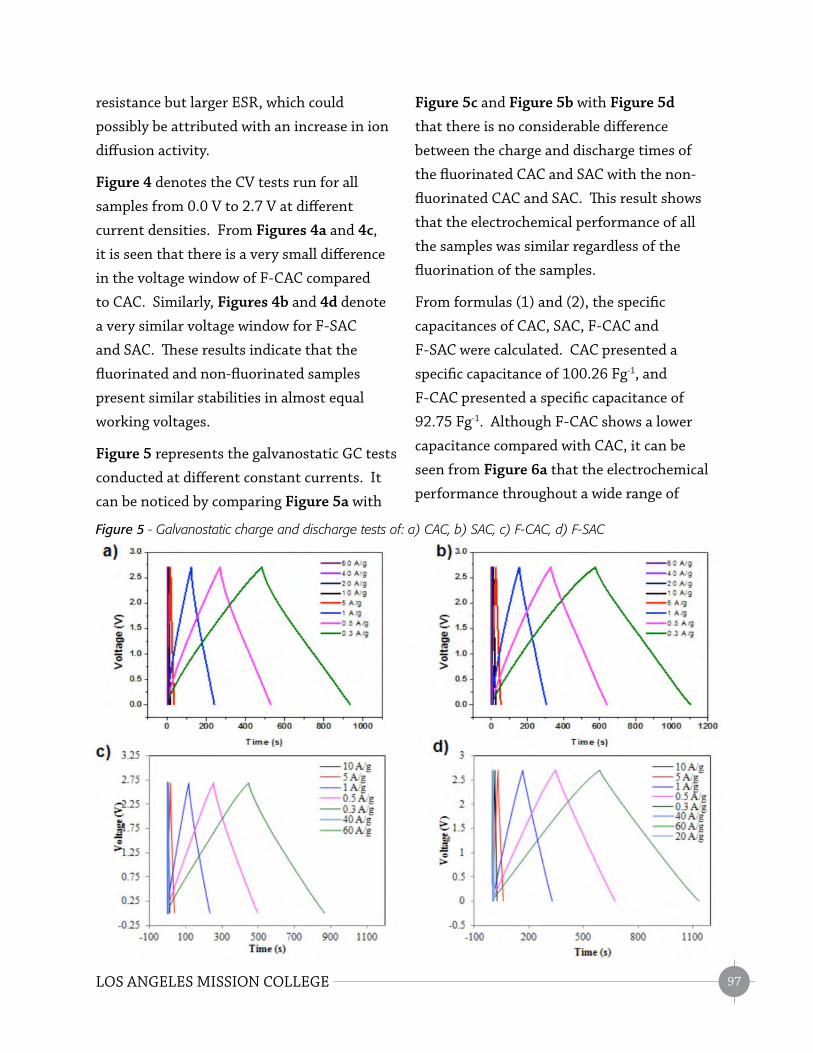
LOS ANGELES MISSION COLLEGE 97
resistance but larger ESR, which could
possibly be attributed with an increase in ion
diff usion activity.
Figure 4 denotes the CV tests run for all
samples from 0.0 V to 2.7 V at diff erent
current densities. From Figures 4a and 4c,
it is seen that there is a very small diff erence
in the voltage window of F-CAC compared
to CAC. Similarly, Figures 4b and 4d denote
a very similar voltage window for F-SAC
and SAC. Th ese results indicate that the
fl uorinated and non-fl uorinated samples
present similar stabilities in almost equal
working voltages.
Figure 5 represents the galvanostatic GC tests
conducted at diff erent constant currents. It
can be noticed by comparing Figure 5a with
Figure 5c and Figure 5b with Figure 5d
that there is no considerable diff erence
between the charge and discharge times of
the fl uorinated CAC and SAC with the non-
fl uorinated CAC and SAC. Th is result shows
that the electrochemical performance of all
the samples was similar regardless of the
fl uorination of the samples.
From formulas (1) and (2), the specifi c
capacitances of CAC, SAC, F-CAC and
F-SAC were calculated. CAC presented a
specifi c capacitance of 100.26 Fg-1, and
F-CAC presented a specifi c capacitance of
92.75 Fg-1. Although F-CAC shows a lower
capacitance compared with CAC, it can be
seen from Figure 6a that the electrochemical
performance throughout a wide range of
Figure 5 - Galvanostatic charge and discharge tests of: a) CAC, b) SAC, c) F-CAC, d) F-SAC

MURJ - VOLUME 398
current densities is very similar. Th erefore,
such diff erence in the capacitance of F-CAC
compared to CAC cannot be considered as
a detrimental eff ect of fl uorination on the
EDLC’s performance. Th e specifi c capacitance
of F-SAC was 121.42 Fg-1, and that of SAC was
116.91 Fg-1. Although the diff erence in the
last two capacitances is small, as represented
in Figure 6b, from Figure 6a, it can be
noticed that in a wide range of currents,
the capacitance of F-SAC showed a trend of
improvement over the capacitance of SAC.
Th us, this diff erence could be interpreted
as a possible eff ect of fl uorination on the
electrochemical performance of EDLCs.
CONCLUSION
Fluorination of commercialized active carbons
CAC, SAC, showed slightly positive eff ects
on the electrochemical performance of these
materials. Impedance tests showed that there
was an increased in the ion diff usion activity
for both F-CAC and F-SAC. CV-tests and
GC-tests showed that there was a similar
performance in fl uorinated and non-
fl uorinated samples. From the calculations
of the specifi c capacitances of all samples, it
is concluded that the project did not show an
enhanced eff ects for CAC after fl uorination.
However, a slightly signifi cant trend of
improvement was observed for the F-SAC
samples. Further experimentation needs
to be performed on these commercialized
active materials to demonstrate and confi rm
possible promising eff ects of fl uorination on
the electrochemical performance of EDLCs
for further application on portable electronic
devices and electric vehicles as substitutes
for batteries.
ACKNOWLEDGEMENTS
Th is project was made possible thanks to
the Transfer Student Summer Research
Program (TSSRP) at the Henry Samueli
School of Engineering and Applied Science
at Th e University of California, Los Angeles
(UCLA), the support from Lu Lab from the
Department of Chemical and Biomolecular
Engineering and the support and guidance
from the STEM program at Los Angeles
Mission College.
a)
b)
Figure 6 - Specifi c capacitances of tested samples at: a) wide range of current densities; b) fi nal specifi c capacitances of samples at scanning rates of 0.3 mV s-1

LOS ANGELES MISSION COLLEGE 99
REFERENCES
[1] Zhai, Y. P., et al. “Carbon Materials
for Chemical Capacitive Energy Storage.”
Advanced Materials 23.42 (2011): 4828-4850.
[2] Frackowiak, Elzbieta, and François
Béguin. “Carbon‐Based Nanomaterials
for Electrochemical Energy Storage.”
Nanotechnology for the Energy Challenge
(2010): 177-204.
[3] Ghosh, Arunabha, and Young Hee Lee.
“Carbon‐Based Electrochemical Capacitors.”
ChemSusChem 5.3 (2012): 480-499.
[4] Zhang, Li Li, and X. S. Zhao. “Carbon-
based materials as supercapacitor electrodes.”
Chemical Society Reviews 38.9 (2009):
2520-2531.
[5] Jung, Min-Jung, et al. “Fluorination
eff ect of activated carbon electrodes on the
electrochemical performance of electric
double layer capacitors.” Journal of Fluorine
Chemistry 132.12 (2011): 1127-1133.
[6] Winter, Martin, and Ralph J. Brodd. “What
are batteries, fuel cells, and supercapacitors?”
Chemical reviews 104.10 (2004): 4245-4270.
[7] Lillo-Ródenas, M. A., D. Cazorla-Amorós,
and A. Linares-Solano. “Understanding
chemical reactions between carbons and
NaOH and KOH: an insight into the chemical
activation mechanism.” Carbon 41.2 (2003):
267-275.
[8] Schneuwly, Adrian, and Roland
Gallay. “Properties and applications of
supercapacitors: From the state-of-the-art to
future trends.” Rossens, Switzerland (2000).
[9] Lee, Young-Seak. “Syntheses and
properties of fl uorinated carbon materials.”
Journal of Fluorine Chemistry 128.4 (2007):
392-403.
[10] Kim, Mok-Hwa, et al. “Fluorinated
activated carbon with superb kinetics for the
supercapacitor application in nonaqueous
electrolyte.” Colloids and Surfaces A:
Physicochemical and Engineering Aspects 443
(2014): 535-539.
[11] Jung, Min-Jung, et al. “Physico-chemical
surface modifi cation of activated carbon
by oxyfl uorination and its electrochemical
characterization.” Colloids and Surfaces A:
Physicochemical and Engineering Aspects 389.1
(2011): 274-280.
[12] Lee, Jinwoo, Jaeyun Kim, and Taeghwan
Hyeon. “Recent progress in the synthesis of
porous carbon materials.” Advanced Materials
18.16 (2006): 2073-2094.
[13] Sharma, Pawan, and T. S. Bhatti.
“A review on electrochemical double-
layer capacitors.” Energy Conversion and
Management 51.12 (2010): 2901-2912.

STEMLOS ANGELES MISSION COLLEGE
SCIENCE TECHNOLOGY ENGINEERING MATH
13356 Eldridge Avenue Sylmar, California 91342 www.lamission.edu
Mission Undergraduate Research Journal
Printed on recycled paper with vegetable-based inks