Embed Size (px)
Citation preview

MUSE: A tool for testing and debugging a multi-terminal programming system
by E. W. PULLEN and D. F. SHUTTEE Control Data Corporation Palo Alto, California
INTRODUCTION
Current literature on multi-terminal time sharing systems has a great deal to say about the macroscopic relationship of their parts and the statistics of their performance. However, very little is written about the efforts expended in putting them together or making them work efficiently and reliably, in the hands of the users. Traditionally checkout and testing of multi-terminal systems have assumed a method of an on-site marathon. Testing of the product outside the customer's shop has been virtually non-existent.
A major problem facing the system engineer in the checkout of suc!1 systems is just getting all the pieces together. In a large system with 64 terminals, for instance, it is not economically practical to assemble this equipment and make it available for several months, even when floor space and other logistic problems have been solved. To man this number of terminals, coordinate the activity at each one, and reproduce the system problem in such an environment is a virtual impossibility. Added to this is the problem of subjecting a multi-terminal system to various job environments and various types of users.
The system engineer could stand like the conductor of some great symphony orchestra. With baton poised, he would strike the note for a worst case loading of the system by his Teletype operators. But this would be unrealistic and uneconomical as the problem of checking a number of potential worst case conditions would still remain, as would the problem of repeating the results in case of system malfunction. Astfbtle, but nonetheless serious problem is determining the margiilal performance of a system when one more terminal is added or a significantly different work load is imposed through one terminal. Effects of changes in background computing activities must also be superimposed on the multi-terminal environment.
The traditional approach is to do a best job with a few terminals. The system is then installed in the
491
customer's environment with a larger - but probably not the maximum - number of terminals. Debugging and testing proceeds on-site until the customer is satisfied with the quality of system performance. The trauma associated with this approach is similar to bringing up ten or twenty little batch systems all at once, all interconnected, only worse.
The .. customer bears the burnt of equipment costs. He pays for terminals and lines he cannot put to use and concurrently he pays for computing time and machine hours which could be put to other uses. When the system programmers eventually leave - all too soon as far as the customer is concerned - there is little information on the effects of adding one, five, or ten more terminals to the system. When major design flaws are encountered during on-site debugging, the emphasis is on a quick fix. Often, the result is a very complicated product which cannot be readily updated or improved.
Unfortunately the end product may not be readily usable for another customer even when hardware configurations are similar.
The obvious solution is to do the job right in the first place. Time sharing systems must be balanced in their resource requirements (memory, disk space, data channel access, ets.) just as c~refully as any power plant fly-wheel. Simulation of an entire system is an effective tool for testing and debugging in the early stages of planning and design. This type of simulation is most useful in defining the problems. Simulation, however, of interaction between user and parts of the system has been overlooked. Designs have been frozen before critical resource conflicts become apparent. Time-critical and resource-critical conditions fall by the way only to resurface in the customer's shop. At this point, a hasty fix can change a well designed system into a poorly. constructed one.
Another submerged problem is associated with making large amounts of terminal and mUltiplexing
From the collection of the Computer History Museum (www.computerhistory.org)
492 Spring Joint Computer Conference, 1968
hardware available in the early development stages even when such equipment can be manned efficiently. This is the problem of hardware-software lag. Communications and terminal hardware designs must be fairly well defined before even a few prototypes can be made avaiiabie for software development. \Vhen many terminals are required, flexibility in the hardware design is many times diminished. The software designer is once again confronted with unilateral hardware d~sign decisions and an integrated system design is again frustrated.
Considerations such as the foregoing resulted in an attempt to simulate the user and communications
. environment' in a program caned MUSE (Muiti-User Environment Simulator). This program allows the multi-terminal system to be extensively exercised independent of multiplexing and terminal hardware. As many as 64 users may be simulated at one time. This program, and to some extent the time-sharing system it tested, are the subjects of this paper.
The tested system
The MUSE program represents a joint effort of the RESPOND (Remote Sharing and Processing of Data) development project and the Quality Assurance Department. The purpose of this effort was to develop a tool for debugging and testing the CONTROL DATA 6000 Series TIY RESPOND time sharing system. The RESPOND system was designed to perform the following tasks:
• Define, store and retrieve files with respect to disk storage devices at the computer site
• Create programs in the form of executable files • Submit these files for processing in the batch
environment controlled by the SCOPE operating system
• Allow output results from the SCOPE processing to be placed on permanent disk files accessible to the user through his remote terminal
rhese capabilities co-exist with the full range of batch ?rocessing operations provided by the SCOPE operating system.
TIY RESPOND is a standard Control Data Corporation product, based on a special system developed by Control Data Corp. for the University of Texas and Aachen University in West Germany. The system operates within a hardware configuration which includes CONTROL DATA 6400, 6500 or 6600 computers with a minimum of 65 thousand words of central core storage (60 bits per word). A Control Data Corp 6676 Communications Terminal Controller acts as the mUltiplexer between the computer data channel and up to 64 Teletype terminals. These terminals may be connected to the multiplexer over
DATAPHONE Service or directly through a standard signal and data set coupler interface.
A resident program includes the command processing code and housekeeping tables for the terminals. Scratch storage is requested and released dynamically from the SeQ PE system as buffers are required for implementing the commands. The amount of core used is dependent upon the number of active terminals in the system, the type of activity at each terminal, and the amount of core available to the 'System. A request for core is placed in a queue if it cannot be satisfied. Queues are also maintained for disk requests, SCOPE processing operations, and output operations. Operation of these queues under a manyterminal environment was of primary interest during program debugging and testing.
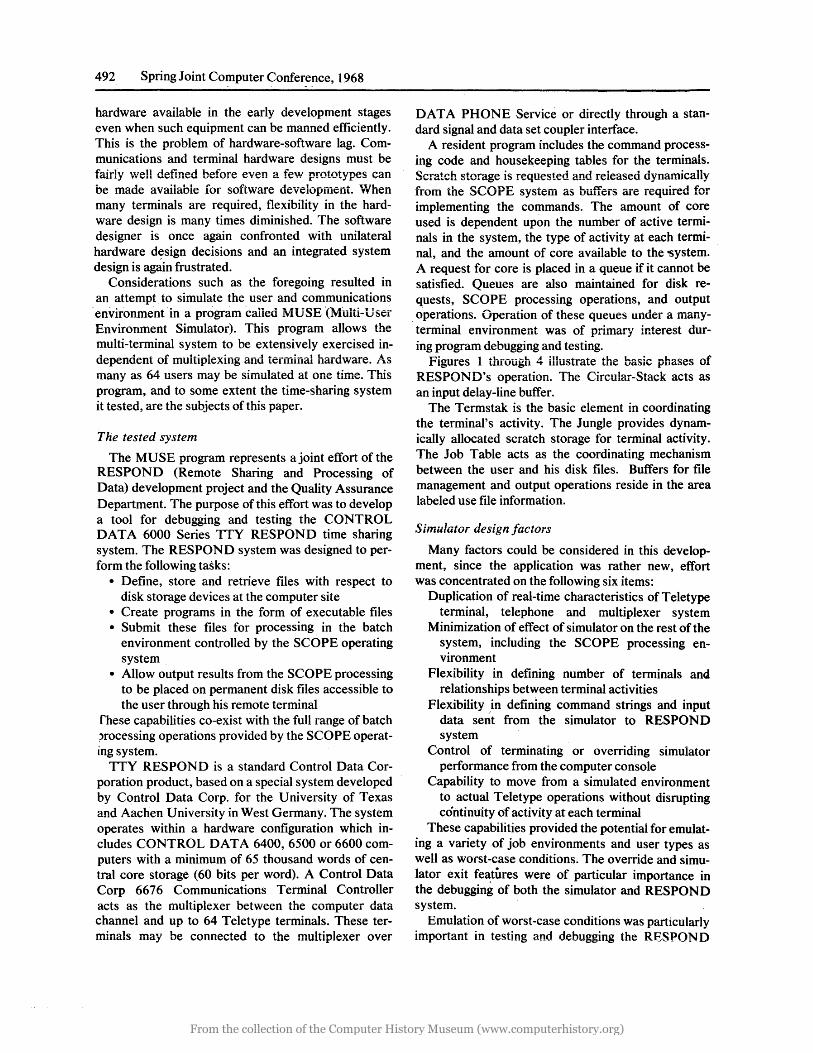
Figures 1 through 4 illustrate the basic phases of RESPOND's operation. The Circular-Stack acts as an input delay-line buffer.
The Termstak is the basic element in coordinating the terminal's activity. The Jungle provides dynamically allocated scratch storage for terminal activity. The Job Table acts as the coordinating mechanism between the user and his disk files. Buffers for file management and output operations reside in the area labeled use file information.
Simulator design factors
Many factors could be considered in this development, since the application was rather new, effort was concentrated on the following six items:
Duplication of real-time characteristics of Teletype terminal, telephone and mUltiplexer system
Minimization of effect of simulator on the rest of the system, including the SCQ PE processing environment
Flexibility in defining number of terminals and relationships between terminal activities
Flexibility in definIng command strings and input data sent from the simulator to RESPOND system
Control of terminating or overriding simulator performance from the computer console
Capability to move from a simulated environment to actual Teletype operations without disrupting continuity of activity at each terminal
These capabilities provided the potential for emulating a variety of job environments and user types as well as worst-case conditions. The override and simulator exit features were of particular importance in the debugging of both the simulator and RESPOND system.
Emulation of worst-case conditions was particularly important in testing and debugging the RESPON D
From the collection of the Computer History Museum (www.computerhistory.org)
product. Worst-case conditions are defined as those which place the heaviest simultaneous load on the RESPOND queueing structure for resources. Two general sets of problems appear under these circumstances:
lOP Program
Periodically samples multiplexer Receives 12-blt character Into terminal I/O buffer Sel>arates and packs Input cbaracters into right-character buffers Attaches input identification code and·transfers buffer to circular stack
RXP Program
Detects and marks termination of input in TERIIISTAK
Service Program
Analyzes Input word In circular stack and parcels input Into jungle unit assigned to terminal Determines wh .. ther Input is a command or incoming data Updates job ·Iablefor terminal If a comn,and, seta flags In TERMSTAK for required processing routine If Incoming data, assembles data in buffer (or transfer to the disk and Issues disk write request
Figure 1- Input
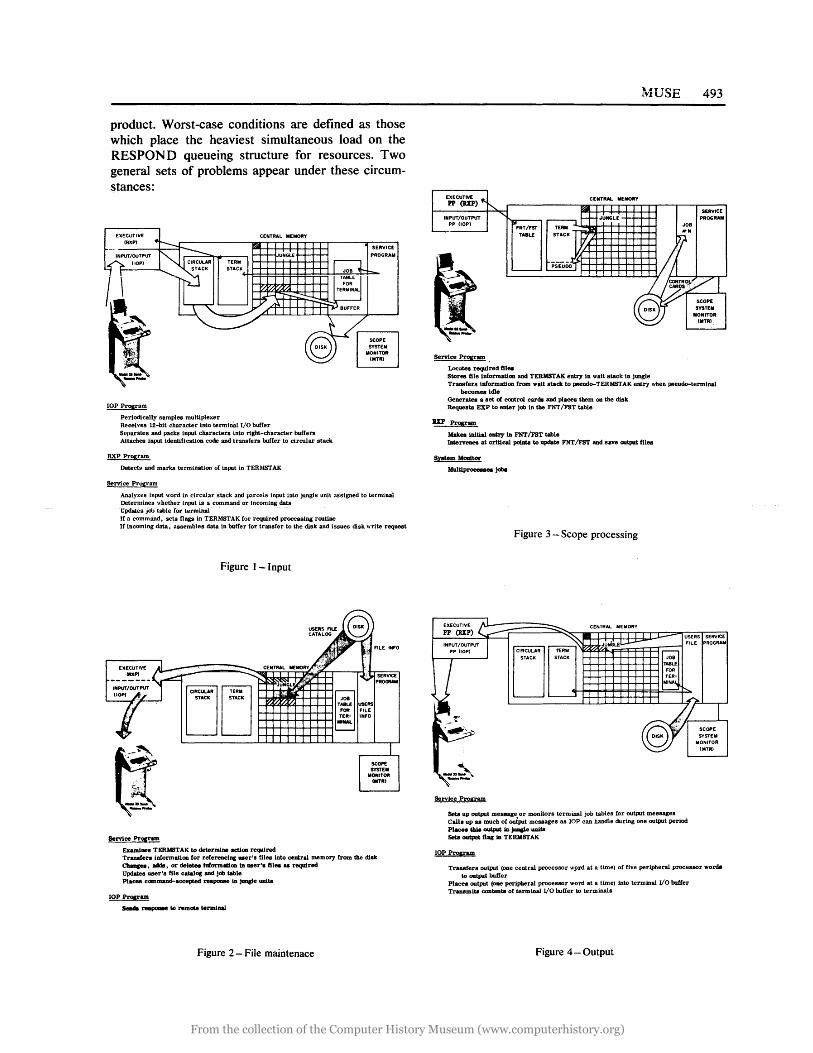
Service Procram
Examines TERMSTAK to determine ..:tionl'eqllired Transfel'll Information for referencing user's flies Into central memory from the disk Cbups, adds, or deletes luformMlanln .. er's til ... required Updates user's file catalog mel jGb table Places command-accepted response In jungle units
lOP Program
SeadII I'8llponse to remote terminal
Figure 2 - File maintenace
lvfUSE 493
EXECUTIV£ pp (UP)
INPUT/OUTPUT PP (lOP)
Service Program
Locates required m. Stores flIe Information and TERMSTAK entry in wait stack in jungle Transfers information from walt stack to pseudo-TERMSTAK entry wben pseudo-terminal
becomes idle Generatea a set m control cards and places tbem on the disk Requests EXP to enter job in tbe FNT /FST table
IXPProgram
Makes initial entry In FNT /FST table Intervenes at critical points to update FNT /FST and save output flies
8I!tem Monitor
Multip1'OCellHll ,.
Figure 3 - Scope processing
CENTRAL MEMORY EXECUTIVE ~ pp (lXP) .-
~ • - USERS SERVICE
INPUT/OUTPUT J JUNGLEI,....L-'-" FILE PROGRAM .--- ~j'l.; pp (lOP) CIRCULAR TERM .---
STACK STACK JOB
~J~ TABLE
FOR TER-MINA~
L-- t-... L---- "---
h ~ ~ -::.~
Service Program
Sets up output message or monitors terminal job tables for output messages Calla up a8 much of output messages as lOP can handle during one output period Plaoea tbia outpat In juDcle units Sets output flag In TERMSTAK
lOP Program
I SCOPE
SYSTEM MONITOR
(MTR)
TrlllUlfers output (Olle central processor wprd at a time) of five peripheral processor words to output buffer
Places output (one peripl>eral processor word at a time) Into terminal I/O buffer TraD8mits contents of terminal I/O buffer to terminals
Figure 4 - Output
From the collection of the Computer History Museum (www.computerhistory.org)
494 Spring Joint Computer Conference, 1968
TIMING PROBLEMS: Many users require execution of the same section of code, use of the same buffer areas, and entry into the same queues simultaneously. SATURATION PROBLEMS: Queues become very long or full, causing rejection of a request for a resource. Buffers are filled, requiring the system to allocate and link to additional buffers.
For example, when an INPUT or a FILE command terminates, sorting buffers are in demand and, the disk request queue grows. Another example is the LOGOUT-LOGIN operation by which each user's file catalog must be transferred to from the disk.
Four general classes of users can be simulated by the MUSE program:
A polite general purpose user who accepts the rhythm of the system and is interested in exercising its capabilities.
A stereotype user from a particular job environment who represents a specific set of needs such as file management, short FORTRAN compilations or heavy execution requirements.
The impatient user who will run at his speed, rather than the system's speed, and continues relentlessly to enter commands into the system. '{'he hostife user who is intent on breaking the system.
Single terminal operations often suffice for the polite user and for the initial encounter with the hostile user. Multi-terminal simulation is the only way to adequately gauge system performance for stereotype users, impatient users or a gang of hositle users. Simulator design was oriented toward emulating the impatient, hostile and stereotype users. Since, however, data decks define both the number and type of user a change from anyone group to another is easily accomplished.
The polite user certainly cannot be overlooked. Here is the capability to quickly and thoroughly exercise all variations of a command. For example, the RESPOND user may define a format to organize his data input stream. There are 512 variations on the FORMAT command's structure alone. The checkout of these variations is trivial when run through the simulator but extremely tedious when entered by hand more than once. Problems are easily repeatable when simulator testing is done.
Not all problems can be solved or even isolated by using the simulator alone. System malfunctions associated with misplaced files or records require some searching and guessing after an error is detected. This class of problems is accommodated by the design of the interface between MUSE and RESPOND which
allows simulator operation to be terminated and activity to be transferred to a Teletype terminal. This mode of operation was also vital in resolving simulator and RESPOND communication problems.
Sirnuiator designfeatures
The MUSE simulator consists of two basic parts. The major part is essentially a FORTRAN program with several small assembly language (COMPASS) routines incorporated for .... efficient use" of central memory after loading. A second part consists of extensions to the RESPOND executive program which allow communication with the simulator as though it were the system multiplexer. This interface program provides automatic switching of activity between simulator and Teletype terminals.
The FORTRAN program resides at one of the control points in the multi programming environment of t~e SCOPE system. This program requires a maximum of 9600 words of core memory for the 16-terminal version and 18000 words for the 64-terminal version. A character conversion table relates Teletype codes to internal codes in the same manner as in the RESPOND system.
The commands and data input submitted from the simulator to RESPON D are loaded by the simulator as data strings separated by control cards. The command and input strings reside on disk as separate files for each terminal. A simulator input buffer is filled with characters for each terminal from these files. When the buffer is filled, RESPOND performs a parallel read operation bringing in all characters for all terminals as though the simulator were a multiplexer. Output is transferred by a similar fashion from RESPOND to a simulator output-buffer then to a disk file for each specific terminal. Each data card record in a data string represents one discrete command or one data input line. Data strings may be entered by cards or from magnetic tape. Commands can be up to 77 characters per card and data records up to 80 characters per card with as many cards per input record as desired. The last two columns on a command card are used by the simulator to designate the number of times the command should be repeated under certain conditions.
Up to 36 diagnostics and other replies generated by RESPOND are entered into the simulator program's diagnostic table from data cards. When the simulator receives a message from RESPON D, it scans the diagnostic data cards loaded with the program. If a match is not found, the next line of input to RESPON D is issued. if a match is found, coded information entered with each command triggers a variety of actions. This allows a certain degree of recovery
From the collection of the Computer History Museum (www.computerhistory.org)
wIthin the simulator from conditions within RESPOND when that system is heavily loaded.
The simulator data control cards provide the following capabilities:
• the TERMINAL ID card identifies a particular part of the data string with one or more terminals. All possible or 'up to 35 terminals may be speci
, fied, individually' or . inclusively, to use the same <i~ta string.
• The TERMI,N AL NUMBER card specifies the number of the hi~i.est terminal to be serviced by the' simulator during a particular run. This card is used in allocating fixed buffer space in the FORTRAN' program among the terminals. This facilitates the printing of results files and examining flags when only a small number of terminals are simulated.
• . The WAIT card is used to inhibit the issuing of a . command at any terminal until a LOGOUT has been issued at one or more other specified terminals. This facilitates testing RESPOND supervisory control functions and sharing of files among several users. -
• The CONTINUE control card is used in conjunction with coded information on the input data cards. It allows the movement of a selected group of simulator data from the terminal's current input data string to a re-entry file. The data will be issued at a later time to RESPOND.
The TERMINAL ID control card can be used to establish worst-case and balanced-load conditions with a minimum number of data cards. The WAIT control card can simulate supervisor-user interaction. Users may be held in a wait condition until public files .have been created. The supervisor may be held in a wait condition for password list changes until several users have logged out. Users may wait for the exit of other users during tests of password and file sharing operations.
The capability provided by the CONTINUE con-, trol card is of particular importance. It accommodates
the condition where a portion of the command string requires results from SCOPE processing. When these results are not immediately available, this portion of
"the string (that which end~ with the CONTINUE card) can be placed on a reject file and re-issued later. When a diagnostic message received from RESPOND is included in the simulator's diagnostic table, a check is made t<1 determine if the command is to be reissued. Any input statement may be reissued up to 99 times. Command sequences which do not elicit the correct response after a specified number of repeats are pulled from the string and placed in a reject file. When all entries in the command string for a terminal have been
MUSE 495
passed over once, the contents of the reject file are sent to RESPOND.
The following string of commands is an example of an application of this feature. Assume the user has a FORTRAN program P.
COMPILE P LIST PL BIN PB STATUS 00 02 OPENPL DISPLAY FILE PL EXECUTEPBINPUT OUTPUT=RESULT OPEN RESULT 0002 DISPLAY FILE RESULT COpy RESULT TO PRINTER ooCONTINUE 00 INPUT
The COMPILE operation is requested from the SCOPE processor, as are the EXECUTE and COpy operations,. If the total system is heavily loaded, compilation may not be complete even after two STATUS requests have been issued and replies received. In such a case, the whole string from the first ST ATUS through the ooCONTINUE card is moved to the reject file and the INPUT command will be sent to RESPOND. By the time all the other commands in the data string have been processed the compilation should "be completed. The binary file can be passed to SCOPE for execution. If two attempts to OPEN the file resulting from execution are unsuccessful because the execution job has ,not completed, the string from OPEN RESULT through the ooCONTINUE card will again be placed on the reject file to be serviced at a later time. This feature gives the simulator
'extensive recovery power from the time lags in the RESPOND-SCOPE processing cycle. When 40 or 60 terminals are being simulated this recovery becomes very important. This feature .also lays the foundation for gathering some statistics on turnaround of terminal jobs in a particular computing en vironment and with different types of central processors.
A number of features are controllable by the user through sense switch settings while· the simulator is running. These features include the ability to:
• Force the next entry in the command string on the RESPOND system after a pre programmed time-out period
• Stop output of file contents from RESPOND to the simulator and proceed to the next command
• Call for an intermediate printout of the simulator's results file at any point in time without disrupting operations
• Display on the console screen the activities occurring at each terminal (for instance, the LOG IN command issued by the simulator and
From the collection of the Computer History Museum (www.computerhistory.org)

496 Spring Joint Computer Confer~nce, 1968
the reply from RESPOND). This option may be exercised at any point in time for an arbitrary period of time and then rescinded
• Terminate the simulator run, print the results to that point, and exit the simulator from the computer system at any time
The ability to force commands is used to check input saturation problems and to overcome any breakdown in communications between RESPOND and the simulator. An impatient or hostile user may not wait for a reply from RESPOND to his last command. He may enter another, then another command, stacking up requests within the system. The forcing feature allows simulation of this action. Both the number of times a specific command is repeated and the time-out period required before another command is forced upon RESPOND are readiiy changeable parameters. Each occurrence of this action is recorded in the terminal's results file.
The ability to arbitrarily stop the output of file contents from the RESPOND system duplicates a real user's capability. This was not the reason, however, for including the feature in the simulator. In testing the commands which access SCOPE processing capabilities and recover files from SCOPE only the first several records are needed to identify a successful operation; however, it is often inconvenient to guess the number required. The STOP switch allows the tester to terminate output when he has enough data to answer his questions and before the full contents of the file is displayed. Quality Assurance testing activities make use of the simulator's ability to print intermediate results printout as well as the final results, and the visual display of terminal activity during the actual simulator run.
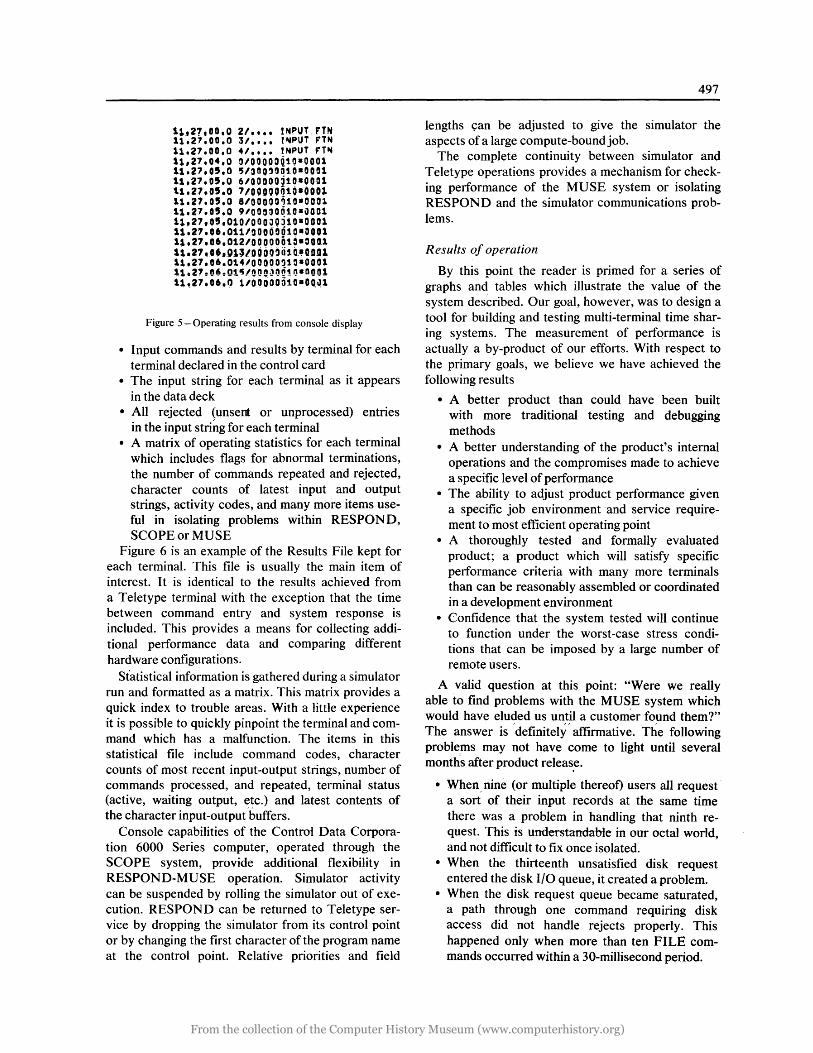
Results from the simuiator are routed to two devices. All input and output strings for all terminals are displayed on the screen of the computer control console together with the terminal number, and computer clock time when entry was made or response received.
Figure 5 illustrates this type of display when 16 terminals LOG IN and perform a series of balanced COMPILE, INPUT and FILE operations. Through this display the simulator operator is aware of the progress of testing at all· times just as if he were viewing the operations of 16 or 20 or even 60 terminals simultaneously. This display forms the basis for the designers' override actions. The contents of the log generated from this display indicate the relative performance' of SCOPE and RESPOND in handling remote user's requests.
Another type of output is a listing produced by the simulato~ at the line printer. This listing includes:
11.26.27.G" 11.26.33.0 O/l.lGIN GLE~ 47154R619 11.26.33.0 l/LOG!N PASSOI 4624261' 11.26.33.0 2/1.0GIN P1SSC2 46242619 11e26~33eO 3/LOGIN PASS03 4624261' 11.26.34.0 4/LOGIN P4SS~4 46~42619 11.26.34.0 5/1.0GIN PASS~5 46242619 11,26.34.0 6/LOGIN PASS06 4624261' 11.26.35.0 7/L"QIN P4SS01 4624261' 11.26.35.0 8/LOGIN PASSOA 46242619 "-i.26,35.0' 9/LOGIN PASCSQ9 46.2t2.6Jt 11.26.35.010JI.OrwtN PAS~10 46242619 '1.26.35.011/1.0G'" PASS11 46242619 11,26.3'.012/LOGIN PlSS12 46242619 11.26.35.013/LOGIN PlSS13 46242619 11.26.35.014/LOGrN PlSS1. 46242619
. 11 .. 26.35.015/LOGIN PlSS15 462.4261..1 11.26.41.0 01 TIM~ 11 26 3~ 11.26.42.0 51 TIME 1f 26 3~ 11.2~.42.0 61 T!H~ lt 26 35 11.26.42.0 71 TtM~ 11 26 35 11.26.42.0 81 TIME 11 26 35 11=26~42.0 91 TIM~ ii 26 3, 11.26,42.0101 Tr~E 11 26 3, 11.26.42.0111 TIM~ 11 263! 11.26.43.0121 Tt~E 11 26 3~ 11.2~.43.0131 TIHF. 11 26 35 11.26.43.0141 TIHF. 11 26 35 11.26.43.0151 TIM~ 11 26 3, 11.26,43.0 11 TIM~ it 26 3, 11.26.43.0 21 TI"~ 11 26 3' 11.26.43.0 31 TtrlF 11 ~6 35 11.26.43.0 41 TIMF 11 ~6 3, 11.26 •• 5.0 01 DATF. 01/13/68 11.26.46.0 51 DATE ~1/13/68 11.26.46.0 61 DATE 01/13/68 11.26 •• 6.0 71 nATF 01/13/6. 11.26 •• 6.0 81 DATF. ~1/13/68 11.26.46.0 ~I DATE 01/t3/68 11.26.46.010/0Ar~ ~1/13/68 11.26.46.0111 DATF. 01/13/68 11.26.47.0121 OATF. 01/13/68 11.26 •• 7.0131 OATF. 01/13/6. 11.26.47.0141 OAfF. Q1/13/68 11.26 •• 7.0151 OATF. 01/13/68 1\.26.47.0 11 OATF. 01/t3/68 11.26.47~0 21 DArF ~1/13/68 11.26.47.0 31 DATE 01/13/68 11.26,47.0 41 ~ATE 01/13/68 11.2~.51.0 01 •••• COMPILE HUDAR 11.26.'2.0 51 •••• r.O~P'LF. ~UDAA l1i26.~2.C 6/ •••• ~O~PtLE HijDAA 11.26.52.0 7/ •••• COMPILE HUDAA 11.26.'2.0 8/ •••• COMPILE ~UDAA 11.26~2.0 9/ •••• COH~rLE HUDAQ 11.26.'3.010/ •••• COMPII.E HUDAR
. 11.26.53.011/ .... r.O,",PILE HUDAA 11.26.'3.012/ •••• ~OMP'LF. ~UnAA 11.26.53.0t3/ •••• COMPILE HUDAR 11.26.".014/ •••• COMPILE HUDAA 11,26.53.015/ •••• ~OMP!Le HUDAR 11.26.54.0 1/ •••• ~OHP'LF. HU~AR 11.26.5 •• 0 2/ •••• ~OHPILE ~UDAR 11.26.154.0 3/ •••• r.O~P'Lr: HUDAR 11.26.54.0 4/~ ••• r.OHP1LF HUDlR 11.26.58.0 0/ •••• INPUT FTN 11.26.58.0 51 •••• INPUT FT~ 11.26.58.0 6-' •• ., r~"'UT F'TN 1t.26.~9.0 7/ •••• fNPUT FT~ 11,26.59.0 8/ •••• 'NPUT FTN 11.26.'9.0 91 •••• INPUT FTN 11.26.~9.010/ •••• tNPUT FTN ll.26.'9.011/ ••• , INPUT FTN 11,26.59.012/ •••• rNPUT FTN 11.26.'9~013/ •••• P"PUT FT'" 11.26.'9.014/ •••• INPUT FT~ 11.26.59.015/ •••• INPUT FTN ll,21.00.0 1/ •••• INPUT F'TN
From the collection of the Computer History Museum (www.computerhistory.org)
11.21.00.0 2/ •••• INPUT.FTN 11.21.00.0 3/ •••• r~PUT PTN 11.27.00.0 4/ •••• INPUT PTN 1,,27.04.0 O/OOOOOQ1Q a 0001 11.27.0'.0 5/aOO'Q010 a OQ01 11.27.0'.0 6/00000i10 8 0001 \1.21.0'.0 7/00000ij~O.OOOi 11.21.05.0 8/00000~10.0001 11.27.05.0 9100~o0610a~001 11,27.0'.010/000ao510 a 0001 11,21.06,011/00000010-0001 11.27.06.012/0Q000010·~OOl 11.21.0 •• 01~/D~~O~ri1~~OD~1 11.21.06.014/00000110 a 0001 11;21=06=01~!OOQjOQ10.0001 11.27.06.~ 1/00000310-0~~1
Figure 5 - Operating results from console display
• Input commands and results by terminal for each terminal declared in the control card
• The input string for each terminal as it appears in the data deck
• All rejected (unsert or unprocessed) entries in the input string for each terminal
• A matrix of operating statistics for each terminal which includes flags for abnormal terminations, the number of commands repeated and rejected, character counts of latest input and output strings, activity codes, and many more items useful in isolating _ problems within RESPOND, SCOPE or MUSE
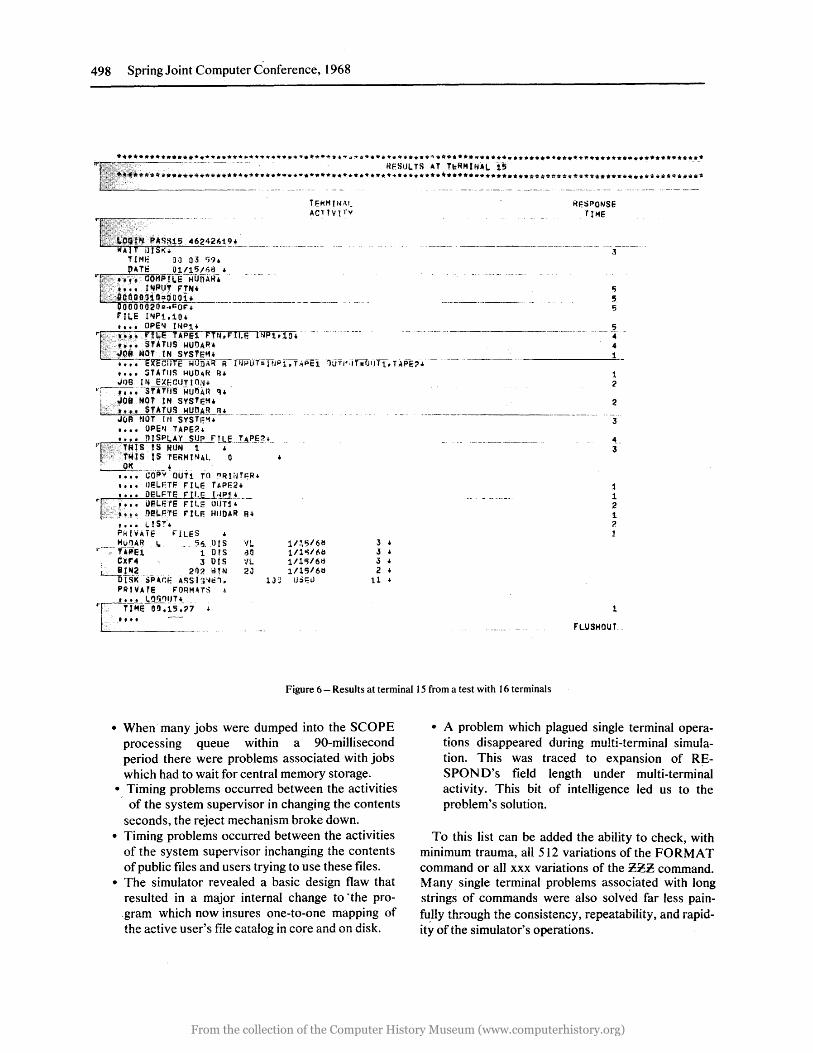
Figure 6 is an example of the Results File kept for each terminal. This file is usually the main item of interest. It is identical to the results achieved from a Teletype terminal with the exception that the time between command entry and system response is included. This provides a means for collecting additional performance data and comparing different hardware configurations.
Statistical information is gathered during a simulator run and formatted as a matrix. This matrix provides a quick index to trouble areas. With a little experience it is possible to quickly pinpoint the terminal and command which has a malfunction. The items in this statistical file include command codes, character counts of most recent input-output strings, number of commands processed, and repeated, terminal status (active, waiting output, etc.) and latest contents of the character input-output buffers.
Console capabilities of the Control Data Corporation 6000 Series computer, operated through the SCOPE system, provide additional flexibility in RESPOND-MUSE operation. Simulator activity can be suspended by rolling the simulator out of execution. RESPOND can be returned to Teletype service by dropping the simulator from its control point or by changing the first character of the program name at the control point. Relative priorities and field
497
lengths 9an be adjusted to give the simulator the aspects of a large compute-bound job.
The complete continuity between simulator and Teletype operations provides a mechanism for checking performance of the -MUSE system or isolating RESPOND and the simulator communications problems.
Results of operation
By this point the reader is primed for a series of graphs and tables which illustrate the value of the system described. Our goal, however, was to design a tool for building and testing multi-terminal time sharing systems. The measurement of performance is actually a by-product of our efforts. With respect to the primary goals, we believe we have achieved the following results
• A better product than could have been built with more traditional testing and debugging methods
• A better understanding of the product's internal operations and the compromises made to achieve a specific level of performance
• The ability to adjust product performance given a specific job environment and service requirement to most efficient operating point
• A thoroughly tested and formally evaluated product; a product which will satisfy specific performance criteria with many more terminals than can be reasonably assembled or coordinated in a development environment
• Confidence that the system tested will continue to function under the worst-case stress conditions that can be imposed by a large number of remote users.
A valid question at this point: "Were we really able to find problems with the MUSE system which would have eluded us until a customer found them?" The answer is definitely· affirmative. The following proble~s may not have come to light until several month·s after product releas,e.
• When. nine (or multiple thereof) users all request -a sort of their input records at the same time there was a problem in handling that ninth request. This is understandable in our octal world, and not difficult to fix once isolated.
• When the thirteenth unsatisfied disk request entered the disk I/O queue, it created a problem.
• When the disk request queue became saturated, a path through one command requiring disk access did not handle rejects properly. This happened only when more than ten FILE commands occurred within a 30-millisecond period.
From the collection of the Computer History Museum (www.computerhistory.org)
498 Spring Joint Computer Conference, 1968
••••••••••••••••••••••••••••••••• ~**+ •• *.~~ .... * •• * ••• *.*q ••••••• ~ •••••••• * ••••••••• * •••• ** •• * ••••••••••• *. -.~--- .. -- -_. --- . - RF.SUL TS AT Tl:HM I '~A"L~·-i5 --
~~ ••• ~ ••••••••• * ••••••••••• * ••• * ••••••••• +.* ••• *.***.** •••• * ••• * •••••• ~+++.+.+~ •••• ** •••••• * •• **.* •••• ***.
TEWMIIMI. ACTtVpv
QQINPAS!';15 46242619+ A j) t<. -----------. ------- .--.-------
TIM~ 00 03 ~?
.~-LtJA.:...:l'_=_l:~ ()t/iS/flo. "~" qOHPfi.-e-HUOA'R. '
....... n. ,l~PUr ,TNt w;"",(:;.;;;O;,.:O;.,;. n;-:o~0-i-\l.:.i-=-I'l ='-'o~o:-:=o~i~. ______ .. ________ . __ ._. _____ _
OOOOQ20= .. J:Or. f'ii.E I"fPi.10. • • •• OPE'4 I "IP1' ~fP' APet PTU~"I1.E I NP1iIo"; .. f~.~ STATUS HUDARt ~O.NO' tN SYSTE".
--'- .. --- _ .. __ .. _-----
3
'5 5 5
5 ---- -. -
4 1
XECIITE ;;Uni\~ TTi·i;.oUh I fjPi. T~jiE- fiUTI';-;T:i)IHf,-f ~PF., ... -"" :iTATIIS ~uO!\R fh JQ9 rN EX~CUTION.
"~';--SUTITs ;;'(jOi\R q. -, ,JOB NOT IN SYSTE~'
.. p STATllS HUOAR fH ________ .. JClA NOT IN SYS'fr;"1";---• • •• OPE~J TAPE?' • •••• nISPLAY sup rTLE TAPE~'
s'" T .. IS IS HUN 1 --;- "---.--- --TNlS tS lERMtNAL 0
: . Of( .. ~~-ij6pv'OUT1 TO "RliHF;R.
• • •• IlE!LFTF F' I LE T APE2 .. , ••• DELFTE £l!.:.E.....l;!~_~ ___ _ i.t. UELE1E rILE OUT~'
~ .. n!l-p.'I'E rJLF. HI/DAR R. , ••• L. !s·(. FRIVAiE ~IlES ..
____ .M..Y..:1A ~ _.!: _ _ ? ~ In S IJL T'~el 1 DIS dO
. CX'4 3 ors ~l~? .. __ .202 ~lN
'It. 21l
DISK ~P.~~ ASSll~~', PRJVAfe rORHAT$ •••• 1.,1)11'11". .. T--me-Q!f: is ~-?7 ~. ---
lJ'J
In.sI6t1 3 1I1o;/6~ J 1I1~/6tj 3 1/15/6D 2 lJ;i~u 11
...
..
.._-------_._--_._-----_.----_._._. __ .. _-..
1 2
3
,,--3
1 1 2 1 ? 1
1
FLYSHOUT_
Figure 6 - Results at terminal 15 from a test with 16 terminals
• When many jobs were dumped into the SCOPE processing queue within a 90-millisecond period there were problems associated with jobs which had to wait for central memory storage .
•. Timing problems occurred between the activities . of the system supervisor in changing the contents seconds, the reject mechanism broke down.
• Timing problems occurred between the activities of the system supervisor inchanging the contents of public files and users trying to use these files.
• The simulator revealed a basic design flaw that resulted in a major internal change to ·the program which now insures one-to-one mapping of the active user's file catalog in core and on disk.
• A problem which plagued single terminal operations disappeared during multi-terminal simulation. This was traced to expansion of RESPON D's field length under multi-terminal activity. This bit of intelligence led us to the problem's solution.
To this list can be added the ability to check, with minimum trauma, all 512 variations of the FORMAT command or all xxx variations of the ~~~ command. M.any single terminal problems associated with long strings of commands were also solved far less painfll;lly through the consistency, repeatability, and rapidity of the simulator's operations.
From the collection of the Computer History Museum (www.computerhistory.org)

The by-product of performance statistics on RESPOND has proven particularly interesting and encouraging. Data has been collected for a total of sixteen simultaneous users operating in the following two environments:
• File Management activity with a small amount of program compilation and execution (approximately 6%)
• General programming activity with equal
and execution operations. All of the data, thus far, has been collected on a
Control Data Corporation ·6400 Series Computer having 65,000 words of central .memory, and utilizing a dual chan~el 6638 disk unit for mass storage. The simulator itself acted as a backbrou~d program requiring between 1700 and 2709 seconds of central processor time and 9600 words of central memory during the testing period.
The distribution of 'wait' times for the file management environment is shown in Figure 7. The wait time
. is defined as the interval between the entry of the last character of a command (the RETURN key of the Teletype) and the arrival of the first character of the reply from the RESPOND system. The mean 'waiting' time is 1.88 sec. The maximum waiting time recorded was 29 sec on the compilation of a FORTRAN program having 1321 statements. In this case the user chose to wait for the compilation to be completed. Commands used heavily in this environment included the FILE. INPUT, and DISPLAY. Table I contains a summary of the. test results for this environment and details on its composition. ..
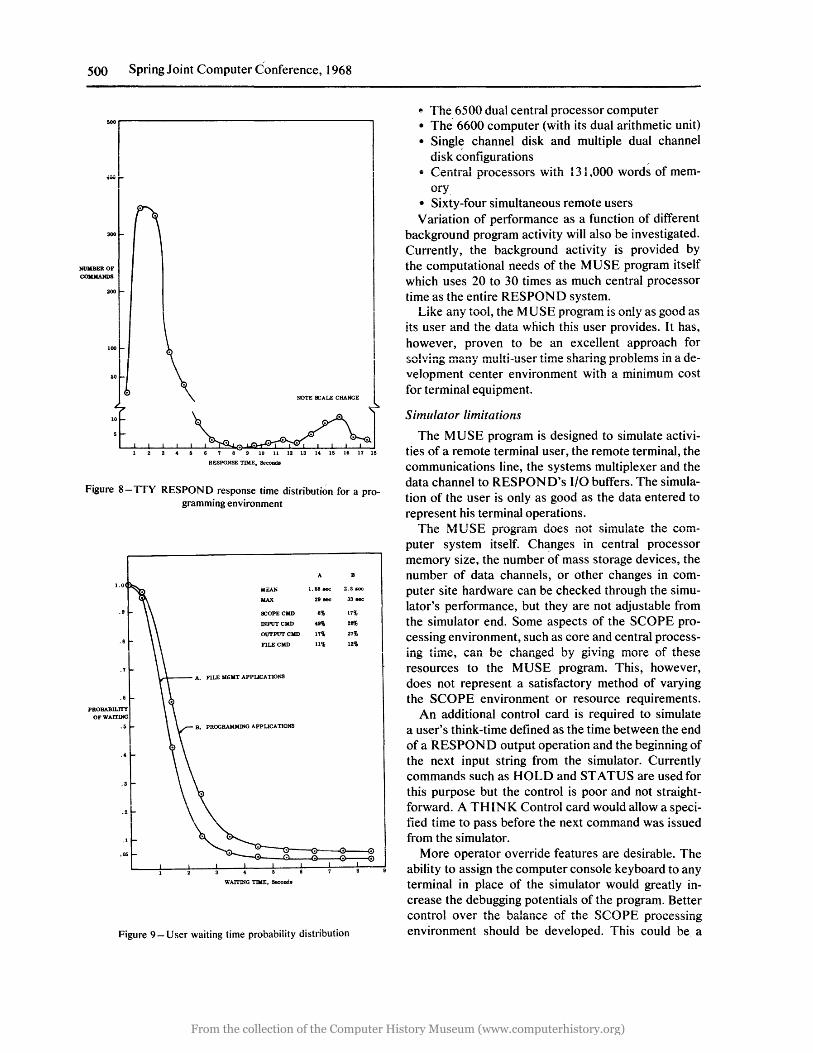
The resuits for a general programming environment are shown in Figure 8. The simulated user was placed in a position of waiting until a compilation or execution was complete, and this has been considered as a single waiting time. The programs compiled contained from 21 FORTRAN statements to 1321 statements.
The mean writing time for this environment was 2.6 seconds, reflecting the 17% of commands requesting SCOPE processing. The maximum waiting time recorded was 33 seconds, and was associated with a wait for a large compilation to be completed. Input and output operations, however, still make up a large portion of the user's activity, as can be seen from the command mix statistics in Table I.
These two environments are compared in Figure 9 and Table I. In Figure 9 the waiting probability is plotted against waiting time. Note that a waiting time of longer than 3 seconds would occur only 7% of the time in a file management environment, and 17% of
MUSE 499
the time in the programming environment even when the average user chose to wait for his compilation or execution to be completed before the next command. In both environments, a wait of 4 seconds would occur less than 10% of the time. Table 1 includes central processor operating statistics for TIY RESPOND under each environment. For file management activity, an average of 13.7 commands are processed per each central processor second used by RESPOND. For programming activity the average raises to 15.4 commands per central processor second used by RESPOND. In the latter case, fewer input 'and file operations are issued to RESPOND and the computing load is shifted to SCOPE.
1~r-----------------------------------------------------------------~
900
800
700
NOTE SCALE CHANGE
10
RESPONSE TIllE, SeccJIIda
Figure 7 -lTY RESPOND response time distribution for a file management environment
Guidance for the selection of LOG IN times, average number of commands per terminal and LOG IN time spread (Table I) were obtained from a number of unpublished sources and from Allan Sherr's MIT monograph on analysis of time shared
systems. l
Additional study is planned to determine variation in RESPOND's performance with the hardware configuration consisting of
From the collection of the Computer History Museum (www.computerhistory.org)
500
300
NUMBER OF
COMMANDS
200
10
Spring Joint Computer Conference, 1968
\ \ NOTE SCALE CHANGE
1 2 3 4 5 6 7 8 9 10 11 12 13 14 15 16 17 18
RESPONSE TIME, 8econda
Figure 8-TrY RESPOND response time distribution for a programming environment
1.0
.9
.7
. 6
PROBABILITY OFWArrlNG
.5
.4
.3
!olEAN
MAX
SCOPE CMIl
INPUTCMD
OUTPUTCMD
FlLECMD
A. FILE !olGMT APPLICATIONS
B. PROGRAMMING APPLICATIONS
A B
1.88..,., 2.6....,
29 """ 33 aec
6% 17%
49% 28% 17% 27%
11% u%
~f ~~I] ~.I 2 3 4 5 9
WArrING TillE, SecoDda
Figure 9- User waiting time probability distribution
• The 6500 dual central processor computer • The 6600 computer (with its dual arithmetic unit) • Single channel disk and mUltiple dual channel
disk configurations • Central processors with 131,000 words of mem-
ory • Sixty-four simultaneous remote users Variation of performance as a function of different
background program activity will also be investigated. Currently, the background activity is provided by the computational needs of the MUSE program itself which uses 20 to 30 times as much central processor time as the entire RES paN 0 system.
Like any tool, the MUSE program is only as good as its user and the data which this user provides. It has, however, proven to be an excellent approach for solving many multi-user time sharing problems in a de-velopment center environment with a minimum cost for terminal equipment.
Simulator limitations
The MUSE program is designed to simulate activities of a remote terminal user, the remote terminal, the communications line, the systems mUltiplexer and the data channel to RES paN D's I/O buffers. The simulation of the user is only as good as the data entered to represent his terminal operations.
The ~,,1USE program does not simulate the computer system itself. Changes in central processor memory size, the number of mass storage devices, the number of data channels, or other changes in computer site hardware can be checked through the simulator's performance, but they are not adjustable from the simulator end. Some aspects of the SCOPE processing environment, such as core and central processing time, can be changed by giving more of these resources to the MUSE program. This, however, does not represent a satisfactory method of varying the SCO PE environment or resource requirements .
An additional control card is required to simulate a user's think-time defined as the time between the end of a RES paN 0 output operation and the beginning of the next input string from the simulator. Currently commands such as HOLD and STATUS are used for this purpose but the control is poor and not straightforward. A THINK Control card would allow a specified time to pass before the next command was issued from the simulator.
More operator override features are desirable. The ability to assign the computer console keyboard to any terminal in place of the simulator would greatly increase the debugging potentials of the program. Better control over the balance of the SCOPE processing environment should be developed. This could be a
From the collection of the Computer History Museum (www.computerhistory.org)
MUSE 501
T ~BLE I - SummarY of results and test specifications
Application File Management Programming
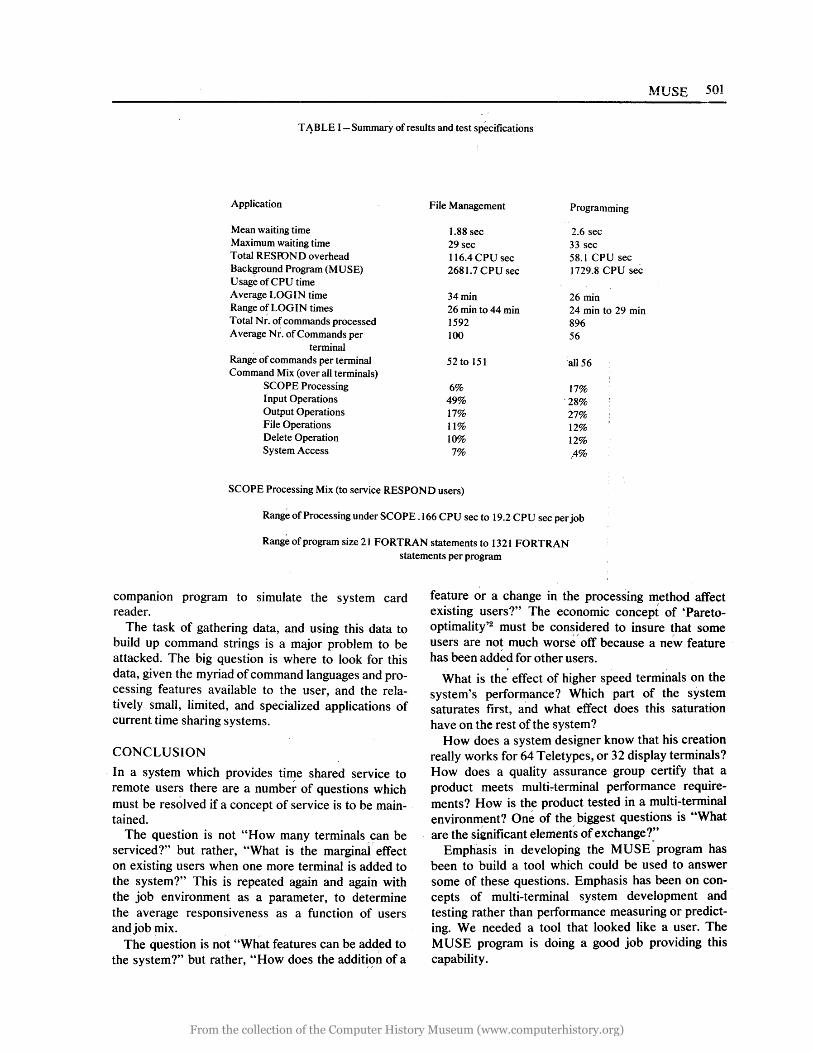
Mean waiting time 1.88 sec 2.6 sec Maximum waiting time 29 sec 33 sec Total RESIDND overhead 116.4 CPU sec 58.1 CPU sec Background Program (MUSE) 2681.7 CPU sec 1729.8 CPU sec Usage of CPU time A verage LOG IN time 34 min 26 min Range of LOG IN times 26 min to 44 min 24 min to 29 min Total Nr. of commands processed 1592 896 Average Nr. of Commands per 100 56
terminal Range of commands per terminal 52 to 151 'all 56 Command Mix (over all terminals)
SCOPE Processing 6% 17% Input Operations 49% '28% Output Operations 17% 27% File Operations 11% 12% Delete Operation 10% 12% System Access 7% A%
SCOPE Processing Mix (to service RESPOND users)
Range of Processing under SCOPE .166 CPU sec to 19.2 CPU sec per job
Range of program size 21 FORTRAN statements to 1321 FORTRAN statements per program
companion program to simulate the system card reader.
The task of gathering data, and using this data to build up command strings is a major problem to be attacked. The big question is where to look for this data, given the myriad of command languages and processing features available to the user, and the relatively small, limited, and specialized applications of current time sharing systems.
CONCLUSION
In a system which provides time shared service to remote users there are a number of questions which must be resolved if a concept of service is to be maintained.
The question is not "How many terminals can be serviced?" but rather, "What is the marginal' effect on existing users when one more terminal is added to the system?" This is repeated again and again with the job environment as a parameter, to determine the average responsiveness as a function of users andjob mix.
The question is not "What features can be added to the system?" but rather, "How does the additi.()n of a
feature or a change in the processing method affect existing users?" The economic concept of 'Paretooptimality'2 must be considered to insure that some users are not much worse' off because a new feature has been added for other users.
What is the effect of higher speed terminals on the system's performance? Which part of the system saturates first, and what effect does this saturation have on the rest of the system?
How does a system designer know that his creation really works for 64 Teletypes, or 32 display terminals? How does a quality assurance group certify that a product meets multi:·terminal performance requirements? How is the product tested in a multi-terminal environment? One of the biggest questions is "What are the significant elements of exchange?~'
Emphasis in developing the MUSE program has been to build a tool which could be used to answer some of these questions. Emphasis has been on concepts of multi-terminal system development and testing rather than performance measuring or predicting. We needed a tool that looked like a user. The MUSE program is doing a good job providing this capability.
From the collection of the Computer History Museum (www.computerhistory.org)

502 Spring Joint Computer Conference, 1968
The fact that RESPON 0 and MUSE can operate together independently of any mUltiplexer or terminal equipment also provides a means of evaluating the performance of new and different computer hardware configurations as well as collecting statistics on existing ones. This paper is a report on a different approach and a new tool in checking, testing, and even developing better time sharing systems. Hopefully, the idea will ca~ch on. Not the use of a specific program but the idea of tes.ting to see 'what happens when,' rather than installing·to find these answers.
APPENDiX
RESPOND COMMAND LANGUAGE MESSAG E (message contents, 70ch max) LIST FILES or FORMATS PEN File Id FORMAT (r~cord number, length, step size, tab and
skip functions) IN PUT File Id, Format Id #EOF FILE File Id, FILE File Id(item select options) HOLD DELETE File Id (item select options) or Format Id DISPLAY File Id (item select options) #STOP ASSEMBLE File Id LIST Result Id BIN Binary Id COMPILE File Id LIST Result Id BIN Binary Id EXECUTE Binary File Id INPUT= Input File Ids
OUTPUT = Output File Ids BIN Binary File Ids
COPY File Id To Peripheral Device
COPY Peripheral Device TO File Id SUBMIT Control Card File Id INPUT=lnput
File Ids, OUTPUT-Output File Ids BIN =Binary File Id's
ST ATUS File Id sent to SCOPE &PASSWORD* LIST or CHANGE (Items) or
ADD (Items) or DELETE (Items)
*TRANSFER FILE or FORMAT, User File Id or Format Id TO Public File Format Id
*DUMP (Creates archive type) *SYSEXIT (RESPOND system exit) LOGOUT
The reader is· referred to the TIY RESPOND Reference Manmil3 for detailed descriptions· of the systems command structure and capabilities
REFERENCES
1 A L SCHERR An analysis of time-shared computer systems MIT Research Monograph No 36 1967
2 T A MARSCHAK Economic theories of organization Handbook of Organization Theory j G March editor McGraw Hill 1966
3 TTY RESPOND reference manual Control Data Corp Publication N r 60189300 1967
~ vailable to system supervisor only
From the collection of the Computer History Museum (www.computerhistory.org)