Embed Size (px)
Citation preview
Preliminary and Incomplete. Please do not cite without permission
- 1 -
Music as a Capital Asset
By Rachel Soloveichik
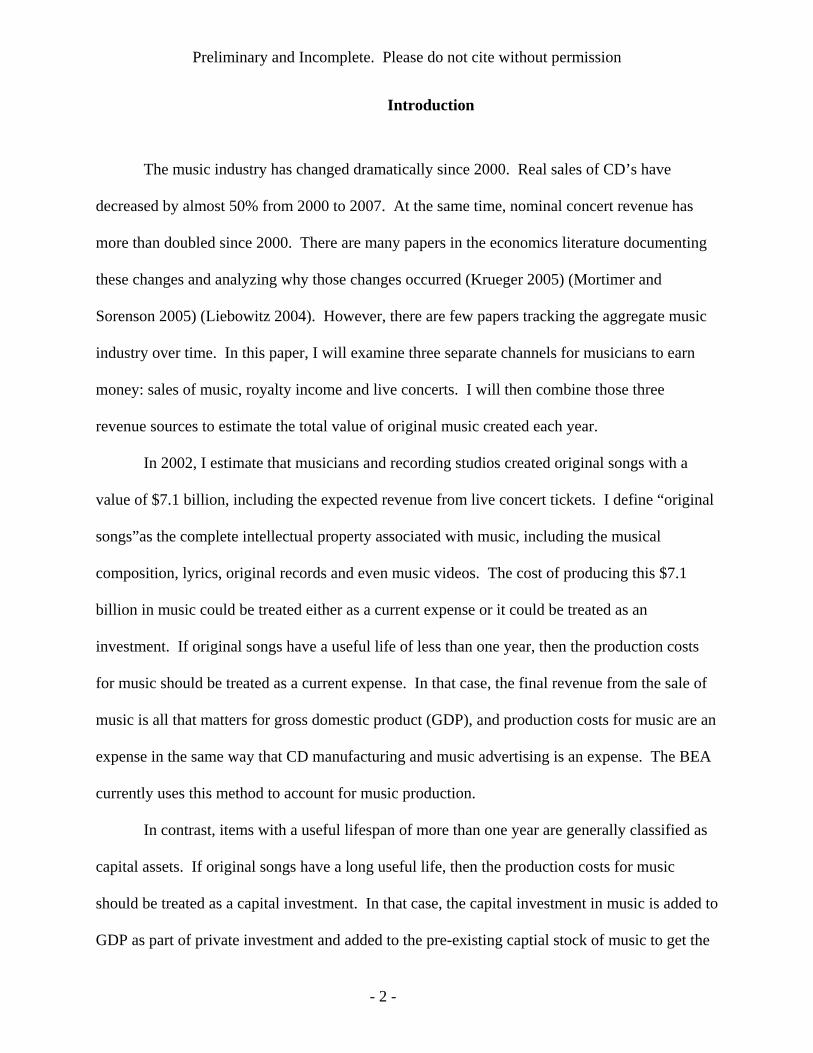
Abstract
In 2002, I estimate that musicians and recording studios created original songs, including
recorded performances, with an estimated value of $7.1 billion. These songs were sold on CDs
in 2003 and will be played on the radio, on television and at live concerts for decades to come.
Because of their long working life, the international guidelines for national accounts, System of
National Accounts 2008, recommends that countries classify production of music and other
entertainment, literary and artistic originals as an investment activity and then depreciate those
songs over time. As a first step in changing the treatment of music in the National Income and
Product Accounts (NIPA), I collected data on music production and calculate what the NIPA
would be if songs were classified as a capital asset.
To preview, my empirical results are: 1)In 2002, musicians and record studios created
original music with a nominal value of $7.1 billion producing recorded music, approximately
0.07% of real GDP; 2)The recorded music industry has been shrinking dramatically since 2000.
Between 2000 and 2007, real GDP growth is reduced by 0.005 percentage points per year if
recorded music is treated as a capital asset; 3) Original music remains valuable for decades after
it is first produced. I calculate that the aggregate capital value of all original music was $34
billion in 2002.
Preliminary and Incomplete. Please do not cite without permission
- 2 -
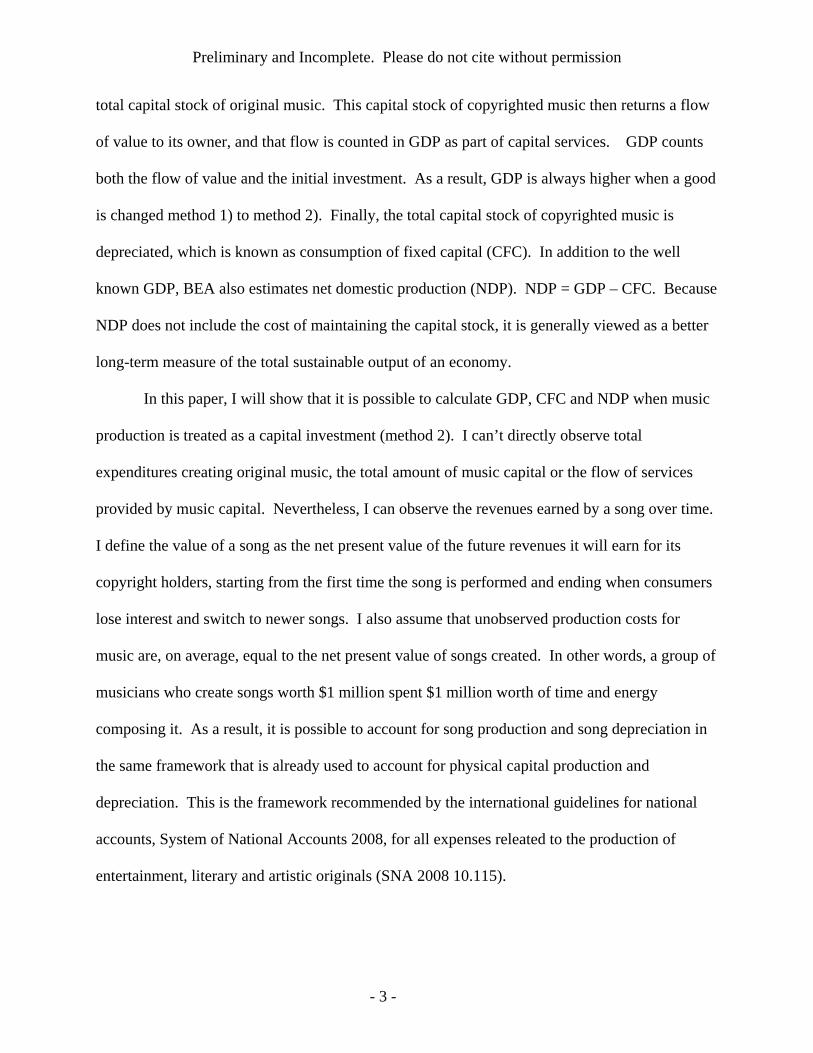
Introduction
The music industry has changed dramatically since 2000. Real sales of CD’s have
decreased by almost 50% from 2000 to 2007. At the same time, nominal concert revenue has
more than doubled since 2000. There are many papers in the economics literature documenting
these changes and analyzing why those changes occurred (Krueger 2005) (Mortimer and
Sorenson 2005) (Liebowitz 2004). However, there are few papers tracking the aggregate music
industry over time. In this paper, I will examine three separate channels for musicians to earn
money: sales of music, royalty income and live concerts. I will then combine those three
revenue sources to estimate the total value of original music created each year.
In 2002, I estimate that musicians and recording studios created original songs with a
value of $7.1 billion, including the expected revenue from live concert tickets. I define “original
songs”as the complete intellectual property associated with music, including the musical
composition, lyrics, original records and even music videos. The cost of producing this $7.1
billion in music could be treated either as a current expense or it could be treated as an
investment. If original songs have a useful life of less than one year, then the production costs
for music should be treated as a current expense. In that case, the final revenue from the sale of
music is all that matters for gross domestic product (GDP), and production costs for music are an
expense in the same way that CD manufacturing and music advertising is an expense. The BEA
currently uses this method to account for music production.
In contrast, items with a useful lifespan of more than one year are generally classified as
capital assets. If original songs have a long useful life, then the production costs for music
should be treated as a capital investment. In that case, the capital investment in music is added to
GDP as part of private investment and added to the pre-existing captial stock of music to get the
Preliminary and Incomplete. Please do not cite without permission
- 3 -
total capital stock of original music. This capital stock of copyrighted music then returns a flow
of value to its owner, and that flow is counted in GDP as part of capital services. GDP counts
both the flow of value and the initial investment. As a result, GDP is always higher when a good
is changed method 1) to method 2). Finally, the total capital stock of copyrighted music is
depreciated, which is known as consumption of fixed capital (CFC). In addition to the well
known GDP, BEA also estimates net domestic production (NDP). NDP = GDP – CFC. Because
NDP does not include the cost of maintaining the capital stock, it is generally viewed as a better
long-term measure of the total sustainable output of an economy.
In this paper, I will show that it is possible to calculate GDP, CFC and NDP when music
production is treated as a capital investment (method 2). I can’t directly observe total
expenditures creating original music, the total amount of music capital or the flow of services
provided by music capital. Nevertheless, I can observe the revenues earned by a song over time.
I define the value of a song as the net present value of the future revenues it will earn for its
copyright holders, starting from the first time the song is performed and ending when consumers
lose interest and switch to newer songs. I also assume that unobserved production costs for
music are, on average, equal to the net present value of songs created. In other words, a group of
musicians who create songs worth $1 million spent $1 million worth of time and energy
composing it. As a result, it is possible to account for song production and song depreciation in
the same framework that is already used to account for physical capital production and
depreciation. This is the framework recommended by the international guidelines for national
accounts, System of National Accounts 2008, for all expenses releated to the production of
entertainment, literary and artistic originals (SNA 2008 10.115).
Preliminary and Incomplete. Please do not cite without permission
- 4 -
From a theoretical point of view, whether live concert revenue should be included in
estimating the value of artistic capital is controversial. On the one hand, musicians typically
perform pre-existing songs at concerts rather than composing new songs for each concert. This
suggests that live concert revenues could be viewed as a return on pre-existing capital stock of
copyrighted music. On the other hand, musicians expend substantial amounts of time and energy
performing their songs at concerts. This suggests that the musician’s profits from ticket sales
could be viewed as a wage payment for labor, not capital. In this paper, I will treat live concert
revenues as a return on pre-existing copyrighted music. I choose this method because musicians
typically earn money from CD sales, airplay royalties and live concerts simultaneously. In
recent years, musicians have been raising prices on live concerts to compensate for CD piracy
(Krueger 2005). As a result, excluding live concerts would cause my estimates to miss the
substitution that is occurring.
To preview, my empirical results are:
1) Original songs have a useful lifespan of at least 50 years, but more than half of their value
comes from sales in the first year.
2) The nominal sales of recorded music fell from $12.6 billion in 2000 to $10.4 billion in 2007.
The nominal royalty revenues rose from $0.9 billion in 2000 to $1.5 billion in 2007. The
nominal revenue from live concerts has increased from $1.7 billion in 2000 to $3.9 billion in
2007.
3) Prices for live concerts have risen significantly faster than the rest of the music industry. This
price growth cannot be explained by quality improvements or input cost growth (Mortimer and
Sorenson 2005). Instead, bands are simply raising the ticket price for concerts over the last
decade (Krueger 2005).

Preliminary and Incomplete. Please do not cite without permission
- 5 -
Taken together, results 2) and 3) show that the treatment of live concert revenue has little
effect on real GDP growth since 2000 with music classified as a capital asset. When concert
revenues are included in the industry, nominal revenue remains steady and prices increase.
When concert revenues are excluded, nominal revenue falls dramatically and prices remain
steady. Real music production drops between 2000 and 2007 in both scenarios. Under both
scenarios, real GDP growth falls by approximately 0.005% per year when music production is
classified as an investment activity.
This research on capitalizing music production is part of a broader research project on
changing the treatment of intangible assets in the national income and product accounts. Other
researchers at the BEA have developed a satellite account measuring the annual investment and
capital value of R & D (Robbins and Moylan 2007), educational investments (Fraumeni,
Reinsdorf, Robinson and Williams 2008) and the role of intangible assets in foreign direct
investment (Bridgman 2008). In a previous paper, I estimated the quarterly investment and
capital value of theatrical movies (Soloveichik 2008). I am currently working to estimate the
annual investment and capital value of other forms of artistic capital such as books, television
programs and plays.
This paper consists of four sections. In section 1, I describe my data on nominal revenues
earned by the music industry and calculate the nominal value of music production back to 1929.
In section 2, I describe my price index and calculate the real value of music production back to
1929. In section 3, I describe the various way in which an original song can earn money and
estimate the total revenues earned by recording studios and musicians over time. Finally, in
section 4, I estimate the total stream of revenue received and expenses incurred by musicians for
every year after a song is released. I then use that revenue stream to estimate the depreciation
Preliminary and Incomplete. Please do not cite without permission
- 6 -
schedule for original songs. Finally, I combine the real production data from section 2 with the
depreciation schedule to estimate capital stocks of music from 1929 to 2006.
1. Nominal Music Production
Musicians earn money from their original songs in four possible ways: 1)They can record the
songs and sell them, either on CD or as a download for computers, Ipods or ringtones for
cellphones (or records or tapes, etc.). In order to simplify the discussion, I will often refer to this
market as CD sales, but my data includes all legal media; 2)They can license the songs for radio
play, television broadcast, commercials, theatrical films or live performance by another artist;
3)They can sell the songs on sheet music for individuals to play themselves; 4)They can perform
the songs at a live concert and earn money by selling tickets.
In this paper, I define the value of a copyrighted song as the expected present value of
future revenues minus future costs. For example, suppose that a song earns $X in Year 0, $Y in
Year 1 and $Z in Year 2. Given a discount rate, ρ, the value of a song at release is:
Net Present Value at Release = $X+$Y/(1+ ρ)+$Z/(1+ ρ)2
In this paper, I discount future revenues at the ρ = 10% real. In other words, a musician
is indifferent between being paid $1 now and $1.10 (inflation adjusted) next year. I chose the
discount rate of 10% real because the music industry is extremely risky, and so discount rates
should be high enough to compensate for the risk.1 Because I am focusing on revenues, I do not
1 My estimates of nominal production, real production, depreciation and capital stock are all sensitive to the discount rate used to calculate the net present value of music. Please e-mail me for alternative estimates when a different discount rate is used.
Preliminary and Incomplete. Please do not cite without permission
- 7 -
include any piracy or other illegal copies which do not pay royalties to the musicians or
recording studios.
Revenues Across Distribution Channels 1985-2007
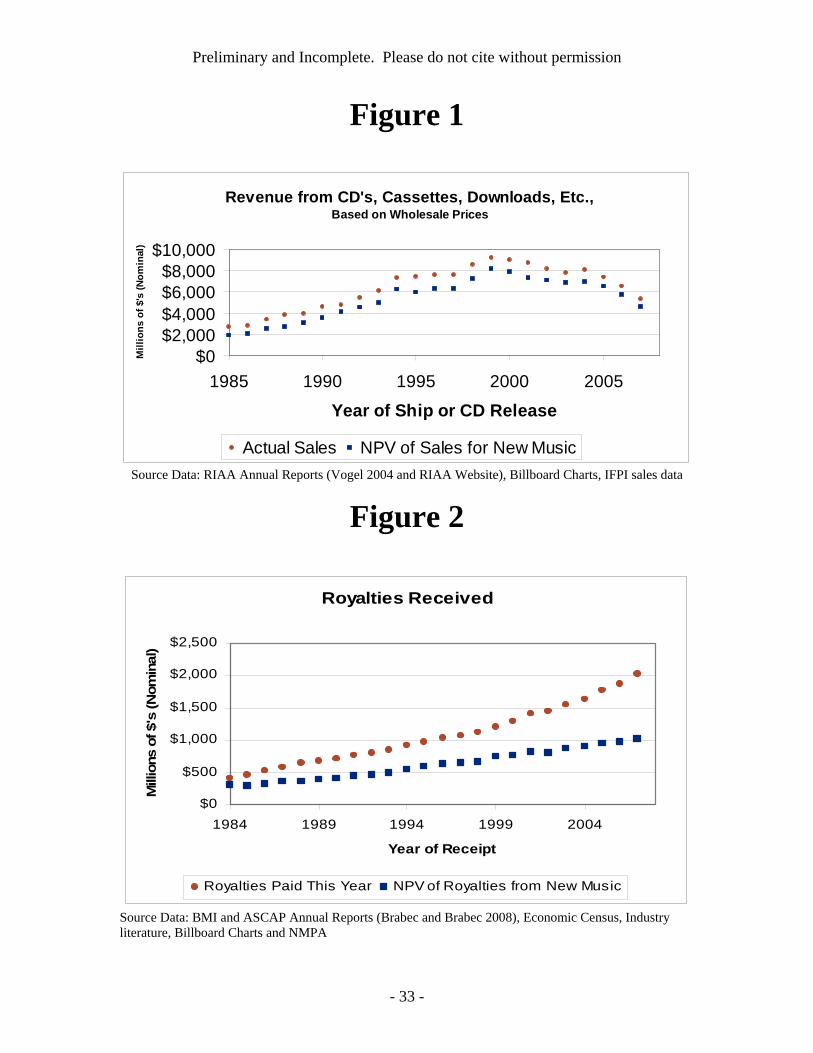
Figure 1 shows the net present value of music sales by year of initial release. The main
data source for Figure 1 is the Recording Industry Association of America (RIAA) annual reports
on sales for CD’s, Internet downloads, ringtones, etc. (Vogel 2004) (RIAA 2003-2007). I then
adjusted the RIAA data to account for retailer mark-up (Cohen 2004), classic CD’s sold for years
after initial release, re-release of old songs on compilation albums, imports of songs by non-US
musicians and exports of songs by US musicians to abroad. Taken together, these adjustments
allow me to calculate annual production of music by US musicians using the RIAA data on US
sales. Appendix 1 contains much more detail on the exact adjustment procedures used.
The most striking result from Figure 1 is that nominal revenues from the sale of music
have been plummeting since 2000. The RIAA data include digital downloads and ringtones – so
the decline isn’t just a shift from CD’s to Ipods. Instead, consumers are not buying as much
music. These findings are not new to this paper. A number of industry and academic experts
have discussed this phenomenon in recent years. The industry sources are adamant that the main
cause the revenue decline is illegal downloading (Hiatt and Serpick 2007) (RIAA website).
The economic literature is more mixed, but generally agrees that illegal downloads are a major
cause of revenue declines (Oberholzer-Gee and Strumpf 2005) (Mortimer and Sorenson 2005)
(Krueger 2004) (Liebowitze 2004).2
2Many of the economic papers focus on a much more micro level than the RIAA is concerned with. For example, Oberholzer-Gee and Strumpf (2005) found that CD sales did not drop during time when Napster worked better for
Preliminary and Incomplete. Please do not cite without permission
- 8 -
Figure 2 shows the net present value of music royalties by year of initial release for every
year from 1985 to 2007. Most royalty payments are for performance royalties, which are paid
every time a song is played on the radio, broadcast on television or performed live by another
artist. The main data source for performance royalties is the annual reports by ASCAP and BMI
(Brabec and Brabec 2008). ASCAP and BMI handle more than 95% of performance royalties in
the US, and so their annual reports are a very good proxy for the total performance royalties paid
in the US. The remainder of royalties are synchronization royalties, which are payments for the
right to include a song in a television program, theatrical film or commercial.3 Finally, I adjusted
the performance royalty and synchronization royalty data to account for non-US musicians,
exports and classic songs played years after their original release. These adjustments allow me
to calculate the value of US music production from revenue data. Appendix 1 gives much more
detail on the data used on the process for adjusting revenue.
The most striking result from Figure 2 is that the net present value of royalties from new
music grows much slower than overall royalty revenue. Intuitively, more music is being
produced each year than is destroyed through depreciation. Therefore, revenues from the
licensing of old music are rising even though the production of new music is relatively flat.4
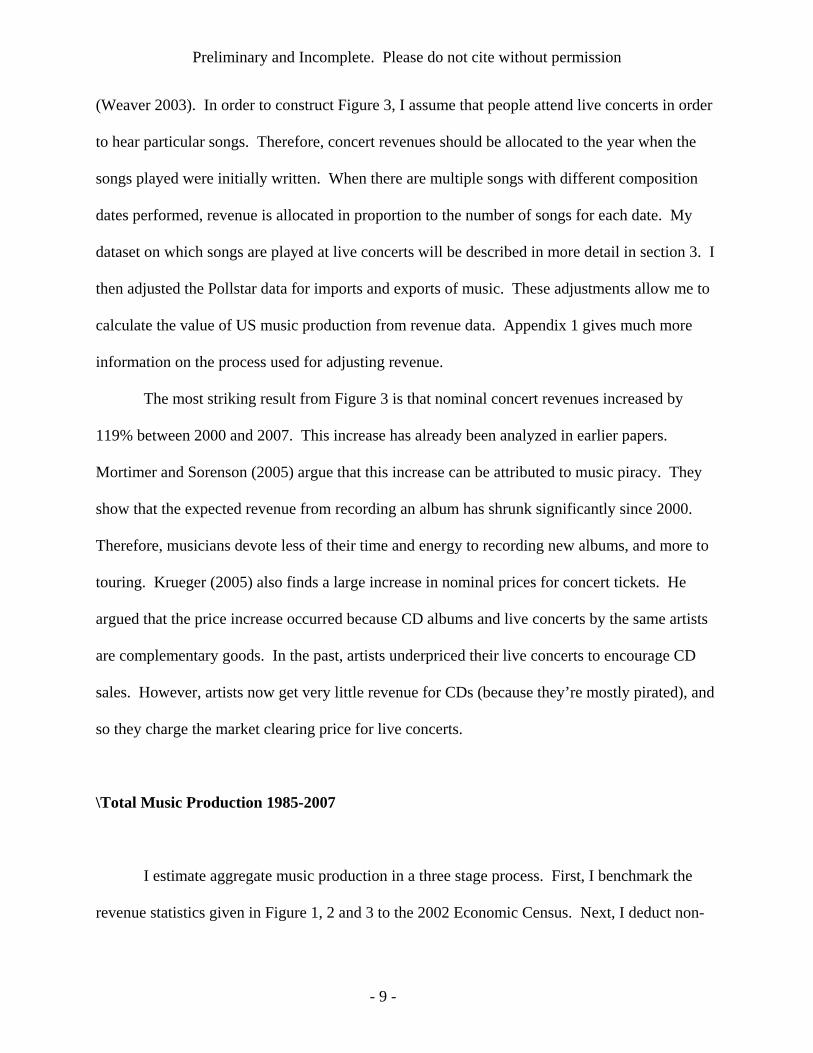
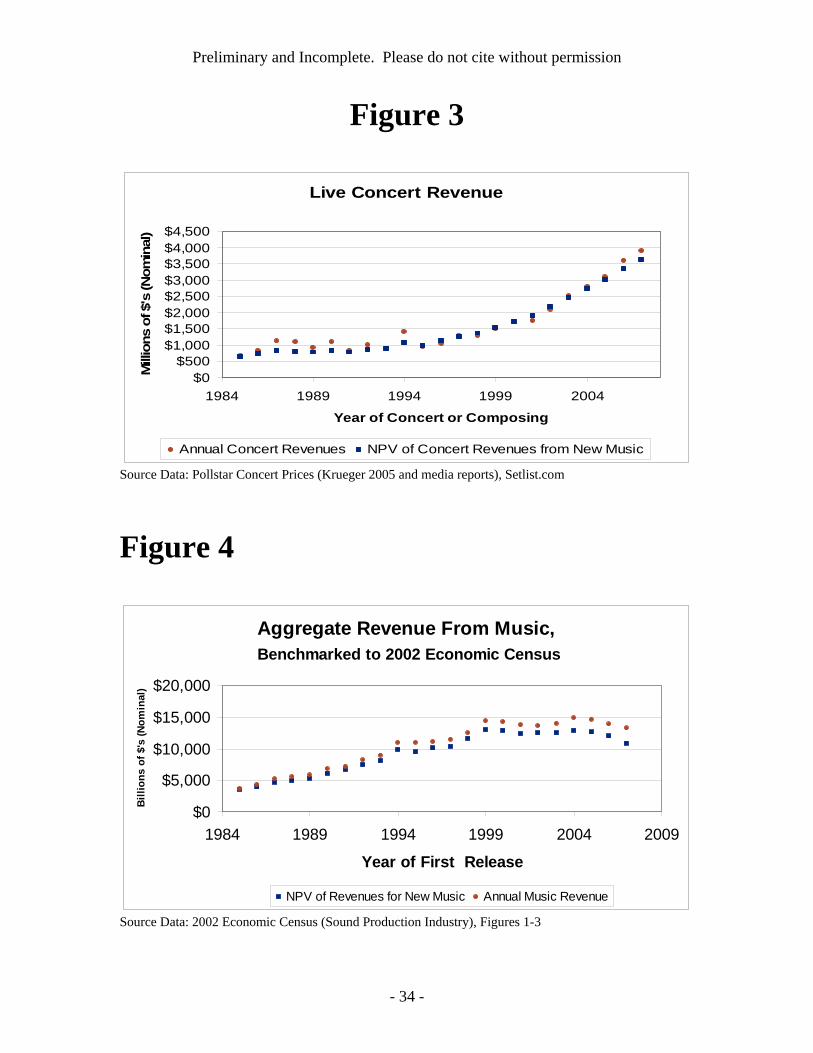
Figure 3 shows the net present value of live concert revenues by year of initial release.
The main datasource for Figure 3 is Pollstar, an industry group that tracks the live concert market
(Krueger 2005), (Pollstar 2006), (USA Today 2005), (Cohan 2007), (Grossberg 2003) and
reasons completely exogenous to the US music industry. They use that short-term stability as evidence that Napster did not affect CD sales in the long-term. However, it possible that piracy does affect CD sales, but it takes more than a few days for the results to be seen. On the other hand, the RIAA seems to assume that all downloads are illegal. It is common for new artists to post songs for their fans to legally download. These new artists may be responsible for some of the drop in CD sales. 3I have not been able to locate any annual data on synchronization royalties. Based on the 2002 Economic Census and the industry literature, I estimate that synchronization royalties are about 15% of performance royalties for every year from 1985 to 2007. 4 The results in Figure 2 are quite sensitive to my price index for royalties.
Preliminary and Incomplete. Please do not cite without permission
- 9 -
(Weaver 2003). In order to construct Figure 3, I assume that people attend live concerts in order
to hear particular songs. Therefore, concert revenues should be allocated to the year when the
songs played were initially written. When there are multiple songs with different composition
dates performed, revenue is allocated in proportion to the number of songs for each date. My
dataset on which songs are played at live concerts will be described in more detail in section 3. I
then adjusted the Pollstar data for imports and exports of music. These adjustments allow me to
calculate the value of US music production from revenue data. Appendix 1 gives much more
information on the process used for adjusting revenue.
The most striking result from Figure 3 is that nominal concert revenues increased by
119% between 2000 and 2007. This increase has already been analyzed in earlier papers.
Mortimer and Sorenson (2005) argue that this increase can be attributed to music piracy. They
show that the expected revenue from recording an album has shrunk significantly since 2000.
Therefore, musicians devote less of their time and energy to recording new albums, and more to
touring. Krueger (2005) also finds a large increase in nominal prices for concert tickets. He
argued that the price increase occurred because CD albums and live concerts by the same artists
are complementary goods. In the past, artists underpriced their live concerts to encourage CD
sales. However, artists now get very little revenue for CDs (because they’re mostly pirated), and
so they charge the market clearing price for live concerts.
\Total Music Production 1985-2007
I estimate aggregate music production in a three stage process. First, I benchmark the
revenue statistics given in Figure 1, 2 and 3 to the 2002 Economic Census. Next, I deduct non-
Preliminary and Incomplete. Please do not cite without permission
- 10 -
music production costs such as advertising, packaging and retailer profits. I was not able to
obtain a time series on sheet music sales, which accounted for 6% of the music market in 2002.
For simplicity, I will assume that sheet music is always 6% of total industry revenue.5 Finally, I
add the benchmarked revenue for CD’s, royalties, live concerts and sheet music together to get
total music production.
My primary dataset for benchmarking music revenues is the 2002 Economic Census.
According to the 2002 Economic Census, the sound recording industry earned $0.66 billion
dollars from the sale of sheet music and music books, $1.21 billion from performance royalties,
$0.19 billion from synchronization royalties for commercials6 and $9.17 billion from the sale of
CD’s, records and cassettes. In a separate section, the 2002 Economic Census also reports that
taxable music groups earned $2.42 billion from concerts.7 The numbers from the Economic
Census are quite consistent with the industry statistics given earlier. In Figure 1, total CD, tape
and download sales for 2002 was $8.2 billion, about 20% below the Economic Census’s estimate
for 2002. In Figure 2, total performance royalties received were $1.25 billion and
synchronization royalties were $0.19 billion, only slightly above the Economic Census’s
estimate of $1.21 billion in performance royalties and $0.19 billion. Finally, in Figure 3, concert
revenues were $2.23 billion in 2002, only slightly below the Economic Census’s estimate of
$2.42 billion. The small discrepancies between industry data and the Economic Census could be
5The 1997 Economic Census does not split out sheet music licensing from other royalties. According to my dataset, about 10% of sheet music are public domain songs. These songs can be (legally) downloaded free or printed by any publisher without payments to the original musician’s family. I will therefore reduce the Economic Census’s revenues by 10%. 6 In this paper, I will not include synchronization royalties paid by theatrical films or television programs because these royalties have already been counted in the value of theatrical films or will be counted in the value of television programs. However, I will include synchronization royalties paid by advertisers because commercials are not considered artistic originals (SNA 2008). 7 Non-taxable musical groups earned an additional $1.6 billion. I exclude this revenue because I believe that most of the revenue is for classical orchestras, which rarely compose original songs.
Preliminary and Incomplete. Please do not cite without permission
- 11 -
explained by slightly different industry classifications, different treatment of imports and
exports8 or other differences in survey methodology.
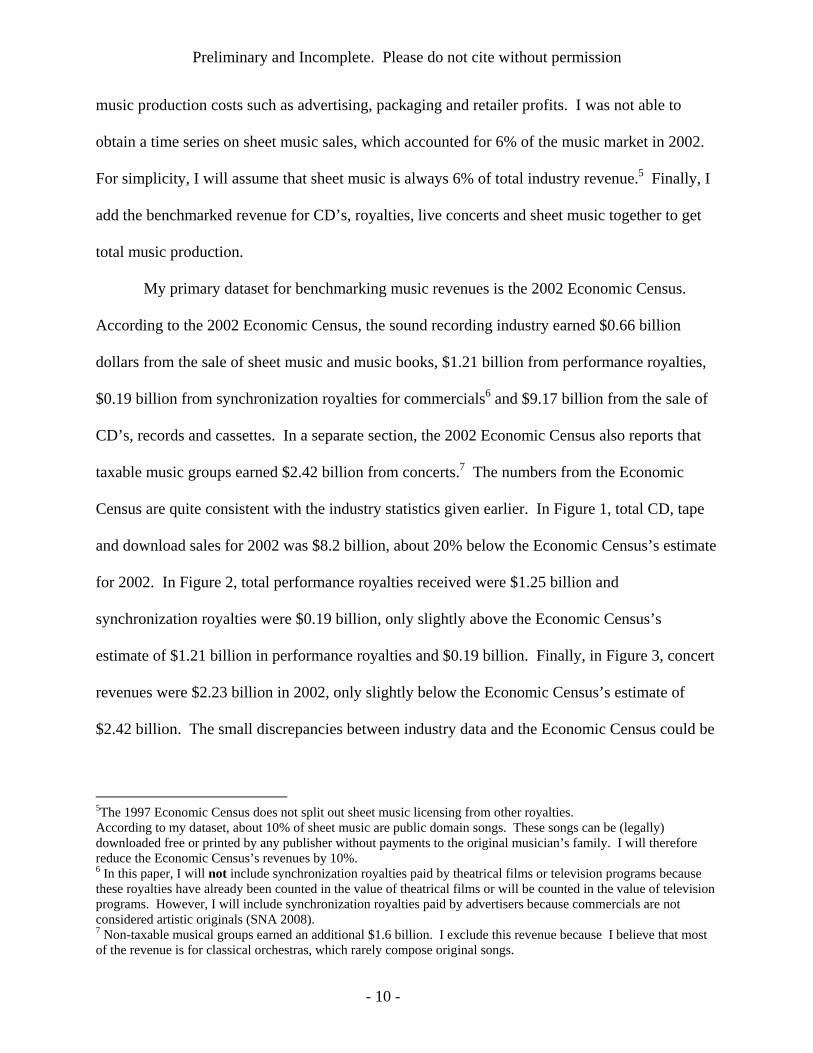
Figure 4 shows the aggregate revenues and the aggregate value of newly released songs.
Overall, I find that nominal revenues and nominal production have been stagnant since 2000. On
the other hand, nominal revenues and nominal production were growing at approximately 9% per
year between 1985 and 2000. However, I need to know non-music costs such as manufacturing
and marketing to estimate the value of music production over time.
Selling, manufacturing and distribution expenses are the easiest non-music cost to
calculate. According to the industry literature, recording studios spend 15% of their CD or
cassette revenues for manufacturing & shipping (Cohen 2004). For digital music such as Itunes,
manufacturing and shipping is free. Based on the ASCAP and BMI annual reports, I estimate
that royalty organizations keep about 15% of the royalties they collect to pay for their
administration costs.9 Finally, I estimate that bands earn enough money from merchandise sales
(such as T-shirts) to cover their touring costs and the promoter’s share of ticket sales.
Accordingly, sales, manufacturing and distribution costs for live concerts are effectively 0%
(Krueger 2005). I was unable to find any industry-specific estimate of the production costs for
sheet music, but in a separate paper I calculate that printing, shipping and other production costs
account for approximately 40% of the wholesale price for books (Soloveichik 2009).
8 In my industry analysis, I first collected data on total US sales, and then adjusted those US sales for imports and exports using industry data. As an alternative to the industry data on imports and exports, I also examined BEA’s own data on imports and exports of music. Based on careful analysis of BEA’s own data, I concluded that BEA’s trade in services survey measures a different definition of trade in services and a different sample universe than the industry data. As a result, I cannot combine BEA’s data on imports and exports with industry data on domestic consumption. Accordingly, I will rely exclusively on industry data to estimate domestic consumption, imports and exports of music. I will then benchmark the industry data to the 2002 Economic Census to derive total domestic production of music. 9 Synchronized royalty payments are not negotiated through an organization. However, I assume that agents charge the same 15% for handling negotiations.
Preliminary and Incomplete. Please do not cite without permission
- 12 -
Marketing expenses are much more complex to calculate. According to the industry
literature, advertising accounts for about 1/3rd of the non-manufacturing costs for CD’s (Cohen
2004 and my own calculations). I have not been able to find any industry literature on
advertising for royalties and live concerts. In this paper, I will assume that advertising is always
1/3rd of total industry revenue net of manufacturing, and advertising is distributed between
recording studios, royalty organizations and live concert promoters in proportion to their market
share. I will also assume that all marketing expenses occur in the first year after a song is
released.
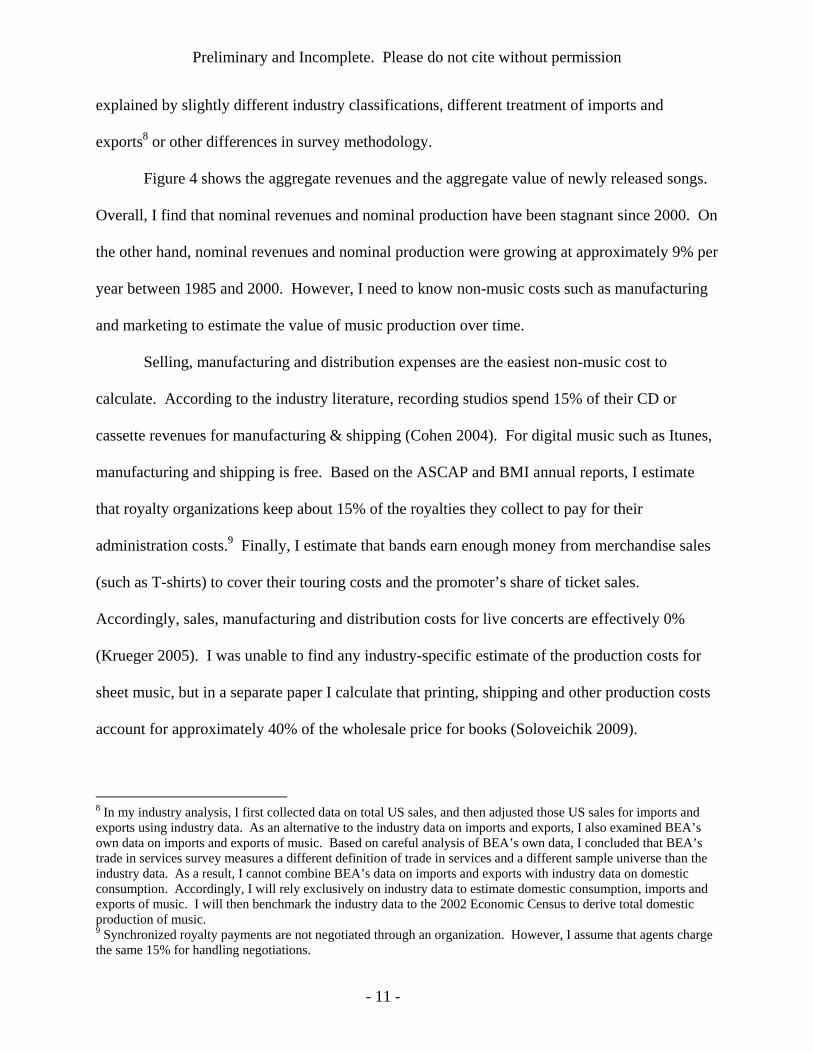
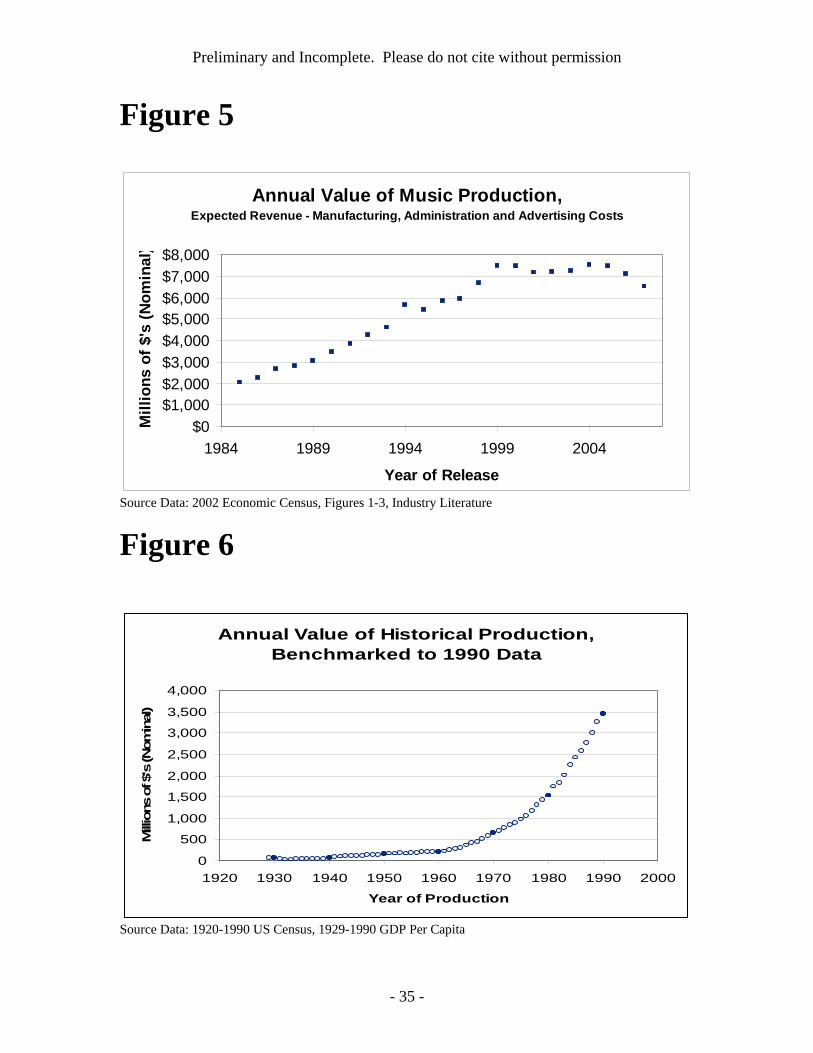
Figure 5 shows my estimate of the annual value of music released from 1985 to 2007.
One interesting finding from Figures 4 and 5 is that the ratio of Artistic Capital to Total Music
Revenue was a little over 40% in 2002. In a previous paper on the movie industry, I found a
similar ratio of Artistic Capital to Total Movie Revenue (Soloveichik 2008). This ratio might be
a subject for future research.
Historical Music Production 1929-1984
I have not been able to find any consistent industry data tracking music revenue from
1929 to 1984. I have located a paper that estimates the unit volume of record sales from 1920
onwards, but that paper does not report revenues or manufacturing cost (Gronow 1983).10 I have
also found isolated quotes reporting the licensing revenue for ASCAP or BMI in a particular year
(Sterling and Kittross 1978), but no consistent time series. Early in the century, sheet music was
a major money-maker for musicians (Sanjek 1988), but the only data I could find on sheet music
10 Prior to the 1970s, jukeboxes accounted for a large portion of record sales. Based on Mortimer’s work with DVDs (2008), I conjecture that records were significantly more expensive when jukeboxes accounted for most of the market.
Preliminary and Incomplete. Please do not cite without permission
- 13 -
sales is from the Census of Manufacturers – which gives inconsistent estimates over time.
Finally, I could not find any consistent data on live concert revenues over time.
Because of the lack of good industry data on sales, I will use Census data to estimate
music production over time.11 Every 10 years, the Census counts the US population and also
surveys a sample population on their employment, earnings, occupation and other interesting
variables. I use the employment and salary for musicians as an extrapolator for music profits.12
In 1990, the Census reported aggregate earnings for all musicians at $2.7 billion (nominal), about
40% lower than the total music industry profits estimated earlier in Figure 5. This discrepancy is
consistent with the fact that recording studios keep a substantial portion of CD profits to pay for
inputs like sound equipment, talent scouts and administrative overhead. In my analysis, I assume
that musician’s salaries were 60% of total industry profits for the entire time period 1929 to
1985.
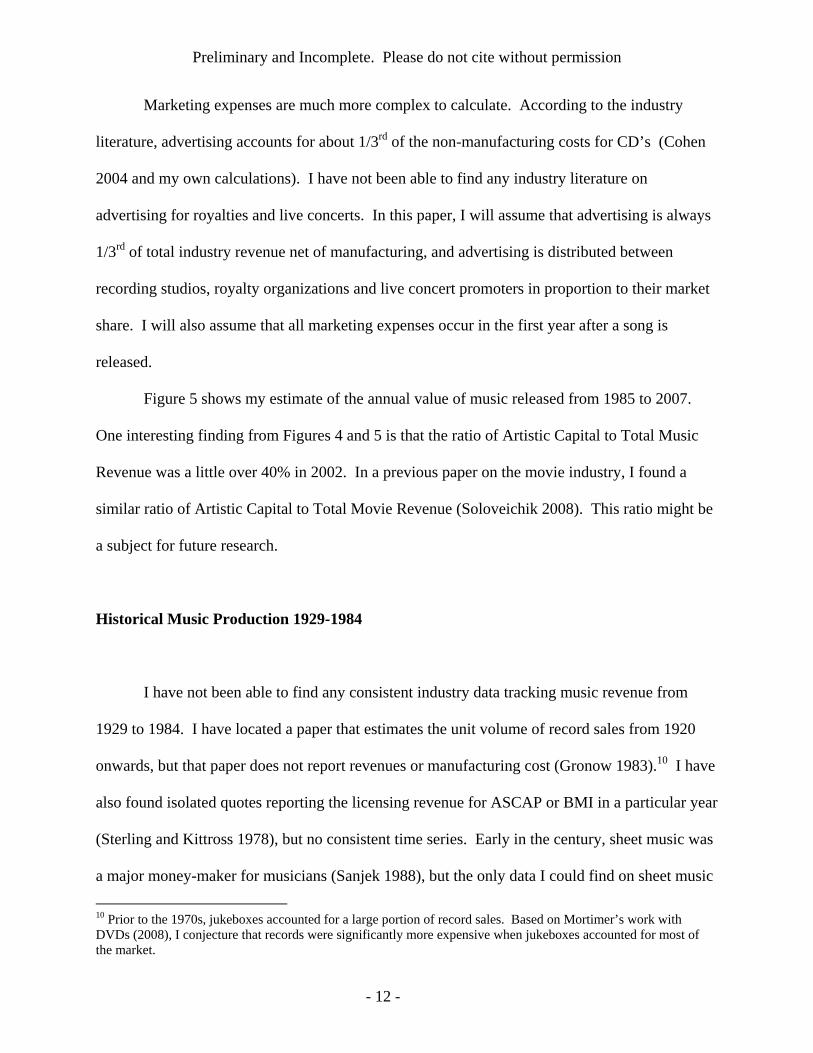
Figure 6 shows my estimate of nominal music revenues from 1929 to 1984. I find that
music revenues growth remained steady from 1930 to 1940 and then grew steadily over time.
Because my data are based on the decennial Census, I am forced to impute nominal revenues for
intermediate years. The exact imputation procedures are available upon request. One important
result of my imputation is the music production appears artificially smooth. Therefore, I cannot
estimate the exact growth rate for any given year – only the long-term average growth rate.
In a previous paper on theatrical movie production, I used IMDB data on exact filming
dates to produce quarterly production estimates for the entire movie industry. These aggregate 11 I also considered using the Current Population Survey, which provides annual employment data. Unfortunately, the sample sizes were too small to get reliable annual data. I also could not use the Consumer Expenditure Survey because the survey does not track non-consumer spending like royalty payments. I also could not use the BLS employment data because the time series for musicians started in 1990, too late for my historical needs. Finally, I considered using union membership data as a count of musicians, but that procedure misses early African-American musicians, who were banned from most unions. 12 A random sample of the Census data is available at Ipums.org. The Census samples are large enough that the standard error for my aggregate estimate is relatively small.
Preliminary and Incomplete. Please do not cite without permission
- 14 -
production estimates sometimes changed dramatically from quarter to quarter when studios
started or stopped filming big movies (Soloveichik 2008). Unfortunately, I can’t provide the
same quarterly data for music with any degree of confidence. The music industry generally does
not report the exact dates a song was first recorded in the studio. Furthermore, the final
recording accounts for relatively little of the time spent producing a CD. Much of the musician’s
time is devoted to writing the song, practicing the song and editing the song before final
recording (Thall 2006). In all of my analysis I will assume that music production takes one year
and production is uniform over that year. Therefore, inventory is assumed to be around half of
annual production.
2. Real Production
It is difficult to develop a price index for copyrighted songs. Each song is a unique
artistic creation, and so I can never compare the cost of producing two identical songs over time.
Furthermore, the main input to producing a song is the musician’s time and energy. It is
impossible for me to determine which songs the musician slaved over, and which ones were easy
to write. In this paper, I will create a consumer-based price index to estimate the cost of
purchasing a unit of music over time. I define a unit of music as one song purchased on tape, CD
or legal download, one minute of radio listening, one live concert and one book of sheet music.
My price index assumes that the quality of musical composition has remained constant
over time. I do not assume that the quality of the music listening experience has remained fixed
Preliminary and Incomplete. Please do not cite without permission
- 15 -
over time.13 Ipods are a big improvement over CD players and CD players were a big
improvement over records and tapes. Similarly, radio sound quality has improved with the
introduction of FM radio, satellite radio and digital radio. However, I believe that these quality
improvements should be attributed to the consumer electronics market and not the music
industry. After all, recording studios can and do re-release classic songs on CD or Itunes. These
songs are often digitally remastered so their sound quality is better than the first release on record
or tape.
My consumer-based price index only tracks legal music consumption. In other words,
the number or price of illegal downloads and pirated CD’s has no impact on my price index. The
number and market share of illegal downloads has been increasing rapidly over the last decade
(RIAA website). By 2006, consumers downloaded approximately 1 billion tracks per month
(Hiatt and Serpick 2007) – more than ten times the legal sales of music. Accordingly, the
average consumer price for music has fallen substantially even while the legal price for music
stays fixed. However, BEA’s general practice is to ignore illegal activity when measuring
prices. For example, we don’t discount prices for goods which are shoplifted frequently.
Furthermore, I don’t have good time series data on how many songs are pirated per year.14 As a
result, I can’t calculate the average consumer price for music over time. Instead, I will only track
prices for legal music consumption.
13 This index may produce flawed results if the market size for music has changed over time for reasons unconnected to music quantity, music quality or music prices. For example, the invention of CD’s might suddenly double the demand for music. Holding the quality and quantity of songs fixed, this doubled demand means that each new song is worth twice the value of an identical song last year. However, the supply of music is elastic, and so music production is likely to rise if an exogenous shock raises the interest level in music. Furthermore, new music technology is also associated with lower costs of music production. In the long-term, new music technologies have an ambiguous effect on profits earned by musicians per song. 14 There are industry groups that estimate the number of tracks downloaded from peer to peer networks. However, there is much less data on less organized piracy such as copying CD’s or e-mailing songs between friends. Even if I had good data on total piracy, I still wouldn’t be able to create a quantity index without knowing the relative weight to use for legal versus illegal songs.

Preliminary and Incomplete. Please do not cite without permission
- 16 -
There are a variety of ways in which music is purchased. In this section, I will construct
four separate consumer price indexes for music: 1) A per-song price index for CD albums,
cassettes, downloads and other music sales; 2) A per-minute price index for radio airplay and
television broadcast; 3) A per-event price index for live concerts; 4)A per-book price index for
sheet music and song books. I will then combine those four price indexes into a single
composite price index, and use that composite to deflate nominal production from Figure 5 and
6.
Price Index for Retail Sales 1976-2007
My price data for retail sales is taken from RIAA’s annual reports. These annual reports
provide both the units shipped and the retail value of shipments for a variety of formats such as
ringtones, digital albums, CD albums, etc. I can then calculate average retail prices for each
format according to the simple formula:
Average Price for Format X= (Total Value of X)/(# Units of X).
As a robustness check, I also computed the average price for audio products as a whole
and compared it to BLS’s price index for “Audio discs, tapes and other media”.15 I find that the
two track reasonably closely from 1999 to 2007, suggesting that the RIAA data is a valid proxy
for actual retail data.
In this paper, I want to measure the price of the intellectual property contained on a CD,
but not the price of the CD as a physical good. I will do that by comparing the retail prices for 15In the past, recording studios charged $2-$4 more for a CD album than the same album on tape. Therefore, the average price per album rose faster than the average price per CD album or tape album. The BLS’s price index for audio media started in 1999. By that time, CD’s had almost completely replaced tapes, and so the BLS’s price index will not biased by this substitution. As I discussed earlier, I believe that the quality improvement from tapes to CD’s should be attributed to the electronics industry – not the music industry. Accordingly, I consider the price increase from tapes to CD’s to be inflation from the standpoint of musicians. In other words, a musician produces the exact same music for a CD and tape – he or she just charges more to compensate for better electronics.
Preliminary and Incomplete. Please do not cite without permission
- 17 -
albums and singles. Physically speaking, a single and an album look identical, and they cost the
same amount for the recording industry to manufacture, ship or sell on-line. However, an album
typically contains 10-20 songs and are sold for $15-$25 in stores. At the same time, a single
contains 1 song and is sold for approximately $5 in stores. The price difference between the two
is the value of the artistic assets contained on the CD. I can therefore estimate the price of an
individual song:
Price Per Song = (Album Price – Single Price)/(Average # of Songs Per Album17 – 1)18
Price per physical CD = (Price per single CD – Price Per Song)
Price for digital file = (Price for single download – Estimated Price Per Song)
This formula provides a price per physical CD of around $4 in 2004. By comparison, an
independent market research firm estimates that it costs around $3.39 cents to manufacture, ship
and sell a CD at a big box retailer like Walmart. The same industry report also states that small
music retailers have higher costs, but does not provide any specific numbers. Even without an
exact number, this analysis is quite close to my estimate of $4 per physical CD in 2004. (Cohen
2004).19
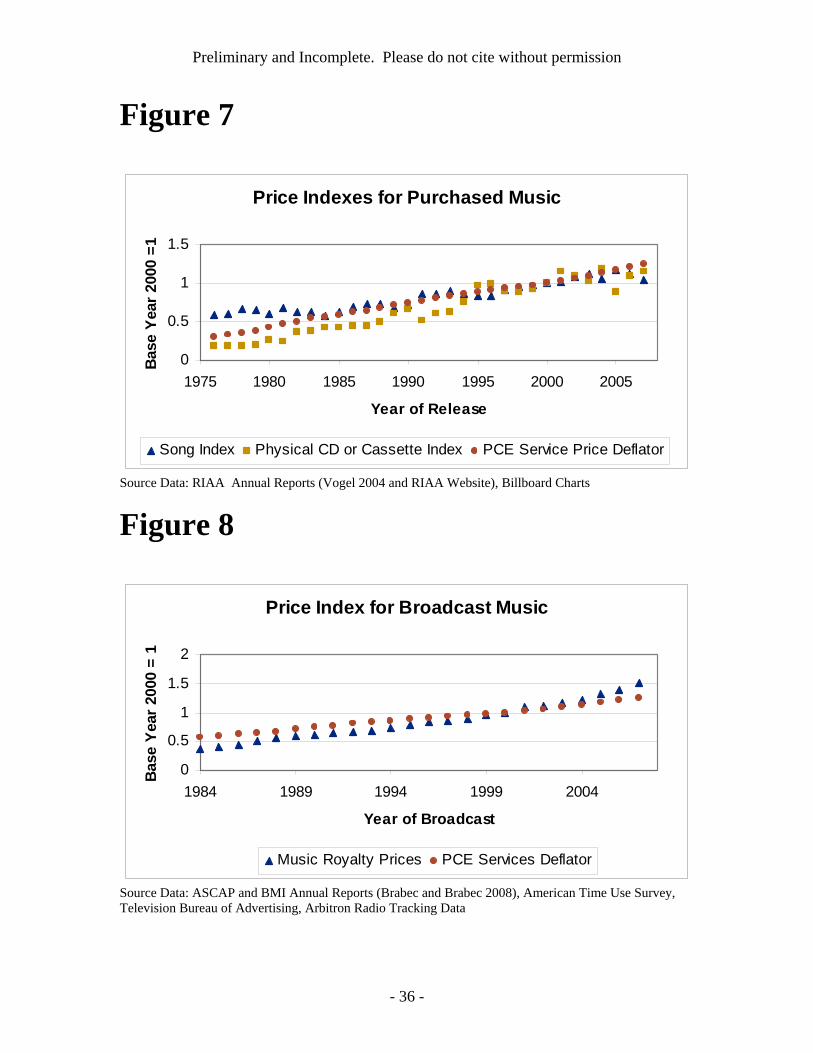
Figure 7 shows a price index for songs from 1976 to 2007. I find that average price per
song has only increased by 77% from 1976 to 2007. In comparison, the PCE services deflator
has risen by 300% over the same time period. The slow growth in song prices is particularly
surprisingly in light of the fact that the price of a physical CD or cassette has risen by 500%
17 In this analysis, I use that overall average # of songs per album for each year (about 15). I also experimented with using a separate average for each year. This yielded very similar results on average, but the yearly data was noisier. 18 It might seem that this formula only works when the average quality of singles and albums is identical. In fact, creative industries have a general practice to charge the same price for all their products, regardless of quality (Orbach and Einav 2007). 19 In particular, the article reports that CD’s cost $1.70 to manufacture and ship and $3.69 for retailer overhead for each sale. However, Walmart uses CD’s as a loss leader for other products, and therefore is willing to lose about $2.00 per CD. Independent music stores typically charged higher prices for CD’s.
Preliminary and Incomplete. Please do not cite without permission
- 18 -
since 1976 (based on the formula described earlier).20 In other words, the area with little
technological improvement, composing music, has enjoyed a very low inflation rate. In contrast,
the area with rapid technological improvement, listening to music, has increased in price much
faster. I
Price Index for Broadcast Royalties 1984-2007
I will compute a price index for royalties on a per minute per listener basis. The two
main licensing organizations, ASCAP and BMI, both charge a fixed fee to radio or television
stations for playing their songs.21 In 2007, radio stations and television stations paid
approximately the same amount of money for licensing rights (Brabec and Brabec 2008).
Furthermore, Americans spend approximately the same amount of time watching television and
listening to the radio.22 Therefore, I can calculate royalty prices according to the simple formula:
Price Per Minute = (Royalties Paid)/[(#Minutes TV + # Minutes Radio)*#Americans]
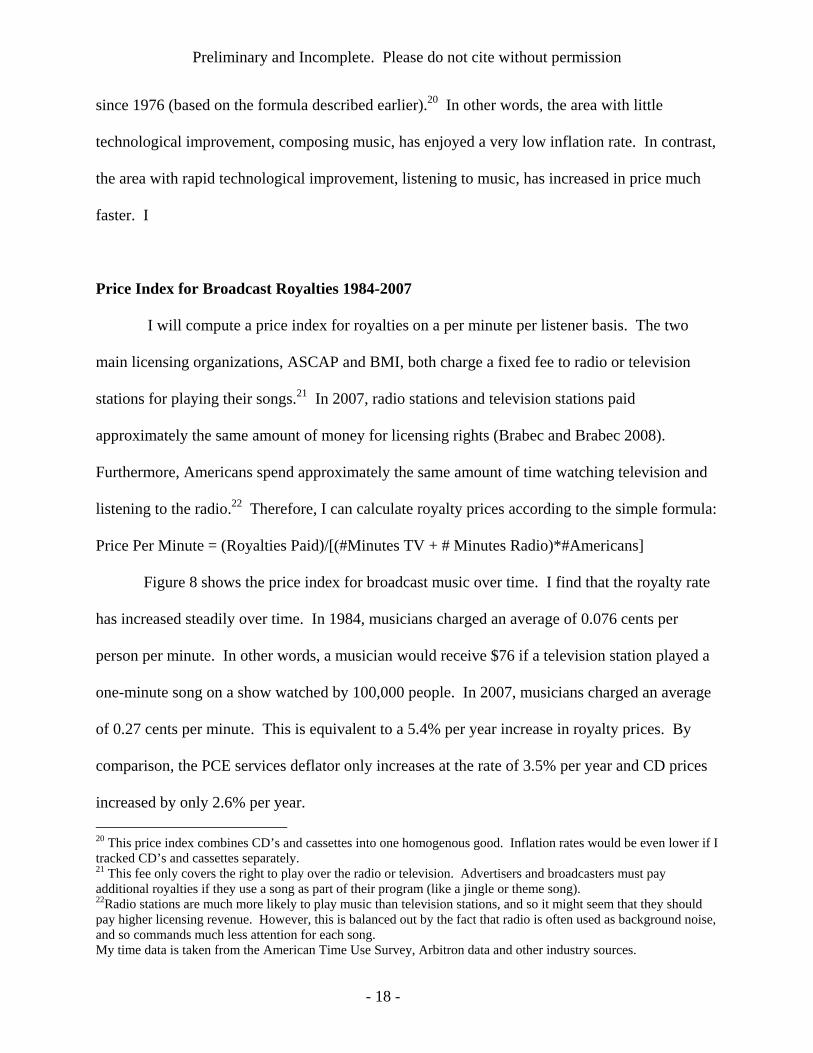
Figure 8 shows the price index for broadcast music over time. I find that the royalty rate
has increased steadily over time. In 1984, musicians charged an average of 0.076 cents per
person per minute. In other words, a musician would receive $76 if a television station played a
one-minute song on a show watched by 100,000 people. In 2007, musicians charged an average
of 0.27 cents per minute. This is equivalent to a 5.4% per year increase in royalty prices. By
comparison, the PCE services deflator only increases at the rate of 3.5% per year and CD prices
increased by only 2.6% per year. 20 This price index combines CD’s and cassettes into one homogenous good. Inflation rates would be even lower if I tracked CD’s and cassettes separately. 21 This fee only covers the right to play over the radio or television. Advertisers and broadcasters must pay additional royalties if they use a song as part of their program (like a jingle or theme song). 22Radio stations are much more likely to play music than television stations, and so it might seem that they should pay higher licensing revenue. However, this is balanced out by the fact that radio is often used as background noise, and so commands much less attention for each song. My time data is taken from the American Time Use Survey, Arbitron data and other industry sources.
Preliminary and Incomplete. Please do not cite without permission
- 19 -
Price Index for Live Concerts
I take my price index for live concerts from the paper “Rockonomics: The Economics of
Popular Music” (Krueger and Connolly, 2005). They calculate a large number of possible price
indexes. In this paper, I will use their Fisher price index by artist. Krueger and Connoly’s price
index goes until 2003. I then collected Pollstar’s reports of average ticket prices for 2003-2007
in order to extend the time series further. For simplicity, I assume that average ticket prices rose
at exactly the same rate as Krueger and Connolly’s carefully constructed price index. I have data
on average ticket prices back to 1995. I found that annual growth rates don’t match up perfectly
with Krueger and Connolly’s data, but overall price growth is quite similar.
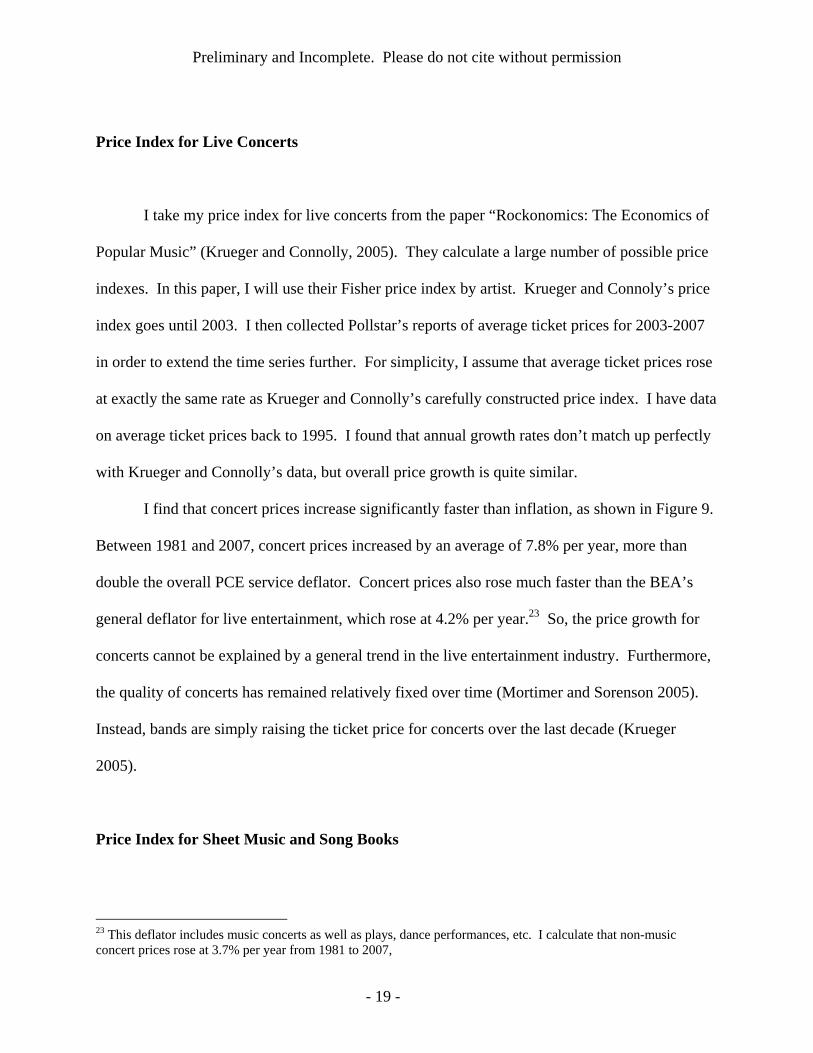
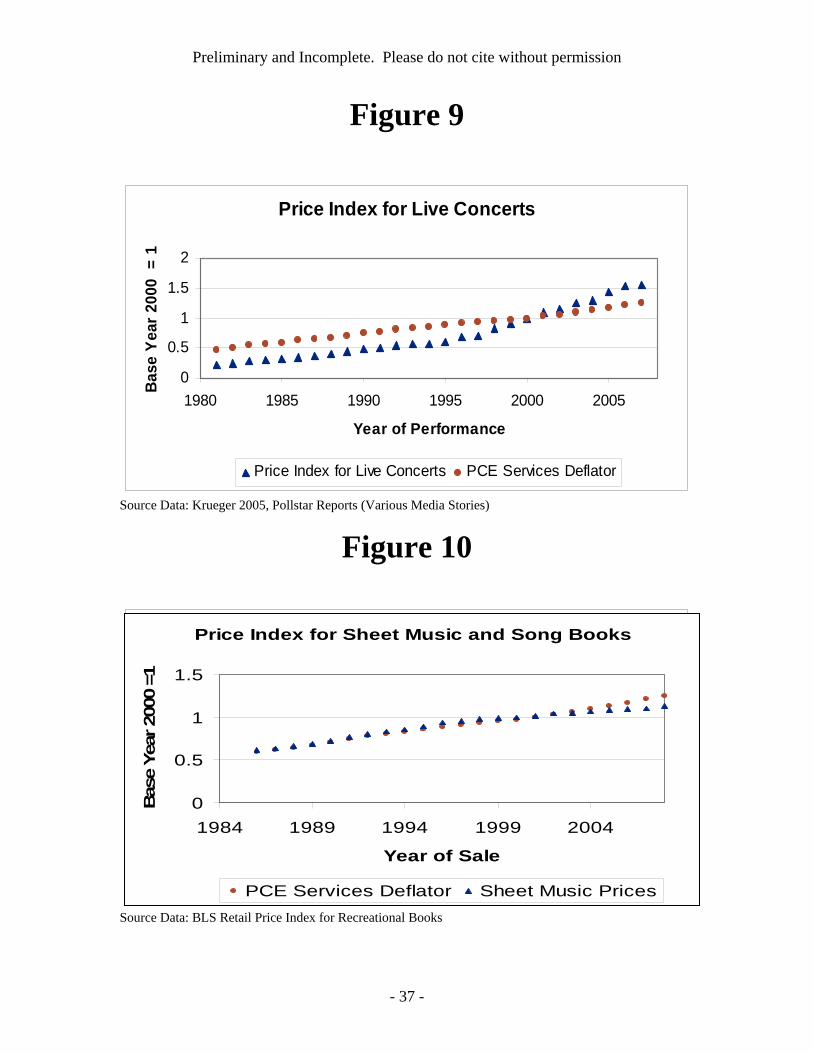
I find that concert prices increase significantly faster than inflation, as shown in Figure 9.
Between 1981 and 2007, concert prices increased by an average of 7.8% per year, more than
double the overall PCE service deflator. Concert prices also rose much faster than the BEA’s
general deflator for live entertainment, which rose at 4.2% per year.23 So, the price growth for
concerts cannot be explained by a general trend in the live entertainment industry. Furthermore,
the quality of concerts has remained relatively fixed over time (Mortimer and Sorenson 2005).
Instead, bands are simply raising the ticket price for concerts over the last decade (Krueger
2005).
Price Index for Sheet Music and Song Books
23 This deflator includes music concerts as well as plays, dance performances, etc. I calculate that non-music concert prices rose at 3.7% per year from 1981 to 2007,
Preliminary and Incomplete. Please do not cite without permission
- 20 -
As discussed earlier in section 1, I was not able to find any time series data on sheet
music sales or sheet music prices. Instead, I will use the consumer price index for recreational
reading as a proxy for sheet music and song book prices. This price index is available from the
BLS website for anybody to download.
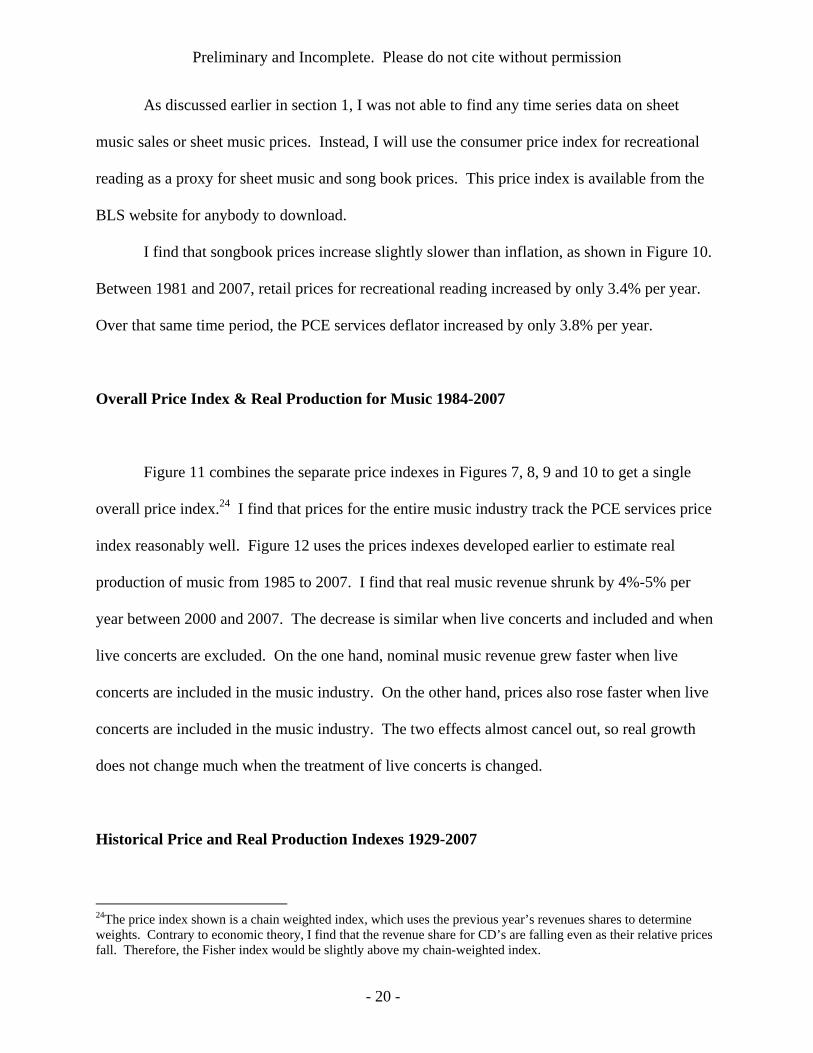
I find that songbook prices increase slightly slower than inflation, as shown in Figure 10.
Between 1981 and 2007, retail prices for recreational reading increased by only 3.4% per year.
Over that same time period, the PCE services deflator increased by only 3.8% per year.
Overall Price Index & Real Production for Music 1984-2007
Figure 11 combines the separate price indexes in Figures 7, 8, 9 and 10 to get a single
overall price index.24 I find that prices for the entire music industry track the PCE services price
index reasonably well. Figure 12 uses the prices indexes developed earlier to estimate real
production of music from 1985 to 2007. I find that real music revenue shrunk by 4%-5% per
year between 2000 and 2007. The decrease is similar when live concerts and included and when
live concerts are excluded. On the one hand, nominal music revenue grew faster when live
concerts are included in the music industry. On the other hand, prices also rose faster when live
concerts are included in the music industry. The two effects almost cancel out, so real growth
does not change much when the treatment of live concerts is changed.
Historical Price and Real Production Indexes 1929-2007
24The price index shown is a chain weighted index, which uses the previous year’s revenues shares to determine weights. Contrary to economic theory, I find that the revenue share for CD’s are falling even as their relative prices fall. Therefore, the Fisher index would be slightly above my chain-weighted index.
Preliminary and Incomplete. Please do not cite without permission
- 21 -
The price indexes developed earlier in this section are all consumer based.
Unfortunately, I don’t have consumer price information before 1985, and so I can’t construct a
consumer-based price index back to 1929. Instead, I will use musician’s wages to construct a
labor-based price index. This labor-based price index assumes that musicians produce the same
amount of music per hour in 1929 and 2009. Such a labor-based index still allows for
technological improvements like CD’s, satellite radio and Ipods that may improve the music
listening experience – but it assumes no technological progress for music composition. I drew
my dataset on labor inputs from the 1920 – 2000 US Census and the 2001-2007 American
Community Survey (ACS).
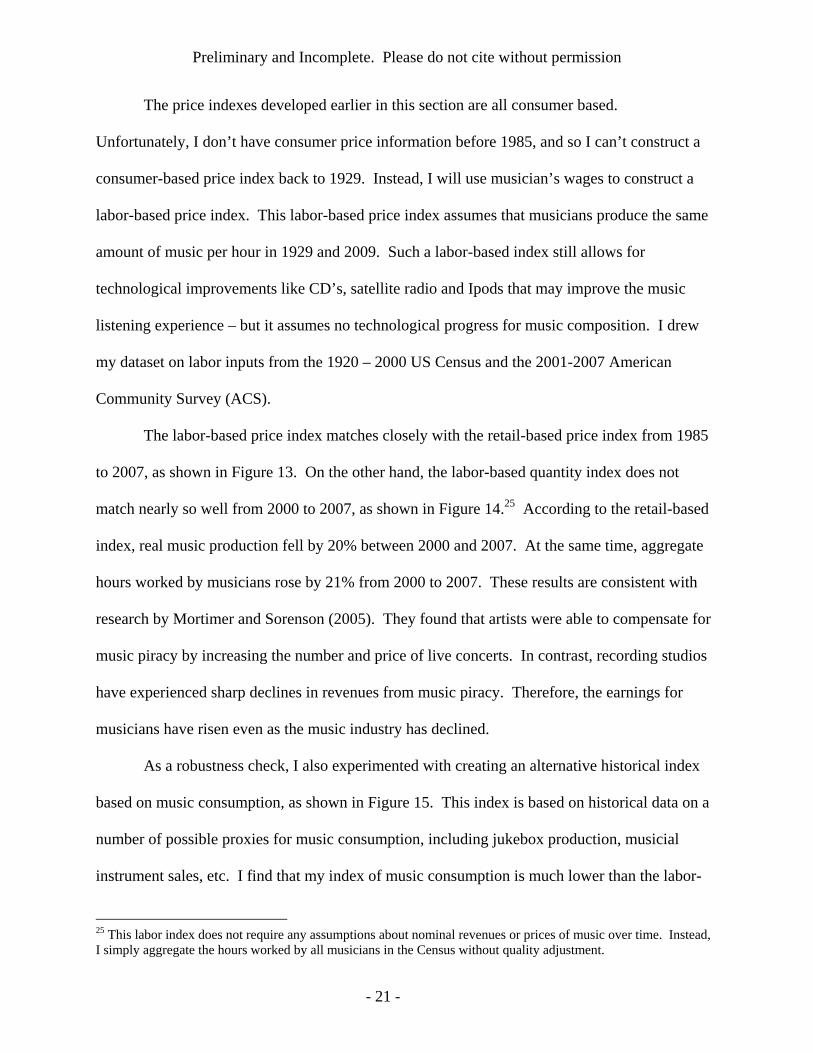
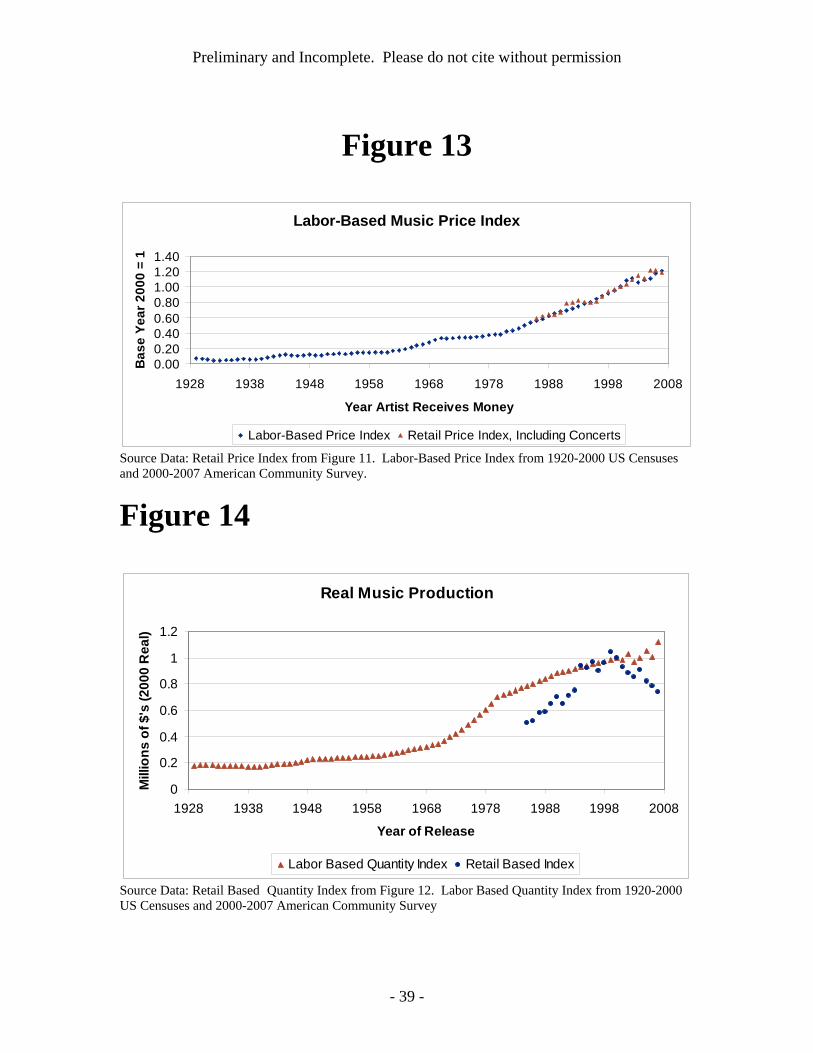
The labor-based price index matches closely with the retail-based price index from 1985
to 2007, as shown in Figure 13. On the other hand, the labor-based quantity index does not
match nearly so well from 2000 to 2007, as shown in Figure 14.25 According to the retail-based
index, real music production fell by 20% between 2000 and 2007. At the same time, aggregate
hours worked by musicians rose by 21% from 2000 to 2007. These results are consistent with
research by Mortimer and Sorenson (2005). They found that artists were able to compensate for
music piracy by increasing the number and price of live concerts. In contrast, recording studios
have experienced sharp declines in revenues from music piracy. Therefore, the earnings for
musicians have risen even as the music industry has declined.
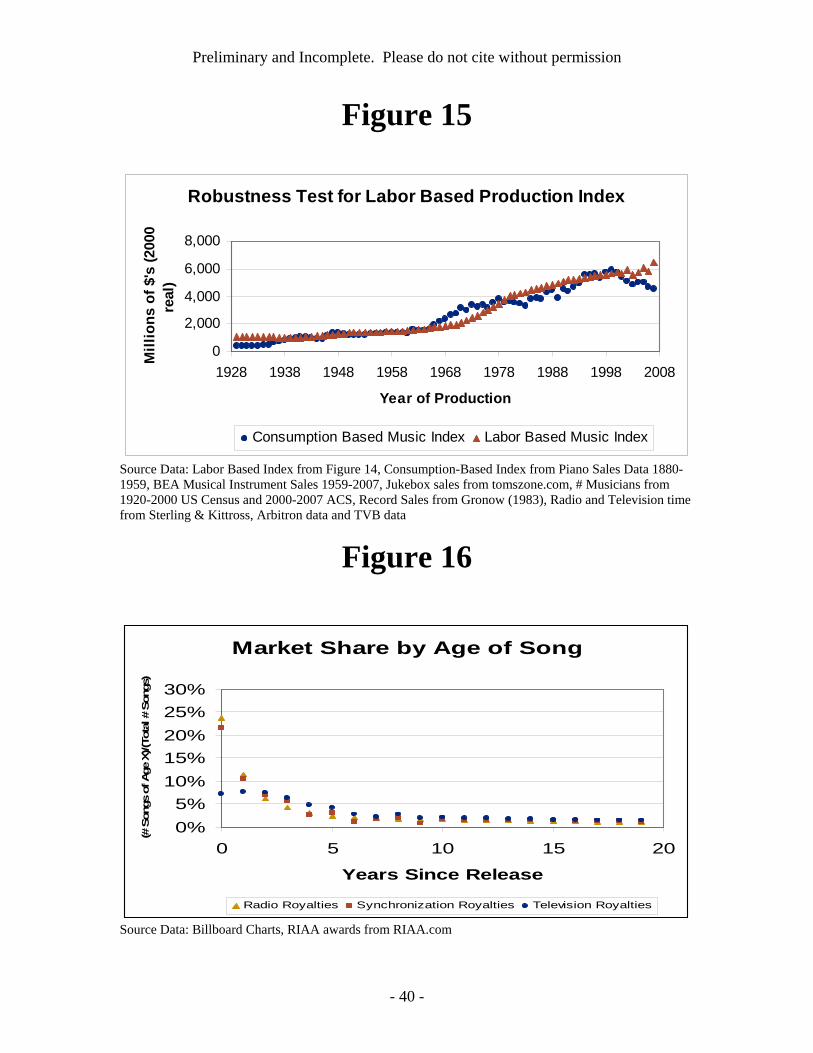
As a robustness check, I also experimented with creating an alternative historical index
based on music consumption, as shown in Figure 15. This index is based on historical data on a
number of possible proxies for music consumption, including jukebox production, musicial
instrument sales, etc. I find that my index of music consumption is much lower than the labor-
25 This labor index does not require any assumptions about nominal revenues or prices of music over time. Instead, I simply aggregate the hours worked by all musicians in the Census without quality adjustment.
Preliminary and Incomplete. Please do not cite without permission
- 22 -
based production index from 1929 to 1940, tracks the labor-based production index reasonably
closely from 1940 to 2000 and then diverges again after 2000. Therefore, I have some
confidence that the labor-based quantity index produces historical estimates within the right
ballpark. Please e-mail me for more details about the music consumption index.
Section 3: Revenue Streams From Original Music
In this section, I will estimate the revenue streams and costs separately for each channel.
I will then combine the separate revenue streams to get an overall depreciation rate for original
songs.
In this paper, I will use four separate datasets to estimate the rate at which studios receive
revenue from their copyrighted movies: 1)Billboard charts of album sales in the United States; 2)
Music Monitor’s tracking of radio airplay by month of airplay and year of original song release;
3)A website listing the songs played in a sample of television programs and theatrical movies;
worldwide box office charts; and 4) A webiste listing the songs played in a sample of live
concerts. All of these datasets required extensive cleaning before they could be used. Please
contact me for more information on the exact data cleaning procedures.
Purchased Music Sales (CD’s, Itunes, Records, Cassettes, etc.)
Figure 16 shows the lifespan for an individual song on CD. I found that the typical song
sells most of its copies soon after release. More than half of all album sales occur in the first
quarter after an album is released, and only 13% of album sales occur more than one year after
Preliminary and Incomplete. Please do not cite without permission
- 23 -
release. Because a popular song can be re-released on compilation albums, the lifespan for songs
is slightly longer than the lifespan for an particular album. However, compilations account for
only 12% of CD sales on average. In addition, many compilation albums are released within
five years of the original song release. Therefore, the vast majority of sales revenue occurs
within the first two years after a song is released on CD.
The lifespan on CD given in Figure 16 relies on a number of assumptions. Billboard’s
charts only report sales for best-selling 250 albums. According to industry sources, the best-
selling albums account for approximately 70% of total sales. In my analysis, I adjust for the
missing data by over-weighting sales for CD’s ranked 150-250. This procedure implicitly
assumes that CD’s ranked 150-250 have the same average age as CD’s ranked 250+. In addition,
Billboard’s charts do not provide actual sales figures, only ranked sales. My estimates of the
lifespan of songs change significantly when I use different formulas to impute gross sales based
on chart rank.
As a robustness test, I also experimented with using an alternative dataset on CD sales
from the Recording Industry Association of America (RIAA).26 I find that the RIAA and
Billboard dataset produce almost identical depreciation profiles, as shown in Figure 16.
According to both datasets, more than 75% of CD sales occur in the first year after a song is
released. Sales then decrease rapidly, and very few albums sell any significant quantities more
than five years after initial release. In the remainder of my paper, I will use the the Billboard
revenue data to estimate depreciation profiles for songs. Results remain very similar when I use
the RIAA depreciation profile.
26 The RIAA does not directly measure sales. Instead, they give out awards for albums that ship 0.5 million, 1 million, 2 million, etc. copies. This awards data is available on their website. I use Billboard data to estimate sales of compilation albums and movie soundtracks. It would have been extremely labor intensive to recalculate these small revenue sources. I then adjusted the Billboard data to account for the fact that compilation albums and soundtracks account for a lower market share in the RIAA data than on Billboard.
Preliminary and Incomplete. Please do not cite without permission
- 24 -
It is important to note that the short lifespan for CD sales does not necessarily mean that
nobody is listening to old songs. CD’s are durable goods, and so consumers may be buying a
CD soon after release and then listening for decades. In fact, the main reason for the short
lifespan of CD sales is probably saturation of the target market. In other words, fans want to
own a new CD as soon as it is released. Furthermore, there is an active resale market for used
CD’s, and so new fans of an artist can buy his or her CD’s without the recording studio making
any money.27
Royalties and Sheet Music Sales
Musicians earn royalties in a variety of ways. Musicians earn performance royalties
whenever a radio station rebroadcasts an pre-existing song. Musicians also earn synchronization
royalties whenever a television program, commercial or theatrical movie combines their song
with film to create a new artistic work.28 Finally, musicians earn performance royalties once
again when a television station broadcasts a program with a pre-existing song, even though the
producer has already paid synchronization royalties for the song. In addition to all of these
royalties, composers also earn royalties whenever their songs are sold on sheet music or music
books.
My radio royalty data is taken the company Music Monitor. This company tracks airplay
by song more than 2,000 radio stations across the US. In my analysis, I requested a dataset
27 During the 1990’s, recording studios earned significant amounts of money from consumers who replaced their record collection with CD’s of the same songs. However, it is straightforward to transfer songs from CD to digital files, and so consumers are unlikely to pay for new releases on a digital format. 28 As discussed in Section 1, I will not count synchronization royalties in the aggregate music market because they have already been counted in the theatrical movie industry or will be counted in the television industry. However, I will still count those royalties when I calculate depreciation rates.

Preliminary and Incomplete. Please do not cite without permission
- 25 -
tracking market share by month and year of airplay. For example, songs composed in 1946
accounted for 0.016% of the radio market in March of 2006. I can then estimate the depreciation
rate by tracking the radio market share for a year over time. Because the sample of radio stations
is very large, it might seem that this procedure produces a very precise estimate of the
depreciation rate. In fact, I only observe 41 months of data, from January of 2006 to May of
2009.29 My estimates may be biased if this period was unusual in any way.
My television and movie royalty data is taken from the website tvtunefinder.com. This
website identifies the songs performed for a sample of popular TV shows. I then looked up the
release date for a stratified sample of songs listed on tvtunefinder. It is important to note that the
shows listed in tvtunefinder.com are not necessarily representative of the entire industry, and
they may be biased in any number of ways. Nevertheless, I was not able to find any more
authoritative datasets.
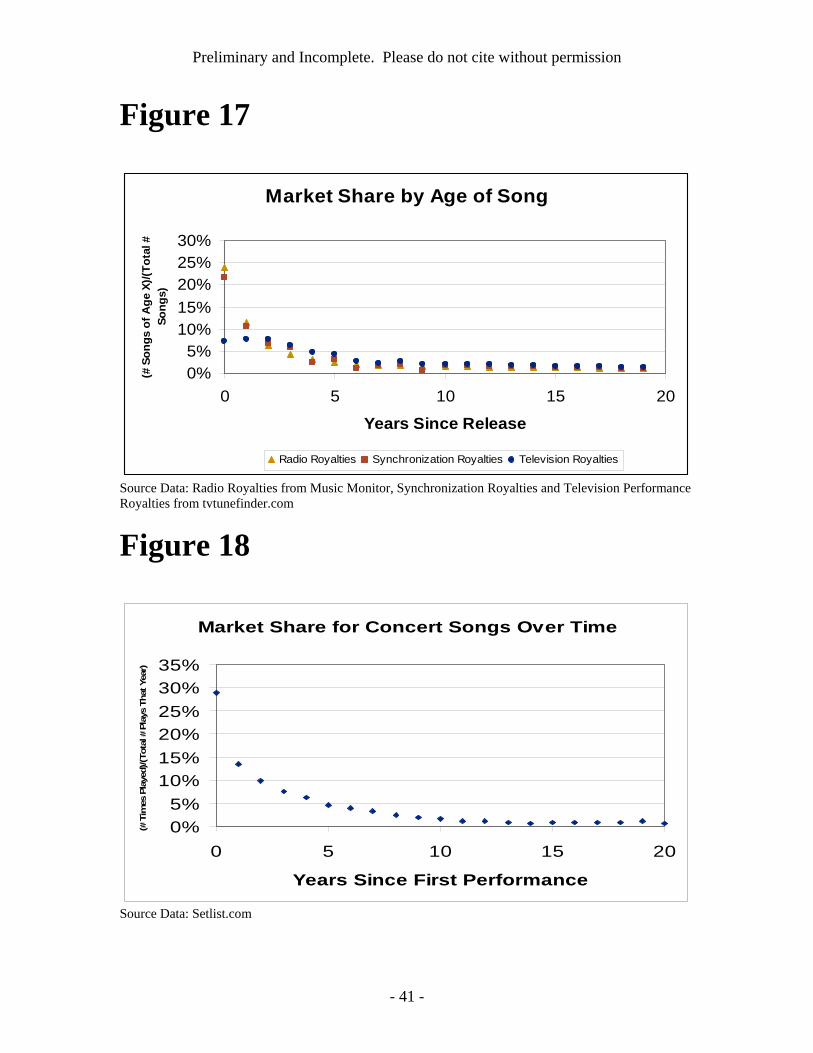
Figure 17 show the average market share by age of songs for radio royalties,
synchronization royalties and television broadcast royalties. I find that radio royalties,
synchronization royalties and sheet music sales decrease extremely fast at first. For example,
songs released in 2005 acounted for 27% of the radio market in January of 2006, but only 16%
of the radio market in December of 2006. On the other hand, I find that royalties from television
broadcast diminish significantly slower. Intuitively, the slower decrease can be explained by the
fact that the original musician gets new royalties each time the show is re-run in syndication.30
29 The dataset provided by Music Monitor starts in January of 2004. However, the market share for classic songs dropped dramatically during 2004 and 2005. This market share decline is not a data error by Music Monitor – Arbitron data reports a similar decline in the market share for Oldies stations. Nevertheless, I believe that including this unusual time period would produce a misleading depreciation curve. I therefore started the sample in January of 2006, after the taste shift had already occurred. 30 I do not yet have any data on the lifespan for television programs. In this analysis, I assume that television programs depreciate at the rate of 40% per year. I also assume that theatrical movies account for 10% of songs played on TV, and those movies depreciate at 3% per year (Soloveichik 2008)
Preliminary and Incomplete. Please do not cite without permission
- 26 -
Based on the radio airplay data, I estimate that older songs depreciate much slower. In
January of 2006, songs released before 1995 accounted for 26.4% of the total radio market.
These same songs accounted for 23.7% of the total radio market in May of 2009. This is
equivalent to an annual depreciation rate of 3.8% per year. I found similar results for
synchronization royalties and sheet music sales, but the datasets for those revenue sources were
too small to estimate the long-term depreciation rate precisely. I will therefore use the same
3.8% rate to depreciate those royalties.
I also experimented with estimating the lifespan for sheet music sales. My sheet music
data is taken from the website musicnotes.com. Unfortunately, I found that musicnotes.com data
had so much random noise that I could not compute a meaningful depreciation curve. However,
the general depreciation pattern was similar to that of television performance royalties.
Therefore, I will assume that sheet music sales depreciate at the same rate as television
performance royalties. Please e-mail me for more information about the sheet music results.
Live Concert Revenues
All of my data on concert songs is taken from the website Setlist.com. This website
collects the program of songs performed (called a set) at concerts for a sample of 379 artists.
The main data starts with concerts during the 1960s, and continues until concerts at the end of
2008. It is important to note that the musicians listed on Setlist.com are not a comprehensive
sample of the industry, or even a random sample of the most influential artists. Setlist.com is a
website created by unpaid fans of a particular musician or band. Individual fans e-mail in set
lists or post the set lists on the website. I do not know if the musicians on Setlist.com are
representative of the entire industry, or whether the concerts posted on Setlist.com are
Preliminary and Incomplete. Please do not cite without permission
- 27 -
representative of the entire concert market. I was also unable to check directly whether the songs
posted on Setlist.com are accurate. Nevertheless, Setlist.com is the best data I could find to
estimate the vintage of songs performed at concerts. I then weighted each concert by the venue’s
reported capacity (as listed on Onlinegigs.com). For example, a concert at Madison Square
Garden, which holds more than 20,000, counts for more than a concert at a local bar.31
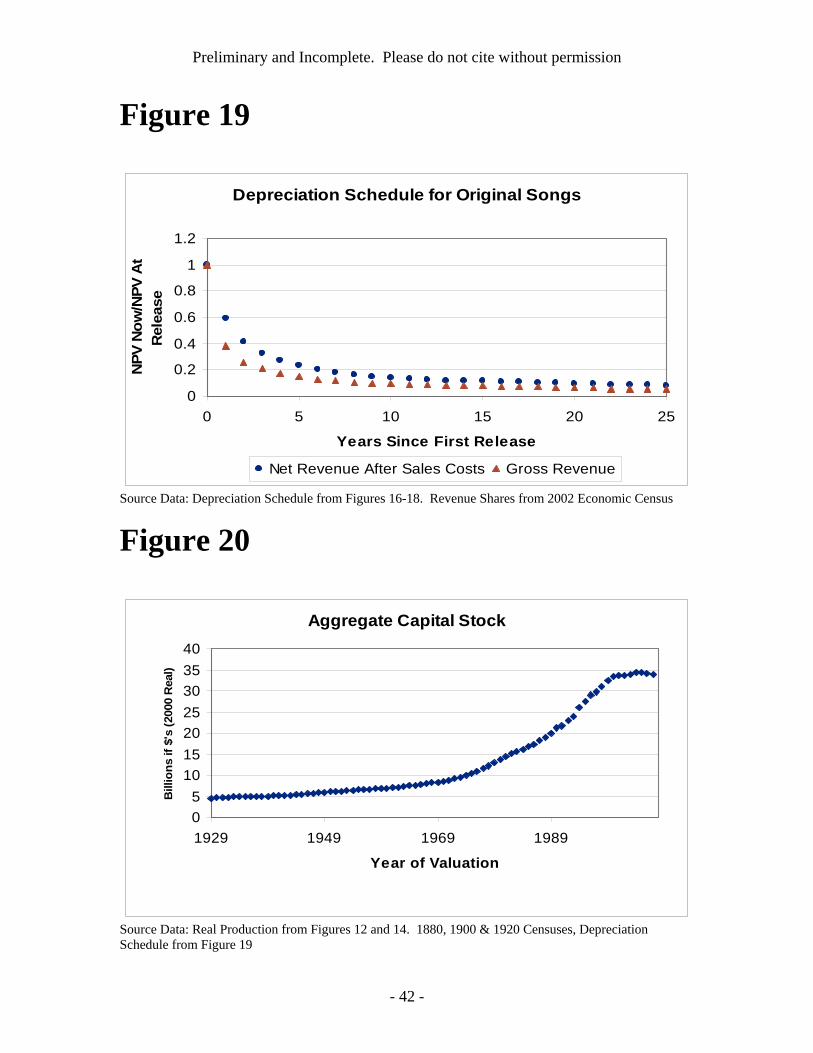
Similar to the earlier results, I find that songs depreciate by rapidly at first, as shown in
Figure 18. On average, songs less than one year old account for 29% of the market share, more
than double the market share for songs one year old. I also find that old songs depreciate very
slowly. 32 Based on a sample of all songs played at least five time, I estimate that classic songs
depreciate at approximately 8%-9% per year. This is slightly higher than the depreciation rate
for radio royalties, which I estimated at approximately 4% per year.
Section 4: Depreciation Rates of Music Over Time
Combined Depreciation Rates
In Figures 15-17, I showed that the lifespan for songs is different on CD, radio, television
and live concerts. Therefore, the average lifespan for a song depends enormously on the weights
given to each revenue stream. In my analysis, I will use the net revenue statistics given by the
2002 Economic Census and the industry literature to weight each revenue stream. In particular, I
assume that CD sales account for 66% of industry net revenue, royalties account for 10% of
industry net revenue, sheet music accounts for 3% of industry net revenue and live concerts 31 I restrict the sample to concert venues that were listed in onlinegigs.com. Depreciation is slightly faster when I impute capacities for venues with missing data or weight all venues equally. 32 This depreciation rate assumes that bands continue to charge the same price over time. Anecdotal evidence suggests that bands charge much higher ticket prices later in their career, after they have built a devoted fan base. The higher ticket prices would reduce depreciation rates.
Preliminary and Incomplete. Please do not cite without permission
- 28 -
account for 20% of industry net revenue. The depreciation schedule would be very different if I
used a different weighting method.
There are many possible reasons why a copyright might decrease in value over time. For
example, all consumers in a target market might have already bought the CD. Alternatively, a
song might fall out of fashion because of cultural change. In this paper, I will not attempt to
distinguish between the various reasons a consumer might stop buying an old song. I will simply
attempt to estimate the schedule at which musicians and recording studios earn money from their
songs, and the costs associated with those revenues.
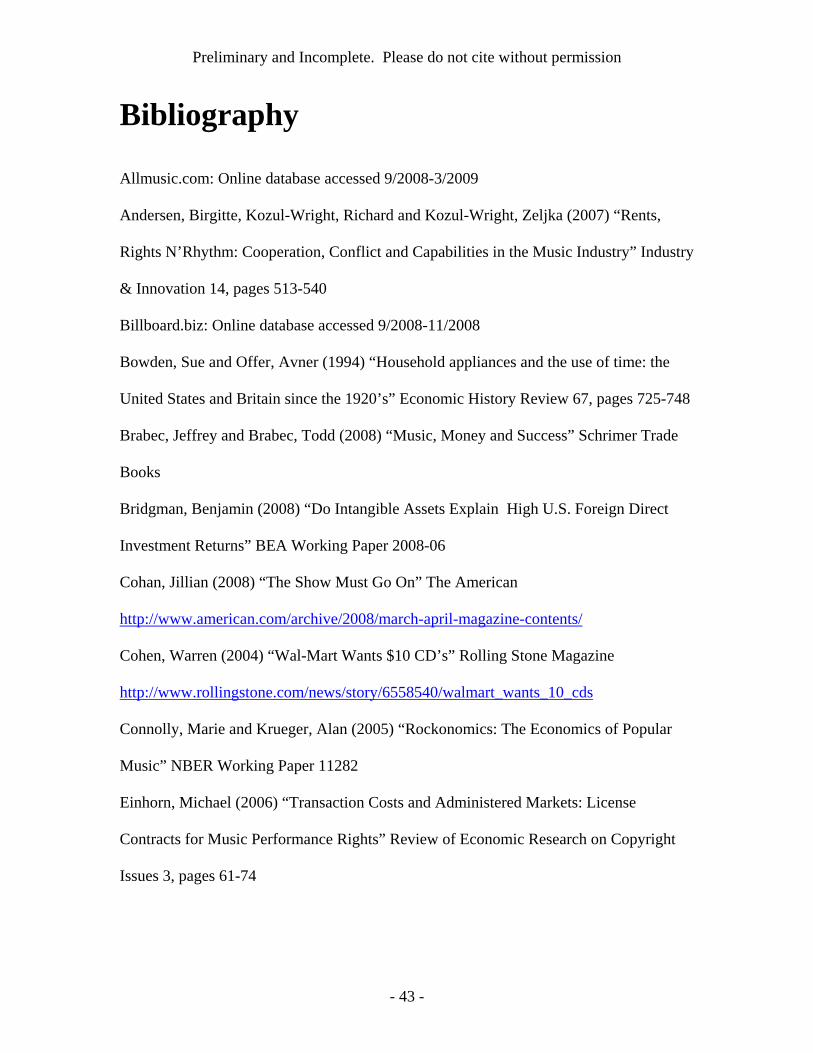
Figure 19 shows the depreciation schedule for original songs based on net revenue after
subtracting sales and advertising costs. These costs are discussed in much more detail in section
1. I find that original songs depreciate by approximately 50% in the first year of life. This is still
high, but much lower than I estimated earlier. The depreciation rate then slows dramatically and
finally stabilizes at approximately 4%.
Comparing My Estimate of Depreciation Rates with Market Transactions
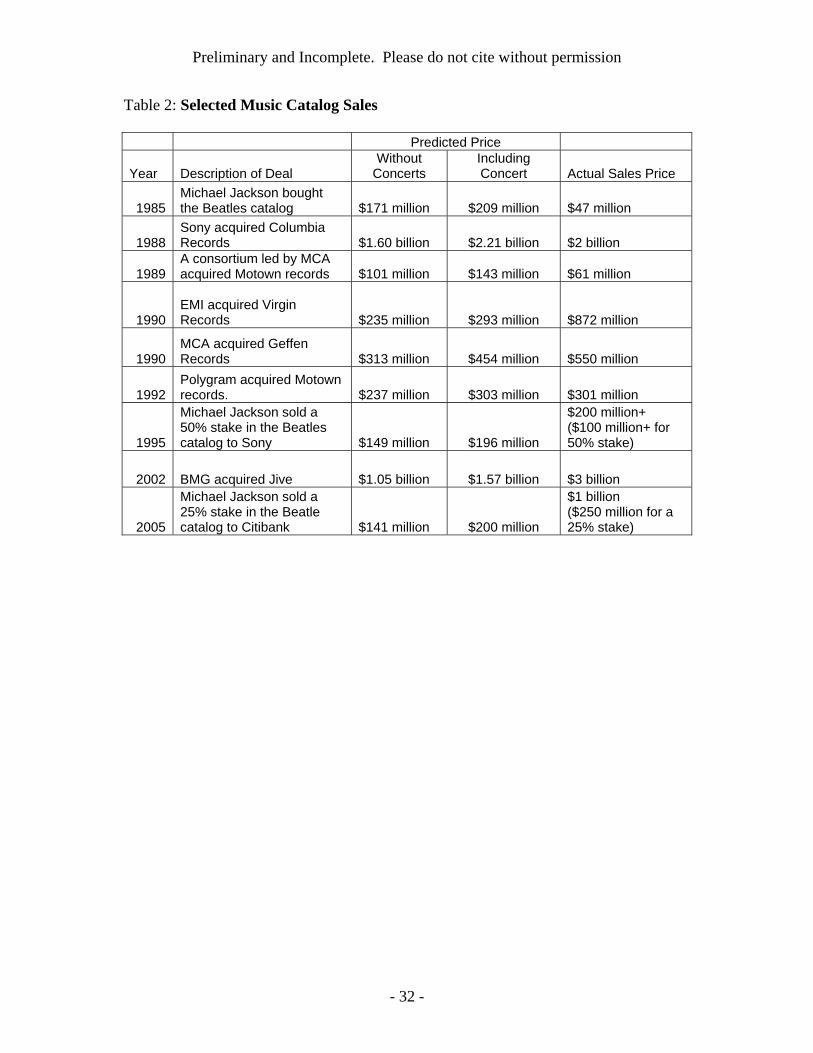
I will check the depreciation schedule show in Figure 19 by comparing it to known
market transactions. My dataset of music catalog sales is primarily taken from the book “The
Business of Music” (Krasilovsky and Shemel 2007). That book describes a number of
acquisitions in the music industry from 1988 to 2002. I also include the multiple sales of the
Beatle catalog, as described in a New York Times article about Michael Jackson (O’Brien 2006).
I then used the depreciation schedules given in Figure 19 to predict the price for each catalog at
the time of sale.33 Table 2 gives more details about each transaction.34
33I use RIAA award data and total production data to proxy for aggregate production. For example, Beatles songs earned 56% of all gold awards in 1969. I therefore assume that Beatles songs accounted for 56% of the aggregate

Preliminary and Incomplete. Please do not cite without permission
- 29 -
It is important to note that a recording studio might sell for more or less than the value of
its music. On the one hand, recording studios only own partial rights to most songs in their
catalog. For example, the recording studio might own the right to sell records of a song – but
they are required to pay a fee to the musician for every copy they sell. Furthermore, musicians
generally keep the right to perform their songs in concert without paying any royalties to the
recording studio. The exact ownership of each song depends on the contract between studios and
musicians, and is often kept private. On the other hand, recording studios own many more assets
than just music catalogs. For example, a studio might have pre-existing contracts with popular
artists, a well developed brand image, relationships with retailers and general industry
experience.
Overall, I find that my predicted prices are significantly lower than the actual acquistion
prices, as shown in Table 2. I also find that the mark-up between predicted price and actual price
varies enormously across catalog sales. Nevertheless, I am reassured by the fact that the two
prices are within the same general ballpark. The observed differences in price can easily be
explained by non-music intangible assets mentioned in the last paragraph. I will continue to use
the depreciation schedules described in Figure 20 for my empirical analysis.35
Capital Stocks of Music Over Time
Figure 19 combines the real production estimates given in Figures 11 and 13 with the
depreciation schedules given in Figure 18. Consistent with the decline in music production, I
value released in 1969. My estimates of prices for individual catalogs are quite sensitive to the exact method used to estimate initial value. 34Music catalogs may include foreign musicians in addition to US production. In addition, music catalogs may include synchronization royalties, which I choose to count in theatrical movie and television accounts. I increase the value of music production by approximately 25% a year to adjust. 35 It is also possible that depreciation profiles have changed over time. In theory, BEA could use separate depreciation profiles for 1960s songs and 1990s. However, that would be extremely difficult to implement.
Preliminary and Incomplete. Please do not cite without permission
- 30 -
find that the real capital stock of music has declined since 2000. In 2007, the total value of all
music capital was $34 billion, about six times annual production. As a robustness check, I also
computed the capital stocks using a simple geometric depreciation rate of 20% per year. I found
that the aggregate capital stock of music did not change much when I used this simplification
Conclusion
In this paper, I showed that it is possible to calculate GDP, CFC and NDP when music
production is treated as a capital investment and songs are treated as a capital asset. Using my
calculations, BEA could bring the GDP statistics in line with System of National Accounts
recommendation for music production (SNA 2008).
To review, my empirical results were:
1)In 2002, musicians and record studios created original music with a nominal value of $7.1
billion producing recorded music, approximately 0.07% of real GDP;
2)The recorded music industry has been shrinking dramatically since 2000. Between 2000 and
2007, real GDP growth falls by 0.005% per year if recorded music is treated as a capital asset;
3)Original music remains valuable for decades after it is first produced. I calculate that the
aggregate capital value of all original music was $34 billion in 2002.
Preliminary and Incomplete. Please do not cite without permission
- 31 -
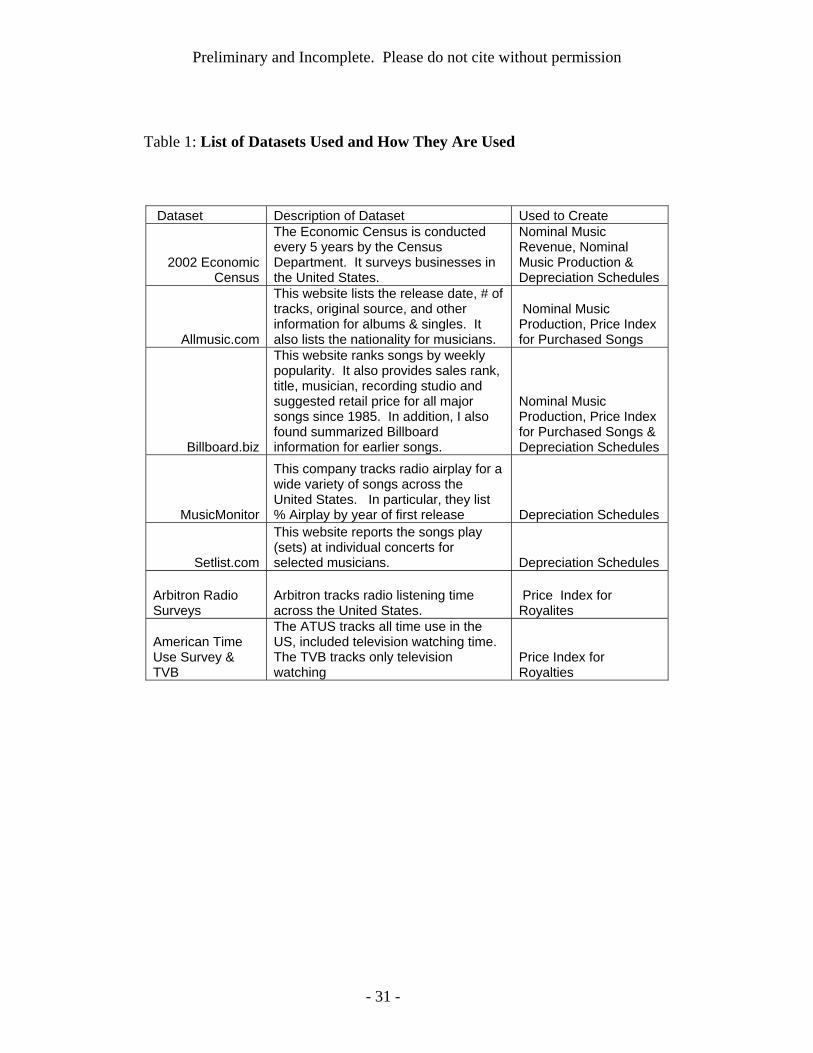
Table 1: List of Datasets Used and How They Are Used
Dataset Description of Dataset Used to Create
2002 Economic Census
The Economic Census is conducted every 5 years by the Census Department. It surveys businesses in the United States.
Nominal Music Revenue, Nominal Music Production & Depreciation Schedules
Allmusic.com
This website lists the release date, # of tracks, original source, and other information for albums & singles. It also lists the nationality for musicians.
Nominal Music Production, Price Index for Purchased Songs
Billboard.biz
This website ranks songs by weekly popularity. It also provides sales rank, title, musician, recording studio and suggested retail price for all major songs since 1985. In addition, I also found summarized Billboard information for earlier songs.
Nominal Music Production, Price Index for Purchased Songs & Depreciation Schedules
MusicMonitor
This company tracks radio airplay for a wide variety of songs across the United States. In particular, they list % Airplay by year of first release Depreciation Schedules
Setlist.com
This website reports the songs play (sets) at individual concerts for selected musicians. Depreciation Schedules
Arbitron Radio Surveys
Arbitron tracks radio listening time across the United States.
Price Index for Royalites
American Time Use Survey & TVB
The ATUS tracks all time use in the US, included television watching time. The TVB tracks only television watching
Price Index for Royalties
Preliminary and Incomplete. Please do not cite without permission
- 32 -
Table 2: Selected Music Catalog Sales
Predicted Price
Year Description of Deal Without
Concerts Including Concert Actual Sales Price
1985 Michael Jackson bought the Beatles catalog $171 million $209 million $47 million
1988 Sony acquired Columbia Records $1.60 billion $2.21 billion $2 billion
1989 A consortium led by MCA acquired Motown records $101 million $143 million $61 million
1990 EMI acquired Virgin Records $235 million $293 million $872 million
1990 MCA acquired Geffen Records $313 million $454 million $550 million
1992 Polygram acquired Motown records. $237 million $303 million $301 million
1995
Michael Jackson sold a 50% stake in the Beatles catalog to Sony $149 million $196 million
$200 million+ ($100 million+ for 50% stake)
2002 BMG acquired Jive $1.05 billion $1.57 billion $3 billion
2005
Michael Jackson sold a 25% stake in the Beatle catalog to Citibank $141 million $200 million
$1 billion ($250 million for a 25% stake)
Preliminary and Incomplete. Please do not cite without permission
- 33 -
Figure 1
Source Data: RIAA Annual Reports (Vogel 2004 and RIAA Website), Billboard Charts, IFPI sales data
Figure 2
Source Data: BMI and ASCAP Annual Reports (Brabec and Brabec 2008), Economic Census, Industry literature, Billboard Charts and NMPA
Revenue from CD's, Cassettes, Downloads, Etc.,Based on Wholesale Prices
$0$2,000$4,000$6,000$8,000
$10,000
1985 1990 1995 2000 2005
Year of Ship or CD Release
Mill
ions
of $
's (N
omin
al)
Actual Sales NPV of Sales for New Music
Royalties Received
$0
$500
$1,000
$1,500
$2,000
$2,500
1984 1989 1994 1999 2004
Year of Receipt
Mill
ions
of $
's (N
omin
al)
Royalties Paid This Year NPV of Royalties from New Music
Preliminary and Incomplete. Please do not cite without permission
- 34 -
Figure 3
Source Data: Pollstar Concert Prices (Krueger 2005 and media reports), Setlist.com
Figure 4
Source Data: 2002 Economic Census (Sound Production Industry), Figures 1-3
Live Concert Revenue
$0$500
$1,000$1,500$2,000$2,500$3,000$3,500$4,000$4,500
1984 1989 1994 1999 2004
Year of Concert or Composing
Mill
ions
of $
's (N
omin
al)
Annual Concert Revenues NPV of Concert Revenues from New Music
Aggregate Revenue From Music, Benchmarked to 2002 Economic Census
$0
$5,000
$10,000
$15,000
$20,000
1984 1989 1994 1999 2004 2009
Year of First Release
Bill
ions
of $
's (N
omin
al)
NPV of Revenues for New Music Annual Music Revenue
Preliminary and Incomplete. Please do not cite without permission
- 35 -
Figure 5
Source Data: 2002 Economic Census, Figures 1-3, Industry Literature
Figure 6
Source Data: 1920-1990 US Census, 1929-1990 GDP Per Capita
Annual Value of Historical Production, Benchmarked to 1990 Data
0
500
1,000
1,500
2,000
2,500
3,000
3,500
4,000
1920 1930 1940 1950 1960 1970 1980 1990 2000
Year of Production
Mill
ions
of $
's (N
omin
al)
Annual Value of Music Production,Expected Revenue - Manufacturing, Administration and Advertising Costs
$0$1,000$2,000$3,000$4,000$5,000$6,000$7,000$8,000
1984 1989 1994 1999 2004
Year of Release
Mill
ions
of $
's (N
omin
al)
Preliminary and Incomplete. Please do not cite without permission
- 36 -
Figure 7
Source Data: RIAA Annual Reports (Vogel 2004 and RIAA Website), Billboard Charts
Figure 8
Source Data: ASCAP and BMI Annual Reports (Brabec and Brabec 2008), American Time Use Survey, Television Bureau of Advertising, Arbitron Radio Tracking Data
Price Index for Broadcast Music
0
0.5
1
1.5
2
1984 1989 1994 1999 2004
Year of Broadcast
Base
Yea
r 20
00 =
1
Music Royalty Prices PCE Services Deflator
Price Indexes for Purchased Music
0
0.5
1
1.5
1975 1980 1985 1990 1995 2000 2005
Year of Release
Base
Yea
r 200
0 =1
Song Index Physical CD or Cassette Index PCE Service Price Deflator
Preliminary and Incomplete. Please do not cite without permission
- 37 -
Figure 9
Source Data: Krueger 2005, Pollstar Reports (Various Media Stories)
Figure 10
Source Data: BLS Retail Price Index for Recreational Books
Price Index for Live Concerts
0
0.5
1
1.5
2
1980 1985 1990 1995 2000 2005
Year of Performance
Base
Yea
r 20
00 =
1
Price Index for Live Concerts PCE Services Deflator
Overall Prices for the Music Industry
0
0.5
1
1.5
1984 1989 1994 1999 2004
Year of Release
Base
Yea
r 20
00 =
1
Combined Music Price Index PCE Services Sector
Price Index for Sheet Music and Song Books
0
0.5
1
1.5
1984 1989 1994 1999 2004
Year of Sale
Bas
e Ye
ar 2
000
=1
PCE Services Deflator Sheet Music Prices

Preliminary and Incomplete. Please do not cite without permission
- 38 -
Figure 11
Source Data: Price Index from Figures 7, 8, 9 and 10. Revenue shares from Figures 1, 2, 3
Figure 12
Source Data: Nominal Production from Figure 5, Price Index from Figure 10
Overall Prices for the Music Industry
0
0.5
1
1.5
1984 1989 1994 1999 2004
Year of Release
Bas
e Y
ear
2000
= 1
Combined Music Price Index PCE Services Sector
Real Production in the Music Industry
$0
$2,000
$4,000
$6,000
$8,000
1984 1989 1994 1999 2004
Year of Release
Mill
ions
of $
's (2
000)
Preliminary and Incomplete. Please do not cite without permission
- 39 -
Figure 13
Source Data: Retail Price Index from Figure 11. Labor-Based Price Index from 1920-2000 US Censuses and 2000-2007 American Community Survey.
Figure 14
Source Data: Retail Based Quantity Index from Figure 12. Labor Based Quantity Index from 1920-2000 US Censuses and 2000-2007 American Community Survey
Labor-Based Music Price Index
0.000.200.400.600.801.001.201.40
1928 1938 1948 1958 1968 1978 1988 1998 2008
Year Artist Receives Money
Bas
e Ye
ar 2
000
= 1
Labor-Based Price Index Retail Price Index, Including Concerts
Real Music Production
0
0.2
0.4
0.6
0.8
1
1.2
1928 1938 1948 1958 1968 1978 1988 1998 2008
Year of Release
Mill
ions
of $
's (2
000
Rea
l)
Labor Based Quantity Index Retail Based Index
Preliminary and Incomplete. Please do not cite without permission
- 40 -
Figure 15
Source Data: Labor Based Index from Figure 14, Consumption-Based Index from Piano Sales Data 1880-1959, BEA Musical Instrument Sales 1959-2007, Jukebox sales from tomszone.com, # Musicians from 1920-2000 US Census and 2000-2007 ACS, Record Sales from Gronow (1983), Radio and Television time from Sterling & Kittross, Arbitron data and TVB data
Figure 16
Source Data: Billboard Charts, RIAA awards from RIAA.com
Market Share by Age of Song
0%5%
10%15%20%25%30%
0 5 10 15 20
Years Since Release
(# S
ongs
of A
ge X
)/(To
tal #
Son
gs)
Radio Royalties Synchronization Royalties Television Royalties
Robustness Test for Labor Based Production Index
0
2,000
4,000
6,000
8,000
1928 1938 1948 1958 1968 1978 1988 1998 2008
Year of Production
Mill
ions
of $
's (2
000
real
)
Consumption Based Music Index Labor Based Music Index
Preliminary and Incomplete. Please do not cite without permission
- 41 -
Figure 17
Source Data: Radio Royalties from Music Monitor, Synchronization Royalties and Television Performance Royalties from tvtunefinder.com
Figure 18
Source Data: Setlist.com
Market Share for Concert Songs Over Time
0%5%
10%15%20%25%30%35%
0 5 10 15 20
Years Since First Performance
(# T
imes
Pla
yed)
/(Tot
al #
Pla
ys T
hat Y
ear)
Market Share by Age of Song
0%5%
10%15%20%25%30%
0 5 10 15 20
Years Since Release
(# S
ongs
of A
ge X
)/(To
tal #
So
ngs)
Radio Royalties Synchronization Royalties Television Royalties
Preliminary and Incomplete. Please do not cite without permission
- 42 -
Figure 19
Source Data: Depreciation Schedule from Figures 16-18. Revenue Shares from 2002 Economic Census
Figure 20
Source Data: Real Production from Figures 12 and 14. 1880, 1900 & 1920 Censuses, Depreciation Schedule from Figure 19
Depreciation Schedule for Original Songs
0
0.2
0.4
0.6
0.8
1
1.2
0 5 10 15 20 25
Years Since First Release
NPV
Now
/NPV
At
Rel
ease
Net Revenue After Sales Costs Gross Revenue
Aggregate Capital Stock
05
10152025303540
1929 1949 1969 1989
Year of Valuation
Bill
ions
if $
's (2
000
Rea
l)
Preliminary and Incomplete. Please do not cite without permission
- 43 -
Bibliography
Allmusic.com: Online database accessed 9/2008-3/2009
Andersen, Birgitte, Kozul-Wright, Richard and Kozul-Wright, Zeljka (2007) “Rents,
Rights N’Rhythm: Cooperation, Conflict and Capabilities in the Music Industry” Industry
& Innovation 14, pages 513-540
Billboard.biz: Online database accessed 9/2008-11/2008
Bowden, Sue and Offer, Avner (1994) “Household appliances and the use of time: the
United States and Britain since the 1920’s” Economic History Review 67, pages 725-748
Brabec, Jeffrey and Brabec, Todd (2008) “Music, Money and Success” Schrimer Trade
Books
Bridgman, Benjamin (2008) “Do Intangible Assets Explain High U.S. Foreign Direct
Investment Returns” BEA Working Paper 2008-06
Cohan, Jillian (2008) “The Show Must Go On” The American
http://www.american.com/archive/2008/march-april-magazine-contents/
Cohen, Warren (2004) “Wal-Mart Wants $10 CD’s” Rolling Stone Magazine
http://www.rollingstone.com/news/story/6558540/walmart_wants_10_cds
Connolly, Marie and Krueger, Alan (2005) “Rockonomics: The Economics of Popular
Music” NBER Working Paper 11282
Einhorn, Michael (2006) “Transaction Costs and Administered Markets: License
Contracts for Music Performance Rights” Review of Economic Research on Copyright
Issues 3, pages 61-74
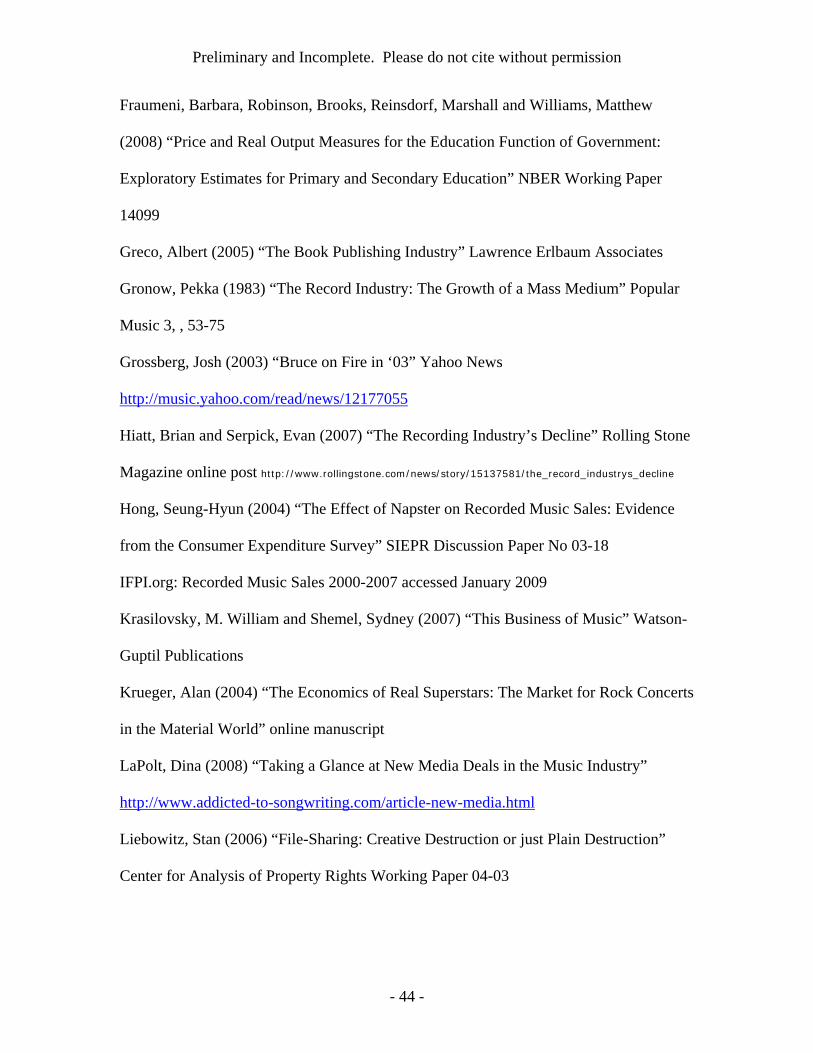
Preliminary and Incomplete. Please do not cite without permission
- 44 -
Fraumeni, Barbara, Robinson, Brooks, Reinsdorf, Marshall and Williams, Matthew
(2008) “Price and Real Output Measures for the Education Function of Government:
Exploratory Estimates for Primary and Secondary Education” NBER Working Paper
14099
Greco, Albert (2005) “The Book Publishing Industry” Lawrence Erlbaum Associates
Gronow, Pekka (1983) “The Record Industry: The Growth of a Mass Medium” Popular
Music 3, , 53-75
Grossberg, Josh (2003) “Bruce on Fire in ‘03” Yahoo News
http://music.yahoo.com/read/news/12177055
Hiatt, Brian and Serpick, Evan (2007) “The Recording Industry’s Decline” Rolling Stone
Magazine online post http://www.rollingstone.com/news/story/15137581/the_record_industrys_decline
Hong, Seung-Hyun (2004) “The Effect of Napster on Recorded Music Sales: Evidence
from the Consumer Expenditure Survey” SIEPR Discussion Paper No 03-18
IFPI.org: Recorded Music Sales 2000-2007 accessed January 2009
Krasilovsky, M. William and Shemel, Sydney (2007) “This Business of Music” Watson-
Guptil Publications
Krueger, Alan (2004) “The Economics of Real Superstars: The Market for Rock Concerts
in the Material World” online manuscript
LaPolt, Dina (2008) “Taking a Glance at New Media Deals in the Music Industry”
http://www.addicted-to-songwriting.com/article-new-media.html
Liebowitz, Stan (2006) “File-Sharing: Creative Destruction or just Plain Destruction”
Center for Analysis of Property Rights Working Paper 04-03
Preliminary and Incomplete. Please do not cite without permission
- 45 -
Leibowitz, Stan (2007) “Don’t Play it Again Sam: Radio Play, Record Sales and Property
Rights” online manuscript
Mortimer, Julie and Sorensen, Alan (2005) “Supply Responses to Digital Distribution:
Recorded Music and Live Performances”
http://www.aeaweb.org/annual_mtg_papers/2006/0107_0800_0702.pdf
O’Brien, Timothy (2006) “What Happened to the Fortune Michael Jackson Made?” New
York Times http://www.nytimes.com/2006/05/14/business/yourmoney/14michael.html
Oberholzer-Gee, Felix and Strumph, Koleman (2005) “The Effect of File Sharing on
Record Sales, An Empirical Analysis” online manuscript
Orbach, Barak and Einav, Liran (2007) “Uniform Prices for Differentiated Goods: The
Case of the Movie-Theater Industry” International Review of Law and Economics
doi:10.1016/j.irle.2007.06.002
Pollstar (2006) “Rolling Stones Lead 2006 Tours”
http://www.pollstar.com/news/viewnews.pl?NewsID=7543
Recording Industry Association of American (2008) “1990-2007 Year End Statistics”,
online database on Gold and Platinum awards & reports; accessed 9/2008-3/2009
Robbins, Carol and Moylan, Carol (2007) “Research and Development Satellite Account
Update” Survey of Current Business October 2007
Ruggles, Steven, Sobeck, Matthew, Alexander, Trend, Fitch, Catherine, Goeken, Ronald,
Kelly Hall, Patricia, King, Miriam and Ronnander, Chad (2008) “Integrated Public Use
Microdata Series: Version 4.0 [Machine-readable dabase” US Censuses 1920-200 and
American Community Survey 2000-2007. Minneapolis, MN: Minnesota Population
Center

Preliminary and Incomplete. Please do not cite without permission
- 46 -
Sanjeck, Russell (1988) “American Popular Music and its Business: The First Four
Hundred Years” Oxford University Press
Schankerman, Mark and Pakes, Ariel (1986) Estimates of the value of patent rights in
European countries during the post-1950 period. The Economic Journal, 95 (384), pp
1052-1076
Setlist.com: Online database accessed 9/2008-3/2009
Sterling, Christopher and Kittross, John (1978, 1990 & 2001) “Stay Tuned: A Concise
History of American Broadcasting” Wadsworth Publishing Company
Thall, Peter (2006) “What They’ll Never Tell You About the Music Business” Watson-
Guptil Publications
U.S. Master Depreciation Guide (2007) CCH Tax Law Editors
IRS Publication 946 (2007) http://www.irs.gov/pub/irs-pdf/p946.pdf (Accessed June 30th
2008)
United Nations Statistics Division “Updated System of National Accounts 1993 (1993
SNA): Volume 1: Chapters 1-17”
http://unstats.un.org/unsd/nationalaccount/AEG/papers/m2LynchCommentsOriginals.pdf
(Access June 30th 2008)
U.S. Census Bureau: ‘Sound Production Industries: 2002” Economic Census,
http://www.census.gov/prod/ec02/ec0251slls.pdf (Accessed June 30th 2008)
USA Today Magazine (2005) “Rolling Stones, U2 Help Drive Concert Revenues to
Record in 2005” http://www.usatoday.com/life/music/news/2005-12-29-concert-tour-
money_x.htm
Preliminary and Incomplete. Please do not cite without permission
- 47 -
Vogel, Harold (2004) “Entertainment Industry Economics” The Cambridge University
Press
Weaver, Jane (2003) “The Concert Business Takes a Hit” MSNBC report
http://www.msnbc.msn.com/id/3073163/
Wikipedia.org: Online database accessed 9/2008-3/2009
Preliminary and Incomplete. Please do not cite without permission
- 48 -
Appendix 1: Description of Revenue Adjustments
Adjustments for Figure 1 (CD Sales)
I use Billboard chart data to translate RIAA’s annual sales data to an estimate of net present value of music sales by year of release. I first downloaded Billboard’s top 200 and top pop charts from 1985 to 2007. I then imputed sales according to the formula: CD’s Sold = (1/Rank ^.667)*(Average Monthly Sales). I calibrated this formula with data from Music Media’s global sales charts, which report both sales rank and also estimated sales numbers.
I then selected a stratified subsample of albums and looked up whether the album is a new release CD (versus re-release of old songs) and what year the album was first released. On average, I estimate that two thirds of CD’s sold are new release albums that are within one year of initial release. Based on the depreciation profile estimated in Figure 17, I estimate that sales after the first year account for 28% of the total value of a song. Accordingly, I calculate the following formula: Net Present Value of New Releases = (Total RIAA Sales) * (% Sales that Are New Releases) * (1+28%)
I estimate imports of music using Billboard chart data and online databases. In order to calculate US imports, I assume that all country of production follows the musician’s nationality. For example, all profits from the Beatles music are attributed to the United Kingdom (where the Beatles were born), all profits from Michael Jackson are attributed to the United States, etc.36 On average, about 80% of CD’s sold in the United States are produced by US musicians,37 and the market share for imports has been rising over time. Accordingly, the RIAA sales data slightly understate the true growth in US production.
I estimate exports of music using international sales data from the IFPI, international charts from a wide variety of countries and online sale database. I first downloaded IFPI’s estimates of annual CD sales by country. I then collected charts for each major country and looked up nationality for a stratified subsample of artists on those charts. I find that the share of American music varies enormously across countries: approximately 4% of Japanese CD’s were produced by Americans, 15% of French CD’s, 28% of German CD’s, 32% of British CD’s and 73% of Canadian CD’s. On average, I estimate that American artists account for 24% of European sales and 12% of sales in the rest of the world (excluding US). I then weighted each country’s % American by the total CD sales in that country. Based on those figures, I estimate that exports account for only 20% of the total value of an American musician’s songs. My dataset was detailed
36 I use the country of residence at the time a musician started their career to determine nationality. It is common for popular musicians to maintain several homes in various countries, and sometimes change their legal residence for tax reasons. Recording studios often retain a large portion of the profits from a CD, and so I could potentially adjust for nationality of recording studio. However, musicians generally work with a recording studio from their home country (Cite), and so that adjustment would add complexity without changing results. 37Excluding re-release CD’s and classic CD’s. The US share is slightly smaller over the full sample.
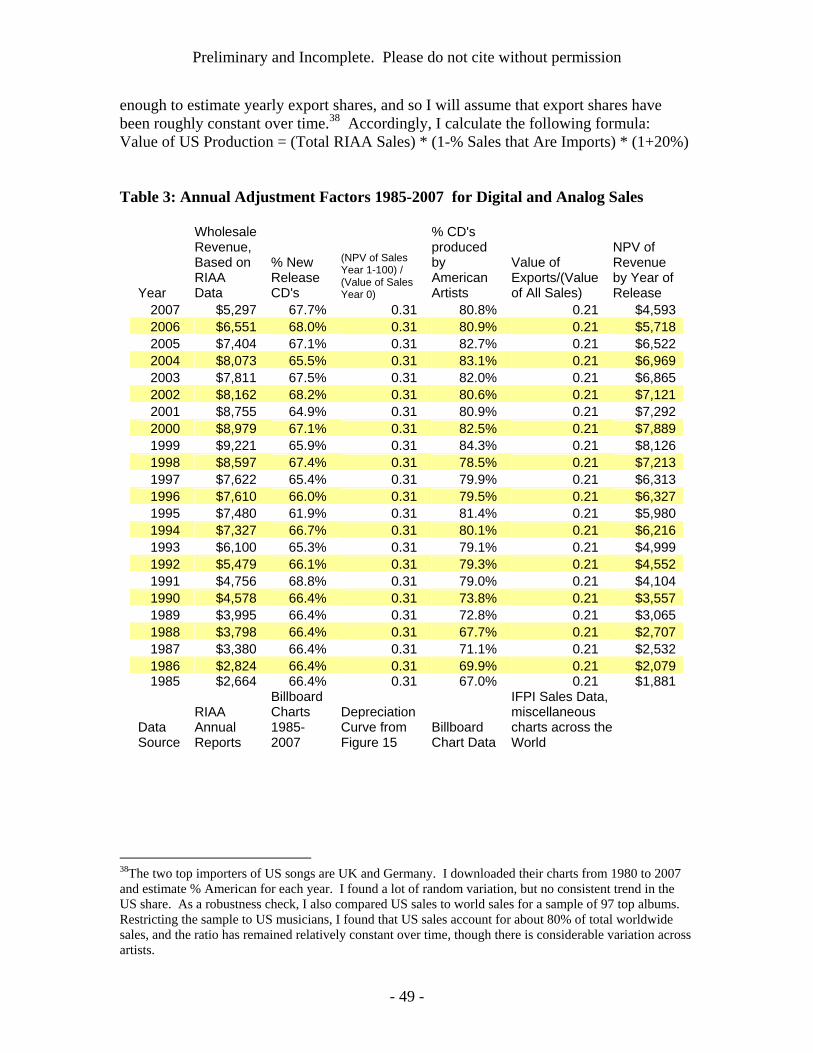
Preliminary and Incomplete. Please do not cite without permission
- 49 -
enough to estimate yearly export shares, and so I will assume that export shares have been roughly constant over time.38 Accordingly, I calculate the following formula: Value of US Production = (Total RIAA Sales) * (1-% Sales that Are Imports) * (1+20%)
Table 3: Annual Adjustment Factors 1985-2007 for Digital and Analog Sales
Year
Wholesale Revenue, Based on RIAA Data
% New Release CD's
(NPV of Sales Year 1-100) / (Value of Sales Year 0)
% CD's produced by American Artists
Value of Exports/(Value of All Sales)
NPV of Revenue by Year of Release
2007 $5,297 67.7% 0.31 80.8% 0.21 $4,5932006 $6,551 68.0% 0.31 80.9% 0.21 $5,7182005 $7,404 67.1% 0.31 82.7% 0.21 $6,5222004 $8,073 65.5% 0.31 83.1% 0.21 $6,9692003 $7,811 67.5% 0.31 82.0% 0.21 $6,8652002 $8,162 68.2% 0.31 80.6% 0.21 $7,1212001 $8,755 64.9% 0.31 80.9% 0.21 $7,2922000 $8,979 67.1% 0.31 82.5% 0.21 $7,8891999 $9,221 65.9% 0.31 84.3% 0.21 $8,1261998 $8,597 67.4% 0.31 78.5% 0.21 $7,2131997 $7,622 65.4% 0.31 79.9% 0.21 $6,3131996 $7,610 66.0% 0.31 79.5% 0.21 $6,3271995 $7,480 61.9% 0.31 81.4% 0.21 $5,9801994 $7,327 66.7% 0.31 80.1% 0.21 $6,2161993 $6,100 65.3% 0.31 79.1% 0.21 $4,9991992 $5,479 66.1% 0.31 79.3% 0.21 $4,5521991 $4,756 68.8% 0.31 79.0% 0.21 $4,1041990 $4,578 66.4% 0.31 73.8% 0.21 $3,5571989 $3,995 66.4% 0.31 72.8% 0.21 $3,0651988 $3,798 66.4% 0.31 67.7% 0.21 $2,7071987 $3,380 66.4% 0.31 71.1% 0.21 $2,5321986 $2,824 66.4% 0.31 69.9% 0.21 $2,0791985 $2,664 66.4% 0.31 67.0% 0.21 $1,881
Data Source
RIAA Annual Reports
Billboard Charts 1985-2007
Depreciation Curve from Figure 15
Billboard Chart Data
IFPI Sales Data, miscellaneous charts across the World
38The two top importers of US songs are UK and Germany. I downloaded their charts from 1980 to 2007 and estimate % American for each year. I found a lot of random variation, but no consistent trend in the US share. As a robustness check, I also compared US sales to world sales for a sample of 97 top albums. Restricting the sample to US musicians, I found that US sales account for about 80% of total worldwide sales, and the ratio has remained relatively constant over time, though there is considerable variation across artists.
Preliminary and Incomplete. Please do not cite without permission
- 50 -
Adjustments for Figure 2 (Royalty Revenue) Because my paper is focused on the production of music, I would like to report
the annual value of royalties by year of first release rather than year of sale. In other words, a 2008 replay of ‘Lucy in the Sky with Diamonds’ should be attributed to the 1960s, when the Beatlers originally wrote the books. I will estimate annual production according to the formula:
Production = [(Actual Sales)-(Predicted Sales With No New Production)]*[(NPV of all Sales)/(Sales in First Year)]
For example, suppose that revenue from a new song decreases at 50% per year ($1 Year 0, $0.50 Year 1, $0.25 Year 2, etc.). Using that hypothetical depreciation rate, the net present value (NPV) of a new song is 1.82 times its sales in the first year (at 10% discount rate). In 2006, annual sales of all songs were $1.9 billion. Without any new production, sales in 2007 would be $1.9*0.5 = $0.95 billion. In fact, annual sales were $2 billion. Therefore, I calculate that NPV of royalties for all songs released in 2007 were ($2-$0.95)*(1.82) = $1.94 billion. Of course this formula requires a known price index for royalties and a known depreciation curve. I use the price index given in Figure 8 and the depreciation curve given in Figure 17 to calculate the real royalties, the real stock of pre-existing music and the real value of new music production from 1985 to 2007.
I estimate imports and exports for royalties using methods very similar to the methods used earlier to estimate imports and exports for CD’s. In particular, I take my import share for new music royalties exactly from Table 1. I also assumed the share of American music is the same for CD sales and royalties for each individual country. However, average export share is slightly different because I use royalty revenue rather than CD sales to weight each country’s data. Once again, I don’t have detailed enough data to estimate annual export share. I will assume that export shares are fixed over time.
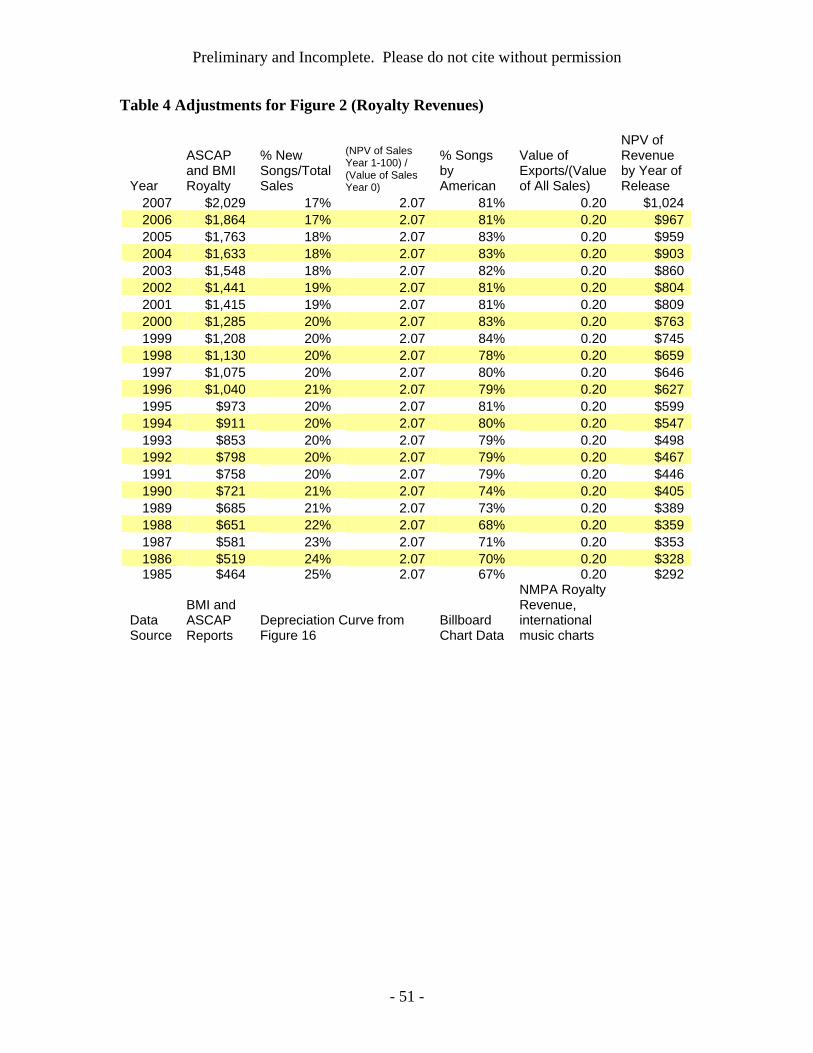
Preliminary and Incomplete. Please do not cite without permission
- 51 -
Table 4 Adjustments for Figure 2 (Royalty Revenues)
Year
ASCAP and BMI Royalty
% New Songs/Total Sales
(NPV of Sales Year 1-100) / (Value of Sales Year 0)
% Songs by American
Value of Exports/(Value of All Sales)
NPV of Revenue by Year of Release
2007 $2,029 17% 2.07 81% 0.20 $1,0242006 $1,864 17% 2.07 81% 0.20 $9672005 $1,763 18% 2.07 83% 0.20 $9592004 $1,633 18% 2.07 83% 0.20 $9032003 $1,548 18% 2.07 82% 0.20 $8602002 $1,441 19% 2.07 81% 0.20 $8042001 $1,415 19% 2.07 81% 0.20 $8092000 $1,285 20% 2.07 83% 0.20 $7631999 $1,208 20% 2.07 84% 0.20 $7451998 $1,130 20% 2.07 78% 0.20 $6591997 $1,075 20% 2.07 80% 0.20 $6461996 $1,040 21% 2.07 79% 0.20 $6271995 $973 20% 2.07 81% 0.20 $5991994 $911 20% 2.07 80% 0.20 $5471993 $853 20% 2.07 79% 0.20 $4981992 $798 20% 2.07 79% 0.20 $4671991 $758 20% 2.07 79% 0.20 $4461990 $721 21% 2.07 74% 0.20 $4051989 $685 21% 2.07 73% 0.20 $3891988 $651 22% 2.07 68% 0.20 $3591987 $581 23% 2.07 71% 0.20 $3531986 $519 24% 2.07 70% 0.20 $3281985 $464 25% 2.07 67% 0.20 $292
Data Source
BMI and ASCAP Reports
Depreciation Curve from Figure 16
Billboard Chart Data
NMPA Royalty Revenue, international music charts
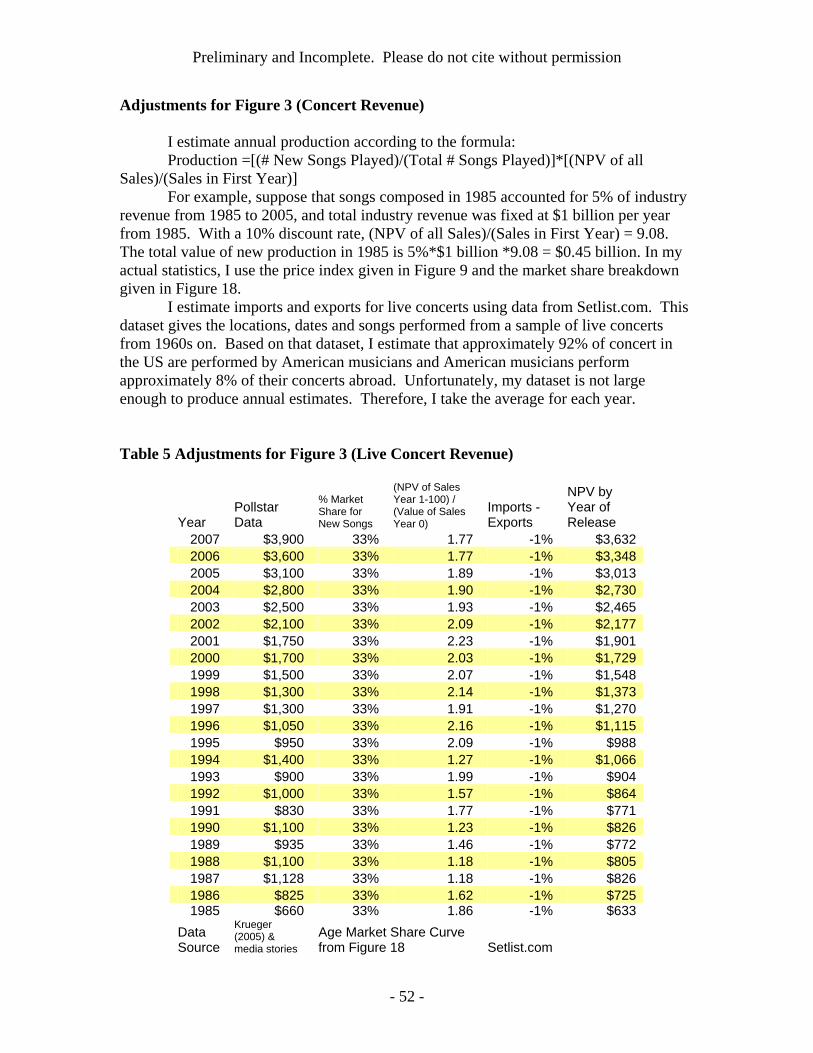
Preliminary and Incomplete. Please do not cite without permission
- 52 -
Adjustments for Figure 3 (Concert Revenue)
I estimate annual production according to the formula: Production =[(# New Songs Played)/(Total # Songs Played)]*[(NPV of all
Sales)/(Sales in First Year)] For example, suppose that songs composed in 1985 accounted for 5% of industry
revenue from 1985 to 2005, and total industry revenue was fixed at $1 billion per year from 1985. With a 10% discount rate, (NPV of all Sales)/(Sales in First Year) = 9.08. The total value of new production in 1985 is 5%*$1 billion *9.08 = $0.45 billion. In my actual statistics, I use the price index given in Figure 9 and the market share breakdown given in Figure 18.
I estimate imports and exports for live concerts using data from Setlist.com. This dataset gives the locations, dates and songs performed from a sample of live concerts from 1960s on. Based on that dataset, I estimate that approximately 92% of concert in the US are performed by American musicians and American musicians perform approximately 8% of their concerts abroad. Unfortunately, my dataset is not large enough to produce annual estimates. Therefore, I take the average for each year.
Table 5 Adjustments for Figure 3 (Live Concert Revenue)
Year Pollstar Data
% Market Share for New Songs
(NPV of Sales Year 1-100) / (Value of Sales Year 0)
Imports - Exports
NPV by Year of Release
2007 $3,900 33% 1.77 -1% $3,632 2006 $3,600 33% 1.77 -1% $3,348 2005 $3,100 33% 1.89 -1% $3,013 2004 $2,800 33% 1.90 -1% $2,730 2003 $2,500 33% 1.93 -1% $2,465 2002 $2,100 33% 2.09 -1% $2,177 2001 $1,750 33% 2.23 -1% $1,901 2000 $1,700 33% 2.03 -1% $1,729 1999 $1,500 33% 2.07 -1% $1,548 1998 $1,300 33% 2.14 -1% $1,373 1997 $1,300 33% 1.91 -1% $1,270 1996 $1,050 33% 2.16 -1% $1,115 1995 $950 33% 2.09 -1% $988 1994 $1,400 33% 1.27 -1% $1,066 1993 $900 33% 1.99 -1% $904 1992 $1,000 33% 1.57 -1% $864 1991 $830 33% 1.77 -1% $771 1990 $1,100 33% 1.23 -1% $826 1989 $935 33% 1.46 -1% $772 1988 $1,100 33% 1.18 -1% $805 1987 $1,128 33% 1.18 -1% $826 1986 $825 33% 1.62 -1% $725 1985 $660 33% 1.86 -1% $633
Data Source
Krueger (2005) & media stories
Age Market Share Curve from Figure 18 Setlist.com

Preliminary and Incomplete. Please do not cite without permission
- 53 -