Embed Size (px)
Citation preview
10.1101/gr.134635.111Access the most recent version at doi:2012 22: 1589-1598 originally published online July 3, 2012Genome Res.
Nathan D. Dees, Qunyuan Zhang, Cyriac Kandoth, et al. MuSiC: Identifying mutational significance in cancer genomes
Material
Supplemental
http://genome.cshlp.org/content/suppl/2012/11/13/gr.134635.111.DC1.html
References
http://genome.cshlp.org/content/22/8/1589.full.html#ref-list-1
This article cites 35 articles, 22 of which can be accessed free at:
License
Commons Creative
.http://creativecommons.org/licenses/by-nc/3.0/described at
a Creative Commons License (Attribution-NonCommercial 3.0 Unported License), as ). After six months, it is available underhttp://genome.cshlp.org/site/misc/terms.xhtml
first six months after the full-issue publication date (see This article is distributed exclusively by Cold Spring Harbor Laboratory Press for the
ServiceEmail Alerting
click here.top right corner of the article or
Receive free email alerts when new articles cite this article - sign up in the box at the
http://genome.cshlp.org/subscriptionsgo to: Genome Research To subscribe to
© 2012, Published by Cold Spring Harbor Laboratory Press
Cold Spring Harbor Laboratory Press on February 17, 2014 - Published by genome.cshlp.orgDownloaded from Cold Spring Harbor Laboratory Press on February 17, 2014 - Published by genome.cshlp.orgDownloaded from
Resource
MuSiC: Identifying mutational significancein cancer genomesNathan D. Dees,1,4 Qunyuan Zhang,1,4 Cyriac Kandoth,1 Michael C. Wendl,1,2
William Schierding,1 Daniel C. Koboldt,1 Thomas B. Mooney,1 Matthew B. Callaway,1
David Dooling,1 Elaine R. Mardis,1,2,3 Richard K. Wilson,1,2,3 and Li Ding1,2,5
1The Genome Institute, Washington University, St. Louis, Missouri 63108, USA; 2Department of Genetics, Washington University,
St. Louis, Missouri 63110, USA; 3Siteman Cancer Center, Washington University, St. Louis, Missouri 63110, USA
Massively parallel sequencing technology and the associated rapidly decreasing sequencing costs have enabled systemicanalyses of somatic mutations in large cohorts of cancer cases. Here we introduce a comprehensive mutational analysispipeline that uses standardized sequence-based inputs along with multiple types of clinical data to establish correlationsamong mutation sites, affected genes and pathways, and to ultimately separate the commonly abundant passengermutations from the truly significant events. In other words, we aim to determine the Mutational Significance in Cancer(MuSiC) for these large data sets. The integration of analytical operations in the MuSiC framework is widely applicable toa broad set of tumor types and offers the benefits of automation as well as standardization. Herein, we describe thecomputational structure and statistical underpinnings of the MuSiC pipeline and demonstrate its performance using 316ovarian cancer samples from the TCGA ovarian cancer project. MuSiC correctly confirms many expected results, andidentifies several potentially novel avenues for discovery.
[Supplemental material is available for this article.]
The continued advancement of DNA sequencing technologies
(Mardis 2011) now allows for the rapid sequencing of large sets of
cancer cases (matched tumor and normal samples) for the purposes
of mutation discovery. This technological progression has shifted
the emphasis in cancer genomics from the analysis of a single pa-
tient sample to that of hundreds of patient samples across a broad
range of tumor types. Such an expansion of scope facilitates the
ascertainment of recurrent mutations within genes and functional
pathways. Additionally, the increasing scope permits correlating
mutations and pathways with clinical phenotypes where appro-
priate clinical data exist. The outcome of such correlation can in-
clude the identification of prognostic or diagnostic markers or the
identification of actionable targets for developing therapeutic
options that may inform clinical trials development.
To this end, we present a packaged suite of comprehensive,
user-friendly tools designed to determine mutational significance
in cancer (MuSiC). The primary goal of MuSiC is to separate the
significant events which are likely drivers for disease from the
passenger mutations present in mutational discovery sets using
a variety of statistical methods. This package provides unique prac-
tical advantages over existing software and requires a few basic
input elements: mapped reads in BAM format, predicted or val-
idated single nucleotide variants (SNVs) and indels in mutation
annotation format (MAF), a set of regions of interest (typically the
boundaries of coding exons), and any relevant numeric and/or cat-
egorical clinical data. Usage is straightforward. With a single com-
mand, a user can (1) apply statistical methods across the cohort to
identify significantly mutated genes and (2) identify significantly
altered pathways and gene sets, (3) investigate the proximity of
amino acid mutations within the same gene, (4) search for gene-
based or site-based relationships and correlations between the
mutations themselves, (5) correlate mutations to clinical features,
and (6) cross-reference the findings with relevant databases, such
as Pfam (Finn et al. 2010), COSMIC (Forbes et al. 2008), and OMIM
(McKusick 1998). These functions can be accessed individually or
run as an automated serial implementation.
To illustrate performance, we tested the MuSiC suite on an
exome capture data set consisting of 316 cases of ovarian carci-
noma (OV) that were previously described by the TCGA Research
Network (The Cancer Genome Atlas Research Network 2011). The
original analysis provided statistically supported lists of signifi-
cantly mutated genes, therapeutically targetable copy number
amplifications in several genes (e.g., MECOM, MAPK1, CCNE1, and
KRAS), evidence of overlaps between DNA methylation clusters
and gene expression subtypes, and confirmation of involvement
of the NOTCH and FOXM1 signaling pathways in serous ovarian
cancer pathophysiology. Using MuSiC, we complement the previous
results with detailed descriptions of the correlations between muta-
tion spectra and clinical data. We found evidence of mutual exclu-
sion between mutations in two major tumor suppressors, TP53 and
RB1, and strong statistical support for the correlation of germline
BRCA1 point mutations and age at disease onset (Hall et al. 1990;
Miki et al. 1994). MuSiC also helps us confirm the importance of
mutations in the P53 DNA-binding domain (Sigal and Rotter 2000).
Results
Overview
The development of MuSiC was motivated by the rapidly
expanding numbers of mutation data sets from a wide variety of
tumor types. It is imperative during post-discovery analysis to
separate the significant, or ‘‘driver,’’ mutations from the passenger
mutations to more accurately pinpoint the key genes and pathways
4These authors contributed equally to this work.5Corresponding authorE-mail [email protected] published online before print. Article, supplemental material, and publi-cation date are at http://www.genome.org/cgi/doi/10.1101/gr.134635.111.
22:1589–1598 � 2012, Published by Cold Spring Harbor Laboratory Press; ISSN 1088-9051/12; www.genome.org Genome Research 1589www.genome.org
Cold Spring Harbor Laboratory Press on February 17, 2014 - Published by genome.cshlp.orgDownloaded from

critical for disease initiation and progression. MuSiC is designed
precisely to streamline this process into an easily accessible high-
throughput software exercise.
MuSiC currently consists of seven analysis modules and an
eighth execution module, ‘‘MuSiC Play,’’ which runs each analysis
module sequentially (Fig. 1). MuSiC Play parses the input and out-
put of each of the individual modules and then produces a com-
posite summary of all executed modules. Table 1 lists the type of
analysis performed and the types of variants considered by each
individual MuSiC module. More detailed descriptions of the specific
analysis algorithms performed by each module are given below.
Significantly mutated gene tests
We use the concept of ‘‘significantly mutated genes’’ (SMG) to
describe genes that show a significantly higher mutation rate than
the background mutation rate (BMR) when multiple mutational
mechanisms (coding indel and single nucleotide substitution,
splice site mutation, etc.) are considered. Specialized measurements
of the BMR may also be considered; BMRs in MuSiC are optionally
calculated across the entire sample set, across particular subgroups
of similarly mutated samples, or for each sample individually. For
each BMR subgroup considered and for each category of mutational
mechanism, the mutation rates are compared to the appropriate
BMR, and a single P-value summarizing all considerations is gen-
erated for each gene. We refer to this summarization procedure as
the significantly mutated gene (SMG) test.
We assessed multiple methods of calculating summarized
P-values, including a convolution test (CT), a Fisher’s combined
P-value test (FCPT), and the likelihood ratio test (LRT), using
a partially simulated data set (this data set and the associated test
simulations are described in the Supplemental Material). By this
approach, we determined that the P-value distribution obtained
using the CT method most closely resembled the uniform distri-
bution expected under the null (in this case, the null is such that
no gene is truly significantly mutated), while the FCPT and LRT
methods produced slightly inflated or deflated P-values, respec-
tively (Supplemental Fig. S1). During the SMG test, a false discovery
rate (FDR) also is calculated. We evaluate our SMG test results by
establishing a P-value or FDR threshold (threshold typically 0.2 or
less for FDR), and then appropriately filtering the test output.
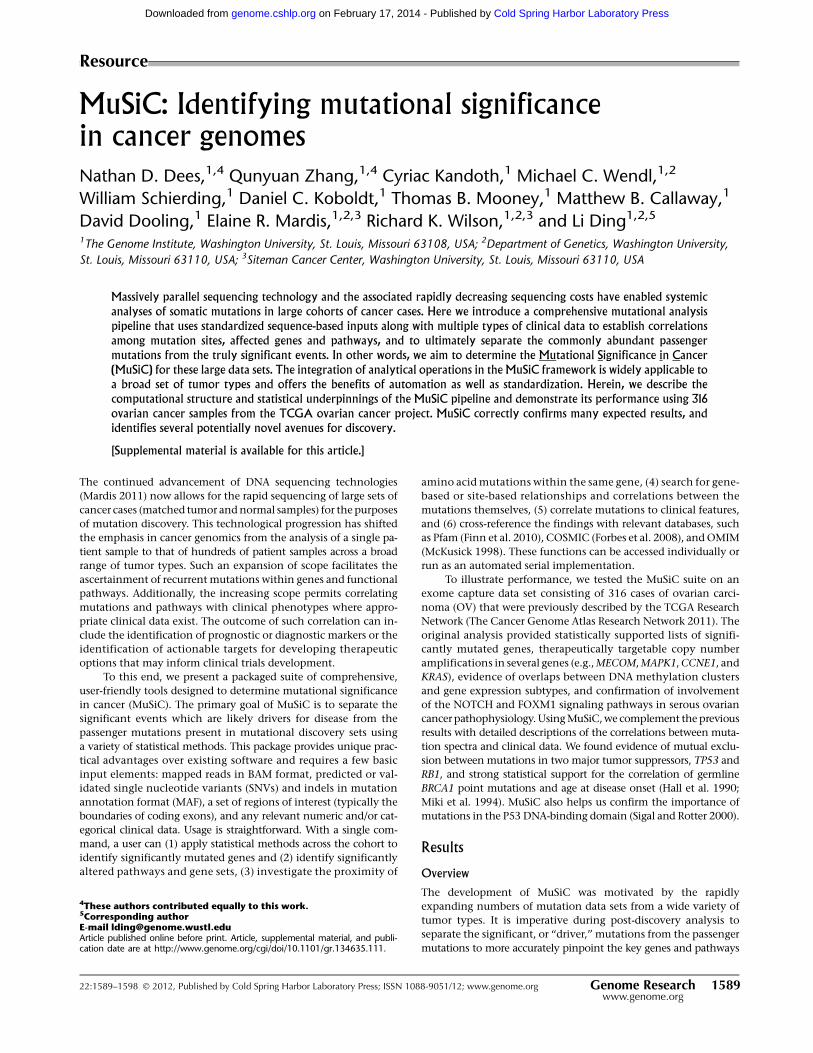
The results of MuSiC’s SMG analysis for the ovarian cancer
data set were previously reported (The Cancer Genome Atlas Re-
search Network 2011). Briefly, there were 12 genes found to be
significantly mutated in the data set. The CT, FCPT, and LRT P-values
for these genes as well as the BMR for each mutational mechanism
category in the ovarian data set are displayed in Figure 2. BRCA1
and BRCA2 are known ovarian cancer risk genes (King et al.
2003; Pal et al. 2005). In addition to 27 (BRCA1) and 25 (BRCA2)
germline nonsense, splice site, and indel mutations, 11 and 10
nonsynonymous somatic mutations were discovered in this data
set in BRCA1 and BRCA2, respectively (The Cancer Genome Atlas
Research Network 2011).
Significantly mutated pathway/gene set analysis
To identify known cellular pathways with significant accretions of
somatic mutations in ovarian tumors, we integrated the PathScan
algorithm (Wendl et al. 2011) as a module of the MuSiC pipeline.
PathScan treats pathways as groups of genes defined by databases
such as KEGG (Kanehisa and Goto 2000), BioCarta (Nishimura
2001), and Reactome (Joshi-Tope et al. 2005), with the KEGG
definitions currently set as the default implementation. PathScan
can be configured, however, to assess any grouping of genes, including
groupings from nonpathway databases such as Pfam (Finn et al. 2010).
Using PathScan, we analyzed the OV somatic mutation data
set in two ways. First, the entire data set was analyzed regardless
of the frequency of mutation in specific genes. Secondly, due to the
overwhelming abundance of TP53 mutations, we also performed the
analysis using identical parameters but excluding TP53 mutations.
The most significant pathways identified in the first analysis
were a collection of KEGG cancer pathways including ‘‘Thyroid
Cancer’’ (hsa05216), ‘‘Bladder Cancer’’ (hsa05219), ‘‘Basal Cell Car-
cinoma’’ (hsa05217), ‘‘Nonsmall Cell Lung Cancer’’ (hsa05223), and
‘‘Melanoma’’ (hsa05218). In the midst of those significant cancer
pathways sits the ‘‘p53 Signaling’’ pathway (hsa04115) at a P-value
of 2.62 3 10�126. Also, MuSiC found the ‘‘Apoptosis’’ pathway
(hsa04210), including not only TP53 mutations but also nine
phosphoinositide 3-kinase mutations, to be affected. This latter
group of mutations includes two PIK3CA mutations, previously
implicated in both breast and ovarian cancers (Levine et al. 2005).
In the second analysis where TP53 mutations were excluded,
the collection of KEGG cancer pathways was no longer identified
as the most significant pathways in the OV data set. Instead, for
instance, this analysis identified the environmental information
processing class ‘‘Receptors and Channels’’ pathway from the KEGG
Brite database (hsa04000) as the most significant (P = 4.36 3 10�91)
Table 1. Analyses performed and the variants included for eachMuSiC module
MuSiC module Analysis type Variants included
SMG test Statistical test Optionala
PathScan Statistical test Optionala
Mutation relationtest
Statistical test Optionala
Clinical correlationtest
Statistical test Optionala
Proximity analysis Mathematicalquery
Optionala
COSMIC/OMIManalysis
Database query Optionala
Pfam annotation Database query All
aIn all of the tools, a user may optionally include only nonsynonymousvariants, or, alternatively, both nonsynonymous and synonymous variantsmay be considered.
Figure 1. MuSiC flow diagram. MuSiC modules can either be imple-mented individually with various required input files or may be imple-mented in serial via one command where four inputs are used to executethe entire package of tools.
1590 Genome Researchwww.genome.org
Dees et al.
Cold Spring Harbor Laboratory Press on February 17, 2014 - Published by genome.cshlp.orgDownloaded from
(Table 2). Limiting the analysis scope to the KEGG Pathway data-
base, a similar pathway was identified from the environmental
information processing class, the ‘‘Neuroactive Ligand-Receptor
Interaction’’ pathway (hsa04080). This pathway incurred 266
mutations across the OV data set yielding a P-value of 2.5 3 10�11.
The ‘‘Calcium Signaling’’ pathway (hsa04020, P = 4.9 3 10�8) also
rose to the level of significance from the TP53-excluded KEGG
analysis, which is interesting due to the role of calcium signaling in
many cellular processes including cell death (Crompton 2000). The
results from the OV data set feature 266 mutations throughout this
pathway, highlighted by 35 mutations in voltage-dependent calcium-
channel genes (CACNA1A-H and CACNA1S), and 25 mutations in
RYR1 and RYR2 genes, whose expression
has been correlated with tumor grade in
breast cancer (Abdul et al. 2008).
Mutation relation test
The mutation relation test (MRT) at-
tempts to reveal correlations and mutual-
exclusion relationships among significantly
and highly mutated genes in a pairwise
fashion. Positive correlations suggest that
mutations and their associated pathways
putatively function synergistically to pro-
mote carcinogenesis, while negative corre-
lations imply that the alteration of a single
component or pathway may be sufficient,
wholly or in part, for carcinogenesis.
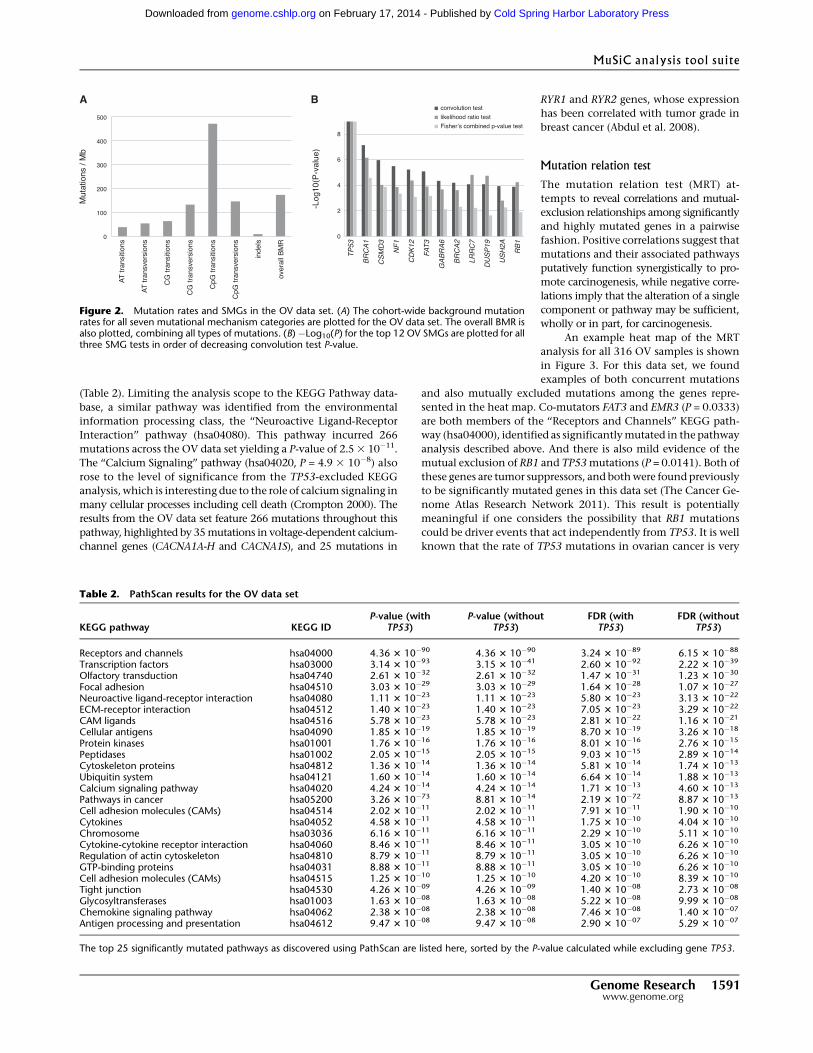
An example heat map of the MRT
analysis for all 316 OV samples is shown
in Figure 3. For this data set, we found
examples of both concurrent mutations
and also mutually excluded mutations among the genes repre-
sented in the heat map. Co-mutators FAT3 and EMR3 (P = 0.0333)
are both members of the ‘‘Receptors and Channels’’ KEGG path-
way (hsa04000), identified as significantly mutated in the pathway
analysis described above. And there is also mild evidence of the
mutual exclusion of RB1 and TP53 mutations (P = 0.0141). Both of
these genes are tumor suppressors, and both were found previously
to be significantly mutated genes in this data set (The Cancer Ge-
nome Atlas Research Network 2011). This result is potentially
meaningful if one considers the possibility that RB1 mutations
could be driver events that act independently from TP53. It is well
known that the rate of TP53 mutations in ovarian cancer is very
Figure 2. Mutation rates and SMGs in the OV data set. (A) The cohort-wide background mutationrates for all seven mutational mechanism categories are plotted for the OV data set. The overall BMR isalso plotted, combining all types of mutations. (B)�Log10(P) for the top 12 OV SMGs are plotted for allthree SMG tests in order of decreasing convolution test P-value.
Table 2. PathScan results for the OV data set
KEGG pathway KEGG IDP-value (with
TP53)P-value (without
TP53)FDR (with
TP53)FDR (without
TP53)
Receptors and channels hsa04000 4.36 3 10�90 4.36 3 10�90 3.24 3 10�89 6.15 3 10�88
Transcription factors hsa03000 3.14 3 10�93 3.15 3 10�41 2.60 3 10�92 2.22 3 10�39
Olfactory transduction hsa04740 2.61 3 10�32 2.61 3 10�32 1.47 3 10�31 1.23 3 10�30
Focal adhesion hsa04510 3.03 3 10�29 3.03 3 10�29 1.64 3 10�28 1.07 3 10�27
Neuroactive ligand-receptor interaction hsa04080 1.11 3 10�23 1.11 3 10�23 5.80 3 10�23 3.13 3 10�22
ECM-receptor interaction hsa04512 1.40 3 10�23 1.40 3 10�23 7.05 3 10�23 3.29 3 10�22
CAM ligands hsa04516 5.78 3 10�23 5.78 3 10�23 2.81 3 10�22 1.16 3 10�21
Cellular antigens hsa04090 1.85 3 10�19 1.85 3 10�19 8.70 3 10�19 3.26 3 10�18
Protein kinases hsa01001 1.76 3 10�16 1.76 3 10�16 8.01 3 10�16 2.76 3 10�15
Peptidases hsa01002 2.05 3 10�15 2.05 3 10�15 9.03 3 10�15 2.89 3 10�14
Cytoskeleton proteins hsa04812 1.36 3 10�14 1.36 3 10�14 5.81 3 10�14 1.74 3 10�13
Ubiquitin system hsa04121 1.60 3 10�14 1.60 3 10�14 6.64 3 10�14 1.88 3 10�13
Calcium signaling pathway hsa04020 4.24 3 10�14 4.24 3 10�14 1.71 3 10�13 4.60 3 10�13
Pathways in cancer hsa05200 3.26 3 10�73 8.81 3 10�14 2.19 3 10�72 8.87 3 10�13
Cell adhesion molecules (CAMs) hsa04514 2.02 3 10�11 2.02 3 10�11 7.91 3 10�11 1.90 3 10�10
Cytokines hsa04052 4.58 3 10�11 4.58 3 10�11 1.75 3 10�10 4.04 3 10�10
Chromosome hsa03036 6.16 3 10�11 6.16 3 10�11 2.29 3 10�10 5.11 3 10�10
Cytokine-cytokine receptor interaction hsa04060 8.46 3 10�11 8.46 3 10�11 3.05 3 10�10 6.26 3 10�10
Regulation of actin cytoskeleton hsa04810 8.79 3 10�11 8.79 3 10�11 3.05 3 10�10 6.26 3 10�10
GTP-binding proteins hsa04031 8.88 3 10�11 8.88 3 10�11 3.05 3 10�10 6.26 3 10�10
Cell adhesion molecules (CAMs) hsa04515 1.25 3 10�10 1.25 3 10�10 4.20 3 10�10 8.39 3 10�10
Tight junction hsa04530 4.26 3 10�09 4.26 3 10�09 1.40 3 10�08 2.73 3 10�08
Glycosyltransferases hsa01003 1.63 3 10�08 1.63 3 10�08 5.22 3 10�08 9.99 3 10�08
Chemokine signaling pathway hsa04062 2.38 3 10�08 2.38 3 10�08 7.46 3 10�08 1.40 3 10�07
Antigen processing and presentation hsa04612 9.47 3 10�08 9.47 3 10�08 2.90 3 10�07 5.29 3 10�07
The top 25 significantly mutated pathways as discovered using PathScan are listed here, sorted by the P-value calculated while excluding gene TP53.
MuSiC analysis tool suite
Genome Research 1591www.genome.org
Cold Spring Harbor Laboratory Press on February 17, 2014 - Published by genome.cshlp.orgDownloaded from
high (Ahmed et al. 2010), including the OV data set used in this
analysis (The Cancer Genome Atlas Research Network 2011). How-
ever, for the few cases that do not have a driver mutation in TP53, we
speculate, based on our mutual exclusion results, that mutations in
RB1 may represent an independent path to ovarian adenocarci-
noma. Of course, due to the small numbers of mutations present
in RB1 and EMR3 (six and five mutations, respectively), additional
data would be required to confirm any hypotheses generated using
these results.
Clinical correlation test
The clinical correlation test (CCT) can be used to determine re-
lationships between clinical phenotypes and observed mutations.
The input clinical data may be represented in either numeric or
categorical (‘‘class’’) formats. For example, in the OV data set, we
obtained clinical data for 315 of the 316 OV samples; the numeric
clinical data consisted of the patients’ ages at disease diagnosis and
also their survival periods (in days), and the categorical clinical
data for the OV data set included information about a sample’s
race, tumor stage, tumor grade, the outcome of the primary ther-
apy, and, lastly, their vital status. For both data types, the goal of
the CCT is to determine whether specific mutations/genes are as-
sociated with a particular clinical feature. As these associations can
sometimes be biased by covariate clinical features, MuSiC also of-
fers a generalized linear model (GLM) analysis option within the
CCT. This tool allows users to define any number of clinical traits as
covariates to discovered mutations and, subsequently, to eliminate
any possible biases introduced to the phenotype/mutation asso-
ciations by the covariates’ effects.
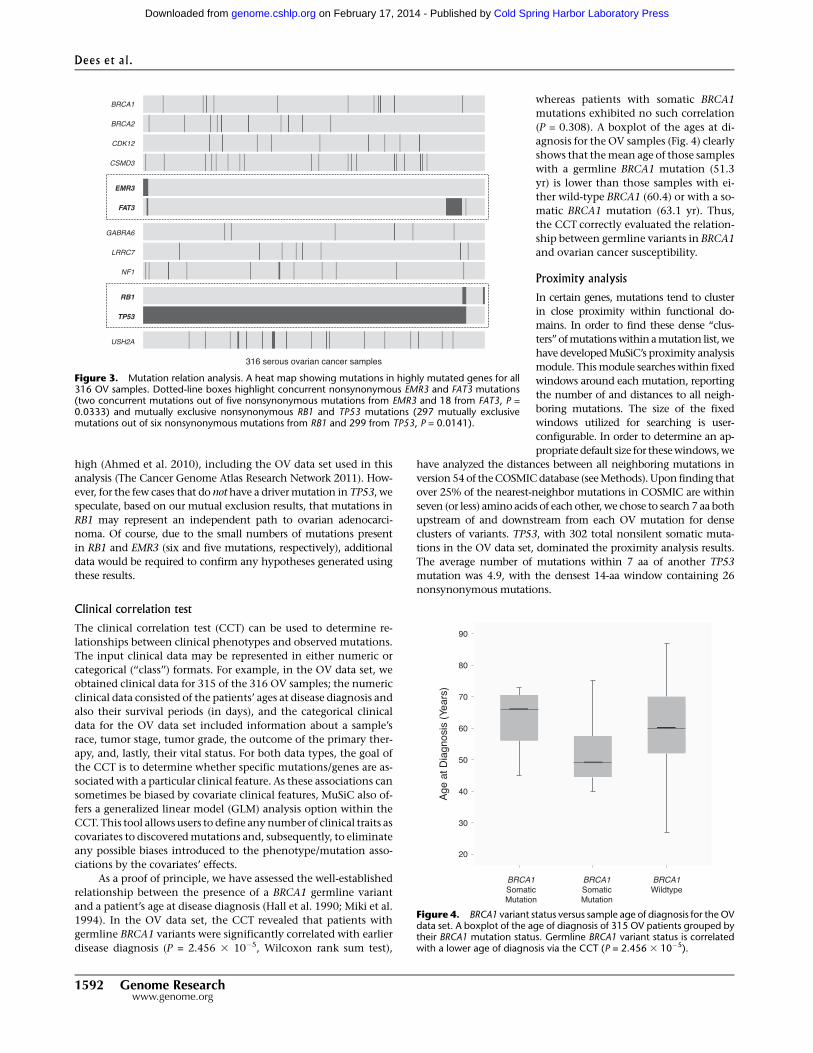
As a proof of principle, we have assessed the well-established
relationship between the presence of a BRCA1 germline variant
and a patient’s age at disease diagnosis (Hall et al. 1990; Miki et al.
1994). In the OV data set, the CCT revealed that patients with
germline BRCA1 variants were significantly correlated with earlier
disease diagnosis (P = 2.456 3 10�5, Wilcoxon rank sum test),
whereas patients with somatic BRCA1
mutations exhibited no such correlation
(P = 0.308). A boxplot of the ages at di-
agnosis for the OV samples (Fig. 4) clearly
shows that the mean age of those samples
with a germline BRCA1 mutation (51.3
yr) is lower than those samples with ei-
ther wild-type BRCA1 (60.4) or with a so-
matic BRCA1 mutation (63.1 yr). Thus,
the CCT correctly evaluated the relation-
ship between germline variants in BRCA1
and ovarian cancer susceptibility.
Proximity analysis
In certain genes, mutations tend to cluster
in close proximity within functional do-
mains. In order to find these dense ‘‘clus-
ters’’ of mutations within a mutation list, we
have developed MuSiC’s proximity analysis
module. This module searches within fixed
windows around each mutation, reporting
the number of and distances to all neigh-
boring mutations. The size of the fixed
windows utilized for searching is user-
configurable. In order to determine an ap-
propriate default size for these windows, we
have analyzed the distances between all neighboring mutations in
version 54 of the COSMIC database (see Methods). Upon finding that
over 25% of the nearest-neighbor mutations in COSMIC are within
seven (or less) amino acids of each other, we chose to search 7 aa both
upstream of and downstream from each OV mutation for dense
clusters of variants. TP53, with 302 total nonsilent somatic muta-
tions in the OV data set, dominated the proximity analysis results.
The average number of mutations within 7 aa of another TP53
mutation was 4.9, with the densest 14-aa window containing 26
nonsynonymous mutations.
Figure 3. Mutation relation analysis. A heat map showing mutations in highly mutated genes for all316 OV samples. Dotted-line boxes highlight concurrent nonsynonymous EMR3 and FAT3 mutations(two concurrent mutations out of five nonsynonymous mutations from EMR3 and 18 from FAT3, P =0.0333) and mutually exclusive nonsynonymous RB1 and TP53 mutations (297 mutually exclusivemutations out of six nonsynonymous mutations from RB1 and 299 from TP53, P = 0.0141).
Figure 4. BRCA1 variant status versus sample age of diagnosis for the OVdata set. A boxplot of the age of diagnosis of 315 OV patients grouped bytheir BRCA1 mutation status. Germline BRCA1 variant status is correlatedwith a lower age of diagnosis via the CCT (P = 2.456 3 10�5).
Dees et al.
1592 Genome Researchwww.genome.org
Cold Spring Harbor Laboratory Press on February 17, 2014 - Published by genome.cshlp.orgDownloaded from
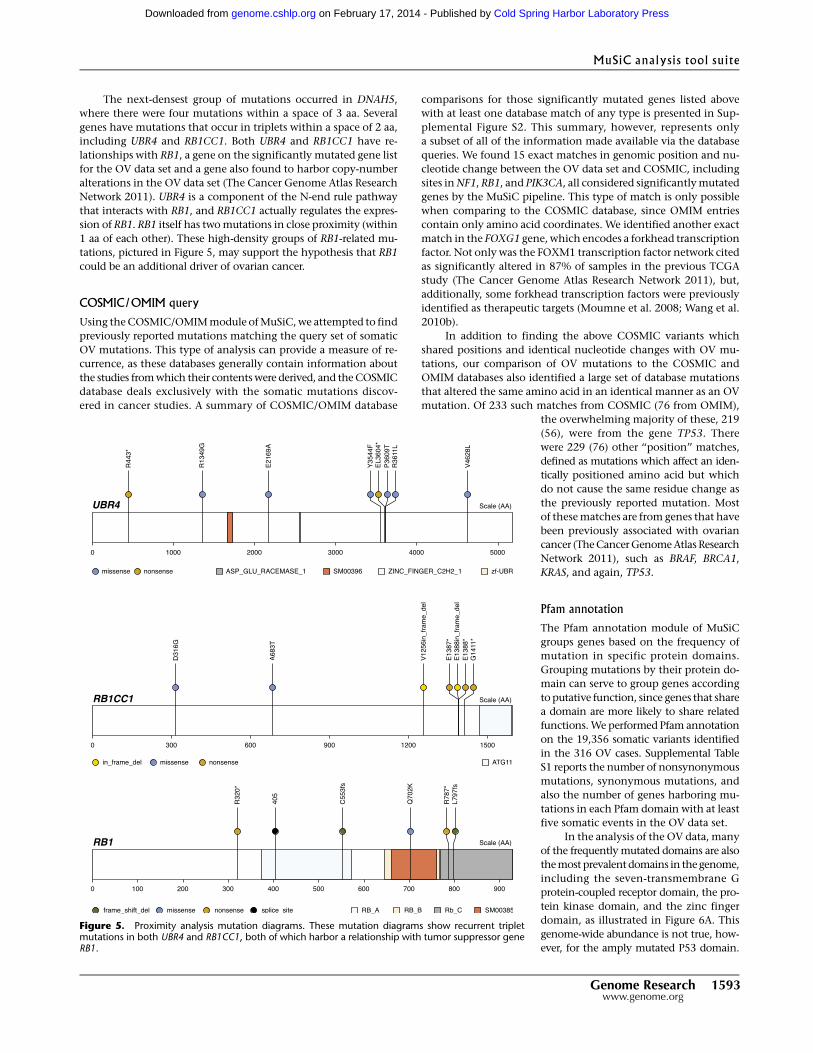
The next-densest group of mutations occurred in DNAH5,
where there were four mutations within a space of 3 aa. Several
genes have mutations that occur in triplets within a space of 2 aa,
including UBR4 and RB1CC1. Both UBR4 and RB1CC1 have re-
lationships with RB1, a gene on the significantly mutated gene list
for the OV data set and a gene also found to harbor copy-number
alterations in the OV data set (The Cancer Genome Atlas Research
Network 2011). UBR4 is a component of the N-end rule pathway
that interacts with RB1, and RB1CC1 actually regulates the expres-
sion of RB1. RB1 itself has two mutations in close proximity (within
1 aa of each other). These high-density groups of RB1-related mu-
tations, pictured in Figure 5, may support the hypothesis that RB1
could be an additional driver of ovarian cancer.
COSMIC/OMIM query
Using the COSMIC/OMIM module of MuSiC, we attempted to find
previously reported mutations matching the query set of somatic
OV mutations. This type of analysis can provide a measure of re-
currence, as these databases generally contain information about
the studies from which their contents were derived, and the COSMIC
database deals exclusively with the somatic mutations discov-
ered in cancer studies. A summary of COSMIC/OMIM database
comparisons for those significantly mutated genes listed above
with at least one database match of any type is presented in Sup-
plemental Figure S2. This summary, however, represents only
a subset of all of the information made available via the database
queries. We found 15 exact matches in genomic position and nu-
cleotide change between the OV data set and COSMIC, including
sites in NF1, RB1, and PIK3CA, all considered significantly mutated
genes by the MuSiC pipeline. This type of match is only possible
when comparing to the COSMIC database, since OMIM entries
contain only amino acid coordinates. We identified another exact
match in the FOXG1 gene, which encodes a forkhead transcription
factor. Not only was the FOXM1 transcription factor network cited
as significantly altered in 87% of samples in the previous TCGA
study (The Cancer Genome Atlas Research Network 2011), but,
additionally, some forkhead transcription factors were previously
identified as therapeutic targets (Moumne et al. 2008; Wang et al.
2010b).
In addition to finding the above COSMIC variants which
shared positions and identical nucleotide changes with OV mu-
tations, our comparison of OV mutations to the COSMIC and
OMIM databases also identified a large set of database mutations
that altered the same amino acid in an identical manner as an OV
mutation. Of 233 such matches from COSMIC (76 from OMIM),
the overwhelming majority of these, 219
(56), were from the gene TP53. There
were 229 (76) other ‘‘position’’ matches,
defined as mutations which affect an iden-
tically positioned amino acid but which
do not cause the same residue change as
the previously reported mutation. Most
of these matches are from genes that have
been previously associated with ovarian
cancer (The Cancer Genome Atlas Research
Network 2011), such as BRAF, BRCA1,
KRAS, and again, TP53.
Pfam annotation
The Pfam annotation module of MuSiC
groups genes based on the frequency of
mutation in specific protein domains.
Grouping mutations by their protein do-
main can serve to group genes according
to putative function, since genes that share
a domain are more likely to share related
functions. We performed Pfam annotation
on the 19,356 somatic variants identified
in the 316 OV cases. Supplemental Table
S1 reports the number of nonsynonymous
mutations, synonymous mutations, and
also the number of genes harboring mu-
tations in each Pfam domain with at least
five somatic events in the OV data set.
In the analysis of the OV data, many
of the frequently mutated domains are also
the most prevalent domains in the genome,
including the seven-transmembrane G
protein-coupled receptor domain, the pro-
tein kinase domain, and the zinc finger
domain, as illustrated in Figure 6A. This
genome-wide abundance is not true, how-
ever, for the amply mutated P53 domain.
Figure 5. Proximity analysis mutation diagrams. These mutation diagrams show recurrent tripletmutations in both UBR4 and RB1CC1, both of which harbor a relationship with tumor suppressor geneRB1.
MuSiC analysis tool suite
Genome Research 1593www.genome.org
Cold Spring Harbor Laboratory Press on February 17, 2014 - Published by genome.cshlp.orgDownloaded from

Analysis of this Pfam annotation result correctly confirms the
significance of the P53 domain mutations in this cohort. Figure 6A
also shows that this domain is recurrently mutated but only in
a small number of genes, much different from all of the other
domains pictured. And lastly, Figure 6B shows that the P53 domain
has an unusually high nonsynonymous:synonymous mutation
ratio. All of these details are indicative (correctly) of an important
mutation hotspot in this cohort.
The Pfam annotation module output may also be modified
slightly and fed into the SMG test algorithm in order to produce
a mathematical result describing ‘‘significantly mutated domains’’
(rather than significantly mutated genes) and their associated
P-values. For a detailed explanation of this option, please see the
Supplemental Material, including Supplemental Table S2. The re-
sults presented therein reaffirm the significance of the mutations
in the P53 domain, as well as in the other frequently mutated
domains.
DiscussionThere are several software tools available purporting to determine
mutational significance. CHASM (Carter et al. 2010), for instance,
uses a machine-learning technique to distinguish driver mutations
from passengers based on a driver/passenger mutation training set.
Mutation Assessor (Reva et al. 2011) provides a prediction of the
functional impact of a mutation based on the specificity of mul-
tiple sequence alignments and conservation scores. And tools such
as CanPredict (Kaminker et al. 2007) are database-driven, deriving
multiple metrics for each variant, starting with stored information
and models, and then making use of the metrics through a de-
cision-tree analysis. Other tools, such as ANNOVAR (Wang et al.
2010a), provide detailed annotations of genetic alterations, much
like MuSiC’s Pfam annotation module. Although not currently
publicly available, the ‘‘Firehose’’ pipeline does share some fea-
tures with MuSiC, including an SMG analysis tool and a pathway
analysis tool, PARADIGM (Vaske et al. 2010), but Firehose as a
whole is heavily focused on orderly sequencing and quality control
rather than post-discovery variant analysis.
MuSiC, on the other hand, is the first available set of com-
bined tools that enables a complete, multidimensional statistical
evaluation of next-generation-derived cancer data sets. No other
publicly available tool suite currently incorporates clinical data
along with coverage data and database references into the
determination of the most significant
mutations among a large mutation list full
of passengers. MuSiC merges several meth-
odological aspects of the above-mentioned
tools with many novel additional algo-
rithms, providing the capability of large-
cohort, data-driven statistical analysis to
the entire research community.
Use of MuSiC is straightforward. The
simplicity of the input files and tool
updating make this package extremely
accessible. MuSiC also accommodates both
large and small research organizations;
although the entire suite of tools is capa-
ble of running sequentially on a single
processor, the most CPU-intensive mod-
ules offer easily parsable options for par-
allelizing jobs across multiple machines
or across a job cluster.
Future support for the MuSiC package will be devoted to the
handling of additional file formats, such as the variant call format
(VCF), and also to the development of a graphical user interface
(GUI). We intend to design new tools aimed at incorporating
a wider variety of biological and variant data types, such as copy
alteration data, and 3D protein structures from RCSB’s Protein Data
Bank (Berman et al. 2000), to be used for improved proximity
analysis calculations. We also intend to implement recurrence
tests across other data entities, such as significantly mutated
transcripts and significantly mutated gene families. We also plan
to enhance the assessment of the functional impact of pro-
tein mutations in MuSiC through the integration of published
solutions, such as Mutation Assessor (Reva et al. 2011) and
PolyPhen-2 (Adzhubei et al. 2010), as well as through the design
of new modules which take advantage of databases that cate-
gorize such effects, such as SIFT (Kumar et al. 2009). And lastly, a
fuller integration of the results from various MuSiC modules,
many of which are currently considered in isolation, will provide an
even more comprehensive picture of cancer genomic mechanisms.
Methods
Sample data set used in this studyAlignment mapping files for the ovarian cancer cohort, as well asall mutational data in mutation annotation format (MAF) areavailable at The Cancer Genome Atlas (TCGA) website, http://cancergenome.nih.gov/, via dbGaP. The dbGaP study accessionnumber is phs000178.v1.p1.
Significantly mutated gene tests
We describe our calculation of background mutation rates andthree methods for calculating summarized P-values below.
Background mutation rate (BMR)
Calculations of BMR, although simply described as the number ofmutated bases per total bases, are often controversial. Our methodis dependent upon the data available, under the premise that thenumber of bases having available alignment data should providethe denominator for the BMR calculation, since this number alsoprovides the upper limit to the number of bases available for mu-tation discovery. Therefore, we first count the number of baseswith sufficient aligned read-depth based upon user-defined coverage
Figure 6. Pfam domains affected by OV mutations. (A) A histogram of the most highly mutateddomains in the OV data set next to the number of genes affected in each domain. (B) A stacked bar-graph where the value 100% represents the total number of mutations in a particular Pfam domain.Lighter and darker sections of the bars represent which proportions of the total mutations are non-synonymous and synonymous, respectively.
Dees et al.
1594 Genome Researchwww.genome.org
Cold Spring Harbor Laboratory Press on February 17, 2014 - Published by genome.cshlp.orgDownloaded from
limits set independently for the tumor and normal BAM files for eachsample in the cohort. For the purposes of our algorithm, counts aredetermined for six specific reference sequence-based denominations,with separate counts for each of A and T bases, CpG-connected C andG bases, and lastly C and G bases not connected as CpG. We alsocategorize the discovered mutations along the lines of mutationalmechanism, with separate categories for AT transitions, AT trans-versions, CpG transitions, CpG transversions, CG (non-CpG) tran-sitions and transversions, and a seventh ‘‘indel’’ category, for whichwe use the entirety of the covered space in the sample-set whencomparing indel-affected bases versus available bases. In order tocalculate the BMR of each mutational mechanism category, thenumber of mutations found in that category is divided by thetotal number of bases available in which such a call could havebeen made.
MuSiC allows for the calculation of BMR and for the sub-sequent comparisons of mutation rate to BMR, to be performedseparately for each subgroup in a user-specified number of sub-groups. If the user specifies that only one subgroup is to be con-sidered (the default option), then the entire cohort is used in thecalculations of mutation rate and BMR for the seven mutationalmechanism categories. In this case, seven P-values are generatedfor each gene and are summarized using the three methods de-scribed below. However, if more than one subgroup is to be con-sidered for a given cohort, the mutation rates and BMRs for theseven mutational mechanism categories are calculated separatelyfor each subgroup (seven mutation rate and BMR calculations persubgroup), with P-values generated for each category within eachsubgroup. In this case, the number of P-values generated for eachgene will equal seven times the number of subgroups to be con-sidered. All P-values for each gene are still summarized using thethree methods discussed below.
If the number of subgroups to be considered is greater than onebut not equal to the number of samples in the cohort, the BMR foreach sample is first calculated individually, and then these per-sample BMR values are clustered using k-means clustering into thenumber of subgroups specified by the user. These clustered sub-groups are then used for all subsequent mutation rate and BMRcalculations. Alternatively, if the number of subgroups specified bythe user equals the number of samples in the cohort, then eachsample is considered independently for each mutation rate and BMRmeasurement.
The BMRs calculated across the entire OV data set for eachmutational mechanism category, including the overall BMR acrossall categories, are plotted in Figure 2A.
Fisher’s combined P-value test (FCPT)
FCPT combines all P-values for a particular gene into a statistic, xc,according to Fisher’s method (Fisher 1925),
xc = � 2 +k
i = 1
logðpiÞ;
where pi is the P-value obtained via binomial distribution for thei-th subgroup mutational mechanism type, and k the number ofsubgroup mutational mechanism categories for a gene. The finalP-value for the entire gene is calculated as the probability ofobserving a value no less than xc, based on a x2 distribution with 2kdegrees of freedom.
Likelihood ratio test (LRT)
LRT constructs a likelihood ratio-based statistic (xl) for a gene,
xl = 2 +k
i = 1
logLðMi;CijriÞLðMi;CijRiÞ
� �;
where Mi, Ci, Ri, and ri are mutation number, coverage, BMR, andmaximum likelihood estimate (MLE) of the mutation rate, re-spectively, for the i-th subgroup mutational mechanism categoryof a gene, k is the number of mutation types, and L() is the like-lihood of observed mutation number for the i-th subgroup muta-tional mechanism category, defined as the point probability ofobserving Mi mutations given a coverage of Ci and a mutationrate of Ri or ri. The final P-value for the entire gene is calculated asthe probability of observing a value no less than xl, based on anapproximate x2 distribution with k degrees of freedom.
Convolution test (CT)
CT calculates a summarized log statistic of joint binomial pointprobability,
Sg = � +k
i = 1
logðLðMi;CijRiÞÞ;
where Mi, Ci, Ri, k, and L() are referred to as the same as in the LRTmethod. Getz et al. (2007) proposed that the P-value for a gene canbe calculated by taking one minus a left-tail probability, i.e., theprobability of observing a value less than Sg, and the semiexactdistribution of Sg can be obtained by a binned histogram-basedconvolution procedure. This procedure is advantageous for thelarge amounts of data involved in genome-wide investigation ofcohort mutations because it provides exact P-values in a minimumamount of computation time; usually one must choose betweenprecision and length of compute. However, one disadvantage ofthis convolution procedure is that the two tails of the Sg distribu-tion are mixed, and therefore the directionality is lost. In this case,both improbably large mutation rates and improbably low muta-tion rates give high values for Sg. To remedy this issue, our CTmethod modifies the published convolution procedure by ex-cluding genes with mutation rates that are close to or equal to 0.In other words, we exclude genes whose mutation rates are ex-tremely far below the BMR, as they never would be considered‘‘significantly mutated’’ in practice.
The output file for the SMG test is a compilation of theP-values for each test for each gene under the null hypothesis thatthe number of mutations seen in the gene is in accordance withthose seen in the background. False discovery rates are alsoreported for each test for each gene.
Significantly mutated pathway/gene set analysis
Sequence data from a single cancer genome do not contain sufficientinformation to adequately investigate pathway/phenotype associa-tions. This problem requires systematic analysis of larger cohorts.There are several published methods for identifying significantlymutated pathways or gene sets (e.g., Lin et al. 2007; Tarca et al. 2009;Vaske et al. 2010), but we have incorporated a new tool calledPathScan into the MuSiC package. PathScan accounts for twoimportant factors other methods neglect: (1) variations in genelengths and the consequent differences of their mutational likeli-hoods under the null hypothesis; and (2) distribution of mutationsamong samples and their proper combination into an overallP-value.
We have configured PathScan in MuSiC to perform pathwayanalysis using a wide variety of annotated databases, includingKEGG (Kanehisa and Goto 2000), BioCarta (Nishimura 2001), andReactome (Joshi-Tope et al. 2005), as mentioned above. The resultsdescribed above where TP53 is excluded from the pathway analysisare achieved easily through MuSiC’s implementation of a parame-ter called ‘‘genes-to-ignore,’’ in which the user may providea comma-delimited list of genes whose mutations should be skippedover when reading the MAF file during the analysis.
MuSiC analysis tool suite
Genome Research 1595www.genome.org
Cold Spring Harbor Laboratory Press on February 17, 2014 - Published by genome.cshlp.orgDownloaded from
Mutation relation test (MRT)
We have developed the MRT to look for any latent relationshipsamong mutated genes. This module is a correlation test for twobinary variables to see whether or not any two genes are mutatedconcurrently (positive correlation) or exclusively (negative corre-lation). Because the numbers of mutated genes may vary signifi-cantly among samples (most have only a few mutations whereassome may have many), and because direct correlation betweengenes in high-mutation-count samples is not comparable to that inlow-mutation-count samples, classic correlation analysis is invalid.To control for this confounder, we calculate P-values in the MRTthrough a restricted permutation, taking into account the distri-bution of mutated gene numbers amongt the samples. Permuta-tions are performed, therefore, by first calculating the numbers ofmutated genes in individual samples and then randomly per-muting the observed mutations, keeping both the number ofmutations in each gene and also the distribution of mutated genenumber per sample constant. Concurrence and exclusion amongmutations are tested separately. This method has been successfullyapplied to lung cancer data in our previous study (Ding et al. 2008).
Clinical correlation test (CCT)
The CCT module was developed for detecting correlations betweenmutations and clinical features. Mutation data are again treated as0-1 variables, where all mutations occurring within the same geneare grouped (the default method), or optionally, where a morestrict definition of collapsing is used, grouping only those muta-tions with identical genomic coordinates and nucleotide changes.Clinical features can either be categorical or numerical variables,where a Fisher’s exact test (and optionally, a x2 test) is used tocalculate P-values for categorical clinical data, and a Wilcoxon ranksum test (and optionally, Pearson’s correlation) is used to analyzenumerical clinical data. The null model for the calculated P-valuesdepends on the type of clinical data being analyzed. For categoricalclinical data, the null model is that mutations happen randomly inthe various categories represented across the samples, with nopreference given to any one category. For numerical clinical data,the null model is that mutations have no effects on a trait (i.e., thatmutations will not increase or decrease the value of the numeri-cally reported trait).
A GLM analysis option also exists in which a user may definean analysis model which must include a response variable anda variant, and then any number of covariates may be considered.The variants and covariates may all be clinical features, or, moretypically, genes from the mutation list should be listed as variants,with clinical features making up the covariates. The output of theGLM option includes a P-value which indicates association be-tween the response variable and the variant, as well as otherstandard outputs from a deviance analysis.
Proximity analysis
In MuSiC, we have defined proximity analysis as an investigationof the density of mutations across a cohort in the amino acid spaceof a given gene’s annotated transcript. The goal of this analysis is toextract evidence of mutations clustered within specific domains,an event which is significant in light of the null model where pointmutations occur at random locations throughout the genome.Highly mutated domains across a group of samples might be in-dicative of an underlying mechanistic association which contrib-utes to the shared condition of the cohort, such as the onset ofdisease. The specific action taken in the tool is to query the dis-tance (in number of amino acids) between every pair of mutations
on a given transcript of a mutated gene within the sample set, andthen to determine which mutations fall within ‘‘close proximity.’’‘‘Close proximity’’ may be determined by the user as an input tothe module, with the units of this parameter being the number ofsequential amino acids between two events.
The algorithm operates as follows: First, the amino acid po-sition of each mutation within its respective transcript is de-termined. Then, for each mutation in the input MAF file, twovalues are calculated: (1) the number of other mutations on thesame transcript within the proximity limit set by the user; and (2)the distance to the closest other mutation in this nearby set. (Notethat if more than one mutation occurs within the same aminoacid, the distance to the closest mutation in this case would be0 aa.) Then, for each mutation, we report a few general details fromthe MAF file in the output, such as the genomic coordinates, ref-erence and variant bases, and the sample in which the mutationwas found. We further report the calculated values, such as theamino acid position of the mutation within the transcript, and also(1) and (2) listed directly above.
In the Proximity Analysis Results section, we chose to use 7 aaas the maximum distance from any OV mutation within which tolook for clusters of mutations. This default distance was chosenafter querying the entire COSMIC mutation database (version 54,comprising 171,473 mutations), and looking for the proximity ofmutations found in dense clusters. For each gene present in thedatabase, we calculated the distance between each mutation inthat gene and its closest neighboring mutation. As many muta-tions sharing the exact same genomic coordinates are reportedmore than once in COSMIC, we only used one instance of eachmutational position when calculating nearest-neighbor distances.Through these per-gene measurements, we found that over 25% ofall neighboring mutations in COSMIC are within 7 aa of each other(25% thus represents the first quartile of nearest-neighbor dis-tances). We thus set 7 aa as the default range within which tosearch for clusters of mutations in the proximity analysis module.
COSMIC/OMIM query
In the COSMIC/OMIM tool, a list of mutations is queried for re-currence against both the Catalogue of Somatic Mutations inCancer (COSMIC) database and the Online Mendelian Inheritancein Man database (OMIM). The usefulness of this tool is twofold;first, recurrent events between these two databases and a list ofvariations from a cohort provide a quick extension set, especially asthe databases are expanded over time, and secondly, we havedownloaded entries from the COSMIC database related to muta-tions that report some type of amino acid transformation andprovide this file with the MuSiC package, making this type of queryvery user-friendly.
The tool functions as follows: For every mutation found in theinput MAF file, information related to this mutation is gatheredfrom both the COSMIC and OMIM databases. Relevant in-formation is ascertained by relating the genomic coordinate(COSMIC) or the amino acid change (COSMIC and OMIM) asso-ciated with the variant to all database entries. (Note that the MAFused as input must contain an additional field with column header‘‘amino_acid_change,’’ which is the field searched for to performthe amino acid comparison.) A database entry must lie within theuser-specified number of bases (default = 5) or amino acids (default =
2) of the MAF variant to be considered as a ‘‘nearby’’ match. Weview the thresholds for ‘‘nearby’’ matches as adequate for takinginto account the different definitions of reference sequences andgene transcripts that may be used by different contributors to thedatabases. Alternatively, ‘‘exact’’ matches are direct overlaps in boththe location and base/amino acid change of a variant in the MAF
Dees et al.
1596 Genome Researchwww.genome.org
Cold Spring Harbor Laboratory Press on February 17, 2014 - Published by genome.cshlp.orgDownloaded from
and a mutation found in the database. If only the location (thegenomic coordinate or amino acid position) of a variant matcha database entry but not the nucleotide or amino acid change, thesematches are deemed ‘‘position’’ matches. We currently ignore silentmutations in OMIM queries, as these types of mutations do notaffect protein coding. However, the positions of silent mutations arestill considered in comparison with the COSMIC database.
All discoveries based on these database queries are appendedto the input MAF file as extra columns (one column per database).The information written to the output file by the tool will eitherdescribe ‘‘exact’’ or ‘‘position’’ matches in amino acid or base changeor will (optionally) give all results from the gene associated withthe variant for a ‘‘nearby’’ match, one of which must qualify thesite as actually having a ‘‘nearby’’ match. If a variant has no matchin the particular database, a ‘‘novel’’ declaration is made for thevariant, and (again, optionally) all of the results found from theassociated gene will be printed next to the declaration to givethe user an idea of what matches are possible for that gene. Andlastly, if the gene for a variant is not found in the database, a messagenoting this circumstance is printed along with a ‘‘novel’’ declarationfor the variant.
For each queried database, the tool further prints an outputsummary which tallies the types of matches found throughout theentire data set using that database. The user can learn, for instance,how many sites matched exactly in both nucleotide and position,or perhaps how many variants matched database entries in onlythe amino acid category (labeled AA in the summary) while notmatching in exact position or nucleotide change (labeled NT).
Pfam annotation
Our Pfam annotation tool supposes the use of Sanger’s Pfam da-tabase (cited above) as another avenue for defining recurrencewithin the mutation list of a large group of cancer samples. ThePfam database is a catalog of functional regions (or domains) presentwithin protein sequences. Referencing this list with the locations ofsomatic mutations across a cohort provides knowledge about whichdomains are most frequently affected by mutations in a certain dis-ease and, therefore, may provide some insight as to the significance(or insignificance) of the mutations in question.
In order to use the Pfam database, we have translated thecatalog’s amino acid coordinate system into a genomic positioncoordinate system. The amino acid sequences chosen to be trans-lated were ranked at every coding and splice site position in thegenome, based first on the translational and functional effectpredicted by the transcript at a given position, and then secondlyon the NCBI status of the particular transcript. The sequence of the‘‘best’’ transcript chosen at each site was used to recover Pfam do-mains from Sanger’s database. We have incorporated this informationinto a table used by the tool via a fast-lookup program called Tabix,available in the SAMtools package (Li et al. 2009). The Pfam anno-tation module uses the genetic coordinates of a variant to appenda Pfam annotation domain column to the end of any MAF file.
This tool has been expanded to query a few other proteinannotation databases in addition to Pfam. We provide informationfrom the SUPERFAMILY database (Wilson et al. 2009), the SMARTdatabase (Schultz et al. 2000), and the Patternscan database in ourannotation query. (Patternscan is a new version of the Prositedatabase [Sigrist et al. 2010].) Patternscan provides informationsimilar to that of the Pfam database regarding protein domains andfamilies at functional sites, but SUPERFAMILYand SMART focus onevolved protein structural families and signaling protein domains,respectively. All of this information will be present in the outputfile, comma delimited, with the name of the database separatedfrom the annotation result by an underscore.
Software availability
The MuSiC software tools, source code, and reference data are ac-cessible through our website, http://gmt.genome.wustl.edu, andare supported on Ubuntu Linux 10.04 (Lucid Lynx). Installationon all Debian-based systems will initiate automatic updates fromour software server. The MuSiC suite is also available on CPAN(http://www.cpan.org) and GitHub (https://github.com) under thenamespace ‘‘Genome’’ in both locations, and integration of MuSiCinto Galaxy (http://usegalaxy.org) is also available. A summary ofbenchmarking statistics for each MuSiC module is available in theSupplemental Material.
AcknowledgmentsWe thank the following people and groups at The Genome In-stitute: Scott Smith and Joshua F. McMichael from the AnalysisPipeline group for help packaging the software and designing thewebsite; Christopher A. Miller, John W. Wallis, David E. Larson,Christopher C. Harris, and Michael D. McLellan from the MedicalGenomics group for constructive discussions; and Devin P. Lockefor critical review of the manuscript. This work was funded bygrants to R.K.W. from the National Human Genome Research In-stitute (NHGRI U54 HG003079).
References
Abdul M, Ramlal S, Hoosein N. 2008. Ryanodine receptor expressioncorrelates with tumor grade in breast cancer. Pathol Oncol Res 14: 157–160.
Adzhubei IA, Schmidt S, Peshkin L, Ramensky VE, Gerasimova A, Bork P,Kondrashov AS, Sunyaev SR. 2010. A method and server for predictingdamaging missense mutations. Nat Methods 7: 248–249.
Ahmed AA, Etemadmoghadam D, Temple J, Lynch AG, Riad M, Sharma R,Stewart C, Fereday S, Caldas C, Defazio A, et al. 2010. Driver mutationsin TP53 are ubiquitous in high grade serous carcinoma of the ovary.J Pathol 221: 49–56.
Berman HM, Westbrook J, Feng Z, Gilliland G, Bhat TN, Weissig H,Shindyalov IN, Bourne PE. 2000. The Protein Data Bank. Nucleic AcidsRes 28: 235–242.
The Cancer Genome Atlas Research Network. 2011. Integrated genomicanalyses of ovarian carcinoma. Nature 474: 609–615.
Carter H, Samayoa J, Hruban RH, Karchin R. 2010. Prioritization of drivermutations in pancreatic cancer using cancer-specific high-throughputannotation of somatic mutations (CHASM). Cancer Biol Ther 10: 582–587.
Crompton M. 2000. Mitochondrial intermembrane junctional complexesand their role in cell death. J Physiol 529: 11–21.
Ding L, Getz G, Wheeler DA, Mardis ER, McLellan MD, Cibulskis K, SougnezC, Greulich H, Muzny DM, Morgan MB, et al. 2008. Somatic mutationsaffect key pathways in lung adenocarcinoma. Nature 455: 1069–1075.
Finn RD, Mistry J, Tate J, Coggill P, Heger A, Pollington JE, Gavin OL,Gunasekaran P, Ceric G, Forslund K, et al. 2010. The Pfam proteinfamilies database. Nucleic Acids Res 38: D211–D222.
Fisher RA. 1925. Statistical methods for research workers. Oliver and Boyd,Edinburgh, UK.
Forbes SA, Bhamra G, Bamford S, Dawson E, Kok C, Clements J, MenziesA, Teague JW, Futreal PA, Stratton MR. 2008. The catalogue ofsomatic mutations in cancer (COSMIC). Curr Protoc Hum Genet57: 10.11.1–10.11.26.
Getz G, Hofling H, Mesirov JP, Golub TR, Meyerson M, Tibshirani R, LanderES. 2007. Comment on ‘‘The consensus coding sequences of humanbreast and colorectal cancers.’’Science 317: 1500. doi: 10.1126/science.1138764.
Hall JM, Lee MK, Newman B, Morrow JE, Anderson LA, Huey B, King MC.1990. Linkage of early-onset familial breast cancer to chromosome17q21. Science 250: 1684–1689.
Joshi-Tope G, Gillespie M, Vastrik I, D’Eustachio P, Schmidt E, de Bono B,Jassal B, Gopinath GR, Wu GR, Matthews L, et al. 2005. Reactome: Aknowledgebase of biological pathways. Nucleic Acids Res 33: D428–D432.
Kaminker JS, Zhang Y, Watanabe C, Zhang Z. 2007. CanPredict: Acomputational tool for predicting cancer-associated missensemutations. Nucleic Acids Res 35: W595–W598.
MuSiC analysis tool suite
Genome Research 1597www.genome.org
Cold Spring Harbor Laboratory Press on February 17, 2014 - Published by genome.cshlp.orgDownloaded from
Kanehisa M, Goto S. 2000. KEGG: Kyoto Encyclopedia of Genes andGenomes. Nucleic Acids Res 28: 27–30.
King MC, Marks JH, Mandell JB. 2003. Breast and ovarian cancer risks due toinherited mutations in BRCA1 and BRCA2. Science 302: 643–646.
Kumar P, Henikoff S, Ng PC. 2009. Predicting the effects of coding non-synonymous variants on protein function using the SIFT algorithm. NatProtoc 4: 1073–1081.
Levine DA, Bogomolniy F, Yee CJ, Lash A, Barakat RR, Borgen PI, Boyd J.2005. Frequent mutation of the PIK3CA gene in ovarian and breastcancers. Clin Cancer Res 11: 2875–2878.
Li H, Handsaker B, Wysoker A, Fennell T, Ruan J, Homer N, Marth G,Abecasis G, Durbin R. 2009. The Sequence Alignment/Map format andSAMtools. Bioinformatics 25: 2078–2079.
Lin J, Gan CM, Zhang X, Jones S, Sjoblom T, Wood LD, Parsons DW,Papadopoulos N, Kinzler KW, Vogelstein B, et al. 2007. Amultidimensional analysis of genes mutated in breast and colorectalcancers. Genome Res 17: 1304–1318.
Mardis ER. 2011. A decade’s perspective on DNA sequencing technology.Nature 470: 198–203.
McKusick VA. 1998. Mendelian inheritance in man. A catalogue of human genesand genetic disorders. Johns Hopkins University Press, Baltimore, MD.
Miki Y, Swensen J, Shattuck-Eidens D, Futreal PA, Harshman K, Tavtigian S,Liu Q, Cochran C, Bennett LM, Ding W, et al. 1994. A strong candidatefor the breast and ovarian cancer susceptibility gene BRCA1. Science266: 66–71.
Moumne L, Batista F, Benayoun BA, Nallathambi J, Fellous M, Sundaresan P,Veitia RA. 2008. The mutations and potential targets of the forkheadtranscription factor FOXL2. Mol Cell Endocrinol 282: 2–11.
Nishimura D. 2001. BioCarta. Biotech Software and Internet Report 2: 117–120.Pal T, Permuth-Wey J, Betts JA, Krischer JP, Fiorica J, Arango H, LaPolla J,
Hoffman M, Martino MA, Wakeley K, et al. 2005. BRCA1 and BRCA2mutations account for a large proportion of ovarian carcinoma cases.Cancer 104: 2807–2816.
Reva B, Antipin Y, Sander C. 2011. Predicting the functional impact ofprotein mutations: Application to cancer genomics. Nucleic Acids Res 39:e118. doi: 10.1093/nar/gkr407.
Schultz J, Copley RR, Doerks T, Ponting CP, Bork P. 2000. SMART: A web-based tool for the study of genetically mobile domains. Nucleic Acids Res28: 231–234.
Sigal A, Rotter V. 2000. Oncogenic mutations of the p53 tumor suppressor:The demons of the guardian of the genome. Cancer Res 60: 6788–6793.
Sigrist CJ, Cerutti L, de Castro E, Langendijk-Genevaux PS, Bulliard V, BairochA, Hulo N. 2010. PROSITE, a protein domain database for functionalcharacterization and annotation. Nucleic Acids Res 38: D161–D166.
Tarca AL, Draghici S, Khatri P, Hassan SS, Mittal P, Kim JS, Kim CJ, KusanovicJP, Romero R. 2009. A novel signaling pathway impact analysis.Bioinformatics 25: 75–82.
Vaske CJ, Benz SC, Sanborn JZ, Earl D, Szeto C, Zhu J, Haussler D, Stuart JM.2010. Inference of patient-specific pathway activities from multi-dimensional cancer genomics data using PARADIGM. Bioinformatics 26:i237–i245.
Wang K, Li M, Hakonarson H. 2010a. ANNOVAR: Functional annotation ofgenetic variants from high-throughput sequencing data. Nucleic AcidsRes 38: e164. doi: 10.1093/nar/gkq.
Wang Z, Ahmad A, Li Y, Banerjee S, Kong D, Sarkar FH. 2010b. Forkhead boxM1 transcription factor: A novel target for cancer therapy. Cancer TreatRev 36: 151–156.
Wendl MC, Wallis JW, Lin L, Kandoth C, Mardis ER, Wilson RK, Ding L.2011. PathScan: A tool for discerning mutational significance in groupsof putative cancer genes. Bioinformatics 27: 1595–1602.
Wilson D, Pethica R, Zhou Y, Talbot C, Vogel C, Madera M, Chothia C, GoughJ. 2009. SUPERFAMILY—sophisticated comparative genomics, datamining, visualization and phylogeny. Nucleic Acids Res 37: D380–D386.
Received November 9, 2011; accepted in revised form May 16, 2012.
Dees et al.
1598 Genome Researchwww.genome.org
Cold Spring Harbor Laboratory Press on February 17, 2014 - Published by genome.cshlp.orgDownloaded from