Embed Size (px)
Citation preview
Mutation-induced protein interaction kinetics changesaffect apoptotic network dynamic properties andfacilitate oncogenesisLinjie Zhaoa, Tanlin Sunb, Jianfeng Peib,1, and Qi Ouyanga,b,c,1
aState Key Laboratory for Artificial Microstructures and Mesoscopic Physics, School of Physics, Peking University, Beijing 100871, China; bCenter forQuantitative Biology, Academy for Advanced Interdisciplinary Studies, Peking University, Beijing 100871, China; and cPeking-Tsinghua Center for LifeSciences, Academy for Advanced Interdisciplinary Studies, Peking University, Beijing 100871, China
Edited by José N. Onuchic, Rice University, Houston, TX, and approved June 17, 2015 (received for review February 4, 2015)
It has been a consensus in cancer research that cancer is a diseasecaused primarily by genomic alterations, especially somatic muta-tions. However, the mechanism of mutation-induced oncogenesis isnot fully understood. Here, we used the mitochondrial apoptoticpathway as a case study and performed a systematic analysis ofintegrating pathway dynamics with protein interaction kinetics toquantitatively investigate the causal molecular mechanism of muta-tion-induced oncogenesis. A mathematical model of the regulatorynetwork was constructed to establish the functional role of dynamicbifurcation in the apoptotic process. The oncogenic mutation enrich-ment of each of the protein functional domains involved was foundstrongly correlated with the parameter sensitivity of the bifurcationpoint. We further dissected the causal mechanism underlying thiscorrelation by evaluating the mutational influence on protein inter-action kinetics using molecular dynamics simulation. We analyzed 29matched mutant–wild-type and 16 matched SNP—wild-type proteinsystems. We found that the binding kinetics changes reflected by thechanges of free energy changes induced by protein interaction mu-tations, which induce variations in the sensitive parameters of thebifurcation point, were a major cause of apoptosis pathway dysfunc-tion, and mutations involved in sensitive interaction domains showhigh oncogenic potential. Our analysis provided a molecular basis forconnecting protein mutations, protein interaction kinetics, networkdynamics properties, and physiological function of a regulatorynetwork. These insights provide a framework for coupling muta-tion genotype to tumorigenesis phenotype and help elucidate thelogic of cancer initiation.
mutation-induced oncogenesis | dynamic bifurcation | parameter sensitivityanalysis | mutation enrichment | protein interaction kinetics
High-throughput whole-genome sequencing (1) and massivelyparallel technologies (2) have enabled cancer researchers to
understand that cancer is a disease caused primarily by genomicalterations, especially somatic cell mutations (3, 4). This stimu-lated extensive research endeavors to identify the landscape ofcancer-related mutations. In the last decade, studies of differenttumor types using cancer genomic and pathology analysis in-dicate that oncogenic mutations are concentrated primarily in afew core regulatory pathways that govern cell phenotypic be-haviors (5–8). These results led to the idea that “genetic aber-rations alter normal cellular regulation and then drive tumordevelopment” (9, 10). Therefore, mutation-induced oncogenesisshould be explored from a network and system perspective.A systematic interpretation of oncogenesis can be achieved in
part by analyzing interactions among mutated genes and performingfunctional annotation of cancer-related proteins in functionalpathways. A more quantitative approach is network modeling usingordinary differential equations (ODEs) and mathematical simula-tions. This well-established method has been successfully used tounderstand cellular dynamic functionalities and network regulatoryprinciples, including the relationship between genetic mutations andoncogenesis (11–15). For example, Stites et al. (14) studied com-
mon oncogenic Ras mutations that affect Ras activation. Theyperformed ODE model simulation to investigate the steady-stateRas concentration response to kinetic parameter changes and founda strong correlation between oncogenic mutations and Ras activa-tion level. Chen et al. (15) recently analyzed the p53-induced apo-ptosis model and found that parameters significantly affecting thesystem’s bifurcation points corresponded with frequently mutatedoncogenic genes. These studies demonstrate the suitability of ap-plying systems-level analysis to understand oncogenesis. However,the limitations of previous analyses are obvious. Only pure network-based dynamics analyses were conducted, in which proteins wereabstracted as theoretical nodes, structural details of interactionswere ignored, functional processes of protein conformationalchanges were oversimplified, only correlations between mutationsand dynamic properties were analyzed, and the causal molecularclues for the oncogenic function of cancer-related mutationsremained unexplored.In this study, we investigate the causal mechanisms of mutation-
induced oncogenesis by integrating network-based dynamicsmodeling with structural-based mutation analysis and moleculardynamics simulation of protein interactions. This approach enablesus to map cancer-related mutations to network dynamics changesvia protein–protein interaction kinetics. We propose that cancer-related gene mutations may change relevant protein interactionkinetics in the network, which directly change the network’s modelparameters. Subsequently, some of these disturbances may quali-tatively change system dynamics behaviors, thereby disruptingnormal cellular processes, and ultimately causing cancer.
Significance
Cancer is highly correlated with somatic mutations. Under-standing how mutation induces oncogenesis is an importanttask in cancer research. We proposed a strategy that combinednetwork-based dynamics modeling with structural-based mu-tation analysis and molecular dynamics simulation to map cancer-related mutations to network dynamics changes via protein–protein interaction kinetics. This approach identifies the oncogenicrole of mutations and subsequently determines the causal mech-anism of mutation-induced oncogenesis. This work provides aframework for coupling mutation genotype to tumorigenesisphenotype. It is also a step toward seeking more effective an-ticancer drug targets in cellular pathways.
Author contributions: L.Z., T.S., J.P., and Q.O. designed research; L.Z. and T.S. performedresearch; L.Z. and T.S. analyzed data; and L.Z., T.S., J.P., and Q.O. wrote the paper.
The authors declare no conflict of interest.
This article is a PNAS Direct Submission.
Freely available online through the PNAS open access option.1To whom correspondence may be addressed. Email: [email protected] or [email protected].
This article contains supporting information online at www.pnas.org/lookup/suppl/doi:10.1073/pnas.1502126112/-/DCSupplemental.
www.pnas.org/cgi/doi/10.1073/pnas.1502126112 PNAS Early Edition | 1 of 9
BIOPH
YSICSAND
COMPU
TATIONALBIOLO
GY
PNASPL
US
We used the mitochondrial apoptotic pathway as a case study tovalidate our hypothesis, because dysfunction of this pathway maylead to many diseases, including cancer (16). After we constructeda mathematical model for the regulatory network based on massaction kinetics, we established the functional role of dynamic bi-furcation in apoptosis and used parameter sensitivity analysis toexamine the nonuniform effect of parameter variation on thebifurcation point using techniques developed during our previouswork (15). We also investigated oncogenic mutations involved inthe network by mapping them onto 3D protein structures andidentified mutation enrichment for each protein functional do-main. We found that cancer-related mutations also have a non-uniform distribution among different functional domains, and thisdistribution is strongly correlated with the nonuniformity of pa-rameter sensitivity of the bifurcation point. We further dissectedthe causal mechanism underlying this correlation by evaluatingmutational influence on protein interaction kinetics using mo-lecular dynamics simulation. We found that the mutation-inducedbinding energy change is a major cause of parameter changes inthe regulatory network model, and the kinetics changes of proteininteractions that induce variations in the bifurcation point sensi-tive parameters are a major cause of apoptosis pathway dysfunc-tion. We identified the oncogenic role of each mutation bycombining the bifurcation point change direction due to param-eter perturbation and the binding energy change direction due tomutation disturbance and found that mutations involved in sen-sitive interactions (corresponding to sensitive parameters of thebifurcation point) are most likely oncogenic.Our approach, which couples pathway dynamics with protein
interaction kinetics, provides a molecular basis for connectionsamong protein mutations, protein interaction kinetics, networkdynamics properties, and physiological function of a regulatorynetwork. This work bridges the gap between genotype (muta-tions) and phenotype (tumorigenesis) and validates the hypoth-esis that mutation-induced abnormal changes in biologicalsystem dynamic properties may be a major cause of cancer ini-tiation and development.
ResultsModel Construction and Nonlinear Dynamics Analysis. Apoptosis is ahighly regulated process that is strongly dependent on mito-chondrial function (16). We constructed a simplified apoptoticnetwork focused primarily on the regulation of mitochondrialouter membrane permeabilization (MOMP), where cross-talkbetween intrinsic and extrinsic pathways occurs and multipleapoptotic signals culminate (17). MOMP is a primary cause ofcell apoptosis; it leads to irreversible cell death by releasingproapoptotic factors such as cytochrome c and Smac from themitochondrial intermembrane space and subsequently facilitat-ing caspase activation (18). MOMP is controlled primarily throughinteractions among Bcl-2 protein family (19). Bcl-2 family memberscan be classified into two groups: pro- and antiapoptotic factors.The former contains the following three subtypes: the MOMP ef-fectors Bax and Bak; Bax and Bak activators such as Bid and Bim;and sensitizers such as Puma and Noxa. Antiapoptotic memberssuch as Bcl-2, Bcl-xL, and A1 can be considered as inhibitors of Baxand Bak association (20).We performed extensive data survey and collection and con-
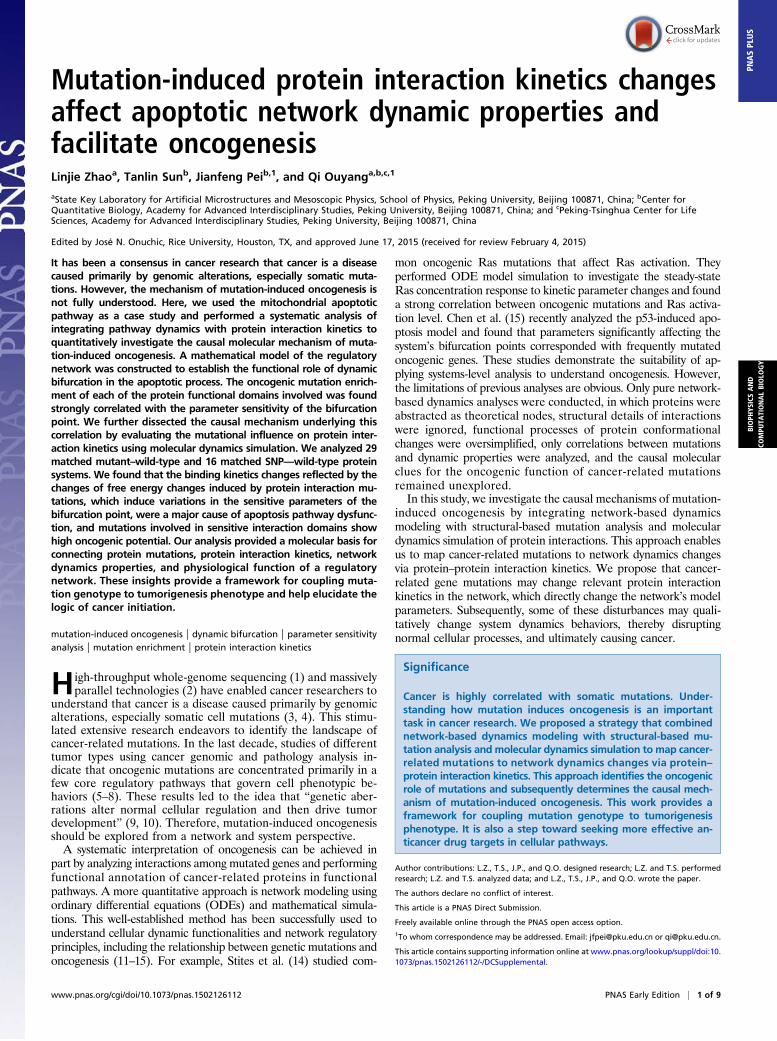
structed the MOMP core regulatory network triggered by ex-trinsic stimulus (Fig. 1). During apoptosis, initiator caspases suchas caspase8 that have been activated by the death-inducing sig-naling complex (DISC; not shown in our network) cleave Bidinto the active form tBid (21). Then, tBid promotes a series ofconformational changes in Bax, resulting in its translocation fromthe cytosol onto the mitochondrial outer membrane (MOM) (22).Active Bax monomers incrementally form oligomers and createpores in MOM, consequently causing MOMP (23). The anti-apoptotic proteins A1 and Bcl-2 bind tBid and Bax in the cyto-plasm and on the membrane to inhibit effector activation (24),whereas the membrane-bound Bax dimer undergoes autoactiva-tion to generate a positive feedback loop that enhances oligomeraccumulation (25). Puma binds to both A1 and Bcl-2 to neutralizethe inhibitors and release the effectors from the protein complex,and Noxa specifically binds to A1 (26).
Fig. 1. Extrinsic signal-induced mitochondrial apoptotic pathway. Blue lines indicate binding, red lines indicate activation, and black lines indicate con-formational transformation. Bax*, activated Bax; colon, protein complex; MOM superscript, proteins on mitochondrial outer membrane. Different functionsof Bcl2 family proteins, such as Activator, Inhibitor, Effector, and Sensitizer, are colored in red, green, yellow, and orange, respectively. Heterodimers arecolored in blue. Apoptosis is induced by activated caspase8; Bax oligomers (denoted by BaxMOM
4) create pores in the mitochondrial outer membrane, whichcauses MOMP and cell death initiation. Proteins with redundant function are compressed into a representative reactant; Bax and Bak are represented by Bax,and Bcl2, Bcl-xl, and Mcl-1 are represented by Bcl2.
2 of 9 | www.pnas.org/cgi/doi/10.1073/pnas.1502126112 Zhao et al.
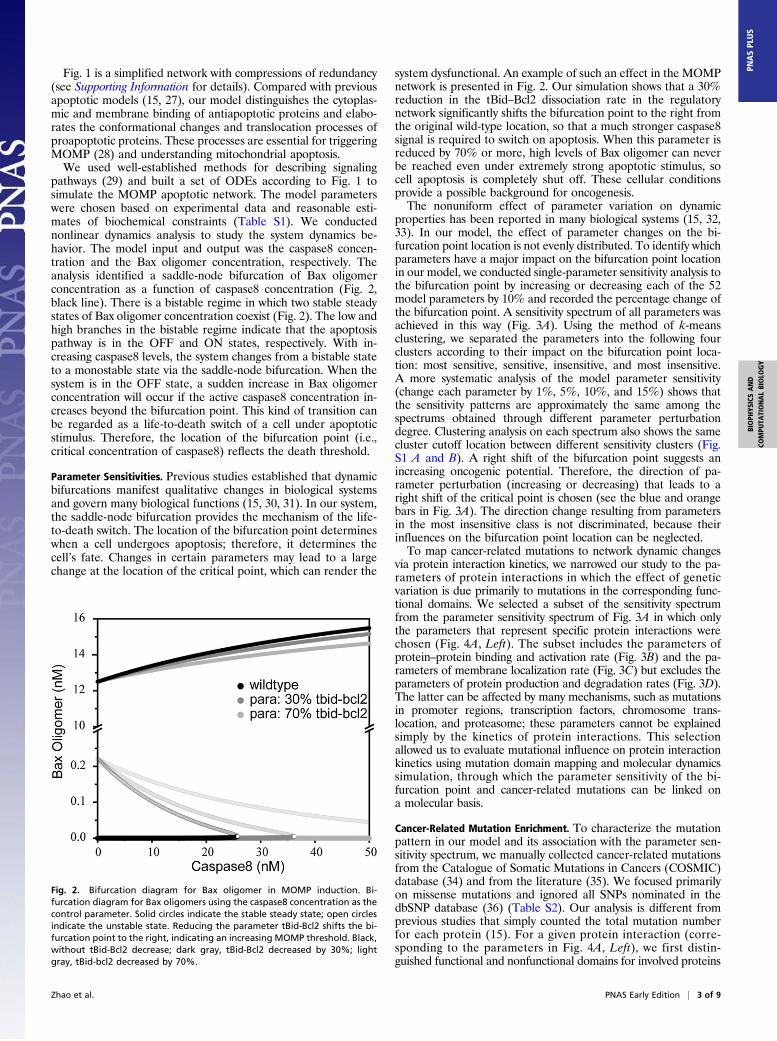
Fig. 1 is a simplified network with compressions of redundancy(see Supporting Information for details). Compared with previousapoptotic models (15, 27), our model distinguishes the cytoplas-mic and membrane binding of antiapoptotic proteins and elabo-rates the conformational changes and translocation processes ofproapoptotic proteins. These processes are essential for triggeringMOMP (28) and understanding mitochondrial apoptosis.We used well-established methods for describing signaling
pathways (29) and built a set of ODEs according to Fig. 1 tosimulate the MOMP apoptotic network. The model parameterswere chosen based on experimental data and reasonable esti-mates of biochemical constraints (Table S1). We conductednonlinear dynamics analysis to study the system dynamics be-havior. The model input and output was the caspase8 concen-tration and the Bax oligomer concentration, respectively. Theanalysis identified a saddle-node bifurcation of Bax oligomerconcentration as a function of caspase8 concentration (Fig. 2,black line). There is a bistable regime in which two stable steadystates of Bax oligomer concentration coexist (Fig. 2). The low andhigh branches in the bistable regime indicate that the apoptosispathway is in the OFF and ON states, respectively. With in-creasing caspase8 levels, the system changes from a bistable stateto a monostable state via the saddle-node bifurcation. When thesystem is in the OFF state, a sudden increase in Bax oligomerconcentration will occur if the active caspase8 concentration in-creases beyond the bifurcation point. This kind of transition canbe regarded as a life-to-death switch of a cell under apoptoticstimulus. Therefore, the location of the bifurcation point (i.e.,critical concentration of caspase8) reflects the death threshold.
Parameter Sensitivities. Previous studies established that dynamicbifurcations manifest qualitative changes in biological systemsand govern many biological functions (15, 30, 31). In our system,the saddle-node bifurcation provides the mechanism of the life-to-death switch. The location of the bifurcation point determineswhen a cell undergoes apoptosis; therefore, it determines thecell’s fate. Changes in certain parameters may lead to a largechange at the location of the critical point, which can render the
system dysfunctional. An example of such an effect in the MOMPnetwork is presented in Fig. 2. Our simulation shows that a 30%reduction in the tBid–Bcl2 dissociation rate in the regulatorynetwork significantly shifts the bifurcation point to the right fromthe original wild-type location, so that a much stronger caspase8signal is required to switch on apoptosis. When this parameter isreduced by 70% or more, high levels of Bax oligomer can neverbe reached even under extremely strong apoptotic stimulus, socell apoptosis is completely shut off. These cellular conditionsprovide a possible background for oncogenesis.The nonuniform effect of parameter variation on dynamic
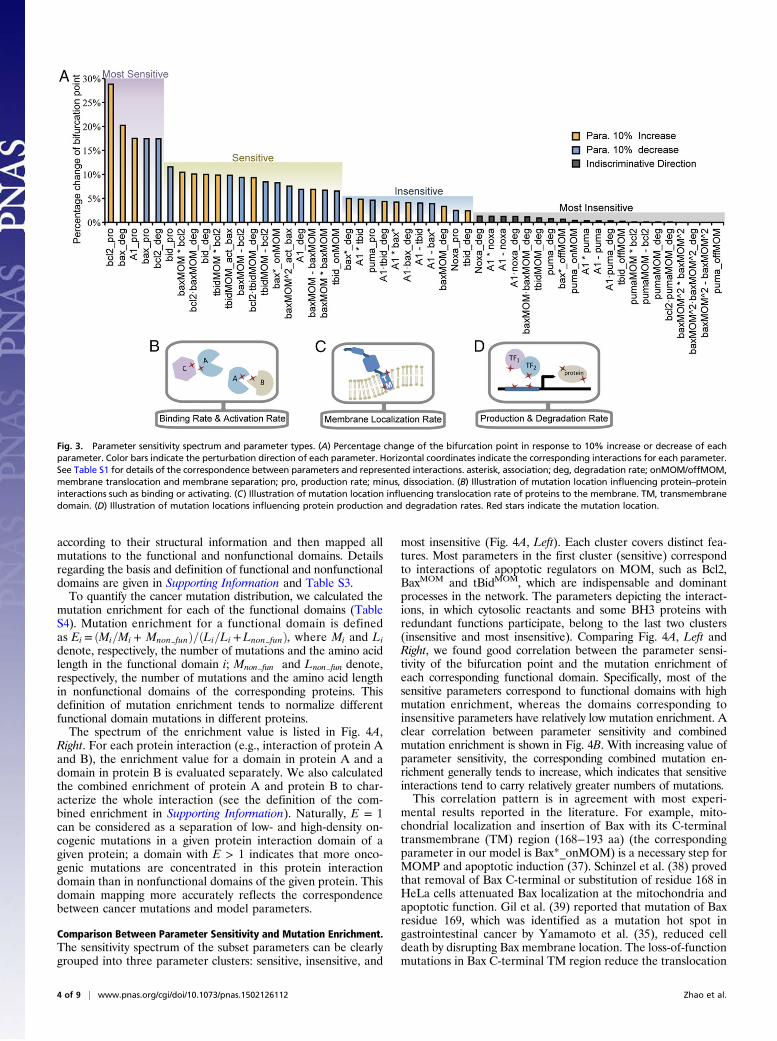
properties has been reported in many biological systems (15, 32,33). In our model, the effect of parameter changes on the bi-furcation point location is not evenly distributed. To identify whichparameters have a major impact on the bifurcation point locationin our model, we conducted single-parameter sensitivity analysis tothe bifurcation point by increasing or decreasing each of the 52model parameters by 10% and recorded the percentage change ofthe bifurcation point. A sensitivity spectrum of all parameters wasachieved in this way (Fig. 3A). Using the method of k-meansclustering, we separated the parameters into the following fourclusters according to their impact on the bifurcation point loca-tion: most sensitive, sensitive, insensitive, and most insensitive.A more systematic analysis of the model parameter sensitivity(change each parameter by 1%, 5%, 10%, and 15%) shows thatthe sensitivity patterns are approximately the same among thespectrums obtained through different parameter perturbationdegree. Clustering analysis on each spectrum also shows the samecluster cutoff location between different sensitivity clusters (Fig.S1 A and B). A right shift of the bifurcation point suggests anincreasing oncogenic potential. Therefore, the direction of pa-rameter perturbation (increasing or decreasing) that leads to aright shift of the critical point is chosen (see the blue and orangebars in Fig. 3A). The direction change resulting from parametersin the most insensitive class is not discriminated, because theirinfluences on the bifurcation point location can be neglected.To map cancer-related mutations to network dynamic changes
via protein interaction kinetics, we narrowed our study to the pa-rameters of protein interactions in which the effect of geneticvariation is due primarily to mutations in the corresponding func-tional domains. We selected a subset of the sensitivity spectrumfrom the parameter sensitivity spectrum of Fig. 3A in which onlythe parameters that represent specific protein interactions werechosen (Fig. 4A, Left). The subset includes the parameters ofprotein–protein binding and activation rate (Fig. 3B) and the pa-rameters of membrane localization rate (Fig. 3C) but excludes theparameters of protein production and degradation rates (Fig. 3D).The latter can be affected by many mechanisms, such as mutationsin promoter regions, transcription factors, chromosome trans-location, and proteasome; these parameters cannot be explainedsimply by the kinetics of protein interactions. This selectionallowed us to evaluate mutational influence on protein interactionkinetics using mutation domain mapping and molecular dynamicssimulation, through which the parameter sensitivity of the bi-furcation point and cancer-related mutations can be linked ona molecular basis.
Cancer-Related Mutation Enrichment. To characterize the mutationpattern in our model and its association with the parameter sen-sitivity spectrum, we manually collected cancer-related mutationsfrom the Catalogue of Somatic Mutations in Cancers (COSMIC)database (34) and from the literature (35). We focused primarilyon missense mutations and ignored all SNPs nominated in thedbSNP database (36) (Table S2). Our analysis is different fromprevious studies that simply counted the total mutation numberfor each protein (15). For a given protein interaction (corre-sponding to the parameters in Fig. 4A, Left), we first distin-guished functional and nonfunctional domains for involved proteins
Fig. 2. Bifurcation diagram for Bax oligomer in MOMP induction. Bi-furcation diagram for Bax oligomers using the caspase8 concentration as thecontrol parameter. Solid circles indicate the stable steady state; open circlesindicate the unstable state. Reducing the parameter tBid-Bcl2 shifts the bi-furcation point to the right, indicating an increasing MOMP threshold. Black,without tBid-Bcl2 decrease; dark gray, tBid-Bcl2 decreased by 30%; lightgray, tBid-bcl2 decreased by 70%.
Zhao et al. PNAS Early Edition | 3 of 9
BIOPH
YSICSAND
COMPU
TATIONALBIOLO
GY
PNASPL
US
according to their structural information and then mapped allmutations to the functional and nonfunctional domains. Detailsregarding the basis and definition of functional and nonfunctionaldomains are given in Supporting Information and Table S3.To quantify the cancer mutation distribution, we calculated the
mutation enrichment for each of the functional domains (TableS4). Mutation enrichment for a functional domain is definedas Ei = ðMi=Mi + Mnon funÞ=ðLi=Li +Lnon funÞ, where Mi and Lidenote, respectively, the number of mutations and the amino acidlength in the functional domain i; Mnon fun and Lnon fun denote,respectively, the number of mutations and the amino acid lengthin nonfunctional domains of the corresponding proteins. Thisdefinition of mutation enrichment tends to normalize differentfunctional domain mutations in different proteins.The spectrum of the enrichment value is listed in Fig. 4A,
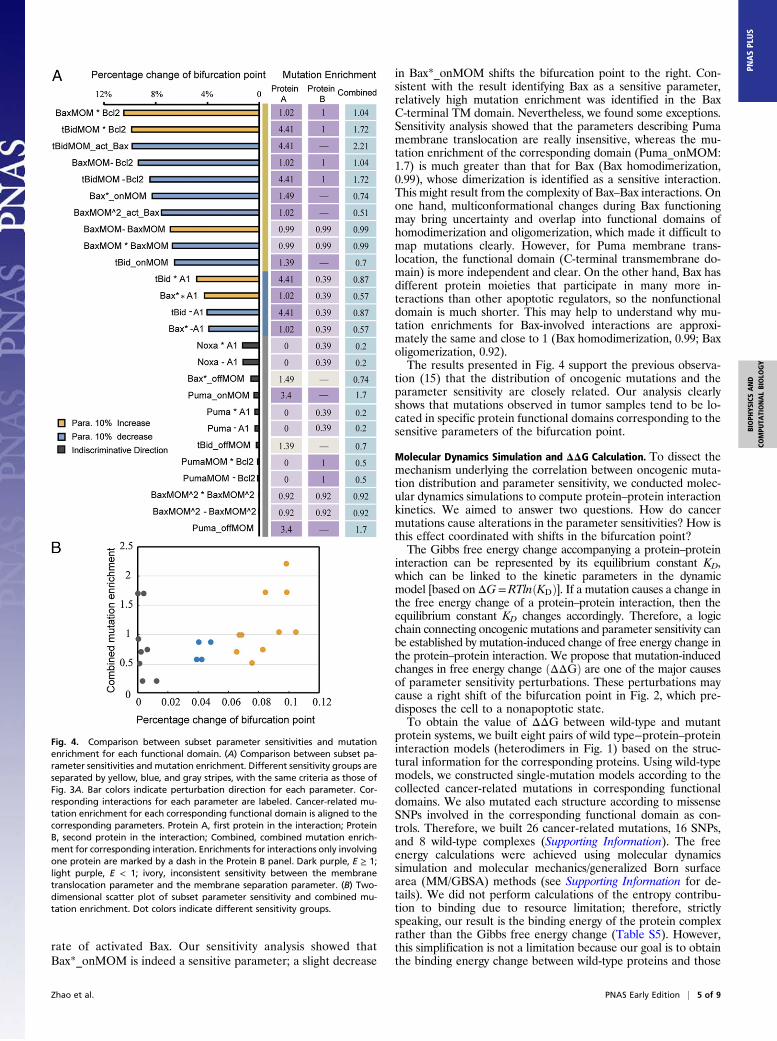
Right. For each protein interaction (e.g., interaction of protein Aand B), the enrichment value for a domain in protein A and adomain in protein B is evaluated separately. We also calculatedthe combined enrichment of protein A and protein B to char-acterize the whole interaction (see the definition of the com-bined enrichment in Supporting Information). Naturally, E = 1can be considered as a separation of low- and high-density on-cogenic mutations in a given protein interaction domain of agiven protein; a domain with E > 1 indicates that more onco-genic mutations are concentrated in this protein interactiondomain than in nonfunctional domains of the given protein. Thisdomain mapping more accurately reflects the correspondencebetween cancer mutations and model parameters.
Comparison Between Parameter Sensitivity and Mutation Enrichment.The sensitivity spectrum of the subset parameters can be clearlygrouped into three parameter clusters: sensitive, insensitive, and
most insensitive (Fig. 4A, Left). Each cluster covers distinct fea-tures. Most parameters in the first cluster (sensitive) correspondto interactions of apoptotic regulators on MOM, such as Bcl2,BaxMOM and tBidMOM, which are indispensable and dominantprocesses in the network. The parameters depicting the interact-ions, in which cytosolic reactants and some BH3 proteins withredundant functions participate, belong to the last two clusters(insensitive and most insensitive). Comparing Fig. 4A, Left andRight, we found good correlation between the parameter sensi-tivity of the bifurcation point and the mutation enrichment ofeach corresponding functional domain. Specifically, most of thesensitive parameters correspond to functional domains with highmutation enrichment, whereas the domains corresponding toinsensitive parameters have relatively low mutation enrichment. Aclear correlation between parameter sensitivity and combinedmutation enrichment is shown in Fig. 4B. With increasing value ofparameter sensitivity, the corresponding combined mutation en-richment generally tends to increase, which indicates that sensitiveinteractions tend to carry relatively greater numbers of mutations.This correlation pattern is in agreement with most experi-
mental results reported in the literature. For example, mito-chondrial localization and insertion of Bax with its C-terminaltransmembrane (TM) region (168−193 aa) (the correspondingparameter in our model is Bax*_onMOM) is a necessary step forMOMP and apoptotic induction (37). Schinzel et al. (38) provedthat removal of Bax C-terminal or substitution of residue 168 inHeLa cells attenuated Bax localization at the mitochondria andapoptotic function. Gil et al. (39) reported that mutation of Baxresidue 169, which was identified as a mutation hot spot ingastrointestinal cancer by Yamamoto et al. (35), reduced celldeath by disrupting Bax membrane location. The loss-of-functionmutations in Bax C-terminal TM region reduce the translocation
Fig. 3. Parameter sensitivity spectrum and parameter types. (A) Percentage change of the bifurcation point in response to 10% increase or decrease of eachparameter. Color bars indicate the perturbation direction of each parameter. Horizontal coordinates indicate the corresponding interactions for each parameter.See Table S1 for details of the correspondence between parameters and represented interactions. asterisk, association; deg, degradation rate; onMOM/offMOM,membrane translocation and membrane separation; pro, production rate; minus, dissociation. (B) Illustration of mutation location influencing protein–proteininteractions such as binding or activating. (C) Illustration of mutation location influencing translocation rate of proteins to the membrane. TM, transmembranedomain. (D) Illustration of mutation locations influencing protein production and degradation rates. Red stars indicate the mutation location.
4 of 9 | www.pnas.org/cgi/doi/10.1073/pnas.1502126112 Zhao et al.
rate of activated Bax. Our sensitivity analysis showed thatBax*_onMOM is indeed a sensitive parameter; a slight decrease
in Bax*_onMOM shifts the bifurcation point to the right. Con-sistent with the result identifying Bax as a sensitive parameter,relatively high mutation enrichment was identified in the BaxC-terminal TM domain. Nevertheless, we found some exceptions.Sensitivity analysis showed that the parameters describing Pumamembrane translocation are really insensitive, whereas the mu-tation enrichment of the corresponding domain (Puma_onMOM:1.7) is much greater than that for Bax (Bax homodimerization,0.99), whose dimerization is identified as a sensitive interaction.This might result from the complexity of Bax–Bax interactions. Onone hand, multiconformational changes during Bax functioningmay bring uncertainty and overlap into functional domains ofhomodimerization and oligomerization, which made it difficult tomap mutations clearly. However, for Puma membrane trans-location, the functional domain (C-terminal transmembrane do-main) is more independent and clear. On the other hand, Bax hasdifferent protein moieties that participate in many more in-teractions than other apoptotic regulators, so the nonfunctionaldomain is much shorter. This may help to understand why mu-tation enrichments for Bax-involved interactions are approxi-mately the same and close to 1 (Bax homodimerization, 0.99; Baxoligomerization, 0.92).The results presented in Fig. 4 support the previous observa-
tion (15) that the distribution of oncogenic mutations and theparameter sensitivity are closely related. Our analysis clearlyshows that mutations observed in tumor samples tend to be lo-cated in specific protein functional domains corresponding to thesensitive parameters of the bifurcation point.
Molecular Dynamics Simulation and ΔΔG Calculation. To dissect themechanism underlying the correlation between oncogenic muta-tion distribution and parameter sensitivity, we conducted molec-ular dynamics simulations to compute protein–protein interactionkinetics. We aimed to answer two questions. How do cancermutations cause alterations in the parameter sensitivities? How isthis effect coordinated with shifts in the bifurcation point?The Gibbs free energy change accompanying a protein–protein
interaction can be represented by its equilibrium constant KD,which can be linked to the kinetic parameters in the dynamicmodel [based on ΔG=RTlnðKDÞ]. If a mutation causes a change inthe free energy change of a protein–protein interaction, then theequilibrium constant KD changes accordingly. Therefore, a logicchain connecting oncogenic mutations and parameter sensitivity canbe established by mutation-induced change of free energy change inthe protein–protein interaction. We propose that mutation-inducedchanges in free energy change ðΔΔGÞ are one of the major causesof parameter sensitivity perturbations. These perturbations maycause a right shift of the bifurcation point in Fig. 2, which pre-disposes the cell to a nonapoptotic state.To obtain the value of ΔΔG between wild-type and mutant
protein systems, we built eight pairs of wild type−protein–proteininteraction models (heterodimers in Fig. 1) based on the struc-tural information for the corresponding proteins. Using wild-typemodels, we constructed single-mutation models according to thecollected cancer-related mutations in corresponding functionaldomains. We also mutated each structure according to missenseSNPs involved in the corresponding functional domain as con-trols. Therefore, we built 26 cancer-related mutations, 16 SNPs,and 8 wild-type complexes (Supporting Information). The freeenergy calculations were achieved using molecular dynamicssimulation and molecular mechanics/generalized Born surfacearea (MM/GBSA) methods (see Supporting Information for de-tails). We did not perform calculations of the entropy contribu-tion to binding due to resource limitation; therefore, strictlyspeaking, our result is the binding energy of the protein complexrather than the Gibbs free energy change (Table S5). However,this simplification is not a limitation because our goal is to obtainthe binding energy change between wild-type proteins and those
Fig. 4. Comparison between subset parameter sensitivities and mutationenrichment for each functional domain. (A) Comparison between subset pa-rameter sensitivities and mutation enrichment. Different sensitivity groups areseparated by yellow, blue, and gray stripes, with the same criteria as those ofFig. 3A. Bar colors indicate perturbation direction for each parameter. Cor-responding interactions for each parameter are labeled. Cancer-related mu-tation enrichment for each corresponding functional domain is aligned to thecorresponding parameters. Protein A, first protein in the interaction; ProteinB, second protein in the interaction; Combined, combined mutation enrich-ment for corresponding interation. Enrichments for interactions only involvingone protein are marked by a dash in the Protein B panel. Dark purple, E ≥ 1;light purple, E < 1; ivory, inconsistent sensitivity between the membranetranslocation parameter and the membrane separation parameter. (B) Two-dimensional scatter plot of subset parameter sensitivity and combined mu-tation enrichment. Dot colors indicate different sensitivity groups.
Zhao et al. PNAS Early Edition | 5 of 9
BIOPH
YSICSAND
COMPU
TATIONALBIOLO
GY
PNASPL
US
with single point mutations, which are very similar in structure. Inmost cases, the entropy difference can be ignored.The ΔΔG calculation results for matched mutant/SNP–wild
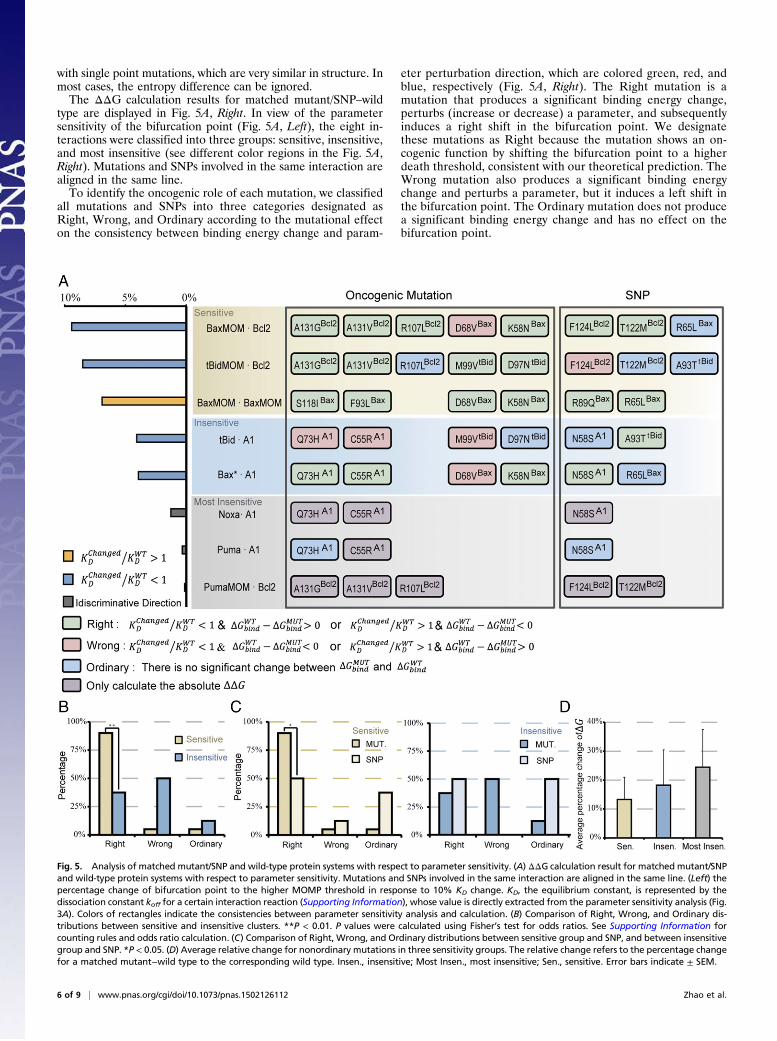
type are displayed in Fig. 5A, Right. In view of the parametersensitivity of the bifurcation point (Fig. 5A, Left), the eight in-teractions were classified into three groups: sensitive, insensitive,and most insensitive (see different color regions in the Fig. 5A,Right). Mutations and SNPs involved in the same interaction arealigned in the same line.To identify the oncogenic role of each mutation, we classified
all mutations and SNPs into three categories designated asRight, Wrong, and Ordinary according to the mutational effecton the consistency between binding energy change and param-
eter perturbation direction, which are colored green, red, andblue, respectively (Fig. 5A, Right). The Right mutation is amutation that produces a significant binding energy change,perturbs (increase or decrease) a parameter, and subsequentlyinduces a right shift in the bifurcation point. We designatethese mutations as Right because the mutation shows an on-cogenic function by shifting the bifurcation point to a higherdeath threshold, consistent with our theoretical prediction. TheWrong mutation also produces a significant binding energychange and perturbs a parameter, but it induces a left shift inthe bifurcation point. The Ordinary mutation does not producea significant binding energy change and has no effect on thebifurcation point.
Fig. 5. Analysis of matched mutant/SNP and wild-type protein systems with respect to parameter sensitivity. (A) ΔΔG calculation result for matched mutant/SNPand wild-type protein systems with respect to parameter sensitivity. Mutations and SNPs involved in the same interaction are aligned in the same line. (Left) thepercentage change of bifurcation point to the higher MOMP threshold in response to 10% KD change. KD, the equilibrium constant, is represented by thedissociation constant koff for a certain interaction reaction (Supporting Information), whose value is directly extracted from the parameter sensitivity analysis (Fig.3A). Colors of rectangles indicate the consistencies between parameter sensitivity analysis and calculation. (B) Comparison of Right, Wrong, and Ordinary dis-tributions between sensitive and insensitive clusters. **P < 0.01. P values were calculated using Fisher’s test for odds ratios. See Supporting Information forcounting rules and odds ratio calculation. (C) Comparison of Right, Wrong, and Ordinary distributions between sensitive group and SNP, and between insensitivegroup and SNP. *P < 0.05. (D) Average relative change for nonordinary mutations in three sensitivity groups. The relative change refers to the percentage changefor a matched mutant−wild type to the corresponding wild type. Insen., insensitive; Most Insen., most insensitive; Sen., sensitive. Error bars indicate ± SEM.
6 of 9 | www.pnas.org/cgi/doi/10.1073/pnas.1502126112 Zhao et al.
Parameter sensitivity analysis of the bifurcation point iden-tifies two types of parameter perturbation that can in-duce a right shift of the bifurcation point: those that increase KD(KChanged
D =KWTD > 1, orange bar in Fig. 5A, Left), and those that
decrease KD (KChangedD =KWT
D < 1, blue bar in Fig. 5A, Left).Therefore, based on ΔG=RTlnðKDÞ, in cases of increase KD, aRight mutation should satisfyΔGWT
bind −ΔGMUTbind < 0; otherwise it is
a “Wrong” mutation. In cases of decrease KD, a Right mutationshould satisfy ΔGWT
bind −ΔGMUTbind > 0, otherwise it is a Wrong mu-
tation. For mutations involved in the most insensitive group, weonly calculated the absolute value of ΔΔG owing to the un-definable sensitivity direction (Table S6).Fig. 5A shows that the Right, Wrong, and Ordinary mutations/
SNPs are not evenly distributed in different sensitivity groups.Statistical analyses of the Right, Wrong, and Ordinary mutationdistributions of the first two sensitivity groups are shown in Fig. 5B and C. Of 20 total mutations in the sensitive interactions, wefound that 90% were Right mutations (Fig. 5B), which was sig-nificantly higher than that in insensitive interactions (37.5%)(P < 0.01, Fisher’s test). Fig. 5C, Left shows that the Right mu-tations in sensitive interactions (90%) were greater than those inSNPs (40%) (P < 0.05, Fisher’s test). This tendency was notobserved in the insensitive group (Fig. 5C, Right). These resultssuggest that mutations in sensitive domains have high enrich-ment values and strong oncogenic function, whereas mutationsin insensitive domains behave more like harmless SNPs.To explore the mutational influence on wild-type binding en-
ergy in different sensitivity groups, we calculated the averagerelative change of binding energy ðΔΔGÞ for each nonordinarymutation in three sensitivity groups (Fig. 5D). The resultsshowed a clearly increasing tendency of binding energy changefrom sensitive to most insensitive class. This suggests a distinctselection threshold for mutations in domains with differentsensitivity. Sensitive parameters provide key regulatory positionsin the regulatory network; a slight perturbation caused by amutation will lead to qualitative changes in network behavior.Therefore, if we assume that each gene in the cell mutates moreor less randomly (40), mutations occurring in sensitive domainstend to be selected out and reserved more easily than those innonsensitive domains during the process of tumor evolution.It is consistent with the experimental results that most of the
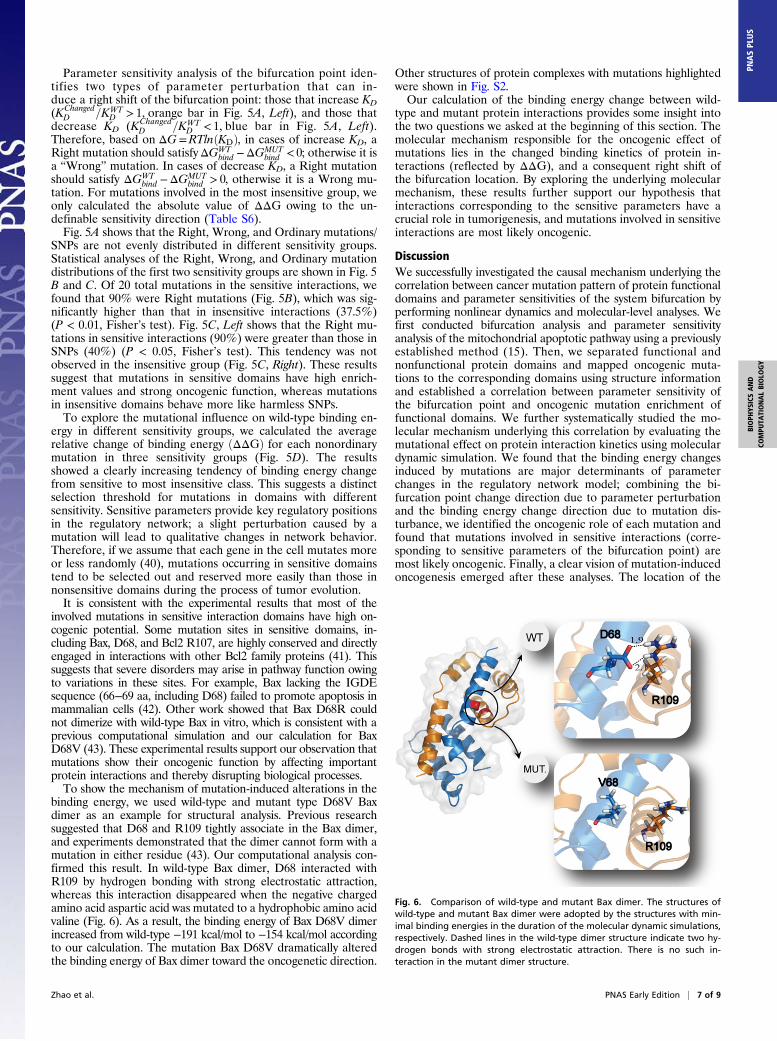
involved mutations in sensitive interaction domains have high on-cogenic potential. Some mutation sites in sensitive domains, in-cluding Bax, D68, and Bcl2 R107, are highly conserved and directlyengaged in interactions with other Bcl2 family proteins (41). Thissuggests that severe disorders may arise in pathway function owingto variations in these sites. For example, Bax lacking the IGDEsequence (66−69 aa, including D68) failed to promote apoptosis inmammalian cells (42). Other work showed that Bax D68R couldnot dimerize with wild-type Bax in vitro, which is consistent with aprevious computational simulation and our calculation for BaxD68V (43). These experimental results support our observation thatmutations show their oncogenic function by affecting importantprotein interactions and thereby disrupting biological processes.To show the mechanism of mutation-induced alterations in the
binding energy, we used wild-type and mutant type D68V Baxdimer as an example for structural analysis. Previous researchsuggested that D68 and R109 tightly associate in the Bax dimer,and experiments demonstrated that the dimer cannot form with amutation in either residue (43). Our computational analysis con-firmed this result. In wild-type Bax dimer, D68 interacted withR109 by hydrogen bonding with strong electrostatic attraction,whereas this interaction disappeared when the negative chargedamino acid aspartic acid was mutated to a hydrophobic amino acidvaline (Fig. 6). As a result, the binding energy of Bax D68V dimerincreased from wild-type −191 kcal/mol to −154 kcal/mol accordingto our calculation. The mutation Bax D68V dramatically alteredthe binding energy of Bax dimer toward the oncogenetic direction.
Other structures of protein complexes with mutations highlightedwere shown in Fig. S2.Our calculation of the binding energy change between wild-
type and mutant protein interactions provides some insight intothe two questions we asked at the beginning of this section. Themolecular mechanism responsible for the oncogenic effect ofmutations lies in the changed binding kinetics of protein in-teractions (reflected by ΔΔG), and a consequent right shift ofthe bifurcation location. By exploring the underlying molecularmechanism, these results further support our hypothesis thatinteractions corresponding to the sensitive parameters have acrucial role in tumorigenesis, and mutations involved in sensitiveinteractions are most likely oncogenic.
DiscussionWe successfully investigated the causal mechanism underlying thecorrelation between cancer mutation pattern of protein functionaldomains and parameter sensitivities of the system bifurcation byperforming nonlinear dynamics and molecular-level analyses. Wefirst conducted bifurcation analysis and parameter sensitivityanalysis of the mitochondrial apoptotic pathway using a previouslyestablished method (15). Then, we separated functional andnonfunctional protein domains and mapped oncogenic muta-tions to the corresponding domains using structure informationand established a correlation between parameter sensitivity ofthe bifurcation point and oncogenic mutation enrichment offunctional domains. We further systematically studied the mo-lecular mechanism underlying this correlation by evaluating themutational effect on protein interaction kinetics using moleculardynamic simulation. We found that the binding energy changesinduced by mutations are major determinants of parameterchanges in the regulatory network model; combining the bi-furcation point change direction due to parameter perturbationand the binding energy change direction due to mutation dis-turbance, we identified the oncogenic role of each mutation andfound that mutations involved in sensitive interactions (corre-sponding to sensitive parameters of the bifurcation point) aremost likely oncogenic. Finally, a clear vision of mutation-inducedoncogenesis emerged after these analyses. The location of the
Fig. 6. Comparison of wild-type and mutant Bax dimer. The structures ofwild-type and mutant Bax dimer were adopted by the structures with min-imal binding energies in the duration of the molecular dynamic simulations,respectively. Dashed lines in the wild-type dimer structure indicate two hy-drogen bonds with strong electrostatic attraction. There is no such in-teraction in the mutant dimer structure.
Zhao et al. PNAS Early Edition | 7 of 9
BIOPH
YSICSAND
COMPU
TATIONALBIOLO
GY
PNASPL
US
saddle-node bifurcation point represents a MOMP threshold; ifthis threshold is exceeded, the system switches on apoptosis.Oncogenic mutations may increase this threshold by introducingsignificant changes in binding kinetics between key regulators.Consequently, the death switch is averted and cells can evadeapoptosis. These conditions may enable oncogenesis.The correlation between domain mutation enrichment spectrum
and parameter sensitivity spectrum of the bifurcation point sug-gests that bifurcation point perturbation is a good measure topredict causal genes and mutations in cancer. Stites et al. (14)proposed a protein-level, perturbation-based analysis of unregu-lated Ras activation associated with cancer and successfully ex-plained the correlation between Ras mutation properties and theknown pathological mechanisms of Ras signaling activation. In ouropinion, the selection of different dynamic features should not beconsidered as an inconsistency; the specific biological function tobe embodied should be taken into account. For apoptosis, G1/Stransition or any other checkpoint-like processes, such as epithelial-to-mesenchymal transition, induce bifurcation behaviors reflectingthe qualitative change of a system. This is a good measure fordescribing the switch-like cell fate decision from a dynamic point ofview. The steady-state level of certain protein species (reflectingprotein concentration) is more precise for evaluating signal trans-duction pathways that require proper concentrations of active ki-nases for activation (44). Considering these aspects, our analysisalso can be applied to any apoptotic response pathways that sharesimilar interaction topology and key regulators, with a bifurcationbehavior as the pathway functional property.The parameters in network analysis include binding/unbind-
ing kinetic rates. Therefore, binding energy, a reflection of theequilibrium constant KD, is not a direct indicator of networkparameters. In this work, we assumed that the mutation effect onKD is due primarily to the change of koff (Fig. 5A, Left), con-sidering that kon is described based on diffusion rules and long-range force, which will not be significantly influenced by singlemutation, whereas koff is determined primarily by short-rangeinteractions (ionic interactions, hydrogen bonds, and hydropho-bic interaction) and is more likely to change due to amino acidvariation (45). Our parameter sensitivity analysis also shows thateven if the mutation has a significant effect on kon under certainconditions it also would not bring discordance to the originalresults (Supporting Information). It will be more precise if we canspecify the mechanisms of kinetic parameter change. Tiwaryet al. (46) recently developed a method to calculate koff of theinteraction between a protein and its small molecule ligand. Thismethod is based on metadynamics, which samples as manyconfigurations as possible to rebuild the different binding phases
at a large timescale. However, this method is not applicable forprotein complex simulations with large sample space, and theaccuracy is limited. Therefore, the method of calculating kineticrates of protein–protein interactions by molecular dynamicssimulation is at a very early stage. We hope this method will befully developed in the future to further facilitate investigationssuch as the present study.Our study selected a subset of parameters that represent spe-
cific protein interactions, including binding and membrane trans-location, for analysis. The structural information of those selectedprotein interactions has been reported; therefore, we accuratelymapped mutations to interaction domains and established thecorrespondence between mutations and model parameters. Fur-ther calculations also depended on structural information for theprotein interactions. Some important factors were excluded fromthis analysis because sufficient information on the molecularmechanisms and interaction structures was not currently available.Nonexon mutations (47), transcription factor mutations (48), andproteasome mutations (49), which often affect protein expressionlevels and protein degradation processes and play important rolesin cancer development, were out of the scope of our study,whereas we find some consistency between sensitivity of these kindof parameters and corresponding oncogenetic aberrations (Sup-porting Information). An analysis including those factors couldprovide a more complete picture of oncogenesis.
Materials and MethodsEquations for the Mitochondrial Apoptotic Network. We compiled a set ofODEs (Supporting Information) to model the mitochondrial apoptotic net-work induced by extrinsic death signals.
Cancer Mutation, SNP, and Protein Structure Database. All mutations in ouranalysis were obtained from COSMIC and literature. The missense SNPs wereobtained from dbSNP. Some initial structure of wild-type protein complexeswere obtained from Protein Data Bank (www.rcsb.org/pdb/home/home.do),and some were obtained by molecular replacement (Supporting Information).
Molecular Dynamics Simulation and MM/GBSA Method. All molecular dynamicssimulations were performed using Amber software (version 11). Single tra-jectories were used to calculate the binding energy and residue energydecomposition using the MM/GBSA algorithm in AmberTools12 (SupportingInformation).
ACKNOWLEDGMENTS. We thank J. Chen, L. H. Lai, F. J. Chen, X. M. Ma, D. Q. Yu,Y. S. Cao, H. Y. Fang, Z. W. Xie, X. Zhao, B. Shao, J. Y. Xi, H. L. Wang, and F. T.Li for helpful discussions. This work was partially supported by NationalNatural Science Foundation of China Grants 11074009 and 81273436 andChinese Ministry of Science and Technology Grants 2012AA02A702 and2012AA020301.
1. Kandoth C, et al. (2013) Mutational landscape and significance across 12 major cancertypes. Nature 502(7471):333–339.
2. Dahl F, et al. (2007) Multigene amplification and massively parallel sequencing forcancer mutation discovery. Proc Natl Acad Sci USA 104(22):9387–9392.
3. Alexandrov LB, et al.; Australian Pancreatic Cancer Genome Initiative; ICGC BreastCancer Consortium; ICGC MMML-Seq Consortium; ICGC PedBrain (2013) Signatures ofmutational processes in human cancer. Nature 500(7463):415–421.
4. Stratton MR, Campbell PJ, Futreal PA (2009) The cancer genome. Nature 458(7239):719–724.
5. Jones S, et al. (2008) Core signaling pathways in human pancreatic cancers revealed byglobal genomic analyses. Science 321(5897):1801–1806.
6. Ding L, et al. (2008) Somatic mutations affect key pathways in lung adenocarcinoma.Nature 455(7216):1069–1075.
7. Cancer Genome Atlas Research Network (2008) Comprehensive genomic character-ization defines human glioblastoma genes and core pathways. Nature 455(7216):1061–1068.
8. Bild AH, Potti A, Nevins JR (2006) Linking oncogenic pathways with therapeutic op-portunities. Nat Rev Cancer 6(9):735–741.
9. Pe’er D, Hacohen N (2011) Principles and strategies for developing network models incancer. Cell 144(6):864–873.
10. Kreeger PK, Lauffenburger DA (2010) Cancer systems biology: A network modelingperspective. Carcinogenesis 31(1):2–8.
11. Ferrell JE, Jr, Tsai TY, Yang Q (2011) Modeling the cell cycle: Why do certain circuitsoscillate? Cell 144(6):874–885.
12. Zhang XP, Liu F, Cheng Z, Wang W (2009) Cell fate decision mediated by p53 pulses.Proc Natl Acad Sci USA 106(30):12245–12250.
13. Ma W, Trusina A, El-Samad H, Lim WA, Tang C (2009) Defining network topologiesthat can achieve biochemical adaptation. Cell 138(4):760–773.
14. Stites EC, Trampont PC, Ma Z, Ravichandran KS (2007) Network analysis of oncogenicRas activation in cancer. Science 318(5849):463–467.
15. Chen J, Yue H, Ouyang Q (2014) Correlation between oncogenic mutations andparameter sensitivity of the apoptosis pathway model. PLOS Comput Biol 10(1):e1003451.
16. Tait SW, Green DR (2010) Mitochondria and cell death: Outer membrane per-meabilization and beyond. Nat Rev Mol Cell Biol 11(9):621–632.
17. Spencer SL, Sorger PK (2011) Measuring and modeling apoptosis in single cells. Cell144(6):926–939.
18. Chipuk JE, Bouchier-Hayes L, Green DR (2006) Mitochondrial outer membrane per-meabilization during apoptosis: The innocent bystander scenario. Cell Death Differ13(8):1396–1402.
19. Llambi F, Green DR (2011) Apoptosis and oncogenesis: Give and take in the BCL-2family. Curr Opin Genet Dev 21(1):12–20.
20. Youle RJ, Strasser A (2008) The BCL-2 protein family: Opposing activities that mediatecell death. Nat Rev Mol Cell Biol 9(1):47–59.
21. Li H, Zhu H, Xu CJ, Yuan J (1998) Cleavage of BID by caspase 8 mediates the mito-chondrial damage in the Fas pathway of apoptosis. Cell 94(4):491–501.
22. Lovell JF, et al. (2008) Membrane binding by tBid initiates an ordered series of eventsculminating in membrane permeabilization by Bax. Cell 135(6):1074–1084.
8 of 9 | www.pnas.org/cgi/doi/10.1073/pnas.1502126112 Zhao et al.
23. Kim H, et al. (2009) Stepwise activation of BAX and BAK by tBID, BIM, and PUMAinitiates mitochondrial apoptosis. Mol Cell 36(3):487–499.
24. Hsu Y-T, Wolter KG, Youle RJ (1997) Cytosol-to-membrane redistribution of Bax andBcl-X(L) during apoptosis. Proc Natl Acad Sci USA 94(8):3668–3672.
25. Tan C, et al. (2006) Auto-activation of the apoptosis protein Bax increases mito-chondrial membrane permeability and is inhibited by Bcl-2. J Biol Chem 281(21):14764–14775.
26. Happo L, Strasser A, Cory S (2012) BH3-only proteins in apoptosis at a glance. J Cell Sci125(Pt 5):1081–1087.
27. Chen C, et al. (2007) Modeling of the role of a Bax-activation switch in the mito-chondrial apoptosis decision. Biophys J 92(12):4304–4315.
28. Leber B, Lin J, Andrews DW (2007) Embedded together: The life and death conse-quences of interaction of the Bcl-2 family with membranes. Apoptosis 12(5):897–911.
29. Aldridge BB, Burke JM, Lauffenburger DA, Sorger PK (2006) Physicochemical mod-elling of cell signalling pathways. Nat Cell Biol 8(11):1195–1203.
30. Lu M, Jolly MK, Levine H, Onuchic JN, Ben-Jacob E (2013) MicroRNA-based regulationof epithelial-hybrid-mesenchymal fate determination. Proc Natl Acad Sci USA 110(45):18144–18149.
31. Ferrell JE, Jr, et al. (2009) Simple, realistic models of complex biological processes:Positive feedback and bistability in a cell fate switch and a cell cycle oscillator. FEBSLett 583(24):3999–4005.
32. Lee YS, Liu OZ, Hwang HS, Knollmann BC, Sobie EA (2013) Parameter sensitivityanalysis of stochastic models provides insights into cardiac calcium sparks. Biophys J104(5):1142–1150.
33. Yue H, et al. (2006) Insights into the behaviour of systems biology models from dy-namic sensitivity and identifiability analysis: A case study of an NF-kappaB signallingpathway. Mol Biosyst 2(12):640–649.
34. Forbes SA, et al. (2015) COSMIC: Exploring the world’s knowledge of somatic muta-tions in human cancer. Nucleic Acids Res 43(Database Issue):D805–D811.
35. Yamamoto H, Sawai H, Perucho M (1997) Frameshift somatic mutations in gastroin-testinal cancer of the microsatellite mutator phenotype. Cancer Res 57(19):4420–4426.
36. Sherry ST, et al. (2001) dbSNP: The NCBI database of genetic variation. Nucleic AcidsRes 29(1):308–311.
37. Billen LP, Shamas-Din A, Andrews DW (2008) Bid: A Bax-like BH3 protein. Oncogene27(Suppl 1):S93–S104.
38. Schinzel A, et al. (2004) Conformational control of Bax localization and apoptoticactivity by Pro168. J Cell Biol 164(7):1021–1032.
39. Gil J, Yamamoto H, Zapata JM, Reed JC, Perucho M (1999) Impairment of the proa-poptotic activity of Bax by missense mutations found in gastrointestinal cancers.Cancer Res 59(9):2034–2037.
40. Vogelstein B, et al. (2013) Cancer genome landscapes. Science 339(6127):1546–1558.41. Ku B, Liang C, Jung JU, Oh BH (2011) Evidence that inhibition of BAX activation by
BCL-2 involves its tight and preferential interaction with the BH3 domain of BAX. Cell
Res 21(4):627–641.42. Zha H, et al. (1996) Structure-function comparisons of the proapoptotic protein Bax in
yeast and mammalian cells. Mol Cell Biol 16(11):6494–6508.43. Czabotar PE, et al. (2013) Bax crystal structures reveal how BH3 domains activate Bax
and nucleate its oligomerization to induce apoptosis. Cell 152(3):519–531.44. Dhillon AS, Hagan S, Rath O, Kolch W (2007) MAP kinase signalling pathways in
cancer. Oncogene 26(22):3279–3290.45. Schreiber G (2002) Kinetic studies of protein-protein interactions. Curr Opin Struct
Biol 12(1):41–47.46. Tiwary P, Limongelli V, Salvalaglio M, Parrinello M (2015) Kinetics of protein-ligand
unbinding: Predicting pathways, rates, and rate-limiting steps. Proc Natl Acad Sci USA
112(5):E386–E391.47. Fredriksson NJ, Ny L, Nilsson JA, Larsson E (2014) Systematic analysis of noncoding
somatic mutations and gene expression alterations across 14 tumor types. Nat Genet
46(12):1258–1263.48. O’Farrell TJ, Ghosh P, Dobashi N, Sasaki CY, Longo DL (2004) Comparison of the
effect of mutant and wild-type p53 on global gene expression. Cancer Res 64(22):
8199–8207.49. Tank EM, True HL (2009) Disease-associated mutant ubiquitin causes proteaso-
mal impairment and enhances the toxicity of protein aggregates. PLoS Genet 5(2):
e1000382.50. Albeck JG, Burke JM, Spencer SL, Lauffenburger DA, Sorger PK (2008) Modeling a
snap-action, variable-delay switch controlling extrinsic cell death. PLoS Biol 6(12):
2831–2852.51. The 1000 Genomes Project Consortium (2010) A map of human genome variation
from population-scale sequencing. Nature 467(7319):1061–1073.52. Ikegaki N, Katsumata M, Minna J, Tsujimoto Y (1994) Expression of bcl-2 in small cell
lung carcinoma cells. Cancer Res 54(1):6–8.53. Monni O, et al. (1997) BCL2 overexpression associated with chromosomal amplifica-
tion in diffuse large B-cell lymphoma. Blood 90(3):1168–1174.54. Rampino N, et al. (1997) Somatic frameshift mutations in the BAX gene in colon
cancers of the microsatellite mutator phenotype. Science 275(5302):967–969.55. Gohlke H, Kiel C, Case DA (2003) Insights into protein-protein binding by binding free
energy calculation and free energy decomposition for the Ras-Raf and Ras-RalGDS
complexes. J Mol Biol 330(4):891–913.
Zhao et al. PNAS Early Edition | 9 of 9
BIOPH
YSICSAND
COMPU
TATIONALBIOLO
GY
PNASPL
US


![KINETICS OF STRAIN-INDUCED MORPHOLOGICAL …chen/publications/YZWang1993Actamater... · ALNICO [4] and fl-brass [5]) ... composition has been proposed by Miyazaki et al. [20]. These](https://img.pdfslide.net/doc/110x75/5b5ae1b27f8b9ab8578cddd4/kinetics-of-strain-induced-morphological-chenpublicationsyzwang1993actamater.jpg)