Embed Size (px)
Citation preview
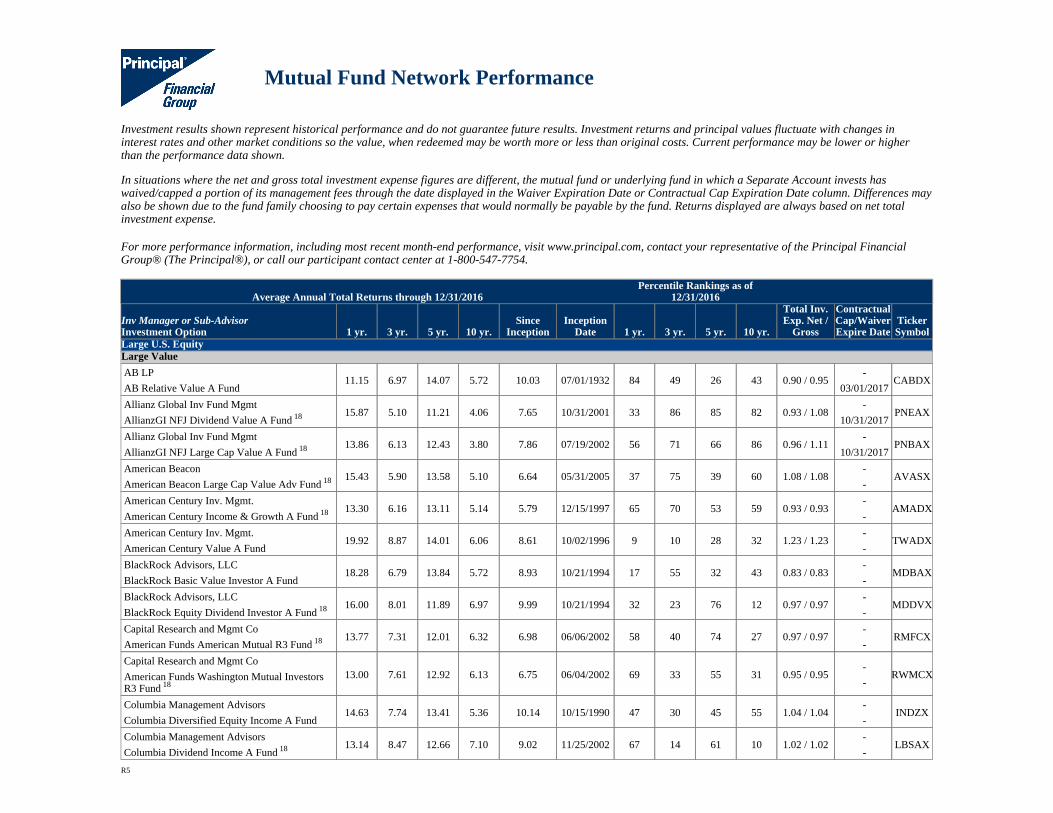
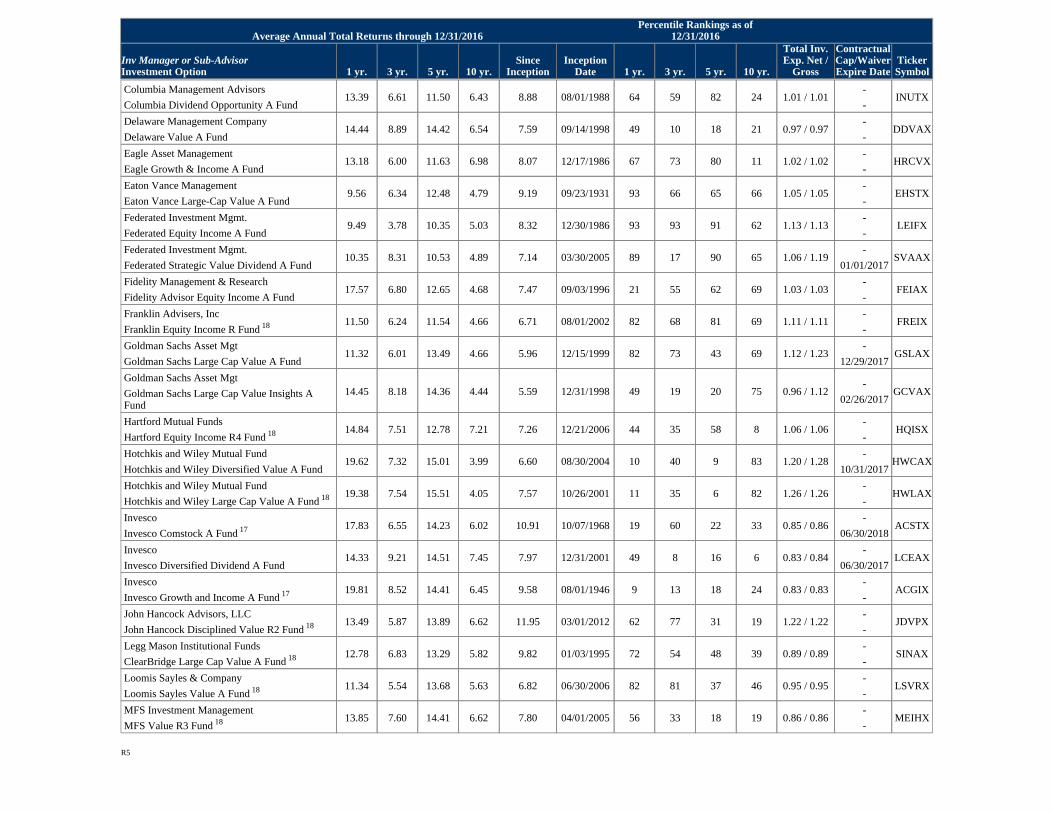
Mutual Fund Network Performance
Investment results shown represent historical performance and do not guarantee future results. Investment returns and principal values fluctuate with changes ininterest rates and other market conditions so the value, when redeemed may be worth more or less than original costs. Current performance may be lower or higherthan the performance data shown.
In situations where the net and gross total investment expense figures are different, the mutual fund or underlying fund in which a Separate Account invests haswaived/capped a portion of its management fees through the date displayed in the Waiver Expiration Date or Contractual Cap Expiration Date column. Differences mayalso be shown due to the fund family choosing to pay certain expenses that would normally be payable by the fund. Returns displayed are always based on net totalinvestment expense.
For more performance information, including most recent month-end performance, visit www.principal.com, contact your representative of the Principal FinancialGroup® (The Principal®), or call our participant contact center at 1-800-547-7754.
Average Annual Total Returns through 12/31/2016Percentile Rankings as of
12/31/2016
Inv Manager or Sub-AdvisorInvestment Option 1 yr. 3 yr. 5 yr. 10 yr.
SinceInception
InceptionDate 1 yr. 3 yr. 5 yr. 10 yr.
Total Inv.Exp. Net /
Gross
ContractualCap/WaiverExpire Date
TickerSymbol
Large U.S. EquityLarge Value
AB LP
AB Relative Value A Fund11.15 6.97 14.07 5.72 10.03 07/01/1932 84 49 26 43 0.90 / 0.95
-
03/01/2017CABDX
Allianz Global Inv Fund Mgmt
AllianzGI NFJ Dividend Value A Fund 18 15.87 5.10 11.21 4.06 7.65 10/31/2001 33 86 85 82 0.93 / 1.08-
10/31/2017PNEAX
Allianz Global Inv Fund Mgmt
AllianzGI NFJ Large Cap Value A Fund 18 13.86 6.13 12.43 3.80 7.86 07/19/2002 56 71 66 86 0.96 / 1.11-
10/31/2017PNBAX
American Beacon
American Beacon Large Cap Value Adv Fund 18 15.43 5.90 13.58 5.10 6.64 05/31/2005 37 75 39 60 1.08 / 1.08-
-AVASX
American Century Inv. Mgmt.
American Century Income & Growth A Fund 18 13.30 6.16 13.11 5.14 5.79 12/15/1997 65 70 53 59 0.93 / 0.93-
-AMADX
American Century Inv. Mgmt.
American Century Value A Fund19.92 8.87 14.01 6.06 8.61 10/02/1996 9 10 28 32 1.23 / 1.23
-
-TWADX
BlackRock Advisors, LLC
BlackRock Basic Value Investor A Fund18.28 6.79 13.84 5.72 8.93 10/21/1994 17 55 32 43 0.83 / 0.83
-
-MDBAX
BlackRock Advisors, LLC
BlackRock Equity Dividend Investor A Fund 18 16.00 8.01 11.89 6.97 9.99 10/21/1994 32 23 76 12 0.97 / 0.97-
-MDDVX
Capital Research and Mgmt Co
American Funds American Mutual R3 Fund 18 13.77 7.31 12.01 6.32 6.98 06/06/2002 58 40 74 27 0.97 / 0.97-
-RMFCX
Capital Research and Mgmt Co
American Funds Washington Mutual InvestorsR3 Fund 18
13.00 7.61 12.92 6.13 6.75 06/04/2002 69 33 55 31 0.95 / 0.95-
-RWMCX
Columbia Management Advisors
Columbia Diversified Equity Income A Fund14.63 7.74 13.41 5.36 10.14 10/15/1990 47 30 45 55 1.04 / 1.04
-
-INDZX
Columbia Management Advisors
Columbia Dividend Income A Fund 18 13.14 8.47 12.66 7.10 9.02 11/25/2002 67 14 61 10 1.02 / 1.02-
-LBSAX
R5
Columbia Management Advisors
Columbia Dividend Opportunity A Fund13.39 6.61 11.50 6.43 8.88 08/01/1988 64 59 82 24 1.01 / 1.01
-
-INUTX
Delaware Management Company
Delaware Value A Fund14.44 8.89 14.42 6.54 7.59 09/14/1998 49 10 18 21 0.97 / 0.97
-
-DDVAX
Eagle Asset Management
Eagle Growth & Income A Fund13.18 6.00 11.63 6.98 8.07 12/17/1986 67 73 80 11 1.02 / 1.02
-
-HRCVX
Eaton Vance Management
Eaton Vance Large-Cap Value A Fund9.56 6.34 12.48 4.79 9.19 09/23/1931 93 66 65 66 1.05 / 1.05
-
-EHSTX
Federated Investment Mgmt.
Federated Equity Income A Fund9.49 3.78 10.35 5.03 8.32 12/30/1986 93 93 91 62 1.13 / 1.13
-
-LEIFX
Federated Investment Mgmt.
Federated Strategic Value Dividend A Fund10.35 8.31 10.53 4.89 7.14 03/30/2005 89 17 90 65 1.06 / 1.19
-
01/01/2017SVAAX
Fidelity Management & Research
Fidelity Advisor Equity Income A Fund17.57 6.80 12.65 4.68 7.47 09/03/1996 21 55 62 69 1.03 / 1.03
-
-FEIAX
Franklin Advisers, Inc
Franklin Equity Income R Fund 18 11.50 6.24 11.54 4.66 6.71 08/01/2002 82 68 81 69 1.11 / 1.11-
-FREIX
Goldman Sachs Asset Mgt
Goldman Sachs Large Cap Value A Fund11.32 6.01 13.49 4.66 5.96 12/15/1999 82 73 43 69 1.12 / 1.23
-
12/29/2017GSLAX
Goldman Sachs Asset Mgt
Goldman Sachs Large Cap Value Insights AFund
14.45 8.18 14.36 4.44 5.59 12/31/1998 49 19 20 75 0.96 / 1.12-
02/26/2017GCVAX
Hartford Mutual Funds
Hartford Equity Income R4 Fund 18 14.84 7.51 12.78 7.21 7.26 12/21/2006 44 35 58 8 1.06 / 1.06-
-HQISX
Hotchkis and Wiley Mutual Fund
Hotchkis and Wiley Diversified Value A Fund19.62 7.32 15.01 3.99 6.60 08/30/2004 10 40 9 83 1.20 / 1.28
-
10/31/2017HWCAX
Hotchkis and Wiley Mutual Fund
Hotchkis and Wiley Large Cap Value A Fund 18 19.38 7.54 15.51 4.05 7.57 10/26/2001 11 35 6 82 1.26 / 1.26-
-HWLAX
Invesco
Invesco Comstock A Fund 17 17.83 6.55 14.23 6.02 10.91 10/07/1968 19 60 22 33 0.85 / 0.86-
06/30/2018ACSTX
Invesco
Invesco Diversified Dividend A Fund14.33 9.21 14.51 7.45 7.97 12/31/2001 49 8 16 6 0.83 / 0.84
-
06/30/2017LCEAX
Invesco
Invesco Growth and Income A Fund 17 19.81 8.52 14.41 6.45 9.58 08/01/1946 9 13 18 24 0.83 / 0.83-
-ACGIX
John Hancock Advisors, LLC
John Hancock Disciplined Value R2 Fund 18 13.49 5.87 13.89 6.62 11.95 03/01/2012 62 77 31 19 1.22 / 1.22-
-JDVPX
Legg Mason Institutional Funds
ClearBridge Large Cap Value A Fund 18 12.78 6.83 13.29 5.82 9.82 01/03/1995 72 54 48 39 0.89 / 0.89-
-SINAX
Loomis Sayles & Company
Loomis Sayles Value A Fund 18 11.34 5.54 13.68 5.63 6.82 06/30/2006 82 81 37 46 0.95 / 0.95-
-LSVRX
MFS Investment Management
MFS Value R3 Fund 18 13.85 7.60 14.41 6.62 7.80 04/01/2005 56 33 18 19 0.86 / 0.86-
-MEIHX
Average Annual Total Returns through 12/31/2016Percentile Rankings as of
12/31/2016
Inv Manager or Sub-AdvisorInvestment Option 1 yr. 3 yr. 5 yr. 10 yr.
SinceInception
InceptionDate 1 yr. 3 yr. 5 yr. 10 yr.
Total Inv.Exp. Net /
Gross
ContractualCap/WaiverExpire Date
TickerSymbol
R5
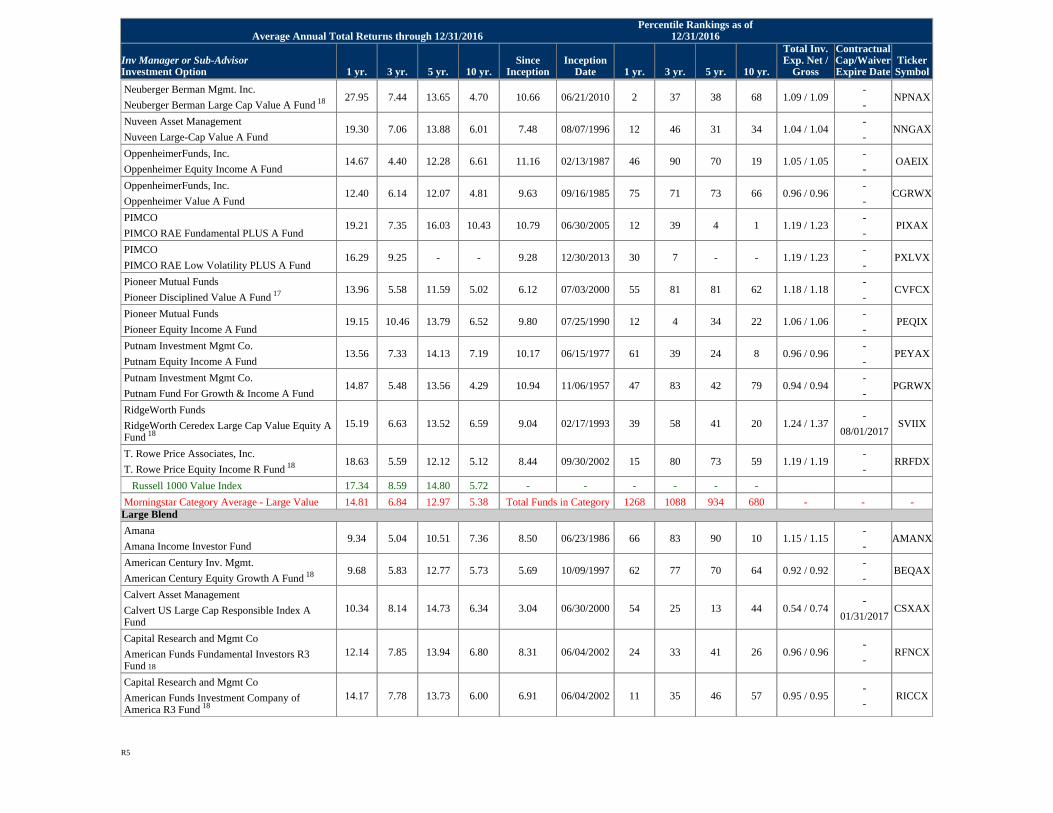
Neuberger Berman Mgmt. Inc.
Neuberger Berman Large Cap Value A Fund 18 27.95 7.44 13.65 4.70 10.66 06/21/2010 2 37 38 68 1.09 / 1.09-
-NPNAX
Nuveen Asset Management
Nuveen Large-Cap Value A Fund19.30 7.06 13.88 6.01 7.48 08/07/1996 12 46 31 34 1.04 / 1.04
-
-NNGAX
OppenheimerFunds, Inc.
Oppenheimer Equity Income A Fund14.67 4.40 12.28 6.61 11.16 02/13/1987 46 90 70 19 1.05 / 1.05
-
-OAEIX
OppenheimerFunds, Inc.
Oppenheimer Value A Fund12.40 6.14 12.07 4.81 9.63 09/16/1985 75 71 73 66 0.96 / 0.96
-
-CGRWX
PIMCO
PIMCO RAE Fundamental PLUS A Fund19.21 7.35 16.03 10.43 10.79 06/30/2005 12 39 4 1 1.19 / 1.23
-
-PIXAX
PIMCO
PIMCO RAE Low Volatility PLUS A Fund16.29 9.25 - - 9.28 12/30/2013 30 7 - - 1.19 / 1.23
-
-PXLVX
Pioneer Mutual Funds
Pioneer Disciplined Value A Fund 17 13.96 5.58 11.59 5.02 6.12 07/03/2000 55 81 81 62 1.18 / 1.18-
-CVFCX
Pioneer Mutual Funds
Pioneer Equity Income A Fund19.15 10.46 13.79 6.52 9.80 07/25/1990 12 4 34 22 1.06 / 1.06
-
-PEQIX
Putnam Investment Mgmt Co.
Putnam Equity Income A Fund13.56 7.33 14.13 7.19 10.17 06/15/1977 61 39 24 8 0.96 / 0.96
-
-PEYAX
Putnam Investment Mgmt Co.
Putnam Fund For Growth & Income A Fund14.87 5.48 13.56 4.29 10.94 11/06/1957 47 83 42 79 0.94 / 0.94
-
-PGRWX
RidgeWorth Funds
RidgeWorth Ceredex Large Cap Value Equity AFund 18
15.19 6.63 13.52 6.59 9.04 02/17/1993 39 58 41 20 1.24 / 1.37-
08/01/2017SVIIX
T. Rowe Price Associates, Inc.
T. Rowe Price Equity Income R Fund 18 18.63 5.59 12.12 5.12 8.44 09/30/2002 15 80 73 59 1.19 / 1.19-
-RRFDX
Russell 1000 Value Index 17.34 8.59 14.80 5.72 - - - - - -
Morningstar Category Average - Large Value 14.81 6.84 12.97 5.38 Total Funds in Category 1268 1088 934 680 - - -Large Blend
Amana
Amana Income Investor Fund9.34 5.04 10.51 7.36 8.50 06/23/1986 66 83 90 10 1.15 / 1.15
-
-AMANX
American Century Inv. Mgmt.
American Century Equity Growth A Fund 18 9.68 5.83 12.77 5.73 5.69 10/09/1997 62 77 70 64 0.92 / 0.92-
-BEQAX
Calvert Asset Management
Calvert US Large Cap Responsible Index AFund
10.34 8.14 14.73 6.34 3.04 06/30/2000 54 25 13 44 0.54 / 0.74-
01/31/2017CSXAX
Capital Research and Mgmt Co
American Funds Fundamental Investors R3Fund 18
12.14 7.85 13.94 6.80 8.31 06/04/2002 24 33 41 26 0.96 / 0.96-
-RFNCX
Capital Research and Mgmt Co
American Funds Investment Company ofAmerica R3 Fund 18
14.17 7.78 13.73 6.00 6.91 06/04/2002 11 35 46 57 0.95 / 0.95-
-RICCX
Average Annual Total Returns through 12/31/2016Percentile Rankings as of
12/31/2016
Inv Manager or Sub-AdvisorInvestment Option 1 yr. 3 yr. 5 yr. 10 yr.
SinceInception
InceptionDate 1 yr. 3 yr. 5 yr. 10 yr.
Total Inv.Exp. Net /
Gross
ContractualCap/WaiverExpire Date
TickerSymbol
R5
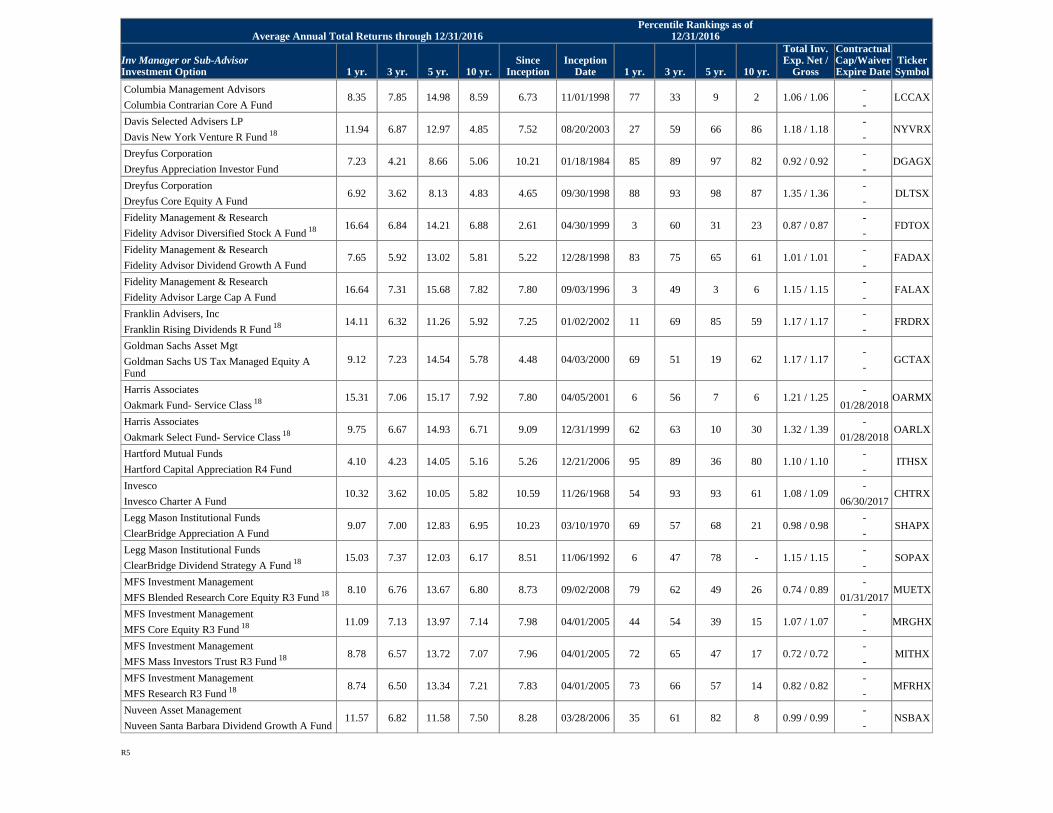
Columbia Management Advisors
Columbia Contrarian Core A Fund8.35 7.85 14.98 8.59 6.73 11/01/1998 77 33 9 2 1.06 / 1.06
-
-LCCAX
Davis Selected Advisers LP
Davis New York Venture R Fund 18 11.94 6.87 12.97 4.85 7.52 08/20/2003 27 59 66 86 1.18 / 1.18-
-NYVRX
Dreyfus Corporation
Dreyfus Appreciation Investor Fund7.23 4.21 8.66 5.06 10.21 01/18/1984 85 89 97 82 0.92 / 0.92
-
-DGAGX
Dreyfus Corporation
Dreyfus Core Equity A Fund6.92 3.62 8.13 4.83 4.65 09/30/1998 88 93 98 87 1.35 / 1.36
-
-DLTSX
Fidelity Management & Research
Fidelity Advisor Diversified Stock A Fund 18 16.64 6.84 14.21 6.88 2.61 04/30/1999 3 60 31 23 0.87 / 0.87-
-FDTOX
Fidelity Management & Research
Fidelity Advisor Dividend Growth A Fund7.65 5.92 13.02 5.81 5.22 12/28/1998 83 75 65 61 1.01 / 1.01
-
-FADAX
Fidelity Management & Research
Fidelity Advisor Large Cap A Fund16.64 7.31 15.68 7.82 7.80 09/03/1996 3 49 3 6 1.15 / 1.15
-
-FALAX
Franklin Advisers, Inc
Franklin Rising Dividends R Fund 18 14.11 6.32 11.26 5.92 7.25 01/02/2002 11 69 85 59 1.17 / 1.17-
-FRDRX
Goldman Sachs Asset Mgt
Goldman Sachs US Tax Managed Equity AFund
9.12 7.23 14.54 5.78 4.48 04/03/2000 69 51 19 62 1.17 / 1.17-
-GCTAX
Harris Associates
Oakmark Fund- Service Class 18 15.31 7.06 15.17 7.92 7.80 04/05/2001 6 56 7 6 1.21 / 1.25-
01/28/2018OARMX
Harris Associates
Oakmark Select Fund- Service Class 18 9.75 6.67 14.93 6.71 9.09 12/31/1999 62 63 10 30 1.32 / 1.39-
01/28/2018OARLX
Hartford Mutual Funds
Hartford Capital Appreciation R4 Fund4.10 4.23 14.05 5.16 5.26 12/21/2006 95 89 36 80 1.10 / 1.10
-
-ITHSX
Invesco
Invesco Charter A Fund10.32 3.62 10.05 5.82 10.59 11/26/1968 54 93 93 61 1.08 / 1.09
-
06/30/2017CHTRX
Legg Mason Institutional Funds
ClearBridge Appreciation A Fund9.07 7.00 12.83 6.95 10.23 03/10/1970 69 57 68 21 0.98 / 0.98
-
-SHAPX
Legg Mason Institutional Funds
ClearBridge Dividend Strategy A Fund 18 15.03 7.37 12.03 6.17 8.51 11/06/1992 6 47 78 - 1.15 / 1.15-
-SOPAX
MFS Investment Management
MFS Blended Research Core Equity R3 Fund 18 8.10 6.76 13.67 6.80 8.73 09/02/2008 79 62 49 26 0.74 / 0.89-
01/31/2017MUETX
MFS Investment Management
MFS Core Equity R3 Fund 18 11.09 7.13 13.97 7.14 7.98 04/01/2005 44 54 39 15 1.07 / 1.07-
-MRGHX
MFS Investment Management
MFS Mass Investors Trust R3 Fund 18 8.78 6.57 13.72 7.07 7.96 04/01/2005 72 65 47 17 0.72 / 0.72-
-MITHX
MFS Investment Management
MFS Research R3 Fund 18 8.74 6.50 13.34 7.21 7.83 04/01/2005 73 66 57 14 0.82 / 0.82-
-MFRHX
Nuveen Asset Management
Nuveen Santa Barbara Dividend Growth A Fund11.57 6.82 11.58 7.50 8.28 03/28/2006 35 61 82 8 0.99 / 0.99
-
-NSBAX
Average Annual Total Returns through 12/31/2016Percentile Rankings as of
12/31/2016
Inv Manager or Sub-AdvisorInvestment Option 1 yr. 3 yr. 5 yr. 10 yr.
SinceInception
InceptionDate 1 yr. 3 yr. 5 yr. 10 yr.
Total Inv.Exp. Net /
Gross
ContractualCap/WaiverExpire Date
TickerSymbol
R5
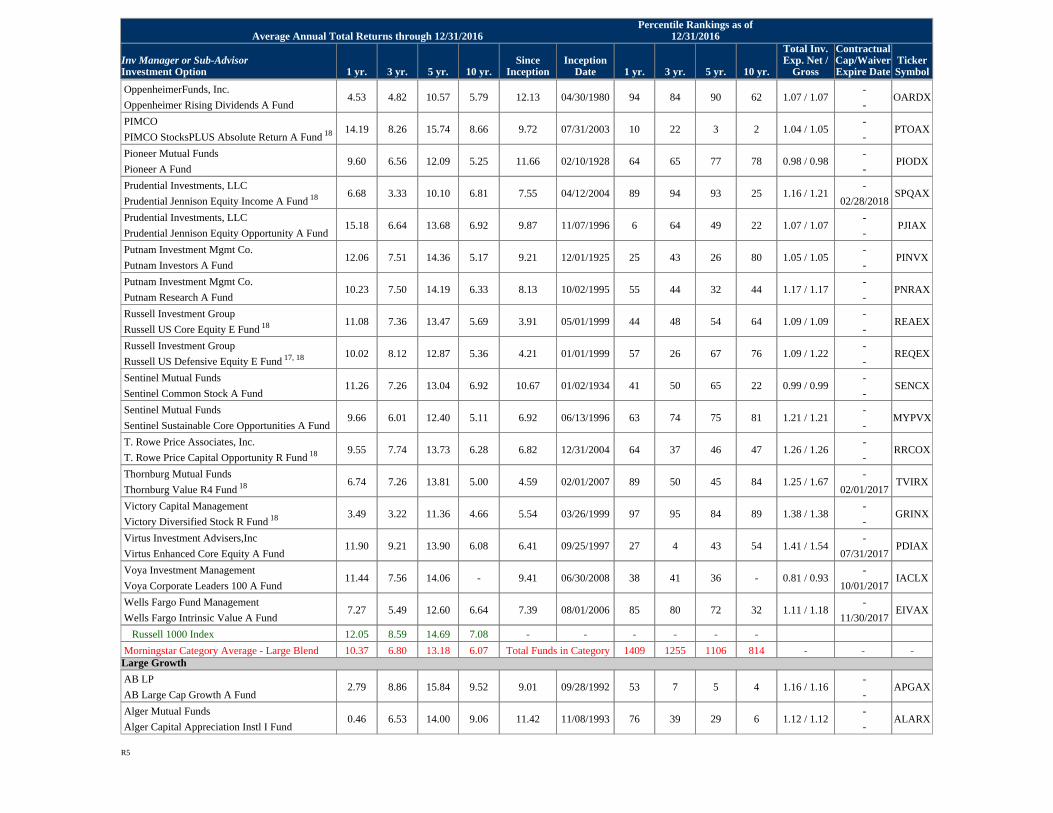
OppenheimerFunds, Inc.
Oppenheimer Rising Dividends A Fund4.53 4.82 10.57 5.79 12.13 04/30/1980 94 84 90 62 1.07 / 1.07
-
-OARDX
PIMCO
PIMCO StocksPLUS Absolute Return A Fund 18 14.19 8.26 15.74 8.66 9.72 07/31/2003 10 22 3 2 1.04 / 1.05-
-PTOAX
Pioneer Mutual Funds
Pioneer A Fund9.60 6.56 12.09 5.25 11.66 02/10/1928 64 65 77 78 0.98 / 0.98
-
-PIODX
Prudential Investments, LLC
Prudential Jennison Equity Income A Fund 18 6.68 3.33 10.10 6.81 7.55 04/12/2004 89 94 93 25 1.16 / 1.21-
02/28/2018SPQAX
Prudential Investments, LLC
Prudential Jennison Equity Opportunity A Fund15.18 6.64 13.68 6.92 9.87 11/07/1996 6 64 49 22 1.07 / 1.07
-
-PJIAX
Putnam Investment Mgmt Co.
Putnam Investors A Fund12.06 7.51 14.36 5.17 9.21 12/01/1925 25 43 26 80 1.05 / 1.05
-
-PINVX
Putnam Investment Mgmt Co.
Putnam Research A Fund10.23 7.50 14.19 6.33 8.13 10/02/1995 55 44 32 44 1.17 / 1.17
-
-PNRAX
Russell Investment Group
Russell US Core Equity E Fund 18 11.08 7.36 13.47 5.69 3.91 05/01/1999 44 48 54 64 1.09 / 1.09-
-REAEX
Russell Investment Group
Russell US Defensive Equity E Fund 17, 18 10.02 8.12 12.87 5.36 4.21 01/01/1999 57 26 67 76 1.09 / 1.22-
-REQEX
Sentinel Mutual Funds
Sentinel Common Stock A Fund11.26 7.26 13.04 6.92 10.67 01/02/1934 41 50 65 22 0.99 / 0.99
-
-SENCX
Sentinel Mutual Funds
Sentinel Sustainable Core Opportunities A Fund9.66 6.01 12.40 5.11 6.92 06/13/1996 63 74 75 81 1.21 / 1.21
-
-MYPVX
T. Rowe Price Associates, Inc.
T. Rowe Price Capital Opportunity R Fund 18 9.55 7.74 13.73 6.28 6.82 12/31/2004 64 37 46 47 1.26 / 1.26-
-RRCOX
Thornburg Mutual Funds
Thornburg Value R4 Fund 18 6.74 7.26 13.81 5.00 4.59 02/01/2007 89 50 45 84 1.25 / 1.67-
02/01/2017TVIRX
Victory Capital Management
Victory Diversified Stock R Fund 18 3.49 3.22 11.36 4.66 5.54 03/26/1999 97 95 84 89 1.38 / 1.38-
-GRINX
Virtus Investment Advisers,Inc
Virtus Enhanced Core Equity A Fund11.90 9.21 13.90 6.08 6.41 09/25/1997 27 4 43 54 1.41 / 1.54
-
07/31/2017PDIAX
Voya Investment Management
Voya Corporate Leaders 100 A Fund11.44 7.56 14.06 - 9.41 06/30/2008 38 41 36 - 0.81 / 0.93
-
10/01/2017IACLX
Wells Fargo Fund Management
Wells Fargo Intrinsic Value A Fund7.27 5.49 12.60 6.64 7.39 08/01/2006 85 80 72 32 1.11 / 1.18
-
11/30/2017EIVAX
Russell 1000 Index 12.05 8.59 14.69 7.08 - - - - - -
Morningstar Category Average - Large Blend 10.37 6.80 13.18 6.07 Total Funds in Category 1409 1255 1106 814 - - -Large Growth
AB LP
AB Large Cap Growth A Fund2.79 8.86 15.84 9.52 9.01 09/28/1992 53 7 5 4 1.16 / 1.16
-
-APGAX
Alger Mutual Funds
Alger Capital Appreciation Instl I Fund0.46 6.53 14.00 9.06 11.42 11/08/1993 76 39 29 6 1.12 / 1.12
-
-ALARX
Average Annual Total Returns through 12/31/2016Percentile Rankings as of
12/31/2016
Inv Manager or Sub-AdvisorInvestment Option 1 yr. 3 yr. 5 yr. 10 yr.
SinceInception
InceptionDate 1 yr. 3 yr. 5 yr. 10 yr.
Total Inv.Exp. Net /
Gross
ContractualCap/WaiverExpire Date
TickerSymbol
R5
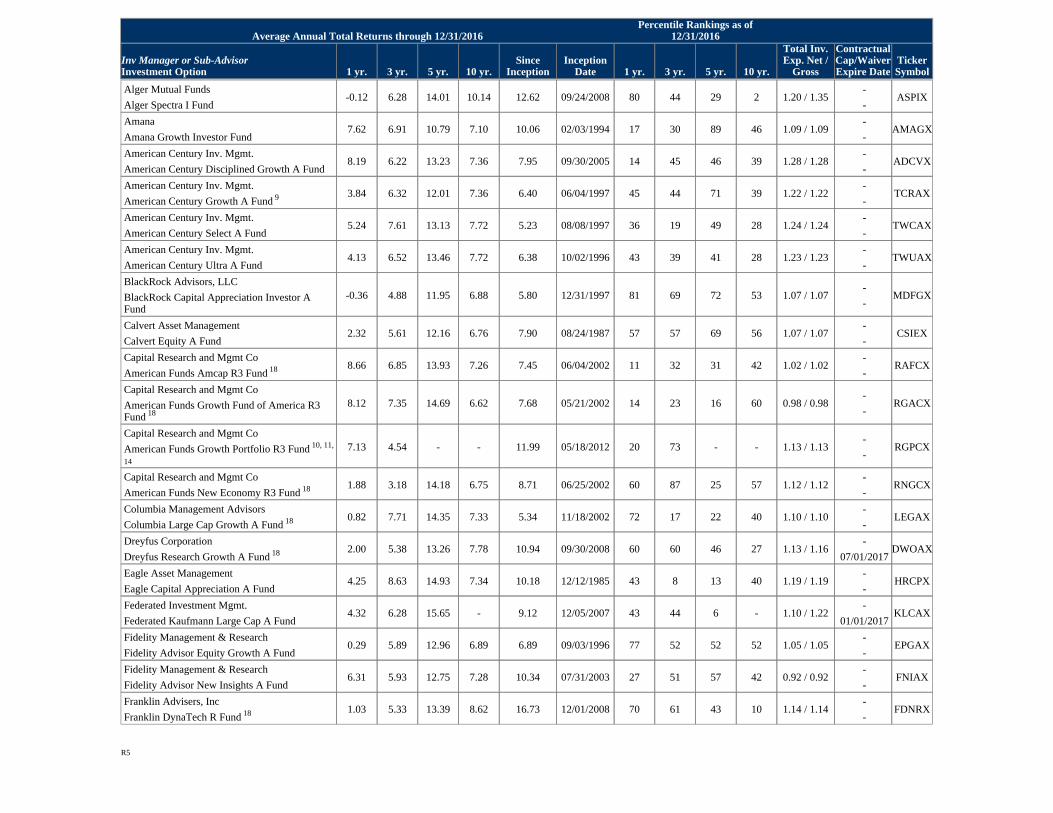
Alger Mutual Funds
Alger Spectra I Fund-0.12 6.28 14.01 10.14 12.62 09/24/2008 80 44 29 2 1.20 / 1.35
-
-ASPIX
Amana
Amana Growth Investor Fund7.62 6.91 10.79 7.10 10.06 02/03/1994 17 30 89 46 1.09 / 1.09
-
-AMAGX
American Century Inv. Mgmt.
American Century Disciplined Growth A Fund8.19 6.22 13.23 7.36 7.95 09/30/2005 14 45 46 39 1.28 / 1.28
-
-ADCVX
American Century Inv. Mgmt.
American Century Growth A Fund 9 3.84 6.32 12.01 7.36 6.40 06/04/1997 45 44 71 39 1.22 / 1.22-
-TCRAX
American Century Inv. Mgmt.
American Century Select A Fund5.24 7.61 13.13 7.72 5.23 08/08/1997 36 19 49 28 1.24 / 1.24
-
-TWCAX
American Century Inv. Mgmt.
American Century Ultra A Fund4.13 6.52 13.46 7.72 6.38 10/02/1996 43 39 41 28 1.23 / 1.23
-
-TWUAX
BlackRock Advisors, LLC
BlackRock Capital Appreciation Investor AFund
-0.36 4.88 11.95 6.88 5.80 12/31/1997 81 69 72 53 1.07 / 1.07-
-MDFGX
Calvert Asset Management
Calvert Equity A Fund2.32 5.61 12.16 6.76 7.90 08/24/1987 57 57 69 56 1.07 / 1.07
-
-CSIEX
Capital Research and Mgmt Co
American Funds Amcap R3 Fund 18 8.66 6.85 13.93 7.26 7.45 06/04/2002 11 32 31 42 1.02 / 1.02-
-RAFCX
Capital Research and Mgmt Co
American Funds Growth Fund of America R3Fund 18
8.12 7.35 14.69 6.62 7.68 05/21/2002 14 23 16 60 0.98 / 0.98-
-RGACX
Capital Research and Mgmt Co
American Funds Growth Portfolio R3 Fund 10, 11,
14
7.13 4.54 - - 11.99 05/18/2012 20 73 - - 1.13 / 1.13-
-RGPCX
Capital Research and Mgmt Co
American Funds New Economy R3 Fund 18 1.88 3.18 14.18 6.75 8.71 06/25/2002 60 87 25 57 1.12 / 1.12-
-RNGCX
Columbia Management Advisors
Columbia Large Cap Growth A Fund 18 0.82 7.71 14.35 7.33 5.34 11/18/2002 72 17 22 40 1.10 / 1.10-
-LEGAX
Dreyfus Corporation
Dreyfus Research Growth A Fund 18 2.00 5.38 13.26 7.78 10.94 09/30/2008 60 60 46 27 1.13 / 1.16-
07/01/2017DWOAX
Eagle Asset Management
Eagle Capital Appreciation A Fund4.25 8.63 14.93 7.34 10.18 12/12/1985 43 8 13 40 1.19 / 1.19
-
-HRCPX
Federated Investment Mgmt.
Federated Kaufmann Large Cap A Fund4.32 6.28 15.65 - 9.12 12/05/2007 43 44 6 - 1.10 / 1.22
-
01/01/2017KLCAX
Fidelity Management & Research
Fidelity Advisor Equity Growth A Fund0.29 5.89 12.96 6.89 6.89 09/03/1996 77 52 52 52 1.05 / 1.05
-
-EPGAX
Fidelity Management & Research
Fidelity Advisor New Insights A Fund6.31 5.93 12.75 7.28 10.34 07/31/2003 27 51 57 42 0.92 / 0.92
-
-FNIAX
Franklin Advisers, Inc
Franklin DynaTech R Fund 18 1.03 5.33 13.39 8.62 16.73 12/01/2008 70 61 43 10 1.14 / 1.14-
-FDNRX
Average Annual Total Returns through 12/31/2016Percentile Rankings as of
12/31/2016
Inv Manager or Sub-AdvisorInvestment Option 1 yr. 3 yr. 5 yr. 10 yr.
SinceInception
InceptionDate 1 yr. 3 yr. 5 yr. 10 yr.
Total Inv.Exp. Net /
Gross
ContractualCap/WaiverExpire Date
TickerSymbol
R5
Franklin Advisers, Inc
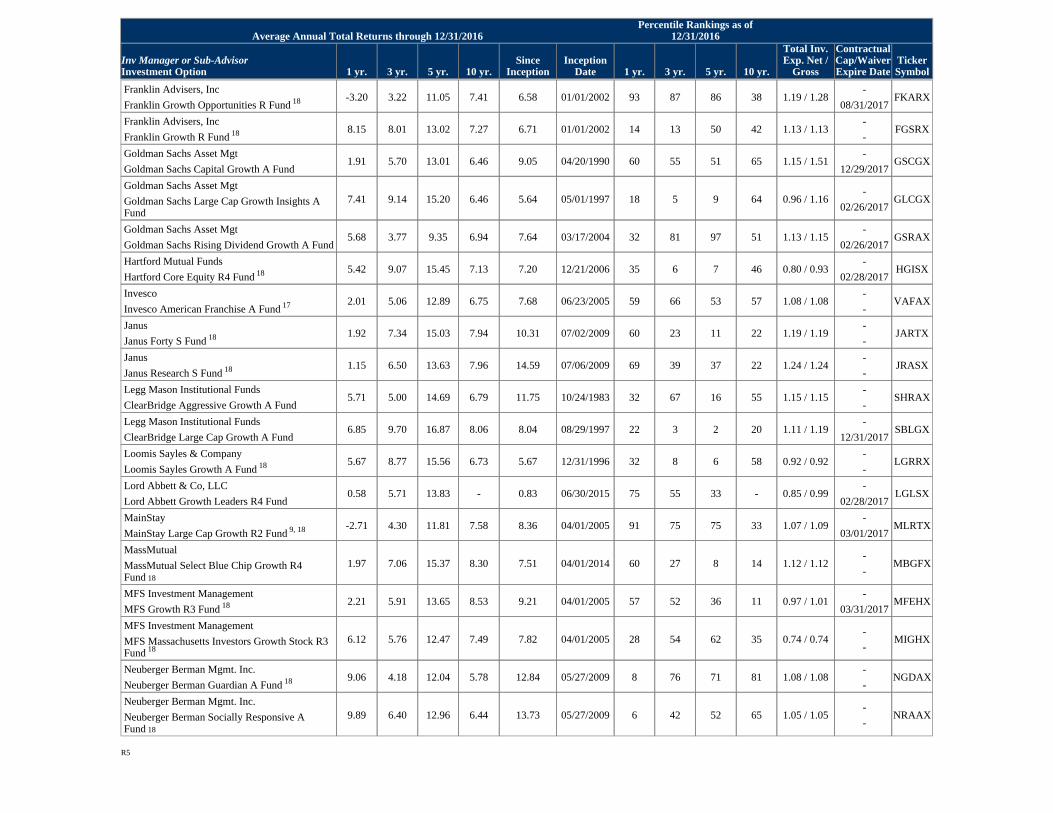
Franklin Growth Opportunities R Fund 18 -3.20 3.22 11.05 7.41 6.58 01/01/2002 93 87 86 38 1.19 / 1.28-
08/31/2017FKARX
Franklin Advisers, Inc
Franklin Growth R Fund 18 8.15 8.01 13.02 7.27 6.71 01/01/2002 14 13 50 42 1.13 / 1.13-
-FGSRX
Goldman Sachs Asset Mgt
Goldman Sachs Capital Growth A Fund1.91 5.70 13.01 6.46 9.05 04/20/1990 60 55 51 65 1.15 / 1.51
-
12/29/2017GSCGX
Goldman Sachs Asset Mgt
Goldman Sachs Large Cap Growth Insights AFund
7.41 9.14 15.20 6.46 5.64 05/01/1997 18 5 9 64 0.96 / 1.16-
02/26/2017GLCGX
Goldman Sachs Asset Mgt
Goldman Sachs Rising Dividend Growth A Fund5.68 3.77 9.35 6.94 7.64 03/17/2004 32 81 97 51 1.13 / 1.15
-
02/26/2017GSRAX
Hartford Mutual Funds
Hartford Core Equity R4 Fund 18 5.42 9.07 15.45 7.13 7.20 12/21/2006 35 6 7 46 0.80 / 0.93-
02/28/2017HGISX
Invesco
Invesco American Franchise A Fund 17 2.01 5.06 12.89 6.75 7.68 06/23/2005 59 66 53 57 1.08 / 1.08-
-VAFAX
Janus
Janus Forty S Fund 18 1.92 7.34 15.03 7.94 10.31 07/02/2009 60 23 11 22 1.19 / 1.19-
-JARTX
Janus
Janus Research S Fund 18 1.15 6.50 13.63 7.96 14.59 07/06/2009 69 39 37 22 1.24 / 1.24-
-JRASX
Legg Mason Institutional Funds
ClearBridge Aggressive Growth A Fund5.71 5.00 14.69 6.79 11.75 10/24/1983 32 67 16 55 1.15 / 1.15
-
-SHRAX
Legg Mason Institutional Funds
ClearBridge Large Cap Growth A Fund6.85 9.70 16.87 8.06 8.04 08/29/1997 22 3 2 20 1.11 / 1.19
-
12/31/2017SBLGX
Loomis Sayles & Company
Loomis Sayles Growth A Fund 18 5.67 8.77 15.56 6.73 5.67 12/31/1996 32 8 6 58 0.92 / 0.92-
-LGRRX
Lord Abbett & Co, LLC
Lord Abbett Growth Leaders R4 Fund0.58 5.71 13.83 - 0.83 06/30/2015 75 55 33 - 0.85 / 0.99
-
02/28/2017LGLSX
MainStay
MainStay Large Cap Growth R2 Fund 9, 18 -2.71 4.30 11.81 7.58 8.36 04/01/2005 91 75 75 33 1.07 / 1.09-
03/01/2017MLRTX
MassMutual
MassMutual Select Blue Chip Growth R4Fund 18
1.97 7.06 15.37 8.30 7.51 04/01/2014 60 27 8 14 1.12 / 1.12-
-MBGFX
MFS Investment Management
MFS Growth R3 Fund 18 2.21 5.91 13.65 8.53 9.21 04/01/2005 57 52 36 11 0.97 / 1.01-
03/31/2017MFEHX
MFS Investment Management
MFS Massachusetts Investors Growth Stock R3Fund 18
6.12 5.76 12.47 7.49 7.82 04/01/2005 28 54 62 35 0.74 / 0.74-
-MIGHX
Neuberger Berman Mgmt. Inc.
Neuberger Berman Guardian A Fund 18 9.06 4.18 12.04 5.78 12.84 05/27/2009 8 76 71 81 1.08 / 1.08-
-NGDAX
Neuberger Berman Mgmt. Inc.
Neuberger Berman Socially Responsive AFund 18
9.89 6.40 12.96 6.44 13.73 05/27/2009 6 42 52 65 1.05 / 1.05-
-NRAAX
Average Annual Total Returns through 12/31/2016Percentile Rankings as of
12/31/2016
Inv Manager or Sub-AdvisorInvestment Option 1 yr. 3 yr. 5 yr. 10 yr.
SinceInception
InceptionDate 1 yr. 3 yr. 5 yr. 10 yr.
Total Inv.Exp. Net /
Gross
ContractualCap/WaiverExpire Date
TickerSymbol
R5
Nuveen Asset Management
Nuveen Large Cap Growth Opportunities AFund
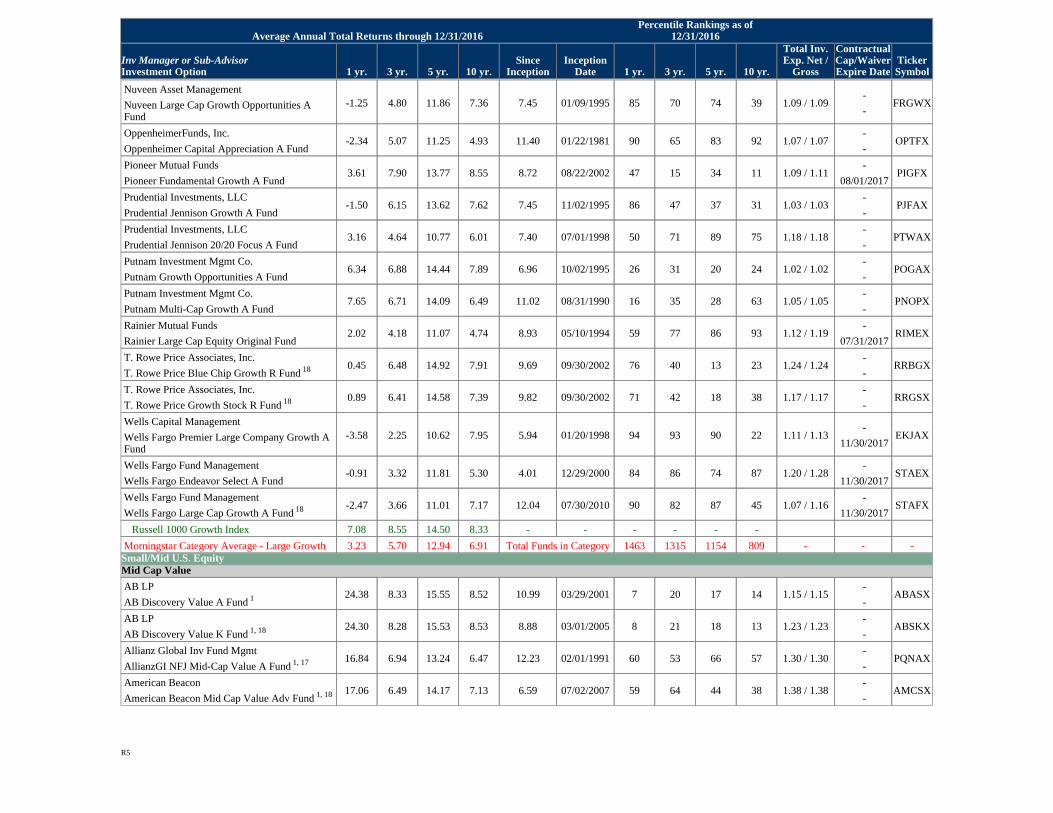
-1.25 4.80 11.86 7.36 7.45 01/09/1995 85 70 74 39 1.09 / 1.09-
-FRGWX
OppenheimerFunds, Inc.
Oppenheimer Capital Appreciation A Fund-2.34 5.07 11.25 4.93 11.40 01/22/1981 90 65 83 92 1.07 / 1.07
-
-OPTFX
Pioneer Mutual Funds
Pioneer Fundamental Growth A Fund3.61 7.90 13.77 8.55 8.72 08/22/2002 47 15 34 11 1.09 / 1.11
-
08/01/2017PIGFX
Prudential Investments, LLC
Prudential Jennison Growth A Fund-1.50 6.15 13.62 7.62 7.45 11/02/1995 86 47 37 31 1.03 / 1.03
-
-PJFAX
Prudential Investments, LLC
Prudential Jennison 20/20 Focus A Fund3.16 4.64 10.77 6.01 7.40 07/01/1998 50 71 89 75 1.18 / 1.18
-
-PTWAX
Putnam Investment Mgmt Co.
Putnam Growth Opportunities A Fund6.34 6.88 14.44 7.89 6.96 10/02/1995 26 31 20 24 1.02 / 1.02
-
-POGAX
Putnam Investment Mgmt Co.
Putnam Multi-Cap Growth A Fund7.65 6.71 14.09 6.49 11.02 08/31/1990 16 35 28 63 1.05 / 1.05
-
-PNOPX
Rainier Mutual Funds
Rainier Large Cap Equity Original Fund2.02 4.18 11.07 4.74 8.93 05/10/1994 59 77 86 93 1.12 / 1.19
-
07/31/2017RIMEX
T. Rowe Price Associates, Inc.
T. Rowe Price Blue Chip Growth R Fund 18 0.45 6.48 14.92 7.91 9.69 09/30/2002 76 40 13 23 1.24 / 1.24-
-RRBGX
T. Rowe Price Associates, Inc.
T. Rowe Price Growth Stock R Fund 18 0.89 6.41 14.58 7.39 9.82 09/30/2002 71 42 18 38 1.17 / 1.17-
-RRGSX
Wells Capital Management
Wells Fargo Premier Large Company Growth AFund
-3.58 2.25 10.62 7.95 5.94 01/20/1998 94 93 90 22 1.11 / 1.13-
11/30/2017EKJAX
Wells Fargo Fund Management
Wells Fargo Endeavor Select A Fund-0.91 3.32 11.81 5.30 4.01 12/29/2000 84 86 74 87 1.20 / 1.28
-
11/30/2017STAEX
Wells Fargo Fund Management
Wells Fargo Large Cap Growth A Fund 18 -2.47 3.66 11.01 7.17 12.04 07/30/2010 90 82 87 45 1.07 / 1.16-
11/30/2017STAFX
Russell 1000 Growth Index 7.08 8.55 14.50 8.33 - - - - - -
Morningstar Category Average - Large Growth 3.23 5.70 12.94 6.91 Total Funds in Category 1463 1315 1154 809 - - -Small/Mid U.S. EquityMid Cap Value
AB LP
AB Discovery Value A Fund 1 24.38 8.33 15.55 8.52 10.99 03/29/2001 7 20 17 14 1.15 / 1.15-
-ABASX
AB LP
AB Discovery Value K Fund 1, 18 24.30 8.28 15.53 8.53 8.88 03/01/2005 8 21 18 13 1.23 / 1.23-
-ABSKX
Allianz Global Inv Fund Mgmt
AllianzGI NFJ Mid-Cap Value A Fund 1, 17 16.84 6.94 13.24 6.47 12.23 02/01/1991 60 53 66 57 1.30 / 1.30-
-PQNAX
American Beacon
American Beacon Mid Cap Value Adv Fund 1, 18 17.06 6.49 14.17 7.13 6.59 07/02/2007 59 64 44 38 1.38 / 1.38-
-AMCSX
Average Annual Total Returns through 12/31/2016Percentile Rankings as of
12/31/2016
Inv Manager or Sub-AdvisorInvestment Option 1 yr. 3 yr. 5 yr. 10 yr.
SinceInception
InceptionDate 1 yr. 3 yr. 5 yr. 10 yr.
Total Inv.Exp. Net /
Gross
ContractualCap/WaiverExpire Date
TickerSymbol
R5
BlackRock Advisors, LLC
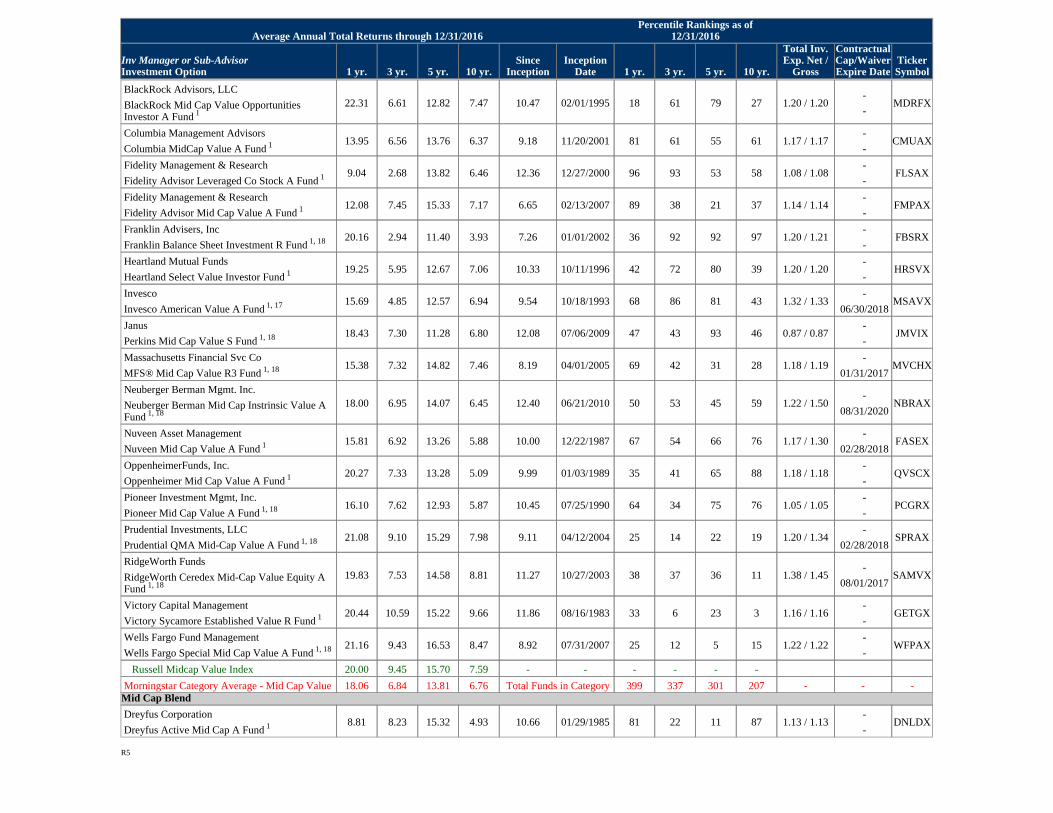
BlackRock Mid Cap Value OpportunitiesInvestor A Fund 1
22.31 6.61 12.82 7.47 10.47 02/01/1995 18 61 79 27 1.20 / 1.20-
-MDRFX
Columbia Management Advisors
Columbia MidCap Value A Fund 1 13.95 6.56 13.76 6.37 9.18 11/20/2001 81 61 55 61 1.17 / 1.17-
-CMUAX
Fidelity Management & Research
Fidelity Advisor Leveraged Co Stock A Fund 1 9.04 2.68 13.82 6.46 12.36 12/27/2000 96 93 53 58 1.08 / 1.08-
-FLSAX
Fidelity Management & Research
Fidelity Advisor Mid Cap Value A Fund 1 12.08 7.45 15.33 7.17 6.65 02/13/2007 89 38 21 37 1.14 / 1.14-
-FMPAX
Franklin Advisers, Inc
Franklin Balance Sheet Investment R Fund 1, 18 20.16 2.94 11.40 3.93 7.26 01/01/2002 36 92 92 97 1.20 / 1.21-
-FBSRX
Heartland Mutual Funds
Heartland Select Value Investor Fund 1 19.25 5.95 12.67 7.06 10.33 10/11/1996 42 72 80 39 1.20 / 1.20-
-HRSVX
Invesco
Invesco American Value A Fund 1, 17 15.69 4.85 12.57 6.94 9.54 10/18/1993 68 86 81 43 1.32 / 1.33-
06/30/2018MSAVX
Janus
Perkins Mid Cap Value S Fund 1, 18 18.43 7.30 11.28 6.80 12.08 07/06/2009 47 43 93 46 0.87 / 0.87-
-JMVIX
Massachusetts Financial Svc Co
MFS® Mid Cap Value R3 Fund 1, 18 15.38 7.32 14.82 7.46 8.19 04/01/2005 69 42 31 28 1.18 / 1.19-
01/31/2017MVCHX
Neuberger Berman Mgmt. Inc.
Neuberger Berman Mid Cap Instrinsic Value AFund 1, 18
18.00 6.95 14.07 6.45 12.40 06/21/2010 50 53 45 59 1.22 / 1.50-
08/31/2020NBRAX
Nuveen Asset Management
Nuveen Mid Cap Value A Fund 1 15.81 6.92 13.26 5.88 10.00 12/22/1987 67 54 66 76 1.17 / 1.30-
02/28/2018FASEX
OppenheimerFunds, Inc.
Oppenheimer Mid Cap Value A Fund 1 20.27 7.33 13.28 5.09 9.99 01/03/1989 35 41 65 88 1.18 / 1.18-
-QVSCX
Pioneer Investment Mgmt, Inc.
Pioneer Mid Cap Value A Fund 1, 18 16.10 7.62 12.93 5.87 10.45 07/25/1990 64 34 75 76 1.05 / 1.05-
-PCGRX
Prudential Investments, LLC
Prudential QMA Mid-Cap Value A Fund 1, 18 21.08 9.10 15.29 7.98 9.11 04/12/2004 25 14 22 19 1.20 / 1.34-
02/28/2018SPRAX
RidgeWorth Funds
RidgeWorth Ceredex Mid-Cap Value Equity AFund 1, 18
19.83 7.53 14.58 8.81 11.27 10/27/2003 38 37 36 11 1.38 / 1.45-
08/01/2017SAMVX
Victory Capital Management
Victory Sycamore Established Value R Fund 1 20.44 10.59 15.22 9.66 11.86 08/16/1983 33 6 23 3 1.16 / 1.16-
-GETGX
Wells Fargo Fund Management
Wells Fargo Special Mid Cap Value A Fund 1, 18 21.16 9.43 16.53 8.47 8.92 07/31/2007 25 12 5 15 1.22 / 1.22-
-WFPAX
Russell Midcap Value Index 20.00 9.45 15.70 7.59 - - - - - -
Morningstar Category Average - Mid Cap Value 18.06 6.84 13.81 6.76 Total Funds in Category 399 337 301 207 - - -Mid Cap Blend
Dreyfus Corporation
Dreyfus Active Mid Cap A Fund 1 8.81 8.23 15.32 4.93 10.66 01/29/1985 81 22 11 87 1.13 / 1.13-
-DNLDX
Average Annual Total Returns through 12/31/2016Percentile Rankings as of
12/31/2016
Inv Manager or Sub-AdvisorInvestment Option 1 yr. 3 yr. 5 yr. 10 yr.
SinceInception
InceptionDate 1 yr. 3 yr. 5 yr. 10 yr.
Total Inv.Exp. Net /
Gross
ContractualCap/WaiverExpire Date
TickerSymbol
R5
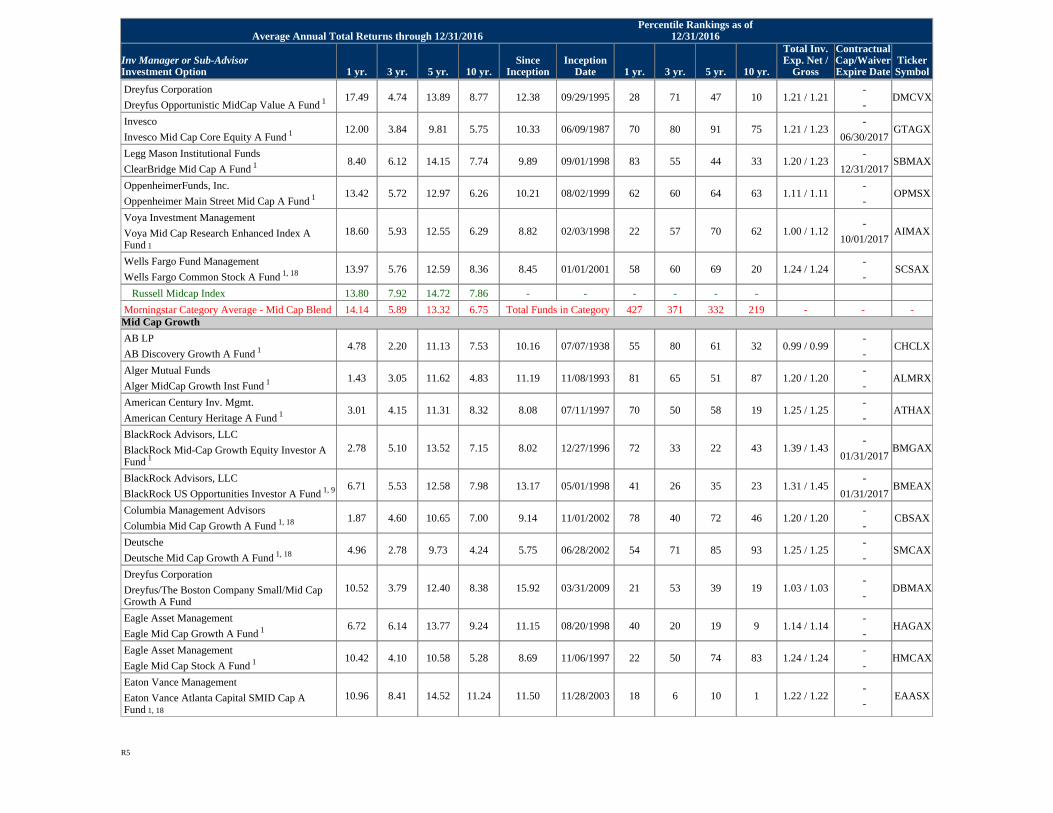
Dreyfus Corporation
Dreyfus Opportunistic MidCap Value A Fund 1 17.49 4.74 13.89 8.77 12.38 09/29/1995 28 71 47 10 1.21 / 1.21-
-DMCVX
Invesco
Invesco Mid Cap Core Equity A Fund 1 12.00 3.84 9.81 5.75 10.33 06/09/1987 70 80 91 75 1.21 / 1.23-
06/30/2017GTAGX
Legg Mason Institutional Funds
ClearBridge Mid Cap A Fund 1 8.40 6.12 14.15 7.74 9.89 09/01/1998 83 55 44 33 1.20 / 1.23-
12/31/2017SBMAX
OppenheimerFunds, Inc.
Oppenheimer Main Street Mid Cap A Fund 1 13.42 5.72 12.97 6.26 10.21 08/02/1999 62 60 64 63 1.11 / 1.11-
-OPMSX
Voya Investment Management
Voya Mid Cap Research Enhanced Index AFund 1
18.60 5.93 12.55 6.29 8.82 02/03/1998 22 57 70 62 1.00 / 1.12-
10/01/2017AIMAX
Wells Fargo Fund Management
Wells Fargo Common Stock A Fund 1, 18 13.97 5.76 12.59 8.36 8.45 01/01/2001 58 60 69 20 1.24 / 1.24-
-SCSAX
Russell Midcap Index 13.80 7.92 14.72 7.86 - - - - - -
Morningstar Category Average - Mid Cap Blend 14.14 5.89 13.32 6.75 Total Funds in Category 427 371 332 219 - - -Mid Cap Growth
AB LP
AB Discovery Growth A Fund 1 4.78 2.20 11.13 7.53 10.16 07/07/1938 55 80 61 32 0.99 / 0.99-
-CHCLX
Alger Mutual Funds
Alger MidCap Growth Inst Fund 1 1.43 3.05 11.62 4.83 11.19 11/08/1993 81 65 51 87 1.20 / 1.20-
-ALMRX
American Century Inv. Mgmt.
American Century Heritage A Fund 1 3.01 4.15 11.31 8.32 8.08 07/11/1997 70 50 58 19 1.25 / 1.25-
-ATHAX
BlackRock Advisors, LLC
BlackRock Mid-Cap Growth Equity Investor AFund 1
2.78 5.10 13.52 7.15 8.02 12/27/1996 72 33 22 43 1.39 / 1.43-
01/31/2017BMGAX
BlackRock Advisors, LLC
BlackRock US Opportunities Investor A Fund 1, 9 6.71 5.53 12.58 7.98 13.17 05/01/1998 41 26 35 23 1.31 / 1.45-
01/31/2017BMEAX
Columbia Management Advisors
Columbia Mid Cap Growth A Fund 1, 18 1.87 4.60 10.65 7.00 9.14 11/01/2002 78 40 72 46 1.20 / 1.20-
-CBSAX
Deutsche
Deutsche Mid Cap Growth A Fund 1, 18 4.96 2.78 9.73 4.24 5.75 06/28/2002 54 71 85 93 1.25 / 1.25-
-SMCAX
Dreyfus Corporation
Dreyfus/The Boston Company Small/Mid CapGrowth A Fund
10.52 3.79 12.40 8.38 15.92 03/31/2009 21 53 39 19 1.03 / 1.03-
-DBMAX
Eagle Asset Management
Eagle Mid Cap Growth A Fund 1 6.72 6.14 13.77 9.24 11.15 08/20/1998 40 20 19 9 1.14 / 1.14-
-HAGAX
Eagle Asset Management
Eagle Mid Cap Stock A Fund 1 10.42 4.10 10.58 5.28 8.69 11/06/1997 22 50 74 83 1.24 / 1.24-
-HMCAX
Eaton Vance Management
Eaton Vance Atlanta Capital SMID Cap AFund 1, 18
10.96 8.41 14.52 11.24 11.50 11/28/2003 18 6 10 1 1.22 / 1.22-
-EAASX
Average Annual Total Returns through 12/31/2016Percentile Rankings as of
12/31/2016
Inv Manager or Sub-AdvisorInvestment Option 1 yr. 3 yr. 5 yr. 10 yr.
SinceInception
InceptionDate 1 yr. 3 yr. 5 yr. 10 yr.
Total Inv.Exp. Net /
Gross
ContractualCap/WaiverExpire Date
TickerSymbol
R5
Federated Investment Mgmt.
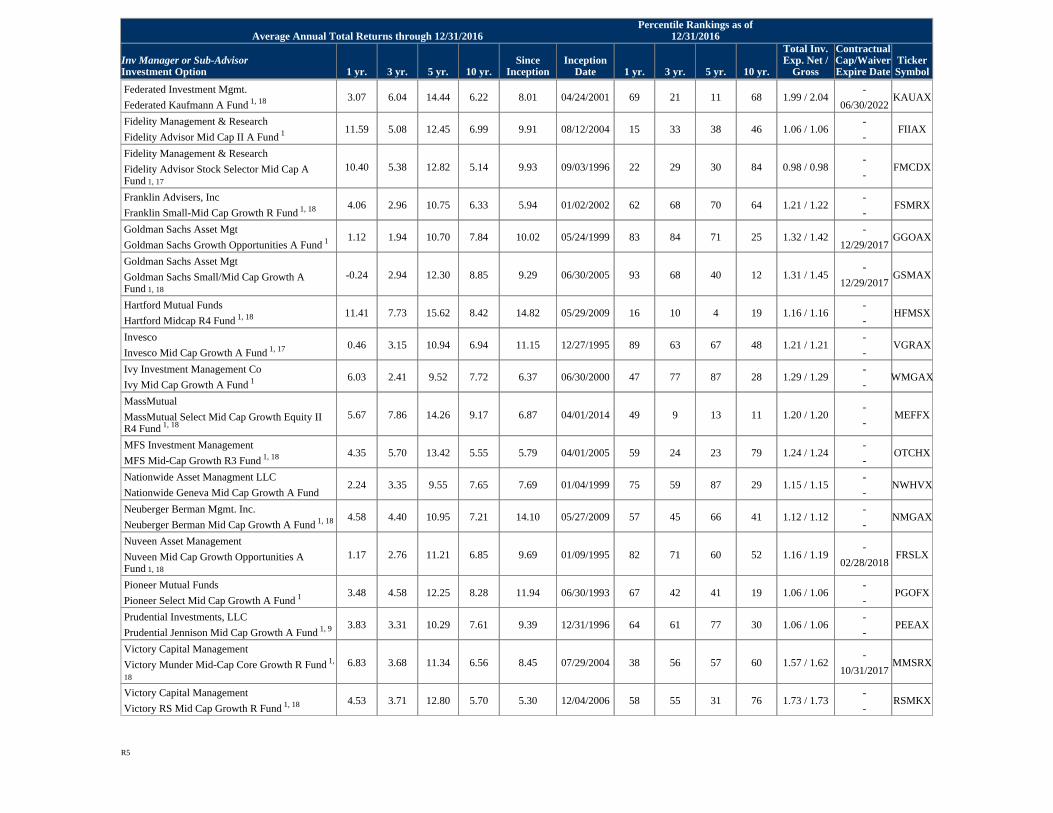
Federated Kaufmann A Fund 1, 18 3.07 6.04 14.44 6.22 8.01 04/24/2001 69 21 11 68 1.99 / 2.04-
06/30/2022KAUAX
Fidelity Management & Research
Fidelity Advisor Mid Cap II A Fund 1 11.59 5.08 12.45 6.99 9.91 08/12/2004 15 33 38 46 1.06 / 1.06-
-FIIAX
Fidelity Management & Research
Fidelity Advisor Stock Selector Mid Cap AFund 1, 17
10.40 5.38 12.82 5.14 9.93 09/03/1996 22 29 30 84 0.98 / 0.98-
-FMCDX
Franklin Advisers, Inc
Franklin Small-Mid Cap Growth R Fund 1, 18 4.06 2.96 10.75 6.33 5.94 01/02/2002 62 68 70 64 1.21 / 1.22-
-FSMRX
Goldman Sachs Asset Mgt
Goldman Sachs Growth Opportunities A Fund 1 1.12 1.94 10.70 7.84 10.02 05/24/1999 83 84 71 25 1.32 / 1.42-
12/29/2017GGOAX
Goldman Sachs Asset Mgt
Goldman Sachs Small/Mid Cap Growth AFund 1, 18
-0.24 2.94 12.30 8.85 9.29 06/30/2005 93 68 40 12 1.31 / 1.45-
12/29/2017GSMAX
Hartford Mutual Funds
Hartford Midcap R4 Fund 1, 18 11.41 7.73 15.62 8.42 14.82 05/29/2009 16 10 4 19 1.16 / 1.16-
-HFMSX
Invesco
Invesco Mid Cap Growth A Fund 1, 17 0.46 3.15 10.94 6.94 11.15 12/27/1995 89 63 67 48 1.21 / 1.21-
-VGRAX
Ivy Investment Management Co
Ivy Mid Cap Growth A Fund 1 6.03 2.41 9.52 7.72 6.37 06/30/2000 47 77 87 28 1.29 / 1.29-
-WMGAX
MassMutual
MassMutual Select Mid Cap Growth Equity IIR4 Fund 1, 18
5.67 7.86 14.26 9.17 6.87 04/01/2014 49 9 13 11 1.20 / 1.20-
-MEFFX
MFS Investment Management
MFS Mid-Cap Growth R3 Fund 1, 18 4.35 5.70 13.42 5.55 5.79 04/01/2005 59 24 23 79 1.24 / 1.24-
-OTCHX
Nationwide Asset Managment LLC
Nationwide Geneva Mid Cap Growth A Fund2.24 3.35 9.55 7.65 7.69 01/04/1999 75 59 87 29 1.15 / 1.15
-
-NWHVX
Neuberger Berman Mgmt. Inc.
Neuberger Berman Mid Cap Growth A Fund 1, 18 4.58 4.40 10.95 7.21 14.10 05/27/2009 57 45 66 41 1.12 / 1.12-
-NMGAX
Nuveen Asset Management
Nuveen Mid Cap Growth Opportunities AFund 1, 18
1.17 2.76 11.21 6.85 9.69 01/09/1995 82 71 60 52 1.16 / 1.19-
02/28/2018FRSLX
Pioneer Mutual Funds
Pioneer Select Mid Cap Growth A Fund 1 3.48 4.58 12.25 8.28 11.94 06/30/1993 67 42 41 19 1.06 / 1.06-
-PGOFX
Prudential Investments, LLC
Prudential Jennison Mid Cap Growth A Fund 1, 9 3.83 3.31 10.29 7.61 9.39 12/31/1996 64 61 77 30 1.06 / 1.06-
-PEEAX
Victory Capital Management
Victory Munder Mid-Cap Core Growth R Fund 1,
18
6.83 3.68 11.34 6.56 8.45 07/29/2004 38 56 57 60 1.57 / 1.62-
10/31/2017MMSRX
Victory Capital Management
Victory RS Mid Cap Growth R Fund 1, 18 4.53 3.71 12.80 5.70 5.30 12/04/2006 58 55 31 76 1.73 / 1.73-
-RSMKX
Average Annual Total Returns through 12/31/2016Percentile Rankings as of
12/31/2016
Inv Manager or Sub-AdvisorInvestment Option 1 yr. 3 yr. 5 yr. 10 yr.
SinceInception
InceptionDate 1 yr. 3 yr. 5 yr. 10 yr.
Total Inv.Exp. Net /
Gross
ContractualCap/WaiverExpire Date
TickerSymbol
R5
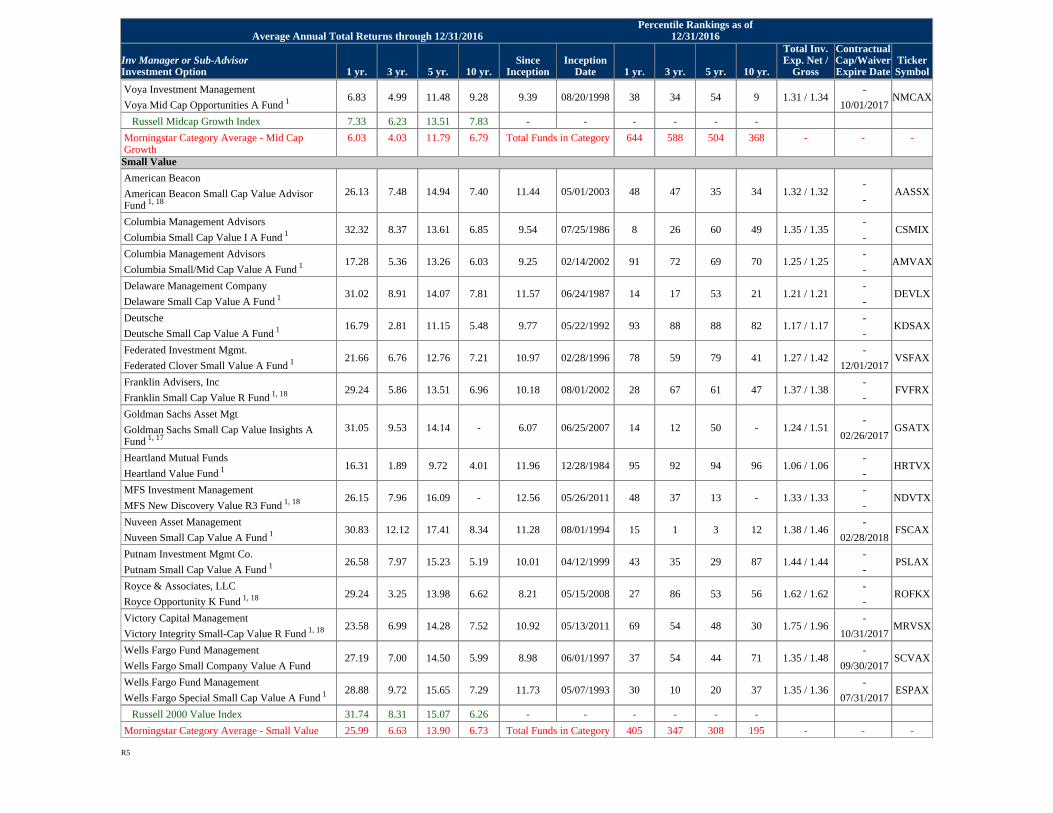
Voya Investment Management
Voya Mid Cap Opportunities A Fund 1 6.83 4.99 11.48 9.28 9.39 08/20/1998 38 34 54 9 1.31 / 1.34-
10/01/2017NMCAX
Russell Midcap Growth Index 7.33 6.23 13.51 7.83 - - - - - -
Morningstar Category Average - Mid CapGrowth
6.03 4.03 11.79 6.79 Total Funds in Category 644 588 504 368 - - -
Small Value
American Beacon
American Beacon Small Cap Value AdvisorFund 1, 18
26.13 7.48 14.94 7.40 11.44 05/01/2003 48 47 35 34 1.32 / 1.32-
-AASSX
Columbia Management Advisors
Columbia Small Cap Value I A Fund 1 32.32 8.37 13.61 6.85 9.54 07/25/1986 8 26 60 49 1.35 / 1.35-
-CSMIX
Columbia Management Advisors
Columbia Small/Mid Cap Value A Fund 1 17.28 5.36 13.26 6.03 9.25 02/14/2002 91 72 69 70 1.25 / 1.25-
-AMVAX
Delaware Management Company
Delaware Small Cap Value A Fund 1 31.02 8.91 14.07 7.81 11.57 06/24/1987 14 17 53 21 1.21 / 1.21-
-DEVLX
Deutsche
Deutsche Small Cap Value A Fund 1 16.79 2.81 11.15 5.48 9.77 05/22/1992 93 88 88 82 1.17 / 1.17-
-KDSAX
Federated Investment Mgmt.
Federated Clover Small Value A Fund 1 21.66 6.76 12.76 7.21 10.97 02/28/1996 78 59 79 41 1.27 / 1.42-
12/01/2017VSFAX
Franklin Advisers, Inc
Franklin Small Cap Value R Fund 1, 18 29.24 5.86 13.51 6.96 10.18 08/01/2002 28 67 61 47 1.37 / 1.38-
-FVFRX
Goldman Sachs Asset Mgt
Goldman Sachs Small Cap Value Insights AFund 1, 17
31.05 9.53 14.14 - 6.07 06/25/2007 14 12 50 - 1.24 / 1.51-
02/26/2017GSATX
Heartland Mutual Funds
Heartland Value Fund 1 16.31 1.89 9.72 4.01 11.96 12/28/1984 95 92 94 96 1.06 / 1.06-
-HRTVX
MFS Investment Management
MFS New Discovery Value R3 Fund 1, 18 26.15 7.96 16.09 - 12.56 05/26/2011 48 37 13 - 1.33 / 1.33-
-NDVTX
Nuveen Asset Management
Nuveen Small Cap Value A Fund 1 30.83 12.12 17.41 8.34 11.28 08/01/1994 15 1 3 12 1.38 / 1.46-
02/28/2018FSCAX
Putnam Investment Mgmt Co.
Putnam Small Cap Value A Fund 1 26.58 7.97 15.23 5.19 10.01 04/12/1999 43 35 29 87 1.44 / 1.44-
-PSLAX
Royce & Associates, LLC
Royce Opportunity K Fund 1, 18 29.24 3.25 13.98 6.62 8.21 05/15/2008 27 86 53 56 1.62 / 1.62-
-ROFKX
Victory Capital Management
Victory Integrity Small-Cap Value R Fund 1, 18 23.58 6.99 14.28 7.52 10.92 05/13/2011 69 54 48 30 1.75 / 1.96-
10/31/2017MRVSX
Wells Fargo Fund Management
Wells Fargo Small Company Value A Fund27.19 7.00 14.50 5.99 8.98 06/01/1997 37 54 44 71 1.35 / 1.48
-
09/30/2017SCVAX
Wells Fargo Fund Management
Wells Fargo Special Small Cap Value A Fund 1 28.88 9.72 15.65 7.29 11.73 05/07/1993 30 10 20 37 1.35 / 1.36-
07/31/2017ESPAX
Russell 2000 Value Index 31.74 8.31 15.07 6.26 - - - - - -
Morningstar Category Average - Small Value 25.99 6.63 13.90 6.73 Total Funds in Category 405 347 308 195 - - -
Average Annual Total Returns through 12/31/2016Percentile Rankings as of
12/31/2016
Inv Manager or Sub-AdvisorInvestment Option 1 yr. 3 yr. 5 yr. 10 yr.
SinceInception
InceptionDate 1 yr. 3 yr. 5 yr. 10 yr.
Total Inv.Exp. Net /
Gross
ContractualCap/WaiverExpire Date
TickerSymbol
R5
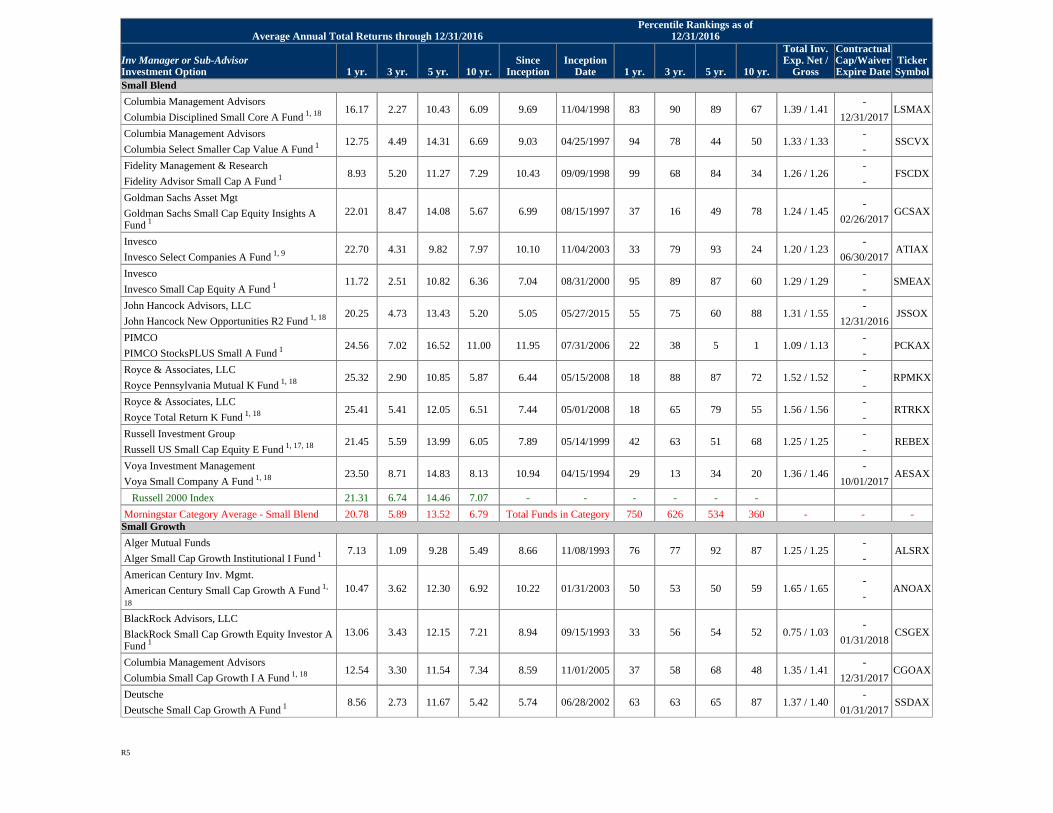
Small Blend
Columbia Management Advisors
Columbia Disciplined Small Core A Fund 1, 18 16.17 2.27 10.43 6.09 9.69 11/04/1998 83 90 89 67 1.39 / 1.41-
12/31/2017LSMAX
Columbia Management Advisors
Columbia Select Smaller Cap Value A Fund 1 12.75 4.49 14.31 6.69 9.03 04/25/1997 94 78 44 50 1.33 / 1.33-
-SSCVX
Fidelity Management & Research
Fidelity Advisor Small Cap A Fund 1 8.93 5.20 11.27 7.29 10.43 09/09/1998 99 68 84 34 1.26 / 1.26-
-FSCDX
Goldman Sachs Asset Mgt
Goldman Sachs Small Cap Equity Insights AFund 1
22.01 8.47 14.08 5.67 6.99 08/15/1997 37 16 49 78 1.24 / 1.45-
02/26/2017GCSAX
Invesco
Invesco Select Companies A Fund 1, 9 22.70 4.31 9.82 7.97 10.10 11/04/2003 33 79 93 24 1.20 / 1.23-
06/30/2017ATIAX
Invesco
Invesco Small Cap Equity A Fund 1 11.72 2.51 10.82 6.36 7.04 08/31/2000 95 89 87 60 1.29 / 1.29-
-SMEAX
John Hancock Advisors, LLC
John Hancock New Opportunities R2 Fund 1, 18 20.25 4.73 13.43 5.20 5.05 05/27/2015 55 75 60 88 1.31 / 1.55-
12/31/2016JSSOX
PIMCO
PIMCO StocksPLUS Small A Fund 1 24.56 7.02 16.52 11.00 11.95 07/31/2006 22 38 5 1 1.09 / 1.13-
-PCKAX
Royce & Associates, LLC
Royce Pennsylvania Mutual K Fund 1, 18 25.32 2.90 10.85 5.87 6.44 05/15/2008 18 88 87 72 1.52 / 1.52-
-RPMKX
Royce & Associates, LLC
Royce Total Return K Fund 1, 18 25.41 5.41 12.05 6.51 7.44 05/01/2008 18 65 79 55 1.56 / 1.56-
-RTRKX
Russell Investment Group
Russell US Small Cap Equity E Fund 1, 17, 18 21.45 5.59 13.99 6.05 7.89 05/14/1999 42 63 51 68 1.25 / 1.25-
-REBEX
Voya Investment Management
Voya Small Company A Fund 1, 18 23.50 8.71 14.83 8.13 10.94 04/15/1994 29 13 34 20 1.36 / 1.46-
10/01/2017AESAX
Russell 2000 Index 21.31 6.74 14.46 7.07 - - - - - -
Morningstar Category Average - Small Blend 20.78 5.89 13.52 6.79 Total Funds in Category 750 626 534 360 - - -Small Growth
Alger Mutual Funds
Alger Small Cap Growth Institutional I Fund 1 7.13 1.09 9.28 5.49 8.66 11/08/1993 76 77 92 87 1.25 / 1.25-
-ALSRX
American Century Inv. Mgmt.
American Century Small Cap Growth A Fund 1,
18
10.47 3.62 12.30 6.92 10.22 01/31/2003 50 53 50 59 1.65 / 1.65-
-ANOAX
BlackRock Advisors, LLC
BlackRock Small Cap Growth Equity Investor AFund 1
13.06 3.43 12.15 7.21 8.94 09/15/1993 33 56 54 52 0.75 / 1.03-
01/31/2018CSGEX
Columbia Management Advisors
Columbia Small Cap Growth I A Fund 1, 18 12.54 3.30 11.54 7.34 8.59 11/01/2005 37 58 68 48 1.35 / 1.41-
12/31/2017CGOAX
Deutsche
Deutsche Small Cap Growth A Fund 1 8.56 2.73 11.67 5.42 5.74 06/28/2002 63 63 65 87 1.37 / 1.40-
01/31/2017SSDAX
Average Annual Total Returns through 12/31/2016Percentile Rankings as of
12/31/2016
Inv Manager or Sub-AdvisorInvestment Option 1 yr. 3 yr. 5 yr. 10 yr.
SinceInception
InceptionDate 1 yr. 3 yr. 5 yr. 10 yr.
Total Inv.Exp. Net /
Gross
ContractualCap/WaiverExpire Date
TickerSymbol
R5
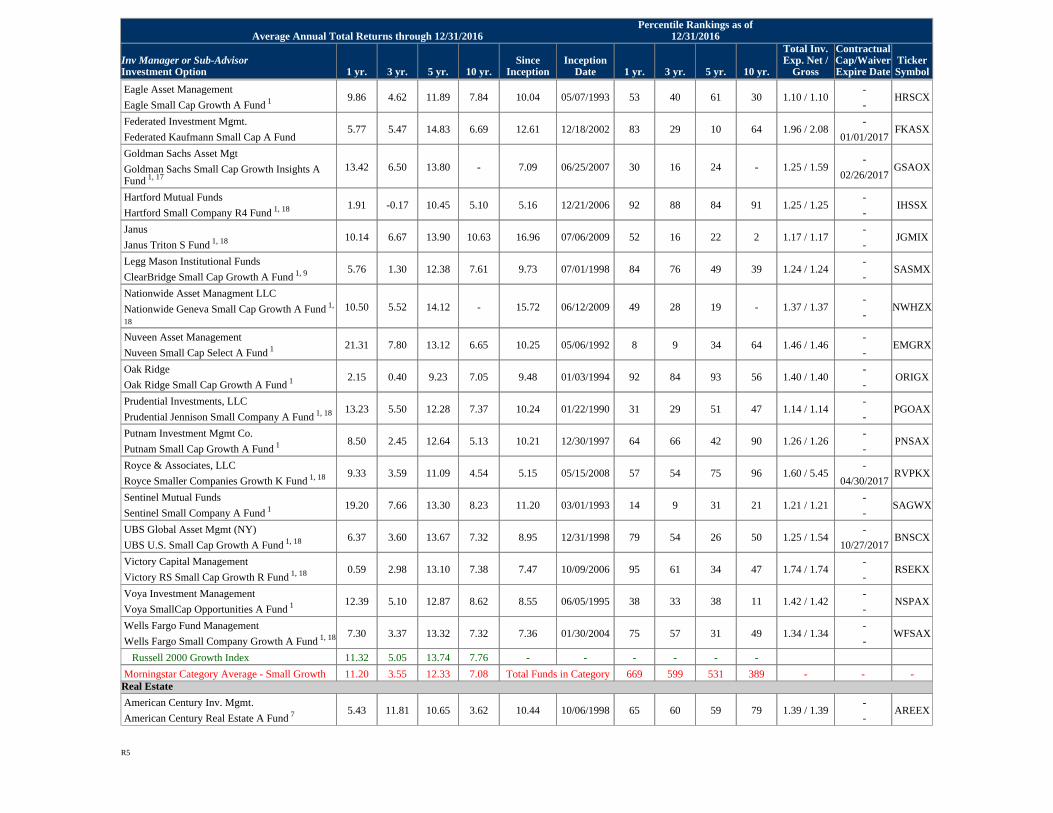
Eagle Asset Management
Eagle Small Cap Growth A Fund 1 9.86 4.62 11.89 7.84 10.04 05/07/1993 53 40 61 30 1.10 / 1.10-
-HRSCX
Federated Investment Mgmt.
Federated Kaufmann Small Cap A Fund5.77 5.47 14.83 6.69 12.61 12/18/2002 83 29 10 64 1.96 / 2.08
-
01/01/2017FKASX
Goldman Sachs Asset Mgt
Goldman Sachs Small Cap Growth Insights AFund 1, 17
13.42 6.50 13.80 - 7.09 06/25/2007 30 16 24 - 1.25 / 1.59-
02/26/2017GSAOX
Hartford Mutual Funds
Hartford Small Company R4 Fund 1, 18 1.91 -0.17 10.45 5.10 5.16 12/21/2006 92 88 84 91 1.25 / 1.25-
-IHSSX
Janus
Janus Triton S Fund 1, 18 10.14 6.67 13.90 10.63 16.96 07/06/2009 52 16 22 2 1.17 / 1.17-
-JGMIX
Legg Mason Institutional Funds
ClearBridge Small Cap Growth A Fund 1, 9 5.76 1.30 12.38 7.61 9.73 07/01/1998 84 76 49 39 1.24 / 1.24-
-SASMX
Nationwide Asset Managment LLC
Nationwide Geneva Small Cap Growth A Fund 1,
18
10.50 5.52 14.12 - 15.72 06/12/2009 49 28 19 - 1.37 / 1.37-
-NWHZX
Nuveen Asset Management
Nuveen Small Cap Select A Fund 1 21.31 7.80 13.12 6.65 10.25 05/06/1992 8 9 34 64 1.46 / 1.46-
-EMGRX
Oak Ridge
Oak Ridge Small Cap Growth A Fund 1 2.15 0.40 9.23 7.05 9.48 01/03/1994 92 84 93 56 1.40 / 1.40-
-ORIGX
Prudential Investments, LLC
Prudential Jennison Small Company A Fund 1, 18 13.23 5.50 12.28 7.37 10.24 01/22/1990 31 29 51 47 1.14 / 1.14-
-PGOAX
Putnam Investment Mgmt Co.
Putnam Small Cap Growth A Fund 1 8.50 2.45 12.64 5.13 10.21 12/30/1997 64 66 42 90 1.26 / 1.26-
-PNSAX
Royce & Associates, LLC
Royce Smaller Companies Growth K Fund 1, 18 9.33 3.59 11.09 4.54 5.15 05/15/2008 57 54 75 96 1.60 / 5.45-
04/30/2017RVPKX
Sentinel Mutual Funds
Sentinel Small Company A Fund 1 19.20 7.66 13.30 8.23 11.20 03/01/1993 14 9 31 21 1.21 / 1.21-
-SAGWX
UBS Global Asset Mgmt (NY)
UBS U.S. Small Cap Growth A Fund 1, 18 6.37 3.60 13.67 7.32 8.95 12/31/1998 79 54 26 50 1.25 / 1.54-
10/27/2017BNSCX
Victory Capital Management
Victory RS Small Cap Growth R Fund 1, 18 0.59 2.98 13.10 7.38 7.47 10/09/2006 95 61 34 47 1.74 / 1.74-
-RSEKX
Voya Investment Management
Voya SmallCap Opportunities A Fund 1 12.39 5.10 12.87 8.62 8.55 06/05/1995 38 33 38 11 1.42 / 1.42-
-NSPAX
Wells Fargo Fund Management
Wells Fargo Small Company Growth A Fund 1, 18 7.30 3.37 13.32 7.32 7.36 01/30/2004 75 57 31 49 1.34 / 1.34-
-WFSAX
Russell 2000 Growth Index 11.32 5.05 13.74 7.76 - - - - - -
Morningstar Category Average - Small Growth 11.20 3.55 12.33 7.08 Total Funds in Category 669 599 531 389 - - -Real Estate
American Century Inv. Mgmt.
American Century Real Estate A Fund 7 5.43 11.81 10.65 3.62 10.44 10/06/1998 65 60 59 79 1.39 / 1.39-
-AREEX
Average Annual Total Returns through 12/31/2016Percentile Rankings as of
12/31/2016
Inv Manager or Sub-AdvisorInvestment Option 1 yr. 3 yr. 5 yr. 10 yr.
SinceInception
InceptionDate 1 yr. 3 yr. 5 yr. 10 yr.
Total Inv.Exp. Net /
Gross
ContractualCap/WaiverExpire Date
TickerSymbol
R5
Delaware Management Company
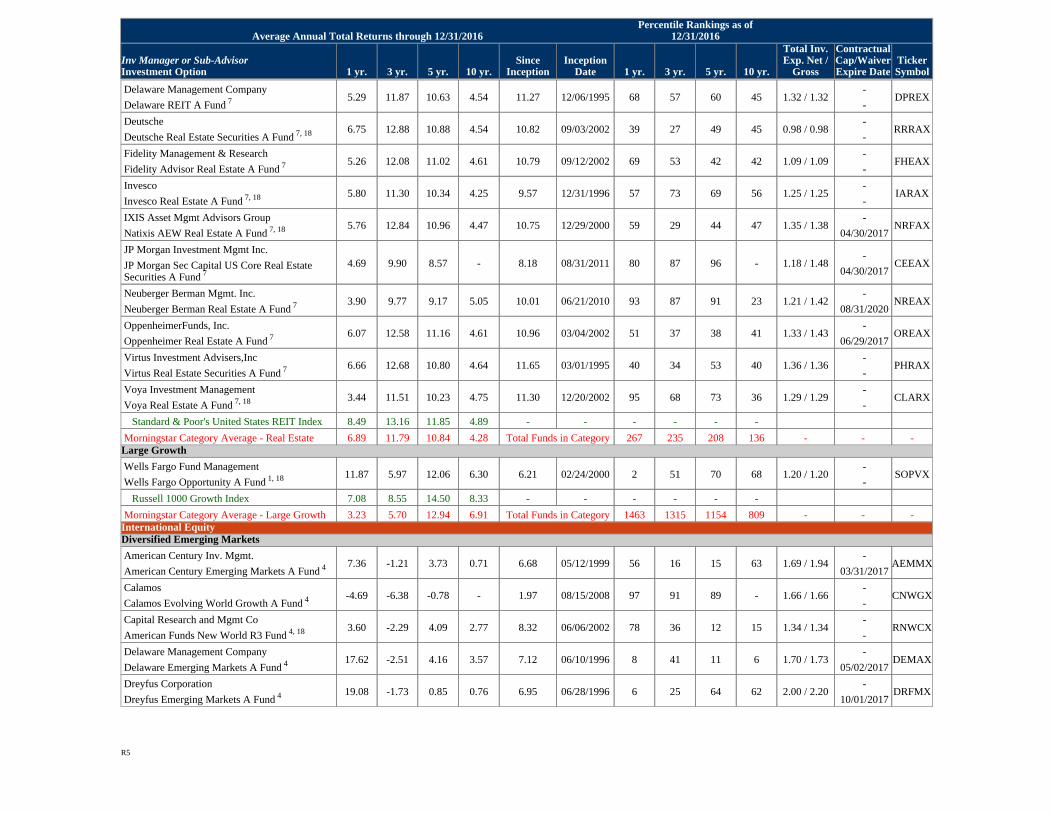
Delaware REIT A Fund 7 5.29 11.87 10.63 4.54 11.27 12/06/1995 68 57 60 45 1.32 / 1.32-
-DPREX
Deutsche
Deutsche Real Estate Securities A Fund 7, 18 6.75 12.88 10.88 4.54 10.82 09/03/2002 39 27 49 45 0.98 / 0.98-
-RRRAX
Fidelity Management & Research
Fidelity Advisor Real Estate A Fund 7 5.26 12.08 11.02 4.61 10.79 09/12/2002 69 53 42 42 1.09 / 1.09-
-FHEAX
Invesco
Invesco Real Estate A Fund 7, 18 5.80 11.30 10.34 4.25 9.57 12/31/1996 57 73 69 56 1.25 / 1.25-
-IARAX
IXIS Asset Mgmt Advisors Group
Natixis AEW Real Estate A Fund 7, 18 5.76 12.84 10.96 4.47 10.75 12/29/2000 59 29 44 47 1.35 / 1.38-
04/30/2017NRFAX
JP Morgan Investment Mgmt Inc.
JP Morgan Sec Capital US Core Real EstateSecurities A Fund 7
4.69 9.90 8.57 - 8.18 08/31/2011 80 87 96 - 1.18 / 1.48-
04/30/2017CEEAX
Neuberger Berman Mgmt. Inc.
Neuberger Berman Real Estate A Fund 7 3.90 9.77 9.17 5.05 10.01 06/21/2010 93 87 91 23 1.21 / 1.42-
08/31/2020NREAX
OppenheimerFunds, Inc.
Oppenheimer Real Estate A Fund 7 6.07 12.58 11.16 4.61 10.96 03/04/2002 51 37 38 41 1.33 / 1.43-
06/29/2017OREAX
Virtus Investment Advisers,Inc
Virtus Real Estate Securities A Fund 7 6.66 12.68 10.80 4.64 11.65 03/01/1995 40 34 53 40 1.36 / 1.36-
-PHRAX
Voya Investment Management
Voya Real Estate A Fund 7, 18 3.44 11.51 10.23 4.75 11.30 12/20/2002 95 68 73 36 1.29 / 1.29-
-CLARX
Standard & Poor's United States REIT Index 8.49 13.16 11.85 4.89 - - - - - -
Morningstar Category Average - Real Estate 6.89 11.79 10.84 4.28 Total Funds in Category 267 235 208 136 - - -Large Growth
Wells Fargo Fund Management
Wells Fargo Opportunity A Fund 1, 18 11.87 5.97 12.06 6.30 6.21 02/24/2000 2 51 70 68 1.20 / 1.20-
-SOPVX
Russell 1000 Growth Index 7.08 8.55 14.50 8.33 - - - - - -
Morningstar Category Average - Large Growth 3.23 5.70 12.94 6.91 Total Funds in Category 1463 1315 1154 809 - - -International EquityDiversified Emerging Markets
American Century Inv. Mgmt.
American Century Emerging Markets A Fund 4 7.36 -1.21 3.73 0.71 6.68 05/12/1999 56 16 15 63 1.69 / 1.94-
03/31/2017AEMMX
Calamos
Calamos Evolving World Growth A Fund 4 -4.69 -6.38 -0.78 - 1.97 08/15/2008 97 91 89 - 1.66 / 1.66-
-CNWGX
Capital Research and Mgmt Co
American Funds New World R3 Fund 4, 18 3.60 -2.29 4.09 2.77 8.32 06/06/2002 78 36 12 15 1.34 / 1.34-
-RNWCX
Delaware Management Company
Delaware Emerging Markets A Fund 4 17.62 -2.51 4.16 3.57 7.12 06/10/1996 8 41 11 6 1.70 / 1.73-
05/02/2017DEMAX
Dreyfus Corporation
Dreyfus Emerging Markets A Fund 4 19.08 -1.73 0.85 0.76 6.95 06/28/1996 6 25 64 62 2.00 / 2.20-
10/01/2017DRFMX
Average Annual Total Returns through 12/31/2016Percentile Rankings as of
12/31/2016
Inv Manager or Sub-AdvisorInvestment Option 1 yr. 3 yr. 5 yr. 10 yr.
SinceInception
InceptionDate 1 yr. 3 yr. 5 yr. 10 yr.
Total Inv.Exp. Net /
Gross
ContractualCap/WaiverExpire Date
TickerSymbol
R5

Goldman Sachs Asset Mgt
Goldman Sachs Emerging Markets EquityInsights A Fund 4, 18
10.83 -0.68 3.38 - -0.99 10/05/2007 33 10 20 - 1.55 / 1.67-
02/26/2017GERAX
Russell Investment Group
Russell Emerging Markets E Fund 4 11.20 -3.09 1.15 1.85 8.40 09/22/1998 30 54 58 39 1.77 / 1.77-
-REMEX
Templeton Asset Management
Templeton Developing Markets R Fund 4, 18 17.48 -4.78 -0.81 -0.29 7.78 01/02/2002 8 79 89 89 1.82 / 1.9804/30/2017
04/30/2017TDMRX
Van Eck Associates Corporation
Van Eck Emerging Markets A Fund 4 -0.43 -4.86 4.57 1.15 6.35 12/20/1993 92 80 7 51 1.46 / 1.46-
-GBFAX
Wells Fargo Fund Management
Wells Fargo Emerging Markets Equity A Fund 4,
9
11.65 -2.86 0.09 2.45 6.03 09/06/1994 27 48 77 24 1.61 / 1.61-
-EMGAX
MSCI Emerging Markets NR Index 11.19 -2.55 1.28 1.84 - - - - - -
Morningstar Category Average - DiversifiedEmerging Markets
8.47 -3.18 1.61 1.32 Total Funds in Category 813 606 425 173 - - -
Foreign Large Value
AB LP
AB International Value A Fund 4 -0.97 -1.74 5.75 -3.28 4.28 03/29/2001 87 35 45 94 1.40 / 1.40-
-ABIAX
American Beacon
American Beacon International Equity AdvFund 4, 18
-0.14 -3.34 6.23 0.50 6.84 05/01/2003 81 70 32 32 1.20 / 1.20-
-AAISX
American Century Inv. Mgmt.
American Century International Value A Fund 4 1.36 -3.29 5.36 0.46 3.46 03/31/1997 59 69 55 38 1.57 / 1.57-
-MEQAX
Calvert Asset Management
Calvert International Equity A Fund 4 -3.85 -3.84 5.06 -2.50 3.14 07/02/1992 97 81 64 89 1.39 / 1.45-
01/31/2017CWVGX
Columbia Management Advisors
Columbia Overseas Value A Fund 4, 18 0.80 -0.89 7.08 - 4.19 02/28/2013 67 19 15 - 1.39 / 1.39-
-COAVX
Franklin Templeton Investments
Franklin Mutual International R Fund 4 2.90 0.11 6.70 - 7.90 05/01/2009 40 10 20 - 1.67 / 1.74-
04/30/2017FRMIX
Legg Mason Institutional Funds
ClearBridge International Value A Fund 4 3.30 -3.57 6.43 0.49 5.40 02/18/1986 35 75 26 33 1.31 / 1.56-
12/31/2017SBIEX
T. Rowe Price Associates, Inc.
T. Rowe Price International Growth & Income RFund 4, 18
0.08 -3.12 5.00 -0.09 7.13 09/30/2002 78 63 66 52 1.35 / 1.35-
-RRIGX
Templeton Asset Management
Templeton Foreign R Fund 4, 18 11.42 -2.81 6.61 2.00 5.56 01/02/2002 9 52 21 7 1.47 / 1.47-
-TEFRX
Wells Fargo Fund Management
Wells Fargo International Value A Fund 4 3.97 -2.25 5.53 -0.82 4.52 10/31/2003 31 44 50 71 1.35 / 1.46-
09/30/2017WFFAX
MSCI ACWI Ex USA Value Index 8.92 -2.40 4.58 0.34 - - - - - -
Morningstar Category Average - Foreign LargeValue
3.34 -2.44 5.37 -0.25 Total Funds in Category 337 272 223 139 - - -
Foreign Large Blend
Average Annual Total Returns through 12/31/2016Percentile Rankings as of
12/31/2016
Inv Manager or Sub-AdvisorInvestment Option 1 yr. 3 yr. 5 yr. 10 yr.
SinceInception
InceptionDate 1 yr. 3 yr. 5 yr. 10 yr.
Total Inv.Exp. Net /
Gross
ContractualCap/WaiverExpire Date
TickerSymbol
R5
BlackRock Advisors, LLC
BlackRock International Opportunities InvestorA Fund 4
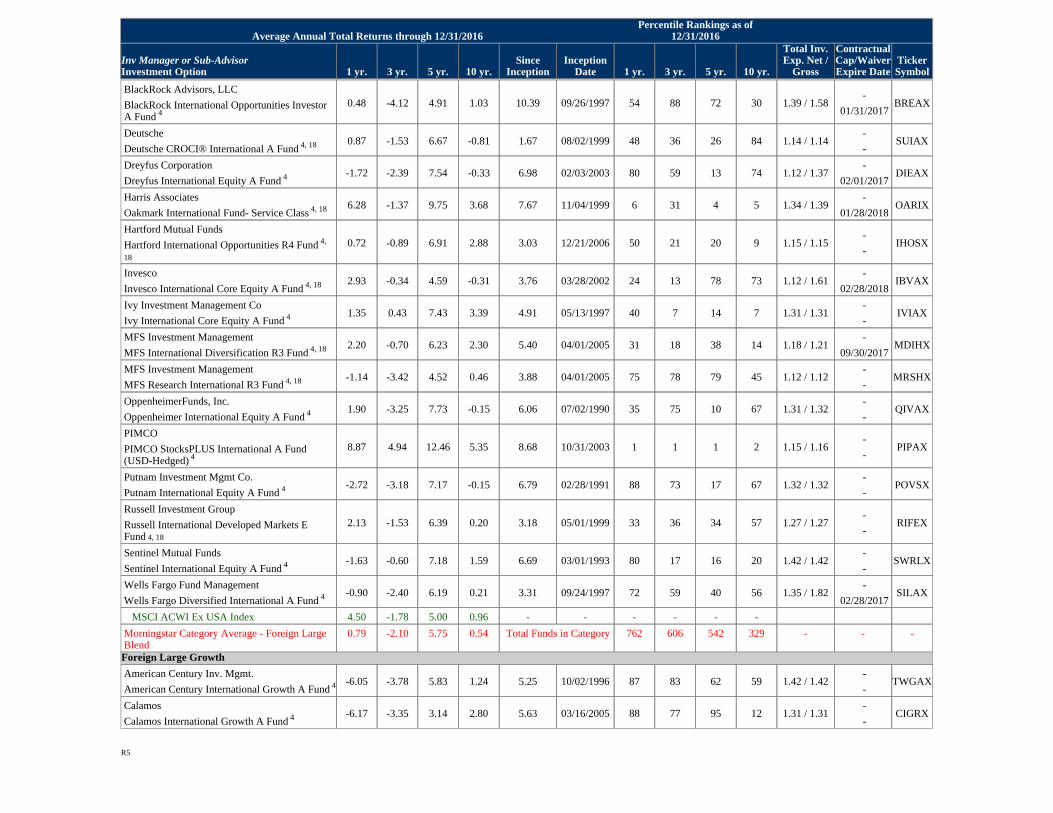
0.48 -4.12 4.91 1.03 10.39 09/26/1997 54 88 72 30 1.39 / 1.58-
01/31/2017BREAX
Deutsche
Deutsche CROCI® International A Fund 4, 18 0.87 -1.53 6.67 -0.81 1.67 08/02/1999 48 36 26 84 1.14 / 1.14-
-SUIAX
Dreyfus Corporation
Dreyfus International Equity A Fund 4 -1.72 -2.39 7.54 -0.33 6.98 02/03/2003 80 59 13 74 1.12 / 1.37-
02/01/2017DIEAX
Harris Associates
Oakmark International Fund- Service Class 4, 18 6.28 -1.37 9.75 3.68 7.67 11/04/1999 6 31 4 5 1.34 / 1.39-
01/28/2018OARIX
Hartford Mutual Funds
Hartford International Opportunities R4 Fund 4,
18
0.72 -0.89 6.91 2.88 3.03 12/21/2006 50 21 20 9 1.15 / 1.15-
-IHOSX
Invesco
Invesco International Core Equity A Fund 4, 18 2.93 -0.34 4.59 -0.31 3.76 03/28/2002 24 13 78 73 1.12 / 1.61-
02/28/2018IBVAX
Ivy Investment Management Co
Ivy International Core Equity A Fund 4 1.35 0.43 7.43 3.39 4.91 05/13/1997 40 7 14 7 1.31 / 1.31-
-IVIAX
MFS Investment Management
MFS International Diversification R3 Fund 4, 18 2.20 -0.70 6.23 2.30 5.40 04/01/2005 31 18 38 14 1.18 / 1.21-
09/30/2017MDIHX
MFS Investment Management
MFS Research International R3 Fund 4, 18 -1.14 -3.42 4.52 0.46 3.88 04/01/2005 75 78 79 45 1.12 / 1.12-
-MRSHX
OppenheimerFunds, Inc.
Oppenheimer International Equity A Fund 4 1.90 -3.25 7.73 -0.15 6.06 07/02/1990 35 75 10 67 1.31 / 1.32-
-QIVAX
PIMCO
PIMCO StocksPLUS International A Fund(USD-Hedged) 4
8.87 4.94 12.46 5.35 8.68 10/31/2003 1 1 1 2 1.15 / 1.16-
-PIPAX
Putnam Investment Mgmt Co.
Putnam International Equity A Fund 4 -2.72 -3.18 7.17 -0.15 6.79 02/28/1991 88 73 17 67 1.32 / 1.32-
-POVSX
Russell Investment Group
Russell International Developed Markets EFund 4, 18
2.13 -1.53 6.39 0.20 3.18 05/01/1999 33 36 34 57 1.27 / 1.27-
-RIFEX
Sentinel Mutual Funds
Sentinel International Equity A Fund 4 -1.63 -0.60 7.18 1.59 6.69 03/01/1993 80 17 16 20 1.42 / 1.42-
-SWRLX
Wells Fargo Fund Management
Wells Fargo Diversified International A Fund 4 -0.90 -2.40 6.19 0.21 3.31 09/24/1997 72 59 40 56 1.35 / 1.82-
02/28/2017SILAX
MSCI ACWI Ex USA Index 4.50 -1.78 5.00 0.96 - - - - - -
Morningstar Category Average - Foreign LargeBlend
0.79 -2.10 5.75 0.54 Total Funds in Category 762 606 542 329 - - -
Foreign Large Growth
American Century Inv. Mgmt.
American Century International Growth A Fund 4 -6.05 -3.78 5.83 1.24 5.25 10/02/1996 87 83 62 59 1.42 / 1.42-
-TWGAX
Calamos
Calamos International Growth A Fund 4 -6.17 -3.35 3.14 2.80 5.63 03/16/2005 88 77 95 12 1.31 / 1.31-
-CIGRX
Average Annual Total Returns through 12/31/2016Percentile Rankings as of
12/31/2016
Inv Manager or Sub-AdvisorInvestment Option 1 yr. 3 yr. 5 yr. 10 yr.
SinceInception
InceptionDate 1 yr. 3 yr. 5 yr. 10 yr.
Total Inv.Exp. Net /
Gross
ContractualCap/WaiverExpire Date
TickerSymbol
R5
Capital Research and Mgmt Co
American Funds EuroPacific Growth R3 Fund 4,
18
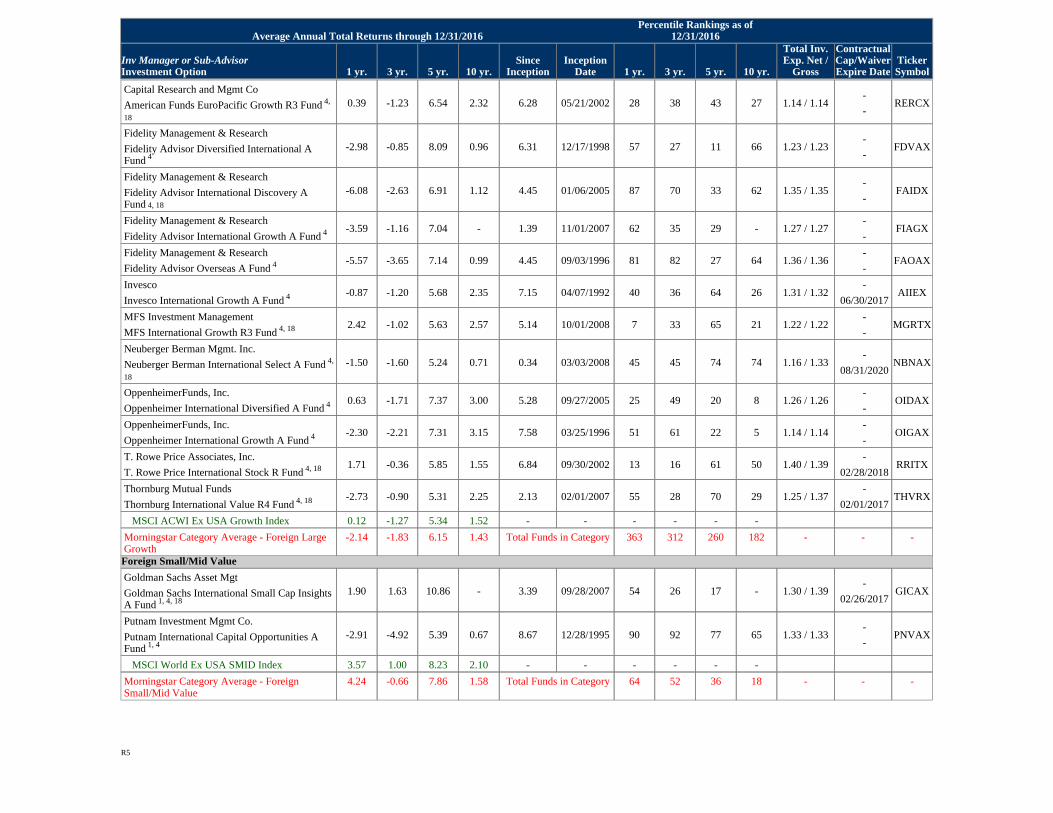
0.39 -1.23 6.54 2.32 6.28 05/21/2002 28 38 43 27 1.14 / 1.14-
-RERCX
Fidelity Management & Research
Fidelity Advisor Diversified International AFund 4
-2.98 -0.85 8.09 0.96 6.31 12/17/1998 57 27 11 66 1.23 / 1.23-
-FDVAX
Fidelity Management & Research
Fidelity Advisor International Discovery AFund 4, 18
-6.08 -2.63 6.91 1.12 4.45 01/06/2005 87 70 33 62 1.35 / 1.35-
-FAIDX
Fidelity Management & Research
Fidelity Advisor International Growth A Fund 4 -3.59 -1.16 7.04 - 1.39 11/01/2007 62 35 29 - 1.27 / 1.27-
-FIAGX
Fidelity Management & Research
Fidelity Advisor Overseas A Fund 4 -5.57 -3.65 7.14 0.99 4.45 09/03/1996 81 82 27 64 1.36 / 1.36-
-FAOAX
Invesco
Invesco International Growth A Fund 4 -0.87 -1.20 5.68 2.35 7.15 04/07/1992 40 36 64 26 1.31 / 1.32-
06/30/2017AIIEX
MFS Investment Management
MFS International Growth R3 Fund 4, 18 2.42 -1.02 5.63 2.57 5.14 10/01/2008 7 33 65 21 1.22 / 1.22-
-MGRTX
Neuberger Berman Mgmt. Inc.
Neuberger Berman International Select A Fund 4,
18
-1.50 -1.60 5.24 0.71 0.34 03/03/2008 45 45 74 74 1.16 / 1.33-
08/31/2020NBNAX
OppenheimerFunds, Inc.
Oppenheimer International Diversified A Fund 4 0.63 -1.71 7.37 3.00 5.28 09/27/2005 25 49 20 8 1.26 / 1.26-
-OIDAX
OppenheimerFunds, Inc.
Oppenheimer International Growth A Fund 4 -2.30 -2.21 7.31 3.15 7.58 03/25/1996 51 61 22 5 1.14 / 1.14-
-OIGAX
T. Rowe Price Associates, Inc.
T. Rowe Price International Stock R Fund 4, 18 1.71 -0.36 5.85 1.55 6.84 09/30/2002 13 16 61 50 1.40 / 1.39-
02/28/2018RRITX
Thornburg Mutual Funds
Thornburg International Value R4 Fund 4, 18 -2.73 -0.90 5.31 2.25 2.13 02/01/2007 55 28 70 29 1.25 / 1.37-
02/01/2017THVRX
MSCI ACWI Ex USA Growth Index 0.12 -1.27 5.34 1.52 - - - - - -
Morningstar Category Average - Foreign LargeGrowth
-2.14 -1.83 6.15 1.43 Total Funds in Category 363 312 260 182 - - -
Foreign Small/Mid Value
Goldman Sachs Asset Mgt
Goldman Sachs International Small Cap InsightsA Fund 1, 4, 18
1.90 1.63 10.86 - 3.39 09/28/2007 54 26 17 - 1.30 / 1.39-
02/26/2017GICAX
Putnam Investment Mgmt Co.
Putnam International Capital Opportunities AFund 1, 4
-2.91 -4.92 5.39 0.67 8.67 12/28/1995 90 92 77 65 1.33 / 1.33-
-PNVAX
MSCI World Ex USA SMID Index 3.57 1.00 8.23 2.10 - - - - - -
Morningstar Category Average - ForeignSmall/Mid Value
4.24 -0.66 7.86 1.58 Total Funds in Category 64 52 36 18 - - -
Average Annual Total Returns through 12/31/2016Percentile Rankings as of
12/31/2016
Inv Manager or Sub-AdvisorInvestment Option 1 yr. 3 yr. 5 yr. 10 yr.
SinceInception
InceptionDate 1 yr. 3 yr. 5 yr. 10 yr.
Total Inv.Exp. Net /
Gross
ContractualCap/WaiverExpire Date
TickerSymbol
R5
Foreign Small/Mid Blend
Voya Investment Management
Voya Multi-Manager International Small Cap AFund 1, 4
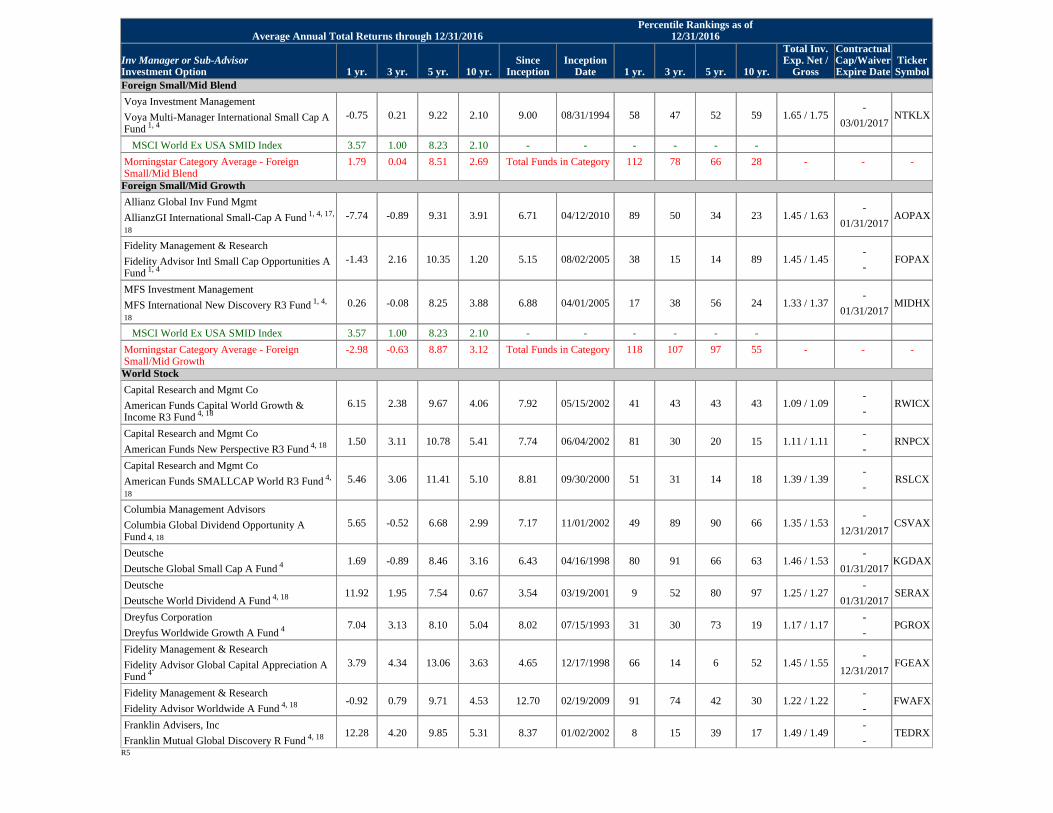
-0.75 0.21 9.22 2.10 9.00 08/31/1994 58 47 52 59 1.65 / 1.75-
03/01/2017NTKLX
MSCI World Ex USA SMID Index 3.57 1.00 8.23 2.10 - - - - - -
Morningstar Category Average - ForeignSmall/Mid Blend
1.79 0.04 8.51 2.69 Total Funds in Category 112 78 66 28 - - -
Foreign Small/Mid Growth
Allianz Global Inv Fund Mgmt
AllianzGI International Small-Cap A Fund 1, 4, 17,
18
-7.74 -0.89 9.31 3.91 6.71 04/12/2010 89 50 34 23 1.45 / 1.63-
01/31/2017AOPAX
Fidelity Management & Research
Fidelity Advisor Intl Small Cap Opportunities AFund 1, 4
-1.43 2.16 10.35 1.20 5.15 08/02/2005 38 15 14 89 1.45 / 1.45-
-FOPAX
MFS Investment Management
MFS International New Discovery R3 Fund 1, 4,
18
0.26 -0.08 8.25 3.88 6.88 04/01/2005 17 38 56 24 1.33 / 1.37-
01/31/2017MIDHX
MSCI World Ex USA SMID Index 3.57 1.00 8.23 2.10 - - - - - -
Morningstar Category Average - ForeignSmall/Mid Growth
-2.98 -0.63 8.87 3.12 Total Funds in Category 118 107 97 55 - - -
World Stock
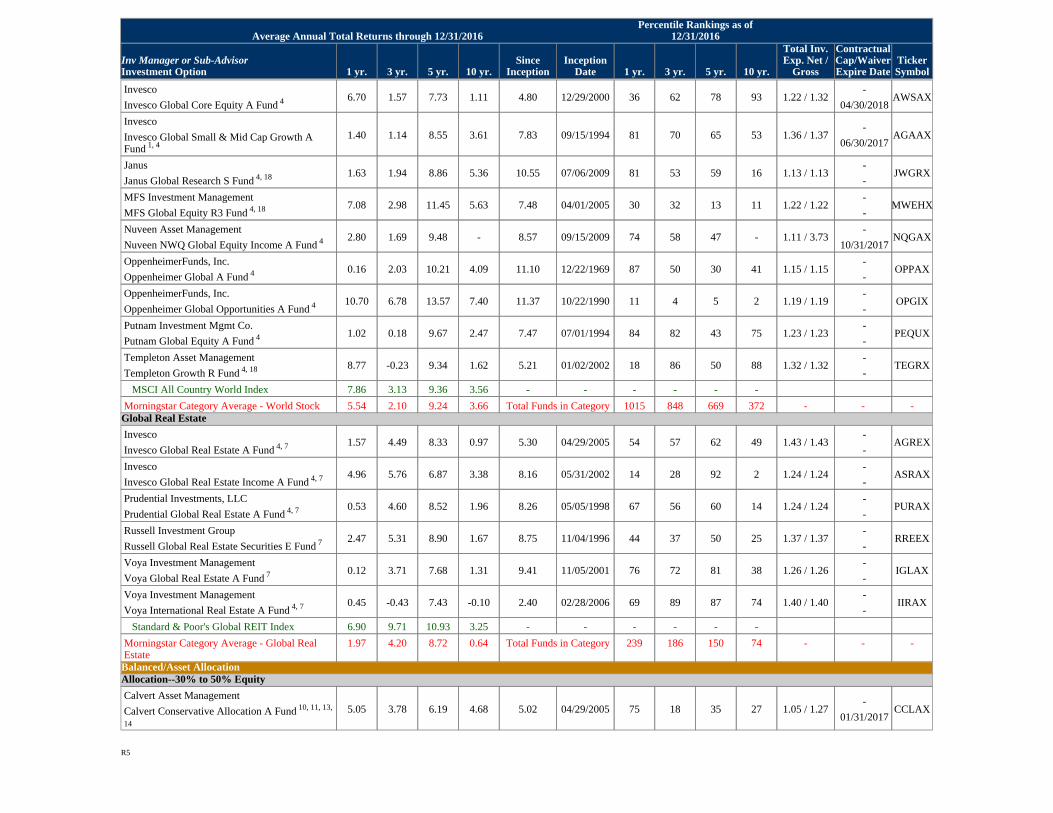
Capital Research and Mgmt Co
American Funds Capital World Growth &Income R3 Fund 4, 18
6.15 2.38 9.67 4.06 7.92 05/15/2002 41 43 43 43 1.09 / 1.09-
-RWICX
Capital Research and Mgmt Co
American Funds New Perspective R3 Fund 4, 18 1.50 3.11 10.78 5.41 7.74 06/04/2002 81 30 20 15 1.11 / 1.11-
-RNPCX
Capital Research and Mgmt Co
American Funds SMALLCAP World R3 Fund 4,
18
5.46 3.06 11.41 5.10 8.81 09/30/2000 51 31 14 18 1.39 / 1.39-
-RSLCX
Columbia Management Advisors
Columbia Global Dividend Opportunity AFund 4, 18
5.65 -0.52 6.68 2.99 7.17 11/01/2002 49 89 90 66 1.35 / 1.53-
12/31/2017CSVAX
Deutsche
Deutsche Global Small Cap A Fund 4 1.69 -0.89 8.46 3.16 6.43 04/16/1998 80 91 66 63 1.46 / 1.53-
01/31/2017KGDAX
Deutsche
Deutsche World Dividend A Fund 4, 18 11.92 1.95 7.54 0.67 3.54 03/19/2001 9 52 80 97 1.25 / 1.27-
01/31/2017SERAX
Dreyfus Corporation
Dreyfus Worldwide Growth A Fund 4 7.04 3.13 8.10 5.04 8.02 07/15/1993 31 30 73 19 1.17 / 1.17-
-PGROX
Fidelity Management & Research
Fidelity Advisor Global Capital Appreciation AFund 4
3.79 4.34 13.06 3.63 4.65 12/17/1998 66 14 6 52 1.45 / 1.55-
12/31/2017FGEAX
Fidelity Management & Research
Fidelity Advisor Worldwide A Fund 4, 18 -0.92 0.79 9.71 4.53 12.70 02/19/2009 91 74 42 30 1.22 / 1.22-
-FWAFX
Franklin Advisers, Inc
Franklin Mutual Global Discovery R Fund 4, 18 12.28 4.20 9.85 5.31 8.37 01/02/2002 8 15 39 17 1.49 / 1.49-
-TEDRX
Average Annual Total Returns through 12/31/2016Percentile Rankings as of
12/31/2016
Inv Manager or Sub-AdvisorInvestment Option 1 yr. 3 yr. 5 yr. 10 yr.
SinceInception
InceptionDate 1 yr. 3 yr. 5 yr. 10 yr.
Total Inv.Exp. Net /
Gross
ContractualCap/WaiverExpire Date
TickerSymbol
R5
Invesco
Invesco Global Core Equity A Fund 4 6.70 1.57 7.73 1.11 4.80 12/29/2000 36 62 78 93 1.22 / 1.32-
04/30/2018AWSAX
Invesco
Invesco Global Small & Mid Cap Growth AFund 1, 4
1.40 1.14 8.55 3.61 7.83 09/15/1994 81 70 65 53 1.36 / 1.37-
06/30/2017AGAAX
Janus
Janus Global Research S Fund 4, 18 1.63 1.94 8.86 5.36 10.55 07/06/2009 81 53 59 16 1.13 / 1.13-
-JWGRX
MFS Investment Management
MFS Global Equity R3 Fund 4, 18 7.08 2.98 11.45 5.63 7.48 04/01/2005 30 32 13 11 1.22 / 1.22-
-MWEHX
Nuveen Asset Management
Nuveen NWQ Global Equity Income A Fund 4 2.80 1.69 9.48 - 8.57 09/15/2009 74 58 47 - 1.11 / 3.73-
10/31/2017NQGAX
OppenheimerFunds, Inc.
Oppenheimer Global A Fund 4 0.16 2.03 10.21 4.09 11.10 12/22/1969 87 50 30 41 1.15 / 1.15-
-OPPAX
OppenheimerFunds, Inc.
Oppenheimer Global Opportunities A Fund 4 10.70 6.78 13.57 7.40 11.37 10/22/1990 11 4 5 2 1.19 / 1.19-
-OPGIX
Putnam Investment Mgmt Co.
Putnam Global Equity A Fund 4 1.02 0.18 9.67 2.47 7.47 07/01/1994 84 82 43 75 1.23 / 1.23-
-PEQUX
Templeton Asset Management
Templeton Growth R Fund 4, 18 8.77 -0.23 9.34 1.62 5.21 01/02/2002 18 86 50 88 1.32 / 1.32-
-TEGRX
MSCI All Country World Index 7.86 3.13 9.36 3.56 - - - - - -
Morningstar Category Average - World Stock 5.54 2.10 9.24 3.66 Total Funds in Category 1015 848 669 372 - - -Global Real Estate
Invesco
Invesco Global Real Estate A Fund 4, 7 1.57 4.49 8.33 0.97 5.30 04/29/2005 54 57 62 49 1.43 / 1.43-
-AGREX
Invesco
Invesco Global Real Estate Income A Fund 4, 7 4.96 5.76 6.87 3.38 8.16 05/31/2002 14 28 92 2 1.24 / 1.24-
-ASRAX
Prudential Investments, LLC
Prudential Global Real Estate A Fund 4, 7 0.53 4.60 8.52 1.96 8.26 05/05/1998 67 56 60 14 1.24 / 1.24-
-PURAX
Russell Investment Group
Russell Global Real Estate Securities E Fund 7 2.47 5.31 8.90 1.67 8.75 11/04/1996 44 37 50 25 1.37 / 1.37-
-RREEX
Voya Investment Management
Voya Global Real Estate A Fund 7 0.12 3.71 7.68 1.31 9.41 11/05/2001 76 72 81 38 1.26 / 1.26-
-IGLAX
Voya Investment Management
Voya International Real Estate A Fund 4, 7 0.45 -0.43 7.43 -0.10 2.40 02/28/2006 69 89 87 74 1.40 / 1.40-
-IIRAX
Standard & Poor's Global REIT Index 6.90 9.71 10.93 3.25 - - - - - -
Morningstar Category Average - Global RealEstate
1.97 4.20 8.72 0.64 Total Funds in Category 239 186 150 74 - - -
Balanced/Asset AllocationAllocation--30% to 50% Equity
Calvert Asset Management
Calvert Conservative Allocation A Fund 10, 11, 13,
14
5.05 3.78 6.19 4.68 5.02 04/29/2005 75 18 35 27 1.05 / 1.27-
01/31/2017CCLAX
Average Annual Total Returns through 12/31/2016Percentile Rankings as of
12/31/2016
Inv Manager or Sub-AdvisorInvestment Option 1 yr. 3 yr. 5 yr. 10 yr.
SinceInception
InceptionDate 1 yr. 3 yr. 5 yr. 10 yr.
Total Inv.Exp. Net /
Gross
ContractualCap/WaiverExpire Date
TickerSymbol
R5
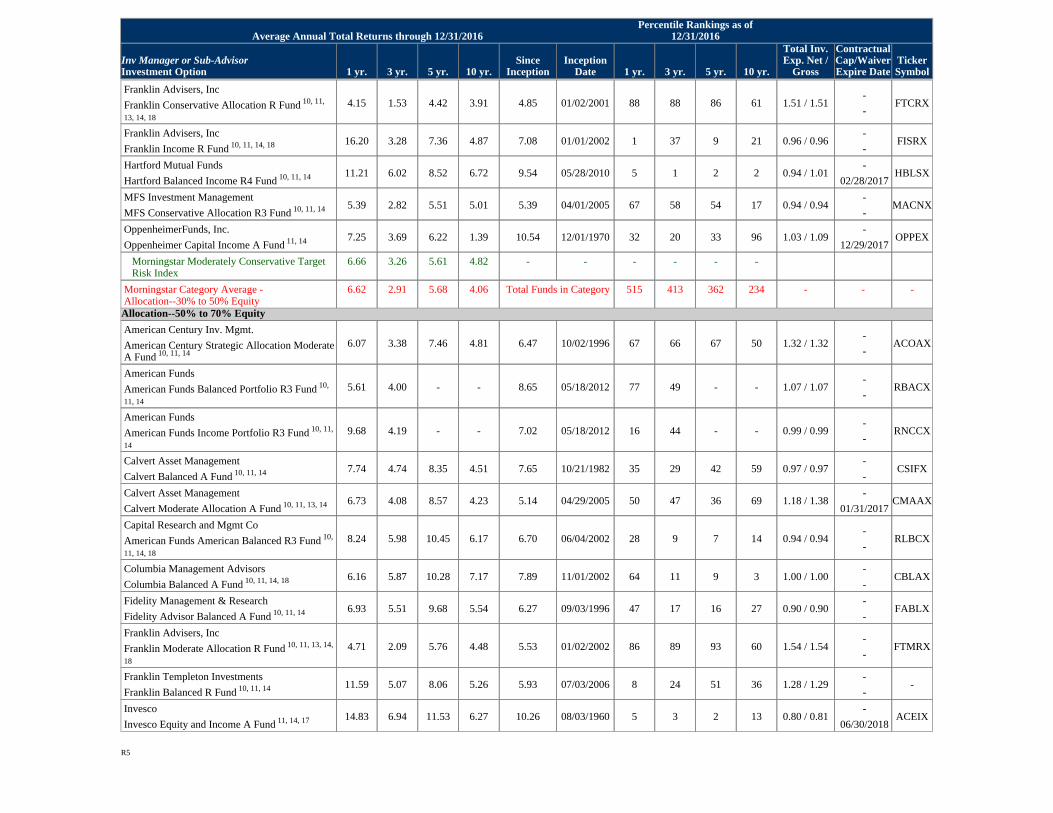
Franklin Advisers, Inc
Franklin Conservative Allocation R Fund 10, 11,
13, 14, 18
4.15 1.53 4.42 3.91 4.85 01/02/2001 88 88 86 61 1.51 / 1.51-
-FTCRX
Franklin Advisers, Inc
Franklin Income R Fund 10, 11, 14, 18 16.20 3.28 7.36 4.87 7.08 01/01/2002 1 37 9 21 0.96 / 0.96-
-FISRX
Hartford Mutual Funds
Hartford Balanced Income R4 Fund 10, 11, 14 11.21 6.02 8.52 6.72 9.54 05/28/2010 5 1 2 2 0.94 / 1.01-
02/28/2017HBLSX
MFS Investment Management
MFS Conservative Allocation R3 Fund 10, 11, 14 5.39 2.82 5.51 5.01 5.39 04/01/2005 67 58 54 17 0.94 / 0.94-
-MACNX
OppenheimerFunds, Inc.
Oppenheimer Capital Income A Fund 11, 14 7.25 3.69 6.22 1.39 10.54 12/01/1970 32 20 33 96 1.03 / 1.09-
12/29/2017OPPEX
Morningstar Moderately Conservative TargetRisk Index
6.66 3.26 5.61 4.82 - - - - - -
Morningstar Category Average -Allocation--30% to 50% Equity
6.62 2.91 5.68 4.06 Total Funds in Category 515 413 362 234 - - -
Allocation--50% to 70% Equity
American Century Inv. Mgmt.
American Century Strategic Allocation ModerateA Fund 10, 11, 14
6.07 3.38 7.46 4.81 6.47 10/02/1996 67 66 67 50 1.32 / 1.32-
-ACOAX
American Funds
American Funds Balanced Portfolio R3 Fund 10,
11, 14
5.61 4.00 - - 8.65 05/18/2012 77 49 - - 1.07 / 1.07-
-RBACX
American Funds
American Funds Income Portfolio R3 Fund 10, 11,
14
9.68 4.19 - - 7.02 05/18/2012 16 44 - - 0.99 / 0.99-
-RNCCX
Calvert Asset Management
Calvert Balanced A Fund 10, 11, 14 7.74 4.74 8.35 4.51 7.65 10/21/1982 35 29 42 59 0.97 / 0.97-
-CSIFX
Calvert Asset Management
Calvert Moderate Allocation A Fund 10, 11, 13, 14 6.73 4.08 8.57 4.23 5.14 04/29/2005 50 47 36 69 1.18 / 1.38-
01/31/2017CMAAX
Capital Research and Mgmt Co
American Funds American Balanced R3 Fund 10,
11, 14, 18
8.24 5.98 10.45 6.17 6.70 06/04/2002 28 9 7 14 0.94 / 0.94-
-RLBCX
Columbia Management Advisors
Columbia Balanced A Fund 10, 11, 14, 18 6.16 5.87 10.28 7.17 7.89 11/01/2002 64 11 9 3 1.00 / 1.00-
-CBLAX
Fidelity Management & Research
Fidelity Advisor Balanced A Fund 10, 11, 14 6.93 5.51 9.68 5.54 6.27 09/03/1996 47 17 16 27 0.90 / 0.90-
-FABLX
Franklin Advisers, Inc
Franklin Moderate Allocation R Fund 10, 11, 13, 14,
18
4.71 2.09 5.76 4.48 5.53 01/02/2002 86 89 93 60 1.54 / 1.54-
-FTMRX
Franklin Templeton Investments
Franklin Balanced R Fund 10, 11, 14 11.59 5.07 8.06 5.26 5.93 07/03/2006 8 24 51 36 1.28 / 1.29-
--
Invesco
Invesco Equity and Income A Fund 11, 14, 17 14.83 6.94 11.53 6.27 10.26 08/03/1960 5 3 2 13 0.80 / 0.81-
06/30/2018ACEIX
Average Annual Total Returns through 12/31/2016Percentile Rankings as of
12/31/2016
Inv Manager or Sub-AdvisorInvestment Option 1 yr. 3 yr. 5 yr. 10 yr.
SinceInception
InceptionDate 1 yr. 3 yr. 5 yr. 10 yr.
Total Inv.Exp. Net /
Gross
ContractualCap/WaiverExpire Date
TickerSymbol
R5
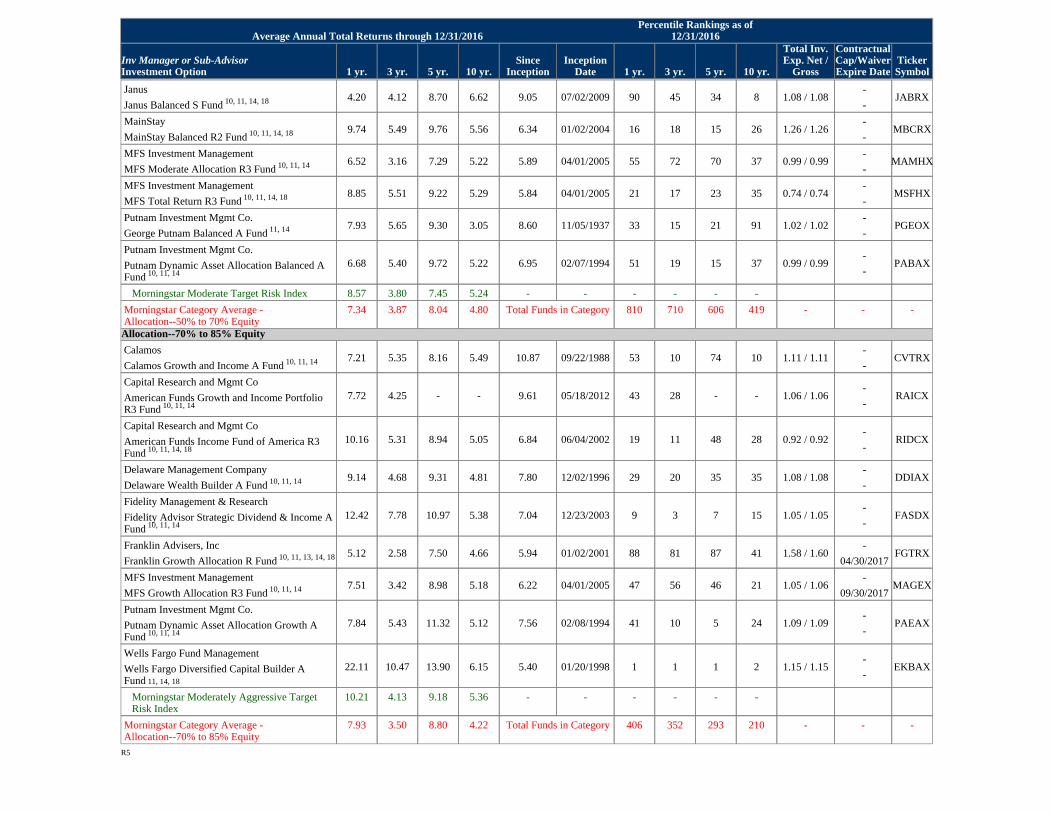
Janus
Janus Balanced S Fund 10, 11, 14, 18 4.20 4.12 8.70 6.62 9.05 07/02/2009 90 45 34 8 1.08 / 1.08-
-JABRX
MainStay
MainStay Balanced R2 Fund 10, 11, 14, 18 9.74 5.49 9.76 5.56 6.34 01/02/2004 16 18 15 26 1.26 / 1.26-
-MBCRX
MFS Investment Management
MFS Moderate Allocation R3 Fund 10, 11, 14 6.52 3.16 7.29 5.22 5.89 04/01/2005 55 72 70 37 0.99 / 0.99-
-MAMHX
MFS Investment Management
MFS Total Return R3 Fund 10, 11, 14, 18 8.85 5.51 9.22 5.29 5.84 04/01/2005 21 17 23 35 0.74 / 0.74-
-MSFHX
Putnam Investment Mgmt Co.
George Putnam Balanced A Fund 11, 14 7.93 5.65 9.30 3.05 8.60 11/05/1937 33 15 21 91 1.02 / 1.02-
-PGEOX
Putnam Investment Mgmt Co.
Putnam Dynamic Asset Allocation Balanced AFund 10, 11, 14
6.68 5.40 9.72 5.22 6.95 02/07/1994 51 19 15 37 0.99 / 0.99-
-PABAX
Morningstar Moderate Target Risk Index 8.57 3.80 7.45 5.24 - - - - - -
Morningstar Category Average -Allocation--50% to 70% Equity
7.34 3.87 8.04 4.80 Total Funds in Category 810 710 606 419 - - -
Allocation--70% to 85% Equity
Calamos
Calamos Growth and Income A Fund 10, 11, 14 7.21 5.35 8.16 5.49 10.87 09/22/1988 53 10 74 10 1.11 / 1.11-
-CVTRX
Capital Research and Mgmt Co
American Funds Growth and Income PortfolioR3 Fund 10, 11, 14
7.72 4.25 - - 9.61 05/18/2012 43 28 - - 1.06 / 1.06-
-RAICX
Capital Research and Mgmt Co
American Funds Income Fund of America R3Fund 10, 11, 14, 18
10.16 5.31 8.94 5.05 6.84 06/04/2002 19 11 48 28 0.92 / 0.92-
-RIDCX
Delaware Management Company
Delaware Wealth Builder A Fund 10, 11, 14 9.14 4.68 9.31 4.81 7.80 12/02/1996 29 20 35 35 1.08 / 1.08-
-DDIAX
Fidelity Management & Research
Fidelity Advisor Strategic Dividend & Income AFund 10, 11, 14
12.42 7.78 10.97 5.38 7.04 12/23/2003 9 3 7 15 1.05 / 1.05-
-FASDX
Franklin Advisers, Inc
Franklin Growth Allocation R Fund 10, 11, 13, 14, 18 5.12 2.58 7.50 4.66 5.94 01/02/2001 88 81 87 41 1.58 / 1.60-
04/30/2017FGTRX
MFS Investment Management
MFS Growth Allocation R3 Fund 10, 11, 14 7.51 3.42 8.98 5.18 6.22 04/01/2005 47 56 46 21 1.05 / 1.06-
09/30/2017MAGEX
Putnam Investment Mgmt Co.
Putnam Dynamic Asset Allocation Growth AFund 10, 11, 14
7.84 5.43 11.32 5.12 7.56 02/08/1994 41 10 5 24 1.09 / 1.09-
-PAEAX
Wells Fargo Fund Management
Wells Fargo Diversified Capital Builder AFund 11, 14, 18
22.11 10.47 13.90 6.15 5.40 01/20/1998 1 1 1 2 1.15 / 1.15-
-EKBAX
Morningstar Moderately Aggressive TargetRisk Index
10.21 4.13 9.18 5.36 - - - - - -
Morningstar Category Average -Allocation--70% to 85% Equity
7.93 3.50 8.80 4.22 Total Funds in Category 406 352 293 210 - - -
Average Annual Total Returns through 12/31/2016Percentile Rankings as of
12/31/2016
Inv Manager or Sub-AdvisorInvestment Option 1 yr. 3 yr. 5 yr. 10 yr.
SinceInception
InceptionDate 1 yr. 3 yr. 5 yr. 10 yr.
Total Inv.Exp. Net /
Gross
ContractualCap/WaiverExpire Date
TickerSymbol
R5
Allocation--85%+ Equity
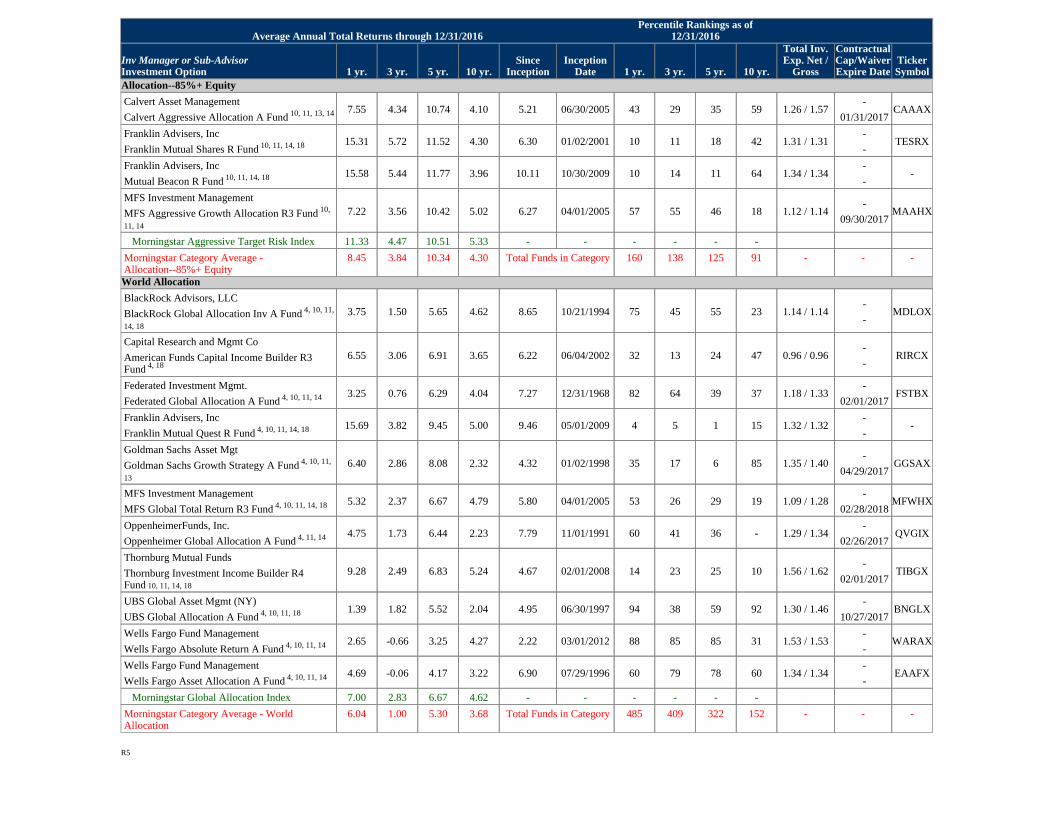
Calvert Asset Management
Calvert Aggressive Allocation A Fund 10, 11, 13, 14 7.55 4.34 10.74 4.10 5.21 06/30/2005 43 29 35 59 1.26 / 1.57-
01/31/2017CAAAX
Franklin Advisers, Inc
Franklin Mutual Shares R Fund 10, 11, 14, 18 15.31 5.72 11.52 4.30 6.30 01/02/2001 10 11 18 42 1.31 / 1.31-
-TESRX
Franklin Advisers, Inc
Mutual Beacon R Fund 10, 11, 14, 18 15.58 5.44 11.77 3.96 10.11 10/30/2009 10 14 11 64 1.34 / 1.34-
--
MFS Investment Management
MFS Aggressive Growth Allocation R3 Fund 10,
11, 14
7.22 3.56 10.42 5.02 6.27 04/01/2005 57 55 46 18 1.12 / 1.14-
09/30/2017MAAHX
Morningstar Aggressive Target Risk Index 11.33 4.47 10.51 5.33 - - - - - -
Morningstar Category Average -Allocation--85%+ Equity
8.45 3.84 10.34 4.30 Total Funds in Category 160 138 125 91 - - -
World Allocation
BlackRock Advisors, LLC
BlackRock Global Allocation Inv A Fund 4, 10, 11,
14, 18
3.75 1.50 5.65 4.62 8.65 10/21/1994 75 45 55 23 1.14 / 1.14-
-MDLOX
Capital Research and Mgmt Co
American Funds Capital Income Builder R3Fund 4, 18
6.55 3.06 6.91 3.65 6.22 06/04/2002 32 13 24 47 0.96 / 0.96-
-RIRCX
Federated Investment Mgmt.
Federated Global Allocation A Fund 4, 10, 11, 14 3.25 0.76 6.29 4.04 7.27 12/31/1968 82 64 39 37 1.18 / 1.33-
02/01/2017FSTBX
Franklin Advisers, Inc
Franklin Mutual Quest R Fund 4, 10, 11, 14, 18 15.69 3.82 9.45 5.00 9.46 05/01/2009 4 5 1 15 1.32 / 1.32-
--
Goldman Sachs Asset Mgt
Goldman Sachs Growth Strategy A Fund 4, 10, 11,
13
6.40 2.86 8.08 2.32 4.32 01/02/1998 35 17 6 85 1.35 / 1.40-
04/29/2017GGSAX
MFS Investment Management
MFS Global Total Return R3 Fund 4, 10, 11, 14, 18 5.32 2.37 6.67 4.79 5.80 04/01/2005 53 26 29 19 1.09 / 1.28-
02/28/2018MFWHX
OppenheimerFunds, Inc.
Oppenheimer Global Allocation A Fund 4, 11, 14 4.75 1.73 6.44 2.23 7.79 11/01/1991 60 41 36 - 1.29 / 1.34-
02/26/2017QVGIX
Thornburg Mutual Funds
Thornburg Investment Income Builder R4Fund 10, 11, 14, 18
9.28 2.49 6.83 5.24 4.67 02/01/2008 14 23 25 10 1.56 / 1.62-
02/01/2017TIBGX
UBS Global Asset Mgmt (NY)
UBS Global Allocation A Fund 4, 10, 11, 18 1.39 1.82 5.52 2.04 4.95 06/30/1997 94 38 59 92 1.30 / 1.46-
10/27/2017BNGLX
Wells Fargo Fund Management
Wells Fargo Absolute Return A Fund 4, 10, 11, 14 2.65 -0.66 3.25 4.27 2.22 03/01/2012 88 85 85 31 1.53 / 1.53-
-WARAX
Wells Fargo Fund Management
Wells Fargo Asset Allocation A Fund 4, 10, 11, 14 4.69 -0.06 4.17 3.22 6.90 07/29/1996 60 79 78 60 1.34 / 1.34-
-EAAFX
Morningstar Global Allocation Index 7.00 2.83 6.67 4.62 - - - - - -
Morningstar Category Average - WorldAllocation
6.04 1.00 5.30 3.68 Total Funds in Category 485 409 322 152 - - -
Average Annual Total Returns through 12/31/2016Percentile Rankings as of
12/31/2016
Inv Manager or Sub-AdvisorInvestment Option 1 yr. 3 yr. 5 yr. 10 yr.
SinceInception
InceptionDate 1 yr. 3 yr. 5 yr. 10 yr.
Total Inv.Exp. Net /
Gross
ContractualCap/WaiverExpire Date
TickerSymbol
R5
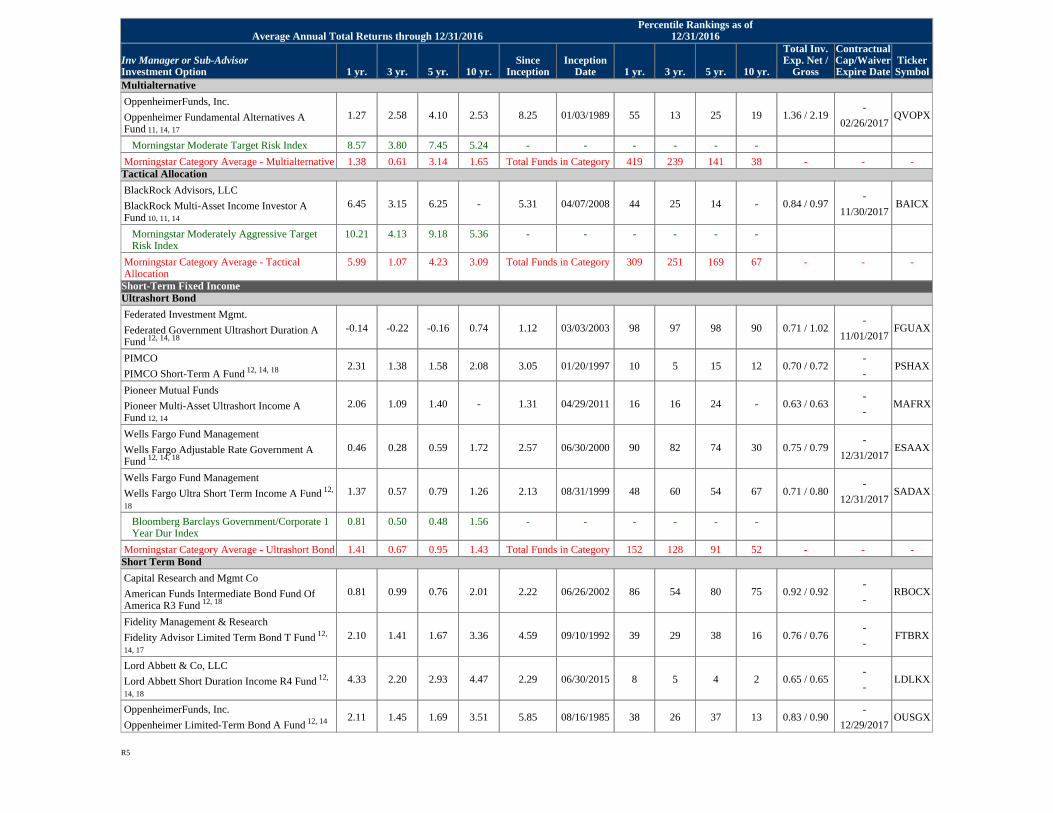
Multialternative
OppenheimerFunds, Inc.
Oppenheimer Fundamental Alternatives AFund 11, 14, 17
1.27 2.58 4.10 2.53 8.25 01/03/1989 55 13 25 19 1.36 / 2.19-
02/26/2017QVOPX
Morningstar Moderate Target Risk Index 8.57 3.80 7.45 5.24 - - - - - -
Morningstar Category Average - Multialternative 1.38 0.61 3.14 1.65 Total Funds in Category 419 239 141 38 - - -Tactical Allocation
BlackRock Advisors, LLC
BlackRock Multi-Asset Income Investor AFund 10, 11, 14
6.45 3.15 6.25 - 5.31 04/07/2008 44 25 14 - 0.84 / 0.97-
11/30/2017BAICX
Morningstar Moderately Aggressive TargetRisk Index
10.21 4.13 9.18 5.36 - - - - - -
Morningstar Category Average - TacticalAllocation
5.99 1.07 4.23 3.09 Total Funds in Category 309 251 169 67 - - -
Short-Term Fixed IncomeUltrashort Bond
Federated Investment Mgmt.
Federated Government Ultrashort Duration AFund 12, 14, 18
-0.14 -0.22 -0.16 0.74 1.12 03/03/2003 98 97 98 90 0.71 / 1.02-
11/01/2017FGUAX
PIMCO
PIMCO Short-Term A Fund 12, 14, 18 2.31 1.38 1.58 2.08 3.05 01/20/1997 10 5 15 12 0.70 / 0.72-
-PSHAX
Pioneer Mutual Funds
Pioneer Multi-Asset Ultrashort Income AFund 12, 14
2.06 1.09 1.40 - 1.31 04/29/2011 16 16 24 - 0.63 / 0.63-
-MAFRX
Wells Fargo Fund Management
Wells Fargo Adjustable Rate Government AFund 12, 14, 18
0.46 0.28 0.59 1.72 2.57 06/30/2000 90 82 74 30 0.75 / 0.79-
12/31/2017ESAAX
Wells Fargo Fund Management
Wells Fargo Ultra Short Term Income A Fund 12,
18
1.37 0.57 0.79 1.26 2.13 08/31/1999 48 60 54 67 0.71 / 0.80-
12/31/2017SADAX
Bloomberg Barclays Government/Corporate 1Year Dur Index
0.81 0.50 0.48 1.56 - - - - - -
Morningstar Category Average - Ultrashort Bond 1.41 0.67 0.95 1.43 Total Funds in Category 152 128 91 52 - - -Short Term Bond
Capital Research and Mgmt Co
American Funds Intermediate Bond Fund OfAmerica R3 Fund 12, 18
0.81 0.99 0.76 2.01 2.22 06/26/2002 86 54 80 75 0.92 / 0.92-
-RBOCX
Fidelity Management & Research
Fidelity Advisor Limited Term Bond T Fund 12,
14, 17
2.10 1.41 1.67 3.36 4.59 09/10/1992 39 29 38 16 0.76 / 0.76-
-FTBRX
Lord Abbett & Co, LLC
Lord Abbett Short Duration Income R4 Fund 12,
14, 18
4.33 2.20 2.93 4.47 2.29 06/30/2015 8 5 4 2 0.65 / 0.65-
-LDLKX
OppenheimerFunds, Inc.
Oppenheimer Limited-Term Bond A Fund 12, 14 2.11 1.45 1.69 3.51 5.85 08/16/1985 38 26 37 13 0.83 / 0.90-
12/29/2017OUSGX
Average Annual Total Returns through 12/31/2016Percentile Rankings as of
12/31/2016
Inv Manager or Sub-AdvisorInvestment Option 1 yr. 3 yr. 5 yr. 10 yr.
SinceInception
InceptionDate 1 yr. 3 yr. 5 yr. 10 yr.
Total Inv.Exp. Net /
Gross
ContractualCap/WaiverExpire Date
TickerSymbol
R5
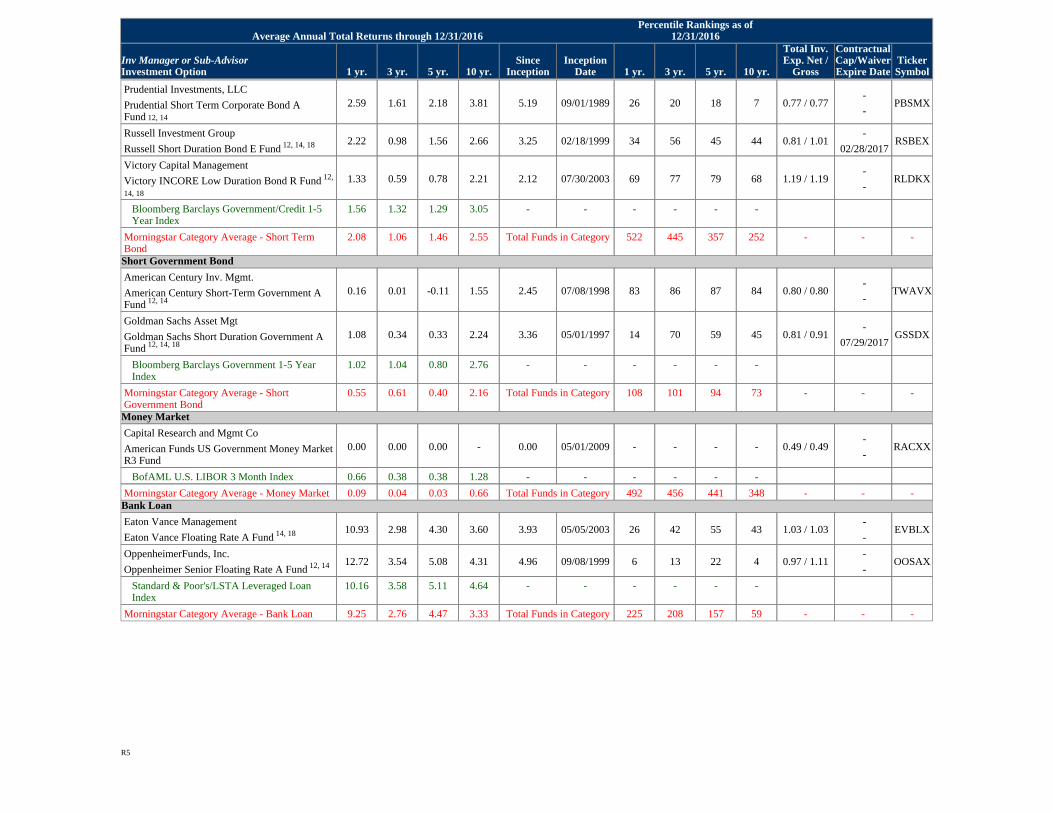
Prudential Investments, LLC
Prudential Short Term Corporate Bond AFund 12, 14
2.59 1.61 2.18 3.81 5.19 09/01/1989 26 20 18 7 0.77 / 0.77-
-PBSMX
Russell Investment Group
Russell Short Duration Bond E Fund 12, 14, 18 2.22 0.98 1.56 2.66 3.25 02/18/1999 34 56 45 44 0.81 / 1.01-
02/28/2017RSBEX
Victory Capital Management
Victory INCORE Low Duration Bond R Fund 12,
14, 18
1.33 0.59 0.78 2.21 2.12 07/30/2003 69 77 79 68 1.19 / 1.19-
-RLDKX
Bloomberg Barclays Government/Credit 1-5Year Index
1.56 1.32 1.29 3.05 - - - - - -
Morningstar Category Average - Short TermBond
2.08 1.06 1.46 2.55 Total Funds in Category 522 445 357 252 - - -
Short Government Bond
American Century Inv. Mgmt.
American Century Short-Term Government AFund 12, 14
0.16 0.01 -0.11 1.55 2.45 07/08/1998 83 86 87 84 0.80 / 0.80-
-TWAVX
Goldman Sachs Asset Mgt
Goldman Sachs Short Duration Government AFund 12, 14, 18
1.08 0.34 0.33 2.24 3.36 05/01/1997 14 70 59 45 0.81 / 0.91-
07/29/2017GSSDX
Bloomberg Barclays Government 1-5 YearIndex
1.02 1.04 0.80 2.76 - - - - - -
Morningstar Category Average - ShortGovernment Bond
0.55 0.61 0.40 2.16 Total Funds in Category 108 101 94 73 - - -
Money Market
Capital Research and Mgmt Co
American Funds US Government Money MarketR3 Fund
0.00 0.00 0.00 - 0.00 05/01/2009 - - - - 0.49 / 0.49-
-RACXX
BofAML U.S. LIBOR 3 Month Index 0.66 0.38 0.38 1.28 - - - - - -
Morningstar Category Average - Money Market 0.09 0.04 0.03 0.66 Total Funds in Category 492 456 441 348 - - -Bank Loan
Eaton Vance Management
Eaton Vance Floating Rate A Fund 14, 18 10.93 2.98 4.30 3.60 3.93 05/05/2003 26 42 55 43 1.03 / 1.03-
-EVBLX
OppenheimerFunds, Inc.
Oppenheimer Senior Floating Rate A Fund 12, 14 12.72 3.54 5.08 4.31 4.96 09/08/1999 6 13 22 4 0.97 / 1.11-
-OOSAX
Standard & Poor's/LSTA Leveraged LoanIndex
10.16 3.58 5.11 4.64 - - - - - -
Morningstar Category Average - Bank Loan 9.25 2.76 4.47 3.33 Total Funds in Category 225 208 157 59 - - -
Average Annual Total Returns through 12/31/2016Percentile Rankings as of
12/31/2016
Inv Manager or Sub-AdvisorInvestment Option 1 yr. 3 yr. 5 yr. 10 yr.
SinceInception
InceptionDate 1 yr. 3 yr. 5 yr. 10 yr.
Total Inv.Exp. Net /
Gross
ContractualCap/WaiverExpire Date
TickerSymbol
R5
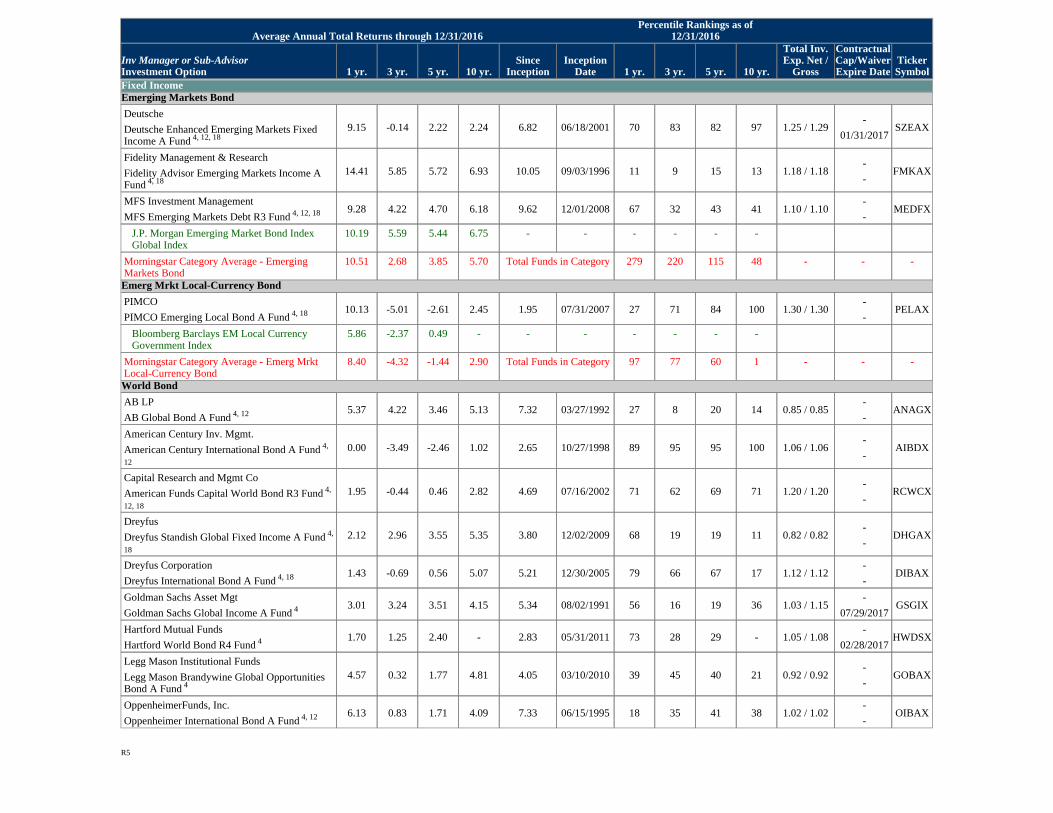
Fixed IncomeEmerging Markets Bond
Deutsche
Deutsche Enhanced Emerging Markets FixedIncome A Fund 4, 12, 18
9.15 -0.14 2.22 2.24 6.82 06/18/2001 70 83 82 97 1.25 / 1.29-
01/31/2017SZEAX
Fidelity Management & Research
Fidelity Advisor Emerging Markets Income AFund 4, 18
14.41 5.85 5.72 6.93 10.05 09/03/1996 11 9 15 13 1.18 / 1.18-
-FMKAX
MFS Investment Management
MFS Emerging Markets Debt R3 Fund 4, 12, 18 9.28 4.22 4.70 6.18 9.62 12/01/2008 67 32 43 41 1.10 / 1.10-
-MEDFX
J.P. Morgan Emerging Market Bond IndexGlobal Index
10.19 5.59 5.44 6.75 - - - - - -
Morningstar Category Average - EmergingMarkets Bond
10.51 2.68 3.85 5.70 Total Funds in Category 279 220 115 48 - - -
Emerg Mrkt Local-Currency Bond
PIMCO
PIMCO Emerging Local Bond A Fund 4, 18 10.13 -5.01 -2.61 2.45 1.95 07/31/2007 27 71 84 100 1.30 / 1.30-
-PELAX
Bloomberg Barclays EM Local CurrencyGovernment Index
5.86 -2.37 0.49 - - - - - - -
Morningstar Category Average - Emerg MrktLocal-Currency Bond
8.40 -4.32 -1.44 2.90 Total Funds in Category 97 77 60 1 - - -
World Bond
AB LP
AB Global Bond A Fund 4, 12 5.37 4.22 3.46 5.13 7.32 03/27/1992 27 8 20 14 0.85 / 0.85-
-ANAGX
American Century Inv. Mgmt.
American Century International Bond A Fund 4,
12
0.00 -3.49 -2.46 1.02 2.65 10/27/1998 89 95 95 100 1.06 / 1.06-
-AIBDX
Capital Research and Mgmt Co
American Funds Capital World Bond R3 Fund 4,
12, 18
1.95 -0.44 0.46 2.82 4.69 07/16/2002 71 62 69 71 1.20 / 1.20-
-RCWCX
Dreyfus
Dreyfus Standish Global Fixed Income A Fund 4,
18
2.12 2.96 3.55 5.35 3.80 12/02/2009 68 19 19 11 0.82 / 0.82-
-DHGAX
Dreyfus Corporation
Dreyfus International Bond A Fund 4, 18 1.43 -0.69 0.56 5.07 5.21 12/30/2005 79 66 67 17 1.12 / 1.12-
-DIBAX
Goldman Sachs Asset Mgt
Goldman Sachs Global Income A Fund 4 3.01 3.24 3.51 4.15 5.34 08/02/1991 56 16 19 36 1.03 / 1.15-
07/29/2017GSGIX
Hartford Mutual Funds
Hartford World Bond R4 Fund 4 1.70 1.25 2.40 - 2.83 05/31/2011 73 28 29 - 1.05 / 1.08-
02/28/2017HWDSX
Legg Mason Institutional Funds
Legg Mason Brandywine Global OpportunitiesBond A Fund 4
4.57 0.32 1.77 4.81 4.05 03/10/2010 39 45 40 21 0.92 / 0.92-
-GOBAX
OppenheimerFunds, Inc.
Oppenheimer International Bond A Fund 4, 12 6.13 0.83 1.71 4.09 7.33 06/15/1995 18 35 41 38 1.02 / 1.02-
-OIBAX
Average Annual Total Returns through 12/31/2016Percentile Rankings as of
12/31/2016
Inv Manager or Sub-AdvisorInvestment Option 1 yr. 3 yr. 5 yr. 10 yr.
SinceInception
InceptionDate 1 yr. 3 yr. 5 yr. 10 yr.
Total Inv.Exp. Net /
Gross
ContractualCap/WaiverExpire Date
TickerSymbol
R5
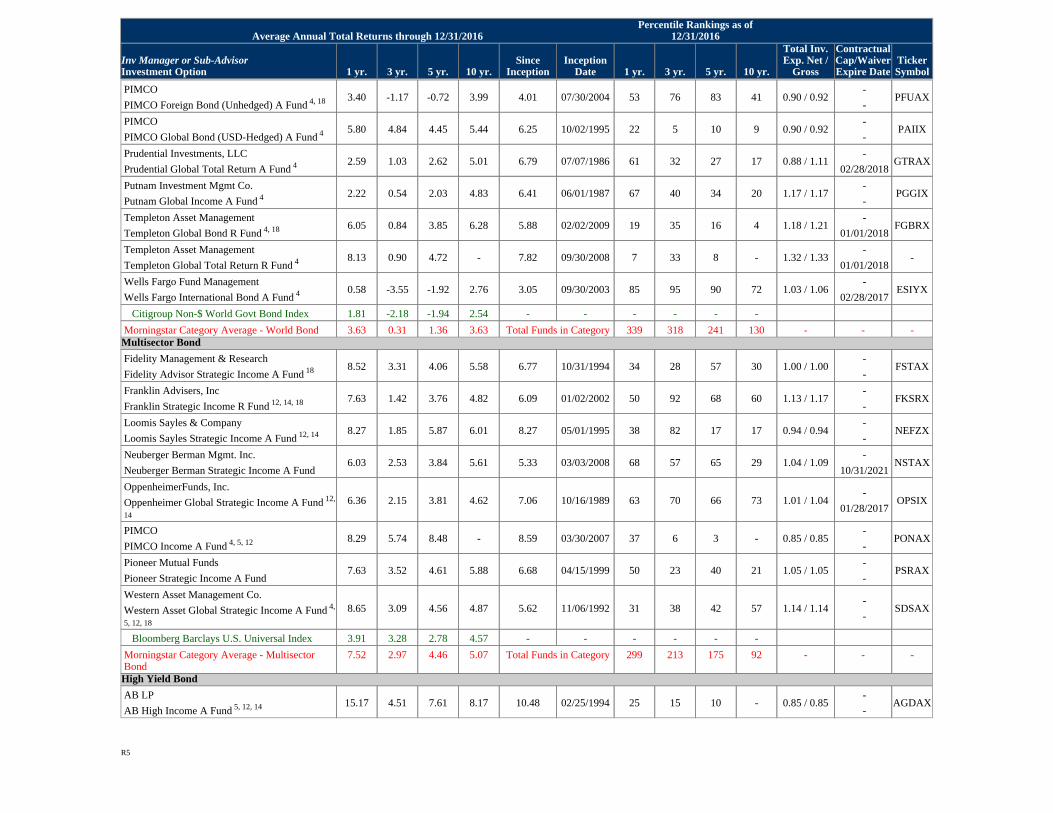
PIMCO
PIMCO Foreign Bond (Unhedged) A Fund 4, 18 3.40 -1.17 -0.72 3.99 4.01 07/30/2004 53 76 83 41 0.90 / 0.92-
-PFUAX
PIMCO
PIMCO Global Bond (USD-Hedged) A Fund 4 5.80 4.84 4.45 5.44 6.25 10/02/1995 22 5 10 9 0.90 / 0.92-
-PAIIX
Prudential Investments, LLC
Prudential Global Total Return A Fund 4 2.59 1.03 2.62 5.01 6.79 07/07/1986 61 32 27 17 0.88 / 1.11-
02/28/2018GTRAX
Putnam Investment Mgmt Co.
Putnam Global Income A Fund 4 2.22 0.54 2.03 4.83 6.41 06/01/1987 67 40 34 20 1.17 / 1.17-
-PGGIX
Templeton Asset Management
Templeton Global Bond R Fund 4, 18 6.05 0.84 3.85 6.28 5.88 02/02/2009 19 35 16 4 1.18 / 1.21-
01/01/2018FGBRX
Templeton Asset Management
Templeton Global Total Return R Fund 4 8.13 0.90 4.72 - 7.82 09/30/2008 7 33 8 - 1.32 / 1.33-
01/01/2018-
Wells Fargo Fund Management
Wells Fargo International Bond A Fund 4 0.58 -3.55 -1.92 2.76 3.05 09/30/2003 85 95 90 72 1.03 / 1.06-
02/28/2017ESIYX
Citigroup Non-$ World Govt Bond Index 1.81 -2.18 -1.94 2.54 - - - - - -
Morningstar Category Average - World Bond 3.63 0.31 1.36 3.63 Total Funds in Category 339 318 241 130 - - -Multisector Bond
Fidelity Management & Research
Fidelity Advisor Strategic Income A Fund 18 8.52 3.31 4.06 5.58 6.77 10/31/1994 34 28 57 30 1.00 / 1.00-
-FSTAX
Franklin Advisers, Inc
Franklin Strategic Income R Fund 12, 14, 18 7.63 1.42 3.76 4.82 6.09 01/02/2002 50 92 68 60 1.13 / 1.17-
-FKSRX
Loomis Sayles & Company
Loomis Sayles Strategic Income A Fund 12, 14 8.27 1.85 5.87 6.01 8.27 05/01/1995 38 82 17 17 0.94 / 0.94-
-NEFZX
Neuberger Berman Mgmt. Inc.
Neuberger Berman Strategic Income A Fund6.03 2.53 3.84 5.61 5.33 03/03/2008 68 57 65 29 1.04 / 1.09
-
10/31/2021NSTAX
OppenheimerFunds, Inc.
Oppenheimer Global Strategic Income A Fund 12,
14
6.36 2.15 3.81 4.62 7.06 10/16/1989 63 70 66 73 1.01 / 1.04-
01/28/2017OPSIX
PIMCO
PIMCO Income A Fund 4, 5, 12 8.29 5.74 8.48 - 8.59 03/30/2007 37 6 3 - 0.85 / 0.85-
-PONAX
Pioneer Mutual Funds
Pioneer Strategic Income A Fund7.63 3.52 4.61 5.88 6.68 04/15/1999 50 23 40 21 1.05 / 1.05
-
-PSRAX
Western Asset Management Co.
Western Asset Global Strategic Income A Fund 4,
5, 12, 18
8.65 3.09 4.56 4.87 5.62 11/06/1992 31 38 42 57 1.14 / 1.14-
-SDSAX
Bloomberg Barclays U.S. Universal Index 3.91 3.28 2.78 4.57 - - - - - -
Morningstar Category Average - MultisectorBond
7.52 2.97 4.46 5.07 Total Funds in Category 299 213 175 92 - - -
High Yield Bond
AB LP
AB High Income A Fund 5, 12, 14 15.17 4.51 7.61 8.17 10.48 02/25/1994 25 15 10 - 0.85 / 0.85-
-AGDAX
Average Annual Total Returns through 12/31/2016Percentile Rankings as of
12/31/2016
Inv Manager or Sub-AdvisorInvestment Option 1 yr. 3 yr. 5 yr. 10 yr.
SinceInception
InceptionDate 1 yr. 3 yr. 5 yr. 10 yr.
Total Inv.Exp. Net /
Gross
ContractualCap/WaiverExpire Date
TickerSymbol
R5
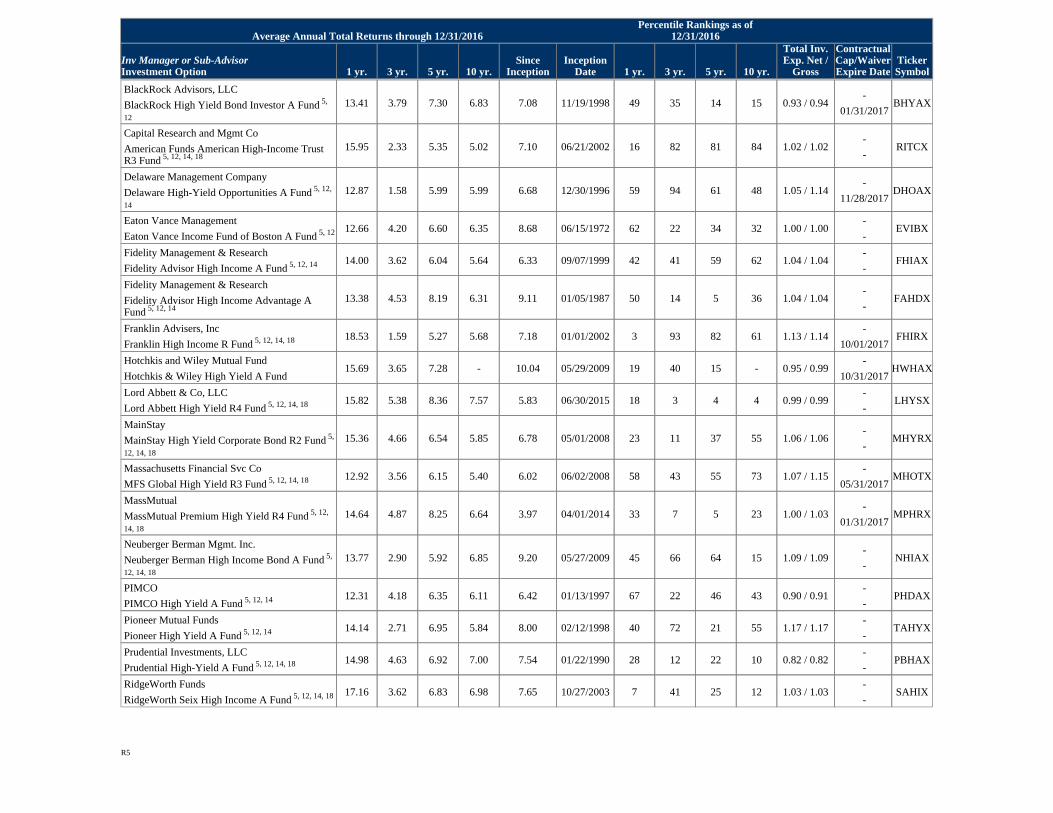
BlackRock Advisors, LLC
BlackRock High Yield Bond Investor A Fund 5,
12
13.41 3.79 7.30 6.83 7.08 11/19/1998 49 35 14 15 0.93 / 0.94-
01/31/2017BHYAX
Capital Research and Mgmt Co
American Funds American High-Income TrustR3 Fund 5, 12, 14, 18
15.95 2.33 5.35 5.02 7.10 06/21/2002 16 82 81 84 1.02 / 1.02-
-RITCX
Delaware Management Company
Delaware High-Yield Opportunities A Fund 5, 12,
14
12.87 1.58 5.99 5.99 6.68 12/30/1996 59 94 61 48 1.05 / 1.14-
11/28/2017DHOAX
Eaton Vance Management
Eaton Vance Income Fund of Boston A Fund 5, 12 12.66 4.20 6.60 6.35 8.68 06/15/1972 62 22 34 32 1.00 / 1.00-
-EVIBX
Fidelity Management & Research
Fidelity Advisor High Income A Fund 5, 12, 14 14.00 3.62 6.04 5.64 6.33 09/07/1999 42 41 59 62 1.04 / 1.04-
-FHIAX
Fidelity Management & Research
Fidelity Advisor High Income Advantage AFund 5, 12, 14
13.38 4.53 8.19 6.31 9.11 01/05/1987 50 14 5 36 1.04 / 1.04-
-FAHDX
Franklin Advisers, Inc
Franklin High Income R Fund 5, 12, 14, 18 18.53 1.59 5.27 5.68 7.18 01/01/2002 3 93 82 61 1.13 / 1.14-
10/01/2017FHIRX
Hotchkis and Wiley Mutual Fund
Hotchkis & Wiley High Yield A Fund15.69 3.65 7.28 - 10.04 05/29/2009 19 40 15 - 0.95 / 0.99
-
10/31/2017HWHAX
Lord Abbett & Co, LLC
Lord Abbett High Yield R4 Fund 5, 12, 14, 18 15.82 5.38 8.36 7.57 5.83 06/30/2015 18 3 4 4 0.99 / 0.99-
-LHYSX
MainStay
MainStay High Yield Corporate Bond R2 Fund 5,
12, 14, 18
15.36 4.66 6.54 5.85 6.78 05/01/2008 23 11 37 55 1.06 / 1.06-
-MHYRX
Massachusetts Financial Svc Co
MFS Global High Yield R3 Fund 5, 12, 14, 18 12.92 3.56 6.15 5.40 6.02 06/02/2008 58 43 55 73 1.07 / 1.15-
05/31/2017MHOTX
MassMutual
MassMutual Premium High Yield R4 Fund 5, 12,
14, 18
14.64 4.87 8.25 6.64 3.97 04/01/2014 33 7 5 23 1.00 / 1.03-
01/31/2017MPHRX
Neuberger Berman Mgmt. Inc.
Neuberger Berman High Income Bond A Fund 5,
12, 14, 18
13.77 2.90 5.92 6.85 9.20 05/27/2009 45 66 64 15 1.09 / 1.09-
-NHIAX
PIMCO
PIMCO High Yield A Fund 5, 12, 14 12.31 4.18 6.35 6.11 6.42 01/13/1997 67 22 46 43 0.90 / 0.91-
-PHDAX
Pioneer Mutual Funds
Pioneer High Yield A Fund 5, 12, 14 14.14 2.71 6.95 5.84 8.00 02/12/1998 40 72 21 55 1.17 / 1.17-
-TAHYX
Prudential Investments, LLC
Prudential High-Yield A Fund 5, 12, 14, 18 14.98 4.63 6.92 7.00 7.54 01/22/1990 28 12 22 10 0.82 / 0.82-
-PBHAX
RidgeWorth Funds
RidgeWorth Seix High Income A Fund 5, 12, 14, 18 17.16 3.62 6.83 6.98 7.65 10/27/2003 7 41 25 12 1.03 / 1.03-
-SAHIX
Average Annual Total Returns through 12/31/2016Percentile Rankings as of
12/31/2016
Inv Manager or Sub-AdvisorInvestment Option 1 yr. 3 yr. 5 yr. 10 yr.
SinceInception
InceptionDate 1 yr. 3 yr. 5 yr. 10 yr.
Total Inv.Exp. Net /
Gross
ContractualCap/WaiverExpire Date
TickerSymbol
R5
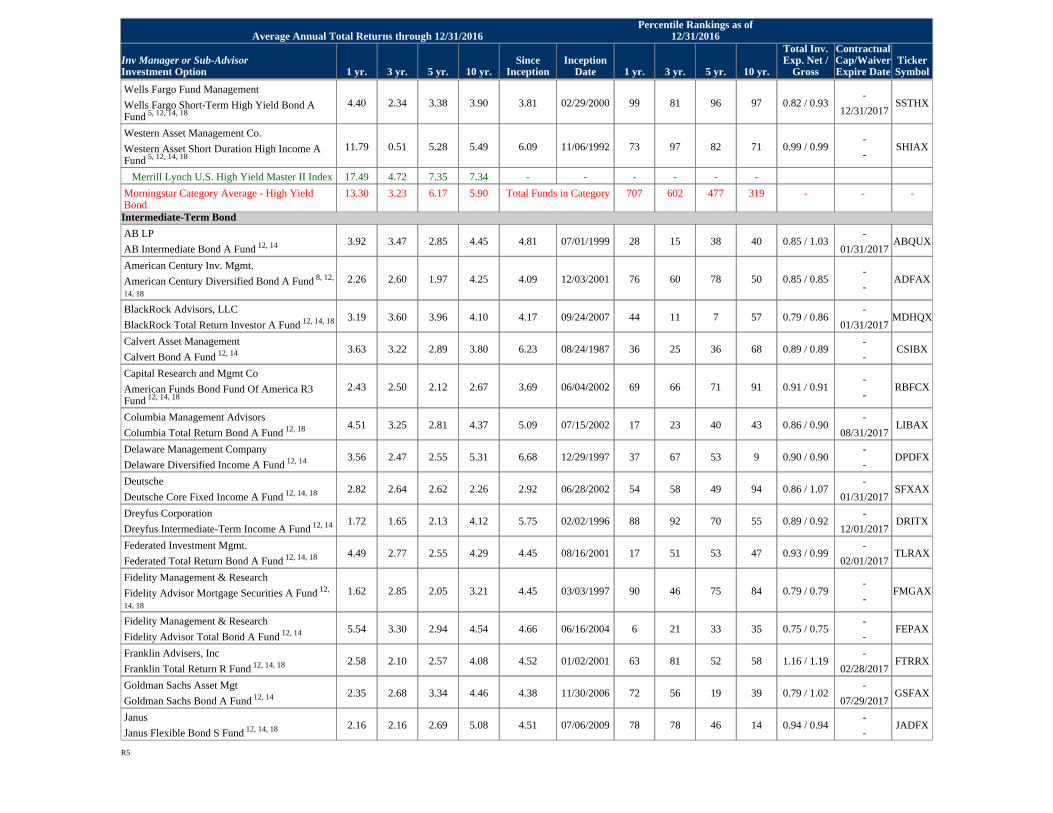
Wells Fargo Fund Management
Wells Fargo Short-Term High Yield Bond AFund 5, 12, 14, 18
4.40 2.34 3.38 3.90 3.81 02/29/2000 99 81 96 97 0.82 / 0.93-
12/31/2017SSTHX
Western Asset Management Co.
Western Asset Short Duration High Income AFund 5, 12, 14, 18
11.79 0.51 5.28 5.49 6.09 11/06/1992 73 97 82 71 0.99 / 0.99-
-SHIAX
Merrill Lynch U.S. High Yield Master II Index 17.49 4.72 7.35 7.34 - - - - - -
Morningstar Category Average - High YieldBond
13.30 3.23 6.17 5.90 Total Funds in Category 707 602 477 319 - - -
Intermediate-Term Bond
AB LP
AB Intermediate Bond A Fund 12, 14 3.92 3.47 2.85 4.45 4.81 07/01/1999 28 15 38 40 0.85 / 1.03-
01/31/2017ABQUX
American Century Inv. Mgmt.
American Century Diversified Bond A Fund 8, 12,
14, 18
2.26 2.60 1.97 4.25 4.09 12/03/2001 76 60 78 50 0.85 / 0.85-
-ADFAX
BlackRock Advisors, LLC
BlackRock Total Return Investor A Fund 12, 14, 18 3.19 3.60 3.96 4.10 4.17 09/24/2007 44 11 7 57 0.79 / 0.86-
01/31/2017MDHQX
Calvert Asset Management
Calvert Bond A Fund 12, 14 3.63 3.22 2.89 3.80 6.23 08/24/1987 36 25 36 68 0.89 / 0.89-
-CSIBX
Capital Research and Mgmt Co
American Funds Bond Fund Of America R3Fund 12, 14, 18
2.43 2.50 2.12 2.67 3.69 06/04/2002 69 66 71 91 0.91 / 0.91-
-RBFCX
Columbia Management Advisors
Columbia Total Return Bond A Fund 12, 18 4.51 3.25 2.81 4.37 5.09 07/15/2002 17 23 40 43 0.86 / 0.90-
08/31/2017LIBAX
Delaware Management Company
Delaware Diversified Income A Fund 12, 14 3.56 2.47 2.55 5.31 6.68 12/29/1997 37 67 53 9 0.90 / 0.90-
-DPDFX
Deutsche
Deutsche Core Fixed Income A Fund 12, 14, 18 2.82 2.64 2.62 2.26 2.92 06/28/2002 54 58 49 94 0.86 / 1.07-
01/31/2017SFXAX
Dreyfus Corporation
Dreyfus Intermediate-Term Income A Fund 12, 14 1.72 1.65 2.13 4.12 5.75 02/02/1996 88 92 70 55 0.89 / 0.92-
12/01/2017DRITX
Federated Investment Mgmt.
Federated Total Return Bond A Fund 12, 14, 18 4.49 2.77 2.55 4.29 4.45 08/16/2001 17 51 53 47 0.93 / 0.99-
02/01/2017TLRAX
Fidelity Management & Research
Fidelity Advisor Mortgage Securities A Fund 12,
14, 18
1.62 2.85 2.05 3.21 4.45 03/03/1997 90 46 75 84 0.79 / 0.79-
-FMGAX
Fidelity Management & Research
Fidelity Advisor Total Bond A Fund 12, 14 5.54 3.30 2.94 4.54 4.66 06/16/2004 6 21 33 35 0.75 / 0.75-
-FEPAX
Franklin Advisers, Inc
Franklin Total Return R Fund 12, 14, 18 2.58 2.10 2.57 4.08 4.52 01/02/2001 63 81 52 58 1.16 / 1.19-
02/28/2017FTRRX
Goldman Sachs Asset Mgt
Goldman Sachs Bond A Fund 12, 14 2.35 2.68 3.34 4.46 4.38 11/30/2006 72 56 19 39 0.79 / 1.02-
07/29/2017GSFAX
Janus
Janus Flexible Bond S Fund 12, 14, 18 2.16 2.16 2.69 5.08 4.51 07/06/2009 78 78 46 14 0.94 / 0.94-
-JADFX
Average Annual Total Returns through 12/31/2016Percentile Rankings as of
12/31/2016
Inv Manager or Sub-AdvisorInvestment Option 1 yr. 3 yr. 5 yr. 10 yr.
SinceInception
InceptionDate 1 yr. 3 yr. 5 yr. 10 yr.
Total Inv.Exp. Net /
Gross
ContractualCap/WaiverExpire Date
TickerSymbol
R5
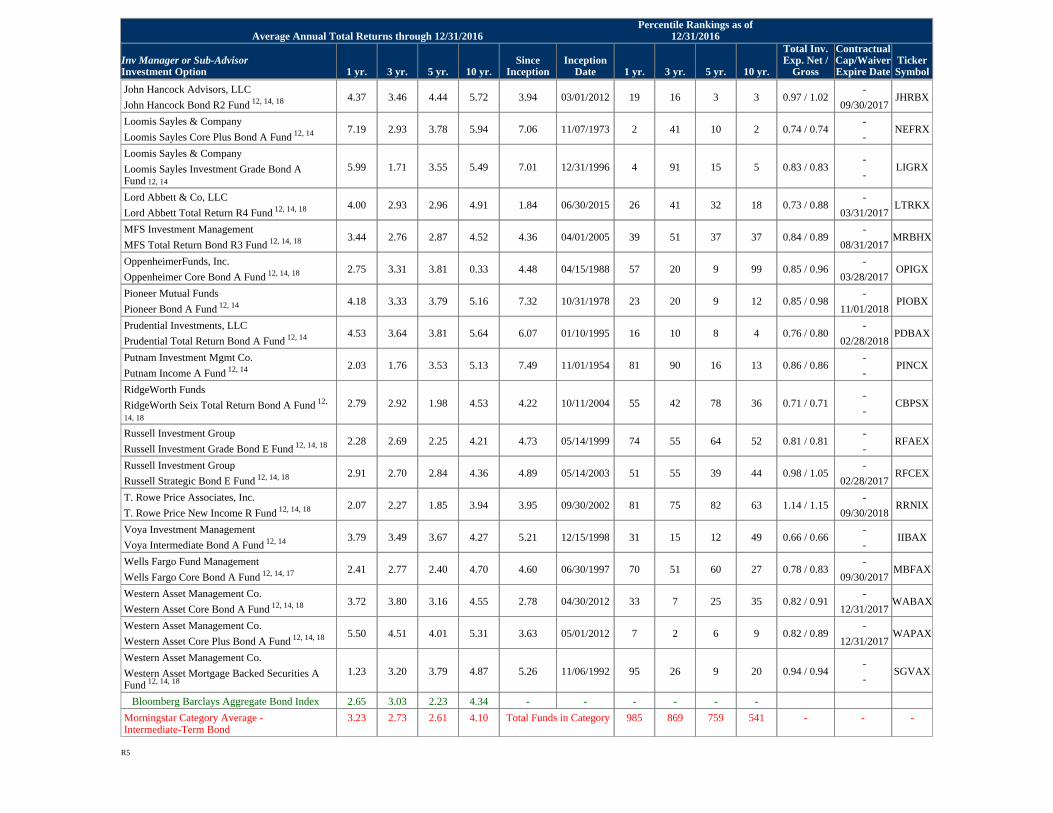
John Hancock Advisors, LLC
John Hancock Bond R2 Fund 12, 14, 18 4.37 3.46 4.44 5.72 3.94 03/01/2012 19 16 3 3 0.97 / 1.02-
09/30/2017JHRBX
Loomis Sayles & Company
Loomis Sayles Core Plus Bond A Fund 12, 14 7.19 2.93 3.78 5.94 7.06 11/07/1973 2 41 10 2 0.74 / 0.74-
-NEFRX
Loomis Sayles & Company
Loomis Sayles Investment Grade Bond AFund 12, 14
5.99 1.71 3.55 5.49 7.01 12/31/1996 4 91 15 5 0.83 / 0.83-
-LIGRX
Lord Abbett & Co, LLC
Lord Abbett Total Return R4 Fund 12, 14, 18 4.00 2.93 2.96 4.91 1.84 06/30/2015 26 41 32 18 0.73 / 0.88-
03/31/2017LTRKX
MFS Investment Management
MFS Total Return Bond R3 Fund 12, 14, 18 3.44 2.76 2.87 4.52 4.36 04/01/2005 39 51 37 37 0.84 / 0.89-
08/31/2017MRBHX
OppenheimerFunds, Inc.
Oppenheimer Core Bond A Fund 12, 14, 18 2.75 3.31 3.81 0.33 4.48 04/15/1988 57 20 9 99 0.85 / 0.96-
03/28/2017OPIGX
Pioneer Mutual Funds
Pioneer Bond A Fund 12, 14 4.18 3.33 3.79 5.16 7.32 10/31/1978 23 20 9 12 0.85 / 0.98-
11/01/2018PIOBX
Prudential Investments, LLC
Prudential Total Return Bond A Fund 12, 14 4.53 3.64 3.81 5.64 6.07 01/10/1995 16 10 8 4 0.76 / 0.80-
02/28/2018PDBAX
Putnam Investment Mgmt Co.
Putnam Income A Fund 12, 14 2.03 1.76 3.53 5.13 7.49 11/01/1954 81 90 16 13 0.86 / 0.86-
-PINCX
RidgeWorth Funds
RidgeWorth Seix Total Return Bond A Fund 12,
14, 18
2.79 2.92 1.98 4.53 4.22 10/11/2004 55 42 78 36 0.71 / 0.71-
-CBPSX
Russell Investment Group
Russell Investment Grade Bond E Fund 12, 14, 18 2.28 2.69 2.25 4.21 4.73 05/14/1999 74 55 64 52 0.81 / 0.81-
-RFAEX
Russell Investment Group
Russell Strategic Bond E Fund 12, 14, 18 2.91 2.70 2.84 4.36 4.89 05/14/2003 51 55 39 44 0.98 / 1.05-
02/28/2017RFCEX
T. Rowe Price Associates, Inc.
T. Rowe Price New Income R Fund 12, 14, 18 2.07 2.27 1.85 3.94 3.95 09/30/2002 81 75 82 63 1.14 / 1.15-
09/30/2018RRNIX
Voya Investment Management
Voya Intermediate Bond A Fund 12, 14 3.79 3.49 3.67 4.27 5.21 12/15/1998 31 15 12 49 0.66 / 0.66-
-IIBAX
Wells Fargo Fund Management
Wells Fargo Core Bond A Fund 12, 14, 17 2.41 2.77 2.40 4.70 4.60 06/30/1997 70 51 60 27 0.78 / 0.83-
09/30/2017MBFAX
Western Asset Management Co.
Western Asset Core Bond A Fund 12, 14, 18 3.72 3.80 3.16 4.55 2.78 04/30/2012 33 7 25 35 0.82 / 0.91-
12/31/2017WABAX
Western Asset Management Co.
Western Asset Core Plus Bond A Fund 12, 14, 18 5.50 4.51 4.01 5.31 3.63 05/01/2012 7 2 6 9 0.82 / 0.89-
12/31/2017WAPAX
Western Asset Management Co.
Western Asset Mortgage Backed Securities AFund 12, 14, 18
1.23 3.20 3.79 4.87 5.26 11/06/1992 95 26 9 20 0.94 / 0.94-
-SGVAX
Bloomberg Barclays Aggregate Bond Index 2.65 3.03 2.23 4.34 - - - - - -
Morningstar Category Average -Intermediate-Term Bond
3.23 2.73 2.61 4.10 Total Funds in Category 985 869 759 541 - - -
Average Annual Total Returns through 12/31/2016Percentile Rankings as of
12/31/2016
Inv Manager or Sub-AdvisorInvestment Option 1 yr. 3 yr. 5 yr. 10 yr.
SinceInception
InceptionDate 1 yr. 3 yr. 5 yr. 10 yr.
Total Inv.Exp. Net /
Gross
ContractualCap/WaiverExpire Date
TickerSymbol
R5
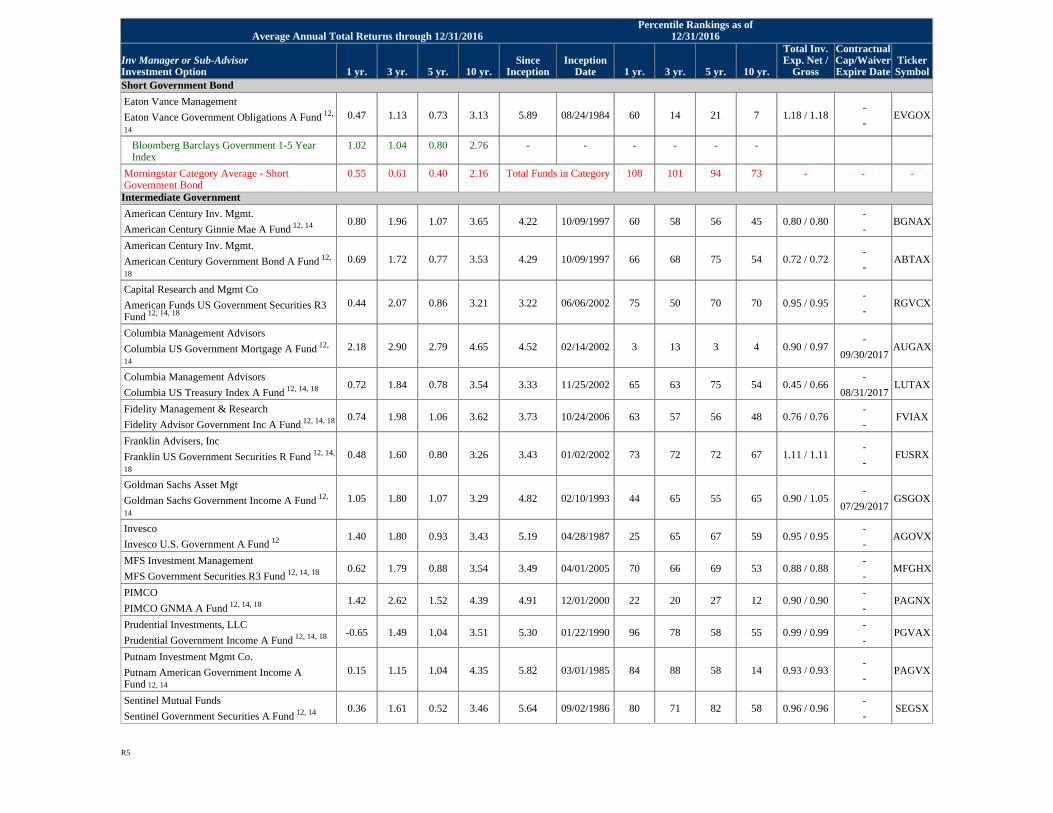
Short Government Bond
Eaton Vance Management
Eaton Vance Government Obligations A Fund 12,
14
0.47 1.13 0.73 3.13 5.89 08/24/1984 60 14 21 7 1.18 / 1.18-
-EVGOX
Bloomberg Barclays Government 1-5 YearIndex
1.02 1.04 0.80 2.76 - - - - - -
Morningstar Category Average - ShortGovernment Bond
0.55 0.61 0.40 2.16 Total Funds in Category 108 101 94 73 - - -
Intermediate Government
American Century Inv. Mgmt.
American Century Ginnie Mae A Fund 12, 14 0.80 1.96 1.07 3.65 4.22 10/09/1997 60 58 56 45 0.80 / 0.80-
-BGNAX
American Century Inv. Mgmt.
American Century Government Bond A Fund 12,
18
0.69 1.72 0.77 3.53 4.29 10/09/1997 66 68 75 54 0.72 / 0.72-
-ABTAX
Capital Research and Mgmt Co
American Funds US Government Securities R3Fund 12, 14, 18
0.44 2.07 0.86 3.21 3.22 06/06/2002 75 50 70 70 0.95 / 0.95-
-RGVCX
Columbia Management Advisors
Columbia US Government Mortgage A Fund 12,
14
2.18 2.90 2.79 4.65 4.52 02/14/2002 3 13 3 4 0.90 / 0.97-
09/30/2017AUGAX
Columbia Management Advisors
Columbia US Treasury Index A Fund 12, 14, 18 0.72 1.84 0.78 3.54 3.33 11/25/2002 65 63 75 54 0.45 / 0.66-
08/31/2017LUTAX
Fidelity Management & Research
Fidelity Advisor Government Inc A Fund 12, 14, 18 0.74 1.98 1.06 3.62 3.73 10/24/2006 63 57 56 48 0.76 / 0.76-
-FVIAX
Franklin Advisers, Inc
Franklin US Government Securities R Fund 12, 14,
18
0.48 1.60 0.80 3.26 3.43 01/02/2002 73 72 72 67 1.11 / 1.11-
-FUSRX
Goldman Sachs Asset Mgt
Goldman Sachs Government Income A Fund 12,
14
1.05 1.80 1.07 3.29 4.82 02/10/1993 44 65 55 65 0.90 / 1.05-
07/29/2017GSGOX
Invesco
Invesco U.S. Government A Fund 12 1.40 1.80 0.93 3.43 5.19 04/28/1987 25 65 67 59 0.95 / 0.95-
-AGOVX
MFS Investment Management
MFS Government Securities R3 Fund 12, 14, 18 0.62 1.79 0.88 3.54 3.49 04/01/2005 70 66 69 53 0.88 / 0.88-
-MFGHX
PIMCO
PIMCO GNMA A Fund 12, 14, 18 1.42 2.62 1.52 4.39 4.91 12/01/2000 22 20 27 12 0.90 / 0.90-
-PAGNX
Prudential Investments, LLC
Prudential Government Income A Fund 12, 14, 18 -0.65 1.49 1.04 3.51 5.30 01/22/1990 96 78 58 55 0.99 / 0.99-
-PGVAX
Putnam Investment Mgmt Co.
Putnam American Government Income AFund 12, 14
0.15 1.15 1.04 4.35 5.82 03/01/1985 84 88 58 14 0.93 / 0.93-
-PAGVX
Sentinel Mutual Funds
Sentinel Government Securities A Fund 12, 14 0.36 1.61 0.52 3.46 5.64 09/02/1986 80 71 82 58 0.96 / 0.96-
-SEGSX
Average Annual Total Returns through 12/31/2016Percentile Rankings as of
12/31/2016
Inv Manager or Sub-AdvisorInvestment Option 1 yr. 3 yr. 5 yr. 10 yr.
SinceInception
InceptionDate 1 yr. 3 yr. 5 yr. 10 yr.
Total Inv.Exp. Net /
Gross
ContractualCap/WaiverExpire Date
TickerSymbol
R5
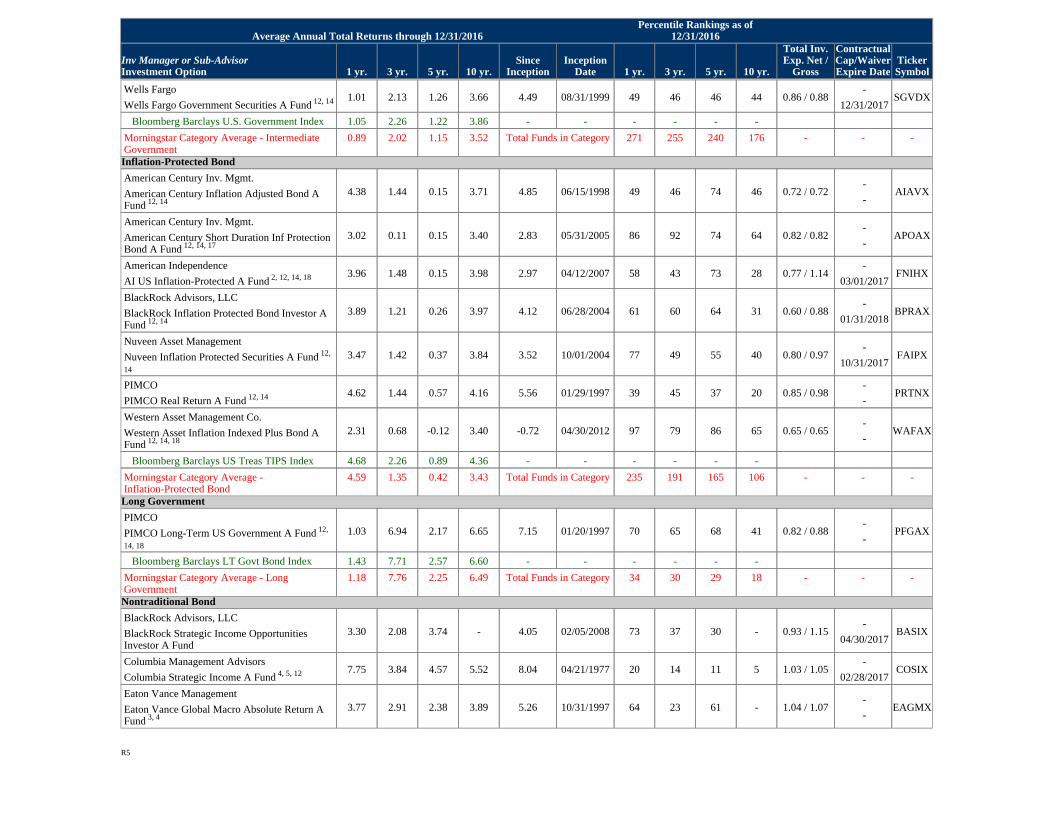
Wells Fargo
Wells Fargo Government Securities A Fund 12, 14 1.01 2.13 1.26 3.66 4.49 08/31/1999 49 46 46 44 0.86 / 0.88-
12/31/2017SGVDX
Bloomberg Barclays U.S. Government Index 1.05 2.26 1.22 3.86 - - - - - -
Morningstar Category Average - IntermediateGovernment
0.89 2.02 1.15 3.52 Total Funds in Category 271 255 240 176 - - -
Inflation-Protected Bond
American Century Inv. Mgmt.
American Century Inflation Adjusted Bond AFund 12, 14
4.38 1.44 0.15 3.71 4.85 06/15/1998 49 46 74 46 0.72 / 0.72-
-AIAVX
American Century Inv. Mgmt.
American Century Short Duration Inf ProtectionBond A Fund 12, 14, 17
3.02 0.11 0.15 3.40 2.83 05/31/2005 86 92 74 64 0.82 / 0.82-
-APOAX
American Independence
AI US Inflation-Protected A Fund 2, 12, 14, 18 3.96 1.48 0.15 3.98 2.97 04/12/2007 58 43 73 28 0.77 / 1.14-
03/01/2017FNIHX
BlackRock Advisors, LLC
BlackRock Inflation Protected Bond Investor AFund 12, 14
3.89 1.21 0.26 3.97 4.12 06/28/2004 61 60 64 31 0.60 / 0.88-
01/31/2018BPRAX
Nuveen Asset Management
Nuveen Inflation Protected Securities A Fund 12,
14
3.47 1.42 0.37 3.84 3.52 10/01/2004 77 49 55 40 0.80 / 0.97-
10/31/2017FAIPX
PIMCO
PIMCO Real Return A Fund 12, 14 4.62 1.44 0.57 4.16 5.56 01/29/1997 39 45 37 20 0.85 / 0.98-
-PRTNX
Western Asset Management Co.
Western Asset Inflation Indexed Plus Bond AFund 12, 14, 18
2.31 0.68 -0.12 3.40 -0.72 04/30/2012 97 79 86 65 0.65 / 0.65-
-WAFAX
Bloomberg Barclays US Treas TIPS Index 4.68 2.26 0.89 4.36 - - - - - -
Morningstar Category Average -Inflation-Protected Bond
4.59 1.35 0.42 3.43 Total Funds in Category 235 191 165 106 - - -
Long Government
PIMCO
PIMCO Long-Term US Government A Fund 12,
14, 18
1.03 6.94 2.17 6.65 7.15 01/20/1997 70 65 68 41 0.82 / 0.88-
-PFGAX
Bloomberg Barclays LT Govt Bond Index 1.43 7.71 2.57 6.60 - - - - - -
Morningstar Category Average - LongGovernment
1.18 7.76 2.25 6.49 Total Funds in Category 34 30 29 18 - - -
Nontraditional Bond
BlackRock Advisors, LLC
BlackRock Strategic Income OpportunitiesInvestor A Fund
3.30 2.08 3.74 - 4.05 02/05/2008 73 37 30 - 0.93 / 1.15-
04/30/2017BASIX
Columbia Management Advisors
Columbia Strategic Income A Fund 4, 5, 12 7.75 3.84 4.57 5.52 8.04 04/21/1977 20 14 11 5 1.03 / 1.05-
02/28/2017COSIX
Eaton Vance Management
Eaton Vance Global Macro Absolute Return AFund 3, 4
3.77 2.91 2.38 3.89 5.26 10/31/1997 64 23 61 - 1.04 / 1.07-
-EAGMX
Average Annual Total Returns through 12/31/2016Percentile Rankings as of
12/31/2016
Inv Manager or Sub-AdvisorInvestment Option 1 yr. 3 yr. 5 yr. 10 yr.
SinceInception
InceptionDate 1 yr. 3 yr. 5 yr. 10 yr.
Total Inv.Exp. Net /
Gross
ContractualCap/WaiverExpire Date
TickerSymbol
R5
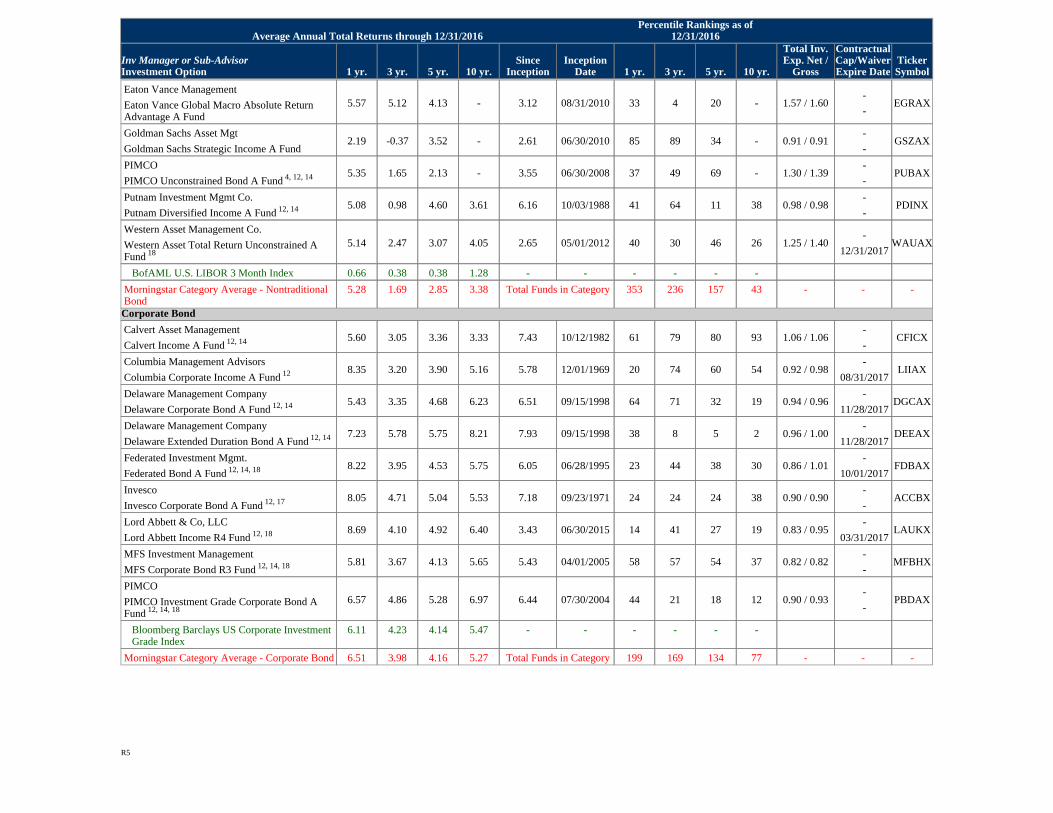
Eaton Vance Management
Eaton Vance Global Macro Absolute ReturnAdvantage A Fund
5.57 5.12 4.13 - 3.12 08/31/2010 33 4 20 - 1.57 / 1.60-
-EGRAX
Goldman Sachs Asset Mgt
Goldman Sachs Strategic Income A Fund2.19 -0.37 3.52 - 2.61 06/30/2010 85 89 34 - 0.91 / 0.91
-
-GSZAX
PIMCO
PIMCO Unconstrained Bond A Fund 4, 12, 14 5.35 1.65 2.13 - 3.55 06/30/2008 37 49 69 - 1.30 / 1.39-
-PUBAX
Putnam Investment Mgmt Co.
Putnam Diversified Income A Fund 12, 14 5.08 0.98 4.60 3.61 6.16 10/03/1988 41 64 11 38 0.98 / 0.98-
-PDINX
Western Asset Management Co.
Western Asset Total Return Unconstrained AFund 18
5.14 2.47 3.07 4.05 2.65 05/01/2012 40 30 46 26 1.25 / 1.40-
12/31/2017WAUAX
BofAML U.S. LIBOR 3 Month Index 0.66 0.38 0.38 1.28 - - - - - -
Morningstar Category Average - NontraditionalBond
5.28 1.69 2.85 3.38 Total Funds in Category 353 236 157 43 - - -
Corporate Bond
Calvert Asset Management
Calvert Income A Fund 12, 14 5.60 3.05 3.36 3.33 7.43 10/12/1982 61 79 80 93 1.06 / 1.06-
-CFICX
Columbia Management Advisors
Columbia Corporate Income A Fund 12 8.35 3.20 3.90 5.16 5.78 12/01/1969 20 74 60 54 0.92 / 0.98-
08/31/2017LIIAX
Delaware Management Company
Delaware Corporate Bond A Fund 12, 14 5.43 3.35 4.68 6.23 6.51 09/15/1998 64 71 32 19 0.94 / 0.96-
11/28/2017DGCAX
Delaware Management Company
Delaware Extended Duration Bond A Fund 12, 14 7.23 5.78 5.75 8.21 7.93 09/15/1998 38 8 5 2 0.96 / 1.00-
11/28/2017DEEAX
Federated Investment Mgmt.
Federated Bond A Fund 12, 14, 18 8.22 3.95 4.53 5.75 6.05 06/28/1995 23 44 38 30 0.86 / 1.01-
10/01/2017FDBAX
Invesco
Invesco Corporate Bond A Fund 12, 17 8.05 4.71 5.04 5.53 7.18 09/23/1971 24 24 24 38 0.90 / 0.90-
-ACCBX
Lord Abbett & Co, LLC
Lord Abbett Income R4 Fund 12, 18 8.69 4.10 4.92 6.40 3.43 06/30/2015 14 41 27 19 0.83 / 0.95-
03/31/2017LAUKX
MFS Investment Management
MFS Corporate Bond R3 Fund 12, 14, 18 5.81 3.67 4.13 5.65 5.43 04/01/2005 58 57 54 37 0.82 / 0.82-
-MFBHX
PIMCO
PIMCO Investment Grade Corporate Bond AFund 12, 14, 18
6.57 4.86 5.28 6.97 6.44 07/30/2004 44 21 18 12 0.90 / 0.93-
-PBDAX
Bloomberg Barclays US Corporate InvestmentGrade Index
6.11 4.23 4.14 5.47 - - - - - -
Morningstar Category Average - Corporate Bond 6.51 3.98 4.16 5.27 Total Funds in Category 199 169 134 77 - - -
Average Annual Total Returns through 12/31/2016Percentile Rankings as of
12/31/2016
Inv Manager or Sub-AdvisorInvestment Option 1 yr. 3 yr. 5 yr. 10 yr.
SinceInception
InceptionDate 1 yr. 3 yr. 5 yr. 10 yr.
Total Inv.Exp. Net /
Gross
ContractualCap/WaiverExpire Date
TickerSymbol
R5
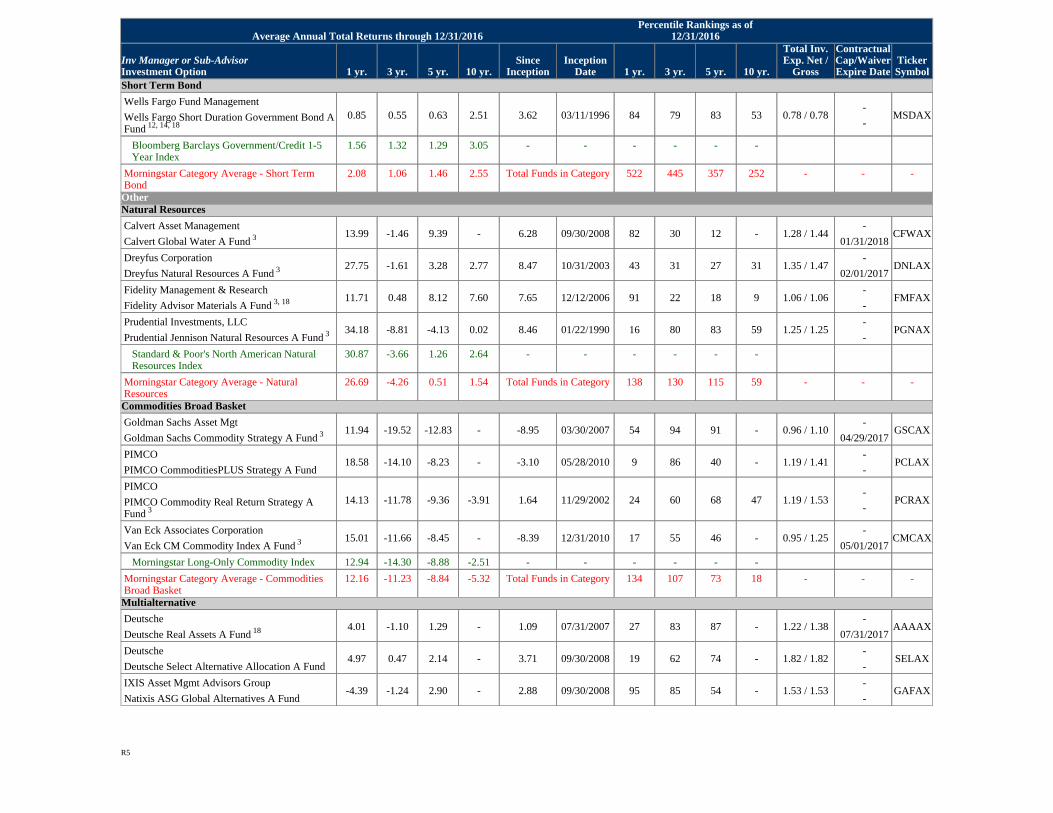
Short Term Bond
Wells Fargo Fund Management
Wells Fargo Short Duration Government Bond AFund 12, 14, 18
0.85 0.55 0.63 2.51 3.62 03/11/1996 84 79 83 53 0.78 / 0.78-
-MSDAX
Bloomberg Barclays Government/Credit 1-5Year Index
1.56 1.32 1.29 3.05 - - - - - -
Morningstar Category Average - Short TermBond
2.08 1.06 1.46 2.55 Total Funds in Category 522 445 357 252 - - -
OtherNatural Resources
Calvert Asset Management
Calvert Global Water A Fund 3 13.99 -1.46 9.39 - 6.28 09/30/2008 82 30 12 - 1.28 / 1.44-
01/31/2018CFWAX
Dreyfus Corporation
Dreyfus Natural Resources A Fund 3 27.75 -1.61 3.28 2.77 8.47 10/31/2003 43 31 27 31 1.35 / 1.47-
02/01/2017DNLAX
Fidelity Management & Research
Fidelity Advisor Materials A Fund 3, 18 11.71 0.48 8.12 7.60 7.65 12/12/2006 91 22 18 9 1.06 / 1.06-
-FMFAX
Prudential Investments, LLC
Prudential Jennison Natural Resources A Fund 3 34.18 -8.81 -4.13 0.02 8.46 01/22/1990 16 80 83 59 1.25 / 1.25-
-PGNAX
Standard & Poor's North American NaturalResources Index
30.87 -3.66 1.26 2.64 - - - - - -
Morningstar Category Average - NaturalResources
26.69 -4.26 0.51 1.54 Total Funds in Category 138 130 115 59 - - -
Commodities Broad Basket
Goldman Sachs Asset Mgt
Goldman Sachs Commodity Strategy A Fund 3 11.94 -19.52 -12.83 - -8.95 03/30/2007 54 94 91 - 0.96 / 1.10-
04/29/2017GSCAX
PIMCO
PIMCO CommoditiesPLUS Strategy A Fund18.58 -14.10 -8.23 - -3.10 05/28/2010 9 86 40 - 1.19 / 1.41
-
-PCLAX
PIMCO
PIMCO Commodity Real Return Strategy AFund 3
14.13 -11.78 -9.36 -3.91 1.64 11/29/2002 24 60 68 47 1.19 / 1.53-
-PCRAX
Van Eck Associates Corporation
Van Eck CM Commodity Index A Fund 3 15.01 -11.66 -8.45 - -8.39 12/31/2010 17 55 46 - 0.95 / 1.25-
05/01/2017CMCAX
Morningstar Long-Only Commodity Index 12.94 -14.30 -8.88 -2.51 - - - - - -
Morningstar Category Average - CommoditiesBroad Basket
12.16 -11.23 -8.84 -5.32 Total Funds in Category 134 107 73 18 - - -
Multialternative
Deutsche
Deutsche Real Assets A Fund 18 4.01 -1.10 1.29 - 1.09 07/31/2007 27 83 87 - 1.22 / 1.38-
07/31/2017AAAAX
Deutsche
Deutsche Select Alternative Allocation A Fund4.97 0.47 2.14 - 3.71 09/30/2008 19 62 74 - 1.82 / 1.82
-
-SELAX
IXIS Asset Mgmt Advisors Group
Natixis ASG Global Alternatives A Fund-4.39 -1.24 2.90 - 2.88 09/30/2008 95 85 54 - 1.53 / 1.53
-
-GAFAX
Average Annual Total Returns through 12/31/2016Percentile Rankings as of
12/31/2016
Inv Manager or Sub-AdvisorInvestment Option 1 yr. 3 yr. 5 yr. 10 yr.
SinceInception
InceptionDate 1 yr. 3 yr. 5 yr. 10 yr.
Total Inv.Exp. Net /
Gross
ContractualCap/WaiverExpire Date
TickerSymbol
R5
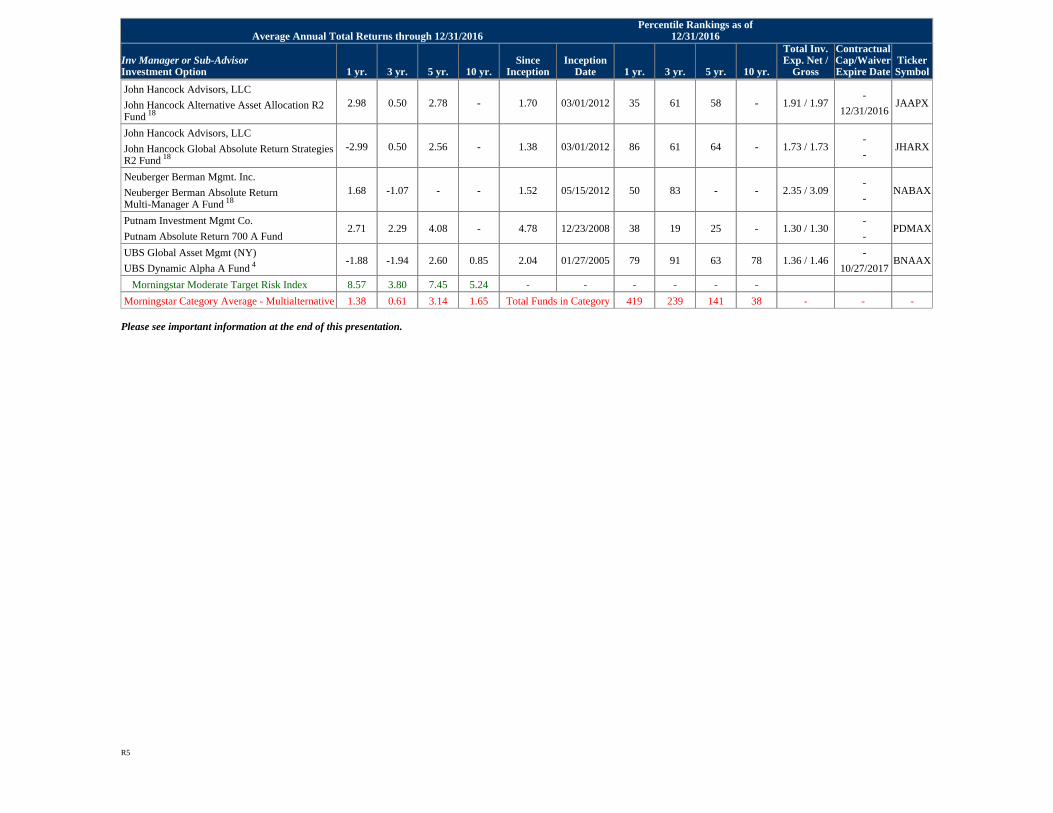
John Hancock Advisors, LLC
John Hancock Alternative Asset Allocation R2Fund 18
2.98 0.50 2.78 - 1.70 03/01/2012 35 61 58 - 1.91 / 1.97-
12/31/2016JAAPX
John Hancock Advisors, LLC
John Hancock Global Absolute Return StrategiesR2 Fund 18
-2.99 0.50 2.56 - 1.38 03/01/2012 86 61 64 - 1.73 / 1.73-
-JHARX
Neuberger Berman Mgmt. Inc.
Neuberger Berman Absolute ReturnMulti-Manager A Fund 18
1.68 -1.07 - - 1.52 05/15/2012 50 83 - - 2.35 / 3.09-
-NABAX
Putnam Investment Mgmt Co.
Putnam Absolute Return 700 A Fund2.71 2.29 4.08 - 4.78 12/23/2008 38 19 25 - 1.30 / 1.30
-
-PDMAX
UBS Global Asset Mgmt (NY)
UBS Dynamic Alpha A Fund 4 -1.88 -1.94 2.60 0.85 2.04 01/27/2005 79 91 63 78 1.36 / 1.46-
10/27/2017BNAAX
Morningstar Moderate Target Risk Index 8.57 3.80 7.45 5.24 - - - - - -
Morningstar Category Average - Multialternative 1.38 0.61 3.14 1.65 Total Funds in Category 419 239 141 38 - - -
Please see important information at the end of this presentation.
Average Annual Total Returns through 12/31/2016Percentile Rankings as of
12/31/2016
Inv Manager or Sub-AdvisorInvestment Option 1 yr. 3 yr. 5 yr. 10 yr.
SinceInception
InceptionDate 1 yr. 3 yr. 5 yr. 10 yr.
Total Inv.Exp. Net /
Gross
ContractualCap/WaiverExpire Date
TickerSymbol
R5
Important InformationA mutual fund's share price and investment return will vary with market conditions, and the principal value of an investment when you sell your shares may bemore or less than the original cost.
Percentile rankings are based on total returns in accordance with the appropriate Morningstar peer group.
Returns shown for periods of less than one year are not annualized. All returns displayed here are after Total Investment Expense of the investment option.
Investment options are subject to investment risk. Shares or unit values will fluctuate and investments, when redeemed, may be worth more or less than theiroriginal cost. This does not apply, however, to the guaranteed portions of group annuity contracts issued by Principal Life that constitute guaranteed benefitpolicies as defined in ERISA §401(b)(2)(B).
Any operating expenses of a mutual fund or underlying mutual fund that are part of net Total Investment Expense are obtained from the mutual fund's mostrecent prospectus. The operating expenses shown as part of Total Investment Expense include voluntary expense limits and fee credit.
Investors should carefully consider a mutual fund’s investment objectives, risks, charges, and expenses prior to investing. A prospectus, or summaryprospectus if available, containing this and other information can be obtained by contacting a financial professional, visiting principal.com, or calling1-800-547-7754. Read the prospectus carefully before investing.
Insurance products and plan administrative services, if applicable, are provided by Principal Life Insurance Company. Principal Funds, Inc. is distributed byPrincipal Funds Distributor, Inc. Securities are offered through Principal Securities, Inc., 800-547-7754, member SIPC and/or independent broker/dealers.Securities sold by a Principal Securities® Registered Representative are offered through Principal Securities. Principal Funds Distributor, Principal Securitiesand Principal Life are members of the Principal Financial Group®, Des Moines, IA 50392. Certain investment options may not be available in all states or U.S.commonwealths.©Principal Financial Services 2012.
For a Mutual Fund investment option, Total Investment Expense gross equals the sum of (a) the total fund operating expenses plus (b) if the mutual fund investsin other mutual funds, the weighted-average management fee of those other mutual funds, as listed in the most recent prospectus. The actual Total InvestmentExpense may change if the mutual fund investment option's allocation of assets to other mutual funds changes.
This report includes investment options that contain information from a variety of sources. A primary source is Morningstar which provides holdingsinformation, operations data, and rankings or statistics proprietary to Morningstar. Morningstar is generally the source of information on mutual fundsunaffiliated with the Principal.
(C) 2017 Morningstar, Inc. All Rights Reserved. Part of the investment data contained herein includes Morningstar peer group comparisons, ratings, holdingsand other data from its mutual fund and variable annuity databases and : (1) is proprietary to Morningstar and/or its content providers: (2) may not be copiedor distributed; and (3) is not warranted to be accurate, complete, or timely. Neither Morningstar nor its content providers are responsible for any damages orlosses arising from any use of this information.
Compliance number: t16083102t1
1. Small-cap and mid-cap investment options are subject to more fluctuation in value and may have additional risks than other investment options with stocksof larger, more stable companies.
2. Each index based investment option is invested in the stocks or bonds of the index it tracks. Performance of indexes reflects the unmanaged results for themarket segment the selected stocks or bonds represent. There is no assurance an index based investment option will match the performance of the index tracked.
Common Platform Mutual Fund Network,
3. Specialty investment options may experience greater volatility than funds with a broader investment strategy due to sector focus. These investment options arenot intended to serve as a complete investment program by itself.
4. International and global investment options are subject to additional risk due to fluctuating exchange rates, foreign accounting and financial policies, andother economic and political environments.
5. High yield investment options are subject to greater credit risk and volatility that is associated with high yield bonds.
7. Real Estate investment options are subject to investment and liquidity risk and other risks inherent in real estate such as those associated with general andlocal economic conditions. Property values can decline due to environmental and other reasons. In addition, fluctuation in interest rates can negatively impactthe performance of real estate investment options.
8. As of December 3, 2001, Bond, Intermediate-Term Bond, and Premium Bond merged into Diversified Bond. For periods prior to December 3, 2001,Institutional Class has been restated to reflect the expenses of the Advisor Class.
9. This investment option is closed to new investors.
10. Equity investment options involve greater risk, including heightened volatility, than fixed-income investment options. Fixed-income investment options aresubject to interest rate risk, and their value will decline as interest rates rise.
11. Asset allocation does not guarantee a profit or protect against a loss. Investing in real estate, small-cap, international, and high-yield investment optionsinvolves additional risks.
12. Fixed-income investment options are subject to interest rate risk, and their value will decline as interest rates rise. Neither the principal of bond investmentoptions nor their yields are guaranteed by the U.S. government.
13. This fund indirectly bears its pro rata share of the management fees incurred by the underlying funds in which it invests. The operating expenses of theunderlying mutual funds are part of total investment expense. Performance results reflect the application of these expenses.
14. Fixed-income and asset allocation investment options that invest in mortgage securities are subject to increased risk due to real estate exposure.
17. This investment option has experienced a name change.
18. For Mutual Fund Network investment options, returns for all time periods, except the Since Inception time frame, may include the historical performance ofthe oldest share class of the fund, adjusted to reflect a portion of the fees and expenses of this share class. Since Inception returns display the actual return of thisshare class and do not reflect the adjusted returns of the oldest share class. Please see the fund's prospectus for more information on specific expenses, and thefund's most recent shareholder report for actual date of first sale. Expenses are deducted from income earned by the fund. As a result, dividends and investmentresults will differ for each share class.
Benchmark Descriptions
Balanced Strategy Composite Index is composed of 30% Russell 1000 Index, 4% Russell 2500 Index, 14% MSCI EAFE Index, 3% MSCI Emerging MarketsIndex, 4% MSCI World Index, 5% NAREIT Equity Index, and 40% Barclays Capital Aggregate Bond Index.
Bloomberg Barclays 1-3 Yr Government Index is comprised of both the Treasury Bond Index and the Agency Bond Index.
Bloomberg Barclays Aggregate Bond Index represents securities that are domestic, taxable, and dollar denominated. The index covers the U.S. investment gradefixed rate bond market, with index components for government and corporate securities, mortgage pass-through securities, and asset-backed securities. Thesemajor sectors are subdivided into more specific indices that are calculated and reported on a regular basis.
Bloomberg Barclays Government 1-5 Year Index tracks the U.S. Government component of the U.S. Government/Credit index with a maturity of 1-5 years.
Common Platform Mutual Fund Network,
Bloomberg Barclays Long-Term Govt/Credit Index includes those indexes found in the Government index which have a maturity of 10 years or more. Thereturns we publish for the index are total returns, which include reinvestment of dividends. .
Bloomberg Barclays LT Govt Bond Index includes those indexes found in the Barclays Government index which have a maturity of 10 years or more.
Bloomberg Barclays U.S. Government Index is the U.S. Government component of the U.S. Government/Credit Index.
Bloomberg Barclays U.S. Universal Index represents the union of the U.S. Aggregate Bond Index, the U.S. High Yield Corporate Index, the 144A Index, theEurodollar Index, the Emerging Markets Index, the non-ERISA portion of the CMBS Index, and the CMBS High Yield Index.
Bloomberg Barclays US Corporate Investment Grade Index is an unmanaged index consisting of publicly issued US Corporate and specified foreign debenturesand secured notes that are rated investment grade and have at least one year to final maturity.
Bloomberg Barclays US Treas TIPS Index consists of inflation-protected securities issued by the U.S. Treasury.
BofAML Convertible Bonds All Qualities Index is an unmanaged index that measures convertible securities performance.
BofAML U.S. LIBOR 3 Month Index is an average of the interest rate for U.S. dollar deposits, known as Eurodollars, of a stated maturity. LIBOR is anabbreviation for the London Interbank Offered Rate.
Citigroup Non-$ World Govt Bond Index covers thirteen government-bond markets: Austria, Belgium, Canada, Denmark, France, Germany, Italy, Japan, theNetherlands, Spain, Sweden and the United Kingdom.
Conservative Strategy Composite Index is composed of 11% Russell 1000 Index, 4% MSCI EAFE Index, 2% MSCI World Index, 3% NAREIT Equity Index, 60%Barclays Capital Aggregate Bond Index, and 20% Merrill Lynch US Treasury 1-3 year Index.
Diversified Real Asset Strategic Index is composed of 35% Bloomberg Barclays U.S. Treasury TIPS Index, 20% S&P Global Infrastructure Index, 20% S&PGlobal Natural Resources Index, 15% Bloomberg Commodity Index, and 10% FTSE EPRA/NAREIT Developed Markets Index.
Growth Strategy Composite Index is composed of 41% Russell 1000 Index, 6% Russell 2500 Index, 17% MSCI EAFE Index, 4% MSCI Emerging Markets Index,6% MSCI World Index, 6% NAREIT Equity Index, and 20% Barclays Capital Aggregate Bond Index.
Merrill Lynch U.S. High Yield Master II Index measures the performance of high yield bonds.
Moderate Strategy Composite Index is composed of 20% Russell 1000 Index, 3% Russell 2500 Index, 9% MSCI EAFE Index, 2% MSCI Emerging Markets Index,3% MSCI World Index, 3% NAREIT Equity Index, and 60% Barclays Capital Aggregate Bond Index.
Morningstar Aggressive Target Risk Index represents a portfolio of global equities, bonds and traditional inflation hedges such as commodities and TIPS. Thisportfolio is held in a static allocation appropriate for U.S. investors who seek above-average exposure to equity market risk and returns.
Morningstar Lifetime Moderate 2010 Index represents a portfolio of global equities, bonds and traditional inflation hedges such as commodities and TIPS. Thisportfolio is held in proportions appropriate for a U.S. investor who is near retirement.
Morningstar Lifetime Moderate 2015 Index represents a portfolio of global equities, bonds and traditional inflation hedges such as commodities and TIPS. Thisportfolio is held in proportions appropriate for a U.S. investor who is about five years away from retirement.
Morningstar Lifetime Moderate 2020 Index represents a portfolio of global equities, bonds and traditional inflation hedges such as commodities and TIPS. Thisportfolio is held in proportions appropriate for a U.S. investor who is about ten years away from retirement.
Morningstar Lifetime Moderate 2025 Index represents a portfolio of global equities, bonds and traditional inflation hedges such as commodities and TIPS. Thisportfolio is held in proportions appropriate for a U.S. investor who is about 15 years away from retirement.
Common Platform Mutual Fund Network,
Morningstar Lifetime Moderate 2030 Index represents a portfolio of global equities, bonds and traditional inflation hedges such as commodities and TIPS. Thisportfolio is held in proportions appropriate for a U.S. investor who is about 20 years away from retirement.
Morningstar Lifetime Moderate 2035 Index represents a portfolio of global equities, bonds and traditional inflation hedges such as commodities and TIPS. Thisportfolio is held in proportions appropriate for a U.S. investor who is about 25 years away from retirement.
Morningstar Lifetime Moderate 2040 Index represents a portfolio of global equities, bonds and traditional inflation hedges such as commodities and TIPS. Thisportfolio is held in proportions appropriate for a U.S. investor who is about 30 years away from retirement.
Morningstar Lifetime Moderate 2045 Index represents a portfolio of global equities, bonds and traditional inflation hedges such as commodities and TIPS. Thisportfolio is held in proportions appropriate for a U.S. investor who is about 35 years away from retirement.
Morningstar Lifetime Moderate 2050 Index represents a portfolio of global equities, bonds and traditional inflation hedges such as commodities and TIPS. Thisportfolio is held in proportions appropriate for a U.S. investor who is about 40 years away from retirement.
Morningstar Lifetime Moderate Income Index represents a portfolio of global equities, bonds and traditional inflation hedges such as commodities and TIPS.This portfolio is held in proportions appropriate for a U.S. investor who is at least ten years into retirement.
Morningstar Moderately Aggressive Target Risk Index represents a portfolio of global equities, bonds and traditional inflation hedges such as commodities andTIPS. This portfolio is held in a static allocation appropriate for U.S. investors who seek a slightly above-average exposure to equity market risk and returns.
Morningstar Moderately Conservative Target Risk Index represents a portfolio of global equities, bonds and traditional inflation hedges such as commoditiesand TIPS. This portfolio is held in a static allocation appropriate for U.S. investors who seek a slightly below-average exposure to equity market risk andreturns.
MSCI AC Far East ex Japan Index is a free float-adjusted market capitalization weighted index that is designed to measure the equity market performance ofthe Far East, excluding Japan.
MSCI ACWI Ex USA Index is a free float-adjusted market capitalization index that is designed to measure the combined equity market performance ofdeveloped and emerging market countries excluding the US.
MSCI All Country World Index is a free float-adjusted market capitalization weighted index that is designed to measure the equity market performance ofdeveloped and emerging markets.
MSCI China Index is a free float-adjusted market capitalization weighted index that is designed to measure the equity market performance of China excludingHong Kong.
MSCI EAFE Value Index is a subset of the MSCI EAFE Index, which is an unmanaged index that measures the stock returns of companies in developedeconomies outside of North America. The MSCI EAFE Value Index consists of securities classified by MSCI as most representing the value style.
MSCI Emerging Markets Latin America Index is a free float-adjusted market capitalization weighted index that is designed to measure the equity marketperformance of emerging markets in Latin America.
MSCI Emerging Markets NR Index measures equity market performance in the global emerging markets. It consists of 26 emerging market countries in Europe,Latin America and the Pacific Basin.
MSCI Europe NDTR D Index is listed for Europe stock funds. This index measures the performance of stock markets in Austria, Belgium, Denmark, Finland,France, Germany, Italy, the Netherlands, Norway, Spain, Sweden, Switzerland, Ireland, Portugal, and the United Kingdom.
MSCI World NDTR D Index includes all 23 MSCI developed market countries. The "ND" indicates that the index is listed in U.S. dollars, with net dividendsreinvested.
Common Platform Mutual Fund Network,
MSCI World/Metals & Mining Index tracks the Metals & Mining industry of the MSCI World Index.
Russell 1000 Growth Index is a market-capitalization weighted index of those firms in the Russell 1000 with higher price-to-book ratios and higher forecastedgrowth values.
Russell 1000 Index consists of the 1000 largest companies within the Russell 3000 index. Also known as the Market-Oriented Index, because it represents thegroup of stocks from which most active money managers choose.
Russell 1000 Value Index is a market-capitalization weighted index of those firms in the Russell 1000 with lower price-to-book ratios and lower forecastedgrowth values.
Russell 2000 Growth Index is a market-weighted total return index that measures the performance of companies within the Russell 2000 Index having higherprice-to-book ratio and higher forecasted growth values.
Russell 2000 Index consists of the smallest 2000 companies in the Russell 3000 Index, representing approximately 10% of the Russell 3000 total marketcapitalization.
Russell 2000 Value Index is a market-weighted total return index that measures the performance of companies within the Russell 2000 Index having lowerprice-to-book ratios and lower forecasted growth values.
Russell Midcap Growth Index is a market-weighted total return index that measures the performance of companies within the Russell Midcap Index havinghigher price-to-book ratios and higher forecasted growth values.
Russell Midcap Index includes firms 201 through 1000, based on market capitalization, from the Russell 3000 Index.
Russell Midcap Value Index is a market-weighted total return index that measures the performance of companies within the Russell Midcap index having lowerprice-to-book ratios and lower forecasted growth values.
Standard & Poor's 1500 Energy Index tracks the Energy sector of the S&P 1500 Index.
Standard & Poor's 500 Index is a market capitalization-weighted index of 500 widely held stocks often used as a proxy for the stock market.
Standard & Poor's North American Natural Resources Index measures the performance of U.S. traded stocks of natural resource related companies in the U.S.and Canada.
Common Platform Mutual Fund Network,
Glossary of Terms7 Day Yield - The 7-Day Yield % more closely reflects the current earnings of this money market investment option than the total return displayed.
Category Average Return - Morningstar takes the average return of the funds that exist in a category for the time period and divide by the number of funds thatexist for that time period. For calendar year category average returns, Morningstar includes funds that have merged, liquidated, or changed categories whencalculating category averages.
Total Investment Expense Gross - The maximum expense ratio that can be applied to an investment option. This includes expenses and management fees,including 12b-1 fees, administrative fees, and all other asset-based costs incurred by the investment option, except brokerage costs.
Total Investment Expense Net - Gross expense ratio less any fee waivers, reimbursements or caps. The expenses, as a percentage of net assets, actually borneby the fund. Investment performance results are always net of expense ratios.
Expense Waiver - The investment advisor can waive a portion of their management fees resulting in a lower net investment expense ratio.
Contractual Cap - A contractual agreement between the investment advisor and the fund to limit, as a percentage of net assets, the expenses borne by the fund.
Inception Date - Date on which the investment option began its operations.
Morningstar Category - The Morningstar Category identifies investment options based on their actual investment styles as measured by their underlyingportfolio holdings (portfolio statistics and compositions over the past three years).
Percentile Rankings - Each investment’s total returns are compared to other investments in the same Morningstar category for various time periods. Totalreturns are ranked on a scale from 1 to 100 where 1 represents the highest-returning 1% of investments and 100 represents the lowest returning investments.
Investment Advisor - May include Registered Investment Advisers as defined in the Advisers Act of 1940, Investment Advisers as defined in the InvestmentCompany Act of 1940, as well as a company employed by the investment option's advisor to handle the investment option's day-to-day management. In theseinstances, the portfolio manager generally works for the fund's subadvisor, and not the advisor. See definition of Multiple Sub-Advisor appearing elsewhere inthis presentation for greater detail about Sub-Advisors.
Ticker Symbol - This is a symbol assigned to a mutual fund by NASDAQ and is commonly used to locate funds on electronic price-quoting systems. To receivea ticker symbol, mutual funds must meet minimum requirements. Mutual funds may qualify for a regular ticker if the fund has more than $25 million in assets, ormore than 1,000 shareholders. Supplemental tickers must have at least $10 million in assets, or have completed a minimum of two business years. SupplementalNASDAQ funds do not appear in newspaper listings, even though they report performance to and are tracked by NASDAQ.
R5