Embed Size (px)
Citation preview
Jessica Granderson, [email protected] Berkeley National Laboratory
M&V 2.0 Demonstrations2017 Building Technologies Office Peer Review
2
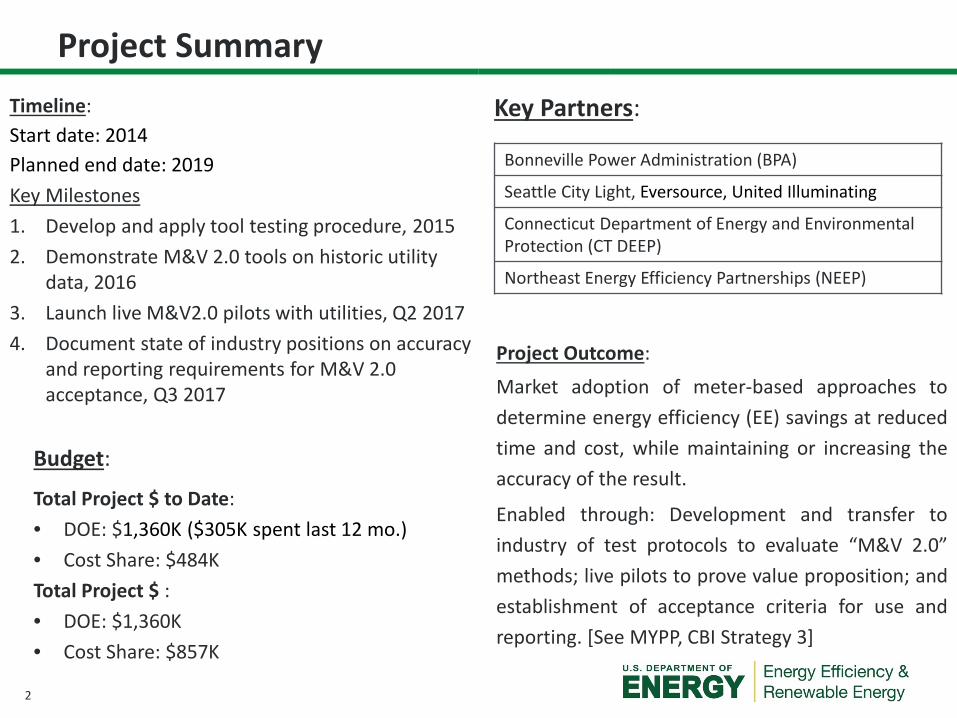
Project SummaryTimeline:Start date: 2014Planned end date: 2019Key Milestones 1. Develop and apply tool testing procedure, 20152. Demonstrate M&V 2.0 tools on historic utility
data, 20163. Launch live M&V2.0 pilots with utilities, Q2 20174. Document state of industry positions on accuracy
and reporting requirements for M&V 2.0 acceptance, Q3 2017
Budget:
Total Project $ to Date: • DOE: $1,360K ($305K spent last 12 mo.)• Cost Share: $484KTotal Project $ : • DOE: $1,360K• Cost Share: $857K
Key Partners:
Project Outcome:
Market adoption of meter-based approaches todetermine energy efficiency (EE) savings at reducedtime and cost, while maintaining or increasing theaccuracy of the result.
Enabled through: Development and transfer toindustry of test protocols to evaluate “M&V 2.0”methods; live pilots to prove value proposition; andestablishment of acceptance criteria for use andreporting. [See MYPP, CBI Strategy 3]
Bonneville Power Administration (BPA)
Seattle City Light, Eversource, United Illuminating
Connecticut Department of Energy and Environmental Protection (CT DEEP)
Northeast Energy Efficiency Partnerships (NEEP)

3
Grounding Concepts
• Traditional approaches to savings estimation, i.e. M&V – Custom engineering calculations– Stipulated, deemed, average measure savings– Calibrated physics-based simulation modeling– Manual meter-based billing analysis
• Advanced M&V, i.e. M&V “2.0”– Automated meter analytics using software tools, more data, to streamline the
process, provide more timely performance feedback • Utility program issues
– Different baselines for different measures, prior use not always appropriate– Attribution of meter-level savings to measures installed (adjustments)– Transparency, 3rd party review
Right: meter-based savings estimation – baseline energy use is mathematically modeled, projected to estimate consumption if the measure had never been implemented. Saving are the difference between actual metered and baseline projected use.
4
Purpose and Objectives
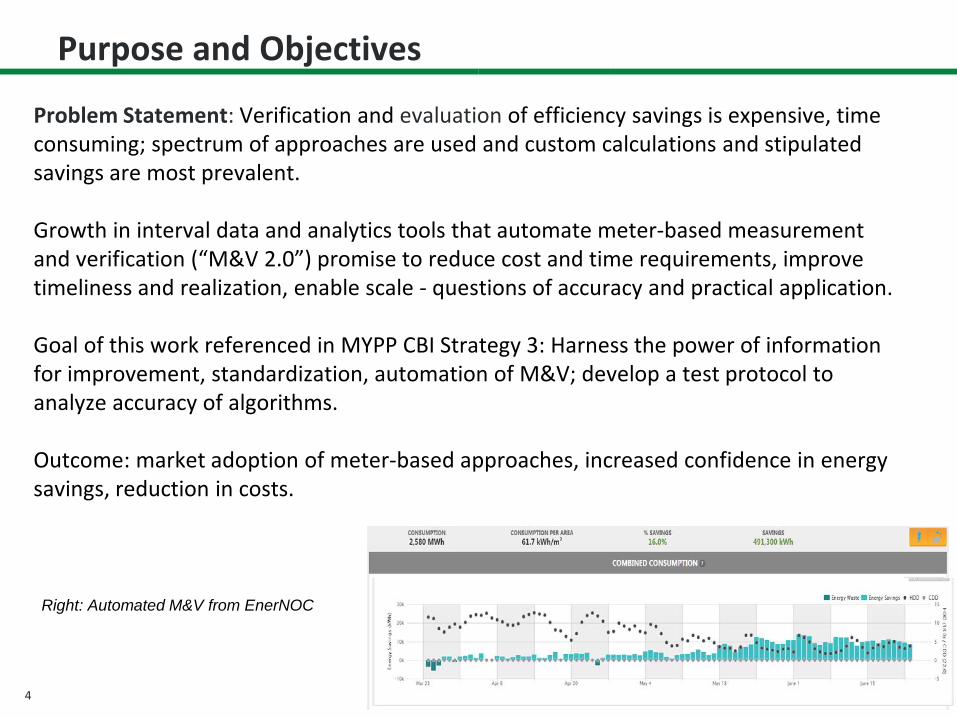
Problem Statement: Verification and evaluation of efficiency savings is expensive, time consuming; spectrum of approaches are used and custom calculations and stipulated savings are most prevalent.
Growth in interval data and analytics tools that automate meter-based measurement and verification (“M&V 2.0”) promise to reduce cost and time requirements, improve timeliness and realization, enable scale - questions of accuracy and practical application.
Goal of this work referenced in MYPP CBI Strategy 3: Harness the power of information for improvement, standardization, automation of M&V; develop a test protocol to analyze accuracy of algorithms.
Outcome: market adoption of meter-based approaches, increased confidence in energy savings, reduction in costs.
Right: Automated M&V from EnerNOC
5
Purpose and Objectives
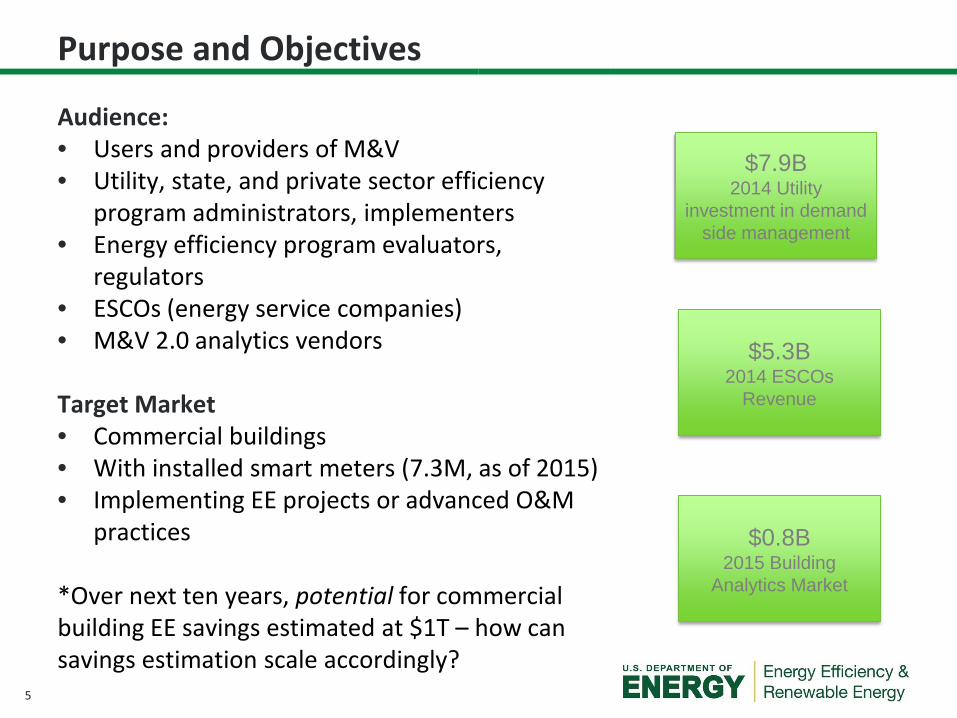
Audience:• Users and providers of M&V• Utility, state, and private sector efficiency
program administrators, implementers• Energy efficiency program evaluators,
regulators• ESCOs (energy service companies)• M&V 2.0 analytics vendors
Target Market• Commercial buildings• With installed smart meters (7.3M, as of 2015)• Implementing EE projects or advanced O&M
practices
*Over next ten years, potential for commercial building EE savings estimated at $1T – how can savings estimation scale accordingly?
$7.9B2014 Utility
investment in demand side management
$5.3B2014 ESCOs
Revenue
$0.8B2015 Building
Analytics Market

6
Purpose and Objectives
Impact of Project:
Near-term: transparent replicable test methods for M&V tools used by industry; early demonstration of M&V 2.0 w utility partners; documentation of time and cost savings, accuracy.
Intermediate: Scaled demonstration and dissemination of results to industry at large; tools and resources adopted to standardize practical application of M&V 2.0 methods.
Long-term: scaled adoption of cost effective, accurate, meter-based savings estimation; market growth from private capital injection, due to higher confidence in EE savings results.
Below: Replication of CBI Logic Model – objectives, activities, short- mid- and long-term outcomes
Accelerate adoption of EE
by providing information …
Facilitate use of tools, access to
standardized transparent
performance data
Owners, investors equipped with tools to understand and
value energy performance
Stakeholders use performance data to incorporate EE into
financial transactions
Adoption of solutions to improve
whole-building energy performance
7
Approach
• 2014-2015: Develop test procedure to assess and compare predictive accuracy of auto-M&V tools; apply to evaluate proprietary and open tools
• 2016: Demonstrate software/methods using historical utility program data
• 2017: Pilots on ‘live’ projects, transfer test procedure to industry, establish acceptance criteria and practitioner resources
Key Issues: What are acceptable uncertainties and confidence levels for regulatory community? How good is good enough? How to handle non-routine adjustments, attribute meter savings to measures?
Distinctive Characteristics: Transparent testing and public piloting; providing cost, benefit and performance evidence, how-to guidance from pilots to address barriers to adoption.

8
Progress and Accomplishments
Accomplishments Summary:
• In discussion with Efficiency Valuation Organization to explore delivering tool testing protocols* to industry
• Supported 2 utilities and 1 regulator to partner in demonstrating models on real world program data**
• Initiated M&V 2.0 pilots with 2 utilities• Initiated discussions with regulatory groups to identify
accuracy, uncertainty, reporting requirements
* Granderson, J, Touzani, S, Custodio, C, Sohn, M, Jump, D, Fernandes, S. 2016. Accuracy of automated measurement and verification (M&V) techniques for commercial buildings. Applied Energy 173: 296-308.
** Granderson, J, Touzani, S, Fernandes, S, Taylor, C. 2017. Application of automated measurement and verification to utility energy efficiency program data. Energy and Buildings, In Press.
9
Progress and Accomplishments
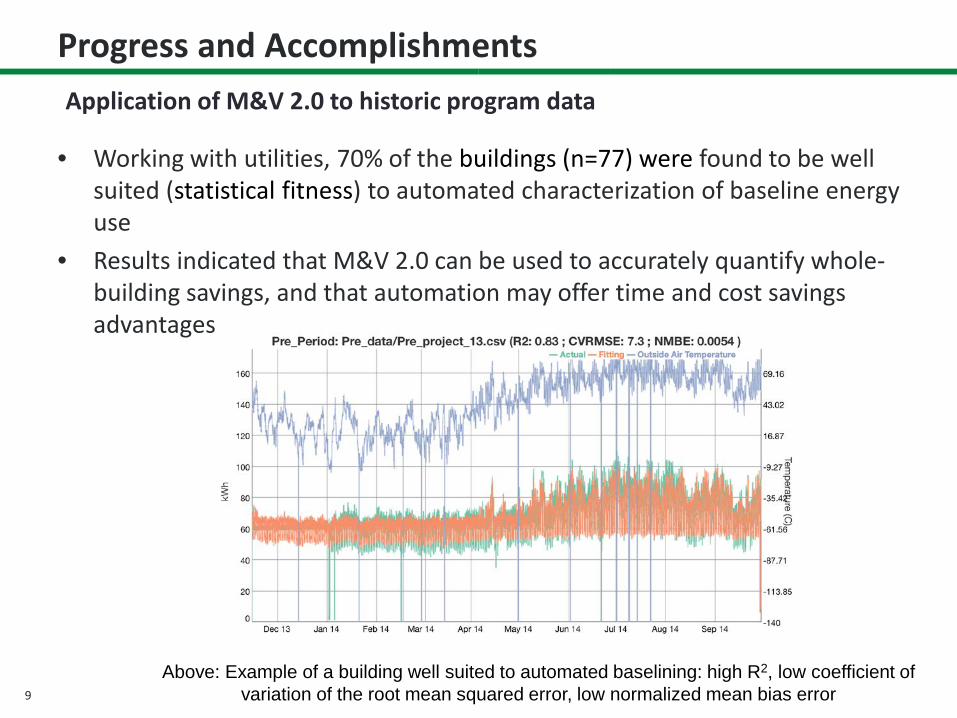
• Working with utilities, 70% of the buildings (n=77) were found to be well suited (statistical fitness) to automated characterization of baseline energy use
• Results indicated that M&V 2.0 can be used to accurately quantify whole-building savings, and that automation may offer time and cost savings advantages
Above: Example of a building well suited to automated baselining: high R2, low coefficient of variation of the root mean squared error, low normalized mean bias error
Application of M&V 2.0 to historic program data
10
Progress and Accomplishments
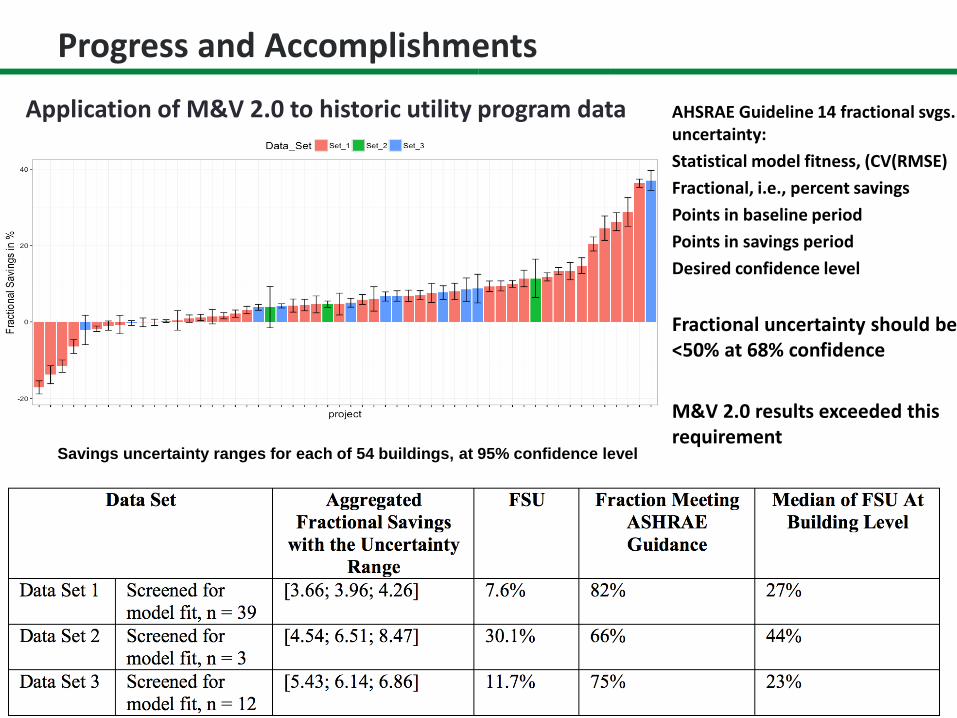
Savings uncertainty ranges for each of 54 buildings, at 95% confidence level
Application of M&V 2.0 to historic utility program data AHSRAE Guideline 14 fractional svgs. uncertainty:Statistical model fitness, (CV(RMSE)Fractional, i.e., percent savingsPoints in baseline periodPoints in savings periodDesired confidence level
Fractional uncertainty should be <50% at 68% confidence
M&V 2.0 results exceeded this requirement
11
Progress and Accomplishments
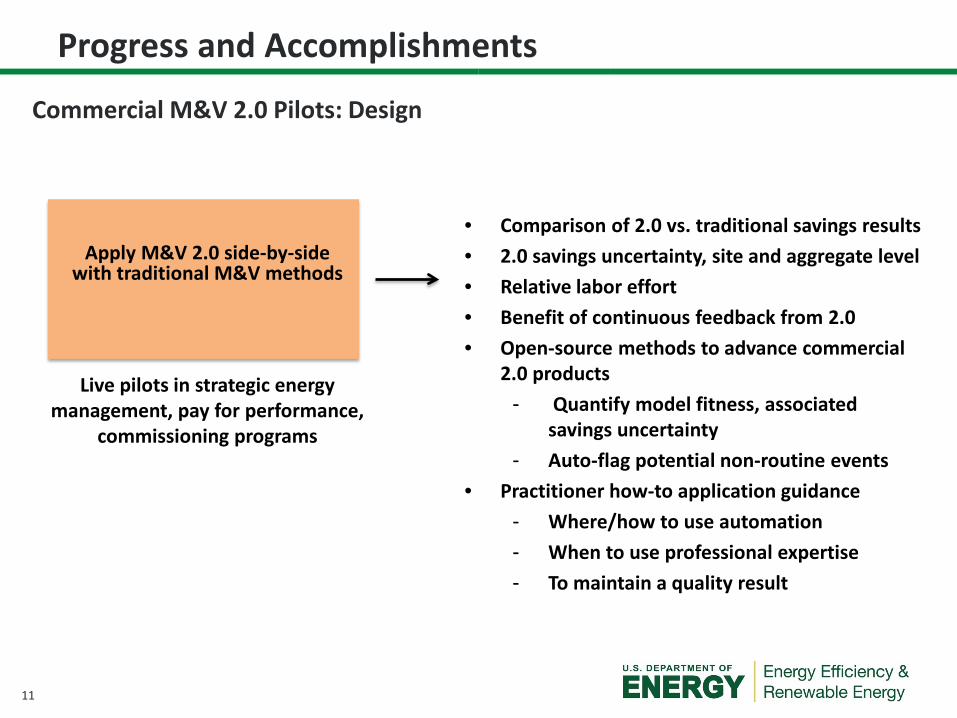
Commercial M&V 2.0 Pilots: Design
Apply M&V 2.0 side-by-side with traditional M&V methods
Live pilots in strategic energy management, pay for performance,
commissioning programs
• Comparison of 2.0 vs. traditional savings results• 2.0 savings uncertainty, site and aggregate level• Relative labor effort• Benefit of continuous feedback from 2.0 • Open-source methods to advance commercial
2.0 products- Quantify model fitness, associated
savings uncertainty- Auto-flag potential non-routine events
• Practitioner how-to application guidance- Where/how to use automation- When to use professional expertise- To maintain a quality result
12
Progress and Accomplishments
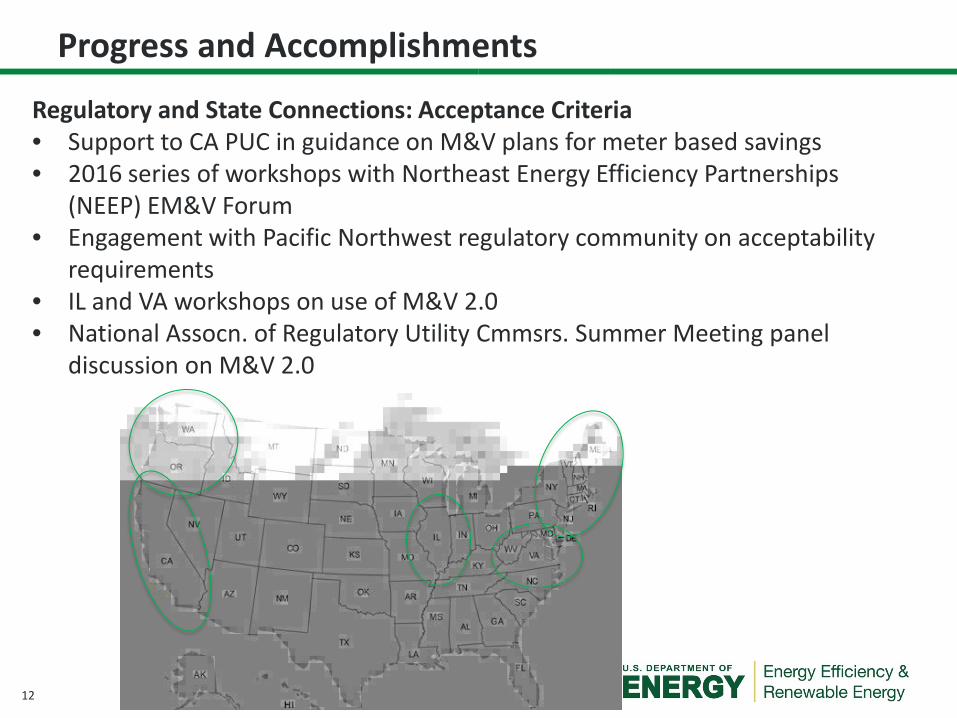
Regulatory and State Connections: Acceptance Criteria• Support to CA PUC in guidance on M&V plans for meter based savings• 2016 series of workshops with Northeast Energy Efficiency Partnerships
(NEEP) EM&V Forum • Engagement with Pacific Northwest regulatory community on acceptability
requirements• IL and VA workshops on use of M&V 2.0• National Assocn. of Regulatory Utility Cmmsrs. Summer Meeting panel
discussion on M&V 2.0
13
Progress and Accomplishments
• Market Impact: Work being used and co-funded by multiple industry stakeholders, including– CA-PUC: In context of recent legislation requiring meter-based savings– State Energy Program, BPA, utilities: pilots tools and application
resources– Multi-year engagement of CEE whole-buildings committee for
knowledge transfer
• Awards/Recognition: - Invited to co-author RMI multi-
stakeholder paper on current status and promise of M&V 2.0
- Work cited in most recent NEEP industry brief
14
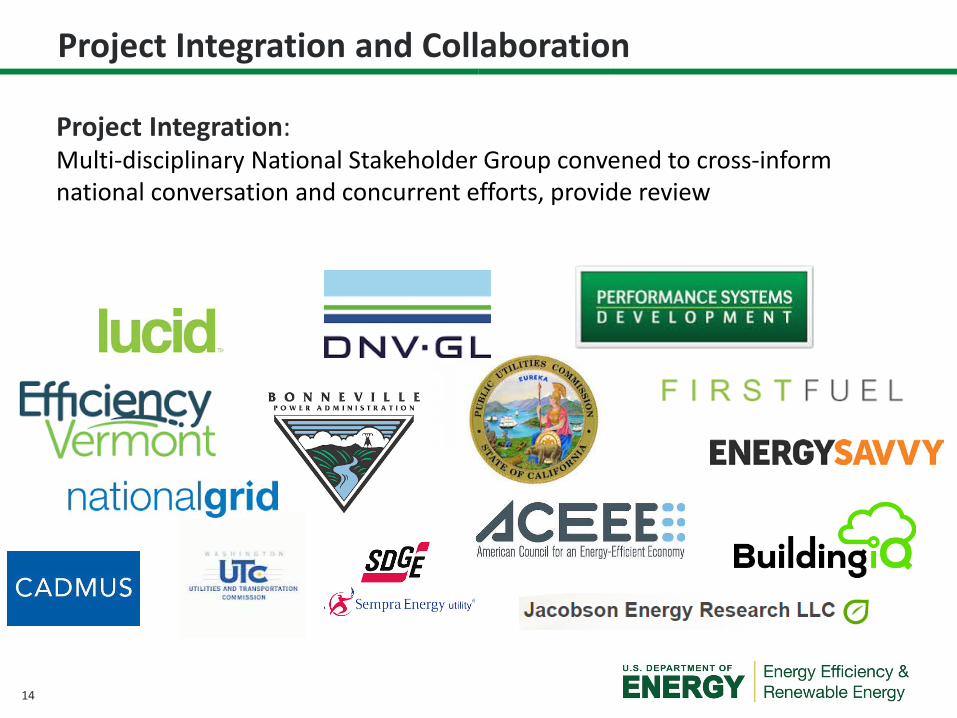
Project Integration: Multi-disciplinary National Stakeholder Group convened to cross-inform national conversation and concurrent efforts, provide review
Project Integration and Collaboration
15
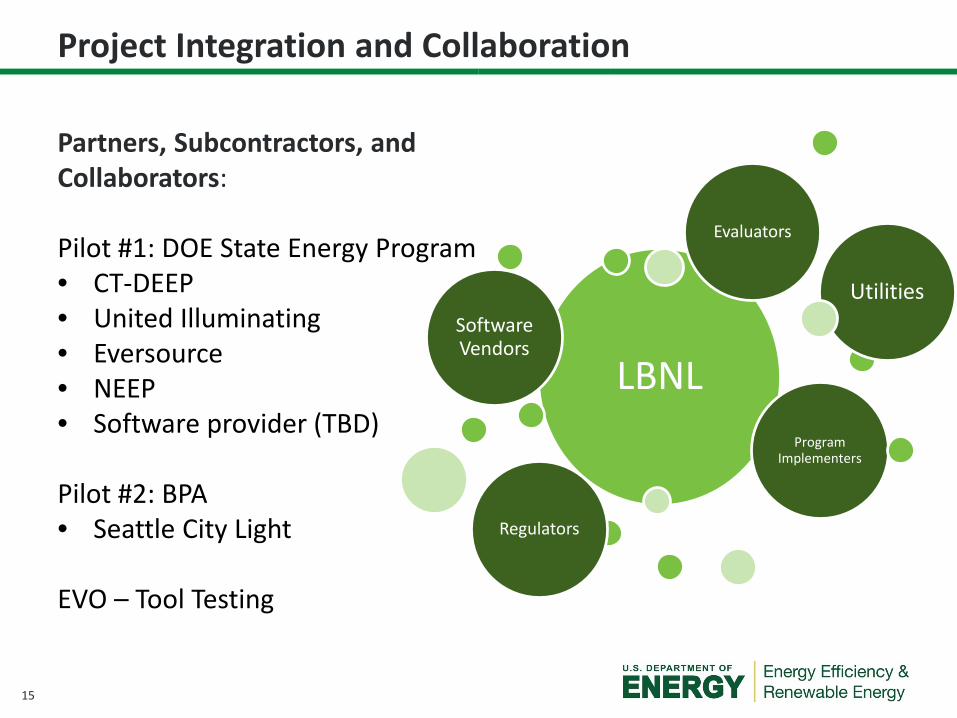
Partners, Subcontractors, and Collaborators:
Pilot #1: DOE State Energy Program• CT-DEEP• United Illuminating• Eversource• NEEP• Software provider (TBD)
Pilot #2: BPA• Seattle City Light
EVO – Tool Testing
Project Integration and Collaboration
LBNLSoftware Vendors
Utilities
Program Implementers
Regulators
Evaluators
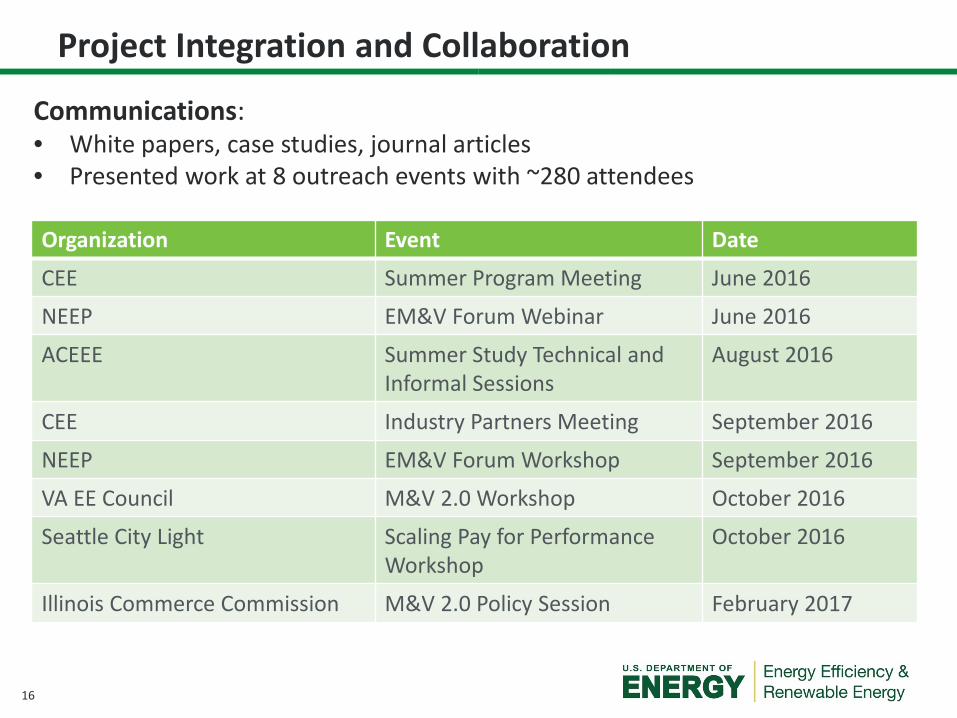
16
Communications: • White papers, case studies, journal articles• Presented work at 8 outreach events with ~280 attendees
Project Integration and Collaboration
Organization Event Date
CEE Summer Program Meeting June 2016
NEEP EM&V Forum Webinar June 2016
ACEEE Summer Study Technical and Informal Sessions
August 2016
CEE Industry Partners Meeting September 2016
NEEP EM&V Forum Workshop September 2016
VA EE Council M&V 2.0 Workshop October 2016
Seattle City Light Scaling Pay for Performance Workshop
October 2016
Illinois Commerce Commission M&V 2.0 Policy Session February 2017

17
Next Steps:• Monitor pilots and report on outcomes• Continued industry outreach & CEE collaboration• Document acceptability requirements• Support transition of tool testing• Quarterly stakeholder group meetings
Future Plans:• Scaled demonstration, market adoption to enable
• Next generation holistic whole-building programs to deliver deep savings
• Reliable cost effective savings estimation for increased confidence and investment in efficiency
• With meter as foundation, ability to integrate energy, demand, cost savings, as EE, distributed energy resources, and transaction-based services converge
Next Steps and Future Plans
18
REFERENCE SLIDES
19
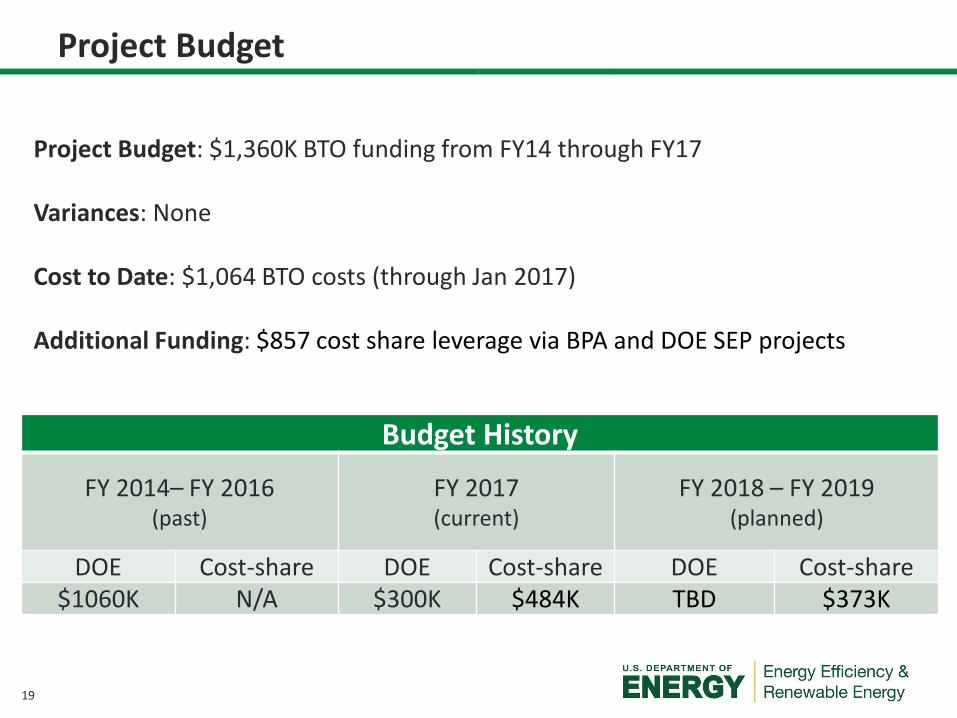
Project Budget: $1,360K BTO funding from FY14 through FY17
Variances: None
Cost to Date: $1,064 BTO costs (through Jan 2017)
Additional Funding: $857 cost share leverage via BPA and DOE SEP projects
Budget History
FY 2014– FY 2016(past)
FY 2017(current)
FY 2018 – FY 2019(planned)
DOE Cost-share DOE Cost-share DOE Cost-share$1060K N/A $300K $484K TBD $373K
Project Budget

20
Project Plan and Schedule
Project Start: FY '14Projected End: FY '18
●●
Task Q1 Q2 Q3 Q4 Q1 Q2 Q3 Q4 Q1 Q2 Q3 Q4
Q3 FY '15 Milestone: Complete initial evalution of M&V 2.0 models obtained under FY '14 solicitation
●
Q1 FY '16 Milestone: Document co-development of utility resources and activities and outcomes to date from ongoing CEE engagement in a memo to BTO
●
Q2 FY '16 Milestone: Recruit at least 2 utilities to use M&V 2.0 ●
Q2 FY '16 Milestone: Completion of the first FY '16 industry outreach events ●
Q1 FY '17 Milestone: National Stakeholder Group convened and FY'17 schedule planned
●
Q1 FY '17 Go/No-Go Decision: M&V 2.0 pilots planned or underway ●
Q2 FY '17 Milestone: Industry organization has agreed to deliver M&V 2.0 tool testing
●
Q3 FY '17 Milestone: Documentation of industry positions on accuracy, uncertainty, reporting
●
Q4 FY '17 Milestone: Publish pilot findings ●
Past Work
Project Schedule
Current/Future Work
FY2015 FY2016 FY2017
Completed WorkActive Task (in progress work)Milestone/Deliverable (Plan)Milestone/Deliverable (Actual)