Embed Size (px)
Citation preview
MWD Educational Field Trip to the Sacramento/San Joaquin Bay Delta
October 2016
Burbank Water and Power
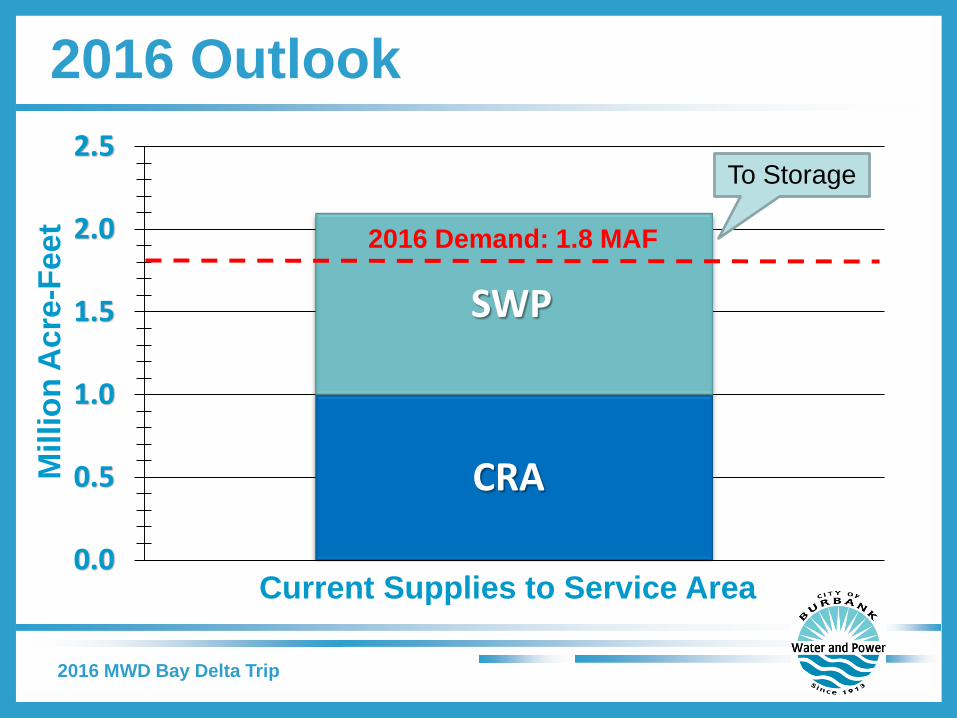
2016 Outlook
CRA
SWP
0.0
0.5
1.0
1.5
2.0
2.5
Mill
ion
Acr
e-Fe
et
Current Supplies to Service Area
2016 Demand: 1.8 MAF
2016 MWD Bay Delta Trip
To Storage
-
1
2
3
4
5
6
1980 1983 1986 1989 1992 1995 1998 2001 2004 2007 2010
Mill
ions
of A
cre-
Feet
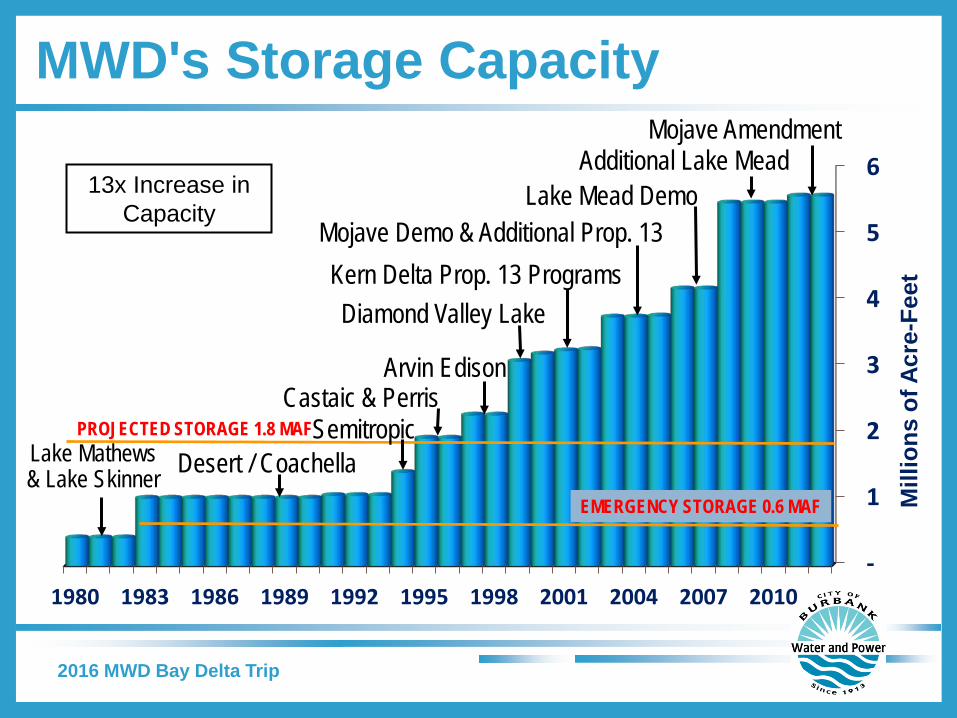
EMERGENCY STORAGE 0.6 MAF
PROJECTED STORAGE 1.8 MAF
MWD's Storage Capacity
13x Increase in Capacity
Desert / Coachella Lake Mathews & Lake Skinner
Castaic & Perris
Mojave Demo & Additional Prop. 13
Diamond Valley Lake
Lake Mead Demo
Kern Delta Prop. 13 Programs
Arvin Edison
Additional Lake Mead
Semitropic
Mojave Amendment
2016 MWD Bay Delta Trip
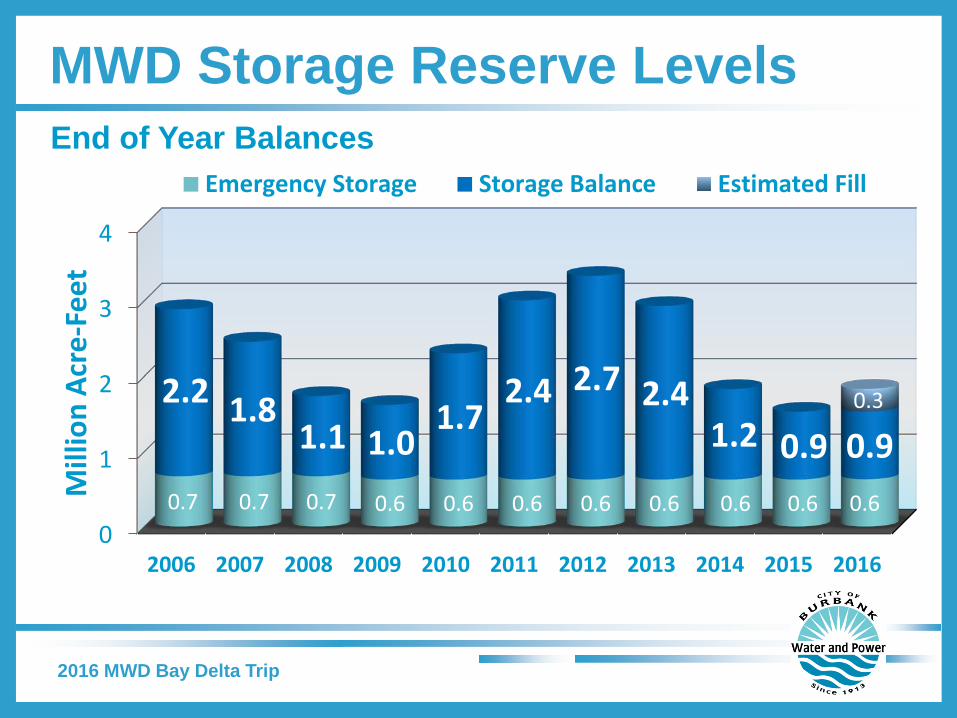
MWD Storage Reserve Levels
2016 MWD Bay Delta Trip
0
1
2
3
4
2006 2007 2008 2009 2010 2011 2012 2013 2014 2015 2016
0.7 0.7 0.7 0.6 0.6 0.6 0.6 0.6 0.6 0.6 0.6
2.2 1.8 1.1 1.0
1.7 2.4 2.7 2.4
1.2 0.9 0.9 0.3
Mill
ion
Acre
-Fee
t
Emergency Storage Storage Balance Estimated Fill
End of Year Balances
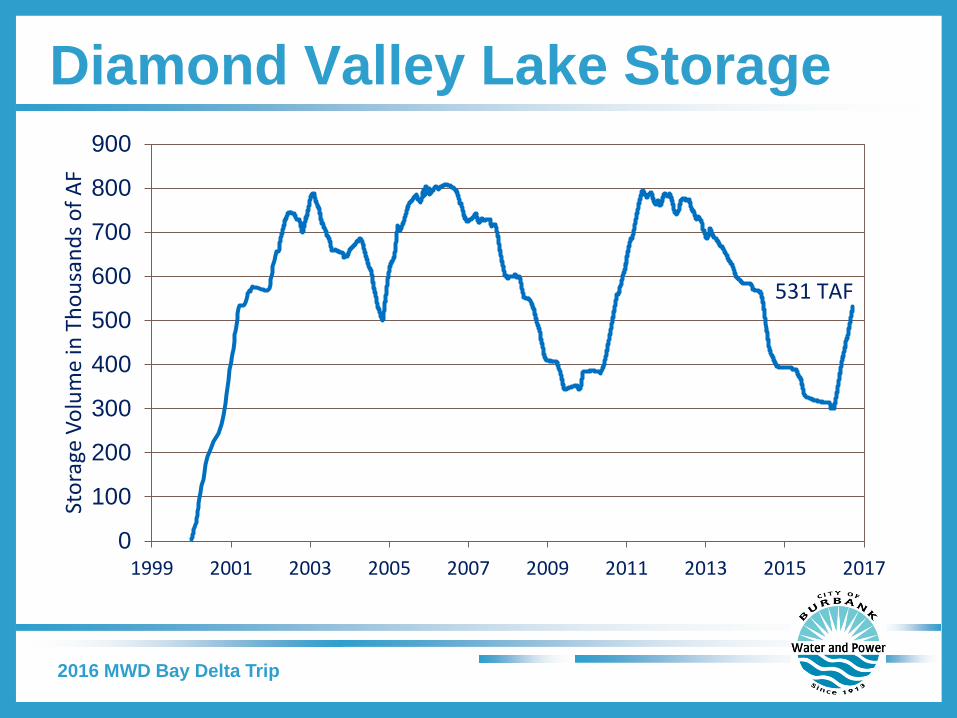
Diamond Valley Lake Storage
2016 MWD Bay Delta Trip
0
100
200
300
400
500
600
700
800
900
1999 2001 2003 2005 2007 2009 2011 2013 2015 2017
Stor
age
Volu
me
in T
hous
ands
of A
F
531 TAF
2016 MWD Bay Delta Trip
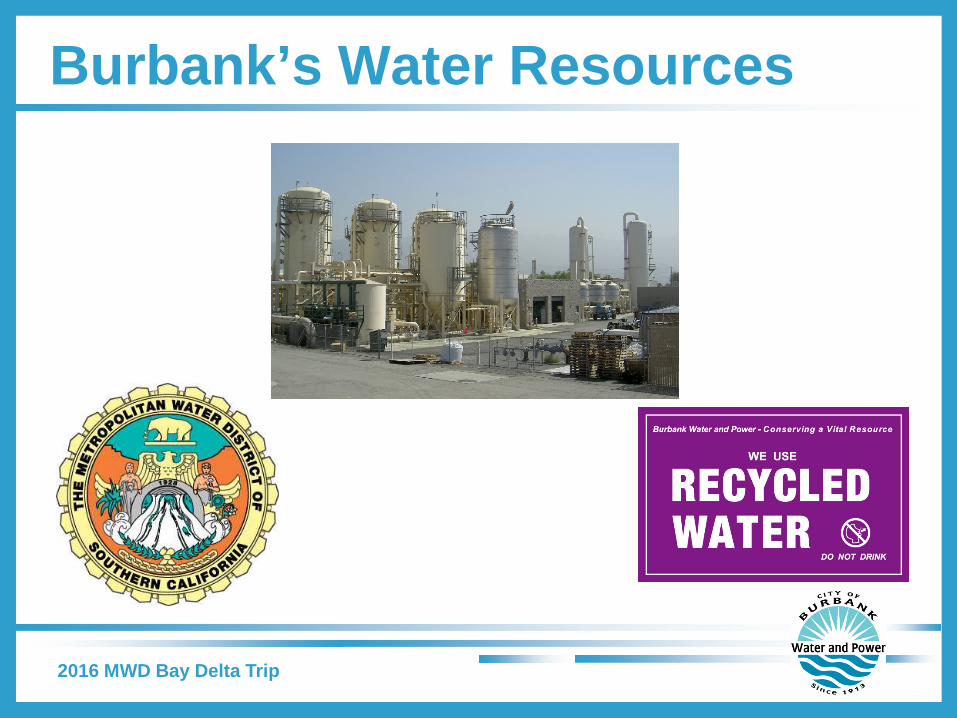
Burbank’s Water Resources
2016 MWD Bay Delta Trip
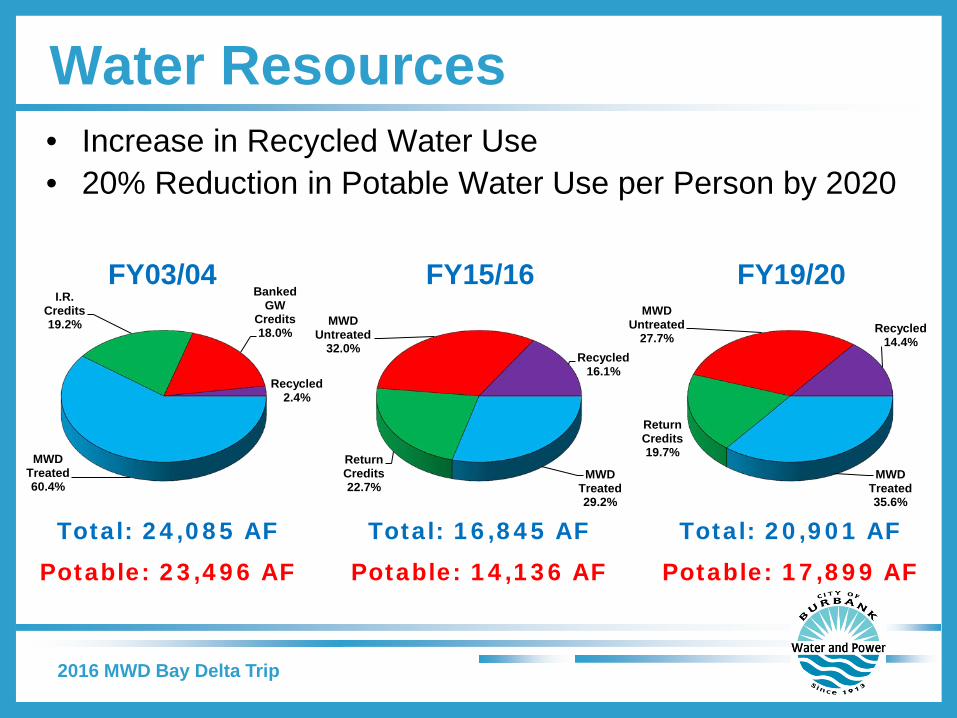
Water Resources • Increase in Recycled Water Use • 20% Reduction in Potable Water Use per Person by 2020
Total: 24,085 AF Total: 16,845 AF Total: 20,901 AF
MWD Treated 60.4%
I.R. Credits 19.2%
Banked GW
Credits 18.0%
Recycled 2.4%
FY03/04
MWD Treated 35.6%
Return Credits 19.7%
MWD Untreated
27.7% Recycled
14.4%
FY19/20
MWD Treated 29.2%
Return Credits 22.7%
MWD Untreated
32.0% Recycled
16.1%
FY15/16
Potable: 23,496 AF Potable: 14,136 AF Potable: 17,899 AF
2016 MWD Bay Delta Trip
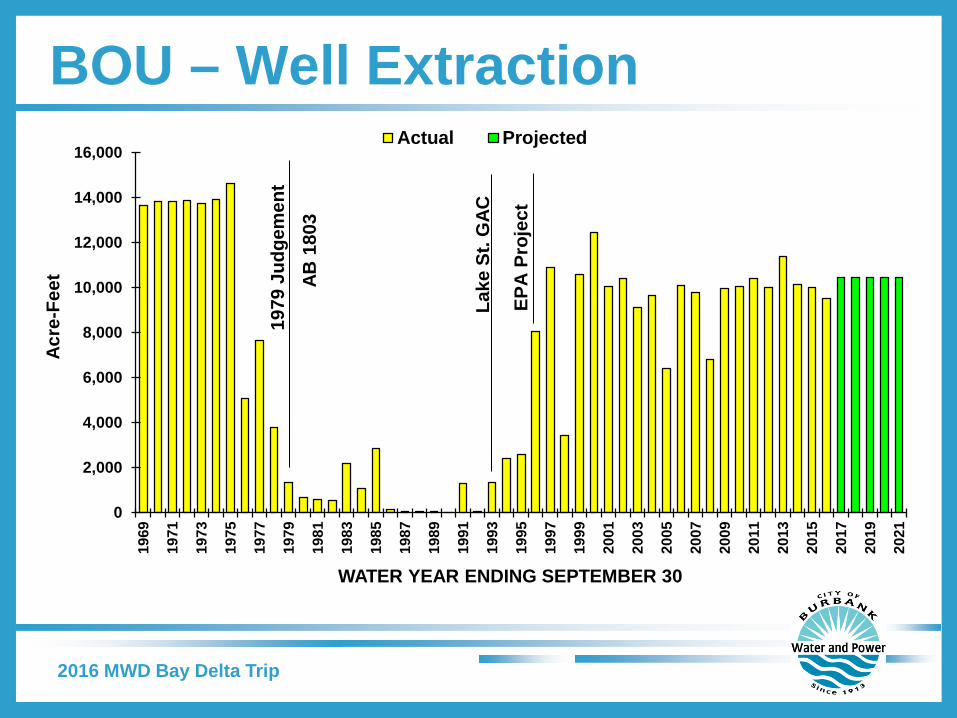
BOU – Well Extraction
0
2,000
4,000
6,000
8,000
10,000
12,000
14,000
16,00019
69
1971
1973
1975
1977
1979
1981
1983
1985
1987
1989
1991
1993
1995
1997
1999
2001
2003
2005
2007
2009
2011
2013
2015
2017
2019
2021
Acr
e-Fe
et
WATER YEAR ENDING SEPTEMBER 30
Actual Projected
Lake
St.
GAC
EPA
Proj
ect
1979
Jud
gem
ent
AB 1
803
2016 MWD Bay Delta Trip
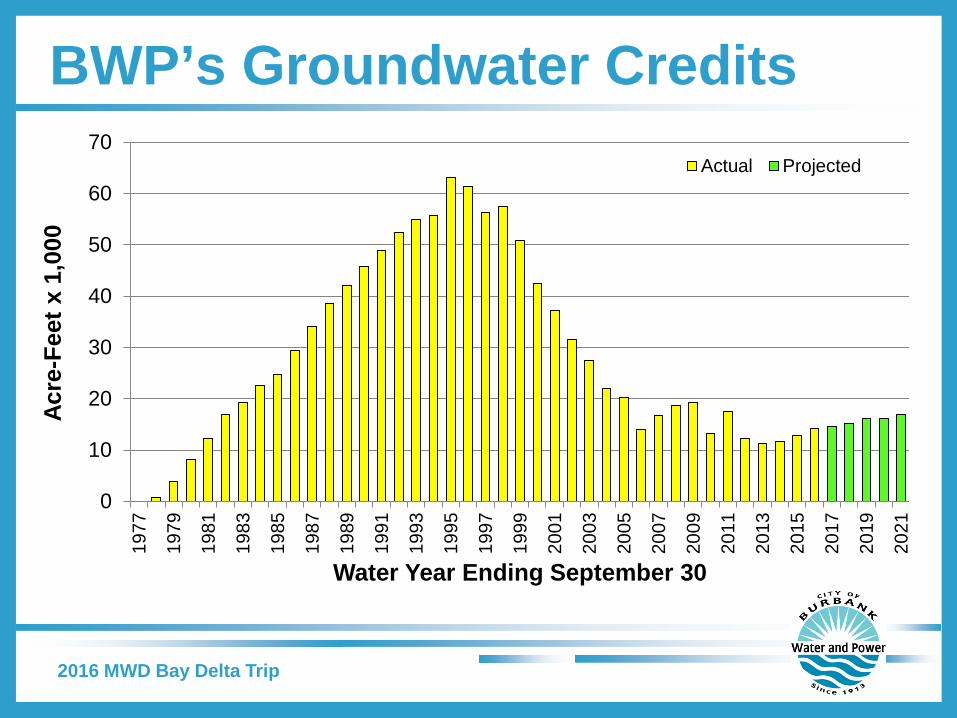
BWP’s Groundwater Credits
0
10
20
30
40
50
60
7019
77
1979
1981
1983
1985
1987
1989
1991
1993
1995
1997
1999
2001
2003
2005
2007
2009
2011
2013
2015
2017
2019
2021
Acre
-Fee
t x 1
,000
Water Year Ending September 30
Actual Projected
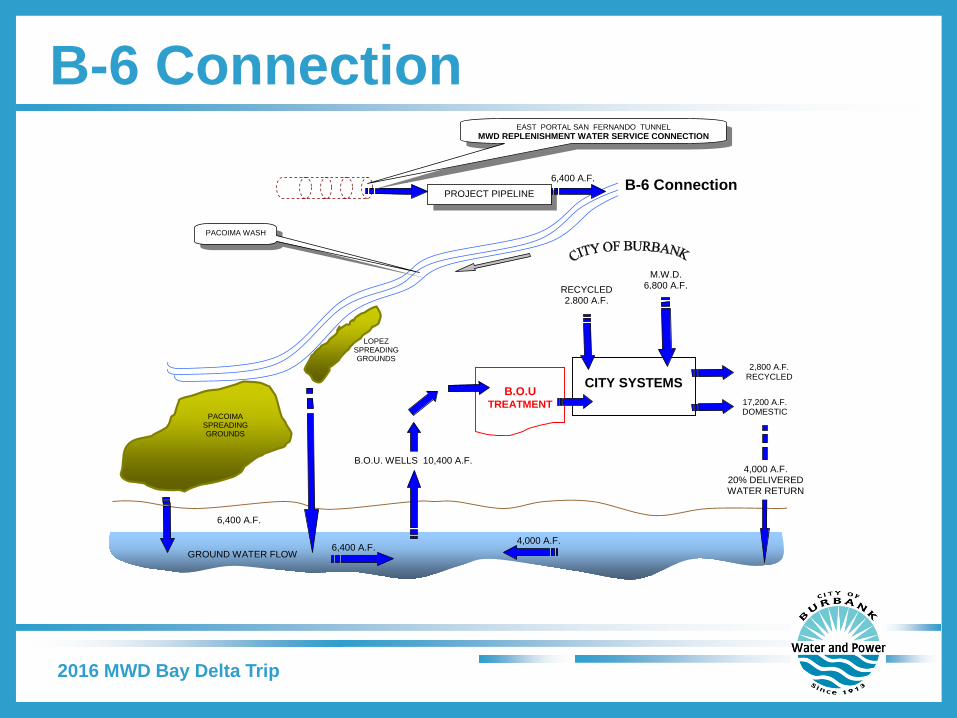
17,200 A.F. DOMESTIC
PACOIMA WASH
PROJECT PIPELINE
PACOIMA SPREADING GROUNDS
CITY SYSTEMS
B.O.U TREATMENT
LOPEZ SPREADING GROUNDS
B.O.U. WELLS 10,400 A.F.
6,400 A.F. B-6 Connection
EAST PORTAL SAN FERNANDO TUNNEL MWD REPLENISHMENT WATER SERVICE CONNECTION
GROUND WATER FLOW 6,400 A.F.
4,000 A.F.
4,000 A.F. 20% DELIVERED WATER RETURN
6,400 A.F.
M.W.D. 6,800 A.F. RECYCLED
2,800 A.F.
2,800 A.F. RECYCLED
B-6 Connection
2016 MWD Bay Delta Trip
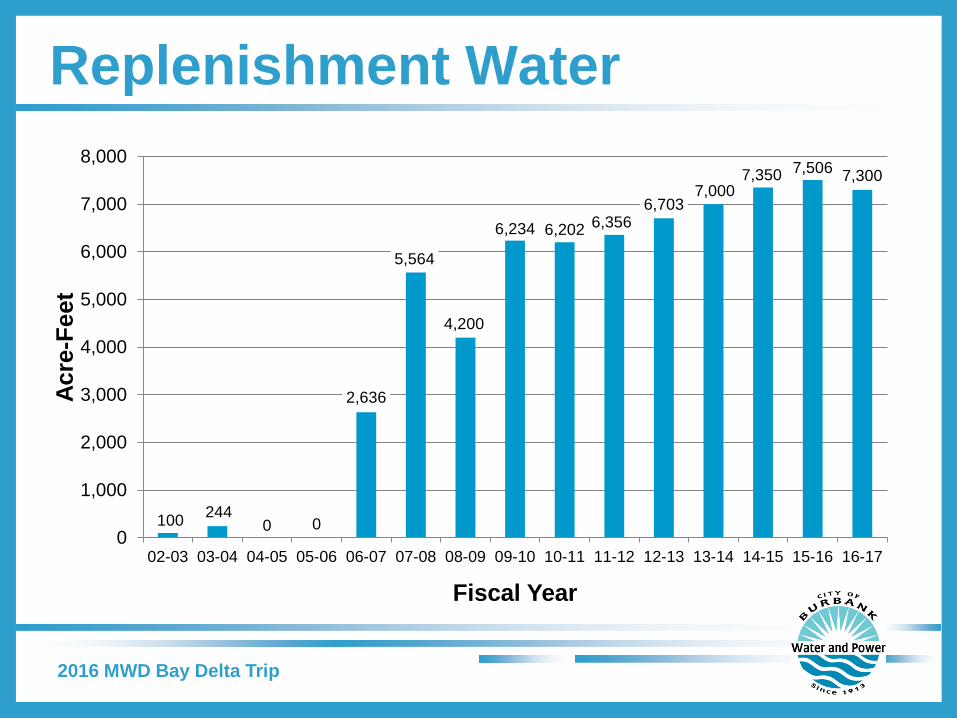
Replenishment Water
2016 MWD Bay Delta Trip
100 244 0 0
2,636
5,564
4,200
6,234 6,202 6,356 6,703
7,000 7,350 7,506 7,300
0
1,000
2,000
3,000
4,000
5,000
6,000
7,000
8,000
02-03 03-04 04-05 05-06 06-07 07-08 08-09 09-10 10-11 11-12 12-13 13-14 14-15 15-16 16-17
Fiscal Year
Acre
-Fee
t
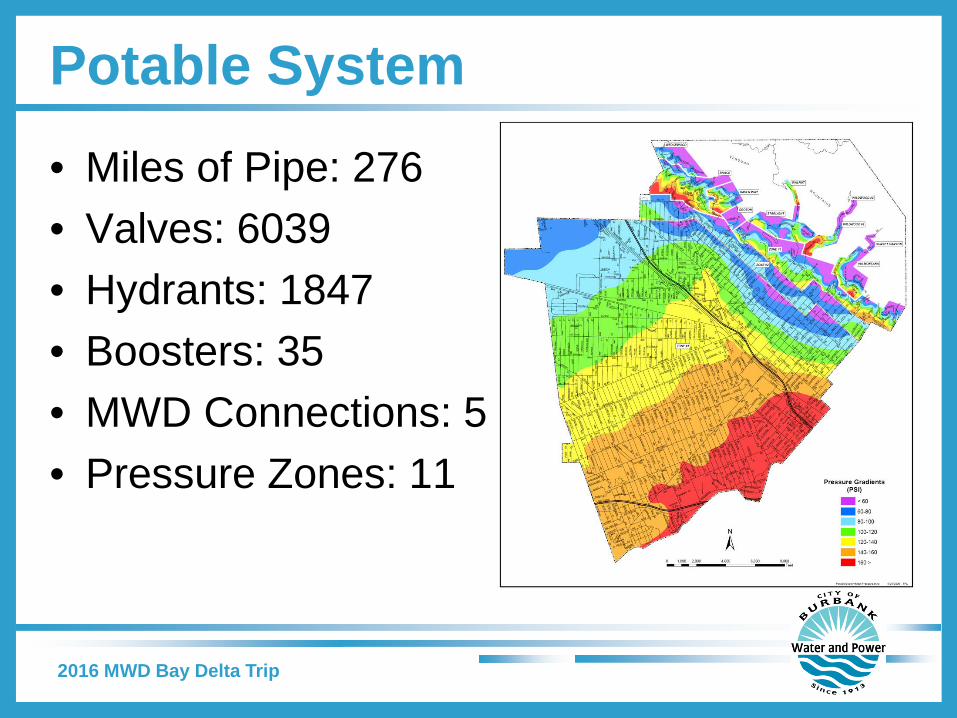
Potable System • Miles of Pipe: 276 • Valves: 6039 • Hydrants: 1847 • Boosters: 35 • MWD Connections: 5 • Pressure Zones: 11
2016 MWD Bay Delta Trip
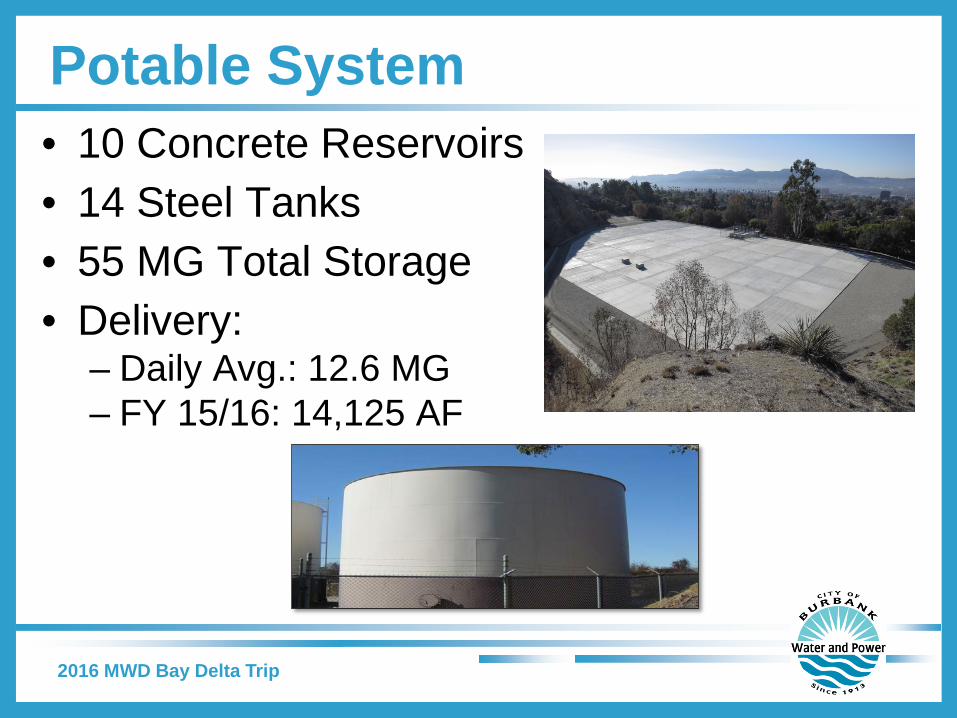
Potable System • 10 Concrete Reservoirs • 14 Steel Tanks • 55 MG Total Storage • Delivery:
– Daily Avg.: 12.6 MG – FY 15/16: 14,125 AF
2016 MWD Bay Delta Trip
Burbank’s Recycled Water • Sustainable potable water conservation • Reduces GHG Emissions • Uses an otherwise under- utilized resource • Drought proofs a portion of our water supply • Reduces expenses to potable water customers • Current goal is to meet 15% of our
water supply
2016 MWD Bay Delta Trip
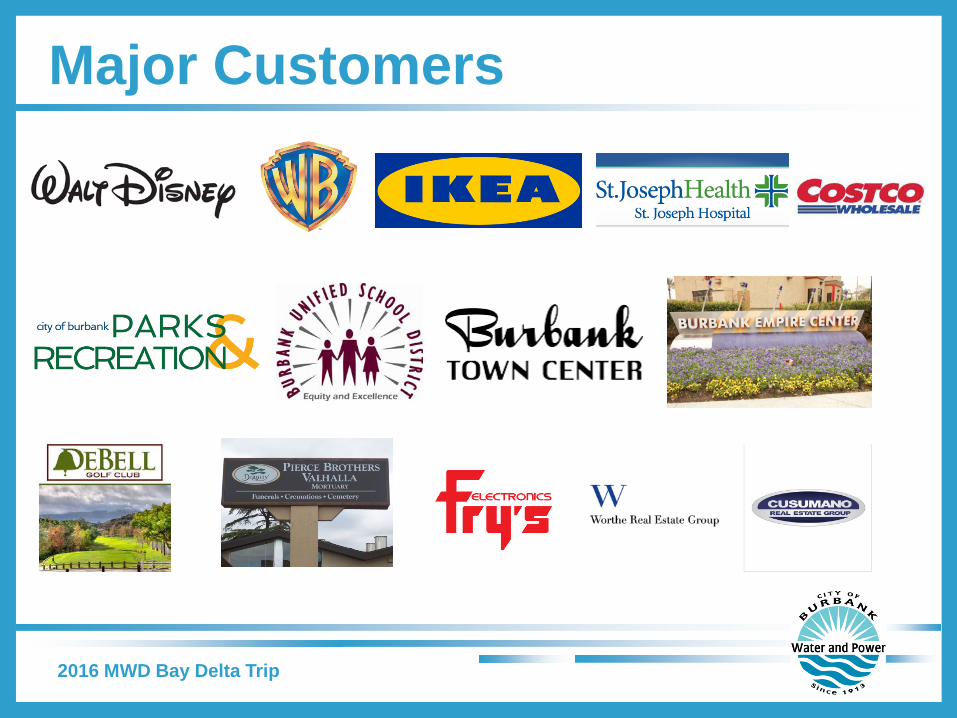
Major Customers
2016 MWD Bay Delta Trip
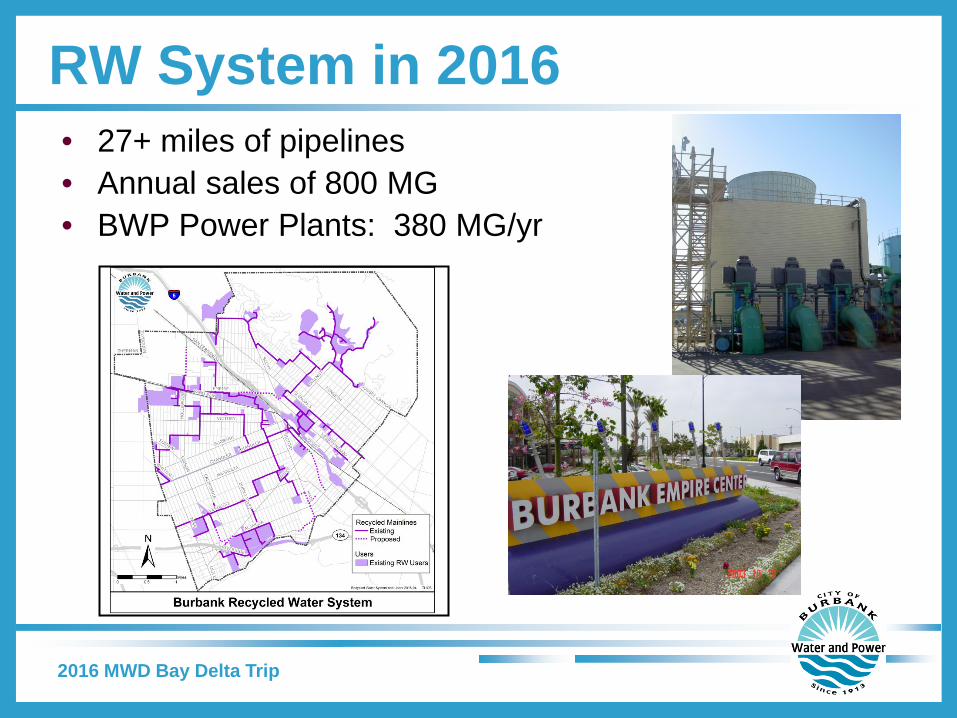
• 27+ miles of pipelines • Annual sales of 800 MG • BWP Power Plants: 380 MG/yr
RW System in 2016
2016 MWD Bay Delta Trip
2016 MWD Bay Delta Trip
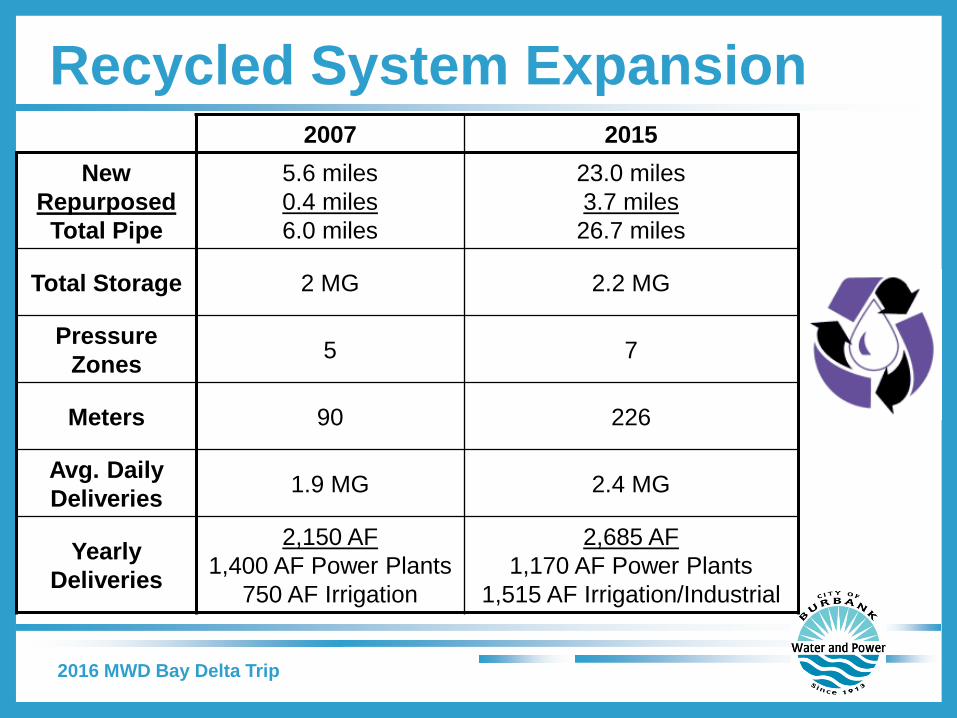
Recycled System Expansion 2007 2015
New Repurposed
Total Pipe
5.6 miles 0.4 miles 6.0 miles
23.0 miles 3.7 miles
26.7 miles
Total Storage 2 MG 2.2 MG
Pressure Zones 5 7
Meters 90 226
Avg. Daily Deliveries 1.9 MG 2.4 MG
Yearly Deliveries
2,150 AF 1,400 AF Power Plants
750 AF Irrigation
2,685 AF 1,170 AF Power Plants
1,515 AF Irrigation/Industrial
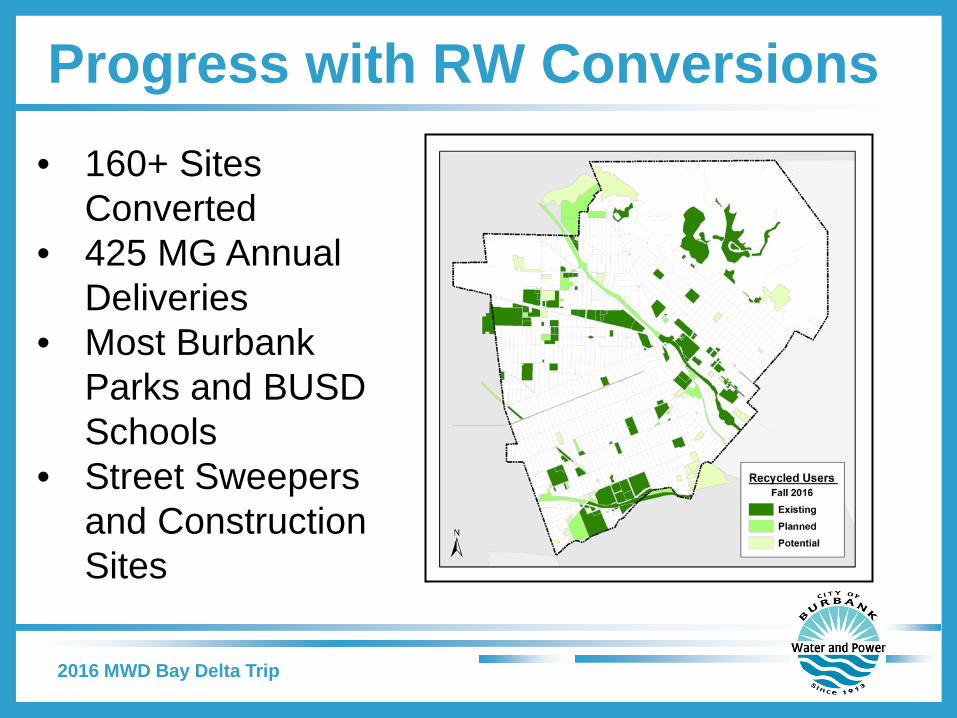
• 160+ Sites Converted
• 425 MG Annual Deliveries
• Most Burbank Parks and BUSD Schools
• Street Sweepers and Construction Sites
Progress with RW Conversions
2016 MWD Bay Delta Trip
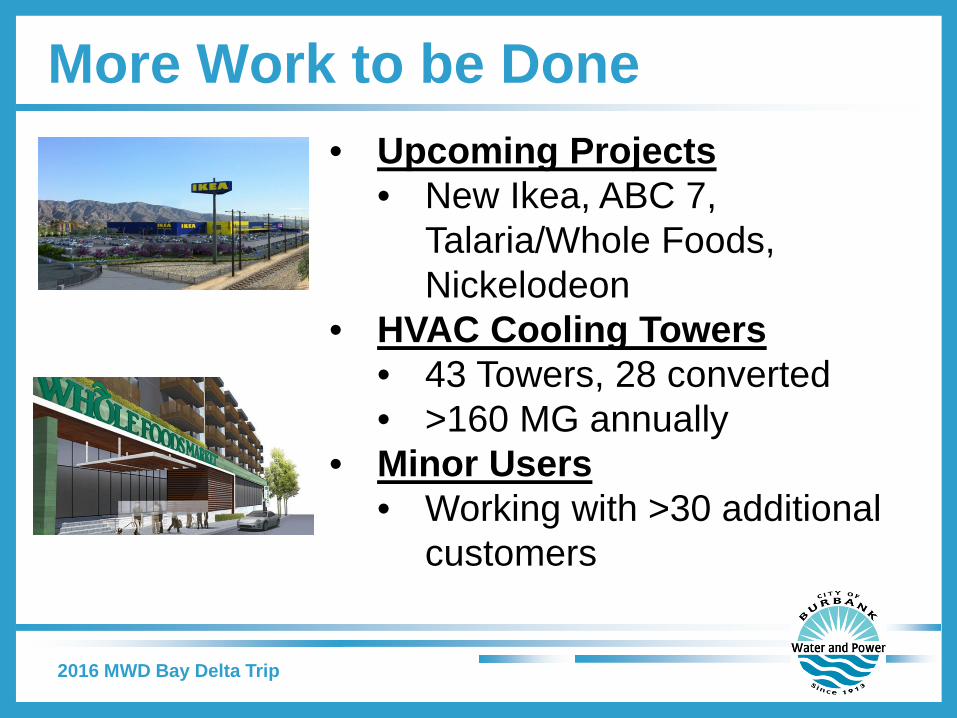
• Upcoming Projects • New Ikea, ABC 7,
Talaria/Whole Foods, Nickelodeon
• HVAC Cooling Towers • 43 Towers, 28 converted • >160 MG annually
• Minor Users • Working with >30 additional
customers
More Work to be Done
2016 MWD Bay Delta Trip
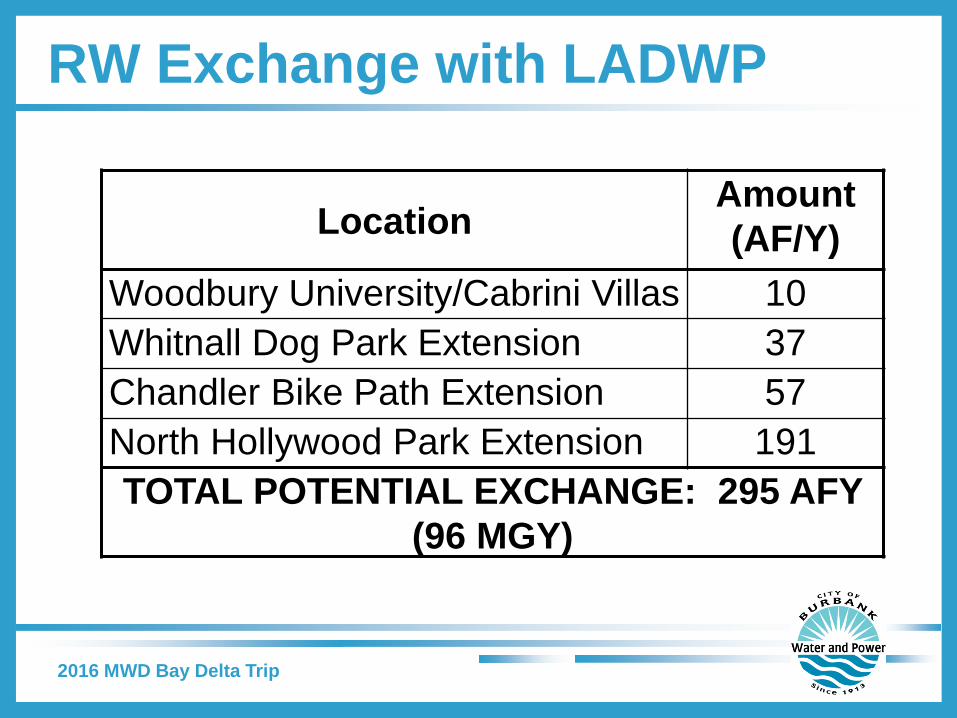
Location Amount (AF/Y)
Woodbury University/Cabrini Villas 10 Whitnall Dog Park Extension 37 Chandler Bike Path Extension 57 North Hollywood Park Extension 191 TOTAL POTENTIAL EXCHANGE: 295 AFY
(96 MGY)
RW Exchange with LADWP
2016 MWD Bay Delta Trip
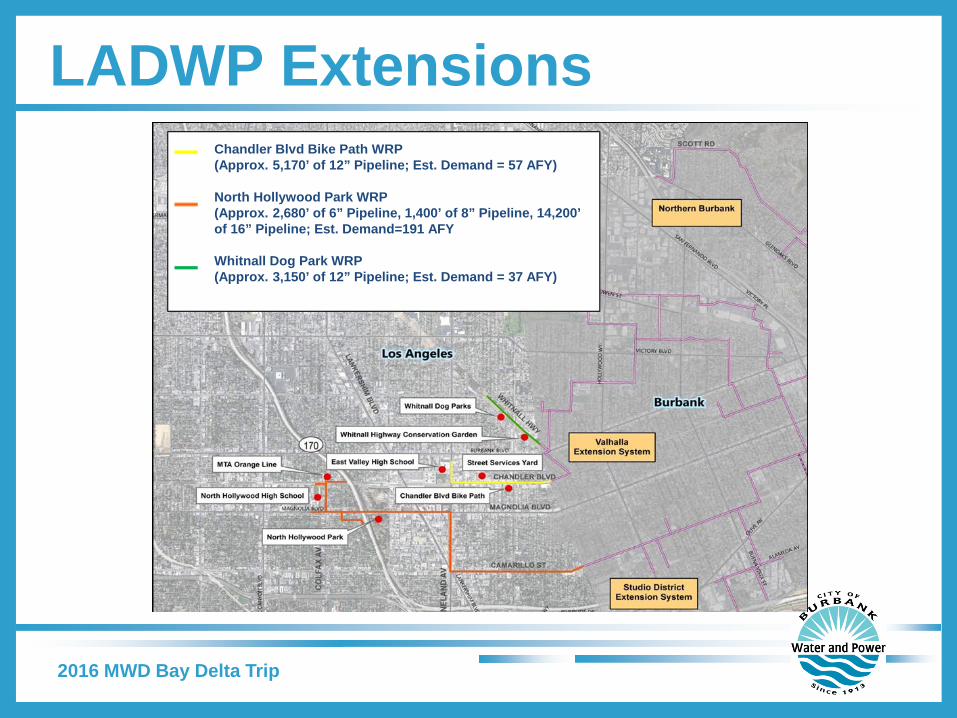
LADWP Extensions
2016 MWD Bay Delta Trip
Chandler Blvd Bike Path WRP (Approx. 5,170’ of 12” Pipeline; Est. Demand = 57 AFY) North Hollywood Park WRP (Approx. 2,680’ of 6” Pipeline, 1,400’ of 8” Pipeline, 14,200’ of 16” Pipeline; Est. Demand=191 AFY Whitnall Dog Park WRP (Approx. 3,150’ of 12” Pipeline; Est. Demand = 37 AFY)
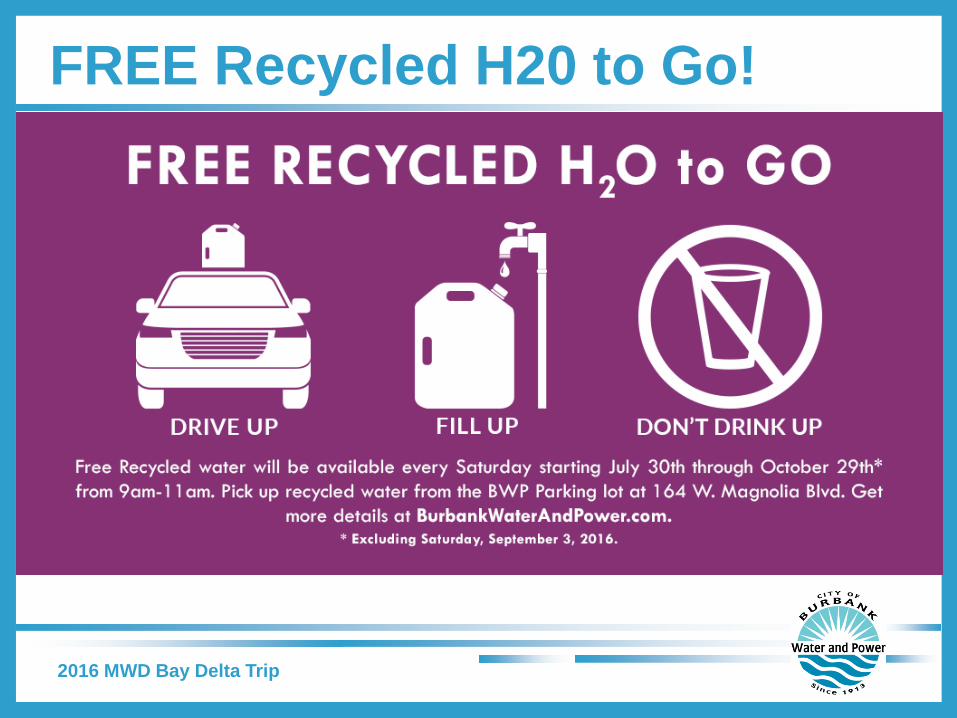
FREE Recycled H20 to Go!
2016 MWD Bay Delta Trip
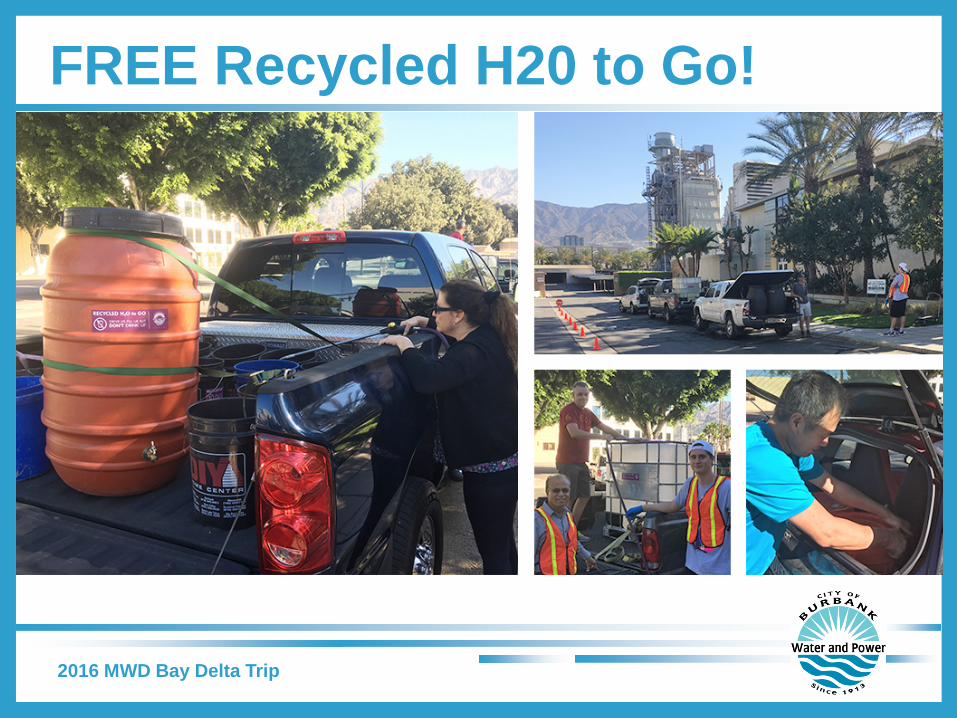
FREE Recycled H20 to Go!
2016 MWD Bay Delta Trip
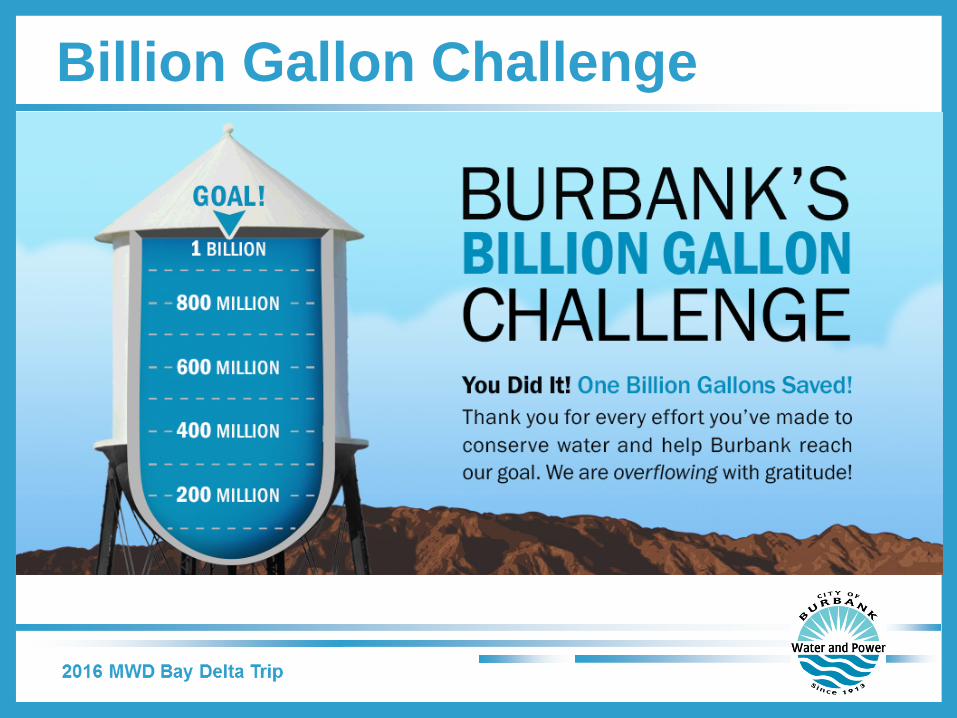
Billion Gallon Challenge
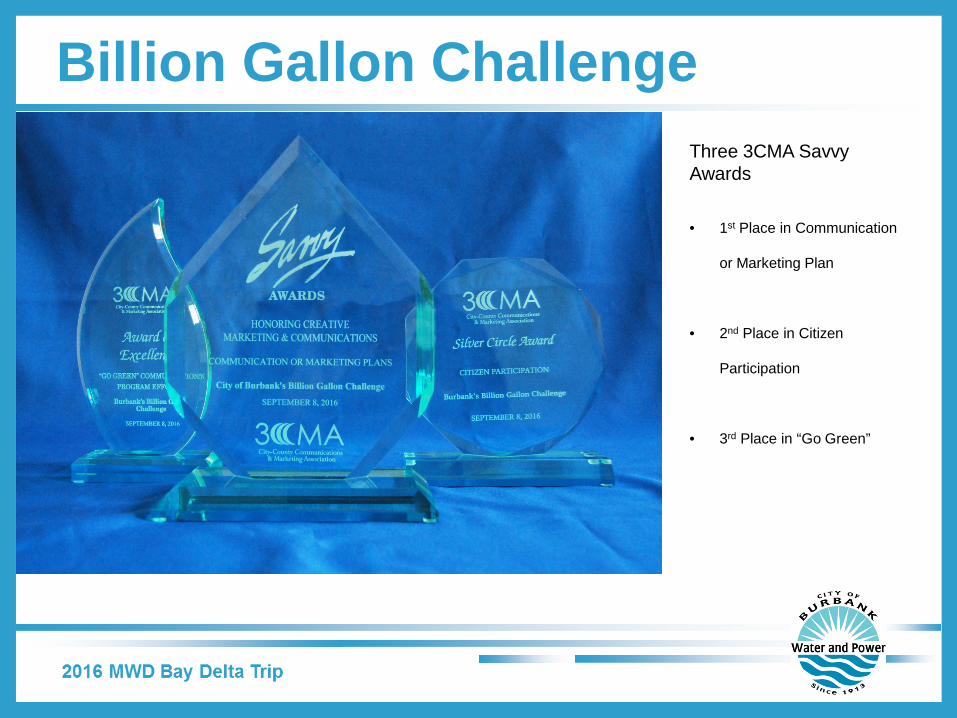
Billion Gallon Challenge Three 3CMA Savvy Awards • 1st Place in Communication
or Marketing Plan
• 2nd Place in Citizen
Participation
• 3rd Place in “Go Green”
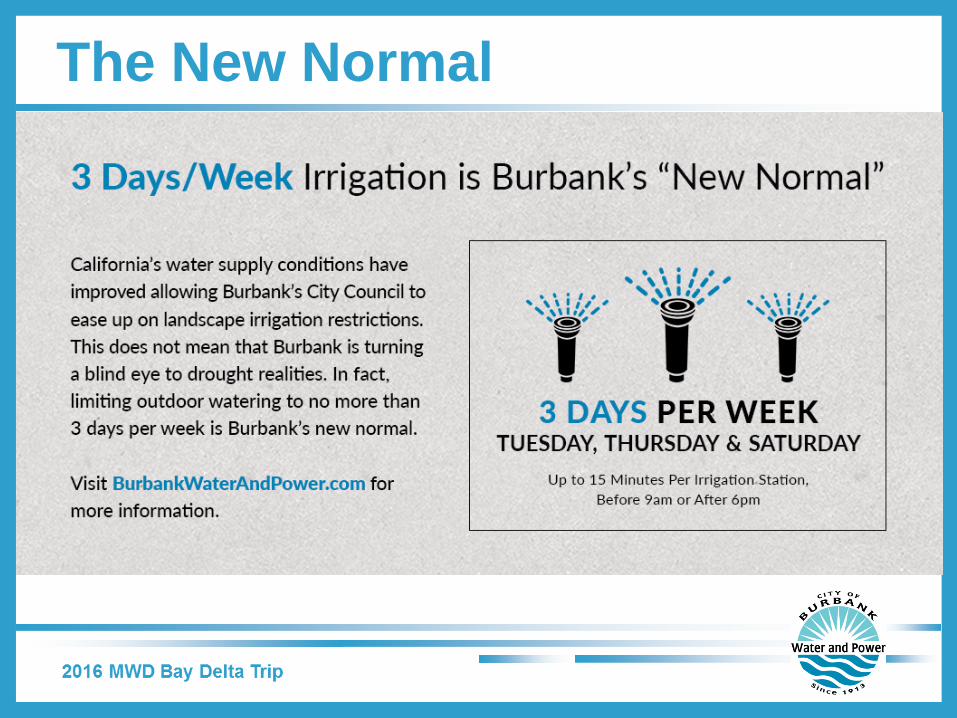
The New Normal
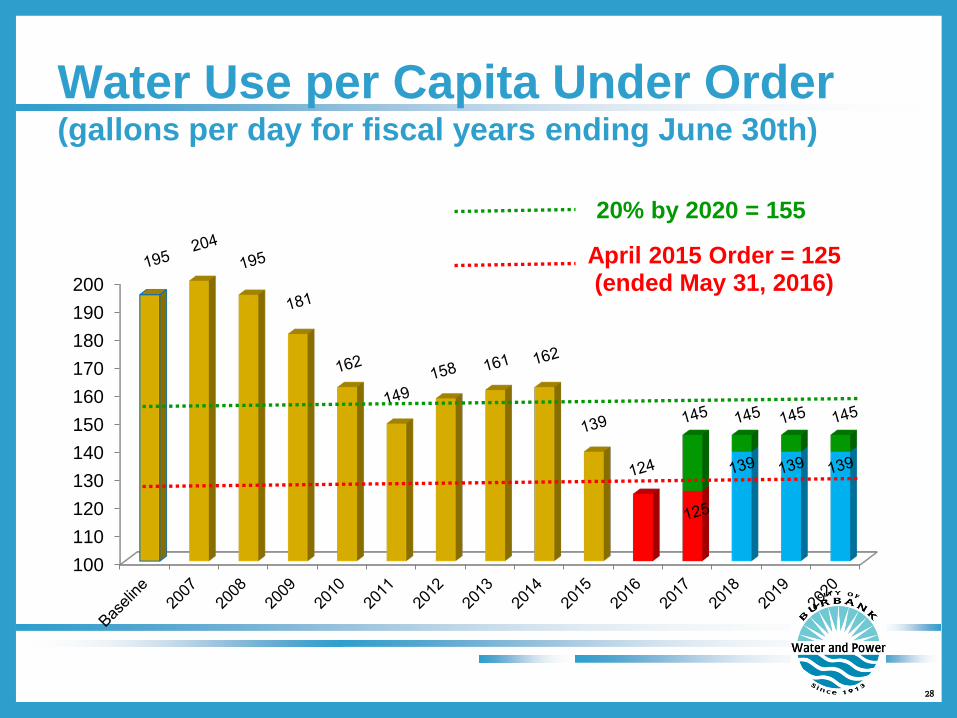
Water Use per Capita Under Order (gallons per day for fiscal years ending June 30th)
28
100110120130140150160170180190200
April 2015 Order = 125 (ended May 31, 2016)
20% by 2020 = 155
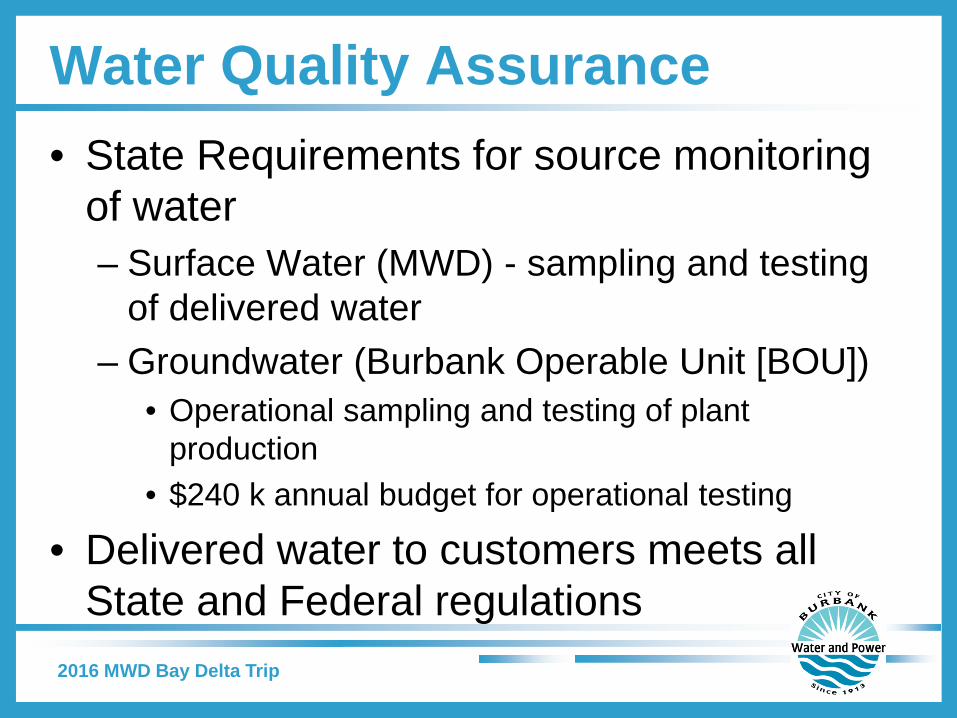
Water Quality Assurance • State Requirements for source monitoring
of water – Surface Water (MWD) - sampling and testing
of delivered water – Groundwater (Burbank Operable Unit [BOU])
• Operational sampling and testing of plant production
• $240 k annual budget for operational testing
• Delivered water to customers meets all State and Federal regulations 2016 MWD Bay Delta Trip
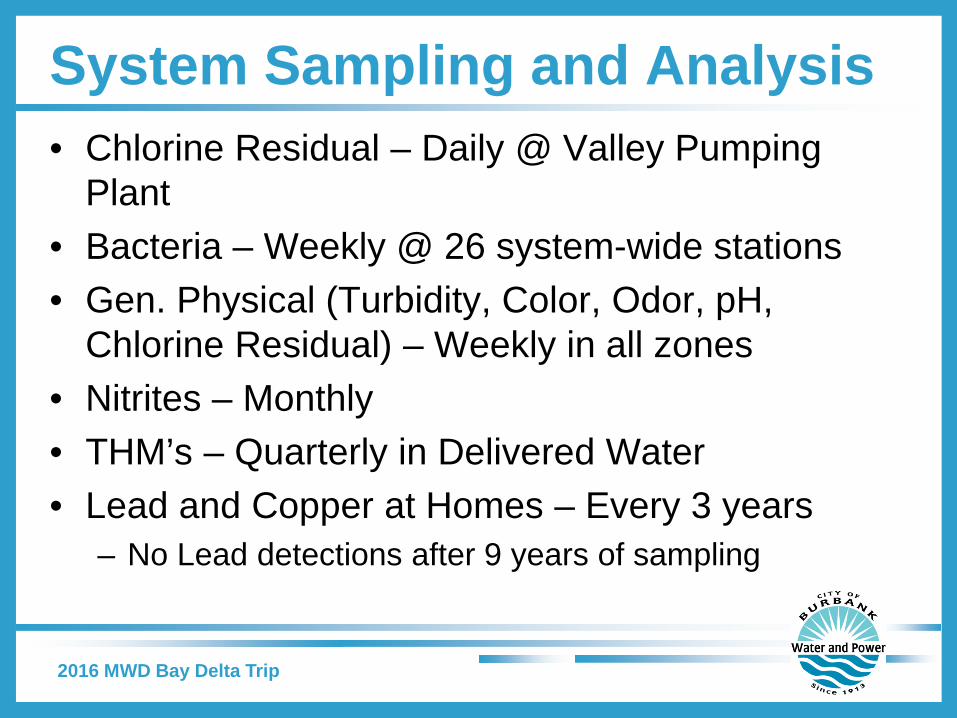
System Sampling and Analysis • Chlorine Residual – Daily @ Valley Pumping
Plant • Bacteria – Weekly @ 26 system-wide stations • Gen. Physical (Turbidity, Color, Odor, pH,
Chlorine Residual) – Weekly in all zones • Nitrites – Monthly • THM’s – Quarterly in Delivered Water • Lead and Copper at Homes – Every 3 years
– No Lead detections after 9 years of sampling
2016 MWD Bay Delta Trip
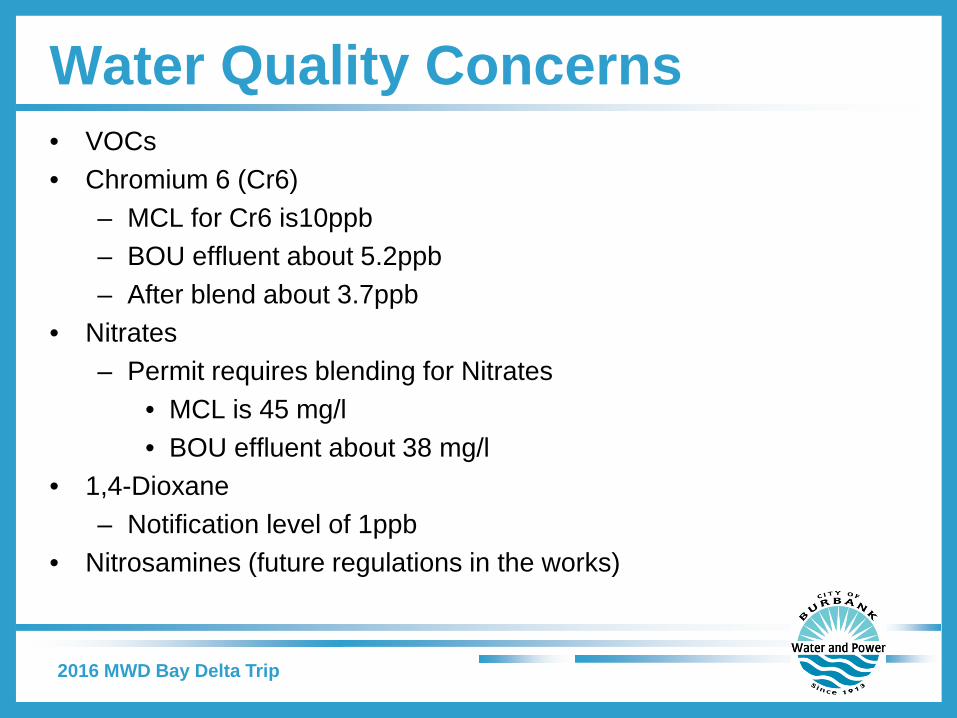
Water Quality Concerns • VOCs • Chromium 6 (Cr6)
– MCL for Cr6 is10ppb – BOU effluent about 5.2ppb – After blend about 3.7ppb
• Nitrates – Permit requires blending for Nitrates
• MCL is 45 mg/l • BOU effluent about 38 mg/l
• 1,4-Dioxane – Notification level of 1ppb
• Nitrosamines (future regulations in the works)
2016 MWD Bay Delta Trip
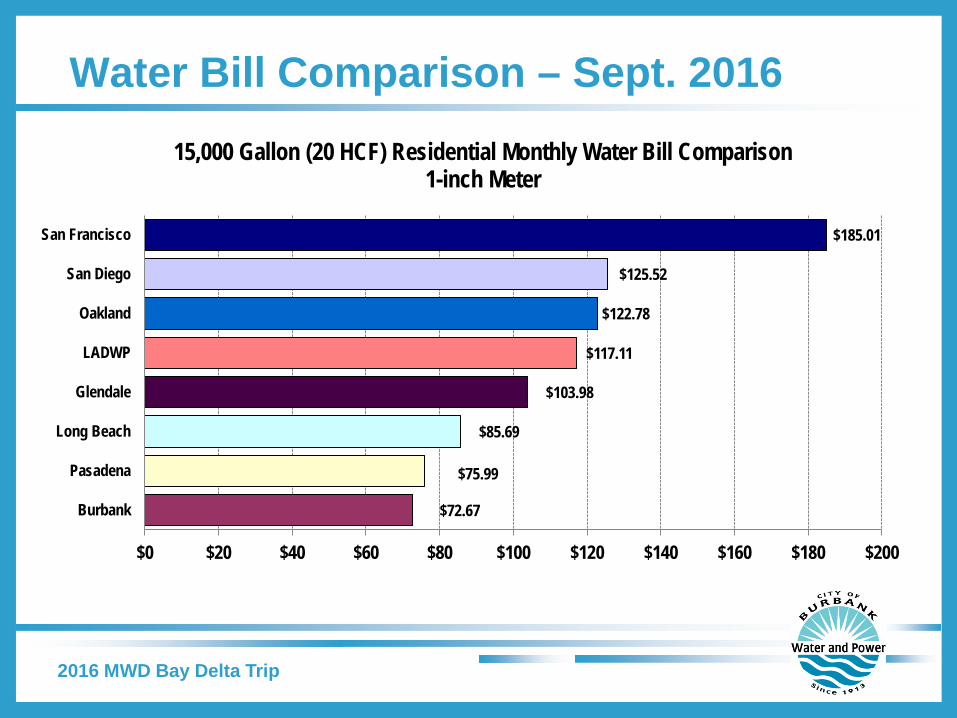
Water Bill Comparison – Sept. 2016
2016 MWD Bay Delta Trip
$72.67
$75.99
$85.69
$103.98
$117.11
$122.78
$125.52
$185.01
$0 $20 $40 $60 $80 $100 $120 $140 $160 $180 $200
Burbank
Pasadena
Long Beach
Glendale
LADWP
Oakland
San Diego
San Francisco
15,000 Gallon (20 HCF) Residential Monthly Water Bill Comparison 1-inch Meter
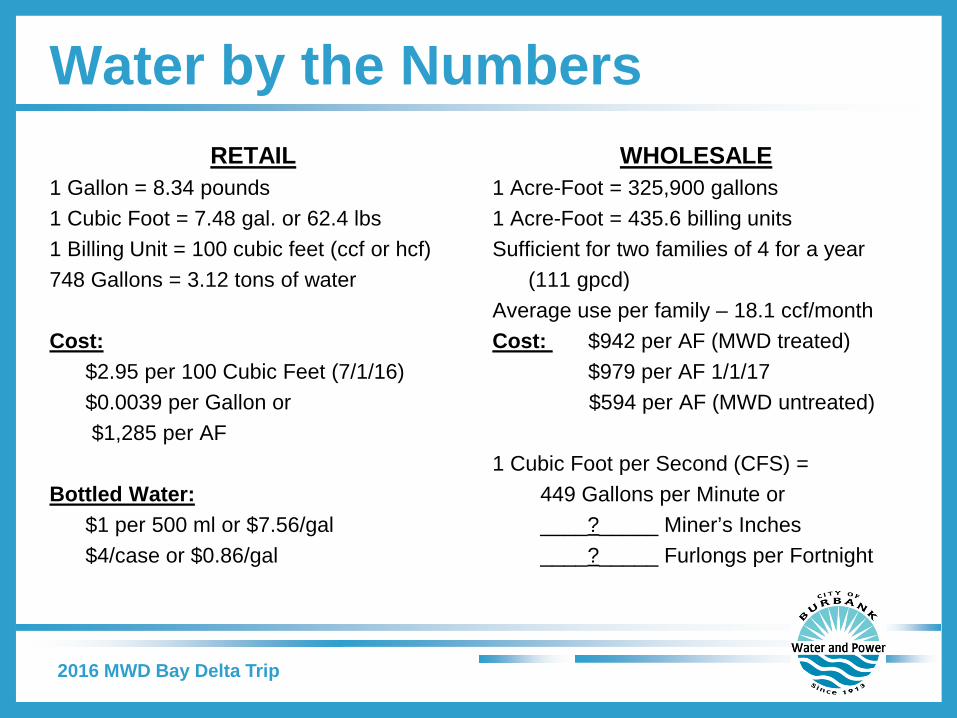
Water by the Numbers RETAIL
1 Gallon = 8.34 pounds 1 Cubic Foot = 7.48 gal. or 62.4 lbs 1 Billing Unit = 100 cubic feet (ccf or hcf) 748 Gallons = 3.12 tons of water
Cost: $2.95 per 100 Cubic Feet (7/1/16) $0.0039 per Gallon or
$1,285 per AF
Bottled Water: $1 per 500 ml or $7.56/gal $4/case or $0.86/gal
WHOLESALE 1 Acre-Foot = 325,900 gallons 1 Acre-Foot = 435.6 billing units Sufficient for two families of 4 for a year (111 gpcd) Average use per family – 18.1 ccf/month Cost: $942 per AF (MWD treated) $979 per AF 1/1/17
$594 per AF (MWD untreated) 1 Cubic Foot per Second (CFS) =
449 Gallons per Minute or ____?_____ Miner’s Inches ____?_____ Furlongs per Fortnight
2016 MWD Bay Delta Trip


![Sacramento-San Joaquin Delta Regional Ecosystem ... › Issues › fish › DeltaSmelt-1[1].pdf · Sacramento-San Joaquin Delta Regional Ecosystem Restoration Implementation Plan](https://img.pdfslide.net/doc/110x75/5f1fc9f6b0ee6d10ab1c372f/sacramento-san-joaquin-delta-regional-ecosystem-a-issues-a-fish-a-deltasmelt-11pdf.jpg)