Embed Size (px)
Citation preview
April 21, 2014
Mala
ysi
a
SEC
TO
R R
ESEA
RC
H |
SEE PAGE 10 FOR IMPORTANT DISCLOSURES AND ANALYST CERTIFICATIONS PP16832/01/2013 (031128)
MY Automotive Sector OVERWEIGHT (from NEUTRAL)
Values have emerged
Share prices of UMWH and MBM have retraced 28% and 21%
in the last 12 months relative to the KLCI. We upgrade UMWH and MBM to BUY on undemanding
valuations and as we turn upbeat on Perodua.
Upgrade sector to OVERWEIGHT with BUYs on UMWH, TCM,
MBM and BAuto. TCM is our favourite.
What’s New
Recently, Perodua hosted a visit to its existing manufacturing plant
in Rawang. Upon completion of its new adjacent state-of-the-art
plant by mid-3Q14, Perodua will be able to produce 400k units of
vehicles p.a. on two shifts, doubling its existing capacity of 200k
units p.a. The new capacity will support Perodua’s Rawang plant
as the new regional hub for Daihatsu. Perodua aims to export 10%
of its vehicles production capacity (up to ~40k units p.a). There is
also potential for contract assembly for its parent company,
Toyota.
What’s Our View
Current valuations of UMWH and MBM are attractive as we believe
all negatives have been priced in. UMWH now offers a 15% upside
to our adjusted SOP-based MYR12.44 TP (-2%) supported by a net
dividend yield of ~4%. Stripping its 55.2%-owned UMW OG, UMWH’s
other businesses are undervalued at just 10x FY15 PER which offers
a decent entry point. Meanwhile, MBM stands a fair chance in
supplying auto parts (seatbelts, airbags, wheels) to its 22.6%-
owned Perodua when the latter ramps up production at its new
plant. MBM currently trades at 8x FY15 PER, offering a 13% upside
to our new MYR3.60 TP (-4%) pegged on 9x FY15 PER.
Current undemanding valuations prompt us to upgrade UMW and
MBM to BUYs from HOLDs. UMWH and MBM’s longer term outlook
remains intact with positive earnings bias from associate-Perodua
when Perodua ventures into the export market or inks a major
contract assembly works for Daihatsu. We like Perodua for its
exposure in the small car segment as we believe that consumers
will down-trade to the smaller car segment in light of the rising
cost of living and GST implementation in Apr 2015.
Our unchanged 2014 TIV forecast of 675k units (+3% YoY) remains
achievable. We upgrade the sector to OVERWEIGHT based on a
bottom-up approach. We are also BUYers of TCM and BAuto.
Among the four auto stocks, TCM is our favourite for its: (i) strong
vehicle sales outlook; (ii) possible reinstatement as Shariah
complaint; and (iii) undemanding valuations.
Analysts
Ivan Yap
(603) 2297 8612
April 21, 2014 2
Automotive
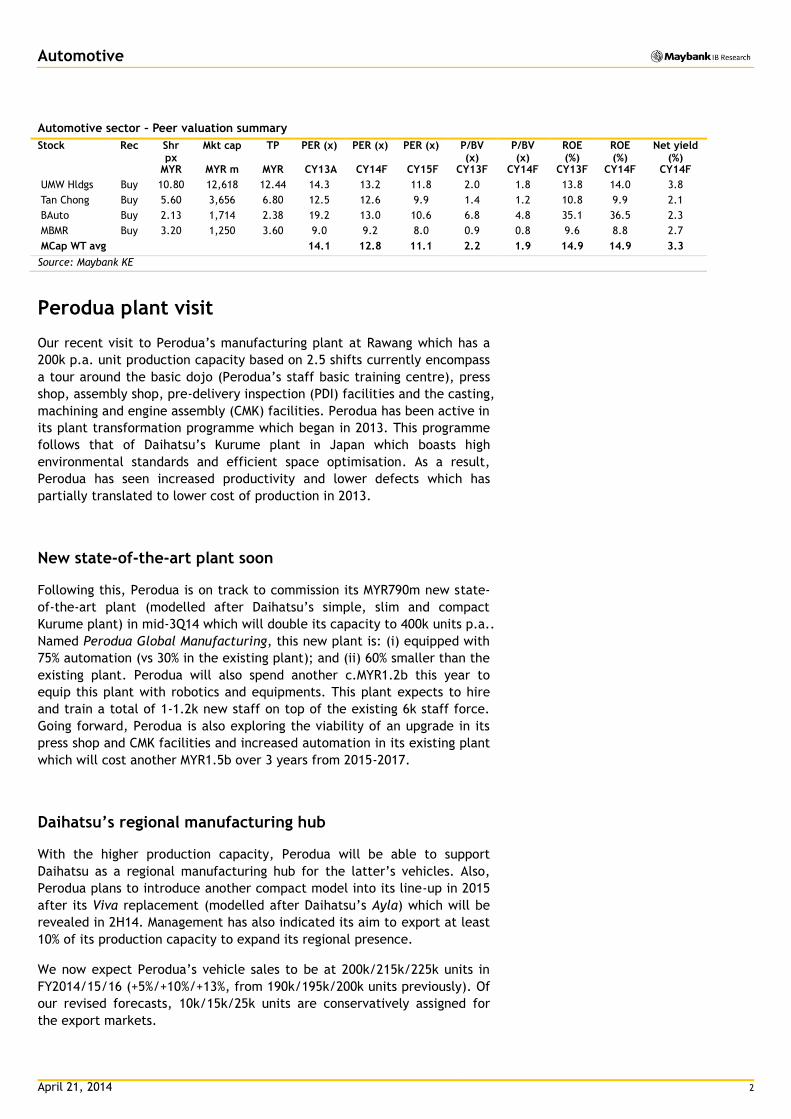
Automotive sector – Peer valuation summary
Stock Rec Shr px
Mkt cap TP PER (x) PER (x) PER (x) P/BV (x)
P/BV (x)
ROE (%)
ROE (%)
Net yield (%)
MYR MYR m MYR CY13A CY14F CY15F CY13F CY14F CY13F CY14F CY14F
UMW Hldgs Buy 10.80 12,618 12.44 14.3 13.2 11.8 2.0 1.8 13.8 14.0 3.8
Tan Chong Buy 5.60 3,656 6.80 12.5 12.6 9.9 1.4 1.2 10.8 9.9 2.1
BAuto Buy 2.13 1,714 2.38 19.2 13.0 10.6 6.8 4.8 35.1 36.5 2.3
MBMR Buy 3.20 1,250 3.60 9.0 9.2 8.0 0.9 0.8 9.6 8.8 2.7
MCap WT avg 14.1 12.8 11.1 2.2 1.9 14.9 14.9 3.3
Source: Maybank KE
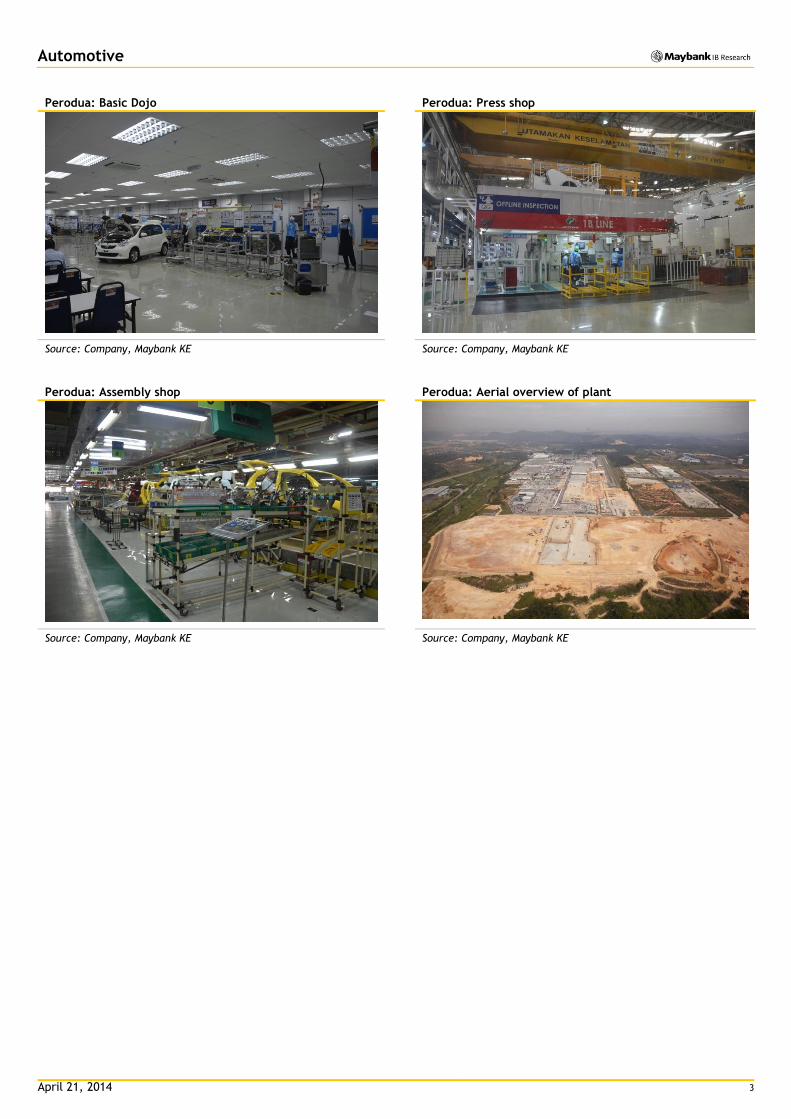
Perodua plant visit
Our recent visit to Perodua’s manufacturing plant at Rawang which has a
200k p.a. unit production capacity based on 2.5 shifts currently encompass
a tour around the basic dojo (Perodua’s staff basic training centre), press
shop, assembly shop, pre-delivery inspection (PDI) facilities and the casting,
machining and engine assembly (CMK) facilities. Perodua has been active in
its plant transformation programme which began in 2013. This programme
follows that of Daihatsu’s Kurume plant in Japan which boasts high
environmental standards and efficient space optimisation. As a result,
Perodua has seen increased productivity and lower defects which has
partially translated to lower cost of production in 2013.
New state-of-the-art plant soon
Following this, Perodua is on track to commission its MYR790m new state-
of-the-art plant (modelled after Daihatsu’s simple, slim and compact
Kurume plant) in mid-3Q14 which will double its capacity to 400k units p.a..
Named Perodua Global Manufacturing, this new plant is: (i) equipped with
75% automation (vs 30% in the existing plant); and (ii) 60% smaller than the
existing plant. Perodua will also spend another c.MYR1.2b this year to
equip this plant with robotics and equipments. This plant expects to hire
and train a total of 1-1.2k new staff on top of the existing 6k staff force.
Going forward, Perodua is also exploring the viability of an upgrade in its
press shop and CMK facilities and increased automation in its existing plant
which will cost another MYR1.5b over 3 years from 2015-2017.
Daihatsu’s regional manufacturing hub
With the higher production capacity, Perodua will be able to support
Daihatsu as a regional manufacturing hub for the latter’s vehicles. Also,
Perodua plans to introduce another compact model into its line-up in 2015
after its Viva replacement (modelled after Daihatsu’s Ayla) which will be
revealed in 2H14. Management has also indicated its aim to export at least
10% of its production capacity to expand its regional presence.
We now expect Perodua’s vehicle sales to be at 200k/215k/225k units in
FY2014/15/16 (+5%/+10%/+13%, from 190k/195k/200k units previously). Of
our revised forecasts, 10k/15k/25k units are conservatively assigned for
the export markets.
April 21, 2014 3
Automotive
Perodua: Basic Dojo Perodua: Press shop
Source: Company, Maybank KE Source: Company, Maybank KE
Perodua: Assembly shop Perodua: Aerial overview of plant
Source: Company, Maybank KE Source: Company, Maybank KE
April 21, 2014
C
OM
PA
NY R
ESEA
RC
H |
SEE PAGE 10 FOR IMPORTANT DISCLOSURES AND ANALYST CERTIFICATIONS PP16832/01/2013 (031128)
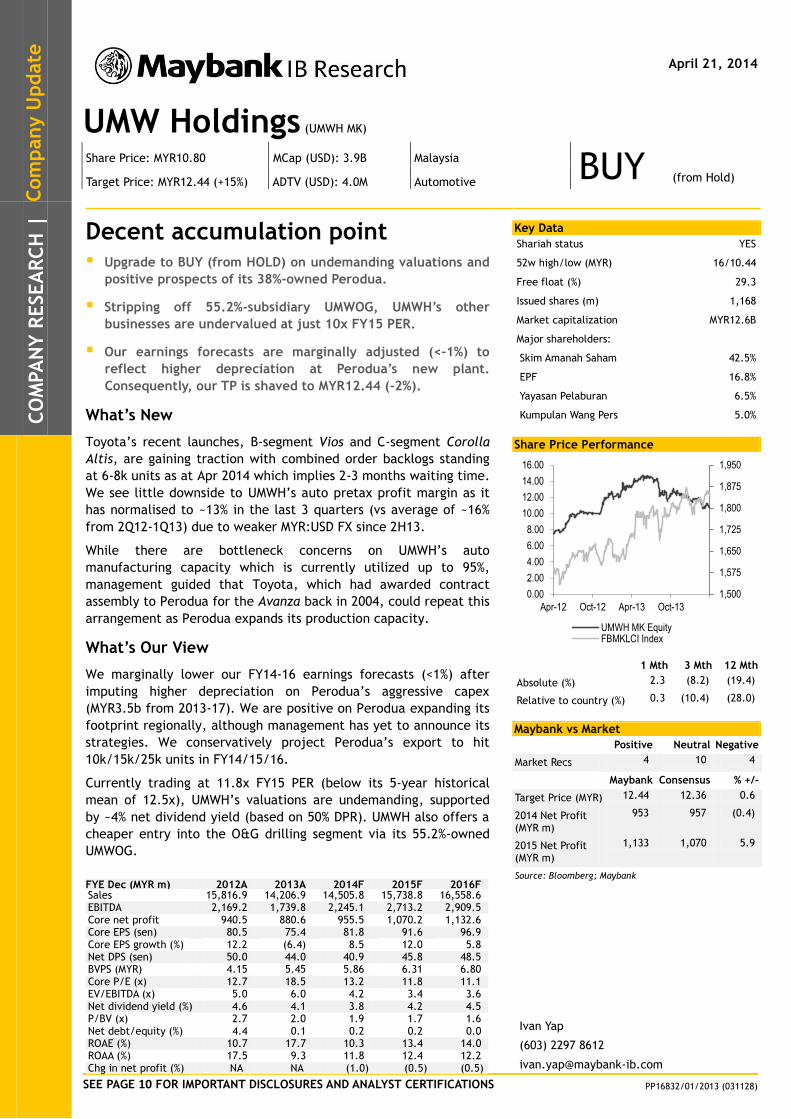
UMW Holdings (UMWH MK)
Share Price: MYR10.80 MCap (USD): 3.9B Malaysia BUY Target Price: MYR12.44 (+15%) ADTV (USD): 4.0M Automotive (from Hold)
Decent accumulation point Upgrade to BUY (from HOLD) on undemanding valuations and
positive prospects of its 38%-owned Perodua.
Stripping off 55.2%-subsidiary UMWOG, UMWH’s other
businesses are undervalued at just 10x FY15 PER.
Our earnings forecasts are marginally adjusted (<-1%) to
reflect higher depreciation at Perodua’s new plant.
Consequently, our TP is shaved to MYR12.44 (-2%).
What’s New
Toyota’s recent launches, B-segment Vios and C-segment Corolla
Altis, are gaining traction with combined order backlogs standing
at 6-8k units as at Apr 2014 which implies 2-3 months waiting time.
We see little downside to UMWH’s auto pretax profit margin as it
has normalised to ~13% in the last 3 quarters (vs average of ~16%
from 2Q12-1Q13) due to weaker MYR:USD FX since 2H13.
While there are bottleneck concerns on UMWH’s auto
manufacturing capacity which is currently utilized up to 95%,
management guided that Toyota, which had awarded contract
assembly to Perodua for the Avanza back in 2004, could repeat this
arrangement as Perodua expands its production capacity.
What’s Our View
We marginally lower our FY14-16 earnings forecasts (<1%) after
imputing higher depreciation on Perodua’s aggressive capex
(MYR3.5b from 2013-17). We are positive on Perodua expanding its
footprint regionally, although management has yet to announce its
strategies. We conservatively project Perodua’s export to hit
10k/15k/25k units in FY14/15/16.
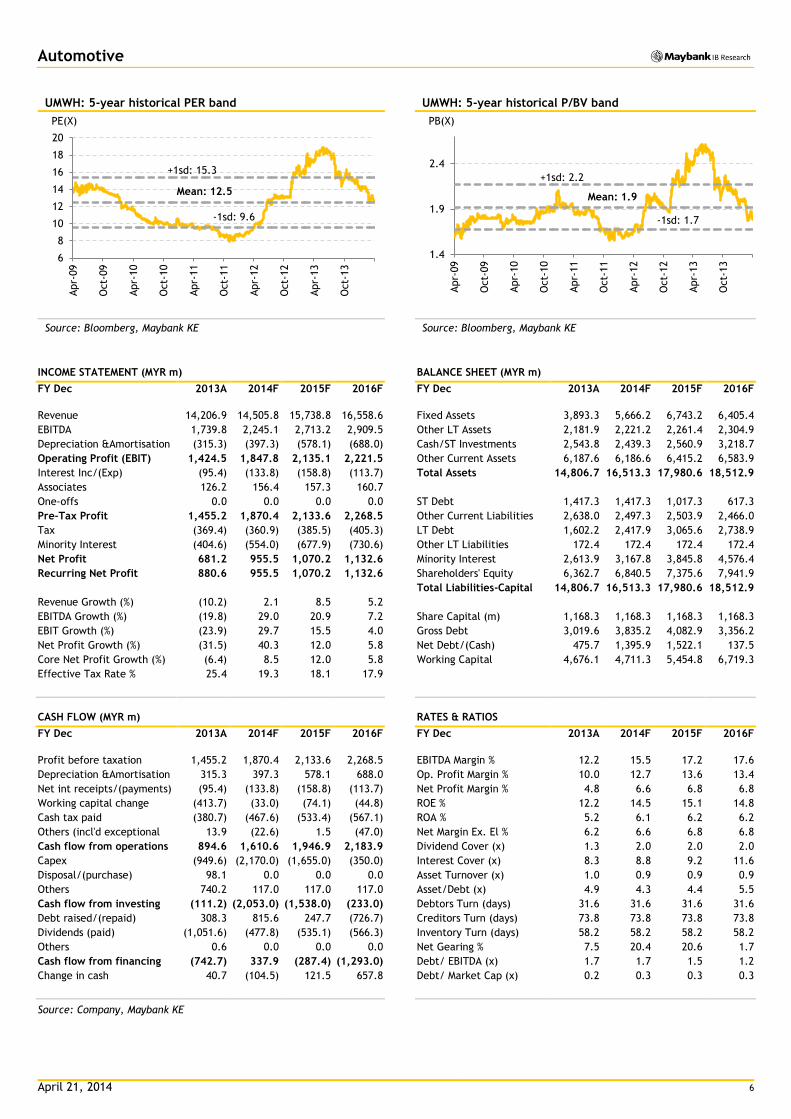
Currently trading at 11.8x FY15 PER (below its 5-year historical
mean of 12.5x), UMWH’s valuations are undemanding, supported
by ~4% net dividend yield (based on 50% DPR). UMWH also offers a
cheaper entry into the O&G drilling segment via its 55.2%-owned
UMWOG.
Key Data
Shariah status YES
52w high/low (MYR) 16/10.44
Free float (%) 29.3
Issued shares (m) 1,168
Market capitalization MYR12.6B
Major shareholders:
Skim Amanah Saham 42.5%
EPF 16.8%
Yayasan Pelaburan 6.5%
Kumpulan Wang Pers 5.0%
Share Price Performance
1 Mth 3 Mth 12 Mth
Absolute (%) 2.3 (8.2) (19.4)
Relative to country (%) 0.3 (10.4) (28.0)
Maybank vs Market
Positive Neutral Negative
Market Recs 4 10 4
Maybank Consensus % +/-
Target Price (MYR) 12.44 12.36 0.6
2014 Net Profit (MYR m)
953 957 (0.4)
2015 Net Profit (MYR m)
1,133 1,070 5.9
Source: Bloomberg; Maybank
FYE Dec (MYR m) 2012A 2013A 2014F 2015F 2016F Sales 15,816.9 14,206.9 14,505.8 15,738.8 16,558.6 EBITDA 2,169.2 1,739.8 2,245.1 2,713.2 2,909.5 Core net profit 940.5 880.6 955.5 1,070.2 1,132.6 Core EPS (sen) 80.5 75.4 81.8 91.6 96.9 Core EPS growth (%) 12.2 (6.4) 8.5 12.0 5.8 Net DPS (sen) 50.0 44.0 40.9 45.8 48.5 BVPS (MYR) 4.15 5.45 5.86 6.31 6.80 Core P/E (x) 12.7 18.5 13.2 11.8 11.1 EV/EBITDA (x) 5.0 6.0 4.2 3.4 3.6 Net dividend yield (%) 4.6 4.1 3.8 4.2 4.5 P/BV (x) 2.7 2.0 1.9 1.7 1.6 Net debt/equity (%) 4.4 0.1 0.2 0.2 0.0 ROAE (%) 10.7 17.7 10.3 13.4 14.0 ROAA (%) 17.5 9.3 11.8 12.4 12.2 Chg in net profit (%) NA NA (1.0) (0.5) (0.5)
Ivan Yap
(603) 2297 8612
1,500
1,575
1,650
1,725
1,800
1,875
1,950
0.00
2.00
4.00
6.00
8.00
10.00
12.00
14.00
16.00
Apr-12 Oct-12 Apr-13 Oct-13
UMWH MK EquityFBMKLCI Index
Com
pany U
pdate
April 21, 2014 5
Automotive
Expect consensus to re-rate
Consensus has rated UMWH a HOLD (56% of consensus) with an average TP
of MYR12.36, close to our revised SOP based TP of MYR12.44. With all
negatives priced in after an 11% fall in its share price YTD, we now see
value in UMWH and expect consensus to follow with upgrades on the stock.
Toyota’s 1Q14 vehicle sales remain strong at 25k units (+4k units or +21%
YoY) due to positive demand to its new vehicle launches.
SOP valuations
Division Effective Interest (%)
Valuation Method Value (MYR m)
Per share (MYR)
Automotive
UMW Toyota 51.0% 12x FY15 PER 5,688.6 4.87
Perodua 38.0% 12x FY15 PER 2,278.0 1.95
Equipment 100.0% 10x FY15 PER 1,435.2 1.23
Manufacturing & Engineering 100.0% 10x FY15 PER 228.0 0.20
Oil & Gas 55.2% 23x FY15 PER 6,096.4 5.22
Others
Land rigs - Sher I, II, III (India) 70.0% 10x FY15 PER 18.7 0.02
Land rigs - Ghazal I, III, IV, V (Middle East) 60.0% 10x FY15 PER 21.4 0.02
WSP 22.5% Investment cost 128.6 0.11
United Seamless Tubulaar (USTPL) 32.2% Investment cost 66.8 0.06
Shanghai Tube-Cote Petroleum Pipe Coating (STPPC) 49.0% Investment cost 20.0 0.02
Zhongyou BSS (Qinhuangdao) Petropipe (BSS) 34.3% Investment cost 125.2 0.11
Shanghai BSW Petro-pipe (BSW) 32.4% Investment cost 31.8 0.03
Jiangsu Tube-Cote Shuguang Coating 28.1% Investment cost 10.3 0.01
SOP (MYR) 16,148.8 13.82
Discount to SOP (10%) (1.38)
Target Price (MYR) 12.44
Source: Maybank KE
UMW: Foreign shareholding (16% as at end-Mar 2014)
Source: Company, Maybank KE
2.0
4.0
6.0
8.0
10.0
12.0
14.0
16.0
18.0
20.0
22.0
24.0
26.0
28.0
30.0
Mar-
09
Jun-0
9
Sep-0
9
Dec-0
9
Mar-
10
Jun-1
0
Sep-1
0
Dec-1
0
Mar-
11
Jun-1
1
Sep-1
1
Dec-1
1
Mar-
12
Jun-1
2
Sep-1
2
Dec-1
2
Mar-
13
Jun-1
3
Sep-1
3
Dec-1
3
Mar-
14
End-1Q 2014: 16.0% (Since end-1Q13: -10.0 ppt)
%
April 21, 2014 6
Automotive
UMWH: 5-year historical PER band UMWH: 5-year historical P/BV band
Source: Bloomberg, Maybank KE Source: Bloomberg, Maybank KE
INCOME STATEMENT (MYR m) BALANCE SHEET (MYR m)
FY Dec 2013A 2014F 2015F 2016F FY Dec 2013A 2014F 2015F 2016F
Revenue 14,206.9 14,505.8 15,738.8 16,558.6 Fixed Assets 3,893.3 5,666.2 6,743.2 6,405.4
EBITDA 1,739.8 2,245.1 2,713.2 2,909.5 Other LT Assets 2,181.9 2,221.2 2,261.4 2,304.9
Depreciation &Amortisation (315.3) (397.3) (578.1) (688.0) Cash/ST Investments 2,543.8 2,439.3 2,560.9 3,218.7
Operating Profit (EBIT) 1,424.5 1,847.8 2,135.1 2,221.5 Other Current Assets 6,187.6 6,186.6 6,415.2 6,583.9
Interest Inc/(Exp) (95.4) (133.8) (158.8) (113.7) Total Assets 14,806.7 16,513.3 17,980.6 18,512.9
Associates 126.2 156.4 157.3 160.7
One-offs 0.0 0.0 0.0 0.0 ST Debt 1,417.3 1,417.3 1,017.3 617.3
Pre-Tax Profit 1,455.2 1,870.4 2,133.6 2,268.5 Other Current Liabilities 2,638.0 2,497.3 2,503.9 2,466.0
Tax (369.4) (360.9) (385.5) (405.3) LT Debt 1,602.2 2,417.9 3,065.6 2,738.9
Minority Interest (404.6) (554.0) (677.9) (730.6) Other LT Liabilities 172.4 172.4 172.4 172.4
Net Profit 681.2 955.5 1,070.2 1,132.6 Minority Interest 2,613.9 3,167.8 3,845.8 4,576.4
Recurring Net Profit 880.6 955.5 1,070.2 1,132.6 Shareholders' Equity 6,362.7 6,840.5 7,375.6 7,941.9
Total Liabilities-Capital 14,806.7 16,513.3 17,980.6 18,512.9
Revenue Growth (%) (10.2) 2.1 8.5 5.2
EBITDA Growth (%) (19.8) 29.0 20.9 7.2 Share Capital (m) 1,168.3 1,168.3 1,168.3 1,168.3
EBIT Growth (%) (23.9) 29.7 15.5 4.0 Gross Debt 3,019.6 3,835.2 4,082.9 3,356.2
Net Profit Growth (%) (31.5) 40.3 12.0 5.8 Net Debt/(Cash) 475.7 1,395.9 1,522.1 137.5
Core Net Profit Growth (%) (6.4) 8.5 12.0 5.8 Working Capital 4,676.1 4,711.3 5,454.8 6,719.3
Effective Tax Rate % 25.4 19.3 18.1 17.9
CASH FLOW (MYR m) RATES & RATIOS
FY Dec 2013A 2014F 2015F 2016F FY Dec 2013A 2014F 2015F 2016F
Profit before taxation 1,455.2 1,870.4 2,133.6 2,268.5 EBITDA Margin % 12.2 15.5 17.2 17.6
Depreciation &Amortisation 315.3 397.3 578.1 688.0 Op. Profit Margin % 10.0 12.7 13.6 13.4
Net int receipts/(payments) (95.4) (133.8) (158.8) (113.7) Net Profit Margin % 4.8 6.6 6.8 6.8
Working capital change (413.7) (33.0) (74.1) (44.8) ROE % 12.2 14.5 15.1 14.8
Cash tax paid (380.7) (467.6) (533.4) (567.1) ROA % 5.2 6.1 6.2 6.2
Others (incl'd exceptional items)
13.9 (22.6) 1.5 (47.0) Net Margin Ex. El % 6.2 6.6 6.8 6.8
Cash flow from operations 894.6 1,610.6 1,946.9 2,183.9 Dividend Cover (x) 1.3 2.0 2.0 2.0
Capex (949.6) (2,170.0) (1,655.0) (350.0) Interest Cover (x) 8.3 8.8 9.2 11.6
Disposal/(purchase) 98.1 0.0 0.0 0.0 Asset Turnover (x) 1.0 0.9 0.9 0.9
Others 740.2 117.0 117.0 117.0 Asset/Debt (x) 4.9 4.3 4.4 5.5
Cash flow from investing (111.2) (2,053.0) (1,538.0) (233.0) Debtors Turn (days) 31.6 31.6 31.6 31.6
Debt raised/(repaid) 308.3 815.6 247.7 (726.7) Creditors Turn (days) 73.8 73.8 73.8 73.8
Dividends (paid) (1,051.6) (477.8) (535.1) (566.3) Inventory Turn (days) 58.2 58.2 58.2 58.2
Others 0.6 0.0 0.0 0.0 Net Gearing % 7.5 20.4 20.6 1.7
Cash flow from financing (742.7) 337.9 (287.4) (1,293.0) Debt/ EBITDA (x) 1.7 1.7 1.5 1.2
Change in cash 40.7 (104.5) 121.5 657.8 Debt/ Market Cap (x) 0.2 0.3 0.3 0.3
Source: Company, Maybank KE
6
8
10
12
14
16
18
20
Apr-
09
Oct-
09
Apr-
10
Oct-
10
Apr-
11
Oct-
11
Apr-
12
Oct-
12
Apr-
13
Oct-
13
PE(X)
Mean: 12.5
-1sd: 9.6
+1sd: 15.3
1.4
1.9
2.4
Apr-
09
Oct-
09
Apr-
10
Oct-
10
Apr-
11
Oct-
11
Apr-
12
Oct-
12
Apr-
13
Oct-
13
PB(X)
Mean: 1.9
-1sd: 1.7
+1sd: 2.2
April 21, 2014
C
OM
PA
NY R
ESEA
RC
H |
SEE PAGE 10 FOR IMPORTANT DISCLOSURES AND ANALYST CERTIFICATIONS PP16832/01/2013 (031128)
MBM Resources (MBM MK)
Share Price: MYR3.20 MCap (USD): 0.4B Malaysia BUY Target Price: MYR3.60 (+13%) ADTV (USD): 0.1M Automotive (from Hold)
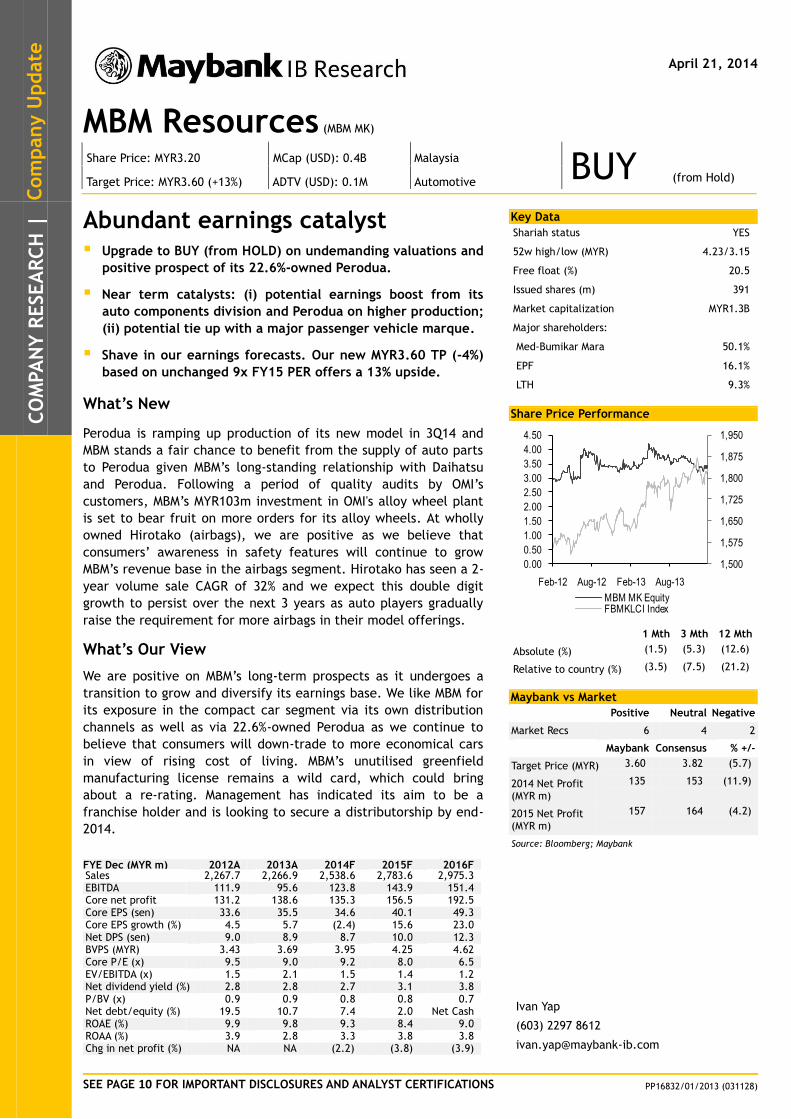
Abundant earnings catalyst Upgrade to BUY (from HOLD) on undemanding valuations and
positive prospect of its 22.6%-owned Perodua.
Near term catalysts: (i) potential earnings boost from its
auto components division and Perodua on higher production;
(ii) potential tie up with a major passenger vehicle marque.
Shave in our earnings forecasts. Our new MYR3.60 TP (-4%)
based on unchanged 9x FY15 PER offers a 13% upside.
What’s New
Perodua is ramping up production of its new model in 3Q14 and
MBM stands a fair chance to benefit from the supply of auto parts
to Perodua given MBM’s long-standing relationship with Daihatsu
and Perodua. Following a period of quality audits by OMI’s
customers, MBM’s MYR103m investment in OMI's alloy wheel plant
is set to bear fruit on more orders for its alloy wheels. At wholly
owned Hirotako (airbags), we are positive as we believe that
consumers’ awareness in safety features will continue to grow
MBM’s revenue base in the airbags segment. Hirotako has seen a 2-
year volume sale CAGR of 32% and we expect this double digit
growth to persist over the next 3 years as auto players gradually
raise the requirement for more airbags in their model offerings.
What’s Our View
We are positive on MBM’s long-term prospects as it undergoes a
transition to grow and diversify its earnings base. We like MBM for
its exposure in the compact car segment via its own distribution
channels as well as via 22.6%-owned Perodua as we continue to
believe that consumers will down-trade to more economical cars
in view of rising cost of living. MBM’s unutilised greenfield
manufacturing license remains a wild card, which could bring
about a re-rating. Management has indicated its aim to be a
franchise holder and is looking to secure a distributorship by end-
2014.
Key Data
Shariah status YES
52w high/low (MYR) 4.23/3.15
Free float (%) 20.5
Issued shares (m) 391
Market capitalization MYR1.3B
Major shareholders:
Med-Bumikar Mara 50.1%
EPF 16.1%
LTH 9.3%
Share Price Performance
1 Mth 3 Mth 12 Mth
Absolute (%) (1.5) (5.3) (12.6)
Relative to country (%) (3.5) (7.5) (21.2)
Maybank vs Market
Positive Neutral Negative
Market Recs 6 4 2
Maybank Consensus % +/-
Target Price (MYR) 3.60 3.82 (5.7)
2014 Net Profit (MYR m)
135 153 (11.9)
2015 Net Profit (MYR m)
157 164 (4.2)
Source: Bloomberg; Maybank
FYE Dec (MYR m) 2012A 2013A 2014F 2015F 2016F Sales 2,267.7 2,266.9 2,538.6 2,783.6 2,975.3 EBITDA 111.9 95.6 123.8 143.9 151.4 Core net profit 131.2 138.6 135.3 156.5 192.5 Core EPS (sen) 33.6 35.5 34.6 40.1 49.3 Core EPS growth (%) 4.5 5.7 (2.4) 15.6 23.0 Net DPS (sen) 9.0 8.9 8.7 10.0 12.3 BVPS (MYR) 3.43 3.69 3.95 4.25 4.62 Core P/E (x) 9.5 9.0 9.2 8.0 6.5 EV/EBITDA (x) 1.5 2.1 1.5 1.4 1.2 Net dividend yield (%) 2.8 2.8 2.7 3.1 3.8 P/BV (x) 0.9 0.9 0.8 0.8 0.7 Net debt/equity (%) 19.5 10.7 7.4 2.0 Net Cash ROAE (%) 9.9 9.8 9.3 8.4 9.0 ROAA (%) 3.9 2.8 3.3 3.8 3.8 Chg in net profit (%) NA NA (2.2) (3.8) (3.9)
Ivan Yap
(603) 2297 8612
1,500
1,575
1,650
1,725
1,800
1,875
1,950
0.00
0.50
1.00
1.50
2.00
2.50
3.00
3.50
4.00
4.50
Feb-12 Aug-12 Feb-13 Aug-13
MBM MK EquityFBMKLCI Index
Com
pany U
pdate
April 21, 2014 8
Automotive
Expansion on track
Hino and Perodua manufacturing plants on track
We expect some initial start-up losses at Hino's (commissioned in Mar 2014)
and Perodua's plant (to be commissioned in 3Q14) before they hit their full
scale production possibly in 2015. This will be partially offset by higher
assembly margins. Hino’s plant will feature a capacity of 10k units p.a.
based on two shifts, producing the full range of Hino products for the
Malaysian market. Meanwhile, Perodua’s new plant with capacity of 200k
units p.a. (current capacity: 200k units p.a. on 2 shifts) based on 2 shifts
will focus on the export market.
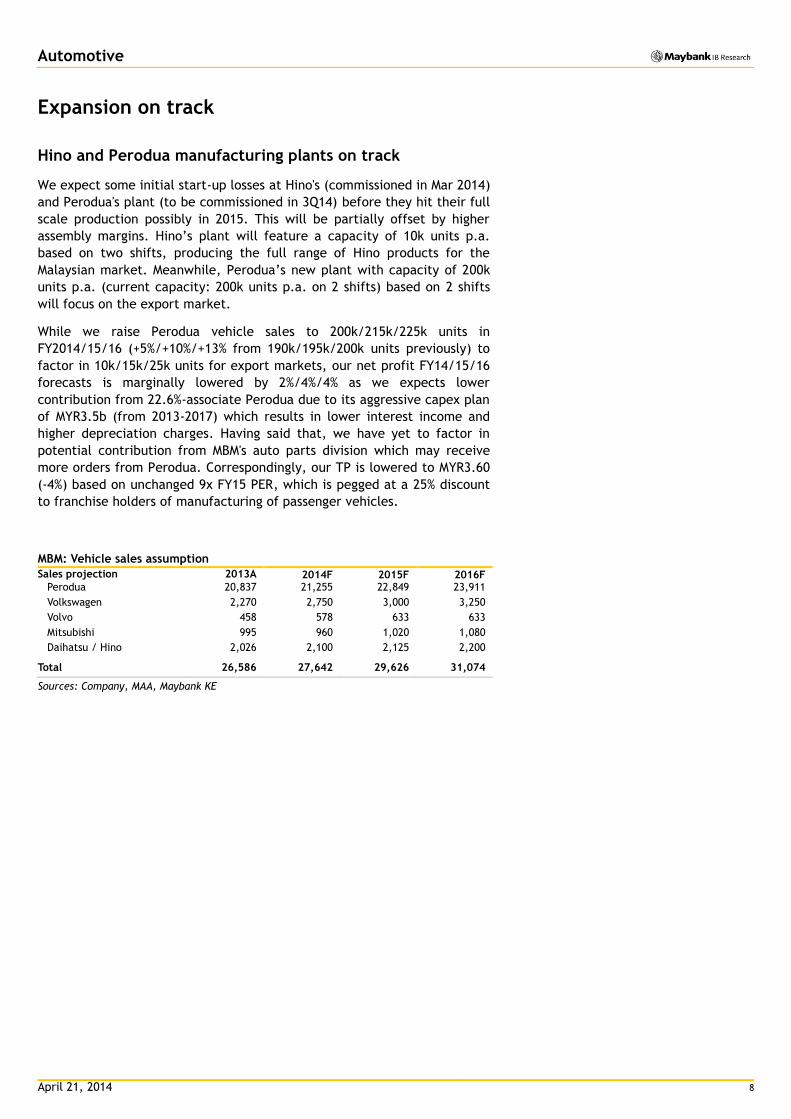
While we raise Perodua vehicle sales to 200k/215k/225k units in
FY2014/15/16 (+5%/+10%/+13% from 190k/195k/200k units previously) to
factor in 10k/15k/25k units for export markets, our net profit FY14/15/16
forecasts is marginally lowered by 2%/4%/4% as we expects lower
contribution from 22.6%-associate Perodua due to its aggressive capex plan
of MYR3.5b (from 2013-2017) which results in lower interest income and
higher depreciation charges. Having said that, we have yet to factor in
potential contribution from MBM's auto parts division which may receive
more orders from Perodua. Correspondingly, our TP is lowered to MYR3.60
(-4%) based on unchanged 9x FY15 PER, which is pegged at a 25% discount
to franchise holders of manufacturing of passenger vehicles.
MBM: Vehicle sales assumption
Sales projection 2013A 2014F 2015F 2016F Perodua 20,837 21,255 22,849 23,911
Volkswagen 2,270 2,750 3,000 3,250
Volvo 458 578 633 633
Mitsubishi 995 960 1,020 1,080
Daihatsu / Hino 2,026 2,100 2,125 2,200
Total 26,586 27,642 29,626 31,074
Sources: Company, MAA, Maybank KE
April 21, 2014 9
Automotive
MBM: 5-year historical PER band MBM: 5-year historical P/BV band
Source: Bloomberg, Maybank KE Source: Bloomberg, Maybank KE
INCOME STATEMENT (MYR m) BALANCE SHEET (MYR m)
FY Dec 2013A 2014F 2015F 2016F FY Dec 2013A 2014F 2015F 2016F
Turnover 2,266.9 2,538.6 2,783.6 2,975.3 Fixed Assets 401.5 405.4 393.9 382.5
Cost of goods sold (2,090.3) (2,318.8) (2,524.0) (2,693.5) Other LT Assets 1,183.1 1,235.5 1,297.3 1,398.7
Gross profit 176.6 219.8 259.5 281.7 Cash/ST Investments 325.1 365.7 445.7 526.7
Other ope. (exp)/ Inc. (106.4) (132.7) (152.6) (166.2) Other Current Assets 642.9 707.8 759.4 801.0
EBIT 70.2 87.1 106.9 115.5 Total Assets 2,552.7 2,714.4 2,896.4 3,108.8
Net int (exp)/ Inc (14.5) (11.8) (10.6) (8.2)
Associates & JV 140.0 118.0 127.2 167.7 ST Debt 157.1 157.1 157.1 157.1
Exceptional gain/ (loss) 0.0 0.0 0.0 0.0 Other Current Liabilities 301.1 322.7 342.6 355.7
Pre-tax profit 195.7 193.3 223.5 275.0 LT Debt 322.6 322.6 322.6 322.6
Tax (18.1) (19.3) (22.4) (27.5) Other LT Liabilities 5.5 5.5 5.5 5.5
Minority interest (39.1) (38.7) (44.7) (55.0) Minority Interest 323.7 362.4 407.1 462.1
Net profit 138.6 135.3 156.5 192.5 Shareholders' Equity 1,442.7 1,544.2 1,661.5 1,805.9
Recurring net profit 138.6 135.3 156.5 192.5 Total Liabilities-Capital 2,552.7 2,714.4 2,896.4 3,108.8
Revenue Growth (%) (0.0) 12.0 9.6 6.9 Share Capital (m) 390.6 390.6 390.6 390.6
EBITDA Growth (%) (14.6) 29.4 16.3 5.2 Gross Debt 479.7 479.7 479.7 479.7
EBIT Growth (%) (23.6) 24.0 22.7 8.0 Net Debt/(Cash) 154.5 114.0 33.9 (47.0)
Net Profit Growth (%) 1.6 (2.4) 15.6 23.0 Working Capital 509.8 593.7 705.4 814.9
Core Net Profit Growth (%) 5.7 (2.4) 15.6 23.0
Tax Rate % 9.2 10.0 10.0 10.0
CASH FLOW (MYR m) RATES & RATIOS
FY Dec 2013A 2014F 2015F 2016F FY Dec 2013A 2014F 2015F 2016F
Profit before taxation 195.7 193.3 223.5 275.0 EBITDA Margin % 4.2 4.9 5.2 5.1
Depreciation &Amortisation 25.4 36.7 37.0 36.0 Op. Profit Margin % 3.1 3.4 3.8 3.9
Net int receipts/(payments) (14.5) (11.8) (10.6) (8.2) Net Profit Margin % 6.1 5.3 5.6 6.5
Working capital change 168.1 (36.2) (23.5) (18.4) ROE % 10.0 9.1 9.8 11.1
Cash tax paid (24.8) (26.4) (30.6) (37.6) ROA % 5.5 5.1 5.6 6.4
Others (incl'd exceptional items)
(173.0) (94.4) (106.0) (151.3) Net Margin Ex. El % 6.1 5.3 5.6 6.5
Cash flow from operations 176.9 61.1 89.8 95.5 Dividend Cover (x) 4.0 4.0 4.0 4.0
Capex (117.0) (40.0) (25.0) (24.0) Interest Cover (x) 4.8 7.4 10.1 14.1
Disposal/(purchase) 83.7 0.0 0.0 0.0 Asset Turnover (x) 0.9 0.9 1.0 1.0
Others 41.4 74.8 75.9 79.2 Asset/Debt (x) 5.3 5.7 6.0 6.5
Cash flow from investing 8.1 34.8 50.9 55.2 Debtors Turn (days) 212.8 243.4 266.9 285.3
Debt raised/(repaid) (89.2) 0.0 0.0 0.0 Creditors Turn (days) 289.0 317.6 345.8 369.0
Equity raised/(repaid) 0.0 0.0 0.0 0.0 Inventory Turn (days) 283.4 317.6 345.8 369.0
Dividends (paid) (55.9) (33.8) (39.1) (48.1) Net Gearing % 10.7 7.4 2.0 NA
Interest payments (23.0) (21.6) (21.6) (21.6) Debt/ EBITDA (x) 5.0 3.9 3.3 3.2
Others 0.2 0.0 0.0 0.0 Debt/ Market Cap (x) 0.4 0.4 0.4 0.4
Cash flow from financing (167.9) (55.4) (60.7) (69.7)
Change in cash 17.1 40.5 80.1 81.0
Source: Company, Maybank KE
3.0
5.0
7.0
9.0
11.0
Apr-
09
Apr-
10
Apr-
11
Apr-
12
Apr-
13
PE(X)
Mean: 7.4
-1sd: 5.2
+1sd: 9.7
0.3
0.6
0.9
1.2
Apr-
09
Apr-
10
Apr-
11
Apr-
12
Apr-
13
PB(X)
Mean: 0.7
-1sd: 0.6
+1sd: 0.9
April 21, 2014 10
Automotive
Research Offices
REGIONAL
WONG Chew Hann, CA
Regional Head of Institutional Research (603) 2297 8686 [email protected]
ONG Seng Yeow
Regional Head of Retail Research
(65) 6432 1453 [email protected]
Alexander GARTHOFF
Institutional Product Manager
(852) 2268 0638 [email protected]
ECONOMICS
Suhaimi ILIAS
Chief Economist
Singapore | Malaysia
(603) 2297 8682 [email protected]
Luz LORENZO
Philippines
(63) 2 849 8836 [email protected]
Tim LEELAHAPHAN
Thailand (662) 658 1420 [email protected]
JUNIMAN
Chief Economist, BII
Indonesia
(62) 21 29228888 ext 29682 [email protected]
Josua PARDEDE
Economist / Industry Analyst, BII
Indonesia
(62) 21 29228888 ext 29695 [email protected]
MALAYSIA
WONG Chew Hann, CA Head of Research (603) 2297 8686 [email protected] • Strategy • Construction & Infrastructure
Desmond CH’NG, ACA (603) 2297 8680 [email protected] • Banking & Finance
LIAW Thong Jung (603) 2297 8688 [email protected] • Oil & Gas - Regional • Shipping
ONG Chee Ting, CA (603) 2297 8678 [email protected] • Plantations - Regional
Mohshin AZIZ (603) 2297 8692 [email protected] • Aviation - Regional • Petrochem
YIN Shao Yang, CPA (603) 2297 8916 [email protected] • Gaming – Regional • Media
TAN Chi Wei, CFA (603) 2297 8690 [email protected] • Power • Telcos
WONG Wei Sum, CFA (603) 2297 8679 [email protected] • Property & REITs
LEE Yen Ling (603) 2297 8691 [email protected] • Building Materials • Glove Producers
CHAI Li Shin (603) 2297 8684 [email protected] • Plantation • Construction & Infrastructure
KANG Chun Ee (603) 2297 8675 [email protected] • Consumer
Ivan YAP (603) 2297 8612 [email protected] • Automotive
LEE Cheng Hooi Regional Chartist (603) 2297 8694 [email protected]
Tee Sze Chiah Head of Retail Research (603) 2297 6858 [email protected]
HONG KONG / CHINA
Howard WONG Head of Research (852) 2268 0648 [email protected] • Oil & Gas - Regional
Alexander LATZER (852) 2268 0647 [email protected] • Metals & Mining - Regional
Jacqueline KO, CFA (852) 2268 0633 [email protected] • Consumer
Karen KWAN (852) 2268 0640 [email protected] • Property & REITs
Osbert TANG, CFA (852) 21 5096 8370 [email protected] • Transport & Industrials
Philip TSE, CFA FRM (852) 2268 0643 [email protected] • Property & REITs
Ricky WK NG, CFA (852) 2268 0689 [email protected] • Utilities & Renewable Energy
Simon QIAN, CFA (852) 2268 0634 [email protected] • Telecom & Internet
Steven ST CHAN (852) 2268 0645 [email protected] • Banking & Financials
Warren LAU (852) 2268 0644 [email protected] • Technology – Regional
William YANG (852) 2268 0675 [email protected] • Technology – Regional
INDIA
Jigar SHAH Head of Research
(91) 22 6623 2601
• Oil & Gas • Automobile • Cement
Anubhav GUPTA
(91) 22 6623 2605
• Metal & Mining • Capital Goods • Property
Urmil SHAH
(91) 22 6623 2606 [email protected]
• Technology • Media
SINGAPORE
NG Wee Siang Head of Research (65) 6432 1467 [email protected] • Banking & Finance
Gregory YAP (65) 6432 1450 [email protected] • SMID Caps – Regional • Technology & Manufacturing • Telcos
Wilson LIEW (65) 6432 1454 [email protected] • Property Developers
ONG Kian Lin (65) 6432 1470 [email protected] • S-REITs
James KOH (65) 6432 1431 [email protected] • Consumer - Regional
YEAK Chee Keong, CFA (65) 6432 1460 [email protected] • Offshore & Marine
Derrick HENG (65) 6432 1446 [email protected] • Transport (Land, Shipping & Aviation)
WEI Bin (65) 6432 1455 [email protected] • Commodity • Logistics • S-chips
John CHEONG (65) 6432 1461 [email protected] • Small & Mid Caps • Healthcare
INDONESIA
Wilianto IE Head of Research (62) 21 2557 1125 [email protected] • Strategy
Rahmi MARINA (62) 21 2557 1128 [email protected] • Banking & Finance
Aurellia SETIABUDI (62) 21 2953 0785 [email protected] • Property
Anthony YUNUS (62) 21 2557 1136 [email protected] • Consumer • Poultry
Isnaputra ISKANDAR (62) 21 2557 1129 [email protected] • Metals & Mining • Cement
Pandu ANUGRAH (62) 21 2557 1137 [email protected] • Infrastructure • Construction • Transport
Janni ASMAN (62) 21 2953 0784 [email protected] • Cigarette • Healthcare • Retail
PHILIPPINES
Luz LORENZO Head of Research (63) 2 849 8836 [email protected] • Strategy
Laura DY-LIACCO (63) 2 849 8840 [email protected] • Utilities • Conglomerates • Telcos
Lovell SARREAL (63) 2 849 8841 [email protected] • Consumer • Media • Cement
Rommel RODRIGO (63) 2 849 8839 [email protected] • Conglomerates • Property • Gaming • Ports/ Logistics
Katherine TAN (63) 2 849 8843 [email protected] • Banks • Construction
Ramon ADVIENTO (63) 2 849 8845 [email protected] • Mining
THAILAND
Maria LAPIZ Head of Institutional Research Dir (66) 2257 0250 | (66) 2658 6300 ext 1399 [email protected] • Consumer / Materials
Jesada TECHAHUSDIN, CFA (66) 2658 6300 ext 1394 [email protected] • Financial Services
Kittisorn PRUITIPAT, CFA, FRM (66) 2658 6300 ext 1395 [email protected] • Real Estate
Sittichai DUANGRATTANACHAYA (66) 2658 6300 ext 1393 [email protected] • Services Sector
Sukit UDOMSIRIKUL Head of Retail Research (66) 2658 6300 ext 5090 [email protected]
Mayuree CHOWVIKRAN (66) 2658 6300 ext 1440 [email protected] • Strategy
Padon VANNARAT (66) 2658 6300 ext 1450 [email protected] • Strategy
Surachai PRAMUALCHAROENKIT (66) 2658 6300 ext 1470 [email protected] • Auto • Conmat • Contractor • Steel
Suttatip PEERASUB (66) 2658 6300 ext 1430 [email protected] • Media • Commerce
Sutthichai KUMWORACHAI (66) 2658 6300 ext 1400 [email protected] • Energy • Petrochem
Termporn TANTIVIVAT (66) 2658 6300 ext 1520 [email protected] • Property
Woraphon WIROONSRI (66) 2658 6300 ext 1560 [email protected] • Banking & Finance
Jaroonpan WATTANAWONG (66) 2658 6300 ext 1404 [email protected] • Transportation • Small cap
Chatchai JINDARAT (66) 2658 6300 ext 1401 [email protected] • Electronics
VIETNAM
LE Hong Lien, ACCA Head of Institutional Research (84) 844 55 58 88 x 8181 [email protected] • Strategy • Consumer • Diversified • Utilities
THAI Quang Trung, CFA, Deputy Manager, Institutional Research (84) 844 55 58 88 x 8180 [email protected] • Real Estate • Construction • Materials
TRUONG Thanh Hang (84) 844 55 58 88 x 8085 [email protected] • Consumer
Le Nguyen Nhat Chuyen (84) 844 55 58 88 x 8082 [email protected] • Oil & Gas NGUYEN Thi Ngan Tuyen, Head of Retail Research (84) 8 44 555 888 x 8081 [email protected] • Food & Beverage • Oil&Gas • Banking
NGUYEN Trung Hoa, Dy Head of Retail Research (84) 8 44 555 888 x 8088 [email protected] • Macro • Steel • Real estate
TRINH Thi Ngoc Diep (84) 4 44 555 888 x 8208 [email protected] • Technology • Utilities • Construction
TRUONG Quang Binh (84) 4 44 555 888 x 8087 [email protected] • Rubber plantation • Tyres and Tubes • Oil&Gas
PHAM Nhat Bich (84) 8 44 555 888 x 8083 [email protected] • Consumer • Manufacturing • Fishery
NGUYEN Thi Sony Tra Mi (84) 8 44 555 888 x 8084 [email protected] • Port operation • Pharmaceutical
• Food & Beverage
April 21, 2014 11
Automotive
APPENDIX I: TERMS FOR PROVISION OF REPORT, DISCLAIMERS AND DISCLOSURES
DISCLAIMERS
This research report is prepared for general circulation and for information purposes only and under no circumstances should it be considered or intended as an offer to sell or a solicitation of an offer to buy the securities referred to herein. Investors should note that values of such securities, if any, may fluctuate and that each security’s price or value may rise or fall. Opinions or recommendations contained herein are in form of technical ratings and fundamental ratings. Technical ratings may differ from fundamental ratings as technical valuations apply different methodologies and are purely based on price and volume-related information extracted from the relevant jurisdiction’s stock exchange in the equity analysis. Accordingly, investors’ returns may be less than the original sum invested. Past performance is not necessarily a guide to future performance. This report is not intended to provide personal investment advice and does not take into account the specific investment objectives, the financial situation and the particular needs of persons who may receive or read this report. Investors should therefore seek financial, legal and other advice regarding the appropriateness of investing in any securities or the investment strategies discussed or recommended in this report.
The information contained herein has been obtained from sources believed to be reliable but such sources have not been independently verified by Maybank Investment Bank Berhad, its subsidiary and affiliates (collectively, “MKE”) and consequently no representation is made as to the accuracy or completeness of this report by MKE and it should not be relied upon as such. Accordingly, MKE and its officers, directors, associates, connected parties and/or employees (collectively, “Representatives”) shall not be liable for any direct, indirect or consequential losses or damages that may arise from the use or reliance of this report. Any information, opinions or recommendations contained herein are subject to change at any time, without prior notice.
This report may contain forward looking statements which are often but not always identified by the use of words such as “anticipate”, “believe”, “estimate”, “intend”, “plan”, “expect”, “forecast”, “predict” and “project” and statements that an event or result “may”, “will”, “can”, “should”, “could” or “might” occur or be achieved and other similar expressions. Such forward looking statements are based on assumptions made and information currently available to us and are subject to certain risks and uncertainties that could cause the actual results to differ materially from those expressed in any forward looking statements. Readers are cautioned not to place undue relevance on these forward-looking statements. MKE expressly disclaims any obligation to update or revise any such forward looking statements to reflect new information, events or circumstances after the date of this publication or to reflect the occurrence of unanticipated events.
MKE and its officers, directors and employees, including persons involved in the preparation or issuance of this report, may, to the extent permitted by law, from time to time participate or invest in financing transactions with the issuer(s) of the securities mentioned in this report, perform services for or solicit business from such issuers, and/or have a position or holding, or other material interest, or effect transactions, in such securities or options thereon, or other investments related thereto. In addition, it may make markets in the securities mentioned in the material presented in this report. MKE may, to the extent permitted by law, act upon or use the information presented herein, or the research or analysis on which they are based, before the material is published. One or more directors, officers and/or employees of MKE may be a director of the issuers of the securities mentioned in this report.
This report is prepared for the use of MKE’s clients and may not be reproduced, altered in any way, transmitted to, copied or distributed to any other party in whole or in part in any form or manner without the prior express written consent of MKE and MKE and its Representatives accepts no liability whatsoever for the actions of third parties in this respect.
This report is not directed to or intended for distribution to or use by any person or entity who is a citizen or resident of or located in any locality, state, country or other jurisdiction where such distribution, publication, availability or use would be contrary to law or regulation. This report is for distribution only under such circumstances as may be permitted by applicable law. The securities described herein may not be eligible for sale in all jurisdictions or to certain categories of investors. Without prejudice to the foregoing, the reader is to note that additional disclaimers, warnings or qualifications may apply based on geographical location of the person or entity receiving this report.
Malaysia
Opinions or recommendations contained herein are in the form of technical ratings and fundamental ratings. Technical ratings may differ from fundamental ratings as technical valuations apply different methodologies and are purely based on price and volume-related information extracted from Bursa Malaysia Securities Berhad in the equity analysis.
Singapore
This report has been produced as of the date hereof and the information herein may be subject to change. Maybank Kim Eng Research Pte. Ltd. (“Maybank KERPL”) in Singapore has no obligation to update such information for any recipient. For distribution in Singapore, recipients of this report are to contact Maybank KERPL in Singapore in respect of any matters arising from, or in connection with, this report. If the recipient of this report is not an accredited investor, expert investor or institutional investor (as defined under Section 4A of the Singapore Securities and Futures Act), Maybank KERPL shall be legally liable for the contents of this report, with such liability being limited to the extent (if any) as permitted by law.
Thailand
The disclosure of the survey result of the Thai Institute of Directors Association (“IOD”) regarding corporate governance is made pursuant to the policy of the Office of the Securities and Exchange Commission. The survey of the IOD is based on the information of a company listed on the Stock Exchange of Thailand and the market for Alternative Investment disclosed to the public and able to be accessed by a general public investor. The result, therefore, is from the perspective of a third party. It is not an evaluation of operation and is not based on inside information. The survey result is as of the date appearing in the Corporate Governance Report of Thai Listed Companies. As a result, the survey may be changed after that date. Maybank Kim Eng Securities (Thailand) Public Company Limited (“MBKET”) does not confirm nor certify the accuracy of such survey result.
Except as specifically permitted, no part of this presentation may be reproduced or distributed in any manner without the prior written permission of MBKET. MBKET accepts no liability whatsoever for the actions of third parties in this respect.
US
This research report prepared by MKE is distributed in the United States (“US”) to Major US Institutional Investors (as defined in Rule 15a-6 under the Securities Exchange Act of 1934, as amended) only by Maybank Kim Eng Securities USA Inc (“Maybank KESUSA”), a broker-dealer registered in the US (registered under Section 15 of the Securities Exchange Act of 1934, as amended). All responsibility for the distribution of this report by Maybank KESUSA in the US shall be borne by Maybank KESUSA. All resulting transactions by a US person or entity should be effected through a registered broker-dealer in the US. This report is not directed at you if MKE is prohibited or restricted by any legislation or regulation in any jurisdiction from making it available to you. You should satisfy yourself before reading it that Maybank KESUSA is permitted to provide research material concerning investments to you under relevant legislation and regulations.
UK
This document is being distributed by Maybank Kim Eng Securities (London) Ltd (“Maybank KESL”) which is authorized and regulated, by the Financial Services Authority and is for Informational Purposes only. This document is not intended for distribution to anyone defined as a Retail Client under the Financial Services and Markets Act 2000 within the UK. Any inclusion of a third party link is for the recipients convenience only, and that the firm does not take any responsibility for its comments or accuracy, and that access to such links is at the individuals own risk. Nothing in this report should be considered as constituting legal, accounting or tax advice, and that for accurate guidance recipients should consult with their own independent tax advisers.
April 21, 2014 12
Automotive
Disclosure of Interest
Malaysia: MKE and its Representatives may from time to time have positions or be materially interested in the securities referred to herein and may further act as market maker or may have assumed an underwriting commitment or deal with such securities and may also perform or seek to perform investment banking services, advisory and other services for or relating to those companies.
Singapore:As of April 21, 2014, Maybank KERPL and the covering analyst do not have any interest in any companies recommended in this research report.
Thailand: MBKET may have a business relationship with or may possibly be an issuer of derivative warrants on the securities /companies mentioned in the research report. Therefore, Investors should exercise their own judgment before making any investment decisions. MBKET, its associates, directors, connected parties and/or employees may from time to time have interests and/or underwriting commitments in the securities mentioned in this report.
Hong Kong: KESHK may have financial interests in relation to an issuer or a new listing applicant referred to as defined by the requirements under Paragraph 16.5(a) of the Hong Kong Code of Conduct for Persons Licensed by or Registered with the Securities and Futures Commission.
As of April 21, 2014, KESHK and the authoring analyst do not have any interest in any companies recommended in this research report.
MKE may have, within the last three years, served as manager or co-manager of a public offering of securities for, or currently may make a primary market in issues of, any or all of the entities mentioned in this report or may be providing, or have provided within the previous 12 months, significant advice or investment services in relation to the investment concerned or a related investment and may receive compensation for the services provided from the companies covered in this report.
OTHERS
Analyst Certification of Independence
The views expressed in this research report accurately reflect the analyst’s personal views about any and all of the subject securities or issuers; and no part of the research analyst’s compensation was, is or will be, directly or indirectly, related to the specific recommendations or views expressed in the report.
Reminder
Structured securities are complex instruments, typically involve a high degree of risk and are intended for sale only to sophisticated investors who are capable of understanding and assuming the risks involved. The market value of any structured security may be affected by changes in economic, financial and political factors (including, but not limited to, spot and forward interest and exchange rates), time to maturity, market conditions and volatility and the credit quality of any issuer or reference issuer. Any investor interested in purchasing a structured product should conduct its own analysis of the product and consult with its own professional advisers as to the risks involved in making such a purchase.
No part of this material may be copied, photocopied or duplicated in any form by any means or redistributed without the prior consent of MKE.
Definition of Ratings
Maybank Kim Eng Research uses the following rating system
BUY Return is expected to be above 10% in the next 12 months (excluding dividends)
HOLD Return is expected to be between - 10% to +10% in the next 12 months (excluding dividends)
SELL Return is expected to be below -10% in the next 12 months (excluding dividends)
Applicability of Ratings
The respective analyst maintains a coverage universe of stocks, the list of which may be adjusted according to needs. Investment ratings are only applicable to the stocks which form part of the coverage universe. Reports on companies which are not part of the coverage do not carry investment ratings as we do not actively follow developments in these companies.
DISCLOSURES
Legal Entities Disclosures
Malaysia: This report is issued and distributed in Malaysia by Maybank Investment Bank Berhad (15938-H) which is a Participating Organization of Bursa Malaysia Berhad and a holder of Capital Markets and Services License issued by the Securities Commission in Malaysia. Singapore: This material is issued and distributed in Singapore by Maybank KERPL (Co. Reg No 197201256N) which is regulated by the Monetary Authority of Singapore. Indonesia: PT Kim Eng Securities (“PTKES”) (Reg. No. KEP-251/PM/1992) is a member of the Indonesia Stock Exchange and is regulated by the BAPEPAM LK. Thailand: MBKET (Reg. No.0107545000314) is a member of the Stock Exchange of Thailand and is regulated by the Ministry of Finance and the Securities and Exchange Commission. Philippines: Maybank ATRKES (Reg. No.01-2004-00019) is a member of the Philippines Stock Exchange and is regulated by the Securities and Exchange Commission. Vietnam: Maybank Kim Eng Securities JSC (License Number: 71/UBCK-GP) is licensed under the State Securities Commission of Vietnam.Hong Kong: KESHK (Central Entity No AAD284) is regulated by the Securities and Futures Commission. India: Kim Eng Securities India Private Limited (“KESI”) is a participant of the National Stock Exchange of India Limited (Reg No: INF/INB 231452435) and the Bombay Stock Exchange (Reg. No. INF/INB 011452431) and is regulated by Securities and Exchange Board of India. KESI is also registered with SEBI as Category 1 Merchant Banker (Reg. No. INM 000011708) US: Maybank KESUSA is a member of/ and is authorized and regulated by the FINRA – Broker ID 27861. UK: Maybank KESL (Reg No 2377538) is authorized and regulated by the Financial Services Authority.
April 21, 2014 13
Automotive
Malaysia Maybank Investment Bank Berhad
(A Participating Organisation of
Bursa Malaysia Securities Berhad)
33rd Floor, Menara Maybank,
100 Jalan Tun Perak,
50050 Kuala Lumpur
Tel: (603) 2059 1888;
Fax: (603) 2078 4194
Singapore Maybank Kim Eng Securities Pte Ltd
Maybank Kim Eng Research Pte Ltd
9 Temasek Boulevard
#39-00 Suntec Tower 2
Singapore 038989
Tel: (65) 6336 9090
Fax: (65) 6339 6003
London Maybank Kim Eng Securities
(London) Ltd
6/F, 20 St. Dunstan’s Hill
London EC3R 8HY, UK
Tel: (44) 20 7621 9298
Dealers’ Tel: (44) 20 7626 2828
Fax: (44) 20 7283 6674
New York Maybank Kim Eng Securities USA
Inc
777 Third Avenue, 21st Floor
New York, NY 10017, U.S.A.
Tel: (212) 688 8886
Fax: (212) 688 3500
Stockbroking Business:
Level 8, Tower C, Dataran Maybank,
No.1, Jalan Maarof
59000 Kuala Lumpur
Tel: (603) 2297 8888
Fax: (603) 2282 5136
Hong Kong Kim Eng Securities (HK) Ltd
Level 30,
Three Pacific Place,
1 Queen’s Road East,
Hong Kong
Tel: (852) 2268 0800
Fax: (852) 2877 0104
Indonesia PT Maybank Kim Eng Securities
Plaza Bapindo
Citibank Tower 17th Floor
Jl Jend. Sudirman Kav. 54-55
Jakarta 12190, Indonesia
Tel: (62) 21 2557 1188
Fax: (62) 21 2557 1189
India Kim Eng Securities India Pvt Ltd
2nd Floor, The International 16,
Maharishi Karve Road,
Churchgate Station,
Mumbai City - 400 020, India
Tel: (91).22.6623.2600
Fax: (91).22.6623.2604
Philippines Maybank ATR Kim Eng Securities Inc.
17/F, Tower One & Exchange Plaza
Ayala Triangle, Ayala Avenue
Makati City, Philippines 1200
Tel: (63) 2 849 8888
Fax: (63) 2 848 5738
Thailand Maybank Kim Eng Securities
(Thailand) Public Company Limited
999/9 The Offices at Central World,
20th - 21st Floor,
Rama 1 Road Pathumwan,
Bangkok 10330, Thailand
Tel: (66) 2 658 6817 (sales)
Tel: (66) 2 658 6801 (research)
Vietnam Maybank Kim Eng Securities Limited
4A-15+16 Floor Vincom Center Dong
Khoi, 72 Le Thanh Ton St. District 1
Ho Chi Minh City, Vietnam
Tel : (84) 844 555 888
Fax : (84) 8 38 271 030
Saudi Arabia In association with
Anfaal Capital
Villa 47, Tujjar Jeddah
Prince Mohammed bin Abdulaziz
Street P.O. Box 126575
Jeddah 21352
Tel: (966) 2 6068686
Fax: (966) 26068787
South Asia Sales Trading Kevin FOY
Tel: (65) 6336-5157
US Toll Free: 1-866-406-7447
North Asia Sales Trading Alex TSUN
Tel: (852) 2268 0228
US Toll Free: 1 877 837 7635
www.maybank-ke.com | www.maybank-keresearch.com


![[Unchanged] Opportunity amid adversity - I3investorcdn1.i3investor.com/my/files/dfgs88n/2016/01/07/1483882668... · Opportunity amid adversity Adapt ... for corporate exercises](https://img.pdfslide.net/doc/110x75/5b0a24417f8b9abe5d8dc293/unchanged-opportunity-amid-adversity-i3investorcdn1-amid-adversity-adapt-.jpg)