Embed Size (px)
Citation preview


1
Copyright Healthcare Quality Improvement Partnership 2019
My broken hip – a patient’s perspective
On a wet, windy afternoon I took my three granddaughters to a cafe for a drink after school. Without warning, my foot slipped and I fell to the floor. In a public place, in front of my small granddaughters, I had broken my hip. I was 68 years old.
I was admitted to the local hospital. The next morning a surgeon explained I needed a total hip replacement. I was taken to theatre 20 hours after admission.
My perception of someone who broke their hip was of a frail, elderly person. My overwhelming thought was that I needed to tell the staff that I was normally fit and active and had slipped while looking after grandchildren.
It is truly shocking to break a hip – both physically and emotionally. There is no preparation for it. Rationally I knew I had a new joint but there was no outward sign that I was ‘mended’ in the form of a plaster or other support. My leg was swollen and red, and it was almost impossible to imagine that I would walk again. Two physiotherapists saw me and helped me out of bed the day after surgery, but I had low blood pressure and fainted the first couple of days when trying to walk.
Everyone was very kind but there was an air of pressure and haste in my bay; I appreciated the staff were very busy with the other patients needing a lot of attention. My husband and daughter visited me every day, as did friends, but I would have welcomed someone to talk to about the present and the future, and some written information for me to browse. I was reluctant to ask too many questions as everyone was very busy. I still felt scared about the future and was very keen to know exactly what I should be doing to help my recovery.
I was very eager to go home, but didn’t feel prepared and the discharge was very hasty. It was a frightening and uncertain time at home for a while, despite having a very supportive family. Fear of never returning to normal, of having another fall and lack of confidence in my injured leg were paramount in my thoughts.
I was sent an NHS physiotherapist appointment for three months later. I felt the need to see a private physiotherapist to establish what I could be doing physically and what to avoid.
I received a phone call from the hospital at some point, asking only if I could walk outside; it was a very brief call! However, I felt I was thoroughly assessed at the fracture clinic, my X-ray was shown to me and the staff were very informative and positive. This appointment certainly increased my now growing confidence.
However, I am very thankful to now be back to normal and walking, swimming and cycling as before. I am very grateful for the expertise of my surgeon.
Phyll Taylor Falls and Fragility Fracture Audit Programme patient panel member
The NHFD has facilitated improvements in the care of frail and older people with hip fracture, reversing the fatalism with which their care, recovery and outcome was so often viewed in previous decades. Deaths following hip fracture may have halved since 2007, but this patient story highlights how distressing hip fracture can still be, even for younger and fitter people. It reminds us to focus on understanding people's experience, both in and out of hospital, and on ensuring that they return to their former lifestyle; topics that this report and future work need to address.
Antony Johansen Orthogeriatrician and NHFD clinical lead

Copyright Healthcare Quality Improvement Partnership 2019 2
Introduction The National Hip Fracture Database (NHFD) was established in 2007 as a collaboration between the British Orthopaedic Association (BOA) and the British Geriatrics Society (BGS), and its methodology has not changed since the description provided in our 2017 report.
All 175 trauma units in England, Wales and Northern Ireland continue to upload data describing the process and outcome of the care provided to 66,313 people who presented with hip fracture in 2018 – over 95% of patients in these countries.
Since 2007 the NHFD has reported a progressive improvement in mortality in the month after hip fracture and this trend continues with just 4,007 people (6.1%) dying in 2018. This figure represents a decrease of one in eight when compared with the mortality figure of 6.9% we reported for 2017 and implies that 564 fewer people died within a month of breaking their hip in 2018.
This report examines the quality of patient care using a set of six NHFD key performance indicators and is designed to complement the very broad range of data on many aspects of assessment, surgical and anaesthetic care, rehabilitation, follow-up and outcome presented in the run charts, benchmarking tables and dashboards freely available to the public on the NHFD website.
Foreword As an orthopaedic trauma surgeon, I have been reading the NHFD annual report every year since the database began 12 years ago. No one who is interested in improving the care for patients with fragility fractures can fail to be impressed. The development of the NHFD to include all acute hospitals in England, Wales and Northern Ireland, with high-quality data on over 95% of all patients with a hip fracture, is a remarkable achievement in itself.
However, to have demonstrated an almost year-on-year reduction in mortality through the adoption of best practice quality standards is the truly remarkable result of this venture. I would never have believed that this was possible back in 2007.
The NHFD has undoubtedly been one of the biggest success stories of the NHS in recent years. But what about its influence abroad? For the last year I have had the great privilege of being the president of the Global Fragility Fracture Network (FFN). The FFN is a worldwide network of activists whose mission is to improve the care of patients with fragility fractures. It is in this role that I have seen – with great pride – the enormous positive influence of the NHFD. There are now national FFNs in countries from Brazil through India and China, to Malaysia and New Zealand. Almost the first question that each of these networks asks is: ‘How do we create our own version of the NHFD?’ The NHFD has become the standard to which other countries aspire. It is no accident that the three pillars of the Global FFN are based upon the NHFD quality standards related to acute multidisciplinary care, fast and effective rehabilitation and prompt secondary prevention to reduce the risk of future fractures. I was particularly pleased to see the expansion and development of the Patient Panel described in this year’s report. It is so important that the development and implementation of strategies to improve care are based upon what is important to the patient. I have no doubt that the panel, with support from the Royal Osteoporosis Society, will make sure that this is the case. Congratulations from me and from all of my colleagues in the Global Fragility Fracture Network, and a big thank you to all of those involved in the UK National Hip Fracture Database.
Matt Costa Professor of orthopaedic trauma, University of Oxford
President of the Global Fragility Fracture Network (FFN)

Copyright Healthcare Quality Improvement Partnership 2019
3
Executive summary
Key messages
Patient experience Patient experience should be central to the design of hip fracture services. Information leaflets must be available to inform and empower patients
and their families. Patients’ views on their care should be routinely sought and regularly fed back to clinical teams.
KPI 1 Orthogeriatric care has transformed trauma services and serves as a model for collaborative working. Involving trainee geriatricians in hip fracture services will improve
provision of perioperative support, and will train those who will develop and lead future services.
KPI 2 Quality Improvement work should examine the reasons for delays to theatre, in order to ensure the efficient planning and use of trauma lists. This will benefit all
patients who need urgent anaesthesia and surgery.
KPI 3 Over a quarter of patients are undergoing an operation that is not the one recommended by NICE. More should be done to embed standardised, evidence-based
decision-making around surgical implant choices. NHFD clinical leads in hospitals should review current surgical practice and their implant inventories to ensure consistency across consultant-led teams.
KPI 4 One in five patients are still not able to get out of bed on the day after surgery. Prompt mobilisation after surgery is everyone’s responsibility and is key to patients’
successful return to pre-fracture activities and residence. Surgical and anaesthetic limiting factors should be monitored and addressed in regular clinical governance meetings involving the whole multidisciplinary team.
KPI 5 Prevention, recognition and management of delirium is everyone’s responsibility. As delirium commonly compromises patient experience and recovery, screening for
delirium should be a priority in the first days after surgery. Effective management of pain, fluids, anaemia and nutrition requires a multidisciplinary approach, and delirium rates should be monitored and addressed in regular governance meetings involving the whole team.
KPI 6 Most people want to return to their previous independence after a hip fracture. NICE guidance highlights the need for hip fracture programmes to be responsible for
seamless care between hospital and community services if they are to deliver improved outcome and reduced costs.
Mortality Increased hip fractures numbers add to winter pressures on trauma services, and partly explain patients’ greater risk of dying in the winter months. If we are to
avoid the 325 additional deaths that result each winter then trauma services need to plan for the greater number and complexity of the cases that present then. Hip fracture mortality figures continue to improve, but teams need to examine each case individually to ensure that lessons are learned by the whole multidisciplinary team and that the needs of patients, and of those close to them, are anticipated at the end of life.

Copyright Healthcare Quality Improvement Partnership 2019 4

Copyright Healthcare Quality Improvement Partnership 2019 5
Key performance indicator 1
Will I see both an orthopaedic surgeon and a medical specialist after breaking my hip?
Definition: Is the patient assessed by a consultant, specialist or associate specialist (SAS), or specialist trainee geriatrician within 72 hours of presentation?
There is compelling evidence that comprehensive geriatric assessment (CGA) improves outcomes for older people. Early review by an orthogeriatrician will help to prepare patients for prompt surgery, minimise the proportion of patients managed without surgery (a figure that remained at just 2% in 2018), improve perioperative medical care and expedite the planning of rehabilitation and discharge.
The range of achieving prompt orthogeriatric review was 35–100% in England, where the influence of BPT (best practice tariff) means this KPI was achieved for 93% of patients in 2018, in contrast to 58% in Wales and 87% in Northern Ireland.
There remains huge variation in how likely a patient is to receive an admission assessment by an orthogeriatrician. Different hospitals report figures that ranged from 1–100% of patients in 2018. The ‘caterpillar plot’ (see left page) shows the distribution of this, with four units in Wales still having no orthogeriatric service.
Thirty seven units (21%) have 99.8% confidence limits below the national average for KPI 1. Teams should check the online KPI 1 table to see their own position. If this suggests performance that is significantly below the national average they should examine local arrangements for orthogeriatric support for their patients. Teams with performance significantly above average should be congratulated.
Much of the success of the NHFD and of BPT in reducing 30-day mortality in England can be traced to their promotion of collaborative orthopaedic-geriatric working (Neuburger et al, 2015, 2017).
In 2017 we showed that units were reporting that for each patient admitted with hip fracture there was an average of 4 hours provided in senior orthogeriatricians’ job-plans. In this year’s NHFD facilities survey this figure had risen to 5.5 hours (see chart above), in part reflecting ongoing development of orthogeriatric services which often support other people with frailty and older trauma patients.

Copyright Healthcare Quality Improvement Partnership 2019
6
Key performance indicator 2
Will my operation be done today or tomorrow?
Definition: Is the date of surgery the same day or the day following first presentation with hip fracture? This KPI is consistent with NICE clinical guidelines (CG124), rather than with the 36 hour figure used for BPT.
Surgery is the only effective way to address a patient’s pain and allow them to get out of bed. Patients waited an average of 33.1 hours for surgery in 2018, the same as we reported for 2017, but longer than the 31.4 hours reported for 2015.
Click on the above image to go to the NHFD website and see how performance has been changing in your own unit – during and since 2018.
This ‘caterpillar plot’ (see chart on left) and the online KPI 2 table show enormous variation in performance.
The proportion of patients who received surgery by the day after fracture ranged from 13–94% in different units: a range of 29–94% in
England, 47–77% in Wales and 13–37% in Northern Ireland.
Variation between units is less marked than for KPI 1, but the online KPI 2 table identifies 38 units (22%) which should review their performance, as the proportion of their patients receiving prompt surgery was significantly below the national average.
NHFD captures surgical and anaesthetic data for each patient. The table below considers the 31% in whom surgery was delayed and we found that in 50% of these cases the reason for delay was characterised as administrative. This may result from increasing pressures on lists and operating departments, but may also reflect inefficient management of theatre lists – something which local teams will have more potential to influence.
Reason for delay 2018
Administrative/logistic – awaiting space on theatre list 42.2%
Administrative/logistic – cancelled due to list over-run 7.7%
Awaiting medical review/investigation or stabilisation 25.6%
Awaiting orthopaedic diagnosis/investigation 6.6%
Delayed as a result of direct-acting oral anticoagulant (DOAC) 6.9%
Delayed for reversal of warfarin 3.5%
Other 7.4%
The other 50% of cases where surgery was delayed related to delays in orthopaedic diagnosis and investigation, or while patients were reviewed and optimised by surgeons, orthogeriatricians and anaesthetists before surgery. In 10% of all cases delay was attributed to the need for the effect of anticoagulant therapy to wear off or be reversed.
NICE CG124 specifically recommends that units should develop and ensure the consistent use of pre-operative protocols and care bundles to expedite the management of common medical problems that will lead to delay in surgery.
It is a concern that in January 2019 our facilities survey identified that not all units have developed these. Indeed, 19% still do not have a protocol for perioperative management of people who are taking direct-acting oral anticoagulants, even though this is a topic on which there is an extensive literature (Taranu et al 2018).

Copyright Healthcare Quality Improvement Partnership 2019
7
Key performance indicator 3
Will my surgeon offer the type of operation recommended by NICE?
Definition: Does the patient receive the type of orthopaedic procedure that is recommended for their type of fracture in NICE CG124? NICE CG124 and NICE QS16 place great emphasis on the operation and implant that should be offered for different fracture types, reflecting both the numbers of trials which have been performed and the potential cost of some types of implant. Clinical teams should review trends in surgical aspects of performance using their surgery run charts (see chart on right), and the online KPI 3 table which summarises how well each unit is meeting the full set of NICE recommendations. In 2018 we saw further improvement in rates of arthroplasty cementing (91.4%, compared with 88.9% for 2017) and use of nails for sub-trochanteric fractures (89.8% compared with 86.5%). Recent work using NHFD data on over 80,000 patients questioned the safety of expensive intra-medullary nails for trochanteric fractures (Whitehouse et al 2019). In 2018 it is encouraging that our sliding hip screw (SHS) run chart suggests use of SHS for the more stable A1/A2 (AO classification) types of trochanteric fractures to have stopped falling (79.2%, compared with 78.8% for 2017). NHFD promotion of NICE CG124 may have helped reverse a previous drift towards use of costly nails. Compliance with NICE guidelines is poorer in respect of total hip replacement (THR) for displaced intracapsular fracture. Such patients make up less than 10% of
all patients in the NHFD so this shortfall has a relatively small impact on the final KPI 3 but this area remains contentious. In 2018 only a third (33.4%) of patients who NICE views as eligible received THR, but this figure represents a further improvement, and is significantly better than the 31.4% we reported for 2017. In 2017 an update to NICE CG124 confirmed the cost-effectiveness of THR in appropriate patients. The question of which patients should receive THR has previously been examined using NHFD data (Perry et al 2016). This identified unacceptable factors such as a patient’s socioeconomic status as affecting their chances of being offered THR, but also highlighted huge variation in provision of THR in different hospitals. This was still apparent in 2018 when this figure ranged from 5–63% in different units.
This ‘caterpillar plot’ (see chart on left) identifies 21 units (12%) where the proportion of eligible people who received THR was significantly below the national average. Teams should examine the online THR table. If below average performance is highlighted they should look for ways to improve access to THR. Early identification of
eligible patients and regular availability of trained hip arthroplasty surgeons will help improve rates of prompt THR, perhaps using a group messaging mobile phone app to aid identification of appropriate surgeons. This subject clearly warrants further scrutiny and the NHFD is now collaborating with the National Joint Registry (NJR) to share and learn from our complementary perspectives on this controversial aspect of hip fracture surgery.

Copyright Healthcare Quality Improvement Partnership 2019
8
Understanding hemiarthroplasty usage
Half of people with hip fractures sustain displaced intracapsular fractures, and since most are not ideally suited for total hip arthroplasty, hemiarthroplasty remains the commonest operation recorded by the NHFD. Hemiarthroplasty implant costs amount to over £10.6 million per year in England alone (GIRFT 2019), but these are not recorded in the NJR. In this year’s NHFD facilities survey we therefore asked hospitals to indicate the types of implant that they ‘usually’ and ‘occasionally’ use (see chart below).
Despite NICE recommendations, seven units (4%) reported only or predominantly using uncemented types of implant. The remaining 96% listed cemented implants as their prosthesis of choice, but with huge variation across the country. Implant choice has major cost implications; an area of great interest to ‘Getting It Right First Time’ (GIRFT). The table below sets the commonest hemiarthroplasty stems that units reported using against GIRFT’s figures for the prices they might be paying.
The pie charts above illustrate the huge variation in routine practice between hospitals. A more than fourfold difference between the cheapest cemented monoblock stem and uncemented modular stem would equate with a cost difference of over £90,000 per year for an average sized hospital. A recent study showed how this variation in practice is not reflected in clinical benefit (Sims et al 2019), and hospitals should review their hemiarthroplasty implant inventory accordingly.

Copyright Healthcare Quality Improvement Partnership 2019
9
Key performance indicator 4 Will I be able to get out of bed by the day after my operation? Definition: Is the patient recorded to have been
successfully ‘mobilised’ out of bed by the day after that of their operation? Prolonged bed rest compromises the dignity of older people and those with frailty. It also increases their risk of delirium, thromboembolism, hospital acquired infection and pressure damage; as well as leading to loss of muscle strength and compromising their rehabilitation potential.
It was therefore a concern that our 2017 collaboration with the Chartered Society for Physiotherapy (CSP) in the national Physiotherapy Hip Fracture Sprint Audit (PHFSA) found patients to be spending 3 days in bed after a hip fracture (see chart below) – half of this after an operation, the purpose of which was to allow patients to get up.
Rates of successful mobilisation varied considerably between units in 2018, with some reporting that all patients were able to stand, or be hoisted, from bed by the day after surgery. The figures for units in England ranged 36–100%, 55–98% in Wales, and 78–95% in Northern Ireland.
High rates of successful mobilisation in some units suggest effective working and collaboration between physiotherapists and the rest of the multidisciplinary team.
The PHFSA showed that a failure to get up was more often due to low blood pressure, poor pain control or confusion, rather than a lack of physiotherapist input. Such factors can only be addressed with a multidisciplinary approach, and it is encouraging that this year’s NHFD facilities survey reports physiotherapists now routinely attend clinical governance meetings in 88% of units, compared with just 63% reported during PHFSA in 2017.
The online KPI 4 table and ‘caterpillar plot’ above identifies 52 units (30%) with performance that was significantly below the national average, with large numbers of patients failing to mobilise promptly. These units will wish to examine the reasons underpinning this.
From January 2020 the NHFD will introduce a new question in our dataset, asking clinical teams to identify and document the main reason why an individual patient is unable to get up by the day after surgery. This is intended to encourage multidisciplinary collaboration between surgeons, anaesthetists, orthogeriatricians, nurses and therapists that is necessary if patients are allowed to make a prompt start in their rehabilitation.
Patients are still spending nearly three days in bed after a hip fracture

Copyright Healthcare Quality Improvement Partnership 2019
10
Key performance indicator 5
Will you check that I do not become confused after my operation?
Definition: Did the patient receive a 4A test (4AT) in the week after operation, that indicates that they do not develop postoperative delirium? Delirium is the most common complication of any surgery and anaesthesia in older people and affects a quarter of people with hip fracture (2018 NHFD report).
Since 2017 the NHFD has championed the use of the 4AT (Bellelli et al 2014). 4AT (see image on left) is a quick and simple examination of the four components of delirium, making routine screening possible and helping to improve our understanding of a complication that often dominates patients’ hospital stay and delays recovery. Delirium can also cause huge distress
to them, to other patients, to their families and to the whole ward team. In 2018 over 60,000 patients (92%) were offered a 4AT in the week after surgery for hip fracture, with a figure of 96% in England, (compared with 43% in Wales and 53% in Northern Ireland) showing the effectiveness of BPT in incentivising this assessment, as 4AT testing was introduced into BPT criteria in April 2017.
Local teams should examine their own figures using the assessment benchmark table. The proportion of patients recorded as ‘delirium-free’ (4AT score under 4) varied from 0% in four units in Wales where 4AT was still not being used in 2018,
to a surprisingly high figure (over 90%) in a few units which should review how the test is being performed. Postoperative delirium is very common among people with dementia, as well as among those noted to have cognitive impairment when they first present to hospital. For this reason, screening using the Abbreviated Mental Test (AMT) is a key
element of the approach to preoperative assessment that has been promoted by NHFD and BPT. Identification of cognitive impairment (an AMT score of less than 8 out of 10) should encourage teams to adapt their approach and employ measures to minimise the risk of delirium (suggested by a 4AT score of 4+) (SIGN 2019; Marcantonio et al 2001). Development of delirium will reflect factors as diverse as the ward environment, pain control, and perioperative surgical and anaesthetic management. KPI 5 serves as a useful measure of the overall quality of acute hip fracture care. For this reason, we would encourage teams to use the 4AT as part of their care bundle on the day after surgery, and from January 2020 the NHFD will be asking clinical staff to record the date on which the 4AT was performed. This will allow KPI 5 to be adjusted to capture the proportion of patients demonstrated to be free of delirium in the 72 hours after operation, which we believe will encourage sites to test for delirium earlier and make this KPI a more effective measure of the overall quality and outcome of acute perioperative care.
NHFD has championed the provision of nerve blocks as a way of improving patients’ pain after
surgery, and our run chart has documented progressive improvement in the proportion of people
being offered this following both general and regional anaesthesia. In 2017 we recorded marked
further improvement, with figures of 70.8% (cf. 64.2% in 2016) following general anaesthesia and
50.1% (cf. 40.2% in 2016) following spinal anaesthesia (see chart below).
Since the start of 2017 we have also collected data on the use of nerve blocks before surgery – in the
emergency unit and in the orthopaedic ward. It is very encouraging that provision of such nerve
blocks increased from 36.0% to 47.3% just over the course of 2017, as this is a very effective means
of reducing fracture pain, and avoiding excessive reliance on powerful painkillers such as opiates
which carry significant side effects in this group of patients.
Delirium assessment
Delirium is the commonest complication of surgery and anaesthesia in older people.
NHFD have adopted the 4A test (4AT) as the
basis for key performance indicator 5. This
quick and simple examination of the four key
components of delirium (see box) will
encourage routine screening for delirium and
improve our understanding of a complication
that can dominate patients’ hospital stay and
recovery (Bellelli et al 2014).
In 2017 the 4AT was completed in the week
after surgery in 90% of all patients.
In England, the use of 4AT is incentivised by
best practice tariff and 95.3% of patients were

Copyright Healthcare Quality Improvement Partnership 2019
11
Key performance indicator 6
Will you check that I get back to live in my usual home?
Definition: Is the patient known to have been discharged to their original home or care home, or to be there at 120 day follow-up?
Over 2018 there has been a gradual fall in mean acute hospital length of stay (LOS) to 15.1 days and of mean trust LOS to 19.5 days (see run chart below), from the equivalent figures of 15.6 days and 20 days we reported for 2017.
This may appear encouraging for those organising and funding acute hospital care, but the 2016 NHFD report showed that a substantial part of rehabilitation is provided in community trusts and care homes. The LOS and costs associated with this are uncertain, particularly in England where they are poorly captured in Hospital Episode Statistics (HES) data.
Different patients may have very different perspectives on how quickly they would like to be discharged from hospital following a hip fracture. Some wish to return home as soon as possible, resenting time spent in hospital, particularly if they do not feel they are receiving the intensive rehabilitation they need. Others may be fearful of returning home, having lost confidence after their fall, and may need prolonged rehabilitation if they are to successfully return home.
As a result, KPI 6 is focused not on the length, but on the outcome of rehabilitation.
The final outcome of rehabilitation is not apparent from patients’ destination when they leave the acute trust, as for nearly 20% this will be ‘other’: to another acute or community bed (see chart above). For this reason, KPI 6 combines the total number of people returning directly to their original residence with an additional figure – the number of others shown to have returned there by the time of 120-day follow-up.
We found that 69% of people return to their original residence after a hip fracture, but the benchmark table on the NHFD website shows considerable variation, with KPI 6 ranging from 37–91% in different hospitals.
The lower end of this range will include those units which transfer a significant proportion of their patients to rehabilitation closer to home or in another trust, but which do not follow them up to see if they return to their original residence from there; or whether patients are at home at the time of 120-day follow-up.
Such units can improve their understanding of their patient’s outcome by routinely enquiring about their patient’s progress after transfer to rehabilitation. These results can be recorded in the 120day follow-up section on the database, and updated with additional people who have returned home by 120-day follow-up. We have created a template sites can use when developing their own follow-up processes.
NICE CG124 specifically recommended that Hip Fracture Programmes should have responsibility for the whole pathway of patients’ recovery. This is why units will need to follow-up their patients if they are to perform well against KPI 6.

Copyright Healthcare Quality Improvement Partnership 2019
12
Using the NHFD to support quality improvement The NHFD does not just report on local and national performance but is designed as a platform to facilitate local quality improvement (QI) projects. An example is the recent Hip Fracture Quality Improvement Programme (HipQIP) ‘Scaling Up’ project; a multicentre QI collaborative which was funded by the Health Foundation and led by Northumbria Healthcare NHS Foundation Trust. Five units were recruited (Northumbria Specialist Emergency Care Hospital, Gloucester Royal Hospital, Weston General Hospital and Great Western Hospital, Swindon) with James Cook University Hospital in Middleborough acting as an ‘exemplar site’, as it had previously piloted similar QI work.
HipQIP set out to provide high quality hip fracture care using pathways to ensure consistent care. Interventions included better pain management, access to nerve blocks in the Emergency Department, and appointing dedicated ward-based nutritional assistants at each site to improve nutritional support in hospital.
Peer reviews led by the BOA were provided to each site and were particularly helpful in examining baseline site performance, and in gaining essential support, including from trust executives. This work ran over 2 years and its impact was monitored using custom NHFD run charts, with its outcomes evaluated in an independent report by the NHFD team.
30-day mortality was initially 9.2%, in the four HipQIP units and in 16 matched control sites. Over the project’s 2 years this figure fell to just 5.8% (compared with 7.7% in the 16 control sites. See chart above). The four HipQIP sites recorded 119 fewer deaths than would have been expected at the baseline figure of 9.2%, and 77 fewer than would have occurred at the mortality achieved in the 16 control sites. Significantly more people made a good recovery and were able to return home – an outcome that many older people and those with frailty consider more relevant than merely surviving after hip fracture (Salkeld et al 2000).
‘Each year, an additional 119 patients successfully returned to their own home as a result of the HipQIP work.’
NHFD evaluation report 2019

Copyright Healthcare Quality Improvement Partnership 2019
13
Understanding variation in performance
The ‘weekend effect’ and variation in the quality and outcome of care remains a contentious issue in the UK and has previously been examined in research work using NHFD data (Sayers et al 2017, Neuburger et al 2018).
Best practice is for patients to receive surgery within 36 hours of presentation, but local factors underpinning variation in achieving this are complex.
To help local teams examine this issue further we have developed ‘heat maps’, an anonymised example of which is shown opposite, of variations in time to surgery by day of the week, and across the hours of each day.
These online heat maps use descriptive statistics to profile the association between day and time of presentation and the probability of patients receiving prompt surgical treatment in each hospital.
Using data from 2017 we found 57% of all patients to be admitted during 08:00–23:59 Monday to Friday, with 17% admitted during 00:00–07:59 Monday to Friday, and 26% admitted on Saturdays or Sundays.
We found that 70% of patients received surgery within 36 hours, but that this figure ranged from just 60% (on Fridays and Saturdays at 20:00–23:59), to as high as 77% (Monday to Friday at 04:00–07:59).
Patients were significantly less likely to receive surgery within 36 hours if they presented on a Friday during 16:00–03:59, or Saturday during 08:00–03:59 or on most days between 20:00–03:59.
Teams in individual hospitals should examine the online heat maps for their own performance in 2017, as this will stimulate discussion and help local clinical teams and managers to plan the staffing and organisation of intaking trauma teams, and the orthopaedic, anaesthetic and theatre staff who will provide their operation.
Percentage of patients who received surgery within 36 hours <50% 50-74% 75%+
NATIONAL 08-11 12-15 16-19 20-23 00-03 04-07 Total
Monday
Tuesday
Wednesday
Thursday
Friday
Saturday
Sunday
Total
Hospital A 08-11 12-15 16-19 20-23 00-03 04-07 Total
Monday
Tuesday
Wednesday
Thursday
Friday
Saturday
Sunday
Total
Hospital B 08-11 12-15 16-19 20-23 00-03 04-07 Total
Monday
Tuesday
Wednesday
Thursday
Friday
Saturday
Sunday
Total
Hospital C 08-11 12-15 16-19 20-23 00-03 04-07 Total
Monday
Tuesday
Wednesday
Thursday
Friday
Saturday
Sunday
Total
Hospital D 08-11 12-15 16-19 20-23 00-03 04-07 Total
Monday
Tuesday
Wednesday
Thursday
Friday
Saturday
Sunday
Total
Hospital E 08-11 12-15 16-19 20-23 00-03 04-07 Total
Monday
Tuesday
Wednesday
Thursday
Friday
Saturday
Sunday
Total

Copyright Healthcare Quality Improvement Partnership 2019
14
Mortality
Since 2007 the NHFD has reported a steady improvement in mortality in the 30 days after hip fracture. This fall continued in 2018, with 4,007 people (6.1%) dying in the 30 days following a hip fracture. This figure represents a one in eight fall from the 6.9% we reported for 2017, and implies that 564 fewer people died within a month of breaking their hip in 2018.
Seasonal variation The NHFD has previously demonstrated seasonal variation in the incidence of hip fracture (Johansen et al 2016) and this is reflected in our mortality run chart (below).
Over the seven years since 2011 the NHFD recorded a total of 7,443 deaths within 30 days of hip fracture in the three summer months (June, July, August), but 9,714 in the three winter months (December, January and February).
This equates with 325 (30%) more people dying in the winter months each year.
This finding is partly explained by the seasonality of hip fracture; 1,250 (8%) more people were recorded to have presented during the winter months each year.
On average people spend over 20 days in hospital, so this additional workload will compound the stresses on hospital services of the Christmas and New Year period.
Increased numbers of people present with hip fracture at this time of year, but during the winter months they are also at increased risk of dying after this injury.
Over these seven years the NHFD recorded that 7.5% of people died within 30 days. This figure varied significantly across the months of the year; ranging from just 6.7% in July to a peak of 8.7% in January (see figure below).
Such findings must be taken into consideration when planning and organising trauma and orthogeriatric services. If we are to try and avoid the 325 additional deaths which occur each winter then trauma units must anticipate the additional numbers and needs of people who will present during the winter months.

Copyright Healthcare Quality Improvement Partnership 2019
15
Casemix-adjusted 30-day mortality
A total of 66,140 patients from all 175 trauma units in England, Wales and Northern Ireland were included in this year’s analysis (see funnel plot on page below).
Our casemix-adjusted analysis of 30-day mortality uses externally validated Civil Registration Data from NHS Digital, and Business Services Organisation (BSO) in Northern Ireland, as previously described (Tsang et al 2017). Each year the casemix adjustment process is refined and the model coefficients are updated to reflect changes in the data reported by hospitals.
Casemix factors such as age and sex (see chart below) have a profound effect on mortality. Other factors (fracture type, anaesthetic grade, pre-fracture mobility and residence are not so reliably recorded and poor quality data still led to several units appearing as outliers as a result of data that suggested an unusually healthy population.
Our theatre data capture sheet is designed to help theatre staff ensure the quality of key casemix data, but some units still reported improbably high numbers of patients as American Society of Anaesthesiologists (ASA) grades 1 or 2.
Units’ crude and adjusted mortality figures are detailed in the outcome benchmark tables. A marked difference between crude and adjusted mortality may suggest poor quality data for the six casemix variables. In this case, clinical leads should log into the database and examine online reports of their data quality. Local clinical leads are responsible for checking the quality of data they submit. This will avoid
poor quality data creating a misleading picture that might adversely affect their team’s morale and the local population’s confidence in their hip fracture service.
All hospitals with mortality rates above the 95% control limits were contacted and managed according to our outlier policy. Where increased mortality suggests poor performance we recommend sites consider requesting a BOA peer review.
It is interesting to note that only one of the English trusts identified as an outlier for either high or low hip fracture mortality had also been identified in Summary Hospital-level Mortality Indicators (SHMIs) for the same period.
This suggests that NHFD outlier status is likely to be a result of the quality of the care provided by trauma services teams, rather than a reflection of trust-wide factors.
Hospitals with increased 30-day mortality
Last year we identified eight hospitals as ‘outliers’ with casemix-adjusted mortality rates above the upper 99.8% (≈3SD) control limit. Seven have improved, so only one remained an outlier for 2018:
• Morriston Hospital, Swansea (MOR) reported an adjusted mortality of 10.8% in 2017. In 2018 a crude mortality of 8.3%, and poor data quality meant that the unit’s adjusted mortality remained above the 99.8% control limit at 10.0%.
Seven other units were identified as outliers for 2018. In four cases this reflected high figures for both crude and adjusted mortality:
• Scunthorpe General Hospital (SCU) had a crude mortality of 10.4%, but missing ASA data contributed to a casemix-adjusted figure of 11.1%.
• University Hospital of Wales, Cardiff (UHW) reported a crude mortality of 9.5%, with a figure of 9.6% after adjustment.
• County Hospital, Hereford (HCH) reported a crude mortality of 9.2%, but poor ASA and mobility data quality exacerbated this appearance, giving an adjusted figure of 12.9%.
• Manor Hospital, Walsall (WMH) had a crude mortality of 9.1%, which adjusted to 11.3% as a result of poor-quality mobility data.

Copyright Healthcare Quality Improvement Partnership 2019
16
In three other units poor-quality data contributed to casemix-adjusted figures above the 99.8% (≈3SD) limit for mortality in 2018:
• Hull Royal Infirmary (HRI) reported a crude mortality of 8.8%, but missing ASA and residence data led to an adjusted figure of 10.9%.
• George Eliot Hospital, Nuneaton (NUN) had a crude mortality of 8.5% that adjusted to 10.8% as a result of poor-quality pre-fracture mobility data.
• Southport and Formby District General Hospital (SOU) had a crude mortality of 8.7% which adjusted to 11.6% as a result of poor-quality ASA and pre-fracture mobility data.
Sixteen other hospitals had adjusted mortality above the upper 95% (≈2SD) control limit. Observations at this significance level should be interpreted with caution. In any analysis of 175 units some will fall outside such control limits by chance, as a result of expected statistical variation.
• Barnet General Hospital (BNT); Basildon Hospital (BAS); Kings Mill Hospital, Mansfield (KMH); James Paget Hospital, Great Yarmouth (JPH); Nevill Hall Hospital, Abergavenny (NEV); Norfolk and Norwich Hospital
(NOR); Royal Hampshire County Hospital, Winchester (RHC); Queen Elizabeth Hospital, Edgbaston (QEB); and Whiston Hospital, Merseyside (WHI) had adjusted mortality above the 95% limit.
• Barnsley District General Hospital (BAR) had adjusted mortality above the 95% control limit; in part reflecting missing ASA data.
• Luton & Dunstable Hospital (LDH) had adjusted mortality above the 95% control limit; in part reflecting poor mobility data.
• East and North Herts Hospital (ENH); Northwick Park Hospital (NPH); John Radcliffe Hospital, Oxford (RAD); Royal Lancaster Infirmary (RLI); and University Hospital Coventry (UHC) all reported crude mortality of below 8%, but poor mobility or ASA data quality led to adjusted figures above the upper 95% limit.
Hospitals with low 30-day mortality
We identified two hospitals as positive ‘outliers’ with adjusted mortality below the lower 99.8% (≈3SD) limit – a finding consistent with these units’ excellent performance over a number of years:
• Queen Alexandra Hospital, Portsmouth (QAP), reported a crude mortality of 3.5%, and of just 3.3% following casemix adjustment.
• Royal United Hospital, Bath (BAT), reported a crude mortality figure of 3.6% which fell to 2.9% after casemix adjustment, as the result of an unusually high number of people recorded with very poor ASA grades.
In addition, nine hospitals (Bronglais Hospital, Aberystwyth (BRG); Craigavon Area Hospital (CRG); Royal Derby Hospital (DER); King's College Hospital (KCH); Maelor Hospital, Wrexham (WRX); North Devon District Hospital (NDD); Royal Victoria Infirmary, Newcastle (RVN); Stepping Hill Hospital (SHH); and University Hospital of North Staffordshire (STO)) had adjusted 30-day mortality in 2018 that was better than the lower 95% limit. Another two units (Queen Elizabeth Hospital, King’s Lynn(QKL); and Saint Helier Hospital, Carshalton (SHC)) achieved excellent figures, though with less reliable data for their patients’ prior mobility or ASA grade.
Copyright Healthcare Quality Improvement Partnership 2019
17
Developing real time mortality outlier run charts
The availability of NHFD run charts means that the findings of this mortality analysis should not come as a surprise to the units identified as outliers from the funnel plot; their crude mortality figures have been available to them for the last year.
However, two factors make it difficult for local clinical leads to be confident of their performance:
• A number of units continue to be identified as having poor data quality in the NHFD annual report. This could have been identified by comparing casemix with the typical distribution of ASA and other figures described in the website reports section, but time-pressed staff struggle to do this.
• It is difficult to know whether a mortality run chart that is above the national average is significantly abnormal for a unit of any particular size.
We have been working with the University of Oxford’s Nuffield Department of Orthopaedics, Rheumatology and Musculoskeletal Sciences (NDORMS), to develop a completely new approach to identification of mortality outliers.
In 2020 we plan to launch new casemix-adjusted mortality run charts, (an anonymised example of which is below).
Like our current mortality run chart, these will run a few months in arrears to allow linkage to mortality data and will update quarterly. The new charts will also
include a casemix-adjusted mortality line alongside the existing crude mortality line.
The difference between crude and adjusted lines will reflect the impact of local casemix data, and a significant difference should alert local teams to potential issues with their data quality and completeness – allowing them to correct this.
The new run charts will also include 95% and 99.8% control limits, the width of which will reflect the number of cases being managed by that unit.
If a unit’s casemix-adjusted mortality moves outside these limits, local teams will therefore be able to see this and respond immediately, rather than waiting for the results of the NHFD’s mortality outlier analysis the following summer.
Regional variation
In other work with NDORMS we have linked NHFD and HES data to explore geographic variation in the outcome for surgery in different fracture types. There was little variation in outcome for intracapsular fracture, but we did find significant variation for trochanteric fractures: East of England had the highest percentage of deaths within 30 days (8.5%) and the North East the lowest (5.9%).
The extent to which this reflects regional variation in approaches to medical assessment, anaesthesia and other aspects of hip fracture warrants further investigation, especially given the regional nature of training programmes.
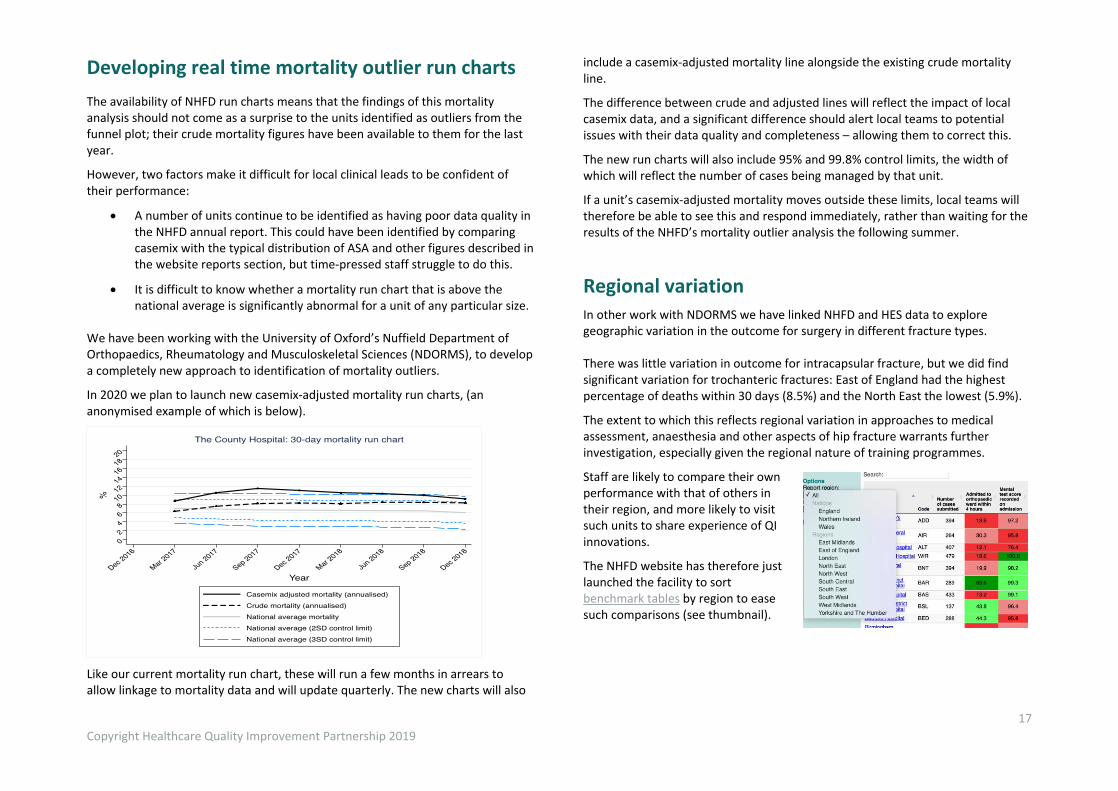
Staff are likely to compare their own performance with that of others in their region, and more likely to visit such units to share experience of QI innovations.
The NHFD website has therefore just launched the facility to sort benchmark tables by region to ease such comparisons (see thumbnail).

Copyright Healthcare Quality Improvement Partnership 2019
18
Secondary prevention The last two years have seen a slight reduction in the use of oral bone protection medication, both among patients admitted with hip fracture and as secondary prevention started during their stay – in part reflecting increased use of injectable treatments (see table below).
Action taken 2016 2018
Assessed but no bone protection medication needed or appropriate 21.6% 21.5%
Oral medication - continued from pre-admission 7.3% 6.5%
- started on this admission 42.4% 40.3%
Injectable medication - continued from pre-admission 0.9% 1.1%
- started on this admission 7.4% 8.7%
No treatment, pending DXA scan or bone clinic assessment 17.4% 18.6%
No assessment or no action taken 2.9% 3.2%
Our current approach to recording bone treatment does not capture the actual drugs being used and cannot track how these change between admission, discharge and follow-up.
From January 2020 we plan to improve the coding of different types of bone protection in our new dataset in a way that will correspond to that used by our sister audit the Fracture Liaison Service Database (FLS-DB) and avoid duplication of data entry for the two audits.
Patient safety
In 2018 we redesigned our third audit the National Audit of Inpatient Falls (NAIF) – moving from the previous approach of a ‘snapshot’ audit every two years to a model of continuous data collection.
NAIF is now focused on patients whom the NHFD identifies as having sustained a hip fracture following an inpatient fall in any setting: acute hospitals, mental health units and community hospitals.
Data collection for the first phase of NAIF has now been completed and the data will be reported on in the 2019 annual report, due for release in March 2020.
The second phase of NAIF will be launched in January 2020 – hospital Falls Teams will collect additional data to define preventative actions taken or not taken, circumstances surrounding the fall, and actions taken after the fall (NICE quality standards); and developing effective approaches to critical incident reviews.
Patient experience
This annual report focuses on a set of key performance indicators that all reflect the patient priorities described in the patient story with which it began. The RCP has established a Patient and Carer Panel, managed by the Royal Osteoporosis Society with members of the public with personal and family experience of fragility fracture, falls or hip fracture who are embedded in the three national audits.
They have advised on our current NHFD patient report, ‘12 Questions: My Hip Fracture Care’, which seeks to encourage patients and those close to them to ask important questions of the trauma teams looking after them, so as to better understand the care they are likely to receive. Next year we plan to revise and update this alongside other information and resources we provide to patients and those close to them. Additionally, in our 2020 facilities survey we plan to question sites about the patient resources and carer support that they are currently offering.
Improvement toolkits
The NHFD team have developed an online improvement repository, consisting of a library of case studies on improvement plans, how they were implemented and whether they were effective. In addition, a series of short videos are available to guide users on how to use the public run charts and benchmark tables.
Impact of the NHFD
In July 2019 we asked clinical staff in different trauma units to comment on the impact of NHFD participation on their services and the patient care they provided.
Their comments illustrate how much people have learned from the NHFD, and how it has supported local service development and quality improvement.
Copyright Healthcare Quality Improvement Partnership 2019
19
References and bibliography
A full list of the references, NHFD documents and previous annual reports cited in the 2019 annual report can be accessed here.
National Hip Fracture Database report 2019
Citation for this report: Royal College of Physicians. National Hip Fracture Database annual report 2019. London: RCP, 2019. This report was prepared by the National Hip Fracture Database team: Lara Amusan, FFFAP programme manager, RCP Tim Bunning, Crown Informatics, RCP Elizabeth Fagan, NHFD project manager, RCP James Hannaford, FFFAP programme coordinator Sam Hawley, epidemiologist and statistician, University of Oxford Dominic Inman, NHFD clinical lead, orthopaedic surgery Antony Johansen, NHFD clinical lead, orthogeriatrics Andrew Judge, professor and senior statistician, University of Oxford Ifeoma Onyekwulu, NHFD programme coordinator, RCP Anjali Shah, epidemiologist, University of Oxford Data analysis by Nuffield Department of Orthopaedics, Rheumatology and Musculoskeletal Sciences, University of Oxford www.ndorms.ox.ac.uk NHFD data collection webtool and performance tables are provided by Crown Informatics www.crowninformatics.com Falls and Fragility Fracture Audit Programme The NHFD is run by the Care Quality Improvement Department (CQID) of the Royal College of Physicians (RCP). It is part of the Falls and Fragility Fracture Audit Programme; one of three workstreams alongside the Fracture Liaison Service Database (FLS-DB) and National Audit of Inpatient Falls (NAIF). Healthcare Quality Improvement Partnership The National Hip Fracture Database is commissioned by the Healthcare Quality Improvement Partnership (HQIP) as part of the National Clinical Audit and Patient Outcomes Programme (NCAPOP). HQIP is led by a consortium of the Academy of Medical Royal Colleges, the Royal College of Nursing, and National Voices. Its aim is to promote quality improvement in patient outcomes, and to increase the
impact of clinical audit, outcome review programmes and registries on healthcare quality in England and Wales. HQIP commissions, manages and develops the National Clinical Audit and Patient Outcomes Programme (NCAPOP), comprising around 40 projects covering care provided to people with a wide range of medical, surgical and mental health conditions. The programme is funded by NHS England, the Welsh Government and, with some individual projects, other devolved administrations and crown dependencies www.hqip.org.uk/national-programmes The Royal College of Physicians The Royal College of Physicians is a registered charity that aims to ensure high-quality care for patients by promoting the highest standards of medical practice. It provides and sets standards in clinical practice, education and training, conducts assessments and examinations, quality assures external audit programmes, supports doctors in their practice of medicine, and advises the government, the public and the profession on healthcare issues. 11 St Andrews Place, London NW1 4LE www.rcplondon.ac.uk Registered Charity No. 210508
Copyright All rights reserved. Applications for the copyright owner’s written permission to reproduce significant parts of this publication (including photocopying or storing it in any medium by electronic means and whether or not transiently or incidentally to some other use of this publication) should be addressed to the publisher. Brief extracts from this publication may be reproduced without the written permission of the copyright owner, provided that the source is fully acknowledged. Copyright © Healthcare Quality Improvement Partnership 2019 ISBN: 978-1-86016-769-0 eISBN: 978-1-86016-770-6
Get in touch For further information please contact us – we want to hear from you.
www.nhfd.co.uk [email protected] @RCP_FFFAP