Embed Size (px)
Citation preview

My precious! The location and diffusion of
scientific research: evidence from the
Synchrotron Diamond Light Source∗
Christian Helmersa,b† Henry Overmanb
a Universidad Carlos III de Madrid
b SERC, LSE
July 15, 2013
ABSTRACT
We analyze the impact of the establishment of a GBP 380 million basic scientific research
facility in the UK on the geographical distribution of related research. We investigate whether
the siting of the Diamond Light Source, a 3rd generation synchrotron light source, in Oxfordshire
induced a clustering of related research in its geographic proximity. To account for the potentially
endogenous location choice of the synchrotron, we exploit the availability of a ‘runner-up’ site
near Manchester. We use both academic publications and patent data to trace the geographical
distribution of related knowledge and innovation. Our results suggest that the siting of the
synchrotron in Oxfordshire created a highly localized cluster of related scientific research.
KEYWORDS: Synchrotron, location, innovation, patents
JEL Classification: R12, R58, O31, O38
∗We thank Zhe Sun and Wenjie Wu for excellent research assistance. We thank seminar/session
participants at UC Berkeley, UC Merced, EPFL Lausanne, KU Leuven, Stanford, Santa Clara, the
University of Wurzburg, the SERC Conference 2011 at LSE, the Royal Economic Society Conference
2013, a workshop at Universitat de Barcelona, the Technology Transfer Conference 2011, and the
7th Meeting of the Urban Economics Association for their useful comments and suggestions. We are
particularly grateful to Walter Luyten for advice on the data construction.†Corresponding author: [email protected]

1 Introduction
We investigate the impact of the establishment of a GBP 380 million scientific research
facility in the UK on the geographical distribution of the knowledge created by the
facility. The Diamond Light Source, a so-called 3rd generation synchrotron light source,
represents the single largest investment in research infrastructure in the modern history
of the UK. The facility, which started operating in January 2007, is one of only 22 3rd
generation synchrotron facilities worldwide and enables researchers to conduct novel
scientific experiments that are likely to shift the knowledge frontier in a number of
scientific disciplines.1
While our analysis provides evidence on the impact of the establishment of Diamond
on research and innovation, we are primarily interested in the geographical aspects of
knowledge creation and diffusion. That is, we investigate whether the location choice
of the Diamond Light Source has impacted on the geographical distribution of research
in relevant scientific fields. The fundamental research question that we address in this
way is whether the establishment of basic scientific research infrastructure, that is in-
herently indivisible, leads to a geographical clustering of related research in proximity
to the infrastructure or whether the benefits of such scientific facilities spread across the
country independently of its location. This, so far under-researched, question is particu-
larly relevant with regard to ‘lumpy’, long-term, large-scale infrastructure investments
such as a synchrotron. The analysis, therefore, also sheds light on the formation of
research clusters and the implications for the geographical distribution of innovation.
In general, answering this question and establishing a causal effect of location choice
on some outcome variable of interest is difficult due to the endogeneity inherent in loca-
tion choice. However, in the case of the Diamond Light Source, we are able to address
this problem by exploiting the availability of a ‘control’ location against which we can
compare the ‘treated’ location. Diamond was built at the Harwell Science and Inno-
vation Campus at the Rutherford Appleton Laboratory in Didcot in Oxfordshire. But
there had previously been concrete plans to locate Diamond about 215 kilometers away
in another research hub in Daresbury near Manchester. The final decision to locate
Diamond in Oxfordshire was preceded by a heated and highly controversial political
debate on the siting. Hence, by comparing the change in scientific research conducted
in proximity to the location where Diamond was constructed and the ‘runner-up’ lo-
cation (conditional on time-invariant unobservable as well as time-varying observable
location-specific characteristics), we avoid confounding spatial effects caused by the
1There are a number of other 3rd generation synchrotron facilities in Europe including the EuropeanSynchrotron Radiation Facility (ESRF) in Grenoble, Soleil in Paris, and more recently ALBA, inCerdanyola del Valles, Spain. See http://www.lightsources.org
2

establishment of Diamond with those caused by unobserved, time-varying, location-
specific characteristics.2
Our main focus is on tracing the geographical distribution of relevant research using
scientific publications. We provide some additional evidence of the impact on patents to
assess potentially broader effects on innovation. These two codified forms of knowledge
are particularly suitable measures of research output and innovation in the context
of our analysis given the nature of the scientific research enabled by Diamond. First,
research conducted at the facility can be regarded as ‘cutting edge’, which makes it likely
to result in findings publishable in scientific academic journals and capable of meeting
the ‘new-to-the-world’ threshold for patentability. Second, research at Diamond focuses
on highly codifiable scientific disciplines such as structural biology, physics, chemistry,
materials science, and engineering which makes it likely to result in patentable subject
matter.
Our findings suggest that the establishment of Diamond in Didcot resulted in strong
clustering of related research near to the facility. We find a statistically significant and
economically important increase in academic publications with our main set of results
indicating an increase in our measure of scientific output of about 6 standard deviations
within a 25km radius of Diamond. This effect applies to research that is generated from
experiments carried out directly at Diamond as well as related research that does not
use the synchrotron facility. Our identification startegy allows us to interpret this as
evidence in favor of local externalities, that is, research output in proximity to Diamond
increased more following Diamond’s opening than it would have had the synchrotron
been located elsewhere. Our results show that this strong, positive effect does not
extend beyond the direct proximity to Diamond. We demonstrate that this result is
robust to a number of variations of our empirical specification as well as changes in the
construction of our measures of research input and output.
Our results contribute to the literature on the importance of agglomeration exter-
nalities produced by indivisible scientific research facilities for science and innovation.
This literature focuses overwhelmingly on externalities between companies (Jaffe et
al., 1993; Audretsch and Feldman, 1996a) or from university to private industry (Jaffe,
1989; Kantor and Whalley, 2009; 2012). We offer for the first time empirical evidence on
the importance of local externalities created by basic scientific research infrastructure
in forming clusters of scientific research.
This paper is organized as follows. Section 2 provides detailed information on
Diamond and its location choice. Section 3 outlines the empirical approach taken to
identify the impact of the establishment of Diamond. Section 4 describes the data used
2Since Diamond was placed in an existing cluster, the challenge is in separating any possible cluster-related externalities from the (local) externalities created by Diamond.
3

in the analysis while Section 5 discusses the results. Section 6 presents a number of
robustness checks and Section 7 concludes.
2 Diamond Light Source
2.1 UK’s 3rd generation synchrotron
The Diamond Light Source is a synchrotron facility. Synchrotron facilities are circular
particle accelerators that produce beams of x-rays, infrared and ultraviolet light (see
Figure 1).3 Such synchrotron light is useful to study small objects, such as molecules
and atoms, whose visualization requires light with shorter wavelengths than available
in microscopes.4 Diamond consists of a 561 meter storage ring and has a total floor
area of 45,500 m2.
Diamond is funded by the UK Science and Technology Facilities Council (86%) and
the Wellcome Trust (14%). After the siting decision had been taken in March 2000,
the two-phase construction of Diamond was initiated in early 2003. In Phase I, the
buildings for the synchrotron facility were constructed and the first seven beamlines
established. The cost of Phase I is GBP 263 million. User operations on the beam lines
constructed in Phase I began in January 2007. In Phase II, another 15 beamlines are
currently being added to the facility, requiring another GBP 120 million in investment.
The different beamlines are optimized for specific research applications. There are
currently 19 operational beamlines at Diamond which are used to conduct experiments
in various fields including condensed matter physics, materials science, biology and
medicine serving both basic and applied research. This provides ample scope for the
creation of new publishable as well as patentable knowledge in a range of applied
scientific fields.
Diamond superseded the existing synchrotron in the UK which was located at the
STFC Daresbury Laboratory near Manchester. The Synchrotron Radiation Source
(SRS), which opened in 1981, was the second synchrotron light source in the UK.
It replaced the UK’s first synchrotron NINA built in 1964 also in Daresbury (NINA
was closed in 1977). Given Diamond’s technical superiority, the SRS became obsolete
and was closed in August 2008. The main difference between SRS – a 2nd genera-
3A synchrotron consists of a large ring-shaped tube into which charged particles are fired from alinear accelerator and in which they are accelerated further. The ring is enclosed by magnets that keepthe particles in the tube ‘on orbit’. The accelerated particles are ejected into a so-called storage ring inwhich they circulate without accelerating further. The continuous movement of the electrons, which iscreated by so-called insertion devices, results in electromagnetic waves, so-called synchrotron radiation.This radiation is captured in beamlines in which the radiation is used for experiments.
4There are three types of experiments that can be conducted at Diamond: (a) X-ray diffraction andscattering, (b) spectroscopy, (c) imaging and microscopy. Each of these techniques is more suitable forspecific experiments.
4

tion synchrotron – and Diamond – a 3rd generation synchrotron – is how synchrotron
light is generated. While 2nd generation synchrotrons rely on dipole bending mag-
nets to produce synchrotron radiation, 3rd generation synchrotrons rely on so-called
undulators/wigglers which cause electrons to wiggle producing more intense, brighter
synchrotron light. This allows higher resolution and improves the synchrotron’s appli-
cability for x-ray microscopy to spectromicroscopy which benefits particular scientific
fields such as crystallography. This suggests that Diamond and the SRS are not com-
plementary but rather that Diamond’s capabilities far outperform the SRS.5
Beamtime is granted after submission of a proposal which also specifies the amount
of time the research team would like to use the facility and the beamline that will
be used.6 Beamtime is allocated to academic users through a scientific peer review
panel and a panel that assesses technical feasibility.7 Beamtime is free for academic
users and corporate users that commit to putting the research results into the public
domain. Private companies wanting to maintain the ownership of any intellectual
property resulting from their work at Diamond may apply for beamtime, but are liable
to a usage fee.8
To facilitate access for researchers, Diamond offers onsite accommodation for its
users. It also provides funding for travel and subsistence for UK academics. Alter-
natively, researchers also have the possibility to use Diamond remotely – users can
send their samples to Diamond where the experiments are then conducted by Diamond
staff which entails some restrictions on the flexibility with which experiments can be
conducted.
2.2 Location choice
Our identification strategy rests on a strong controversy that arose in the siting of
Diamond. Initially, the government had firm plans to site the new synchrotron at the
STFC Daresbury Laboratory next to the existing UK synchrotron. However, the Well-
come Trust suggested that the new synchrotron should be built instead at the Harwell
5Our conversations with scientists that conduct experiments at Diamond confirmed its technicaladvantage over the SRS. Scientists regard Diamond as crucial for their research and report that beforeits existence, they either would have used similar synchrotron facilities abroad, for example in Franceof Switzerland, or they would not have been able to pursue their specific line of research.
6There are three non-proprietary access routes: (a) direct access, where prospective users submitproposals for individual projects that can last for a maximum of 6 months; (b) long term access, whichprovides access for projects for up to 2 years; and (c) block allocation, which allows to pool beamtimeacross different groups.
7The members of the academic peer review panel come from a wide range of UK and Europeanuniversities, research institutions, and private companies. The list of panel members is available onDiamond’s website: http://www.diamond.ac.uk/Home/ForUsers/academics/panel.html
880% of beamtime is allocated to external, i.e., academic and industrial, users. Industrial users canuse only up to 10% of the beamtime for external users.
5

Science and Innovation Campus in Didcot (Oxfordshire) effectively co-locating Dia-
mond with the Rutherford Appleton Laboratory (RAL). According to a range of news
articles, Wellcome believed that “greater scientific benefits would result from a location
close to the existing neutron source [ISIS] and to Medical Research Council units and
the University of Oxford” (Nature, 2 December 1999).9 Hence, the main argument was
to concentrate research facilities in a single location (Didcot was already home to ISIS,
one of the leading pulsed neutron and muon sources worldwide) to strengthen national
centers of excellence in research. Supporters of the Daresbury location, in contrast,
argued that given the expected applicability of Diamond to only a limited number of
scientific disciplines, Wellcome was overstating the importance of geographical proxim-
ity to the so-called Oxford-London-Cambridge Golden Triangle. Instead, they argued
that relocation of staff from the existing synchrotron at Daresbury to Didcot would
represent a substantial but unnecessary expense and deprive the Manchester region of
publicly funded top scientists employed at the SRS.10 The controversy received broad
public attention and led to heated debates in Parliament as well as to discussions in a
large number of news channels and newspapers including reports by the BBC, Financial
Times, the Times Higher Education, The Guardian, as well as scientific media, such
as Nature. The issue received particular public interest as supporters of the Daresbury
site framed the controversy within the longstanding debate on the North-South divide
in terms of scientific research infrastructure in the UK.
In March 2000, the government announced that the synchrotron would be built
at the Rutherford Appleton Laboratory near Oxford. However, the debate continued
and even more than a decade later, Diamond’s website still justifies this decision by
stating that “[t]he Harwell Science and Innovation Campus is a thriving hub of scientific
research and there is a high concentration of users within the region. Diamond is
surrounded by a number of scientific research facilities making the site a centre of
excellence in terms of tools and expertise and therefore the ideal location for the UK’s
new synchrotron.” This statement implies that geographical proximity to potential
users is the main argument in favor of the decision to locate the facility in Didcot
near Oxford. The underlying assumption is that geographical proximity influences not
only a potential user’s decision to employ the facility to conduct research but also the
impact of the resulting scientific output. However, the strongly controversial debate
surrounding the decision to locate Diamond near Oxford and the arguments offered
by both sides suggest that ex ante both locations were similarly competitive clusters
9It is unclear whether the Wellcome trust was first to favor Didcot over Daresbury or whether the UKOffice of Science and Technology pronounced its preference for Oxfordshire first (see a Parliamentarydebate in March 2000).
10Savings were reported to be at the order of GBP 32 million (Nature, 16 September 1999).
6
from a scientific point of view with respect to research that could be conducted using
a synchrotron. This provides the basis for our identification strategy outlined in the
following section.
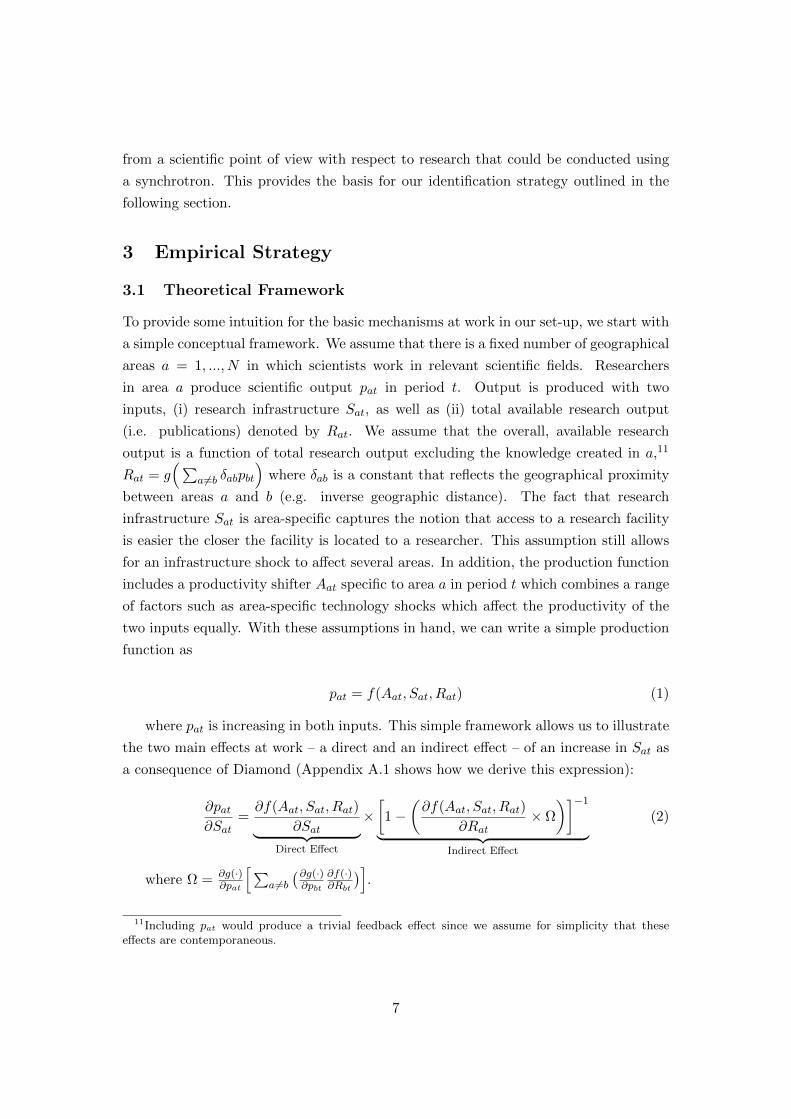
3 Empirical Strategy
3.1 Theoretical Framework
To provide some intuition for the basic mechanisms at work in our set-up, we start with
a simple conceptual framework. We assume that there is a fixed number of geographical
areas a = 1, ..., N in which scientists work in relevant scientific fields. Researchers
in area a produce scientific output pat in period t. Output is produced with two
inputs, (i) research infrastructure Sat, as well as (ii) total available research output
(i.e. publications) denoted by Rat. We assume that the overall, available research
output is a function of total research output excluding the knowledge created in a,11
Rat = g(∑
a6=b δabpbt
)where δab is a constant that reflects the geographical proximity
between areas a and b (e.g. inverse geographic distance). The fact that research
infrastructure Sat is area-specific captures the notion that access to a research facility
is easier the closer the facility is located to a researcher. This assumption still allows
for an infrastructure shock to affect several areas. In addition, the production function
includes a productivity shifter Aat specific to area a in period t which combines a range
of factors such as area-specific technology shocks which affect the productivity of the
two inputs equally. With these assumptions in hand, we can write a simple production
function as
pat = f(Aat, Sat, Rat) (1)
where pat is increasing in both inputs. This simple framework allows us to illustrate
the two main effects at work – a direct and an indirect effect – of an increase in Sat as
a consequence of Diamond (Appendix A.1 shows how we derive this expression):
∂pat∂Sat
=∂f(Aat, Sat, Rat)
∂Sat︸ ︷︷ ︸Direct Effect
×[1−
(∂f(Aat, Sat, Rat)
∂Rat× Ω
)]−1
︸ ︷︷ ︸Indirect Effect
(2)
where Ω = ∂g(·)∂pat
[∑a6=b
(∂g(·)∂pbt
∂f(·)∂Rbt
)].
11Including pat would produce a trivial feedback effect since we assume for simplicity that theseeffects are contemporaneous.
7

In our set-up, a positive infrastructure shock, i.e. an increase in Sat, has a positive
direct effect on research output (∂f(Aat,Sat,Rat)∂Sat
> 0) because it enables researchers
to conduct novel experiments that push the knowledge frontier. Hence, even in the
absence of externalities, the shock creates more output through this direct effect. In
the presence of externalities, however, the shock creates output above and beyond the
direct effect. Here, externalities emerge because the output of researchers in area a
depends on the aggregate research output. In this way, the infrastructure shock in a
directly increases output of researchers in area a (direct effect) and feeds back into the
production of output via the total research output, i.e., a’s output affects b’s output
which in turn affects a’s output via Rat (indirect effect). The indirect effect introduces
a nonlinearity into the production function which produces localized externalities. The
effect is localized because Rat is increasing in δab, that is, the indirect effect increases
in geographical proximity between areas a and b. Hence, the indirect effect acts as
positive multiplier in Equation (2) as long as 0 < ∂f(·)∂Rat
×Ω < 1. Obviously, this set-up
is simplistic in many ways (e.g. it does not explain the optimal choice of inputs), and
it should not suggest that local externalities only emerge because of the use of other
researchers’ output as research input. A range of factors can produce local externalities.
Still, the framework illustrates one possible way in which geographical proximity to
infrastructure affects output directly but also indirectly through its effect on total
research output. The following section explains how we empirically separate these two
effects and test for their presence.
3.2 Empirical Approach
We want to know if the establishment of the Diamond Light Source in Didcot resulted
in the geographical concentration of research and innovative output in proximity to its
location beyond what would have happened, had Diamond been sited elsewhere. We
focus on the geographical distribution of research within the UK because, as observed
by a member of Parliament in a debate on the siting of Diamond “[w]hether one flies
from Tokyo to Daresbury or from Tokyo to Oxford is irrelevant.” (Hon. Stunell, March
2000).12 The object of interest is the geographical distribution of research activity
conducted in scientific fields related to Diamond. Our main focus will be on explaining
differences in research activity across different geographical areas in the UK where we
define geographical areas as Local Authorities (LAs).13 We rely on observable mea-
12It might nevertheless be interesting to investigate potential international spillovers. For example,British universities and researchers in geographical proximity to Diamond might have found it easierto initiate international collaborations due to the need by foreign researchers to team up with localresearchers to have better and more flexible access to the synchrotron facility.
13We face a trade-off in the choice of spatial units for our analysis. Activity is sufficiently ‘rare’ thatwe want to aggregate up to avoid problems of excess zeros, but we want to use small spatial scales to
8

sures of research for our analysis: academic journal publication, author, and affiliation
counts. We also provide some evidence on the impact on patents although journal ar-
ticles are our central focus mainly because of the substantially longer time lag between
the research being conducted and a corresponding patent application becoming visible
to the public (as discussed in the Data Section 4). In addition, establishing a link with
the research relevant to Diamond is substantially more difficult for patents than scien-
tific articles (see Section 4). This focus also means that we are not directly concerned
with potential ‘byproducts’ created by the establishment of a basic research facility
(David et al., 1992), such as the formation of related scientific networks. However,
these ‘byproducts’ are certainly among the factors that could be driving the outcome
measures used in our analysis. To help with exposition, in this section we will refer
to (academic) paper counts for Local Authority areas (the main focus of our empir-
ical results). All methods extend readily to alternative counts and different units of
observation.
Empirically, the main challenge in establishing a causal link from Diamond to the
geographical distribution of related scientific research is the potential endogeneity of
Diamond’s location (which corresponds to Aat in Section 3.1 above). If (correctly antic-
ipated) changes in the geographical distribution of knowledge determined the location
of Diamond, then we may incorrectly attribute those changes to a causal impact of
Diamond. This affects the identification of the direct effect of Diamond as well as po-
tential externalities created by the synchrotron. As discussed above, our main strategy
for dealing with this endogeneity is to exploit the availability of a ‘runner-up’ location:
Daresbury.14 This section provides details.
Our starting point is the following estimating equation:
pat = α+∑t
Dt +∑r
DrDI +
∑r
DrDI × I(t ≥ 2007) + εat (3)
better capture any changes to the geographical distribution of activity. Experimentation with larger(Travel to Work Areas) and smaller (postcode areas) units suggest that Local Authorities representthe most appropriate observational unit for balancing this trade-off.
14In contrast to Greenstone et al. (2010) or Malmendier et al. (2012), who rely on several winnersand runner-ups for comparison, we only have a single winner and a single runner-up. However, foridentification, we rely on differences in variation in scientific output before and after the opening ofDiamond by scientists located across the UK as a function of their geographical distance to bothlocations. As such, our analysis is related to a broader literature that uses variation across treated andcontrol locations to estimate causal effects on endogenous location choices. For example, Redding andSturm (2008) examine the costs of remoteness using the quasi-random variation arising from the divisionof Germany after World War II. Ahlfeldt et al. (2012) use both the division and reunification of Berlinto generate exogenous variation in market access at the city-block level to distinguish agglomerationforces from other location-specific unobserved factors such as shared amenities or common naturaladvantages. Similarly, Draca et al. (2011) estimate the causal effect of policing on crime using quasi-random variation generated by the response to the 2005 terrorist attacks in London (as a responsecentral London received additional policing relative to other London boroughs).
9

where pat is the count of published academic papers from authors employed in
area a at time t; Dt a dummy variable taking value one if year is equal to t, zero
otherwise; DrDI are a set of R ‘ring’ dummies which take value one if the area is
within a given distance of Diamond, zero otherwise;15 I(t ≥ 2007) is a ‘post-Diamond’
indicator variable taking value one from 2007 onwards (the year Diamond opened for
external users), zero otherwise; εat is an idiosyncratic error.
In our main analysis we use three ring dummies corresponding to distances 0-25km,
25km-125km, 125km-175km.16 The ring dummies allow for the fact that research activ-
ity may not be uniformly distributed in areas close to Diamond even before the facility
is operational. In our main analysis the comparison group comprises areas located more
than 175km from Diamond (the omitted category).17 In this specification, the interac-
tion of these ring dummies with an indicator for years after the opening of Diamond
is intended to capture any impact of Diamond on research activities in areas close to
the facility. The time dummies allow for the fact that aggregate research activity may
vary over time.
As usual, anything that causes the error εat to be correlated with the distance
to Diamond (as captured by the ring dummies) will bias coefficients on the distance
dummies and hence our estimate of the impact of Diamond. The main source of such
correlation, in our context, arises because the decision where to locate Diamond was
influenced by an assessment of the research potential of different places. To help address
this problem, we can control for observable characteristics of locations as follows:
pat = α+∑t
Dt +∑r
DrDI +
∑r
DrDI × I(t ≥ 2007)+
+ β1Xat + β2Xat × I(t ≥ 2007) + εat (4)
where Xat are characteristics of areas that may affect research activity. Equation 4
provides consistent estimates of the treatment effect of Diamond if Cov(εat, DrDI |Xat, Xat×
I(t ≥ 2007)) = 0 ∀r. The inclusion of Xat controls for the fact that observable area
characteristics may drive both the number of papers published and the location of
Diamond, introducing correlation between εat and DrDI in Equation 3.
The interaction term Xat × I(t ≥ 2007) further allows for the possibility that the
impact of these area characteristics on research activity may change at the same time
as Diamond was opened in a way that was correctly anticipated by government when
15We use straight line, rather than travel distances, because these are much easier to calculate andvery likely to be highly correlated with actual travel distances. See Combes and Lafourcade (2005).
16The specification of the distances implies that Oxford is included in the first distance ring, Cam-bridge and London in the second, and the third ring includes cities such as Nottingham or Cardiff.
17We verify the robustness of our results for different distance ring definitions in Section 6.2.
10

making its decision about the location of Diamond. This may seem unlikely, but re-
search funding decisions provide a crucial mechanism through which such effects could
occur (and where the government may be able to correctly ‘anticipate’ decisions it will
make in the future). Research funding in the UK is allocated both through indepen-
dent research councils and through the Higher Education Funding Council (HEFCE).
HEFCE funding is based on a HEFCE run research assessment exercise (RAE) which
last reported in 2008 and HEFCE rules on how to use the RAE to allocate funds. If
government knew, for example, that more research funding would be concentrated on
centres of excellence following the RAE exercise then it would anticipate increased fund-
ing (and hence academic articles and patenting) for areas near Didcot, regardless of the
location of Diamond. If this influenced the decision to locate Diamond in Didcot, then
we need to control for the interaction term in Equation 4. In practice, the arguments
in favour of including the interaction term are weakened by the fact that the decision
on where to locate Diamond was taken in 2000, meaning that government would need
to be correctly anticipating RAE outcomes in 2008 and funding decisions fairly far in
advance. The arguments for including Xat are somewhat stronger – characteristics that
affect research activity clearly influence the decision on Diamond and do not change
that quickly over time. That said, if the location of Diamond causes changes in Xat
then controlling for it will lead us to underestimate the impact of Diamond.18
In Equation 4 we may still worry that characteristics unobservable to the econome-
trician affect both research activity and the location of Diamond. If these characteristics
are time invariant, then we can use the panel dimension of the data to control for them
by estimating:
pat = αa +∑t
Dt +∑r
DrDI × I(t ≥ 2007)+
+ β1Xat + β2Xat × I(t ≥ 2007) + εat (5)
where αa is now a fixed effect for area a and everything else is as in Equation 4 (note
that the terms in∑
rDrDI drop out as the distance ring dummies are time-invariant).
This still leaves the possibility that something unobservable, but time varying affects
both research activity and the location of Diamond. One concrete concern may be
the tendency for existing ‘clusters’ of innovation to strengthen over time.19 Given
that we know Diamond was sited in an existing research cluster, this will overestimate
the impact of Diamond if this clustering effect is observed in the research areas most
closely associated with Diamond (in ways that are not fully captured by observable
18Angrist and Pischke (2009) refer to this as the ‘bad control’ problem.19See, for example, Audretsch and Feldman (1996b) and Feldman and Francis (2004).
11

characteristics Xat). We see this as the main identification problem for estimates of
the causal effect of Diamond based on Equation 5. To address this concern we use
the availability of a runner up location at Daresbury. As discussed above, Daresbury
also represents an existing cluster of activity in this area. So if any positive effect of
Diamond is driven purely by the tendency for existing clusters to strengthen over time
then we should observe a similar pattern of increased activity in areas close to the
centre of the alternative cluster in Daresbury. This suggests that we estimate:
pat = αa +∑t
Dt +∑r
DrDI × I(t ≥ 2007)+
+∑r
DrDA × I(t ≥ 2007) +
+ β1Xat + β2Xat× I(t ≥ 2007) + εat (6)
where DrDA are a set of R ‘ring’ dummies which take value one if the area is within
a given distance of Daresbury, zero otherwise and everything else is as before.20 If the
synchrotron at Daresbury had continued to operate, then comparing the coefficients
on DrDA and Dr
DI would give us the impact of Diamond controlling for any average
tendency for innovation to concentrate around existing geographical clusters. These
estimates would be consistent provided that Cov(εat, DrDI |Xat, Xat×I(t ≥ 2007), αa) =
0. Exploiting the availability of the control location, our identifying assumption is
that conditional on a range of location-specific characteristics as well as location fixed
effects, changes in the geographic distributions of research activity in related scientific
disciplines would have been the same around Didcot and Daresbury in the absence of
the construction of Diamond. Section 5.1 is careful to provide descriptive evidence in
support of this identifying assumption.
By estimating Equation 6 we use a difference-in-difference specification to test
whether the geographical distribution of research changes after the opening of Diamond.
In our context, two factors complicate the interpretation of the resulting parameter es-
timates. The first complicating factor arises because, strictly speaking, Equation 6
only provides estimates of the treatment effect of Diamond if there are no spillovers
between the treatment and control groups which are due to treatment (i.e. the opening
of Diamond). In our context, spillovers can arise for various reasons, including global
externalities (research advances), interactions (increased collaboration across UK uni-
versities), and general equilibrium effects (increase in the supply of researchers in the
20We correct for overlaps in the Diamond and Daresbury distance rings by allocating a given locationto either the Diamond or the Daresbury distance ring depending on whether it is closer to Diamond orDaresbury.
12
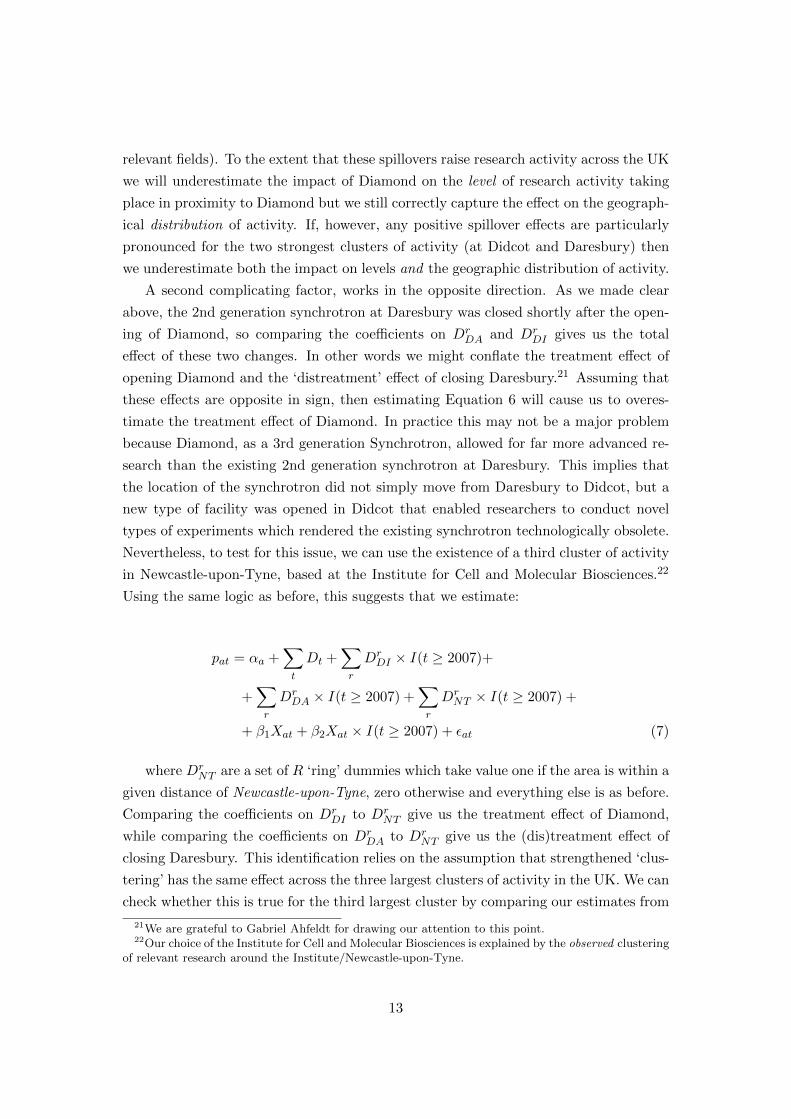
relevant fields). To the extent that these spillovers raise research activity across the UK
we will underestimate the impact of Diamond on the level of research activity taking
place in proximity to Diamond but we still correctly capture the effect on the geograph-
ical distribution of activity. If, however, any positive spillover effects are particularly
pronounced for the two strongest clusters of activity (at Didcot and Daresbury) then
we underestimate both the impact on levels and the geographic distribution of activity.
A second complicating factor, works in the opposite direction. As we made clear
above, the 2nd generation synchrotron at Daresbury was closed shortly after the open-
ing of Diamond, so comparing the coefficients on DrDA and Dr
DI gives us the total
effect of these two changes. In other words we might conflate the treatment effect of
opening Diamond and the ‘distreatment’ effect of closing Daresbury.21 Assuming that
these effects are opposite in sign, then estimating Equation 6 will cause us to overes-
timate the treatment effect of Diamond. In practice this may not be a major problem
because Diamond, as a 3rd generation Synchrotron, allowed for far more advanced re-
search than the existing 2nd generation synchrotron at Daresbury. This implies that
the location of the synchrotron did not simply move from Daresbury to Didcot, but a
new type of facility was opened in Didcot that enabled researchers to conduct novel
types of experiments which rendered the existing synchrotron technologically obsolete.
Nevertheless, to test for this issue, we can use the existence of a third cluster of activity
in Newcastle-upon-Tyne, based at the Institute for Cell and Molecular Biosciences.22
Using the same logic as before, this suggests that we estimate:
pat = αa +∑t
Dt +∑r
DrDI × I(t ≥ 2007)+
+∑r
DrDA × I(t ≥ 2007) +
∑r
DrNT × I(t ≥ 2007) +
+ β1Xat + β2Xat × I(t ≥ 2007) + εat (7)
where DrNT are a set of R ‘ring’ dummies which take value one if the area is within a
given distance of Newcastle-upon-Tyne, zero otherwise and everything else is as before.
Comparing the coefficients on DrDI to Dr
NT give us the treatment effect of Diamond,
while comparing the coefficients on DrDA to Dr
NT give us the (dis)treatment effect of
closing Daresbury. This identification relies on the assumption that strengthened ‘clus-
tering’ has the same effect across the three largest clusters of activity in the UK. We can
check whether this is true for the third largest cluster by comparing our estimates from
21We are grateful to Gabriel Ahfeldt for drawing our attention to this point.22Our choice of the Institute for Cell and Molecular Biosciences is explained by the observed clustering
of relevant research around the Institute/Newcastle-upon-Tyne.
13
the diff-in-diff-in-diff specification (Equation 7) to the total effect estimated from the
diff-in-diff specification that does not use the existence of a third cluster (Equation 6).
For these reasons, Equations 6 and 7 are our preferred specifications. We do, however,
supplement our analysis with a number of variations of our main model specifications,
discussed in Section 6.
While specifications 6 and 7 account for the endogeneity inherent in Diamond’s
chosen location, the ring dummies do not distinguish between Diamond’s direct and
indirect effects discussed above. The framework presented in Section 3.1 suggests a
straightforward way to separate these two effects. As we discuss in detail in the Data
Section 4, we have data on research output that resulted directly from work at Dia-
mond as well as from related research (where scientists did not rely on Diamond for
their research). Defining pat as a combination of both types of research output allows
us to obtain an estimate of the combined effects of Diamond. However, if we limit
pat to related research, the coefficients on the ring dummies measure only the indirect
effect because this research output was not generated by using the synchrotron directly.
Hence, we can obtain estimates of both the direct and indirect effects within the empir-
ical framework described above depending on how we define pat. The following section
describes in more detail how we identify direct and related research output resulting
from Diamond.
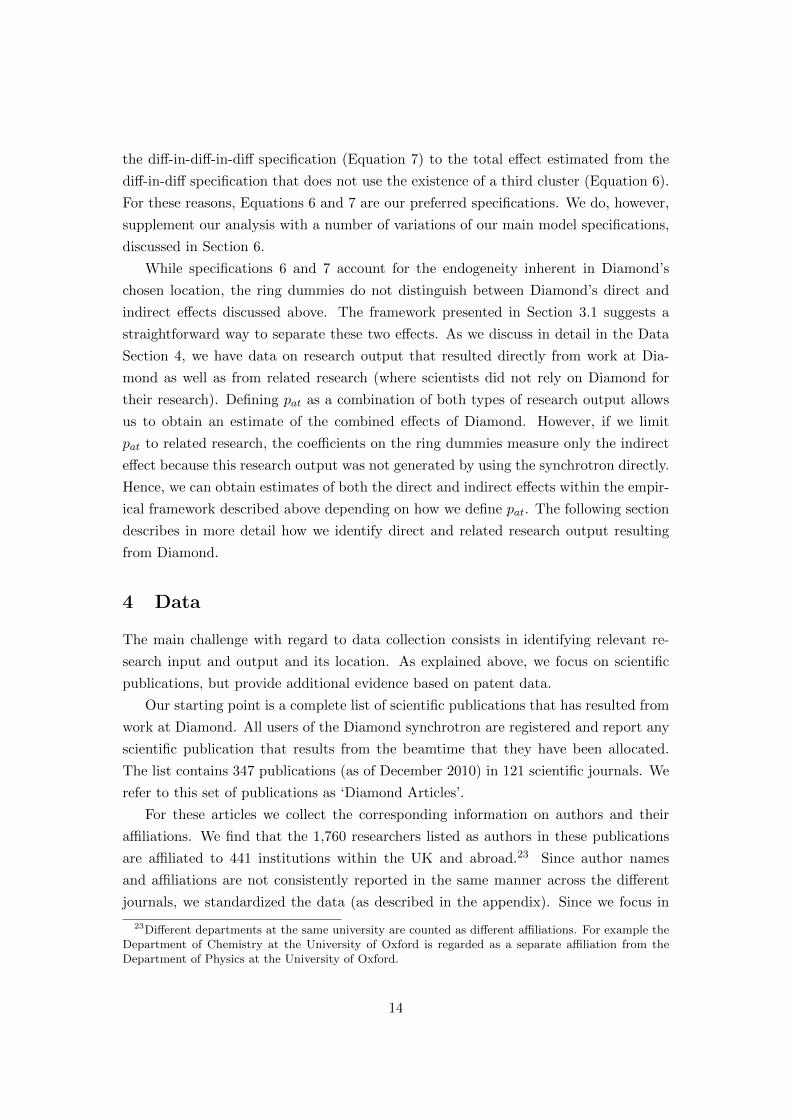
4 Data
The main challenge with regard to data collection consists in identifying relevant re-
search input and output and its location. As explained above, we focus on scientific
publications, but provide additional evidence based on patent data.
Our starting point is a complete list of scientific publications that has resulted from
work at Diamond. All users of the Diamond synchrotron are registered and report any
scientific publication that results from the beamtime that they have been allocated.
The list contains 347 publications (as of December 2010) in 121 scientific journals. We
refer to this set of publications as ‘Diamond Articles’.
For these articles we collect the corresponding information on authors and their
affiliations. We find that the 1,760 researchers listed as authors in these publications
are affiliated to 441 institutions within the UK and abroad.23 Since author names
and affiliations are not consistently reported in the same manner across the different
journals, we standardized the data (as described in the appendix). Since we focus in
23Different departments at the same university are counted as different affiliations. For example theDepartment of Chemistry at the University of Oxford is regarded as a separate affiliation from theDepartment of Physics at the University of Oxford.
14
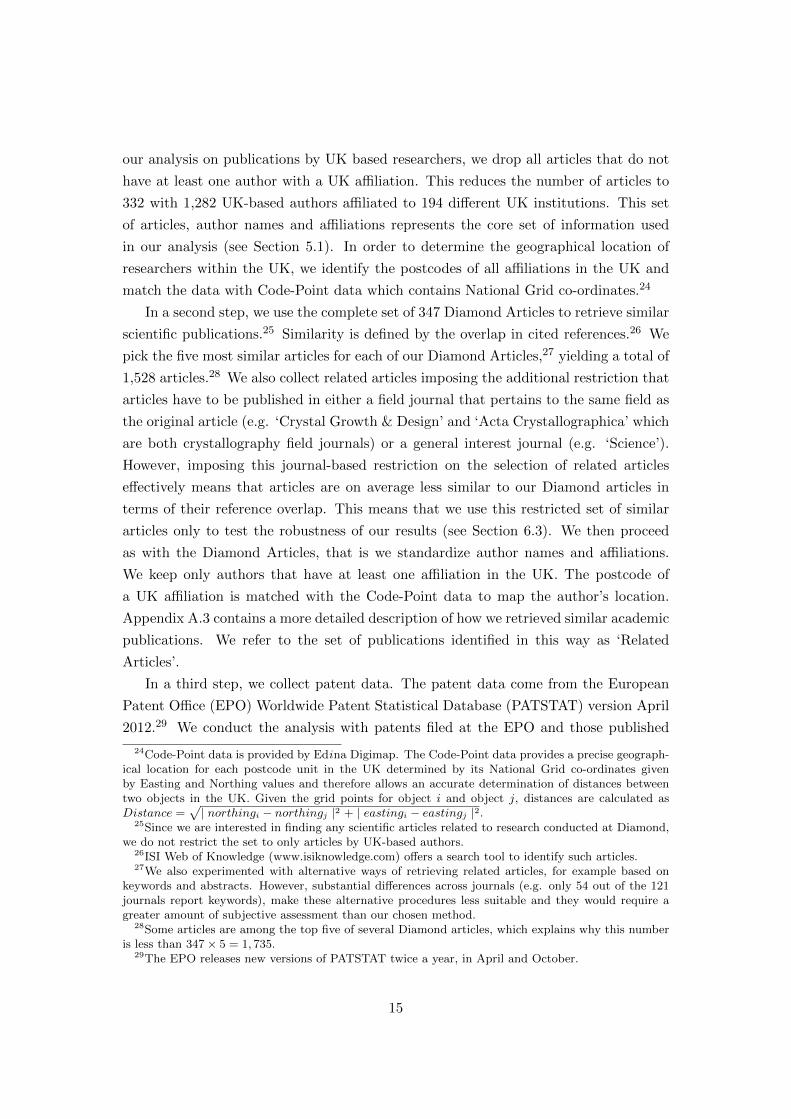
our analysis on publications by UK based researchers, we drop all articles that do not
have at least one author with a UK affiliation. This reduces the number of articles to
332 with 1,282 UK-based authors affiliated to 194 different UK institutions. This set
of articles, author names and affiliations represents the core set of information used
in our analysis (see Section 5.1). In order to determine the geographical location of
researchers within the UK, we identify the postcodes of all affiliations in the UK and
match the data with Code-Point data which contains National Grid co-ordinates.24
In a second step, we use the complete set of 347 Diamond Articles to retrieve similar
scientific publications.25 Similarity is defined by the overlap in cited references.26 We
pick the five most similar articles for each of our Diamond Articles,27 yielding a total of
1,528 articles.28 We also collect related articles imposing the additional restriction that
articles have to be published in either a field journal that pertains to the same field as
the original article (e.g. ‘Crystal Growth & Design’ and ‘Acta Crystallographica’ which
are both crystallography field journals) or a general interest journal (e.g. ‘Science’).
However, imposing this journal-based restriction on the selection of related articles
effectively means that articles are on average less similar to our Diamond articles in
terms of their reference overlap. This means that we use this restricted set of similar
articles only to test the robustness of our results (see Section 6.3). We then proceed
as with the Diamond Articles, that is we standardize author names and affiliations.
We keep only authors that have at least one affiliation in the UK. The postcode of
a UK affiliation is matched with the Code-Point data to map the author’s location.
Appendix A.3 contains a more detailed description of how we retrieved similar academic
publications. We refer to the set of publications identified in this way as ‘Related
Articles’.
In a third step, we collect patent data. The patent data come from the European
Patent Office (EPO) Worldwide Patent Statistical Database (PATSTAT) version April
2012.29 We conduct the analysis with patents filed at the EPO and those published
24Code-Point data is provided by Edina Digimap. The Code-Point data provides a precise geograph-ical location for each postcode unit in the UK determined by its National Grid co-ordinates givenby Easting and Northing values and therefore allows an accurate determination of distances betweentwo objects in the UK. Given the grid points for object i and object j, distances are calculated asDistance =
√| northingi − northingj |2 + | eastingi − eastingj |2.
25Since we are interested in finding any scientific articles related to research conducted at Diamond,we do not restrict the set to only articles by UK-based authors.
26ISI Web of Knowledge (www.isiknowledge.com) offers a search tool to identify such articles.27We also experimented with alternative ways of retrieving related articles, for example based on
keywords and abstracts. However, substantial differences across journals (e.g. only 54 out of the 121journals report keywords), make these alternative procedures less suitable and they would require agreater amount of subjective assessment than our chosen method.
28Some articles are among the top five of several Diamond articles, which explains why this numberis less than 347× 5 = 1, 735.
29The EPO releases new versions of PATSTAT twice a year, in April and October.
15

directly by the UK Intellectual Property Office (UKIPO) that have at least one UK-
based inventor.30 Patent data are only visible after a patent has been published. Hence,
although we use the application date of a patent in our analysis, our sample of patents
is limited to patents that have been published. Given the usual 18-month delay between
application and publication date, this implies that we only have patent data at best
until October 2010. In fact, we see a considerable drop in the number of filings already
towards the end of 2009 which is attributable to this reporting delay and motivates us
to only use patent filings up to 2008 in our analysis. This limitation of the available
patent data is our main motivation for relying principally on academic publications
in our analysis. Another limitation is that in contrast to the official list of academic
publications from Diamond, we do not have any official list of patents that are the
direct outcome of research conducted at Diamond. This means we have to retrieve
relevant patents by searching for patent documents that list ‘Diamond researchers’ as
inventors.31 Hence, we first match the set of 1,760 author names to inventor names that
appear on any patent in the set that we have extracted from PATSTAT.32 Appendix A.4
contains a description of the matching process. We find 191 authors to be inventors of
a total of 779 patents. This represents the set of patents created by researchers working
at Diamond. However, in contrast to academic articles published by Diamond users, for
patents applied for after the opening of Diamond we cannot reliably determine whether
the patent has resulted directly from research at Diamond.
To retrieve similar patents, as a next step, we exploit patents’ IPC codes to retrieve
patents protecting similar technologies.33 More specifically, we search for patents with
a similar, narrowly defined IPC profile as the patents identified through the ‘Diamond
author’ names (see Appendix A.5). The IPC similarity search algorithm yields a total of
6,713 patents that protect technologies for which Diamond is potentially relevant. We
then use postal addresses of the 9,080 inventors listed on these patents to geographically
‘locate’ the corresponding inventive activity. We thus extract postcodes from inventors’
addresses to identify their geographical location by matching them with Code-point
data.34 Finally, we standardize inventor names and create a unique inventor identifier to
30Hence, the set of patents includes patents that were (a) filed directly with the UKIPO, (b) filed withthe EPO, and (c) published by the UKIPO or EPO although received through the Patent CooperationTreaty (PCT) channel that list at list one inventor with a UK address. In case (c), the applicationwas originally made with the World Intellectual Property Organization (WIPO), but the examinationis still conducted by the national patent office or the EPO (in case of so-called Euro-PCTs) whichpublishes and grants the patent.
31‘Diamond researchers’ are any authors that are listed on any of the 347 scientific publicationsresulting directly from Diamond.
32We limit the search for patents applied for after 1980.33The International Patent Classification (IPC) is a hierarchical classification allocating patents into
technology areas.34In order to extract postcodes from inventors’ addresses, we first corrected misspelled or missing
16

avoid counting the same inventor name spelled in different ways as multiple inventors.35
5 Results
In this section, we consider results when using academic articles, their authors, and
the corresponding research institutions as our measure of research activity. We first
offer some descriptive evidence and then discuss the main analytical results. The main
results are based on Local Authorities as the geographical unit of observation and use
counts of academic articles as our measure for research output. Results for patents are
reported in section 6.1. Results for alternative specifications and output measures are
reported in the robustness section 6.2.
5.1 Descriptives
As discussed in Section 4, we have information on an initial set of 347 Diamond Arti-
cles - published academic articles that result directly from experiments conducted at
Diamond. The quality of the academic journals in which these Diamond Articles are
published is relatively high, but varies substantially. Using the simple impact factor
as a measure for journal quality, the average impact factor is a high 5.5 with a lower
but still relatively high median of 3.5. The minimum and maximum are 0.4 (Acta
Crystallographica Section E) and 49.9 (Acta Crystallographica Section A) respectively.
There are a total of 1,760 authors for these Diamond Articles. There are, on average,
five authors per article with a minimum of 1 and a maximum of 24. These authors
are affiliated with 441 institutions worldwide. On average, there are 4.2 affiliations per
article. Slightly more than half (56%) of all affiliations are outside of the UK with most
foreign authors affiliated with institutions in the US, Germany, and France. There
are 1,282 authors with at least one UK affiliation. For reasons discussed in Section 3
- although we use the full set of Diamond Articles to identify related publications -
we focus only on authors with British affiliations when considering the impact on the
geographical distribution of research.36 This means dropping 15 articles which have no
British affiliated authors to leave us with a sample of 332 Diamond Articles with 1,282
authors affiliated to 194 British institutions.
Table 1 shows some descriptive statistics for these 332 Diamond Articles. There
postcodes in inventors’ addresses and then retrieved them by searching the inventor address field inPATSTAT for any UK postcode that is contained in a register of postcodes that we created. To makethis approach feasible, this was done at the ‘postcode district’ level, i.e., using the up-to four charactersbefore the space (e.g., OX2 of OX2 6UD).
35PATSTAT offers such an id variable, but it is often incorrect. To address this, we created analgorithm that groups the same inventor names that have been spelled or input differently.
36This means we also exclude Northern Irish affiliations.
17

are, on average, 5.7 authors per article. Co-authors tend to share affiliations, so that
there are markedly less institutional affiliations per article - the mean is 2.2 for this
sample. The median number of institutional affiliates per author is 1, although some
authors have more than one (either because they have multiple affiliations or because
they change institution at some point in the sample). The table also shows data on the
geographic distribution of researchers listed on Diamond Articles in terms of distances
(in km) to Diamond and Daresbury before and after the establishment of Diamond.
These data suggest that, on average, authors are located considerably closer to Diamond
in the years before 2007 (and the establishment of Diamond). After 2007 the distance to
both Diamond and Daresbury is smaller than pre-2007 although the difference appears
to be a lot stronger for Diamond: the average distance from Diamond is 180km pre-
2007, 155km for 2007 on, whereas the average distance from Daresbury is only 10km less
for 2007 on (changing from 206km to 196km). This provides some preliminary evidence
that researchers that eventually published articles based on work done at Diamond were
located closer to Diamond than Daresbury before the opening of Diamond and were
located even closer after it became operational. This, however, may simply reflect the
fact that the location of Diamond was in some sense ‘optimal’ with respect to likely
users which is why our regression analysis accounts for the endogeneity of location
choice.
The lower panel of Table 1 shows some descriptive statistics for the set of Related
Articles. On average, there are 3.8 authors per article, with the co-authoring decision
again favoring same institution, so that the number of affiliations per article is lower
at 1.7. When we look at the geographic distribution of these authors, we see that the
mean and median distances are both very close to that of ‘Diamond Authors.’ We see
a similar pattern in terms of authors being located in closer geographical proximity to
Diamond after its opening in 2007 (on average 6km). Average distances to Diamond
are in fact slightly smaller before the opening of Diamond than in the case of Diamond
authors.
Maps 2 and 3 visualize the distribution of authors of Diamond and related articles
across the UK before and after Diamond became operational. The maps plot the
number of authors (as many times as they appear on separate publications) in a given
location (as determined by the postcode of the authors’ affiliation) summed over two
periods: before the opening of Diamond 2003-2006 and after the opening of Diamond
2007-2010. The maps also show the locations of Diamond and Daresbury as well as the
corresponding distance rings.37 We see some research activity both around Daresbury
37The Diamond and Daresbury distance rings overlap in maps 2 and 3. We eliminate any suchoverlap in our regression analysis. For example, if the location of a given research output falls intoboth the 125km distance rings of Diamond and Daresbury, we assign the location to either Diamond’s
18

and Diamond’s eventual location in the period before Diamond opened its beamlines.
A comparison with the map that plots the data for 2007-2010 shows clear evidence for
increased activity both around Daresbury and Diamond, although the level of activity
appears to have increased considerably more around Diamond than Daresbury. The
increased clustering of research activity around Diamond appears to occur in direct
proximity to Diamond within the 25km distance band.
Figure 4 offers additional preliminary evidence for clustering around Diamond post-
opening. The figure shows the number of academic articles – only Related Articles –
by authors located within 25km distance of either Diamond (solid line) or Daresbury
(dashed dark grey line) along with the total number of academic articles (dot-dashed
light grey line). The figure highlights two striking features of the data: first, pre-
Diamond, there is little relevant academic research output especially in direct prox-
imity to Diamond and Daresbury, which supports our view that Diamond enabled re-
searchers to break new ground.38 Second, the number of academic articles published by
researchers close to Diamond increases signficantly shortly after Diamond was opened,
whereas the line remains essentially flat around Daresbury. This evidence strongly sug-
gests a highly localized (25km) clustering effect around Diamond. Because Figure 4
uses only data for related publications, the plot provides strong, descriptive evidence
for local externalities created by Diamond.
To explore this further, Figure 5 shows annual coefficient estimates (βCt) from the
regressions pat = αa +∑
tDt + βCtD25C ×Dt + εat (with C = [DI,DA]) for Diamond
and Daresbury (within 25km) where t = 2000, 2001, ..., 2010, and 2007 (the year of Di-
amond’s opening) is the omitted category. These regressions pick up any pre-Diamond
effects and therefore provide direct evidence on our identifying assumption of compa-
rable pre-Diamond trends in both locations. In fact, the figures confirm the similarly
low pre-Diamond trends around Diamond as well as Daresbury. Whereas there is only
a very moderate reaction in terms of publications after 2007 in the Daresbury area,
the figure for Diamond shows the significant increase in academic activity within 25km
of Diamond. The remainder of this section makes these comparisons more precise by
providing estimates for the specifications developed in Equations (3) to (7).
5.2 Regression results
We start by providing estimation results for Equations (3) to (5) in Table 3. The
dependent variable is the LA-by-year count of scientific articles (Table 2 contains the
corresponding descriptive statistics). We begin with the combined set of Diamond and
or Daresbury’s 125km distance ring depending on whether its distance to Diamond is smaller or equalto its distance to Daresbury.
38Although this may partly reflect the way we construct related articles as discussed in Section 4.
19

related articles which means estimates reflect the combined direct and indirect effects
of Diamond. Later we estimate separate models for a sample of only related articles.
Column [I] reports OLS results when we simply include time dummies and three ring
dummies corresponding to distances 0-25km, 25km-125km, 125km-175km (with the
omitted category more than 175km). Consistent with our earlier descriptive statistics,
these dummies capture the geographical clustering of research within 25km of Diamond.
Results in column [II] show what happens when we interact these ring dummies with
a ‘post-Diamond dummy’ - an indicator for years after the opening of Diamond. In
this specification, the interaction of these ring dummies with the post-diamond dummy
captures the impact of Diamond on research activities in areas close to the facility. As
is clear from column [II] the coefficient on the interaction term for the 0-25km ring is
large and statistically significant (at the 10% level).
As discussed above, one possible explanation of these results is that locations differ
in terms of their research potential and that this research potential may explain both
the location of Diamond and any differences in research activity. The remaining speci-
fications in Table 3 deal with this possibility. Column [III] introduces measures of local
skill composition (%NVQ4 and above) and size to capture differences in LA research
potential, while Column [IV] interacts these characteristics with the post-Diamond
dummy (Equation 4) to allow the effect of research potential to change at the same
time as Diamond is up and running. Neither of these changes make much difference
to the overall results although it is interesting to note that we find in Column [IV]
a small negative post-Diamond effect on research activity 125-175km away from Dia-
mond. Columns [V] to [VII] allow for the possibility that time invariant unobservable
factors may explain both the distribution of research activity and the location decision
on Diamond by introducing LA fixed effects (on their own - column [V] and in com-
bination with the research potential variables - columns [VI] and [VII] - see Equation
5). Again, results on the geographical clustering of post-Diamond publications within
0-25km are essentially unaffected.
Clearly, we cannot rule out the possibility that something unobserved and time
varying drives these results (because it is the within-area variation in publication counts
pre- and post-Diamond that we use to identify the effects of Diamond). As explained
above, however, we can rule out one concrete concern that the post-Diamond effect
is simply driven by the tendency for existing ‘clusters’ of innovation to strengthen
over time (which we see as the main identification problem for estimates of the causal
effect of Diamond based on Equation 5). To recap, we control for this possibility
by using the availability of a runner up location at Daresbury. Results are reported
in Table 4. Column [I] reports results when we include ring dummies for Daresbury
interacted with the post-Diamond dummy. We see that the geographical clustering close
20

to Diamond after 2007 is not replicated around Daresbury. Column [II] shows that this
conclusion is robust to the introduction of observable time varying characteristics of
locations that capture research potential. Column [III] introduces area fixed effects
to control for unobservables, while Column [IV] introduces both area fixed effects and
observable characteristics. Again, results are essentially unchanged. If the positive
effect of Diamond is driven purely by the tendency for existing clusters to strengthen
over time then we should observe a similar pattern of increased activity in areas close
to the center of the alternative cluster in Daresbury - and these results suggest that we
do not.
Recall, however, that Daresbury may be affected by a negative ‘distreatment’ effect
that occurs from the shut-down of the second generation synchrotron that used to
operate on that site. While there is reason to be somewhat sceptical of this possibility
given the big differences between the 2nd and 3rd generation technologies, we address
this issue by estimating Equation 7 which includes an additional set of ‘Newcastle’ ring
dummies intended to capture any post-Diamond change in the geographical clustering
of research around the Institute for Cell and Molecular Biosciences. Column [I] in
Table 5 reports results (for the interacted terms) when including fixed effects and all
three sets of dummies. The coefficients on the Newcastle dummies are positive, but not
statistically significant at any reasonable level. Columns [II] and [III] show that these
findings do not change when we consider pairwise comparisons by estimating equation
(6) for Diamond and Newcastle or for Daresbury and Newcastle. Finally, Column
[IV] shows that these results are robust to controlling for observable characteristics of
locations that might affect research potential. These results mean that, even accounting
for a general tendency of clusters (in fields relevant to Diamond) to strengthen over
time, we find a strong positive effect of Diamond on research output in the area close
to Diamond. At the same time, we find little evidence for either a distreatment effect
or a strengthening of geographical clusters independent of the effect of Diamond.
So far, we used LA-level counts of academic articles as the outcome variable. This
includes articles produced by researchers working directly at Diamond as well as related
articles (see discussion above in Section 4). To obtain estimates of the indirect effect,
Table 6 restricts the article count to related publications, that is, only publications that
have not resulted from direct work at Diamond. The results shown in Table 6 indicate
a positive effect of Diamond on ‘related articles’ within direct proximity (25km ring) of
Diamond. In fact, the pattern of estimates is very similar to that for total article counts
although the post-Diamond coefficients fall considerably in magnitude as a result of the
trimmed article counts. Still, research output within a 25km radius of Diamond shows
an increase in related articles of about 5 standard deviations, which is only slightly less
than what we obtained when using the total number of articles. This suggests that
21

Diamond affects not only the location of research that relies on access to the facility
directly, but also that of related research and hence provides strong evidence for the
presence of local externalities created by Diamond.
To investigate the drivers of the observed clustering around Diamond following the
establishment of the 3rd generation synchrotron, we vary our baseline model in two
ways. First, in Table 7 we show results when we ignore the number of publications by
author and instead use as our dependent variable author counts by LA and year (i.e. we
count authors only once independently of their number of publications in a given year).
We view this as a measure of research input rather than output, which allows us to ask
whether the clustering effect is created by an increase in the number of scientists in
proximity to Diamond. In addition, we also use information on the ordering of authors
in a given publication. In the sciences, by convention the position of an author in the
list of authors is a strong indicator of the author’s role in the research that has led to
the publication.39 This means by taking into consideration the ordering of authors in a
given publication, we are able to weigh author counts by authors’ relative importance for
a given research output. Table 7 shows that we find a strong, positive, and statistically
significant effect on the number of researchers within the 25km Diamond distance ring
whereas no such effect can be seen around Daresbury. Diamond affects the number
of people publishing not just the amount of papers published. This conclusion holds
even when we take into account the importance of the contribution of a given author to
published articles. Second, Table 8 shows results when using the number of institutions
by LA and year as our dependent variable (i.e. we count institutions within LAs that
appear as an affiliation at least in one article published in a given year). This can
be regarded as an alternative measure of research input and allows us to ask whether
relevant research is conducted at a larger number of institutions within proximity of the
clusters. The corresponding estimates are positive within a 25km radius of Diamond
but statistically indistinguishable from zero. This implies that the clustering effect
appears to be driven by an increase in the number of scientists working on related
research rather than an increase in the number of institutions where relevant research
is conducted in proximity to Diamond.
Table 7 suggests that the increase in the number of publications in direct proximity
of Diamond is driven by an increase in the number of scientists. This begs the ques-
tion whether this increase is at least partly driven by researchers that move closer to
39The first and last author are usually perceived to have contributed the most to an article whereasauthors appearing in the middle receive less credit (for survey evidence on this perception see Wren etal., 2007). This means that we assign the first and last authors the same score whereas the score dropsthe further down an author name appears in the byline.
22

Diamond when the synchrotron facility became operational. We identify moving sci-
entists through changes in the affiliations that they indicate on their publications. We
are only interested in scientists that moved between geographically distinct institutions
after Diamond was opened.40 Figure 6 shows the change in distances to Diamond and
Daresbury for moving scientists. The numbers denote individual scientists.41 If a given
scientist is located above the 45-degree line, he moved closer to Diamond/Daresbury
after Diamond opened. The right-hand-side scatterplot suggests that scientists moved
on average further away from Daresbury (the average distance before Diamond’s open-
ing was 179km and after its opening 211km). The pattern is less conclusive for Diamond
in the left-hand scatterplot. While 16 scientists moved closer to Diamond, 12 scientists
moved away. Yet, the average distance decreased from 168km to 134km. Nevertheless,
only five scientists moved within a 25km radius of Diamond while at the same time five
scientists moved out of the 25km radius. This analysis shows that only few scientists
moved across geographically distinct locations after Diamond opened (1.3% of all sci-
entists in our sample who account for 3.6% of publications). While scientists move on
average closer to Diamond, few scientists move into direct proximity of Diamond. This
implies that the strong clustering effect that we observe within the 25km distance ring
is unlikely to be driven by the movement of scientists.42 The lack of movement may
be at least partly explained by the fact that (senior) academic positions are not easily
changed, especially because locating in direct proximity to Diamond would most likely
require a position either at Oxford University or the Rutherford Appleton Laboratory
in Didcot, which are both very competitive workplaces.
Table 9 shows results when we restrict author and institution counts to authors and
institutions that appear on related articles. The results in Columns [I] and [II] of Table
9 show that the coefficients on the 25km ring dummies around Diamond are no longer
statistically significant, although still positive and large in magnitude. This means that
there is no statistically significant increase in the number of authors post-Diamond when
we disregard researchers that work directly at Diamond. This in combination with our
findings in Table 6, that is, a statistically significant increase in the number of related
publications within the first distance ring around Diamond, suggests that Diamond
has not lead to an increase in the number of scientists working in relevant fields, but
Diamond enabled these scientists in its geographical proximity to increase their relevant
research output – even without working directly at Diamond. This provides additional
evidence for the presence of externalities as a consequence of Diamond. It also allows
40Results are not affected if we also include researchers that moved shortly before Diamond opened.41There are only 28 scientists that moved between geographically distinct institutions after Diamond
opened.42This makes it also unlikely that the effect is driven by researchers around Didcot that would have
moved had the synchrotron been located elsewhere.
23

us to interpret the results of Table 7, which combined scientists that worked directly at
Diamond and those that did not work at Diamond, as evidence that the increase in the
total number of scientists is driven by scientists working directly at Diamond. Finally,
the results in Columns [III] and [IV] of Table 9 confirm the results of Table 8 that the
increase in research output is not driven by an increase in the number of institutions
at which scientists work on related topics.
6 Robustness
In this section, we complement our analysis with a number of robustness exercises that
vary the underlying data as well as our empirical specifications. First, we explore po-
tential patterns when relying on patents instead of academic publication as our measure
of research output. Second, we test a number of variations of our main specifications.
Third, we use the alternative set of related articles where we impose the additional
restriction that articles have to be published in either a field journal that pertains to
the same field as the original article or a general interest journal (see Section 4).
6.1 Patents
As discussed in Section 4, we successfully matched 191 Diamond Authors to inventor
names on patent documents. These 191 authors appear on 779 patents as inventors.
For our regression analysis, we limit the data to patents applied for between 2000 and
2008. This reduces the number of patents filed by ‘Diamond Inventors’ to 556. The
IPC similarity-based algorithm retrieves an additional 3,555 patents filed between 2000
and 2008 that list at least one UK-based inventor. Table 10 re-runs the specifications
shown in Table 3 with the patent data. The results indicate a strong difference in
the level of patenting around Diamond, which is robust to the inclusion of the post-
Diamond distance ring interaction terms as well as covariates Xat. However, when we
test for changes in patenting upon the opening of Diamond, overall we do not detect
any statistically significant effect. When we control for location-specific time-invariant
unobservables, the estimate in Column [V] of the coefficient on the 25km distance
ring dummy is statistically significant – at 10%; but the effect vanishes when time-
variant location characteristics are included (Column [VI]). Keeping in mind the two
important limitations of the patent data discussed in Section 4, i.e., publication lag
and the difficulty in identifying direct links with Diamond, we interpret these findings
cautiously as suggesting that it may be too early to detect any ‘Diamond effect’ in
patent filings. Nevertheless, the positive and statistically significant coefficient on the
25km Diamond distance ring suggests the existence of an innovative cluster in the area
24

near Diamond independently of the siting of Diamond, which supports our efforts to
account for the endogeneity of the location choice.
6.2 Variations of basic model
In this section, we explore the robustness of our main results to a number of modifica-
tions to our baseline specifications.
First, we use a different set of distance rings, changing the width of the rings as
follows: the first ring is enlarged to 30km, the second shrinks to 100km and the third
remains the same in width but now comprises the distance 100-150km. The omitted
category are now locations beyond 150km. This increases the number of LAs included in
the first ring around Daresbury from 8 to 13 LAs. The second distance band changes
from 155 to 113 LAs in the case of Diamond and from 80 to 57 LAs in the case of
Daresbury. The third distance ring now includes 69 (previously 41) LAs for Diamond
and 23 (previously 7) LAs for Daresbury. The number of LAs included in the distance
rings around Newcastle change from 5 to 7 for the first ring, from 17 to 10 for the second
ring and from 9 to 11 LAs in the third ring. Table 11 shows the corresponding results
for our main specifications. The table shows that our estimates on the first distance
ring around Diamond are unaffected by the change in the width of the distance rings.
Also the coefficients on the first distance rings around Daresbury and Newcastle remain
statistically not significant. We also explore how our results change when we modify
the number of distance rings. We use specifications that allow for either only two
(25km and 125km) or four (25km, 75km, 125km, and 175km) distance rings. Table 12
shows that these modifications have little effect on our results. It is interesting to note,
however, that allowing for a 25-75km distance ring points to a drop in relevant research
output after the establishment of Diamond within that distance band.
Second, we look more directly for a ‘Daresbury shutdown’ effect. One way to do
this is to test directly for the ‘dis-treatment’ effect by running Equation 5 only with
Daresbury distance rings. A second possibility is to include an additional time dummy
equal to one beginning in the year when Daresbury was closed (2008) and interacting
this with the various distance rings. We have tried both with the corresponding results
shown in Columns [I]-[III] of Table 13. The specification of Column [I] provides little, if
any direct evidence for such a ‘Daresbury shutdown’ effect. However, results in Columns
[II] and [III] indicate that such an effect may be partly at work. However, it is asking a
lot of the data to separately identify two such offsetting effects (of Diamond opening and
Daresbury shutting down) when they occur at almost the same time (2007 and 2008).
Hence, the combination of the results shown in Tables 5 and 13 provide overall little
evidence for a shutdown effect driving our estimates on the first distance ring around
25
Diamond. Table 13 also shows results when we test for a Diamond ‘announcement
effect’ by including an indicator equal to one at the time when construction of Diamond
began (2003).43 There is some evidence of such an anticipation effect although our
estimates on the first distance ring around Diamond remain largely unaffected by the
inclusion of an ‘announcement effect’ dummy variable and its interaction with the
distance rings.
Finally, Table 14 shows results when we limit the sample to LAs that report a
positive author/article count in at least one sample year. This reduces the number
of LAs from 379 to 76 and the sample size shrinks to 835 observations. The results
remain qualitatively unchanged with the dummy variable for the first distance ring
around Diamond being positive and now statistically significant at the 5% level.
6.3 Construction of related academic articles
Finally, we also modify the way we construct the set of related academic articles.
As explained in Section 4, our main results are based on a set of similar articles where
similarity is defined by the overlap in cited references with Diamond articles. To explore
the sensitivity of our results to changes in the way we select related research, we also
collect related articles restricting the set to articles to those that have been published in
either a field journal that pertains to the same field as the Diamond article or a general
interest journal. This restriction, however, means that the set of related articles will
be on average less similar in terms of the reference overlap. Collecting related articles
in this way produces a set of 539 related academic articles with 1,519 authors that
are affiliated to 231 institutions. Table 15 shows the results. The estimates are very
similar to those displayed in Tables 3 and 4, that is, the coefficients on the first Diamond
ring dummy are positive and statistically significant whereas no such positive effect is
observed around Daresbury.
7 Conclusion
Does the location of basic scientific research infrastructure affect its use and impact?
This fundamental question is difficult to answer because the locations of scientific fa-
cilities are chosen in order to maximize their impact, posing a formidable challenge to
empirical work that attempts to assess the causal relationship between location choice
and impact. We address this question in the context of the Diamond Light Source, a
3rd generation synchrotron, in the UK and ask whether the location choice affected
43Our time series starts in 2000, the year the decision on the location of Diamond was taken. Forthis reason we rely on the date when the construction started rather than the announcement date.
26

where scientific research – that benefits from the existence of Diamond – is conducted.
The existence of a ‘runner-up’ location (and a third geographical cluster) allows us to
address the endogeneity inherent in the chosen location. Since the ‘runner-up’ location
in Daresbury was home to the previous 2nd generation synchrotron, we also account
for possible dis-treatment effects.
Overall, we find fairly strong evidence that Diamond caused the geographic concen-
tration of relevant research close to Diamond (within a 25km radius) over and above
what would have been expected had Diamond been located elsewhere. Our results
show that this is because of both a direct effect (more scientists located close to Dia-
mond use the facility) and local externalities created by the facility. We also find some
(weak) evidence of a dis-treatment effect close to Daresbury when that facility closes.
In summary, we find strong and robust evidence of a positive impact of Diamond on the
geographical clustering of research output in form of scientific publications and input
in form of scientists in close proximity to the newly opened facility.
Our findings point to several directions for potential future research. For example, it
would be interesting to assess whether Diamond enabled scientists to conduct different
and novel types of experiments in their field of research, which resulted in increased
scientific output, or whether scientists switched fields to take advantage of the existence
of Diamond. Borjas and Doran (2012) analyze the reaction of American mathematicians
to the sudden influx of Soviet mathematicians following the collapse of the Soviet
Union in terms of the research-field they choose to work in. Looking at Diamond
would allow us to look at the effect of an infrastructure rather than a labor supply
shock. Addressing this question, however, would involve collecting information on the
whole research output of scientists over time. A related topic of interest is to track
scientists that conducted experiments at the 2nd generation synchrotron in Daresbury
to understand how they reacted to the opening of Diamond. It would also be interesting
to explore whether Diamond induced new collaborations within the cluster around
Didcot described in our results or with researchers outside of the cluster. Finally, while
we attempted to assess the impact of Diamond on innovation through patent data,
more work could be undertaken to investigate the effect of Diamond on innovation,
especially in the private sector, to see whether it exhibits similar spatial clustering.
27
References
[1] Ahlfeldt, G.M., S.J. Redding, D.M. Sturm, and N. Wolf (2012): ‘The Economics
of Density: Evidence from the Berlin Wall,’ Econometrica, forthcoming.
[2] Audretsch, D. B. and M. P. Feldman. (1996a): ‘R&D Spillovers and the Geography
of Innovation and Production,’ American Economic Review, 86(3): 630-640.
[3] Audretsch, D. B. and M. P. Feldman. (1996b): ‘Innovative Clusters and the In-
dustry Life-cycle,’ The Review of Industrial Organization, 11(2): 253-273.
[4] Borjas, G.J. and K.B. Doran (2012): ‘Cognitive Mobility: Labor Market Responses
to Supply Shocks in the Space of Ideas,’ NBER Working Paper No. 18614.
[5] Combes, P.-P. and M. Lafourcade (2005): ‘Transport Costs: measures, determi-
nants, and regional policy implications for France,’ Journal of Economic Geogra-
phy, 5: 319-349.
[6] David, P., D. Mowery, and W. E. Steinmueller (1992): ‘Analysing the Economic
Payoffs from Basic Research,’ Economics of innovation and New Technology, 2:
73-90.
[7] Draca, M., S. Machin, and R. Witt (2011): ‘Panic on the Streets of London:
Police, Crime, and the July 2005 Terror Attacks,’ American Economic Review,
101: 2157-2181.
[8] Feldman, M. P., and J. Francis. (2004): ‘Homegrown Solutions: Fostering Cluster
Formation,’ Economic Development Quarterly, 18(2): 127-137.
[9] Fox-Kean, M. and P. Thompson (2005): ‘Patent Citations and the Geography
of Knowledge Spillovers: A Reassessment,’ American Economic Review, 95(1):
450-460.
[10] Greenstone, M., R. Hornbeck and E. Moretti (2010): ‘Identifying Agglomeration
Spillovers: Evidence from Winners and Losers of Large Plant Openings,’ Journal
of Political Economy, forthcoming.
[11] Helmers C., M. Rogers and P. Schautschick (2011): ‘Intellectual Property at the
Firm-Level in the UK: The Oxford Firm-Level Intellectual Property Database,’
Oxford University, Department of Economics Working Paper No. 546.
[12] Jaffe, A. (1989): ‘Real Effects of Academic Research’, American Economic Review,
79(5): 957-970.
28

[13] Jaffe, A., M. Trajtenberg, and R. Henderson (1993): ‘Geographic localization
of knowledge spillovers as evidenced by patent citations,’ Quarterly Journal of
Economics, 108: 577-598.
[14] Kantor, S. and A. Whalley (2009): ‘Do Universities Generate Agglomeration
Spillovers? Evidence from Endowment Value Shocks’, The Review of Economics
and Statistics, forthcoming.
[15] Kantor, S. and A. Whalley (2012): ‘Private Gains from Public University Re-
search: The Case of Productivity Spillovers from Agricultural Experiment Sta-
tions’, mimeo.
[16] Loder, N. (1999): ‘Wellcome Trust backs Rutherford to host synchrotron,’ Nature,
402(6761): 451-451.
[17] Malmendier, U., E. Moretti, and F.S. Peters (2012): Winning by Losing: Evidence
on the Long-Run Effects of Mergers, NBER Working Paper 18024.
[18] Martinez, C. (2010): ‘Insight into Different Types of Patent Families, OECD Sci-
ence, Technology and Industry Working Papers, 2010/2, OECD Publishing. doi:
10.1787/5kml97dr6ptl-en
[19] Redding, S., and D. Sturm (2008): ‘The Costs of Remoteness: Evidence from
German Division and Reunification,’ American Economic Review, 98(5): 1766-
1797.
[20] Wren, J.D, K.Z. Kozak, K.R. Johnson, S.J. Deakyne, L.M. Schilling, and R.P.
Dellavalle (2007): ‘The write position,’ EMBO Reports, 8: 988-991.
29

A Appendix
A.1 Derivation of Equation (2)
We show how we obtain the expression in Equation (2) starting with the production
function:
pat = f(Aat, Sat, Rat) (8)
The derivative of (8) with respect to infrastructure Sat is
∂pat∂Sat
=∂f(·)∂Sat
+∂f(·)∂Rat
∂Rat
∂g(·)
[∂g(·)∂pbt
∂pbtSat
+ ...+∂g(·)∂pNt
∂pNt
∂Sat
](9)
since ∂Rat∂g(·) = 1, we can re-write Equation (9) as
∂pat∂Sat
=∂f(·)∂Sat
+∂f(·)∂Rat
[∑a6=b
∂g(·)∂pbt
∂pbt∂Sat
](10)
using the fact that ∂Rbt∂g(·) = 1, we can write
∂pbt∂Sat
=∂f(·)∂Rbt
∂g(·)∂pat
∂pat∂Sat
(11)
using (11) to re-write (10), we get
∂pat∂Sat
=∂f(·)∂Sat
+∂f(·)∂Rat
∂g(·)∂pat
∂pat∂Sat
[∑a6=b
∂g(·)∂pbt
∂f(·)∂Rbt
](12)
re-arranging to isolate ∂pat∂Sat
gives expression (2)
∂pat∂Sat
=∂f(·)∂Sat
×
[1− ∂f(·)
∂Rat
∂g(·)∂pat
(∑a6=b
∂g(·)∂pbt
∂f(·)∂Rbt
)]−1
(13)
A.2 ‘Diamond publications’
As of December 2010, there were 347 published scientific articles available on Diamond’s
website. These articles appeared in 121 scientific journals in various fields. While
nearly all journals contain an abstract of the article, only 54 report keywords. These
publications list a total of 1,760 authors. Author names had to be complemented and
standardized as the way in which names are listed differs across journals. These authors
are affiliated with 441 institutions all over the world. We also standardized the names
30

of affiliations as the way in which they were reported differed in part considerably
across journals. We also complemented addresses of affiliations whenever necessary by
retrieving postal addresses from the relevant institutions’ official websites.
A.3 Related academic publications
ISI Web of Knowledge offers a tool that searches for a given article the entire ISI Web of
Knowledge database for other articles that contain the same references as the original
article. We used this tool to retrieve all articles that share at least one reference with
our 347 ‘Diamond articles’. We then computed a similarity score as the average of
the number of shared references divided by the number of references in the ‘Diamond
article’ and the number of shared references divided by the number of references in the
article retrieved through ISI. We then retained for each of the 347 ‘Diamond articles’
the five most similar articles, where similarity is measured by the similarity score based
on the relative number of shared references. As an alternative, we also collected related
articles imposing the additional restriction that articles have to be published in either a
field journal that pertains to the same field as the original article (e.g. ‘Crystal Growth
& Design’ and ‘Acta Crystallographica’ which are both crystallography field journals)
or a general interest journal (e.g. ‘Science’). In a next step, we recovered all author
names and their affiliations from these similar articles. We standardized author names
and affiliations and dropped all authors that report no affiliation with an entity in the
UK. We then retrieved postcodes for all UK affiliations and matched them with Code-
Point data to obtain the corresponding grid coordinates which allow us to compute
distances to Diamond and Daresbury.
A.4 Matching author and inventor names
This appendix describes the algorithm used to match author names with inventor
names. Both ‘Diamond author’ and inventor names were first standardized and then
split into single words. For example, a ‘Diamond author’ or inventor called ‘William
A. Smith’ is first transformed into ‘william a smith’ and then the name split into its
three components ‘william’, ‘a’, and ‘smith’. In a third step, all words are separately
matched, that is ‘william’, ‘a’, and ‘smith’ are matched to for example ‘anton’, ‘johan’,
‘smith’. Only inventor names that match at least two of the words of a ‘Diamond
author’ name are retained. We applied a number of refinements to this matching al-
gorithm in the actual matching process in order to avoid obvious false positives, such
as for example in the case where names contain several initials, such as ‘andrew c
w smith’ matching with ‘michael w a c jefferson’ only because both names have ‘c’
31

and ‘w’ in common. In a next step, we checked the data manually to eliminate false
matches. Finally, we added authors’ affiliations and inventors’ addresses and check the
data again manually. For example, we compared ‘william a smith’ (=‘Diamond author’)
with ‘william smith’ (=inventor) and checked whether the author’s affiliation loosely
coincides with the inventor’s address. Loosely means that if the affiliation is Oxford,
we may accept an inventor’s address in Oxford (inventors often/usually indicate their
home address). This, however, varies depending on the uniqueness of the name. So
in case of ‘william smith’, this would not suffice as it is likely that there are several,
different inventors’ called ‘william smith’ in the Oxford region which would make a false
positive match very likely. If a person is for example called ‘henrietta krueger-hahn’,
the same postcode/city is likely sufficient, however, to call it a definitive match given
that it is unlikely that there is a second person with that same name that would be
capable of applying for a patent. Hence, our matching algorithm involves both auto-
mated and some discretionary manual matching in order to minimize the occurrence
of false positive or negative matches.44
A.5 IPC similarity algorithm
We retrieved patents that protect similar technologies as the ‘Diamond patents’ by
creating an IPC similarity measure using the full IPC code as well as IPC groups.45
Our algorithm that retrieves technologically similar patents works as follows: (1) drop
all equivalents of the ‘Diamond patents’ from the set of potential matches because the
overlap in IPCs would be perfect simply due to the fact that the equivalents protect
the same underlying invention;46 (2) match a ‘Diamond patent’s IPC profile (using
both IPC symbols and groups) to the IPC profile of any patent in our set of UK/EPO
patents held by UK residents; (3) compute the overlap for both types of patents, i.e.,
the number of matched IPCs divided by the total number of IPC of each type of patent
– the ‘Diamond patent’ and the potential match – minus the number of matched IPCs.
This corrects the score for the fact that patents with a larger number of IPCs are more
likely to match with another patent’s IPC profile; (4) compute the matching score as
the simple average of the two scores for matches at the IPC symbol- and group-level;
44For a more detailed discussion of the methodological challenges in the matching of patent data seeHelmers et al. (2011).
45The importance of employing IPCs at the most detailed level possible is highlighted by the critiqueexpressed by Fox-Kean and Thompson (2005) of the Jaffe et al. (1993) approach to constructing anIPC-based similarity measure. Jaffe et al. (1993) relied on IPC classes which Fox-Kean and Thompson(2005) showed to be technologically too heterogeneous to yield a meaningful similarity measure.
46Equivalents are defined as patents having the same set of priority documents. Note that ourdefinition is inbetween EPO’s narrow DOCDB and broad INPADOC definition and corresponds to thefirst equivalents definition in Martinez (2010).
32

(5) keep only scores above the 99th percentile of the score distribution of all matched
patents for each ‘Diamond patent’. This means that we keep only the most similar
patents although the similarity cut-off value therefore varies by ‘Diamond patent’ in
absolute terms. This represents our set of patents protecting technologies relevant to
Diamond.
33

Figure 1: Diamond synchrotron facility
Source: Diamond Light Source.
34

Figure 2: Academic publications: number of articles – pre-Diamond 2003-2006
Figure 3: Academic publications: number of articles – post-Diamond 2007-2010
35

Figure 4: Academic publications: number of related articles – distance to Diamondand Daresbury (Before & After 2007)
Figure 5: Academic publications: number of related articles – annual coefficient esti-mates for Diamond and Daresbury (Before & After 2007)
-30
1050
9013
017
021
0C
oeffi
cien
t est
imat
es
2000 2002 2004 2006 2008 2010Publication Year
-30
1050
9013
017
021
0
2000 2002 2004 2006 2008 2010Publication Year
Notes: The two graphs show annual coefficient estimates βCt from the regressions pat = αa +∑
tDt + βCtD25C ×Dt + εat
(with C = [DI,DA]) for Diamond and Daresbury (within 25km) where t = 2000, 2001, ..., 2010, 2007 is the omitted category.
36

Figure 6: Moving scientists: Distance to Diamond and Daresbury (Before & After2007)
Notes: The graphs show geographical distances to Diamond (left graph) and Daresbury (righ graph) before and after Diamondopened for the set of scientists (the numbers represent the individual scientists) that moved from one institution to anotherduring that time period. Scientists above the 45-line have moved closer to Diamond/Daresbury, whereas scientists below the45-line have moved further away from Diamond/Daresbury.
37

Table 1: Summary statistics for Academic publications
Mean Median Std. Dev. Min. Max.
‘Diamond’ academic journal articles
Descriptive Statistics of Authors & Affiliations (UK only)
# authors per article 5.69 5 2.99 1 20# affiliations per article 2.19 2 1.23 1 7# affiliations per author 1.13 1 0.38 1 3
Geographical Distribution of ‘Diamond’ Authors’ Affiliations
< 2007 (Before Establishment of Diamond)Distance (km) to Diamond 180.1 120.6 148.4 0 539.3Distance (km) to Daresbury 206.2 219.4 76.7 0 340.0
≥ 2007 (After Establishment of Diamond)Distance (km) to Diamond 154.8 117.3 152.1 0 623.4Distance (km) to Daresbury 196.4 216.5 82.4 0 425.6
Related academic journal articles
Descriptive Statistics of Authors & Affiliations (UK only)
# authors per article 3.85 3 2.47 1 17# affiliations per article 1.66 1 0.92 1 8# affiliations per author 1.26 1 0.50 1 4
Geographical Distribution of Authors’ Affiliations
< 2007 (Before Establishment of Diamond)Distance (km) to Diamond 170.5 120.6 136.9 0 554.3Distance (km) to Daresbury 192.0 209.7 85.7 0 347.3
≥ 2007 (After Establishment of Diamond)Distance (km) to Diamond 164.3 118.4 155.1 0 624.3Distance (km) to Daresbury 199.2 212.1 84.6 0 426.7
Notes:1) There are 332 academic articles, 1,282 ‘Diamond authors’, that are affiliated to 194 institutions.2) There are 520 related academic articles, 1,269 ‘related authors’, that are affiliated to 223institutions.
38

Table 2: Summary statistics for regression samples
Mean Median Std. Dev. Min. Max. Obs
Dependent variable
# Authors 0.97 0 8.10 0 270 4,121# Unique authors 0.74 0 5.51 0 159 4,121# Unique authors weighted by position 0.37 0 2.72 0 79.58 4,121# Articles (Diamond and Related) 0.31 0 2.39 0 84 4,121# Articles (Related) 0.18 0 1.13 0 34 4,121# Unique Institutions 0.15 0 0.84 0 20 4,121# Patents (Diamond and Related) 1.97 1 4.44 0 55 3,364
Covariates
# %NVQ4 and above 26.65 25.8 8.52 5.6 100 4,121# Labor force 75.80 60.0 49.95 2.6 457.6 4,121
39

Tab
le3:
Acad
em
icA
rtic
les:
OL
S(3
79L
A–
2000-
201
0)
[I]
[II]
[III
][I
V]
[V]
[VI]
[VII
]
Dia
mon
d25km
6.20
4*0.
527*
0.17
10.
491
(3.2
11)
(0.3
08)
(0.2
80)
(0.3
05)
125k
m0.
035
0.01
6-0
.148
**-0
.001
(0.1
04)
(0.0
26)
(0.0
69)
(0.0
21)
175k
m-0
.218
***
-0.0
31*
0.15
9***
-0.0
03(0
.067
)(0
.018
)(0
.058
)(0
.017
)D
iam
ond×I(t≥
200
7)
25km
15.6
10*
15.6
27*
14.9
04*
15.6
04*
15.
798
*15
.009*
(8.2
21)
(8.2
04)
(8.1
12)
(8.2
18)
(8.1
92)
(8.1
08)
125km
0.05
30.
024
-0.3
52**
0.050
-0.0
34
-0.3
77*
**(0
.226
)(0
.219
)(0
.149)
(0.2
27)
(0.2
01)
(0.1
43)
175km
-0.5
01**
*-0
.467
***
-0.0
32
-0.5
05*
**-0
.388*
**-0
.102
(0.1
45)
(0.1
41)
(0.1
25)
(0.1
46)
(0.1
10)
(0.1
20)
%N
VQ
4an
dab
ove
0.03
3***
0.003
0.0
32*
-0.0
01(0
.012
)(0
.002
)(0
.018)
(0.0
12)
Lab
orfo
rce
0.00
7***
0.00
1**
*0.
094
***
0.0
58*
**(0
.001
)(0
.000
)(0
.016)
(0.0
15)
%N
VQ
4an
dab
ove×I(t≥
2007)
0.06
9***
0.066
***
(0.0
22)
(0.0
22)
Lab
orfo
rce×I(t≥
2007)
0.01
4***
0.009
***
(0.0
03)
(0.0
02)
Tim
ed
um
mie
sY
ES
YE
SY
ES
YE
SY
ES
YE
SY
ES
Fix
edE
ffec
tsN
ON
ON
ON
OY
ES
YE
SY
ES
R2
0.10
60.
212
0.24
40.
278
0.211
0.0
62
0.0
95
Ob
serv
atio
ns
4,12
14,
121
4,12
14,
121
4,1
21
4,1
21
4,1
21
Note
s:1)
Dep
enden
tva
riable
ispublica
tion
count
by
LA
and
yea
r.2)
Robust
standard
erro
rscl
ust
ered
at
LA
-lev
el.
3)
All
regre
ssio
ns
incl
ude
aco
nst
ant.
4)
379
inst
ead
of
380
LA
sb
ecause
no
cova
riate
sav
ailable
for
Isle
sof
Sci
lly.
40

Table 4: Academic Articles: OLS (379 LA – 2000-2010)
[I] [II] [III] [IV]
Diamond 25km 0.529* 0.493(0.309) (0.305)
125km 0.018 0.002(0.030) (0.026)
175km -0.028 -0.001(0.023) (0.020)
Diamond × I(t ≥ 2007) 25km 15.586* 14.919* 15.574* 15.048*(8.229) (8.121) (8.223) (8.113)
125km 0.028 -0.335 0.020 -0.334(0.286) (0.217) (0.290) (0.214)
175km -0.526** -0.015 -0.535** -0.060(0.228) (0.211) (0.232) (0.205)
Daresbury 25km 0.226 0.199(0.201) (0.213)
125km -0.015 -0.016(0.023) (0.022)
175km -0.005 0.014(0.041) (0.035)
Daresbury × I(t ≥ 2007) 25km 0.952 0.617 0.940 0.713(1.019) (0.974) (1.019) (0.939)
125km -0.072 -0.030 -0.082 0.027(0.301) (0.248) (0.303) (0.237)
175km -0.303 0.057 -0.310 0.017(0.314) (0.247) (0.319) (0.244)
%NVQ4 and above 0.004 -0.001(0.002) (0.013)
Labor force 0.001*** 0.059***(0.000) (0.015)
%NVQ4 and above × I(t ≥ 2007) 0.070*** 0.066***(0.023) (0.022)
Labor force × I(t ≥ 2007) 0.014*** 0.009***(0.003) (0.002)
Time dummies YES YES YES YESFixed Effects NO NO YES YESR2 0.214 0.278 0.214 0.095Observations 4,121 4,121 4,121 4,121
Notes:1) Dependent variable is publication count by LA and year.2) Robust standard errors clustered at LA-level.3) All regressions include a constant.4) 379 instead of 380 LAs because no covariates available for Isles of Scilly.
41

Table 5: Academic Articles: OLS (379 LA – 2000-2010)
[I] [II] [III] [IV]
Diamond × I(t ≥ 2007) 25km 15.850* 15.726* 15.251*(8.224) (8.221) (8.114)
125km 0.295 0.172 -0.121(0.229) (0.223) (0.162)
175km -0.260* -0.383*** 0.152(0.149) (0.140) (0.167)
Daresbury × I(t ≥ 2007) 25km 1.216 0.822 0.949(1.003) (1.016) (0.928)
125km 0.133 -0.259 0.211(0.241) (0.291) (0.188)
175km -0.328** -0.721*** 0.158(0.141) (0.215) (0.169)
Newcastle × I(t ≥ 2007) 25km 1.792 1.669 1.399 1.547(1.909) (1.908) (1.915) (1.716)
125km 0.318 0.195 -0.074 0.445(0.434) (0.431) (0.464) (0.320)
175km 1.238 1.115 0.845 0.725(0.930) (0.928) (0.943) (0.630)
%NVQ4 and above -0.001(0.013)
Labor force 0.058***(0.015)
%NVQ4 and above × I(t ≥ 2007) 0.068***(0.023)
Labor force × I(t ≥ 2007) 0.009***(0.002)
Time dummies YES YES YES YESFixed Effects YES YES YES YESR2 0.219 0.216 0.040 0.096Observations 4,121 4,121 4,121 4,121
Notes:1) Dependent variable is publication count by LA and year.2) Robust standard errors clustered at LA-level.3) All regressions include a constant.4) 379 instead of 380 LAs because no covariates available for Isles of Scilly.
42

Table 6: Academic Articles: Only Related Articles OLS (379 LA – 2000-2010)
[I] [II] [III] [IV]
Diamond 25km 0.529* 0.493(0.309) (0.305)
125km 0.018 0.001(0.030) (0.026)
175km -0.028 -0.001(0.023) (0.020)
Diamond × I(t ≥ 2007) 25km 5.968* 5.629* 5.960* 5.687*(3.404) (3.320) (3.401) (3.309)
125km -0.018 -0.205* -0.024 -0.208(0.160) (0.122) (0.162) (0.121)
175km -0.311** -0.049 -0.317** -0.077(0.128) (0.118) (0.130) (0.116)
Daresbury 25km 0.226 0.199(0.201) (0.213)
125km -0.015 -0.016(0.023) (0.022)
175km -0.005 0.014(0.041) (0.035)
Daresbury × I(t ≥ 2007) 25km 0.459 0.288 0.452 0.340(0.596) (0.549) (0.596) (0.532)
125km -0.074 -0.052 -0.081 -0.021(0.162) (0.137) (0.164) (0.131)
175km -0.196 -0.012 -0.200 -0.035(0.168) (0.132) (0.172) (0.131)
%NVQ4 and above 0.003 -0.005(0.002) (0.005)
Labor force 0.001*** 0.034***(0.000) (0.007)
%NVQ4 and above × I(t ≥ 2007) 0.036*** 0.035***(0.012) (0.012)
Labor force × I(t ≥ 2007) 0.007*** 0.004***(0.001) (0.001)
Time dummies YES YES YES YESFixed Effects NO NO YES YESR2 0.166 0.253 0.164 0.084Observations 4,121 4,121 4,121 4,121
Notes:1) Dependent variable is publication count by LA and year.2) Robust standard errors clustered at LA-level.3) All regressions include a constant.4) 379 instead of 380 LAs because no covariates available for Isles of Scilly.
43

Table 7: Academic Articles – Channels: Inputs (unique author count)OLS (379 LA – 2000-2010)
Unique author count Weighted bybyline position<
[I] [II] [III] [IV] [V]
Diamond × I(t ≥ 2007) 25km 33.685* 33.778* 34.378* 14.421* 14.734*(18.240) (18.264) (12.264) (8.379) (8.379)
125km -0.835** -0.734 -0.108 -0.391 -0.065(0.367) (0.551) (0.398) (0.285) (0.209)
175km -0.193 -0.095 0.525 -0.038 0.286(0.300) (0.515) (0.416) (0.267) (0.219)
Daresbury × I(t ≥ 2007) 25km 1.496 2.187 0.390 0.750(2.336) (2.299) (1.006) (0.984)
125km 0.118 0.723 0.099 0.410(0.610) (0.484) (0.320) (0.258)
175km -0.117 0.553 -0.097 0.296(0.555) (0.416) (0.284) (0.218)
Newcastle × I(t ≥ 2007) 25km 3.429 1.664(3.756) (1.831)
125km 0.827 0.426(0.556) (0.303)
175km 2.614 1.401(2.069) (1.113)
%NVQ4 and above -0.014 -0.014 -0.014 -0.015 -0.015(0.029) (0.029) (0.029) (0.014) (0.014)
Labor force 0.182*** 0.183*** 0.183*** 0.101*** 0.101***(0.044) (0.044) (0.044) (0.023) (0.023)
%NVQ4 and above × I(t ≥ 2007) 0.164*** 0.165*** 0.167*** 0.089*** 0.090***(0.060) (0.061) (0.061) (0.032) (0.032)
Labor force × I(t ≥ 2007) 0.021*** 0.020 0.019*** 0.010*** 0.009***(0.005) (0.005) (0.005) (0.002) (0.002)
Time dummies YES YES YES YES YESFixed Effects YES YES YES YES YESR2 0.082 0.082 0.082 0.074 0.074Observations 4,121 4,121 4,121 4,121 4,121
Notes:1) Dependent variable is unique author count by LA and year (each author counted only onceindependently of number of publications).2) Robust standard errors clustered at LA-level.3) All regressions include a constant.4) 379 instead of 380 LAs because no covariates available for Isles of Scilly.5) < Author counts weighted by the inverse average position in list of author names. First and lastauthor assigned weight equal to one.
44

Table 8: Academic Articles – Channels: Inputs (unique affiliation count)OLS (379 LA – 2000-2010)
[I] [II] [III] [IV] [V]
Diamond × I(t ≥ 2007) 25km 3.498 3.648 3.783 3.472 3.570(2.432) (2.519) (2.519) (2.437) (2.437)
125km -0.123* -0.006 0.128 -0.150 -0.051(0.064) (0.141) (0.114) (0.103) (0.082)
175km -0.034 -0.272** -0.138 -0.063 0.032(0.047) (0.122) (0.090) (0.085) (0.076)
Daresbury × I(t ≥ 2007) 25km 0.037 0.172 -0.123 -0.014(0.219) (0.202) (0.188) (0.173)
125km -0.072 0.059 -0.041 0.066(0.151) (0.128) (0.112) (0.096)
175km -0.172 -0.180 -0.039 0.027(0.151) (0.084) (0.103) (0.078)
Newcastle × I(t ≥ 2007) 25km 0.434 0.243(0.558) (0.461)
125km -0.014 0.033(0.130) (0.089)
175km 0.903 0.623(0.622) (0.447)
%NVQ4 and above -0.009*** -0.009*** -0.009***(0.003) (0.003) (0.003)
Labor force 0.034*** 0.034*** 0.035***(0.006) (0.007) (0.007)
%NVQ4 and above × I(t ≥ 2007) 0.026*** 0.026*** 0.026***(0.008) (0.008) (0.008)
Labor force × I(t ≥ 2007) 0.005*** 0.005*** 0.004***(0.001) (0.001) (0.001)
Time dummies YES YES YES YES YESFixed Effects YES YES YES YES YESR2 0.101 0.139 0.152 0.304 0.102Observations 4,121 4,121 4,121 4,121 4,121
Notes:1) Dependent variable is unique institutions count by LA and year (each institution counted onlyonce independently of number of publications).2) Robust standard errors clustered at LA-level.3) All regressions include a constant.4) 379 instead of 380 LAs because no covariates available for Isles of Scilly.
45

Table 9: Academic Articles – Channels: Inputs – Only Related ArticlesOLS (379 LA – 2000-2010)
Unique author count Unique affiliation count[I] [II] [III] [IV]
Diamond × I(t ≥ 2007) 25km 7.521 7.709 2.591 2.671(5.012) (5.012) (1.981) (1.980)
125km -0.271 -0.075 -0.158* -0.076(0.166) (0.117) (0.083) (0.062)
175km -0.097 0.097 -0.096 -0.017(0.157) (0.125) (0.067) (0.059)
Daresbury × I(t ≥ 2007) 25km 0.311 0.529 -0.081 0.009(0.724) (0.714) (0.157) (0.145)
125km -0.020 0.177 0.060 0.027(0.177) (0.137) (0.086) (0.071)
175km -0.125 0.115 -0.064 -0.006(0.160) (0.116) (0.078) (0.057)
Newcastle × I(t ≥ 2007) 25km 1.048 0.210(1.124) (0.358)
125km 0.143 0.013(0.137) (0.068)
175km 0.835 0.489(0.646) (0.370)
%NVQ4 and above -0.010 -0.009 -0.006*** -0.006**(0.007) (0.007) (0.002) (0.002)
Labor force 0.053*** 0.053*** 0.022*** 0.023***(0.011) (0.011) (0.003) (0.004)
%NVQ4 and above × I(t ≥ 2007) 0.046** 0.046*** 0.018*** 0.018***(0.017) (0.017) (0.006) (0.006)
Labor force × I(t ≥ 2007) 0.005 0.004*** 0.003*** 0.003***(0.001) (0.001) (0.001) (0.001)
Time dummies YES YES YES YESFixed Effects YES YES YES YESR2 0.069 0.069 0.091 0.092Observations 4,121 4,121 4,121 4,121
Notes:1) In Columns [I] and [II], dependent variable is unique author count by LA and year (each authorcounted only once independently of number of publications). In Columns [III] and [IV], dependentvariable is unique institutions count by LA and year (each institution counted only onceindependently of number of publications).2) Robust standard errors clustered at LA-level.3) All regressions include a constant.4) 379 instead of 380 LAs because no covariates available for Isles of Scilly.
46

Tab
le10
:P
ate
nts
:O
LS
(379
LA
–20
00-2
008)
[I]
[II]
[III
][I
V]
[V]
[VI]
Dia
mon
d25km
6.73
5**
7.22
6**
6.24
0*6.
140*
(3.3
47)
(3.6
14)
(3.4
81)
(3.4
56)
125km
1.46
0***
1.44
0***
0.98
8***
0.94
3**
(0.4
69)
(0.4
82)
(0.4
35)
(0.4
37)
175km
-0.4
69-0
.511
-0.0
67-0
.043
(0.3
47)
(0.3
56)
(0.2
86)
(0.2
87)
Dia
mon
d×I(t≥
2007)
25km
-2.2
11-2
.061
-1.7
17
-2.2
35*
-2.0
47
(1.3
48)
(1.2
65)
(1.2
25)
(1.3
48)
(1.3
26)
125km
0.08
50.
001
0.19
40.
079
0.2
04
(0.1
84)
(0.1
97)
(0.2
38)
(0.1
81)
(0.2
00)
175km
0.17
80.
245
0.13
50.
169
0.0
70
(0.1
61)
(0.1
78)
(0.1
74)
(0.1
57)
(0.1
62)
%N
VQ
4an
dab
ove
0.09
0***
0.09
8***
-0.0
05
(0.0
27)
(0.0
28)
(0.0
15)
Lab
orfo
rce
0.01
5***
0.01
5***
0.002
(0.0
05)
(0.0
05)
(0.0
32)
%N
VQ
4an
dab
ove×I(t≥
2007)
-0.0
32
-0.0
20*
(0.0
16)
(0.0
11)
Lab
orfo
rce×I(t≥
2007)
-0.0
02
-0.0
03
(0.0
02)
(0.0
03)
Tim
ed
um
mie
sY
ES
YE
SY
ES
YE
SY
ES
YE
SF
ixed
Eff
ects
NO
NO
NO
NO
YE
SY
ES
R2
0.05
10.
052
0.10
40.
105
0.000
0.0
00
Ob
serv
atio
ns
3,36
43,
364
3,36
43,
364
3,364
3,3
64
Note
s:1)
Dep
enden
tva
riable
ispate
nt
count
by
LA
and
yea
r.2)
Robust
standard
erro
rscl
ust
ered
at
LA
-lev
el.
3)
All
regre
ssio
ns
incl
ude
aco
nst
ant.
4)
379
inst
ead
of
380
LA
sb
ecause
no
cova
riate
sav
ailable
for
Isle
sof
Sci
lly.
5)
Conta
ins
UK
and
EP
Opate
nt
filings.
6)
Pate
nts
alloca
ted
toyea
rsby
applica
tion
date
.
47

Table 11: Academic Articles – Robustness: Width of Distance Rings:OLS (379 LA – 2000-2010)
[I] [II] [III] [IV] [V]
Diamond 30km 0.479(0.305)
100km -0.033(0.028)
150km 0.039(0.046)
Diamond × I(t ≥ 2007) 30km 14.854* 15.663* 14.994* 15.813* 15.089*(8.112) (8.221) (8.104) (8.224) (8.105)
150km -0.566** 0.083 -0.546** 0.233 -0.442*(0.245) (0.235) (0.248) (0.213) (0.232)
150km 0.081 -0.065 0.103 0.085 0.206(0.335) (0.361) (0.332) (0.347) (0.333)
Daresbury 30km 0.108(0.139)
100km -0.022(0.018)
150km -0.005(0.027)
Daresbury × I(t ≥ 2007) 30km -0.099 0.413 0.082 0.563 0.216(0.673) (0.671) (0.642) (0.664) (0.638)
100km -0.012 0.007 0.051 0.157 0.167(0.225) (0.309) (0.211) (0.293) (0.202)
150km 0.163 -0.052 0.197 -0.037 0.197(0.274) (0.325) (0.261) (0.287) (0.246)
Newcastle × I(t ≥ 2007) 30km 1.798 1.236(1.443) (1.287)
100km -0.312** 0.078(0.150) (0.184)
150km 0.738 0.414(0.722) (0.471)
%NVQ4 and above 0.004 -0.003 -0.004(0.003) (0.014) (0.014)
Labor force 0.001 0.059*** 0.059***(0.000) (0.015) (0.015)
%NVQ4 and above × I(t ≥ 2007) 0.075*** 0.079*** 0.074***(0.026) (0.026) (0.027)
Labor force × I(t ≥ 2007) 0.014*** 0.009*** 0.009***(0.003) (0.002) (0.003)
Time dummies YES YES YES YES YESFixed Effects NO YES YES YES YESR2 0.281 0.210 0.096 0.216 0.096Observations 4,121 4,121 4,121 4,121 4,121
Notes:1) Dependent variable is publication count by LA and year.2) Robust standard errors clustered at LA-level.3) All regressions include a constant.4) 379 instead of 380 LAs because no covariates available for Isles of Scilly.
48

Table 12: Academic Articles – Robustness: # Distance Rings:OLS (379 LA – 2000-2010)
[I] [II] [III] [IV]
Diamond × I(t ≥ 2007) 25km 15.063* 15.124* 25km 15.012* 15.215*(8.106) (8.106) (8.112) (8.113)
125km -0.319** -0.250* 75km -0.692** -0.482**(0.151) (0.138) (0.270) (0.227)
125km -0.179 0.035(0.256) (0.217)
175km -0.052 0.161(0.208) (0.170)
Daresbury × I(t ≥ 2007) 25km 0.728 0.810 25km 0.722 0.958(0.922) (0.921) (0.944) (0.933)
125km 0.042 0.079 75km -0.143 0.078(0.170) (0.154) (0.250) (0.212)
125km 0.185 0.346(0.289) (0.244)
175km 0.027 0.166(0.246) (0.172)
Newcastle × I(t ≥ 2007) 25km 1.411 25km 1.564(1.710) (1.716)
125km 0.317 75km 0.435(0.303) (0.354)
125km 0.463(0.500)
175km 0.725(0.629)
%NVQ4 and above -0.001 -0.001 -0.003 -0.003(0.013) (0.013) (0.013) (0.013)
Labor force 0.059*** 0.058*** 0.057*** 0.057***(0.015) (0.015) (0.015) (0.015)
%NVQ4 and above × I(t ≥ 2007) 0.067*** 0.067*** 0.069*** 0.071***(0.022) (0.022) (0.023) (0.024)
Labor force × I(t ≥ 2007) 0.009*** 0.009*** 0.009*** 0.009***(0.002) (0.002) (0.002) (0.002)
Time dummies YES YES YES YESFixed Effects YES YES YES YESR2 0.095 0.096 0.098 0.099Observations 4,121 4,121 4,121 4,121
Notes:1) Dependent variable is publication count by LA and year.2) Robust standard errors clustered at LA-level.3) All regressions include a constant.4) 379 instead of 380 LAs because no covariates available for Isles of Scilly.
49

Table 13: Academic Articles – Robustness: Daresbury Shutdown andDiamond Construction Effects: OLS (379 LA – 2000-2010)
[I] [II] [III] [IV] [V]Daresbury Shutdown Diamond Construction
Diamond × I(t ≥ 2007) 25km 15.251* 3.004 15.009* 14.877*(8.114) (1.832) (8.108) (8.024)
125km -0.121 -0.242* -0.377*** -0.136(0.162) (0.146) (0.143) (0.156)
175km 0.152 0.353* -0.103 0.158(0.167) (0.180) (0.120) (0.165)
Daresbury × I(t ≥ 2007) 25km 0.789 0.949 0.249 0.899(0.944) (0.928) (0.604) (0.901)
125km 0.079 0.211 0.119 0.222(0.173) (0.188) (0.184) (0.188)
175km 0.085 0.158 0.414** 0.159(0.179) (0.169) (0.176) (0.161)
Newcastle × I(t ≥ 2007) 25km 1.547 0.310 1.530(1.716) (0.387) (1.686)
125km 0.445 0.081 0.407(0.320) (0.286) (0.295)
175km 0.725 -0.271 0.709(0.630) (0.282) (0.595)
Diamond × I(Shut/Const) 25km 16.346* 0.872***(8.841) (0.301)
125km 0.170 0.036(0.235) (0.049)
175km -0.282 -0.015(0.178) (0.044)
Daresbury × I(Shut/Const) 25km 0.919 0.119(1.302) (0.163)
125km 0.111 -0.024(0.271) (0.050)
175km -0.356* 0.0001(0.181) (0.049)
Newcastle × I(Shut/Const) 25km 1.634 0.040(1.853) (0.097)
125km 0.479 0.095(0.649) (0.098)
175km 1.323 0.039(0.992) (0.143)
Daresbury Shutdown -2.013*** -2.009***(0.620) (0.631)
Diamond Construction -1.751*** -2.029***(0.558) (0.625)
Time dummies YES YES YES YES YESFixed Effects YES YES YES YES YESR2 0.042 0.096 0.109 0.095 0.098Observations 4,121 4,121 4,121 4,121 4,121
Notes:1) I(Shut/Const) is either the DaresburyShutdown or the DiamondConstruction dummy variabledepending on the specification.2) Dependent variable is publication count by LA and year.3) Controls: % NVQ4 and above; % NVQ4 and above × I(t ≥ 2007); Labor force; Labor force ×I(t ≥ 2007).4) Robust standard errors clustered at LA-level.5) All regressions include a constant.5) 379 instead of 380 LAs because no covariates available for Isles of Scilly.
50

Table 14: Academic Articles – LAs with ≥ 1 author:OLS (76 LA – 2000-2010)
[I] [II] [III] [IV]
Diamond × I(t ≥ 2007) 25km 18.793** 17.449* 17.482* 17.317*(9.061) (9.059) (9.176) (9.069)
125km -0.924 -1.689*** -1.686 -1.836*(0.763) (0.628) (1.165) (1.059)
175km -2.337 -2.825 -2.750** -2.976***(0.539) (0.744) (1.043) (1.055)
Daresbury × I(t ≥ 2007) 25km -1.000 0.369(1.946) (2.173)
125km -1.045 -0.425(1.353) (1.303)
175km -2.160 -0.127(1.463) (1.431)
%NVQ4 and above 0.148* 0.026 0.026(0.078) (0.067) (0.067)
Labor force 0.066** 0.038 0.038(0.027) (0.028) (0.028)
%NVQ4 and above × I(t ≥ 2007) 0.158** 0.157*(0.064) (0.068)
Labor force × I(t ≥ 2007) 0.008* 0.008(0.004) (0.004)
Time dummies YES YES YES YESFixed Effects YES YES YES YESR2 0.161 0.271 0.381 0.268Observations 835 835 835 835
Notes:1) Dependent variable is publication count by LA and year.2) Robust standard errors clustered at LA-level.3) All regressions include a constant.4) Includes only LAs that report an author count ≥ 1 in at least 1 year.
51

Table 15: Academic Articles – Restricted Set of Related Articles:OLS (379 LA – 2000-2010)
[I] [II] [III] [IV]
Diamond × I(t ≥ 2007) 25km 15.114* 14.372* 14.882* 14.395*(7.820) (7.744) (7.848) (7.748)
125km -0.007 -0.333** 0.024 -0.307(0.192) (0.135) (0.278) (0.205)
175km -0.358*** -0.109 -0.517** -0.084(0.101) (0.111) (0.220) (0.196)
Daresbury × I(t ≥ 2007) 25km 0.730 0.545(0.935) (0.845)
125km -0.098 0.013(0.284) (0.223)
175km -0.319 -0.020(0.277) (0.218)
%NVQ4 and above 0.030* -0.0002 -0.002(0.016) (0.012) (0.012)
Labor force 0.093*** 0.060*** 0.060***(0.016) (0.015) (0.015)
%NVQ4 and above × I(t ≥ 2007) 0.062*** 0.063***(0.021) (0.022)
Labor force × I(t ≥ 2007) 0.008*** 0.007***(0.002) (0.002)
Time dummies YES YES YES YESFixed Effects YES YES YES YESR2 0.059 0.086 0.211 0.086Observations 2,141 2,141 2,141 2,141
Notes:1) Dependent variable is publication count by LA and year.2) Robust standard errors clustered at LA-level.3) All regressions include a constant.4) 379 instead of 380 LAs because no covariates available for Isles of Scilly.
52