Embed Size (px)
Citation preview

Submitted to: Submitted by LPO Student Team:Debora Shiflett, MBA Jeremy CovertDirector, VUMC Financial Training, Matt DolsonVUMC Department of Finance Samara Orkin
Ryan SeiberlingSarah Sisk
Vanderbilt’s Finance Leadership Program Evaluation November 27, 2012
Table of ContentsEXECUTIVE SUMMARY..........................................................................................................................................1EVALUATION INTRODUCTION............................................................................................................................2
Organizational Context of the Evaluation.............................................................................................................2THE EVALUATION PROCESS.................................................................................................................................4
Purpose of the Evaluation........................................................................................................................................4Key Questions Guiding the Evaluation..................................................................................................................5Evaluation Method...................................................................................................................................................5Stakeholders..............................................................................................................................................................6FLP Logic Model......................................................................................................................................................7Evaluation Design.....................................................................................................................................................8Data Collection Plan and Instruments...................................................................................................................9
Data Collection Plan............................................................................................................................................10Instrument 1 - Productivity & Satisfaction Survey (Pre/Post).............................................................................11Instrument 2 - Reaction Survey...........................................................................................................................12Instrument 3 - Outcome Survey...........................................................................................................................13Instrument 4 - Focus Group.................................................................................................................................15
Coding Plan and Data Analysis.............................................................................................................................18Instrument 1 - Productivity & Satisfaction Survey..............................................................................................18Instrument 2 - Reaction Survey...........................................................................................................................20Instrument 3 - Outcome Survey...........................................................................................................................22Instrument 4 - Focus Group.................................................................................................................................26
Presentation Plan....................................................................................................................................................30
Tables Table 1: FLP CIRO Evaluation Methodology................................................................................................................6Table 2: Evaluation Stakeholders...................................................................................................................................6Table 3: Data Collection Plan.......................................................................................................................................10Table 4: Example Productivity & Satisfaction Survey Data Capture Table.................................................................19Table 5: Example Results Survey Data Capture Table.................................................................................................21Table 6: Example Outcome Survey Data Table (Likert Reponses)..............................................................................22Table 7: Example Outcome Survey Data Table (Question 8)......................................................................................23Table 8: Example Outcome Survey Data Table (Question 9)......................................................................................24Table 9: Example Outcome Survey Data Table (Question 10)....................................................................................25Table 10: Evaluation Results Communication Plan.....................................................................................................31 FiguresFigure 1: Overview of the FLP’s Inaugural Offering.....................................................................................................4Figure 2: FLP Logic Model............................................................................................................................................7Figure 3: Summary of Evaluative Design’s Annual Treatment Cycle...........................................................................9Figure 4: Example Productivity & Satisfaction Results Chart.....................................................................................19Figure 5: Example Results Survey Data Results Chart................................................................................................21Figure 6: Example Outcome Survey Results Chart (Likert Reponses)........................................................................23Figure 7: Example Outcome Survey Results Chart (Question 8).................................................................................23Figure 8: Example Outcome Survey Results Chart (Question 9).................................................................................24Figure 9: Example Outcome Survey Results Chart (Question 10)...............................................................................25Figure 10: Focus Group Coding Example....................................................................................................................30

EXECUTIVE SUMMARY
Vanderbilt’s executive leadership team has a vision to create a “One University” culture between the Vanderbilt Medical Center and the University that will ultimately require greater efficiency and communication across the organization. Therefore, the executive team determined that in order to drive the organization toward this new vision, finance leaders must possess and utilize leadership skills on the job and be able to skillfully foster a positive culture change – a primary component of which is “big picture thinking.” Succession planning was also prioritized for the finance department. As a result, Vanderbilt contracted The Advisory Board to create and implement a leadership development program, the Financial Leadership Program (FLP).
The FLP Evaluation Plan provides a process to assess if the program’s observed impact aligns with the one intended. This plan will help to determine where and how program effectiveness may be improved, if at all. Using the following key questions, the evaluation plan will evaluate for:
1. Leadership Skills: Has participants’ use of the tools and principles taught in the FLP improved work productivity and processes of the department?
2. Big Picture Thinking: As a result of the FLP, do the participants find themselves better able to consider the potential impact of their decisions on the internal Vanderbilt clients they serve?
3. Pipeline/Succession: Is the FLP program producing the leaders needed to fill the talent pipeline and meet the Finance Department’s future leadership needs?
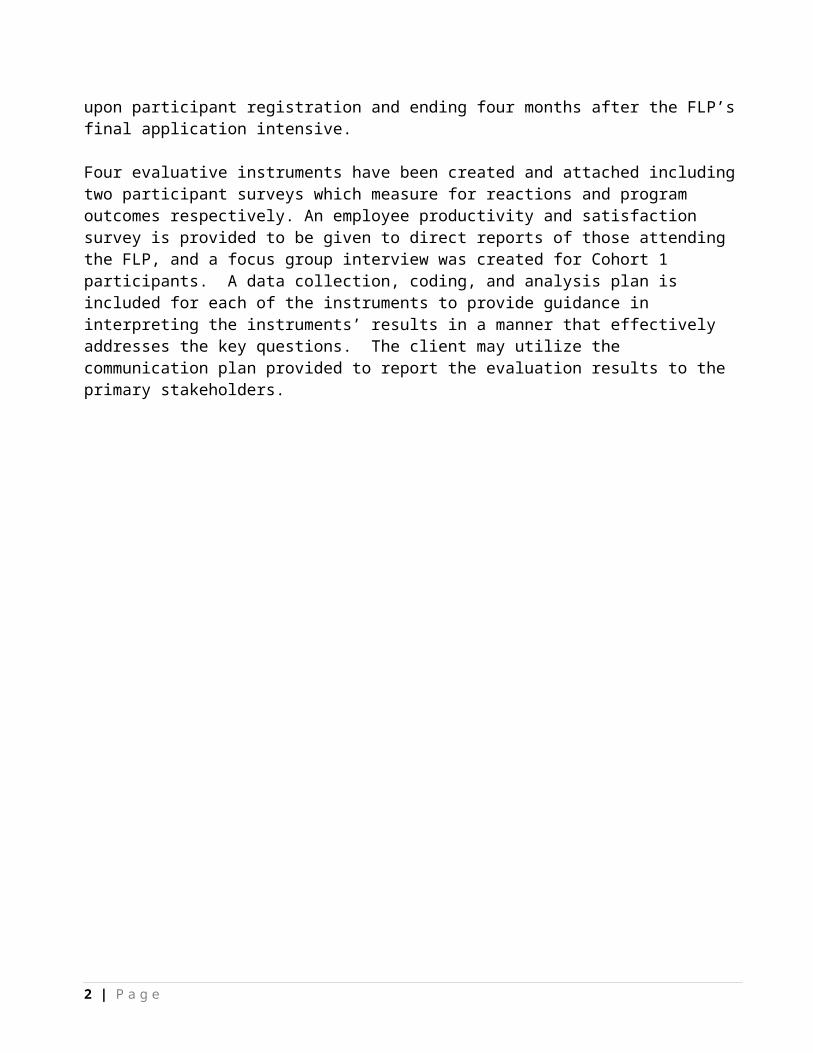
The CIRO Evaluation Model was used to design an evaluative plan to assess the FLP’s ability to meet the needs established from the executive team which are reflected in the questions above. The evaluation follows the same year-long cycle of the FLP – commencing upon participant registration and ending four months after the FLP’s final application intensive.
Four evaluative instruments have been created and attached including two participant surveys which measure for reactions and program outcomes respectively. An employee productivity and satisfaction survey is provided to be given to direct reports of those attending the FLP, and a focus group interview was created for Cohort 1 participants. A data collection, coding, and analysis plan is included for each of the instruments to provide guidance in interpreting the instruments’ results in a manner that effectively addresses the key questions. The client may utilize the communication plan provided to report the evaluation results to the primary stakeholders.
1 | P a g e

EVALUATION INTRODUCTION
Organizational Context of the Evaluation
Five years ago, a new Vanderbilt University executive leadership team came on board and began making changes. Recently, this executive leadership team, led by the Chancellor Nicholas S. Zeppos, instituted a new initiative that would streamline processes and communications across the institution for greater efficiency and communication with the ultimate goal of operating as “One University.” The executive team determined that in order to drive the organization toward this new vision, finance leaders must possess and utilize leadership skills on the job and be able to skillfully foster a positive culture change – a primary component of which is “big picture thinking.” The executive team also expressed concern that individuals possess the required leadership skills needed to take over for the current leadership team when the time comes. To tackle these objectives, the senior executive team tapped our client Debora Shiftlett, the Director of Vanderbilt University Medical Center (VUMC) Financial Training, to initiate a leadership development program for finance. (D. Shiftlett, address to LPO class, September 25, 2012). (D. Shiftlett, personal communication, October 14, 2012).
In addition to these new learning and cultural change objectives set forth by the senior executive team, VUMC’s finance staff has challenges inherent in their daily work. Specifically, the changing nature and complexity of health care regulations are external factors that consistently put pressure on leaders and workers to not just keep up, but to innovate. Furthermore, VUMC Finance Department is challenged to operate from a system’s perspective by creating and implementing financial systems across the institution. Having a “bigger picture” perspective is therefore important in both the operational and strategic work of the department (D. Shiftlett, address to LPO class, September 25, 2012).
To meet the challenges issued by the senior executive team to create a leadership program for finance and in keeping with the reality of the current work environment, our client selected current vendor, The Advisory Board, to provide the content and facilitation for a new leadership development program. The Advisory Board was selected for multiple reasons: its research focus in healthcare, its reputation for implementing best practices for healthcare training, and its competitive cost structure because Vanderbilt is an existing customer. While the executive team continues to deliberate about leadership competencies needed for the finance staff, Debora benchmarked leadership skill requirements from well-known leadership competency models and decided that the competencies taught by The Advisory Board were a match with those needed by Vanderbilt’s finance team. The leadership program purchased is an established, pre-packaged product (D. Shiftlett, personal communication, October 14, 2012). The curriculum includes a series of six workshops and three application intensives designed to focus on current culture challenges within the organization as well as on real-world work projects. The program was officially dubbed Vanderbilt’s “Finance Leadership Program” or FLP.
Debora and her leadership team recognized a unique opportunity to progress toward the desired culture of “One University” by including the University Central leaders in the FLP. As such, program participants are from both the University Central and Medical Center Finance departments, the majority of which have never worked together prior to the start of the FLP. To further address cultural issues, The Advisory Board facilitator works closely with Debora to understand Vanderbilt’s unique
2 | P a g e
culture and apply this knowledge to make workshop discussions and examples more relevant. In addition, certain components of the FLP have been completely customized for Vanderbilt.
Objectives of the Finance Leadership Program
The next important milestone in the evaluation process is to clearly understand the objectives of the FLP. These were determined by the client in conjunction with The Advisory Board personnel. According to the FLP intranet website, the primary objectives of the program are to:
1. Increase breadth and depth of leadership skills and organizational knowledge among current leaders
2. Build new skills that will enable staff members to see, understand, and respond to the bigger picture and customers’ needs
3. Develop staff for the next level of leadership - equipping them with the skills needed to take the place of existing leaders when the time comes
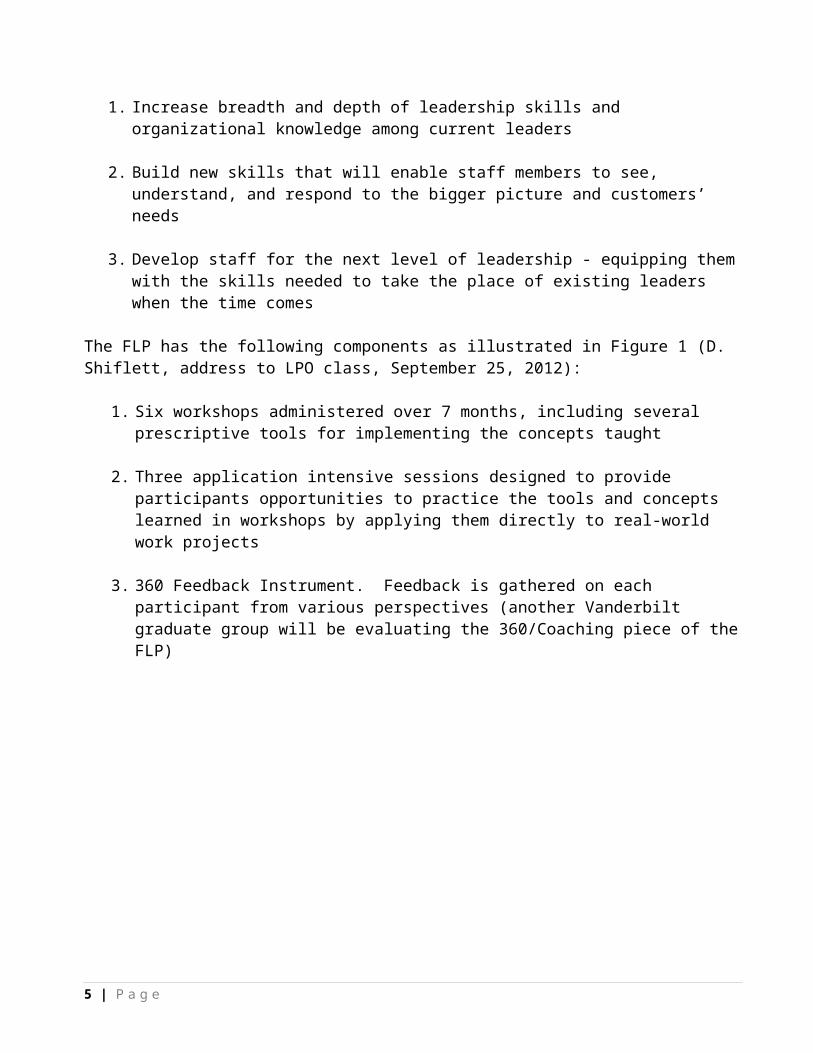
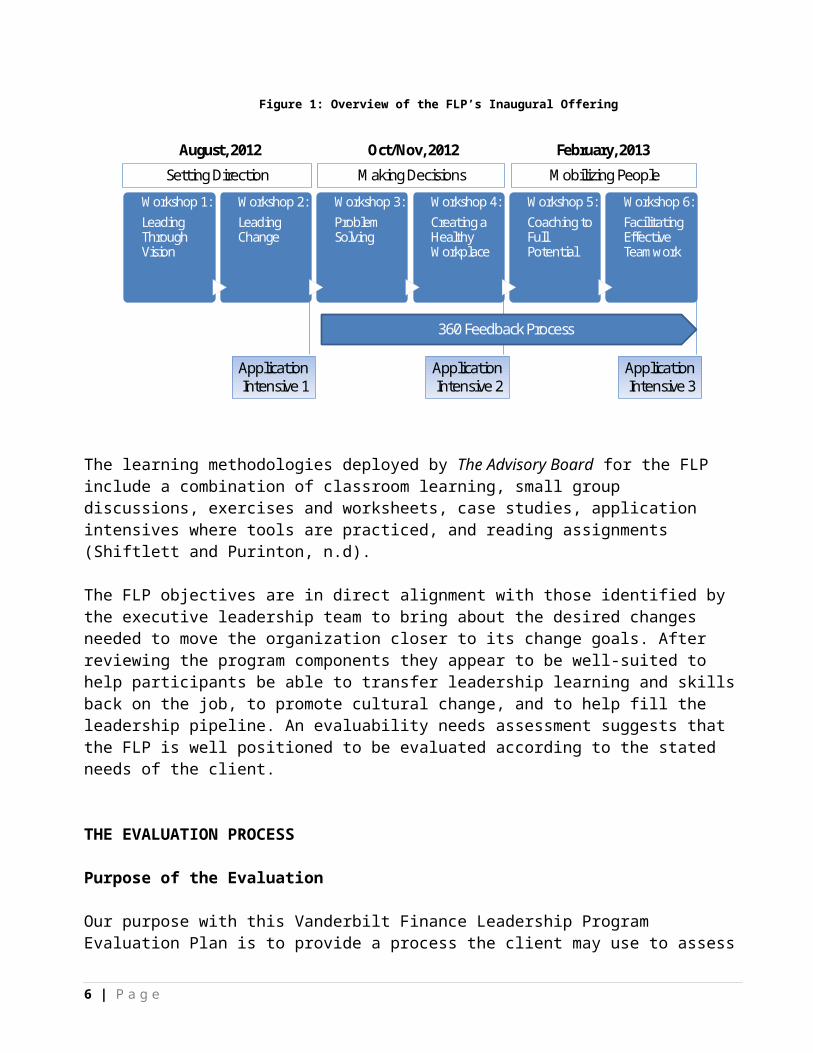
The FLP has the following components as illustrated in Figure 1 (D. Shiflett, address to LPO class, September 25, 2012):
1. Six workshops administered over 7 months, including several prescriptive tools for implementing the concepts taught
2. Three application intensive sessions designed to provide participants opportunities to practice the tools and concepts learned in workshops by applying them directly to real-world work projects
3. 360 Feedback Instrument. Feedback is gathered on each participant from various perspectives (another Vanderbilt graduate group will be evaluating the 360/Coaching piece of the FLP)
3 | P a g e

Figure 1: Overview of the FLP’s Inaugural Offering
Workshop 1:Leading Through Vision
Workshop 2:Leading Change
Workshop 3:Problem Solving
Workshop 4:Creating a Healthy Workplace
Workshop 5:Coaching to Full Potential
Workshop 6:Facilitating Effective Teamwork
Setting Direction Making Decisions Mobilizing People
August, 2012 Oct/Nov, 2012 February, 2013
ApplicationIntensive 1
ApplicationIntensive 2
ApplicationIntensive 3
360 Feedback Process
The learning methodologies deployed by The Advisory Board for the FLP include a combination of classroom learning, small group discussions, exercises and worksheets, case studies, application intensives where tools are practiced, and reading assignments (Shiftlett and Purinton, n.d).
The FLP objectives are in direct alignment with those identified by the executive leadership team to bring about the desired changes needed to move the organization closer to its change goals. After reviewing the program components they appear to be well-suited to help participants be able to transfer leadership learning and skills back on the job, to promote cultural change, and to help fill the leadership pipeline. An evaluability needs assessment suggests that the FLP is well positioned to be evaluated according to the stated needs of the client.
THE EVALUATION PROCESS
Purpose of the Evaluation
Our purpose with this Vanderbilt Finance Leadership Program Evaluation Plan is to provide a process the client may use to assess the FLP to determine if the program’s actual impact aligns with the one intended. This evaluation plan will help to determine where and how program effectiveness may be improved, if at all. Specifically, the evaluation plan will look at several aspects of the program’s impact including but not limited to:
The value of the concepts and tools presented to the participants
If the participants actually implemented the tools into their own departmental culture
What changes occurred as a result of implementation
4 | P a g e

How participants were able to apply concepts from the program
How did the use of the tools and concepts improve productivity, processes, and work culture
Closely reviewing the impact of the workshops and application intensives, getting feedback from participants as well as other stakeholders, and repeating this evaluation as a part of each annual offering of the FLP will assist Finance Department leadership with understanding the FLP’s impact.
Key Questions Guiding the Evaluation
The client initially provided several questions she wanted answered about the FLP’s effectiveness. After thoughtful consideration, our group produced three primary focus areas around which these questions seemed to cluster: leadership skills, big picture thinking, and pipeline/succession planning. We then distilled the questions within these categories into a key question which will be used in guiding our evaluation plan.
1. Leadership Skills: Has participants’ use of the tools and principles taught in the FLP improved work productivity and processes of the department?
2. Big Picture Thinking: As a result of the FLP, do the participants find themselves better able to consider the potential impact of their decisions on the internal Vanderbilt clients they serve?
3. Pipeline/Succession: Is the FLP program producing the leaders needed to fill the talent pipeline and meet the Finance Department’s future leadership needs?
Evaluation Method
Vanderbilt’s FLD Program will be evaluated using the CIRO Approach posed by Warr, Bird, and Rackham which frames the evaluation around context, input, reaction, and outcomes (1970). This approach is particularly applicable for leadership development programs and for new programs, both of which are the case here. The CIRO Approach fits well because the client has expressed larger organizational objectives that the program should meet, and CIRO frames an evaluation first with the larger organizational objectives desired. In other words, the first step is to unearth what is lacking, what would fill the gap, and what goals the organization has created that created a need for the intervention in the first place. From this contextual frame, all other inquiries flow down from there, including questions about inputs, participants’ reactions, and outcomes. The CIRO Approach delivers additional value because it allows outcomes to be presented first, thus allowing us to quickly report results that impact the client’s overarching organizational goals.
5 | P a g e
In order to address the FLP’s essential evaluation questions, our use of the CIRO Approach will involve gathering data around the following:
Table 1: FLP CIRO Evaluation Methodology
FLP CIRO Evaluation MethodologyContext What is missing, what is needed, and are the leadership development goals of the Finance
Department (FD) being addressed by The Advisory Board FLP? Is the FLP comprehensive enough to meet all of FD’s leadership goals?
Input What leadership resources (i.e. personnel) are available as a result of the program effort? What supports are necessary to reinforce the changes after the program is completed?
Reaction What do participants perceive regarding the FLP’s relevance and timeliness? What do participant perceive regarding their ability to apply skills learned back on the job?
Outcome Did the FLP sufficiently increase the leadership skills, the big picture thinking capabilities, and the leadership succession pipeline of the joint finance department managers?
Stakeholders
The following tables provide a breakdown of the primary and secondary stakeholders of the FLP. Based upon conversations with our client, we recognize the primary stakeholders as those persons with significant influence and decision-making authority. They have direct impact on the program and will be the major users of the evaluation data. The secondary stakeholders are those directly and indirectly involved with the program with no decision-making authority, as well as, those persons who will indirectly feel impacts of the FLP.
Table 2: Evaluation Stakeholders
Primary Stakeholders (Program Decision Makers)Stakeholder Role
Brett Sweet VU CFOEric Kopstain Associate Vice Chancellor for FinanceWarren Beck Associate Vice Chancellor for Health Affairs for VUMCCohort 1 Participants Senior Managers and Managers receiving trainingDebora Shiflett Director, VUMC Financial Training & Primary
Evaluation Client
Secondary StakeholdersStakeholder Role
Cohort 2 Participants Additional managers receiving trainingNon-participating Finance Department employees Frontline customer interactionsFinance Department Customers Recipients of improved performance
6 | P a g e
FLP Logic Model
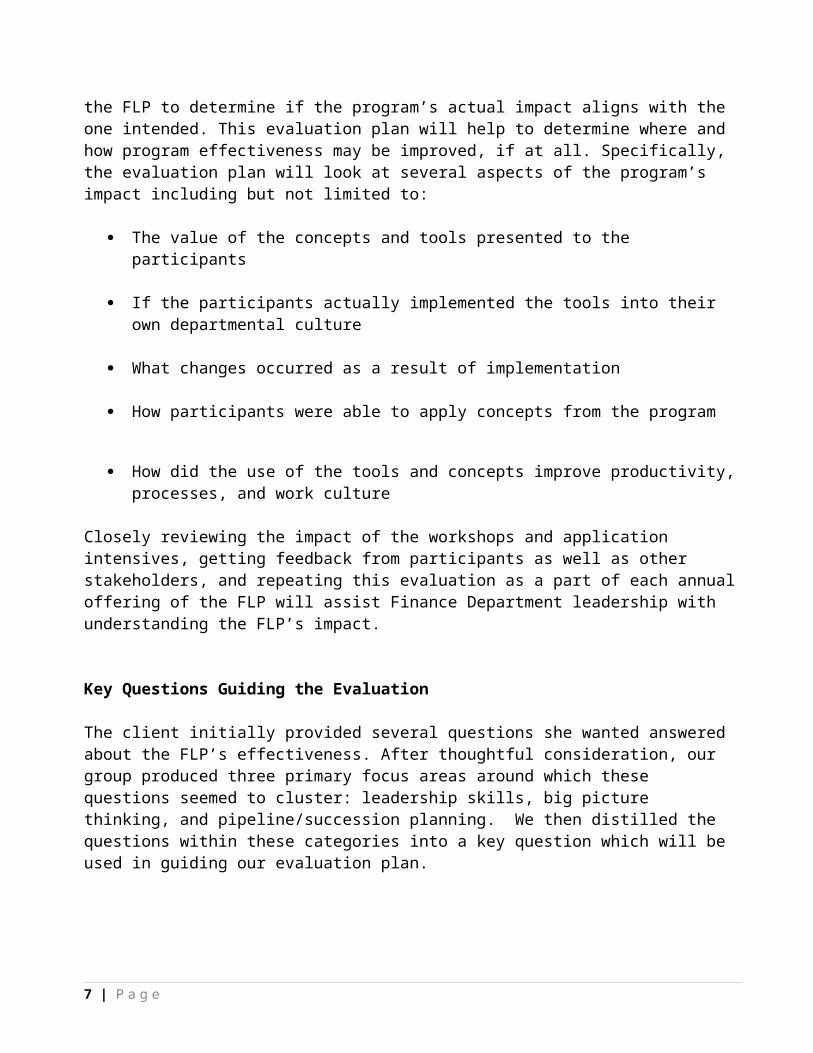
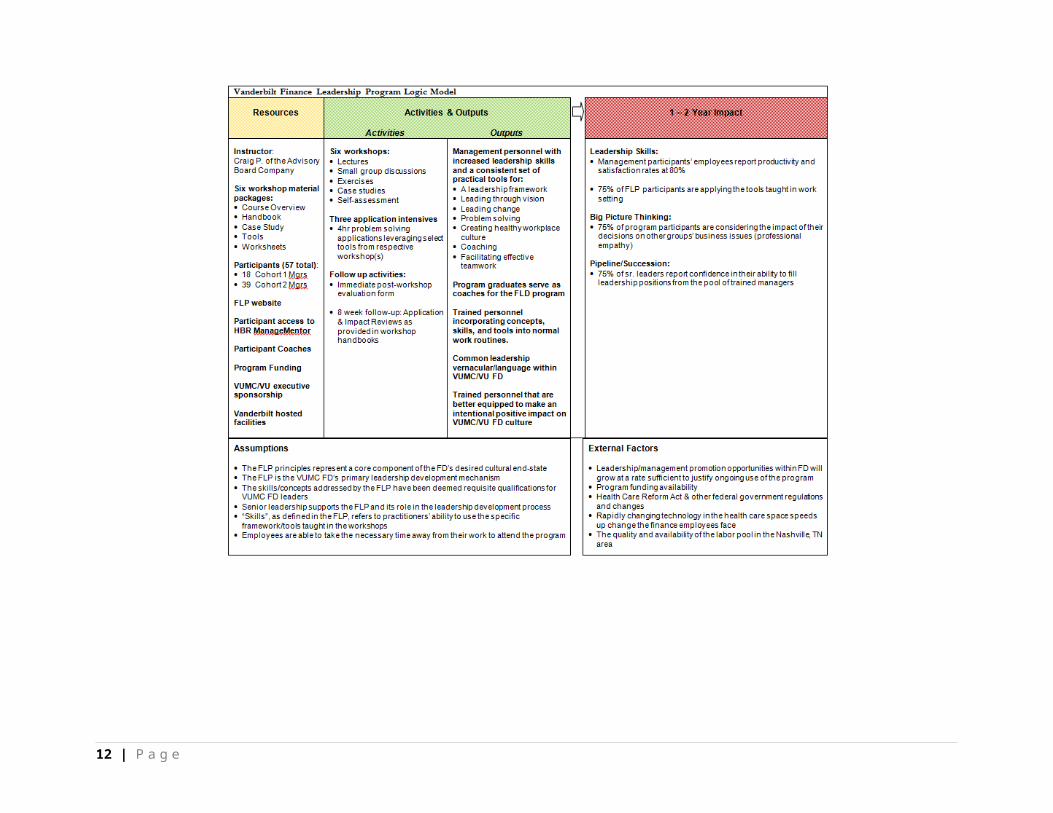
A key tool known as a logic model was designed to gain a clearer understanding from a systems perspective of the FLP program. A logic model is especially useful in making explicit connections between important program components, specifically, the FLP’s resources, activities, outputs, and impacts. By reading left to right, the reader may add the words, “if this, then” to understand how each component of the program directly feeds the next category.
Figure 2: FLP Logic Model
7 | P a g e
Evaluation Design
In crafting a design for the FLP Evaluation, our goal was to link the design to the specific needs of the client and to ensure the design of the evaluation fits with the methodology chosen. The evaluation design provided in Figure 3 is consistent with the CIRO approach in that it will attempt to address the Primary Stakeholder’s key questions within a framework of what the FLP may be lacking (Context), the leadership personnel resources available to the Finance Department as a result of the program (Input), the participants’ perception of the sufficiency/applicability of skills gained (Reaction), and the actual impact the program appears to be having (Outcomes). See section Data Collection Plan and Instruments for specific questions associated with each level of the CIRO model, collection instruments used to assess for them, and the timing for administration.
The following are key components and factors impacting the evaluation’s design:
Structure / Timing1. The evaluation design views the FLP as a single annual treatment consisting of nine
“component treatments” (six workshops / three application intensives) conducted within the first seven months of the annual treatment cycle.
2. The evaluation design uses a mix methods approach consisting of pre/post-test survey design (productivity & satisfaction survey), time series design (reaction survey), and a post-treatment assessments (outcome survey and focus groups). This design will produce both quantitative and qualitative data, the analysis of which is discussed in detail in the Coding Plan and Data Analysis section.
Sampling1. 100% of employees reporting directly to managerial program participants will be given
the pre/post treatment Productivity & Satisfaction Survey2. 100% of program participants will be given the Reaction Surveys and Outcome Survey3. Sampling for the Focus groups will consist of all Cohort 1 participants. Groups should
not consist of more than twelve participants each.
Use of Results 1. All survey questions are designed to track trends within question responses, both within
an annual treatment cycle and year-over treatment comparison. The section labeled Coding Plan and Data Analysis provides details regarding the analysis of instrument results.
2. Results from the pre/post Productivity & Satisfaction Surveys, Reaction Surveys, and Outcome Survey will be compiled into a single report and used as an input for the Debora and the executive team’s decision-making process.
3. Results from focus groups will be used by the evaluation’s primary stakeholders to address the key questions of the evaluation and make programmatic decisions and/or curriculum adjustments regarding the FLP.
8 | P a g e
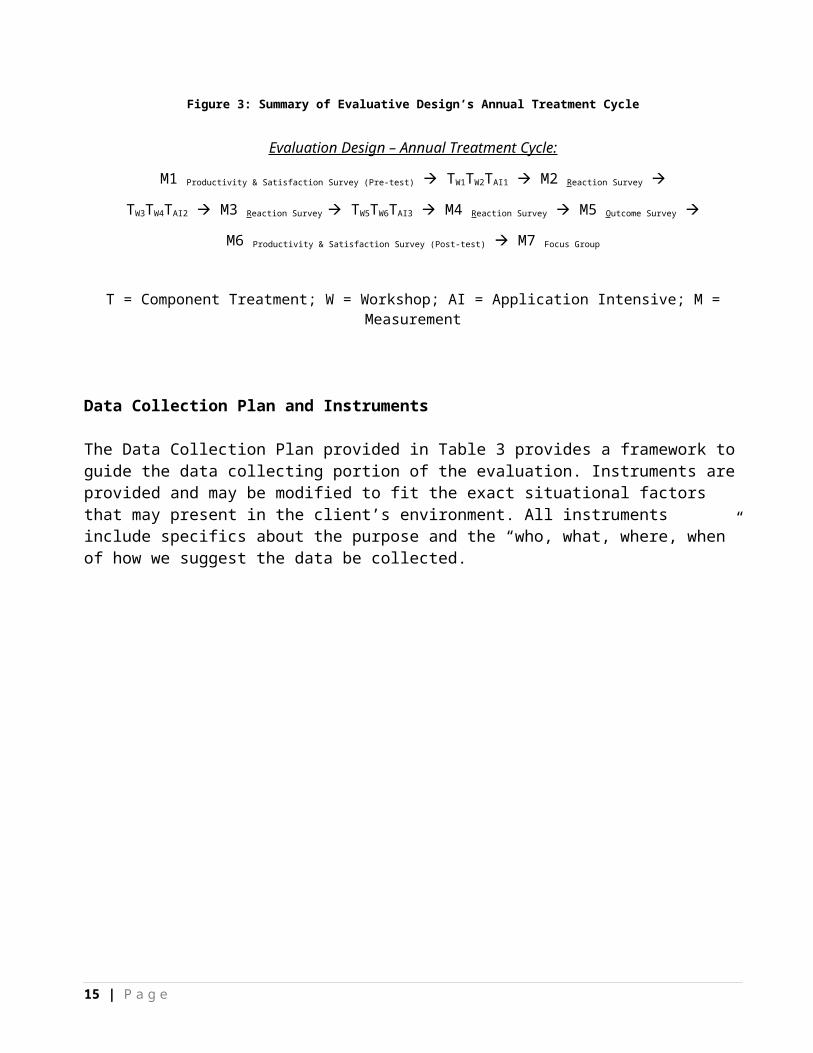
Figure 3: Summary of Evaluative Design’s Annual Treatment Cycle
Evaluation Design – Annual Treatment Cycle:
M1 Productivity & Satisfaction Survey (Pre-test) TW1TW2TAI1 M2 Reaction Survey
TW3TW4TAI2 M3 Reaction Survey TW5TW6TAI3 M4 Reaction Survey M5 Outcome Survey
M6 Productivity & Satisfaction Survey (Post-test) M7 Focus Group
T = Component Treatment; W = Workshop; AI = Application Intensive; M = Measurement
Data Collection Plan and Instruments
The Data Collection Plan provided in Table 3 provides a framework to guide the data collecting portion of the evaluation. Instruments are provided and may be modified to fit the exact situational factors that may present in the client’s environment. All instruments include specifics about the purpose and the “who, what, where, when” of how we suggest the data be collected.
9 | P a g e

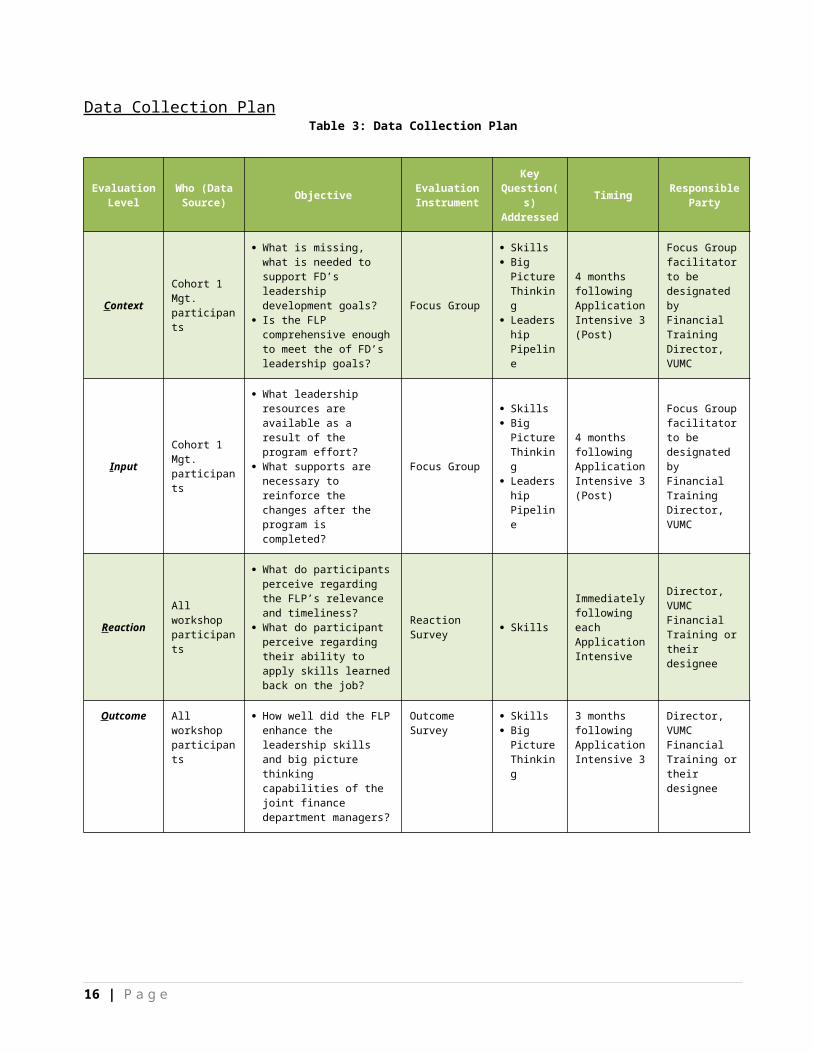
Data Collection PlanTable 3: Data Collection Plan
Evaluation Level
Who (Data Source) Objective Evaluation
Instrument
Key Question(s) Addressed
Timing Responsible Party
Context Cohort 1 Mgt. participants
What is missing, what is needed to support FD’s leadership development goals?
Is the FLP comprehensive enough to meet the of FD’s leadership goals?
Focus Group
Skills Big Picture
Thinking Leadership
Pipeline
4 months following Application Intensive 3 (Post)
Focus Group facilitator to be designated by Financial Training Director, VUMC
Input Cohort 1 Mgt. participants
What leadership resources are available as a result of the program effort?
What supports are necessary to reinforce the changes after the program is completed?
Focus Group
Skills Big Picture
Thinking Leadership
Pipeline
4 months following Application Intensive 3 (Post)
Focus Group facilitator to be designated by Financial Training Director, VUMC
Reaction All workshop participants
What do participants perceive regarding the FLP’s relevance and timeliness?
What do participant perceive regarding their ability to apply skills learned back on the job?
Reaction Survey Skills
Immediately following each Application Intensive
Director, VUMC Financial Training or their designee
Outcome
All workshop participants
How well did the FLP enhance the leadership skills and big picture thinking capabilities of the joint finance department managers?
Outcome Survey Skills Big Picture
Thinking
3 months following Application Intensive 3
Director, VUMC Financial Training or their designee
Employees reporting to Program Participants
Are management participants’ teams displaying increased productivity and employee satisfaction rates?
Productivity & Satisfaction Survey
Skills Big Picture
Thinking Leadership
Pipeline
At participant enrollment (Pre)
Immediately following Application Intensive 3 (Post)
3 months following Application Intensive 3 (Post)
Director, VUMC Financial Training or their designee
Cohort 1 Mgt. participants
What is the confidence level that the FD leadership bench is sufficiently growing as a result of the FLP?
To what extend are we seeing discipline around the use of the tools?
Focus Group
Skills Big Picture
Thinking Leadership
Pipeline
4 months following Application Intensive 3
Focus Group facilitator to be designated by Financial Training Director, VUMC
10 | P a g e

Instrument 1 - Productivity & Satisfaction Survey (Pre/Post)
Objective: Gauge the extent to which participants’ teams are displaying increased productivity and employee satisfaction rates
Responsible Party: Director, VUMC Financial Training or designee
Given to: All Employees reporting to Program Participants; 80-100% response goal
Timing of Administration: Given at time of participant enrollment (Pre) and again at 3 months following Application Intensive 3 (Post); Respondents will be given 2 weeks to respond.
Collection Method: Any free electronic survey tool readily available (e.g. Survey Monkey or in-house tool)
Survey DesignThis survey will be administered using a 5-point Likert scale which should be attached to each of the survey statements below.
ScaleStrongly Agree ☐ Agree ☐ Neutral ☐ Disagree ☐ Strongly Disagree ☐ N/A ☐
Survey Statements1. My work here is meaningful2. I am frequently stressed at work3. My opinions matter to my manager4. My manager’s expectations of me are realistic5. My assigned responsibilities support an appropriate level of professional growth6. I am effectively engaged with my leaders7. I have the necessary support to execute my duties in a consistently efficient manner8. I have the necessary support to create quality work deliverables consistently9. When necessary, I am able to adapt the way I accomplish my work in order to meet the mission of
the Finance Department10. My manager knows how to bring out my best performance
11 | P a g e

Instrument 2 - Reaction Survey
Objective: To gauge the participants’ perception of the FLP’s relevance their ability to apply skills learned back on the job
Responsible Party: Director, VUMC Financial Training or designee
Given to: All workshop participants; 100% response rate goal.
Timing of Administration: Immediately following each Application Intensive
Collection Method: Hardcopy pen/paper survey
Survey DesignThis survey will be administered using a 5-point Likert scale which should be attached to each of the survey statements below.
ScaleStrongly Agree ☐ Agree ☐ Neutral ☐ Disagree ☐ Strongly Disagree ☐ N/A ☐
Survey Statements
Which workshops and application intensive did you most recently complete? (Check One)
____ Workshops 1 & 2 + application intensive 1____ Workshops 3 & 4 + application intensive 2____ Workshops 4 & 5 + application intensive 3
1. The content of these two workshops are relevant to leadership skills in my position. 2. The FLP content is relevant for all finance operations at Vanderbilt.3. The instructor gave the content in a timely manner. 4. I can see the value that applying the FLP will have on other departments5. The skills learned in the FLP increase my ability to understand the impact that my work has on
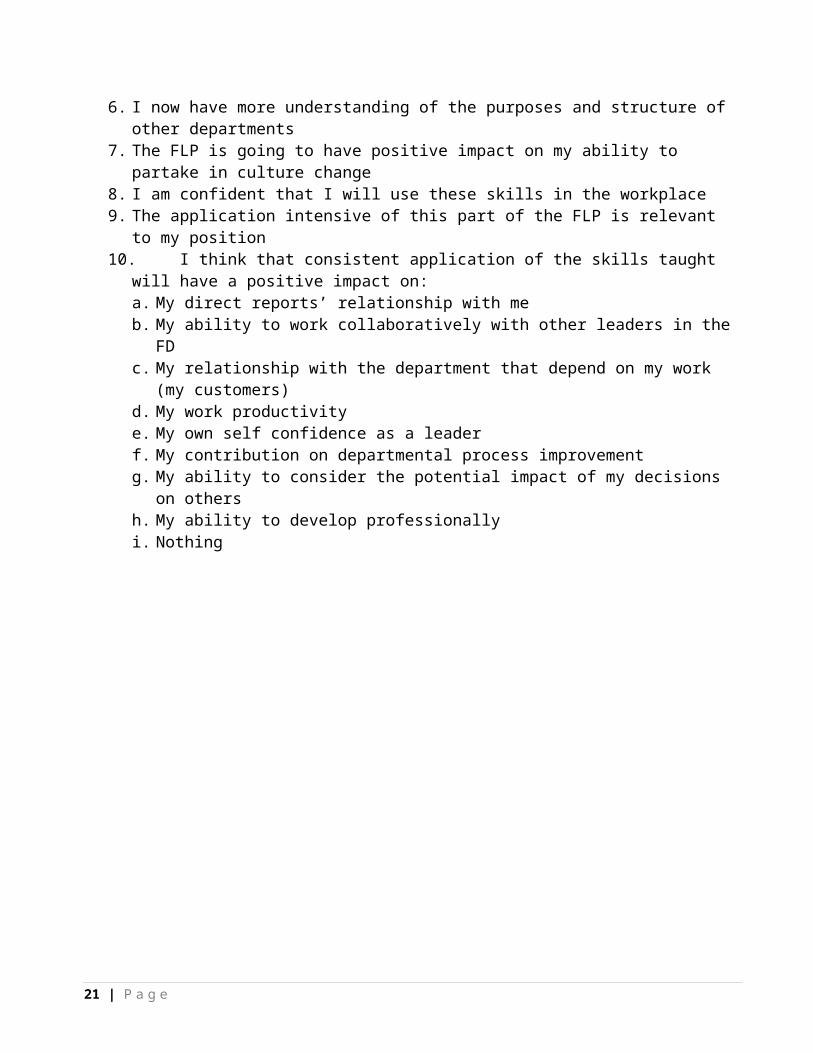
others. 6. I now have more understanding of the purposes and structure of other departments7. The FLP is going to have positive impact on my ability to partake in culture change 8. I am confident that I will use these skills in the workplace9. The application intensive of this part of the FLP is relevant to my position10. I think that consistent application of the skills taught will have a positive impact on:
a. My direct reports’ relationship with meb. My ability to work collaboratively with other leaders in the FDc. My relationship with the department that depend on my work (my customers)d. My work productivity e. My own self confidence as a leaderf. My contribution on departmental process improvementg. My ability to consider the potential impact of my decisions on othersh. My ability to develop professionallyi. Nothing
12 | P a g e
Instrument 3 - Outcome Survey
Objective: Gauge the extent to which participants’ leadership skills and big picture thinking are enhanced and whether they are implementing tools learned.
Responsible Party: Director, VUMC Financial Training or designee
Given to: All Program Participants; 80-100% response goal
Timing of Administration: Given three months following Application Intensive 3; Participants will be given two weeks to respond.
Collection Method: Any free electronic survey tool readily available (e.g. Survey Monkey or in-house tool)
Survey DesignThis survey will be administered using combination of scales which should be attached to each of the survey statements according the “Scales” section below.
Scales Questions 1-7, 5-Likert scale:
Strongly Agree ☐ Agree ☐ Neutral ☐ Disagree ☐ Strongly Disagree ☐ N/A ☐
Question 8, all that apply check-list:
☐ Tried skills that did not work; ☐ Lack of management support; ☐ Lack of relevant opportunity; ☐ Unsure of how to apply skills; ☐ Too busy; ☐ I have not been kept from successfully applying my learning; ☐ Other
Question 9 a-g, single-choice frequency scale:1 time 2 times 3 times 4+ times Never ☐ ☐ ☐ ☐ ☐
Question 10, all that apply check-list:☐ Communication; ☐ Self-Awareness; ☐ Coaching; ☐ Problem Solving; ☐ Facilitation; ☐ Executing Decisions; ☐ Brainstorming; ☐ Emotional Intelligence; ☐ Analyzing Situations; ☐ Leading a Team; ☐ Problem Framing; ☐ Being Visionary; ☐ Motivating Others; ☐ Creating Harmony; ☐ Embracing Change; ☐ Changing Culture
13 | P a g e
Survey Statements
1. As a result of the FLP workshops, I have made positive adjustments in how I make decisions.2. When I make a decision that impacts someone, I follow up with him or her to confirm the
anticipated impact.3. As a result of the FLP workshops, I have made positive adjustments in how I set direction.4. When I am working on a project in a team, I observe my teammates taking into account how their
work decisions affect mine.5. I understand how my decisions impact other employees in the Finance Department.6. As a result of the FLP workshops, I have made positive adjustments in how I mobilize people.7. Throughout the week, I directly engage with those impacted by my work.8. What, if anything, has kept you from successfully applying your learning? (Check all that apply)9. Since completing the FLP workshops and application intensives:
a. I have used the Crafting a Vision tool.b. I have used the Creating a Two Year Blueprint tool.c. I have used the Cultural Alignment Test tool.d. I have used the Assessing Personal Conviction tool.e. I have used the Assessing Stakeholders tool.f. I have used the Maximizing the Potential for Action tool.g. I have used the Planning for Effective Communication tool.
10. Since completing the FLP workshops, what leadership skills have improved? (Check all that apply)
14 | P a g e
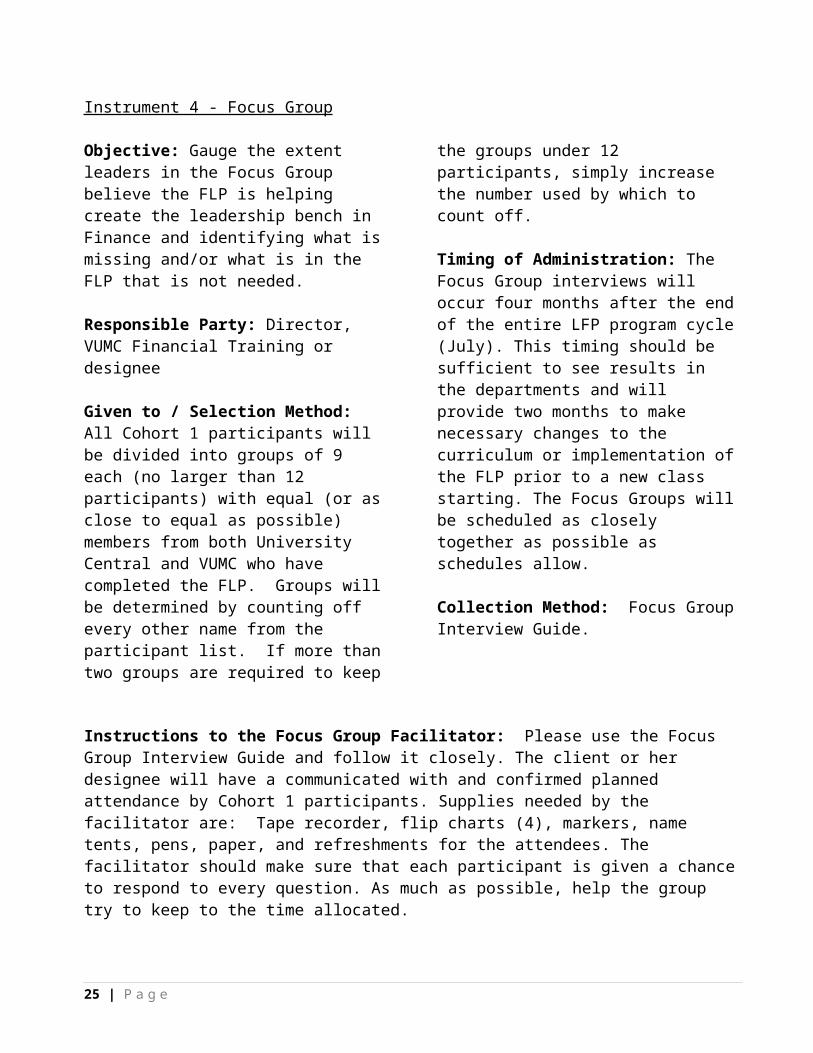
Instrument 4 - Focus Group
Objective: Gauge the extent leaders in the Focus Group believe the FLP is helping create the leadership bench in Finance and identifying what is missing and/or what is in the FLP that is not needed.
Responsible Party: Director, VUMC Financial Training or designee
Given to / Selection Method: All Cohort 1 participants will be divided into groups of 9 each (no larger than 12 participants) with equal (or as close to equal as possible) members from both University Central and VUMC who have completed the FLP. Groups will be determined by counting off every other name from the participant list. If more than two groups are required to keep the groups under 12
participants, simply increase the number used by which to count off.
Timing of Administration: The Focus Group interviews will occur four months after the end of the entire LFP program cycle (July). This timing should be sufficient to see results in the departments and will provide two months to make necessary changes to the curriculum or implementation of the FLP prior to a new class starting. The Focus Groups will be scheduled as closely together as possible as schedules allow.
Collection Method: Focus Group Interview Guide.
Instructions to the Focus Group Facilitator: Please use the Focus Group Interview Guide and follow it closely. The client or her designee will have a communicated with and confirmed planned attendance by Cohort 1 participants. Supplies needed by the facilitator are: Tape recorder, flip charts (4), markers, name tents, pens, paper, and refreshments for the attendees. The facilitator should make sure that each participant is given a chance to respond to every question. As much as possible, help the group try to keep to the time allocated.
Focus Group Interview Guide
Thank you for attending the FLP Focus Group session today. My name is ___________________ , and I am a member of the team evaluating the Finance Leadership Program that you participated in over the course of seven months. Your input is especially helpful because of your leadership experience at Vanderbilt and having been program participants.
Over the course of the next two hours, I will be asking several questions about your opinions and experiences with the program. It is important that you provide honest and candid feedback since the organization wants to learn about the results of the program. The feedback you provide will help the organization learn about possible ways to improve the program where needed and to understand ways the FLP is or is not successful. The questions will revolve around three major goals of the FLP.
[Facilitator may create and show a PowerPoint (PPT) slide that has these key areas of inquiry about the FLP:
15 | P a g e
1. Learning and Cultivating Leadership Skills Important to Vanderbilt2. Enhancing Big Picture Thinking on the Job3. Filling the Leadership Pipeline for Finance]
As you answer the questions, I will record what you’re saying on the flip chart. Please let me know if what I record is accurate. This session will also be tape-recorded to make sure your ideas are captured completely.
All the information gathered today will be treated confidentially; names will not be used in the evaluation report. Your name tent includes a number, and this number will be used next to your comment. This will tell us how many people provided various comments as well providing anonymity during analysis of your feedback.
We are looking for everyone’s insights on the program, so it’s important we hear from all of you to gain a wide range of opinions.
Your tables include paper and pens for making any notes you wish to make while others are talking so you don’t forget what you’d like to say. Refreshments are provided, so please enjoy them any time during the session. There is a Sign-In sheet circulating, so please be sure to record your presence today.
Do you have questions before getting started?
Great—let’s go ahead and get started. Let’s begin by asking each person to introduce him- or her-self.
1. You are all leaders in the Finance departments at Vanderbilt and have all been through the FLP. If you look at the PPT slide and consider the three categories listed, what worked well with the FLP? [Facilitator may display the PPT slide at this time to remind participants of the FLP program goals]
2. If you think again about the concepts on the PPT slide, to what extent is the FLP meeting the leadership learning needs necessary to meet the goals of Finance?
3. Was there some aspect about leadership that is needed in the Finance departments but not represented in the FLP program?
16 | P a g e
4. Considering the goals on the PPT slide, were any aspects of the FLP not relevant in meeting
these goals and why were they not relevant?
5. What human resources and/or capabilities are now available as a result of the FLP, if any?
6. Are there additional supports that need to be put in place to reinforce positive changes you have noticed from the FLP?
7. What impact, if any, is the FLP having on growing the leadership “bench” in Finance?
8. To what extent, if at all, do you see tools learned in the FLP used by participants? [Recommend that the facilitator create/display a PPT slide showing the tools taught in the FLP:
o Crafting a Vision, o Creating a Two-Year Blueprinto Assessing Personal Convictiono Assessing Stakeholderso Maximizing Potential for Actiono Planning for Effective Communication]
8A. Probe: Are any tools missing in the FLP that need to be added?
9. To what extent have you seen use of the tools enhance departmental and/or individual performance?
10. My final question to each of you is this: If you were king or queen of Vanderbilt for a day and you could make any changes you wish to the FLP or any aspect of leadership development in Finance, what would you do? (Feel free to think big here…money and time are no objects.)
Those are all the questions I have for you today. Thank you for participating and for your input. Once we complete the evaluation, we will provide feedback to this group and the executive team about results and recommendations. Thank you again for attending. Have a nice day.
17 | P a g e

Coding Plan and Data Analysis
Each instrument collects specific data which will be used to inform the client and the other decision makers on the executive team. Detailed coding plans and suggestions for ways to analyze the data are provided in sample charts. The client may need to make adjustments as necessary once the collected data is in hand.
Instrument 1 - Productivity & Satisfaction Survey
Purpose: The results of this survey may be used to evaluate for the levels and trends for the self-reported productivity and satisfaction of employees whose managers are participating in the FLP program. The FLP Logic Model assumes that 80% of employees surveyed will report productivity and satisfaction at the Strongly Agree or Agree level.
The results of this survey may be used by decision makers in conjunction with the results of the Focus Group and Outcome Survey results to gain a comprehensive view of the outcomes resulting from the FLP.
Coding & Data Analysis: The following describes how to code and analyze the data captured by the Productivity & Satisfaction Survey.
Questions from this survey are bucketed into two primary categories:
Satisfaction Indicators (1-5)1. My work here is meaningful2. I am frequently stressed at work3. My opinions matter to my manager4. My manager’s expectations of me are realistic5. My assigned responsibilities support an
appropriate level of professional growth
Productivity Indicators (6-10)6. I am effectively engaged with my leaders7. I have the necessary support to execute my
duties in a consistently efficient manner8. I have the necessary support to create quality
work deliverables consistently9. When necessary, I am able to adapt the way I
accomplish my work in order to meet the mission of the Finance Department
10. My manager knows how to bring out my best performance
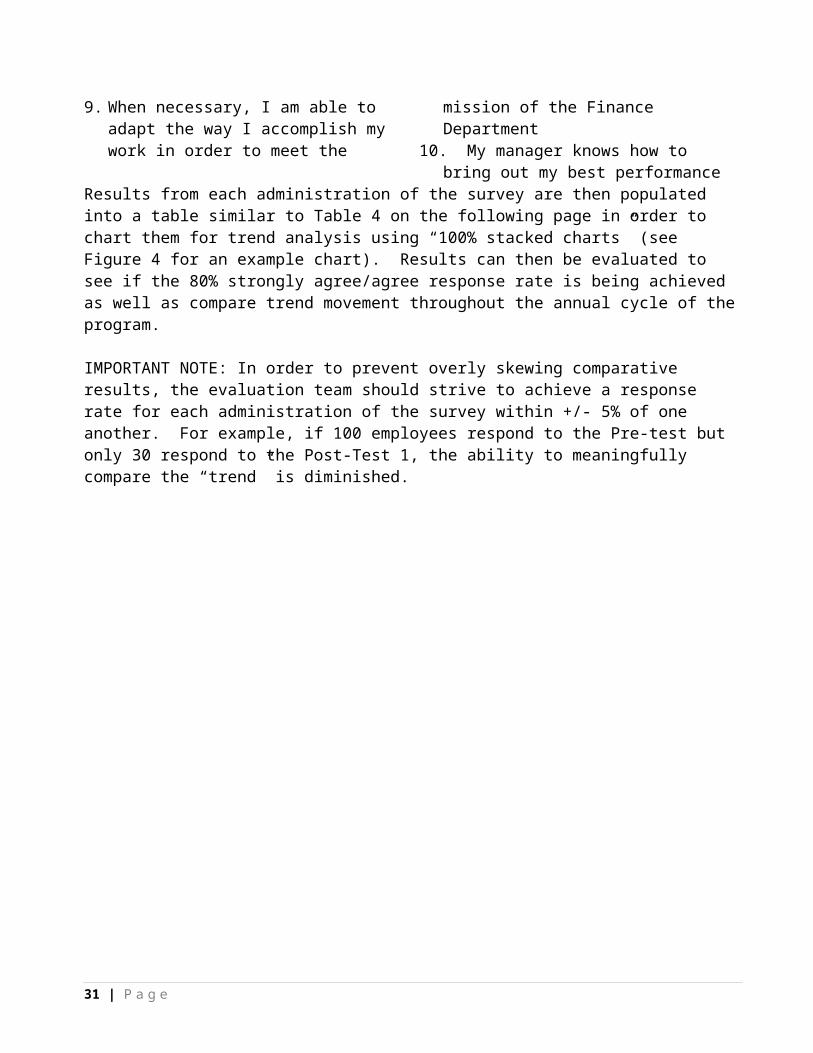
Results from each administration of the survey are then populated into a table similar to Table 4 on the following page in order to chart them for trend analysis using “100% stacked charts” (see Figure 4 for an example chart). Results can then be evaluated to see if the 80% strongly agree/agree response rate is being achieved as well as compare trend movement throughout the annual cycle of the program.
IMPORTANT NOTE: In order to prevent overly skewing comparative results, the evaluation team should strive to achieve a response rate for each administration of the survey within +/- 5% of one another. For example, if 100 employees respond to the Pre-test but only 30 respond to the Post-Test 1, the ability to meaningfully compare the “trend” is diminished.
18 | P a g e

Table 4: Example Productivity & Satisfaction Survey Data Capture Table
Pre-Test Post-Test 1 Post-Test 2 Pre-Test Post-Test 1 Post-Test 2Strongly Agree / Agree 42 42 44 27 48 43Neutral 1 3 1 4 6 9Disagree / Strongly Disagree 36 13 10 27 13 28n/a 2 5 1 4 4 4
Satisfaction Productivity
Figure 4: Example Productivity & Satisfaction Results Chart
0%10%20%30%40%50%60%70%80%90%
100%
Pre-
Test
Post
-Tes
t 1
Post
-Tes
t 2
Pre-
Test
Post
-Tes
t 1
Post
-Tes
t 2
Satisfaction Productivity
n/a
Disagree / Strongly Disagree
Neatral
Strongly Agree / Agree
Optional Control Group Administration: The evaluation team may wish to use a control group design when administering this survey in order to further isolate for impact directly attributable to the FLP. Under this scenario the evaluation team would also administer this survey to a comparable group of Finance Department employees whose managers are not participating in the FLP (i.e. control group). The control group results would then be analyzed as described herein and compared to the results of the employees whose managers are participating in the program. The expectation of results would be that the overall productivity and satisfaction rates would be higher in the FLP group than in the control group. If results trend together then it is indicative that productivity and satisfaction levels of employees whose managers participate in the FLP are not being significantly influenced by their managers’ participation, regardless of the levels reported.
19 | P a g e

Instrument 2 - Reaction Survey
Purpose: The results of this survey may be used to evaluate for the levels and trends for initial reactions of FLP participants. The FLP Logic Model assumes that 75% of participants are applying skills in the work setting at a Strongly Agree or Agree level; therefore, the reaction survey results will provide the anticipated use from participants that should align with the 75% that will use the skills.
Decision makers may use the results of this survey in conjunction with the results of the Focus Group, Outcome Survey, and Productivity & Satisfaction Survey results to gain a comprehensive view of the outcomes resulting from the FLP.
Coding & Data Analysis: The following describes how to code and analyze the data captured by the Reaction Survey.
Questions from this survey are bucketed into two primary categories:
Relevancy & Timeliness Indicator (1-3)1. The content of these two workshops are relevant to leadership skills in my position. 2. The FLP content is relevant for all finance operations at Vanderbilt.3. The instructor gave the content in a timely manner.
Anticipated Ability to use Tools Indicator (4-10)4. I can see the value that applying the FLP will have on other departments5. The skills learned in the FLP increase my ability to understand the impact that my work has
on others. 6. I now have more understanding of the purposes and structure of other departments7. The FLP is going to have positive impact on my ability to partake in culture change 8. I am confident that I will use these skills in the workplace9. The application intensive of this part of the FLP is relevant to my position10. I think that consistent application of the skills taught will have a positive impact on:
a. My direct reports’ relationship with meb. My ability to work collaboratively with other leaders in the FDc. My relationship with the department that depend on my work (my customers)d. My work productivity e. My own self confidence as a leaderf. My contribution on departmental process improvementg. My ability to consider the potential impact of my decisions on othersh. My ability to develop professionallyi. Nothing
20 | P a g e

Results from each administration of the survey are then populated into a table similar to Table 5 below on the following page in order to chart them for analysis using “100% stacked charts” (see Figure 6 for an example chart). Results can then be evaluated to see if the 75% strongly agree/agree response rate is being achieved for the concepts/tools associated with the respective Application Intensives.
Table 5: Example Results Survey Data Capture Table
Part 1 Part 2 Part 3 Part 1 Part 2 Part 3Strongly Agree / Agree 42 42 44 27 48 43Neutral 1 3 1 4 6 9Disagree / Strongly Disagree 36 13 10 27 13 28n/a 2 5 1 4 4 4
Relevance & Timeliness Anticipated Ability to use Tools Indicator
Figure 5: Example Results Survey Data Results Chart
21 | P a g e
Instrument 3 - Outcome Survey
Purpose: The results of this survey may used to evaluate the levels of application of tools by participants of the FLP, as well as, the enhancement of leadership skills and big picture thinking as a result of the FLP. The FLP Logic Model assumes that 75% of participants will strongly agree or agree that they are applying the tools taught in the FLP. The Logic Model also assumes that 75% of participants will strong agree or agree that they are considering the impact of their decisions on others (professional empathy) after completing the FLP.
The results of this survey may be used by decision makers in conjunction with the results of the Focus Group, the Productivity & Satisfaction Survey, and Reaction Survey to gain a comprehensive view of the outcomes resulting from the FLP.
Coding & Data Analysis: The following describes how to code and analyze the data captured by the Outcome Survey.
Questions from this survey are bucketed into two primary categories:
Leadership Skill Indicators (Questions 1, 3, 6, 8, 9, 10)1. As a result of the FLP workshops, I have made positive adjustments in how I make decisions.3. As a result of the FLP workshops, I have made positive adjustments in how I set direction.6. As a result of the FLP workshops, I have made positive adjustments in how I mobilize people.8. What, if anything, has kept you from successfully applying your learning? 9. Since completing the FLP workshops and application intensives (responses a-g)10. Since completing the FLP workshops, what leadership skills have improved?
Big Picture Thinking Indicators (1, 2, 4, 5, 7)1. As a result of the FLP workshops, I have made positive adjustments in how I make decisions.2. When I make a decision that impacts someone, I follow up with him or her to confirm the
anticipated impact.4. When I am working on a project in a team, I observe my teammates taking into account how their
work decisions affect mine.5. I understand how my decisions impact other employees in the Finance Department.7. Throughout the week, I directly engage with those impacted by my work.
Analysis of Questions 1-7 (Likert Scale Reponses)Responses from questions 1-7 can divided into the two categories of indicators shown above, analyzed using 100% stacked charts, and evaluated to see if the 75% strongly agree/agree response rate is being achieved. Table 6 and Figure 6 below provide an example of how this might be done:
Table 6: Example Outcome Survey Data Table (Likert Reponses)
Leadership SkillsBig Picture
ThinkingStrongly Agree / Agree 41 37Neutral 5 7Disagree / Strongly Disagree 30 23n/a 5 13
22 | P a g e

Figure 6: Example Outcome Survey Results Chart (Likert Reponses)
0%
10%
20%
30%
40%
50%
60%
70%
80%
90%
100%
Leadership Skills Big Picture Thinking
Outcome Survey Results
n/a
Disagree / Strongly Disagree
Neatral
Strongly Agree / Agree
Analysis of Question 8Responses from question 8’s multi-selection question may be tabled and charted to provide insight into the most commonly reported barriers to applying learning provided via the FLP. Table 7 and Figure 7 below provide an example of how this might be done:
Table 7: Example Outcome Survey Data Table (Question 8)
Skills did not work
Lack of mgmt support
Lack of opportunity
Unsure how to apply Too busy
Successfully applied learning Other
Number of Selections 37 50 38 48 69 57 26
Challenges to Implenting Learning
Figure 7: Example Outcome Survey Results Chart (Question 8)
0 10 20 30 40 50 60 70 80
Skills did not work
Lack of mgmt support
Lack of opportunity
Unsure how to apply
Too busy
Successfully applied learning
Other
Chal
leng
es to
Impl
entin
g Le
arni
ng
Barriers to Applying Learning
Number of Selections
23 | P a g e

Analysis of Question 9Responses from question 9 may be tabled and charted using 100% stacked charts to provide insight into the frequency of which each of the tools provided via the FLP are being used by participants. The logic model assumes that 75% of participants will have used each of the tools at least one time. Table 8 and Figure 8 below provide an example of how results might be displayed:
Table 8: Example Outcome Survey Data Table (Question 9)
Crafting a Vision
Creating Two Yr Blueprint
Cultural Alignment
Personal Conviction
Assess Stakeholders
Max. Potential for Action
Effective Communication
1 time 35 40 34 47 30 24 172 times 2 12 12 26 13 12 223 times 36 2 17 11 12 16 164+ times 2 0 8 3 9 6 9Never 6 35 14 13 27 13 20
Tools of the FLP
Figure 8: Example Outcome Survey Results Chart (Question 9)
0%
10%
20%
30%
40%
50%
60%
70%
80%
90%
100%
Crafting a Vision Creating Two YrBlueprint
Cultural Alignment PersonalConviction
AssessStakeholders
Max. Potential forAction
EffectiveCommunication
Never
4+ times
3 times
2 times
1 time
24 | P a g e

Analysis of Question 10Responses from question 10’s multi-selection question may be tabled and charted to provide insight into the leadership skill most improved as a result of participation in the FLP. Table 9 and Figure 9 below provide an example of how this might be done:
Table 9: Example Outcome Survey Data Table (Question 10)
CommunicationSelf-
Awareness CoachingProblem Solving Facilitation
Executing Decisions Brainstorming
Emotional Intelligence
Analyzing Situations Leading a Team
Problem Framing Being Visionary
Motivating Others
Creating Harmony
Embracing Change
Changing Culture
Number of Selections 37 64 38 42 28 30 41 14 47 60 37 40 15 44 31 11
Leadership Skills of the FLP
Figure 9: Example Outcome Survey Results Chart (Question 10)
0 10 20 30 40 50 60 70
Communication
Self-Awareness
Coaching
Problem Solving
Facilitation
Executing Decisions
Brainstorming
Emotional Intelligence
Analyzing Situations
Leading a Team
Problem Framing
Being Visionary
Motivating Others
Creating Harmony
Embracing Change
Changing Culture
Lead
ersh
ip S
kills
of t
he F
LP
Leadership Skills Improvement
Number of Selections
25 | P a g e
Instrument 4 - Focus Group
Purpose: Focus Group interviews with Cohort 1 will provide qualitative data from key financial participant-leaders around to what extent the Outcomes, Input, and Context questions are being addressed by the FLP.
Coding & Data Analysis: We recommend analyzing the qualitative data from the Focus Groups by deriving semantic meaning from responses and linking them to themes that surface from the Focus Group Interviews. Themes have been provided that we believe will help categorize responses and will allow the client to place them into buckets of like-minded or similar responses. Look for recurring or strong themes that appear. This will allow the client to calculate what percent of all responses revolve around a certain theme and to identify the most outstanding themes by the number of responses given.
The Coding Key below provides all the interview questions with examples of possible themes around certain concepts related to the questions. The Coding Key may be used as a guide to keep track of participant responses and tabulate them according to themes. The Coding Key provided below may be adjusted to fit the actual qualitative data gathered from the Focus Groups. Please add, subtract, or modify the themes as necessary to match up with actual results.
We suggest recording the number of times a response is made from the Focus Groups’ flip chart pages and tallying them in a Focus Group Coding Spreadsheet. Once all the responses have been recorded in the boxes on the spreadsheet, counting up how many times a theme was mentioned will yield important data. It will be clear by the emerged themes which ideas or suggestions regarding the FLP are most important to the Focus Group participants. Quantitative data, such as “X percent of all responses on Question 10 indicated that we should open up the FLP to all Finance employees” may be calculated from the qualitative interview process. This quantitative data will yield results and answers to the essential evaluation questions. To help provide a method of converting the qualitative data into quantitative results, a Focus Group Coding Spreadsheet has been provided in a separate document attached to the Evaluation Portfolio.
Coding Key—Likely Themes Mentioned By Participants
1. You are all leaders in the Finance departments at Vanderbilt and have all been through the FLP. If you look at the PPT slide and consider the three categories listed, what worked well with the FLP?
a. Interesting presenter/ great presenter/we like the facilitatorb. Relevant content/ we can use this stuffc. Insightful discussion with colleagues/ learned from the group conversationsd. Application to my real projects at work/ I actually got work done during traininge. Exercises that applied what we learned/ application intensivesf. Stories colleagues told about real experiences/ personal testimonies/examples at workg. Other
2. If you think again about the concepts on the PPT slide, to what extent is the FLP meeting the leadership learning needs necessary to meet the goals of Finance?
26 | P a g e

a. It was comprehensive/covered everything/ it was on targetb. Useful to my work/ applicablec. Skills training is not what we need/ this is not the problemd. I didn’t find it useful/ it was a waste of time and moneye. FLP is missing key leadership concepts like team building, living with ambiguity, etcf. Who decided this is what we need to learn / what is the FLP based ong. Other
3. Was there some aspect about leadership that is needed in the Finance departments but not represented in the FLP program?
a. It was comprehensive/ can’t think of anything elseb. Need benchmarking with institutions like us / what do places like us do that worksc. It was missing topics around:
i. Emotional intelligence/interpersonal skills/personal managementii. Systems thinking/ holistic perspective
iii. Project management/ getting stuff doneiv. Dealing with Conflict/ dysfunction between people v. Other
d. Leveraging other Finance Department’s strengths/ working together is smarte. Helping with other Finance department’s challenges/ we need what they havef. Other
4. Considering the goals on the PPT slide, were any aspects of the FLP not relevant in meeting these goals and why were they not relevant?
a. All or most items were relevant/ built appropriate skillsb. Some skills not relevant enough/ won’t use them very much/non-productivec. Was relevant but too simple / not deep enough/ too superficial at our level/ too generald. Some group discussions were not productive/ people were allowed to go off on tangentse. Some aspects of the FLP seemed like busy work/ wasted timef. Not relevant to delivering better customer solutions/ did not target our customer prioritiesg. Other
5. What human resources and/or capabilities are now available as a result of the FLP, if any?
a. I liked them / they were all appropriate or relevantb. The FLP is a good foundation to be built upon/ good startc. I didn’t like them / no significant change noticed in people or what they can do/ pipeline not
helpedd. Employees can be developed further now that they have a common language/ helped begin to
fill pipelinee. Participants are more strategic in decision making/ big picture thinkingf. Other
27 | P a g e

6. Are there additional supports that need to be put in place to reinforce positive changes you have noticed from the FLP?
a. Participant reunions/ ongoing forums to continue the conversations/ refresher eventsb. Leadership colloquium for Finance/ ongoing series of formal leadership activities/ take more
advantage of leadership resources at VU/ guest professor-speakersc. More senior leadership support through continual communication/ leadership walks the walk,
not just talks the talkd. Leadership links FLP with strategic priorities/ why is this important to where we’re
headed/where are we headede. Incentivize/ tie to performance reviews/ bonuses for helping rising starsf. Phase II FLP program/ go deeper into the contentg. Other
7. What impact, if any, is the FLP having on growing the leadership “bench” in Finance?a. Nothing/ it has to happen on its ownb. It is increasing the potential bench/ we see stars risingc. Leadership serves as role models/ more mentoring/ more coachingd. Highlights need for aggressive succession planning/ we need to escalate the process/ pending
retirements of key leaderse. Other
8. To what extent, if at all, do you see tools learned in the FLP used by participants?
a. I have seen the tools used at work/ I heard people are using themb. I have rarely seen the tools used/ no one talks about themc. They are being used, but I predict only for a short time/ this might be a fadd. We are too busy to use the tools/ tools were a waste of time
8A. Probe: Are any tools missing in the FLP that need to be added?
a. How to deal with problem colleagues/ getting the wrong people off the busb. Managing office politics/ being politically correct and effectivec. Creating greater customer collaboration/ forging customer partnershipd. Managing up/ How do I lead my leadere. How to be a better follower/leader-follower relationshipf. Collaborative negotiation/ getting to “yes” so everyone winsg. Other
9. To what extent have you seen use of the tools enhance departmental and/or individual performance?
a. None / Not going to helpb. Some / Little / It’s a good startc. Direct impact/ improves the list of potential successors
28 | P a g e

d. Only in the short term / temporarye. Improved customer satisfaction rating/ customers noticing a positive differencef. Improved employee satisfaction rating/ employees more engaged, motivatedg. Improved individual performance review ratings/ better work performance, productsh. Employees more confident to apply for higher leadership positions/ employees feel more
empoweredi. Other
10. My final question to each of you is this: If you were king or queen of Vanderbilt for a day and you could make any changes you wish to the FLP or any aspect of leadership development in Finance, what would you do? (Feel free to think big here…money and time are no object).
a. Embedding with customers for bigger picture thinking/short-term assignments at customer location
b. Have one finance department instead of two/ combine our teams/cross trainingc. Ice cream Fridays/ social events/ social media contentsd. The Advisory Board facilitator become a full-time trainer/ add staff person dedicated to
leadership learning e. Open up the FLP to all Finance employees/ other departmentsf. FLP should be all action learning with little or no classroom learning/ real world work project
cases to work on together as Cohortg. Virtual online leadership courses available 24/7
Focus Group CodingDuring the interview, Focus Group participants may comment on multiple ideas or themes in their responses. Figure 10 below provides a sample of how evaluators should be diligent to watch for this and to code multiple ideas appropriately.
29 | P a g e

Figure 10: Focus Group Coding Example
Possible Coding Responses TOTALa. I have seen the tools used at work/ I heard people are using them Ib. I have rarely seen the tools used/ no one talks about them Ic. They are being used, but I predict only for a short time/ this might be a fad Id. We are too busy to use the tools/ tools were a waste of time
Sample Coding ChartQuestion 8: To what extent, if at all, do you see tools learned in the FLP used by participants?Answer: Member #1 : "I see it every once in a while. I guess a 10% change is better than nothing." Member#2: "Right. I've seen a lot of my people really take advantage and use the communication tools with each other. I've got one guy who's been really fired up since it started. But I don't think it will last, I'm already seeing his old ways start to take over."
Presentation Plan
We believe our client is best served by providing the plan in Table 10 for communicating results of the evaluation plan to the appropriate parties. For our purposes, the two stakeholder groups identified as communication targets for the evaluation results will be Cohort 1 participants and Brett Sweet & the VU Finance Executive team. Presentations with Cohort 1 will focus on communicating survey results, initial implications in terms of programmatic decision-making, and soliciting verification of recommendations to be brought to Brett Sweet and the executive team. Presentations to the Executive team will report high-level results and recommended program changes that may require executive leadership discussions and approvals.
30 | P a g e

Table 10: Evaluation Results Communication Plan
Communications by Stakeholder AudiencesStakeholder Role/Stake Communication Plan
Cohort 1 Participants
Senior Manager participants in the FLP who also have significant influence into shaping recommendations of any needed adjustments to the FLP
Within 30-days of completion of the final focus group, we recommend that a working meeting be conducted with all Cohort 1 participants to review and verify the evaluation’s initial findings
It is recommend that a briefing package which contains the following pieces of information be provided to Cohort 1 participants in advance of that working meeting:o Key questions addressed by the evaluationo Summary of initial programmatic implications currently
thought to be resulting from the evaluationo Supporting data tables and charts produced by each of the
surveys and summarized results of focus group The agenda of the working meeting may include the following:
o Confirming with the group the validity of initial implications stemming from the results
o Moving toward consensus regarding the set of programmatic adjustments/ recommendations that will be presented to the executive committee
o Identifying any additional KPI’s needed for the FLP and initial thoughts on how to monitor them
Brett Sweet & Executive Team
VU CFO and other leadership of VU Finance Departments who have the ultimate decision making authority (including funding) regarding the FLP
Prior to the kick-off of the second FLP offering, conduct in-person FLP debrief with VU Finance Department Executive Leadership that will focus on:o Summary of key evaluative findings organized by the three 3
key questions around leadership skills enhanced, big picture thinking fostered, and confidence level that the leadership pipeline is being built appropriately
o Summary of FLP strengths/weakness based on themes identified in the focus groups and supported by survey results
o Programmatic adjustments/recommendations being made as a result of the evaluation, including any revised Key Performance Indicators (KPI) that will be introduced as a way enhance ability to monitor the effectiveness of the FLP going forward
31 | P a g e
References
Shiftlett, D., & Purinton, A. (n.d.). Finance Leadership Program. VUMC Department of Finance. Retrieved September 30, 2012, from https://dof.mc.vanderbilt.edu/ft/Pages/vu/Leadership/FLP.aspx
Shiftlett, D. (2012, October 14). Team questions regarding the FLP [Telephone interview].
Shiftlett, D. (2012, September 25). Vanderbilt Finance Department. Address presented at LPO Evaluation 3150 Class in Vanderbilt University's Peabody College, Nashville, TN.
Warr, P. B., Bird, M. W., & Rackham, N. (1970). Evaluation of management training: A practical framework, with cases, for evaluating training needs and results. London: Gower P.
32 | P a g e