Embed Size (px)
Citation preview
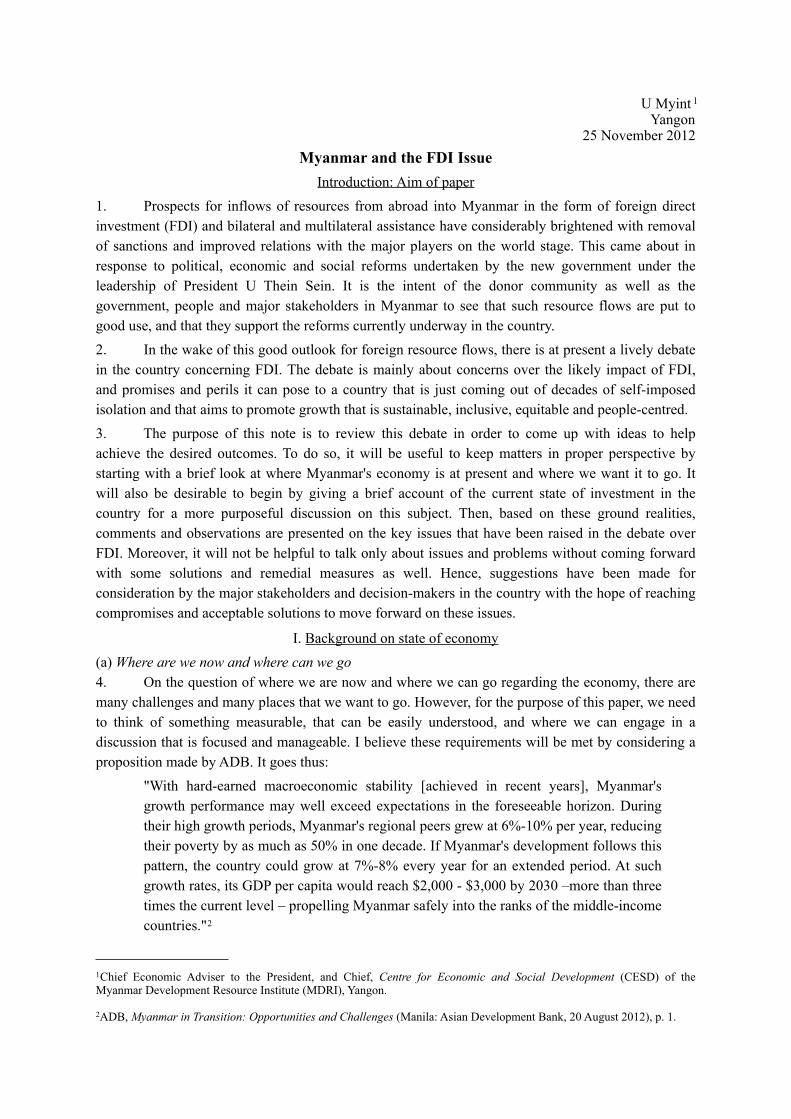
U Myint 1
Yangon25 November 2012
Myanmar and the FDI IssueIntroduction: Aim of paper
1. Prospects for inflows of resources from abroad into Myanmar in the form of foreign direct investment (FDI) and bilateral and multilateral assistance have considerably brightened with removal of sanctions and improved relations with the major players on the world stage. This came about in response to political, economic and social reforms undertaken by the new government under the leadership of President U Thein Sein. It is the intent of the donor community as well as the government, people and major stakeholders in Myanmar to see that such resource flows are put to good use, and that they support the reforms currently underway in the country. 2. In the wake of this good outlook for foreign resource flows, there is at present a lively debate in the country concerning FDI. The debate is mainly about concerns over the likely impact of FDI, and promises and perils it can pose to a country that is just coming out of decades of self-imposed isolation and that aims to promote growth that is sustainable, inclusive, equitable and people-centred. 3. The purpose of this note is to review this debate in order to come up with ideas to help achieve the desired outcomes. To do so, it will be useful to keep matters in proper perspective by starting with a brief look at where Myanmar's economy is at present and where we want it to go. It will also be desirable to begin by giving a brief account of the current state of investment in the country for a more purposeful discussion on this subject. Then, based on these ground realities, comments and observations are presented on the key issues that have been raised in the debate over FDI. Moreover, it will not be helpful to talk only about issues and problems without coming forward with some solutions and remedial measures as well. Hence, suggestions have been made for consideration by the major stakeholders and decision-makers in the country with the hope of reaching compromises and acceptable solutions to move forward on these issues.
I. Background on state of economy(a) Where are we now and where can we go4. On the question of where we are now and where we can go regarding the economy, there are many challenges and many places that we want to go. However, for the purpose of this paper, we need to think of something measurable, that can be easily understood, and where we can engage in a discussion that is focused and manageable. I believe these requirements will be met by considering a proposition made by ADB. It goes thus:
"With hard-earned macroeconomic stability [achieved in recent years], Myanmar's growth performance may well exceed expectations in the foreseeable horizon. During their high growth periods, Myanmar's regional peers grew at 6%-10% per year, reducing their poverty by as much as 50% in one decade. If Myanmar's development follows this pattern, the country could grow at 7%-8% every year for an extended period. At such growth rates, its GDP per capita would reach $2,000 - $3,000 by 2030 –more than three times the current level – propelling Myanmar safely into the ranks of the middle-income countries."2
1Chief Economic Adviser to the President, and Chief, Centre for Economic and Social Development (CESD) of the Myanmar Development Resource Institute (MDRI), Yangon.
2ADB, Myanmar in Transition: Opportunities and Challenges (Manila: Asian Development Bank, 20 August 2012), p. 1.
5. We all share ADB's assessment with respect to the need for Myanmar to grow in a sustained way at a reasonably high rate, as suggested at around 7% - 8%. As for the double digit growth of the past decade where Myanmar's GDP on average grew more than twice that of other Asian countries (Table 1), it has led some of us to suspect that there were two economic worlds in Myanmar at that time. One was the real world where people lived, and the other was the statistical world that existed in official reports and documents. For a long time, there was a strongly felt need among us for "national reconciliation" of these two worlds.3 Such reconciliation was considered essential because concepts like sustainable growth and inclusive growth will not inspire much confidence, if the growth process itself and its key indicator lacked credibility and were under suspicion. 6. We believe there has been a measure of success in the national reconciliation of the two economic worlds that came about with the recent initiation of economic reforms in the country. This happened when the earlier 10.5% average annual target growth rate set for the Fifth Five Year Plan4 was revised downwards to a more realistic and achievable 7.7%. This revision was announced by President U Thein Sein in June 2012.5 The Plan's annual growth targets set at 6.0% and 6.3% for fiscal 2011/12 and 2012/13 were also modest judging by Myanmar's past high growth standards. And unlike in the past, these target growth rates are now more in line with ADB forecast of 6.1% and 6.7% growth for these two years for the Asian region.6
7. The national reconciliation of the real and statistical worlds, unlike reconciliation in the political sphere, was not a dramatic affair and it did not receive any noticeable local and international acclaim or attention. Nevertheless, it was a big relief for those of us who are often called upon to draft policy briefs on the state of the economy that are expected to be credible and are not at variance with the rudiments of economics. The trouble with working with dubious statistics is that you often cannot help but get an uneasy feeling that you may perhaps be engaging in writing a scholarly piece in the realm of social science fiction.8. But to get back to ADB, its proposition of Myanmar's GDP growing by 7% - 8% per year in a sustained way and per capita GDP increasing to between US$2,000 and US$3,000 by the year 2030 is fine and I believe it will be a welcome piece of good news about the economy which we have not had for some time. As pointed out by ADB, if our regional peers have done it, why not us? However, there is one matter that we may wish to look into regarding this proposition. It is this: what happens to our regional peers, and especially our ASEAN member and partner countries, when Myanmar reaches its goal of between $2,000 to $3,000 per capita GDP in 2030?9. What happens can be seen in table (2). It shows two things. First, in year 2000 Myanmar was at the bottom of the list of per capita GDP of ASEAN countries. After growing continuously for over a decade at double digit rates it still remains at the bottom of the ASEAN per capita list in 2011. The second point is that if Myanmar's GDP grows at 7% - 8% per year and reaches a per capita GDP of between $2,000 and $3,000, 19 years later in 2030, table (2) shows that except in the case of the
2
3For a discussion on this, please see U Myint, Myanmar Economy: a Comparative View (Stockholm: Institute for Security and Development Policy, 2009).
4Ministry of National Planning and Economic Development, Myanmar's Socio-economic Development: Up to the end of March 2011(Naypyitaw: MNPED, May 2011), pp. 52 and 53. The Five Year Plan under reference is currently under implementation and covers the period (2011/12 – 2015/16).
5New Light of Myanmar, "Job opportunities, income can be increased and triple growth realized only if current volume of financial investments be doubled" (Yangon: New Light of Myanmar, 20 June 2012); p. 1. Note that in this statement, $800 is estimated to be the per capita GDP of Myanmar at the present time.
6Mizzima News, "Burma's predicted growth rate increased: ADB", 03 October 2012.
Philippines, Myanmar will still be below the year 2011 level of per capita GDP of the remaining five original members of ASEAN. The worrisome part of this is that in another 19 years from now, the original 5 ASEAN members, and perhaps together with a few other members, will have moved into another world far removed from Myanmar with a per capita GDP of between $2,000 and $3,000.
10. We can of course, be more upbeat than ADB with our GDP growth rate. Why not go for 10.4%? ADB says our neighbour China has done that over two decades (1991 - 2010).7 If GDP grows at 10.4% per year and population grows at 1% per year, then per capita GDP will grow annually at 9.4%. ADB assumes Myanmar's per capita GDP to be $857 in 2011. A per capita GDP of $857 growing at 9.4% per year will rise to $4,724 in 19 years.8 Doing this still leaves the per capita GDP of Myanmar in 2030 below those of Thailand, Malaysia, Brunei and Singapore in 2011.11. Moreover, using the nominal exchange rate to make inter-country comparisons of per capita GDP in terms of a common currency such as the US dollar, as it was done above, may not be appropriate. The general feeling is that the purchasing power parity (PPP) dollar rate of exchange for currencies prepared by the World Bank's International Comparisons Programme gives a more meaningful measure for making international comparisons of GDP and its components.9 The per capita GDP of ASEAN countries in PPP$ is given in table (3). Using this exchange rate the per capita GDP of Myanmar comes to PPP$ 1,535 in 2011. If Myanmar's GDP grows by 7% to 8% per year, then its per capita GDP will rise to between PPP$ 4,400.8 and PPP$ 5,263.0 by year 2030.10 By using the PPP$ exchange rate, Myanmar's per capita GDP situation in 2030 relative to other ASEAN countries will be better. But table (3) illustrates the country's situation in 2030 is still below the year 2011 level of per capita GDP of Thailand, Malaysia, Brunei and Singapore. Hence, where Myanmar is going to be, relative to other ASEAN members countries in year 2030 and beyond, will continue to be a valid concern under the PPP$ scenario as well. 12. There is one other point concerning the ADB proposition to which attention may need to be drawn. It has to do with its claim that when the country's GDP per capita reaches $2,000 - $3,000 in 2030, that will propel Myanmar "safely into the ranks of the middle-income countries."11 This is debatable because multilateral institutions keep raising the bar with the definition on what constitutes a "middle-income" country. For instance, the World Bank says for year 2000 a country is middle-income if its per capita GDP is $1,970.12 Then the bar was raised to $3,764 to qualify for this status for the year 2010.13 This is doubling the height of the bar in a decade. And the 2000-2010 was not particularly a wonderful decade for the world economy. Hence, if the bar is set at $3,764 in 2010 and may be raised by a factor of 4 in two decades to reach 2030, then Myanmar with a per capita GDP of $2,000 - $3,000 may safely qualify to remain in the "low-income" group. In a way, this may not be
3
7Op.Cit.; Table 2, p. 3.
8The calculation is as follows: 857(1.094)19 = 4,724.
9For a brief and simple explanation of what purchasing power parity (PPP) exchange rate means, please see note at the bottom of table (3).
10The calculation is as follows: ADB assumes population growth rate of Myanmar to be 1.3% per year for the next two decades. This means a GDP growth rate between 7% and 8% will result in per capita GDP growth rate between 5.7% and 6.7%. Myanmar's per capita GDP of PPP$ 1,535 in year 2011 growing at 5.7% will rise in year 2030 to 1535(1.057)19 = 4,400.8. Likewise, if the per capita growth rate is 6.7%, per capita GDP in year 2030 will be 1535(1.067)19 = 5,263.0
11See paragraph 4, p. 1 above.
12World Bank, World Development Report 2002, table 1 "Key Indicators of Development", p. 233.
13World Bank, World Development Report 2012, table 1 "Key Indicators of Development", p. 393.
bad because it will continue to qualify the country to obtain credits from the International Development Association (IDA) of the World Bank on attractive terms – 50 years loan period, 7 years grace, and 3/4% service charge per year. But it could also be bad, if after working hard as anticipated over the next 19 years, the country remains in the "low-income" camp. Such an outcome will hurt the country's image and self respect. However, that should not bother me, as I will not be around by then. What worries me more is the prospect of being reborn as a Burmese and to go through this education system – a scary thought! Hence, I take this opportunity to express deep appreciation to those who say the education system at present is in an awful mess and it needs to be fixed.14 As a retired old school teacher, I share this sentiment. It will require a lot of dedication, cooperation and support from all of us to overhaul and fix the system, as soon as possible, but definitely by 2030, because by then in my next incarnation, I may be attending kindergarten as a school girl in some remote village somewhere in Myanmar.(b) Structure of GDP and need for economic and export diversification13. Aside from the level and rate of growth of GDP it will be necessary to look also at its structure. A shift over time in the relative shares of agriculture, industry and services in GDP is generally accepted as a measure of structural change in an economy undergoing a process of industrialization and modernization. Sectoral shares of GDP for 1970, 1980, 1990 and 2011 – a period extending over the past 41 years – for 19 Asian countries are given in table (4). The countries in the table are listed in ascending order based on the share of agriculture in GDP in year 2011. By that year there has been a substantial decline in the share of agriculture and with the service sector rising to account for the major share in most countries. Among the 19 countries in the list, the service sector forms the largest component of their GDP in 15 countries, and in 9 countries this sector has more than 50% share in GDP. As for Myanmar, it is among three countries with agriculture still accounting for around 35% of GDP and the service sector with a share of 38% shows little dynamism and, in fact, this sector's share three decades ago in 1980 was higher at 40% of GDP. These indicate there has not been significant structural transformation of the economy of Myanmar over the past 40 years.14. The lack of structural transformation of the economy is reflected in the export structure of Myanmar (table 5). In 2010, the share of food and agricultural raw materials accounted for 40% of Myanmar’s total exports, 33% was contributed by natural gas, and manufactured goods made up only 22%. This is in sharp contrast with the export structure of the Asian countries listed in table (5) where manufacture goods form the largest share of export earnings. It may be noted that the major oil exporters in the region such as Malaysia and Indonesia have also reduced their dependence on oil exports over the past years. There is thus a clear need for Myanmar to diversify its production and exports to get into the mainstream of development in the Asian region.(c) Coming to terms with the present poor state of economy15. The implication in order to come to terms with the above concerns and the challenges they pose, is that Myanmar will need to set its sights not only on growth in the quantity of per capita GDP but also to improve its quality. Setting sight on improving the quality of GDP and more importantly, the growth process itself in general, is precisely what President U Thein Sein and reformers in the country are engaged in at present. 16. When Myanmar became an independent nation in 1948, it was tipped along with the Philippines, as the most likely countries to industrialize way ahead of others in the Asian region. At that time, Singapore, Hong Kong, Taiwan and South Korea were looked upon, more or less, as basket cases. It did not happen that way. The basket case turned out to be not them but us. Why? There are
4
14"NLD targets overhaul for 'ruined' education system", Myanmar Times (Yangon, 15-21 October 2012 edition); p. 3.
many reasons. However, one generally accepted important cause why the Myanmar economy fell so far and so fast was because beginning in the early 1960s, the country decided to go its own way and do its own thing without bothering to take note of, to draw lessons from or to be influenced by, what was happening in the countries around it and in the rest of the world. Now all that has changed. Myanmar has concluded that doing its own thing in its own way does not work, and has decided to open-up and re-engage with the outside world. 17. The re-engagement has been initiated with determination and quite liberally, with both small and big players in the region and in the world, that by most accounts has achieved good results. The way forward from here will be to build on the good outcomes of the present honey-moon period for a more lasting and mutually beneficial relationship with the country's development partners, in particular by enlisting their cooperation and support in formulating, implementing, monitoring and reviewing the social, political and economic reforms that are currently underway in the country. 18. In undertaking the above task, one issue that has occupied a dominant place in the present effort at re-engagement with the outside world relates to foreign direct investment. Although there seems to be a general consensus that it would be desirable to revitalize FDI, how to go about doing it, raises complex, sensitive and emotional issues that have generated a lively debate. That such a debate is taking place, and well publicized in the country's local media, which is unthinkable a year ago, is an impressive achievement in itself. What is more important, the debate provides a good opportunity to demonstrate to the people of Myanmar and to the world community that the key players in the country can engage in a meaningful dialogue on a controversial but highly important issue for economic development like the FDI. Hence, it is essential for the debate to generate more light than heat and to come forward with outcomes that are beneficial for the country and its people, and at the same time, are acceptable to the local and foreign investors and business communities. This is a tall order. Nevertheless, some thoughts are given below on how we might proceed on the FDI issue to help make this dream come true.
II. FDI: Concepts and Issues(a) Definition of Foreign Direct Investment19. Foreign Investment can be defined in a simple way as an investment made by a company based in one country, into a company based in another country. Normally, Foreign Direct Investment (FDI) is considered to have taken place if a company in one country makes a physical investment, such as in buildings, factories, machinery and equipment in another country. However, foreign investment can also take place through Foreign Portfolio Investment (FPI) by acquiring foreign securities such as stocks and bonds and which does not require physical investment or active management of foreign assets. Hence, FPI which involves passive holding of foreign assets is referred to as Foreign Indirect Investment. 20. In contrast, the company in the home or source country that engages in FDI is said to exercise a measure of control and management of the company in the host or recipient country in which FDI is made. Hence, a broader definition of FDI has been adopted by organizations such as OECD15 and World Bank and according to this definition, a company in a home country, call it company A, is said to engage in FDI if it invests in company B in the host country, if A has 10% or more of the voting
5
15Organization for Economic Cooperation and Development (OECD) members are as follows: Australia, Austria, Belgium, Canada, Chile, Czech Republic, Denmark, Estonia, Finland, France, Germany, Greece, Hungary, Iceland, Ireland, Israel, Italy, Japan, Korea, Luxembourg, Mexico, Netherlands, New Zealand, Norway, Poland, Portugal, Slovak Republic, Slovenia, Spain, Sweden, Switzerland, Turkey, United Kingdom and United States.
stock of B.16
21. The main difference between FPI and FDI is that under FDI the investing company takes ownership and control positions in the host country firm and also acts as managers. Whereas under FPI, the investor gains ownership positions in host country firm but does not exercise control or management.22. FDI has played a key role in internationalization of business and globalization. Advances in information technology resulted in less costly and more effective global communications that made it much easier to manage foreign investments. In addition, there has been liberalization of trade and investment policies in many countries over the past years. Deregulation and privatization of industries and significant changes in capital and financial markets also helped.(b) FDI: views, models, types and forms23. Since FDI involves movement of capital across borders it has usually been associated with politics and several views have emerged. A radical view on it is held by Marxism that takes a hostile stance and looks upon FDI as a means to exploit a country’s economy, resources and people. In-bound FDI should therefore, according to this view, be discouraged and foreign assets in the country should be nationalized. Opposed to this is the free market view that looks upon FDI as helping a country to specialize in producing goods and services that it is best suited to produce and thereby creating a win-win situation that brings benefits to both the home and host countries. Obviously the truth will lie between these two extremes. However, there is a third view called the pragmatic nationalism view that is said to have received wide acceptance among countries at the present time. Under this view, FDI is approved if its benefits outweighs its costs. This raises the tricky question of what are benefits and costs of FDI and will be taken up later.24. As regards FDI models, three have been mentioned.17 These are: (i) The first is the one adopted by countries such as Malaysia, Singapore and Thailand,
that relies mostly on FDI and integrating the economy into Transnational Corporation (TNC)18 production networks and becoming competitive by upgrading within those networks.
(ii) The second, adopted by Republic of Korea and Taiwan Province of China was based on developing domestic enterprises and technological capacities by relying on TNCs as sources of technology, but mostly at arm’s length.
(iii) The third is pursued by Hong Kong, that relies on market forces but helped to get good results by providing infrastructure and governance.
25. Concerning types of FDI, there are two – horizontal and vertical. The horizontal FDI type occurs when an investor produces the same product or service in the foreign country in the same way as he does in his home country. For example, Toyota sets up a car factory in Thailand and produces cars as it does in Japan using the same method of production. The vertical FDI type takes place when an investor fragments or breaks up the production process internationally, and locates each stage of production in a country where it can be produced at least cost. Examples of this can be seen when Toyota produces car engine parts and components in Vietnam, body parts in Thailand and tires in
6
16World Bank, World Development Report 2012, “Technical Note on Selected World Economic Indicators 2012”, p. 409.
17UNCTAD, World Investment Report 1999, “Foreign Direct Investment and the Challenge of Development,” Overview, p. xxv.
18Transnational Corporation (TNC) is also often referred to as Multinational Corporation (MNC).
Malaysia. These are known as “upstream vertical FDI”. Then the car maybe assembled in China and dealership to sell the new cars could be given to Singapore to advertise, find markets and sell them all over the world. This latter part of the value adding process and production and marketing chain are known as “downstream vertical FDI”. 26. As for forms which FDI can take, there are many. The more well-known among them include: (i) Setting up a company, an affiliate, an entity or a new industrial or business
establishment in the host country. This is referred to as a Greenfield FDI; (ii) A TNC or foreign company can join with a local company in the host country by
merging or by taking-over, or buying out, the local company. This is known as a foreign investor engaging in Mergers and Acquisitions (M&A) deal in the host country with a local firm through FDI;
(iii) Another well-known way is for the foreign investor to enter into a Joint Venture (JV) arrangement with a local partner;
(iv) A foreign investor can enter into a reciprocal distribution agreement with a local firm. Under such an agreement, the foreign and local firms act as national distributor for each other’s products. In this way, they save distribution costs; and
(v) Finally the foreign investor, through FDI, can engage with a local company by issuing a contract or license to permit the use its technology or a production process by the local company.
(c) Benefits and costs of FDI27. FDI brings a bundle of benefits as follows: (i) Capital: FDI brings investable funds into a country, that is more reliable and easier to
service than commercial loans. TNCs also usually go for long-term projects; (ii) Employment: Greater inflows of investment by increasing economic activity, output
and incomes creates jobs. On-the-job training and learning-by-doing improves skills and productivity of workers;
(iii) Technology: TNCs bring modern technology, among which there are some that will come only with them. This technology inflow improves the efficiency of existing technology in the host country. TNCs can adapt technologies to suit local conditions as they have a lot of experience in many countries. They may set up local Research and Development facilities. They can upgrade technology to keep up with new innovations or to cater to needs of changes in tastes, consumption patterns and fashions. They can help bring about technical efficiency and technical change in local companies, suppliers, clients, and competitors by providing assistance, showing examples and by increasing competition;
(iv) Market access: TNCs can assist access to export markets for products already produced in the country, to switch products from domestic to world markets, or to develop new products for exports;
(v) Skills and management: TNCs have access to top management experts, and individuals with expertise in organizational and other skills all over the world that can be brought over for consultations and advice to set-up training facilities. These could give a competitive edge to business firms in the host country;
(vi) Environment: Finally, it has been noted that TNCs are in the lead in developing clean technologies and modern environmental management systems. These can be applied
7
in the FDI host countries in which they operate.28. As for costs and factors that limit host governments from getting a fuller benefit from FDI, they are as follows: (i) Information and coordination shortcomings in the international investment process; (ii) The infant industry issue that raises concerns FDI may crowd out local business
firms; (iii) Low capacity of host country government and the local business sector that limits
their ability to take fuller advantage of benefits available from FDI; and (iv) Weak bargaining and regulatory capabilities of the host country government that
make it difficult to gain equal benefits from FDI and that can result in TNCs abusing their market power.
(d) High transaction costs29. While foreign investment laws are becoming more and more similar among countries, there are big differences between these countries on how these laws and rules are implemented. For instance there are huge differences with respect to how long it takes to get FDI approval, as well as costs to get the approval. After approval is obtained, setting up facilities, operating them, importing and exporting goods, paying taxes and generally dealing with the authorities can differ greatly among countries. These reduce benefits that can come from FDI and also reduce the country’s competitiveness in the world market. One important way to deal with this is to get rid of the unnecessary and wasteful business costs, particularly administrative and bureaucratic costs. In addition, the recommendation has been made to set up a one-stop agency to guide and assist foreign investors to get necessary approvals. This agency must be vested with authority to be able to provide truly one-stop services and its rules and procedures must be clear and straightforward.(e) Infant industries, promoting local enterprise development and crowding-out question30. Every government wants to promote local enterprise development. When local enterprises are not yet well-developed and in their early stage, they will face great difficulties and will be “crowded-out” if big players on the world stage like the TNCs are allowed to come into the country and to compete with them. Hence, consider the case of a small or medium local enterprise (SME) that has good potential of developing into a mature company that will hold its own against competition in the region and world market. Such an enterprise faces two problems when a TNC comes into the country.31. First in the product market, strong competition from TNC will mean the local enterprise will not be able to devote the resources or have the incentive to engage in its own entrepreneurial, management and technological development, which is a long and costly process, but which is essential for it to grow-up and to become a mature company. 32. The second problem is in the factor market, such as inputs in the form of finance and skilled labour. Here again, TNC has an advantage. It has abundant financial resources to draw upon, and due to its reputation it attracts and can pay high salaries to the highly skilled and best professionals in the country. It can also outbid local firms to get other key inputs required to run the business. These raise the cost of inputs for the local enterprises. Both the difficulties that could arise for local enterprises with respect to the product and factor markets due to the operation of TNCs in the country are of high concern and should be given the serious attention and consideration they deserve.33. However, the strength of a market economy to grow and to become efficient depends a lot on ensuring a level playing field and having a fair and healthy competitive environment for the business community. And it has been pointed out that the line between protecting the local enterprise so that it
8

can grow, and ensuring a legitimate competition to promote efficiency is very hard to draw. So instead of protecting an infant that has good prospects to grow, we may end up protecting an infant that is inefficient and will not grow-up at all. That is the danger that will need to be kept in view.
9
III. Myanmar and the state of FDI(a) The rate of Gross Domestic Investment(GDI) in Myanmar34. Before considering FDI, we should look at the more inclusive Gross Domestic Investment (GDI) rate of Myanmar.19 This is given in table (6). It shows that for the past decade, it averaged 13% of GDP per year in Myanmar. This is too low and accounted for only about half of average GDI rates of the 17 other Asian countries listed in the table. It is doubtful that a country with a 13% GDI rate, or even 15.5% rate reached in 2010, will be able to bring about the needed structural transformation of the economy, to reduce poverty, or to successfully launch the desired economic and social reforms. There is thus a clear need for Myanmar to raise its investment rate from its present low and ineffectual level, to increase output, incomes and employment. This applies to both domestic and foreign investment. Raising the rate of domestic investment is just as important as foreign investment. The domestic investment law has already been drafted and the debate on it is likely to be a lively one as well. But for now, this paper will deal with FDI as it is a hot topic at present.(b) Global and regional trends in FDI flows35. Taking note of global and regional trends in FDI flows and changes that are taking place will be useful to have as background in discussing the FDI issue in Myanmar. These are given in the Memorandum section of table (7). It shows that the global FDI inflows reached a peak amounting to $1.98 trillion in 2007, fell to a low of $1.19 trillion in 2009 due to the global financial crisis, and stood at $1.52 trillion in 2011, indicating it has not recovered to its peak level of 2007. As for the Asia and East and Southeast Asia regions, their FDI inflows declined due to the crisis, but quickly recovered and the inflows had increased well beyond their pre-crisis peaks by 2011. Due to their better performance, the share of both in the global FDI inflows increased substantially over the 2000 - 2011 period. For Asia the rise in share was from 10.5% to 27.8% and in the case of East and Southeast Asia it rose from 10.1% to 22.0% over the period.(c) FDI inflows into developing Asian countries including Myanmar36. The data on this is given also in table (7). In the table, 20 developing Asian countries are listed in descending order on the basis of amount of FDI inflows in 2011. China tops the list with an inflow of $124 billion. Myanmar with an inflow of $850 million occupies 17th place on the list, just slightly behind Cambodia and Bangladesh, but way behind Vietnam, Thailand, Malaysia and Indonesia with FDI inflows ranging from $7 billion to $19 billion in that year.(d) FDI outflows from Asia and East and Southeast Asia37. The rise in share of Asian region in world FDI inflows has been matched by a corresponding rise in the Asian share in world FDI outflows. This is given in table (8). Asia's share in world FDI outflows more than doubled from 7.1% in year 2000 to 16.6% in 2011. Similarly, East and Southeast Asia's share also more than doubled from 6.7% to 14.2% over the same period. As can be seen in the table, ten Asian countries have become important sources of FDI in 2011, with Japan leading the list with an outflow of $114 billion, followed by Hong Kong ($82 bil.), China ($65 bil.), Singapore ($25 bil.), and Republic of Korea ($20 bil.). Fairly large outflows ranging from $7 bil. to $15 bil. were also reported from Myanmar's neighbours Indonesia, Thailand, India and Malaysia.
10
19Gross Domestic Investment is defined by the World Bank as consisting of outlays on additions to the fixed assets of the economy plus net changes in the level of inventories. Fixed assets include land improvements, plant, machinery and equipment purchases, and construction of buildings. Inventories are stocks of goods held by firms and "work in progress". See World Bank, World Development Report 2012, Technical notes, p. 408.
IV. Debate on FDI issue (a) Ground realities38. In reviewing the on-going debate on FDI, it will be useful to set out several "ground realities". These are: (i) At present Myanmar has the lowest per capita GDP among ASEAN countries
amounting to between $800 and $857, which is too low to provide a decent livelihood, income and employment for the population. This is made worse because it is likely that income distribution is becoming more uneven and the gap between the rich and the poor is widening over the years.
(ii) An important reason why output is so low is because of low investment, both domestic and foreign. Unless, these levels of investment are increased and output rises from its very low level, prospects are not promising to achieve goals like poverty reduction, and promoting growth that is inclusive, sustainable or people centred.
(iii) Since Myanmar is starting from such a low output base, even a reasonably high rate of growth over two decades will not get the country into the same league as countries like Thailand and Malaysia, not to speak of Singapore, as these neighbouring countries will also be growing over the years. It is therefore essential for Myanmar to ensure, as stated above, that in addition to the quantity, the quality of growth improves substantially through reforms that make it sustainable and people centred.
(iv) The people centred development strategy that has been advocated20 gives priority to improving the quality of life of ordinary citizens, and especially poor citizens. As Myanmar is still in the early stage of development, this will require the average family in the country to enjoy not only basic necessities (food, clothing and shelter) but conventional necessities such as access to health and education facilities, safe water, proper sanitation, convenient transport, reliable domestic power supply, an efficient telecommunications system, a decent dwelling, a pleasant and safe neighbourhood as well as social amenities such as parks, theatres, libraries, sport and recreation facilities. The President mentioned our poor people usually have to work from dawn to dusk to eke out a meager existence without time left for anything else. In a people centered development strategy, working hours will be reduced through better social organization and increased attention given to workers' welfare, which in turn will give them more leisure time to pursue cultural, social, religious and recreational activities. With the good resource base we have and enterprising young people I see all around, I don't see why this can't be done. Moreover, I believe by adopting and implementing appropriate policies and measures, FDI can play a significant role to help us attain this objective. And opportunities that now exist to do this should not be missed.
(v) This good opportunity should not be missed for two reasons. First, the amount of FDI inflow into Myanmar is very low compared to its neighbours. In 2011, the inflow into Myanmar was $850 million, into Thailand it was $9,572 million, Malaysia $11,966 million and Indonesia $18,906 million (Table 7). Hence, the question as ADB might
11
20Please see "President U Thein Sein calls for more efforts in reform process for national development", New Light of Myanmar, 12 May 2012; and "Priority task of government is to satisfy desire, fulfill requirements of people", New Light of Myanmar, 13 May 2012. For full text of statement please see http:www.president-office.gov.mm/briefing-room/daily-news/new3
have raised, if Thailand with an FDI inflow 11 times that of Myanmar, Malaysia 14 times, and Indonesia 22 times, and these countries prospered, why not Myanmar? The second point is that our neighbours have not only become significant recipients of FDI but sources of FDI as well. As illustrated above, the share of East and Southeast Asia in World's FDI inflows and outflows doubled over the last decade. The personal initiatives undertaken by President U Thein Sein on goodwill missions abroad have brought about a very positive response from our neighbours and others to revitalize FDI flows into Myanmar. Advantage should be taken of this good opportunity. Thoughts on how we might do it, are presented below.
(b) Incentives: yes, maybe (with reservations) and definitely no39. In thinking about revitalizing FDI flows into Myanmar, incentives in the FDI Law are the ones that raise the most contentious issues and that have held up proceedings. Who gets what, when, how, why, how much, for how long, and so on, raise problems that are not easily resolved in any country at any time. Incentives and the way they are implemented can also result in special favours through reserving certain rights for certain groups or protecting certain segments of society that do not deserve such protection. More than anything else, we do not want the special favours to go to the specially favoured few in the country that will make them more special. Instead we want the special favours to benefit the ordinary people of Myanmar, especially poor people. Since other countries are competing with us for FDI, what incentives they are giving have been mentioned with suggestion that we should match these incentives with our own. So, all in all, things are quite complicated and it seems to me that there is merit for those who say we should proceed in this area with more caution. I have also tried to convey this message at a meeting some time ago which goes like this: "At present a lot of internal and external pressures have been exerted on us, for all sorts
of reasons, to rush headlong into many areas that are strewn with land mines. But we will have to be realistic and make our best efforts to resist these pressures and move forward at a pace, in a time frame, and in a manner that we feel confident are reasonably cautious, well thought-out and planned, within our capacity to deliver, and that meets our strategic concerns."21
40. In view of the complex nature of the debate on incentives and as so much has already been said about it, I will not take it up here, in order not to go over already well covered and familiar ground. Furthermore, foreigners have also been reminding us that we should not be looking only at incentives to attract FDI but also disincentives and disfavours in the country that are keeping it away. They have a valid point. It is too important, deserves a separate paper and will be taken up later.41. There is one other point that has emerged from the FDI debate that is interesting. It says: "Myanmar absolutely must retain policies that treat foreign investors unfairly ... It must
do so for all of the reasons that each of the industrialized countries adopted the same policies when they were first industrialising."22
42. I agree absolutely that the industrialized countries, starting with Britain not in the 1500s but 200 years later in the mid eighteenth century, treated foreigners unfairly in their industrialization process. Let me count the ways how they did it.
12
21U Myint, "Resumption of Official Development Assistance (ODA): Views from Myanmar Perspective", Workshop on Economic Development, Traders Hotel, Yangon, 1 March 2012.
22Rick Rowden, "Free market myths: Seven to watch out for when rushing through an investment law", Myanmar Times (Yangon: 24 -30 September 2012 edition), p. 18.
(i) When populations increased due to better diet, living conditions and medical care, they were sent off to occupy empty spaces in the Americas, Canada, and Australia. The few natives that were around in those lands were taken care of with some ethnic cleansing or were herded into reservations.
(ii) When energy and raw materials ran out to meet needs of rising industrial production, countries that have these resources were colonised.
(iii) Colonies were used as markets for expanding industrial output, without caring if that destroyed the local industries there.
(iv) Child labour played a part in the textile industry that spearheaded the industrial revolution in Britain. Their nimble little fingers were good to repair broken threads in confined spaces, the beds they slept in were always warm because they worked in shifts 24 hours a day, and as for the place of work, poetry called it a hut and history a hovel. Human trafficking in the form of slave trade was used to acquire cheap labour to work in cotton plantations. Forced labour was used to build railways. Cronies were also there, but were called robber barons.
(v) Another big advantage, global warming and climate change were not matters of concern then. There was no one to complain if factories were emitting tons of carbon dioxide into the atmosphere that were going to make many people sick. Just the opposite. Smoking chimneys were looked upon with pride as a sign of industrial prowess.
(vi) Finally, another attractive feature in those days – there was no one to impose sanctions on you because you are violating the human and democratic rights of your own people and others in the rest of the world. Unless, of course, you impose sanctions on each other which was not a wise thing to do.
43. Briefly put, the industrialized countries faced the same sort of problems in coming to terms with challenges in their "first frontier" days as Myanmar is facing now at the "last frontier". But the policies and solutions they adopted to resolve those problems, at least those that are listed above, are no longer available in the twenty-first century for those at the last frontier. 44. Mr. Rowden also stated that Myanmar must treat FDI unfairly, because without it, it will amount to something like a school girl foot ball team on the Myanmar side playing against the Manchester United team from outside.23 The point is well made and well taken. Thanks for the reminder. The situation, however, is more complicated than that. At present what concerns us more is not the Manchester United from outside. But Manchester United inside. The way things are going, we could easily end up with an economy that is crony driven. We do not want that. We do not want FDI to inadvertently hasten that outcome. A further widening of the gap between the rich and the poor could raise social tensions and unrest which will be highly undesirable for Myanmar at this time when so much effort has been devoted to national reconciliation and peace building.45. I agree when FDI is allowed in, adequate safeguards should be there to protect the school girls. But we should not over-do that either. Or else we may become a school girl driven economy which is not going to get the people of Myanmar anywhere.
13
23Ibid.
V. Becoming a New Asian Tiger(a) Tapping a New Asian Tiger46. Myanmar Times came out with a Special Feature in September 2012, titled “Invest Myanmar: Tapping a New Asian Tiger.”24 A good deal of journalist flair was in evidence in that Special Feature. It said agriculture in the country offers huge opportunities despite challenges, the largely untapped minerals sector is receiving a gold rush of interest, energy sector has boosted foreign reserves, banking sector needs revitalization, and market research is required to get accurate information for investors. Mention was made with respect to FDI in the oil and gas sector that “if investors doubt, they will be too late.” There were also interesting observations noting that Myanmar’s small businesses are not ready for competition and that “local businesses need to be smart and clever.”47. These are sound recommendations and the Myanmar business community will benefit from them. However, in addition for the need to become smart and clever to survive in the opening-up process that is underway, there are several problems that the Asian tigers encountered in the course of their development that will be useful for Myanmar to keep in view. These are given below.48. To begin, there are seven tiger economies in East and Southeast Asia. They include, in East Asia: Hong Kong, South Korea and Taiwan; and in Southeast Asia: Indonesia, Malaysia, Singapore and Thailand. What has been interesting about the Asian tigers for many people all over the world, is that these countries achieved impressive economic growth rates for a decade up to 1996. It is believed this good economic performance has improved the standard of living of their citizens and has reduced poverty in these countries. For the most part, the Asian tigers also had budget surpluses, high private saving rates, low inflation, comfortable foreign exchange reserves, and exchange rates that did not seem to be out of line. For all these, they received a lot of praise and high marks from the International Monetary Fund (IMF). The World Bank was also impressed with them. The Bank called them “miracle” economies. They were considered outstanding examples of how to achieve economic progress, and other developing countries were advised to learn from their experience.49. Then something went wrong with the Asian tigers over the period from mid 1997 to early 1998. Their growth rates nose-dived and became negative. Businesses collapsed, banks failed, and the countries were faced with serious problems of unemployment, poverty and social dislocation. The disease spread from one tiger to another rapidly. The standard medicines that were given to them did not seem to do much good. In fact, the disease became worse, lasted much longer, and caused more harm than anyone has expected. It looked like the IMF’s star pupils, which we all thought would be getting distinctions in six subjects, failed the exams. They not only failed the exams, but had to swallow their pride and go to the IMF and major donors to beg for help – a terrible surprise and shock to all concerned. What happened and why?50. With regard to the question of what happened and why there is general agreement that the main thing that caused the problem was the huge flow of private capital into and out of these counties within a very short time. In 1996, there was a net private capital inflow of $97 billion into these countries. Then in the latter half of 1997, the flow reversed itself and there was a net outflow of $12 billion. This means there was a turnaround of $109 billion within a period of about 6 months, a very large sum of money for these countries. It amounted to 10% of their combined GDP.
14
24“Invest Myanmar: Tapping a New Asian Tiger, Final Frontier, The rise and rise of Myanmar”, Myanmar Times (Special Feature: September 2012).
51. The bulk of the flows came as loans from private creditors. The fact that such a big turnaround could occur in such a short time means a large part of the capital flow was made up of short-term loans. Technically, a short-term loan is considered to be a loan repayable in one year or less. But practically, short-term can mean as short as one to two months. The Asian financial crisis is mainly concerned with this big and devastating turnaround in short-term capital flow that occurred in these countries. The reasons why it took place, and the havoc it caused, are basically the things that need to be looked into. It offers lessons for Myanmar in order not to be carried away and to seriously start believing our own propaganda that we are the next Asian tiger and get the country into trouble.(b) Success having within it, seed of decline52. An important contributing factor to the crisis has been side effects of Asian tigers’ own economic success. Exports have fueled this success. The tigers started off by selling basic materials and low technology labour-intensive goods. But by the early 1990s, they began moving into complex and increasingly high technology products such as automobiles, semiconductors, and consumer electronics. The wealth created by export success, in turn, helped fuel an investment boom in commercial and residential property, industrial assets and infrastructure. Over the period 1990 to 1996, the value of commercial and residential real estate in cities like Hong Kong, Bangkok and Jakarta sky-rocketed. Heavy dependence was placed on commercial banks to finance the construction binge to meet the rising demand and expectations that resulted from the boom. As long as property values were rising, the banks were happy to provide the loans.
(c) Picking winners53. In reflecting on the Asian tigers movement away from producing and selling basic materials and low technology labour intensive to high technology products gets us into giving thought to question of industrial development for Myanmar. Industrialization is looked upon as essential to overcome technological dependence and to break away from the colonial pattern of production where a country relies upon a few primary commodities for its export earnings and has to import most of its necessary manufactured goods. Such concerns have prompted countries like Japan and the Republic of Korea to give particular attention to the nature of industrialization and the type of industry that they felt should be promoted in the early stage of their development process. 54. Thus in the 1950s, conventional wisdom dictated that Japan with a large population and high unemployment should concentrate on textiles, garments, leather goods, footwear, toys and other low technology and labour intensive products. While Japan took advantage of available opportunities for developing labour intensive industries in the early stage of its industrial development, it did not neglect to promote more advanced industries. On the contrary, it deliberately went against conventional wisdom and opted to develop capital, skill and technology intensive industries such as steel, oil refining, petrochemicals, automobiles, industrial machinery and electronics. The thinking behind such a course of action has been described by a former Japanese Minister as follows: “In the short-term, these industries would seem to make economic nonsense, but in
the long-term these are precisely the industries where technological progress is rapid and productivity rises fast. Without these industries it would be difficult to employ a population of a hundred million and raise their standard of living to that of Europe.”25
55. The outcome of Japan’s bold policy initiative at that time has been remarkable. For example, in the case of steel, Japan’s output was 5 million tons per year in the early 1950s, and its cost of production for the product was twice the world’s average at that time. By the early 1970s, Japan’s
15
25Quoted by Ajit Singh in his article “A Third World View” which appeared in Alan Horrox and Gillian McCredie (eds.), Money Talks (London: Thames Methuen, 1983); p. 65.
annual steel output has risen to 100 million tons and the country that has to import all the raw materials to make steel has become the world’s most efficient steel producer.56. Japan’s effort to develop an automobile export industry is more revealing. When it embarked on that venture several decades ago, many observers viewed it with skepticism and amusement. It was felt then that a car export drive that will bring Japan into direct competition with the United States required not only a sophisticated manufacturing and technological base, but high-level business management, and organizational and marketing skills – attributes which were regarded as lacking in the Japanese economy at that time. Japan nevertheless went ahead with its car export campaign and developed an automobile manufacturing and export capability that outperformed all the industrialized countries of the West. In the mid 1950s Japan produced 50,000 passenger cars a year, while the United States produced 6 million. By 1981, Japan’s car output rose to 11 million, 3 million more than the USA. 26
57. Similarly, in the mid-1950s, the Republic of Korea with a war shattered economy, lacking in natural and financial resources and with a hostile neighbour threatening its existence, appeared to be doomed to be an economic basket case. Yet the country launched a concerted industrialization drive based on manufactured exports that resulted in selling not only computer and telecommunications equipment that are at the forefront of technology, but also steel, chemicals and super tankers to the advanced countries.58. In the 1990s governments of the tiger economies also played an active part in the investment boom and tried to pick winners but were less successful. They concentrated on building infrastructure – expressways, urban rapid transit systems, airports, seaports, container facilities, and upgrading public utilities such as telephone networks and electric power grids. The Malaysian government, for example, was building a new government administrative center at a cost of US$8 billion and was funding a massive high technology communications corridor, as well as a huge dam as part of a very expensive power generation scheme. 59. At the same time governments throughout the region tried to pick winners and encouraged private businesses to invest in selected sectors that they felt were in the national interest and that were in accord with their industrialization strategies. This was particularly so in South Korea. The large conglomerates there, called chaebols, were urged to invest in new factories, industrial complexes and exported-oriented production facilities. As the chaebols rely heavily on borrowings, this led to massive build up of debts. These debts rose, on average, to four times their equity. 60. In Malaysia, the government also pushed for strategic investment in the semiconductor and automobile industries. The car it produced, called the Proton, was manufactured behind a tariff wall of 200%. By 1995, a total of 225,000 units of Protons were produced annually and it captured 62% of the domestic market. Many doubt that it will survive in a competitive environment.61. Indonesia presented a more interesting case. There, President Suharto has long supported a network of an estimated 300 businesses run by his family members and friends in a system known as crony capitalism. Many of these were lucrative monopolies granted by the President. For example, in 1990 a President’s son, Mr. Hutomo, was granted a monopoly in the sale of cloves, which is mixed with tobacco to make cigarettes preferred by most Indonesians. Then again, in 1995 the President announced that the country is coming out with a national car. The car is to be built by a firm owned by Mr. Hutomo, in cooperation with Kia Motors of South Korea. A consortium of Indonesian banks was persuaded to provide almost $700 million as a start up loan for the venture.
16
26Ibid.
62. In short, by the mid 1990s an investment boom was raging across the Asian region, fueled by private initiative, government encouragement, and sometimes by crony capitalism. Moreover, most of this investment was financed by borrowed money. The boom as usual cannot be sustained. It began to unravel when excess capacity developed. For example, in Korea the semiconductor factories built at the government’s urging were in serious trouble when prices of Dynamic Random Access Memory chips (DRAMs) dropped drastically on the world market in 1996. The earnings of these Korean companies fell by 90%. This meant the companies would face difficulties in meeting scheduled payments on their debt.63. Similarly, the real estate and property boom in Thailand began to face capacity limits. It was estimated that by early 1997, there were 365,000 unoccupied apartment units in Bangkok, and another 100,000 units were scheduled for completion by the end of that year. There has obviously been a turnaround in the market situation – from excess demand of earlier years to excess supply in the latter half of the 1990s. It was further estimated that the excess supply would be able to meet commercial and residential needs of Bangkok for the next five years.64. What happened in Korea with its semiconductor industry and in the Bangkok property market was happening in other countries in the region as well. Huge investments in industrial assets and property had created a situation of excess capacity and falling prices, while the companies that made these investments were burdened with massive debts which they were increasingly finding it difficult to repay and service. Two things made the situation worse and resulted in the financial and economic crisis. They were (i) deterioration in the external payments situation; and (ii) huge debts incurred were in US dollars.(d) Dark side of the Asian miracle65. The review and reappraisal of the Asian tigers economic performance that resulted from the crisis, has sharpened focus on what has been described as the dark side of the Asian miracle. The point made here is that good economic performance of the tigers is not just due to correct policies and sound macroeconomic fundamentals. It was also because undemocratic governments were running the show in many of them. These governments relied on cheap labour to promote exports by keeping wages low. Wages were kept low by suppressing labour unions and relying on woman workers who were discriminated against and were paid much less than their male counterparts. The good economic performance and export growth was also achieved by overexploiting their natural resource base and destroying the environment. When their own resource base is depleted, they then move on to exploit the natural resources of their neighbours and thereby threatening environmental ruin in these countries. The tigers’ export growth that relied on developed Western countries’ markets was also successful only because there were so few of them – only seven countries. If all the developing countries in the world, numbering over a hundred, followed the tigers’ example, the Western markets would not be able to absorb the volume of exports that will be produced, which in turn will provoke a protectionist response from the West. Weakness in the banking and the financial sector was an important factor in the crisis. Shortcomings in monitoring, assessment of risk, and financial viability of projects led to misallocation of funds to unproductive investments, and mismatch of maturities with short term funds financing investments that will only yield returns in the long run. For example, in Indonesia there were 238 banks of various kinds, including 160 private banks. Many of these were owned by the large business firms that used the captive banks as easy source of funding for their activities. Finally, at that time economies such as Taiwan, South Korea and Hong Kong were given special favours and privileges in trade and development aid, especially by the US, as these economies were important to contain mainland China.
17

18
V. The Way Forward66. With regard to the way forward, I wish to take up an issue of high interest to Myanmar and to the world community at the present time. This is FDI in the natural gas sector and to ensure that it supports the reforms and the nation building initiatives that are underway at present in the country. 67. The discovery of large natural gas reserves in off-shore areas and their exploitation through foreign participation, technology and investment have made natural gas Myanmar’s number one foreign exchange earner. In 2010/11 it earned $2.5 billion and accounted for 32.6% of total exports.27 This large and growing output of natural gas has high potential for downstream activities such as in producing fertilizers, and providing throughput for a chemical industry. Natural gas could also be used to generate electricity to meet present shortfall in power needs of households as well as of industrial and business sectors. 68. Heavy reliance for foreign exchange earnings on natural gas, a depletable resource, raises concerns about its sustainability for long run growth. A good way to resolve this issue is to adopt a policy of appropriate change in asset composition. Natural gas resources of Myanmar represent the country's assets that are in the ground. Using revenues obtained from sale of gas, such as by investing in infrastructure, factories, and on improving human resources will change asset composition. This means assets in the ground will be replaced by assets above ground, which will not only sustain, but increase development potential. And in this way the assets above ground can bring benefits not only to the present generation, but to future generations that have a right to the natural resources of the country.69. Change of asset composition mentioned above is easier said than done. What could happen is that assets underground are dug up, but they are not replaced by assets above ground and in fact, nothing worthwhile for the people takes place above ground. This could result in resource rich countries and is known as "resource curse". The reasons for this are as follows:28
(i) A report by the United States Senate Foreign Relations Committee states: "too often, oil money that should go to a nation’s poor ends up in the pockets of the rich, or it may be squandered on grand palaces and massive showcase projects instead of being invested productively."
(ii) In many economies that are not resource-dependent, governments tax citizens, who demand efficient and responsive government in return. This bargain establishes a political relationship between rulers and subjects. In countries whose economies are dominated by natural resources, however, rulers don't need to tax their citizens because they have a guaranteed source of income from natural resources. Because the country's citizens aren't being taxed, they have less incentive to be watchful with how government spends its money. In addition, those benefiting from mineral resource wealth may perceive an effective and watchful civil service and civil society as a threat to the benefits that they enjoy, and they may take steps to thwart them. As a result, citizens are often poorly served by their rulers, and if the citizens complain, money from the natural resources enables governments to pay for armed forces to keep the citizens in check. Countries whose economies are dominated by resource extraction industries tend to be
19
27Ministry of National Planning and Economic Development, Myanmar's Socio-economic Development: Up to end of March 2011 (Yangon: MNPED, May 2011); p. 61.
28The list of reasons listed below are extracted from Wikipedia article on "Resource Curse".
more repressive, corrupt and badly managed. (iii) Huge flows of money from natural resources fuel corruption. The government has less
need to build up the institutional infrastructure to regulate and tax a productive economy outside the resource sector, so the economy may remain undeveloped. The presence of offshore tax havens provide widespread opportunities for corrupt officials to hide their wealth.
(iv) It has also been reported that extractive operations in some countries are illegal and are encouraged by corrupt multinational corporations in collusion with national governments. Objections made by indigenous inhabitants are usually ignored.
(v) Natural resources can provoke conflicts within societies as different groups and factions fight for their share. Sometimes these emerge openly as separatist conflicts in regions where the resources are produced but often the conflicts occur in more hidden forms, such as fights between different government ministries or departments for access to budgetary allocations. This tends to erode governments' abilities to function effectively.
(vi) There are several main types of relationships between natural resources and armed conflicts. First, resource curse effects can undermine the quality of governance and economic performances, thereby increasing the vulnerability of countries to conflicts. Second, conflicts can occur over the control and exploitation of resources and the allocation of their revenues. Third, access to resource revenues by belligerents can prolong conflicts.
(vii) Prices for natural resources are often subject to wide fluctuations. When government revenues are dominated by inflows from natural resources this volatility can play havoc with government planning and debt service. Abrupt changes in economic realities that result from this can provoke widespread breaking of contracts or curtailment of social programmes, eroding the rule of law and popular support.
(viii) Since governments expect more income in the future, they start accumulating debt, even though they are receiving natural resource revenues as well. In addition, the country's natural resources act as collateral leading to more credit. However, if the natural resources' prices begin to fall, a government would have less money with which to pay a more expensive debt. For example, many oil-rich countries like Nigeria and Venezuela saw rapid expansions of their debt burdens during the 1970s oil boom; however, when oil prices fell in the 1980s, bankers stopped lending to them and many of them fell into arrears, triggering penalty interest charges that made their debts grow even more.
(ix) In many poor countries, natural resource industries tend to pay far higher salaries than what would be available elsewhere in the economy. This tends to attract the best talent from both private and government sectors, damaging these sectors by depriving them of their best skilled personnel. Another possible effect of the resource curse is that countries that rely on natural resource exports may tend to neglect education because they see no immediate need for it. Resource-poor economies like Singapore, Taiwan, or South Korea, by contrast, spent enormous efforts on education, and this contributed in part to their economic success.
(x) Human rights throughout resource-cursed countries are dismal or completely lacking. Most normally resource-cursed countries are ruled by either authoritarian or other types of highly repressive regimes. These regimes are kept in power by a select elite such as high-ranking politicians. As long as the existing government keeps these few happy
20
they can rule without fear of consequence. This system is set up so that the common folk those most in need of the protection are left to fend for themselves.
(xi) Finally, large inflows of foreign exchange from exports of natural resource like natural gas cause the exchange rate of the domestic currency to appreciate with adverse consequences on other exports such as rice, beans, and fishery products. This is known as "Dutch disease". It is already causing a problem for Myanmar and is highlighted in a paper I submitted to the National Workshop on Reforms for Economic Development of Myanmar held at Naypyitaw in August, 2011.29
70. Since the main attraction of FDI in the case of Myanmar is in the natural resource sector, extreme care must be exercised to ensure the country does not suffer from the resource curse. In keeping with our tradition, some sort of yadaya chay will be required to protect us from this curse. However, as I do not have much expertise in this area, I think the next best thing to do is to look at our government budget. How much are we getting from our gas exports? Where are all these earnings going? Are they going where they should be going or where we want them to go? If not, then what do we do about it?71. But if we look at the list of problems that can arise from the resource curse, we will have to look at more than the government budget. Hence, the Centre for Economic and Social Development (CESD) of the Myanmar Development Resource Institute (MDRI) will give top priority to this issue and will take up the challenge. I am pleased to report that we are not alone in this. Several donors have given us all the support we need. We are now cooperating closely with top world experts in taxation, natural resource management, fiscal and budgetary matters, and rules, laws and regulations regarding extractive industries that will keep the multinationals as well as us in line to do the right thing. CESD is an independent, non-political and legal institution and it will be providing full support to the President and to the National Investment Commission on this matter. We will also be interacting with the representatives at the Hluttaws, members of political parties, business and academic communities, ethnic nationality groups, civil society organizations, the mass media and ordinary citizens to solicit views and to exchange thoughts and ideas on how best to go forward in this very important area. 72. As for the on-going debate on the FDI, regardless of its importance, maybe we should adopt a more flexible approach towards it. After all, laws, rules, regulations and the constitution itself, are not given to us by the Tha Gyar Min, the King of the Devas. We make these laws and we can unmake them. We can change them whenever we think they are not working well or we feel they are not serving the purpose for which they have been adopted. 73. In conclusion, I am confident that when the Tha Gyar Min pays his annual visit to our fair land in coming April, he will be pleased with the FDI law that has been adopted and he will put all those who worked so hard at it in his Golden Folder (Shwe Parabike), that is if their names are not there already. I am also hopeful he will cut the names of the members of the local Manchester United team from his Canine Leather folder and paste them in his Golden Folder for the cooperation and understanding that they have displayed on the FDI issue.
21
29U Myint, "Myanmar Kyat Exchange Rate Issue", Myanmar International Convention Centre (MICC), National Workshop on Reforms for Economic Development of Myanmar, Naypyitaw, 19-21 August, 2011.
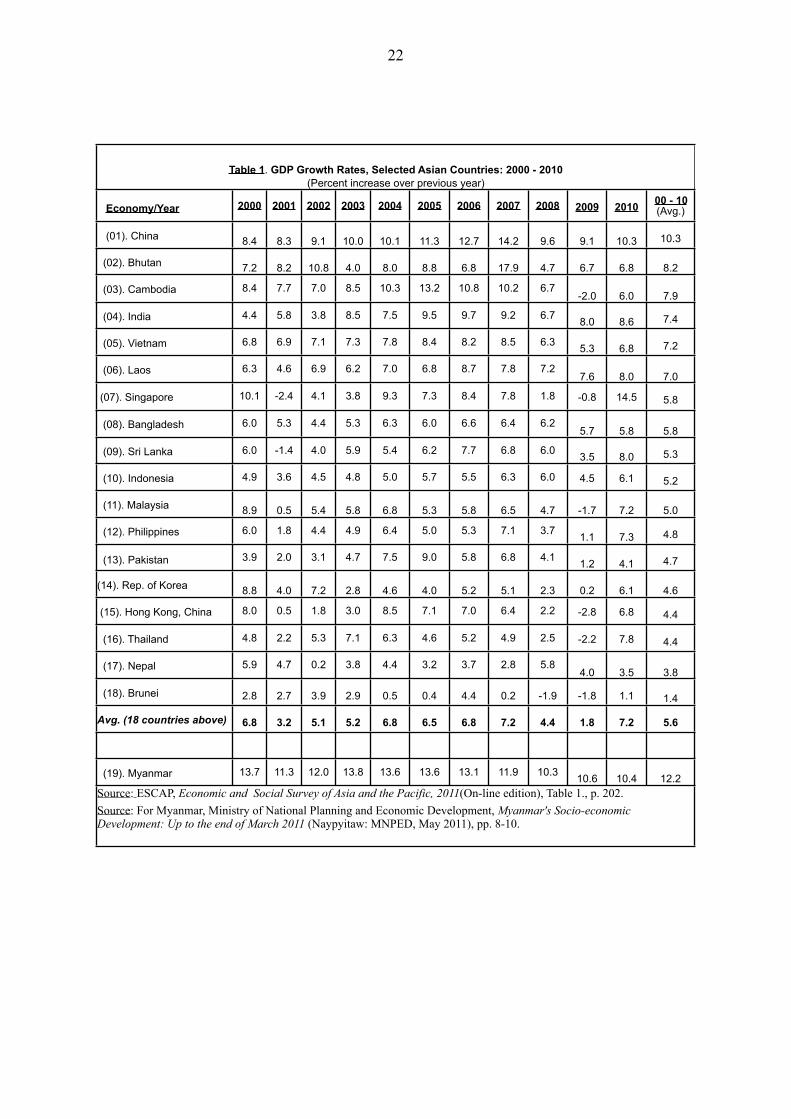
Table 1. GDP Growth Rates, Selected Asian Countries: 2000 - 2010(Percent increase over previous year)
Table 1. GDP Growth Rates, Selected Asian Countries: 2000 - 2010(Percent increase over previous year)
Table 1. GDP Growth Rates, Selected Asian Countries: 2000 - 2010(Percent increase over previous year)
Table 1. GDP Growth Rates, Selected Asian Countries: 2000 - 2010(Percent increase over previous year)
Table 1. GDP Growth Rates, Selected Asian Countries: 2000 - 2010(Percent increase over previous year)
Table 1. GDP Growth Rates, Selected Asian Countries: 2000 - 2010(Percent increase over previous year)
Table 1. GDP Growth Rates, Selected Asian Countries: 2000 - 2010(Percent increase over previous year)
Table 1. GDP Growth Rates, Selected Asian Countries: 2000 - 2010(Percent increase over previous year)
Table 1. GDP Growth Rates, Selected Asian Countries: 2000 - 2010(Percent increase over previous year)
Table 1. GDP Growth Rates, Selected Asian Countries: 2000 - 2010(Percent increase over previous year)
Table 1. GDP Growth Rates, Selected Asian Countries: 2000 - 2010(Percent increase over previous year)
Table 1. GDP Growth Rates, Selected Asian Countries: 2000 - 2010(Percent increase over previous year)
Table 1. GDP Growth Rates, Selected Asian Countries: 2000 - 2010(Percent increase over previous year)
Economy/Year 2000 2001 2002 2003 2004 2005 2006 2007 2008 2009 2010 00 - 10(Avg.)
(01). China 8.4 8.3 9.1 10.0 10.1 11.3 12.7 14.2 9.6 9.1 10.3 10.3
(02). Bhutan 7.2 8.2 10.8 4.0 8.0 8.8 6.8 17.9 4.7 6.7 6.8 8.2
(03). Cambodia 8.4 7.7 7.0 8.5 10.3 13.2 10.8 10.2 6.7-2.0 6.0 7.9
(04). India 4.4 5.8 3.8 8.5 7.5 9.5 9.7 9.2 6.7 8.0 8.6 7.4
(05). Vietnam 6.8 6.9 7.1 7.3 7.8 8.4 8.2 8.5 6.3 5.3 6.8 7.2
(06). Laos 6.3 4.6 6.9 6.2 7.0 6.8 8.7 7.8 7.27.6 8.0 7.0
(07). Singapore 10.1 -2.4 4.1 3.8 9.3 7.3 8.4 7.8 1.8 -0.8 14.5 5.8
(08). Bangladesh 6.0 5.3 4.4 5.3 6.3 6.0 6.6 6.4 6.25.7 5.8 5.8
(09). Sri Lanka 6.0 -1.4 4.0 5.9 5.4 6.2 7.7 6.8 6.0 3.5 8.0 5.3
(10). Indonesia 4.9 3.6 4.5 4.8 5.0 5.7 5.5 6.3 6.0 4.5 6.1 5.2
(11). Malaysia 8.9 0.5 5.4 5.8 6.8 5.3 5.8 6.5 4.7 -1.7 7.2 5.0
(12). Philippines 6.0 1.8 4.4 4.9 6.4 5.0 5.3 7.1 3.7 1.1 7.3 4.8
(13). Pakistan 3.9 2.0 3.1 4.7 7.5 9.0 5.8 6.8 4.1 1.2 4.1 4.7
(14). Rep. of Korea 8.8 4.0 7.2 2.8 4.6 4.0 5.2 5.1 2.3 0.2 6.1 4.6
(15). Hong Kong, China 8.0 0.5 1.8 3.0 8.5 7.1 7.0 6.4 2.2 -2.8 6.8 4.4
(16). Thailand 4.8 2.2 5.3 7.1 6.3 4.6 5.2 4.9 2.5 -2.2 7.8 4.4
(17). Nepal 5.9 4.7 0.2 3.8 4.4 3.2 3.7 2.8 5.84.0 3.5 3.8
(18). Brunei 2.8 2.7 3.9 2.9 0.5 0.4 4.4 0.2 -1.9 -1.8 1.1 1.4
Avg. (18 countries above) 6.8 3.2 5.1 5.2 6.8 6.5 6.8 7.2 4.4 1.8 7.2 5.6
(19). Myanmar 13.7 11.3 12.0 13.8 13.6 13.6 13.1 11.9 10.3 10.6 10.4 12.2Source: ESCAP, Economic and Social Survey of Asia and the Pacific, 2011(On-line edition), Table 1., p. 202.Source: For Myanmar, Ministry of National Planning and Economic Development, Myanmar's Socio-economic Development: Up to the end of March 2011 (Naypyitaw: MNPED, May 2011), pp. 8-10.
Source: ESCAP, Economic and Social Survey of Asia and the Pacific, 2011(On-line edition), Table 1., p. 202.Source: For Myanmar, Ministry of National Planning and Economic Development, Myanmar's Socio-economic Development: Up to the end of March 2011 (Naypyitaw: MNPED, May 2011), pp. 8-10.
Source: ESCAP, Economic and Social Survey of Asia and the Pacific, 2011(On-line edition), Table 1., p. 202.Source: For Myanmar, Ministry of National Planning and Economic Development, Myanmar's Socio-economic Development: Up to the end of March 2011 (Naypyitaw: MNPED, May 2011), pp. 8-10.
Source: ESCAP, Economic and Social Survey of Asia and the Pacific, 2011(On-line edition), Table 1., p. 202.Source: For Myanmar, Ministry of National Planning and Economic Development, Myanmar's Socio-economic Development: Up to the end of March 2011 (Naypyitaw: MNPED, May 2011), pp. 8-10.
Source: ESCAP, Economic and Social Survey of Asia and the Pacific, 2011(On-line edition), Table 1., p. 202.Source: For Myanmar, Ministry of National Planning and Economic Development, Myanmar's Socio-economic Development: Up to the end of March 2011 (Naypyitaw: MNPED, May 2011), pp. 8-10.
Source: ESCAP, Economic and Social Survey of Asia and the Pacific, 2011(On-line edition), Table 1., p. 202.Source: For Myanmar, Ministry of National Planning and Economic Development, Myanmar's Socio-economic Development: Up to the end of March 2011 (Naypyitaw: MNPED, May 2011), pp. 8-10.
Source: ESCAP, Economic and Social Survey of Asia and the Pacific, 2011(On-line edition), Table 1., p. 202.Source: For Myanmar, Ministry of National Planning and Economic Development, Myanmar's Socio-economic Development: Up to the end of March 2011 (Naypyitaw: MNPED, May 2011), pp. 8-10.
Source: ESCAP, Economic and Social Survey of Asia and the Pacific, 2011(On-line edition), Table 1., p. 202.Source: For Myanmar, Ministry of National Planning and Economic Development, Myanmar's Socio-economic Development: Up to the end of March 2011 (Naypyitaw: MNPED, May 2011), pp. 8-10.
Source: ESCAP, Economic and Social Survey of Asia and the Pacific, 2011(On-line edition), Table 1., p. 202.Source: For Myanmar, Ministry of National Planning and Economic Development, Myanmar's Socio-economic Development: Up to the end of March 2011 (Naypyitaw: MNPED, May 2011), pp. 8-10.
Source: ESCAP, Economic and Social Survey of Asia and the Pacific, 2011(On-line edition), Table 1., p. 202.Source: For Myanmar, Ministry of National Planning and Economic Development, Myanmar's Socio-economic Development: Up to the end of March 2011 (Naypyitaw: MNPED, May 2011), pp. 8-10.
Source: ESCAP, Economic and Social Survey of Asia and the Pacific, 2011(On-line edition), Table 1., p. 202.Source: For Myanmar, Ministry of National Planning and Economic Development, Myanmar's Socio-economic Development: Up to the end of March 2011 (Naypyitaw: MNPED, May 2011), pp. 8-10.
Source: ESCAP, Economic and Social Survey of Asia and the Pacific, 2011(On-line edition), Table 1., p. 202.Source: For Myanmar, Ministry of National Planning and Economic Development, Myanmar's Socio-economic Development: Up to the end of March 2011 (Naypyitaw: MNPED, May 2011), pp. 8-10.
Source: ESCAP, Economic and Social Survey of Asia and the Pacific, 2011(On-line edition), Table 1., p. 202.Source: For Myanmar, Ministry of National Planning and Economic Development, Myanmar's Socio-economic Development: Up to the end of March 2011 (Naypyitaw: MNPED, May 2011), pp. 8-10.
22
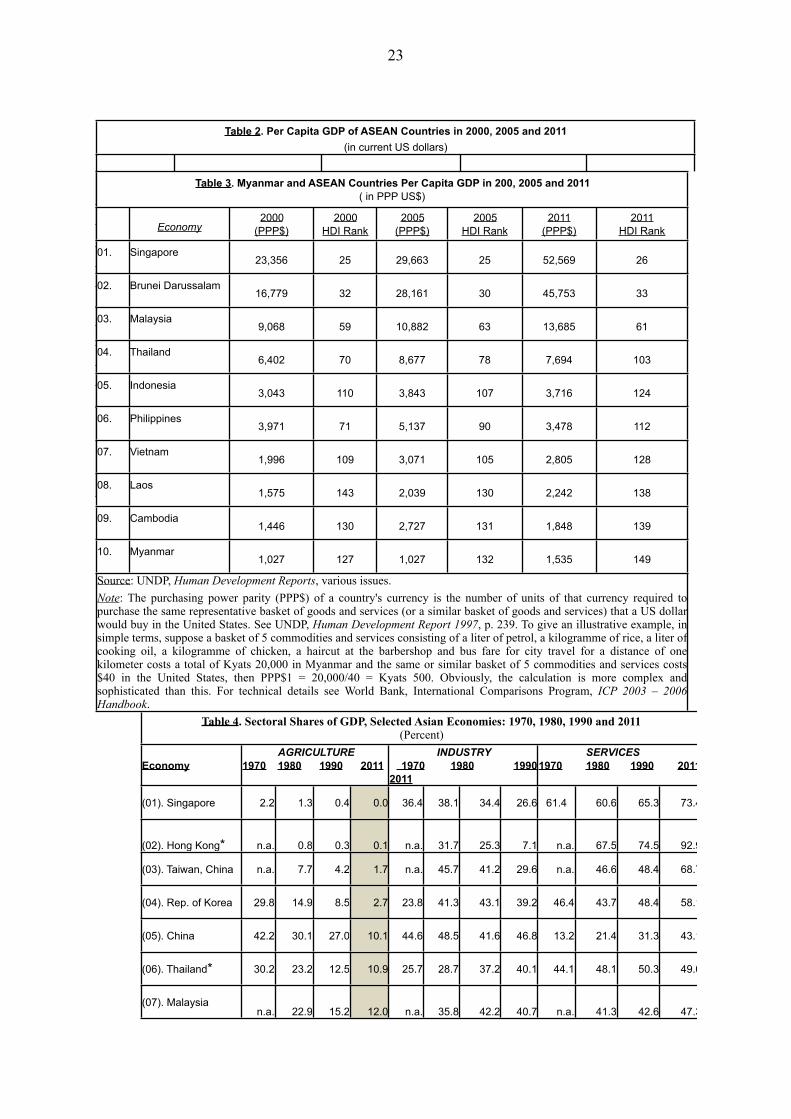
Table 2. Per Capita GDP of ASEAN Countries in 2000, 2005 and 2011(in current US dollars)
Table 2. Per Capita GDP of ASEAN Countries in 2000, 2005 and 2011(in current US dollars)
Table 2. Per Capita GDP of ASEAN Countries in 2000, 2005 and 2011(in current US dollars)
Table 2. Per Capita GDP of ASEAN Countries in 2000, 2005 and 2011(in current US dollars)
Table 2. Per Capita GDP of ASEAN Countries in 2000, 2005 and 2011(in current US dollars)
Economy/year 2000 2005 2011
01. Singapore 24,740 27,490 46,241
02. Brunei Darussalam n.a n.a 31,008a
03. Malaysia 3,380 10,320 9,656
04. Thailand 2,010 2,750 4,972
05. Indonesia 570 1,280 3,495
06. Philippines 1,040 1,300 2,370
07. Vietnam 390 620 1,411
08. Laos 290 440 1,320
09. Cambodia 260 380 900
10. Myanmar 142b 216 857Sources: For years 2000 and 2005, data are obtained from World Bank, World Development Reports, 2002 and 2006(on-line editions) and for year 2011 from World Bank, http://data.worldbank.org/indicator/NY.GDP.PCAP.CDFor Myanmar: the figures for 2000 and 2005 are from IMF, Staff Report for the 2002 and 2010 Article IV Consultations, issued on 30 September 2002 and 1 March 2011 respectively. The figure for 2011 is from ADB, Myanmar in Transition: Opportunities and Challenges (Manila: Asian Development Bank, 20 August 2012).a refers to year 2010, b refers to year 2001, n.a means not available.
Sources: For years 2000 and 2005, data are obtained from World Bank, World Development Reports, 2002 and 2006(on-line editions) and for year 2011 from World Bank, http://data.worldbank.org/indicator/NY.GDP.PCAP.CDFor Myanmar: the figures for 2000 and 2005 are from IMF, Staff Report for the 2002 and 2010 Article IV Consultations, issued on 30 September 2002 and 1 March 2011 respectively. The figure for 2011 is from ADB, Myanmar in Transition: Opportunities and Challenges (Manila: Asian Development Bank, 20 August 2012).a refers to year 2010, b refers to year 2001, n.a means not available.
Sources: For years 2000 and 2005, data are obtained from World Bank, World Development Reports, 2002 and 2006(on-line editions) and for year 2011 from World Bank, http://data.worldbank.org/indicator/NY.GDP.PCAP.CDFor Myanmar: the figures for 2000 and 2005 are from IMF, Staff Report for the 2002 and 2010 Article IV Consultations, issued on 30 September 2002 and 1 March 2011 respectively. The figure for 2011 is from ADB, Myanmar in Transition: Opportunities and Challenges (Manila: Asian Development Bank, 20 August 2012).a refers to year 2010, b refers to year 2001, n.a means not available.
Sources: For years 2000 and 2005, data are obtained from World Bank, World Development Reports, 2002 and 2006(on-line editions) and for year 2011 from World Bank, http://data.worldbank.org/indicator/NY.GDP.PCAP.CDFor Myanmar: the figures for 2000 and 2005 are from IMF, Staff Report for the 2002 and 2010 Article IV Consultations, issued on 30 September 2002 and 1 March 2011 respectively. The figure for 2011 is from ADB, Myanmar in Transition: Opportunities and Challenges (Manila: Asian Development Bank, 20 August 2012).a refers to year 2010, b refers to year 2001, n.a means not available.
Sources: For years 2000 and 2005, data are obtained from World Bank, World Development Reports, 2002 and 2006(on-line editions) and for year 2011 from World Bank, http://data.worldbank.org/indicator/NY.GDP.PCAP.CDFor Myanmar: the figures for 2000 and 2005 are from IMF, Staff Report for the 2002 and 2010 Article IV Consultations, issued on 30 September 2002 and 1 March 2011 respectively. The figure for 2011 is from ADB, Myanmar in Transition: Opportunities and Challenges (Manila: Asian Development Bank, 20 August 2012).a refers to year 2010, b refers to year 2001, n.a means not available.
Table 3. Myanmar and ASEAN Countries Per Capita GDP in 200, 2005 and 2011( in PPP US$)
Table 3. Myanmar and ASEAN Countries Per Capita GDP in 200, 2005 and 2011( in PPP US$)
Table 3. Myanmar and ASEAN Countries Per Capita GDP in 200, 2005 and 2011( in PPP US$)
Table 3. Myanmar and ASEAN Countries Per Capita GDP in 200, 2005 and 2011( in PPP US$)
Table 3. Myanmar and ASEAN Countries Per Capita GDP in 200, 2005 and 2011( in PPP US$)
Table 3. Myanmar and ASEAN Countries Per Capita GDP in 200, 2005 and 2011( in PPP US$)
Table 3. Myanmar and ASEAN Countries Per Capita GDP in 200, 2005 and 2011( in PPP US$)
Table 3. Myanmar and ASEAN Countries Per Capita GDP in 200, 2005 and 2011( in PPP US$)
Table 3. Myanmar and ASEAN Countries Per Capita GDP in 200, 2005 and 2011( in PPP US$)
Table 3. Myanmar and ASEAN Countries Per Capita GDP in 200, 2005 and 2011( in PPP US$)
Table 3. Myanmar and ASEAN Countries Per Capita GDP in 200, 2005 and 2011( in PPP US$)
Table 3. Myanmar and ASEAN Countries Per Capita GDP in 200, 2005 and 2011( in PPP US$)
Table 3. Myanmar and ASEAN Countries Per Capita GDP in 200, 2005 and 2011( in PPP US$)
Table 3. Myanmar and ASEAN Countries Per Capita GDP in 200, 2005 and 2011( in PPP US$)
Table 3. Myanmar and ASEAN Countries Per Capita GDP in 200, 2005 and 2011( in PPP US$)
Table 3. Myanmar and ASEAN Countries Per Capita GDP in 200, 2005 and 2011( in PPP US$)
Table 3. Myanmar and ASEAN Countries Per Capita GDP in 200, 2005 and 2011( in PPP US$)
Table 3. Myanmar and ASEAN Countries Per Capita GDP in 200, 2005 and 2011( in PPP US$)
Table 3. Myanmar and ASEAN Countries Per Capita GDP in 200, 2005 and 2011( in PPP US$)
Table 3. Myanmar and ASEAN Countries Per Capita GDP in 200, 2005 and 2011( in PPP US$)
EconomyEconomy2000
(PPP$)2000
(PPP$)2000
(PPP$)2000
HDI Rank2000
HDI Rank2005
(PPP$)2005
(PPP$)2005
(PPP$)2005
HDI Rank2005
HDI Rank2005
HDI Rank2011
(PPP$)2011
(PPP$)2011
(PPP$)2011
HDI Rank2011
HDI Rank2011
HDI Rank
01. SingaporeSingapore23,35623,35623,356 2525 29,66329,66329,663 252525 52,56952,56952,569 262626
02. Brunei DarussalamBrunei Darussalam16,77916,77916,779 3232 28,16128,16128,161 303030 45,75345,75345,753 333333
03. MalaysiaMalaysia9,0689,0689,068 5959 10,88210,88210,882 636363 13,68513,68513,685 616161
04. ThailandThailand6,4026,4026,402 7070 8,6778,6778,677 787878 7,6947,6947,694 103103103
05. IndonesiaIndonesia3,0433,0433,043 110110 3,8433,8433,843 107107107 3,7163,7163,716 124124124
06. PhilippinesPhilippines3,9713,9713,971 7171 5,1375,1375,137 909090 3,4783,4783,478 112112112
07. VietnamVietnam1,9961,9961,996 109109 3,0713,0713,071 105105105 2,8052,8052,805 128128128
08. LaosLaos1,5751,5751,575 143143 2,0392,0392,039 130130130 2,2422,2422,242 138138138
09. CambodiaCambodia1,4461,4461,446 130130 2,7272,7272,727 131131131 1,8481,8481,848 139139139
10. MyanmarMyanmar1,0271,0271,027 127127 1,0271,0271,027 132132132 1,5351,5351,535 149149149
Source: UNDP, Human Development Reports, various issues.Note: The purchasing power parity (PPP$) of a country's currency is the number of units of that currency required to purchase the same representative basket of goods and services (or a similar basket of goods and services) that a US dollar would buy in the United States. See UNDP, Human Development Report 1997, p. 239. To give an illustrative example, in simple terms, suppose a basket of 5 commodities and services consisting of a liter of petrol, a kilogramme of rice, a liter of cooking oil, a kilogramme of chicken, a haircut at the barbershop and bus fare for city travel for a distance of one kilometer costs a total of Kyats 20,000 in Myanmar and the same or similar basket of 5 commodities and services costs $40 in the United States, then PPP$1 = 20,000/40 = Kyats 500. Obviously, the calculation is more complex and sophisticated than this. For technical details see World Bank, International Comparisons Program, ICP 2003 – 2006 Handbook.
Source: UNDP, Human Development Reports, various issues.Note: The purchasing power parity (PPP$) of a country's currency is the number of units of that currency required to purchase the same representative basket of goods and services (or a similar basket of goods and services) that a US dollar would buy in the United States. See UNDP, Human Development Report 1997, p. 239. To give an illustrative example, in simple terms, suppose a basket of 5 commodities and services consisting of a liter of petrol, a kilogramme of rice, a liter of cooking oil, a kilogramme of chicken, a haircut at the barbershop and bus fare for city travel for a distance of one kilometer costs a total of Kyats 20,000 in Myanmar and the same or similar basket of 5 commodities and services costs $40 in the United States, then PPP$1 = 20,000/40 = Kyats 500. Obviously, the calculation is more complex and sophisticated than this. For technical details see World Bank, International Comparisons Program, ICP 2003 – 2006 Handbook.
Source: UNDP, Human Development Reports, various issues.Note: The purchasing power parity (PPP$) of a country's currency is the number of units of that currency required to purchase the same representative basket of goods and services (or a similar basket of goods and services) that a US dollar would buy in the United States. See UNDP, Human Development Report 1997, p. 239. To give an illustrative example, in simple terms, suppose a basket of 5 commodities and services consisting of a liter of petrol, a kilogramme of rice, a liter of cooking oil, a kilogramme of chicken, a haircut at the barbershop and bus fare for city travel for a distance of one kilometer costs a total of Kyats 20,000 in Myanmar and the same or similar basket of 5 commodities and services costs $40 in the United States, then PPP$1 = 20,000/40 = Kyats 500. Obviously, the calculation is more complex and sophisticated than this. For technical details see World Bank, International Comparisons Program, ICP 2003 – 2006 Handbook.
Source: UNDP, Human Development Reports, various issues.Note: The purchasing power parity (PPP$) of a country's currency is the number of units of that currency required to purchase the same representative basket of goods and services (or a similar basket of goods and services) that a US dollar would buy in the United States. See UNDP, Human Development Report 1997, p. 239. To give an illustrative example, in simple terms, suppose a basket of 5 commodities and services consisting of a liter of petrol, a kilogramme of rice, a liter of cooking oil, a kilogramme of chicken, a haircut at the barbershop and bus fare for city travel for a distance of one kilometer costs a total of Kyats 20,000 in Myanmar and the same or similar basket of 5 commodities and services costs $40 in the United States, then PPP$1 = 20,000/40 = Kyats 500. Obviously, the calculation is more complex and sophisticated than this. For technical details see World Bank, International Comparisons Program, ICP 2003 – 2006 Handbook.
Source: UNDP, Human Development Reports, various issues.Note: The purchasing power parity (PPP$) of a country's currency is the number of units of that currency required to purchase the same representative basket of goods and services (or a similar basket of goods and services) that a US dollar would buy in the United States. See UNDP, Human Development Report 1997, p. 239. To give an illustrative example, in simple terms, suppose a basket of 5 commodities and services consisting of a liter of petrol, a kilogramme of rice, a liter of cooking oil, a kilogramme of chicken, a haircut at the barbershop and bus fare for city travel for a distance of one kilometer costs a total of Kyats 20,000 in Myanmar and the same or similar basket of 5 commodities and services costs $40 in the United States, then PPP$1 = 20,000/40 = Kyats 500. Obviously, the calculation is more complex and sophisticated than this. For technical details see World Bank, International Comparisons Program, ICP 2003 – 2006 Handbook.
Source: UNDP, Human Development Reports, various issues.Note: The purchasing power parity (PPP$) of a country's currency is the number of units of that currency required to purchase the same representative basket of goods and services (or a similar basket of goods and services) that a US dollar would buy in the United States. See UNDP, Human Development Report 1997, p. 239. To give an illustrative example, in simple terms, suppose a basket of 5 commodities and services consisting of a liter of petrol, a kilogramme of rice, a liter of cooking oil, a kilogramme of chicken, a haircut at the barbershop and bus fare for city travel for a distance of one kilometer costs a total of Kyats 20,000 in Myanmar and the same or similar basket of 5 commodities and services costs $40 in the United States, then PPP$1 = 20,000/40 = Kyats 500. Obviously, the calculation is more complex and sophisticated than this. For technical details see World Bank, International Comparisons Program, ICP 2003 – 2006 Handbook.
Source: UNDP, Human Development Reports, various issues.Note: The purchasing power parity (PPP$) of a country's currency is the number of units of that currency required to purchase the same representative basket of goods and services (or a similar basket of goods and services) that a US dollar would buy in the United States. See UNDP, Human Development Report 1997, p. 239. To give an illustrative example, in simple terms, suppose a basket of 5 commodities and services consisting of a liter of petrol, a kilogramme of rice, a liter of cooking oil, a kilogramme of chicken, a haircut at the barbershop and bus fare for city travel for a distance of one kilometer costs a total of Kyats 20,000 in Myanmar and the same or similar basket of 5 commodities and services costs $40 in the United States, then PPP$1 = 20,000/40 = Kyats 500. Obviously, the calculation is more complex and sophisticated than this. For technical details see World Bank, International Comparisons Program, ICP 2003 – 2006 Handbook.
Source: UNDP, Human Development Reports, various issues.Note: The purchasing power parity (PPP$) of a country's currency is the number of units of that currency required to purchase the same representative basket of goods and services (or a similar basket of goods and services) that a US dollar would buy in the United States. See UNDP, Human Development Report 1997, p. 239. To give an illustrative example, in simple terms, suppose a basket of 5 commodities and services consisting of a liter of petrol, a kilogramme of rice, a liter of cooking oil, a kilogramme of chicken, a haircut at the barbershop and bus fare for city travel for a distance of one kilometer costs a total of Kyats 20,000 in Myanmar and the same or similar basket of 5 commodities and services costs $40 in the United States, then PPP$1 = 20,000/40 = Kyats 500. Obviously, the calculation is more complex and sophisticated than this. For technical details see World Bank, International Comparisons Program, ICP 2003 – 2006 Handbook.
Source: UNDP, Human Development Reports, various issues.Note: The purchasing power parity (PPP$) of a country's currency is the number of units of that currency required to purchase the same representative basket of goods and services (or a similar basket of goods and services) that a US dollar would buy in the United States. See UNDP, Human Development Report 1997, p. 239. To give an illustrative example, in simple terms, suppose a basket of 5 commodities and services consisting of a liter of petrol, a kilogramme of rice, a liter of cooking oil, a kilogramme of chicken, a haircut at the barbershop and bus fare for city travel for a distance of one kilometer costs a total of Kyats 20,000 in Myanmar and the same or similar basket of 5 commodities and services costs $40 in the United States, then PPP$1 = 20,000/40 = Kyats 500. Obviously, the calculation is more complex and sophisticated than this. For technical details see World Bank, International Comparisons Program, ICP 2003 – 2006 Handbook.
Source: UNDP, Human Development Reports, various issues.Note: The purchasing power parity (PPP$) of a country's currency is the number of units of that currency required to purchase the same representative basket of goods and services (or a similar basket of goods and services) that a US dollar would buy in the United States. See UNDP, Human Development Report 1997, p. 239. To give an illustrative example, in simple terms, suppose a basket of 5 commodities and services consisting of a liter of petrol, a kilogramme of rice, a liter of cooking oil, a kilogramme of chicken, a haircut at the barbershop and bus fare for city travel for a distance of one kilometer costs a total of Kyats 20,000 in Myanmar and the same or similar basket of 5 commodities and services costs $40 in the United States, then PPP$1 = 20,000/40 = Kyats 500. Obviously, the calculation is more complex and sophisticated than this. For technical details see World Bank, International Comparisons Program, ICP 2003 – 2006 Handbook.
Source: UNDP, Human Development Reports, various issues.Note: The purchasing power parity (PPP$) of a country's currency is the number of units of that currency required to purchase the same representative basket of goods and services (or a similar basket of goods and services) that a US dollar would buy in the United States. See UNDP, Human Development Report 1997, p. 239. To give an illustrative example, in simple terms, suppose a basket of 5 commodities and services consisting of a liter of petrol, a kilogramme of rice, a liter of cooking oil, a kilogramme of chicken, a haircut at the barbershop and bus fare for city travel for a distance of one kilometer costs a total of Kyats 20,000 in Myanmar and the same or similar basket of 5 commodities and services costs $40 in the United States, then PPP$1 = 20,000/40 = Kyats 500. Obviously, the calculation is more complex and sophisticated than this. For technical details see World Bank, International Comparisons Program, ICP 2003 – 2006 Handbook.
Source: UNDP, Human Development Reports, various issues.Note: The purchasing power parity (PPP$) of a country's currency is the number of units of that currency required to purchase the same representative basket of goods and services (or a similar basket of goods and services) that a US dollar would buy in the United States. See UNDP, Human Development Report 1997, p. 239. To give an illustrative example, in simple terms, suppose a basket of 5 commodities and services consisting of a liter of petrol, a kilogramme of rice, a liter of cooking oil, a kilogramme of chicken, a haircut at the barbershop and bus fare for city travel for a distance of one kilometer costs a total of Kyats 20,000 in Myanmar and the same or similar basket of 5 commodities and services costs $40 in the United States, then PPP$1 = 20,000/40 = Kyats 500. Obviously, the calculation is more complex and sophisticated than this. For technical details see World Bank, International Comparisons Program, ICP 2003 – 2006 Handbook.
Source: UNDP, Human Development Reports, various issues.Note: The purchasing power parity (PPP$) of a country's currency is the number of units of that currency required to purchase the same representative basket of goods and services (or a similar basket of goods and services) that a US dollar would buy in the United States. See UNDP, Human Development Report 1997, p. 239. To give an illustrative example, in simple terms, suppose a basket of 5 commodities and services consisting of a liter of petrol, a kilogramme of rice, a liter of cooking oil, a kilogramme of chicken, a haircut at the barbershop and bus fare for city travel for a distance of one kilometer costs a total of Kyats 20,000 in Myanmar and the same or similar basket of 5 commodities and services costs $40 in the United States, then PPP$1 = 20,000/40 = Kyats 500. Obviously, the calculation is more complex and sophisticated than this. For technical details see World Bank, International Comparisons Program, ICP 2003 – 2006 Handbook.
Source: UNDP, Human Development Reports, various issues.Note: The purchasing power parity (PPP$) of a country's currency is the number of units of that currency required to purchase the same representative basket of goods and services (or a similar basket of goods and services) that a US dollar would buy in the United States. See UNDP, Human Development Report 1997, p. 239. To give an illustrative example, in simple terms, suppose a basket of 5 commodities and services consisting of a liter of petrol, a kilogramme of rice, a liter of cooking oil, a kilogramme of chicken, a haircut at the barbershop and bus fare for city travel for a distance of one kilometer costs a total of Kyats 20,000 in Myanmar and the same or similar basket of 5 commodities and services costs $40 in the United States, then PPP$1 = 20,000/40 = Kyats 500. Obviously, the calculation is more complex and sophisticated than this. For technical details see World Bank, International Comparisons Program, ICP 2003 – 2006 Handbook.
Source: UNDP, Human Development Reports, various issues.Note: The purchasing power parity (PPP$) of a country's currency is the number of units of that currency required to purchase the same representative basket of goods and services (or a similar basket of goods and services) that a US dollar would buy in the United States. See UNDP, Human Development Report 1997, p. 239. To give an illustrative example, in simple terms, suppose a basket of 5 commodities and services consisting of a liter of petrol, a kilogramme of rice, a liter of cooking oil, a kilogramme of chicken, a haircut at the barbershop and bus fare for city travel for a distance of one kilometer costs a total of Kyats 20,000 in Myanmar and the same or similar basket of 5 commodities and services costs $40 in the United States, then PPP$1 = 20,000/40 = Kyats 500. Obviously, the calculation is more complex and sophisticated than this. For technical details see World Bank, International Comparisons Program, ICP 2003 – 2006 Handbook.
Source: UNDP, Human Development Reports, various issues.Note: The purchasing power parity (PPP$) of a country's currency is the number of units of that currency required to purchase the same representative basket of goods and services (or a similar basket of goods and services) that a US dollar would buy in the United States. See UNDP, Human Development Report 1997, p. 239. To give an illustrative example, in simple terms, suppose a basket of 5 commodities and services consisting of a liter of petrol, a kilogramme of rice, a liter of cooking oil, a kilogramme of chicken, a haircut at the barbershop and bus fare for city travel for a distance of one kilometer costs a total of Kyats 20,000 in Myanmar and the same or similar basket of 5 commodities and services costs $40 in the United States, then PPP$1 = 20,000/40 = Kyats 500. Obviously, the calculation is more complex and sophisticated than this. For technical details see World Bank, International Comparisons Program, ICP 2003 – 2006 Handbook.
Source: UNDP, Human Development Reports, various issues.Note: The purchasing power parity (PPP$) of a country's currency is the number of units of that currency required to purchase the same representative basket of goods and services (or a similar basket of goods and services) that a US dollar would buy in the United States. See UNDP, Human Development Report 1997, p. 239. To give an illustrative example, in simple terms, suppose a basket of 5 commodities and services consisting of a liter of petrol, a kilogramme of rice, a liter of cooking oil, a kilogramme of chicken, a haircut at the barbershop and bus fare for city travel for a distance of one kilometer costs a total of Kyats 20,000 in Myanmar and the same or similar basket of 5 commodities and services costs $40 in the United States, then PPP$1 = 20,000/40 = Kyats 500. Obviously, the calculation is more complex and sophisticated than this. For technical details see World Bank, International Comparisons Program, ICP 2003 – 2006 Handbook.
Source: UNDP, Human Development Reports, various issues.Note: The purchasing power parity (PPP$) of a country's currency is the number of units of that currency required to purchase the same representative basket of goods and services (or a similar basket of goods and services) that a US dollar would buy in the United States. See UNDP, Human Development Report 1997, p. 239. To give an illustrative example, in simple terms, suppose a basket of 5 commodities and services consisting of a liter of petrol, a kilogramme of rice, a liter of cooking oil, a kilogramme of chicken, a haircut at the barbershop and bus fare for city travel for a distance of one kilometer costs a total of Kyats 20,000 in Myanmar and the same or similar basket of 5 commodities and services costs $40 in the United States, then PPP$1 = 20,000/40 = Kyats 500. Obviously, the calculation is more complex and sophisticated than this. For technical details see World Bank, International Comparisons Program, ICP 2003 – 2006 Handbook.
Source: UNDP, Human Development Reports, various issues.Note: The purchasing power parity (PPP$) of a country's currency is the number of units of that currency required to purchase the same representative basket of goods and services (or a similar basket of goods and services) that a US dollar would buy in the United States. See UNDP, Human Development Report 1997, p. 239. To give an illustrative example, in simple terms, suppose a basket of 5 commodities and services consisting of a liter of petrol, a kilogramme of rice, a liter of cooking oil, a kilogramme of chicken, a haircut at the barbershop and bus fare for city travel for a distance of one kilometer costs a total of Kyats 20,000 in Myanmar and the same or similar basket of 5 commodities and services costs $40 in the United States, then PPP$1 = 20,000/40 = Kyats 500. Obviously, the calculation is more complex and sophisticated than this. For technical details see World Bank, International Comparisons Program, ICP 2003 – 2006 Handbook.
Source: UNDP, Human Development Reports, various issues.Note: The purchasing power parity (PPP$) of a country's currency is the number of units of that currency required to purchase the same representative basket of goods and services (or a similar basket of goods and services) that a US dollar would buy in the United States. See UNDP, Human Development Report 1997, p. 239. To give an illustrative example, in simple terms, suppose a basket of 5 commodities and services consisting of a liter of petrol, a kilogramme of rice, a liter of cooking oil, a kilogramme of chicken, a haircut at the barbershop and bus fare for city travel for a distance of one kilometer costs a total of Kyats 20,000 in Myanmar and the same or similar basket of 5 commodities and services costs $40 in the United States, then PPP$1 = 20,000/40 = Kyats 500. Obviously, the calculation is more complex and sophisticated than this. For technical details see World Bank, International Comparisons Program, ICP 2003 – 2006 Handbook.
Table 4. Sectoral Shares of GDP, Selected Asian Economies: 1970, 1980, 1990 and 2011(Percent)
Table 4. Sectoral Shares of GDP, Selected Asian Economies: 1970, 1980, 1990 and 2011(Percent)
Table 4. Sectoral Shares of GDP, Selected Asian Economies: 1970, 1980, 1990 and 2011(Percent)
Table 4. Sectoral Shares of GDP, Selected Asian Economies: 1970, 1980, 1990 and 2011(Percent)
Table 4. Sectoral Shares of GDP, Selected Asian Economies: 1970, 1980, 1990 and 2011(Percent)
Table 4. Sectoral Shares of GDP, Selected Asian Economies: 1970, 1980, 1990 and 2011(Percent)
Table 4. Sectoral Shares of GDP, Selected Asian Economies: 1970, 1980, 1990 and 2011(Percent)
Table 4. Sectoral Shares of GDP, Selected Asian Economies: 1970, 1980, 1990 and 2011(Percent)
Table 4. Sectoral Shares of GDP, Selected Asian Economies: 1970, 1980, 1990 and 2011(Percent)
Table 4. Sectoral Shares of GDP, Selected Asian Economies: 1970, 1980, 1990 and 2011(Percent)
Table 4. Sectoral Shares of GDP, Selected Asian Economies: 1970, 1980, 1990 and 2011(Percent)
Table 4. Sectoral Shares of GDP, Selected Asian Economies: 1970, 1980, 1990 and 2011(Percent)
Table 4. Sectoral Shares of GDP, Selected Asian Economies: 1970, 1980, 1990 and 2011(Percent)
Table 4. Sectoral Shares of GDP, Selected Asian Economies: 1970, 1980, 1990 and 2011(Percent)
Table 4. Sectoral Shares of GDP, Selected Asian Economies: 1970, 1980, 1990 and 2011(Percent)
Table 4. Sectoral Shares of GDP, Selected Asian Economies: 1970, 1980, 1990 and 2011(Percent)
Table 4. Sectoral Shares of GDP, Selected Asian Economies: 1970, 1980, 1990 and 2011(Percent)
Table 4. Sectoral Shares of GDP, Selected Asian Economies: 1970, 1980, 1990 and 2011(Percent)
Table 4. Sectoral Shares of GDP, Selected Asian Economies: 1970, 1980, 1990 and 2011(Percent)
EconomyEconomy AGRICULTURE1970 1980 1990 2011 AGRICULTURE1970 1980 1990 2011 AGRICULTURE1970 1980 1990 2011 AGRICULTURE1970 1980 1990 2011 AGRICULTURE1970 1980 1990 2011
INDUSTRY 1970 1980 1990 2011
INDUSTRY 1970 1980 1990 2011
INDUSTRY 1970 1980 1990 2011
INDUSTRY 1970 1980 1990 2011
INDUSTRY 1970 1980 1990 2011
INDUSTRY 1970 1980 1990 2011
SERVICES1970 1980 1990 2011 SERVICES1970 1980 1990 2011 SERVICES1970 1980 1990 2011 SERVICES1970 1980 1990 2011 SERVICES1970 1980 1990 2011 SERVICES1970 1980 1990 2011
(01). Singapore(01). Singapore 2.2 1.3 0.4 0.00.0 36.4 38.138.1 34.4 26.626.6 61.4 60.660.6 65.3 73.473.4
(02). Hong Kong*(02). Hong Kong* n.a. 0.8 0.3 0.10.1 n.a. 31.731.7 25.3 7.17.1 n.a. 67.567.5 74.5 92.992.9
(03). Taiwan, China(03). Taiwan, China n.a. 7.7 4.2 1.71.7 n.a. 45.745.7 41.2 29.629.6 n.a. 46.646.6 48.4 68.768.7
(04). Rep. of Korea(04). Rep. of Korea 29.8 14.9 8.5 2.72.7 23.8 41.341.3 43.1 39.239.2 46.4 43.743.7 48.4 58.158.1
(05). China(05). China 42.2 30.1 27.0 10.110.1 44.6 48.548.5 41.6 46.846.8 13.2 21.421.4 31.3 43.143.1
(06). Thailand*(06). Thailand* 30.2 23.2 12.5 10.910.9 25.7 28.728.7 37.2 40.140.1 44.1 48.148.1 50.3 49.049.0
(07). Malaysia(07). Malaysian.a. 22.9 15.2 12.012.0 n.a. 35.835.8 42.2 40.740.7 n.a. 41.341.3 42.6 47.347.3
23
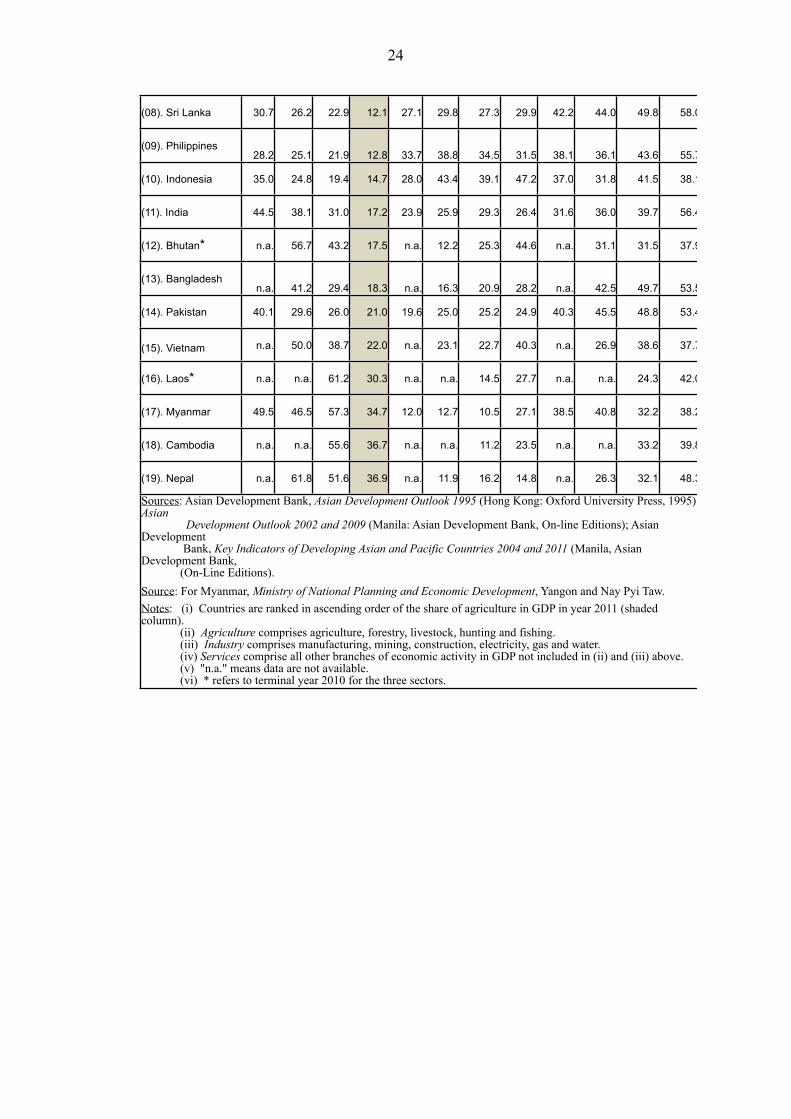
(08). Sri Lanka(08). Sri Lanka 30.7 26.2 22.9 12.112.1 27.1 29.829.8 27.3 29.929.9 42.2 44.044.0 49.8 58.058.0
(09). Philippines(09). Philippines28.2 25.1 21.9 12.812.8 33.7 38.838.8 34.5 31.531.5 38.1 36.136.1 43.6 55.755.7
(10). Indonesia(10). Indonesia 35.0 24.8 19.4 14.714.7 28.0 43.443.4 39.1 47.247.2 37.0 31.831.8 41.5 38.138.1
(11). India (11). India 44.5 38.1 31.0 17.217.2 23.9 25.925.9 29.3 26.426.4 31.6 36.036.0 39.7 56.456.4
(12). Bhutan*(12). Bhutan* n.a. 56.7 43.2 17.517.5 n.a. 12.212.2 25.3 44.644.6 n.a. 31.131.1 31.5 37.937.9
(13). Bangladesh(13). Bangladeshn.a. 41.2 29.4 18.318.3 n.a. 16.316.3 20.9 28.228.2 n.a. 42.542.5 49.7 53.553.5
(14). Pakistan(14). Pakistan 40.1 29.6 26.0 21.021.0 19.6 25.025.0 25.2 24.924.9 40.3 45.545.5 48.8 53.453.4
(15). Vietnam(15). Vietnam n.a. 50.0 38.7 22.022.0 n.a. 23.123.1 22.7 40.340.3 n.a. 26.926.9 38.6 37.737.7
(16). Laos*(16). Laos* n.a. n.a. 61.2 30.330.3 n.a. n.a.n.a. 14.5 27.727.7 n.a. n.a.n.a. 24.3 42.042.0
(17). Myanmar(17). Myanmar 49.5 46.5 57.3 34.734.7 12.0 12.712.7 10.5 27.127.1 38.5 40.840.8 32.2 38.238.2
(18). Cambodia(18). Cambodia n.a. n.a. 55.6 36.736.7 n.a. n.a.n.a. 11.2 23.523.5 n.a. n.a.n.a. 33.2 39.839.8
(19). Nepal(19). Nepal n.a. 61.8 51.6 36.936.9 n.a. 11.911.9 16.2 14.814.8 n.a. 26.326.3 32.1 48.348.3
Sources: Asian Development Bank, Asian Development Outlook 1995 (Hong Kong: Oxford University Press, 1995); Asian Development Outlook 2002 and 2009 (Manila: Asian Development Bank, On-line Editions); Asian Development Bank, Key Indicators of Developing Asian and Pacific Countries 2004 and 2011 (Manila, Asian Development Bank, (On-Line Editions).Source: For Myanmar, Ministry of National Planning and Economic Development, Yangon and Nay Pyi Taw.Notes: (i) Countries are ranked in ascending order of the share of agriculture in GDP in year 2011 (shaded column). (ii) Agriculture comprises agriculture, forestry, livestock, hunting and fishing. (iii) Industry comprises manufacturing, mining, construction, electricity, gas and water. (iv) Services comprise all other branches of economic activity in GDP not included in (ii) and (iii) above. (v) "n.a." means data are not available. (vi) * refers to terminal year 2010 for the three sectors.
Sources: Asian Development Bank, Asian Development Outlook 1995 (Hong Kong: Oxford University Press, 1995); Asian Development Outlook 2002 and 2009 (Manila: Asian Development Bank, On-line Editions); Asian Development Bank, Key Indicators of Developing Asian and Pacific Countries 2004 and 2011 (Manila, Asian Development Bank, (On-Line Editions).Source: For Myanmar, Ministry of National Planning and Economic Development, Yangon and Nay Pyi Taw.Notes: (i) Countries are ranked in ascending order of the share of agriculture in GDP in year 2011 (shaded column). (ii) Agriculture comprises agriculture, forestry, livestock, hunting and fishing. (iii) Industry comprises manufacturing, mining, construction, electricity, gas and water. (iv) Services comprise all other branches of economic activity in GDP not included in (ii) and (iii) above. (v) "n.a." means data are not available. (vi) * refers to terminal year 2010 for the three sectors.
Sources: Asian Development Bank, Asian Development Outlook 1995 (Hong Kong: Oxford University Press, 1995); Asian Development Outlook 2002 and 2009 (Manila: Asian Development Bank, On-line Editions); Asian Development Bank, Key Indicators of Developing Asian and Pacific Countries 2004 and 2011 (Manila, Asian Development Bank, (On-Line Editions).Source: For Myanmar, Ministry of National Planning and Economic Development, Yangon and Nay Pyi Taw.Notes: (i) Countries are ranked in ascending order of the share of agriculture in GDP in year 2011 (shaded column). (ii) Agriculture comprises agriculture, forestry, livestock, hunting and fishing. (iii) Industry comprises manufacturing, mining, construction, electricity, gas and water. (iv) Services comprise all other branches of economic activity in GDP not included in (ii) and (iii) above. (v) "n.a." means data are not available. (vi) * refers to terminal year 2010 for the three sectors.
Sources: Asian Development Bank, Asian Development Outlook 1995 (Hong Kong: Oxford University Press, 1995); Asian Development Outlook 2002 and 2009 (Manila: Asian Development Bank, On-line Editions); Asian Development Bank, Key Indicators of Developing Asian and Pacific Countries 2004 and 2011 (Manila, Asian Development Bank, (On-Line Editions).Source: For Myanmar, Ministry of National Planning and Economic Development, Yangon and Nay Pyi Taw.Notes: (i) Countries are ranked in ascending order of the share of agriculture in GDP in year 2011 (shaded column). (ii) Agriculture comprises agriculture, forestry, livestock, hunting and fishing. (iii) Industry comprises manufacturing, mining, construction, electricity, gas and water. (iv) Services comprise all other branches of economic activity in GDP not included in (ii) and (iii) above. (v) "n.a." means data are not available. (vi) * refers to terminal year 2010 for the three sectors.
Sources: Asian Development Bank, Asian Development Outlook 1995 (Hong Kong: Oxford University Press, 1995); Asian Development Outlook 2002 and 2009 (Manila: Asian Development Bank, On-line Editions); Asian Development Bank, Key Indicators of Developing Asian and Pacific Countries 2004 and 2011 (Manila, Asian Development Bank, (On-Line Editions).Source: For Myanmar, Ministry of National Planning and Economic Development, Yangon and Nay Pyi Taw.Notes: (i) Countries are ranked in ascending order of the share of agriculture in GDP in year 2011 (shaded column). (ii) Agriculture comprises agriculture, forestry, livestock, hunting and fishing. (iii) Industry comprises manufacturing, mining, construction, electricity, gas and water. (iv) Services comprise all other branches of economic activity in GDP not included in (ii) and (iii) above. (v) "n.a." means data are not available. (vi) * refers to terminal year 2010 for the three sectors.
Sources: Asian Development Bank, Asian Development Outlook 1995 (Hong Kong: Oxford University Press, 1995); Asian Development Outlook 2002 and 2009 (Manila: Asian Development Bank, On-line Editions); Asian Development Bank, Key Indicators of Developing Asian and Pacific Countries 2004 and 2011 (Manila, Asian Development Bank, (On-Line Editions).Source: For Myanmar, Ministry of National Planning and Economic Development, Yangon and Nay Pyi Taw.Notes: (i) Countries are ranked in ascending order of the share of agriculture in GDP in year 2011 (shaded column). (ii) Agriculture comprises agriculture, forestry, livestock, hunting and fishing. (iii) Industry comprises manufacturing, mining, construction, electricity, gas and water. (iv) Services comprise all other branches of economic activity in GDP not included in (ii) and (iii) above. (v) "n.a." means data are not available. (vi) * refers to terminal year 2010 for the three sectors.
Sources: Asian Development Bank, Asian Development Outlook 1995 (Hong Kong: Oxford University Press, 1995); Asian Development Outlook 2002 and 2009 (Manila: Asian Development Bank, On-line Editions); Asian Development Bank, Key Indicators of Developing Asian and Pacific Countries 2004 and 2011 (Manila, Asian Development Bank, (On-Line Editions).Source: For Myanmar, Ministry of National Planning and Economic Development, Yangon and Nay Pyi Taw.Notes: (i) Countries are ranked in ascending order of the share of agriculture in GDP in year 2011 (shaded column). (ii) Agriculture comprises agriculture, forestry, livestock, hunting and fishing. (iii) Industry comprises manufacturing, mining, construction, electricity, gas and water. (iv) Services comprise all other branches of economic activity in GDP not included in (ii) and (iii) above. (v) "n.a." means data are not available. (vi) * refers to terminal year 2010 for the three sectors.
Sources: Asian Development Bank, Asian Development Outlook 1995 (Hong Kong: Oxford University Press, 1995); Asian Development Outlook 2002 and 2009 (Manila: Asian Development Bank, On-line Editions); Asian Development Bank, Key Indicators of Developing Asian and Pacific Countries 2004 and 2011 (Manila, Asian Development Bank, (On-Line Editions).Source: For Myanmar, Ministry of National Planning and Economic Development, Yangon and Nay Pyi Taw.Notes: (i) Countries are ranked in ascending order of the share of agriculture in GDP in year 2011 (shaded column). (ii) Agriculture comprises agriculture, forestry, livestock, hunting and fishing. (iii) Industry comprises manufacturing, mining, construction, electricity, gas and water. (iv) Services comprise all other branches of economic activity in GDP not included in (ii) and (iii) above. (v) "n.a." means data are not available. (vi) * refers to terminal year 2010 for the three sectors.
Sources: Asian Development Bank, Asian Development Outlook 1995 (Hong Kong: Oxford University Press, 1995); Asian Development Outlook 2002 and 2009 (Manila: Asian Development Bank, On-line Editions); Asian Development Bank, Key Indicators of Developing Asian and Pacific Countries 2004 and 2011 (Manila, Asian Development Bank, (On-Line Editions).Source: For Myanmar, Ministry of National Planning and Economic Development, Yangon and Nay Pyi Taw.Notes: (i) Countries are ranked in ascending order of the share of agriculture in GDP in year 2011 (shaded column). (ii) Agriculture comprises agriculture, forestry, livestock, hunting and fishing. (iii) Industry comprises manufacturing, mining, construction, electricity, gas and water. (iv) Services comprise all other branches of economic activity in GDP not included in (ii) and (iii) above. (v) "n.a." means data are not available. (vi) * refers to terminal year 2010 for the three sectors.
Sources: Asian Development Bank, Asian Development Outlook 1995 (Hong Kong: Oxford University Press, 1995); Asian Development Outlook 2002 and 2009 (Manila: Asian Development Bank, On-line Editions); Asian Development Bank, Key Indicators of Developing Asian and Pacific Countries 2004 and 2011 (Manila, Asian Development Bank, (On-Line Editions).Source: For Myanmar, Ministry of National Planning and Economic Development, Yangon and Nay Pyi Taw.Notes: (i) Countries are ranked in ascending order of the share of agriculture in GDP in year 2011 (shaded column). (ii) Agriculture comprises agriculture, forestry, livestock, hunting and fishing. (iii) Industry comprises manufacturing, mining, construction, electricity, gas and water. (iv) Services comprise all other branches of economic activity in GDP not included in (ii) and (iii) above. (v) "n.a." means data are not available. (vi) * refers to terminal year 2010 for the three sectors.
Sources: Asian Development Bank, Asian Development Outlook 1995 (Hong Kong: Oxford University Press, 1995); Asian Development Outlook 2002 and 2009 (Manila: Asian Development Bank, On-line Editions); Asian Development Bank, Key Indicators of Developing Asian and Pacific Countries 2004 and 2011 (Manila, Asian Development Bank, (On-Line Editions).Source: For Myanmar, Ministry of National Planning and Economic Development, Yangon and Nay Pyi Taw.Notes: (i) Countries are ranked in ascending order of the share of agriculture in GDP in year 2011 (shaded column). (ii) Agriculture comprises agriculture, forestry, livestock, hunting and fishing. (iii) Industry comprises manufacturing, mining, construction, electricity, gas and water. (iv) Services comprise all other branches of economic activity in GDP not included in (ii) and (iii) above. (v) "n.a." means data are not available. (vi) * refers to terminal year 2010 for the three sectors.
Sources: Asian Development Bank, Asian Development Outlook 1995 (Hong Kong: Oxford University Press, 1995); Asian Development Outlook 2002 and 2009 (Manila: Asian Development Bank, On-line Editions); Asian Development Bank, Key Indicators of Developing Asian and Pacific Countries 2004 and 2011 (Manila, Asian Development Bank, (On-Line Editions).Source: For Myanmar, Ministry of National Planning and Economic Development, Yangon and Nay Pyi Taw.Notes: (i) Countries are ranked in ascending order of the share of agriculture in GDP in year 2011 (shaded column). (ii) Agriculture comprises agriculture, forestry, livestock, hunting and fishing. (iii) Industry comprises manufacturing, mining, construction, electricity, gas and water. (iv) Services comprise all other branches of economic activity in GDP not included in (ii) and (iii) above. (v) "n.a." means data are not available. (vi) * refers to terminal year 2010 for the three sectors.
Sources: Asian Development Bank, Asian Development Outlook 1995 (Hong Kong: Oxford University Press, 1995); Asian Development Outlook 2002 and 2009 (Manila: Asian Development Bank, On-line Editions); Asian Development Bank, Key Indicators of Developing Asian and Pacific Countries 2004 and 2011 (Manila, Asian Development Bank, (On-Line Editions).Source: For Myanmar, Ministry of National Planning and Economic Development, Yangon and Nay Pyi Taw.Notes: (i) Countries are ranked in ascending order of the share of agriculture in GDP in year 2011 (shaded column). (ii) Agriculture comprises agriculture, forestry, livestock, hunting and fishing. (iii) Industry comprises manufacturing, mining, construction, electricity, gas and water. (iv) Services comprise all other branches of economic activity in GDP not included in (ii) and (iii) above. (v) "n.a." means data are not available. (vi) * refers to terminal year 2010 for the three sectors.
Sources: Asian Development Bank, Asian Development Outlook 1995 (Hong Kong: Oxford University Press, 1995); Asian Development Outlook 2002 and 2009 (Manila: Asian Development Bank, On-line Editions); Asian Development Bank, Key Indicators of Developing Asian and Pacific Countries 2004 and 2011 (Manila, Asian Development Bank, (On-Line Editions).Source: For Myanmar, Ministry of National Planning and Economic Development, Yangon and Nay Pyi Taw.Notes: (i) Countries are ranked in ascending order of the share of agriculture in GDP in year 2011 (shaded column). (ii) Agriculture comprises agriculture, forestry, livestock, hunting and fishing. (iii) Industry comprises manufacturing, mining, construction, electricity, gas and water. (iv) Services comprise all other branches of economic activity in GDP not included in (ii) and (iii) above. (v) "n.a." means data are not available. (vi) * refers to terminal year 2010 for the three sectors.
Sources: Asian Development Bank, Asian Development Outlook 1995 (Hong Kong: Oxford University Press, 1995); Asian Development Outlook 2002 and 2009 (Manila: Asian Development Bank, On-line Editions); Asian Development Bank, Key Indicators of Developing Asian and Pacific Countries 2004 and 2011 (Manila, Asian Development Bank, (On-Line Editions).Source: For Myanmar, Ministry of National Planning and Economic Development, Yangon and Nay Pyi Taw.Notes: (i) Countries are ranked in ascending order of the share of agriculture in GDP in year 2011 (shaded column). (ii) Agriculture comprises agriculture, forestry, livestock, hunting and fishing. (iii) Industry comprises manufacturing, mining, construction, electricity, gas and water. (iv) Services comprise all other branches of economic activity in GDP not included in (ii) and (iii) above. (v) "n.a." means data are not available. (vi) * refers to terminal year 2010 for the three sectors.
Sources: Asian Development Bank, Asian Development Outlook 1995 (Hong Kong: Oxford University Press, 1995); Asian Development Outlook 2002 and 2009 (Manila: Asian Development Bank, On-line Editions); Asian Development Bank, Key Indicators of Developing Asian and Pacific Countries 2004 and 2011 (Manila, Asian Development Bank, (On-Line Editions).Source: For Myanmar, Ministry of National Planning and Economic Development, Yangon and Nay Pyi Taw.Notes: (i) Countries are ranked in ascending order of the share of agriculture in GDP in year 2011 (shaded column). (ii) Agriculture comprises agriculture, forestry, livestock, hunting and fishing. (iii) Industry comprises manufacturing, mining, construction, electricity, gas and water. (iv) Services comprise all other branches of economic activity in GDP not included in (ii) and (iii) above. (v) "n.a." means data are not available. (vi) * refers to terminal year 2010 for the three sectors.
Sources: Asian Development Bank, Asian Development Outlook 1995 (Hong Kong: Oxford University Press, 1995); Asian Development Outlook 2002 and 2009 (Manila: Asian Development Bank, On-line Editions); Asian Development Bank, Key Indicators of Developing Asian and Pacific Countries 2004 and 2011 (Manila, Asian Development Bank, (On-Line Editions).Source: For Myanmar, Ministry of National Planning and Economic Development, Yangon and Nay Pyi Taw.Notes: (i) Countries are ranked in ascending order of the share of agriculture in GDP in year 2011 (shaded column). (ii) Agriculture comprises agriculture, forestry, livestock, hunting and fishing. (iii) Industry comprises manufacturing, mining, construction, electricity, gas and water. (iv) Services comprise all other branches of economic activity in GDP not included in (ii) and (iii) above. (v) "n.a." means data are not available. (vi) * refers to terminal year 2010 for the three sectors.
Sources: Asian Development Bank, Asian Development Outlook 1995 (Hong Kong: Oxford University Press, 1995); Asian Development Outlook 2002 and 2009 (Manila: Asian Development Bank, On-line Editions); Asian Development Bank, Key Indicators of Developing Asian and Pacific Countries 2004 and 2011 (Manila, Asian Development Bank, (On-Line Editions).Source: For Myanmar, Ministry of National Planning and Economic Development, Yangon and Nay Pyi Taw.Notes: (i) Countries are ranked in ascending order of the share of agriculture in GDP in year 2011 (shaded column). (ii) Agriculture comprises agriculture, forestry, livestock, hunting and fishing. (iii) Industry comprises manufacturing, mining, construction, electricity, gas and water. (iv) Services comprise all other branches of economic activity in GDP not included in (ii) and (iii) above. (v) "n.a." means data are not available. (vi) * refers to terminal year 2010 for the three sectors.
Sources: Asian Development Bank, Asian Development Outlook 1995 (Hong Kong: Oxford University Press, 1995); Asian Development Outlook 2002 and 2009 (Manila: Asian Development Bank, On-line Editions); Asian Development Bank, Key Indicators of Developing Asian and Pacific Countries 2004 and 2011 (Manila, Asian Development Bank, (On-Line Editions).Source: For Myanmar, Ministry of National Planning and Economic Development, Yangon and Nay Pyi Taw.Notes: (i) Countries are ranked in ascending order of the share of agriculture in GDP in year 2011 (shaded column). (ii) Agriculture comprises agriculture, forestry, livestock, hunting and fishing. (iii) Industry comprises manufacturing, mining, construction, electricity, gas and water. (iv) Services comprise all other branches of economic activity in GDP not included in (ii) and (iii) above. (v) "n.a." means data are not available. (vi) * refers to terminal year 2010 for the three sectors.
24
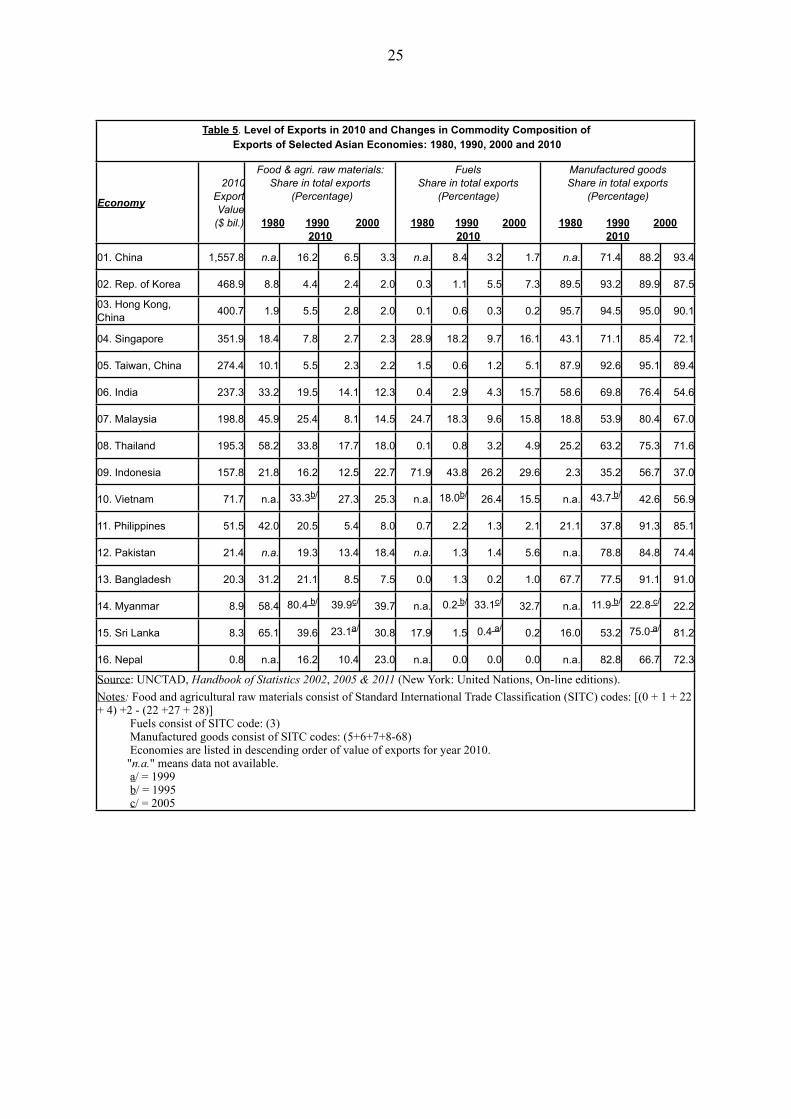
Table 5. Level of Exports in 2010 and Changes in Commodity Composition of Exports of Selected Asian Economies: 1980, 1990, 2000 and 2010
Table 5. Level of Exports in 2010 and Changes in Commodity Composition of Exports of Selected Asian Economies: 1980, 1990, 2000 and 2010
Table 5. Level of Exports in 2010 and Changes in Commodity Composition of Exports of Selected Asian Economies: 1980, 1990, 2000 and 2010
Table 5. Level of Exports in 2010 and Changes in Commodity Composition of Exports of Selected Asian Economies: 1980, 1990, 2000 and 2010
Table 5. Level of Exports in 2010 and Changes in Commodity Composition of Exports of Selected Asian Economies: 1980, 1990, 2000 and 2010
Table 5. Level of Exports in 2010 and Changes in Commodity Composition of Exports of Selected Asian Economies: 1980, 1990, 2000 and 2010
Table 5. Level of Exports in 2010 and Changes in Commodity Composition of Exports of Selected Asian Economies: 1980, 1990, 2000 and 2010
Table 5. Level of Exports in 2010 and Changes in Commodity Composition of Exports of Selected Asian Economies: 1980, 1990, 2000 and 2010
Table 5. Level of Exports in 2010 and Changes in Commodity Composition of Exports of Selected Asian Economies: 1980, 1990, 2000 and 2010
Table 5. Level of Exports in 2010 and Changes in Commodity Composition of Exports of Selected Asian Economies: 1980, 1990, 2000 and 2010
Table 5. Level of Exports in 2010 and Changes in Commodity Composition of Exports of Selected Asian Economies: 1980, 1990, 2000 and 2010
Table 5. Level of Exports in 2010 and Changes in Commodity Composition of Exports of Selected Asian Economies: 1980, 1990, 2000 and 2010
Table 5. Level of Exports in 2010 and Changes in Commodity Composition of Exports of Selected Asian Economies: 1980, 1990, 2000 and 2010
Table 5. Level of Exports in 2010 and Changes in Commodity Composition of Exports of Selected Asian Economies: 1980, 1990, 2000 and 2010
Economy
2010ExportValue
($ bil.)
Food & agri. raw materials: Share in total exports
(Percentage)
1980 1990 2000 2010
Food & agri. raw materials: Share in total exports
(Percentage)
1980 1990 2000 2010
Food & agri. raw materials: Share in total exports
(Percentage)
1980 1990 2000 2010
Food & agri. raw materials: Share in total exports
(Percentage)
1980 1990 2000 2010
FuelsShare in total exports
(Percentage)
1980 1990 2000 2010
FuelsShare in total exports
(Percentage)
1980 1990 2000 2010
FuelsShare in total exports
(Percentage)
1980 1990 2000 2010
FuelsShare in total exports
(Percentage)
1980 1990 2000 2010
Manufactured goodsShare in total exports
(Percentage)
1980 1990 2000 2010
Manufactured goodsShare in total exports
(Percentage)
1980 1990 2000 2010
Manufactured goodsShare in total exports
(Percentage)
1980 1990 2000 2010
Manufactured goodsShare in total exports
(Percentage)
1980 1990 2000 2010
01. China 1,557.8 n.a. 16.2 6.5 3.3 n.a. 8.4 3.2 1.7 n.a. 71.4 88.2 93.4
02. Rep. of Korea 468.9 8.8 4.4 2.4 2.0 0.3 1.1 5.5 7.3 89.5 93.2 89.9 87.5
03. Hong Kong, China 400.7 1.9 5.5 2.8 2.0 0.1 0.6 0.3 0.2 95.7 94.5 95.0 90.1
04. Singapore 351.9 18.4 7.8 2.7 2.3 28.9 18.2 9.7 16.1 43.1 71.1 85.4 72.1
05. Taiwan, China 274.4 10.1 5.5 2.3 2.2 1.5 0.6 1.2 5.1 87.9 92.6 95.1 89.4
06. India 237.3 33.2 19.5 14.1 12.3 0.4 2.9 4.3 15.7 58.6 69.8 76.4 54.6
07. Malaysia 198.8 45.9 25.4 8.1 14.5 24.7 18.3 9.6 15.8 18.8 53.9 80.4 67.0
08. Thailand 195.3 58.2 33.8 17.7 18.0 0.1 0.8 3.2 4.9 25.2 63.2 75.3 71.6
09. Indonesia 157.8 21.8 16.2 12.5 22.7 71.9 43.8 26.2 29.6 2.3 35.2 56.7 37.0
10. Vietnam 71.7 n.a. 33.3b/ 27.3 25.3 n.a. 18.0b/ 26.4 15.5 n.a. 43.7 b/ 42.6 56.9
11. Philippines 51.5 42.0 20.5 5.4 8.0 0.7 2.2 1.3 2.1 21.1 37.8 91.3 85.1
12. Pakistan 21.4 n.a. 19.3 13.4 18.4 n.a. 1.3 1.4 5.6 n.a. 78.8 84.8 74.4
13. Bangladesh 20.3 31.2 21.1 8.5 7.5 0.0 1.3 0.2 1.0 67.7 77.5 91.1 91.0
14. Myanmar 8.9 58.4 80.4 b/ 39.9c/ 39.7 n.a. 0.2 b/ 33.1c/ 32.7 n.a. 11.9 b/ 22.8 c/ 22.2
15. Sri Lanka 8.3 65.1 39.6 23.1a/ 30.8 17.9 1.5 0.4 a/ 0.2 16.0 53.2 75.0 a/ 81.2
16. Nepal 0.8 n.a. 16.2 10.4 23.0 n.a. 0.0 0.0 0.0 n.a. 82.8 66.7 72.3
Source: UNCTAD, Handbook of Statistics 2002, 2005 & 2011 (New York: United Nations, On-line editions).Notes: Food and agricultural raw materials consist of Standard International Trade Classification (SITC) codes: [(0 + 1 + 22 + 4) +2 - (22 +27 + 28)] Fuels consist of SITC code: (3) Manufactured goods consist of SITC codes: (5+6+7+8-68) Economies are listed in descending order of value of exports for year 2010. "n.a." means data not available. a/ = 1999 b/ = 1995 c/ = 2005
Source: UNCTAD, Handbook of Statistics 2002, 2005 & 2011 (New York: United Nations, On-line editions).Notes: Food and agricultural raw materials consist of Standard International Trade Classification (SITC) codes: [(0 + 1 + 22 + 4) +2 - (22 +27 + 28)] Fuels consist of SITC code: (3) Manufactured goods consist of SITC codes: (5+6+7+8-68) Economies are listed in descending order of value of exports for year 2010. "n.a." means data not available. a/ = 1999 b/ = 1995 c/ = 2005
Source: UNCTAD, Handbook of Statistics 2002, 2005 & 2011 (New York: United Nations, On-line editions).Notes: Food and agricultural raw materials consist of Standard International Trade Classification (SITC) codes: [(0 + 1 + 22 + 4) +2 - (22 +27 + 28)] Fuels consist of SITC code: (3) Manufactured goods consist of SITC codes: (5+6+7+8-68) Economies are listed in descending order of value of exports for year 2010. "n.a." means data not available. a/ = 1999 b/ = 1995 c/ = 2005
Source: UNCTAD, Handbook of Statistics 2002, 2005 & 2011 (New York: United Nations, On-line editions).Notes: Food and agricultural raw materials consist of Standard International Trade Classification (SITC) codes: [(0 + 1 + 22 + 4) +2 - (22 +27 + 28)] Fuels consist of SITC code: (3) Manufactured goods consist of SITC codes: (5+6+7+8-68) Economies are listed in descending order of value of exports for year 2010. "n.a." means data not available. a/ = 1999 b/ = 1995 c/ = 2005
Source: UNCTAD, Handbook of Statistics 2002, 2005 & 2011 (New York: United Nations, On-line editions).Notes: Food and agricultural raw materials consist of Standard International Trade Classification (SITC) codes: [(0 + 1 + 22 + 4) +2 - (22 +27 + 28)] Fuels consist of SITC code: (3) Manufactured goods consist of SITC codes: (5+6+7+8-68) Economies are listed in descending order of value of exports for year 2010. "n.a." means data not available. a/ = 1999 b/ = 1995 c/ = 2005
Source: UNCTAD, Handbook of Statistics 2002, 2005 & 2011 (New York: United Nations, On-line editions).Notes: Food and agricultural raw materials consist of Standard International Trade Classification (SITC) codes: [(0 + 1 + 22 + 4) +2 - (22 +27 + 28)] Fuels consist of SITC code: (3) Manufactured goods consist of SITC codes: (5+6+7+8-68) Economies are listed in descending order of value of exports for year 2010. "n.a." means data not available. a/ = 1999 b/ = 1995 c/ = 2005
Source: UNCTAD, Handbook of Statistics 2002, 2005 & 2011 (New York: United Nations, On-line editions).Notes: Food and agricultural raw materials consist of Standard International Trade Classification (SITC) codes: [(0 + 1 + 22 + 4) +2 - (22 +27 + 28)] Fuels consist of SITC code: (3) Manufactured goods consist of SITC codes: (5+6+7+8-68) Economies are listed in descending order of value of exports for year 2010. "n.a." means data not available. a/ = 1999 b/ = 1995 c/ = 2005
Source: UNCTAD, Handbook of Statistics 2002, 2005 & 2011 (New York: United Nations, On-line editions).Notes: Food and agricultural raw materials consist of Standard International Trade Classification (SITC) codes: [(0 + 1 + 22 + 4) +2 - (22 +27 + 28)] Fuels consist of SITC code: (3) Manufactured goods consist of SITC codes: (5+6+7+8-68) Economies are listed in descending order of value of exports for year 2010. "n.a." means data not available. a/ = 1999 b/ = 1995 c/ = 2005
Source: UNCTAD, Handbook of Statistics 2002, 2005 & 2011 (New York: United Nations, On-line editions).Notes: Food and agricultural raw materials consist of Standard International Trade Classification (SITC) codes: [(0 + 1 + 22 + 4) +2 - (22 +27 + 28)] Fuels consist of SITC code: (3) Manufactured goods consist of SITC codes: (5+6+7+8-68) Economies are listed in descending order of value of exports for year 2010. "n.a." means data not available. a/ = 1999 b/ = 1995 c/ = 2005
Source: UNCTAD, Handbook of Statistics 2002, 2005 & 2011 (New York: United Nations, On-line editions).Notes: Food and agricultural raw materials consist of Standard International Trade Classification (SITC) codes: [(0 + 1 + 22 + 4) +2 - (22 +27 + 28)] Fuels consist of SITC code: (3) Manufactured goods consist of SITC codes: (5+6+7+8-68) Economies are listed in descending order of value of exports for year 2010. "n.a." means data not available. a/ = 1999 b/ = 1995 c/ = 2005
Source: UNCTAD, Handbook of Statistics 2002, 2005 & 2011 (New York: United Nations, On-line editions).Notes: Food and agricultural raw materials consist of Standard International Trade Classification (SITC) codes: [(0 + 1 + 22 + 4) +2 - (22 +27 + 28)] Fuels consist of SITC code: (3) Manufactured goods consist of SITC codes: (5+6+7+8-68) Economies are listed in descending order of value of exports for year 2010. "n.a." means data not available. a/ = 1999 b/ = 1995 c/ = 2005
Source: UNCTAD, Handbook of Statistics 2002, 2005 & 2011 (New York: United Nations, On-line editions).Notes: Food and agricultural raw materials consist of Standard International Trade Classification (SITC) codes: [(0 + 1 + 22 + 4) +2 - (22 +27 + 28)] Fuels consist of SITC code: (3) Manufactured goods consist of SITC codes: (5+6+7+8-68) Economies are listed in descending order of value of exports for year 2010. "n.a." means data not available. a/ = 1999 b/ = 1995 c/ = 2005
Source: UNCTAD, Handbook of Statistics 2002, 2005 & 2011 (New York: United Nations, On-line editions).Notes: Food and agricultural raw materials consist of Standard International Trade Classification (SITC) codes: [(0 + 1 + 22 + 4) +2 - (22 +27 + 28)] Fuels consist of SITC code: (3) Manufactured goods consist of SITC codes: (5+6+7+8-68) Economies are listed in descending order of value of exports for year 2010. "n.a." means data not available. a/ = 1999 b/ = 1995 c/ = 2005
Source: UNCTAD, Handbook of Statistics 2002, 2005 & 2011 (New York: United Nations, On-line editions).Notes: Food and agricultural raw materials consist of Standard International Trade Classification (SITC) codes: [(0 + 1 + 22 + 4) +2 - (22 +27 + 28)] Fuels consist of SITC code: (3) Manufactured goods consist of SITC codes: (5+6+7+8-68) Economies are listed in descending order of value of exports for year 2010. "n.a." means data not available. a/ = 1999 b/ = 1995 c/ = 2005
25
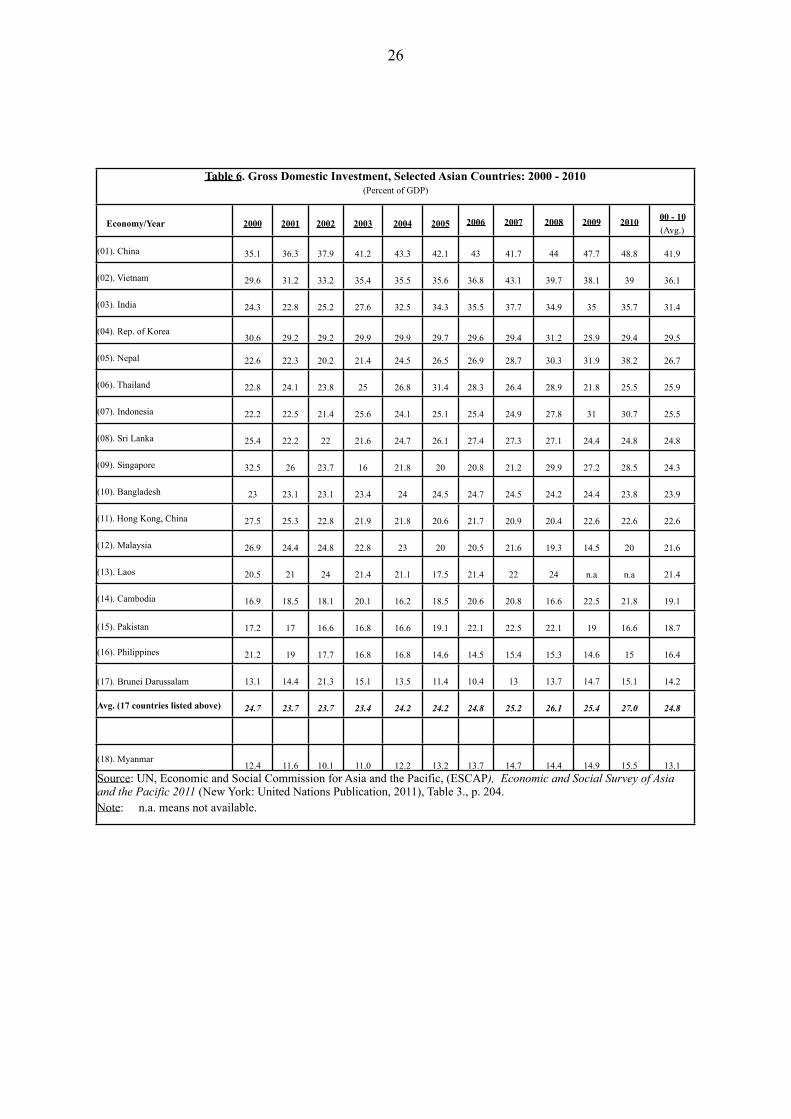
Table 6. Gross Domestic Investment, Selected Asian Countries: 2000 - 2010(Percent of GDP)
Table 6. Gross Domestic Investment, Selected Asian Countries: 2000 - 2010(Percent of GDP)
Table 6. Gross Domestic Investment, Selected Asian Countries: 2000 - 2010(Percent of GDP)
Table 6. Gross Domestic Investment, Selected Asian Countries: 2000 - 2010(Percent of GDP)
Table 6. Gross Domestic Investment, Selected Asian Countries: 2000 - 2010(Percent of GDP)
Table 6. Gross Domestic Investment, Selected Asian Countries: 2000 - 2010(Percent of GDP)
Table 6. Gross Domestic Investment, Selected Asian Countries: 2000 - 2010(Percent of GDP)
Table 6. Gross Domestic Investment, Selected Asian Countries: 2000 - 2010(Percent of GDP)
Table 6. Gross Domestic Investment, Selected Asian Countries: 2000 - 2010(Percent of GDP)
Table 6. Gross Domestic Investment, Selected Asian Countries: 2000 - 2010(Percent of GDP)
Table 6. Gross Domestic Investment, Selected Asian Countries: 2000 - 2010(Percent of GDP)
Table 6. Gross Domestic Investment, Selected Asian Countries: 2000 - 2010(Percent of GDP)
Table 6. Gross Domestic Investment, Selected Asian Countries: 2000 - 2010(Percent of GDP)
Economy/Year 2000 2001 2002 2003 2004 2005 2006 2007 2008 2009 2010 00 - 10(Avg.)
(01). China 35.1 36.3 37.9 41.2 43.3 42.1 43 41.7 44 47.7 48.8 41.9
(02). Vietnam 29.6 31.2 33.2 35.4 35.5 35.6 36.8 43.1 39.7 38.1 39 36.1
(03). India 24.3 22.8 25.2 27.6 32.5 34.3 35.5 37.7 34.9 35 35.7 31.4
(04). Rep. of Korea30.6 29.2 29.2 29.9 29.9 29.7 29.6 29.4 31.2 25.9 29.4 29.5
(05). Nepal 22.6 22.3 20.2 21.4 24.5 26.5 26.9 28.7 30.3 31.9 38.2 26.7
(06). Thailand 22.8 24.1 23.8 25 26.8 31.4 28.3 26.4 28.9 21.8 25.5 25.9
(07). Indonesia 22.2 22.5 21.4 25.6 24.1 25.1 25.4 24.9 27.8 31 30.7 25.5
(08). Sri Lanka 25.4 22.2 22 21.6 24.7 26.1 27.4 27.3 27.1 24.4 24.8 24.8
(09). Singapore 32.5 26 23.7 16 21.8 20 20.8 21.2 29.9 27.2 28.5 24.3
(10). Bangladesh 23 23.1 23.1 23.4 24 24.5 24.7 24.5 24.2 24.4 23.8 23.9
(11). Hong Kong, China 27.5 25.3 22.8 21.9 21.8 20.6 21.7 20.9 20.4 22.6 22.6 22.6
(12). Malaysia 26.9 24.4 24.8 22.8 23 20 20.5 21.6 19.3 14.5 20 21.6
(13). Laos 20.5 21 24 21.4 21.1 17.5 21.4 22 24 n.a n.a 21.4
(14). Cambodia 16.9 18.5 18.1 20.1 16.2 18.5 20.6 20.8 16.6 22.5 21.8 19.1
(15). Pakistan 17.2 17 16.6 16.8 16.6 19.1 22.1 22.5 22.1 19 16.6 18.7
(16). Philippines 21.2 19 17.7 16.8 16.8 14.6 14.5 15.4 15.3 14.6 15 16.4
(17). Brunei Darussalam 13.1 14.4 21.3 15.1 13.5 11.4 10.4 13 13.7 14.7 15.1 14.2
Avg. (17 countries listed above) 24.7 23.7 23.7 23.4 24.2 24.2 24.8 25.2 26.1 25.4 27.0 24.8
(18). Myanmar12.4 11.6 10.1 11.0 12.2 13.2 13.7 14.7 14.4 14.9 15.5 13.1
Source: UN, Economic and Social Commission for Asia and the Pacific, (ESCAP), Economic and Social Survey of Asia and the Pacific 2011 (New York: United Nations Publication, 2011), Table 3., p. 204.Note: n.a. means not available.
Source: UN, Economic and Social Commission for Asia and the Pacific, (ESCAP), Economic and Social Survey of Asia and the Pacific 2011 (New York: United Nations Publication, 2011), Table 3., p. 204.Note: n.a. means not available.
Source: UN, Economic and Social Commission for Asia and the Pacific, (ESCAP), Economic and Social Survey of Asia and the Pacific 2011 (New York: United Nations Publication, 2011), Table 3., p. 204.Note: n.a. means not available.
Source: UN, Economic and Social Commission for Asia and the Pacific, (ESCAP), Economic and Social Survey of Asia and the Pacific 2011 (New York: United Nations Publication, 2011), Table 3., p. 204.Note: n.a. means not available.
Source: UN, Economic and Social Commission for Asia and the Pacific, (ESCAP), Economic and Social Survey of Asia and the Pacific 2011 (New York: United Nations Publication, 2011), Table 3., p. 204.Note: n.a. means not available.
Source: UN, Economic and Social Commission for Asia and the Pacific, (ESCAP), Economic and Social Survey of Asia and the Pacific 2011 (New York: United Nations Publication, 2011), Table 3., p. 204.Note: n.a. means not available.
Source: UN, Economic and Social Commission for Asia and the Pacific, (ESCAP), Economic and Social Survey of Asia and the Pacific 2011 (New York: United Nations Publication, 2011), Table 3., p. 204.Note: n.a. means not available.
Source: UN, Economic and Social Commission for Asia and the Pacific, (ESCAP), Economic and Social Survey of Asia and the Pacific 2011 (New York: United Nations Publication, 2011), Table 3., p. 204.Note: n.a. means not available.
Source: UN, Economic and Social Commission for Asia and the Pacific, (ESCAP), Economic and Social Survey of Asia and the Pacific 2011 (New York: United Nations Publication, 2011), Table 3., p. 204.Note: n.a. means not available.
Source: UN, Economic and Social Commission for Asia and the Pacific, (ESCAP), Economic and Social Survey of Asia and the Pacific 2011 (New York: United Nations Publication, 2011), Table 3., p. 204.Note: n.a. means not available.
Source: UN, Economic and Social Commission for Asia and the Pacific, (ESCAP), Economic and Social Survey of Asia and the Pacific 2011 (New York: United Nations Publication, 2011), Table 3., p. 204.Note: n.a. means not available.
Source: UN, Economic and Social Commission for Asia and the Pacific, (ESCAP), Economic and Social Survey of Asia and the Pacific 2011 (New York: United Nations Publication, 2011), Table 3., p. 204.Note: n.a. means not available.
Source: UN, Economic and Social Commission for Asia and the Pacific, (ESCAP), Economic and Social Survey of Asia and the Pacific 2011 (New York: United Nations Publication, 2011), Table 3., p. 204.Note: n.a. means not available.
26
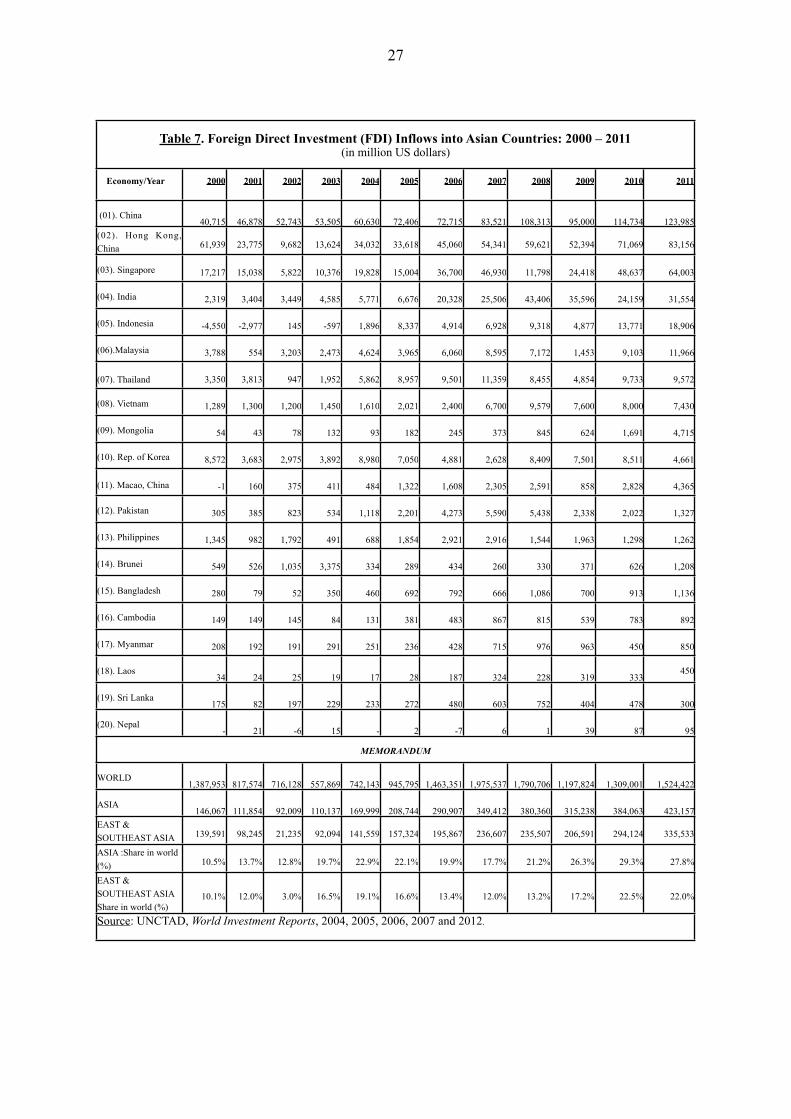
Table 7. Foreign Direct Investment (FDI) Inflows into Asian Countries: 2000 – 2011(in million US dollars)
Table 7. Foreign Direct Investment (FDI) Inflows into Asian Countries: 2000 – 2011(in million US dollars)
Table 7. Foreign Direct Investment (FDI) Inflows into Asian Countries: 2000 – 2011(in million US dollars)
Table 7. Foreign Direct Investment (FDI) Inflows into Asian Countries: 2000 – 2011(in million US dollars)
Table 7. Foreign Direct Investment (FDI) Inflows into Asian Countries: 2000 – 2011(in million US dollars)
Table 7. Foreign Direct Investment (FDI) Inflows into Asian Countries: 2000 – 2011(in million US dollars)
Table 7. Foreign Direct Investment (FDI) Inflows into Asian Countries: 2000 – 2011(in million US dollars)
Table 7. Foreign Direct Investment (FDI) Inflows into Asian Countries: 2000 – 2011(in million US dollars)
Table 7. Foreign Direct Investment (FDI) Inflows into Asian Countries: 2000 – 2011(in million US dollars)
Table 7. Foreign Direct Investment (FDI) Inflows into Asian Countries: 2000 – 2011(in million US dollars)
Table 7. Foreign Direct Investment (FDI) Inflows into Asian Countries: 2000 – 2011(in million US dollars)
Table 7. Foreign Direct Investment (FDI) Inflows into Asian Countries: 2000 – 2011(in million US dollars)
Table 7. Foreign Direct Investment (FDI) Inflows into Asian Countries: 2000 – 2011(in million US dollars)
Economy/Year 2000 2001 2002 2003 2004 2005 2006 2007 2008 2009 2010 2011
(01). China40,715 46,878 52,743 53,505 60,630 72,406 72,715 83,521 108,313 95,000 114,734 123,985
(02). Hong Kong, China 61,939 23,775 9,682 13,624 34,032 33,618 45,060 54,341 59,621 52,394 71,069 83,156
(03). Singapore 17,217 15,038 5,822 10,376 19,828 15,004 36,700 46,930 11,798 24,418 48,637 64,003
(04). India 2,319 3,404 3,449 4,585 5,771 6,676 20,328 25,506 43,406 35,596 24,159 31,554
(05). Indonesia -4,550 -2,977 145 -597 1,896 8,337 4,914 6,928 9,318 4,877 13,771 18,906
(06).Malaysia 3,788 554 3,203 2,473 4,624 3,965 6,060 8,595 7,172 1,453 9,103 11,966
(07). Thailand 3,350 3,813 947 1,952 5,862 8,957 9,501 11,359 8,455 4,854 9,733 9,572
(08). Vietnam 1,289 1,300 1,200 1,450 1,610 2,021 2,400 6,700 9,579 7,600 8,000 7,430
(09). Mongolia 54 43 78 132 93 182 245 373 845 624 1,691 4,715
(10). Rep. of Korea 8,572 3,683 2,975 3,892 8,980 7,050 4,881 2,628 8,409 7,501 8,511 4,661
(11). Macao, China -1 160 375 411 484 1,322 1,608 2,305 2,591 858 2,828 4,365
(12). Pakistan 305 385 823 534 1,118 2,201 4,273 5,590 5,438 2,338 2,022 1,327
(13). Philippines 1,345 982 1,792 491 688 1,854 2,921 2,916 1,544 1,963 1,298 1,262
(14). Brunei 549 526 1,035 3,375 334 289 434 260 330 371 626 1,208
(15). Bangladesh 280 79 52 350 460 692 792 666 1,086 700 913 1,136
(16). Cambodia 149 149 145 84 131 381 483 867 815 539 783 892
(17). Myanmar 208 192 191 291 251 236 428 715 976 963 450 850
(18). Laos34 24 25 19 17 28 187 324 228 319 333
450
(19). Sri Lanka175 82 197 229 233 272 480 603 752 404 478 300
(20). Nepal- 21 -6 15 - 2 -7 6 1 39 87 95
MEMORANDUMMEMORANDUMMEMORANDUMMEMORANDUMMEMORANDUMMEMORANDUMMEMORANDUMMEMORANDUMMEMORANDUMMEMORANDUMMEMORANDUMMEMORANDUMMEMORANDUM
WORLD1,387,953 817,574 716,128 557,869 742,143 945,795 1,463,351 1,975,537 1,790,706 1,197,824 1,309,001 1,524,422
ASIA146,067 111,854 92,009 110,137 169,999 208,744 290,907 349,412 380,360 315,238 384,063 423,157
EAST & SOUTHEAST ASIA 139,591 98,245 21,235 92,094 141,559 157,324 195,867 236,607 235,507 206,591 294,124 335,533
ASIA :Share in world (%) 10.5% 13.7% 12.8% 19.7% 22.9% 22.1% 19.9% 17.7% 21.2% 26.3% 29.3% 27.8%
EAST & SOUTHEAST ASIAShare in world (%)
10.1% 12.0% 3.0% 16.5% 19.1% 16.6% 13.4% 12.0% 13.2% 17.2% 22.5% 22.0%
Source: UNCTAD, World Investment Reports, 2004, 2005, 2006, 2007 and 2012.Source: UNCTAD, World Investment Reports, 2004, 2005, 2006, 2007 and 2012.Source: UNCTAD, World Investment Reports, 2004, 2005, 2006, 2007 and 2012.Source: UNCTAD, World Investment Reports, 2004, 2005, 2006, 2007 and 2012.Source: UNCTAD, World Investment Reports, 2004, 2005, 2006, 2007 and 2012.Source: UNCTAD, World Investment Reports, 2004, 2005, 2006, 2007 and 2012.Source: UNCTAD, World Investment Reports, 2004, 2005, 2006, 2007 and 2012.Source: UNCTAD, World Investment Reports, 2004, 2005, 2006, 2007 and 2012.Source: UNCTAD, World Investment Reports, 2004, 2005, 2006, 2007 and 2012.Source: UNCTAD, World Investment Reports, 2004, 2005, 2006, 2007 and 2012.Source: UNCTAD, World Investment Reports, 2004, 2005, 2006, 2007 and 2012.Source: UNCTAD, World Investment Reports, 2004, 2005, 2006, 2007 and 2012.Source: UNCTAD, World Investment Reports, 2004, 2005, 2006, 2007 and 2012.
27
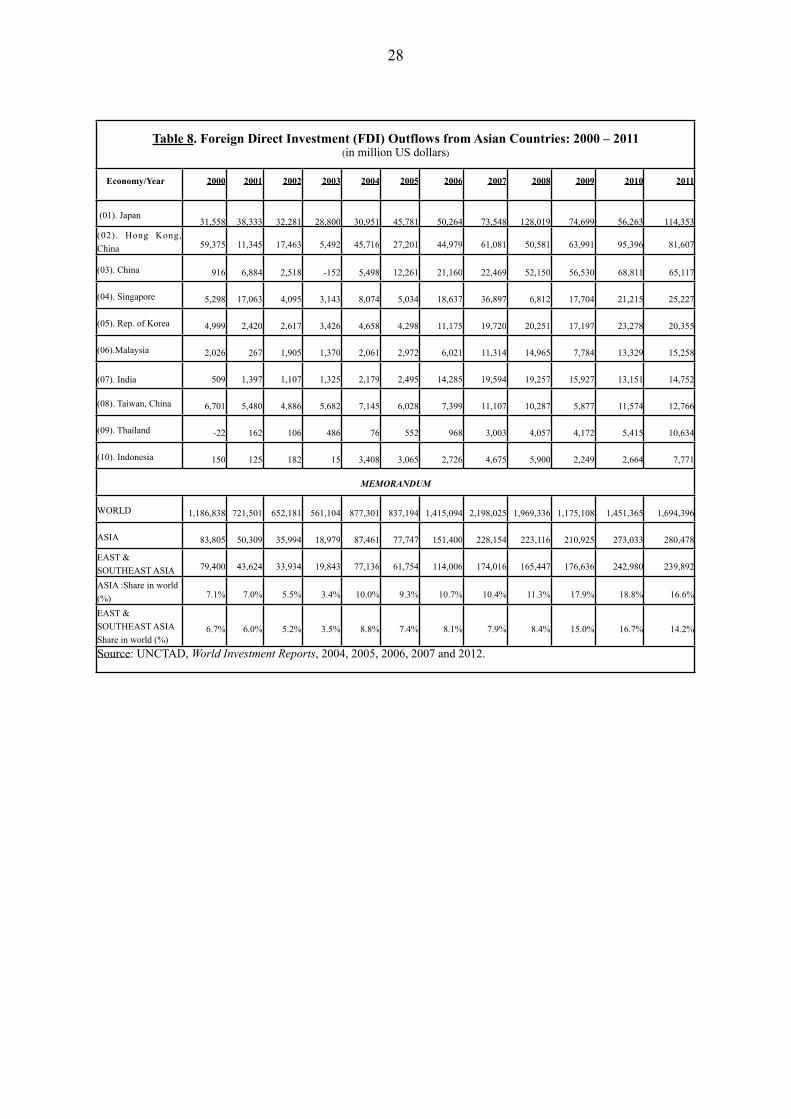
Table 8. Foreign Direct Investment (FDI) Outflows from Asian Countries: 2000 – 2011(in million US dollars)
Table 8. Foreign Direct Investment (FDI) Outflows from Asian Countries: 2000 – 2011(in million US dollars)
Table 8. Foreign Direct Investment (FDI) Outflows from Asian Countries: 2000 – 2011(in million US dollars)
Table 8. Foreign Direct Investment (FDI) Outflows from Asian Countries: 2000 – 2011(in million US dollars)
Table 8. Foreign Direct Investment (FDI) Outflows from Asian Countries: 2000 – 2011(in million US dollars)
Table 8. Foreign Direct Investment (FDI) Outflows from Asian Countries: 2000 – 2011(in million US dollars)
Table 8. Foreign Direct Investment (FDI) Outflows from Asian Countries: 2000 – 2011(in million US dollars)
Table 8. Foreign Direct Investment (FDI) Outflows from Asian Countries: 2000 – 2011(in million US dollars)
Table 8. Foreign Direct Investment (FDI) Outflows from Asian Countries: 2000 – 2011(in million US dollars)
Table 8. Foreign Direct Investment (FDI) Outflows from Asian Countries: 2000 – 2011(in million US dollars)
Table 8. Foreign Direct Investment (FDI) Outflows from Asian Countries: 2000 – 2011(in million US dollars)
Table 8. Foreign Direct Investment (FDI) Outflows from Asian Countries: 2000 – 2011(in million US dollars)
Table 8. Foreign Direct Investment (FDI) Outflows from Asian Countries: 2000 – 2011(in million US dollars)
Economy/Year 2000 2001 2002 2003 2004 2005 2006 2007 2008 2009 2010 2011
(01). Japan31,558 38,333 32,281 28,800 30,951 45,781 50,264 73,548 128,019 74,699 56,263 114,353
(02). Hong Kong, China 59,375 11,345 17,463 5,492 45,716 27,201 44,979 61,081 50,581 63,991 95,396 81,607
(03). China 916 6,884 2,518 -152 5,498 12,261 21,160 22,469 52,150 56,530 68,811 65,117
(04). Singapore 5,298 17,063 4,095 3,143 8,074 5,034 18,637 36,897 6,812 17,704 21,215 25,227
(05). Rep. of Korea 4,999 2,420 2,617 3,426 4,658 4,298 11,175 19,720 20,251 17,197 23,278 20,355
(06).Malaysia 2,026 267 1,905 1,370 2,061 2,972 6,021 11,314 14,965 7,784 13,329 15,258
(07). India 509 1,397 1,107 1,325 2,179 2,495 14,285 19,594 19,257 15,927 13,151 14,752
(08). Taiwan, China 6,701 5,480 4,886 5,682 7,145 6,028 7,399 11,107 10,287 5,877 11,574 12,766
(09). Thailand -22 162 106 486 76 552 968 3,003 4,057 4,172 5,415 10,634
(10). Indonesia 150 125 182 15 3,408 3,065 2,726 4,675 5,900 2,249 2,664 7,771
MEMORANDUMMEMORANDUMMEMORANDUMMEMORANDUMMEMORANDUMMEMORANDUMMEMORANDUMMEMORANDUMMEMORANDUMMEMORANDUMMEMORANDUMMEMORANDUMMEMORANDUM
WORLD 1,186,838 721,501 652,181 561,104 877,301 837,194 1,415,094 2,198,025 1,969,336 1,175,108 1,451,365 1,694,396
ASIA 83,805 50,309 35,994 18,979 87,461 77,747 151,400 228,154 223,116 210,925 273,033 280,478
EAST & SOUTHEAST ASIA 79,400 43,624 33,934 19,843 77,136 61,754 114,006 174,016 165,447 176,636 242,980 239,892
ASIA :Share in world (%) 7.1% 7.0% 5.5% 3.4% 10.0% 9.3% 10.7% 10.4% 11.3% 17.9% 18.8% 16.6%
EAST & SOUTHEAST ASIAShare in world (%)
6.7% 6.0% 5.2% 3.5% 8.8% 7.4% 8.1% 7.9% 8.4% 15.0% 16.7% 14.2%
Source: UNCTAD, World Investment Reports, 2004, 2005, 2006, 2007 and 2012.Source: UNCTAD, World Investment Reports, 2004, 2005, 2006, 2007 and 2012.Source: UNCTAD, World Investment Reports, 2004, 2005, 2006, 2007 and 2012.Source: UNCTAD, World Investment Reports, 2004, 2005, 2006, 2007 and 2012.Source: UNCTAD, World Investment Reports, 2004, 2005, 2006, 2007 and 2012.Source: UNCTAD, World Investment Reports, 2004, 2005, 2006, 2007 and 2012.Source: UNCTAD, World Investment Reports, 2004, 2005, 2006, 2007 and 2012.Source: UNCTAD, World Investment Reports, 2004, 2005, 2006, 2007 and 2012.Source: UNCTAD, World Investment Reports, 2004, 2005, 2006, 2007 and 2012.Source: UNCTAD, World Investment Reports, 2004, 2005, 2006, 2007 and 2012.Source: UNCTAD, World Investment Reports, 2004, 2005, 2006, 2007 and 2012.Source: UNCTAD, World Investment Reports, 2004, 2005, 2006, 2007 and 2012.Source: UNCTAD, World Investment Reports, 2004, 2005, 2006, 2007 and 2012.
28