Embed Size (px)
Citation preview
IJIPBART (2015) Volume 2, Issue (3), pp: 217-227 ISSN: 2349-865X
OPEN ACCESS
International Journal of Innovation in Pharma
Biosciences and Research Technology (IJIPBART)
Original Research Article
www.refsynjournals.com 217
One step N-desmethylation reaction for the synthesis and
characterization of the N-desmethyl Escitalopram from
Escitalopram oxalate
V.Saranya1, G.Vanaja
1*,
C.Premalatha
1, J.Nowsath ali
2
1Department of Chemistry, Dhanalakshmi Srinivasan College of Arts and Science for Women, Perambalur-
621212, India 2 R&D Department, Refsyn Biosciences Pvt. Ltd, Puducherry-605005, India.
ABSTRACT
INTRODUCTION
Synthetic chemistry is a branch of chemistry where chemical reactions are purposefully
employed to obtain a product or several products and this field has evolved to a greater extent.
Synthetic methods which can provide the expected product in high standards of chemical yield,
selectivity and purity as in biochemical methods are needed. A chemical substance used in the
treatment, cure, prevention, or diagnosis of a disease is called a drug. Any component that is not the
chemical entity of the drug substance and affects the purity of active ingredient or drug substance is
called an Impurity, as defined by the International Conference on Harmonization (ICH) Guidelines
(US FDA, 2003). Degradants are chemical substances formed as a result of breakdown of drugs
during longer storage conditions.
The chemical process in which methyl group is removed from a molecule is called
demethylation. N-demethylation is a chemical transformation of major importance in the synthesis of
drugs, intermediates of pharmaceutical compounds and metabolites. N-demethylation of tertiary N-
Article received
July 28, 2015
Article accepted
August 08, 2015
Article published
September 30, 2015
*Corresponding Author:
G. VANAJA,
Dept. of Chemistry,
Dhanalakshmi Srinivan College
of Arts and Science for Women,
Perambalur-621212, India.
Chemical process involves the synthesis of a single product or several
products by mixing compounds at certain proportions and conditions.
In the present study, Escitalopram oxalate is used to synthesize and
characterize N-desmethyl escitalopram by a one step N-
desmethylation reaction. The synthesized impurity N-desmethyl
escitalopram was purified by column chromatography. The purified
impurity was analyzed by HPLC. The functional group in the
compound was analyzed using FT-IR and its molecular weight was
determined by LC-MS. The structure of the purified compound was
determined by 1HNMR spectroscopy and
13CNMR spectroscopy
analysis respectively.
Keywords: Synthetic chemistry, Escitalopram oxalate, Escitalopram,
demethylation, N-desmethyl Escitalopram
Vanaja et al IJIPBART (2015) Volume 2, Issue (3), pp: 196-206
www.refsynjournals.com 218
methylamines has been studied extensively and a variety of methods for this process have been
reported (Thavaneswaran, 2006). N-demethylated products can be synthesized using different
methods. Yan-jie et al., (2013) purified impurities in azithromycin drug, 3’-N-demethyl azithromycin
and 3’-N-demethyl 3
’-N-formyl azithromycin by chromatographic separation technique. Reaction
conditions were optimized with HPLC method and the structures of the derivatives were identified by
H1
NMR and MS. Similarly, the N-demethylation of Sildenafil was studied and the purity of the
compound was analyzed by HPLC and characterized using FT-IR and MS (Suganthi et al., 2015). In
another study, Le Tourneau et al., (2012) studied the structural factors behind macrolide resistance
through the synthesis of new macrolide derivates possessing truncated desosamine sugar moieties and
subsequent determination of their anti-bacterial activity. Similarly, the impurities in the synthesis of
Tramadol hydrochloride and clozapine were also studied (Venkanna et al., 2012; Garipelli et al.,
2010).
Characteraization of impurities using HPLC, LC-MS, FT-IR and NMR were reported in many
studies. Topalli et al., (2012) developed a simple, sensitive and rapid reversed phase HPLC (RP-
HPLC) method for the separation and quantitative determination of related substances of
Clarithromycin in Clarithromycin powder. Asnawi et al., (2011) obtained demethylated quinine by
mild and selective demethylation of quinine using anhydrous aluminium trichloride to prevent the
addition reaction of allyl group. The compound was characterized by FT-IR and HPLC. Sharma et al.,
(2010) developed a new method for N-methylation of aromatic diamines using dimethyl carbonate
(DMC) and investigated the effects of various functional groups on the aromatic ring. Radhkrishna et
al., (2008) detected three unknown impurities in rosiglitazone maleate by simple RP-HPLC. These
impurities were preliminarily identified with LC-MS and characterized by mass number of the
impurities. Kaleemullaha et al., (2011) used a simple and rapid HPLC method to quantify di-p-
Toluoyl-d-Tartaric acid (DPTTA) at very low levels in Escitalopram oxalate. Gangula et al., (2011)
studied the synthesis and identification of five process-related impurities of escitalopram by
employing LC-MS and characterized them using IR and NMR. Mondal et al., (2013) developed a RP-
HPLC method for the simultaneous determination of Escitalopram oxalate and Etizolam.
Escitalopram oxalate is an antidepressant under the group of selective serotonin reuptake
inhibitors (SSRI). N-demthylation of Escitalopram was reported using Chloromethyl chloroformate
(Vipin, Kumar Kaushik, et al., 2006). In this present study, the synthesis of N-desmethyl citalopram
from Escitalopram oxalate by simple one step method and purify the column and characterize by LC-
MS, 1H and
13C NMR and FT-IR.
Vanaja et al IJIPBART (2015) Volume 2, Issue (3), pp: 196-206
www.refsynjournals.com 219
METHODS
Escitalopram oxalate was gifted from Refsyn Biosciences Pvt. Ltd. All the solvents used were
of analytical grade.
Conversion of Escitalopram Oxalate to Escitalopram free base
Escitalopram oxalate was dissolved in water. The pH of the solution was adjusted to 8-9 with
saturated sodium carbonate for converting free base. The compound was extracted with chloroform.
The organic layer was dried and filtered under anhydrous sodium sulphate. The resulting solution was
concentrated under reduced pressure using rotary vacuum evaporator. The weight of crude material
was noted and the material was stored at -20°C until further use. The crude material was analysed by
TLC. Readymade TLC plate (Merck, Silica gel 60 F254) was used as the stationary phase and
chloroform: methanol (9:1, v/v) was used as the mobile phase. The spots were visualized under UV
chamber (short UV- 254nm).
Synthesis of N-Desmethyl Escitalopram
1.0 equivalent of Escitalopram free base was dissolved in 10ml of methanol. 6.9 equivalents
of sodium acetate was added to the reaction mixture and mixed until the compound was dissolved
completely. Then, 1.7 equivalent of iodine was added to the reaction mixture at regular intervals and
the pH was checked and maintained between 8.5 and 9.5 in the reaction mixture by adding 0.1N
sodium hydroxide in drops. The reaction was continued and the pH and TLC were checked every
hour. The reaction was continued over night. The reaction was continued until clear solution. The
reaction was monitored by TLC in the solvent system Chloroform: Methanol (9.8:0.2, v/v).
Visualization of the spots was observed by UV light at 254 nm. After the reaction was completed, 100
ml of dichloromethane was added to the reaction mixture. The organic and aqueous layers were
separated. The organic layer was filtered under anhydrous sodium sulfate and dried. The resulting
solution was concentrated under reduced pressure using rotary vacuum evaporator. The weight of the
crude material was analysed by MASS and purified by column chromatography.
Column Purification of the crude material
1.7g of crude material was taken with 5g of silica gel (for column chromatography 60-120
mesh) and suspended in 10 ml chloroform. The mixture was heated gently until the silica gel becomes
free flowing. A cylindrical glass column (1.5×15 mm) was taken and 20g of fresh silica gel was added
with 100ml of chloroform to make silica slurry. The slurry was transferred and packed in the column
to three-fourth proportion. The adsorbed crude material slurry was poured into the solvent layer above
the silica gel in the packed column. The column elution was started with 100% chloroform and the
polarity was increased using chloroform: methanol in a proportion of 100% chloroform and 99.5:0.5,
99:1, 98.5:1.5,98:2,97:3,96:4,95:5 etc. Individual fractions were monitored for TLC. Same spot
fractions were mixed and concentrated using roteva (super rotavap) at 60oC under vacuum pressure.
The fractions were analyzed for maximum absorbance using UV Spectrophotometer (HITACHI, U-
Vanaja et al IJIPBART (2015) Volume 2, Issue (3), pp: 196-206
www.refsynjournals.com 220
2010). The purified fractions were scanned at wavelengths between 200 and 400 nm and compared
with free base and escitalopram oxalate.
Characterization of N-Desmethyl Escitalopram
Functional group analysis by FT-IR
The fraction collected from the column separation was analyzed to identify the functional
group using FT-IR spectroscopy. 1% of the compound was mixed thoroughly with 99% of Potassium
Bromide and made as a pellet and analyzed using FT-IR (Nicolet IS 5, Thermofischer, USA). The
functional group was identified from the spectral data.
Molecular weight determination by LC-MS
LC-MS/MS analysis was performed using LCMS (LC-2010EV model) with APCI coupled
with HPLC system consisting of Agilent 1100 series low pressure quaternary gradient pump along
with dampener/ degasser, auto sampler and the column oven (Shimadzu, Japan). The analysis was
done in positive electro spray ionization (ESI) mode with turbo ion spray interface. An Inertsil C18
(250x4.6 mm, 5µl, GL Sciences, Japan) column was used for separation. The column eluent was
introduced into the electron spray ionization (ESI) chamber of the mass spectrometer with the split
ratio of 3:7. Mass fragmentation studies were carried out by maintaining normalized collision energy
at 35 eV with the m/z range of 50-300 amu.
Structural determination of purified compound by 1H NMR and
13C NMR
The structure of the purified compound was determined by 1H NMR and
13C NMR using Jeol
400-MHz NMR spectrophotometer with multiple probe facility for 1H,
11B,
13C,
17O,
19F,
31P, Model-
JNM-400.
RESULTS AND DISCUSSION
Synthesis of N-Desmethyl Escitalopram
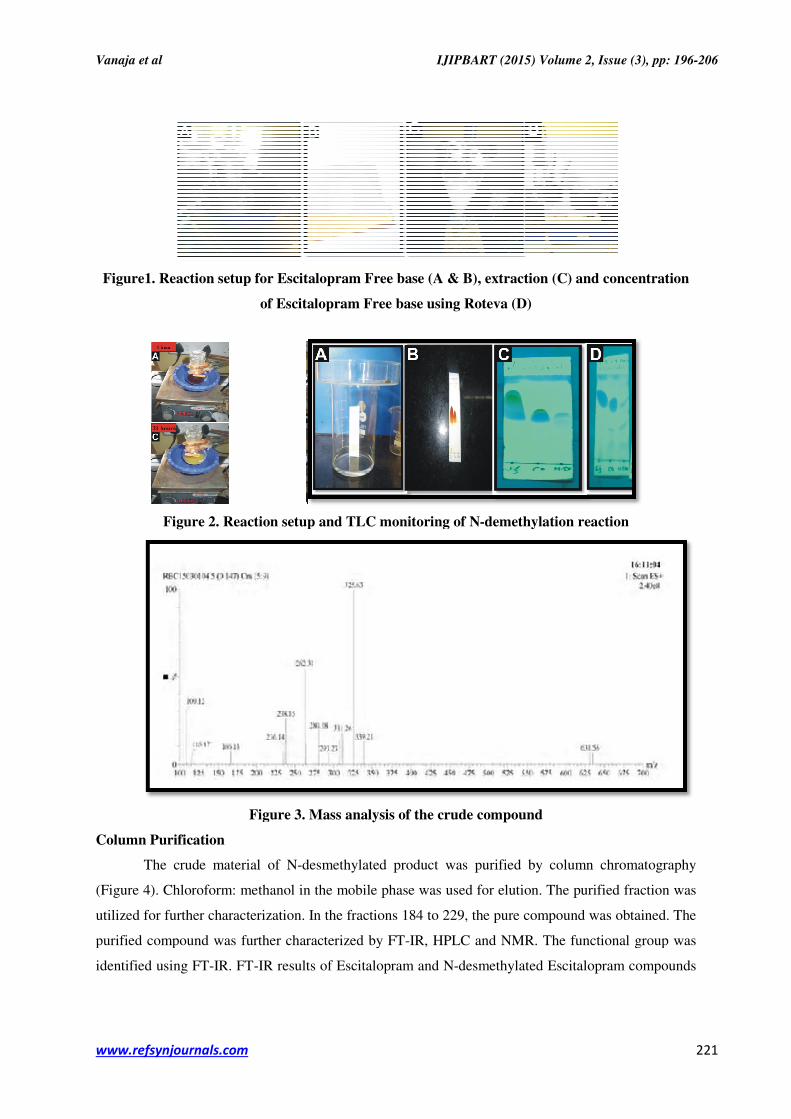
Reaction setup for the Escitalopram free base was shown in Figure 1. The conversion of free
base from salt makes the reaction faster and effective. The free base obtained from salt was used for
N-demethylation reaction.
Figure 2 shows the reaction setup for the synthesis of N- desmethyl Escitalopram after
addition of Iodine. The reaction was continued for a day. Thin Layer Chromatograms of the reaction
mixture at 2, 16 hour and 24 hours were shown in Figure 2 which was visualized under UV chamber.
After 24 hours, the disappearance of starting material was almost 93%. The formation of N-desmethyl
Escitalopram and disappearance of Escitalopram free base indicated completion of the reaction. Taha
et al., (2009) used thin layer chromatography for the determination of (±) Citalopram and its S-
enantiomer Escitalopram. Sundar (2011) developed and validated liquid chromatographic method for
estimation of Escitalopram oxalate in tablet dosage forms. To conform the formation of N-desmethyl
compound MASS analysis was performed. The N-demethylated citalopram product peak was visible
at a m/z ratio of 311 and the citalopram product peak was visible at a m/z ratio of 324 (Figure 3).
Vanaja et al
www.refsynjournals.com
Figure1. Reaction setup for E
of Es
Figure 2. Reaction setup and TLC monitoring of N
Figure
Column Purification
The crude material of N
(Figure 4). Chloroform: methanol in the mobile phase was used for elution. The purified fraction was
utilized for further characterization.
purified compound was further characterized by FT
identified using FT-IR. FT-IR results of Escitalopram and N
IJIPBART (2015) Volume 2,
Reaction setup for Escitalopram Free base (A & B), extraction (C)
scitalopram Free base using Roteva (D)
Reaction setup and TLC monitoring of N-demethylation reaction
Figure 3. Mass analysis of the crude compound
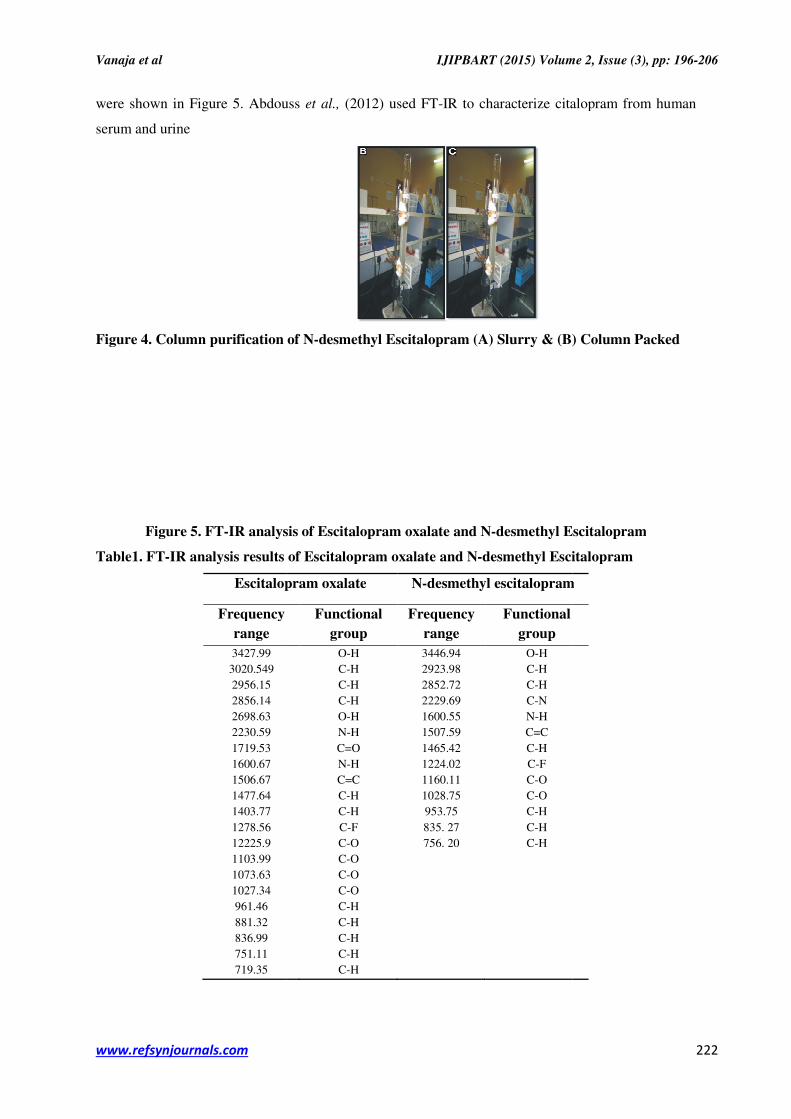
The crude material of N-desmethylated product was purified by column chromatography
(Figure 4). Chloroform: methanol in the mobile phase was used for elution. The purified fraction was
utilized for further characterization. In the fractions 184 to 229, the pure compound was obtained. The
purified compound was further characterized by FT-IR, HPLC and NMR. The functional group was
IR results of Escitalopram and N-desmethylated Escitalopram compounds
IJIPBART (2015) Volume 2, Issue (3), pp: 196-206
221
and concentration
demethylation reaction
desmethylated product was purified by column chromatography
(Figure 4). Chloroform: methanol in the mobile phase was used for elution. The purified fraction was
pure compound was obtained. The
The functional group was
desmethylated Escitalopram compounds
Vanaja et al
www.refsynjournals.com
were shown in Figure 5. Abdouss
serum and urine
Figure 4. Column purification of N
Figure 5. FT-IR analysis of Escitalopram oxalate and N
Table1. FT-IR analysis results of Escitalopram oxalate and N
Escitalopram oxalate
Frequency
range
3427.99
3020.549
2956.15
2856.14
2698.63
2230.59
1719.53
1600.67
1506.67
1477.64
1403.77
1278.56
12225.9
1103.99
1073.63
1027.34
961.46
881.32
836.99
751.11
719.35
IJIPBART (2015) Volume 2,
Abdouss et al., (2012) used FT-IR to characterize citalopram
olumn purification of N-desmethyl Escitalopram (A) Slurry & (B)
IR analysis of Escitalopram oxalate and N-desmethyl Escitalopram
IR analysis results of Escitalopram oxalate and N-desmethyl Escitalopram
Escitalopram oxalate N-desmethyl escitalopram
Frequency Functional
group
Frequency
range
Functional
group
O-H
C-H
C-H
C-H
O-H
N-H
C=O
N-H
C=C
C-H
C-H
C-F
C-O
C-O
C-O
C-O
C-H
C-H
C-H
C-H
C-H
3446.94
2923.98
2852.72
2229.69
1600.55
1507.59
1465.42
1224.02
1160.11
1028.75
953.75
835. 27
756. 20
O-H
C-H
C-H
C-N
N-H
C=C
C-H
C-F
C-O
C-O
C-H
C-H
C-H
IJIPBART (2015) Volume 2, Issue (3), pp: 196-206
222
citalopram from human
(B) Column Packed
desmethyl Escitalopram
desmethyl Escitalopram
desmethyl escitalopram
Functional
Vanaja et al
www.refsynjournals.com
UV-Visible Spectrocopy Analysis
Figure 6 shows the λmax
desmethyl Escitalopram before column purification and Figure 6 shows the
Escitalopram free base and N-desmethyl Escitalopram after column purification. Gandhi
employed spectrophotometric analysis for the determination of Escitalopram Oxalate in combined
tablet dosage form. Chaudhari and Parmar (2010) used spectrophotometric method for the
determination of Escitalopram Oxalate from tablet formulation.
Figure6. λmax values of Escitalopram oxalate, Escitalopram free base and N
Escitalopram before and after column purification
The λmax VALUE of Escitalopram oxalate is 237 & 284.5, for Escitalopram free base was 287 &
239.5 and for N-desmethyl citalopram was 284, 236.5
LC-MS Spectroscopy analysis
Dhavale et al., (2008) used HPTLC for the determination of escitalopram oxalate and
clonazepam in combined tablets. Similarly, Kakde
the simultaneous estimation of escitalopram oxalate and clonazepam in tablet dosage. Samanta
(2011) used RP-HPLC method for the estimation of escitalopram in bulk and in dosage forms.
Greiner et al., (2007) used column
the determination of citalopram and escitalopram together with their active main metabolites
desmethyl (es-)citalopram in human serum.
IJIPBART (2015) Volume 2,
Visible Spectrocopy Analysis
max values of Escitalopram oxalate, Escitalopram free base and N
desmethyl Escitalopram before column purification and Figure 6 shows the
desmethyl Escitalopram after column purification. Gandhi
yed spectrophotometric analysis for the determination of Escitalopram Oxalate in combined
tablet dosage form. Chaudhari and Parmar (2010) used spectrophotometric method for the
determination of Escitalopram Oxalate from tablet formulation.
values of Escitalopram oxalate, Escitalopram free base and N
Escitalopram before and after column purification
VALUE of Escitalopram oxalate is 237 & 284.5, for Escitalopram free base was 287 &
desmethyl citalopram was 284, 236.5
(2008) used HPTLC for the determination of escitalopram oxalate and
clonazepam in combined tablets. Similarly, Kakde et al., (2009) used spectrophotometric met
the simultaneous estimation of escitalopram oxalate and clonazepam in tablet dosage. Samanta
HPLC method for the estimation of escitalopram in bulk and in dosage forms.
(2007) used column-switching high performance liquid chromatography (HPLC) for
the determination of citalopram and escitalopram together with their active main metabolites
)citalopram in human serum.
IJIPBART (2015) Volume 2, Issue (3), pp: 196-206
223
values of Escitalopram oxalate, Escitalopram free base and N-
desmethyl Escitalopram before column purification and Figure 6 shows the λmax values of
desmethyl Escitalopram after column purification. Gandhi et al., (2008)
yed spectrophotometric analysis for the determination of Escitalopram Oxalate in combined
tablet dosage form. Chaudhari and Parmar (2010) used spectrophotometric method for the
values of Escitalopram oxalate, Escitalopram free base and N-desmethyl
VALUE of Escitalopram oxalate is 237 & 284.5, for Escitalopram free base was 287 &
(2008) used HPTLC for the determination of escitalopram oxalate and
(2009) used spectrophotometric method for
the simultaneous estimation of escitalopram oxalate and clonazepam in tablet dosage. Samanta et al.,
HPLC method for the estimation of escitalopram in bulk and in dosage forms.
mance liquid chromatography (HPLC) for
the determination of citalopram and escitalopram together with their active main metabolites
Vanaja et al
www.refsynjournals.com
Figure 7. LC
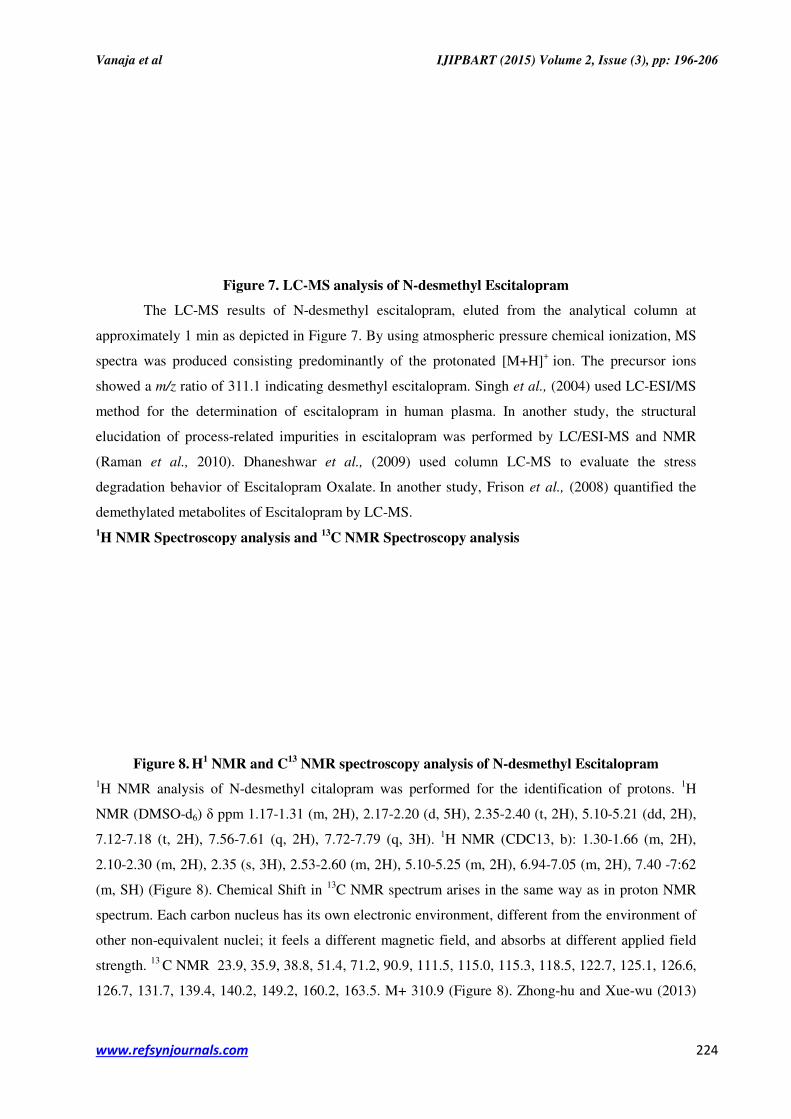
The LC-MS results of
approximately 1 min as depicted in Figure 7. By using atmospheric pressure chemical ionization, MS
spectra was produced consisting predominantly of the protonated [M+H]
showed a m/z ratio of 311.1 indicating desmethyl escitalopram. Singh
method for the determination of escitalopram in human plasma. In another study, the structural
elucidation of process-related impurities in escitalopram was performed by LC/ESI
(Raman et al., 2010). Dhaneshwar
degradation behavior of Escitalopram Oxalate.
demethylated metabolites of Escitalopram by LC
1H NMR Spectroscopy analysis and
Figure 8. H
1 NMR and C
1H NMR analysis of N-desmethyl citalopram was performed for the identification of protons.
NMR (DMSO-d6) δ ppm 1.17-1.31 (m, 2H), 2.17
7.12-7.18 (t, 2H), 7.56-7.61 (q, 2H), 7.72
2.10-2.30 (m, 2H), 2.35 (s, 3H), 2.53
(m, SH) (Figure 8). Chemical Shift in
spectrum. Each carbon nucleus has its own electronic environment, different from the environment of
other non-equivalent nuclei; it feel
strength. 13
C NMR 23.9, 35.9, 38.8, 51.4, 71.2, 90.9, 111.5, 115.0, 115.3, 118.5, 122.7, 125.1, 126.6,
126.7, 131.7, 139.4, 140.2, 149.2, 160.2, 163.5. M+ 310.9 (Figure 8).
IJIPBART (2015) Volume 2,
LC-MS analysis of N-desmethyl Escitalopram
MS results of N-desmethyl escitalopram, eluted from the analytical column at
approximately 1 min as depicted in Figure 7. By using atmospheric pressure chemical ionization, MS
spectra was produced consisting predominantly of the protonated [M+H]+
ion. The precursor ions
311.1 indicating desmethyl escitalopram. Singh et al., (2004) used LC
method for the determination of escitalopram in human plasma. In another study, the structural
related impurities in escitalopram was performed by LC/ESI
2010). Dhaneshwar et al., (2009) used column LC-MS to evaluate the stress
degradation behavior of Escitalopram Oxalate. In another study, Frison et al., (2008) quantified the
demethylated metabolites of Escitalopram by LC-MS.
H NMR Spectroscopy analysis and 13
C NMR Spectroscopy analysis
NMR and C13
NMR spectroscopy analysis of N-desmethyl Escitalopram
desmethyl citalopram was performed for the identification of protons.
1.31 (m, 2H), 2.17-2.20 (d, 5H), 2.35-2.40 (t, 2H), 5.10
7.61 (q, 2H), 7.72-7.79 (q, 3H). 1H NMR (CDC13, b): 1.30
2.30 (m, 2H), 2.35 (s, 3H), 2.53-2.60 (m, 2H), 5.10-5.25 (m, 2H), 6.94-7.05 (m, 2H), 7.40
(m, SH) (Figure 8). Chemical Shift in 13
C NMR spectrum arises in the same way as in proton NMR
spectrum. Each carbon nucleus has its own electronic environment, different from the environment of
equivalent nuclei; it feels a different magnetic field, and absorbs at different applied field
C NMR 23.9, 35.9, 38.8, 51.4, 71.2, 90.9, 111.5, 115.0, 115.3, 118.5, 122.7, 125.1, 126.6,
126.7, 131.7, 139.4, 140.2, 149.2, 160.2, 163.5. M+ 310.9 (Figure 8). Zhong-hu and
IJIPBART (2015) Volume 2, Issue (3), pp: 196-206
224
desmethyl escitalopram, eluted from the analytical column at
approximately 1 min as depicted in Figure 7. By using atmospheric pressure chemical ionization, MS
ion. The precursor ions
(2004) used LC-ESI/MS
method for the determination of escitalopram in human plasma. In another study, the structural
related impurities in escitalopram was performed by LC/ESI-MS and NMR
MS to evaluate the stress
(2008) quantified the
desmethyl Escitalopram
desmethyl citalopram was performed for the identification of protons. 1H
2.40 (t, 2H), 5.10-5.21 (dd, 2H),
H NMR (CDC13, b): 1.30-1.66 (m, 2H),
7.05 (m, 2H), 7.40 -7:62
C NMR spectrum arises in the same way as in proton NMR
spectrum. Each carbon nucleus has its own electronic environment, different from the environment of
s a different magnetic field, and absorbs at different applied field
C NMR 23.9, 35.9, 38.8, 51.4, 71.2, 90.9, 111.5, 115.0, 115.3, 118.5, 122.7, 125.1, 126.6,
hu and Xue-wu (2013)
Vanaja et al IJIPBART (2015) Volume 2, Issue (3), pp: 196-206
www.refsynjournals.com 225
used NMR analysis for the structure identification of unknown impurity in escitalopram. Similarly,
Charde (2012) employed NMR spectroscopy to characterize process related impurities in
escitalopram oxalate.
CONCLUSION
N-demethylation of Escitalopram was performed with the basic simple, cost effective and less
time consuming method by using sodium acetate and iodine. This showed that the N-demethylated
impurities of pharmaceutical drugs can be synthesized by simple method and can avoid the
carcinogenic agent. These compounds can be utilized for future drug discovery, drug developmental
studies as well as reference standards for pharmaceutical and toxicological studies.
REFERENCES
1. U.S. Food and Drug Administration. 2003. Guidance for Industry, Q3A impurities in new drug
substances.
2. Thavaneswaran, S., and Scammells, P.J. 2006. Further investigation of the N-demethylation of
tertiary amine alkaloids using the non-classical Polonovski reaction. Bioorg Med Chem Lett
16(11); 2868-2871.
3. Yan-jie, F., Li-quan, S., Xin-yuan, F., Cong, L., Guo-wei, Y., and Ai-qin, L. 2013. Improvement
in synthesis of 3’-N-demethylazithromycin and its derivatives. Bei Jing Li Gong Da Xue Xue Bao
22(1).
4. Suganthi, S., Geetha, S., and Vanaja G. 2015. Synthesis and characterization of N-desmethyl
sildenafil impurity via non classical polonoskvi method. IJIPBART 2: 126-135.
5. LeTourneau, N., Vimal, P., Klepacki, D., Mankin, A., and Melman, A. 2012. Synthesis and
antibacterial activity of desosamine-modified macrolide derivatives. Bioorg Med Chem Lett 22:
4575-4578.
6. Venkanna, G., Madhusudhan, G., Mukkanti, K., Sankar, A., Kumar, V.M. and Ali, S.A. 2012.
Synthesis of related substances of Tramadol hydrochloride, analgesic drug. J Chem Pharm Res
4(10): 4506-4513.
7. Garipelli, N., Reddy, B.M., and Jithan, A.V. 2010. Synthesis and evaluation of clozapine and its
related compounds. International J Pharm sci Nanotech 2(4).
8. Topalli, S., Rao, B.N., Annapurna, M., Sharma, A., and Chandrashekhar, T.G. 2012.
Development and validation of high performance liquid chromatography method for
quantification of related substances in clarithromycin powder for an oral suspension dosage form.
International J Anal Pharm Biomed Sci 1(1).
9. Asnawi, A., Nawawi, A., Kartasasmita, R.E., and Ibrahim, S. 2011.
Demethylation of quinine using anhydrous aluminium trichloride. ITB J Sci 43: 43-50.
Vanaja et al IJIPBART (2015) Volume 2, Issue (3), pp: 196-206
www.refsynjournals.com 226
10. Sharma, S., Ameta, S.C., and Sharma, V.K. 2010. Use of Dimethyl Carbonate (DMC) as
methylating agent under microwave irradiation-a green chemical approach 2: 20-22.
11. Kaleemullaha, T., Ahmed, M., Sharma, H.K., and Rajput, P. 2011. Reverse phase liquid
chromatographic method for the quantification of di-p-toluoyl-d-tartaric acid in escitalopram
oxalate drug substance. Eurasian J Anal Chem 6(3): 197-205.
12. Gangula, S., Kolla, N.K., and Elati, C.R. 2011. Identification, synthesis and spectral
characterization of impurities in process development of Escitalopram GERF Bullet Biosci 2(1):
1-5.
13. Radhakrishna, S., Rao, M.V.N.B., Raju, T.S., Himabindu, V., and Reddy, GM. 2008. Isolation,
synthesis and characterization of rosiglitazone maleate impurities. E-J chem 5(3): 562-566.
14. Mondal, P., Santhosh, B., Satla, S.R., and Raparla, R. 2013. A new validated simultaneous RP-
HPLC method for estimation of escitalopram oxalate and etizolam in bulk and table dosage form.
Der Pharma Chemica 5(3): 26-32.
15. Vipin kumar kaushik et al, 2006. Process for the preparation of Escitalopram US 7939680 B2
16. Taha, E.A., Salama, N.N., and Wang, S. 2009. Micelle enhanced fluorimetric and thin layer
chromatography densitometric methods for the determination of (±) Citalopram and its S-
enantiomer Escitalopram. Anal Chem Insights 4: 1-9.
17. Sundar B.S. 2011. Development and validation of liquid chromatographic method for
estimation of Escitalopram oxalate in tablet dosage forms. International J Pharma Biosci 2(1).
18. Abdouss, M., Azodi-Deilami, S., Asadi, E., and Shariatinia, Z. 2012. Synthesis of molecularly
imprinted polymer as a sorbent for solid phase extraction of citalopram from human serum and
urine. J Mater Sci Mater Med 23(6): 1543-1552.
19. Gandhi, S.V., Dhavale, N.D., Jadhav, V.Y., and Sabnis, SS. 2008. Spectrophotometric and
Reversed-Phase High-Performance Liquid Chromatographic methods for simultaneous
determination of Escitalopram Oxalate and Clonazepam in combined tablet dosage form. AOAC
International 91(1): 33-38.
20. Chaudhari, B.G., and Parmar, H.R. 2010. Spectrophotometric method for determination of
Escitalopram Oxalate from tablet formulations. International J Pharm Qual Ass 2(1): 9-12.
21. Dhavale, N., Gandhi, S., Sabnis, S., and Bothara, K. 2008. Simultaneous HPTLC determination
of escitalopram oxalate and clonazepam in combined tablets. Chromatographia 67(5): 487-490.
22. Kakde, R.B., and Satone D.D. 2009. Spectrophotometric method for simultaneous estimation of
escitalopram oxalate and clonazepam in tablet dosage form. Indian J Pharm Sci 71(6): 702-705.
23. Samanta, T., Dey, S., Samal, H.B., Kumar, D.B., Mohanty, D.L., and Bhar, K. 2011. RP-HPLC
method for the estimation of escitalopram in bulk and in dosage forms. Int J Chem Res 2(2).
24. Greiner, C., Hiemke, C., Bader, W., and Haen, E. 2007. Determination of citalopram and
escitalopram together with their active main metabolites desmethyl (es-)citalopram in human
Vanaja et al IJIPBART (2015) Volume 2, Issue (3), pp: 196-206
www.refsynjournals.com 227
serum by column-switching high performance liquid chromatography (HPLC) and
spectrophotometric detection. J Chromatogr B 848(2): 391-394.
25. Singh, S.S., Shah, H., Gupta, S., Jain, M., Sharma, K., Thakkar, P., and Shah, R. 2004. Liquid
chromatography-electrospray ionisation mass spectrometry method for the determination of
escitalopram in human plasma and its application in bioequivalence study. J Chromatogr B
811(2): 209-215.
26. Raman, B., Sharma, B.A., Pradeep, D.G., Nandavadekar, S., Singh, D., Karmuse, P.K., and
Kumar, A (2010). Structural elucidation of process-related impurities in escitalopram by LC/ESI-
MS and NMR. J Pharm Biomed Anal 53(4): 895-901.
27. Dhaneshwar, S.R., Mahadik, M.V., Kulkarni, M.J. 2009. Column Liquid Chromatography-
Ultraviolet and Column Liquid Chromatography/Mass spectrometry evaluation of stress
degradation behavior of Escitalopram Oxalate. AOAC Int 92(1): 138-147.
28. Frison, G., Favretto, D., Vogliardi, S., Terranova, C., and Ferrara, S.D. 2008. Quantification of
Citalopram or Escitalopram and their demethylated metabolites in neonatal hair samples by
Liquid Chromatography-Tandem Mass Spectrometry. Ther Drug Monit 30(4); 467-473.
29. Zhong-hua, L., and Xue-wu, X. 2013. Structure identification of unknown impurity in drug
substance of escitalopram. J Pharm Anal 02.
30. Charde, M.S. 2012. Determination of escitalopram oxalate in pharmaceutical formulation by high
performance liquid chromatography. Int J Pharm Chem
Cite this article in press as Vanaja et al. (2015) One step N-desmethylation reaction for the
synthesis and characterization of the N-desmethyl Escitalopram from Escitalopram oxalate,
IJIPBART, 2(03); 196-206.
CONFLICT OF CONFLICT OF CONFLICT OF CONFLICT OF INTERESTSINTERESTSINTERESTSINTERESTS
The authors declare that they have no conflict of interests regarding the publication of this paper.
Copyright © 2015 by authors. This is an open access article distributed under the Creative Commons Attribution License, which
permits unrestricted use, distribution, and reproduction in any medium, provided the original work is properly cited.