Embed Size (px)
Citation preview
CHAPTER 2:
PARTICLE ACCELERATION
N8"t" 19332
L. Vlahos l, M. E. Machado 2, R. Ramaty 3, R. J. Murphy 1.3,
C. Alissandrakis 4, T. Bai 5, D. Batchelor 3, A. O. Benz 6,
E. Chupp 7, D. Ellison _, P. Evenson s, D. J. Forrest 7,G. Holman 3, S. R. Kane 9, P. Kaufmann l°, M. R. Kundu 1,
R. P. Lin 9, A. Mackinnon tl, H. Nakajima 3, M. Pesses 3,
M. Pick 12, J. Ryan 7, R. A. Schwartz 9, D. F. Smith 13,
G. Trottet t2, S. Tsuneta _4, and G. Van Hoven _5.
_University of Maryland, College Park, Maryland2Observatorio de Fisica Cosmica -- CNIE, Argentina
3NASA Goddard Space Flight Center, Greenbelt, Maryland
4University of Athens, Athens, Greece
5Stanford University, Stanford, California
6Institute of Astronomy, Zurich, Switzerland
7University of New Hampshire, Durham, New Hampshire
sUniversity of Delaware, Newark, Delaware
9University of California, Berkeley, California
t°Instituto de Pesquisas Espaciasi, Brazil
t_University of Glasgow, United Kingdom
12Meudon Observatory, France
t3Berkeley Research Associates, Berkeley, California
_4University of Tokyo, Tokyo, Japan
tsUniversity of California, Irvine, California
Rest is a special form of motionG. Kirchhoff
2.1. INTRODUCTION
Electrons and ions are accelerated to high energies be-
fore, during and after the impulsive phase of flares. The
presence of high energy particles at the sun during a solarflare is inferred from the observed electromagnetic radia-
tion resulting from the interaction of the energized particleswith the ambient plasma and/or the magnetic field as well
as from direct particle observations in the interplanetary
space. In this chapter we compile data from the SMM andHINOTORI satellites, particle detectors in several satellites
and from ground based instruments and balloon flights and
attempt to answer a number of fundamental questions thatare stated below. We have also reviewed the progress made
on the theory of mechanisms for particle acceleration inflares.
We define the term acceleration here as the preferential
gain of energy by a small population of electrons and ions.
Heating, on the other hand, is defined as the bulk energiza-tion of the ambient plasma. In other words, the development
of a long nonthermai tail in the ambient distribution will bethe result of "acceleration" but the increase of the random
mean-square velocity of the ambient particles the result of
"heating". The critical velocity, above which, "accelera-
tion" dominates heating varies from flare to flare. The varia-
bility of the critical velocity has created in the past manydiscussions and divisions of flares into "thermal" or "non-
thermal" classes. Another important "distinction" between
"heating" and "acceleration" is the time that is required
for the accelerated particles to reach the chromosphere andthermalize vs the time resolution of our instruments. For ex-
ample, if the acceleration of the tail lasts only a few seconds,
the propagation and thermalization of high energy particlescan be faster than 10 sees, which is below the resolution ofseveral current instruments. In this case, the division between
thermal and nonthermal flares will be a time dependent
phenomenon. Thus, one may argue (paraphrasingKirchhoff's words), that "heating" is a special kind of ac-
celeration. In the rest of this chapter we will show that heat-
ing and acceleration are always present in flares and we willdiscuss mechanisms that will achieve bulk heating and tail
acceleration of the ambient plasma. We will adopt the more
general term "energization" for the bulk heating and ac-celeration.
As a primary goal for our study, we attempted to answer
the following questions:(1) What are the requirements for the coronal magnetic
field structure in the vicinity of the energizationsource?
(2) What is the height (above the photosphere) of the
energization source?
(3) Does the energization start before and continue af-
ter the impulsive phase?
(4) Is there a transition between coronal heating andflares? What are the microflares?
(5) Is there evidence for purely thermal, purely non-
thermal or a hybrid type flare?
(6) What are the time characteristics of the energiza-tion source?
(7) Does every flare accelerate protons?
(8) What is the location of the interaction site of theions and relativistic electrons?
(9) What are the energy spectra for ions and relativistic
electrons? Does the spectrum vary from flare toflare?
(10) What is the relationship between particles at the Sun
and interplanetary space?
(11) Is there any evidence for more than one accelera-tion mechanisms?
(12) Is there a single mechanism that will accelerate par-
ticles to all energies and also heat the plasma?
(13) How fast will the existing mechanisms accelerate
electrons up to several MeV and ions to 1 GeV?
2-1
https://ntrs.nasa.gov/search.jsp?R=19870009899 2018-10-07T04:14:26+00:00Z

(14)If shocksareformedinafewseconds,cantheyberesponsibleforthepromptaccelerationofionsandelectrons?Howaretheseshocksrelatedtolarge-scaleshockswhichareresponsiblefortheTypeIIbursts?
(15)Cantheelectron-cyclotronmaserspreadtheacceler-ationregion?
(16)Whichof theaccelerationmechanismsdiscussedabovecanexplaintheobservedenergyspectra?
WeconcentrateonthesequestionsinSections2.2,2.3and2.4.In Section2.4wealsoreviewtheprogressmadeduringthelastfewyearsonmechanismsforparticleacceler-ationinflaresandinthelastSectionwesummarizethestillopenobservationalandtheoreticalquestions.Wewillattempttoanswerthequestions(1)-(16)inSections2.2.7,2.3.6and2.4.8.Hence,for a quickreviewof thestatusof ourunderstandingoftheproblemofparticleaccelerationinflaresthereadermaygodirectlytotheseSectionsandSection2.5.
Section2.2waspreparedbyM.MachadoandL. VlahosfrominputsfromC. Alissandrakis,T. Bai,D. Batchelor,A.O.Benz,G.Holman,S.R.Kane,P.Kaufmann,M.R.Kundu,R.P.Lin,A.Mackinnon,H. Nakajima,M.Pick,J.Ryan,D. F.Smith,G.Trottet,S.Tsuneta.Section2.3waspreparedbyR.RamatyandR.J.Murphyfromcontri-butionsfromT. Bai,E.Chupp,D. Ellison,P.Evenson,D. J.ForrestandM.PessesandSection2.4waspreparedbyL.VlahosfrominputsfromG.Holman,R.P.Lin,D. F.SmithandG.VanHoven.
Finally,it is importanttostressthatthisisareportofthediscussionscarriedoutduringtheWorkshopsandreflectsstronglytheopinions(andinmanySectionseventhebiases)of theauthors.
2.2 PHENOMENA ASSOCIATED WITH
MILDLY-RELATIVISTIC
ELECTRONS
In this Section we focus our discussion on phenomena
associated with mildly relativistic electrons (10-400 keV)
while in the next we concentrate on phenomena related to
energetic ions and relativistic electrons (E > 500 keV). This
division is in many ways artificial, since particles of all ener-
gies are produced during a flare. Thus, our discussion in this
Section overlaps with Section 2.3 and vice-versa. In fact,
our effort in this chapter will be to unify aspects related to
subjects of Sections 2.2 and 2.3.
Hard X-ray imaging from SMM and HINOTORI satel-
lites and the stereoscopic hard X-ray observations made with
the International Sun Earth Explorer 3 (ISEE-3) and Pioneer
Venus Orbiter (PVO) spacecraft are reviewed in this Sec-
tion. Imaging of microwave bursts is also one of our main
new sources of information about particle acceleration. The
results from the Very Large Array (VLA) telescope have
made a large impact on our understanding of flare models.
The spatial maps from the Nancay (France) Radioheliograph
obtained with a high time resolution (0.04 secs) provide
several new features of the topology of field lines near the
acceleration site. The high time and spectral resolution ofthe Ziirich radio spectrometer and 45 ft. radome-enclosed
antenna at Itapentinga (Brazil), have opened a new windowon the microinstabilities in flares. Balloon measurements with
sensitive hard X-ray detectors have also been carded out withremarkable success.
2.2.1 Soft and Hard X-ray Source
Structure, Location and Development
2.2.1.1 X-ray Imaging
Before the launch of the SMM and HINOTORI
spacecraft, only isolated observations were available on the
spatial structure of hard X-ray emission from flares. These
were mainly provided by stereoscopic observations from two
spacecrafts (PVOs and ISEE-3, see Kane, 1983 and 2.2.1.2
below). Real imaging was first provided by the Hard X-ray
Imaging Spectrometer (HXIS) aboard the SMM, and subse-
quently by the Hinotori hard X-ray telescopes, (SXT).
The HXIS imaged simultaneously in six energy bands
within 3.5-30.0 keV, with temporal resolution between 1.5
and 7 seconds and a spatial resolution of 8" × 8" (van Beek
et al., 1980). The SXT's spatial resolution was 15" x 15"
and the temporal resolution 7 seconds (Oda, 1983;
Makishima, 1982; Tsuneta, 1984).
A heated controversy on the interpretation of impulsive
phase hard X-ray emission motivated the early studies of hard
X-ray images. Two competing models were, and still are,considered. The nonthermal model (Brown, 1971; Lin and
Hudson, 1976; Hoyng et al., 1976) postulates that most ofthe flare energy is carried by a beam of fast electrons which
are created within an active region loop and precipitates at
its chromospheric footpoints, where it produces hard X-rays
by thick target emission. On the other hand a qualitative
model was developed, postulating that a large fraction of the
hard X-ray emission at low energies (tens of keV) could be
due to thermal bremsstrahlung (Brown et al., 1979; Smith
and Lilliequist, 1979; Vlahos and Papadopoulos, 1979;
Emslie and Vlahos, 1980). This model relies on the pos-sibility of creating a hot source (T ---5 × 10⁸K), confined
by plasma instabilities which lead to ion acoustic turbulence
at the expanding conduction fronts which move at the ion
sound speed (see discussion on 2.2.6.2).
In the imaging data, for the range of energies coveredby the HXIS and SXT, the distinction between the two
models is, ideally, quite clear (see e.g., Emslie 1981b, and2.2.1.3 below for the complications). The beam model
predicts strong emission at the footpoints of loops, while the
dissipative thermal alternate should show a bright, expand-
2-2

ingsourcewithinthecoronalloop, and minor contribution
from the footpoints, due to the escaping tail of electronswhich traverse the turbulent fronts.
Figure 2.2.1 (from Duijveman et al., 1982) shows that,at least in some cases, the HXIS observations seem to favor
the nonthermal model. Widely separated footpoints are seen
in three flares shown in the Figure, even as far as 70,000
km away from each other (November 5, 1980 footpoint C
in Figure 2.2. lc). These footpoints overlay regions of en-
hanced chromospheric and transition zone emission, which
brighten in temporal coincidence, in ultraviolet radiation,
with the hard X-ray peaks (see Canfield et al. in this volume
and references therein). Duijveman et al. (1982) analysedthe events and concluded that the observations were con-
sistent only with thick target emission in which the beam
power implied a 20% acceleration efficiency during the early
impulsive phase.
This result is not general: however, and the HINOTORI
investigators (Tanaka, 1983; Ohki et al., 1983 and Tsuneta,
1983b) have been able to identify at least three types of hard
X-ray flares from the characteristics of the hard X-ray image,
spectrum and impulsiveness of the time profile. The gen-
eral characteristics of the three types (A, B and C) are listedin Table 2.2.1.
The three flares shown in Figure 2.2.1 correspond to the
type B, which are typical impulsive burst events. Their dura-
tion ranges from tens of seconds to minutes, and the time
profile consists of an impulsive phase with spiky structure
and effective power law index ranging from 3 to 5, and a
gradual phase, generally softer, with smoother structure.
During the gradual phase the hard X-ray morphology changes
drastically, the footpoints disappear and a single elongated
source is seen at high altitude. This behavior of type B flares
is shown in Figure 2.2.2 (from Machado, 1983a; see
22.5 125 _[_
i/_ - J
3.5 -- 5.5 KEV
E_
l-J
h
22.5 3"I L_
"_- H// =0 I
] le - -_0KEV
APR 10, 1980 -- 09:18:38
N ]30 14 N
I j_F l
I ///
/,
-1-1_
30 2.6 L_
jJ'_
MAY 2'1, 1980 -- 20:55:55
3.5 -- 5.5 KEV
-_.,,.- W
I22" !
NOV 5, 1980 -- 2:_:33:05
(a) (b) (c)
Figure 2.2.1 HXIS contour plots in soft (top) and hard (bottom) X-rays, for three flares discussed by Duijvemanet al. (1982). The integration is over the impulsive spikes and the dashed lines show the magnetic neutral lines.
The hard X-ray footpoints (16 - 30 keV) are labelled as A, B and C.
2-3

Table 2.2.1 Main Characteristics of Solar Hard X-Ray Flares
Type
Time Profile
(E >_ 20 keV)
Hard X-ray Hard X-ray Electron
spectrum image density(E > 15 keV) (E - 20 keV) (cm -3)
Magnetic field
strength (Gauss)
A
E <-- 40 keV very soft
intense smooth 3' - 7-9
time profile hot plasma small point-like
(T = 3 x 10_ K) hard X-ray source
(EM = 1049 cm -3) (- 15 arcsec)
E > 50 keV dominantlyno substantial contributed low altitude
emission with E <_ 40 keV. (- 5000 km)
small spikes FeXXVI emission
_1011 _> 330
B
Impulsive phase
spiky with timescale of sec.
Gradual phasesmooth with
time scale of
min.
power-law footpoint double
(10 - 70 keV) source
thermal sp. (T=3 x 10⁷ K below
40 keV
+
power-law
coronal loop-like
hard X-ray source
10 _o
1011 550
C
smooth time
profile withtime scale of
min. even above100 keV
power-law
3"-3-5
(30 - 150 keY)
systematic
hardening even in
the decay phase
high altitude
(- 40000 km) coronal
hard X-ray and micro-wave sources
3 x 101° 50
Figure 2.2.2 Hard X-ray (16 to 30 keV) observations
of the April 1O, 1980 flare. The doubled shaped struc-
ture (left) corresponds to the time of the impulsive
burst (see Duijveman et al. (1982)), and the singlestructure to the gradual burst (see Machado et al.
(1982)). The edge of the HXIS field of view is shown
as reference. The soft X-ray emission (not shown) en-
compass the entire region with its maximum located
at the position of the gradual component in the second
image. The scale corresponds to 16 arc secs.
Machado et al., 1982 for a complete discussion) for the April
10, 1980 event shown in Figure 2.2.1. We see a transition
from footpoint to single source morphology of the 16-30 keVsources; similar behavior has been observed in the other two
HXIS flares of Figure 2.2.1 (Hoyng et al., 1981; Duijveman
et al., 1982 Machado et al., 1984b).The transition from footpoint to single hard X-ray struc-
ture may reflect, as proposed by Machado et al. (1982) and
Tsuneta (1983b), a change in the mode of the energy release
from strong particle acceleration to plasma heating. A pos-
sible scenario on the way this may happen is described bySmith (1985, see Section 2.2.6.2) and Tsuneta (1985), butwe should also be aware of the limitations of available im-
aging observations, discussed below. However, before reach-
ing a definite conclusion on this subject, we must keep in
mind that most of the SMM and HINOTORI type B flares
(and all of type A) show single source structure (Duijveman
and Hoyng, 1983; Takakura et al., 1985a).
There is, however, good evidence of high temperature
plasma components in the gradual phase of some flares.
These are given by the recent high resolution spectral ob-
2-4
servationsof animpulsiveflare,obtainedwithasolidstatedetector(Linet al., 1981). In the impulsive phase the spec-
trum is a power law, while in the gradual phase a hot ther-
mal component with T _ 3 x 10⁷K appears as the power
law gradually fades. Also, observations of a coronal source
seen by the HXIS after the two ribbon flare of May 21, 1980
(cf. later phase of the flare shown in Figure 2.2.1 .b), have
been interpreted as evidence of a long lasting high tempera-ture (_ 4 × 10⁷K) source (Hoyng et al., 1981; Duijveman,
1983). Duijveman (1983) discussed the heat balance of thissource and found that its cooling rate by classical heat con-
duction would have been much larger than the saturated limit.
He finds that the energy needed to maintain the hot source
throughout its life time of several minutes is of the same order
of magnitude as that needed to maintain the cooler (107K)
soft X-ray emitting component. These imaging and spectral
observations show that high temperature plasma of about
3 × 10⁷K or more is generated during the development ofat least some flares.
Further evidence of high temperature components in the
hard X-ray emission is given from the analysis of the type
A flares. Their integrated hard X-ray emission shows smooth
time profiles, a steep power law index (7-9) and a duration
>__10 minutes. An example of type A flare is the July 17,
1981 flare observed by the HINOTORI (Tsuneta et aL,
1984b). Line ratio analysis of the FeXXVI lines, detected
throughout the flare development (Tanaka et al., 1982;
Moriyama et al., 1983) indicate the presence of 3 to 3.5 x
107K plasma, with emission measure of the order of 1049
cm -3. A possible interpretation of this type of flare is thatintense heating occurs from the start of the flare, with lesser
amount of power being spent in particle acceleration (Tsuneta
et al., 1984b). An example of this type of event as observed
by the HXIS is the July 14, 1980 event described by
Duijveman and Hoyng (1983).
Finally, the type C flares show long lasting time profiles
with power law indices of 2 to 5 between 30 and 200 keV,which tend to decrease with time. An example of this type
is the May 13, 1981 event (Tsuneta et al., 1984a), when a
stationary hard X-ray source was observed at an altitude of
_- 4 x 10a km, coincident with a gyrosynchrotron source
at 35 GHz (Kawabata et al., 1983). These flares seem to
belong to the microwave rich type (Kai and Kosugi, 1985)which are discussed in Section 2.2.4, and show relatively
large energy dependent delays in X-rays which we treat inSection 2.2.3.3 and 2.2.6.
A possible interpretation for the type C flares (Tsunetaet al., 1984a) invokes a coronal thick target trap model. As
shown in Table 2.2.1 the target density of several type C
flares was obtained by assuming that the delay is caused by
complete trapping of nonthermal electrons (Bai and Ramaty,1979; see 2.2.6 below). Also, Yoshimori et al. (1983) have
found typical time delays of tens of seconds between MeVand lower energy hard X-ray emission while type B flares
typically show delays of a few seconds. This may indicatedifferences in the particle acceleration timescales between
type B and C flares. More details on the characteristics ofthese events can be found in the references we have listed.
It is worth pointing out that only a few events (less than
ten total) from each spacecraft can be placed in one of the
types mentioned above. The majority of the events observeddoes not fall in any of the above classes of flares. Thus, we
believe that more complex magnetic structures and energiza-
tion processes are at work during a flare (see discussion inSection 2.2.7).
From the data discussed above, it is clear that hard X-ray
imaging has been achieved with SMM and HINOTORI. The
imaging, however, is restricted to energies below 25-30 keV,
with a spatial resolution of 8" (5800 km) at most. Let us
now discuss some of the implications of these results, look-
ing more closely at the data.
MacKinnon et al. (1985) emphasized that analyses of
HXIS data to date have not adequately considered instrumen-tal effects and data noise. The claim that three flares (April
10, May 21 and November 5, 1980) display "footpoint"emission, and therefore constitute evidence for the thick tar-
get beam interpretation of hard X-ray emission, has rested
on morphological conclusions drawn from non-deconvolved
images. Further, the count levels in these images are some-
times so low that consideration of photon shot noise must
lead one to question the reality of morphological features.
MacKinnon et aL (1984) developed a deconvolution routine,which takes into account all the instrumental effects, by use
of the Maximum Entropy (ME) method. The advantages of
this method, particularly the way it assesses reality of fea-tures are discussed in MacKinnon et al. (1984). MacKin-
non et al. applied the above operation to images produced
in the energy range 16-30 keV for the three HXIS flares
which showed distinct bright points (Duijveman et al., 1982and earlier references therein) and concluded that, in the
16-30 keV range, the presence of distinct bright points is
stable to these procedures, and to the addition of noise
(although other morphological features may be changed, as
may such quantities as "contrast ratio"); it should also be
stated that this is not always true in the 20-30 keVrange due
to poor counts statistics.
Further, evidence for distinct bright points has taken the
form of comparison of individual pixel time profiles, either
to establish simultaneity of footpoint brightening or to dis-
tinguish the footpoint pixels from their neighbors (see
Duijveman et al., 1982). MacKinnon et al. have investigatedthese conclusions quantitatively using cross-correlation
coefficients. These findings, detailed in MacKinnon et al.
(1984), vary slightly over the three flares, but in general they
find that such comparisons do not serve to distinguish the
"footpoints" either because the count statistics are not good
enough, or because other, non-footpoint pixels also brighten
simultaneously. Finally, they emphasize that all the above
2-5

conclusionsarebasedonband5data(16-30keV),sincethelowerbandsarenotreally"hard"X-rays.However,it hasbeenpointedoutthatthecorrelationof pointsA andC intheNovember5,1980(seeFigure2.2.1)flareiswellborneoutinthelowerenergychannelswherethenumberofcountsismuchhigher.MacKinnonet al. feel that this must be a
question which requires careful consideration, in view of the
undoubted role of hot (a few x 107K) thermal plasmas in
these energy bands.
2.2.1.2 Stereoscopic Observation
Simultaneous observations of solar hard X-ray bursts
from two widely separated spacecrafts has recently offered
new possibilities for testing source models, in terms of both
directivity and spatial distribution of the emission (Kane et
al., 1979, 1982; Kane, 1981b). Such stereoscopic obser-
vations of the sun, using the ISEE-3 and PVO spacecraft,
have shown that most of the impulsive hard X-ray emissionoriginates at altitudes < 2500 km above the photosphere (see
Figure 2.2.3). The five events analyzed so far fall into two
groups according to the occultation altitude involved. First,
there is the series of three successive events occuring in a
single active region on November 5, 1979, which were oc-
culted from PVO at low chromospheric altitudes, increas-
ing from about zero for the first event to about 2500 km for
X
_q iL/_
t_W
hDL)L)0ZD
-. lO-iX
3Is..
W
h
o 10-2
u_L
o_
a: i0_ 3
I .... I ' '_' ' I I ' '
ALTITUDE STRUCTURE OF
FLARE HARD X-RAY SOURCE(ISEE- 5, PVO)
350 KeV
IMPULSIVE SOURCE
150 KeY
i J , , _ [ , ,_, , I , , t , [ ,
0 5 " 20 30
OCCULTATION HEIGHT hmin (10 3 Kin)
Figure 2.2.3 The ratio r(E, hmin) of occulted to unoc-
culted X-ray flux plotted against the minimum altitude
bmin observable from the occulted spacecraft (fromKane, 1983).
the third, due to the rotation of the Sun (Kane et al., 1982).For each of these events the ratio of occulted to unocculted
flux was evaluated at photon energies of 150 and 350 keV,and for the third event the time evolution of this ratio was
determined. Second, there are two events (October 5, 1978
and September 14, 1979) for which the occultation altitudes
are coronal (25,000 km and 30,000 km respectively). Flux
ratios are again available at two energies and their time evo-
lution is known for the September 14 event. The main con-
clusions are: (a) about 90 % of the impulsive X-ray emission
and about 70% of gradual (extended) X-ray emissionoriginate at altitudes <_ 2500 km above the photosphere. In
the 100-500 keV range, this altitude dependence is essen-
tially independent of photon energy. (b) The brightness of
the impulsive X-ray source decreases rapidly with increase
in altitude, in a manner similar to that shown in Figure 2.2.3.
2.2.1.3 Implications of Hard X-ray Imaging and
Stereoscopic Observations
Following the work of Brown and McClymont (1976) and
Emslie (1981b), Machado et al. (1985) have computed the
spatial distribution of hard X-rays in flare loops and the chro-
mosphere by applying Brown and McClymont's method to
the analysis of some well-observed SMM flares. Their results
show that, due to the combination of spatial resolution and
rather low energy imaging, only under particular circum-
stances could chromospheric footpoints be seen in the im-
ages. This is readily seen from the fact that, under the best
conditions,the flare loops have to cover three HXIS pixels
(i.e. _> 15000 km) to be able to show separated footpoints.
This implies that in order to have a strong chromosphere
brightening at 20 keV, electrons with similar or higher energy
must have a collisional mean free path equal to or larger than
the above distance, or in other words the loop densities shouldbe _< 4 x 1010cm -3.
A transition from footpoints to single source hard X-ray
structures was observed (cf. 2.2.1.1) in the November 5,
1980 flare studied by Duijveman et al. (1982). This transi-
tion occurred within the main flare region, where footpoints
A and B were observed in the early flare phase. Figure 2.2.4
shows a light curve of the hard X-ray emission of the event,
in which two hard X-ray peaks, P1 and P2, have been de-
fined. P1 corresponds to the time when the footpoints were
observed, while P2 (more gradual and softer) shows a single
source in the hard X-ray (16-30 kev) images which is lo-
cated between the two footpoints, coinciding with the locus
of maximum emission in the soft X-ray images. An approx-imate estimate of the flare volume V = 2.3 x 1026 cm 3can
be obtained, leading to densities n(P1) = 5x101° cm -3 and
n(P2) = 10 H cm -3 of the loop plasma during each peak
(the density increase is presumably due to chromospheric
evaporation). These densities are a lower limit, since a fill-
ing factor = 1 is assumed (see Wolfson et al. (1983) for
a critical discussion). The expected spatial distribution of hard
2-6

8O
4O
0
22-- 30 keVP1
I
IIP2
,l_ ! |
22:30 22:40UT
Figure 2.2.4 Hard X-ray emission light curves of the
November 5, 1980 event. In the 22-30 keV lightcurve
the two peaks are marked with P1 and P2 and cor-
respond to the the points that the spatial distribution
of hard X-rays has been computed.
X-rays can be calculated under simplified assumptions (cf.
Brown and McClymont, 1976; Machado et al., 1985) of the
predominance of Coulomb losses and parallel injection ofelectrons along field lines. We should note that this is the
most favorable case for footpoint prediction, since it neglectsany effect (like e.g., pitch angle distribution, Leach and
Petrosian, 1981) that could increase beam stopping.
Machado et al. (1985) calculated the intensity distribu-
tion of hard X-rays using idealized loop models. They ana-
lyzed three different models for the energy release (see Figure2.2.5a). Case A represents a situation in which the acceler-
ation site is located at the boundary between two pixels,
presumably at the loop's apex, and the beam strength is sym-metrical towards both sides. In case B it has been assumed
that the acceleration region is at the middle of a pixel, and
the beam is predominantly towards one side of the loop.Finally, in case C, the acceleration site is also located at the
middle of a pixel, but beam strengths towards both sides are
equal. The boxes shown in Figure 2.2.5a represent the pix-
a b
CASE A
CASE B
°N
CASE C
(a)
P1
P2
1,26i, 1628I122,13s31 2s11216118216021
NOT CONVOLVED
CASE A
CASE B
is,31,2sl.21.oTco.voLv oi 21,,,12 91c.sE.
(b)
Figure 2.2.5 (a) The three cases of convolution discussed in the text. The cross marks the placewhere particle acceleration is presumed to occur and the arrows the predominant direction of beam
injection. The shaded area in the third pixel is the chromospheric footpoint, which is assumed to besmaller than a HXIS 8" x 8" pixel and is shifted in location across the "footpoint pixel". Note that
in cases B and C, due to its spatial overlap with its neighbor to the right, a fourth pixel should contain
part of the footpoint emission. (b) Result of the intensity distribution of hard X-rays in percentageof the total emission. Cases A, B and C correspond to those shown in Figure 2.2.1. The "footpoint
pixel" contains the total of the emission which should be spread in two (see cases B and C of Figure
2.2.1 ). Note the strong changes that can be expected by changing the location of the acceleration
source and/or the footpoint location. In particular case A of P1 shows a large change in the bright-
ness of the pixel located to the left of the footpoint, and case C of P2 the increase in brightness
of the loop source.
2-7
els from the HXIS instrument, the total emission over half
of a loop length assumed to cover two HXIS 8" pixels and
the third pixel from the left is the "footpoint pixel". The
"footpoint pixel" shows the emission of the chromospheric
part of the hard X-ray distribution. In Figure 2.2.5b Machado
et al. displayed the percentage of the total emission for all
three cases using a photon energy e = 19 keV. These ideal-
ized calculations clearly show a transition from footpoint to
predominantly single structure in the hard X-ray distribu-
tion of P1 and P2. We also present in Figure 2.2.5b theresults obtained from the convolution of the unconvolved dis-
tribution (c.f. earlier comments and Svestka et al., 1983).
The general result here is that the convolution tends to
decrease the footpoint/loop brightness ratio, a result con-
sistent with the observations reported by Duijveman et al.
(1982), Hoyng et al. (1981) and Machado et al. (1982). TheMachado et al. results tend to reinforce the conclusions about
the reality of hard X-ray footpoints, and provide a warning
against the direct interpretation of single hard X-ray sources
as indicative of regions heated by a mechanism different from
the one leading to acceleration (cf. implications of footpoint
to single source transition in type B flares).
Another important aspect to take into account is the heat-
ing effect of beam particles along the loop, due to Coulomb
collisions with the ambient plasma. Calculations of energy
deposition rate as a function of column density, N(cm-2),
have been performed by many authors (Brown, 1972, 1973;
Lin and Hudson, 1976; Emslie, 1978, 1980, 1983), gener-
ally in connection with chromospheric heating calculations.
Machado et al. (1985) have been able to show that in the
cases of high-density flare loops (like e.g., the July 14, 1980
event described by Duijveman and Hoyng, 1983) single
sources are not only likely to appear because of particle stop-
ping within the loop and high efficiency in the nonthermal
bremsstrahlung production, but also because their localized
heating causes an increase in the thermal contribution to the
hard X-ray output below 25 keV (note also that if the heat-
ing is very large it invalidates the condition E > > Eth of
the thick target approximation, where E is the particle's
energy and Eth the mean thermal energy of the particles in
the target). It is also worth noting that these single source
(type A or C) flares often show less "spiky" time prof'des,
which can result as a natural consequence of the fact that
the temporal behavior is no longer exclusively related to time
variations in the beam intensity but also to the conductive
cooling timescale of the heated regions. A detailed analysis
of this latter possibility has not yet been carried out. An al-
ternative for the beam induced heating may also be related
to the opposite case, i.e. low loop densities, which can lead
to beam - plasma - return current instabilities and increasethe beam losses due to non-collisional effects, (Vlahos and
Rowland (1984), Rowland and Vlahos (1984)). This is
another field in which more work is needed before reachingdefinite conclusions.
Machado et al. concluded that, in spite of the instrumen-
tal limitations, the presence of footpoints in the hard X-ray
images, seems to give support to the thick target interpreta-tion of the bursts. MacKinnon et al. (1985) on the other hand,
feel that no aspect of the images demands such an interpre-
tation uniquely, and find that some aspects of the data are
difficult to accommodate in any conventional (thick target
or dissipative thermal) model.
There are several pieces of evidence that indicate that a
substantial fraction of the low energy (E < 30 keV) impul-
sive emission in flares is not purely due to thick target brems-
strahlung. Machado (1983b) reached this conclusion by the
analysis of the energy and particle content of a compact flare
loop, where a pure thick target analysis was shown to be
incompatible with the parameters derived from the soft X-ray
plasma.
Brown et al. (1983b), from the analysis of stereoscopic
observations, find that the detailed quantitative dependence
of occultation ratio on height, energy and time are not com-
patible with the basic thick target model as the sole source
of the hard X-rays. Either emission from thermal sources
or from magnetically trapped electrons have to be invoked
to explain the observations.
Finally, Machado and Lerner (1984) re-analyzed the ob-
servations of a limb flare of April 13, 1980, which showed
a bright X-ray (16-30 keV) source at the boundary between
two distinct magnetic structures (see Machado et al., 1983).
They find that the spatial distribution in intensity and spec-
tral behavior of the hard X-rays is incompatible with a pure
nonthermal interpretation. They conclude that a large frac-
tion (> 50%) of the emission in the 20 keV range is due
to thermal bremsstrahlung of plasma with temperatures > 5
x 107K. The spatial distribution of the emission leads them
to propose that the site of the maximum hard X-ray bright-
ness is located where energy is released (at the region of in-terconnection between two field structures) both in the form
of heating and particle acceleration.
2.2.2 Microwave Source Structure, Location
and Development
Accelerated electrons produce microwave radiation
through their interaction with the magnetic field. High reso-
lution observations at cm-wavelengths have given important
information about the magnetic structure of the flaring region.
Observations at several frequencies can, in principle, pro-
vide valuable diagnostics of both the magnetic field and thedistribution function of the energetic electrons as a function
of time. However, so far there have been very few multi-
frequency observations at high spatial resolution and conse-
quently the discussion has been focused on the diagnosis of
the magnetic field configuration.Two dimensional images with the Very Large Array
(VLA) radio telescope suggest that interacting magnetic loops
2-8

andmagneticfield reconnection have important roles to play
in solar flares. This can occur as a result of emergence of
new flux interacting with pre-existing flux, or as a conse-
quence of rearrangement and/or reactivation (e.g., twisting)of two or more systems of loops. Kundu (1981) illustrated
this phenomenon with a set of 6 cm observations made withthe VLA (spatial resolution - 2 '3 that pertains to changes
in the coronal magnetic field configurations that took place
before the onset of an impulsive burst observed on 14 May1980 (Kundu, 1981; Kundu et al., 1982; Velusamy and
Kundu, 1982). The burst appeared as a gradual component
on which was superimposed a strong impulsive phase (dura-tion - 2 minutes) in coincidence with a hard X-ray burst.
Soft X-ray emission (1.6-25 keV) was associated with the
gradual 6 cm burst (before the impulsive burst), as is to be
expected. There was a delay of hard X-ray emission (> 28keV) relative to 6 cm emission. The most remarkable fea-ture of the 6 cm burst source evolution was that an intense
emission extending along the north-south neutral line, pos-
sible due to reconnections, appeared, just before the impul-
sive burst occurred, as opposed to the preflare and initial
gradual emission being extended along an east-west neutralline. This north-south neutral line must be indicative of the
appearance of a new system of loops. Ultimately the loop
systems changed and developed into a quadrupole structure
near the impulsive peak. This field configuration is reminis-cent of flare models in which current sheet develops at the
interface between two closed loops. The impulsive energy
release must have occurred due to magnetic reconnection of
the field lines connecting the two oppositely polarised bipo-
lar regions (Kundu et al., 1982).
A second burst observed by Kundu et al. 1984 on 24 June
1980, 19:57 UT provides a good example of interacting loops
being involved in triggering the onset of a 6 cm impulsiveflare associated with a hard X-ray burst. It also provides evi-
dence of preflare polarization changes on time scales of a
minute or so, which may be related to coronal magnetic field
configurations responsible for triggering the burst. The 6 cm
burst source is complex, consisting initially of two oppositely
polarized bipolar sources separated E-W by - 1.5' arc. The
first brightening occurs in one component at 19:57:10 UT,
the western component being much weaker at this time. It
then brightens up at 19:58:05 UT, just at the onset of the
impulsive rise of the burst and is accompanied by changes
in its polarization structure. It then decays and splits into two
weak sources separated E-W by - 12" arc. The eastern com-
ponent brightens up at 19:58:41 UT, accompanied by sig-
nificant polarization changes, including reversal of
polarization. A third component appears approximately mid-
way between the eastern and western component at 19:58:45
UT during the peak of the associated hard X-ray burst. The
appearance of this source is again associated with polariza-
tion changes, in particular the clear appearance of several
bipolar loops; its location overlaps two opposite polarities
implying that it might be situated near the top of a loop. Dur-
ing the peak of the associated hard X-ray burst (1980 June
24, 19:57:00 event), a third (perhaps another bipolar) loopappears in between the previous two sources. Kundu believes
that we are dealing with interaction between multiple loop
structures, resultant formation of current sheets and mag-netic field reconnection, which is responsible for the acceler-ation of electrons.
Lantos, Pick and Kundu (1984) combined observationsof three solar radiobursts obtained with the VLA at 6 cm
wavelength and with Nancay Radioheliograph at 1.77m. Asmall change in the centimetric burst location by about 10"
arc corresponds to a large change by about 0.5 Ro in the
related metric location. The metric bursts occur successively
at two different locations separated by about 3.105 km. Dur-
ing the same period, an important change in the microwave
burst source is observed. This may indicate the existence of
discrete injection/acceleration regions and the presence of
very divergent magnetic fields in agreement with the sug-
gestions made by Kane et al. (1980).
The Westerbork Synthesis Radio Telescope (WSRT) was
used by Aiissandrakis and Kundu (1985) for solar observa-
tions at 6.16 cm with a spatial resolution as good as 3" and
a time resolution of 10 sec. In spite of the limitations of one-
dimensional fan-beam scans in total intensity (I) and circu-
lar polarization (V) of burst sources, several interesting fea-tures could be discovered in their structure.
Out of the 76 bursts observed, 57% consisted of two or
more components in total intensity. An example of a burst
with two components is shown in Figure 2.2.6a,b, where
contours of 1-D brightness temperature as a function of po-
sition and time are plotted. In total intensity (I), the burst
consists of two impulsive components, A and B, with their
peaks separated by 26" and a total duration of about 4
minutes. The peaks are almost simultaneous with a possible
delay of component B by no more than 5 sec with respect
to component A. Component A is fairly symmetric with a
width of 7" and a maximum 1-D brightness temperature of
6.5 × 10⁷K arc sec above the background; assuming a cir-
cular shape this value corresponds to a brightness tempera-
ture of about 107K. The other component is asymmetric with
a width of 11" and an estimated brightness temperature of
about 4 × 10⁶K. Alissandrakis and Kundu pointed out that
near the maximum the two components appear to be con-
nected by a bridge of low intensity emission. Such intercon-
nections between burst components are the rule rather than
the exception in their sample of bursts. In the example shownthere is a definite extension of component B is the direction
of component A. The circular polarization map shows that
both components, as well as the bridge between them are
polarized. Component A shows two peaks of opposite sense
with the total intensity peak coinciding with the region ofzero polarization; the degree of polarization at the V peaks
is about 50%. The polarization of the other component is
2-9
-1.5'
-2.0'
LEL
-1.5'÷
-2.0' -
DATE: 80 5 23 STOKES I 1-D CLEANi i t i i [ I I I i I I I [ [ [ : ' l ; i : 1 ] ; I [
A
B
: ' I ' _ I ' J r[ [ i i L I ' ' i ' [ ; I _ I
832 834 U
DATE: 80 5 23 STOKES V 1-D CLEANi i i i i L 1 i i i i 1 1 1 1 1 1 i i i i i I i i i I
- 7-7:-.<.-%_
' ' I / ill I' \\_, k j I/ ,'', ,, -.'.7..-/t I
-- :2."'.-" 0
832 834 U T
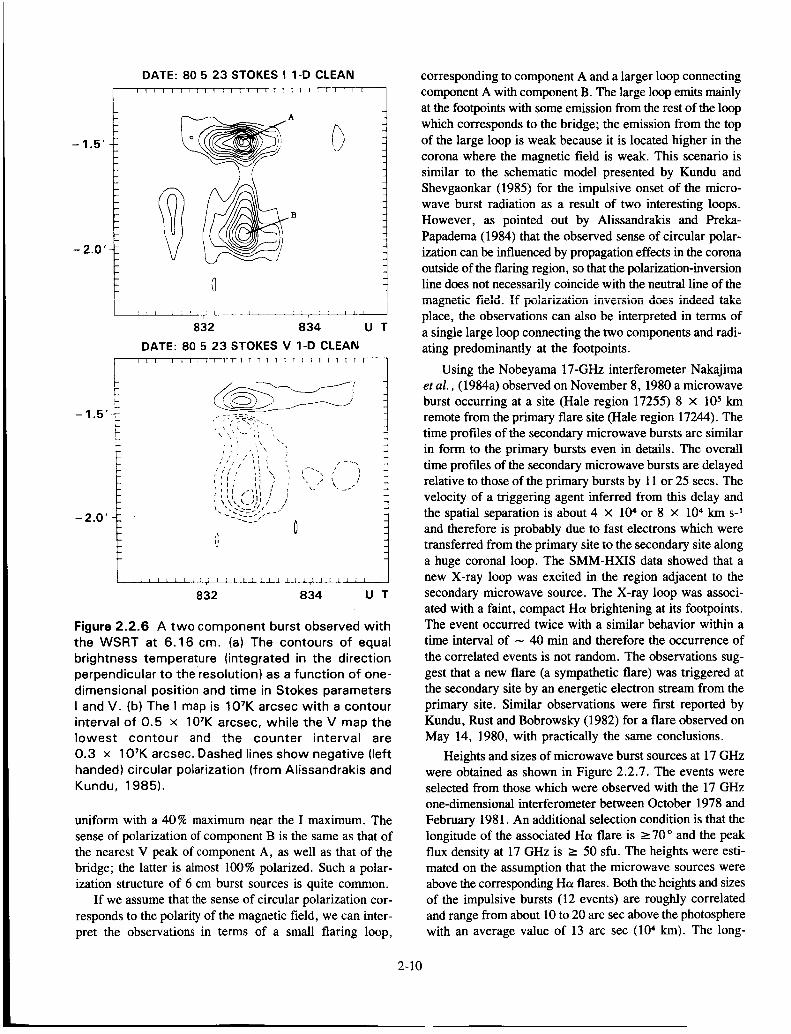
Figure 2.2.6 A two component burst observed with
the WSRT at 6.16 cm. (a) The contours of equal
brightness temperature (integrated in the direction
perpendicular to the resolution) as a function of one-
dimensional position and time in Stokes parameters
I and V. (b) The I map is 107K arcsec with a contour
interval of 0.5 x 1WK arcsec, while the V map thelowest contour and the counter interval are
0.3 x 10⁷K arcsec. Dashed lines show negative (lefthanded) circular polarization (from Alissandrakis and
Kundu, 1985).
uniform with a 40 % maximum near the I maximum. The
sense of polarization of component B is the same as that of
the nearest V peak of component A, as well as that of the
bridge; the latter is almost 100% polarized. Such a polar-
ization structure of 6 cm burst sources is quite common.
If we assume that the sense of circular polarization cor-
responds to the polarity of the magnetic field, we can inter-
pret the observations in terms of a small flaring loop,
2-10
corresponding to component A and a larger loop connecting
component A with component B. The large loop emits mainly
at the footpoints with some emission from the rest of the loop
which corresponds to the bridge; the emission from the top
of the large loop is weak because it is located higher in the
corona where the magnetic field is weak. This scenario is
similar to the schematic model presented by Kundu and
Shevgaonkar (1985) for the impulsive onset of the micro-
wave burst radiation as a result of two interesting loops.
However, as pointed out by Alissandrakis and Preka-
Papadema (1984) that the observed sense of circular polar-
ization can be influenced by propagation effects in the corona
outside of the flaring region, so that the polarization-inversion
line does not necessarily coincide with the neutral line of the
magnetic field. If pu,_u.... u_ttiu.:-_':--,,:......v_1_,u.:...... ut,_ indeed take
place, the observations can also be interpreted in terms of
a single large loop connecting the two components and radi-
ating predominantly at the footpoints.
Using the Nobeyama 17-GHz interferometer Nakajimaet al., (1984a) observed on November 8, 1980 a microwave
burst occurring at a site (Hale region 17255) 8 x 10⁵ km
remote from the primary flare site (Hale region 17244). The
time profiles of the secondary microwave bursts are similar
in form to the primary bursts even in details. The overall
time profiles of the secondary microwave bursts are delayed
relative to those of the primary bursts by 11 or 25 secs. The
velocity of a triggering agent inferred from this delay and
the spatial separation is about 4 x 10⁴ or 8 x 10⁴ km s-1
and therefore is probably due to fast electrons which were
transferred from the primary site to the secondary site along
a huge coronal loop. The SMM-HXIS data showed that a
new X-ray loop was excited in the region adjacent to the
secondary microwave source. The X-ray loop was associ-
ated with a faint, compact Ha brightening at its footpoints.The event occurred twice with a similar behavior within a
time interval of - 40 min and therefore the occurrence of
the correlated events is not random. The observations sug-
gest that a new flare (a sympathetic flare) was triggered at
the secondary site by an energetic electron stream from the
primary site. Similar observations were first reported by
Kundu, Rust and Bobrowsky (1982) for a flare observed on
May 14, 1980, with practically the same conclusions.
Heights and sizes of microwave burst sources at 17 GHz
were obtained as shown in Figure 2.2.7. The events wereselected from those which were observed with the 17 GHz
one-dimensional interferometer between October 1978 and
February 1981. An additional selection condition is that the
longitude of the associated Ha flare is _>70 o and the peakflux density at 17 GHz is _> 50 sfu. The heights were esti-
mated on the assumption that the microwave sources were
above the corresponding Hcf flares. Both the heights and sizes
of the impulsive bursts (12 events) are roughly correlated
and range from about 10 to 20 arc sec above the photosphere
with an average value of 13 arc sec (104 km). The long-

@
ttlN
40-
20
00
' I ' I
LL
00
• OO
I i I
20 40
HEIGHT (arc sec)
Figure 2.2.7 Heights and sizes of microwave burst
sources at 17 GHz. L indicates long-enduring burst.
The remaining events are impulsive (from Nakajimaet al. (1984a)).
enduring bursts (2 events) are located higher (30 arc sec)
and larger (35 arc seat) in size as compared to those of the
impulsive bursts. Although SMM-I-IXIS and HINOTORI-
SXT hard X-ray imaging observations show in several eases
that the hard X-ray component of the impulsive burst is lo-
cated in the chromosphere (e.g., Duijveman, Hoyng, and
Machado, 1982; Tsuneta et aL, 1983), the observations
reported by Nakajima et al., 1984a show that the microwave
emission from the impulsive burst comes from the corona.
The VLA observations have often shown a compact (very
small compared to the distance between Hot kernels) source
of the impulsive bursts located spatially between Hot ker-
nels (Marsh and Hurford, 1980; Velusamy and Kundu, 1982;
Hoyng et al., 1983). On the other hand, the observation
reported above shows that the source size and height are
roughly the same. The height observations of the long-
enduring bursts confirm the results reported by Kosugi et
al. (1983) and Kawabata et aL (1983).
2.2.3 Time Structures and Time Delays inRadio and Hard X-rays
2.2.3.1 Centimeter-Decimeter Millisecond Pulses
and Electron Cyclotron Masering
Spikes of durations less than 100 ms are well known in
the 200 - 3000 MHz radio band. At meter wavelengths some
have been reported near the starting frequency of type IIIbursts (Benz et al., 1982), at decimeter wavelengths as a part
of type IV events (DriSge, 1977) and at centimeter
wavelengths superposed on a gradual event (Slottje, 1978).
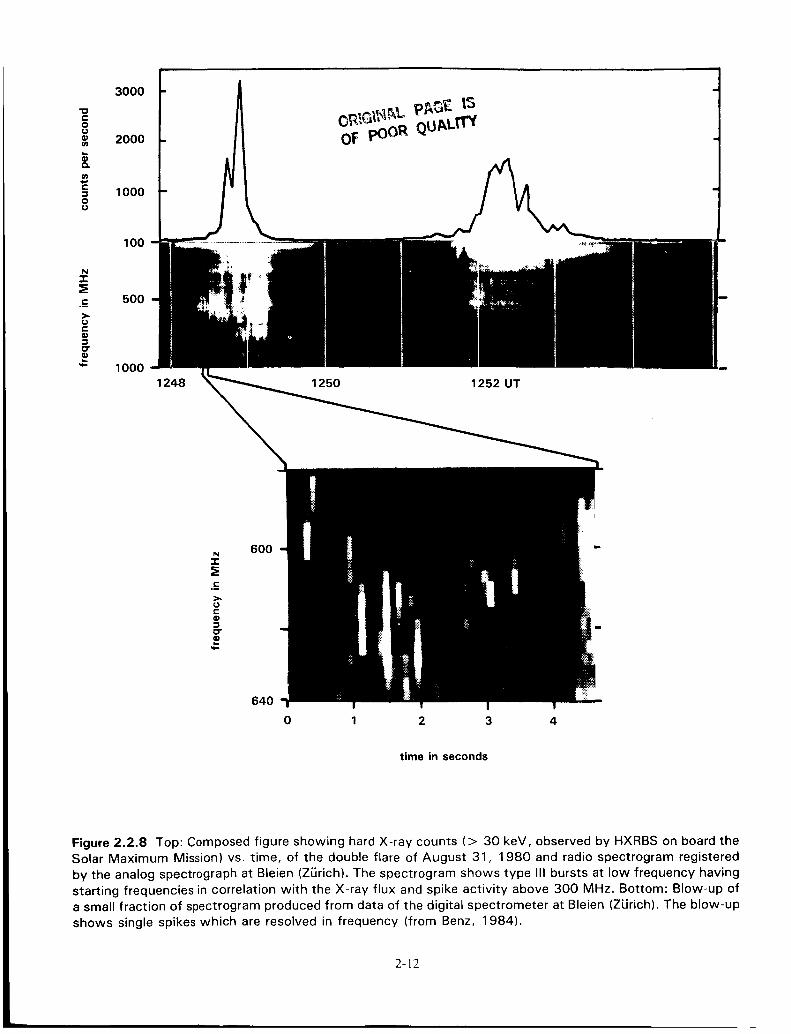
In an analysis of 600 short decimetric events (excluding typeIV's), Benz, Aschwanden and Wiehl (1984) have found 36
events consisting only of spikes. An example of the data is
presented in the Figure 2.2.8 together with a hard X-ray timeprofde and a blow-up of some single spikes. A detailed anal-
ysis (Benz, 1984) shows that the groups of spikes are always
associated with groups of metric type 111bursts. The spikes
tend to occur in the early phase of the type 111groups and
predominantly in the rising phase of hard X-rays. The half-power duration of the spikes is less than 100 ms, the time
resolution of the instrument used. The spectnun of the spikes
has been recorded and the typical half-power widths are 3-10
MHz at 500 MHz, i.e. about 1% of the center frequency.
This puts a severe constraint on the spectral width of the radio
emission and therefore on the generating mechanism. The
most plausible interpretation is emission at the electron cyclo-
tron frequency or harmonic (e.g., upper hybrid wave emis-
sion or cyclotron maser). Even then, the requirement on the
homogeneity of the source is formidable: assuming a locally
homogeneous corona with a magnetic field scale length of
10,000 km, the source size in the direction of the field gra-
dient must be equal to or less than 100 km. This is less than
the upper limit of the size imposed by time variation. As-
suming this dimension for the lateral extent of the source,
the lower limit of brightness temperature is up to 10_SK.
Provided that the emission is radiated close to the plasma
frequency, the source density amounts to about
3 x 109 cm -3. The spikes have peak fluxes of up to 800
sfu and are circularly polarized. The polarization ranges from
25-100%. The sense of polarization is righthanded, oppo-
site to most type 111 bursts occurring at lower frequenciesat the same time.
The high brightness temperature of short duration (1-100
msec) spikes observed during the impulsive phase of some
flares at microwave frequencies (- 3 GHz) indicates that
a coherent radiation mechanism is responsible. Coherent
plasma radiation at the electron plasma frequency was origi-nally suggested as the radiation mechanism (Slottje, 1978;
Kuijpers, van der Post, and Slottje, 1981). Holman, Eichler
and Kundu (1980) argued that electron cyclotron masering
at frequencies just above the electron gyrofrequency or its
second or third harmonic was a likely mechanism for thespike emission. As a third possibility, coherent emission at
twice the upper hybrid frequency, has been suggested by
Vlahos, Sharma and Papadopoulos (1983). Electron cyclo-
tron masering has been the most highly studied of the threemechanisms. The mirroring of suprathermal electrons in a
flaring loop naturally leads to a loss-cone particle distribu-
tion, which is unstable to electron cyclotron maser emission
(Wu and Lee, 1979). The attractive features of this mecha-
nism are that it is a linear process, not requiring wave-wave
interactions, and the conditions for it to operate are essen-
2-11
"0C0
q)(n
3e_
0
N
.=_
0"
q_
3000
2000
1000
100
5OO
1000
1248
600
640
1250 1252 UT
0 1 2 3 4
time in seconds
Figure 2.2.8 Top: Composed figure showing hard X-ray counts (> 30 keV, observed by HXRBS on board theSolar Maximum Mission) vs. time, of the double flare of August 31, 1980 and radio spectrogram registered
by the analog spectrograph at Bleien (Z_rich). The spectrogram shows type III bursts at low frequency having
starting frequencies in correlation with the X-ray flux and spike activity above 300 MHz. Bottom: Blow-up of
a small fraction of spectrogram produced from data of the digital spectrometer at Bleien (ZUrich). The blow-up
shows single spikes which are resolved in frequency (from Benz, 1984).
2-12

tiallythesame as those required for an incoherent micro-
wave source: trapped, mildly relativistic electrons (roughlythe same number as required for the incoherent emission)
with moderately high pitch angles. The masering occurs as
long as the loss-cone distribution of the mirrored electrons
is maintained. As shown by Melrose and Duik (1982) and
Sharma, Vlahos, and Papadopoulos (1982), the saturated
level of the emission is sufficient to provide the observed
high brightness temperatures. The emission must escape ther-mal cyclotron absorption at the next higher harmonic,
however, and this requirement favors second harmonic emis-
sion, since emission at the fundamental will generally not
be able to escape the second harmonic absorption layer.Growth of the first harmonic poses'a problem for second har-
monic emission however, since the first harmonic growthcan saturate the maser before the second harmonic is able
to grow significantly. Sharma et al. (1982) and Sharma andVlahos (1984) have shown that the first harmonic,
extraordinary mode growth will be suppressed by the am-
bient thermal plasma if % > 0.4 tic, (% is the plasma fre-
quency; tic is the gyrofrequency). The growth of the first
harmonic ordinary mode is still large, however, so the con-
ditions under which the second harmonic emission can growand escape are still not entirely clear. Vlahos and Sharma
(1984) analyzed the role of the filling of the loss-cone dis-tribution and suggested that loss-cone driven electron cyclo-tron emission will be localized at the bottom of the corona
and the emitted radiation will have a narrow bandwidth. This
is in agreement with the observations reported above.
Finally, in a recent study Zaitsev, Stepanov and Sterlin
(1985) suggested that the millisecond pulsations are due toa non-linear induced scattering of plasma waves by back-
ground plasma ions. They reduced the coupled non-linear
system of equations, that describe the wave-particle inter-
actions, to the well known Voltera equations which describethe "predator-prey" problem. The duration of the pulses (a
few milliseconds) is used to determine the density of the ener-
getic electrons that cause the radio emission.
2.2.3.2 Ultrafast Time Structure in Microwaves
and Hard X-rays and their Time Delays
The use of antennas with large collecting areas has con-
siderably improved the observation of solar bursts at cen-
timeter and millimeter wavelengths with high sensitivity andtime resolution (Kaufmann et al., 1975, 1982a; Butz et al.,
1976; Tapping, 1983). The 45 ft. diameter radome-enclosed
radio telescope, at Itapetinga, Brazil, operating at 22 GHz
and 44 GI-Iz, was extensively used during the period of SMM
operation, providing high sensitivity (0.03 s.f.u, in single
linear polarization) and high time resolution (1 ms) data; thesedata revealed new aspects of low level solar activity as well
as fine time structures in larger bursts. In practically all the
bursts studied with high sensitivity at mm-cm wavelengths,
fine time structures (< 1 sec) were identified superimposed
on the slower time structures (seconds). The repetition rate
of the ultrafast structures appear to be higher, for higher mean
fluxes of 22 GHz bursts (see Figure 2.2.9). Kaufmann et
aL (1980a, 1980b) suggested a possible interpretation of this
behavior in terms of a quasi-quantization in energy of the
burst response to the energetic injections. A similar sugges-
tion was made earlier from the statistical properties of a col-
lection of X-ray bursts ( - 10 keV) (Kaufmann et aL, 1978).
A trend similar to that shown in Figure 2.2.9 was found in-
dependently at 10.6 GI-Iz (Wiehl and Matzler, 1980) but for
bursts with larger flux and timescales. Kaufmann et aL
(1980a) showed that for a given burst flux level S at 22 GHz
there is a minimum repetition rate of ultrafast structures R,such as S _< k.R, where k is a constant. One of the faster
repetition rates was found at the peak of an intense spike-
like burst (Figure 2.2.10) which was also observed in hard
X-rays by SMM-HXRBS (Kaufmann et al., 1984). A strik-
ing example obtained simultaneously in microwaves and hard
X-rays is the burst of November 4, 1981 at 1928 UT
(Takakura et al., 1983b).
v
>-I--
Ztelt3X..ItL
Z
ttl
N.'T-O
¢q¢q
300_
100 -
10
1
0.10.2
I I I IIIII
mmmb
_7
-- • /-- /_ /
•//_ / []
//
//
--/
I I i
I I I I Illll I
.//
/v// -/
//
[] /[] /
A
A
• 0_/ []
[] REFERENCE -
• DAY/MO/YEAR _ UT TIME -
[] • 10/7/78
• [] 12/7/78A 1812179
19/2/79
• 19/2/79
• 1912179
• 1912179
• 20/2/79
_7 2412179
O 2512/79
I I 111 1 I I I
1
17 17
16 O0
16 39
11 09
12 21
12 24
15 25
16 40
13 51
14 42
IIIII [
10
REPETITION RATE (SEC- 1)
3O
Figure 2.2.9 Scatter diagram of repetition ratesR (s- 1) of fast time structures superimposed on solar
bursts at 22 GHz against the mean flux value S (s.f.u.)for various bursts observed in 1978-1979 with the
13.7-m Itapetinga antenna (from Kaufmann et al.,
1980a).
2-13

18 DEC 1980
7 8 1156 ' I 9 I
34 I. i k/_ I.1o_ ..... :_
2 I I - 2.9s.f.u1 ----_-
22 GHz
0.2 s.f.u.44 GHz _.
/I I
1921:19.5 1921:20.0 UT1 SEC
Figure 2.2.10 One-second section at the peak of an
intense spike-like burst, displaying ultrafast time struc-
tures repeating every 30-60 ms at 22 GHz and 44 GHz(from Kaufmann et al., 1984).
High sensitivity 10.6 GHz data for the same burst was
obtained with the 45-m antenna at Algonquin Radio Observ-
atory, (Tapping, private communication). The presence of
a "ripple" is evident at all microwave frequencies and is
very significant at 30-40 keV range (HINOTORI-HXM). The
ripple relative amplitude (AS/S) is about 30 % at 30-40 keV,
1% at 22 and 44 GHz and 0.4% at 10.6 GHz. The aparent
lack of phase agreement for certain peaks might or might
not be real. Confirmation of a nearly one-to-one correspond-
ence of mm-cm vs hard X-ray association of superimposed
ripples was obtained for the November 13, 1981, 1102 UT
burst. The most important findings of such studies are: (a) the
slow time structure (seconds) are often poorly correlated,
or not correlated, between the four microwaves frequencies
(7, 10.6, 22 and 44 GHz) and 30-40 keV X-rays; (b) the
superimposed "ripple" components are present and corre-
lated (although phase differences might be present) in data
obtained simultaneously by two radio observatories widelyseparated from each other (Brazil and Canada) and by the
HINOTORI-HXM X-ray experiment.
The time structures in complex microwave bursts are fre-
quently not correlated in time at various frequencies. De-
lays of peak emission at different microwave frequenciesrange from near coincidence to 3 sec, both toward higher
and lower frequencies (Kaufmann et al., 1980a; 1982b). De-
lays toward lower frequencies only have been reported by
Uralov and Nefed'ev (1976) and Wiehl et al. (1980). One
long-lasting pulsating burst (quasi-period 0.15 sec) has showna systematic delay of 300 ms for 44 GHz pulses relative to
22 GHz pulses (Zodi et al., 1984). It might be meaningful,
however, to stress that the faster time structures found seem
to be well correlated (as the case of the "ripple" structures
discussed above). In relation to hard X-rays, the microwave
burst emission time structures often appear delayed in time.
For relatively slower (and smoothed) time structures, the hard
X-rays appear to occur 1-2 sec prior to microwave emission
(Crannell et al., 1978).
There are several ways to intepret the time delays reported
above, for example, convolution effects of multiple emittingkernels (Brown et al., 1980, 1983a; MacKinnon and Brown,
1984, see also discussion on Section 2.2.6.2) or the fact that
microwave emitting source may move in a varying magnetic
field (Costa and Kaufmann, 1983) are among the suggested
candidates. For the large delays between the microwave and
hard X-ray peaks (several seconds), it has been suggested
that microwave emission originates from another population
than the one that produces the X-rays (Tandberg-Hanssen
et al., 1984). Finally, the long-enduring persistent quasi-
periodic pulsations in bursts, presenting pseudo-delays at
different microwave frequencies, might be a phenomenon
of a different nature, and might be conceived as due to sim-
ple modulation of synchrotron emission by a varying mag-
netic field (Gaizauskas and Tapping, 1980; Zodi et al.,
1984). Some bursts appear to be strictly coincident in time,
at various microwave frequencies and X-ray energy ranges
(to less than < 100 ms) (Kaufmann et al., 1984).
The impulsive phase X-ray and microwave emission, ex-
amined with high sensitivity and high time resolution put
several constraints on the models of the bursting region.
Among the new observations that require theoretical interpre-
tations are the "ripple" structures, the trend of flux vs. repe-
tition rates, and the possible quasi-quantized energetic
injections. Sturrock et al. (1985) suggest that "elementary
flare bursts" may arise from the energy release of an array
of "elementary flux tubes", which are nearly "quantized"
in flux. As a stochastic process of reconnection sets in, by
mode interaction, explosive reconnection of magnetic islands
may develop in each tube, accounting for the ultrafast time
structures (or "ripple") with subsecond timescales.
2.2.3.3 Time Delays in Hard X-ray Bursts
Before the launch of SMM, energy-dependent delay of
hard X-rays had been observed only from a small number
of flares (Bai and Ramaty, 1979; Vilmer, Kane and Trottet,
1982; Hudson et al., 1980). Hard X-ray delay was first ob-
served from the two intense flares observed on August 4 and
7, 1972 (Hoyng, Brown and van Beek, 1976; Bai and
Ramaty, 1979), which happen to be the first gamma-ray line
flares (Chupp et al., 1973). Hudson et al. (1980) analyzed
a very intense gamma-ray line flare observed with the first
High Energy Astronomical Observatory (HEAO-1), andreported a delay of the continuum above 1 MeV with respect
to the X-ray continuum about 40 keV. Vilmer, Kane and
Trottet (1982) studied the hard X-ray delays exhibited in a
2-14

flare observed with ISEE-3. The HXRBS experiment aboard
SMM, which has a large area and good time resolution (71
cm 2 and 0.128 s in normal mode, respectively; cf. Orwig
et aL, 1980), is most suitable for studying energy-dependentdelays of hard X-rays. In collaboration with the HXRBS
group, Bai studied the delay of hard X-rays for many flares
(Balet aL, 1983a; Bad and Dennis, 1985; Bal, Kiplinger and
Dennis, 1985). A balloon-borne detector and the hard X-ray
detector aboard HINOTORI also detected hard X-ray delays
(Bai et al., 1983b; Ohki et al., 1983). The energy depend-
ence of hard X-ray delays is not simple. In some flares the
delay seems to increase smoothly with hard X-ray energy,but in others, it seems to show a sudden increase. For ex-
ample, in the impulsive flares of June 27, 1980 (Bai et al.,
1983b; Schwartz, 1984) and of February 26, 1981 (Bai and
Dennis, 1985), the delay is negligibly small below a certain
energy, and it suddenly increases above that energy. The
energy at which a sudden increase occurs varies from burst
to burst (Schwartz, 1984). In the August 4 and 7, 1972 flares,
the delay increased gradually with increasing energy to about
5 s, and then for energies above - 150 keV it increased to
- 15 s (Bai and Ramaty, 1979). In the flare of August 14,
1979 flare, the delay was about 10 + 5 s for the energy chan-nel 154-389 keV, but it increased to 32 + 10 s for the next
energy channel 389-874 keV (cf. Vilmer et aL, 1982). (It
is important to keep in mind that fast increases may also be
the result of the fact that the energy channels are wider in
higher energies). However, in other flares the delay seems
to increase smoothly with hard X-ray energy (cf. Bai and
Dennis, 1985). The energy-dependent delay of hard X-rays
is equivalent to flattening of the hard X-ray spectrum. In
flares with the delay increasing like a step function at a cer-tain energy (such as the ones on June 27, 1980 and Febru-
ary 26, 1981), the spectral shape at low energies remains
unchanged while the spectrum at high energies flattens as
time progresses during the burst. If the delay is a smoothfunction of energy, the hard X-ray spectrum flattens with
time both at low energies and high energies (Bai, Kiplinger
and Dennis, 1985). Often single power law spectra give good
fits to the data. The flares exhibiting hard X-ray delays form
a small but significant fraction of the total number observed.
Another important observational fact is that energy dependenthard X-ray delays have been mostly observed in flares which
produced observable nuclear ganuna-rays and/or energeticinterplanetary protons (Bai and Ramaty, 1979; Hudson et
al., 1980; Bai et al., 1983a, 1983b; Bai and Dennis, 1985;
Ohki et al., 1983).
Figure 2.2.1 la shows a smoothed plot of the 60-120 keV
and 120-235 keV rates observed by the UC Berkeley bal-
loon experiment during the impulsive phase of the 27 June
1980 flare (Schwartz, 1984). The smoothed rate during each
0.128 sec interval is computed by averaging the rates over
the surrounding bins using a Gaussian weighting functionwith a 0.5 sec FWHM for the 60-120 keV rate and with a
10 4
HIGH ENERGY DELAYS (SMOOTHED)
AI IBI icl D I N I F I
1615 1616 1617
I I
I x R (60-120 keY
>235 keV )
1112Pl 14151
1615 1616 1617
UNIVERSAL TIME
Figure 2.2.11 Delayed bursts of photon energies >
120 keV. (a)Delay of 120-135 keV profile with
respect to 60-120 keV rate. (b) Delay of > 235 keV
rate with respect to 60-120 keV rate (from Schwartz,1984).
o_ • vv JLJLXVJLtUJt UI_ tWU IL(ttU_ dUUVU I/.U Jr_¥ . JILlll_i|UL_I_
out the high frequency fluctuations, both real and statistical,but does not move the bursts centroids. The cross-correlation
function has been computed between the rate pairs (22-33keV, 60-120 keV), (60-120 keV, 120-235 keV), and (60-120
keV, > 235 keV) for the six bursts, A through F. The
smoothed rates were used only for the rates above 120 keV.
The delay times found by cross-correlating various energy
channels are given in Table 2.2.2. For the burst at 1616:38
UT, the > 235 keV rate is too low to accurately determinea centroid. The delay listed between the 22-33 keV and
60-120 keV rates is an upper limit based on the count ratestatistics. Only burst C, at 1615:52 UT, has a real delay for
the 60-120 keV rate of 0.128 seconds. Above 120 keV, all
of these bursts show real delays. There is a delay of - 1-2seconds in the 120-235 keV rate for the medium sized and
shorter duration bursts A, B, C, and E. For the two most
2-15

Table 2.2.2 Cross Correlation Delays
Cross-Correlation Delays
Burst A B C D E F
Time after 1600 UT
(22-33, 60-120 keV)
(60-120, 120, 235 keV)
(60-20 > 235 keV)
(22-33, 60-120 keV)
14:48 15:37 15:52 16:08 16:38 17:02
< .05 < .05 < .20 < .05 < .05 < .05
.8+ .5 1.1 +__.5 1.9__+5 .4-t-.25 .9-.5 .2+ .25
-- -- -- 1.5+.5 -- 1.88+.5
Delay Expected for Collisional Loss Process
.13 .13 .60 .12 .26 .15
intense and longest duration bursts, D and F, the longest de-
lay is for the > 235 keV rate with only a smaller delay forthe 120-235 keV rate (Bai et al., 1983b). The lack of sig-
nificant delays between the 22-33 keV and 60-120 keV chan-
nels make it unlikely that the large delays at higher energies
can be explained purely by simultaneous injection at all ener-
gies followed by energy-dependent decay due to collisional
energy loss (see bottom of Table 2.2.2). Figure 2.2.12,shows five spectra which were accumulated over the inter-
vals marked in Figure 2.2.11. The evolution is similar over
both bursts. The double power law becomes a single a pow-
er law although the counting rate sensitivity is not enough
to observe the hardening in detail. There are two important
aspects of the spectral evolution which may provide impor-
tant clues to the acceleration process. First, the power law
exponent at low energies (< 70 keV) does not change
throughout the acceleration. Secondly, the spectrum at high
energies hardens up to the point where the power law expo-
nent is the same as at low energies, but not harder. It is not
clear whether the spectral hardening occurs because the break
in the spectrum has moved to very high (> 200
keV) energies or whether the entire high energy portion has
hardened to form a single power law at all energies.
2.2.3.4 Hard X-ray Microflares
The U.C. Berkeley balloon flight of June 27, 1980 was
the first to observe the Sun with high energy resolution (< 1
keV) and sensitivity (50 cm 2 germanium plus 300 cm 2 scin-
tillation detectors, both well collimated and actively shieldedfor low background) in the energy range > 20 keV (Lin et
al., 1984). They discovered the phenomenon of solar hard
X-ray microflares which have peak fluxes - 10-100 timesless than in normal flares. These bursts occurred about once
every five minutes through the 141 minutes of solar observa-
tions. Although they are associated with small increases in
soft X-rays, their spectra are best fit by power laws which
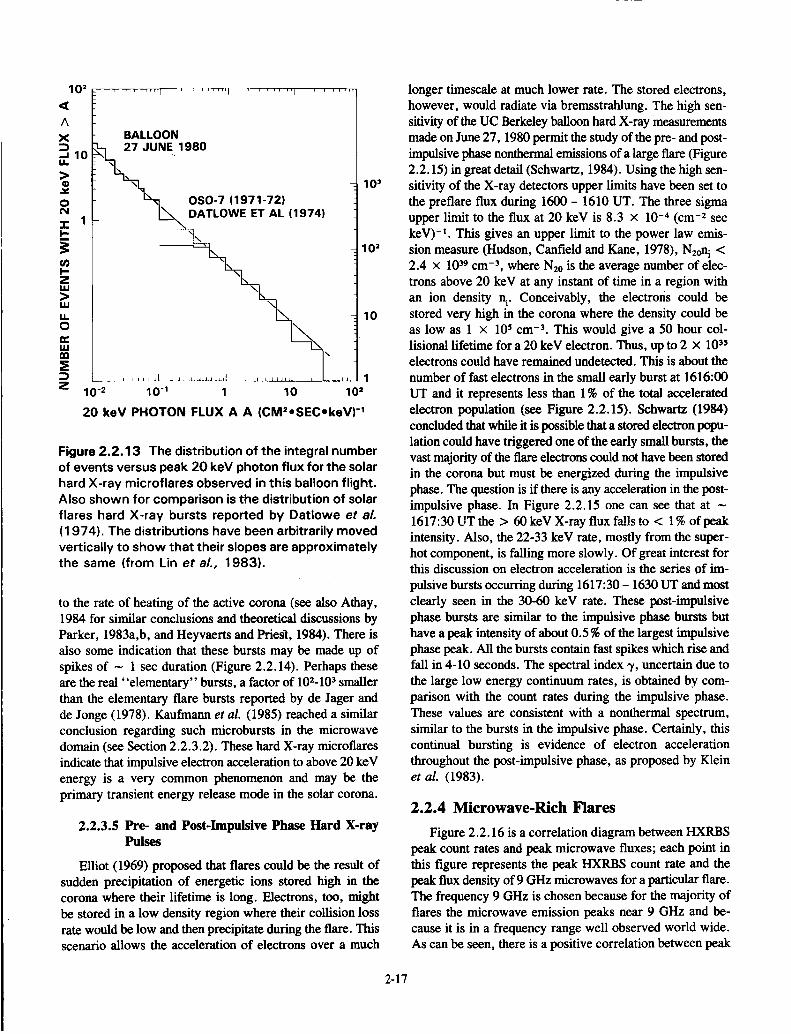
can extend up to > 70 keV. These microflares are thus prob-ably nonthermal in origin. The integral number of events
varies roughly inversely with the X-ray intensity (Figure
2.2.13), so that many more bursts may be occurring with
peak fluxes below their sensitivity. The rate of energy
released in these microflares may be significant compared
10 2
1
7 10-2
_ 10_4
XlO-S
,.II,I.
ZoI.-o3: lO-ea,.
10-1o
10-12
, I , i i i I_ I i |
- 1 _ 27 JUNE 1980
_ ._. E-3.o'
3_-__ 4 E-3-1J' _
E-3.1./_ -_
4_ --_-_
(x10 -7) --__ _t---_.__
5- _ f E -2'9
1x10-91 _ "_'_ _ E-3.s
10 2ENERGY (keV)
10 ¸
Figure 2.2.12 Five spectra accumulated over the in-tervals marked in Figure 2.2.11 (from Schwartz,
1984).
2-16
10 =
<C
A
X
._10I.I.
>q)
.X
oN•I- 1I-
z
ul
0
111
z
' ' ''''"1 ' ' ''''"1 ' ' ''''"1 ' ' ' ....
BALLOON
UNE 1980
OSO-7 (1971-72)
_.. DATLOWE ET AL (1974)........ !
\
, ,, \ _ 1
10 "2 10 -1 1 10 10=
20 keV PHOTON FLUX A A (CM==SECokeV) -1
103
10=
10
Figure 2.2.13 The distribution of the integral number
of events versus peak 20 keV photon flux for the solar
hard X-ray microflares observed in this balloon flight.
Also shown for comparison is the distribution of solar
flares hard X-ray bursts reported by Datlowe et al.
(1974). The distributions have been arbitrarily moved
vertically to show that their slopes are approximatelythe same (from Linet al.. 1983).
to the rate of heating of the active corona (see also Athay,
1984 for similar conclusions and theoretical discussions by
Parker, 1983a,b, and Heyvaerts and Priest, 1984). There is
also some indication that these bursts may be made up of
spikes of - 1 sec duration (Figure 2.2.14). Perhaps these
are the real "elementary" bursts, a factor of 102-103 smaller
than the elementary flare bursts reported by de Jager and
de Jonge (1978). Kaufmann et aL (1985) reached a similar
conclusion regarding such microbursts in the microwave
domain (see Section 2.2.3.2). These hard X-ray microflares
indicate that impulsive electron acceleration to above 20 keV
energy is a very common phenomenon and may be the
primary transient energy release mode in the solar corona.
2.2.3.5 Pre- and Post-Impulsive Phase Hard X-rayPulses
Elliot (1969) proposed that flares could be the result of
sudden precipitation of energetic ions stored high in the
corona where their lifetime is long. Electrons, too, mightbe stored in a low density region where their collision loss
rate would be low and then precipitate during the flare. Thisscenario allows the acceleration of electrons over a much
longer timescale at much lower rate. The stored electrons,
however, would radiate via bremsstrahlung. The high sen-
sitivity of the UC Berkeley balloon hard X-ray measurements
made on June 27, 1980 permit the study of the pre- and post-
impulsive phase nonthennal emissions of a large flare (Figure
2.2.15) in great detail (Schwartz, 1984). Using the high sen-sitivity of the X-ray detectors upper limits have been set to
the preflare flux during 1600 - 1610 UT. The three sigma
upper limit to the flux at 20 keV is 8.3 x 10 -4 (cm -2 sec
keV) -I. This gives an upper limit to the power law emis-
sion measure (Hudson, Canfield and Kane, 1978), N2on i <
2.4 x 1039 cm -3, where N20 is the average number of elec-
trons above 20 keV at any instant of time in a region with
an ion density n r Conceivably, the electrons could be
stored very high in the corona where the density could be
as low as 1 × l0 s cm -3. This would give a 50 hour col-
lisional lifetime for a 20 keV electron. Thus, up to 2 x 1035electrons could have remained undetected. This is about the
number of fast electrons in the small early burst at 1616:00
UT and it represents less than 1% of the total accelerated
electron population (see Figure 2.2.15). Schwartz (1984)
concluded that while it is possible that a stored electron popu-
lation could have triggered one of the early small bursts, the
vast majority of the flare electrons could not have been stored
in the corona but must be energized during the impulsive
phase. The question is if there is any acceleration in the post-
impulsive phase. In Figure 2.2.15 one can see that at -
1617:30 UT the > 60 keV X-ray flux faUsto < 1% ofpeak
intensity. Also, the 22-33 keV rate, mostly from the super-
hot component, is failing more slowly. Of great interest forthis discussion on electron acceleration is the series of im-
pulsive bursts occurring during 1617:30 - 1630 UT and most
clearly seen in the 30-60 keV rate. These post-impulsive
phase bursts are similar to the impulsive phase bursts but
have a peak intensity of about 0.5 % of the largest impulsive
phase peak. All the bursts contain fast spikes which rise and
fall in 4-10 seconds. The spectral index 7, uncertain due to
the large low energy continuum rates, is obtained by com-
parison with the count rates during the impulsive phase.
These values are consistent with a nonthermal spectrum,
similar to the bursts in the impulsive phase. Certainly, this
continual bursting is evidence of electron acceleration
throughout the post-impulsive phase, as proposed by Klein
et al. (1983).
2.2.4 Microwave-Rich Hares
Figure 2.2.16 is a correlation diagram between HXRBS
peak count rates and peak microwave fluxes; each point in
this figure represents the peak HXRBS count rate and the
peak flux density of 9 GHz microwaves for a particular flare.
The frequency 9 GHz is chosen because for the majority of
flares the microwave emission peaks near 9 GHz and be-
cause it is in a frequency range well observed world wide.
As can be seen, there is a positive correlation between peak
2-17

A
tJIJJ
,d.IN0II,-
u'}I,-Z:::)0¢Jv
0")
&N
27 JUNE 1980
30
20
10
30
20
I I
,, ttrLII I
1558 1600 1958
10
0 J
1948
Figure 2.2.14
et al., 1983).
1950 2031
UNIVERSAL TIME
] I
2000
I I
2033
The four largest hard X-ray microflares are shown here at 1.024 sec resolution (from Lin
I04 27 JUNE 1980 CORRECTED SCINTILLATOR RATE' ' I ' 1 .... I .... I ' '
uJ_I03 i__x.66)
U3
_. 102
(_
I >235 keY ( x.0028 )
--IO] , , _ / .... I , , , , I , , , , _ , ,1615 1620 1625 1630 UT
Figure 2.2.15 The hard X-ray burst observed by the scintil-
lation detector. The low decay in the 22-23 keV channel lasts
till >_ 16:31 UT. This is due to the super-hot component. The
small bursts of non-thermal emission occur till 16:31 UT (from
Schwartz, 1 984).
2-18

lg80-1981
• • " _(15 sfu)
10 3 10 4 10 5
HXRBS PEAK COUNT RATE (ctsls)
Figure 2.2.16 Correlation diagram between peakcount rates measured by HXRBS and peak flux den-
sities of 9 GHz microwaves for 1980 through 1981.
Although there is quite a lot of scatter, there seems
to be a positive correlation between these quantities.The median value of MRIs is about 1 (0.85 to be pre-
cise). The three straight diagonal lines indicate con-........ '.... of MRI, '_'' I and 4.o_o,,_ vo,u=o ,/'*, The large dots
indicate GRL flares. Note that the HXRBS peak rates
of the GRL flares are > 5000 cts/s (from Bai,
Kiplinger, and Dennis, 1985).
hard X-ray counts rates and peak microwave flux densities
(cf. Kane, 1973), consistent with our understanding that both
hard X-rays and microwaves are produced by energetic elec-
defined the "microwave-richness index" (MRI) for each
flare as follows:
MRI peak flux density of 9 GHz microwaves (sfu)= x 10HXRBS peak count rate (counts/s)
Here the multiplication by 10 is to make the median value
of MR/about 1. The diagonal straight lines in Figure 2.2.16
represent constant values of MR/. The line for MR/= 1
divides the population into roughly equal numbers. As can
be seen from this figure, there is large scatter: MR/variesmore than an order of magnitude (from less than 1/4 to more
than 4). Bai, Kiplinger, Dennis (1985) studied the charac-
teristics of the "microwave-rich flares" (with MRI > 4).
They noticed that among the gamma-ray line flares studied
by Bai and Dennis (1985) gradual gamma-ray line flares ex-
hibit large delays of hard X-rays and large values of MRI.
They studied 17 microwave-rich flares (12 flares in Figure
2.2.16 plus 5 microwave-rich flares observed in 1982), andfound that these flares share many common characteristics.
(1) Large values of MRI (> 4). This was the selection cri-
terion. (2) Long durations of hard X-ray bursts. Microwave
rich flares last several minutes, as opposed to the ordinary
flares that usually last less than 1 minute. (3) Large H-alpha
area. Except for one microwave-rich flare observed at the
limb, all belong to H-alpha importance class 1 or higher,and 13 out of 17 belong to H-alpha class 2 or 3. (4) Long
delay times (> 10s) of high-energy hard X-rays with respect
to low-energy hard X-rays. In a given burst the delay time
increases with hard X-ray energy. Such delays are equiva-
lent to hardening of the X-ray spectrum with time during
the burst (see Figure 2.2.17). (5) Long delay times (10 -
300s) of microwave time profiles with respect to low-energy
hard X-ray time profiles. (6) Flat hard X-ray spectra. The
average of the power-law spectral indices is 3.5. (Compare
with 3.36, which is the value for the gamma-ray line flares
studied by Bai and Dennis (1985)). (7) Association with type
II and IV radio bursts. All of them produced type II or typeIV bursts or both. Seven of the 13 microwave-rich flares have
HXRBS peak count rates between 1000 and 5000 cts/s. Con-
sidering that the largest HXRBS count rates are of the order
of 105 cts/s (Dennis et al., 1983), the above count rates are
moderate. (8) Emission of nuclear gamma-rays. Only six of
the 17 microwave-rich flares produced observable nuclear
gamma-rays, but it is interesting to note that all the
microwave-rich flares which did not produce observable
nuclear gamma-rays have HXRBS peak rates < 4000 cts/s.
None of the gamma-ray line flares observed during 1980
through 1981 have HXRBS peak rates < 4000 cts/s (Bai
and Dennis, 1985). Therefore, the failure to observe nuclear
gamma-rays from the microwave-rich flares with low
HXRBS count rates are most likely to be due to the threshold
effect of GRS. Another interesting point is that the
microwave-rich flares share all the characteristics of gamma-
ray line flares. Detailed discussions on the correlation of
microwave rich flares and gamma-ray line flares, as well
as a possible scenario for their interpretation can be found
in Bai and Dennis (1985).
2.2.5 Decimetric-Metric Observations and
Comparison with X-ray Observations
Previous studies have already shown that type Ill bursts
and soft X-ray increases are often observed several minutes
prior to the occurrence of the flare itself (Kane et al., 1974).
Evidence for hard X-rays observed before the flash phase
was also reported by Kane and Pick (1976). A systematic
study, using more sensitive spectrometers, was carried out
by Benz et al. (1983b); they listed 45 major events observed
by the HXRBS experiment aboard SMM. For most of these
events, metric type III bursts and decimetric pulsation were
2-19

-110 , , ,
'>
,_E 10-2
-S
x 4WaZ
'-' 3-.,I
n-I-o 5iiinc/1
4
1981 May 13
I I I
"-.[ .'.._ n= 5xlO8cm "3
_ IQo. lo • • --
•..,t.'.. im 5 x108cm -3 --3 x109cm -3........ 1 x109cm "3 ---3 xlOlOcm-3/
I I0410 0415 0420 0425
UNIVERSAL TIME
Figure 2.2.17 Spectral evolution of hard X-ray emission from the 1981 May 13 flare. The top panel shows
the hard X-ray flux at 1 O0 keV, and the middle panel shows the observed spectral evolution (with dots) together
with a spectral evolution calculated using a perfect-trap model. In the last panel the spectral evolutions were
obtained by using various values for the ambient density. In order to get a reasonable fit to the data, the am-
bient density should be as low as 5 x 10 e cm -3. However, this density is incompatible with other observa-
tions as mentioned in the text, Tsuneta et al. (1984) found that the images of the hard X-ray source and the
soft X-ray source are almost the same. These authors also deduced from the emission measure and the size
of the soft X-ray source that the density of the flare loop is 3 x 101° cm -z. As the density increases, the
spectral index change will be less and less, approaching the steady state case. For n = 3 x 101° cm-% the
resultant spectral index evolution is hardly different from a straight line, which is for the steady state case.
Before the hard X-ray peak the spectral index is larger than the steady state case and after the peak it is smaller,
but near the peak the spectral index is similar to that of the steady state case independent of the density (from
Bai and Dennis, 1985).
2-20
observed preceding the hard X-ray emission. In 7 of the 45
flares, significant hard X-ray fluxes were observed before
the rapid general exponential increase. This phase in the flare
development was called "preflash phase". It usually lastsfor about one minute. These observations give evidence for
electron acceleration before the impulsive phase (see also
Section 2.2.3.5).
It is commonly believed that electrons responsible for type
III bursts and hard X-ray emission have a common origin
(Kane, 1972, 1981a) since their temporal evolution is well
correlated. Simultaneous observations of X-ray and radioemission with a time resolution of less than 1 sec have shed
new light on our understanding of the electron acceleration
process. The main conclusions can be summarized as fol-
lows: (a) Some hard X-rays peaks are well correlated with
type III bursts and show delays of the order of or shorter
than one second (Kane, Pick and Raoult, 1980; Benz et al.,
1983b). The type 111source may consist of several elementary
components widely separated (by more than 100,000 kms)
which radiates quasi-simultaneously or successively. This im-
plies that the acceleration/injection region covers a wide
range of magnetic fields (Mercier, 1975; Raoult and Pick,
1980). (b) Kane and Raoult (1981) reported an increase in
the starting frequency of type 11I bursts during the develop-
ment of the impulsive phase. This variation is correlated with
an increase in the hard X-ray flux. As the type HI bursts radi-
ation is emitted at the local plasma frequency, the starting
frequency corresponds to the density at the point where theelectron beams become unstable. Thus this fast variation of
the starting frequency may be explained either by a real var-
iation of the electron density in the source (downward shift
or compression of the injection/acceleration site) or to a var-
iation in the distance from the acceleration site, travelled bythe electron beam before it becomes unstable (Kane et al.,
1982). A systematic study was carried out by Raoult et al.(1985) to determine if the presence of an increase in the start-
ing frequency of type 11I bursts influences the probability
of their correlation with hard X-ray bursts. A total of 55 type
III groups were selected which had been observed with the
Nancay Radiospectrograph (Dumas et al., 1982) in the fre-
quency range 450 - 150 MHz, and with the ISEE-3 X-ray
spectrometer. Of the 55 events, 32 cases, (58%) were as-
sociated with X-ray emission. In this sample, 28 events
(52%) showed an increase in the starting frequency. 75 %
of these events were associated with X-ray emission, result-
ing in significant improvement of the correlation. Con-
versely, 75 % of the X-ray associated events show an increase
in the starting frequency. Thus, an increase in starting fre-
quency seems to be a significant factor that improves the as-
sociation between type 111 burst groups and X-ray bursts.
(c) However, Raoult et al. (1985) pointed out that among
these 55 events, 15 events were associated with type V con-
tinuum visible in the frequency range 450 - 150 MHz with
a typical duration of about one minute or less. All these events
have an X-ray response. Thus, the presence of a type V con-
tinuum at frequencies > 150 MHz appears to be a decisive
factor in increasing the correlation between X-rays and typeIU bursts.
Raoult et al. (1985) also suggested that type 11I/V events
have a consistently large X-ray response. Stewart (1978) first
reported that among a list of X-ray associated radio bursts,
80 % contained a type V burst. They performed a detailed
data analysis for meter events which have an X-ray response.
Their main findings are: (a) Pure type 11I bursts groups are
not associated with intense X-ray emission. The hard X-raybursts associated with these events have fluxes < 1 photoncm -2 sec -_ keV -1 at about 30 keV and are not detectable
above 100 keV. The corresponding radio burst source is often
multiple. The X-ray response around 30 keV closely follows
the starting frequency evolution. (b) When a radio event is
associated with strong X-ray emission (> 1 photon cm -2
see -1 keV -1 at 30 keV and detectable above 100 keV), a
continuum emission (type V) in the range 450 - 150 MHz
appears along with the type 11I groups. The typical evolu-
tion of these events is illustrated in Figures 2.2.18 and 2.2.19,
and may be described as follows: The In'st part of the event,
"preflash phase", contains only type 11I (or U) bursts com-
ing from locations (A). Then a new source "B" (see Figure
2.2.19) appears at the time of the fast increase in the X-rayemission. This is also coincident with an increase in the radio
starting frequency. At that time, one of the pre-existing type
III burst sources (A) becomes predominant. Sources B and
A' have similar sizes (2' - 3' arc at 169 MHz), and they
fluctuate simultaneously within short time delays of less than
one second. Thus both sources contribute to the spiky andsmoothed parts of the radio emission identified as type 11I
and type V bursts, respectively. There is an overall correla-
tion between the radio flux and X-ray fluctuations, althoughthere is no correlation on short timescales. When the rapid
radio fluctuations are no longer present, both X-ray and radio
fluxes decrease sharply and the X-ray emission appears at
energies below 30 keV. The total X-ray flux and radio flux
decrease rather smoothly, the source B being usually the
predominant one. The duration of the type V burst increases
with increasing wavelength. Similarly the duration of the
X-ray emission increases with decreasing energy.
The results described above have implications on the ge-
ometry of the magnetic field structure at the site of injection
of electrons. The presence of sources A' and B, which fluc-
tuate quasi-simultaneously, implies that the electrons are
quasi-simultaneously injected into two structures (or two un-
resolved groups of structures). According to Raoult et al.
(1985) most flares that are associated with a small hard X-ray
emission correspond to an electron injection/acceleration site
that covers several diverging magnetic flux tubes. The fact
that during the impulsive increase of the hard X-ray flux,
the radio emission is reinforced in one pre-existing location
and appears quasi-simultaneously in a new location, suggests
2-21

Figure 2.2.18 Typelll/V bursts on 1981July 29, observed with the Nancay Radiospectrograph (Dumas et a/.,
1982) and the associated hard X-ray burst observed with the SMM-HXRBS experiment. Evolution of the X-ray
emission compared to the evolution of the radio event. (From Raoult et al., 1984).
that at the injection site the two magnetic structures inter-
act. At that time the energy that is released in the interac-
tion region increases sharply. Another possible interpretation
was given by Sprangle and Vlahos (1983) and is discussedin Section 2.4.6.
Rust et al. (1980), Benz et al. (1983b), Aschwanden et
al. (1985) and Dennis et al. (1984) have also studied the
correlation of hard X-rays with decimetric radiation, which
originates at lower altitudes. Their results on decimetric type
-7
E
}o
A
>,g
w[._
r"
_aO
4O
2O
600
4OO
200
12:26:20
i
1 Nancay 169 MHzI ,F W
"--. S
4/k_ _ _5 x SMM - HXRBS• _ i4
12:27 Time U T
Figure 2.2.19 Top: Evolution of the radio flux fromsources A, A' (solid line) and B (broken line) see text.
Bottom: Evolution of X-ray spectral index and hard
X-ray emission. (From Raoult etaL, 1984).
III bursts reinforced many of the conclusions reported for
metric bursts. Aschwanden et al. (1985) have found deci-
metric type III bursts to be associated with hard X-ray eventsin 45 % of the cases. The association rate increases with the
number of bursts per group, duration, bandwidth and maxi-
mum frequency of the group. Some single bursts (but not
all) are correlated with hard X-ray spikes. In some cases the
difference in time of maximum between type III and hard
X-rays is a few tenths of a second, which may be signifi-
cant. This may imply that ordinary cross-field drifts or dif-
fusion from closed to open field lines are too slow. The
acceleration of the electrons by intense electromagnetic
waves, as proposed by Sprangle and Vlahos (1983) seems
to be a likely interpretation (see Section 2.4.6 for details).
These bursts occur at frequencies of 300 MHz to > 1 GHz.
corresponding to densities > 3 x 109 cm 3 (Benz et al.,
1983b).
Strong et al. (1984) investigated a double impulsive flare
in radio, soft and hard X-ray emissions. The decimetric radioemission of both events contains U bursts. In several cases
they have harmonic structure. From the total duration and
extent in frequency of the U bursts the geometry of the loop
guiding the electron beam can be calculated. The average
length of these loops is 94,000 km and 157,000 kin, and the
average height 24,000 km and 45,000 km in the two flares
respectively. The U bursts are sometimes correlated in time
with hard X-ray spikes (Figure 2.2.20). If the elongated soft
X-ray source is interpreted as a loop, its projected size is
only 30,000 km. Post-flare soft X-ray loops have been found
in the second flare with footpoints separated by 115,000 kin.
The presence of loops of different sizes is also evident in
the microwave spectrum which shows evidence for 3 peaks
2-22
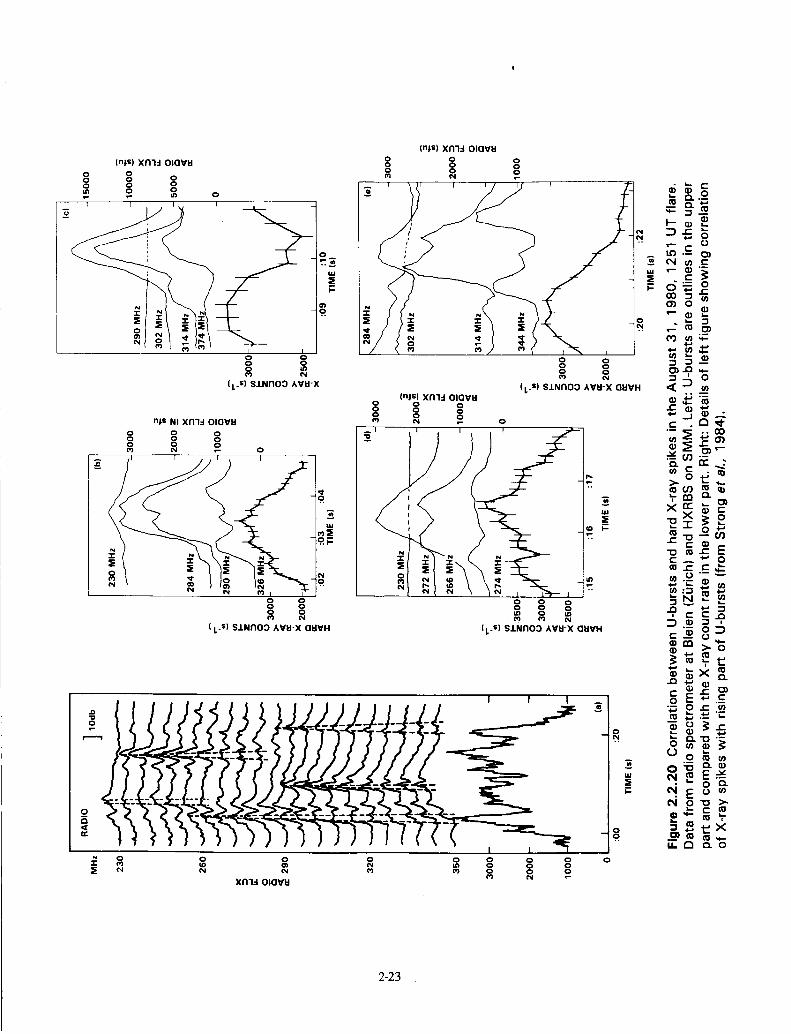
(njs) XNld OIQVkl
o o o(njs) x£n:l 010vu o o o
o o oo o o _ N
(J i i i 1 I_ "_
.__ o.'2."_ .
E
o o o o _-_o o o o 3 "_
(L.S) SJ.NnO:) AVkl-X (L. $1SINRO0 XVkl-X QHVH <:_ m(nls} XN'I-I OlOVkl +-,--""
o o o ._ _"_ _._,o o o
.J_N_xm_01avu o o o o c . C_,_-o o o _l _ i i "-_ "'O_°0o o o _ =_ :_ =,-
E _
o ,, _ _ _.__'- _, " p._
o o o o o "_-_-0 0 0 0 00 0 _D 0
( Ls) S/N_OO XVkl-X OHVH (L -$) SJ.NnOO Avu-x OHVH
_ I -I
,_2., ..... _
I:3_ 0 0 0 0 0 0 0 0
0 0 0_ _ _ m m 0 0 0
t_ tNXN'I:I OIQVH
o
_.'__o_m>_ 6
I
E_ c_o
2-23

indicatingsourceswithwidelydifferentmagneticfieldstrengths.Apparentlyenergeticparticleshaveimmediateac-cesstosmall(softX-ray)loopsandlarge(Uburst,post-flare)loopssuggestingthattheaccelerationsiteisattheboundaryor interfacebetweenthetwoloopsystems.
Thedecimetricemissionofflarescanbedividedintoradi-ationswhichgenerallyoccurduring the impulsive phase and
the type IV emission generally observed after the impulsive
phase. The impulsive phase bursts are found to vary con-
siderably in shape (Wiehl et al., 1985). A large fraction can
be interpreted as due to type HI-like beam instabilities. The
bursts may have some unexpected forms, however, such as
narrow bandwidth (Ap/v <__0.2), called blips by Benz et al.
(1983a) or very high drift velocities (an example is shown
in Figure 2.2.21). These deviations from the normal shape
are probably caused by the disturbed properties of the am-bient plasma.
,z 20o,.
_: _ 500IJ.
oz- 800
0539 0541TIME IN UT
Figure 2.2.21 Top: Dynamic spectrogram of type Ill-
like decimetric emission with very high drift rate, ob-
served on May 19, 1980 with the analog spec-trometer at Bleien (Z_Jrich). Enhanced emission is
bright, horizontal lines are terrestrial interference, and
vertical lines are minute marks. Bottom: Hard X-ray
count rate as observed at energies > 30 key byHXRBS on SSM.
All decimetric bursts during the impulsive phase do notappear to be explained by particle beams. About 25 % of all
cases are in this category and they are strongly associatedwith hard X-rays (70 %). These bursts have been divided into
4 classes by Wiehl et al. (1985). 1) Diffuse patches of emis-
sion probably originate from trapped particles either by syn-
chrotron or loss-cone radiation. 2) Grass-like chains of small
spikes resemble elements of metric type II bursts. They may
be caused by shock waves. 3) Nonperiodic broadband pul-
sations with pre-fiash hard X-ray emission. The decimetric
emission in these cases precedes both hard X-ray and Hot
emission, as shown by Benz et al. (1983b) from a study of
3 flares. However, a more general study of 45 such events
(Aschwanden et al., 1985) has shown that pulsations usu-
ally start after the hard X-rays and end before them. Most
important, pulsations and hard X-rays do not seem to corre-
late closely. Durations of single elements are between 20 and
100 ms. The elements are of similar bandwidth (several 100
MHz) and have about the same low-frequency end. 4) Spikes
of short (< 100 ms), narrowbanded (3-10 MHz) emission
occur in large groups. They are associated with shorter and
more impulsive hard X-ray bursts than the average. Theytend to occur in the early impulsive phase (Benz, 1985). The
single elements are scattered in a chaotic manner between
- 400 and > 1000 MHz (corresponding to densities of 0.3
- 1 x 101° cm-3). Their circular polarization can be be-tween 25 - 40%. They probably are similar to the micro-
wave spikes observed at 2.6 GHz by Slottje (1978), probably
also produced by the electron cyclotron masering.
2.2.6. Discussion of Models for X-ray andMicrowave Emission
Information about the accelerated electrons are obtained
through models which depend on parameters such as local
ambient density, temperature and magnetic field which are
poorly known. Three major problems face us in our interpre-tation of the observations:
-- what is the relative role of thermal and nonthermal elec-
trons in producing X-rays at different energies?
-- does nonthermal production of hard X-rays arise from
beams of electrons (thick-target model) or from a trapped
population of electrons or from a combination of both.
-- do the observations imply a single or a two step acceler-
ation process?
We discuss below several attempts to model the energy
release and answer some of the questions posed above.
2.2.6.1 Trap Plus Precipitation vs Two StepAcceleration Models
The two competing interpretations of the energy-
dependent hard X-rays are trap plus precipitation models
(Kane, 1974; Melrose and Brown, 1976; Bai and Ramaty,
1979; Vilmer et al., 1982; MacKinnon et al., 1983; Ryan,
1985) and second-step acceleration models (Bai and Ramaty,1979; Bai, 1982; Bai et al., 1983a, 1983b; Bai and Dennis,
1985). Interestingly, the first paper that analyzed hard X-ray
delays (Bai and Ramaty, 1979) invoked both interpretations,
the trap model for small delays below 150 keV, and second-
step acceleration for large delays (15 s) above 150 keV. Bai
and Ramaty (1979) and Vilmer et al. (1982) used a pure trap
2-24

model,andMacKinnon et al. (1983), Trottet and Vilmer
(1983), and Ryan (1985) considered the effect of precipita-
tion. MacKinnon et al. (1983) reported that, in the weak
diffusion limit, precipitation does not change the essential
nature of the trap model. A detailed discussion of trap models
is given later in this Section.
We emphasize first that the second-step acceleration isdifferent from the conventional "second-phase" accelera-
tion proposed by Wild, Smerd and Weiss (1963), since the
delay between the two steps is tens seconds and not tens ofminutes.
Bai and Dennis (1985), who have studied many flares ex-
hibiting hard X-ray delays, note the following points favor-
ing the second-step acceleration interpretation. (1) In
impulsive flares which exhibit hard X-ray delays, the delaytime as a function of hard X-ray energy is quite different
from what is expected from the collisional trap plus precipi-
tation models. Instead of increasing gradually with energy,
the delay time exhibits a sudden increase at high energies.
(2) In very gradual flares such as the ones observed on
April 26 and May 13, 1981, the ambient density deduced
with the trap model is of the order of 109 cm -3 (see Figure2.2.17). This is too low to explain the observed emission
measure of soft X-rays (assuming of course, that the hard
and soft X-ray emitting regions are coincident). Actually,
the density deduced for the May 13 flare from the observedemission measure and volume is 3 × 101° cm -3 (Tsuneta
et al., 1984a). The above argument does not exclude the pos-
sibility of trapping of energetic electrons in a huge loop, (this
was proposed by Tsuneta et al., 1984a), but it proves that
trapping is not the primary cause of large hard X-ray delays
(or spectral flattening with time) observed in these gradualflares. (3) The association between hard X-ray delay and pro-
ton acceleration (see Section 2.3), is naturally explained by
the second-step acceleration model. In Fermi type accelera-tion, stochastic acceleration by a fluctuating magnetic field,
or shock acceleration, there exist threshold energies (or in-i_c, tlnn _ner¢i_'_ for both _l_c_trcm_ and nrnton,_ above which
d ............ _---z ..................... 1- ..........
the acceleration can overcome the Coulomb energy loss (e.g.,
Ginzburg and Syrovatskii, 1964; Sturrock, 1974; Ramaty,1979). Therefore, when these kinds of acceleration mecha-
nism accelerate protons to gamma-ray producing energies,
they will also accelerate electrons with energies greater than
the injection energy to higher energies. On the other hand,
in trap models it is hard to see the connection between pro-
ton acceleration and trap electrons. (4) The total bremsstrah-
lung fluence above 270 keV is roughly proportional to the
4-8 MeV fluence (see Chupp 1982 and Figure 2.3.4). Onthe other hand, when the 4-8 MeV fluence is compared with
the hard X-ray fluence above 30 keV, the correlation is very
poor (Bai and Dennis, 1985). Actually many flares with large
fluences in > 30 keV hard X-rays did not produce observ-able nuclear ganuna-rays. With the second-step acceleration,
this is easily explained. In the second-step acceleration model,
both high energy electrons and gamma-ray producing pro-tons are accelerated by the second step, hence we expect a
good correlation between hard X-rays > 270 keV and 4-8
MeV fluences. On the other hand, the fluence of low-energy
hard X-rays (> 30 keV), which is due to electrons acceler-
ated by the first-step mechanism, is not expected to corre-
late well with the gamma-ray fluence, which is due to the
second-step mechanism. (5) In trap models the photon spec-
trum is somewhat steeper at the beginning of the burst than
in a thick-target beam model, and it gradually flattens to beabout the same as the thick-target model near the peak. On
the other hand, if the second-step acceleration is operating,
the photon spectrum at the peak of the burst is expected tobe flatter because of additional acceleration at high energies.
Consistent with the second-step model, the photon spectrum
measured at the peak of the burst is flatter on the average
for gamma-ray line flares than for non-gamma-ray line flares,
which do not in general show hard X-ray delays. The site
of the second-step acceleration is proposed to be the corona
instead of the chromosphere (Bai and Ramaty, 1979; Bai et
al., 1983b); therefore, in this model at least, high energy
electrons are assumed to be trapped in the corona. Hence,
it is possible that in many flares hard X-ray delay is partly
due to trapping and partly due to the second-step accelera-
tion, as proposed by Bai and Ramaty (1979). It is usuallydifficult to determine their relative importance unless we
know the ambient density of the flare loop (trap region). For
the May 13, 1981 flare the ambient density is deduced tobe 3 × 101° cm -3 (Tsuneta et al., 1984), and for this den-
sity the hard X-ray delay is much smaller than the observed
one. For the gradual flare of April 26, 1981, the same is
true (Bai, Kiplinger and Dennis, 1985).
Let us now summarize the recent progress made on
models that invoke trap and precipitation. Vilmer et al.
(1982) applied the trap model to explain observations of high-energy X-ray delays, and McKinnon et al. (1983) considered
the effect of precipitation on the trap model. Trottet and
Vilmer (1983) have also studied the case where the precipi-
tation from the trap is in the strong diffusion limit (e.g.,
wave-particle interaction). The basic ingredients of the model
are: (1) a trap of uniform density no, (2) a continuous in-
jection of nonthermal electrons in the trap, with constant
spectral index 7, during a finite time to, (3) a time dependent
injection function having a maximum at to/2, (4) energylosses entirely due to electron-electron collisions, (5) precipi-
tation from the trap gives rise to a thick target component,either in the weak diffusion limit (Coulomb collisions) or
in the strong diffusion limit (wave-particle interaction). The
computed X-ray time profiles depend then on to, no and the
precipitation process considered. In the weak diffusion limit,
although hard X-ray emission starts simultaneously at all
energies, the higher energy channels reach their maxima later
than the lower ones. For given to and 3' such delays are a
function of no, Figure 2.2.22a shows that At(E) = tmax
2-25
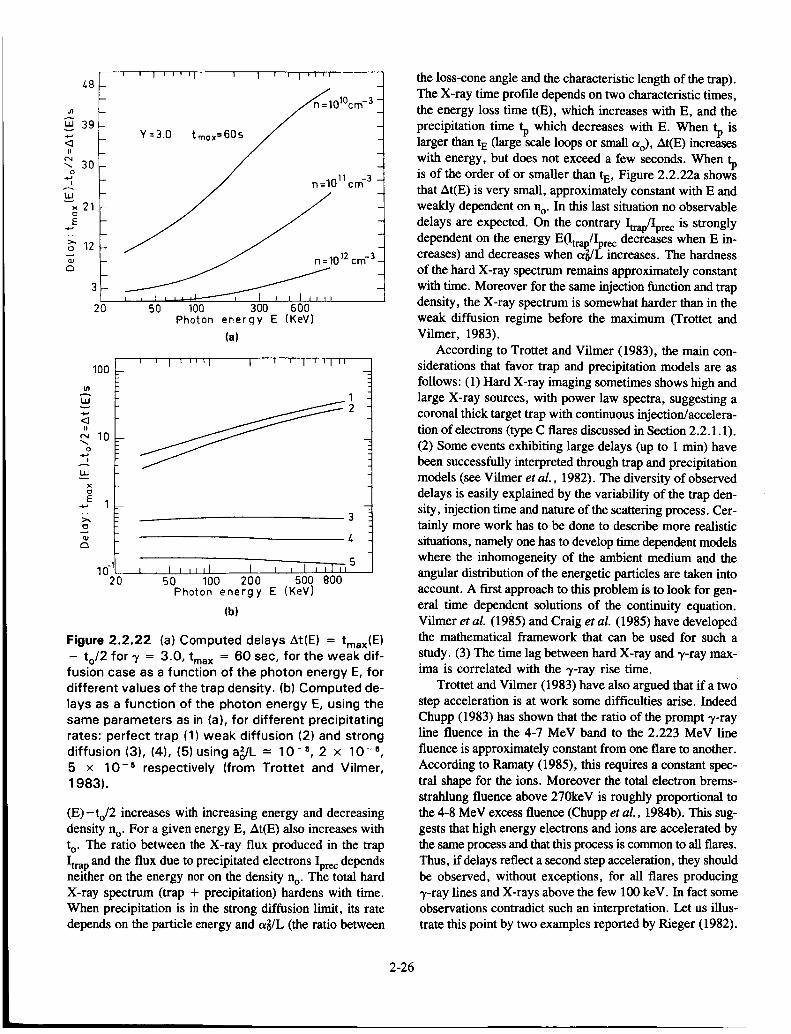
48
ql
39
II
i
I,I
,,21
r ¸
3 --
20
' ' I i ' ' =1 i I i i I i i ,I
//_1010cm- 3 -
Y=3.0 tmax=6/
n:1011cm-3 -
012crn-3
r _ I I ' ,, , I I , I il t,50 100 300 600
Photon energy E (KeV)
(a)
lOO
LU
II
10
.,.,oI
A
Lit
E.,., 1
C3
102O
' ' I _ ;' ;I I n u I I il "
= = I , ,,,I I i k I _"-T'-TI_,,550 100 200 500 800
Photon energy E (KeV)
(b)
Figure 2.2.22 (a) Computed delays At(E) = tmax(E)
- to/2 for 3' = 3.0, tmax = 60 sec, for the weak dif-fusion case as a function of the photon energy E, for
different values of the trap density. (b) Computed de-
lays as a function of the photon energy E, using the
same parameters as in (a), for different precipitating
rates: perfect trap (1) weak diffusion (2) and strong
diffusion (3), (4), (5) using a_)/L = 10 -s, 2 x 10 -5,5 x 10 -5 respectively (from Trottet and Vilmer,1983).
(E)-to/2 increases with increasing energy and decreasing
density no. For a given energy E, At(E) also increases with
to . The ratio between the X-ray flux produced in the trap
Itrap and the flux due to precipitated electrons Iprec dependsneither on the energy nor on the density no . The total hardX-ray spectrum (trap + precipitation) hardens with time.
When precipitation is in the strong diffusion limit, its rate
depends on the particle energy and u_/L (the ratio between
the loss-cone angle and the characteristic length of the trap).
The X-ray time profde depends on two characteristic times,
the energy loss time t(E), which increases with E, and the
precipitation time tp which decreases with E. When _ islarger than tE (large scale loops or small Oto), At(E) increases
with energy, but does not exceed a few seconds. Whenis of the order of or smaller than tE, Figure 2.2.22a showsthat At(E) is very small, approximately constant with E and
weakly dependent on no . In this last situation no observable
delays are expected. On the contrary Itrap/Iprec is strongly
dependent on the energy E(Itrap/Ipree decreases when E in-creases) and decreases when c_/L increases. The hardness
of the hard X-ray spectrum remains approximately constant
with time. Moreover for the same injection function and trapdensity, the X-ray spectrum is somewhat harder than in the
weak diffusion regime before the maximum (Trottet and
Vilmer, 1983).
According to Trottet and Vilmer (1983), the main con-
siderations that favor trap and precipitation models are as
follows: (1) Hard X-ray imaging sometimes shows high and
large X-ray sources, with power law spectra, suggesting a
coronal thick target trap with continuous injection/accelera-
tion of electrons (type C flares discussed in Section 2.2.1.1).
(2) Some events exhibiting large delays (up to 1 min) have
been successfully interpreted through trap and precipitation
models (see Vilmer et al., 1982). The diversity of observed
delays is easily explained by the variability of the trap den-
sity, injection time and nature of the scattering process. Cer-tainly more work has to be done to describe more realistic
situations, namely one has to develop time dependent modelswhere the inhomogeneity of the ambient medium and the
angular distribution of the energetic particles are taken into
account. A first approach to this problem is to look for gen-
eral time dependent solutions of the continuity equation.
Vilmer et al. (1985) and Craig et al. (1985) have developedthe mathematical framework that can be used for such a
study. (3) The time lag between hard X-ray and 3,-ray max-
ima is correlated with the 3,-ray rise time.
Trottet and Vilmer (1983) have also argued that if a two
step acceleration is at work some difficulties arise. Indeed
Chupp (1983) has shown that the ratio of the prompt 3,-rayline fluence in the 4-7 MeV band to the 2.223 MeV line
fluence is approximately constant from one flare to another.
According to Ramaty (1985), this requires a constant spec-
tral shape for the ions. Moreover the total electron brems-
strahlung fluence above 270keV is roughly proportional to
the 4-8 MeV excess fluence (Chupp et al., 1984b). This sug-
gests that high energy electrons and ions are accelerated by
the same process and that this process is common to all flares.
Thus, if delays reflect a second step acceleration, they should
be observed, without exceptions, for all flares producing
3,-ray lines and X-rays above the few 100 keV. In fact some
observations contradict such an interpretation. Let us illus-
trate this point by two examples reported by Rieger (1982).
2-26

First,reversedelaysbetweenX-ray and "r-rays are clearly
observed for the October 14, 1981 flare (4-7 MeV and 10-25
MeV channels peak before the 80-140 keV and 300 keV
channels). Second, the June 21, 1980 flare exhibits variable
delays from one peak to another, the first peaks occurring
even simultaneously in all channels. In summary Trottet and
Vilmer argued that even if a two step acceleration processcannot be definitively ruled out, available observations of
time delays may reflect the interaction between the acceler-
ated particles and the ambient medium rather than the charac-teristics of the acceleration mechanism itself•
Ryan (1985) also considered independently the effects of
particle trapping on the time profiles of hard X-rays and
'r-rays. His results reinforce the work reported above. Ryan
used three different models. The first is that of a closed trap
with a finite density of matter within the trap providing the
slowing down mechanism for the particles and the particle
target for photon production. The two other models employ
particle diffusion in a tenuous trap to allow particles to
precipitate to denser regions of the solar atmosphere where
they interact to produce the photons. The characteristics of
all of these models are (1) to reduce the impulsiveness of
the acceleration as it is seen in the high energy photons and
(2) to produce delays in the maxima of the photon fluxes at
various energies. These effects must be taken into account
in searching for evidence of additional acceleration mecha-
nisms. The constant density coronal trap which has been con-
sidered in the past for electrons below 200 keV can producesignificant delays for electrons of energies > 0.5 MeV and
larger effects still for 3,-rays produced by - 20 MeV pro-
tons. Particle densities of 101° cm -s can produce delays in
the "r-rays of several tens of seconds. If particles are injected
impulsively at one point in the loop, they diffuse toward both
ends of the trap precipitating to the loss regions of high den-
sity. With this process, there is an intrinsic delay in the
precipitation rate and thus the photon flux due to the finite
time required for the particles to diffuse to both ends of the
!oep ,Tb.erise _ud decay tLme_ ,,r,hi_ p ......... 1_..... r_
tional to the size of the trap. It should also be noted that the
particle propagation effects in the observed photon flux for
the constant density trap is also a function of the size of the
trap. The study by Rosner et al. (1978) shows that the mat-
ter density in coronal non-flaring loops is inversely correlated
with the length of the loop. Thus we have the situation where
three mutually exclusive particle trap scenarios produce a
reduced impulsiveness in the photon flux with respect to the
particle acceleration or injection and the convolution of these
effects with the acceleration profile produces a delay in the
flux maxima with respect to the acceleration profile. In ad-
dition, the magnitude of these effects grow with the linear
dimensions of the loop. The implications of this are that they
complicate the search for and identification of a multi-step
acceleration process and they limit the search for rapid fluc-
tuations in photon flux, which is a signature or measure of
the rapidity of the acceleration process.
2.2.6.2 Dissipative Thermal Model
We have emphasized in this section that heating and ac-
celeration of the plasma tail occurs nearly simultaneously
in flares. This poses a fundamental problem: How does the
flare-energized (hot + tail) plasma expand along the field
lines? Since the plasma outside the energy release region is
at coronal temperatures (several million degrees Kelvin), the
energized plasma interfaces with a "cold" ambient plasma.
The steep temperature and/or density gradients accompany-ing the rapid energization may give rise to D.C. and stochas-
tic electric fields which contain most of the electrons, butallow the fastest electrons in the tail of the distribution to
escape. Brown, Melrose and Spicer (1979) suggested (fol-
lowing similar work by Manheimer (1977) in the pellet fusion
plasma) that a return current, driven by the electrostatic
potential at the interface, will set in and most probably will
grow unstable, limiting the heat flux. This suggestion was
followed by two extreme approaches: (1) Ignore the escap-
ing electrons and use a fluid model to simulate the expan-
sion of the hot plasma (see e.g., Smith and Harmony 1982
and references therein). (2) Describe qualitatively the hot
plasma and concentrate on the escaping electrons (Vlahos
and Papadopoulos, 1979 and Emslie and Vlahos, 1980). In
the latter work it was also assumed that inside the energy
release volume the tail was continuously replenished by sub-
Dreicer electric fields• In reality both approaches were of
a limited scope. The real problem is somewhere in between
and we have to simulate the plasma below a critical velocity
(which is not known) as a fluid and as particles above it.
In other words, the need for a multifluid or Vlasov type simu-
lation is obvious. Such simulation is currently possible. It
is worth mentioning that several qualitative suggestions,
based on the dissipative thermal model, appeared in the last
few years.
Brown et al. (1980) suggested that the energy release
volume in a flaring loop may consist of many hot sourceswith !ifeti_m__e._and ._izes below the instrumental resolution.
The overall hard X-ray burst emission is made up of a "con-
volution" of these "multiple kernels". They investigated the
effective (time-integrated) spectrum of hard X-rays from one
such kernel, and showed that the majority of observed spec-
tra could be explained by invoking a spread in the parameters
characterizing the kernels. The hardest spectra are not,
however, amenable to such an intepretation.
Smith (1985) suggested the following scenario for solar
hard X-ray bursts which may explain the evolution of typeB flares (cf. 2.2.1.1). At the beginning of the impulsive
phase, we often see brightening of footpoints which indicates
that a significant fraction of the energy released is going intoaccelerated electrons. This could occur due to fast tearing
modes in a loop leading to electron acceleration via the modi-
fied two-stream instability (see Section 2.4). After these elec-
trons evaporate a sufficient amount of chromospheric plasma,
which then travels back up the loop, the electron plasma beta,
2-27

/3e, rises sufficiently to cut off the modified two-stream in-stability and the footpoint behavior ceases. The emission is
then dominated by the primarily thermal single source near
the top of the loop. There may still be some small regions
in the loop where/3 e is sufficiently small to allow accelera-
tion of electrons required by the microwave emission.
Holman, Kundu, and Papadopoulos (1982) have shown
that streaming suprathermal electrons will be isotropized by
self-generated electrostatic waves (the "anomalous doppler
resonance" instability) if the electron gyrofrequency (fie) ex-
ceeds the plasma frequency (We) somewhere along the loop,
and if the minimum velocity in the suprathermal electron dis-tribution is well above the mean thermal electron velocity
in the ambient plasma. The first condition (fie > We) may
hold in most flare loops, and the second condition will hold
as long as the accelerated electron distribution does not ex-tend down to the thermal distribution, or if the accelerated
electrons escape into a cooler plasma. Holman, Kundu andPapadopoulos also show that if the suprathermal electrons
are also responsible for the observed hard X-ray emission,
the scattering of the particles can also lead to breaks in the
hard X-ray spectrum. These breaks result from wave damp-
ing preventing all of the suprathermal electrons from being
scattered. An important conclusion is that the microwavesource structure does not necessarily indicate the location
of the particle acceleration region. Similar conclusions can
be reached from considerations of the loop geometry and the
directivity of gyrosynchrotron emission (see Petrosian 1982).
Zaitsev and Stepanov (1983) showed that intense local-
ized heating inside the energy release region may violate lo-
cally the condition that the plasma pressure is lower than the
magnetic pressure, which in the past had permitted some nu-
merical calculations of one-dimensional fluid models (e.g.,
Smith and Lilliequist, 1979). As a result, the magnetic field
expands locally and setup a local magnetic trap, and B_/87r >
nkT e and the magnetic field compresses the plasma again.This cycle repeats and sets in an oscillatory motion. Zaitsev's
and Stepanov's results may explain the periodic pulsations
observed in hard X-ray and microwave bursts.
Batchelor et al. (1985) made a new analysis of the ther-
mal flare model proposed by Brown, Melrose and Spicer
(1979). They assumed that the model leads to the develop-
ment of a quasi-Maxwellian electron distribution that explains
both the impulsive hard X-rays and microwaves as opposed
to our previous interpretation that allows a significant num-
ber of nonthermal electrons to escape from the thermal
source. This implies that (a) the part of the microwave spec-
trum for which f < fmax consists of optically thick emis-
, sion, so the source area, Ao, can be calculated from the
Rayleigh-Jeans law, and (b) the plasma temperature can be
measured from the hard X-ray spectrum by determining thebest fit to a single-temperature thermal bremsstrahlung func-
tion. Using (a) and (b), Batchelor et al. (1984) calculated
A o at the time of maximum hard X-ray flux. Assuming that
the source was an arch, they estimated its half-length L o =Ao'_ The theoretical time scale of the burst would then be
r o = Lo/cs, where c s = (kTe/mp)V2 is the ion-sound speed,the speed of expansion of the source during the initial rise
of impulsive emission. To test the prediction of the model,Batchelor et al. (1985) analyzed microwave observations
made at the Bern Radio Observatory and hard X-ray observa-
tions obtained with the SMM-HXRBS experiment. The
results are shown in Figure 2.2.23, which is a plot of log
tr vs log zo, where tr is the measured rise time of the hard
X-ray emission and r o is computed from independent spec-
tral parameters only. For 17 disk flares, the best fit relation-
ship is found to be tr = 0.51%1.5, which is within the
statistical uncertainties of the predicted relationship, t rzo. Three limb flares lie to the left of the disk flares on the
diagram, consistent with the interpretation that they were par-
tially occulted by the solar limb, which would result in
reduced values of L o and % as observed. This result is in
good agreement with the model, and is not explained by anyother known flare models which have been considered. The
main problem with Batchelor et al. model, however, is that
the behavior of the energetic electrons was not properly con-sidered.
2.2.7 Summary
We shall now return to the questions which we have posed
in the introduction and which have guided our discussions
during the workshops:
I I I I F I[ I I I I I I I1 I I I I
/
,4,
,,,- 4///,_ 10 n /
7- /1 ol /t/l
iii
, ///-.ILl
1 • DISK FLARES
[] LIMB FLARES
I I I I I i I i I I I I I Iii I I I I
1 lOTHEORETICAL TIMESCALE (s)
Figure 2.2.23 Correlation diagram of t o and r o. Solidlines indicate best fits by linear least-squares fitting.
Dashed lines are boundaries of the expected positions
of disk points if the sources are arches from 2 to 4
times as long as they are thick (from Batchelor et
al., 1985).
2-28
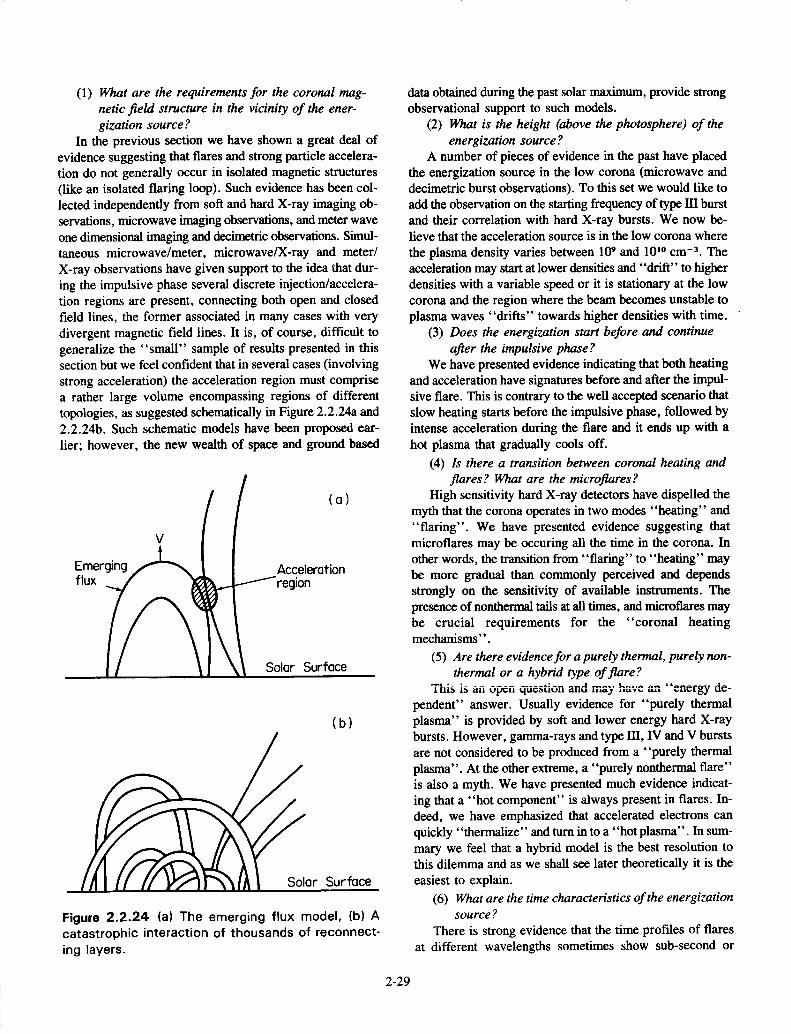
(1) What are the requirements for the coronal mag-
netic field structure in the vicinity of the ener-
gization source ?
In the previous section we have shown a great deal of
evidence suggesting that flares and strong particle accelera-
tion do not generally occur in isolated magnetic structures
(like an isolated flaring loop). Such evidence has been col-
lected independently from soft and hard X-ray imaging ob-
servations, microwave imaging observations, and meter wave
one dimensional imaging and decimetric observations. Simul-
taneous microwave/meter, microwave/X-ray and meter/
X-ray observations have given support to the idea that dur-
ing the impulsive phase several discrete injection/accelera-
tion regions are present, connecting both open and closed
field lines, the former associated in many cases with very
divergent magnetic field lines. It is, of course, difficult to
generalize the "small" sample of results presented in thissection but we feel confident that in several cases (involving
strong acceleration) the acceleration region must comprise
a rather large volume encompassing regions of different
topologies, as suggested schematically in Figure 2.2.24a and2.2.24b. Such schematic models have been proposed ear-
lier; however, the new wealth of space and ground based
(a)
V
Emerging
flux _7__
Acceleration/region
Solar Surface
(b)
_t rSurface
Figure 2.2.24 (a) The emerging flux model, (b) Acatastrophic interaction of thousands of reconnect-
ing layers.
data obtained during the past solar maximum, provide strong
observational support to such models.
(2) What is the height (above the photosphere) of the
energization source?
A number of pieces of evidence in the past have placed
the energization source in the low corona (microwave anddecimetric burst observations). To this set we would like to
add the observation on the starting frequency of type Ill burst
and their correlation with hard X-ray bursts. We now be-lieve that the acceleration source is in the low corona where
the plasma density varies between 109 and 101° cm -3. The
acceleration may start at lower densities and" drift" to higherdensities with a variable speed or it is stationary at the low
corona and the region where the beam becomes unstable to
plasma waves "drifts" towards higher densities with time.
(3) Does the energization start before and continue
after the impulsive phase ?
We have presented evidence indicating that both heating
and acceleration have signatures before and after the impul-
sive flare. This is contrary to the well accepted scenario that
slow heating starts before the impulsive phase, followed by
intense acceleration during the flare and it ends up with a
hot plasma that gradually cools off.
(4) Is there a transition between coronal heating and
flares ? What are the microflares ?
High sensitivity hard X-ray detectors have dispelled the
myth that the corona operates in two modes "heating" and
"flaring". We have presented evidence suggesting that
microflares may be occuring all the time in the corona. In
other words, the transition from "flaring" to "heating" may
be more gradual than commonly perceived and depends
strongly on the sensitivity of available instruments. The
presence of nonthermal tails at all times, and microflares may
be crucial requirements for the "coronal heatingmechanisms".
(5) Are there evidence for a purely thermal, purely non-
thermal or a hybrid type of flare?
lIll_; 1_ ;'Ill U_'_II qLII_3LIUII ¢iJtlU ltwff II¢_LI_.4 ¢,aata w==_=_J _
pendent" answer. Usually evidence for "purely thermal
plasma" is provided by soft and lower energy hard X-ray
bursts. However, gamma-rays and type HI, IV and V burstsare not considered to be produced from a "purely thermal
plasma". At the other extreme, a "purely nonthermal flare"
is also a myth. We have presented much evidence indicat-
ing that a "hot component" is always present in flares. In-deed, we have emphasized that accelerated electrons can
quickly "thermalize" and turn in to a "hot plasma". In sum-
mary we feel that a hybrid model is the best resolution tothis dilemma and as we shall see later theoretically it is the
easiest to explain.
(6) What are the time characteristics of the energizationsource ?
There is strong evidence that the time profiles of flares
at different wavelengths sometimes show sub-second or
2-29

evenmilli-secondpulses.Inseveralcasesthepulsesrepeatatregular or quasi-regular intervals. The brightness temper-
ature for each of these pulses is sometimes so high that a
coherent emission mechanism must be invoked. Delays be-
tween microwave and hard X-ray pulses have also been
reported. We believe that these fast pulses are evidence of
"micro-injection" similar to the ones discussed earlier and
a "flare" is composed of many micro-releases of energy.
The understanding of such fast pulsation is still relatively
poor.
(7) Is there any observational evidence for a two step ac-celeration mechanism ?
A few key observations have guided our past thinking
on particle acceleration in flares. One of them was the event
analyzed by Frost and Dennis (1971). In this event, the im-
pulsive phase was followed by a type II burst, which im-
plies the presence of a shock, coinciding with the
enhancement of relativistic particles. Thus the conclusion was
drawn that during the impulsive phase (or first phase from
the point of view acceleration) mildly relativistic electrons
where accelerated. This phase was followed several minutes
later by a second phase which coincided with the formationof a shock that further accelerated ions and relativistic elec-
trons. During the SMM workshops no evidence was pre-
sented for such delays (of the order of tens of minutes)
between the acceleration of mildly relativistic and relativis-
tic electrons and ions. The delays between pulses in differ-
ent energy channels are of the order of seconds (10-50 secs).
Thus, we must refer to the two phase acceleration rather as
a "two step acceleration" (Bai and Ramaty, 1979) (two ac-
celeration mechanisms operating in close proximity, with one
being delayed from the other by 10-50 seconds). A novel
suggestion was also made during the workshop, namely that
we must search for one acceleration mechanism for parti-
cles of all energies and one possibly for heating. Such a
mechanism must result in no delays for the acceleration of
particles to higher energies. But then the question may be
asked: How does one create delays out of a synchronous ac-
celeration mechanism? The answer is by using a trapping
and precipitation model. The debate between these two ap-
proaches was not resolved during the workshops and the
arguments are presented in Section 2.2.6.
2.3 PHENOMENA ASSOCIATED WITH
IONS AND RELATIVISTIC
ELECTRONS IN SOLAR FLARES
Evidence for the acceleration of ions and relativistic elec-
trons in solar flares is obtained primarily from gamma-ray
line and continuum emissions and from neutron and charged-
particle observations. Gamma-ray lines and neutrons result
from nuclear interactions of accelerated protons and heav-
ier ions with the ambient solar atmosphere, while gamma-
ray continuum is due to electron bremsstrahlung and the
superposition of broad and unresolved narrow gamma-raylines.
In this section we present the gamma-ray and neutron ob-
servations and their implications and discuss the charged par-
ticle observations. We also examine the relationship between
the acceleration of ions and other flare phenomena.
2.3.1 Gamma-Ray Observations
Gamma-ray lines and continuum have been observed
from many flares. The first observations, carried out by de-
tectors on OSO-7 (Chupp et al., 1973), were followed by
observations on HEAO-1 (Hudson et al., 1980), HEAO-3
(Prince et al., 1982), SMM (Chupp et al., 1981) and
HINOTORI (Yoshimori et al., 1983). The gamma-ray spec-
trometer (GRS) on SMM, in particular, has provided a broadbase of data (e.g., Chupp 1984) which forms the basis of
much of the discussion in this Section. In addition, the hard
X-ray burst spectrometer (HXRBS) on SMM has provided
important data regarding the temporal and spectral behavior
of the X-ray continuum below - 0.3 MeV. We consider the
spectra of the observed gamma rays, the timing of the fluxes
in the various photon energy bands and the correlation of
the gamma-ray data with other flare manifestations.
2.3.1.1 Gamma-ray Spectra
An example of a gamma-ray spectrum, observed by GRS
from the April 27, 1981 limb flare, is given in Figure 2.3.1.
Here the distribution of the net detector counts (the differ-
ence between source and background counts) is shown as
a function of photon energy deposited in the detector, for
energies > 0.27 MeV, the GRS detection threshold. As can
be seen, this spectrum is a superposition of continuum emis-
sion, most likely due to electron bremsstrahlung, and nar-
row and broad lines resulting from ion interactions. The
narrow lines are due to proton and alpha-particle interactions
with the ambient medium, while the broad lines are from
the interactions of accelerated heavy particles with ambient
H and He. As indicated, the strongest narrow lines are at6.13 MeV from 160, at 4.44 MeV from _2C, at 2.31 MeV
from t4N, at 2.223 MeV from neutron capture on hydro-
gen, at 1.634 MeV from Z°Ne, at 1.37 MeV from 24Mg, at0.85 MeV from 56Fe and at 0.51 MeV from positron an-
nihilation. The 2.223 MeV line, normally very strong for
disk flares, is greatly suppressed in limb flares (Wang and
Ramaty, 1974). Theoretical nuclear gamma-ray line spec-tra were calculated earlier by Ramaty, Kozlovsky and
Lingenfelter (1979).Because the contribution of the nuclear lines to the total
emission below - 1 MeV is quite small, this component can
be separated from the bremsstrahlung by fitting a power-law
photon spectrum to the data below 1 MeV and then subtract-
ing this power law from the data at higher energies.
However, this technique can only approximate the nuclear
2-30

ZZ<.wtO
)-Z
O(J
APRIL 27, 1981
0.10+05 [ ;
• 0.511
0.10+04
0.10+03
0.10+02
0.10+01
50.00 150.00 250.00 350.00 450.
CHANNEL
Figure 2.3.1 Observed GRS count spectrum of the
April 27, 1981 flare. The solid curve is an estimate
of the contribution of electron bremsstrahlung.
contribution, since forms other than power laws could alsobe fit to the data < 1 MeV. Nevertheless, the fact that the
excess radiation can indeed be attributed to nuclear lines is
supported by the structure of the spectrum, which shows
peaks at anticipated line energies, and by the vanishing ofthe excess above - 7.5 MeV, a feature characteristic of a
spectrum dominated by nuclear lines. Also, the good corre-
lation (Chupp 1982) of the excess fluence (time-integrated
flux) in the 4-8 MeV band with the 2.223 MeV line fluence
for several flares provides additional support for the nuclear
origin of the 4-8 MeV excess. The 2.223 MeV line from
solar flares is a signature of neutrons produced in nuclearreactions of flare-accelerated ions. That the gamma-ray emis-
sion from solar flares in the 4-8 MeV region is predominantly
nuclear was first pointed out by Ramaty, Kozlovsky and Suri
(1977) and Ibragimov and Kocharov (1977).
2.3.1.2 Time Dependences and Correlations withOther Flare Phenomena
Observations of the time dependences of the gamma-ray
fluxes from solar flares provide a great deal of information
on the acceleration and interaction of the energetic particles.
These time dependences are determined by the temporal
structure of the acceleration process, by the lag, due to prop-
agation and trapping, between the acceleration and the in-teraction of the particles, and by the delay between the
interaction of the particles and the emission of photons. Sig-
nificant delays are caused by the finite capture time of the
neutrons in the photosphere for the 2.223 MeV line (Wang
and Ramaty, 1974) and both by the finite lifetimes of the
various positron emitting nuclei and the slowing-down times
of the positrons for the 0.511 MeV line (e.g., Ramaty et al.,
1983a). However, for the June 21, 1980 flare, the time pro-
file of the 0.511 MeV line was analyzed in detail (Murphy
and Ramaty, 1985), and it was found to depend predomi-
nantly on the delayed decay of the positron emitters. This
implies a very short (< 10 sec) slowing-down and annihila-tion time.
On the other hand, bremsstrahlung and most nuclear line
emissions are produced essentially instantaneously at the time
of the interaction of the particles and therefore serve as the
best tracers of the time dependences of the acceleration and
interaction processes. Timing studies based on these radia-
tions define the total duration of particle interaction in flares,
as well as the overall temporal structure of the emission. But
of particular interest is the temporal relationship between the
fluxes in the various energy channels, as these data provide
information on the relationship between ion and electron ac-
celeration, and possibly on the existence of multiple acceler-
ation steps.The GRS gamma-ray observations >0.3 MeV indicate
a range of total flare durations from - 10 sec to over 1000
sec (e.g., Figure 2.3.2). The total emission in the majority
of these events consists of at least a few emission pulses,
each of which can be followed over a wide energy band.
These separate emission pulses can be as short as - 10 sec
and as long as - 100 sec and their duration within a given
flare is roughly proportional to the total event duration. In
a preliminary study (Gardner et al., 1981) of the separate
emission pulses in several GRS events, it was found that thetime of flux maximum in the 4.1-6.4 MeV band occurred
between 0 + 1 sec and 45 sec later than the corresponding
maximum of the - 0.3 MeV flux, the delay being propor-
tional to the emission pulse rise time. In addition to these,
most gamma-ray line flares also show delays between the
various gamma-ray and hard X-ray bands (Bai and Dennis,
1985). But it is important to note that there are cases where
no delays are detected. An example is shown in Figure 2.3.3,
where the maxima in the various energy bands from 0.04
MeV to 25 MeV in several emission pulses are simultaneousto within the GRS instrumental resolution of + 1 sec.
Another aspect of the timing studies is the relationship
between the starting times of the fluxes in different energy
channels. Forrest and Chupp (1983) have studied this rela-
tionship for the 40-65 keV flux and the 4.1-6.4 MeV flux
in two impulsive flares. They found that the starting time,
defined as the time when flux above background was first
detected, was the same in each energy band within of +2
sec for the smaller flare and +0.8 sec for the larger flare,
in spite of the fact that these two flares show evidence for
2-31

it/)
o0
0
n,-
600
4OO
200
I0.0
1980f
'sMM GRS
~10 s -_
F
0118:20 0118:40
i{D7.5
(/}
t-
O 5.00
2.5rr
0
dune 21
4.1-6.4 M'eV
i i I i i
O119:001981 April 27
0119:20 UT
[ i n ' i i ,
FSMM GRtl _I_ 4.1-6.4 MeV
LJ, , , ' , Uh-0805 0810 0815 0820 0825 UT
Figure 2.3.2 The observed time histories in an energyband dominated by gamma-ray lines from a fast
gamma-ray flare (top panel) and a slow gamma-rayflare (bottom panel). From Forrest (1983).
1982 February 812000 ..... , .... t I ..... I,..... f ..... I ..... I .....
SMM GRS_j_ ,_ 40-120 keY9000 - I
ooo ooo: "
_A 500 /_'(n _ I__
0 45 "_"o
12o " n NN
90
6O
30
i
1249:0(
' 10-25 MeV
Figure 2.3.3 The observed time histories in 4 energy
bands for a gamma-ray flare. From Chupp (1984).
a delay in the maxima of the fluxes of the same two energybands.
In addition to the timing studies, information on the rela-
tionship between ion and relativistic electron acceleration can
be obtained by comparing the bremsstrahlung with the
nuclear gamma-ray emissions from many flares. In Figure
2.3.4, the ordinate gives the bremsstrahlung fluence >0.27
MeV, found from a power-law fit for each solar flare event
(see 2.3.1.1), and the abscissa gives the corresponding
nuclear fluence above the power law for the energy range4-8 MeV. As can be seen, for 4-8 MeV nuclear fluences
greater than the GRS sensitivity threshold, relativistic elec-
tron bremsstrahlung is always accompanied by nuclear
gamma-ray emission.
Gamma-ray emission is seen from flares of many different
types, suggesting that ion acceleration could be a rather basic
process. The first 21,5 years of GRS data already show that
(1) a gamma-ray event may be associated with any Ha class,
(2) 20 % (10 out of 50) of flares of class > 2B have associated
4-8 MeV excess (Cliver et al., 1982), (3) 75% of all GRS
events have associated Hcx class B (brilliant) emission, (4)
50% (13 out of 26) of GOES A X-ray events with peak in-
tensity > X2 have significant 4-8 MeV excess, (5) GRS
events are always associated with a solar microwave burst
(> 1GHz) and (6) 53 % (19 out of 36) of 9 GHz bursts with
peak flux density > 1200 solar flux units had significant
4-8 MeV excess (Cliver et al., 1983).
2.3.2 Neutron Observations
Neutrons produced in solar flares have been observed
directly by the GRS experiment (Chupp et al., 1982, 1983)
and by neutron monitors on the ground (Debrunner et al.,
1983). Neutron production in flares has also been inferred
from observation of the 2.223 MeV line (e.g., Prince et al.,1983), and from the detection (Evenson et al., 1983) of
prompt interplanetary protons resulting from the decay of
neutrons produced in flares. The interplanetary proton flux
(from the June 3, 1982 flare) due to neutron decay is shown
in Figure 2.3.5. As we shall see, these data provide very
important complementary information to that obtained fromthe direct neutron and the 2.223 MeV line observations. The
prompt appearance of solar neutrons at Earth, indicated both
2-32

A
?10=
Eo
>o
Or- 10 =N
A
Z
..I"I-<
10i-u)(n
14,1
110-1
1980 FEBRUARY - 1982 FEBRUARY' ' ' ,,i,11 , , , ,,,,I , , ,,,,i
SMM GRS .65 FLARES "
NI4
ke4
• I
-4
-I
, , , =J,,l , , , t,,,Jl = * t i1*1
1 10 10 =14-8 MeV) EXCESS 13,cm -=1
Figure 2.3.4 A correlation plot of the electron brems-
strahlung and nuclear line emission from 65 flares.
From Forrest (1983).
by the ground based and SMM observations, require the
prompt acceleration of high-energy protons in the flare. Pro-tons should be accelerated to hundreds of MeV in less than1 minute.
2.3.3 Implications of the Gamma-Ray andNeutron Observations
Gamma-ray and neutron observations of solar flares can
provide information on the spectrum of the accelerated par-
ticles, on the total number and energy content in these parti-
cles, on the electron-to-proton ratio as a function of energy,
on the anisotropy and interaction site of the accelerated par-
ticles, and, possibly, on the composition of the accelerated
particles and the ambient medium (Ramaty et al., 1983a;Ramaty, 1985). To obtain this information, the observations
must be compared (e.g., Murphy and Ramaty, 1985) with
theoretical calculations which evaluate the expected gamma-
ray and neutron emissions using the basic nuclear processes
(Ramaty, Kozlovsky and Lingenfelter, 1979), particle inter-
action models (Ramaty, Kozlovsky and Lingenfelter, 1975;
Zweibel and Haber, 1983) and various energetic particle
spectra. The spectra that produce the best fits can then be
compared to the predictions of particle acceleration models
(e.g., Pesses, 1983; Lee and Ryan, 1985; Forman, Ramaty
and Zweibel, 1985 and Section 2.4). The acceleration
ID
I>..
09t--O
-4---
Ok-
12_
,°'IIF
102 t
L
10 t
10 0 , , , I , L2 3t
r I
I
I
j_
J_
'
I
' I ' ' ' I ' '4 5
Day of June, 1982
Figure 2.3.5 The flux of 25-45 MeV protons observed at ISEE-3.
The gamma-ray arrival time is indicated by the dashed line. FromEvenson et al. (1983).
2-33

mechanisms that have been considered so far are the stochas-
tic Fermi mechanism and shock acceleration. The former
predicts (Ramaty, 1979) an ion spectrum, which, in the non-
relativistic range, is a Bessel function of the second kind,
provided that the diffusion mean-free-path, X, and the es-
cape time from the acceleration region, T, are energy in-
dependent. The parameter that characterizes this Bessel
function spectrum is efT = V2T/Xc, where V is the velocity
of the scattering elements. Shock acceleration can predict
many spectral forms; the simplest of these, however, is a
power law in momentum, resulting from diffusive accelera-
tion by an infinite planar shock with no losses.
The most appropriate interaction model for gamma-ray
and neutron production in flares is the thick-target model on
which the particles stop in the interaction region; the argu-ments that favor this model have been summarized recently
(Murphy and Ramaty, 1985). The thick-target results pre-sented here are based on the assumption that the angular dis-
tribution of the energetic particles in the interaction region
is isotropic. The calculation of the yield of nuclear-line emis-
sion is essentially independent of this assumption because
this emission is nearly isotropic with respect to the direction
of the fast particles, but the calculation of the bremsstrah-
lung and high-energy neutron yields are quite sensitive to
the angular distribution of the particles. Calculations that take
into account anisotropy of the particles have not yet beenpublished.
2.3.3.1 Energy Spectra of the Accelerated Particles
Gamma-ray and neutron observations can be used to test
the validity of the functional forms of the energetic-particle
spectra predicted by acceleration theories, as well as to set
constraints on the values of the parameters that characterize
these spectra. The relevant observations are (1) the ratio of
the 4-8 MeV nuclear gamma-ray fluence to the 2.223 MeV
line fluence, which provides a measure of the ion spectrum
in the 10 to 100 MeV/nucleon range, and (2) the energy spec-
trum of neutrons released into interplanetary space, which
provides information on the ion spectrum in the 100 to 1000
MeV/nucleon region. Technique (1) can only be used fordisk flares, because, for limb flares, the 2.223 MeV line is
strongly attenuated by Compton scattering in the photosphere
(Wang and Ramaty, 1974). Values of otT, the parameter that
characterizes the Bessel-function spectrum, and s, the spec-
tral index of the power law, obtained (Murphy and Ramaty,
1985) by applying technique (1) to 8 disk flares are listed
in Table 2.3.1 (events 1 through 8).
Table 2.3.1 Energetic Particle Parameters (from Murphy and Ramaty 1985 except as noted)
Flare _T
Bessel Function Power Law InterplanetaryObservations
Np( > 30MeV) S Spectral Np,esc(> 30MeV)Np(> 30MeV) Index
1. Aug. 4, 1972 0.029+0.004 1.0×1033 3.3_+0.2
2. July 11, 1978 0.032 1.6x1033 3.1
3. Nov. 9, 1979 0.018+0.003 3.6X1032 3.7+0.2
4. June 7, 1980 0.021_+0.003 9.3×10³_ 3.5_+0.2
5. July 1, 1980 0.0255:0.006 2.8×1031 3.45:0.2
6. Nov. 6, 1980 0.0255:0.003 1.3x1032 3.35:0.2
7. April 10, 1981 0.0195:0.003 1.4x1032 3.65:0.2
8. June 3, 1982 0.034_+0.005 2.9×1033 3.1_+0.1
9. June 21, 1980 0.025 7.2 X 1032 --
*10. Dec. 9, 1981 -- <2x1031 --
7.2 x 1032 -- 4.3 x 1034
1.3 × 1033 -- --
2.6 x 1032 -- --
6.6x1031 o_T=0.015 8x1029
1.9 x 10 31 -- < 4 X 1028
1.0 X 10 32 -- 3 X 10 29
1.0 X 1032 -- --
2.2x 1033 s = 1.7 3.6 x 1032
-- txT = 0.025 1.5 X 1031
-- -- 1.0 X 1032
*from Cliver et al. (1983)
2 -34

The value of o_T for the June 21, 1980 limb flare (event
9 in Table 2.3.1) was derived from neutron observations.
In Figure 2.3.6, the time-dependent neutron flux observedfrom the June 21, 1980 flare (Forrest, 1983) is compared
with calculated neutron fluxes resulting from both Bessel-
function spectra and power laws, normalized to the observed4-7 MeV fluence. As can be seen, a Bessel-function spec-
man, with aT = 0.025, can simultaneously fit both the shape
and absolute normalization of the observed neutron flux; on
the other hand, a power-law spectrum cannot provide sucha simultaneous fit for any value of s. In Section 2.3.4.1 we
compare the o_T's derived from gamma-ray and neutron ob-servations with the otT's obtained by fitting Bessel functions
to the spectra observed in interplanetary space.
The only other flare for which published neutron time
profiles are available is the June 3, 1982 flare (Chupp et al.,
1983; Debrunner et al., 1983; Evenson et al., 1983). An
analysis similar to that for the June 21, 1980 flare showed
(Murphy and Ramaty, 1985) that a neutron time profile
resulting from a Bessel-function proton spectrum again
provided an acceptable fit to the data. The resultant value
of aT = 0.04 is in good agreement with that determined
independently from the 4-7MeV-to-2.223MeV flux ratio (see
Table 2.3.1). This is the only flare for which the two tech-
niques have so far been used simultaneously.
2.3.3.2 Total Particle Numbers and Energy Contents
In addition to setting constraints on energy spectra, the
gamma-ray line and neutron observations also determine the
total number of particles and the energy content in them, at
least for particle energies above the gamma-ray production
thresholds (generally a few MeV/nucleon). Total numbers
of accelerated protons above 30 MeV, derived for the 9 flares
discussed above, are also shown in Table 2.3.1. Also shown
in this table is an upper limit on the number of protons thatinteract at the Sun for the December 9, 1981 flare, derived
from the measured upper limit on the 2.223 MeV line fluence
(Cliver et aL, 1983) and assuming that aT =0.025. The com-
parison of these numbers with the numbers of particles ob-
served in interplanetary space is discussed in Section 2.3.4.2.Because of the chosen normalization, 30 MeV/nucleon, the
1.0
10"
7
Eo.=O10""
I 1 I I I I
JUNE 21, 1980
FORREST11983)(_4-7 = 76 PHOTONS/cm 2
XJUNE 21, 1980
._ FORREST(1983)
__ '4-7 = 76 PHOTONS/cm2
__ _S=2.5; Npl>3OMeV)
/ cxT= 0.040; .I.'[T,._,,,_.
0.030; 7.3 x l& _ 3.0; 5.8 x 10³_
0.025; 7.2 x 1032 ___.0; 2.9 l&
/5.0; 7.2 x
BESSEL-FUNCTIONSPECTRATHICK TARGET
PHOTOSPHERICABUNDANCESJ I 1 J I I I
0 500 1000 1500 2000 _ 2500 3000 0 500 10001 1500 2000 2500 3000
TIME IN SECONDS AFTER 1:18:20 UT TIME IN SECONDS AFTER 1:18:20 UT
1.0
10"
10-=
10 -3
Figure 2.3.6 Calculated neutron time profiles for the June 21, 1 980 flare and their comparison with observa-tions. From Murphy and Ramaty (1985).
2-35

protonnumbersdonotdependmuchontheassumedfunc-tionalformofthespectrum,ascanbeseeninTable2.3.1.Ontheotherhand,thetotalenergycontentsdodependcrit-icallyontheshapeofthespectrumatlowenergies.Valuesof theenergycontentin ionsof energiesgreaterthan1MeV/nucleonwerederivedforseveralflaresusingBessel-functionspectra(Ramaty,1985):theseenergycontentsrangefrom- 5x 10²sergsfortheJuly1,1980flareto - 2 x 1030
ergs for the August 4, 1972 flare.
2.3.3.3 The Electron-to-Proton Ratio
Having described the derivation of the spectrum and nor-
malization of the protons which produce the gamma-ray lines
and neutrons, we proceed now to describe a similar deriva-
tion for the relativistic electrons which produce the gamma-
ray continuum by bremsstrahlung. The relationship betweenan isotropic power-law electron distribution in the thick-target
model and the resultant photon fluence was given previously
(Ramaty and Murphy, 1984), but, as already mentioned, no
calculations have yet been published for anisotropic distri-butions.
As discussed above, the gamma-ray continuum at ener-
gies below - 1 MeV is primarily electron bremsstrahlung,
at energies between 1 and 8 MeV it is a superposition of
bremsstrahlung and broad and unresolved narrow nuclear
lines, while at higher energies, in addition to bremsstrah-
lung from primary electrons there could be a contribution
from photons from 7r° decay and from bremsstrahlung by
electrons and positrons from charged _r decay. The gamma-ray continuum above 10 MeV from the June 21, 1980 flare
should be mainly electron bremsstrahlung, since the proton
spectrum derived from the neutron observations is too steep
to yield many 7r mesons. The electron spectrum incident on
the thick-target interaction region for this flare, deduced from
the observed (Chupp, 1982) gamma-ray spectrum between
0.27 and 1 MeV and the integral fluence above 10 MeV
(Rieger et al., 1983) can be approximated (Ramaty and
Murphy, 1984) by a power law with spectral index -3.5.
This spectrum is shown in Figure 2.3.7, together with the
proton spectrum obtained from the neutron and nuclear
gamma-ray observations. In Section 2.3.4.3 we compare the
e/p ratio implied by these results with that observed in in-
terplanetary space.
The proton spectrum deduced for the June 3, 1982 flare.
(aT = 0.04) implies a larger r-meson production relative
to electron bremsstrahlung than for the June 21, 1980 flare.
Consequently, the observed > 10 MeV fluence from the June3 flare could contain an important contribution from _r-meson
decay. For more detail, see Murphy and Ramaty (1985).
2.3.3.4 Anisotropy and the Interaction Site of theParticles
Gamma-ray and neutron observations offer the opportu-
nity to study the anisotropy of the accelerated particles. An
38
36
34
32
z 30
o.-I
28
26
I I I 1
24 -
22 I-2 -1
_lp(E)
I I I0 1 2
LOG E (MeV)
3
Figure 2.3.7 Calculated spectra and normalizations
of the total numbers of protons and electrons acceler-
ated in the June 21, 1980 flare. From Ramaty andMurphy (1 984).
important result concerns the neutrons that escape from the
Sun. It was pointed out (Ramaty et al., 1983b) that the fact
that such neutrons were seen from a limb flare (Chupp et
al., 1982) indicates that the primary protons could not have
penetrated to very large depths in the photosphere. The ob-
served neutrons have energies of several hundred MeV and
therefore must be produced by protons of at least such ener-
gies. Such protons, should they travel in straight lines, would
penetrate to great photospheric depths, on the order of a few
tens of g/cm 2. Neutrons produced at such depths in limb
flares could not escape from the photosphere in the direc-
tion of the Earth. The implication is that the primary pro-
tons must be stopped at much shallower depths, probably
at the top of the photosphere. The stopping mechanism could
be magnetic mirroring (Zweibel and Haber, 1983) or scat-
tering off magnetic irregularities at the foot points of loops.
These effects could also isotropize the particles. For the June
3, 1982 flare, Murphy and Ramaty (1985) find that the direc-
tional neutron flux at 50 ° <_ 0 < 90 °, obtained from in-
terplanetary observations of protons from neutron decay, is
2-36

essentiallythe same as that at 90 ° < 0 < 180 °, obtainedfrom the 2.223 MeV line observations. Here 0 is the angle
between the normal to the photosphere and the direction of
observation. This result seems to imply that the flux of pro-
tons up to energies of - 100 MeV in the interaction region
cannot be very anisotropic.On the other hand, Vestrand et al. (1985) found that flares
with gamma-ray continuum >0.27 MeV exhibit a center-to-limb variation, which would be consistent with the down-
ward beaming of relativistic electrons. In addition, Rieger
et al. (1983) have found that all GRS events with significantemission > 10 MeV are from flares near the solar limb. This
observation implies the anisotropy of either the ultra-relativistic electrons, if the > 10 MeV emission is brems-
strahlung, or the very high energy protons, if this emissionresults from _r mesons.
The gamma-ray line observations can, in principle, alsoprovide information on the beaming of the ions at the inter-
action site through the widths of the lines and through Dop-
pler shifts. The observational information on this issue,however, is not clear, primarily because detailed observa-
tions with high-resolution detectors have not yet been car-ried out. The basic theoretical ideas have been described by
Ramaty and Crannell (1976) and by Kozlovsky and Ramaty
(1977).The gamma-ray observations suggest that the ambient
density in the interaction site of the energetic particles shouldexceed a few times 1011 cm -3 and therefore this site should
be the chromosphere. This result is based primarily on the
observed (Share et aL, 1983) time profiles of the 0.511 MeV
line and their comparison (Ramaty and Murphy, 1984;
Murphy and Ramaty, 1985) with theoretical time profiles
I-
Z
>.
,<
i-.
n-
x-J
t(OI I IIIlllL, I I II[llll I I IIIIII i
,oo
0.01
0.0001
I I llllllJ
0.1 1
I I I lllh
I I I IIIIII
10 100 1000
ENERGY (MoV)
Figure 2.3.8 An example of fitting Bessel functionsto the spectrum of the August 21, 1975 flare. From
McGuire and von Rosenvinge (1985).
which take into account the lifetimes of the various positron-
emitting nuclei and the slowing-down and annihilation times
of the positrons.
2.3.3.5 Compositions
Gamma-ray line spectra, such as shown in Figure 2.3.1,
offer the opportunity for studying relative elemental com-
positions. The contribution of proton and alpha-particle in-
teractions in the thick-target model is significantly larger thanthat of the heavier nuclei. Therefore, the structure of the total
nuclear spectrum is much more sensitive to the relative abun-
dances of the ambient medium, i.e., the chromosphere, than
to those of the energetic particles. Studies in progress
(Murphy 1985) indicate that the chromospheric abundances,
deduced from the gamma-ray observations, could differ from
those of the photosphere in a manner similar to that observed
in the energetic particles (see 2.3.4.4).
2.3.4 Interplanetary Charged-ParticleObservations
2.3.4.1 Energy Spectra
Interplanetary protons and heavier ions resulting from ac-celeration in solar flares are observed up to energies of sev-
eral hundreds MeV by instruments on spacecraft (e.g.,
McGuire and von Rosenvinge, 1985) and up to energies of
about 10 GeV by ground based detectors (e.g., Debruuneret al., 1984). Flare-accelerated relativistic electrons are also
observed by detectors on spacecrafts up to energies of tensof MeV (Lin et al., 1982; Evenson et al., 1984). The parti-
cle energy spectra deduced from these measurements are
generally subject to uncertainties introduced by coronal and
interplanetary propagation. These uncertainties, however,can be minimized by considering only particle events that
are well-connected magnetically to the detector and by con-
structing the particle energy spectra at times of maximum
1985). This technique was used recently (McGuire and von
Rosenvinge, 1985) to analyze the proton and alpha-particle
energy spectra from a sample of particle events which show
no evidence of interplanetary shock acceleration or multiple
flare injection. It was found that many flares have proton
spectra which are best fit by Bessel functions (see Section
2.3.3) over a broad energy range (from a few MeV to a few
hundred MeV). An example is shown in Figure 2.3.8. The
implied values for the whole sample, o_T=0.025 +0.01, are
in good agreement with those derived for other flares from
the gamma-ray and neutron observations (see Section2.3.3.1). Moreover, for one flare, that of June 21, 1980,
the Bessel-function spectrum with otT= 0.025, derived from
the neutron and gamma-ray observations, provides an ac-
ceptable fit to the interplanetary proton spectrum which wasalso observed (McDonald and Van HoUebeke, 1985) from
2-37

thisflare.TheseresultsprovidesupportforthevalidityofthestochasticFermimechanismforionaccelerationinflares.Butit shouldbenotedthataccelerationbyplanarshockswithlosses(Forman,RamatyandZweibel,1985)orbyspheri-calshocks(LeeandRyan,1985,seealsoSection2.4)canproducespectrathat,intheenergyrangeofinterest,arein-distinguishablefromtheBessel-functionspectraandthere-forecanalsofit theobservations.Furthermore, the observed
alpha-particle spectra are generally steeper than the proton
spectra, and this result is inconsistent with the assumptions
of constant diffusion mean-free-path and escape time that are
made in the simple treatment of stochastic Fermi accelera-tion (see Section 2.3.3). Stochastic Fermi acceleration with
rigidity-dependent diffusion was treated by Barbosa (1979,
see also Forman, Ramaty and Zweibei, 1985), but no detailed
comparisons of the resultant spectra with data have yet beenmade.
Another spectral form which fits the data of many flaresis an exponential in rigidity, but no acceleration mechanism
that predicts this form has yet been proposed. Occasionally,
the proton spectra show (McGuire and von Rosenvinge,
1985) a complex structure that cannot be fit by any simpleform. Such spectra could result from the combination of more
than one acceleration process.
Particle acceleration at shock fronts is known to occur
at many sites. As already mentioned (see Section 2.3.3) a
prediction of acceleration by planar shocks with no losses
is that the differential particle number per unit momentum
should be a single power law. This implies (Ellison and
Ramaty, 1985) that the differential particle flux per unit
kinetic energy can be approximated by power laws in the
nonrelativistic and ultrarelativistic limits, with the spectral
index steepening by a factor of 2 above a kinetic energy equal
to the particle rest-mass energy. The observed proton energyspectra for some flares can be fit (McGuire and von Rosen-
vinge, 1985) by single power laws up to kinetic energies of
several hundred MeV, consistent with planar shock acceler-
ation without losses. Moreover, the spectra predicted by such
acceleration could also fit the proton spectra that are occa-
sionally observed to extend up to 10 GeV. Recently, solar-flare proton spectra, obtained from the combination of
spacecraft and ground-based data (Debrunner et al., 1984),
show the characteristic steepening at - 1 GeV.
The energy spectra of relativistic interplanetary electrons
from solar flares were studied by Lin, Mewaldt and Van
Hollebeke (1982) and recently by Evenson et al. (1984). The
observed spectra, if fit by power laws in kinetic energy over
narrow energy intervals, show great variability from flare
to flare. This is illustrated in Figure 2.3.9, where the filled
symbols indicate ganuna-ray flares. As can be seen, the
relativistic electron spectra of such flares are among thehardest observed. For the June 21, 1980 flare, in particular,
the electron spectral index, - 3.2, obtained from the inter-
planetary observations, is in good agreement with the index
x
t'-n
o. 5
e-
,m, 4
University of ChicagoISEE--3 (1980 Solar flares)
[]
D[]
[][][]
[][3F7
D • •
[] []
i i i i10-" 10 -3 10 -z 10 -1
5 -- 11 MeVMaximum electron flux
per (cmz-sec-sr- MeV)
Figure 2.3.9 Spectral indices and fluxes from elec-
tron events observed in interplanetary space. Thefilled symbols indicate gamma-ray flares. From Even-
son et al. (1984).
derived from the gamma-ray continuum (see Section
2.3.3.3). Power-law spectra at ultrarelativistic energies areconsistent with both stochastic and shock acceleration withno losses.
2.3.4.2 Total Proton Numbers in InterplanetarySpace
The number of protons that interact at the Sun and the
number that escape into interplanetary space are listed for
several flares in Table 2.3.1. The meager data base notwith-
standing, these results appear to suggest at least 2 categories
of events: (1) events in which the number of interacting ions
greatly exceeds the number escaping (events 4, 5, 6 and 9),
and (2) events in which the number of escaping ions exceeds
the number interacting (events 1 and 10). It remains an un-
answered question whether the variability of the ratio be-
tween the two particle numbers is caused by a variable escape
probability from the Sun or by different acceleration proc-
esses. It is interesting to note that for the June 3, 1982 flare,
the numbers of escaping and interacting ions differed only
by less than an order of magnitude. The complex time de-
pendences of the ganuna-ray emissions from this flare
2-38

(Chuppet al., 1983; Share et al., 1983) might require parti-cle acceleration in at least two phases (Murphy and Ramaty,
1985).
2.3.4.3 The Electron-to-Proton Ratio
The ratio of interplanetary electron fluxes and proton flux-
es at the same energy are shown in Figure 2.3.10. As can
be seen, the largest values of this highly variable ratio cor-
respond to gamma-ray flares. The time dependence of thefluxes of these electron-rich events are diffusive (see Figure
2.3.11), indicating that strong interplanetary shocks were notassociated with these events.
For the June 21, 1980 flare, which is an electron-rich
as well as a gamma-ray event, the interplanetary electron-
to-proton ratio can be compared with the corresponding ratioderived from the gamma-ray and neutron data. The inter-
planetary ratio at - 30 MeV is about 0.05 (Evenson et al.,
1984), while the gamma-ray and neutron data (see Figure
2.3.7) imply that this ratio at 30 MeV is smaller by approxi-
mately a factor of 100. This difference could result from
either the preferential escape of the relativistic electrons, or
an anisotropy of the electrons in the gamma-ray production
region. In the latter case, the isotropic bremsstrahlung cal-culation that was used to obtain the results of Figure 2.3.7would underestimate the electron number.
2.3.4.4 Compositions
The most recent results on the elemental composition of
solar energetic particles were presented by Cook, Stone and
Vogt (1984). It was found that, for flares for which the abun-
dances are not a strong function of energy/nucleon, the ob-
served compositions appear to vary about an average which
could reflect the composition of the medium from which the
particles are accelerated. This composition is different fromthat of the photosphere, but seems to be in agreement with
the composition of the corona and the solar wind. As dis-
cussed in Section 2.3.3.5 the gamma-ray observations sug-
gest that the composition of the chromosphere also differs
from that of the photosphere. Thus, several independentmethods of abundance determinations seem to imply that im-
portant compositional modifications occur during transport
of matter from the photosphere to the rest of the solar at-
mosphere.
In addition to elemental composition, interplanetary par-
ticle observations also provide information on isotopic com-
positions (e.g., Mewaldt, Spalding and Stone, 1984) and
charge (Gloeckler, 1985) states. We shall not discuss thesehere in detail, except to mention that the charge-state obser-
vations strongly suggest that the solar-tim particles seen in
interplanetary space are probably accelerated in the corona.
This conclusion is based on the observed charge-state dis-
(a) 1980 events:(extrapolated electrons)/(25-45 MeV protons)
(3_3<1_3
<1 <1 <1 <1<1<1 <1<1<1<1
<1<1<1<1<I <1 <1 I
(b) 1968-70 events (Ooflowe, 1971):(12-45 MeV electrons)/(extropolated protons)
I • II
(c) Subset of
[][] I o [3 nlo 0 ol 0 [] I 0 pll> o I
panel (a) data corresponding to panel (b) selection criteria
<1<1 []
<1 _I O<1 <11_ D _ <11l [] <11 I III I ill I
10-7 10 .6 10 .5 10 .4 10 -3 10 .2 10 -1 100 10 t
e / p flux ratio
Figure 2.3.10 Electron-to-proton ratios. Square symbols indicate measurements, triangles in-dicate upper or lower limits and filled symbols indicate gamma-ray flares. From Evenson et al.
(1984).
2-39

2000 0000 0400
Day 172 -- 173 of the year 1980
Figure 2.3.11 Interplanetary particle time profiles
from the June 21, 1980 gamma-ray and electron-rich
flare. From Evenson et al. (1984).
tributions, which seem to agree with a plasma of coronal tem-
peratures, and on the presence of singly-charged He, which
implies that the amount of matter traversed during escape
is very small. A similar conclusion follows also from the
apparent absence of spallation products (2H, 3H, Li, Be, B)
from the observed particles. We note, however, that at typi-
cal coronal temperatures singly-charged He is not the
dominant charge state of He.
2.3.5 The Nature of the Ion and Relativistic
Electron Acceleration Mechanisms
A variety of observational evidence (discussed in Sec-
tion 2.2) has shown that energy release in flares is stronglyrelated to the acceleration of nonrelativistic electrons. This
acceleration has been commonly referred to as first-phase
acceleration to distinguish it from such phenomena as Type
II radio emission which were refered to as second-phase ac-
celeration (Wild, Smerd and Weiss, 1963; De Jager, 1969;
Ramaty et al., 1980). Prior to the SMM and other recent
gamma-ray observations, it was believed that ion and
relativistic electron acceleration occurs only in this second
phase. However, the very impulsive nature of the gamma-
ray emission and its close temporal association with the stand-
ard signatures of first-phase acceleration (e.g., hard X-rayemissions), demonstrate that ion acceleration can also take
place in the first phase. This result, together with the fast
onset and rapid rise of the gamma-ray fluxes, sets strong con-straints on the nature of the acceleration mechanism. For ex-
ample, it must be possible to accelerate ions and electronsto tens of MeV within a few seconds and ions to hundreds
of MeV in less than a minute. Which of the various proposed
flare acceleration mechanisms can satisfy these constraints
remains an unanswered question.
We already discussed in Section 2.2.6 that first-phase ac-
celeration might proceed in two steps, as proposed by Bai
and Ramaty (1979), Bai (1982) and Bai et al. (1983b). The
assumption of the two-step model that the ion and relativis-
tic electron accelerations are closely coupled is supported
by the data, in particular by the good correlation betweenthe - 0.3 MeV bremsstrahlung and the 4-8 MeV nuclear
emission (Figure 2.3.4). But there are conflicting points of
view regarding the relationship between ion acceleration andnonrelativistic electron acceleration, which tests the basic
postulate of the two-step model. The finding that there seems
to be a set of characteristics that are common to only ganmm-ray line flares (Bai et al., 1983a; Bai and Dennis, 1985)
argues for a second acceleration step. These characteristics
are: (1) For gamma-ray line flares, the time profiles of higher
energy (> 100 keV) X rays are delayed relative to those
of lower energy X rays (- 50 keV), or, equivalently, the
hard X-ray spectrum flattens with time during the burst. Insome instances, the time profiles of the 4-8 MeV nuclear
gamma rays are also delayed relative to the X-rays (Bai,
1982). (2) The energy spectra of the hard X-ray flux at the
peak of emission is, on average, significantly flatter forgamma-ray line flares than for flares without detectable
gamma-ray lines. (3) Gamma-ray line flares seem to be bet-
ter correlated with Type II and Type IV radio bursts thanare flares with no detectable gamma-ray lines.
On the other hand, it is not clear that gamma-ray flares
always have these distinguishing characteristics and, further-
more, explanations other than second-step acceleration mightexist for at least some of them. As mentioned in Section
2.3.1.2 the peaks of the fluxes in various energy channelscan be simultaneous within the detector time resolution, as
can be seen in Figure 2.3.3. In addition, the comparison of
the starting times of the photon fluxes in the various chan-
nels could be more relevant in determining the reality of
second-step acceleration than the comparison of the peak
times because delays between the peak times could be due
to energy-dependent Coulomb losses in a trap model (which
was discussed extensively in Section 2.2.6). As noted ear-
lier for two impulsive flares, the starting times of the 4.1-6.4MeV and the 40-65 keV fluxes were essentially the same,
even though these two fluxes show evidence for a delay intheir times of maximum (Forrest and Chupp, 1983).
2 -40

Giventhat there is substantial ion and relativistic elec-
tron acceleration in the first phase, it is natural to ask whether
any further particle acceleration occurs in the second phase
by shock acceleration in the corona, as originally proposed
by Wild, Smerd and Weiss (1963). Support for such a con-
cept comes from the poor correlation between the ion popu-lation that interacts at the Sun and that observed in
interplanetary space which could be a manifestation of the
two acceleration phases. Additional evidence comes from the
observations of solar flare heavy ions in interplanetary space,
wherein it appears that the source of the ions is a large volumein the corona (Mason et al., 1984). On the other hand, it
is possible that this lack of correlation is simply due to the
unequal and variable upward and downward escape condi-
tions which are determined by unknown magnetic configu-
rations. Furthermore, the good agreement between the proton
spectra deduced from the gamma-ray observations and those
observed in interplanetary, space suggests that, for at least
some flares, these two ion populations are commonlyaccelerated.
2.3.6 Summary
The opening of a new channel of information on the ac-
celeration of particles in solar flares by routine gamma-ray
and neutron observations is one of the major achievements
of SMM. We summarized the most important available
gamma-ray and neutron data and presented their interpreta-
tions in a manner as independent of specific models as pos-sible. We then explored the relationships of these results with
other flare phenomena.
As gamma-ray and neutron emissions are signatures of
ion and relativistic electron acceleration, we have explored
the relationship of these emissions to the other unambigu-
ous manifestation of particle acceleration: the direct detec-
tion of accelerated particles in interplanetary space. We have
also explored the relationships of the gamma-ray emission
with other flare phenomena, in particular hard X-ray emis-
sion, in an attempt to resolve the question of multiple-stepaccelerations.
We return to the questions posed in the introduction:
1. What are the time characteristics of the energizationsource ?
Gamma-ray emission from flares is prompt. Within de-
tector sensitivity, the starting times of the nuclear gamma-
ray emission and nonrelativistic bremsstrahlung X-ray emis-
sion are the same; but the peaks of the fluxes in the various
energy channels can be delayed one relative to the other (Sec-
tion 2.3.1.2). These results demonstrate that acceleration of
ions and relativistic electrons are closely associated with the
primary energy release in flares.2. Does every flare accelerate protons ?
The good correlation of the relativistic electron brems-
strahlung fluence > 0.27 MeV and the ion-associated nuclear
excess fluence in the energy range 4-8 MeV suggest that,
for 4-8 MeV fluences greater than the GRS sensitivity
threshold, relativistic electron acceleration is always accom-
panied by ion acceleration. There also seems to be an over-
all association of gamma-ray emission with many diverse
flare phenomena, suggesting that ion acceleration could be
quite common.
3. What is the location of the interaction site of theenergetic particles ?
The gamma-ray line observations suggest that the inter-action site of the ions and relativistic electrons is located at
densities > 1011 cm -3 (i.e., in the chromosphere) and the
neutron observations imply that mirroring or scattering
should stop the highest-energy ions from penetrating the pho-
tosphere (Section 2.3.3.4). The comparison of neutron
release into interplanetary space and towards the photosphere
is consistent with isotropic neutron production, at least up
to 100 MeV (Section 2.3.4). But gamma-ray continuum ob-
servations suggest that relativistic electrons are anisotropic
(Section 2.3.4).
4. What are the energy spectra for ions and relativisticelectrons ?
Does the spectrum vary from flare to flare?
The energy spectra of the ions that interact at the Sun
cannot be fit by single power laws in kinetic energy. Better
fits are obtained with more curving spectra such as those
resulting from stochastic Fermi acceleration or shock acceler-
ation with losses (Section 2.2.3.1). The spectral index otT
varies from flare to flare but over a fairly narrow range:
0.015 < c_T < 0.040.
5. What is the relationship between particles at the Sun
and interplanetary space?
The spectra of flare protons observed in interplanetary
space are in many cases similar to those of particles inter-
acting at the Sun (Section 2.3.4.1). The range of spectral
indices, 0.015 < aT < 0.035, is in reasonable agreement
with the range deduced from the gamma-ray measurements,
suggesting thaL for most flares_ a common mechanism could
accelerate both particle populations. On the other hand, the
numbers of ions inferred from the gamma-ray and interplane-
tary observations do not agree on a flare by flare basis. This
could be due to unequal and variable upward and downward
escape probabilities or to two acceleration phases (Section
2.3.5). The hardest relativistic electron spectra and the
highest electron-to-proton ratios are observed from gamma-
ray flares.
6. Is there any evidence for more that one accelerationmechanism ?
The prompt nature of the gamma-ray emission from flaresdemonstrates that ion and relativistic electron acceleration
can occur in the first phase of particle acceleration. A sec-
ond phase of particle acceleration, due to the passage of ashock wave through the corona, probably also accelerates
ions and relativistic electrons, but the ganuna-ray signatures
2-41

oftheseparticleshavenot yet been identified. The possibil-
ity that first-phase acceleration could consist of multiple steps
has also been considered, but the evidence for such steps re-mains equivocal.
2.4 THEORETICAL STUDIES OF
PARTICLE ACCELERATION
In the last two Sections we specified the main require-ments for the acceleration source. We now turn our atten-
tion to the recent development of ideas on bulk energization.
It is well accepted today that the transformation of magnetic
energy into plasma energy is the main process that provides
the observed transient energization in solar flares. We present
in this Section several mechanisms that can, under certain
conditions, accelerate electrons and ions to high energies.
2.4.1 Particle Acceleration in Reconnecting
Magnetic Fields
2.4.1.1 Resistive Tearing Instability
There have been a number of recent attempts (Van
Hoven, 1979; Smith, 1980; Heyvaerts, 1981) to estimate the
electric fields produced by the resistive tearing instability,
but the results disagree. Most of this work concentrates on
the dynamic energy-release mechanism (Furthet al., 1963;
Coppi et al., 1976), with the aim of simulating the temporal
development of the flare impulse. The principal reason for
the lack of agreement on the acceleration performance of tear-
ing reconnection is that the induced electric fields criticallydepend on the small-scale magnetic structure and on the
energy-transport history as the instability nears the point ofsaturation, and such nonlinear behavior is poorly known. The
situation (in the simplest case) is as follows: the resistive tear-
ing instability (or reconnection) grows in a sheared magnetic
field B(r) in which the field lines locally have the changing
orientation of the steps of a spiral staircase. In the vicinityof that step which is perpendicular to the nearest wall (bound-
ary), the magnetic field is decoupled from the plasma so that
it is no longer frozen and can spontaneously tear and recon-nect (Van Hoven, 1979). The reversal of the direction of
the orthogonal components of the nearby field lines and their
later merging, are shown in Figure 2.4.1. As resistive tear-
ing commences, the electric field changes from its pre-
existing low equilibrium value ofE_ = _TJoez, (where _(T)is the resistivity and Jo is the current) in two essential ways.
The B field-aligned z component 7/Jz grows at the recon-
nection point (Van Hoven, 1979), causing an increasing ac-
celeration of electrons and protons along e z. E z can(according to some estimates) reach the Dreicer (1959) value
E D, at which the electric force becomes greater than the col-
lisional drag, and the electrons will be freely accelerated.
y
a lI -_----Q----_----@-----_----_--__®
X
S o
y
i y
Bx(Y)
II IIv 1-o
MAGNETIC ii t=Ti_Xr T h I] TEARING
! _ 2na/a = I
Figure 2.4.1 The development of magnetic tearing. The tail-of-the-arrow symbols show the direction of J(x,O) which is antiparallel to B(x, 0). The stippled arrows show flow velocities.
2 -42

At thesametime,thepreexisting stationary plasma begins
to move across the magnetic-field direction, as shown by the
stippled arrows in Figure 2.4.1. The growing flow velocity
v outside the resistive layer produces a rising E = -v
× B electric field across B_ which generates an increasingmass-independent drift velocity (E x B)/B 2 of the plasma
inside the resistive layer. Thus, there are two distinct mecha-nisms, available in a reconnecting field, for accelerating par-
ticles. The crucial (and yet incompletely answered) question
is how large do these accelerating E fields become as the
magnetic tearing proceeds through its energy supply. The
answer depends sensitively on the time development of the
field structure at the reconnection point, which (in turn) de-
pends on the local resistivity and on the external boundary
conditions. In addition, the most interesting limit for large
electric fields is the "non-constant-_b" (long-wavelength,
roughly) case (Drake et al., 1978; Steinolfson and Van
Hoven, 1983) for which the magnetic gradients are sharper,
and the growth is faster and more prolonged. Most nonlinear
computations presently available use boundary conditions
chosen for mathematical convenience (not for solar applica-
tions), constant resistivity (set at an artificially high level to
limit the expenditure of computer time) and short
wavelengths (same reason). An entirely different scale of cal-culations, involving a full treatment of the energy transport,
is needed to properly follow the variation of the local
resistivity _(T) as Joule heating, radiation losses and ther-
mal conduction come into play (Van Hoven et al., 1984;
Steinolfson and Van Hoven, 1984a). Relevant nonlinear com-
putations of the resistive tearing instability have been per-formed by Van Hoven and Cross (1973), Schaaek and Killeen
(1978), Drake et al. (1978), Ugai (1982, 1983), and Stein-
olfson and Van Hoven (1984b).
The group at the University of California (Irvine) has in-
vestigated two aspects of reconnection growth and satura-
tion. Nonlinear computations have been made which
specifically evaluate electric fields, and linear calculations
..........h_,,,_h,_,_,, pe_rfo..rrned on a reasonably complete v..v._,_........
transport model. The new nonlinear results (Steinolfson and
Van Hoven, 1984b) apply to the canonical single-tearing
layer, with periodic boundaries parallel and remote bound-
aries perpendicular to it, and constant resistivity. However,
exteme care is given to the spatial resolution on which the
electric fields depend, and on attaining the non-constant-6
limit at relatively high levels of magnetic Reynolds number.
The results have proved to be somewhat disappointing, as
far as their potential for a flare model are concerned. Ini-
tially non-constant-tk excitations do indeed grow faster (by
an order of magnitude) and farther (by two orders in energy)
than constant-_k modes. However, the growth rate falls (by
one-half to one order of magnitude) soon after the nonlinear
threshold is crossed (island width _ resistive-layer thick-
ness), thereby slowing the energy output. In addition, the
outward Fermi-acceleration flow develops a stagnation point,
and then reverses. Finally, a new magnetic island grows as
the reconnection point bifurcates (see detailed discussion by
Priest et al. in Chapter 1). This more complex and wider
island structure holds down the parallel electric field to a
value (weakly increasing with S up to l0 s) of order 10 -3 of
the Dreicer field (Dreicer, 1959). This study is continuing,
with emphasis on the effects of boundary conditions at the
ends of the tearing layer, which now cause a back pressure
leading to the flow stagnation, and of energy transport which
can accelerate the reconnection. Energy-transport effects are
the prime focus of Van Hoven's and Steinolfson's secondeffort in this context. They have treated Joule heating, ther-
mal conduction, and (especially) optically-thin radiation
which proves to have the dominant influence in a reconnec-
tion layer. At coronal temperatures, the radiative loss func-
tion gives rise to thermal instabilities (Field 1965), so that
a temperature perturbation spontaneously grows. Van Hovenet aL (1984) have discussed the linear mode structures and
growth rates, and have demonstrated the existence of a
tearing-like and a faster radiative mode at coronal tempera-
tures. A crucial aspect is that the addition of radiation drives
the temperature down at the recormection point, in contrast
to the expected behavior in which the local Ohmic-heating
peak would raise the temperature (T o . The radiative
decrease of T e has the effect of increasing the Coulomb
resistivity 7/a To-3/2, with the potential of accelerating themagnetic-tearing rate. Steinolfson and Van Hoven (1984a)have also examined the reconnection behavior of the faster
radiative mode. It has a growth time which does not vary
with temperature (resistivity) and is 30 times shorter (for
coronal conditions) than that of the tearing mode. They have
now shown that this mode, at a comparable level, exhibits
30 % of the reconnected flux of the slower tearing mode. The
radiative instability thus has the potential for providing fast
magnetic-energy release. In addition, the parallel electric
field _Jz of the radiative mode is 200 times larger (at lowlevels) than that in the equivalent tearing mode. Nonlinear
computations are needed to demonstrate the validity of theselow-level indications.
2.4.1.2 Particle Dynamics Around the Neutral Point
The effects of turbulence in analytical and computational
models have been excluded from most previous studies. It
was assumed that the background magnetic field is initially
smooth and that perturbations are symmetric and/or in-finitesimal. There are indications (Matthaeus et al., 1984)
that finite-amplitude fluctuations can lead to turbulence in
X-point dynamics, thereby increasing reconnection rates.
Consequently, turbulent reconnection might maintain strong
X-point electric fields at high conductivity. The question of
whether a sub-population of particles might be accelerated
to high energies by the reconnection-zone electric field hasbeen studied extensively (e.g., Speiser, 1967; Vasyliunas,
1980). A typical approach has been to calculate the trajec-
2-43

toriesof"testparticles"inmodelMHDmagneticand elec-
tric fields. The electric field has usually been included
parametrically. Sato et al. (1982) followed test particle orbits
in the dynamic electric field of a symmetric, forced and non-
turbulent MHD simulation. It was found that test particles
do not spend much time near the X-type neutral points, but
can easily be trapped near O-type neutral points. This is a
crucial point in the assessment of the importance of recon-
nection as a particle accelerator. In non-steady incompres-
sible simulations, strong accelerating electric fields do not
appear near the O-points. A long residence time near the
O-point is thus unlikely to produce significant particle ac-
celeration. The short residence times of particles near the
X-point region has been viewed as a limitation on the effi-
ciency of the X-point acceleration mechanism. Matthaeus et
al. (1984) followed orbits in the fields generated by an in-
compressible, MHD spectral-method simulation (see e.g.,
Matthaeus and Montgomery, 1981 and Matthaeus, 1982).
The magnetic field configuration is a periodic sheet pinch
which undergoes reconnection. Test particles are trapped in
the reconnection region for a period of the order of an Alfven
transit time in the large electric fields that characterize the
turbulent reconnection process at the moderate magnetic
Reynolds number (S = rR/r A = 1000, where rR is the re-
sistive time and ra is Alfven transit time) used in their simu-lation. They found that a small number of particles gained
substantial energy at the end of their simulation.
2.4.1.3 The Coalescence Instability
Tajima (1982) used a fully self-consistent electromagnetic
relativistic particle code (Langdon et al., 1976; Lin et al.,
1974) to study the coalescence of two current filaments. In
the solar atmosphere these filaments may represent two
different loops. They showed that during the linear stage the
energy release is small (comparable to the Sweet-Parker rate)
but this stage is followed by the nonlinear phase of the coales-
cence instability (Wu et al., 1984; Leboeuf et al., 1982)
which increases the reconnection rate by two or three orders
of magnitude. An important result from their simulation is
that the plasma compressibility leads to an explosive phaseof loop coalescence and its overshoot results in amplitude
oscillations in temperature (by adiabatic compression and
decompression). These oscillations resemble in structure the
double sub-peak amplitude profile of the 1980 June 7 and
21 observations of microwave emission Nakajima et al.
(1984b) observed on 1982 November 26 with the 17 GHz
Nobeyama interferometer. Brunel et al. (1982) found that
the ion distributions formed during the coalescence were
characterized by intense heating and the presence of a longnonthermal tail. A word of caution about these results is in
order here. Although the results seem very encouraging, the
plasma parameters used in these simulations are far from
those experienced in the solar environment. Thus, we can
only use these results to stimulate new thinking and tech-
niques for simulation, specifically oriented to solar physicsin the near future.
2.4.1.4 Laboratory "Simulations" of Solar Flares
Another important tool for the exploration of the physi-cal processes that take place during a flare is the use of labora-
tory experiments that "simulate" the solar environment and
study the dynamics of the energy release process. Numer-
ous such experiments have been performed in the past (e.g.,
Stenzel and Gekelman, 1985; Bratenhal and Baum, 1985).
Recently, a group of scientists in U.S.S.R. have reported
several major results obtained from laboratory experiments.(1) They detected the formation of current sheets, followed
by increased plasma density and magnetic energy in the
vicinity of the current sheet region (Somov et al., 1983;
Altyntsev et al., 1984). (2) They have observed a sudden
excitation of turbulence which was accompanied by fast
energy release and particle acceleration, (Altyntsev et al.,
1977; Altyntsev et al., 1981a). (3) Finally, during the non-
linear stage the field structure is very complex and includes
several magnetic islands (Altyntsev et al., 1983). The main
result from the studies is that during a flare several fine,
spatial and temporal, characteristics of the energy release
can be studied in small laboratory experiment.
2.4.2 Electron Acceleration Along the Mag-netic Field With Sub-Dreicer Electric
Fields
In the simulations reported above the main question is:
What is the strength of the electric field during the nonlinear
phase of each of the instabilities? Let us now move one step
forward and ask the question: What will happen to the plasma
in the presence of a pre-existing electric field? Holman (1985)
studied qualitatively the acceleration of runaway electrons
out of the thermal plasma, the simultaneous Joule heating
of the plasma, and their implications for solar flares. He
shows, in agreement with Spicer (1983), that the simple elec-
tric field acceleration of electrons is incapable of producing
a large enough electron flux to explain the bulk of the ob-
served hard X-ray emission from flares as nonthermal brems-
strahlung. For the bulk of the hard X-ray emission to be
nonthermal, at least 104 oppositely directed current chan-
nels are required, or an acceleration mechanism that does
not result in a net current in the acceleration region is re-
quired. He also finds, however, that if the bulk of the X-ray
emission is thermal, a single current sheet can yield the re-
quired heating and acceleration time scales, and the required
electron energies for the microwave emission. This is ac-complished with an electric field that is much less than the
Dreicer field (E/E D - 0.02-0.1). To obtain the requiredheating time scale and electron energies, the resistivity in
the current sheet must be much greater than the classical
2-44

resistivityof aplasmawithn = 109cm-3,Te = 107K.Aplasmadensityof = 10 I1 cm -3 is required in the flaring
region or, if the density in the current sheet is less than 10 II
cm-3, the resistivity in the sheet must be anomalous. The
identity of the microinstability that will enhance the resistivity
is an open question.
Moghaddam-Taaheri and Vlahos (1985) developed a
quasi-linear code to study the time development of runaway
tails in the presence of a D.C. electric field as well as
Coulomb collisions. It is well known that particles with ve-
locities larger than the critical velocity Vcr = (ED/E0"_Ve
can overcome the drag force due to collisions and therefore
can run away. As the bulk is depleted, the rate of particle
flux in the tail decreases and causes the formation of a posi-
tive slope on the distribution of the runaway tail. This process
sets up a spectrum of plasma waves with phase velocities
on top of the runaway tail. The anomalous Doppler shift of
these waves makes it possible for them to interact with fast
electrons in front of the tail, when they acquire the appropri-
ate parallel velocity to satisfy the resonance condition k|v I
= 6°k + [2e" At this point, electrostatic turbulence can bedriven by both Cherenkov and anomalous Doppler effects.
Using different values of E I Moghaddam-Taaheri and
Vlahos showed that for EI/E o = 0.2 (The Dreicer field for
a plasma with density no = 1011 cm -3 and T e = 1 keV is
E D = 6 x 10⁻² V/m) or higher, electrons first stream along
B and then are isotropized and thermalized. For Ell < 0.2
E D the anomalous Doppler-resonance scattering is weak andthe tail is continuously accelerated to higher and higher
velocities. They suggested that weak electric fields (E I <
0.2 ED) along a large fraction of the loop would be a bettercandidate for electron acceleration than the strong localizedelectric fields.
2.4.3 Lower Hybrid Waves
Tanaka and Papadopoulos (1983) have studied numeri-cally the nnnline_ar develnnment nf r_rn_-field r_urre.nt-drive.n- .i ........ t" .................................
lower hybrid waves (modified two-stream instability). They
showed that for Be = (nkTe/(BE/87r)) < 0.3 and ion drift
velocity = 2-3 V i symmetric electron tails are formed, with
average Velocity = 4-5 V e. Smith (1985) has applied theseresults to the solar flare. He proposed that fast tearing modes
occur in a current carrying loop (Spicer 1982). This leads
to dissipation of the poloidal magnetic field and to bulk mo-
tion of the ions across the primarily toroidal field up to 0.3
VA, (Drake, private communication), where the Alfven speed
vA is the speed in the poloidal field Bp. There are no calcu-lations for the energetics of fast tearing, but calculations for
slow tearing (Arion, 1984) indicate that 46% of the energy
released goes into ion kinetic energy for the collisional tear-
ing mode. It must be admitted that simulations (e.g.,Terasawa, 1981) do not show such a large fraction of the
energy going into ion kinetic energy; however, no simula-
tions have approached the magnetic Reynolds number re-
gime of 101° - 1012 relevant for the Sun. For reasonable
parameters (e.g., Bp = 200G, n = 1.5 x 101o cm -3, vA= 3.5 × l0 s cm s -_, T i = 3 x 10_K, v i = (kTi/mi) _'_ =
5 x 107 cm s-l), the bulk velocity 0.3 vA - 2-3 v i, whichis sufficient to excite the modified two stream instability. The
modified two-stream instability is sensitive to the plasma beta03) and saturates for levels of/3 >_ 0.3. Thus once 13increases
due to additional heating and/or a density increase due to
evaporated material traveling back up the loop, the instabil-
ity turns off and efficient electron acceleration would no
longer occur.
2.4.4 Fermi Acceleration and MHD Turbulence
Fermi or stochastic acceleration of particles in turbulentfields is defined as the process that causes particles to change
their energy in a random manner with many increases and
decreases that lead finally to stochastic acceleration. Stochas-
tic acceleration can also result from resonant pitch-angle scat-tering from Alfven waves with wavelengths of the order of
the particle gyroradius. A simple way of understanding this
mechanism is to imagine the random walk of a particle col-
liding with randomly moving infinitely-heavy scatterers (see
Ramaty, 1979 or Heyvaerts, 1981 for a detailed discussion).
The solution of the diffusion equation for the particle distri-
bution (Tverskoi, 1967) can be expressed in terms of modi-
fied Bessel functions for E < < mc 2 (a case applicable to
non-relativistic protons) and as an exponential for E > >
mc 2 (a case relevant to electrons). There are no analytical
solutions for energies in between. The model is defined only
if the velocity of the particle is equal to or larger than the
velocity of the randomly moving scatterers (e.g., Alfven
velocity). In other words, this mechanism needs a pre-
acceleration or heating mechanism to inject particles above
the momentum Po = MiVA" A similar conclusion can bereached from the analysis of MHD waves resonantly inter-
acting with the particles. For example, a quasi-linear equa-
tion can be written that will connect the spectrum of theunstable waves with the diffusion coefficient and the mini-
mum resonance velocity can be estimated from the resonant
condition between the waves and particles. A particle can
resonate with an Alfven wave only when o_ = kmVA = kiVIi
+ nil* or [VII-V A [ = VA I n[2*/o_ [ (where [2* is therelativistic gyrofrequency). Since the highest turbulent fre-
quency of the spectrum is less than the ion gyrofrequency
[2i, 1VII--VA [ > VA [ fl*/[2i I which implies that particle
momentum must be larger than MiV A to resonate. For amagnetic field strength B = 500G and n - 101° cm -3 the
Alfven speed is - 3000 km/s and the threshold velocity for
ions is 0.1 MeV. Melrose (1983) has shown that magneto-
acoustic turbulence with frequency _0 = 30 s-1 can acceler-
ate ions from a threshold velocity of 0.1 MeV to 30 MeVin 2 secs if (_B/B) 2 = 0.1.
2-45

2.4.5 Shock Acceleration
Shock acceleration is currently one of the most intenselystudied subjects in the space and astrophysical literature
(Drury, 1983). During the workshop several new studies of
shock acceleration were presented. We review here the mainresults.
2.4.5.1 Ion Acceleration
Lee and Ryan (1985) have calculated the temporally and
spatially dependent distribution function of particles acceler-
ated by a spherically symmetric coronal blast wave. The
motivation here is to introduce an important geometrical ef-
fect into the calculation of an evolving acceleration to see
if familiar features of accelerated particles can be reproduced.
In order to carry out these calculations a few assumptions
were made which limit the applicability and interpretation
of the results. First, the particles are transported in a dif-
fusive manner, thereby yielding less information about the
earliest shock effects. Secondly, the density of the medium
decreases as r-2 and the collisions are neglected making the
calculations most relevant in dealing with high altitude and
interplanetary acceleration as opposed to acceleration in the
lower corona. Finally, a diffusion coefficient is chosen in
a reasonable form but is independent of energy. This has an
effect on the spectrum of the prompt arrival of particles at
the earth. The three dimensional geometry yields both the
acceleration effects from the shock, the diffusive escape of
particles from the finite-size acceleration region and the de-
celeration effects from the divergent flow behind the shock.The results of the calculations can be summarized as follows.
The spectrum of particles accelerated by the shock is soft
initially but hardens as time progresses, approaching a power
law in the limit. The distribution of particles at a particular
energy peaks in time as a function of that energy. The lower
energy particles peak in number sooner and subsequently
decay away. Higher energy particles take longer to acceler-
ate as one would expect. The time to reach maximum is
roughly proportional to the particle energy, although signifi-
cant numbers of particles at high energies exist initially. The
particle distribution peaks at the shock front and decays awayin a roughly power law fashion ahead of and behind theshock.
Decker and Vlahos (1984) have studied the role of wave-
particle interactions in the shock-drift acceleration mecha-
nism. Between shock crossings the ions are permitted to in-
teract with a pre-defined spectrum of MHD waves [e.g.,Alfven (parallel and oblique)] assumed to exist upstream and
•downstream of the shock. The amplitude and spatial extent
of wave activity in the upstream region is varied as a func-
tion of angle 0Bn between the shock normal and upstream
magnetic field to simulate a decrease in wave activity as 0Bnapproaches 90 °. For each simulation run, they followed
several thousand test ions which were sampled from a speci-fied pre-acceleration distribution and ensemble-averaged
results compared for the wave and non-wave situations. The
results show that even a moderate level of wave activity can
substantially change the results obtained in the absence of
waves. This occurs because at a "single encounter" (dur-
ing which the ion remains within a gyroradius of the shock),the waves perturb the ion's orbit, increase or decrease the
number of shock crossings, and therefore increase or
decrease the shock-drift energy gain relative to the no wave
situation. In particular the presence of waves generally in-
creases both the fraction and average energy of transmitted
ions and produces a smaller, but much more energetic popu-
lation of ions reflected by the shock.
Tsurutani and Lin (1984) have obtained some preliminary
results on shock acceleration from a comprehensive study
of 37 interplanetary shocks which were observed by theISEE-3 spacecraft near 1 AU. In this study the normals to
the shock surface and the shock speed were determined from
plasma and magnetic field parameters, and the energetic par-
ticle response was catagorized. The main finding was that
particle acceleration to > 2 keV for electrons and > 47 keV
for ions depended on the speed of the shock along the up-
stream magnetic field and on the ratio of the downstream
to upstream magnetic field intensities. These results indicate
that magnetostatic reflections of the particles off the shock
itself play a very important role in the acceleration process.
Figure 2.4.2 shows the 37 shock events plotted versus the
shock speed in the upstream medium, and the angle 0Bn be-tween the shock normal and the upstream magnetic field
(small 0Bn implies quasi-parallel shock, 0an near 90 ° imphesquasi-perpendicular shock). The intensity of the particle ac-
celeration due to each shock is indicated by the symbols: anopen circle indicates little or no acceleration or a flux in-
crease of < 20% above ambient pre-shock levels; a Idledcircle indicates an increase of _ 20 % but < 200 %; and a
plus indicates increases of more than 200%. Typical uncer-
tainties in 0Bn are -- 12 °. We see that the open circles group
toward the bottom left of the figure while pluses tend to the
upper right, with f'dled circles in between. The lines are
drawn for constant shock velocity along the upstream mag-
netic field, VsB = Vs/COS 0Bn. The line VsB = 250 km/secthen separates those events with little or no particle acceler-
ation from those with signficant particle acceleration. Figure
2.4.3 shows the same events with Vsa plotted against the ratio
[B2I/IBI I of downstream to upstream magnetic fieldstrength. If the shock acts as a moving magnetic mirror,thenthis mirror will be least effective for small ratios of
I B2 [ / [ B_ I and vice versa. Figure 2.4.3 shows that this
is the case: the open circles all have [B2[ / I Bi I < 1.7
and VsB < 250 km/sec. Events with larger VsB and small[ B2 [ / [ B_ [ (< 1.7) only result in moderate events (filled
circles), while events with both [ B2 [ / I B_ I > 1.7 and VsB> 250 km/sec give rise to large events.
2-46

o@
E
LM
<
<U,In,,I-
Q,,
oo
,i=
>
300
250
200
150
100
5O
ISEE--3
0 0
0
375
1978-1979
310
++
+
+ +
++
0
C
0 I I I
0 30 60 90
OBn
Figure 2.4.2 The shock speed (vs) in the upstream
medium is plotted versus the angle 0Bn between theshock normal and the upstream magnetic field for 37
events observed with ISEE-3 (from Tsurutani and Lin,1984).
2.4.5.2 Electron Acceleration
Type II bursts, associated with flare-generated shock
waves, require Langmuir waves for the production of radio
ily generated by streaming suprathermal electrons, as for
Type III bursts. Since shock-drift acceleration produces
streaming suprathermal electrons upstream of the shock front,Holman and Pesses (1983) have studied the effectiveness of
shock-drift acceleration for generating Type II bursts, and
the observational consequences. They find that the required
level of Langmuir turbulence can be generated with a
relatively small number of accelerated electrons (nb/n> 10 -6) if the angle between the shock normal and the
upstream magnetic field (if) is greater than 80 ° (for a 1000
km s-_ shock). Except for herringbone structure, which re-
quires electron velocities - c/3, the electrons need only be
accelerated to velocities that are a few times greater than the
mean electron thermal velocity upstream of the shock. Band
splitting is explained by the fact that when _bis within a few
degrees of 90 °, no electrons are accelerated. The split bands
1000
80q
m
::_ 400
200
+
+
+ +
+
o+ •
_ +
• +o o
0 00
- o_
IOl1.0 1.5 2.0
B=/BI
1600
3ooo '12oo,+ + . •
++
+ •
++
++
+
I I2.5 3.0
Figure 2.4.3 A scatter plot of the particle flux in-
creases as function of the shock velocity (V s) relativeto the upstream medium (slow solar wind) and the
shock normal angle 0Bn. The particle flux increases(over the upstream ambient) are indicated by the type
of event point used. Open circles represent eventswith little or no effects (less than 20% increases),
solid circles are moderate events with 20-200% in-
creases, and crosses are large events with > 200%increases. The contours are lines of constant veloc-
ity along the upstream magnetic field, VSB = Vs/COS
0Bn (from Tsurutani and Lin, 1985).
are predicted to arise from different spatial locations (sepa-
rated by - 1') upstream of the shock front. Observations
nf Type _ff bursts associated wit_h_coronaA transients haveshown that the emission sometimes arises from locations be-
low and to the sides of the projected front of the white light
transient. Since a shock front is expected both ahead of and
at the sides of the transient, this indicates that special condi-
tions are required for the generation of the Type II burst.
Such a condition appears to be satisfied by shock drift ac-celeration, since the radio burst is only generated when _b is
large (when the shock is quasi-perpendicular).
Wu (1984) and Leroy and Mangeney (1984) have pro-
posed independently that upstream electrons will be reflected
and energized to high energies by the quasi-perpendicular
shock. The theory is based on the adiabatic mirror reflec-
tion, in the appropriate reference frame, of incident elec-
trons by the increase in magnetic field strength which takes
place in the shock-transition region. The average energy per
reflected electron scales for sufficiently large 0Bn as
2-47

[(4/COS20Bn)_,6 meV_] , where vo is the shock velocity. Since
only particles with large perpendicular velocity will be
reflected, this mechanism creates a ring electron distribu-
tion upstream of the shock. This distribution is unstable to
plasma and maser instabilities and can be the source of Type
II bursts. All the geometric effects discussed by Holman and
Pesses (1983) are also present in this mechanism. It can be
shown that for 0Bn = 80-85 o the flare accelerated electrons
can be further energized to 5-10 times their initial energy.
Tsurutani and Lin (1984) applied the same ideas to ions (seediscussion above).
Electrons drift in the shock transition due to one of the
following processes: (a) magnetic field gradient, (b) temper-
ature gradient, or (c) ExB drift. Ions, on the other hand, do
not drift if they are unmagnetized (e.g., when the ion gyro-radius is larger than the shock transition thickness). When
the electron drift velocity exceeds a certain threshold, cross-field current-driven instabilities are excited and are the source
of energy dissipation in collisionless shocks. We discussed
above that lower hybrid drift (or the modified two-stream)
instability can become an efficient acceleration process.
Vlahos etal. (1982) applied this mechanism to the accelera-
tion of electrons during loop coronal transients events. Lower
hybrid waves excited at the shock front propagate radially
toward the center of the loop with phase velocity along the
magnetic field which exceeds the thermal velocity. The lower
hybrid waves stochastically accelerate the tail of the elec-
tron distribution inside the loop. Vlahos et al. discussed how
the accelerated electrons are trapped in the moving loop and
give a rough estimate of their radiation signature. They found
that plasma radiation can explain the power observed in sta-
tionary and moving Type IV bursts.
2.4.6 Acceleration of Electrons by IntenseRadio Waves
A number of observations have shown the nearly simul-
taneous release of secondary electrons streaming from the
surface of the sun (Type III bursts) and the precipitating elec-
trons associated with hard X-ray bursts (see Kane, Pick and
Raoult, 1980; Kane, 1981b; Kane, Benz and Treumann,
1982; Dennis et al., 1984). One possible explanation for the
accelerated electrons that are responsible for the Type HI
bursts is that they result from the primary precipitating elec-
trons which drift out of a flaring loop and get into open fieldlines. However, this mechanism suffers from a number of
difficulties; among them is the fact that the drift rate is ex-
ceedingly slow (Vlahos, 1979), contrary to observations.
Achterberg and Kuijpers (1984) proposed cross-field dif-fusion from MHD turbulence, but the time scale for such
diffusion is still much longer than the observed temporal
correlation between X-rays and Type III bursts.
A recent parallel development has been the discovery of
intense (10 _° - 1011 Watts), narrow-band, highly polarized
microwave bursts observed by Slottje (1978, 1979) and Zhao
and Jin (1982). These observations have been interpreted asthe signatures of unstable electron distributions, formed in-
side a flaring loop, by the flare released precipitating elec-
trons (Holman, Kundu and Eichler, 1980; Melrose and Dulk,
1982; Sharma, Vlahos and Papadopoulos, 1982; Vlahos,Sharma and Papadopoulos, 1983). These observations
together with the lack of a viable explanation for the second-
ary accelerated electrons have motivated Sprangle and Vlahos
(1983) to examine in detail the interaction of a circularly
polarized electromagnetic (e.m.) wave propagating along a
spatially varying, static, magnetic field as a possible acceler-
ation mechanism responsible for the observed secondary elec-
trons. In this process, the relativistic electron-cyclotron
frequency and the wave phase change in such a way that the
resonance between the particles and the wave is maintained
in a uniform magnetic field (Kolomenskii and Lebedev, 1963;
Roberts and Buchsbaum, 1964). For such a process, the in-
tense, polarized, narrow-band e.m. waves observed by Slottje(1978, 1979) provide a link between the energetic electrons
inside the flaring loop and those observed in the outer co-
rona or interplanetary space (Type III bursts). An overall
schematic of the acceleration process proposed by Sprangle
and Vlahos (1983) is shown in Figure 2.4.4. Here theprecipitating primary electrons are accelerated inside a flar-
ing loop and stream toward the chromosphere. These
precipitating electrons can then excite an intense, polarized,narrow-band e.m. wave. This e.m. wave is assumed to es-
cape the flaring loop region and propagate along a open flux
tube where it can accelerate the secondary electrons (see
Figure 2.4.4). A question can be raised here about the pos-sibility of reabsorption of the e.m. wave before it can es-
cape from the flaring loop. This is especially important whenthe excited e.m. wave is near the fundamental electron-
cyclotron frequency or upper-hybrid frequency. The main
assumption here is that the excited wave approaches the
second harmonic resonance with the particles inside the flar-ing loop where the total electron distribution is not Maxwel-
lian. It is therefore amplified instead of damped (Sharma,Vlahos and Papadopoulos, 1982; Vlahos, Sharma and
Papadopoulos, 1983). Sprangle and Vlahos (1983) concluded
that the e.m. wave can accelerate approximately 10 -4 of the
ambient electrons in the acceleration region to approximately100 keV.
Kane, Benz and Treumann (1982) suggested that the closerelation between type III and X-ray bursts is evidence for
the fact that the acceleration region shares open and closedfield lines. Vlahos believes that this mechanism will be com-
peting with the one presented above, since the trapped elec-trons will become quickly the source for e.m. radiation and
will accelerate electrons together with the primary acceler-
ation source. In other words primary and secondary acceler-
ated electrons will be injected into open field lines during
the flash phase of the flare.
2-48

(a) (b)
(c) ELECTROMAGNETICRADIATION (oo,k)
ACCELERATEDELECTRON
LOCALIZEDEXPLOSION (flare)
Y//"/_ ELECTRON CYCLOTRONMASER INSTABILITY
Figure 2.4.4 The development of the intense radio emission driven acceleration is shown for
three different models. Flare released energetic electrons are precipitating towards an increas-
ing magnetic field, reflected and form a loss-cone velocity distribution. Loss-cone driven elec-
tron cyclotron radiation can escape from the loop and accelerate electrons to high energies inside
(a) open field lines, which will explain the hard X-ray/Type III correlation (b) nearby loop, which
will explain the triggering of quadruple like structure observed by the VLA (c) large closed loop,
which will explain the hard X-ray/Type U correlation (Strong et al. (1984), see Section 2.2.5
and Figure 2.2.21) or the hard X-ray/Type V correlation discussed in Section 2.2.
2.4.7 Preferential Acceleration of
Heavy Ions
One of the more intriguing results of energetic solar par-
ticle flux measurements at - 1 AU is the discovery of
anomalous enhancements in the abundance of some ionic spe-
cies during occasional "unusual" .events, often called 3He-
rich flares (Ramaty et al., 1980, and references therein).
Three different types of enhancements can be distinguished
in these events: (1) the enhancement of the isotope 3He by
as much as three and a half orders of magnitude, at energies
1-10 MeV nucleon-t; (2) enhancement of heavy (A >
4) ions by a factor of 5-10; (3) deviations of other chargestates from solar abundances. These are often correlated with3He-rich flares. A review of the observations and theoreti-
cal interpretations is given by Kocharov and Kocharov
(1984). Fisk (1978) proposed the most successful model so
far since it seems to explain not only the enhancement (1),
but also (2) and (3). It is based on selective preheating of
the 3He and certain heavy ions such as Fe by resonant inter-
action with ion cyclotron waves. Such waves can be driven
unstable by electron currents or ion beams. In a pure hydro-
gen plasma, the ion cyclotron waves have a frequency above
the proton cyclotron frequency flH (i.e., _ = (fl_ + k2c_ '_
= 1.2 - 1.4 IIH where cs is the sound speed) (Kadomtsev,1965). However, in the presence of a noticeable amount of
doubly ionized +He + + and for some combinations of drift
velocities and plasma parameters, waves near the 4He ++ cy-
clotron frequency can be excited. Since o_ _- 1.2 fl3m÷÷ =
f13,++÷, 3He+ + can be resonantly accelerated. In addition,ions with A/Q = 3.3 and A/Q = 4.5 can be accelerated
by the harmonics (i.e. o_ = nfl i - kzvz) although less effl-
2-49

ciently.Thesubjectofionenergizationby ioncyclotronwavesinmultispeciesplasmashasbeenrecentlyexaminedbyPapadopoulos,GaffeyandPalmadesso(1980)andSingh,Schunk,andSojka(1981).Itwasnotedthat,forwaveam-plitudesexceedingathreshold,whichdependsonA/Q,ionaccelerationdoesnotrequireresonancebutcanbeverystrongevenforsignificantfrequencymismatch.Thephysi-calprocessresponsibleforthisisresonanceoverlapping.ThegeneraltheorywasgivenbyChirikov(1979),whileitsap-plicationtolowerhybridheatingof fusionplasmascanbefoundinseveralpublications(Fukuyamaet aL, 1978; Karneyand Bers, 1977; Hsu, 1982). It has been called non-resonant
stochastic acceleration to be distinguished from the process
requiring cyclotron resonance [i.e., _ = nfl i - (kzvz)], andwas first shown by Papadopoulos et al. to exhibit a large
selectivity in the ionic A/Q ratio. Varvoglis and Papadopou-
los (1983) revised the model advanced by Fisk (1978) by
including the proper nonlinear physics of particle energiza-tion by electrostatic ion cyclotron (EIC) waves. Their model
retains two basic concepts of Fisk: the energization by EIC
waves and the need for a second stage of acceleration.
However, there is no need for exciting 4He++ cyclotronwaves, since the dominant process is non-resonant and can
be accomplished by hydrogen cyclotron waves. The A/Q
selectivity in the flux available for energization in the second
stage process enters through the nonlinear saturation level
e_b/TH, which in conventional theories (Dum and Dupree,1970; Palmadesso et al., 1974) depends on the current that
drives the instability.
2.4.8 Summary
In contrast to the dynamic and dramatic development of
the observations theoretical studies concerning particle ac-
celeration in a solar environment during a flare are progress-
ing at a steady rate. Part of the problem, of course, is our
poor understanding of the energy-release process in flares,
specifically our poor understanding of the reconnection
theory in solar flares. Nevertheless, the workshop has stimu-
lated several new ideas and provided many concrete ques-
tions for theoretical studies. Here, we pose several questions
regarding theoretical studies of particle acceleration in solarflares.
( 1 ) Is there a single mechanism that will acceleratepar-
ticles to all energies and also heat the plasma ?
We do not know of any such mechanism today. Themechanisms discussed by us either have a threshold for ac-
celeration (like the stochastic Fermi acceleration and shock
acceleration) or heat and accelerate the tail to mildly relativis-
tic energies (Joule heating and sub-Dreicer E-field acceler-
ation or Joule heating and lower hybrid waves). We then
come to the conclusion that the existing theoretical under-
standing of particle acceleration favor the two step acceler-
ation (with one important twist, the two mechanisms must
operate simultaneously at the same place or in close prox-imity to each other).
(2) How fast will the existing mechanisms accelerate
electrons up to several MeV and ions to 1 GeV?
Electric fields, lower hybrid waves and Joule heating canstart, and then heat and accelerate the electrons to 10-100
keV in fractions of a second, lf a shock or a turbulent spec-
trum of waves is already present, it is possible to acceleratethe electrons further to relativistic energies in 2-50 secs.
Melrose (1983) has already pointed out that magnetosonicturbulence can accelerate ions from O. 1 MeV to 30 MeV in
2 s but the question of pre-accelerating ions to O. 1 MeV andthe driving force for the magnetosonic waves has remained
open.
(3) If shocks are formed in a few seconds, can they be
responsible for the prompt acceleration of ions and
electrons ? How are these shocks related to large-
scale shocks which are responsible for the Type Hbursts ?
The shock acceleration as discussed here will not be
appropriate for the prompt acceleration of particles, since
almost all the above theories have assumed a plane quasi-
parallel or quasi-perpendicular shock. In the vicinity of theenergy release region the shock curvature and structure must
be taken into account. The shocks developed inside theenergy release volume during a flare are formed in the middleof an enhanced level of turbulence and laminar shock drift
or purely diffusive acceleration calculations in a parallel
shock are not valid. In summary, our current understandingof particle acceleration in shocks cannot give us an answer
to the above question.
An important question regarding the formation of shocks
inside the energy release region is the lack of evidence for
Type H-like signatures in the decimetric radio frequencies.
Such continuation for the Type III bursts is clearly present.This of course brings us to the next question of the relation
of flares (and shocks developed inside the energy release
volume) to large scale shocks, responsible for the Type II
bursts and particle acceleration in space. This question re-mains unresolved.
(4) Can the electron-cyclotron maser spread the ac-
celeration region?
We suggested that beams of electrons streaming towards
converging magnetic field lines will be reflected and form
loss-cone type velocity distributions in the low corona. A
fraction (< 1-5 %) of the kinetic energy of the energetic elec-
trons will drive electromagnetic waves that can easily spread
the acceleration region to larger volume outside the flaring
region.
2-50

(5) Which of the acceleration mechanisms discussed
above can explain the observed energy spectra (see
discussion on Section 2.3)?
Most of our discussions on the acceleration mechanisms
have been focussed on the energetics and not on the details
of the energy spectrum of the accelerated particles. The only
mechanisms that have successfully explained the observed
spectra is the stochastic Fermi acceleration and quasi-paralleldiffusive shock acceleration. This of course does not exclude
other mechanisms for flare acceleration but places impor-
tant constraints on them. A detailed study of the energy spec-
trum of the accelerated particles must be the goal for anysuccessful acceleration mechanism in solar flares.
Fermi acceleration and acceleration by quasi-parallel
shocks although successful in explaining the energy spec-trum, have not yet fully addressed other questions e.g., shock
and turbulence formation time, formation of appropriate
wave spectra from MHD waves, relation of MHD waves to
energy release process, etc.
2.5 ACHIEVEMENTS -- OUTSTANDING
QUESTIONS
As it is always the case in science, new and more pre-
cise measurements bring us higher in the helix of knowledge
by replacing or revising older concepts with new ones. At
the same time, however, new and more sophisticated ques-
tions are posed which demand even more sophisticated the-
oretical studies. Comparing the results reported in this
chapter with the Skylab work which was reported in two ar-
ticles by Kane et al. (1980) and Ramaty et al. (1980), one
clearly sees this evolution on many concepts of particle ac-
celeration in solar flares. The main achievements are high-
lighted below:
1. The X-ray imaging has, for the first time, provided
evidence for discrete isolated footpoints during the impul-
sive phase. The footpoints gradually evolve and form a single.... • "l_ __ --1 ...... _._ *L- J ...... i_ .... £ .... £I .... /"_-L^.
_UUlUU Ol IIUL plil_,llli_ 111 IAIIG U_-_ty l)ll_bK; UI bUIIIU tidiest, uuIUl
flares never develop footpoints and the thermal plasma
dominates their evolution. Finally, the majority of the ex-
isting X-ray imaging data are very complex and "refuse"
to be placed in simple classes (e.g., A, B, C etc.). The rather
simplistic division of flares to "thermal" and "nonthermal"
seems to be a convenient abstraction for simple theoretical
models. In reality thermal and nonthermal plasma is dialec-
tically connected; "nonthermal plasma" is quickly therma-
lized and from a locally heated plasma energetic particles
emerge. The X-ray imaging has provided evidence for the
interconnection of thermal and nonthermal plasma.
2. The radio images have also put a mark on our under-
standing of evolution of the magnetic topologies that can lead
to a flare. Interacting loops and bipolar structures commonly
observed suggest that loop-like structures are the elemen-
tary components of the flare process.
The isolated loop structure has been assumed to be one
of the possibilities for energy release in flares. There is now
evidence that more complex magnetic topologies (e.g., in-
teracting loops, emerging flux or even a catastrophic inter-
action of many loops) are at work during a flare. The loop,
however, remains as the elementary structure that partici-
pates in these interactions.
3. The radio maps at meter wavelengths and detailed
studies of the meter/X-ray correlation also point to the direc-
tion that the region of acceleration must encompass open andclosed field lines, and that it is located at the low corona.
4. Analyzing the time evolution of the flare energy
release process with high time resolution instruments has
provided an unprecedented wealth of information that will
take years to interpret physically. Pulsations arise in several
wavelengths, some of them quasi-periodic, some of themchaotic. Fast pulses with durations that sometimes reach the
instrumental resolution and delays between pulses in differ-
ent wavelengths are among the new results. Some of the ob-
served pulses are clearly the result of pulsations in theacceleration source, but in other cases the pulses are the resultof the radiation mechanism.
5. For many years we believed that prior to a flare the
Sun operates in a steady state norm that keeps the coronal
plasma around 2 x 10⁶K. During a flare the energization
mechanism will "process" this 2 x 10⁶K Maxwellian dis-
tribution to a new "heated" and "accelerated" plasma state.
We have provided evidence that show that (1) the accelera-
tion starts before the flash phase and continues after the im-
pulsive phase of the flare, (2) "microflares" continuously
occur in the corona and develop nonthermal tails. Thus, the
acceleration may start from a distorted Maxwellian that is
developed long before the impulsive phase. Furthermore, we
presented evidence that suggest that the number of flares in-
creases as the total energy per flare decreases, which indi-
cates that there is no threshold for reconnection and "flaring"
and "heating" smoothly join each other.
Int_nc_ eah_r_nt po!ari_Ted _m__icrowavennl_e.q some-........... , .......... , r ............
times occur during a flare. They may be the result of the
conversion of kinetic energy of the precipitating electrons
to electromagnetic radiation through the convergence of mag-netic field lines.
7. Observations from gamma-ray detectors on SMM
have dramatically changed our thinking of the way particlesare accelerated in the Sun. The conventional two phase ac-
celeration (a prompt first phase acceleration of mildlyrelativistic electrons followed by a slower second phase ac-
celeration that energizes the ions and accelerates further theelectrons to relativistic electrons) had to be abandoned, be-
cause in many flares fast synchronous (or nearly syn-
chronous) pulses occur simultaneously in several energychannels. Hence, the concept of prompt acceleration of both
electrons and ions to all energies in a few seconds is a new
important discovery, which will change our thinking on par-
2-51

ticleacceleration.However,particlesobservedin inter-planetaryspacemaybeacceleratedby thesecond-phaseacceleration.
8. Wehaveevidencethattheaccelerationofrelativisticelectronsandionsmustbeacommonphenomenonduringflares.
WehaveoutlinedseveralquestionsthatneedfurtherstudyinSections2.2.7,2.3.7and2.4.8.Webelievethatmanydetailedobservationalstudiesarestill neededandweout-linesomeof themhere:
• Stereoscopic observations of hard X-rays which have been
discussed briefly in this chapter, may provide informa-
tion about the precipitating electrons and the validity of
the thick target model.
• X-ray imaging at higher energies and hard X-ray polar-
ization measurements will be valuable for knowing the
critical energy that divides the thermal from the nonther-
mal component of flares.
• Detailed studies of the time structures of hard X-ray bursts
may give us clues to the time development of the energyrelease mechanism.
• Detailed studies of hard X-ray and radio microflares and
the pre- and post-impulsive phase activity are of fun-
damental importance.
• Spectral evolution during hard X-ray pulsations is an im-portant source of information.
• Radio maps in different wavelengths with high time reso-
lution accompanied by detailed models of the radiating
source will play an important role in our understanding
of the evolution of magnetic field topologies in the courseof a flare.
• Detailed studies of the delays of the starting and peak time
in different energy channels will restrict our choices on
particle acceleration mechanisms. Spectral evolution is
also a powerful tool to study the presence of more thanone acceleration mechanism.
A number of outstanding theoretical problems remain
open for future studies:
• Several new concepts have recently emerged concerningthe energy release process during reconnection but usually
these concepts address questions related to the energetics
and not to particle acceleration. We believe that detailed
studies on heating, energetic tail formation and energy
spectra of electrons and ions energized during reconnec-
tion are of fundamental importance.
• The details of the Magnetohydrodynamic waves that are
excited during a flare are not well known. We believe that
this is a major problem that deserves immediate attention.
Of particular importance are questions related to the on-
set time, power spectrum of the excited waves, etc.
• Acceleration of ions, stability of propagating ion beams
and the importance of energetic ions during a flare mustbe examined in detail.
• The mechanisms for electron and ion heating are not wellunderstood and must be examined in detail.
• Prompt formation of shocks and shock acceleration of
electrons and ions is a problem that must be reexamined
in the light of the results presented in this chapter.
• The interaction of "hot" and "cold" plasma during a
flare, the formation and propagation of the so called "con-
duction fronts" is a fundamental astrophysical problem.
Detailed numerical, analytical and observational studies
(using X-ray imaging) must continue.
• Magnetic models for the acceleration and radiation source,
using model velocity distributions must be developed forboth electrons and ions in all energies. These models serve
to restrict or eliminate acceleration mechanisms by com-paring the resulting radiation signatures from the modelwith the data.
• The response of coronal plasma to Sub-Dreicer and muchstronger than the Dreicer electric fields is an area that we
have not explored in detail. The formation of such poten-
tial drops in coronal conditions is also an open question.• The time evolution of the acceleration mechanism is a
higher order problem but the detailed observations, out-
lined above, demand such studies and must be placed inthe agenda for careful study.
The achievements and outstanding questions posed in this
chapter are of fundamental importance for the entire as-
trophysical community, since the impulsive energy release
and particle acceleration observed during a flare is a
phenomenon that must be occuring in many space and labora-
tory plasmas. We believe that our work will serve to gener-
ate new ideas and interpretations of the results presented
during the workshop. We are aware that some of the ques-
tions posed by us are complex and will require detailed ob-
servational and theoretical studies for many years to come.
We hope that our effort will be a guide for these studies.
2.6 ACKNOWLEDGEMENTS
The material presented in this chapter has been discussed
by the members of team B in three separate one-week meet-
ings of the Solar Maximum Mission Workshops at Green-
belt, Maryland in 1983-84. During the workshops, Marcos
Machado led the discussion on "phenomena associated with
mildly-relativistic electrons", Reuven Ramaty led the dis-
cussion on the "phenomena associated with ions and relativis-tic electrons" and Loukas Vlahos led the discussion on
"theoretical studies of particle acceleration". The authors
of this chapter would like to thank their colleagues, J. Brown,
B. Dennis, M. Forman, G. Dulk, P. Cargill, A. Raoult, P.Sprangle, N. Vilmer, V. Tomozov and H. Wiehl, for many
helpful discussions and suggestions.
2-52
L

2.7 REFERENCES
Achterberg, A. and Kuijpers, J. 1984, Astron. Astroph., 130, 111.
Alissandrakis, C.E. and Kundu, M.R. 1985, in preparation.
Alissandrakis, C.E. and Preka-Papadema, P. 1984, Astron.
Astroph., 139, 507.
Altyntsev, A.T., Krasov, V.I. and Tomozov, V.M. 1977, Solar
Phys., 55, 69.
Altyntsev, A.T., Bardakov, V.M. and Krasov, V.I. 1981, ZhETF,
81,901.
Altyntsev, A.T., Krasov, V.I., Lebedev, N.V., Paperny, V.L. and
Simonov, V.G. 1983, Preprint SiblZMIR No. 23-83, Irkutsk.
Altyntsev, A.T., Krasov, V.I. and Tomozov, V.M. 1984, Solar
Flares and Plasma Experiments. Astronomiya, v. 25, Moscow,
p. 99-191.
Arion, D. 1984, Ap. J., 277, 841.
Aschwanden, M.J., Wiehl, H.J. Benz, A.O. and Kane, S.R. 1985,
Solar Phys., in press.
Athay, R.G. 1984, Solar Phys., 93, 123.
Bai, T. 1982, in Gamma Ray Transients and Related Astrophysi-
cal Phenomena, R. E. Lingenfelter, et al. (ed.), (New York:
AIP), p. 409.
Bai, T. and Ramaty, R. 1979, Ap. J., 227, 1072.
Bai, T. and Dennis, B.R. 1985, Ap. J., in press.
Bai, T., Kiplinger, A.L. and Dennis, B.R. 1985, Ap. J., submitted.
Bai, T., Dennis, B.R., Kiplinger, A.L., Orwig, L.E. and Frost,
K.J. 1983a, Solar Phys., 86, 409.
Bai, T., Hudson, H.S., Pelling, R.M., Lin, R.P., Schwartz and
von Rosenvinge, T.T. 1983b, Astrophys. J., 267, 433.
Barbosa, D.D. 1979, Ap. J., 233, 383.
Batchelor, D.A., Crannell, C.J., Dennis, B.R., Wiehl, H.J. and
Magun, A. 1985, Ap. J., in press.
Benz, A.O. 1985, Solar Phys., in press.
Benz, A.O., Zlobec, P. and Jaeggi, M. 1982, Astr. Ap., 109, 305.
Benz, A.O., Bernold, T.E.X. and Dennis, B.R. 1983a, Ap. J.,
271,355.
Benz, A.O., Barrow, C.H., Dennis, B.R., Pick, M., Raoult, A.
and Simnett, G. 1983b, Solar Phys., 83, 267.
Benz, A.O., Achwanden, M.J. and Wiehl, J.J. 1984, Decimetric
Radio Emission During Solar Flares, Kunming Workshop
Proceedings, in press.
Bratenahl, A. and Baum, P.J. 1985, in Unstable Current Systems
and Plasma Instabilities in Astrophysics, ed. M. R. Kundu and
G. D. Holman, D. Reidel, p. 147.
Brown, J.C. 1971, Solar Phys., 18, 485.
Brown, J.C. 1972, Solar Phys., 26, 441.
Brown, J.C. 1973, Solar Phys., 28, 151.
Brown, J.C. and McClymont, A.N. 1976, Solar Phys., 41, 135.
Brown, J.C., Melrose, D.B. and Spicer, D.S. 1979, Ap. J.,
228, 592.
Brown, J.C. and Smith, D.F. 1980, Rep. Prog. Phys., 43, 125.
Brown, J.C., Craig, I.J.D. and Karpen, J.T. 1980, Solar Phys.,
67, 143.
Brown, J.C., Mackinnon, A.L., Zodi, A.M. and Kaufmann,
P. 1983a, Astron. Astrophys., 123, 10.
Brown, J.C. Carlaw, V.A., Cromwell, D. and Kane, S.R. 1983b,
Solar Phys., 88, 281.
Brunel, F., Tajima, T. and Dawson, J.M. 1982, Phys. Rev. Lett.,
49, 323.
Butz, M., Hirth, W., Furth, E. and Harth, W. 1976, Sond.
Kelinheubacher Berichte, 19, 345.
Chirikov, B.V. 1979, Phys. Rev., 52, 264.
Chupp, E.L. 1982, in Gamma Ray Transients and Related Astro-
physical Phenomena, R. E. Lingeffelter, et al. (ed.), (New York:
AIP), p. 363.
Chupp, E.L. 1983, Solar Phys., 86, 383.
Chupp, E.L. 1984, Ann. Rev. Astron. Astrophys., 22, 359.
Chupp, E.L., et al., 1981a, Ap. J. (Letters), 244, L171.
Chupp, E.L., Forrest, D.J., Higbie, P.R., Suri, A.N., Tsai, C. and
Dunphy, P.P. 1973, Nature, 241, 333.
Chupp, E.L., Forrest, D.J., Ryan, J.M., Heslin, J., Reppin,
C., Pinkau, K., Kanbach, G., Rieger, E. and Share, G.H. 1982,
Ap. J. (Letters), 263, L95.
Chupp, E.L., Forrest, D.J., Kanbach, G., Share, G.H. 1983, 19th
Int. Cosmic Ray Conf., (late papers Bangalore), p. 334.
Cliver, E., Share, G., Chupp, E., Matz, S., Howard, R., Koomen,
M., McGuire, R., and Von Rosenvinge, T. 1982, Bull. AAS,
14, 4, 874.
Cliver, E.W. et al., 1983a.
Cliver, E.W., Forrest, D.J., McGuire, R.E. and Von Rosenvinge,
T.T. 1983, in: 18th Internafonal Cosmic Ray Conference Papers
(Late Papers), Bangalore, p. 342.
Cook, W.R., Stone, E.C. and Vogt, R.E. 1984, Ap. J., 279, 827.
Coppi, B., Galvao, R., Pellat, R., Rosenbluth, M.N. and Ruther-
ford, P.H. 1976, Sov. J. Plasma Phys., 2, 533.
Costa, J.E.R. and Kaufmann, P. 1983, Astron. Astrophys.
119, 131.
Crannell, C.J. Frost, K.J., Matzler, C., Ohki, K. and Saba, J.L.
1978, Ap. J., 223, 620.
Craig, I.J.D., MacKinnon, A.L. and Vilmer, N. 1985, Mon. Not.
Roy. Ast. Soc., submitted.
Datlowe, D.W., Elcan, M.J. and Hudson, H.S. 1974, Solar Phys.,
39, 127.
Debrunner, H., Fluckiger, E., Chupp, E.L. and Forrest, D.J. 1983,
in: 18th International Cosmic Ray Conference Papers 4,
Bangalore, p. 75.
Debrunner, H., Fluckiger, E., Lockwood, J.A. and McGuire, R.E.
1984, Journal Geoph. Res., 89, 769.
Decker, R.B. and Vlahos, L. 1985, Journal Geop. Res., 90, 47.
DeJager, C. 1969, in: COSPAR Symposium on Solar Flares and
Space Research, eds. C. DeJager and Z. Svestka, p. 1.
DeJager, C. and De Jonge, G. 1978, Solar Phys., 58, 127.
Dennis, B.R., et al., 1983, NASA TM 84998.
Dennis, B.R., Benz, A.O., Ranieri, M. and Simnett, G. 1984, Solar
Phys., 90, 383.
Drake, J.F., Pritchett, P.L. and Lee, Y.C. 1978, UCLA Phys Rept.
PPG-341, unpublished.
Droge, F. 1977, Astron. Astroph., 57, 285.
Dreicer, H. 1959, Phys. Rev., 115, 238.
Drury, L.O.C. 1983, Rep. Progr. Phys., 46, 973.
Duijveman, A. 1983, Solar Phys., 84, 189.
Duijveman, A. and Hoyng, P. 1983, Solar Phys., 86, 289.
Duijveman, A., Hoyng, P. and Machado, M.E. 1982, Solar Phys.,
81, 137.
Dum, C.T. and Dupree, T.D. 1970, Phys. Fluids, 13, 2064.
Dumas, G., Caroubalos, C. and Bougeret, J.L. 1982, Solar Phys.,
81, 2.
Elliott, H. 1969,in Solar Flares and Space Research, (ed. C. de
2-53

JagerandZ.Svestka),NorthHolland,Amsterdam,p.356,Ellison,D.C.andRamaty,R. 1985,AdvancedSpaceRes.
(COSPAR),4, 7, 137.
Emslie, A.G. 1978, Ap. J., 224, 241.
Emslie, A.G. 1980, Ap. J., 235, 1055.
Emslie, A.G. 1981a, Astrophys. Letters, 22, 171.
Emslie, A.G. 1981b, Ap. J., 245, 711.
Emslie, A.G. 1983, Ap. J., 271, 367.
Emslie, A.G. and Vlahos, L. 1980, Ap. J., 242, 359.
Evenson, P., Meyer, P. and Pyle, K.R. 1983, Ap. J., 274, 875.
Evenson, P., Meyer, P., Yanagita, S. and Forrest, D.J. 1984,
Ap. J., 283, 439.
Field, G.B. 1965, Astrophys. J., 142, 531.
Fisk, L. A. 1978, Ap. J., 224, 1048.
Forman, M.A., Ramaty, R. and Zweibel, E.G. 1985, in: The Phys-
ics of the Sun, eds. P. A. Sturrock et al., Reidel, Dordrecht,
in press.
Forrest, D.J. 1983, in: Positron-Electron Pairs in Astrophysics,
eds. M.L. Burns, A.K. Harding and R. Ramaty, A.I.P., N.Y.,
p. 3.
Forrest, D.J. and Chupp, E.L. 1983, Nature, 305, 291.
Frost, K.J. and Dennis, B.R. 1971, Ap. J., 165, 655.
Fukuyama, A., Momota, H. Itatani, R. and Takizuka, T. 1977,
Phys. Rev. Lett., 38, 101.
Furth, H.P., Killeen, J. and Rosenbluth, M.N. 1963, Phys. Fluids,
6, 459.
Gaizauskas, V. and Tapping, K.F. 1980, Ap. J., 241, 804.
Gardner, B.M., Forrest, D.J., Chupp, E.L., et al., 1981, Bull.
AAS, 13, 903.
Ginzburg, V.L. and Syrovatskii, S.I. 1964, The Origin of Cosmic
Rays, (New York: MacMillan).
Gloeckler, G. 1985, Advances Space Res. (COSPAR), 4, 2, 127.
Heyvaerts, J. 1981, "Particle Acceleration in Solar Flares," in Solar
Flare Magnetohydrodynamics, ed. E. R. Priest, Gordon and
Breach, New York City, pp. 429-555.
Heyvaerts, J. and Priest, E.R. 1984, Astr. Astroph., 137, 63.
Heyvaerts, J., Priest, E.R. and Rust, D.M. 1977, Ap. J., 216, 123.
Holman, G.D. 1984, Ap. J., 293, in press.
Holman, G.D. and Pesses, M.E. 1983, Ap. J., 267, 837.
Holman, G.D., Eichler, D. and Kundu,M.R. 1980, in Proceed-
ings of IAU Symposium 86, "Radio Physics of the Sun",
Kundu, M.R. and Gergely, T.E., eds. (Dordrecht: Reidel),
p. 457.
Holman, G.D., Kundu, M.R. and Papadopoulos, K. 1982, Ap. J.,
257, 354.
Hoyng, P., Brown, J.C. and van Beck, H.F. 1976, Solar Phys.,
48, 197.
Hoyng, P., Duijveman, A., Machado, M.E. et al., 1981, Ap. J.
(Letters), 246, L155.
Hoyng, P., Marsh, K.A., Zirin, H. and Dennis, B.R. 1983, Ap. J.,
268, 865.
Hsu, J.Y. 1982, Phys. Fluids, 25, 179.
Hudson, H.S., Canfield, R.C. and Kane, S.R. 1978, Solar Phys.,
60, 137.
Hudson, H.S., Bai, T., Gruber, D.G., Matteson, J.L., Nolan, P.L.
and Peterson, L.E. 1980, Ap. J. (Letters), 236, L91.
Ibragimov, I.A. and Kocharov, G.E. 1977, Sov. Astron. Lett.,
3(5), 221.
Kadomtsev, B.B. 1965, Plasma Turbulence (London: Academic),
p. 73.
Kai, K. and Kosugi, T. 1985, Publications of Astr. Soc. Japan,
37, 155.
Kane, S.R. 1972, Solar Phys., 27, 174.
Kane, S.R. 1973, in High Energy Phenomena on the Sun, ed.
R. Ramaty and R. G. Stone), (Washington: NASA), p. 55.
Kane, S.R. 1974, in Coronal Disturbances, G. Newkirk, Jr. (ed),
IAU Symp. 57, Reidel, p. 105.
Kane, S.R. 1981a, Astrophys. Space Sci., 75, 163.
Kane, S.R. 1981b, Ap. J., 247, 1113.
Kane, S.R. 1983, Solar Phys., 86, 355.
Kane, S.R. and Anderson, K.A. 1970, Ap. J., 162, 1003.
Kane, S.R. and Pick, M. 1976, Solar Physics., 47, 293.
Kane, S.R. and Raoult, A. 1981, Ap. J. (Letters), 248, L77.
Kane, S.R., Pick, M. and Raoult, A. 1980, Astrophys. J.,
241, L113.
Kane, S,R., Benz, A.O. and Treumann, R.A. 1982, Ap. J., 263.
Kane, S.R., Kreplin, R.W., Martres, M.J., Pick, M. and Soru-
Escaut, I. 1974, Solar Physics, 38, 483.
Kane, S.R., Anderson, K.A., Evans, W.D., Klebesadel, R.W. and
Laros, J. 1979, Ap. J. (Letters), 233, L151.
Kane, S., Anderson, K., Evans, W., Klebesadel, R. and Laros,
J. 1980, Ap. J., 239, 85-88.
Kane, S.R., Fenimore, E.E., Klebesadel, R.W. and Laros, J.G.
1982, Astrophys. J., 254, L53.
Karney, C.F.F. and Bers, A. 1977, Phys. Rev. Letters, 39, 550.
Kaufmann, P., Iacomo, Jr. P., Koppe, E.H. Santos, P.M. Schaal,
R. E. and Blakey, J.R. 1975, Solar Phys., 45, 189.
Kaufmann, P., Piazza, L.R., Schaal, R.E. and Iacomo Jr., P. 1978,
Ann. Geophys., 34, 105.
Kaufmann, P., Strauss, F.M., Raffaelli, J.C. and Opher, R. 1980a,
In: Donnelly, R.F., ed. -- Solar Terrestrial Predictions Proceed-
ings, V. 3, Solar Activity Predictions.
Kaufmann, P. Strauss, F.M., Opher, R. and Laporte, C. 1980b,
Astron. Astrophys., 87, 58.
Kaufmann, P. Strauss, F.M., Schaal, R.E. and Laporte, C. 1982a,
Solar Phys., 78, 389.
Kaufmann, P., Costa, J.E.R. and Strauss, F.M. 1982b, Solar Phys.,
81, 159.
Kaufmann, P., Strauss, F.M., Costa, J.E.R., Dennis, B.R.,
Kiplinger, A., Frost, K.J. and Orwig, L.E. 1983, Solar Phys.,
84, 311.
Kaufmann, P., Correia, E., Costa, J.E.R., Dennis, B.R. Hurford,
G.J. and Brown, J.C. 1984, Solar Phys., 91, 359.
Kaufmann, P., Correia, E., Costa, J.E.R., Sawant, H.S. and Zodi
vaz, A.M. 1985, Solar Phys., 95, 155.
Kawabata, K., Ogawa, H. and Suzuki, I. 1983, Solar Phys.,
86, 247.
Klein, L., Anderson, K., Pick, K.M., Trottet, G., Vilmer, N. and
Kane, S.R. 1983, Solar Phys., 84, 295.
Kocharov, L.G. and Kocharov, G.E. 1984, Space Sci. Rev., 38, 89.
Koiomenskii, A.A. and Lebedev, A.N. 1963, Soviet Phys. DON.,
7, 745.
Kosugi, T., Kai, K. and Suzuki, T. 1983, Solar Phys., 87, 373.
Kozlovsky, B. and Ramaty, R. 1977, Astrophys. Lett., 19, 19.
Kuijpers, J., van der Post, P. and Slottje, C. 1981, Astron.
Astrophys., 103, 331.
Kundu, M.R. 1981, Proc. SMY Workshop, Crimea, p. 26.
Kundu, M.R. and Shevgaonkar, R.K. 1985, Ap. J., 291, 860.
Kundu, M.R., Rust, D.M. and Bobrowsky, M. 1983, Ap. J.,
265, 1084.
2-54

Kundu,M.R.,Schmahl,E.J.,Velusamy,T.andVlahos,L. 1982,Astron.Astrophys.,108, 188.
Kundu, M.R., Machado, M., Erskine, F.T., Rovira, M.G. and
Schmahl. E.J. 1984, Astron. Astrophys., 132, 241.
Langdon, A.B. and Lasinski, B.F. 1976, Methods in Computational
Physics, Academic Press, N.Y., Vol. 16, p. 327.
Lantos, P., Pick, M. and Kundu, M. 1984, Ap. J., 283, L71.
Leach, J. and Petrosian, V. 1981, Ap. J., 251,781.
Leboeuf, J.N., Tajima, T. and Dawson, J.M. 1982, Phys. Fluids,
25, 784.
Lee, M.A. and Ryan, J.M. 1985, Ap. J., submitted.
Leroy, M. and Mangeney, A. 1984, Ann. Geoph. Gauthier Villars,
in press.
Lin, A.T., Dawson, J.M. and Okuda, H. 1974, Phys. Fluids,
17, 1995.
Lin, R.P. and Hudson, H.S. 1976, Solar Phys., 50, 153.
Lin, R.P. et al., 1981, Ap. J. (Letters), 251, L109.
Lin, R.P., Mewaldt, R.A. and Van Hollebeke, M.A.I. 1982,
Ap. J., 253, 949.
Lin, R.P., Schwartz, R.A., Kane, S.R., Pelling, R.M., and Harley,
K.C. 1984, Ap. J., (in press).
Machado, M.E. 1983a, Adv. Space Res., 2, No. 11, 115.
Machado, M.E. 1983b, Solar Phys., 89, 133.
Machado, M.E. and Lerner, G. 1984, Adv. Space Res., in press.
Machado, M.E., Duijveman, A. and Dennis, B.R. 1982, Solar
Phys., 79, 85.
Machado, M.E., Rovira, M.G and Sneibrun, C. 1985, Solar Phys.,
in press.
Machado, M.E. Somov, B.V. Rovira, M.G.and de Jager, C. 1983,
Solar Phys., 85, 157.
MacKinnon, A.L. and Brown, J.C. 1983, Astron. Astrop.,
132, 229.
MacKinnon, A.L., Brown, J.C. and Hayward, J. 1984, Solar Phys.
in press.
MacKinnon, A.L., Brown, J.C., Trottet, G. and Vilmer, N. 1983,
Astron. Astrophys., 119, 297.
Makishima, K. 1982, Proc. HINOTORI symposium on solar flares,
ed. Y. Tanaka, et al., p. 120, published by the Institute of Space
and Astronautical Science, Tokyo.
Manheimer, W. 1977, Phys. Fluids, 20, 165.
Marsh, K.A. and Hurford, G. 1980, Ap. J. (Letters), 240, LI 11.
Mason, G.M., G!oeck!er, G. and Hovestadt, D. !984, ApJ
280, 902.
Matzler, C., Bai, T., Crannell, C.J. and Frost, K.J. 1978, Ap. J.,
223, 1058.
Matthaeus, W.H. 1982, Geoph. Res. Lett., 9, 660.
Matthaeus, W.H., Ambrosiano, J.J. and Goldstein, M.L. 1984,
Phys. Rev. Lett, L53, 1449.
Matthaeus, W.H. and Montgomery, D.C. 1981, J. Plasma Phys.,
25, 11.
McDonald, F.B. and Van HoUebeke, M.A.I. 1985, Ap. J. (Lett.).
McGuire, R.E. and von Rosenvinge, T.T. 1985, Advances Space
Res. (COSPAR), 4, 2, 117.
Melrose, D.B. 1983, Solar Phys., 89, 149.
Melrose, D.B. and Brown, J.C. 1976, Mon. Not. Roy. Astron.
Soc., 176, 15.
Melrose, D.B. and Dulk, G.A. 1982, Ap. J., 259, 844.
Mercier, C. 1975, Solar Phys., 45, 169.
Mewaldt, R.A., Spalding, J.D. and Stone, E.C. 1984, Ap. J.,
280, 892.
Moghaddam-Taaheri, E. and Vlahos, L. 1985, Ap. J., submitted.
Moriyama, F. et al., 1983, Annals of Tokyo Astron. Observatory,
Vol. XIX, No. 2, 276.
Murphy, R.J. Ph.D. Dissertation, University of Maryland (in
preparation 1985).
Murphy, R.J. and Ramaty, R. 1985, Advances Space Res.
(COSPAR), 4, 7, 127.
Nakajima, H., Dennis, B.R., Hoyng, P., Nelson, G., Kosugi,
T. and Kai, K. 1984a, Ap.J., submitted.
Nakajima, H., Dennis, B.R., Tajima, T., Brunel, F. and Sakai,
J. 1984b, Ap. J. (Letters), submitted.
Nakajima, H., Kosugi, T. and Enome, S. 1983, Nature, 305, 292.
Oda, M. 1983, Adv. Space Res., 2, p. 207.
Ohki, K., Takakura, T., Tsuneta, S. and Nitta, N. 1983, Solar
Phys., 86, 301.
Orwig, L.E., Frost, K.J. and Dennis, B.R. 1980, Solar Phys.,
65, 25.
Palmadesso, P.J., Coeffey, T.P., Ossakow, S.L. and Papadopoulos,
K. 1974, Geophys. Res. Letters, 1, 105.
Parker, E.N. 1983a, Ap. J., 264, 635.
Parker, E.N. 1983b, Ap. J., 264, 642.
Papadopoulos, K. Gaffey, J.D., Jr., and Paimadesso, P.J. 1980,
Geophys. Res. Letters, 7, 1014.
Pesses, M.E. 1983, Advance Space. Res., 2, 11, 255.
Petrosian, V. t982, Ap. J. (Letters), 255, L85.
Prince, T.A., Ling, J.C., Mahoney, W.A., Riegler, G.R. and
Jacobson, A.S. 1982, Ap. J. (LeVers), 255, L81.
Prince, T.A., Forrest, D.J., Chupp, E.L., Kanbach, G. and Share,
G.H. 1983, in: 18th International Cosmic Ray Conference
Papers 4, Bangalore, p. 79.
Ramaty, R. 1979, Particle Acceleration Mechanisms in Astrophyics,
American Institute of Physics, New York, p. 135.
Ramaty, R. 1985, in Holzer, T.E., Mahalas, D., Sturrock, P.A.,
Ulrich, R.K. (eds), Physics of the Sun p. 1.
Ramaty, R. and Crannell, C.J. 1976, Ap. J., 203, 766.
Ramaty, R., Kozlovsky, B. and Lingenfelter, R.E. 1975, Space
Sci. Rev., 18, 341.
Ramaty, R., Kozlovsky, B. and Lingenfelter, R.E. 1979, Ap. J.
(Suppl.), 40, 487.
Ramaty, R., Kozlovsky, B. and Suri, A.N. 1977, Ap. J., 214, 617.
Ramaty, R. and Murphy, R.J. 1984, in: High Energy Transients
in A._trophysies: ed. S. Woosley, A.I.P., N.Y., p. 628.
Ramaty, R., Murphy, R.J., Kozlovsky, B. and Lingenfelter, R.E.
1983a, Solar Phys., 86.
Ramaty, R., Murphy, R.J., Kozlovsky, B. and Lingenfelter, R.E.
1983b, Ap. J. (Letters), 273, L41.
Ramaty, R. et al., 1980, Solar Flares, ed. P.A. Sturrock (Boul-
der: Colorado Associated University Press).
Raoult, A. and Pick, M. 1980, Astron. Astrop., 87, 63.
Raoult, A., Pick, M. Dennis, B. and Kanes, S.R. 1984, Ap. J.,
submitted.
Rieger, E., Reppin, C., Kanbach, G., Forrest, D.J., Chupp, E.L.
and Share, G.H. 1983, in: 18th International Cosmic Ray Con-
ference Papers (Late Papers), Bangalore, p. 238.
Rieger, E. 1982, in Hinotori Symp. on Solar Flares (Tokyo: Inst.
Space Astronautical Sci.), p. 246.
Roberts, C.S. and Buchsbaum, S.J. 1964, Phys. Rev. A., 135, 381.
Rowland, H.L. and Vlahos, L. 1984, Astron. Astrop., 142,219.
Rosner, R., Tucker, W.H. and Vaiana, G.S. 1978, Ap. J.,
220, 643.
2-55

Rust,D.M.,Benz,A.O.,Hurford,G.T.,Nelson,G.,Pick,M.andRuzdjak,V. 1981,Ap.J.(Lett),244, L179.
Ryan, J. 1985, Solar Phys. (submitted).
Sato, T., Matsumoto, H. and Nagai, K. 1982, J. Geoph. Res.,
87, 6089.
Schnack, D.D. and Killeen, J. 1979, Nucl. Fusion, 19, 877.
Schwartz, R.A. 1984, Ph.D. Thesis, University of California,
Berkeley, CA.
Share, G.H., Chupp, E.L., Forrest, D.J. and Rieger, E. 1983, in:
Positron-Electron Pairs in Astrophys, eds. M.L. Burns, A.K.
Harding and R. Ramaty, A.I.P., N.Y., p. 15.
Sharma, R.R. and Vlahos, L. 1984, Ap. J., 280, 405.
Sharma, R.R., Vlahos, L. and Papadopoulos, K. 1982, Astron.
Astrophys., 112, 377.
Singh, N., Schunk, R.W. and Sojka, J.J. 1981, Geophys. Res. Let-
ters, 8, 1249.
Slottje, C. 1978, Nature, 275, 520.
Slottje, C. 1979, in IAU Symposium 86, Radio Physics of the Sun,
ed. M.R. Kundu and T.E. Gergely (Dordrecht: Reidel) p. 173.
Smith, D.F. 1980, Solar Phys., 66, 135.
Smith, D.F. 1985, Ap. J., 288, 801.
Smith, D.F. and Lilliequist, C.G. 1979, Ap. J., 232, 582.
Smith, D.F. and Harmony, D.W. 1982, Ap. J., 252, 800 (SH2).
Somov, B.V., Stepanov, V.E., Stepanyan, N.N and Tomozov,
V.M. 1983, Phys. Solariterr., No. 20, Potsdam, p. 5.
Speiser, T.W. 1967, J. Geoph. Res., 76, 8211.
Spicer, D.S. 1982, Space Sci. Rev., 31, 351.
Spicer, D.S. 1983, Advances in Space Research, 2, 135.
Sprangle, P. and Vlahos, L. 1983, Ap. J., 273, L95.
Steinolfson, R.S. and Van Hoven, G. 1983, Phys. Fluids, 26, 117.
Steinolfson, R.S. and van Hoven, G. 1984a, Astrophys. J.,
276, 391.
Steinolfson, R.S. and Van Hoven, G. 1984b, Phys. Fluids,
27, 1207.
Stewart, R.T. 1978, Solar Physics, 58, 121.
Strong, K.T., Benz, A.O., Dennis, B.R., Leibacher, J.W., Mewe,
R., Poland, A.I., Schrijver, J., Simnett, G., Smith, J.B. Jr. and
Sylwester, J. 1984, Ap. J., in press.
Sturrock, P.A. 1974, in IAU Symp. 57, Coronal Disturbances,
G. Newkirk (ed.), 437.
Sturrock, P.A., Kaufmann, P., Moore, R.L. and Smith, D. 1985,
Solar Phys., 94, 341.
Tajima, T. 1982, in Fusion Energy -- 1981, (International Energy
Agency, ICTP, Trieste, 1982), p. 403.
Takakura, T. 1985, Proc. Kunming Workshop in Solar Physics and
Interplanetary Traveling Phenomena.
Takakura, T., Ohki, K., Tsuneta, S. and Nitta, N. 1983a, Solar
Phys., 86, 313.
Takakura, T., Kaufmann, P. Costa, J.E.R., Degaonkar, S.S., Ohki,
K. and Nitta, N. 1983b, Nature, 302, 317.
Tandberg-Hanssen, E., Kaufmann, P., Reichmann, E.J., Teuber,
D.L., Moore, R.L., Orwig, L.E. and Zirin, H. 1984, Solar
Phys., 90, 41.
Tanaka, K. 1983, IAU Col. 71, Activity in Red Dwarf Stars, eds.
P. B. Byrne and M. Rodono, p. 307.
Tanaka, K., Watanabe, T., Nishi, K. and Akita, K. 1982, Ap. J.,
254, L59.
Tanaka, M. and Papadopoulos, K. 1983, Phys. Fluids, 26, 1697.
Tapping, K.F. 1983, Solar Phys., 83, 179.
Terasawa, T. 1981, J. Geophys. Res., 86, 9007.
Trottet, G. and Vilmer, N. 1983, Proceedings of the 18th ICRC
Conference, SP 3-15.
Tsuneta, S., Takakura, T., Nitta, N., Ohki, K., Makishima,
K., Murakami, T., Oda, M., and Ogawara, Y. 1983, Solar
Phys., 86, 313.
Tsuneta, S., Takakura, T., Nitta, N., Ohki, K., Tanaka,
K., Makishima, K., Murakami, T., Oda, M., and Ogawara,
Y. 1984a, Ap. J., 280, 887.
Tsuneta, S., Nitta, N., Ohki, K., Takakura, T., Tanaka,
K., Makishima, K., Murakami, T., Oda, M., and Ogawara,
Y. 1984b, Ap. J., 284, 827.
Tsuneta, S. 1983a, Ph.D. Thesis.
Tsuneta, S. 1983b, in Proc. Japan-France Seminar on Active
Phenomena in the Outer Atmospheres of Stars and the Sun, eds.,
J.-C. Pecker and Y. Uchida, p. 243, (Paris: C.N.R.S.).
Tsuneta, S. 1984, Annals of the Tokyo Astron. Obs., 20, 1.
Tsuneta, S. 1985, Ap. J., 290, 353.
Tsurutani, B.J. and Lin, R.P. 1985, J. Geoph. Res., 90, 1.
Tverskoi, B.A. 1967, Soviet Phys. JEPT, 25, 317.
Ugai, M. 1982, Phys. Fluids, 25, 1027.
Ugai, M. 1983, Phys. Fluids, 26, 1569.
Uralov, A.M. and Nefed'ev, V.P. 1976, Astron. Zh., 83, 1041.
Van Beek, H.F., Hoyng, P., Lafleur, B. and Simnett, G.M. 1980,
Solar Phys., 65, 39.
Van Hoven, G. 1976, Solar Phys., 49, 95.
Van Hoven, G. 1979, Astrophys.J., 232, 572.
Van Hoven, G. and Cross, M.A. 1973, Phys. Rev., A7, 1347.
Van Hoven, G., Tachi, T. and Steinolfson, R.S. 1984, Astrophys.
J., 280, 391.
Varvoglis, H.and Papadopoulos, K. 1983, Ap. J. (Lett.), 270, L95.
Vasyliunas, V.M. 1980, J. Geoph. Res., 85, 4616.
Velusamy, T. and Kundu, M.R. 1982, Ap. J., 258, 388.
Vestrand, W.T., et al., 1985, paper presented at the 25th Meeting
of the Committee on Space Research, Graz.
Vilmer, N., Kane, S.R. and Trottet, G. 1982, Astron. Astrophys.,
108, 306.
Vilmer, N., Trottet, G. and MacKinnon, A.L. 1985, Astron. and
Astrophys., submitted.
Vlahos, L. 1979, in IAU Symposium 86, Radio Physics of the Sun,
ed. M.R. Kundu and T.E. Gergely (Dordrecht: Reidel), p. 173.
Vlahos, L. and Papadopoulos, K. 1979, Ap. J., 233, 717.
Vlahos, L. and Rowland, H.L. 1984, Astr. Ap., 139, 263.
Vlahos, L. and Sharma, R.R. 1984, Ap. J., 290, 347.
Vlahos, L. and Gergely, E.T. and Papadopoulos, K. 1982, Ap. J.,
258, 812.
Vlahos, L., Sharma, R.R. and Papadopoulos, K. 1983, Ap. J., 275.
Wang, H.T. and Ramaty, R. 1974, Solar Physics, 36, 129.
Wiehl, H.J., Benz, A.O. and Aschwanden, M.J. 1985, Solar Phys.,
95, 167.
Wiehl, J.J. and Matzler, C. 1980, Astron. Astrophys., 82, 93.
Wiehl, H.J., Schochlin, W.A. and Magun, A. 1980, Astron.
Astrophys., 92, 260.
Wild, J.P., Smerd, S.F. and Weiss, A. A. 1963, Ann. Rev. Astron.
Astrophys., 1,291.
Wolfson, J.D., Doyle, J.D., Leibacher, J.W. and Phillips, K.J.H.
1983, Ap. J., 269, 1319.
Wu, C.S. 1984, J. Geoph. Res., 89, 8857.
Wu, C.S. and Lee, L.C. 1979, Ap. J., 230, 621.
Wu, C.C., Leboeuf, J.N., Tajima, T. and Dawson, J.N. 1984,
Phys. Fluids, submitted.
2-56

Yoshimori,M.,Okudaira,K.,Hirasima,Y. and Kondo, I. 1983,
Solar Phys., 86, 375.
Zaitsev, V.V. and Stepanov, A.V. 1983, Sov. Astr. (Lea.), 8, 132.
Zaitsev, V.V., Stepanov, A.V., and Sterline, A.M. 1985, Pisma
V. Azh., V. 11, in press.
Zhao, R. and Jin, S. 1982, Scientia Sinica, 25, 422.
Zodi, A.M., Kaufmann, P. and Zirin, H. 1984, Solar Phys.,
92, 283.
Zweibel, E.G. and Haber, D. 1983, Ap. J., 264, 648.
2-57


![[XLS] · Web view% PRITHI RAVINDAR NOORD-BRABANT 5611 RH 300050801 COMMUNITY FOUNDATION OF PRINCE EDWARD ISLAND % JOHN ROBINSON PRESIDENT 980440748 WINDSOR ONTARIO N8T 3N6 P80 980158157](https://img.pdfslide.net/doc/110x75/5aa7b5657f8b9ad31c8c4962/xls-view-prithi-ravindar-noord-brabant-5611-rh-300050801-community-foundation.jpg)