Embed Size (px)
Citation preview

NAB ANNUAL GREEN BOND REPORT Page 1
NAB ANNUALGREEN BOND REPORTFinancial year ended 30 September 2020
NAB ANNUAL GREEN BOND REPORT Page 1
INTRODUCTIONNational Australia Bank Limited ABN 12 004 044 937 (‘NAB’) is pleased to present its Annual Green Bond Report (‘Report’) for the financial year ended 30 September 2020. This report relates to our Green Bond Portfolio (four NAB Green Bonds1 and our UBank Green Term Deposit), as well as our Green Instruments (Green Residential Mortgage Backed Security (‘Green RMBS’) tranche and the NAB Low Carbon Shared Portfolio (‘LCSP’)) as at 30 September 2020 and provides reporting on the use of the proceeds for these instruments and their environmental impact.
Our intent is to be transparent about the methodologies used for our green bond reporting and our attribution of environmental impact arising from our lending activities. We have looked to implement evolving market best practice for annual impact reporting, based on guidelines developed by the International Capital Market Association (‘ICMA’) set out in the April 2020 publication Harmonised Framework for Impact Reporting, together with input from investors, assurance providers and guidance from other sources including the Climate Bonds Initiative (‘CBI’) and the Green Bond Principles (‘GBP’). We continue to work with these stakeholders and will seek to improve our disclosure of impact reporting over time.
NAB’S COMMITMENTS
Sustainability is integrated within the ‘long-term’ pillar of NAB’s business strategy. Through this, we are driving commercial responses to society’s biggest challenges and creating resilient and sustainable business practices.
Climate action is a key focus. NAB was the first Australian bank to sign the Principles for Responsible Banking Collective Commitment to Climate Action, committing to align our lending portfolio to net zero emissions by 2050.
We have set and regularly disclose progress against our climate commitments:
• By September 2022, to set and publish sector-specific targets for portfolio alignment.
• Support current coal-fired power generation customers implementing transition pathways aligned with Paris Agreement goals of 45% reduction in emissions by 2030 and net zero emissions by 2050. NAB will not finance new or material expansions of coal-fired power generation facilities unless there is technology in place to materially reduce emissions.
• Capped thermal coal mining exposures at 2019 levels and reducing thermal coal mining financing by 50% by 2028, with the intention to be effectively zero by 2035 (apart from residual performance guarantees to rehabilitate existing coal assets). NAB will not take on new-to-bank thermal coal mining customers.
• We are continuing our phased review of carbon intensive and climate sensitive sectors with an Oil and Gas sector review intended for completion in 2021.
Commitment to provide A$ billion
in environmental financing by
Commitment to source % of our Group electricity needs from renewable energy by .
Commitment toinnovate across all
key sectors andmarkets, supporting
low carbonopportunities with
clients
(1) NAB Climate Bonds and NAB SDG Bonds are together referred to as ‘NAB Green Bonds’.
(2) This target has a baseline of 2015 and covers all direct GHG emissions (Scope 1) and indirect GHG emissions from consumption of purchased electricity (Scope 2) across all GHGs required in the
GHG Protocol Corporate Standard. This target was restated in 2020 to: (i) include data centres which were previously excluded, and (ii) align with a well-below 2°C scenario. The target has been
prepared in accordance with the Sectoral Decarbonisation Approach (SDA) ‘Services Buildings’ methodology published by the Science Based Target Initiative.
• We will work closely with 100 of our largest greenhouse gas emitting customers to support them in developing or improving their low carbon transition plans by 2023.
• We will source 100% of our Group electricity consumption from renewable energy by 2025.
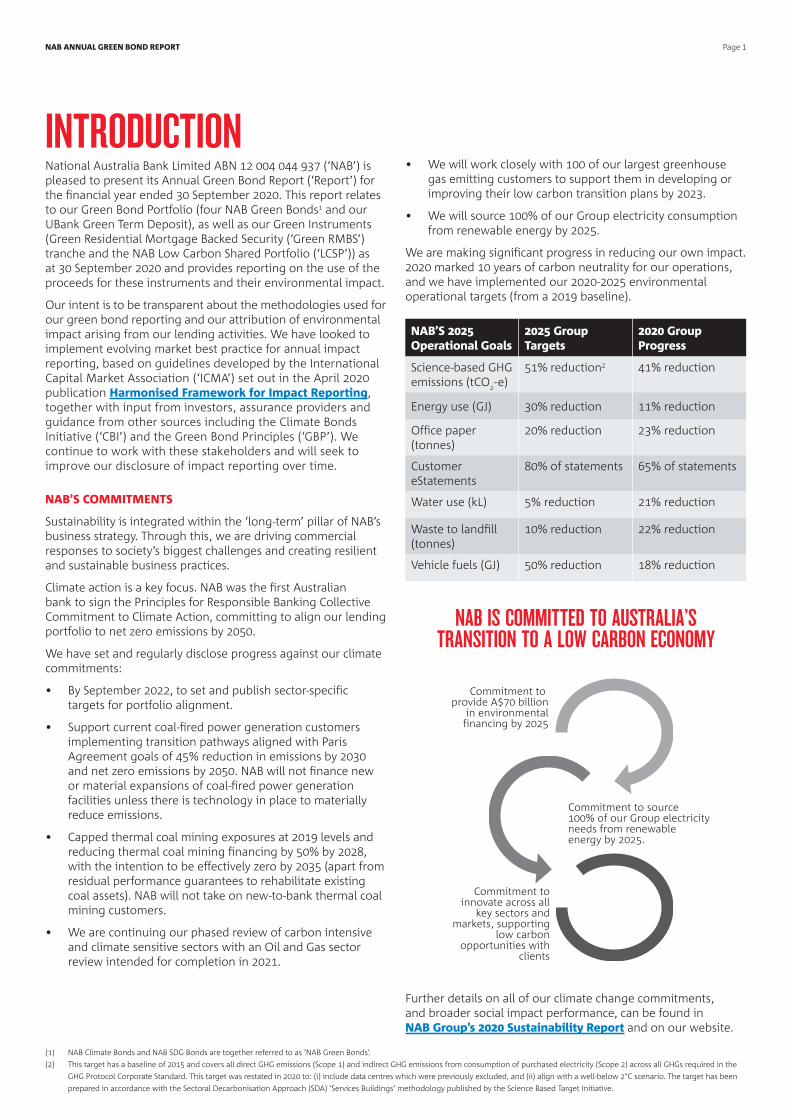
We are making significant progress in reducing our own impact. 2020 marked 10 years of carbon neutrality for our operations, and we have implemented our 2020-2025 environmental operational targets (from a 2019 baseline).
NAB’S 2025 Operational Goals
2025 Group Targets
2020 Group Progress
Science-based GHG emissions (tCO
2-e)
51% reduction2 41% reduction
Energy use (GJ) 30% reduction 11% reduction
Office paper (tonnes)
20% reduction 23% reduction
Customer eStatements
80% of statements 65% of statements
Water use (kL) 5% reduction 21% reduction
Waste to landfill (tonnes)
10% reduction 22% reduction
Vehicle fuels (GJ) 50% reduction 18% reduction
Further details on all of our climate change commitments, and broader social impact performance, can be found in NAB Group’s 2020 Sustainability Report and on our website.
NAB IS COMMITTED TO AUSTRALIA’S TRANSITION TO A LOW CARBON ECONOMY

NAB ANNUAL GREEN BOND REPORT Page 2
NAB’S GREEN BOND FRAMEWORKNAB has developed and implemented a NAB Sustainable Development Goals (‘SDG’) Green Bond Framework (‘Framework’) which applies to its Green Bond Portfolio1 and its Green Instruments2 which are certified under the Climate Bonds Standard V3.0 (‘CBS’) and support and contribute towards meeting the United Nations’ Sustainable Development Goals (‘UN SDGs’).
The Framework has been developed to help NAB meet the requirements of the CBS, which integrates the ICMA Green Bond Principles. The Framework includes the following core components:
a) Use of Proceeds;
b) Selection of Eligible Projects and Assets;
c) Management of Proceeds;
d) Reporting; and
e) External Review and Assurance.
Use of proceeds
The proceeds from the Green Bond Portfolio and Green Instruments are earmarked for financing, or refinancing, portfolios of projects and assets which are:
• in accordance with the Framework; and
• meet eligibility requirements for certification in compliance with the CBS.
The Framework defines the eligible categories for the use of proceeds which currently include:
• renewable energy;
• low carbon transport;
• low carbon buildings;
• energy efficiency; and
• nature-based assets.
Selection of eligible projects and assets
NAB has established a NAB Socially Responsible Investment (SRI) Bond Committee, which oversees all NAB green, social and sustainability bond issuance. The eligible projects and assets supporting the Green Bond Portfolio (‘Green Bond Portfolio Collateral Pool’) may be replenished as underlying loans are repaid, non-compliant projects or assets are removed, and additional eligible projects/assets are identified and funded or reallocated into the Green Bond Portfolio Collateral Pool.
Management of proceeds
NAB has implemented internal monitoring and reporting processes, using its internal information systems, to track and report on eligible projects/assets earmarked for inclusion in the Green Bond Portfolio Collateral Pool and to verify whether the net proceeds of the Green Bond Portfolio have been fully allocated against eligible projects/assets.
Reporting
NAB will publish an annual Green Bond Report, including an annual DNV GL Verification Report for the NAB Green Bond Portfolio and the Green Instruments. For the Green Bond Portfolio, this reporting package will contain details including, but not limited to:
• Net proceeds raised from the Green Bond Portfolio;
• Proceeds from the Green Bond Portfolio allocated against each of the Green Bond eligible categories identified within the Framework;
• A listing of each eligible project and asset included within the Green Bond Portfolio;
• Where available, qualitative and quantitative environmental impact reporting measures for the eligible projects and assets within the Green Bond Portfolio, including calculation methodologies utilised in impact reporting;
• Any unallocated proceeds from the Green Bond Portfolio and details of temporary investments (if any); and
• Confirmation that the use of proceeds of the Green Bond Portfolio are in compliance with the Framework and CBS requirements.
Disclosure of information related to use of proceeds, impact reporting, borrowers and projects financed will be subject to NAB’s confidentiality obligations and the availability of information.
External Review and Assurance
On an annual basis NAB will engage an appropriate verification agent or agents to provide assurance over the NAB Annual Green Bond Report, including impact reporting. The independent verification agent also provides assurance that the Green Bond Portfolio and Green Instruments remain in compliance with the Framework and the post-issuance requirements of the CBS. Following this annual verification update, the verification agent issues its verification statement.
NAB has retained DNV GL as the independent verification agent for its Green Bond Portfolio and Green Instruments.
The NAB Annual Green Bond Report and Verification Statement will be made publicly available on the NAB Capital & Funding website.
(1) Includes NAB’s four green bonds and the UBank Green Term Deposit
(2) Refers to the Green RMBS and the Low Carbon Shared Portfolio

NAB ANNUAL GREEN BOND REPORT Page 3
GREEN BOND PORTFOLIO SUMMARY1
As at 30 September 2020, NAB had a A$575,357,503 surplus of green assets in its Green Bond Portfolio Collateral Pool with projects located across Australia, the UK & Europe, and the USA.2
Issuances/Assets Total (A$)
Green Bond Portfolio 3,574,928,897
Green Bond Portfolio Collateral Pool 4,150,286,401
Surplus in Green Bond Portfolio Collateral Pool 575,357,503
Geographic split of eligible assets in Green Bond Portfolio Collateral Pool
LocationRenewable Energy (wind & solar) (A$)
Low Carbon Transport (A$)
Low Carbon Buildings (A$)
Total (A$)
Australia 769,369,586 526,367,218 945,325,747 2,241,062,551
UK & Europe 1,670,504,411 147,507,807 1,818,012,219
USA 91,211,631 91,211,631
Total Green Bond Portfolio Collateral Pool
4,150,286,401
(1) All A$ equivalent amounts in this Report are based on closing exchange rates published by the Reserve Bank of Australia (RBA) as at 30 September 2020. http://www.rba.gov.au/statistics/tables/
index.html#exchange-rates
(2) All amounts are rounded to the nearest whole number
Australia UK & Europe USA
%%
%
Geographic split of eligible green assets
NAB ANNUAL GREEN BOND REPORT Page 4
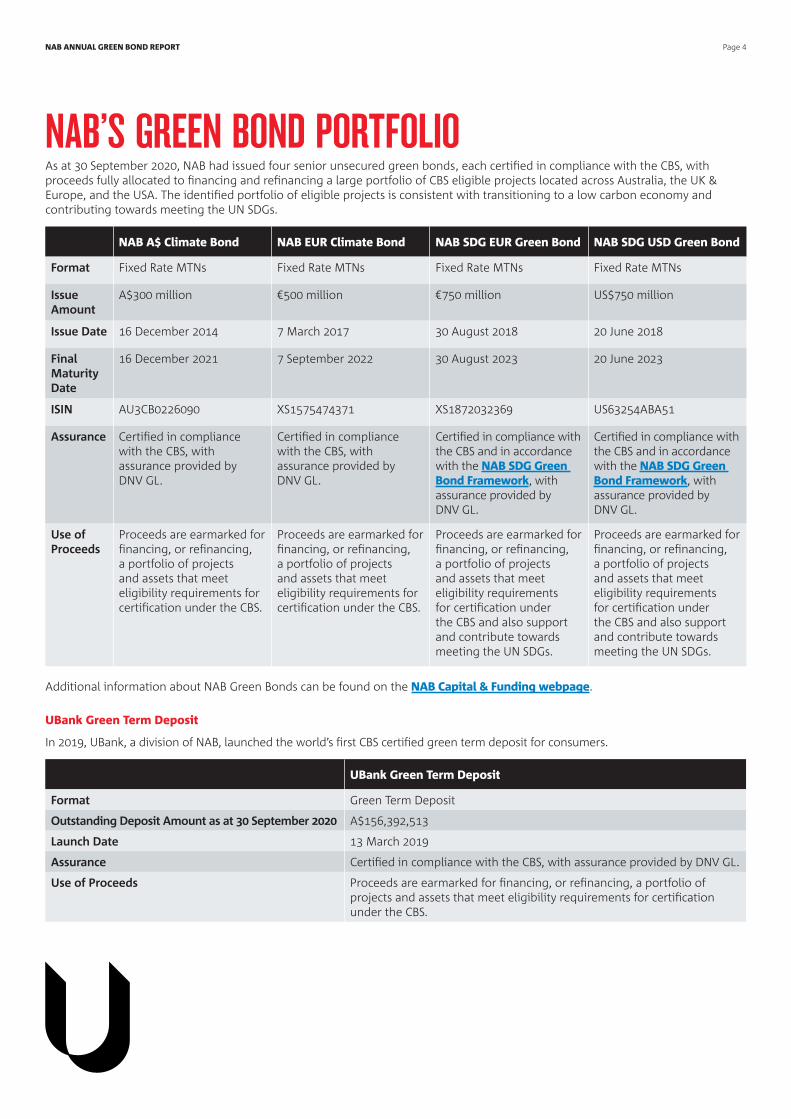
NAB’S GREEN BOND PORTFOLIOAs at 30 September 2020, NAB had issued four senior unsecured green bonds, each certified in compliance with the CBS, with proceeds fully allocated to financing and refinancing a large portfolio of CBS eligible projects located across Australia, the UK & Europe, and the USA. The identified portfolio of eligible projects is consistent with transitioning to a low carbon economy and contributing towards meeting the UN SDGs.
NAB A$ Climate Bond NAB EUR Climate Bond NAB SDG EUR Green Bond NAB SDG USD Green Bond
Format Fixed Rate MTNs Fixed Rate MTNs Fixed Rate MTNs Fixed Rate MTNs
Issue Amount
A$300 million €500 million €750 million US$750 million
Issue Date 16 December 2014 7 March 2017 30 August 2018 20 June 2018
Final Maturity Date
16 December 2021 7 September 2022 30 August 2023 20 June 2023
ISIN AU3CB0226090 XS1575474371 XS1872032369 US63254ABA51
Assurance Certified in compliance with the CBS, with assurance provided by DNV GL.
Certified in compliance with the CBS, with assurance provided by DNV GL.
Certified in compliance with the CBS and in accordance with the NAB SDG Green Bond Framework, with assurance provided by DNV GL.
Certified in compliance with the CBS and in accordance with the NAB SDG Green Bond Framework, with assurance provided by DNV GL.
Use of Proceeds
Proceeds are earmarked for financing, or refinancing, a portfolio of projects and assets that meet eligibility requirements for certification under the CBS.
Proceeds are earmarked for financing, or refinancing, a portfolio of projects and assets that meet eligibility requirements for certification under the CBS.
Proceeds are earmarked for financing, or refinancing, a portfolio of projects and assets that meet eligibility requirements for certification under the CBS and also support and contribute towards meeting the UN SDGs.
Proceeds are earmarked for financing, or refinancing, a portfolio of projects and assets that meet eligibility requirements for certification under the CBS and also support and contribute towards meeting the UN SDGs.
Additional information about NAB Green Bonds can be found on the NAB Capital & Funding webpage.
UBank Green Term Deposit
In 2019, UBank, a division of NAB, launched the world’s first CBS certified green term deposit for consumers.
UBank Green Term Deposit
Format Green Term Deposit
Outstanding Deposit Amount as at 30 September 2020 A$156,392,513
Launch Date 13 March 2019
Assurance Certified in compliance with the CBS, with assurance provided by DNV GL.
Use of Proceeds Proceeds are earmarked for financing, or refinancing, a portfolio of projects and assets that meet eligibility requirements for certification under the CBS.
NAB ANNUAL GREEN BOND REPORT Page 5
IMPACT AND USE OF PROCEEDS The net proceeds raised through the issuance of the Green Bond Portfolio have been earmarked against a range of eligible categories of assets. These are examples of projects that have been funded.
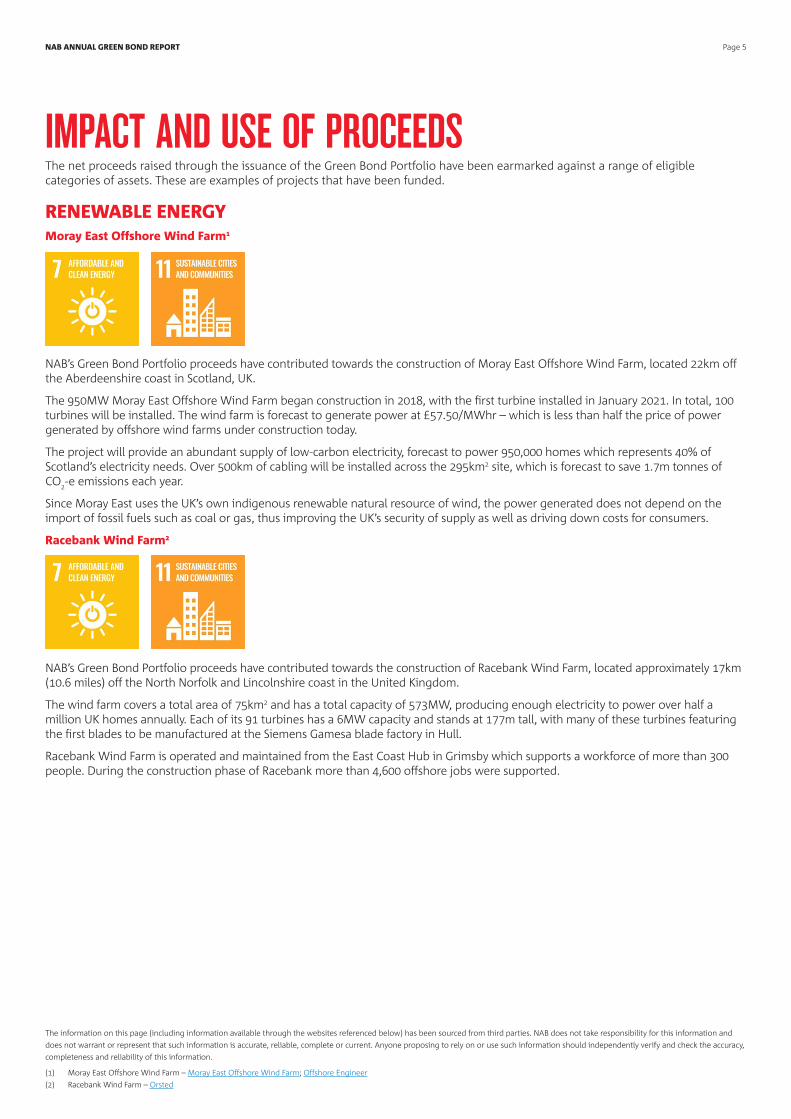
RENEWABLE ENERGYMoray East Offshore Wind Farm1
NAB’s Green Bond Portfolio proceeds have contributed towards the construction of Moray East Offshore Wind Farm, located 22km off the Aberdeenshire coast in Scotland, UK.
The 950MW Moray East Offshore Wind Farm began construction in 2018, with the first turbine installed in January 2021. In total, 100 turbines will be installed. The wind farm is forecast to generate power at £57.50/MWhr – which is less than half the price of power generated by offshore wind farms under construction today.
The project will provide an abundant supply of low-carbon electricity, forecast to power 950,000 homes which represents 40% of Scotland’s electricity needs. Over 500km of cabling will be installed across the 295km2 site, which is forecast to save 1.7m tonnes of CO
2-e emissions each year.
Since Moray East uses the UK’s own indigenous renewable natural resource of wind, the power generated does not depend on the import of fossil fuels such as coal or gas, thus improving the UK’s security of supply as well as driving down costs for consumers.
Racebank Wind Farm2
NAB’s Green Bond Portfolio proceeds have contributed towards the construction of Racebank Wind Farm, located approximately 17km (10.6 miles) off the North Norfolk and Lincolnshire coast in the United Kingdom.
The wind farm covers a total area of 75km2 and has a total capacity of 573MW, producing enough electricity to power over half a million UK homes annually. Each of its 91 turbines has a 6MW capacity and stands at 177m tall, with many of these turbines featuring the first blades to be manufactured at the Siemens Gamesa blade factory in Hull.
Racebank Wind Farm is operated and maintained from the East Coast Hub in Grimsby which supports a workforce of more than 300 people. During the construction phase of Racebank more than 4,600 offshore jobs were supported.
The information on this page (including information available through the websites referenced below) has been sourced from third parties. NAB does not take responsibility for this information and
does not warrant or represent that such information is accurate, reliable, complete or current. Anyone proposing to rely on or use such information should independently verify and check the accuracy,
completeness and reliability of this information.
(1) Moray East Offshore Wind Farm – Moray East Offshore Wind Farm; Offshore Engineer
(2) Racebank Wind Farm – Orsted
NAB ANNUAL GREEN BOND REPORT Page 6
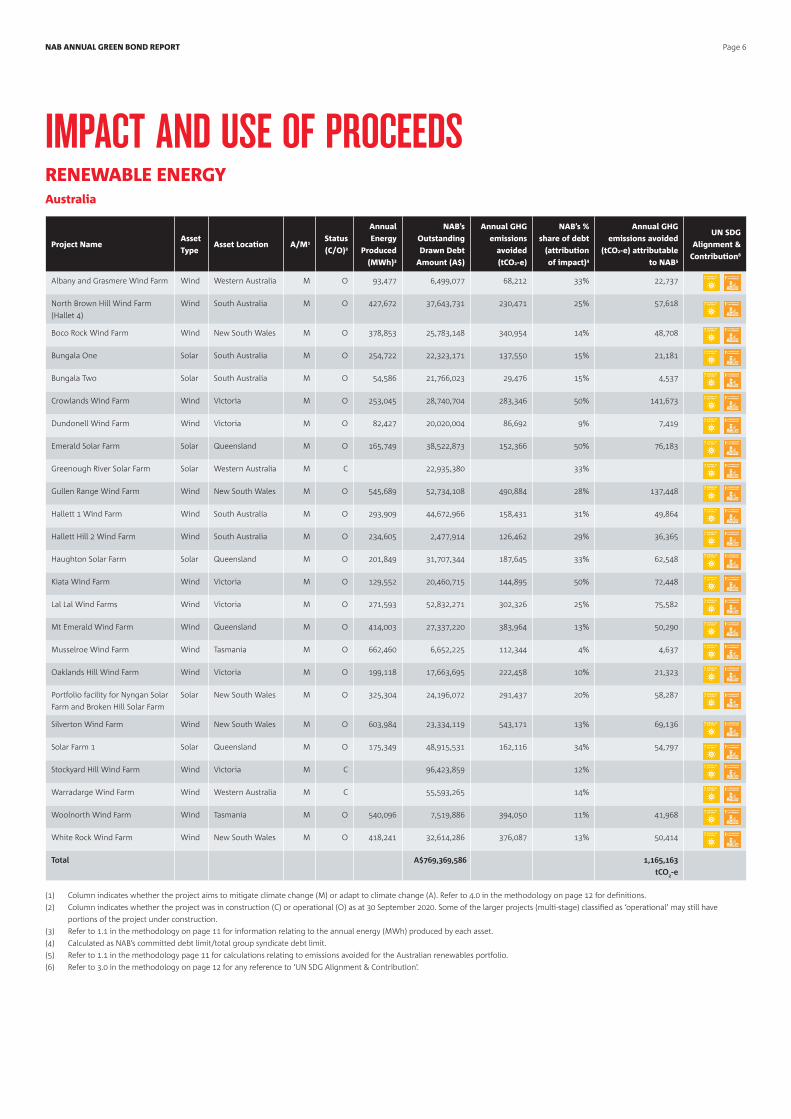
IMPACT AND USE OF PROCEEDS RENEWABLE ENERGYAustralia
Project NameAsset
TypeAsset Location A/M1
Status
(C/O)2
Annual
Energy
Produced
(MWh)3
NAB’s
Outstanding
Drawn Debt
Amount (A$)
Annual GHG
emissions
avoided
(tCO2-e)
NAB’s %
share of debt
(attribution
of impact)4
Annual GHG
emissions avoided
(tCO2-e) attributable
to NAB5
UN SDG
Alignment &
Contribution6
Albany and Grasmere Wind Farm Wind Western Australia M O 93,477 6,499,077 68,212 33% 22,737
North Brown Hill Wind Farm
(Hallet 4)
Wind South Australia M O 427,672 37,643,731 230,471 25% 57,618
Boco Rock Wind Farm Wind New South Wales M O 378,853 25,783,148 340,954 14% 48,708
Bungala One Solar South Australia M O 254,722 22,323,171 137,550 15% 21,181
Bungala Two Solar South Australia M O 54,586 21,766,023 29,476 15% 4,537
Crowlands Wind Farm Wind Victoria M O 253,045 28,740,704 283,346 50% 141,673
Dundonell Wind Farm Wind Victoria M O 82,427 20,020,004 86,692 9% 7,419
Emerald Solar Farm Solar Queensland M O 165,749 38,522,873 152,366 50% 76,183
Greenough River Solar Farm Solar Western Australia M C 22,935,380 33%
Gullen Range Wind Farm Wind New South Wales M O 545,689 52,734,108 490,884 28% 137,448
Hallett 1 Wind Farm Wind South Australia M O 293,909 44,672,966 158,431 31% 49,864
Hallett Hill 2 Wind Farm Wind South Australia M O 234,605 2,477,914 126,462 29% 36,365
Haughton Solar Farm Solar Queensland M O 201,849 31,707,344 187,645 33% 62,548
Kiata Wind Farm Wind Victoria M O 129,552 20,460,715 144,895 50% 72,448
Lal Lal Wind Farms Wind Victoria M O 271,593 52,832,271 302,326 25% 75,582
Mt Emerald Wind Farm Wind Queensland M O 414,003 27,337,220 383,964 13% 50,290
Musselroe Wind Farm Wind Tasmania M O 662,460 6,652,225 112,344 4% 4,637
Oaklands Hill Wind Farm Wind Victoria M O 199,118 17,663,695 222,458 10% 21,323
Portfolio facility for Nyngan Solar
Farm and Broken Hill Solar Farm
Solar New South Wales M O 325,304 24,196,072 291,437 20% 58,287
Silverton Wind Farm Wind New South Wales M O 603,984 23,334,119 543,171 13% 69,136
Solar Farm 1 Solar Queensland M O 175,349 48,915,531 162,116 34% 54,797
Stockyard Hill Wind Farm Wind Victoria M C 96,423,859 12%
Warradarge Wind Farm Wind Western Australia M C 55,593,265 14%
Woolnorth Wind Farm Wind Tasmania M O 540,096 7,519,886 394,050 11% 41,968
White Rock Wind Farm Wind New South Wales M O 418,241 32,614,286 376,087 13% 50,414
Total A$769,369,586 1,165,163
tCO2-e
(1) Column indicates whether the project aims to mitigate climate change (M) or adapt to climate change (A). Refer to 4.0 in the methodology on page 12 for definitions.
(2) Column indicates whether the project was in construction (C) or operational (O) as at 30 September 2020. Some of the larger projects (multi-stage) classified as ‘operational’ may still have
portions of the project under construction.
(3) Refer to 1.1 in the methodology on page 11 for information relating to the annual energy (MWh) produced by each asset.
(4) Calculated as NAB’s committed debt limit/total group syndicate debt limit.
(5) Refer to 1.1 in the methodology page 11 for calculations relating to emissions avoided for the Australian renewables portfolio.
(6) Refer to 3.0 in the methodology on page 12 for any reference to ‘UN SDG Alignment & Contribution’.
NAB ANNUAL GREEN BOND REPORT Page 7
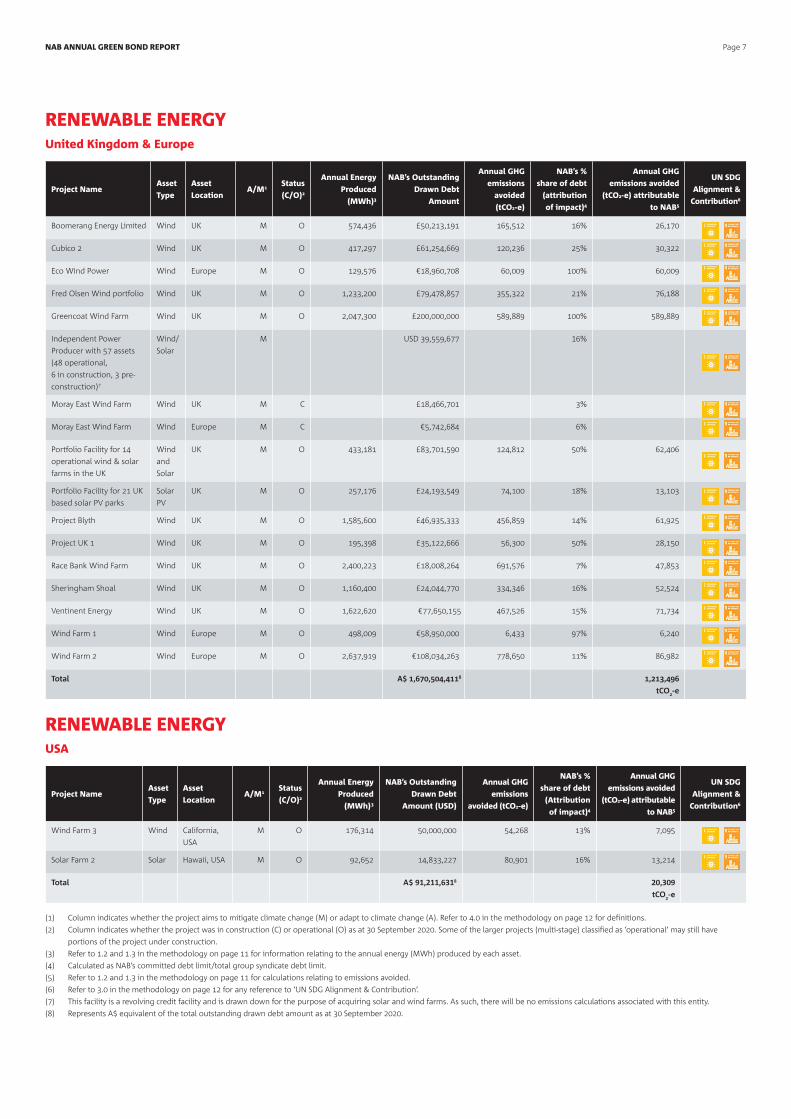
RENEWABLE ENERGYUnited Kingdom & Europe
Project NameAsset
Type
Asset
LocationA/M1
Status
(C/O)2
Annual Energy
Produced
(MWh)3
NAB’s Outstanding
Drawn Debt
Amount
Annual GHG
emissions
avoided
(tCO2-e)
NAB’s %
share of debt
(attribution
of impact)4
Annual GHG
emissions avoided
(tCO2-e) attributable
to NAB5
UN SDG
Alignment &
Contribution6
Boomerang Energy Limited Wind UK M O 574,436 £50,213,191 165,512 16% 26,170
Cubico 2 Wind UK M O 417,297 £61,254,669 120,236 25% 30,322
Eco Wind Power Wind Europe M O 129,576 €18,960,708 60,009 100% 60,009
Fred Olsen Wind portfolio Wind UK M O 1,233,200 £79,478,857 355,322 21% 76,188
Greencoat Wind Farm Wind UK M O 2,047,300 £200,000,000 589,889 100% 589,889
Independent Power
Producer with 57 assets
(48 operational,
6 in construction, 3 pre-
construction)7
Wind/
Solar
M USD 39,559,677 16%
Moray East Wind Farm Wind UK M C £18,466,701 3%
Moray East Wind Farm Wind Europe M C €5,742,684 6%
Portfolio Facility for 14
operational wind & solar
farms in the UK
Wind
and
Solar
UK M O 433,181 £83,701,590 124,812 50% 62,406
Portfolio Facility for 21 UK
based solar PV parks
Solar
PV
UK M O 257,176 £24,193,549 74,100 18% 13,103
Project Blyth Wind UK M O 1,585,600 £46,935,333 456,859 14% 61,925
Project UK 1 Wind UK M O 195,398 £35,122,666 56,300 50% 28,150
Race Bank Wind Farm Wind UK M O 2,400,223 £18,008,264 691,576 7% 47,853
Sheringham Shoal Wind UK M O 1,160,400 £24,044,770 334,346 16% 52,524
Ventinent Energy Wind UK M O 1,622,620 €77,650,155 467,526 15% 71,734
Wind Farm 1 Wind Europe M O 498,009 €58,950,000 6,433 97% 6,240
Wind Farm 2 Wind Europe M O 2,637,919 €108,034,263 778,650 11% 86,982
Total A$ 1,670,504,4118 1,213,496
tCO2-e
RENEWABLE ENERGYUSA
Project NameAsset
Type
Asset
LocationA/M1
Status
(C/O)2
Annual Energy
Produced
(MWh)3
NAB’s Outstanding
Drawn Debt
Amount (USD)
Annual GHG
emissions
avoided (tCO2-e)
NAB’s %
share of debt
(Attribution
of impact)4
Annual GHG
emissions avoided
(tCO2-e) attributable
to NAB5
UN SDG
Alignment &
Contribution6
Wind Farm 3 Wind California,
USA
M O 176,314 50,000,000 54,268 13% 7,095
Solar Farm 2 Solar Hawaii, USA M O 92,652 14,833,227 80,901 16% 13,214
Total A$ 91,211,6318 20,309
tCO2-e
(1) Column indicates whether the project aims to mitigate climate change (M) or adapt to climate change (A). Refer to 4.0 in the methodology on page 12 for definitions.
(2) Column indicates whether the project was in construction (C) or operational (O) as at 30 September 2020. Some of the larger projects (multi-stage) classified as ‘operational’ may still have
portions of the project under construction.
(3) Refer to 1.2 and 1.3 in the methodology on page 11 for information relating to the annual energy (MWh) produced by each asset.
(4) Calculated as NAB’s committed debt limit/total group syndicate debt limit.
(5) Refer to 1.2 and 1.3 in the methodology on page 11 for calculations relating to emissions avoided.
(6) Refer to 3.0 in the methodology on page 12 for any reference to ‘UN SDG Alignment & Contribution’.
(7) This facility is a revolving credit facility and is drawn down for the purpose of acquiring solar and wind farms. As such, there will be no emissions calculations associated with this entity.
(8) Represents A$ equivalent of the total outstanding drawn debt amount as at 30 September 2020.
NAB ANNUAL GREEN BOND REPORT Page 8
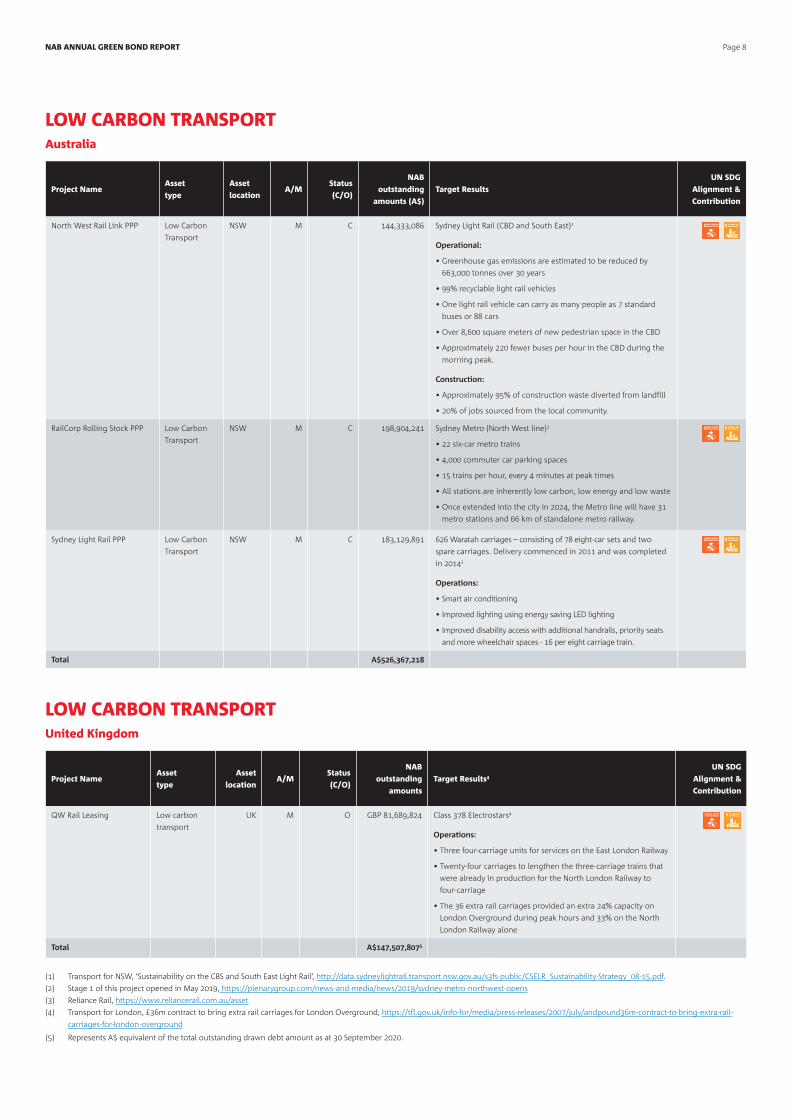
LOW CARBON TRANSPORTAustralia
Project NameAsset
type
Asset
locationA/M
Status
(C/O)
NAB
outstanding
amounts (A$)
Target Results
UN SDG
Alignment &
Contribution
North West Rail Link PPP Low Carbon
Transport
NSW M C 144,333,086 Sydney Light Rail (CBD and South East)1
Operational:
• Greenhouse gas emissions are estimated to be reduced by
663,000 tonnes over 30 years
• 99% recyclable light rail vehicles
• One light rail vehicle can carry as many people as 7 standard
buses or 88 cars
• Over 8,600 square meters of new pedestrian space in the CBD
• Approximately 220 fewer buses per hour in the CBD during the
morning peak.
Construction:
• Approximately 95% of construction waste diverted from landfill
• 20% of jobs sourced from the local community.
RailCorp Rolling Stock PPP Low Carbon
Transport
NSW M C 198,904,241 Sydney Metro (North West line)2
• 22 six-car metro trains
• 4,000 commuter car parking spaces
• 15 trains per hour, every 4 minutes at peak times
• All stations are inherently low carbon, low energy and low waste
• Once extended into the city in 2024, the Metro line will have 31
metro stations and 66 km of standalone metro railway.
Sydney Light Rail PPP Low Carbon
Transport
NSW M C 183,129,891 626 Waratah carriages – consisting of 78 eight-car sets and two
spare carriages. Delivery commenced in 2011 and was completed
in 20143
Operations:
• Smart air conditioning
• Improved lighting using energy saving LED lighting
• Improved disability access with additional handrails, priority seats
and more wheelchair spaces - 16 per eight carriage train.
Total A$526,367,218
LOW CARBON TRANSPORTUnited Kingdom
Project NameAsset
type
Asset
locationA/M
Status
(C/O)
NAB
outstanding
amounts
Target Results4
UN SDG
Alignment &
Contribution
QW Rail Leasing Low carbon
transport
UK M O GBP 81,689,824 Class 378 Electrostars4
Operations:
• Three four-carriage units for services on the East London Railway
• Twenty-four carriages to lengthen the three-carriage trains that
were already in production for the North London Railway to
four-carriage
• The 36 extra rail carriages provided an extra 24% capacity on
London Overground during peak hours and 33% on the North
London Railway alone
Total A$147,507,8075
(1) Transport for NSW, ‘Sustainability on the CBS and South East Light Rail’, http://data.sydneylightrail.transport.nsw.gov.au/s3fs-public/CSELR_Sustainability-Strategy_08-15.pdf.
(2) Stage 1 of this project opened in May 2019, https://plenarygroup.com/news-and-media/news/2019/sydney-metro-northwest-opens
(3) Reliance Rail, https://www.reliancerail.com.au/asset
(4) Transport for London, £36m contract to bring extra rail carriages for London Overground, https://tfl.gov.uk/info-for/media/press-releases/2007/july/andpound36m-contract-to-bring-extra-rail-
carriages-for-london-overground
(5) Represents A$ equivalent of the total outstanding drawn debt amount as at 30 September 2020.
NAB ANNUAL GREEN BOND REPORT Page 9
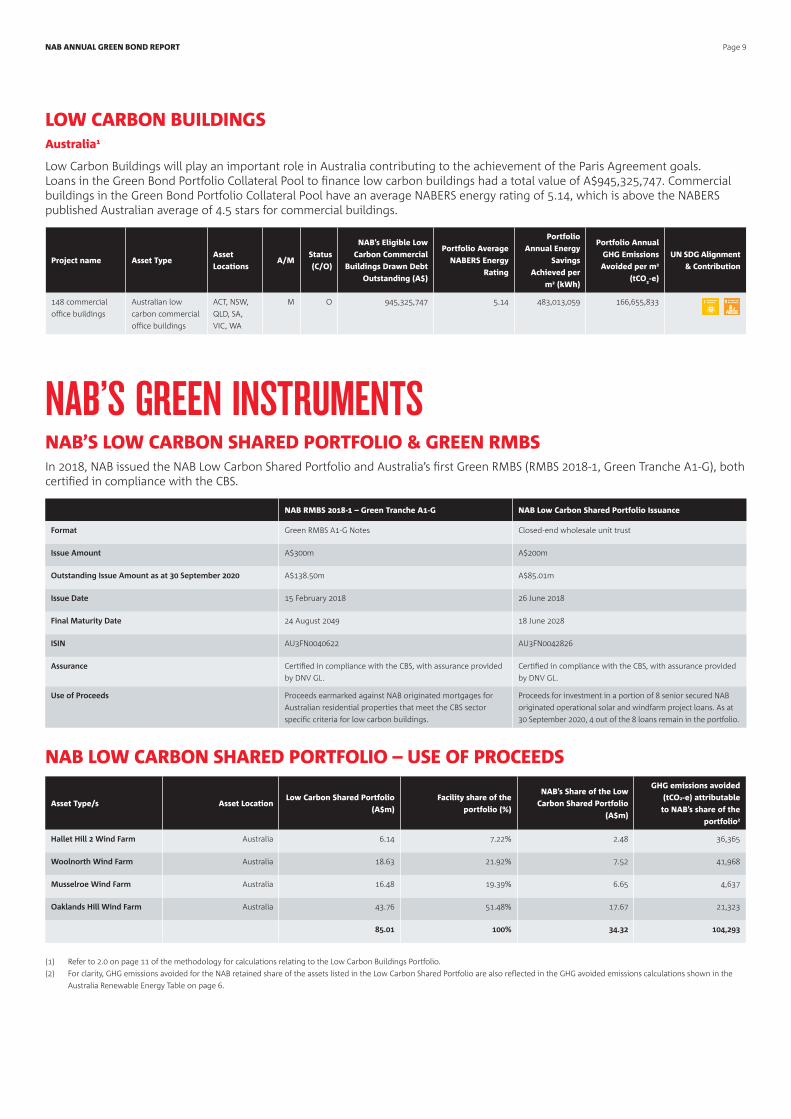
LOW CARBON BUILDINGSAustralia1
Low Carbon Buildings will play an important role in Australia contributing to the achievement of the Paris Agreement goals. Loans in the Green Bond Portfolio Collateral Pool to finance low carbon buildings had a total value of A$945,325,747. Commercial buildings in the Green Bond Portfolio Collateral Pool have an average NABERS energy rating of 5.14, which is above the NABERS published Australian average of 4.5 stars for commercial buildings.
Project name Asset TypeAsset
LocationsA/M
Status
(C/O)
NAB’s Eligible Low
Carbon Commercial
Buildings Drawn Debt
Outstanding (A$)
Portfolio Average
NABERS Energy
Rating
Portfolio
Annual Energy
Savings
Achieved per
m2 (kWh)
Portfolio Annual
GHG Emissions
Avoided per m2
(tCO2-e)
UN SDG Alignment
& Contribution
148 commercial
office buildings
Australian low
carbon commercial
office buildings
ACT, NSW,
QLD, SA,
VIC, WA
M O 945,325,747 5.14 483,013,059 166,655,833
NAB’S GREEN INSTRUMENTSNAB’S LOW CARBON SHARED PORTFOLIO & GREEN RMBS In 2018, NAB issued the NAB Low Carbon Shared Portfolio and Australia’s first Green RMBS (RMBS 2018-1, Green Tranche A1-G), both certified in compliance with the CBS.
NAB RMBS 2018-1 – Green Tranche A1-G NAB Low Carbon Shared Portfolio Issuance
Format Green RMBS A1-G Notes Closed-end wholesale unit trust
Issue Amount A$300m A$200m
Outstanding Issue Amount as at 30 September 2020 A$138.50m A$85.01m
Issue Date 15 February 2018 26 June 2018
Final Maturity Date 24 August 2049 18 June 2028
ISIN AU3FN0040622 AU3FN0042826
Assurance Certified in compliance with the CBS, with assurance provided
by DNV GL.
Certified in compliance with the CBS, with assurance provided
by DNV GL.
Use of Proceeds Proceeds earmarked against NAB originated mortgages for
Australian residential properties that meet the CBS sector
specific criteria for low carbon buildings.
Proceeds for investment in a portion of 8 senior secured NAB
originated operational solar and windfarm project loans. As at
30 September 2020, 4 out of the 8 loans remain in the portfolio.
NAB LOW CARBON SHARED PORTFOLIO – USE OF PROCEEDS
Asset Type/s Asset LocationLow Carbon Shared Portfolio
(A$m)
Facility share of the
portfolio (%)
NAB’s Share of the Low
Carbon Shared Portfolio
(A$m)
GHG emissions avoided
(tCO2-e) attributable
to NAB’s share of the
portfolio2
Hallet Hill 2 Wind Farm Australia 6.14 7.22% 2.48 36,365
Woolnorth Wind Farm Australia 18.63 21.92% 7.52 41,968
Musselroe Wind Farm Australia 16.48 19.39% 6.65 4,637
Oaklands Hill Wind Farm Australia 43.76 51.48% 17.67 21,323
85.01 100% 34.32 104,293
(1) Refer to 2.0 on page 11 of the methodology for calculations relating to the Low Carbon Buildings Portfolio.
(2) For clarity, GHG emissions avoided for the NAB retained share of the assets listed in the Low Carbon Shared Portfolio are also reflected in the GHG avoided emissions calculations shown in the
Australia Renewable Energy Table on page 6.
NAB ANNUAL GREEN BOND REPORT Page 10
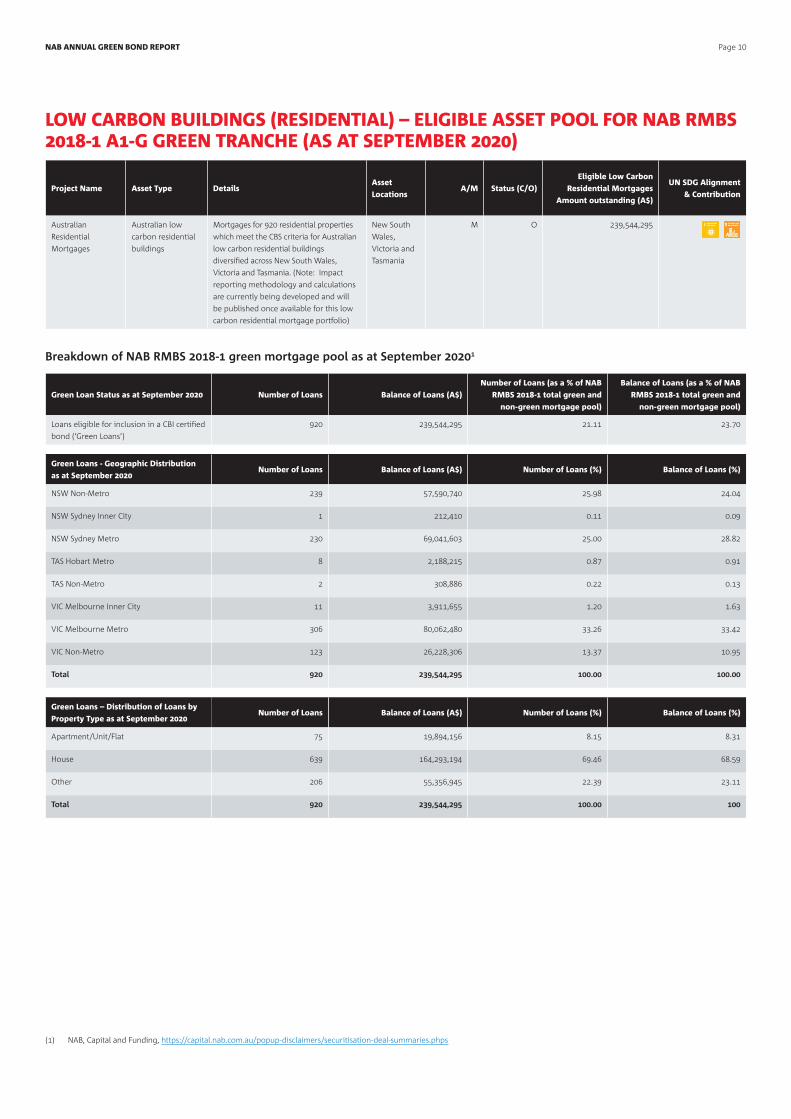
LOW CARBON BUILDINGS (RESIDENTIAL) – ELIGIBLE ASSET POOL FOR NAB RMBS 2018-1 A1-G GREEN TRANCHE (AS AT SEPTEMBER 2020)
Project Name Asset Type DetailsAsset
LocationsA/M Status (C/O)
Eligible Low Carbon
Residential Mortgages
Amount outstanding (A$)
UN SDG Alignment
& Contribution
Australian
Residential
Mortgages
Australian low
carbon residential
buildings
Mortgages for 920 residential properties
which meet the CBS criteria for Australian
low carbon residential buildings
diversified across New South Wales,
Victoria and Tasmania. (Note: Impact
reporting methodology and calculations
are currently being developed and will
be published once available for this low
carbon residential mortgage portfolio)
New South
Wales,
Victoria and
Tasmania
M O 239,544,295
Breakdown of NAB RMBS 2018-1 green mortgage pool as at September 20201
Green Loan Status as at September 2020 Number of Loans Balance of Loans (A$)
Number of Loans (as a % of NAB
RMBS 2018-1 total green and
non-green mortgage pool)
Balance of Loans (as a % of NAB
RMBS 2018-1 total green and
non-green mortgage pool)
Loans eligible for inclusion in a CBI certified
bond (‘Green Loans’)
920 239,544,295 21.11 23.70
Green Loans - Geographic Distribution
as at September 2020Number of Loans Balance of Loans (A$) Number of Loans (%) Balance of Loans (%)
NSW Non-Metro 239 57,590,740 25.98 24.04
NSW Sydney Inner City 1 212,410 0.11 0.09
NSW Sydney Metro 230 69,041,603 25.00 28.82
TAS Hobart Metro 8 2,188,215 0.87 0.91
TAS Non-Metro 2 308,886 0.22 0.13
VIC Melbourne Inner City 11 3,911,655 1.20 1.63
VIC Melbourne Metro 306 80,062,480 33.26 33.42
VIC Non-Metro 123 26,228,306 13.37 10.95
Total 920 239,544,295 100.00 100.00
Green Loans – Distribution of Loans by
Property Type as at September 2020Number of Loans Balance of Loans (A$) Number of Loans (%) Balance of Loans (%)
Apartment/Unit/Flat 75 19,894,156 8.15 8.31
House 639 164,293,194 69.46 68.59
Other 206 55,356,945 22.39 23.11
Total 920 239,544,295 100.00 100
(1) NAB, Capital and Funding, https://capital.nab.com.au/popup-disclaimers/securitisation-deal-summaries.phps
NAB ANNUAL GREEN BOND REPORT Page 11
METHODOLOGY1.0 Annual GHG Emissions avoided – Renewable Energy
1.1. Australia
• Australian power generation data was sourced from the Clean Energy Regulator’s National Greenhouse and Energy Reporting (NGER) data Electricity sector emissions and generation data 2019-2020.
• The emissions avoided calculation used was as follows: Annual energy produced (MWh) x applicable electricity emission factor (kg CO
2-e/KWh) = tonnes CO
2-e avoided. Australian GHG emissions factors were taken from the Australian National Greenhouse
Accounts Factors (August 2020) and the National Greenhouse and Energy Reporting (Measurement) Amendment Determination 2008 (updated for 2019-2020).
• Impact attributable to NAB was calculated by applying the % share of debt to the total GHG emissions avoided by each project or portfolio.
1.2 UK & Europe
• UK and European power generation data was sourced from operational reports available for each renewable energy generation project. For some of these projects, operational data was unavailable for the period and therefore an estimate was made based on available project data.
• The emissions avoided calculation used was as follows: Estimated MWh of electricity produced x applicable electricity emissions factor (per country) (kg CO
2-e/KWh) = tonnes CO
2-e avoided.
• The emissions factors for projects in the UK were sourced from the Department for Business, Energy & Industrial Strategy (DBEIS) UK Government Greenhouse gas reporting: conversion factors 2020.
• The emissions factors for Europe (Ireland, Portugal, Spain, France, Belgium, Germany, Norway and Sweden) were sourced from the International Energy Agency’s (IEA) CO
2 emissions from fuel combustion 2018 (in Excel) and the Department of Business,
Energy & Industry Strategy (DBEIS) UK Government Greenhouse gas reporting: conversion factors 2020. The generation and Transmission & Distribution (T&D) factors came from IEA and the Well-To-Tank (WTT) factors came from DBEIS as per DBEIS UK Government Greenhouse gas reporting: conversion factors for corporate reporting 2020.
• Impact attributable to NAB was calculated by applying the % share of debt to the total GHG emissions avoided by each project or portfolio.
1.3 USA
• US power generation data was sourced from operational reports available for each renewable energy generation project. For some of these projects, operational data was unavailable for the period and therefore an estimate was made based on available project data.
• The emission factors for the US were sourced from The Climate Register 2020 default emission factors and the T&D factors came from the IEA CO
2 emissions from fuel combustion 2019 (in Excel).
• Impact attributable to NAB was calculated by applying the NAB’s % share of debt to the total GHG emissions avoided by each project or portfolio.
2.0 Low-Carbon Buildings (Annual Energy Savings and Annual GHG Emissions Avoided)
• Data in reference to the buildings in NAB’s CRE portfolio was sourced from a combination of:
– internal reporting;
– client reports;
– company websites;
– Australian Government’s Commercial Building Disclosure Program (CBDP): http://cbd.gov.au/registers/cbd-downloadable-data-set; and
– average energy intensity sourced from https://nabers.info/annual-report/2019-2020/office-energy/ and annual carbon intensity sourced from https://nabers.info/annual-report/2019-2020/office-energy/.
• Average NABERS Energy star rating was sourced from the NABERS annual report: https://nabers.info/annual-report/2019-2020/office-energy/.
• Annual Portfolio Energy Savings Achieved (kWh): (Average Statewide Base Building Energy Intensity – Building ‘A’ Energy Intensity) x Net Lettable Area of Building ‘A’.
• Annual Portfolio GHG Emissions Avoided (tCO2-e): (Average Statewide Base Building Carbon Intensity – Building ‘A’ Carbon
Intensity) x Net Lettable Area of Building ‘A’.
• Average NABERS Energy star rating, Annual Portfolio Energy Savings Achieved and Annual Portfolio GHG Emissions Avoided apply to the total portfolio area of all buildings in the portfolio rather than just NAB’s % of debt.
NAB ANNUAL GREEN BOND REPORT Page 12
3.0 UN SDG Alignment and Contribution
Renewables
• Aligns to UN SDG 7: Affordable & Clean Energy and contributes towards UN SDG Target 7.2 – By 2030, increase substantially the share of renewable energy in the global energy mix.
• Aligns to UN SDG 11: Sustainable cities & communities and contributes towards UN SDG Target 11.6 – By 2030, reduce the adverse per capita environmental impact of cities.
Transport
• Aligns to UN SDG 9: Industry innovation and infrastructure and contributes to UN SDG Target 9.1 – Sustainable & resilient infrastructure.
• Aligns to UN SDG 11 Sustainable cities & communities and contributes to UN SDG Target 11.6 – By 2030, reduce the adverse per capita environmental impact of cities.
Low carbon buildings (Commercial office)
• Aligns to UN SDG 7: Affordable & Clean Energy and contributes to UN SDG Target 7.3 – By 2030, double the global rate of improvement of energy efficiency.
• Aligns to UN SDG 11: Sustainable Cities & Communities and contributes to UN SDG Target 11.6 – By 2030, reduce the adverse per capita environmental impact of cities.
Low carbon buildings (Residential for NAB Green RMBS)
• Aligns to UN SDG 7: Affordable & Clean Energy and contributes to UN SDG Target 7.3 – By 2030, double the global rate of improvement of energy efficiency.
• Aligns to UN SDG 11: Sustainable Cities & Communities and contributes to UN SDG Target 11.6 – By 2030, reduce the adverse per capita environmental impact of cities.
4.0 Additional Notes
Definitions
- Adaptation1: Taking practical actions to manage risks from climate impacts, protect communities and strengthen the resilience of the economy.
- Mitigation2: Activities that are designed to reduce greenhouse emissions and/or increase the amounts of greenhouse gases removed from the atmosphere by greenhouse sinks.
(1) Australian Government, Department of Agriculture, Water and the Environment, ‘Adapting to Climate Change’, https://www.environment.gov.au/climate-change/adaptation
(2) NSW Government, ‘Climate change mitigation’, https://climatechange.environment.nsw.gov.au/About-climate-change-in-NSW/NSW-Government-action-on-climate-change/Climate-change-mitigation
NAB ANNUAL GREEN BOND REPORT Page 13
©2021 National Australia Bank Limited ABN 12 004 044 937 AFSL and Australian Credit Licence 230686 A161654-0321
CONTACT USMichael Johnson
Head of Group Funding Group Treasury National Australia Bank Limited
Phone: +61 400 621 839 Email: [email protected]
Sarah Stokie
Debt Investor Relations Group Treasury National Australia Bank
Phone: +61 0477721489 Email: [email protected] Email: [email protected]
David Jenkins
Global Head of Sustainable Finance Corporate & Institutional Banking National Australia Bank Limited
Phone: +61 415 130 227 Email: [email protected]
Jordyn Laina
Senior Associate, Sustainable Finance Corporate & Institutional Banking National Australia Bank Limited
Phone: +61 436 935 232 Email: [email protected]
Rosemary Bissett
Head of ESG Risk Management Group Risk National Australia Bank Limited
Phone: +61 412 314 836 Email: [email protected]
KEY INFORMATIONThis document includes general background information about the activities of National Australia Bank Limited ABN 12 004 044 937 (NAB) and its controlled entities (together, the Group) for the year ended 30 September 2020 (unless otherwise stated herein). It is information in a summary form and does not purport to be complete.
This document does not constitute an offer or invitation for the sale or purchase of securities, nor does it form part of any prospectus or offering document relating to any securities of NAB. Distribution of this document may be restricted or prohibited by law. Recipients are required to inform themselves of, and comply with, all such restrictions or prohibitions and NAB does not accept liability to any person in relation thereto.
While care has been taken in preparing the information in this document, NAB does not warrant or represent that such information is accurate, reliable, complete or current. Anyone proposing to rely on or use such information should independently verify and check the accuracy, completeness, reliability and suitability of the information and should obtain independent and specific advice from appropriate professionals or experts. Certain information in this document may (i) have been sourced from third parties and/or (ii) be cross referenced in this document. NAB takes no responsibility for the accuracy, currency or completeness of such information.
This document contains certain forward-looking statements. The words ‘anticipate’, ‘believe’, ‘expect’, ‘project’, ‘forecast’, ‘estimate’, ‘outlook’, ‘upside’, ‘likely’, ‘intend’, ‘should’, ‘could’, ‘may’, ‘target’, ‘plan’ and other similar expressions are intended to identify forward-looking statements. Such statements speak only as of the date hereof and NAB has no obligation to update or revise any such statements to reflect any change in events, conditions or circumstances on which any such statement is based. There can be no assurance that actual outcomes will not differ materially from these statements. Readers are cautioned not to place undue reliance on these statements.