Embed Size (px)
DESCRIPTION
- PowerPoint PPT Presentation
Citation preview
At War with the WeatherManaging Large-Scale Risks in a New Era of
Catastrophes
Howard C. Kunreuther [email protected]
Risk Management and Decision Processes CenterThe Wharton School, University of Pennsylvania
http://opim.wharton.upenn.edu/risk Joint research with
Erwann Michel-Kerjan
NABE Corporate Roundtable August 5, 2010
0.0%
5.0%
10.0%
15.0%
20.0%
25.0%
30.0%
35.0%
40.0%
45.0%
$0 $10 $20 $30 $40 $50 $60 $70 $80 $90 $100
Loss (in $ Billions)
Exce
edan
ce P
roba
bilit
y
Gross Loss
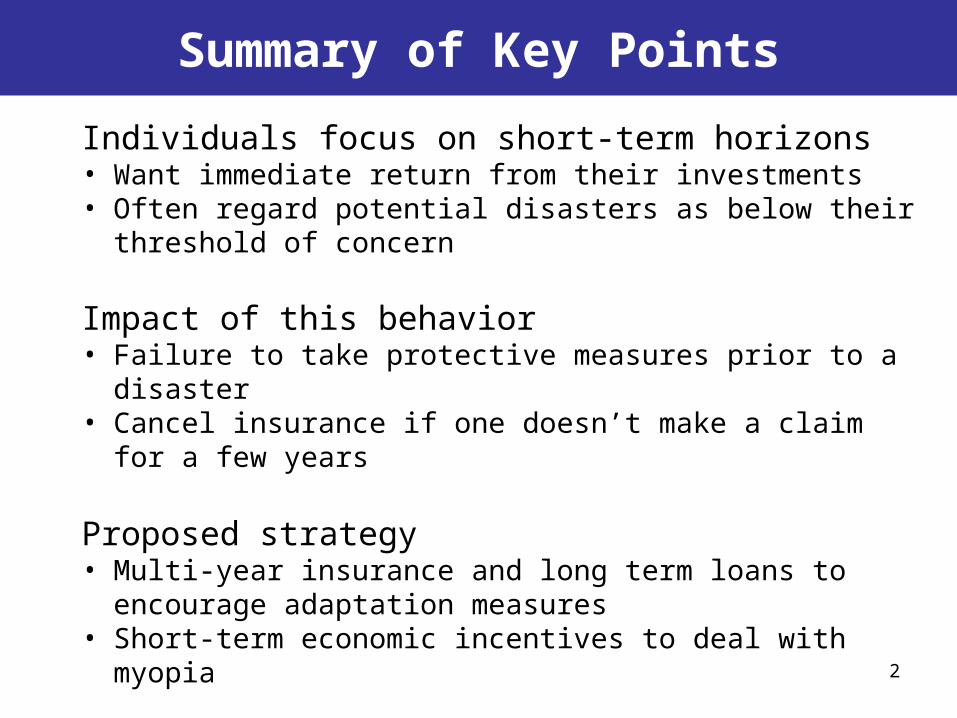
Summary of Key Points
Individuals focus on short-term horizons• Want immediate return from their investments• Often regard potential disasters as below their threshold of
concern
Impact of this behavior• Failure to take protective measures prior to a disaster• Cancel insurance if one doesn’t make a claim for a few years
Proposed strategy• Multi-year insurance and long term loans to encourage
adaptation measures • Short-term economic incentives to deal with myopia
2
Outline of Talk
1. A New Era of Catastrophe2. Guiding Principles for Developing
Risk Management Strategies3. Benefits of Adaptation Measures 4. A New Proposal: Long-Term
Insurance and Loans5. Encouraging Adaptation: An
Example6. Summary
3
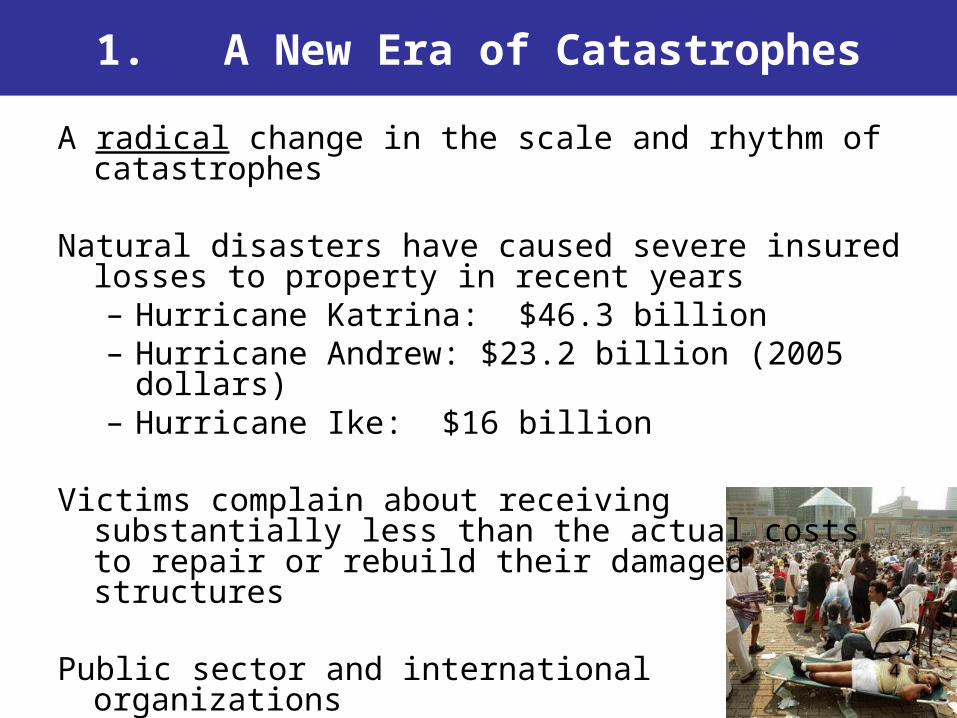
1. A New Era of Catastrophes
A radical change in the scale and rhythm of catastrophes
Natural disasters have caused severe insured losses to property in recent years– Hurricane Katrina: $46.3 billion– Hurricane Andrew: $23.2 billion (2005 dollars)– Hurricane Ike: $16 billion
Victims complain about receiving substantially less than the actual costs to repair or rebuild their damaged structures
Public sector and international organizations (e.g. World Bank) are committed to providing financial assistance to aid the victims of disasters
4
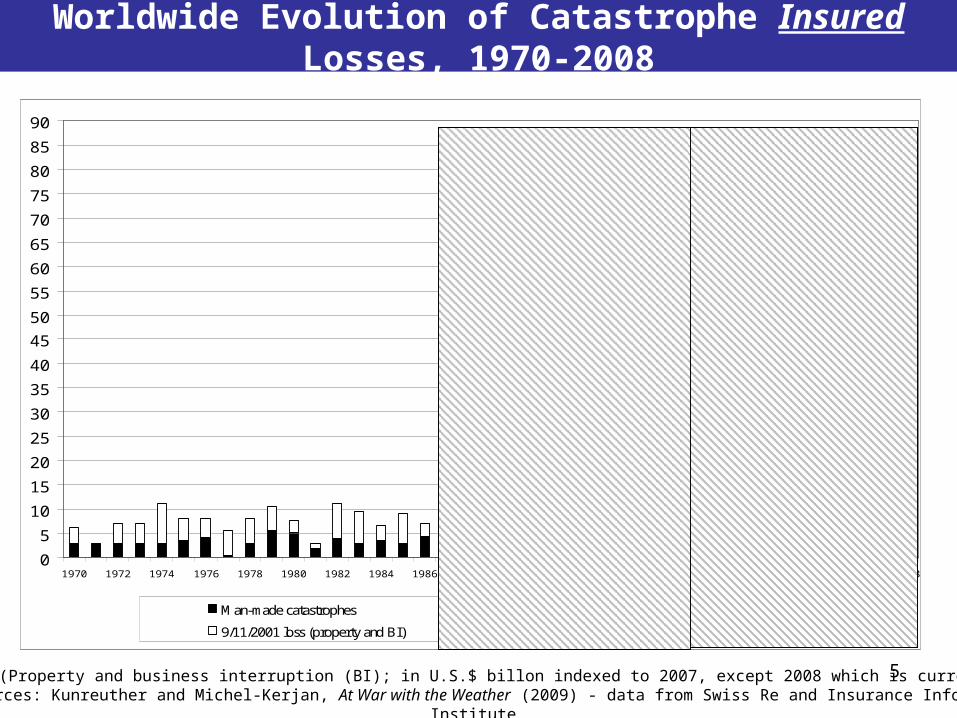
Worldwide Evolution of Catastrophe Insured Losses, 1970-2008
(Property and business interruption (BI); in U.S.$ billon indexed to 2007, except 2008 which is current)Sources: Kunreuther and Michel-Kerjan, At War with the Weather (2009) - data from Swiss Re and Insurance Information
Institute
0
5
10
15
20
25
30
35
40
45
50
55
60
65
70
75
80
85
90
1970 1972 1974 1976 1978 1980 1982 1984 1986 1988 1990 1992 1994 1996 1998 2000 2002 2004 2006 2008
Man-made catastrophes Natural catastrophes
9/11/2001 loss (property and BI) 9/11/2001 loss (liability and life)
5
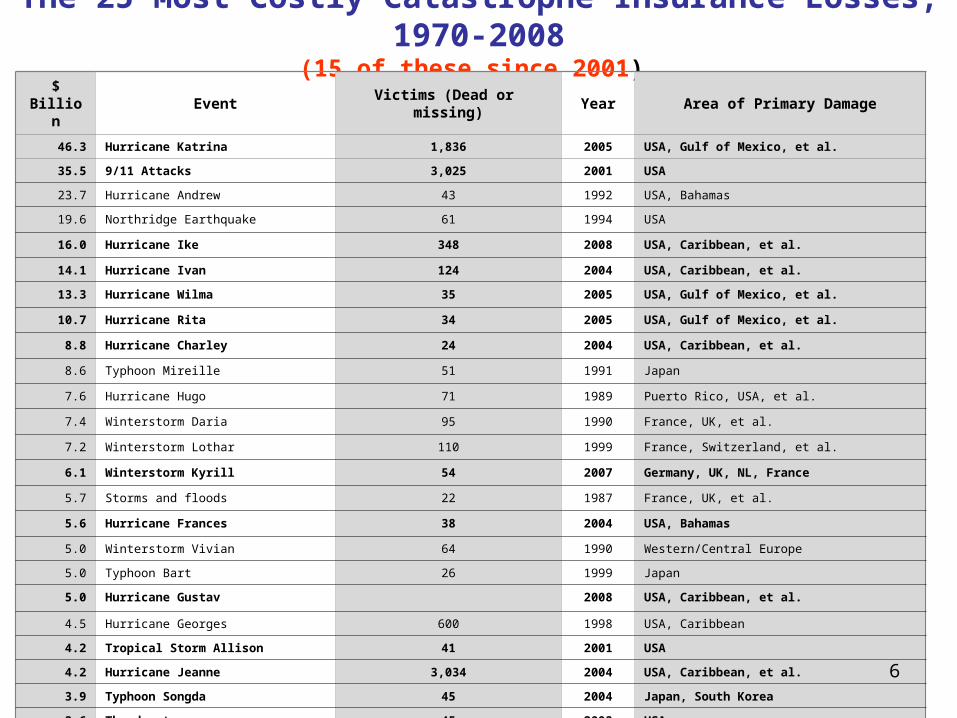
The 25 Most Costly Catastrophe Insurance Losses, 1970-2008
(15 of these since 2001) $ Billion Event Victims (Dead or missing) Year Area of Primary Damage
46.3 Hurricane Katrina 1,836 2005 USA, Gulf of Mexico, et al.
35.5 9/11 Attacks 3,025 2001 USA
23.7 Hurricane Andrew 43 1992 USA, Bahamas
19.6 Northridge Earthquake 61 1994 USA
16.0 Hurricane Ike 348 2008 USA, Caribbean, et al.
14.1 Hurricane Ivan 124 2004 USA, Caribbean, et al.
13.3 Hurricane Wilma 35 2005 USA, Gulf of Mexico, et al.
10.7 Hurricane Rita 34 2005 USA, Gulf of Mexico, et al.
8.8 Hurricane Charley 24 2004 USA, Caribbean, et al.
8.6 Typhoon Mireille 51 1991 Japan
7.6 Hurricane Hugo 71 1989 Puerto Rico, USA, et al.
7.4 Winterstorm Daria 95 1990 France, UK, et al.
7.2 Winterstorm Lothar 110 1999 France, Switzerland, et al.
6.1 Winterstorm Kyrill 54 2007 Germany, UK, NL, France
5.7 Storms and floods 22 1987 France, UK, et al.
5.6 Hurricane Frances 38 2004 USA, Bahamas
5.0 Winterstorm Vivian 64 1990 Western/Central Europe
5.0 Typhoon Bart 26 1999 Japan
5.0 Hurricane Gustav 2008 USA, Caribbean, et al.
4.5 Hurricane Georges 600 1998 USA, Caribbean
4.2 Tropical Storm Allison 41 2001 USA
4.2 Hurricane Jeanne 3,034 2004 USA, Caribbean, et al.
3.9 Typhoon Songda 45 2004 Japan, South Korea
3.6 Thunderstorms 45 2003 USA
3.5 Hurricane Floyd 70 1999 USA, Bahamas, Columbia
6
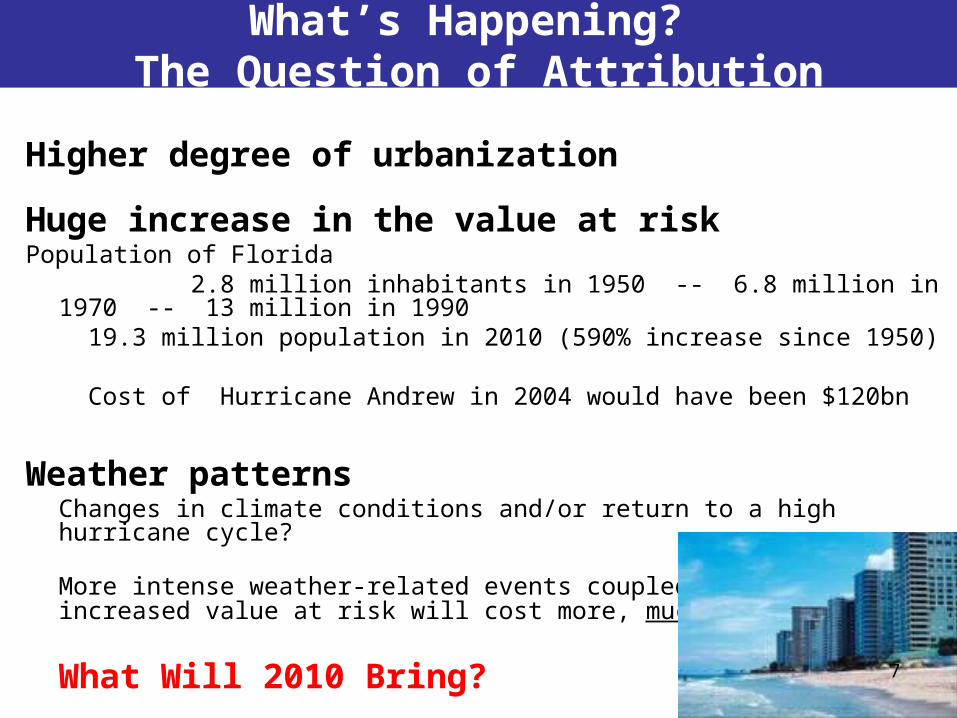
Higher degree of urbanization
Huge increase in the value at riskPopulation of Florida 2.8 million inhabitants in 1950 -- 6.8 million in 1970 -- 13 million in 1990
19.3 million population in 2010 (590% increase since 1950)
Cost of Hurricane Andrew in 2004 would have been $120bn
Weather patternsChanges in climate conditions and/or return to a high hurricane cycle?
More intense weather-related events coupled with increased value at risk will cost more, much more.
What Will 2010 Bring? 7
What’s Happening? The Question of Attribution
7

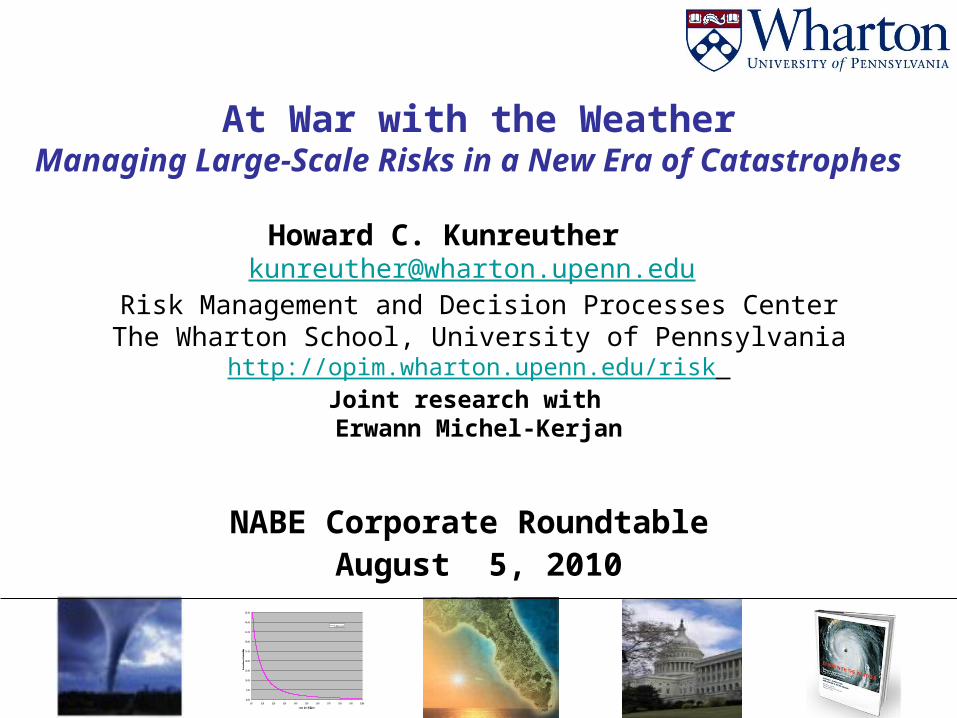
Source: Data from AIR Worldwide Corporation
79%
64%62%
59%54%
36%35%
34%29%
28%26%
23%13%
12%11%
9%5%
0% 10% 20% 30% 40% 50% 60% 70% 80%
Insured Coastal Exposure as a Percentage of Statewide Insured Exposure as of December
2007 (Residential and Commercial Properties)
8
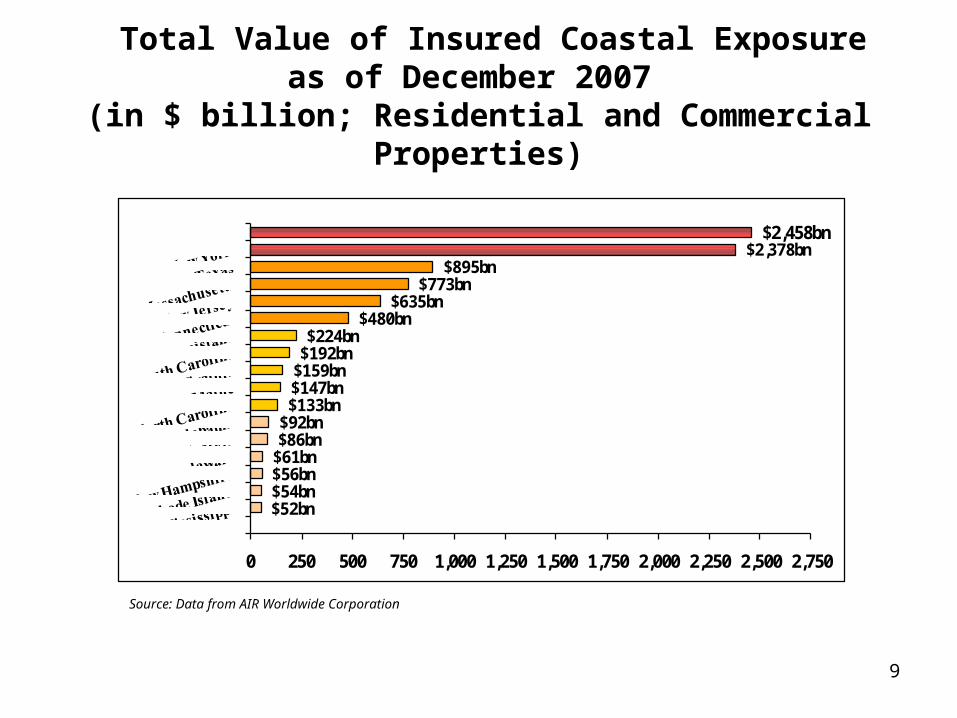
$2,458bn $2,378bn
$895bn $773bn
$635bn $480bn
$224bn $192bn
$159bn $147bn $133bn
$92bn $86bn
$61bn $56bn $54bn $52bn
0 250 500 750 1,000 1,250 1,500 1,750 2,000 2,250 2,500 2,750
Total Value of Insured Coastal Exposure as of December 2007
(in $ billion; Residential and Commercial Properties)
Source: Data from AIR Worldwide Corporation
9
10
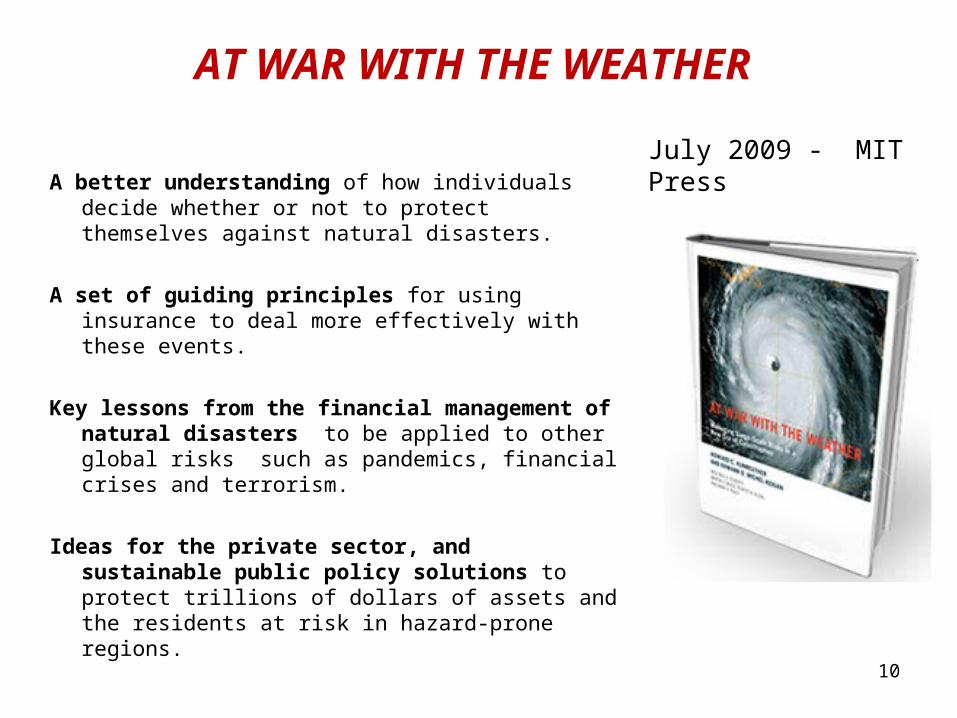
AT WAR WITH THE WEATHER
A better understanding of how individuals decide whether or not to protect themselves against natural disasters.
A set of guiding principles for using insurance to deal more effectively with these events.
Key lessons from the financial management of natural disasters to be applied to other global risks such as pandemics, financial crises and terrorism.
Ideas for the private sector, and sustainable public policy solutions to protect trillions of dollars of assets and the residents at risk in hazard-prone regions.
July 2009 - MIT Press
11
2. Guiding Principles for Developing Risk Management Strategies
Principle 1: Premiums reflecting risk Insurance premiums should be based on risk in order to provide signals to
individuals as to the hazards they face and to encourage them to engage in cost-effective adaptation measures to reduce their vulnerability to catastrophes. Risk-based premiums should also reflect the cost of capital insurers need to integrate into their pricing to assure adequate return to their investors.
Principle 2: Dealing with equity and affordability issues
Any special treatment given to homeowners currently residing in hazard-prone areas (e.g., low-income uninsured or inadequately insured homeowners) should come from general public funding and not through insurance premium subsidies.
12
Insurance VouchersExisting Programs as Models
Food Stamp Program Mission: Vouchers to purchase food based on annual income and family size
Low Income Home Energy Assistance ProgramMission: Assist low-income households in meeting immediate energy needs
Universal Service FundMission: Provide discounts to low-income individuals in rural areas so rates for telecommunications services are comparable to urban areas
1313
Insurance VouchersWho should subsidize low income
residents?General taxpayer – Everyone in society is
responsible
State government – Source of funding would come from state taxes
Insurance policyholders – All homeowners with insurance
Residents in coastal areas – Those in hurricane-prone areas
1414
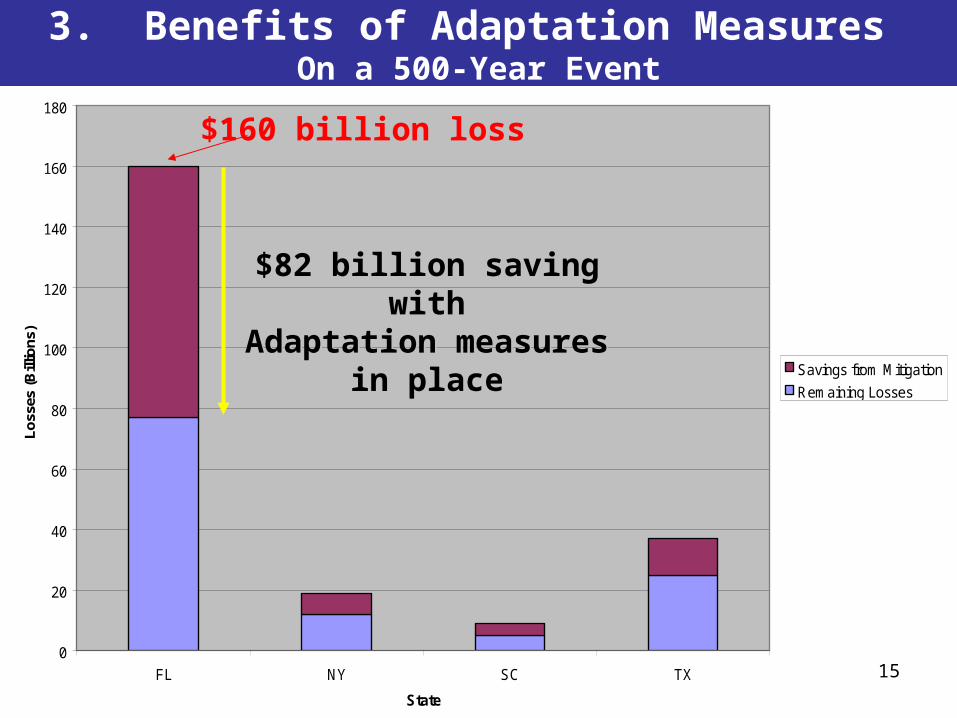
Effects of Mitigation on a 500 Year Event
0
20
40
60
80
100
120
140
160
180
FL NY SC TX
State
Lo
sses
(B
illio
ns)
Savings from Mitigation
Remaining Losses
$160 billion loss
$82 billion saving with$82 billion saving withAdaptation measures Adaptation measures
in placein place
3. Benefits of Adaptation Measures On a 500-Year Event
15

Why Property Owners Do Not Invest in Cost-Effective Adaptation Measures
Short Time Horizons (Quick return on investment)
High Short-Term Discount Rates (Hyperbolic discounting)
Misestimating Probability (Flood will not happen to me)
Liquidity and Upfront Costs (We live from payday to payday)
Truncated Loss Distribution (Only responsible for small portion of loss due to disaster relief)
May Move in 2 or 3 Years (Can’t recover costs of adaptation)1616
Proposed strategy Long-term flood insurance contracts through National Flood Insurance Program (NFIP)
Long-term home improvement loans for mitigating one’s property
Insurance and loans are tied to the property, not
the individual
4. Encouraging Adaptation Measures through
Long-Term Flood Insurance (LTFI)
LTFI Prevents Individuals From Cancelling Their Flood Insurance
Policy
Many homeowners cancel their flood policy if they have not experienced a flood for several years.
Reason: Flood insurance was not a good investment.
Data: Of 1,549 victims of a flood in August 1998 in northern Vermont, FEMA found 84% of residents in SFHAs did not have flood insurance, 45% of whom were required to purchase it (Tobin and Calfee, 2005).
18

Tenure of New Flood Insurance Policies in Mississippi
New Business Year 2001 2002 2003 2004 2005 2006 2007 2008
# New Housing Units 8,297 7,539 8,345 9,183 9,316 44,621 15,599 14,086
Tenure 100% 100% 100% 100% 100% 100% 100% 100%
1 year 73% 68% 65% 72% 66% 73% 72%
2 years 61% 51% 52% 45% 54% 62%
3 years 47% 42% 38% 37% 43%
4 years 39% 30% 32% 29%
5 years 25% 26% 27%
6 years 20% 22%
7 years 17% Authors’ calculation – Data from NFIP/FEMA 19
Characteristic of Adaptation Measures Upfront cost/long-term benefits
Cost of Adaptation Measure – $1,500 to strengthen roof of house
Nature of Disaster
– 1/100 chance of disaster
– Reduction in loss ($27,500)
Expected Annual Benefits: $275 (1/100 * $27,500)
Annual Discount rate of 10%
20
5. Encouraging Adaptation: An Example
20
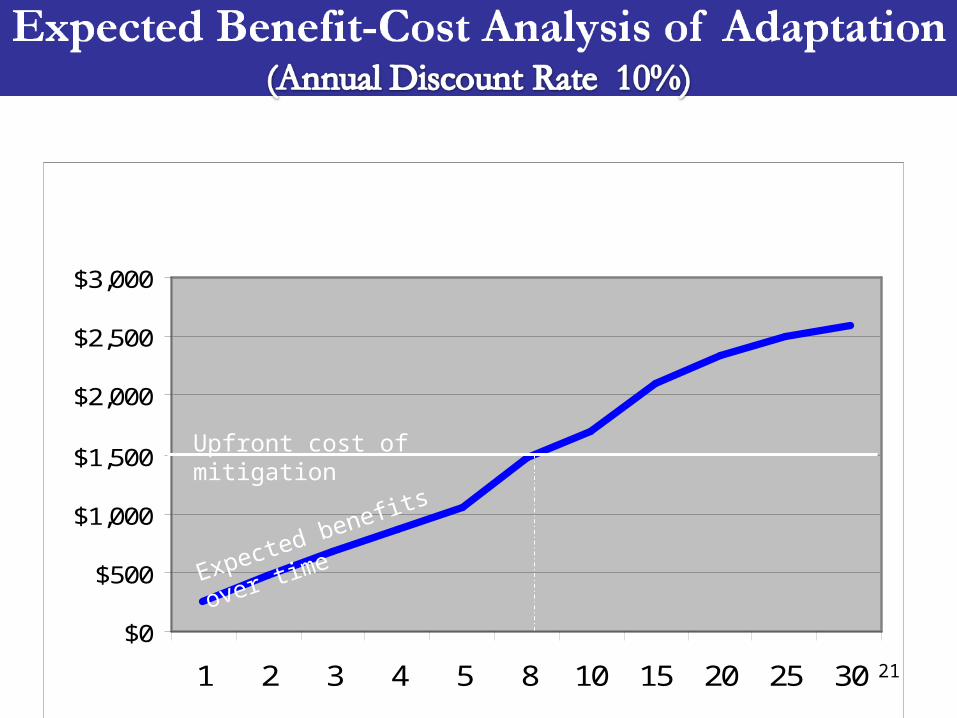
Benefits over 30 years
$0
$500
$1,000
$1,500
$2,000
$2,500
$3,000
1 2 3 4 5 8 10 15 20 25 30
Upfront cost of mitigation
Expected benefits over time
21
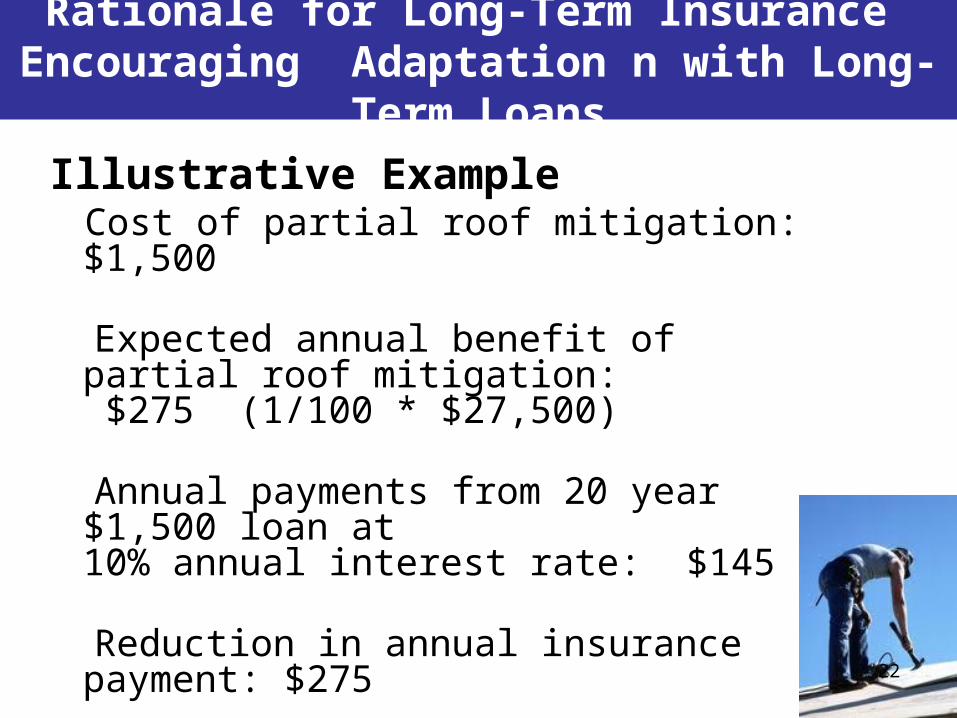
Illustrative Example Cost of partial roof mitigation: $1,500
Expected annual benefit of partial roof mitigation: $275 (1/100 * $27,500)
Annual payments from 20 year $1,500 loan at 10% annual interest rate: $145
Reduction in annual insurance payment: $275
Reduction in annual payments due to adaptation: $275-$145= $130
Rationale for Long-Term Insurance Encouraging Adaptation n with Long-
Term Loans
22
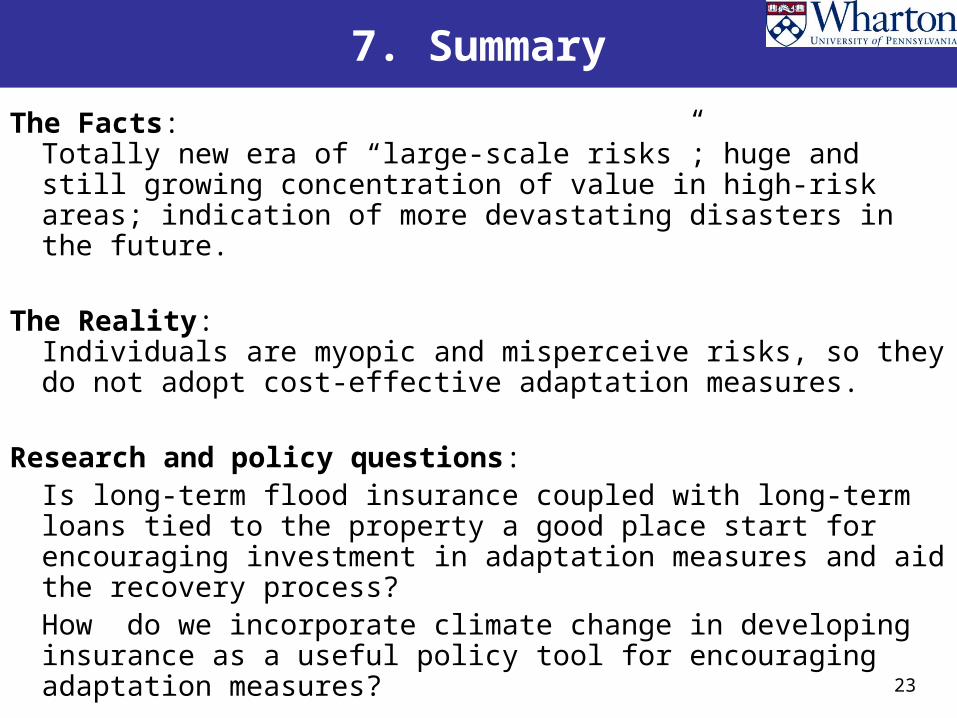
7. Summary
The Facts: Totally new era of “large-scale risks”; huge and still growing concentration of value in high-risk areas; indication of more devastating disasters in the future.
The Reality: Individuals are myopic and misperceive risks, so they do not adopt cost-effective adaptation measures.
Research and policy questions: Is long-term flood insurance coupled with long-term loans tied to the property a good place start for encouraging investment in adaptation measures and aid the recovery process?How do we incorporate climate change in developing insurance as a useful policy tool for encouraging adaptation measures?
23
24