Embed Size (px)
Citation preview
FREQUENCY QUALITY REPORT - NAG
i Nordic Analysis Group
System Operations Committee / Regional Group Nordic
NAG - FREQUENCY QUALITY REPORT
Title Final report
Authors H. Kuisti – M.Lahtinen
M.Nilsson – K.Eketorp – E.Ørum
D.Whitley – A. Slotsvik – A.Jansson
Circulation RGN – Internal TSO
Version 2.0 April 2015
FREQUENCY QUALITY REPORT - NAG
ii Nordic Analysis Group
Abstract
The purpose of this document is to describe the frequency quality challenges the Nordic
Synchronous Area (NSA) faces and identify the factors and mechanisms that contributes to
the frequency quality. By doing this, a next step can be taken to define frequency operational
parameters that will ensure a sound and transparent frequency quality based on analysis and
good operational practice. The report also investigates the impact on system operation as a
result of various frequency quality levels.
The frequency quality trend of "minutes outside the band" has increased over the past years,
indicating that the power system has been operated outside the original design parameters1
and therefore the system security is subjected to increased risk. The time allowed outside the
band per year ranges from 0.4 % to 5 % among the synchronous areas compared in this
report. The current Nordic limit, 10 000 min/year, corresponds to 1.9 % of the time.
Changing the accepted minutes outside normal operating band has an impact on the
probability of going below a certain lowest accepted frequency level during a Dimensioning
Incident. A higher number of minutes outside normal operating band means a higher
probability that the frequency is already under normal operating band when a major incident
occurs, and consequently leads to a higher probability of going under a certain minimum
instantaneous frequency. On the other hand, too strict target for number of minutes outside
normal operating band may lead to unnecessarily high regulation costs.
Further work is recommended to be performed with focus on defining what acceptable risk the
system can be operated with considering frequency quality level, and thereby finding
reasonable limits for operation, both for normal state and disturbance state. The work shall
also consider factors that today are known with a great deal of uncertainty, and that will be
further affected by system changes the next coming years.
A folder containing the reference material is to be found in the ENTSO-E extranet under
RGN/NAG and project name "Frequency Quality".
1 Frequency Containment Reserves for Disturbance (FCR-D) is dimensioned such that the disturbance occurs when the system is within the normal band, however currently the frequency level during normal operation may be below 49.9 Hz more often.
FREQUENCY QUALITY REPORT - NAG
iii Nordic Analysis Group
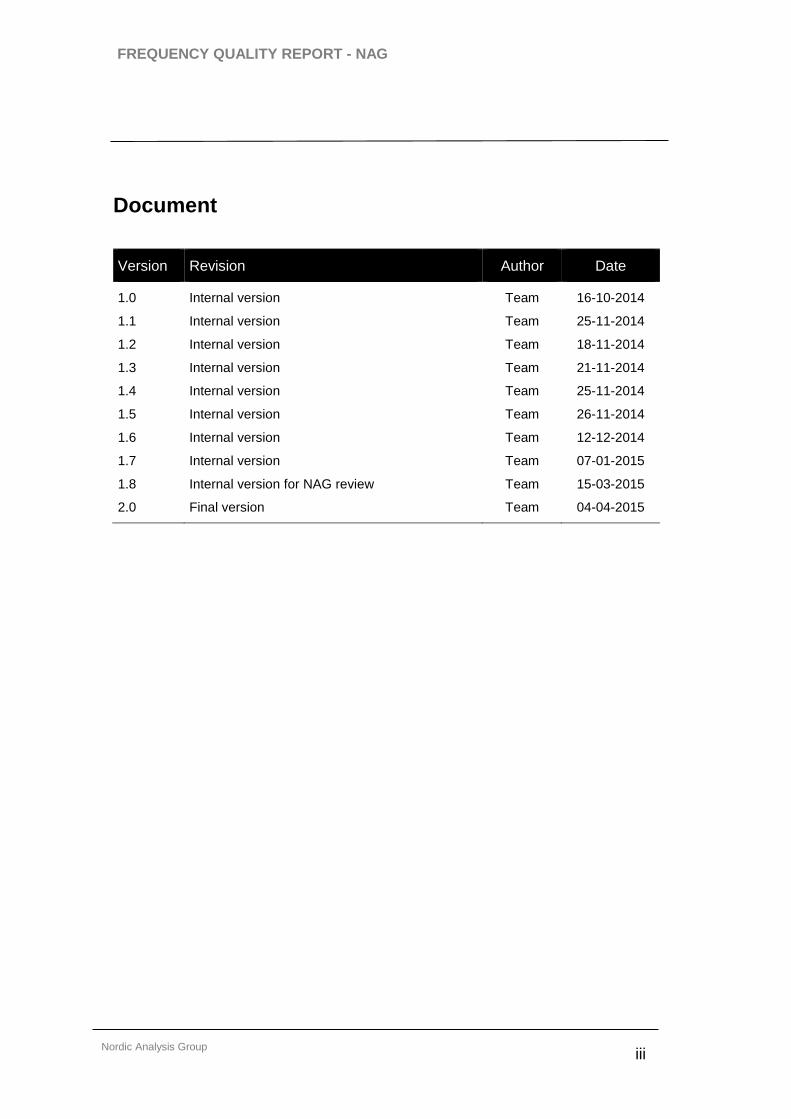
Document
Version Revision Author Date
1.0
1.1
1.2
1.3
1.4
1.5
1.6
1.7
1.8
2.0
Internal version
Internal version
Internal version
Internal version
Internal version
Internal version
Internal version
Internal version
Internal version for NAG review
Final version
Team
Team
Team
Team
Team
Team
Team
Team
Team
Team
16-10-2014
25-11-2014
18-11-2014
21-11-2014
25-11-2014
26-11-2014
12-12-2014
07-01-2015
15-03-2015
04-04-2015
FREQUENCY QUALITY REPORT - NAG
iv Nordic Analysis Group
Contents
LIST OF ABBREVIATIONS .............................................................................................................. 6
1. PURPOSE ..................................................................................................................................... 7
2. INTRODUCTION ........................................................................................................................ 8
3. SCOPE OF WORK .................................................................................................................... 13
4. FREQUENCY STATES ............................................................................................................ 14
NORMAL STATE .................................................................................................................... 14 ALERT STATE ........................................................................................................................ 16 EMERGENCY STATE ............................................................................................................... 16 ISLAND OPERATION ............................................................................................................... 17
5. COMPARISON WITH OTHER SYNCHRONOUS SYSTEMS ........................................... 18
INTRODUCTION ...................................................................................................................... 18 COMPARISON IN SUMMARY ................................................................................................... 18 KEY CONCLUSIONS ................................................................................................................ 19
6. BACKGROUND OF FREQUENCY CONTAINMENT PROCESS ..................................... 21
INTRODUCTION ...................................................................................................................... 21 ELECTRICITY MARKET DEVELOPMENT................................................................................... 21 BACKGROUND OF FREQUENCY QUALITY REQUIREMENTS ...................................................... 22 FREQUENCY CONTAINMENT PROCESS (FCP) ........................................................................ 24 HVDC EMERGENCY SUPPORT ............................................................................................... 25 AUTOMATIC LOAD SHEDDING ............................................................................................... 26 ASPECTS AFFECTING THE DESIGN OF FCR ............................................................................. 27 DESIGNING FCR .................................................................................................................... 29 FRR BALANCING ................................................................................................................... 30
SUMMARY AND CONCLUSIONS .............................................................................................. 31
7. FREQUENCY MEASUREMENT METHODS AND POSSIBLE INDICES ....................... 32
FREQUENCY MEASUREMENT ACCORDING TO STANDARD ....................................................... 32 MEASUREMENT METHODS FOR FREQUENCY QUALITY ........................................................... 32 FREQUENCY MEASUREMENT METHODS AND POSSIBLE INDICES ............................................. 34
8. DESCRIPTION OF ASPECTS AFFECTING THE FREQUENCY QUALITY.................. 38
INTRODUCTION ...................................................................................................................... 38 OVERALL DESCRIPTION OF THE BALANCING PROCESS. .......................................................... 39 RELATIONS BETWEEN INERTIA, RATE OF CHANGE OF FREQUENCY, FBF AND SPEED OF FCR45 60 SEC OSCILLATIONS ............................................................................................................ 46 DEAD BAND ........................................................................................................................... 48 NORMAL OPERATION ............................................................................................................. 48 OPERATION OUTSIDE NORMAL OPERATING BAND .................................................................. 51
9. ANALYSIS RESULTS- FREQUENCY QUALITY LEVELS ............................................... 60
ANALYSIS OF DIFFERENT LEVELS OF MINUTES OUTSIDE NORMAL OPERATING BAND ............. 60 ANALYSIS OF MINIMUM FREQUENCY LEVEL FOR DIFFERENT FBF AND INERTIA .................... 63 FCR-D OBLIGATIONS IN NORDIC SYNCHRONOUS SYSTEM ................................................... 64 SUMMARY OF ANALYSES ....................................................................................................... 68
10. CONCLUSION ....................................................................................................................... 70
11. REFERENCES ....................................................................................................................... 73
FREQUENCY QUALITY REPORT - NAG
v Nordic Analysis Group
ANNEX A – LFC&R – FREQUENCY QUALITY TARGET PARAMETERS ARTICLE 19... 76
ANNEX B – SYNCHRONOUS AREA COMPARISON ................................................................ 78
ANNEX C – TERMS OF REFERENCE .......................................................................................... 79
ANNEX D – AUTOMATIC LOAD SHEDDING SCHEMES ........................................................ 80

FREQUENCY QUALITY REPORT - NAG
6
Nordic Analysis Group
List of abbreviations ACE Area Control Error CPF Cumulative Probability Factor DC Demand Connection ENTSO-E European network of transmission system operators for electricity FALS Frequency Activated Load Shedding FANP Frequency Activated Network Protection FRR-A Frequency Restoration Reserve- Automatic FBF Frequency Bias Factor FCP Frequency Containment Process FCR-D Frequency Restoration Reserve-Disturbed FCR-N Frequency Restoration Reserve-Normal FRCE Frequency Restoration Control Error FRP Frequency Restoration Process HVDC High Voltage Direct Current LFC&R Load-Frequency Control and Reserve, Network code NAG Nordic Analysis Group NC Network Code NE Northern Europe NSA Nordic Synchronous Area NOIS Nordic Operator Information System PCP Primary Control Process PMU Phasor Measurement Unit RfG Requirements for Generators RGN Regional Group Nordic RAR Review of Automatic Reserves RKOM Reglerkraftoptionsmarked (Regulating Power Option Market) ROCOF Rate-of-change-of-frequency SCP Secondary Control Process SFR Standard Frequency Range SOA System Operation Agreement STD Synchronous Time Deviation TCP Tertiary Control Process TSO Transmission System Operator

FREQUENCY QUALITY REPORT - NAG
7
Nordic Analysis Group
1. Purpose
This is a technical report delivered by the Frequency Quality sub-group of Nordic Analysis
Group (NAG) to Regional Group Nordic (RGN). Its aim is to look closer at the historical and
the present day’s challenges of frequency quality in the Nordic Synchronous Area (NSA), as
well as looking at the impact on system operation as a result of various frequency quality
levels. This in order to create a basis for further work with defining operational limits for
frequency. This will in the end ensure that the system in the future is reliable and operated
with an appropriate level of system security. The report will also highlight certain factors that
needs to be considered in order to be compliant with the forthcoming ENTSO-E Network
Codes, foremost the NC LFC&R.
In the report, both normal operation and disturbance situations will be discussed, in addition
to the overall technical challenges of frequency quality.
FREQUENCY QUALITY REPORT - NAG
8
Nordic Analysis Group
2. Introduction
Frequency quality is a measure of the power systems ability to maintain a stable operation
during the changes of consumption and production that are creating imbalances; and to handle
disturbances. The nominal frequency in the NSA is 50 Hz, with a normal operating band per
today in the range of 49.9 to 50.1 Hz.
In the NC LFC&R [8], "Frequency Quality Defining Parameters" are to be found2. These ones
include the following:
- Standard Frequency Range (often referred to "normal operating band" or "normal
operating frequency band")
- Maximum Instantaneous Frequency Deviation
- Maximum Steady State Frequency Deviation
- Time to Restore Frequency
- Frequency Restoration Range
- Alert State Trigger Time
I.e. it is quite clear that frequency quality consist of more than one parameter. Further details
for these parameters are to be found in Appendix A and relevant parameters are further
discussed in Chapter 7.
In [7] report suggestions for new frequency quality indices has been proposed, which covers
indices for identifying and quantifying frequency variations, as well as methods and principles
for defining frequency events and possible measurement methods. The report describes
present praxis for measurement techniques and what can be found within other synchronous
areas. Were relevant, reference to [7] will be made when discussing new indices.
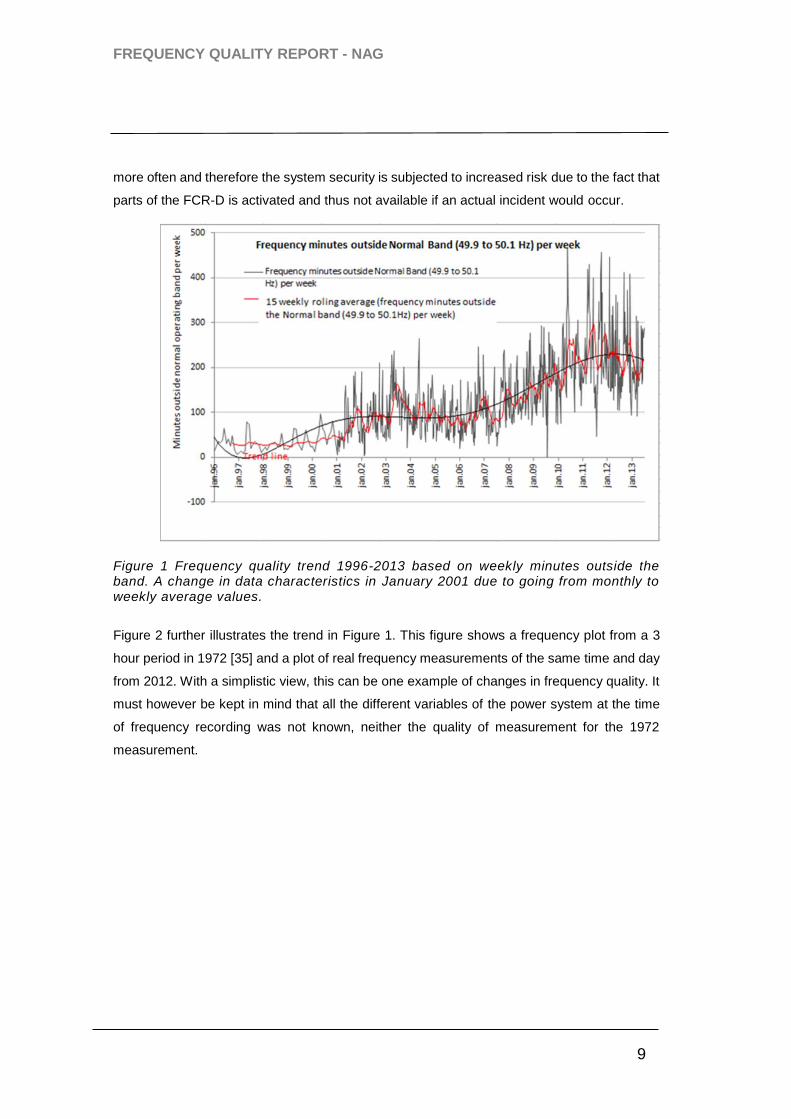
The frequency quality is mainly caused by insufficient balancing between production and
consumption, and measured as "minutes outside the normal operating band".
Figure 1 shows that the trend of "minutes outside the band" has increased over the past years,
indicating that the power system has been operated outside the original design parameters3
2 The Network Codes referred to in this document are at the time being not implemented within the Nordic countries, and details within the codes have not been agreed upon by the Nordic TSO:s.
3 Frequency Containment Reserves for Disturbance (FCR-D) are dimensioned such that the disturbance occurs when the system is at the limit of the normal band. However, currently the frequency level during normal operation may be below 49.9 Hz more often.
FREQUENCY QUALITY REPORT - NAG
9
Nordic Analysis Group
more often and therefore the system security is subjected to increased risk due to the fact that
parts of the FCR-D is activated and thus not available if an actual incident would occur.
Figure 1 Frequency quality trend 1996-2013 based on weekly minutes outside the band. A change in data characteristics in January 2001 due to going from monthly to weekly average values.
Figure 2 further illustrates the trend in Figure 1. This figure shows a frequency plot from a 3
hour period in 1972 [35] and a plot of real frequency measurements of the same time and day
from 2012. With a simplistic view, this can be one example of changes in frequency quality. It
must however be kept in mind that all the different variables of the power system at the time
of frequency recording was not known, neither the quality of measurement for the 1972
measurement.

FREQUENCY QUALITY REPORT - NAG
10
Nordic Analysis Group
Figure 2 Oscillations have increased in 40 years ([35] and 2012 measurement values from ENDK Scada system)
The 2014 target for minutes outside the band has been defined in RGN to be 10 000
minutes/year (see section 4.1). In 2013 it was also 10 000 minutes/year. The performance
year to date is shown below, also with reference to previous years.
Figure 3 Frequency quality in 2013 – total minutes cumulative on the left and weekly bar on the right [from Statnett weekly report on frequency quality]
There are many possible reasons for the deterioration of the frequency quality in normal
operation, significant factors include
- top of the hour imbalances due to market structure
- ramping of HVDC infeed from/to another synchronous areas

FREQUENCY QUALITY REPORT - NAG
11
Nordic Analysis Group
- increased amount of intermittent generation
- insufficient response time of manual balancing reserves
- increased frequency oscillations.
This is the fact even after introduction of quarterly movements (explained later) and better
prognosis for consumption and wind power.
The resulting frequency after loss of large loads, production units or HVDC link serves as
another indication of some aspects of frequency quality in disturbance situations, see Figure
4 for illustration. If such an incident takes place when the initial frequency is below the normal
operating band some of FCR-D is used for balancing and is not available when the disturbance
occurs. This can potentially result in load shedding or even blackout if the incident is severe
enough4.
Figure 4 Typical frequency profile after forced outage of a large production unit (nuclear power plant).
A number of measures have been initiated to reduce the negative trend of frequency quality:
- Quarterly production plans
The TSOs can quarterly adjust production in order to avoid large imbalances
around top of the hour. This ancillary service allows the Nordic TSOs to move
4 It should be noted that the potential risk of getting a system blackout as a result of a slight reduction of FCR-D should be seen as quite low. Blackout often requires multiple unforeseen events and more severe system conditions.

FREQUENCY QUALITY REPORT - NAG
12
Nordic Analysis Group
parts of the production up to 15 minutes ahead or postpone production up to 15
minutes5.
- The ongoing NAG "60s project"6 will find measures to reduce the oscillation (with
period time of typically 60 s) in frequency.
- The Nordic TSOs have introduced automatic secondary reserves, FRR-A
(Frequency Restoration Reserves- Automatic)
FRR-A have a positive influence to the frequency quality as illustrated in figure
below where the distribution of frequency for minutes outside the normal operating
band is presented for different volumes during test period February to March 2013.
Figure 5 Distribution of frequency, separate for three levels of FRR-A during the test period from February to March 2013. [42] The Nordic TSOs will have to comply with the Operational Network Codes (LFC&R [11], OS
[26], OPS [33]) and connection codes (RfG [32], DC [29] and HVDC [34]) post 2016. Work is
ongoing to develop a new System Operation Agreement (SOA) for the Nordic area. This report
will indicate to RGN which parameters are to be included in the new SOA but will not
recommend any values for them.
5 https://www.entsoe.eu/news-events/announcements/announcements-archive/Pages/News/new-requirements-for-quarterly-production-plans-in-sweden-and-finland.aspx
6Project name is "Measures to mitigate the frequency oscillations with a period time of 60-90 s in the Nordic synchronous area". At the moment of writing, the 3rd phase of the project is to be started with the name "Revision of requirement for Nordic Frequency Containment Process".
FREQUENCY QUALITY REPORT - NAG
13
Nordic Analysis Group
3. Scope of work
The scope of work is to study operational and technical aspects in the Nordic synchronous
system relating to frequency quality. The studies will be based on review of historic
methodology, technology facts of 2014 and consideration to the new Network Codes
obligations. Both the consequences of system stability in normal operation and in fault
conditions (referred to as disturbance) will be considered. The consequences of different
levels of frequency quality will be analysed and quantified.
The historical approach of the design of the Nordic power system will also be clarified where
there are clear needs of this (historically accepted and agreed quality levels used today).
Frequency quality will be discussed in light of the comparison with other synchronous systems
and the requirements of the LFC&R Network Code.
The following aspects are not included in the report
- Defining concrete levels for frequency quality levels like for instance normal
operating band, minimum instantaneous frequency deviation etc.
- Defining/analyse frequency quality for island mode operation "or weak grid".
- Defining Dimensioning Incident (DI) in which amount of self regulating loads is a
part.
- Frequency quality considering frequency oscillations.
- Analyse and describe possible indices/methods for identifying system
disturbances (within the NAG activity "Future Inertia").
FREQUENCY QUALITY REPORT - NAG
14
Nordic Analysis Group
4. Frequency states
In the following chapter the definitions is given for the three different frequency states, as
defined in NC OS (Network Code for Operational Security) [26] and in NC LFC&R [8]. The
sub-states named "Normal operation/Operation outside normal operating band" are modes
used in this report to highlight the difference between operation in Normal State, with or without
an event.
- Normal State
o Normal operation
o Operation outside normal operating band
- Alert State
- Emergency State
Furthermore, the following is defined in the NC OS:
- Disturbance means an unplanned event that may cause the Transmission
System to divert from Normal State
In the actual report, the definitions are used as follows:
- "Normal operation" will refer to Normal State without any event (disturbance or
outage) and frequency within normal operating band.
- "Disturbance" will be used for outages with a resulting frequency outside the
normal operating band (± 0.1 Hz). As seen in the definitions below, this event can
result in operation either within "Normal State" or within "Alert State".
In this chapter, some definitions for island mode operation are also presented, even though
this state is not referred to further on in the report (limitation of scope).
Normal State
According to the NC OS7 [26], the system is in Normal State when
Normal State means the System State where the system is within Operational
Security limits in the N-Situation
N-Situation means the situation where no element of the Transmission System is unavailable
due to a fault.
FREQUENCY QUALITY REPORT - NAG
15
Nordic Analysis Group
For the Normal State without disturbance (Normal operation), frequency quality indices that
are related to the normal operating band can be defined. The NC LFC&R [8] defines the normal
operating band as the Standard Frequency Range around the Nominal Frequency8. This
Standard Frequency Range is ±100 mHz for the NSA.
The maximum annual number of minutes outside the Standard Frequency Range is set to a
default 15000 minutes in the NC LFC&R [11] but the TSOs are allowed to agree on another
value. The present limit for minutes outside normal operating band is 10 000 minutes (for
2014), set by RGN [30].
As defined in NC LFC&R Art 42 [11], the System Frequency limits for Normal State are fulfilled
when:
a) the steady state System Frequency Deviation is within the Standard Frequency
Range [author note: +/- 100 mHz]; or
b) the steady state System Frequency Deviation is not larger than 50 % of the
Maximum Steady State Frequency Deviation [author note: 50 % of 0,5 Hz, i.e. 0,25
Hz] for a time period not longer than the Time to Restore Frequency [author note:
15 min]; or
c) the steady state System Frequency Deviation is not larger than the Maximum
Steady State Frequency Deviation for a time period not longer than the Alert State
Trigger Time [author note: 5 min].
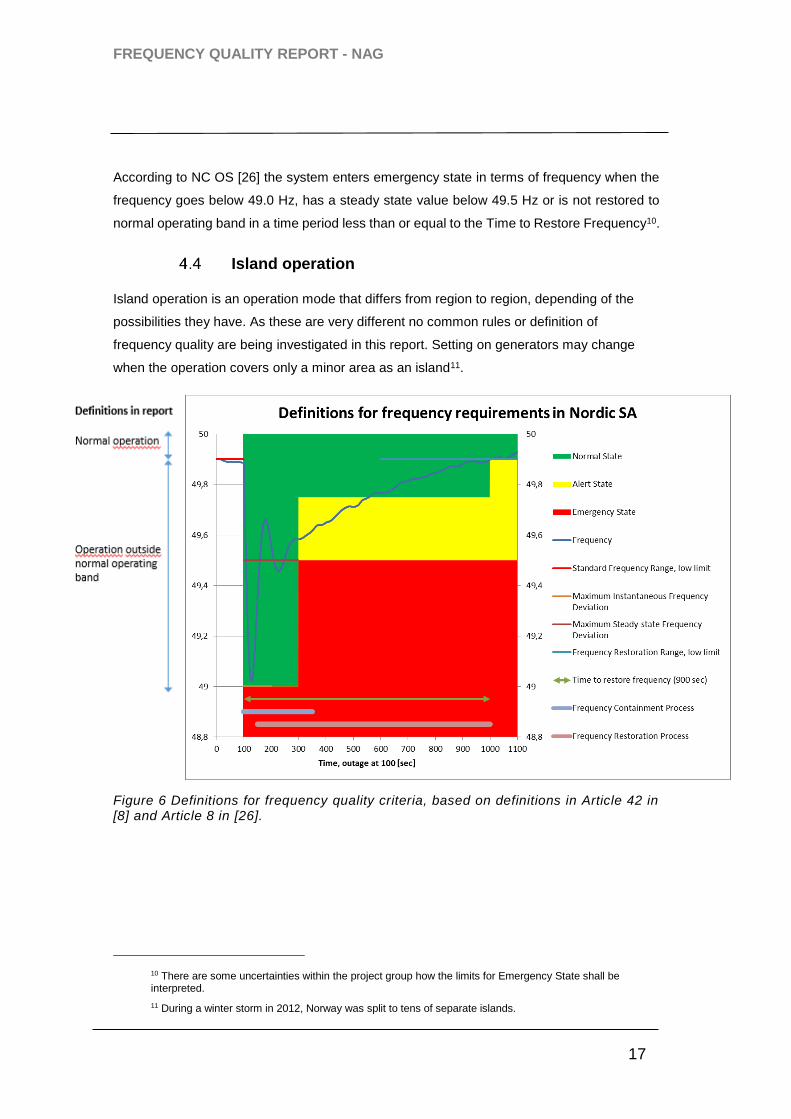
See Figure 6.
Operation outside normal operating band includes outages when a significant loss of
production, HVDC infeed or load disturbs the system by creating an imbalance. The Frequency
Containment Process (FCP) means a process that aims at stabilizing the system frequency
by compensating imbalances by means of appropriate reserves.
This process is common for the whole synchronous area, and a defined share of the reserves
are allocated to individual TSOs.
The NC LFC&R [11] requires that the maximum contribution from a single provider of FCR
should be limited to ensure that the consequences are kept to a minimum if a single provider
would fail to deliver its FCR.
8 Nominal Frequency means the rated value of the System Frequency (50 Hz in the Nordic synchronous area)
FREQUENCY QUALITY REPORT - NAG
16
Nordic Analysis Group
The NC LFC&R [8] defines the Dimensioning Incident (DI) as the highest expected
instantaneously occurring active power imbalance within a LFC Block9 in both positive or
negative direction.
In operation outside normal operating band, these are the primary frequency criteria, as
defined in NC LFC&R [8] and further illustrated in Figure 6:
"Frequency Restoration Range" means the system frequency range to which the
System Frequency is expected to return to after the Dimensioning Incident within
the "Time to Restore Frequency". The default value in the NSA is defined in [8] to
be ±100 mHz.
"Maximum Steady State Frequency Deviation" means the maximum expected
frequency deviation at which the system frequency is designed to be stabilized
after the occurrence the Dimensioning Incident. The default value in the NSA is
defined in [8] to be ± 0.5 Hz.
The NC LFC&R [8] does not distinguish between FCR operating in the normal
operating band (FCR-N) and that operating outside normal operating band (FCR-
D). According to NC LFR&R, it is only in the NSA that two different products are
specified, and in some cases with different specifications for speed of response.
Alert State
According to NC LFCR the following will result in Alert State
- The absolute value of the steady state System Frequency Deviation is larger
than the Maximum Steady State Frequency Deviation; and
- the System Frequency limits for Normal State are not fulfilled
Emergency State
The Operational Security Code defines the Emergency State as the system state where
"Operational Security Limits are violated..."
The Operational Security Limits means the acceptable operating boundaries: thermal limits,
voltage limits, short-circuit current limits, frequency and dynamic stability limits.
9 Currently the Nordic synchronous system is managed as a single Control Block with common dimensioning of FRR and RR.
FREQUENCY QUALITY REPORT - NAG
17
Nordic Analysis Group
According to NC OS [26] the system enters emergency state in terms of frequency when the
frequency goes below 49.0 Hz, has a steady state value below 49.5 Hz or is not restored to
normal operating band in a time period less than or equal to the Time to Restore Frequency10.
Island operation
Island operation is an operation mode that differs from region to region, depending of the
possibilities they have. As these are very different no common rules or definition of
frequency quality are being investigated in this report. Setting on generators may change
when the operation covers only a minor area as an island11.
Figure 6 Definitions for frequency quality criteria, based on definitions in Article 42 in [8] and Article 8 in [26].
10 There are some uncertainties within the project group how the limits for Emergency State shall be interpreted.
11 During a winter storm in 2012, Norway was split to tens of separate islands.
FREQUENCY QUALITY REPORT - NAG
18
Nordic Analysis Group
5. Comparison with other synchronous systems
Introduction
A comparison of ten other synchronous systems, with nominal frequency of 50 and 60 Hz, has
been undertaken. The key parameters are listed in Annex B. The reason for the comparison
is to learn how other systems are managed in terms of frequency and system security. The
key conclusions from this comparison are listed below.
Comparison in summary
The key parameters of nominal frequency, normal operating band, time deviation, frequency
bias, quasi-steady state frequency and instantaneous frequency level have been compared.
The nominal frequency is the same, 50 Hz, throughout all of Europe. Also most Asian countries
and Australia use 50 Hz. Most parts of America use 60 Hz as nominal frequency. [6]
The normal operating band, how much the frequency is allowed to deviate during normal
operation, varies between different synchronous areas. In the Nordic area the normal
operating band is 49.9-50.1 Hz. In Continental Europe (former UCTE), Russia (including the
Baltic countries) and US Eastern Interconnection the normal operating band is narrower;
49.95-50.05 Hz. In Great Britain, Chile and China the normal operating band is instead wider;
49.8-50.2 Hz, [6]. Australia has a normal operating band of 49.85-50.15 Hz [39].
There are different ways of characterising the normal variation of frequency. One way is to
indicate the percentage of time or annual number of minutes outside the normal operating
band. When comparing these figures it shall be kept in mind that normal operating bands are
different in different synchronous areas.
The time allowed outside the normal operating band per year ranges from 0.4 % (Great Britain)
to 5 % (Russia). The current Nordic limit, 10 000 min/year, corresponds to 1.9 % of the time.
Another way is to compare the allowed standard deviations of frequency. These values range
from 0.026 Hz (Russia) to 0.092 Hz (Chile). The current Nordic target value of 10000 min/year
outside normal operating band corresponds to the standard deviation of 0.042 Hz.
Regarding allowed time deviation; ± 30 s is used in the Nordic area, Continental Europe, Great
Britain and Russia. Australia has specified a value ± 5 s for the mainland and ± 15 s for
Tasmania, [39]. Western USA uses an even shorter value, ± 2 s [43].
The method to correct the time deviation differs. In the NSA the time correction is mainly done
manually. However the Nordic FRR Technical Group has proposed to manage this
FREQUENCY QUALITY REPORT - NAG
19
Nordic Analysis Group
automatically as is the practice in Russia [6]. The NC LFC&R [8] does not require the definition
of target value for time deviation for the Nordic area.
The frequency bias factor (FBF), [MW/Hz], also known as the primary control frequency
response, is mainly provided from FCR. The FBF gives the remaining frequency deviation
after a system disturbance, i.e. it represents the "stiffness" of the system. The frequency bias
factors are not directly comparable as the system sizes are different in the terms of generation
capacity. The requirement for minimum frequency bias factor provided from reserves is 27
GW/Hz in the US Eastern connection, 15 GW/Hz in Continental Europe and 6 GW/Hz in the
NSA. The frequency bias factor is in practice higher, typically 29 GW/Hz in Continental
Europe12 and 8 GW/Hz in NSA [36] (including the frequency dependence of loads). The higher
this value is the smaller will the frequency change be after an incident causing power
imbalance. If for instance a 1000 MW unit trips the steady state frequency change will be 40
mHz in CE and 100 mHz in NE.
In the NSA it is required that 50 % of FCR-D is activated in 5 s and the rest in 30 s, whereas
the activation time of FCR-N is longer, 2-3 min. In Great Britain it is required that all FCR shall
be activated within 10 s13 [6]. In Continental Europe and in Russia the activation time of FCR
is 30 s.
The minimum instantaneous frequency for the NSA is not specified in the current System
Operational Agreement but older reports state 49.0 Hz [52], [17]. This is also set in the NC
LFC&R [8] as a default value, and the Nordic TSOs are allowed to agree on another value.
Continental Europe [40], Great Britain and Russia use the minimum frequency 49.2 Hz [47].
The quasi steady state frequency, the level the frequency should at least have reached within
30 - 60 s after a disturbance, is 49.5 Hz in the NSA and in Great Britain, whereas in Continental
Europe and Russia it is set to 49.8 (50.2) Hz [6].
Key conclusions
Key conclusion from the comparison are:
Normal operating band - varies between ± 50 mHz and ± 200 mHz. The Nordic
definition is ± 100 mHz.
12 This value has been calculated in CE WG SF from 90 outages (Erik Ørum is a member of this group)
13 GB has more types of FCR, where one part has a fast response in 10 sec with limited duration – 30 sec, the second type has a response in 30 sec with limited duration – 30 min [44]

FREQUENCY QUALITY REPORT - NAG
20
Nordic Analysis Group
Time allowed outside the normal operating band – ranges from 0.8 % to 5 % of
the time. The NSA current performance is 1.9 %. The standard deviation of
frequency - ranges from 0.026 to 0.092 Hz. The NSA current performance is 0.042
Hz14.
Allowed time deviation – The Nordic limit of ± 30 s is consistent with several other
systems, even though also smaller values are also used in Western USA and
Australia. NC LFC&R however do not require this value to be specified any more in
the Nordic area
Frequency bias factor – this relates to the accepted drop in frequency after
stabilizing. The minimum requirement is 6 GW/Hz for normal operating band for NSA
and 15 GW/Hz for Continental Europe. The performance is in practice better
compared with the minimum requirements.
The frequency bias factors are not directly comparable due to differences in system
size and system needs.
FCR activation time – The fastest response is found in Great Britain 100 % in 10 s,
Continental Europe is 30 s and Nordic is 50 % in 5 sec and 100 % in 30 s.
Minimum instantaneous frequency – this is not specified in the current System
Operational Agreement but older reports state 49.0 Hz. The value is 49.2 Hz in
Continental Europe, Great Britain and Russia.
The steady state minimum frequency – this is 49.5 Hz in the Nordic area and in
Great Britain and 49.8 Hz in Continental Europe and Russia.
14 10 000 minutes outside normal operating band corresponds roughly to standard deviation 0.043 Hz.
FREQUENCY QUALITY REPORT - NAG
21
Nordic Analysis Group
6. Background of frequency containment process
Introduction
A survey regarding the history of frequency quality and design of the frequency containment
process (FCP) has been done in order to clarify why the NSA normal operating band and
Frequency Containment Process (FCP) is designed as it is.
In order to make this survey, four interviews and a workshop have been arranged. The
interviewed have helped us in an educational and engaged way and contributed with material
from decades regarding the NSA history of frequency quality.
We would like to thank Sture Lindahl, Sture Larsson, Kenneth Walve, Set Persson, Jørgen
Falck Christensen and Ole Gjerde for their contribution in order to make this survey.
Electricity market development
As the Nordic electricity market developed and the demand for electricity grew during the 60s,
70s and 80s the electricity companies tried to prognosticate the development of electrical
consumption in order to build power new power plants in time. These prognoses took into
account the risk for a possible electricity shortage and what national economic consequences
a shortage would imply. In 1982, Svenska Fysikersamfundet concluded that an acceptable
rate of occurrence of electricity rationing was once every thirty year. [49]
The Nordic electricity market was deregulated in 2000. Before the deregulation, the electricity
companies were producers, consumers and system operators. To create incentives to
exchange energy between companies a bilateral trade’s price was settled between the two
trading companies marginal prices. This bilateral market of electrical energy was used until
the deregulation of the Nordic electricity market. This deregulation started in Norway by a
parliament’s decision in 1991 but the market was not fully integrated until Denmark joined in
the year of 2000. [50] [49]
The deregulated market is an energy market per hour. As the need for electrical consumption
changes within the hours but the production companies start and stop production at top of the
hour the new deregulated market has created problems with keeping the frequency within the
frequency bandwidth at top of the hour.
A condition for being able to exchange electricity between companies freely with only variable
cost as marginal prices is that delivery dependability exists. Before the deregulation all
companies accepted a joint delivery dependability agreement to make it economic efficient.
Today the market with help by the transmission system operators creates incentives to keep
a delivery dependency. [49]
FREQUENCY QUALITY REPORT - NAG
22
Nordic Analysis Group
The tariffs for the FCR have also changed. Before the deregulation special tariffs were applied
to the nuclear power plants to cover the costs for FCR-D and there where demands for every
producer to contribute with FCR-N in relation to their production. Today the TSO has created
different markets to minimize the costs for these reserves. This cost is then paid for by different
national tariffs. [51][23]
To balance the production and consumption the Norwegian and Swedish TSOs have a shared
responsibility. Balancing based on the national imbalances was done nationally, before the
common Nordic balancing market was established in year 2002. The balancing was done
using ACE calculations, ΔP + Ki*Δf where Ki is the relative share of frequency controlled
normal reserves [48]. The activation was a manual process and the used reserves was from
within each country.
When the common market was introduced, this also implied that activations of resources could
be shared. This meant that if DK needed to up-regulate, DK could ask SE to up-regulate
instead, if they had lower activations prices. Thru this SE could have both up and down
regulation – which was non-optimal. This was solved by giving NO and SE a joint responsibility
for activation of reserves (also in DK and FI) – via calls to these two TSOs. Through this
change of responsibility, the use of ACE disappeared and the balancing was performed based
on the sum of all national imbalances.
Before the deregulation, Statkraft and Vattenfall had a responsibility to restore FCR. A belief
is that it was not as hard as today to keep the frequency within the bandwidth limits as there
were progressive fees for imbalances which made the integrated companies, covering both
production and consumption, to hold there electrical balances better. These integrated
companies were, due to the deregulation, split into production, consumption companies and
the transmission system operators.
Background of frequency quality requirements
The Nordic power system has been designed with the goal of keeping frequency within the
range of 50 ± 0.1 Hz. The assumption that the frequency is normally inside this range has
affected the design of the power system. Because of this, the time the frequency is within the
range 50 ± 0.1 Hz is one central aspect of frequency quality. [11]
Consumers and producers of electricity and transmission grid operators have different
perspectives to frequency quality. From the consumer’s perspective, the current frequency
quality is good enough. Some industries, such as mechanical paper industries can be sensitive
to fast rate of change of frequency, but for the rather large Nordic power system this is not a
FREQUENCY QUALITY REPORT - NAG
23
Nordic Analysis Group
problem. If however operational security of the power system is reduced due to poor frequency
quality this will have an economic impact on the industry. [15] [12] [18]
The frequency quality is more important from a producer's perspective. If a production unit is
used for frequency regulation, the frequency variations cause more regulation and
consequently more wear of the unit. High and low frequencies are a problem also for thermal
power plants. They are able to operate for only a limited time at frequencies outside the range
49...50.3 Hz and there is a risk of vibrations in turbine shafts at frequencies outside this range.
[12] [13]
A transmission system operator perspective focuses on operational security: Keeping the
boundaries established for normal frequency aims at having the FCR-D disposable for
activation when a disturbance occurs. A well-founded design with a functional interaction
between frequency containment reserves and load shedding contributes to a reliable and
robust power system.
Frequency boundaries 50 ± 0.1 Hz
Kungl. Vattenfallstyrelsen wrote in 1957 that with the introduction of electrohydraulic governors
it was not a problem anymore to maintain the frequency within the frequency boundary 50 ±
0.1 Hz. The decision to use 50 ± 0.1 Hz as the normal interval has been up for discussions
but the main reason of having a strict interval is to minimize the risk of having frequencies
above 50.3 Hz after trips of load. If the frequency is above 50.3 Hz the thermal power shafts
can start to vibrate, which increases the units wear. Another advantage with using ± 0.1 Hz
instead of ± 0.2 Hz as boundary is to give the FCR-D an extra second to respond to a
disturbance if the frequency is low at the instance of the disturbance. [19] [12] [15] [13].
Still another reason for defining the range 50 ± 0.1 Hz in normal operation was to operate
close to highest point of efficiency, i.e. close to nominal frequency15.
Lowest instantaneous & steady state frequency
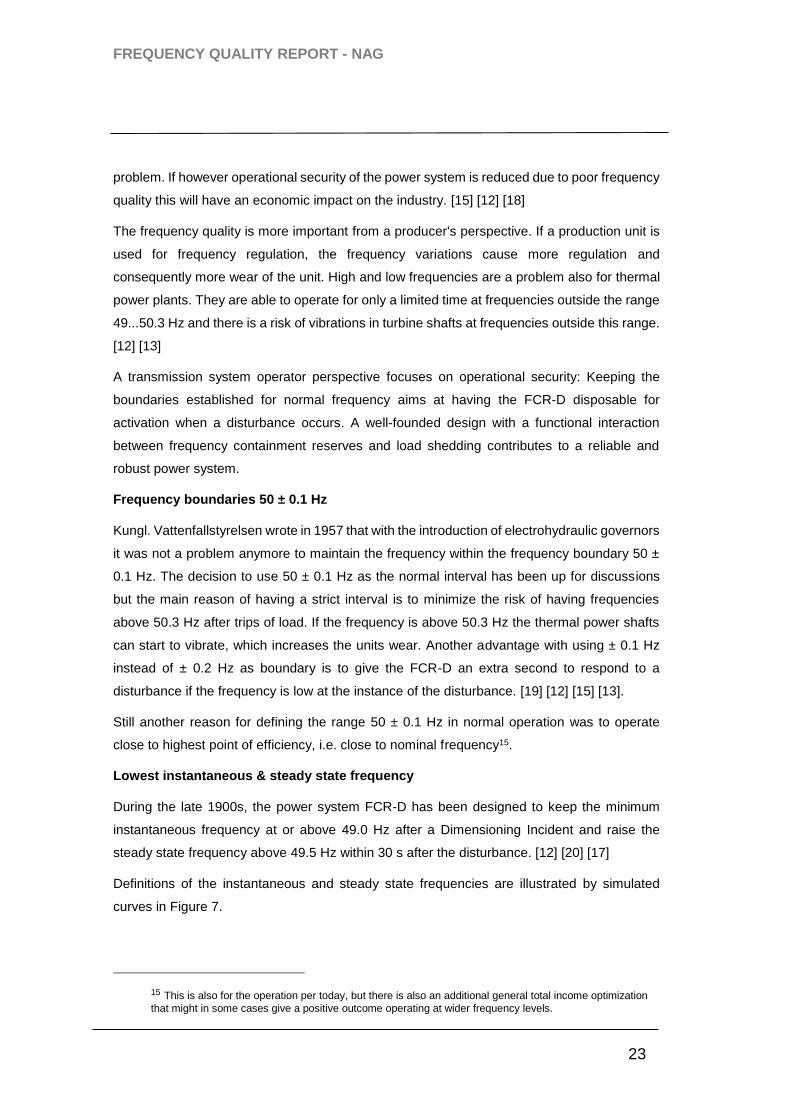
During the late 1900s, the power system FCR-D has been designed to keep the minimum
instantaneous frequency at or above 49.0 Hz after a Dimensioning Incident and raise the
steady state frequency above 49.5 Hz within 30 s after the disturbance. [12] [20] [17]
Definitions of the instantaneous and steady state frequencies are illustrated by simulated
curves in Figure 7.
15 This is also for the operation per today, but there is also an additional general total income optimization
that might in some cases give a positive outcome operating at wider frequency levels.
FREQUENCY QUALITY REPORT - NAG
24
Nordic Analysis Group
Figure 7 Simulated frequency development when a disturbance occurs. Simulation model from [36] used.
Frequency Containment Process (FCP)
In an electric power system there is all the time a balance of electric power. A disturbance (a
loss of generator, load or HVDC-link or just a stochastic difference in production and
consumption) does not cause a power imbalance but only a change in how the balance is
maintained. During frequency deviations the electrical balance is maintained by the decrease
or increase of the kinetic energy of the turbines and generators. The frequency containment
reserves interrupts the frequency alterations and in so doing the withdrawal/storage of power
from the stored kinetic energy. [11] [24]
FCR-N
The current regulation method of FCR-N was developed during the 20th century. Instead of
letting a few main power plants do the regulation it is distributed to several power plants. The
FCR-N is delivered mostly by hydropower plants.
FCR-D
Frequency dependent disturbance reserve (FCR-D) has been designed to keep the frequency
above the minimum instantaneous frequency after any N-1-incident. The minimum
instantaneous frequency should in turn be above frequency levels at which automatic load
shedding starts. If part of the FCR-D is not available when the disturbance occurs this can
lead to load shedding. If the load shedding fails to bring the frequency to levels where power
plants can stay in operation some power plants will be tripped, which can lead to lower and
lower frequencies due to more trips of generating units and ultimately to black-out. Operational
limits for power plants are visualized in Annex D – Automatic Load shedding schemes.
Steady state frequency
Minimum instantaneous frequency

FREQUENCY QUALITY REPORT - NAG
25
Nordic Analysis Group
There was a review of the Nordic FCR–D and the automatic load shedding design during the
1970 because of the installation of large nuclear power plants. The FCR-D consists mostly of
power from hydro power plants. Some of the FCR-D is also delivered from HVDC frequency
support, thermal power plants, hydropower in synchronous condenser mode and
disconnection of loads. [14] [22] [12] [21] [23]
To restore FCR
To restore FCR the start up time of the manual Frequency Restoration Reserve (FRR-M) has
been set to 15 minutes. One of two main reasons for having a time limit of 15 minutes is that
it is a good time span for starting up hydro power units and gas turbines. The second reason
for it is the fact that it takes approximately 15 minutes for an overloaded power line to start
sagging dangerously16. [51]
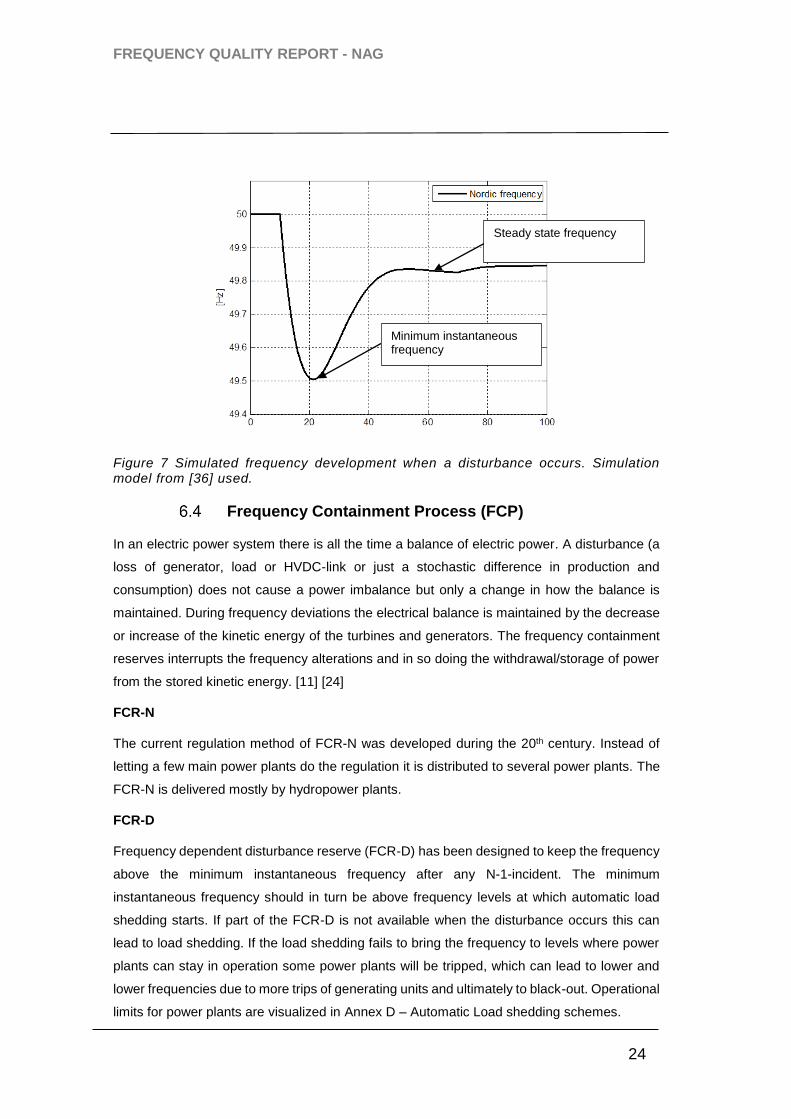
HVDC emergency support
HVDC emergency support is activated at frequencies between 49.9-49.0 Hz and 50.3 – 51.0
Hz. Some emergency support should be seen as FCR-D and some just as emergency support,
but the difference between the two "products" is not clear as seen in Figure 8 and system
protection layout in [53].
The only HVDC emergency support that can always be counted on is the FCR-D from HVDC
connections which is 50 MW from KonTek and 18 MW from Storebælt when these HVDC-links
are in use.
16 Rule of thumb. Depends on loading before over loading occurs, and is also depending on chosen construction criteria of single lines.
FREQUENCY QUALITY REPORT - NAG
26
Nordic Analysis Group
Figure 8 HVDC emergency support in the NSA.
Automatic Load Shedding
It has become standard in power systems to use automatic load shedding to avoid low
frequencies that can trigger power plants protection relays. The main reason for avoiding this
is that a power plant trip due to low frequency will most likely lead to blackouts. [16]
FREQUENCY QUALITY REPORT - NAG
27
Nordic Analysis Group
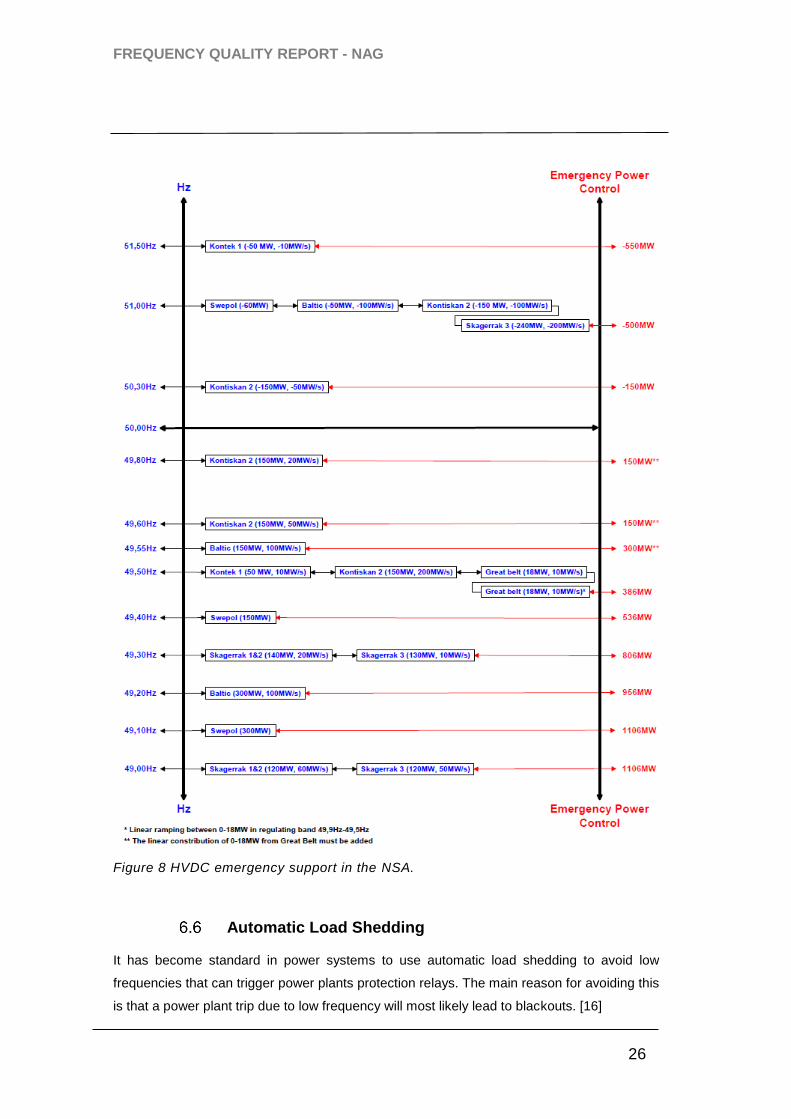
The concept Frequency Activated Network Protection (FANP) was introduced in the 1980s.
The concept means automatic, decentralized load shedding that does not cause disconnection
of ordinary consumers’ load. The region where ordinary consumers were disconnected was
called Frequency Activated Load Shedding (FALS). Figure 9 gives the structure of the
frequency activations from 1983, and in Annex D – Automatic Load shedding schemes from
today, with details for each country within the NSA, is specified.
Figure 9 Frequency activation regions for various system services activated by instantaneous frequencies [17]
Aspects affecting the design of FCR
One aspect is the frequency oscillation. Today there is a frequency oscillation in the Nordic
power system with a time period of around 40-90 s. It is not yet fully clear what the causes of
the oscillation are, but it is amplified by the FCR-N response which have a resonance peak
around these frequencies. Higher amplitude of the frequency oscillation implies an increased
FREQUENCY QUALITY REPORT - NAG
28
Nordic Analysis Group
need of FCR-N to reach the same frequency quality goals (provided that the FCR doesn’t
excite the oscillations). It seems unlikely that there is a way to completely eliminate the 40-90
s oscillations. So they will continue to contribute to the minutes outside normal operating
band and consequently affect the need for FCR-N. [25] [13] [12]
Another aspect that affects the need of FCR-N is the load variations. Disregarding the market
problem at top of the hour with changes of power production, several studies have been
performed to assess how much load varies. Studies done in the 1970s concluded that the load
variations could be up to ± 1 % during a few minutes. It is recommended that these variations
are taken into account when dimensioning the FCR-N and if the variations increase the need
of FCR-N increases [13].
The measurements will need to be improved to facilitate the monitoring of load variation.
Currently it is only possible to estimate the variation of imbalance in the NSA by measuring
the frequency variation and converting that to imbalance variation based on assumed (not
calculated or measured) of frequency bias factor. At least power measurements of all
significant generators and perhaps also of loads with sufficiently high time-resolution are
needed but are not yet sufficiently available to the TSOs.
The power system’s kinetic energy is stored in the rotating mass of the power systems
generators and turbines that are synchronously connected to the grid. When frequency
changes the rotational speed of the generators also change. When the frequency increases,
energy is stored when accelerating the generators and turbines. When the frequency
decreases energy is supplied as the speed of the rotating mass decreases. If the stored kinetic
energy decreases the need for speed of FCR response increases. [11] [13]
During a disturbance the frequency and voltage dependence of loads affects the lowest
instantaneous frequency and the steady state frequency after the disturbance. During
disturbances, the frequency changes gradually in the whole system, whereas the voltage
changes instantaneously but locally. Therefore gradual changes of loads caused by their
frequency dependence take place in the whole system, while instantaneous changes of loads
caused by their voltage dependence occur mainly in certain areas. When dimensioning the
FCR-D a fixed reduction of load (200 MW) is assumed when the frequency drops to the lowest
acceptable steady state value of 49.5 Hz. The voltage dependence of loads is not taken into
account and is also difficult to take into account since it depends on where the trip of power
takes place and in which way the tripped unit contributed to the power flow in the system
before tripping. [13] [12]

FREQUENCY QUALITY REPORT - NAG
29
Nordic Analysis Group
Designing FCR
If the problems at top of the hour and the frequency oscillations are disregarded, the amount
of FCR-N needed can be approximated. With the frequency bandwidth of 0.1 Hz, the historic
assumption that the load vary with ± 1 percent and the fact that the maximum load in the NSA
is around 60 000 MW the need of FCR-N is approximated to 600 MW. [12] [13] [15]
This amount of FCR-N needed is also affected by how well organized the operation monitoring
is. For example, it depends on how well the producers and consumers follow their production
and consumption plans (it should be noted that even though plans are followed on hourly
basis, deviations from plans can occur on shorter time periods with resulting impact on the
frequency quality). This information could be helpful when making a decision of the amount of
secondary regulation that is needed. Also, if the secondary regulation takes five or fifteen
minutes to restore the FCR-N or whether it is automatic or not will also affect the amount of
FCR-N needed. In the end, the amount of FCR-N has been decided by considering the cost
of achieving an acceptable frequency quality level.
When designing the FCR-D it is assumed that the frequency, when the disturbance occurs, is
above 49.9 Hz. The Dimensioning Incident (trip of the nuclear power plant Oskarshamn 3 at
the power of 1400 MW [53]) may then in the worst case cause an instantaneous frequency of
49.0 Hz and a steady state frequency of 49.5 Hz. Based on these criterions and assuming
certain kinetic energy and frequency dependency of loads, the FCR-D is dimensioned and the
requirement for the regulation response is set. [17]
FREQUENCY QUALITY REPORT - NAG
30
Nordic Analysis Group
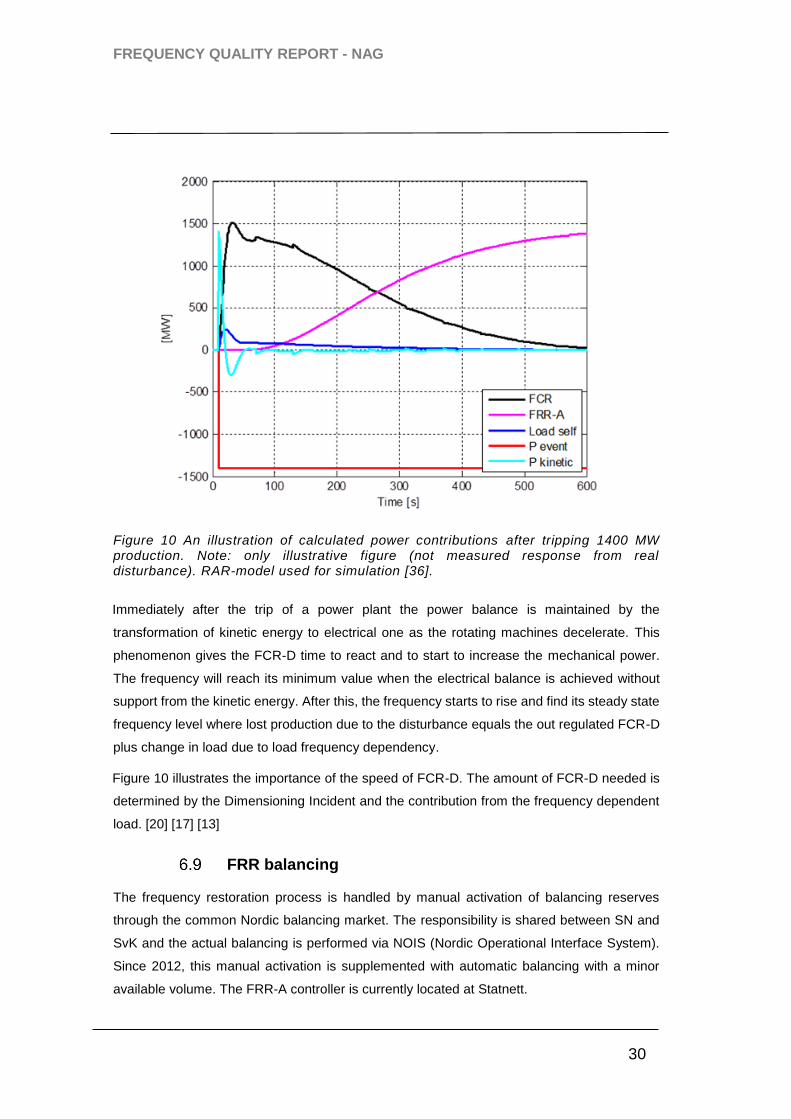
Figure 10 An illustration of calculated power contributions after tripping 1400 MW production. Note: only illustrative figure (not measured response from real disturbance). RAR-model used for simulation [36].
Immediately after the trip of a power plant the power balance is maintained by the
transformation of kinetic energy to electrical one as the rotating machines decelerate. This
phenomenon gives the FCR-D time to react and to start to increase the mechanical power.
The frequency will reach its minimum value when the electrical balance is achieved without
support from the kinetic energy. After this, the frequency starts to rise and find its steady state
frequency level where lost production due to the disturbance equals the out regulated FCR-D
plus change in load due to load frequency dependency.
Figure 10 illustrates the importance of the speed of FCR-D. The amount of FCR-D needed is
determined by the Dimensioning Incident and the contribution from the frequency dependent
load. [20] [17] [13]
FRR balancing
The frequency restoration process is handled by manual activation of balancing reserves
through the common Nordic balancing market. The responsibility is shared between SN and
SvK and the actual balancing is performed via NOIS (Nordic Operational Interface System).
Since 2012, this manual activation is supplemented with automatic balancing with a minor
available volume. The FRR-A controller is currently located at Statnett.
FREQUENCY QUALITY REPORT - NAG
31
Nordic Analysis Group
Summary and conclusions
Thermal power plants will be tripped by under-frequency relays at around 47.5 Hz for security
reasons. This will lead to an even lower frequency and ultimately to a blackout. The FCR and
load-shedding schemes have been designed in order to avoid this scenario.
It is the task of FCR-N (and also FRR) to keep the frequency in the normal operating band ±
0.1 Hz. In this way the whole volume of FCR-D is available when a frequency disturbance
occurs and the frequency is more likely to be kept above levels where load-shedding starts.
Aspect that affects the need for speed of FCR-D response is the size of the Dimensioning
Incident and the amount of stored kinetic energy in the power system. Aspects that affect the
amount of FCR-D needed are the Dimensioning Incident and the frequency dependence of
load.
Aspects that affect the amount of FCR-N is the load variations and how well
production/consumption plans are followed.
If an incident is more severe than the Dimensioning Incident occurs or if part of the FCR-D has
been activated before the incident due to an initial frequency below the normal operating band,
the frequency drop can be deep enough to initiate load-shedding. This could also be the case
if the general system state (inertia, FBF or speed of FCR-D) is other than assumed before the
event.
Load-shedding has been designed to avoid a total black-out but involves disconnecting a large
number of consumers. Some extra features as the “FANP” with automatic load shedding of
electrical steam boilers and electrical heat pumps and emergency support from HVDC exists
to avoid automatic load shedding of ordinary consumers. If the incident causing the frequency
disturbance is severe enough then not even load-shedding will be sufficient to prevent a black-
out.
FREQUENCY QUALITY REPORT - NAG
32
Nordic Analysis Group
7. Frequency measurement methods and possible indices
In the following chapter, a discussion is given regarding how frequency physically is being
measured and how different frequency indices can be used in the operation of the system.
Frequency measurement according to standard
IEC 61000-4-30
The frequency reading shall be obtained every 10 s. As power frequency may not be exactly
50 or 60 Hz within the 10-second time clock interval, the number of cycles may not be an
integer number. The fundamental frequency output is the ratio of the number of integral cycles
counted during the 10-second time clock interval, divided by the cumulative duration of the
integer cycles. Before each assessment, harmonics and inter-harmonics shall be attenuated
to minimize the effects of multiple zero-crossings.
CENELEC EN 50160
The nominal frequency of the supply voltage shall be 50 Hz. Under normal operating
conditions the mean value of the fundamental frequency measured over 10 s shall be within a
range of
50 Hz ± 1 % (i.e. 49,5 ... 50,5 Hz) during 99,5 % of a year 50 Hz + 4 %/- 6 % (i.e. 47 ... 52 Hz) during 100 % of the time
for systems with synchronous connection to an interconnected system [4].
Measurement methods for frequency quality
SvK has measured most of the statistics referred in this report. The frequency is measured
with high accuracy (three decimals). It is a redundant measuring system with one measuring
unit located in Järva (220kV) and another located in Hamra (400kV). The stored measured
frequency of today is integrated over 5 s but the alarm received in the dispatch center use a
one second integrated frequency and the frequency registration during disturbances is
integrated over 0.1 s.
SvK is calculating the minutes outside the normal operating band by using the first 5 s
integrated frequency value of every minute. This one sets the value for the whole minute.
Time deviation is continuously calculated with the absolute time and the measured frequency
as input. For historical data, hourly values are saved.
FREQUENCY QUALITY REPORT - NAG
33
Nordic Analysis Group
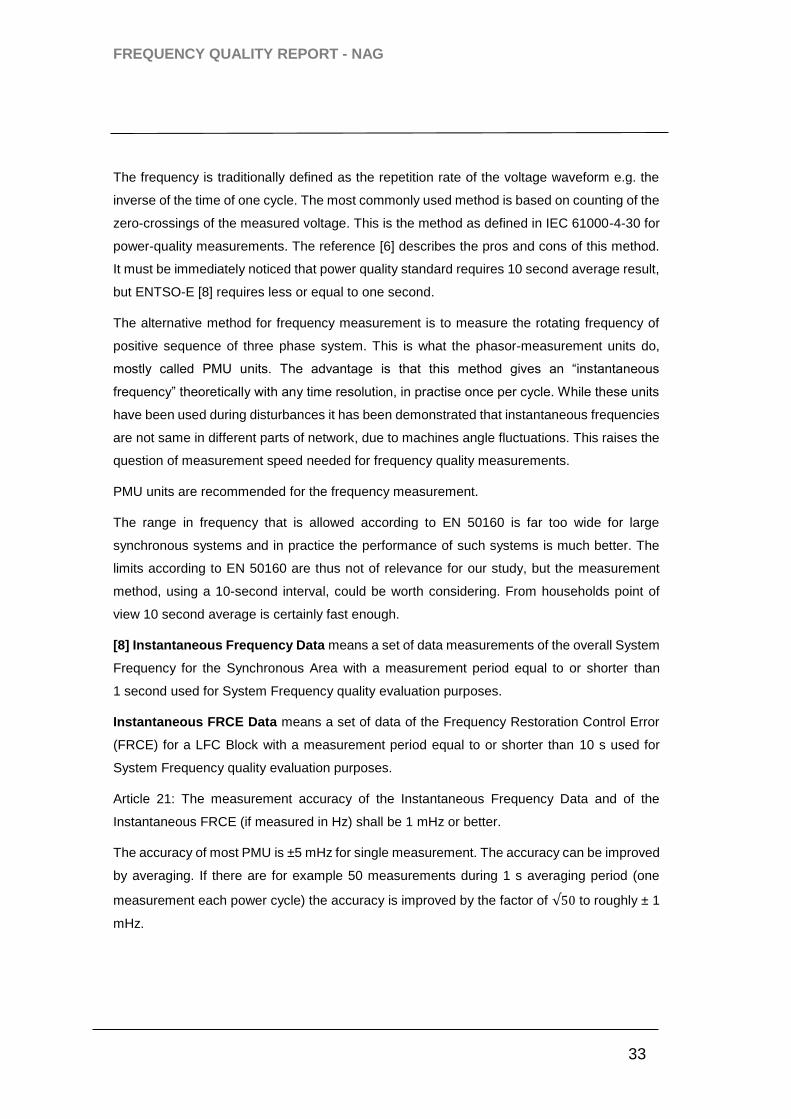
The frequency is traditionally defined as the repetition rate of the voltage waveform e.g. the
inverse of the time of one cycle. The most commonly used method is based on counting of the
zero-crossings of the measured voltage. This is the method as defined in IEC 61000-4-30 for
power-quality measurements. The reference [6] describes the pros and cons of this method.
It must be immediately noticed that power quality standard requires 10 second average result,
but ENTSO-E [8] requires less or equal to one second.
The alternative method for frequency measurement is to measure the rotating frequency of
positive sequence of three phase system. This is what the phasor-measurement units do,
mostly called PMU units. The advantage is that this method gives an “instantaneous
frequency” theoretically with any time resolution, in practise once per cycle. While these units
have been used during disturbances it has been demonstrated that instantaneous frequencies
are not same in different parts of network, due to machines angle fluctuations. This raises the
question of measurement speed needed for frequency quality measurements.
PMU units are recommended for the frequency measurement.
The range in frequency that is allowed according to EN 50160 is far too wide for large
synchronous systems and in practice the performance of such systems is much better. The
limits according to EN 50160 are thus not of relevance for our study, but the measurement
method, using a 10-second interval, could be worth considering. From households point of
view 10 second average is certainly fast enough.
[8] Instantaneous Frequency Data means a set of data measurements of the overall System
Frequency for the Synchronous Area with a measurement period equal to or shorter than
1 second used for System Frequency quality evaluation purposes.
Instantaneous FRCE Data means a set of data of the Frequency Restoration Control Error
(FRCE) for a LFC Block with a measurement period equal to or shorter than 10 s used for
System Frequency quality evaluation purposes.
Article 21: The measurement accuracy of the Instantaneous Frequency Data and of the
Instantaneous FRCE (if measured in Hz) shall be 1 mHz or better.
The accuracy of most PMU is ±5 mHz for single measurement. The accuracy can be improved
by averaging. If there are for example 50 measurements during 1 s averaging period (one
measurement each power cycle) the accuracy is improved by the factor of √50 to roughly ± 1
mHz.
FREQUENCY QUALITY REPORT - NAG
34
Nordic Analysis Group
Frequency measurement methods and possible indices
ENTSO-E [8] has already determined rather comprehensive list of indices, see Chapter 2.
Also in [7], possible frequency indices are being discussed.
From Chapter 5 and [8] it's obvious that four types of indices are commonly used to quantify
the frequency quality:
- the standard deviation
- average of the frequency
- the number of threshold crossings
- and the time outside the normal operating band
Maximum synchronous time deviation is also used as target.
Indices related to sudden frequency events are less commonly used. They will require
measurements at different locations to obtain accurate estimates. Due to the fact that only a
few results per year will be obtained, this is not useful.
Based on Chapter 5 and information given in [8], the commonly used frequency-quality indices
are: the total time that the frequency is outside the Standard Frequency Range (SFR) and the
number of times that frequency is outside the SFR.
The time interval over which the indices are determined may vary from one week to one year.
The average frequency value and the standard deviation give a good impression of how much
the frequency varies around its nominal value.
The maximum synchronous time deviation has been used for a long time. It guides to keep
the average frequency close to nominal. It is good indicator how well the reserves has been
allocated. It should also be noted that large time deviation means that the average value is
shifted and will affect the figure of time outside the SFR. It has been justified earlier also by
synchronous clocks, which nowadays have vanishing importance.
In NC LFC&R [8] the standard deviation of frequency is not highlighted as a frequency index.
But seen from use in GB, and that in fact give another level of information compared with the
"minutes outside normal operating band", it would be seen as a natural factor to follow.
NC LFC&R [11] has stated two averaging times, 1 s for Frequency Quality and 10 s for FRCE
Data. The 10 s value is in line with Power Quality standards and sounds more reasonable from
end users point of view. The reference [9] shows the differences for results if various averaging
times are used. The difference between 1 s or 10 s is rather small, but the 15 min makes
substantial difference.
FREQUENCY QUALITY REPORT - NAG
35
Nordic Analysis Group
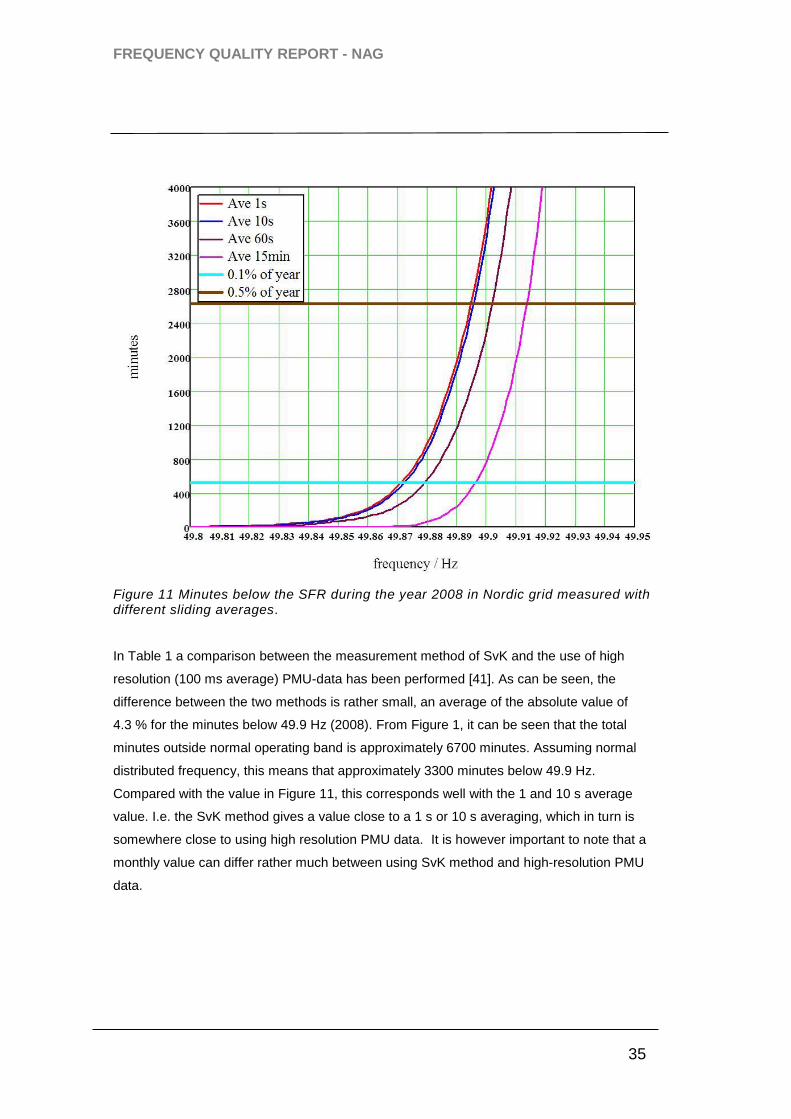
Figure 11 Minutes below the SFR during the year 2008 in Nordic grid measured with different sliding averages.
In Table 1 a comparison between the measurement method of SvK and the use of high
resolution (100 ms average) PMU-data has been performed [41]. As can be seen, the
difference between the two methods is rather small, an average of the absolute value of
4.3 % for the minutes below 49.9 Hz (2008). From Figure 1, it can be seen that the total
minutes outside normal operating band is approximately 6700 minutes. Assuming normal
distributed frequency, this means that approximately 3300 minutes below 49.9 Hz.
Compared with the value in Figure 11, this corresponds well with the 1 and 10 s average
value. I.e. the SvK method gives a value close to a 1 s or 10 s averaging, which in turn is
somewhere close to using high resolution PMU data. It is however important to note that a
monthly value can differ rather much between using SvK method and high-resolution PMU
data.

FREQUENCY QUALITY REPORT - NAG
36
Nordic Analysis Group
Table 1 Comparison between SvK method of calculating minutes outside normal operating band with using PMU-data with no averaging method. Percentage value is the difference between minutes outside for a certain month. Negative value equals less minutes outside with SvK method.
2008 2009 2010
>50,1Hz <49,9Hz >50,1Hz <49,9Hz >50,1Hz <49,9Hz
January -0.40% -1.70% 1.50% -2.30% 5.60% -3.50%
February -2.60% -1.00% 4.40% -5.20%
March -4.90% 6.30% 4.90% -2.60% 8.40% -10.70%
April 13.20% -5.90%
May -4.90% -6.70% 4.10% -10.60% 8.20% -6.80%
June 8.10% 0.70% 3.20% -11.20% 4.00% -6.60%
July 8.00% -15.50% 3.00% -6.80%
August -3.60% -7.30% 3.30% -8.00%
September 0.70% -2.20%
October 1.10% -8.70% -0.30% -4.40% 1.20% -5.90%
Novermber 0.20% 2.70% 1.60% 0.00% 1.70% -2.20%
December 2.80% 0.00% 0.40% -8.90% 4.30% 0.00%
Average 1.90% -2.90% 1.80% -5.80% 4.40% -5.60%
4.40% 5.60%
Average of the
absolute difference 4.30% 4.70% 2.70% 5.80%
Indices for Normal operation
NC LFC&R [8] has set the default value for SFR as ±100 mHz.
For all indices, the measurement procedure shall be agreed upon, at least averaging time
interval. An averaging time of 10 s is well justified for normal operation and is in line with
Power Quality standard [3].
NC LFC&R [8] has defined as default the target for maximum number of minutes outside the
SFR per year as 15 000 minutes. TSO:s have a choice to choose different value, but
obviously the minutes outside the SFR must be one common index for the synchronous
area. Index for shorter time interval is also possible for example one week, which has been
used previously as well.
The standard deviation together with total average is very descriptive especially for annual
statistics, when distribution is very close to normal. Shorter interval distributions may deviate
considerably. While distribution can be assumed to be normal then the outside SFR minutes
can be easily calculated for any frequency range easily.
The Synchronous Time Deviation (STD) is not literally an index. The agreed maximum STD
guides operators to ensure that the average value of the frequency is close to nominal 50.00
Hz. If we assume STD = 30 s during one week period it means that frequency average
deviates 2,5 mHz from nominal and will increase number of minutes outside SFR.
FREQUENCY QUALITY REPORT - NAG
37
Nordic Analysis Group
Indices for Disturbance
Indices for disturbance is more difficult, because there are rather few incident during one
year. The key parameters for each incident are normally analysed:
- Minimum Instantaneous frequency
- Steady state frequency after system has stabilised.
Useful information can be obtained by analysing the rate of change (ROCOF) immediately
after the disturbance has occurred. With this and the knowledge of amount of tripped power
the total kinetic energy in network can be estimated. While doing these analysis one must
remember that after every disturbance there are power fluctuations, which will cause
instantaneous frequencies deviates in different parts of grid.
The actual frequency drop during such events is not typically used as a frequency-quality
index, although smaller frequency drop indicates better reserve situation. The frequency
drop and minimum instantaneous frequency are not recommended for indices, because they
depend on many factors out of operators control. Most important ones are the system inertia
and FBF.
The instantaneous frequency deviation compared with the steady state frequency deviation
can tell something about inertia, frequency depended load and quality of FCR-D, but there is
no simple relations between only two elements.
By dividing the tripped power with the steady state frequency deviation (frequency before trip
minus steady state frequency), the system FBF can be calculated. This value shall be equal
to or above the Dimensioning Incident (trip in MW) divided by the factor 0.4 Hz (49.9-49.5 Hz).
It is difficult to set a graded scale for the FBF, and it is probably more suitable to just have a
defined acceptable lowest limit.
The measurement time interval has to be sufficiently short to be able to observe the variation
of frequency during disturbance. A time interval must be shorter than 1 s, but 100 ms sliding
average is seen as relevant.
Using measurements at one location, the accuracy that can be obtained does not seem to
be very high. Modern technology, using synchronized measurements at locations spread
through the system, are expected to enable a more accurate estimation of these parameters.
In the NC LFC&R [8] the Maximum Instantaneous Frequency Deviation is defined with a
default limit of 1000 mHz, and the Maximum Steady State Frequency Deviation with a
default limit of 500 mHz.
FREQUENCY QUALITY REPORT - NAG
38
Nordic Analysis Group
8. Description of aspects affecting the frequency quality
Introduction
This section describes more into detail the three different frequency states given in Chapter 4,
Normal State, Alert State, and briefly Emergency State. For these the different relevant
frequency indices are considered and how different operational aspects and power system
parameters affect them.
Several of the aspects/parameters covered in this section are changing over time. This must
be kept in mind when a next step is taken and quality indices will be proposed.
Among the aspects that is changing over time and affect the frequency quality the most, are
the change of system inertia, the integration of HVDC links, increase of Dimensioning Incident
and increase of intermittent production sources (wind power).
- As the NSA has grown larger and more rotating mass has been added, the total
kinetic energy in the NSA has become larger overall since the 1980s. Lately, due
to the refurbishment of hydropower units where the power output has been
maximized and losses reduced, the general belief is that the inertia constant (H)
has overall become smaller. However, during the refurbishment of the nuclear
power plants in Sweden, the H constant has in several cases actually increased.
This implies that the power systems rotating mass might not be declining as much
as the general belief is. What is challenging though, is that with the increased
number of HVDC interconnectors and the building of new power production with
no contribution to the NSA´s kinetic energy, the total rotating mass in the NSA
varies more between hours, days and time of the year. [51]
- The number of HVDC interconnectors to the NSA have increased over the last
years. It is clear and generally known that the NSA´s installed HVDC capacity
affects the numbers of minutes outside the normal operating band, but how much
is uncertain.
- When the Dimensioning Incident was introduced in 1975, it was stated that it
should be an incident that could occur once every third year. The incident could
be an outage or a line trip. The dimensioning was limited to 1200 MW until the
power upgrade of Oskarshamn 3 was finished in 2009 and the unit became the
world’s largest boiling water reactor. This single change has increased the
Dimensioning Incident of NSA with 20 percent. This change shouldn’t affect the
minutes outside the normal operating band or the steady state frequency after a
FREQUENCY QUALITY REPORT - NAG
39
Nordic Analysis Group
disturbance, but it affects the lowest possible instantaneous frequency as the
ROCOF will become greater and in case FCR-D is kept constant.
- The installed wind power capacity in NSA has increased during the last years and
is prognosticated to further increase the next couple of years. This intermittent
power production does not follow a production plan as accurately as conventional
power production due to challenges with accurate wind forecasting, and therefore
it affects the minutes outside the normal operating band.
In general, the manual balancing activity is another factor that has a big influence on the
frequency quality. However, these manual operational aspects are not further covered in this
chapter/report.
Overall description of the balancing process.
The generation from power units and consumption from loads connected to the ENTSO-E
NE network needs to be controlled and monitored for secure a high-quality operation of the
synchronous area. The manual balancing, LFC, the technical reserves, load behaviour and
the corresponding control performances are essential to keep the grid in operation, which
means the frequency deviation have to be within certain limits, Maximum Steady State
Frequency Deviation which are 49.5 Hz to 50.5 Hz.
As an example, by increase in the total demand without an increase in the generation the
system frequency will decrease, and by decrease in the demand without a decrease in the
generation the system frequency will increase.
The Load Frequency Control (manual and or automatic), act as a PI-controller in a closed
loop, where frequency containment process, FCP, is the proportional power stabilizing the
frequency and the frequency restoration process, FRP, is the integral power controlled by
operator or the LFC correcting the frequency towards 50 Hz. Frequency is the controlled
quantity and most of the load, some renewable generation and inertia are the not controlled
parts of the process in the closed loop.
Within the ENTSO-E CE synchronous area, the individual control actions and the reserves
are organised in a hierarchical structure with LFC-areas and LFC blocks, but at present the
ENTSO-E NE doesn’t have this kind of a LFC-structure. The pilot of FRR-A operating from
2013 have only shown that automatic balancing can reduce minutes outside the standard
frequency range. Introduction of an energy activation market (FRR-A market) will probably
improve the balancing in the system by more capacity. A more sophisticated system using
more LFCs or some other system to control congestions as an enduring solution for

FREQUENCY QUALITY REPORT - NAG
40
Nordic Analysis Group
automatic balancing are planned to be operational in 2017. Using one or more LFC
controllers will give the same result concerning frequency quality.
Load-Frequency Control actions are performed in principle one way, Figure 13, but the
disturbance has two different origins, Figure 12. Both belong to Normal State in the
frequency band 49.5 Hz to 50.5 Hz:
Operation outside normal operating band, outages
Normal operation, normal load or production imbalances
Figure 12 Relations of activated power between Load-Frequency Control elements. The figure indicates, in principle, the relative size of power from spot market to inertia. It should be noted that the activation order for normal operation and operation outside normal operating band is the same, and moves from inertia to FRR-M. I.e. the "time-line" does not continue from FRR-M to spot market, but arrow is continued to show the relative sizes of power.
1,2,…
FREQUENCY QUALITY REPORT - NAG
41
Nordic Analysis Group
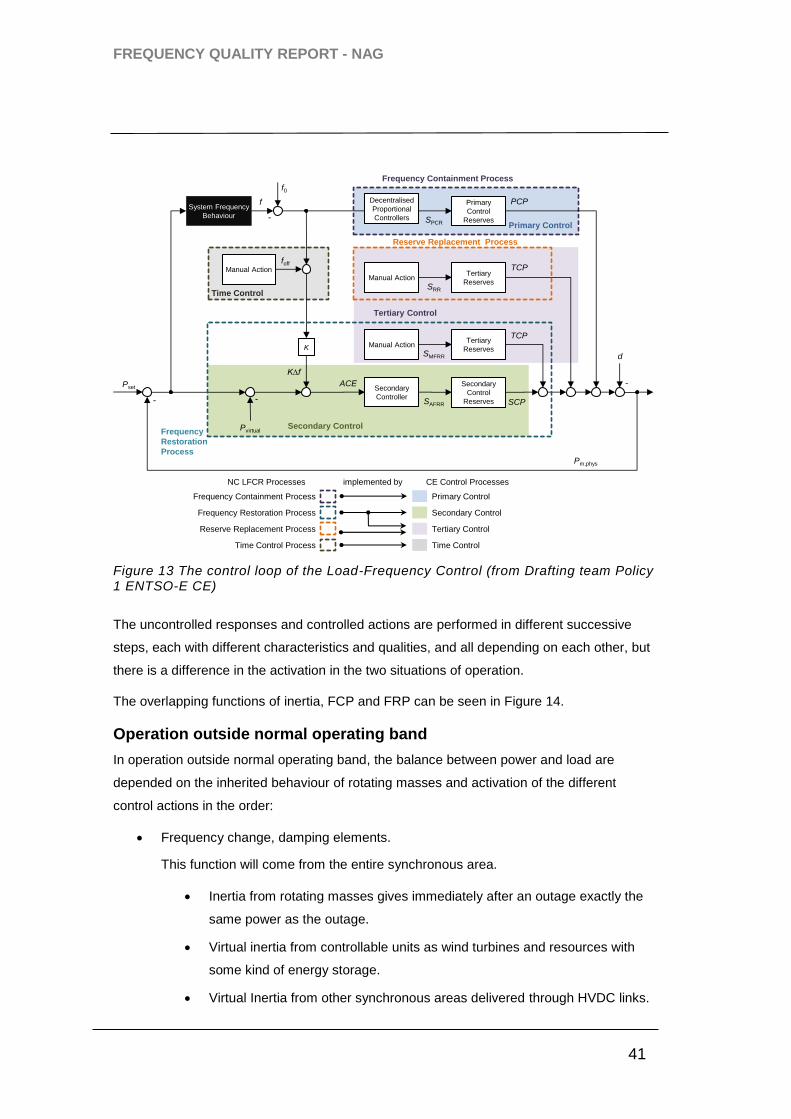
Figure 13 The control loop of the Load-Frequency Control (from Drafting team Policy 1 ENTSO-E CE)
The uncontrolled responses and controlled actions are performed in different successive
steps, each with different characteristics and qualities, and all depending on each other, but
there is a difference in the activation in the two situations of operation.
The overlapping functions of inertia, FCP and FRP can be seen in Figure 14.
Operation outside normal operating band
In operation outside normal operating band, the balance between power and load are
depended on the inherited behaviour of rotating masses and activation of the different
control actions in the order:
Frequency change, damping elements.
This function will come from the entire synchronous area.
Inertia from rotating masses gives immediately after an outage exactly the
same power as the outage.
Virtual inertia from controllable units as wind turbines and resources with
some kind of energy storage.
Virtual Inertia from other synchronous areas delivered through HVDC links.
Secondary
Controller
Secondary
Control
Reserves
Tertiary
Reserves
Tertiary
ReservesManual Action
Manual Action
PsetACE
TCP
SAFRR
SMFRR d
-
K∆f
SRR
SCP
TCP
f0
f
foff
Manual Action
System Frequency
Behaviour
Primary
Control
Reserves
K
Decentralised
Proportional
Controllers SPCR
PCP
Frequency
Restoration
Process
Time Control
Reserve Replacement Process
Primary Control
Secondary Control
Tertiary Control
-
-
Pvirtual
-
Frequency Containment Process
Secondary Control
Tertiary Control
Primary Control
Time Control
Frequency Containment Process
Frequency Restoration Process
Reserve Replacement Process
Time Control Process
Pm,phys
NC LFCR Processes implemented by CE Control Processes

FREQUENCY QUALITY REPORT - NAG
42
Nordic Analysis Group
Frequency containment process, stabilizing elements.
This process will be active in the entire synchronous area.
Elements with a response time much lower than requirement for FCR Full
Activation Time.
Frequency depended load.
Resistant related load as a function of the network voltage.
Speed controlled motors.
Controllable consumption.
Elements with a response time approved to fulfil the requirement for FCR
Full Activation Time.
FCR from (bigger) loads or generators.
Assisting FCR from other synchronous area.
Frequency Restoration, resets the frequency to frequency set point value.
This function is controlled by SN and SvK using NOIS regulating power market.
This function can be done using automatic FRR or manual FRR or a combination of
these two principles for activation.
FRR-A response starts latest 30 second after LFC signal has been sent
from SN. This will solely be activated from the SN FRR-A controller.
FRR-M can be activated depending of the situation and the possibilities the
affected LFC-area has.
In this use, after an outage, the sum of the power of the different element will be the
same as the outage.
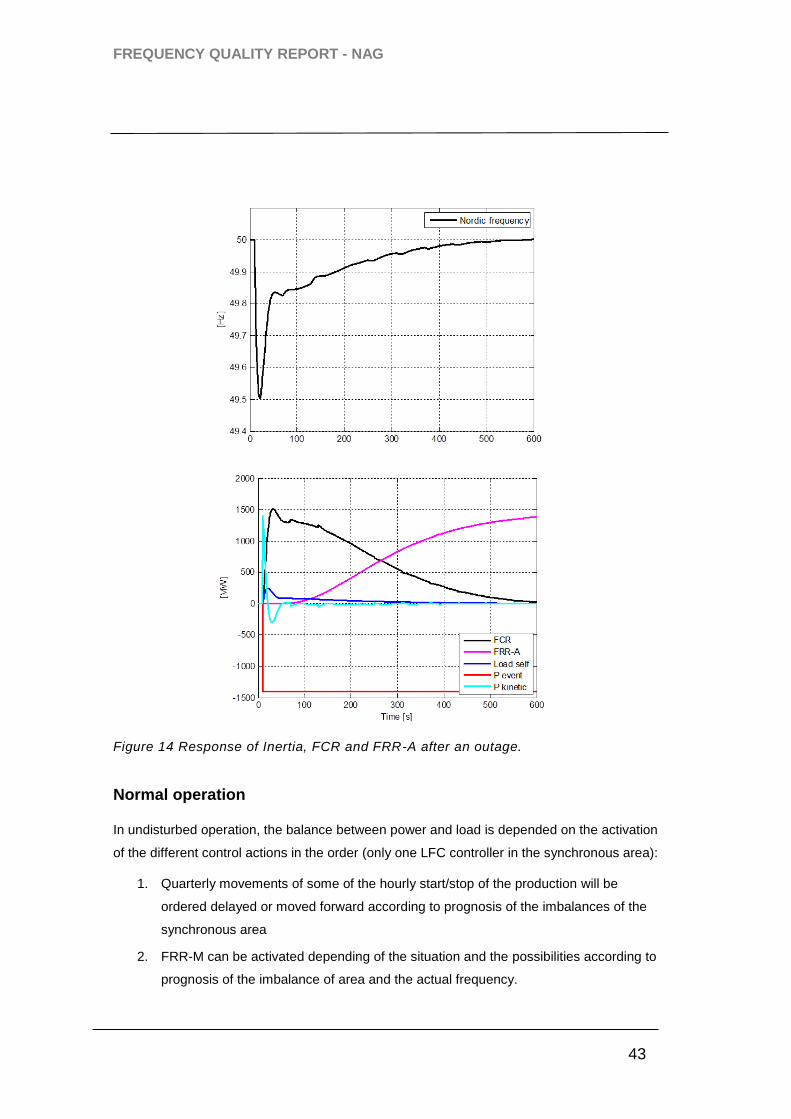
FREQUENCY QUALITY REPORT - NAG
43
Nordic Analysis Group
Figure 14 Response of Inertia, FCR and FRR-A after an outage.
Normal operation In undisturbed operation, the balance between power and load is depended on the activation
of the different control actions in the order (only one LFC controller in the synchronous area):
1. Quarterly movements of some of the hourly start/stop of the production will be
ordered delayed or moved forward according to prognosis of the imbalances of the
synchronous area
2. FRR-M can be activated depending of the situation and the possibilities according to
prognosis of the imbalance of area and the actual frequency.

FREQUENCY QUALITY REPORT - NAG
44
Nordic Analysis Group
3. Inertia and the other damping elements of all areas reduce the rate of change in
frequency and covers for the sum of all imbalances of all areas.
4. FCR in all areas stabilize the frequency and covers a part of the sum of all
imbalances.
5. FRR-A will restore the frequency directly in case of only one LFC and indirectly
through ACE in each LFC-area. Both solutions will achieve 50 Hz. The activated
FRR-A power will cover all imbalances of all areas.
In this use, without an outage, the power of the different element will be much different.
The relations between these elements are different as the dependency of inertia is less than
after an outage. Normal operations within the normal operating band consist of many small
fluctuations in both load and production, but they are stochastic in size and period length.
Figure 15 shows the relations between the elements Inertia, FCR and FRR depending of the
period length (imbalance with oscillating characteristic). The response of frequency
depended load will act together with the FCR, and can be assumed in this case be included
in the FCR-curve.
In Figure 15 the relations of the three power suppliers are from simulations with an imbalance
power between production and consumption with sinus behaviour that is varied. As the overall
power balance is zero the introduced imbalance is covered by the three elements: inertia, FCR
and FRR. In the left side – very fast changes of the introduced imbalance – stop/start of
Figure 15 Relative share of response as a function of imbalance oscillations length.
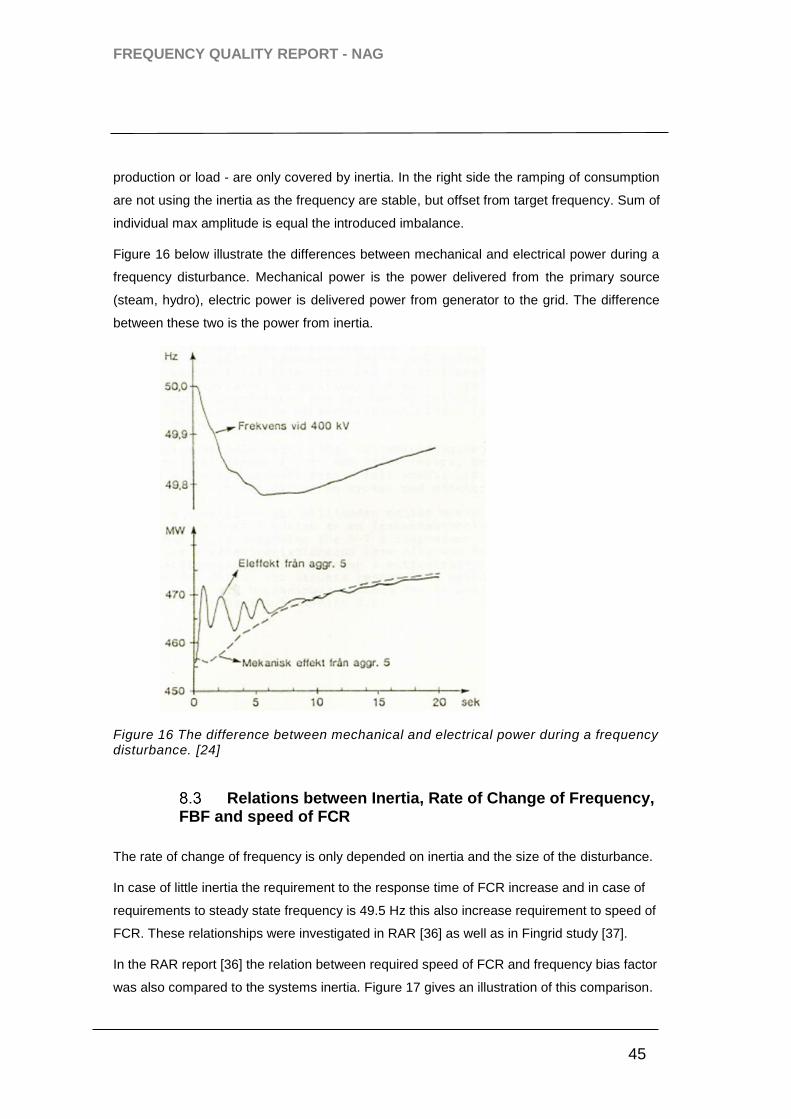
FREQUENCY QUALITY REPORT - NAG
45
Nordic Analysis Group
production or load - are only covered by inertia. In the right side the ramping of consumption
are not using the inertia as the frequency are stable, but offset from target frequency. Sum of
individual max amplitude is equal the introduced imbalance.
Figure 16 below illustrate the differences between mechanical and electrical power during a
frequency disturbance. Mechanical power is the power delivered from the primary source
(steam, hydro), electric power is delivered power from generator to the grid. The difference
between these two is the power from inertia.
Figure 16 The difference between mechanical and electrical power during a frequency disturbance. [24]
Relations between Inertia, Rate of Change of Frequency, FBF and speed of FCR
The rate of change of frequency is only depended on inertia and the size of the disturbance.
In case of little inertia the requirement to the response time of FCR increase and in case of
requirements to steady state frequency is 49.5 Hz this also increase requirement to speed of
FCR. These relationships were investigated in RAR [36] as well as in Fingrid study [37].
In the RAR report [36] the relation between required speed of FCR and frequency bias factor
was also compared to the systems inertia. Figure 17 gives an illustration of this comparison.

FREQUENCY QUALITY REPORT - NAG
46
Nordic Analysis Group
For a low value of inertia (50 GWs)17 and a low value of FBF (3250 MW/Hz), the FCR
response needs to be 10 sec or faster to prevent the frequency from going below 49.2 Hz.
Figure 17 Minimum inertia in the system that is required for keeping the minimum frequency above 49.2 Hz for several values of the Frequency Bias Factor for different system time constants of the FCR-D [36]. See also footnote 17.
60 sec oscillations
As described in Chapter 2 (Introduction), there is an ongoing project called "60s project"
studying the oscillation of the frequency in the NSA18.
The reason for the oscillations is a result of
- Load variations with a wide frequency range (i.e. approximated to white noise)
- A resonance peak within the FCR contributing units close to a period time of 60s.
- For some FCR contributing units a phase shift (frequency to active power) that
excites the oscillations within the studied period time.
Analyses within the project show that increased inertia and frequency dependency for loads
are system parameters that positively contributing to reducing oscillations. The analyses also
17 In [38] the unit MWs/Hz is used. H [MWs] = H [MWs/Hz] x 25.
18 At the moment of writing, the reports from phase 1 and 2 has still not been published.
1000
3000
5000
7000
9000
11000
13000
3250 6500 13000
Min
imu
m r
eq
uir
ed
ine
rtia
fo
r m
inim
um
fre
qu
en
cy
> 4
9.2
Hz
(MW
s/H
z)
Frequency Bias Factor (MW/Hz)
7s
10s
15s
20s
30s
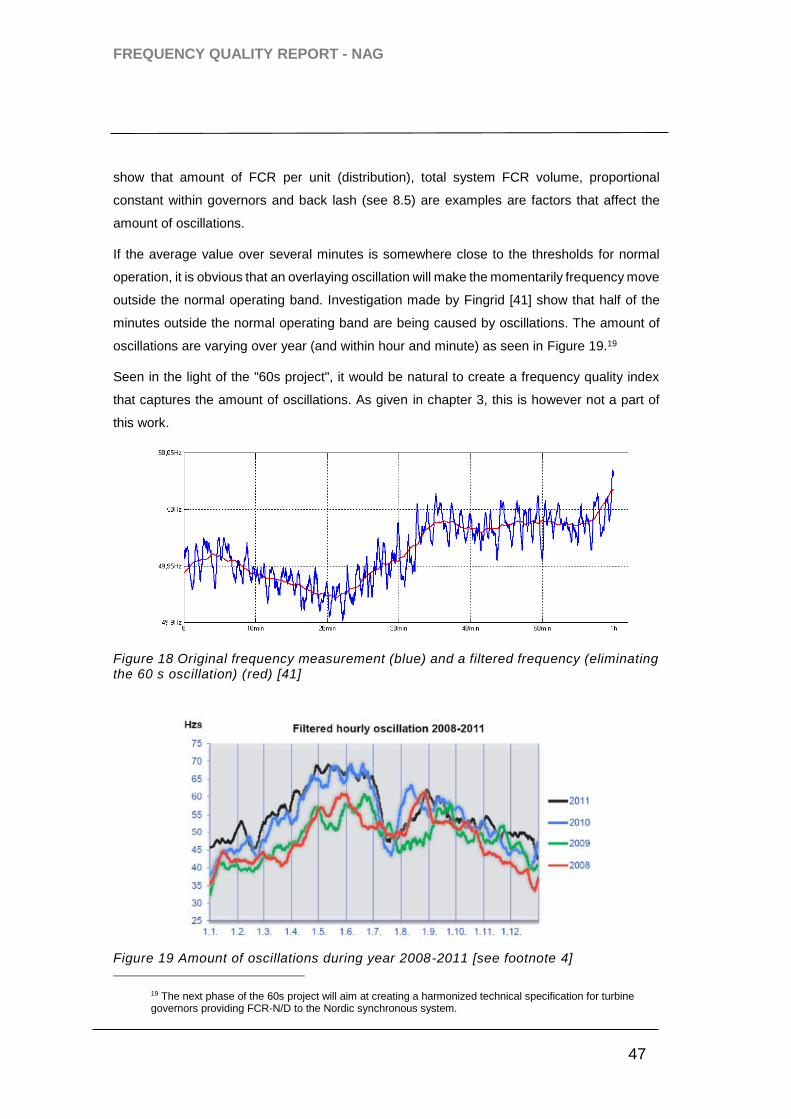
FREQUENCY QUALITY REPORT - NAG
47
Nordic Analysis Group
show that amount of FCR per unit (distribution), total system FCR volume, proportional
constant within governors and back lash (see 8.5) are examples are factors that affect the
amount of oscillations.
If the average value over several minutes is somewhere close to the thresholds for normal
operation, it is obvious that an overlaying oscillation will make the momentarily frequency move
outside the normal operating band. Investigation made by Fingrid [41] show that half of the
minutes outside the normal operating band are being caused by oscillations. The amount of
oscillations are varying over year (and within hour and minute) as seen in Figure 19.19
Seen in the light of the "60s project", it would be natural to create a frequency quality index
that captures the amount of oscillations. As given in chapter 3, this is however not a part of
this work.
Figure 18 Original frequency measurement (blue) and a filtered frequency (eliminating the 60 s oscillation) (red) [41]
Figure 19 Amount of oscillations during year 2008-2011 [see footnote 4]
19 The next phase of the 60s project will aim at creating a harmonized technical specification for turbine governors providing FCR-N/D to the Nordic synchronous system.
FREQUENCY QUALITY REPORT - NAG
48
Nordic Analysis Group
Dead band
In control theory there are more elements where the word dead band is used, but the physical
difference are not the same. The three different meanings are:
Insensibility
This is the insensibility of measurement, i.e. resolutions of measurements
from frequency to position and power measurements.
Intended dead band
This is the band where it is expected no response will take place. E.g. dead
band of +/- 100 mHz from 50 Hz for FCR-D.
Backlash
This is hysteresis coming from mechanical dead band, a set point change
don’t give change in output.
The NC LFC&R [8] distinguishes between inherent Frequency Response Insensitivity and
possible intentional Frequency Response Dead band. The article 44 of NC LFC&R [8] states
the maximum combined effect of inherent Frequency Response Insensitivity and possible
intentional Frequency Response Dead band of the governor of the FCR Providing Units or
FCR Providing Groups is 10 mHz in the Nordic area.
Normal operation
This chapter will describe factors that mostly has an impact on the frequency quality in normal
operation. These ones comes in addition to the aspects in previous chapters.
In general, and as stated earlier in the report, frequency deviating from the nominal comes
from imbalances between production and loads.
Power produced by power plants and the transmissions of HVDC-links change from hour to
hour according to their schedules. This creates momentary imbalances at top of the hour.
These imbalances can be predicted to some extent, but not completely, as power plants do
not follow their schedules exactly.
Loads do not normally follow hourly schedules but are instead varying continuously during
each hour. This creates random imbalances that cannot be predicted even though hourly load
variation pattern can be roughly forecasted and taken into account by purchasing balancing
power proactively. Forecasts always have some error, which results in imbalances as the
generation schedules fail to match the forecasted loads.
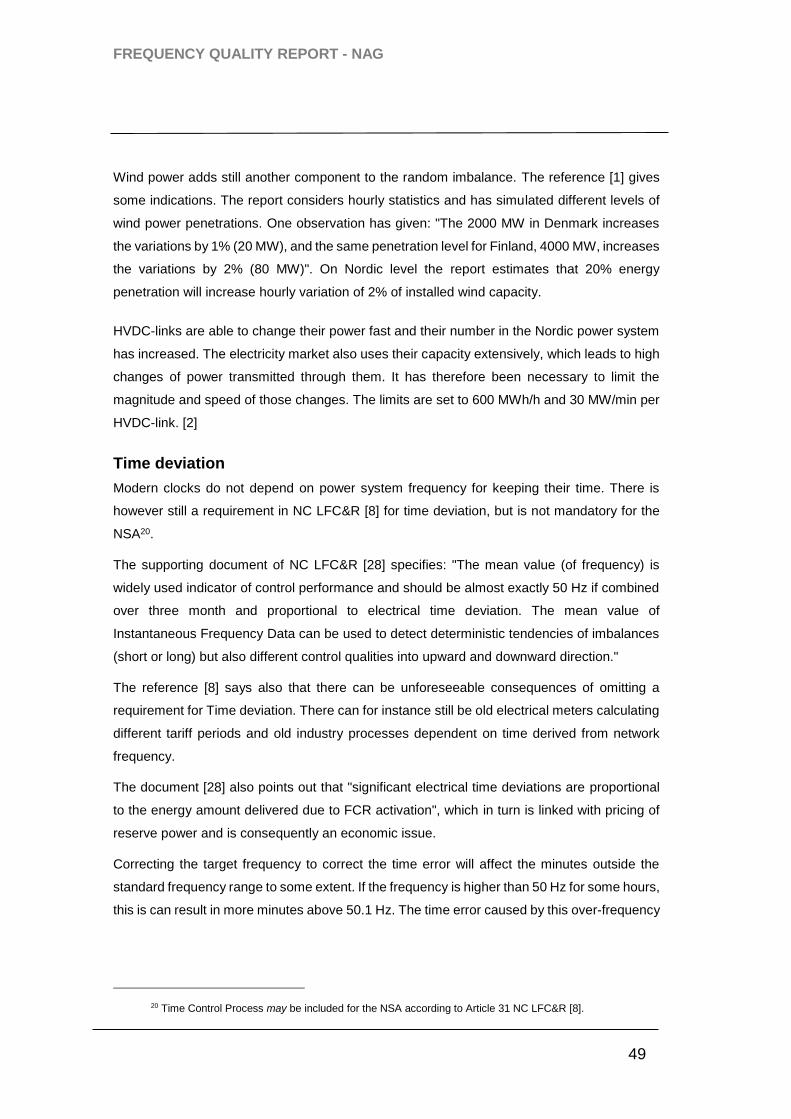
FREQUENCY QUALITY REPORT - NAG
49
Nordic Analysis Group
Wind power adds still another component to the random imbalance. The reference [1] gives
some indications. The report considers hourly statistics and has simulated different levels of
wind power penetrations. One observation has given: "The 2000 MW in Denmark increases
the variations by 1% (20 MW), and the same penetration level for Finland, 4000 MW, increases
the variations by 2% (80 MW)". On Nordic level the report estimates that 20% energy
penetration will increase hourly variation of 2% of installed wind capacity.
HVDC-links are able to change their power fast and their number in the Nordic power system
has increased. The electricity market also uses their capacity extensively, which leads to high
changes of power transmitted through them. It has therefore been necessary to limit the
magnitude and speed of those changes. The limits are set to 600 MWh/h and 30 MW/min per
HVDC-link. [2]
Time deviation
Modern clocks do not depend on power system frequency for keeping their time. There is
however still a requirement in NC LFC&R [8] for time deviation, but is not mandatory for the
NSA20.
The supporting document of NC LFC&R [28] specifies: "The mean value (of frequency) is
widely used indicator of control performance and should be almost exactly 50 Hz if combined
over three month and proportional to electrical time deviation. The mean value of
Instantaneous Frequency Data can be used to detect deterministic tendencies of imbalances
(short or long) but also different control qualities into upward and downward direction."
The reference [8] says also that there can be unforeseeable consequences of omitting a
requirement for Time deviation. There can for instance still be old electrical meters calculating
different tariff periods and old industry processes dependent on time derived from network
frequency.
The document [28] also points out that "significant electrical time deviations are proportional
to the energy amount delivered due to FCR activation", which in turn is linked with pricing of
reserve power and is consequently an economic issue.
Correcting the target frequency to correct the time error will affect the minutes outside the
standard frequency range to some extent. If the frequency is higher than 50 Hz for some hours,
this is can result in more minutes above 50.1 Hz. The time error caused by this over-frequency
20 Time Control Process may be included for the NSA according to Article 31 NC LFC&R [8].
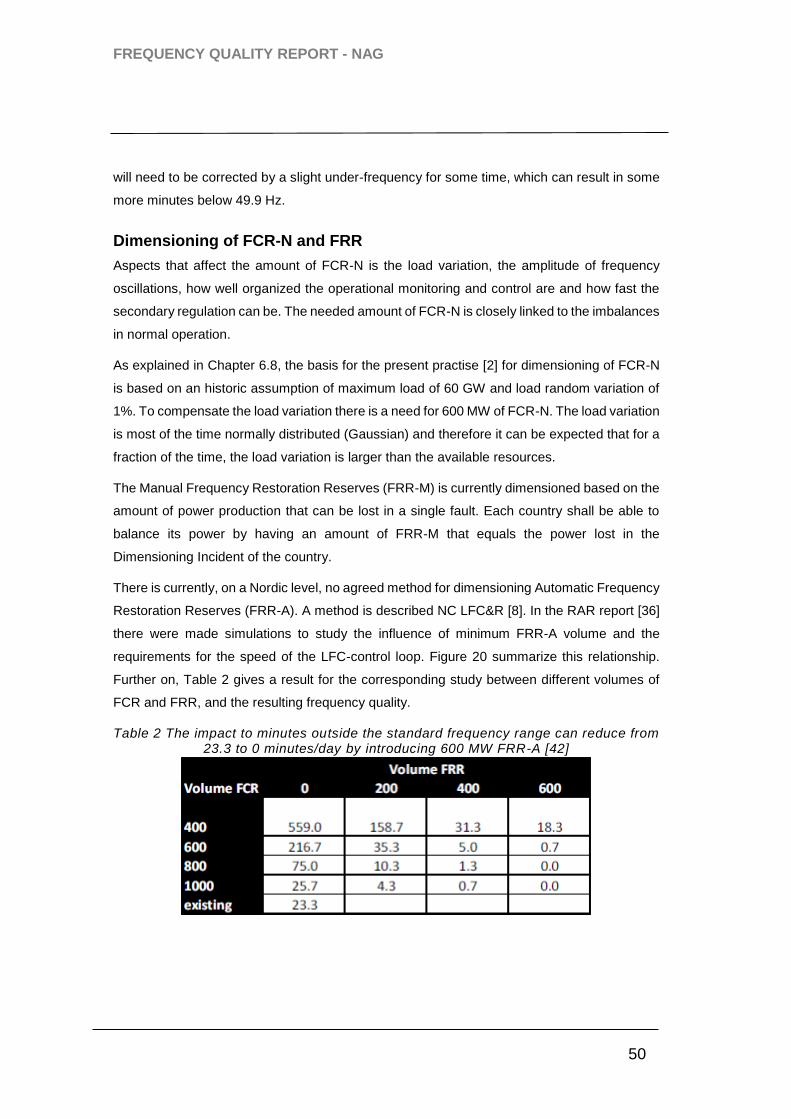
FREQUENCY QUALITY REPORT - NAG
50
Nordic Analysis Group
will need to be corrected by a slight under-frequency for some time, which can result in some
more minutes below 49.9 Hz.
Dimensioning of FCR-N and FRR
Aspects that affect the amount of FCR-N is the load variation, the amplitude of frequency
oscillations, how well organized the operational monitoring and control are and how fast the
secondary regulation can be. The needed amount of FCR-N is closely linked to the imbalances
in normal operation.
As explained in Chapter 6.8, the basis for the present practise [2] for dimensioning of FCR-N
is based on an historic assumption of maximum load of 60 GW and load random variation of
1%. To compensate the load variation there is a need for 600 MW of FCR-N. The load variation
is most of the time normally distributed (Gaussian) and therefore it can be expected that for a
fraction of the time, the load variation is larger than the available resources.
The Manual Frequency Restoration Reserves (FRR-M) is currently dimensioned based on the
amount of power production that can be lost in a single fault. Each country shall be able to
balance its power by having an amount of FRR-M that equals the power lost in the
Dimensioning Incident of the country.
There is currently, on a Nordic level, no agreed method for dimensioning Automatic Frequency
Restoration Reserves (FRR-A). A method is described NC LFC&R [8]. In the RAR report [36]
there were made simulations to study the influence of minimum FRR-A volume and the
requirements for the speed of the LFC-control loop. Figure 20 summarize this relationship.
Further on, Table 2 gives a result for the corresponding study between different volumes of
FCR and FRR, and the resulting frequency quality.
Table 2 The impact to minutes outside the standard frequency range can reduce from 23.3 to 0 minutes/day by introducing 600 MW FRR-A [42]
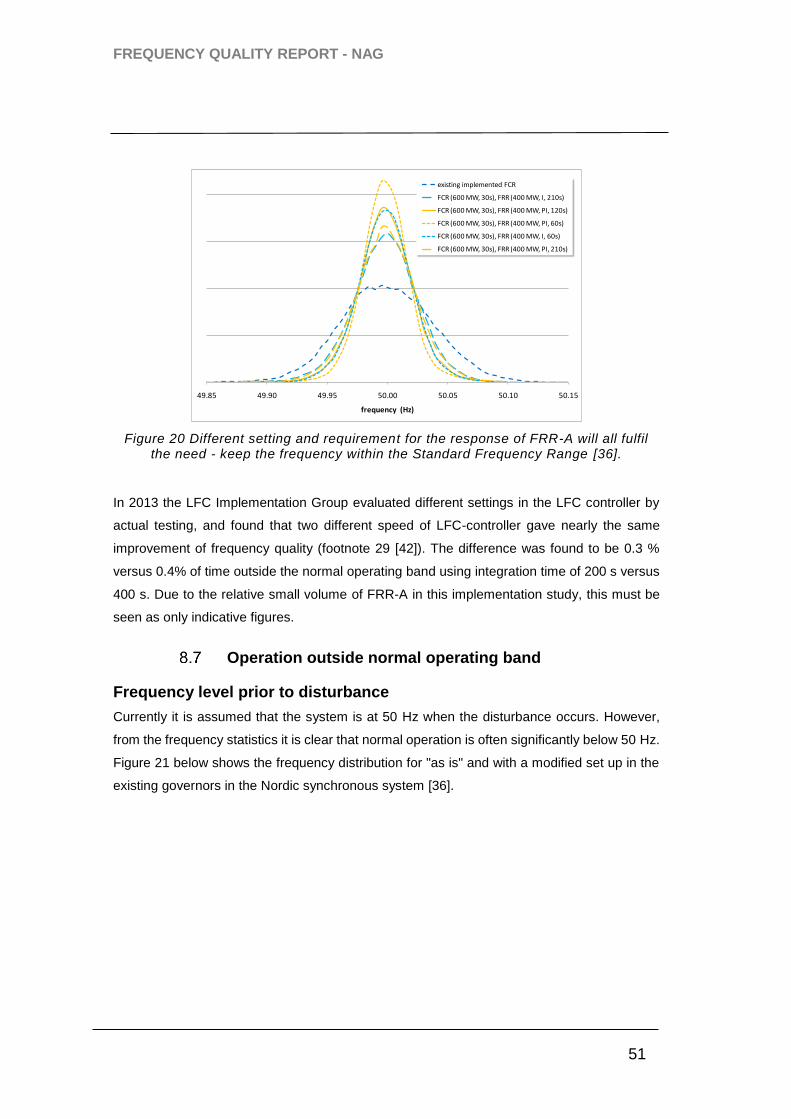
FREQUENCY QUALITY REPORT - NAG
51
Nordic Analysis Group
Figure 20 Different setting and requirement for the response of FRR-A will all fulfil the need - keep the frequency within the Standard Frequency Range [36].
In 2013 the LFC Implementation Group evaluated different settings in the LFC controller by
actual testing, and found that two different speed of LFC-controller gave nearly the same
improvement of frequency quality (footnote 29 [42]). The difference was found to be 0.3 %
versus 0.4% of time outside the normal operating band using integration time of 200 s versus
400 s. Due to the relative small volume of FRR-A in this implementation study, this must be
seen as only indicative figures.
Operation outside normal operating band
Frequency level prior to disturbance
Currently it is assumed that the system is at 50 Hz when the disturbance occurs. However,
from the frequency statistics it is clear that normal operation is often significantly below 50 Hz.
Figure 21 below shows the frequency distribution for "as is" and with a modified set up in the
existing governors in the Nordic synchronous system [36].
49.85 49.90 49.95 50.00 50.05 50.10 50.15
frequency (Hz)
existing implemented FCR
FCR (600 MW, 30s), FRR (400 MW, I, 210s)
FCR (600 MW, 30s), FRR (400 MW, PI, 120s)
FCR (600 MW, 30s), FRR (400 MW, PI, 60s)
FCR (600 MW, 30s), FRR (400 MW, I, 60s)
FCR (600 MW, 30s), FRR (400 MW, PI, 210s)
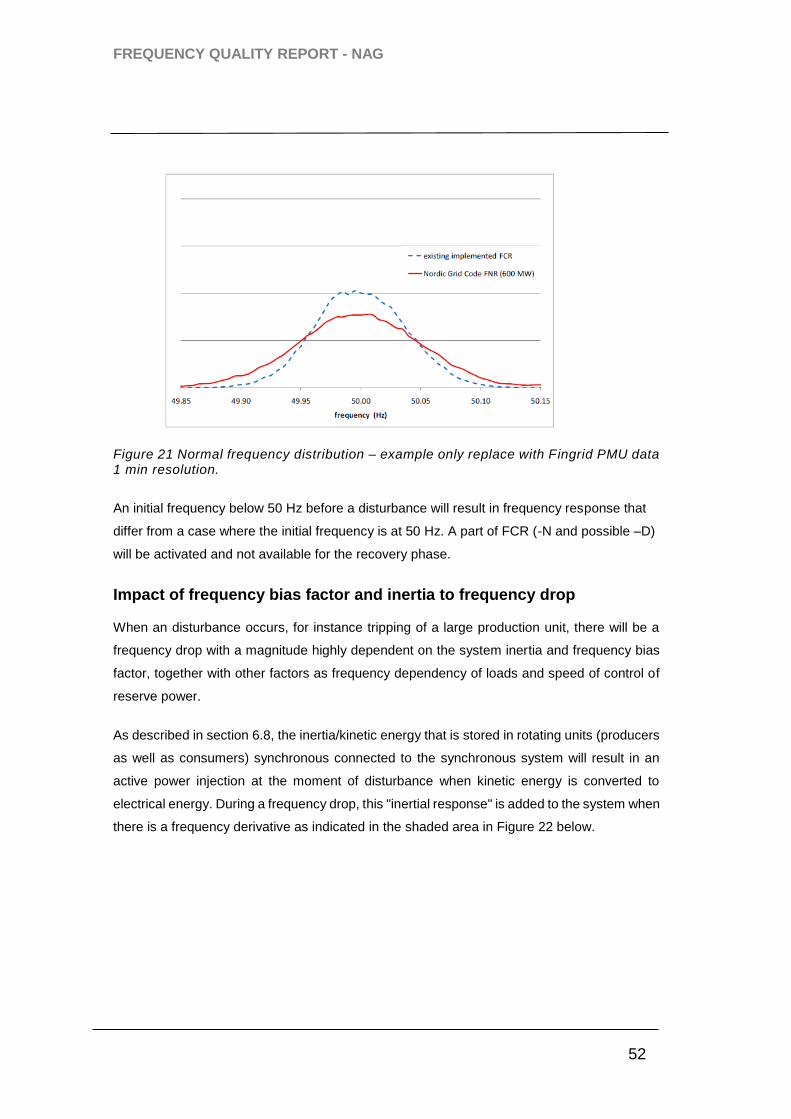
FREQUENCY QUALITY REPORT - NAG
52
Nordic Analysis Group
Figure 21 Normal frequency distribution – example only replace with Fingrid PMU data 1 min resolution.
An initial frequency below 50 Hz before a disturbance will result in frequency response that
differ from a case where the initial frequency is at 50 Hz. A part of FCR (-N and possible –D)
will be activated and not available for the recovery phase.
Impact of frequency bias factor and inertia to frequency drop
When an disturbance occurs, for instance tripping of a large production unit, there will be a
frequency drop with a magnitude highly dependent on the system inertia and frequency bias
factor, together with other factors as frequency dependency of loads and speed of control of
reserve power.
As described in section 6.8, the inertia/kinetic energy that is stored in rotating units (producers
as well as consumers) synchronous connected to the synchronous system will result in an
active power injection at the moment of disturbance when kinetic energy is converted to
electrical energy. During a frequency drop, this "inertial response" is added to the system when
there is a frequency derivative as indicated in the shaded area in Figure 22 below.
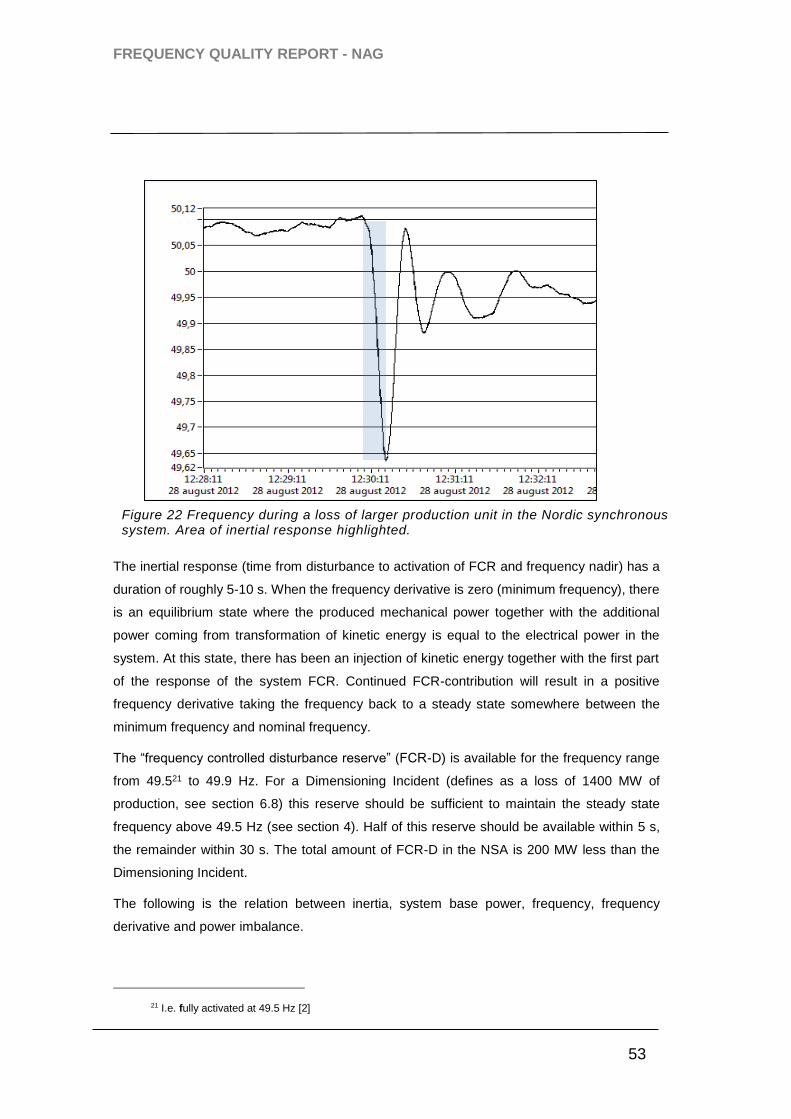
FREQUENCY QUALITY REPORT - NAG
53
Nordic Analysis Group
The inertial response (time from disturbance to activation of FCR and frequency nadir) has a
duration of roughly 5-10 s. When the frequency derivative is zero (minimum frequency), there
is an equilibrium state where the produced mechanical power together with the additional
power coming from transformation of kinetic energy is equal to the electrical power in the
system. At this state, there has been an injection of kinetic energy together with the first part
of the response of the system FCR. Continued FCR-contribution will result in a positive
frequency derivative taking the frequency back to a steady state somewhere between the
minimum frequency and nominal frequency.
The “frequency controlled disturbance reserve” (FCR-D) is available for the frequency range
from 49.521 to 49.9 Hz. For a Dimensioning Incident (defines as a loss of 1400 MW of
production, see section 6.8) this reserve should be sufficient to maintain the steady state
frequency above 49.5 Hz (see section 4). Half of this reserve should be available within 5 s,
the remainder within 30 s. The total amount of FCR-D in the NSA is 200 MW less than the
Dimensioning Incident.
The following is the relation between inertia, system base power, frequency, frequency
derivative and power imbalance.
21 I.e. fully activated at 49.5 Hz [2]
Figure 22 Frequency during a loss of larger production unit in the Nordic synchronous system. Area of inertial response highlighted.
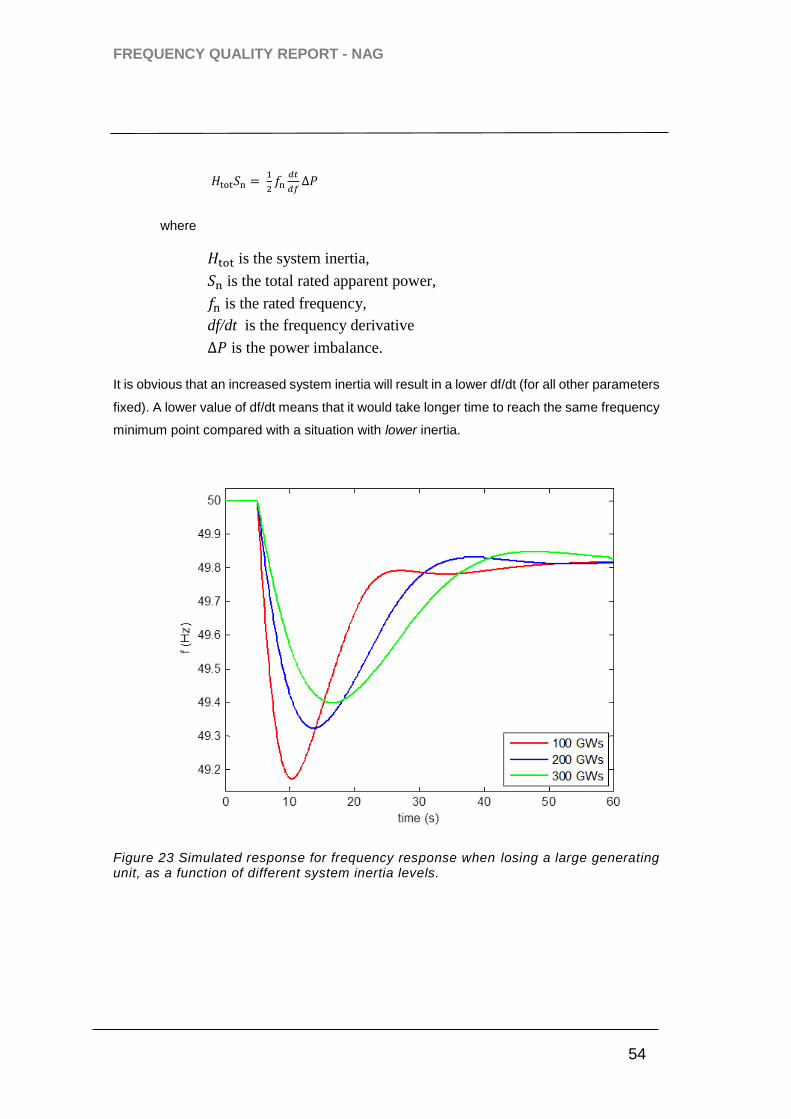
FREQUENCY QUALITY REPORT - NAG
54
Nordic Analysis Group
𝐻tot𝑆n = 1
2𝑓n
𝑑𝑡
𝑑𝑓∆𝑃
where
𝐻tot is the system inertia,
𝑆n is the total rated apparent power,
𝑓n is the rated frequency,
df/dt is the frequency derivative
∆𝑃 is the power imbalance.
It is obvious that an increased system inertia will result in a lower df/dt (for all other parameters
fixed). A lower value of df/dt means that it would take longer time to reach the same frequency
minimum point compared with a situation with lower inertia.
Figure 23 Simulated response for frequency response when losing a large generating unit, as a function of different system inertia levels.

FREQUENCY QUALITY REPORT - NAG
55
Nordic Analysis Group
The total frequency bias factor (FBF22) [MW/Hz] in the system has an impact on the frequency
drop. As explained above, at the equilibrium state when frequency derivative is equal to zero,
there is the first initial part of the FCR being added to the system balance.
However, speed of response of the FCR will have a big impact on the contribution to limit the
frequency dip as can be seen in Figure 24 and Figure 25.
An increased FBF decrease time to minimum frequency level and also the actual value of
minimum frequency level.
Figure 24 Relations between speed of FCR and frequency network characteristic for steady state frequency of 49.5 Hz (frequency deviation after outage is 400 mHz). Loss of production is 1300 MW, FBF 3250 MW/Hz, Inertia 250 GWs [36].
22 The frequency bias factor is the derivative of the FCR-N + FCR-D response (inclusive load frequency dependent load, HVDC contribution etc.).

FREQUENCY QUALITY REPORT - NAG
56
Nordic Analysis Group
Figure 25 Relations between speed of FCR and frequency network characteristic for steady state frequency deviation of 49.7 Hz (frequency deviation after outage is 200 mHz). Loss of production is 1300 MW, FBF 6500 MW/Hz, Inertia 250 GWs [38].
In RAR-report [47] it is specified that the actual FBF is higher than the required amount in
specified in the grid code. The current Nordic grid code requires that 600 MW of FCR-N is
activated at a frequency deviation of 0.1 Hz, equal to 6000 MW/Hz in the band 49.9 to 50.1
Hz, and 1200 MW/(49.9-49.5 Hz) equal to 3000 MW/Hz for frequency between 49.5 - 49.9
Hz.
If reducing the volume of FCR-D to the level required in the grid code (1200 MW), a steady
state frequency will be kept above 49.5 Hz for the Dimensioning Incident. It does however not
guarantee that the instantaneous minimum frequency exceeds a certain value. The minimum
instantaneous frequency depends also on the speed at which FCR is activated, as illustrated
in Figure 24 and Figure 25. As seen, if reducing the amount of FBF from the present "normal
value", to the level given by the requirement in the grid code, the speed of response needs to
be improved if the minimum instantaneous frequency shall be kept at the same level.

FREQUENCY QUALITY REPORT - NAG
57
Nordic Analysis Group
From equation for FBF above, it is obvious that there are parameters vitiated with
uncertainties. These are:
- ∆P
The actual imbalance depends on the total load reduction during the frequency
disturbance. Frequency dependency for loads are further described in section 0.
- H
This factor can be estimated in real time. However, this is a best guess and not a
measured and validated number. System inertia constant can be measured (or
calculated from measured frequency response) after a disturbance.
Also the FBF is vitiated with uncertainties.
- The speed of response for FCR-N/D is somewhat spread [54] and in certain cases
there are indications that units are slower compared with present grid codes.
- On the other hand is volumes of FCR-N/D often larger [36] then stipulated, which
to some extent mitigate the weaker speed of response (as can be seen in Figure
24 and Figure 25).
Impact of self regulation of load
Different load types in the system behaves differently regarding power consumption during a
situation where voltage and/or frequency deviates from their nominal values. This is called
"self regulating" of load.
It is foremost direct driven asynchronous motors that have a large frequency dependency.
Dependent on the primary load, the dependency is different (constant, linearly, quadratic,
cubic etc.). See [31] for further details regarding loads and their behaviour.
It has been estimated that the frequency dependence of loads is 1 % for a frequency variation
of 1 Hz in the NSA. The last study from 1995 [5] gives a figure 0.7 % / Hz for a low load
situation.
Based on the ratio factor given above, currently 200 MW of load in the Nordic synchronous
system is assumed to be self – regulating regarding frequency for the Dimensioning Incident
[2] and thereby for the dimensioning of FCR-D. Per today, this means that the Dimensioning
Incident is defined as the loss of largest single unit reduced with a power amount equal to 200
MW.
In NC LFC&R the following is specified:
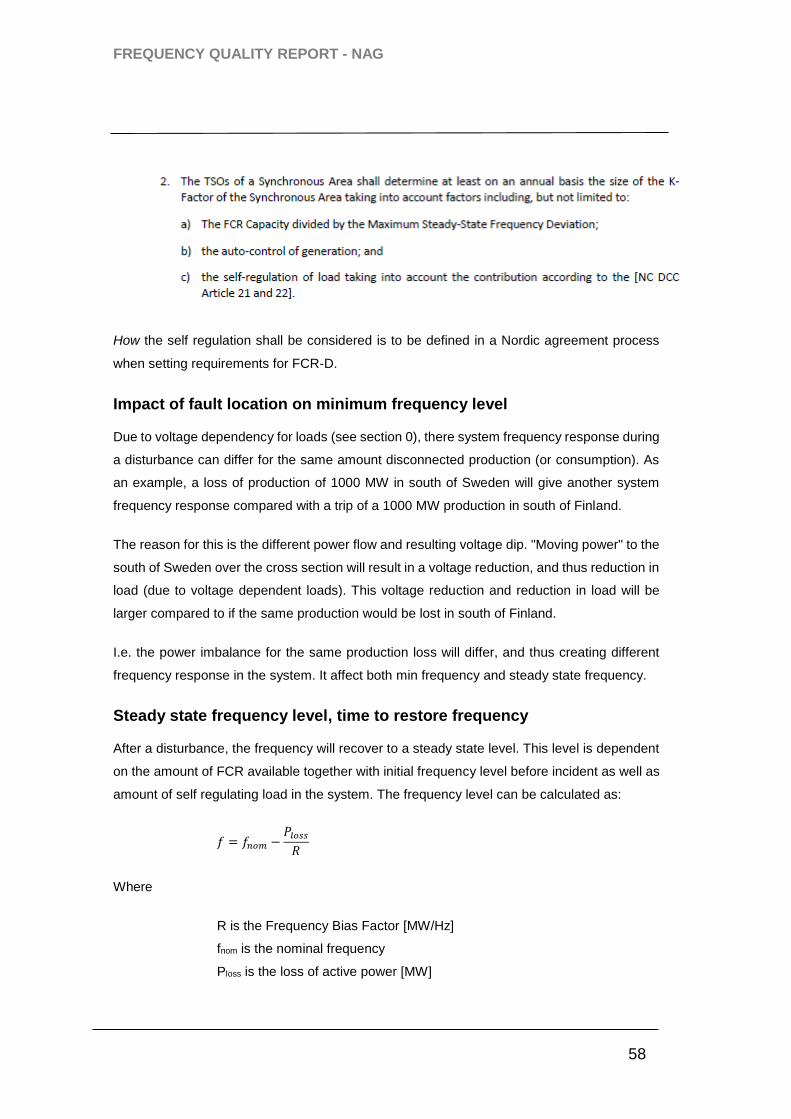
FREQUENCY QUALITY REPORT - NAG
58
Nordic Analysis Group
How the self regulation shall be considered is to be defined in a Nordic agreement process
when setting requirements for FCR-D.
Impact of fault location on minimum frequency level
Due to voltage dependency for loads (see section 0), there system frequency response during
a disturbance can differ for the same amount disconnected production (or consumption). As
an example, a loss of production of 1000 MW in south of Sweden will give another system
frequency response compared with a trip of a 1000 MW production in south of Finland.
The reason for this is the different power flow and resulting voltage dip. "Moving power" to the
south of Sweden over the cross section will result in a voltage reduction, and thus reduction in
load (due to voltage dependent loads). This voltage reduction and reduction in load will be
larger compared to if the same production would be lost in south of Finland.
I.e. the power imbalance for the same production loss will differ, and thus creating different
frequency response in the system. It affect both min frequency and steady state frequency.
Steady state frequency level, time to restore frequency
After a disturbance, the frequency will recover to a steady state level. This level is dependent
on the amount of FCR available together with initial frequency level before incident as well as
amount of self regulating load in the system. The frequency level can be calculated as:
𝑓 = 𝑓𝑛𝑜𝑚 −𝑃𝑙𝑜𝑠𝑠
𝑅
Where
R is the Frequency Bias Factor [MW/Hz]
fnom is the nominal frequency
Ploss is the loss of active power [MW]
FREQUENCY QUALITY REPORT - NAG
59
Nordic Analysis Group
As stated in Article 19, NC LFC&R [8] specifies the Maximum Steady State Frequency
Deviation to 500 mHz. This is in line with the present limits and requirements for FCR-D, which
shall be fully activated at 49.5 Hz.
The current SOA states that after an N-1-fault the system shall be brought to a state where it
can withstand any N-1-fault within 15 minutes. Based on this the time to restore the frequency
to normal operating band after any Dimensioning Incident is currently 15 minutes.
FREQUENCY QUALITY REPORT - NAG
60
Nordic Analysis Group
9. Analysis results- frequency quality levels
In the following chapter the two different aspects are being analysed:
- The impact on probability to fall below a frequency level of 49.0 Hz as a result of
different number of minutes outside normal operating band.
- The impact on minimum frequency level as a result of different FBF and inertia in
the system.
These analyses will reveal the impact of different quality levels when it comes to minutes
outside normal operating band as well as the impact of different system parameter on the
minimum instantaneous frequency level during a Dimensioning Incident.
Analysis of different levels of minutes outside normal operating band
RGN has 19.11.2013 agreed on target (maximum) number of 10 000 minutes outside the
normal operating band for year 2014. This target is not a fixed one but will be reviewed yearly.
If frequency is outside the boundaries 50 ± 0.1 Hz in normal operation for some percent of
time does not significantly increase the risk of frequency going under 49 Hz as the following
analysis shows.
According to the current Nordic System Operation Agreement there shall be in total 1200 MW
frequency controlled disturbance reserves (FCR-D). The frequency controlled disturbance
reserve shall be activated at 49.9 Hz and shall be fully activated at 49.5 Hz. It shall increase
virtually linearly within a frequency range of 49.9-49.5 Hz.
The activated amount P of FCR-D can be calculated based on the equation (1), when the initial
frequency finit is in the range 49.5...49.9 Hz:
P = (49.9 Hz - finit) * 1200 MW / 0.4 Hz (1)

FREQUENCY QUALITY REPORT - NAG
61
Nordic Analysis Group
Table 3 Activated FCR-D when the initial frequency is below 49.9 Hz.
As stated in Chapter 6.8, the Dimensioning Incident in the Nordic power system is the trip of
the nuclear power plant Oskarshamn 3 at the power of 1400 MW. The next most critical
incident can lead to the loss of 1200 MW of production in Norway. There are thus two possible
incidents that can cause power deficits higher than 1200 MW. The rest of the individual n-1 -
incidents are considerably less severe. They include trips of other large nuclear units. There
are in total five possible incidents that can cause power deficits higher than 1000 MW.
Severe frequency disturbances have in practice occurred seldom as the Table 4 shows. The
Dimensioning Incident obviously occurs more rarely but the same figures can be
conservatively used to estimate the occurrence of disturbances severe enough to be able to
cause frequency dips lower than 49 Hz.
Table 4 Frequency disturbance statistics of the time period 30.10.2003 - 10.3.2014
Let us assume that the frequency controlled disturbance reserves would be dimensioned to
ensure that the minimum instantaneous frequency always stays above 49 Hz after the
Dimensioning Incident, occurring when the frequency is 49.9 Hz. It would follow that an initial
frequency lower than 49.9 Hz could lead to a minimum instantaneous frequency below 49 Hz
because not all FCR-D would be available when the Dimensioning Incident occurs. Based on
this reasoning, the Table 5 presents estimated mean times between incidents with frequencies
under 49 Hz with different numbers of minutes outside the normal frequency range.
Number of minutes per year
outside the range 49.9...50.1 Hz
10000 15000 20000
Frequency
limit (Hz)
Acivated FCR-D
(minimum) Minutes when activated
49.88 50 1635 2792 4078
49.87 100 465 921 1493
49.85 150 114 268 489
49.83 200 24 69 143
49.82 250 5 15 38
49.80 300 1 3 9
49.78 350 0.1 0.5 2
49.77 400 0.01 0.1 0.3
f <
Incidents
/year
49.5 Hz 0.8
49.4 Hz 0.2
49.3 Hz 0.1
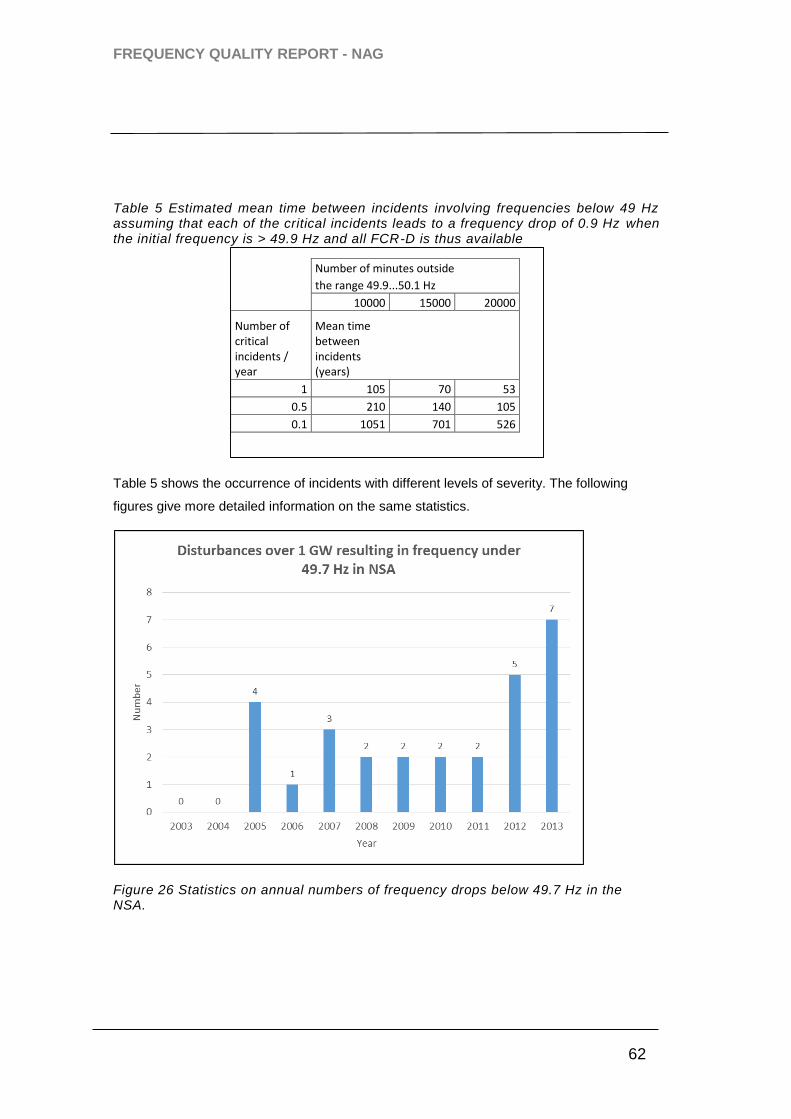
FREQUENCY QUALITY REPORT - NAG
62
Nordic Analysis Group
Table 5 Estimated mean time between incidents involving frequencies below 49 Hz assuming that each of the critical incidents leads to a frequency drop of 0.9 Hz when the initial frequency is > 49.9 Hz and all FCR-D is thus available
Table 5 shows the occurrence of incidents with different levels of severity. The following
figures give more detailed information on the same statistics.
Figure 26 Statistics on annual numbers of frequency drops below 49.7 Hz in the NSA.
Number of minutes outside
the range 49.9...50.1 Hz
10000 15000 20000
Number of critical incidents / year
Mean time between incidents (years)
1 105 70 53
0.5 210 140 105
0.1 1051 701 526

FREQUENCY QUALITY REPORT - NAG
63
Nordic Analysis Group
Figure 27 Monthly distribution of frequency drops deeper than 49.7 Hz in years 2003-2013.
Analysis of minimum frequency level for different FBF and inertia
The maximum frequency drop depends on many factors: tripping production, inertia,
frequency dependency of loads and speed of control of reserve power. Some aspects have
has been emphasized in reference [10]. It gives brief statistics about large frequency drops
during the years 1999 -2013. There are 12 incidents when frequency has dropped below
49.5 Hz and three incidents when frequency has been under 49.3 Hz.
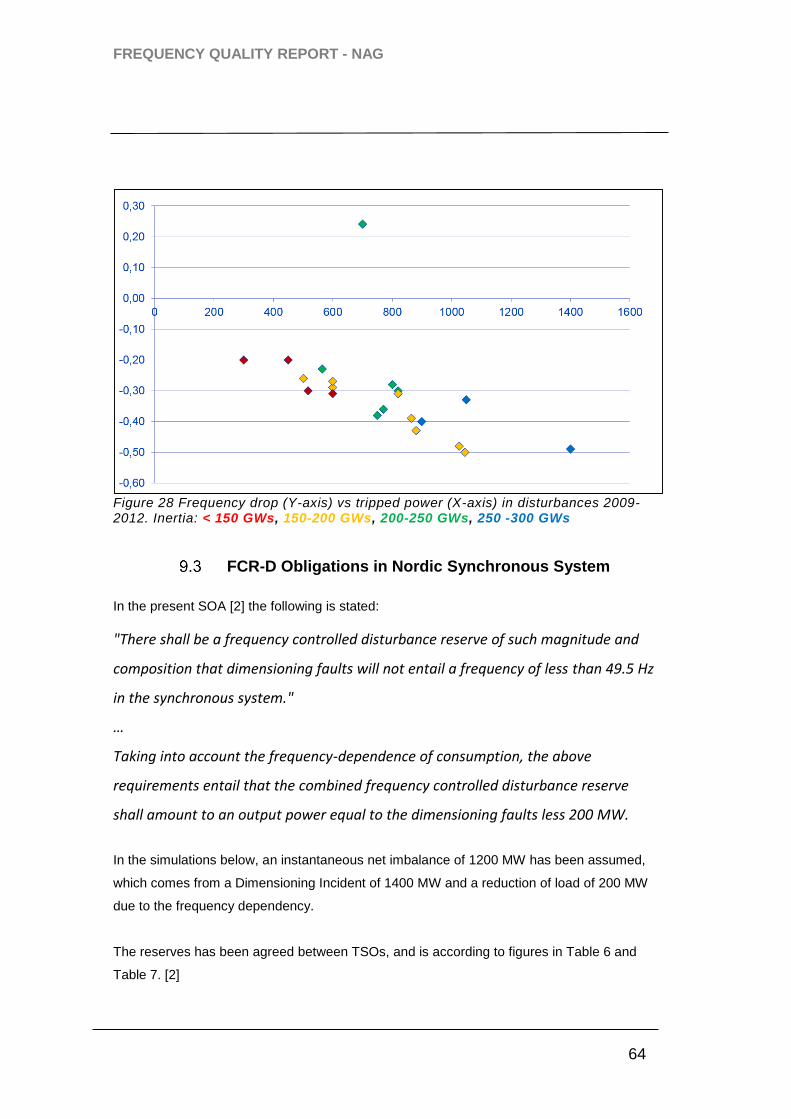
FREQUENCY QUALITY REPORT - NAG
64
Nordic Analysis Group
Figure 28 Frequency drop (Y-axis) vs tripped power (X-axis) in disturbances 2009-2012. Inertia: < 150 GWs, 150-200 GWs, 200-250 GWs, 250 -300 GWs
FCR-D Obligations in Nordic Synchronous System
In the present SOA [2] the following is stated:
"There shall be a frequency controlled disturbance reserve of such magnitude and
composition that dimensioning faults will not entail a frequency of less than 49.5 Hz
in the synchronous system."
…
Taking into account the frequency-dependence of consumption, the above
requirements entail that the combined frequency controlled disturbance reserve
shall amount to an output power equal to the dimensioning faults less 200 MW.
In the simulations below, an instantaneous net imbalance of 1200 MW has been assumed,
which comes from a Dimensioning Incident of 1400 MW and a reduction of load of 200 MW
due to the frequency dependency.
The reserves has been agreed between TSOs, and is according to figures in Table 6 and
Table 7. [2]
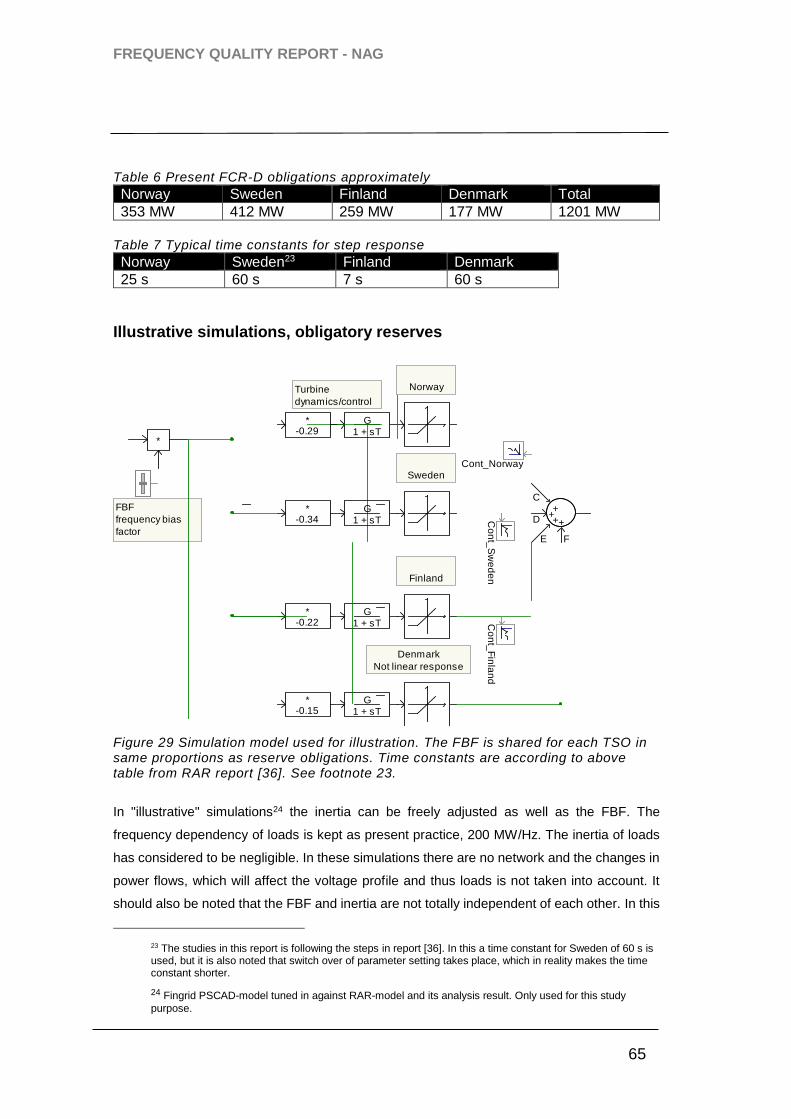
FREQUENCY QUALITY REPORT - NAG
65
Nordic Analysis Group
Table 6 Present FCR-D obligations approximately
Norway Sweden Finland Denmark Total
353 MW 412 MW 259 MW 177 MW 1201 MW
Table 7 Typical time constants for step response
Norway Sweden23 Finland Denmark
25 s 60 s 7 s 60 s
Illustrative simulations, obligatory reserves
Figure 29 Simulation model used for illustration. The FBF is shared for each TSO in same proportions as reserve obligations. Time constants are according to above table from RAR report [36]. See footnote 23.
In "illustrative" simulations24 the inertia can be freely adjusted as well as the FBF. The
frequency dependency of loads is kept as present practice, 200 MW/Hz. The inertia of loads
has considered to be negligible. In these simulations there are no network and the changes in
power flows, which will affect the voltage profile and thus loads is not taken into account. It
should also be noted that the FBF and inertia are not totally independent of each other. In this
23 The studies in this report is following the steps in report [36]. In this a time constant for Sweden of 60 s is used, but it is also noted that switch over of parameter setting takes place, which in reality makes the time constant shorter.
24 Fingrid PSCAD-model tuned in against RAR-model and its analysis result. Only used for this study
purpose.
Turbine
dynamics/control
*
FBF
frequency bias
factor
G1 + sT
*-0.29
C+
D+
E
+
F
+
G1 + sT
*-0.34
G1 + sT
*-0.22
Norway
Sweden
Finland
Co
nt_
Fin
lan
d
Cont_Norway
Co
nt_
Sw
ed
en
G1 + sT
*-0.15
Denmark
Not linear response
as others

FREQUENCY QUALITY REPORT - NAG
66
Nordic Analysis Group
study, the FBF is kept constant independently of total volume of FCR-D. I.e. the changed
volume FCR-D will have an impact on the minimum instantaneous frequency level as well as
the recovery phase to quasi stationary frequency level (i.e. quasi stationary frequency drop
will be the same in the two different scenarios).
The hard limiters limits the control power to obliged power of each TSO.
Figure 30 Responses in case of 1200 MW loss of production. From top: Frequency deviation/ Reserve power responses of each TSO / Power trip and total control power response. Inertia 10000MWs/Hz, FBF = 5230 MW/Hz, Control with present time constants according RAR report. See footnote 23.
Illustrative simulations, typical reserves
A similar case as in previous section, but with typical reserves in the NSA according to Table
8 is presented below.
Table 8 The amount of FCR-D provided today (typical figures)
Norway Sweden Finland Denmark Total
1400 MW 792 MW 259 MW 177 MW 2628 MW
Main : Graphs
0 25 50 75 100 125 150 175 200 ...
...
...
-1.00
-0.80
-0.60
-0.40
-0.20
0.00
0.20
0.40
y (H
z)
df
0
50
100
150
200
250
300
350
400
450
y (M
W)
Cont_Norw ay Cont_Sw eden Cont_Finland Cont_Denmark
-0.2k
0.0
0.2k
0.4k
0.6k
0.8k
1.0k
1.2k
1.4k
1.6k
y (M
W)
dP_load_dist Control_P
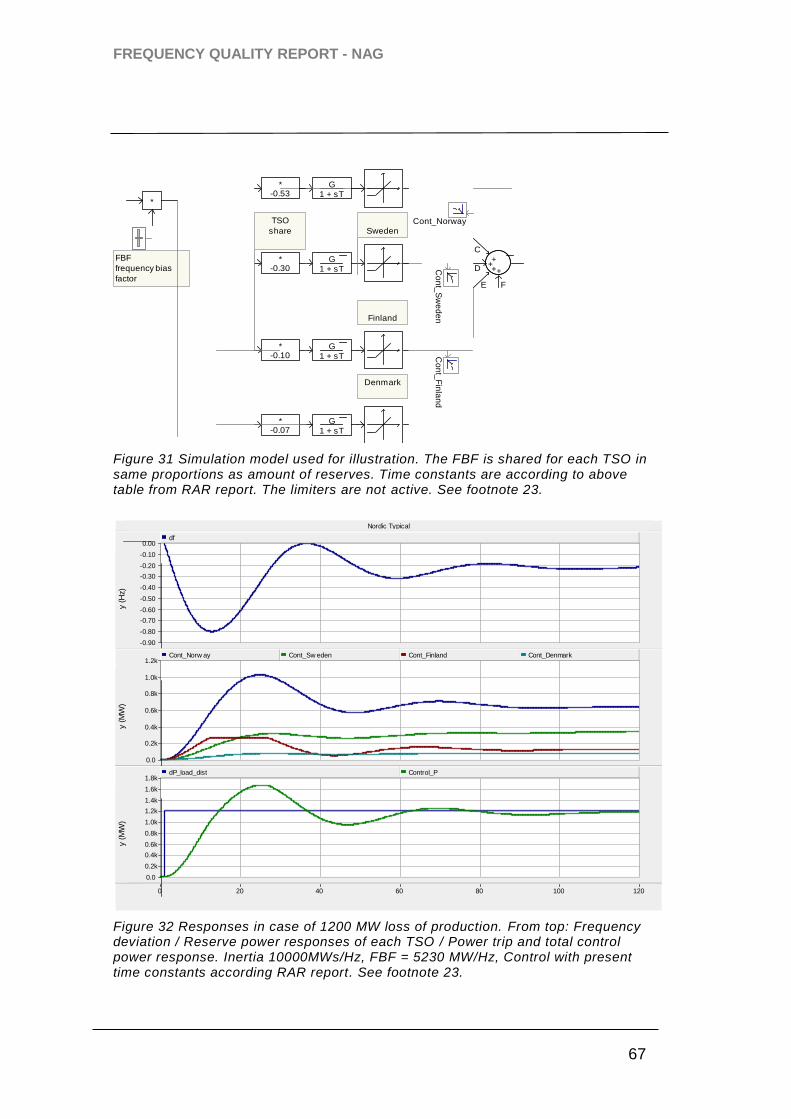
FREQUENCY QUALITY REPORT - NAG
67
Nordic Analysis Group
Figure 31 Simulation model used for illustration. The FBF is shared for each TSO in same proportions as amount of reserves. Time constants are according to above table from RAR report. The limiters are not active. See footnote 23.
Figure 32 Responses in case of 1200 MW loss of production. From top: Frequency deviation / Reserve power responses of each TSO / Power trip and total control power response. Inertia 10000MWs/Hz, FBF = 5230 MW/Hz, Control with present time constants according RAR report. See footnote 23.
*
FBF
frequency bias
factor
G1 + sT
*-0.53
G1 + sT
*-0.30
G1 + sT
*-0.10
Sweden
Finland
Co
nt_
Fin
lan
d
Cont_Norway
Co
nt_
Sw
ed
en
G1 + sT
*-0.07
Denmark
TSO
share
C+
D+
E
+
F
+
Nordic Typical
0 20 40 60 80 100 120 ...
...
...
-0.90
-0.80
-0.70
-0.60
-0.50
-0.40
-0.30
-0.20
-0.10
0.00
y (H
z)
df
0.0
0.2k
0.4k
0.6k
0.8k
1.0k
1.2k
y (M
W)
Cont_Norw ay Cont_Sw eden Cont_Finland Cont_Denmark
0.0
0.2k
0.4k
0.6k
0.8k
1.0k
1.2k
1.4k
1.6k
1.8k
y (M
W)
dP_load_dist Control_P
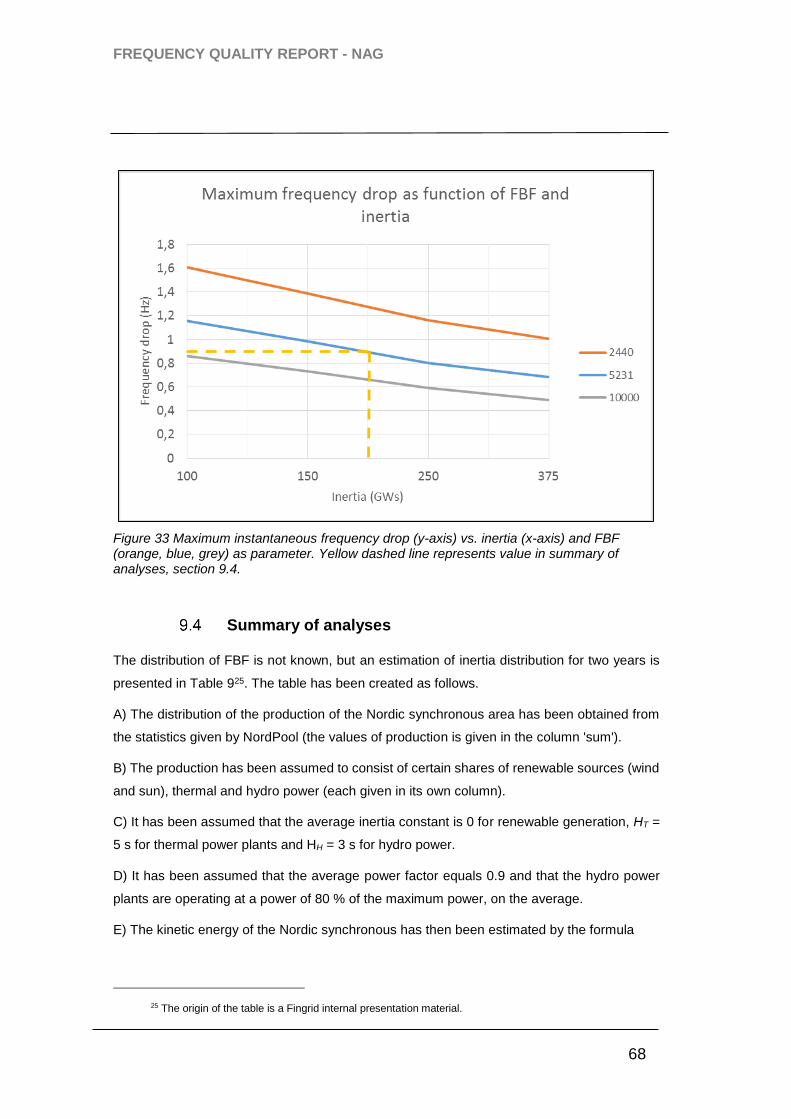
FREQUENCY QUALITY REPORT - NAG
68
Nordic Analysis Group
Figure 33 Maximum instantaneous frequency drop (y-axis) vs. inertia (x-axis) and FBF (orange, blue, grey) as parameter. Yellow dashed line represents value in summary of analyses, section 9.4.
Summary of analyses
The distribution of FBF is not known, but an estimation of inertia distribution for two years is
presented in Table 925. The table has been created as follows.
A) The distribution of the production of the Nordic synchronous area has been obtained from
the statistics given by NordPool (the values of production is given in the column 'sum').
B) The production has been assumed to consist of certain shares of renewable sources (wind
and sun), thermal and hydro power (each given in its own column).
C) It has been assumed that the average inertia constant is 0 for renewable generation, HT =
5 s for thermal power plants and HH = 3 s for hydro power.
D) It has been assumed that the average power factor equals 0.9 and that the hydro power
plants are operating at a power of 80 % of the maximum power, on the average.
E) The kinetic energy of the Nordic synchronous has then been estimated by the formula
25 The origin of the table is a Fingrid internal presentation material.
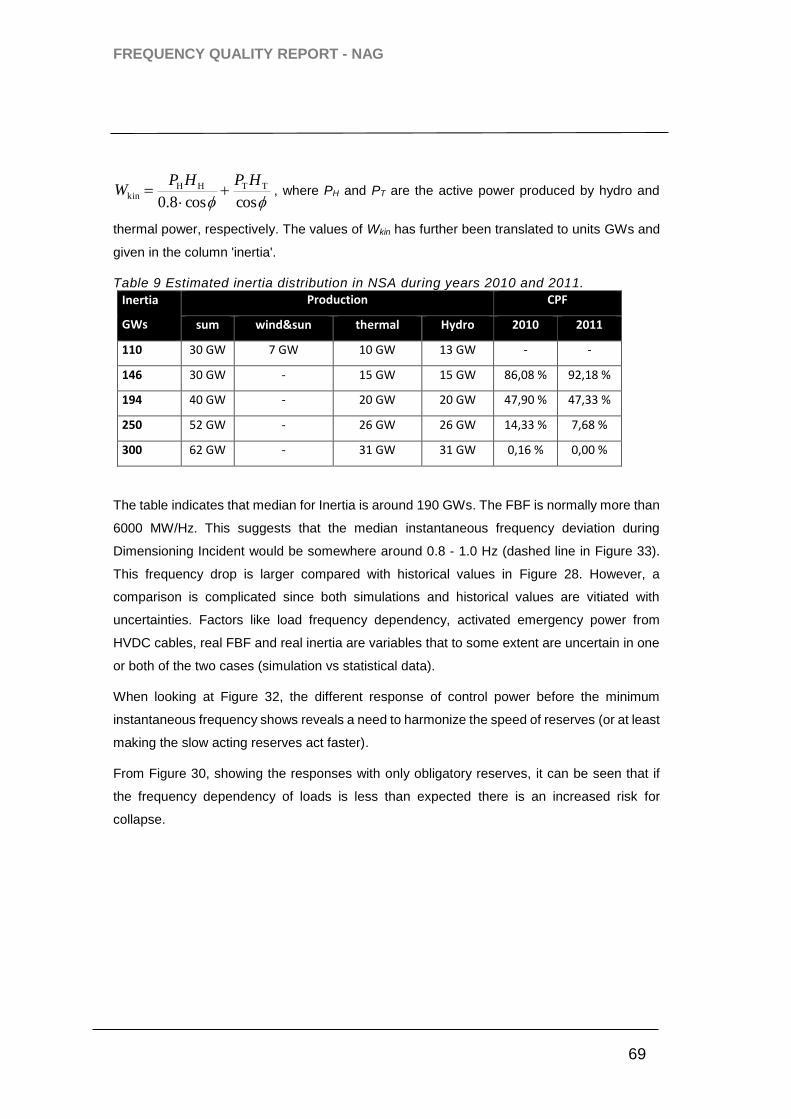
FREQUENCY QUALITY REPORT - NAG
69
Nordic Analysis Group
coscos8.0TTHH
kin
HPHPW
, where PH and PT are the active power produced by hydro and
thermal power, respectively. The values of Wkin has further been translated to units GWs and
given in the column 'inertia'.
Table 9 Estimated inertia distribution in NSA during years 2010 and 2011.
Inertia
GWs
Production CPF
sum wind&sun thermal Hydro 2010 2011
110 30 GW 7 GW 10 GW 13 GW - -
146 30 GW - 15 GW 15 GW 86,08 % 92,18 %
194 40 GW - 20 GW 20 GW 47,90 % 47,33 %
250 52 GW - 26 GW 26 GW 14,33 % 7,68 %
300 62 GW - 31 GW 31 GW 0,16 % 0,00 %
The table indicates that median for Inertia is around 190 GWs. The FBF is normally more than
6000 MW/Hz. This suggests that the median instantaneous frequency deviation during
Dimensioning Incident would be somewhere around 0.8 - 1.0 Hz (dashed line in Figure 33).
This frequency drop is larger compared with historical values in Figure 28. However, a
comparison is complicated since both simulations and historical values are vitiated with
uncertainties. Factors like load frequency dependency, activated emergency power from
HVDC cables, real FBF and real inertia are variables that to some extent are uncertain in one
or both of the two cases (simulation vs statistical data).
When looking at Figure 32, the different response of control power before the minimum
instantaneous frequency shows reveals a need to harmonize the speed of reserves (or at least
making the slow acting reserves act faster).
From Figure 30, showing the responses with only obligatory reserves, it can be seen that if
the frequency dependency of loads is less than expected there is an increased risk for
collapse.
FREQUENCY QUALITY REPORT - NAG
70
Nordic Analysis Group
10. Conclusion Within this work, the focus has been to study possible quality indices for normal operation and
operation outside normal operating band and understand factors, and relationship between
these, that affect the quality. Consequences are being described and analysed for different
values of quality, but no concrete recommendations are being presented for specific
thresholds, target levels etc.
From the historical research, it has been confirmed that frequency quality evaluation is a rather
modern topic that wasn't that much considered 20-30 years ago. Earlier, there was no
evaluation of time outside normal operating band. Therefore, it has also been difficult to, in
detail, compare quality per today with historical values. From samples, it is however
reasonable to believe that the quality has been degraded, which can also be seen in the trend
curve for the latest 15 years.
The LFC&R [8] defines "frequency quality defining parameters". Per today, several of these
parameters are in some way used in the NSA. These are "Standard Frequency Range",
"Maximum Instantaneous Frequency Deviation" and "Maximum Steady State Frequency
Deviation". Of these, it is only the first one that is associated with a "frequency quality"
measure, where the minutes outside normal operating band (or standard frequency range) is
measured. The other parameters are to be seen as fixed limits that are not to be violated.
Measurement of frequency drop will give a good indication of the system state. However, that
is not seen as a quality index for frequency, instead it is a useful measurement for post-incident
analysis for verification of amount of inertia and FBF in the system.
Comparing frequency quality indices with other synchronous areas shows that the Nordic
present way of following frequency is comparable. There are synchronous areas were the
allowed time outside normal operation is less compared with the Nordic, and other areas have
a larger allowed time outside normal operation. However, it is of importance to also notice that
the size of band for normal operation also differ, which makes a comparison difficult.
The band for normal operation is per today ±100 mHz, which also is in line with the default
value in the LFC&R code. From the historical research it was found out that this particular limit
was set due to two reasons; 1) it was a reasonable band of operation for units equipped with
electrohydraulic governors and 3) it would result in an increased margin for activation of
FCR-D.
FREQUENCY QUALITY REPORT - NAG
71
Nordic Analysis Group
For evaluating the frequency quality related to minutes outside normal operating band, the
resolution of frequency data can be lower compared with measuring frequency drop, In the
LFC&R code there is a requirement that measurement period should be equal or shorten than
10 s. Comparing the measurement method for counting minutes outside normal operating
band used per today, the method given in the LFC&R code would give approximately the same
annual number of minutes outside normal operating band as achieved with the present SvK-
method of measuring. However, the relative difference between two different methods can
much higher on short time, for instance when comparing weekly values. Therefore, it is
recommended to improve the measurement method so that statistics are based on continuous
measurements using all 10 s average values in the frequency measurement.
A follow up on the frequency distribution curve (including standard deviation value) gives
additional, valuable information compared with just specifying "minutes outside", in that sense
that the characteristics of the "minutes outside" is actually presented. As an addition to this, or
alternatively, also the number and duration of occasions outside a certain frequency band,
other than the normal operating band, could be followed. The key questions are what the
operator sitting in the control room needs in order to help maintaining sufficiently good
frequency quality and what kind of tools the TSOs need for evaluating the reserves and market
mechanisms.
Looking at the consequences of larger or smaller amount of minutes outside normal operating
band, it has an impact on the probability of going below a certain lowest accepted frequency
level during a Dimensioning Incident. A higher number of minutes outside normal operating
band means a higher probability that the frequency is already under normal operating band
when a major incident occurs, and consequently leads to a higher probability of going under a
certain minimum instantaneous frequency. The probability of going under the minimum
instantaneous frequency however depends also on other things like amount of FCR and
inertia. Going below instantaneous minimum frequency level will result in a risk of activation
of load shedding schemes, which is to be considered as entering an emergency state. Trip of
production and HVDC connections requires very large frequency deviations.
Recommendations for further work
The following recommendations for further work is given
1. Frequency quality versus operational risks
As seen in the simplified study in this work, the probability of entering emergency state after a
Dimensioning Incident increases only little when the number of minutes outside normal

FREQUENCY QUALITY REPORT - NAG
72
Nordic Analysis Group
operating band increases. It is recommended that further work shall be performed with focus
on defining what acceptable risk the system can be operated with considering frequency
quality level, and thereby finding reasonable limits for operation, both for normal state and alert
state. The work shall also consider factors that today are known with a great deal of
uncertainty. This work needs to be coordinated with the current project "Revision of Technical
Specification for Frequency Containment Process".
2. Additional frequency quality parameters
It is recommended that additional frequency quality indices are defined to have more detailed
history for coming evaluation of reserves and revisions of requirements. This could for example
be number of events outside normal operating band, durations of frequency deviations outside
normal operating band, how to evaluate outages to check the relations between all elements
like inertia, FBF, steady state frequency deviation, in relation to instantaneous frequency
deviation. Index for amount of oscillations in the frequency has not been covered within this
work, but it is suggested to be included as one of the additional indices.
3. Frequency and voltage dependency of loads
In addition to the development of different indices, there is also a need to have better
knowledge of what the frequency dependency of load in the system is, both in normal operation
and also after outages including the different reactions to the geographical origin of the outage.
4. HVDC-interconnections correlation to frequency quality
The HVDC-interconnections is well known for affecting frequency quality goals but how much
it affects is important to investigate. It is also recommended to investigate how to minimize the
HVDC interconnections impacts of frequency quality and power system security.
FREQUENCY QUALITY REPORT - NAG
73
Nordic Analysis Group
11. References
[1] Hannele Holttinen, Technical Research Centre of Finland 2005, Impact of Hourly
Wind Power variations on the System Operation in Nordic Countries.
[2] ENTSO: Nordic Grid Code, https://www.entsoe.eu/publications/system-operations-reports/nordic/Pages/default.aspx
[3] Electromagnetic compatibility (EMC) – Testing and measurement techniques – Power
quality measurement methods, IEC 61000-4-30, Edition 2, 2008
[4] CENELEC EN 50160, November 2003
[5] Gunilla le Dous and Anna Holmer, Lastens frekvensberoende I det nordiska
kraftsystemet, Chalmers Examensarbete No. 95/96:02
[6] STRI Report R10-712, An overview of Frequency Quality Indices
[7] STRI Report R11-799, New Indices for Frequency Quality
[8] ENTSO-E Network Code on Load-Frequency Control and Reserves June 2013
[9] Fingrid report: Frequency Measurement process considerations
[10] Fingrid report: Large unit, Liisa Haarla, 2013
[11] Sture Larsson: Interview 2014
[12] Sture Lindahl: Interview 2014
[13] Kenneth Walve: Interview 2014
[14] Set Persson: Interview 2014
[15] Statens Vattenfallsverk: Frekvensreglering, 1963
[16] IEE Transactions on Power Delivery: Summery of the “Guide for abnormal frequency
protection for power generation plants”, 1988
[17] CIGRE: Time response for frequency-activated reserves in Nordel-network, 1983
[18] Svenska Kraftnät: Johan Svensson, 2014
[19] Kungl. Vattenfallsstyrelsen driftbyrån: Frekvensreglering och lastfördelning på det
svenska nätet, 1957
[20] ENTSO-E: System Operational Agreement, 2006
[21] Vattenfall: Svallningsprov i Kilforsens kraftstation, 1977
[22] Svenska Kraftnät: Christer Norlander, 2014

FREQUENCY QUALITY REPORT - NAG
74
Nordic Analysis Group
[23] Svenska Kraftnät: Christer Bäck, 2014
[24] NOSY: Kartläggning av kraftstationernas effektegenskaper vid snabb
frekvensändring i det synkrona Nordel-nätet, 1988
[25] Gothia Power: Mathematical models, Bode plots, step response and eigenvalues in
automatic frequency control, 2012
[26] ENTSO-E, Operational Security Network Code 2013
[27] Energinet.dk: Niels Nørtoft, 2014
[28] ENTSO-E: Supporting Document for the Network Code on Load-Frequency Control
and Reserves, June 2013.
[29] ENTSO-E: ENTSO‐E Network Code on Demand Connection, 21 December 2012.
[30] Minutes of meeting RGN 7/2013 19th of November 2013
[31] http://www.schneider-electric.hu/documents/automation-and-control/asg-3-motors-
and-loads.pdf
[32] ENTSO-E Network Code for Requirements for Grid Connection Applicable to all
Generators, 8 March 2013
[33] ENTSO-E Network Code on Operational Planning and Scheduling, 24 September
2013
[34] ENTSO-E Draft Network Code on High Voltage Direct Current Connections and DC-
connected Power Park Modules, 30 April 2014
[35] Annual Report 1983, Nordel
[36] Analysis & Review of Requirements For Automatic Reserves In The Nordic
Synchronous System, E-bridge, 29 July 2011
[37] Fingrid report: Frequency_drop_consid V2, Matti Lahtinen, 2014
[38] Analysis & Review of Requirements For Automatic Reserves In The Nordic
Synchronous System- Simulink model description, E-bridge, 29 July 2011
[39] Power system frequency and time deviation monitoring report - Reference Guide,
2012, Australian Energy Market operator.
[40] ENTSO-E Continental Europe Operation Handbook, Appendix 1, Load frequency
control and performance
[41] Frequency variation analysis for the years 2008, 2009 and 2010, Fingrid analyse,
Juhani Mäkelä, Minna Laasonen, 30th August 2011.
[42] Report: Implementation of automatic frequency restoration reserves in the
Nordic synchronous power system – Evaluation of Nordic FRR-A during
January – May 2013, E-bridge
FREQUENCY QUALITY REPORT - NAG
75
Nordic Analysis Group
[43] Northern America Time Error correction ,
https://www.naesb.org//pdf2/weq_bklet_011505_tec_mc.pdf
[44] http://www2.nationalgrid.com/UK/Services/Balancing-services/Frequency-
response/Mandatory-Frequency-Response/
[45] National Grid, Tejas Badami, Telephone meeting and e-mail conversation 2014-10-
20
[46] Power and Frequency Control Principles of Different European Synchronous Areas,
http://egdk.ttu.ee/files/parnu2012winter/Parnu_2012_200-204.pdf
[47] Investigation of Domestic Load Control to Provide Primary Frequency Response
Using Smart Meters, Samarakoon, Jenkins, IEEE, March 2012
[48] Elnettets produksjonsstyring og frekvensregulering, Jørgen Falck Christensen, 2014
[49] Svenska Fysikersamfundet – Sveriges elförsörjning, 1982
[50] Nord Pool Spot – www.nordpoolspot.com, 2014.
[51] Frequency quality project, Minutes of Meeting, Meeting with seniors, 2014-09-17.
[52] Power Response Capability of the operating reserve in the Nordel-system, NOSY,
Sture Lindahl, 1989
[53] ENTSO-E, Nordel System Operation Agreement, 2014, https://www.entsoe.eu/Documents/Publications/SOC/Nordic/System_Operation_Agreement_2014.pdf
[54] NAG, Final Report Phase 2, Measures to mitigate the frequency oscillations with a period of, Evert Agneholm, 2014-09-05.
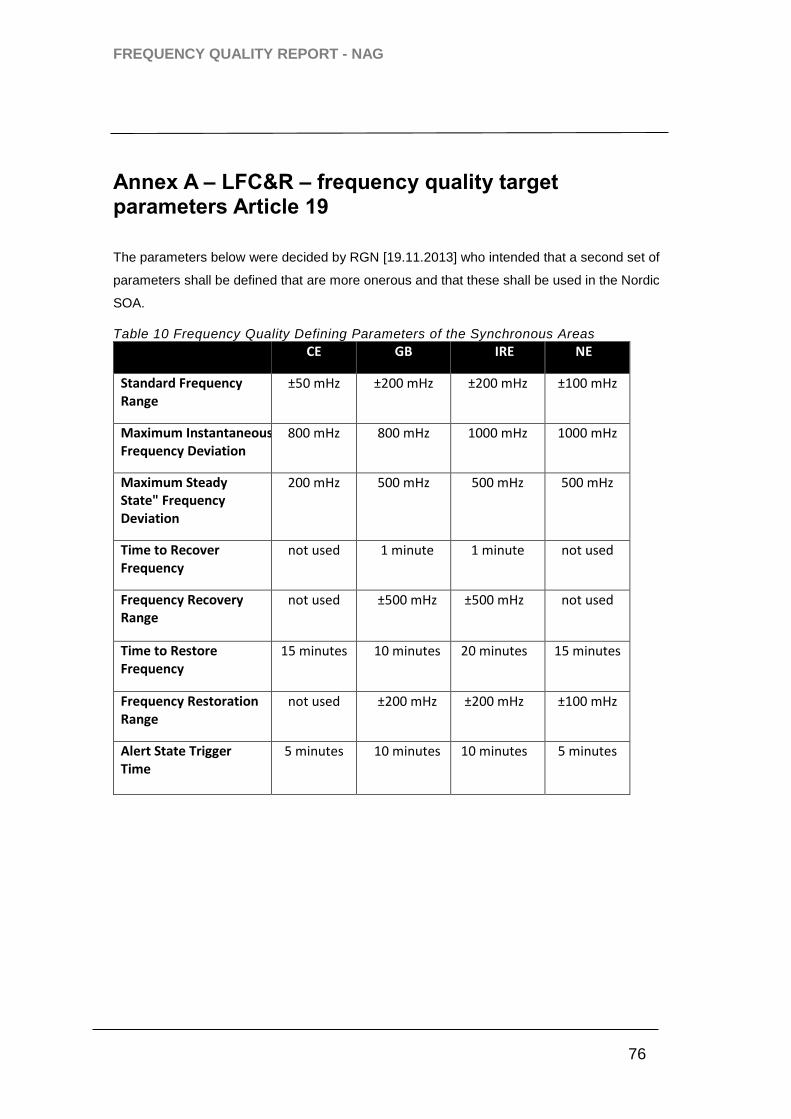
FREQUENCY QUALITY REPORT - NAG
76
Nordic Analysis Group
Annex A – LFC&R – frequency quality target parameters Article 19
The parameters below were decided by RGN [19.11.2013] who intended that a second set of
parameters shall be defined that are more onerous and that these shall be used in the Nordic
SOA.
Table 10 Frequency Quality Defining Parameters of the Synchronous Areas
CE GB IRE NE
Standard Frequency Range
±50 mHz ±200 mHz ±200 mHz ±100 mHz
Maximum Instantaneous Frequency Deviation
800 mHz 800 mHz 1000 mHz 1000 mHz
Maximum Steady State" Frequency Deviation
200 mHz 500 mHz 500 mHz 500 mHz
Time to Recover Frequency
not used 1 minute 1 minute not used
Frequency Recovery Range
not used ±500 mHz ±500 mHz not used
Time to Restore Frequency
15 minutes 10 minutes 20 minutes 15 minutes
Frequency Restoration Range
not used ±200 mHz ±200 mHz ±100 mHz
Alert State Trigger Time
5 minutes 10 minutes 10 minutes 5 minutes
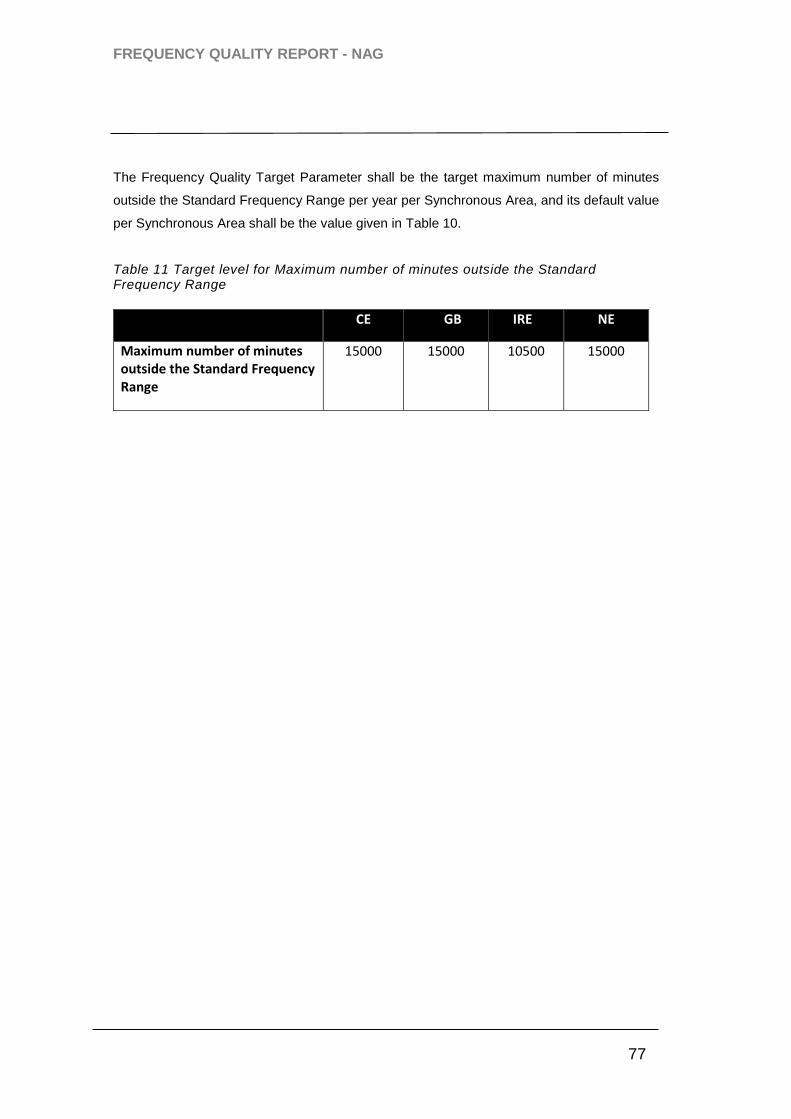
FREQUENCY QUALITY REPORT - NAG
77
Nordic Analysis Group
The Frequency Quality Target Parameter shall be the target maximum number of minutes
outside the Standard Frequency Range per year per Synchronous Area, and its default value
per Synchronous Area shall be the value given in Table 10.
Table 11 Target level for Maximum number of minutes outside the Standard Frequency Range
CE GB IRE NE
Maximum number of minutes outside the Standard Frequency Range
15000 15000 10500 15000
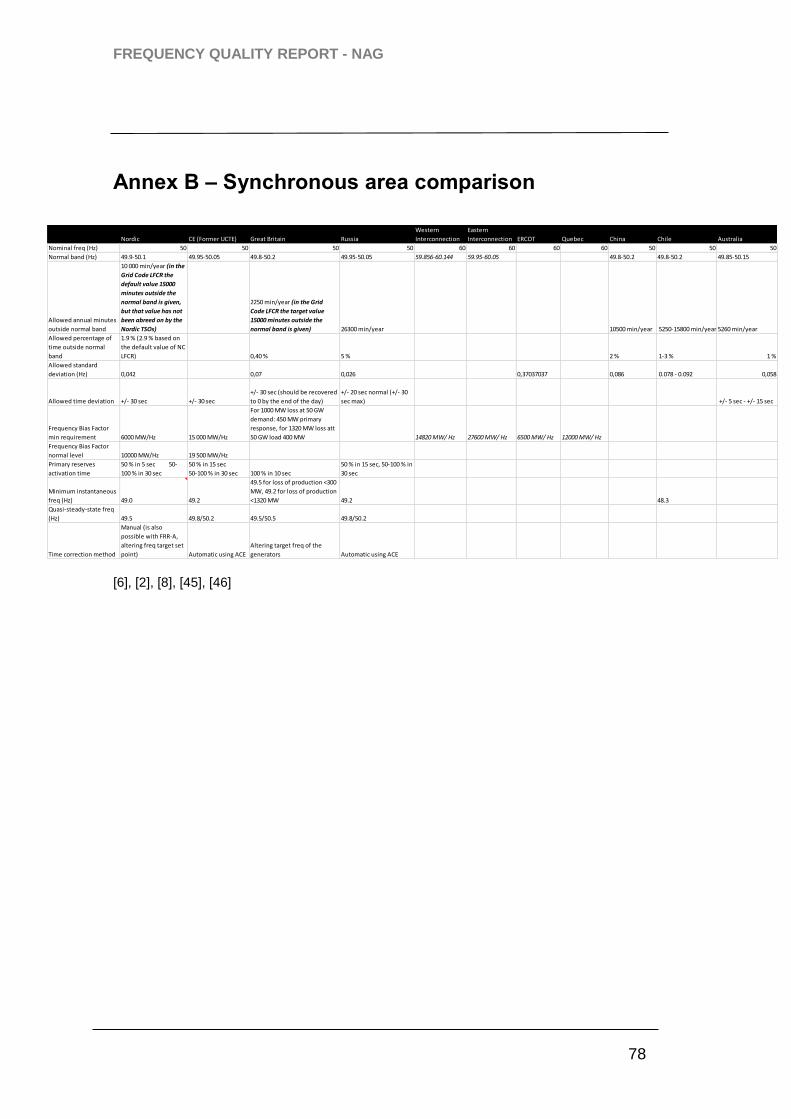
FREQUENCY QUALITY REPORT - NAG
78
Nordic Analysis Group
Annex B – Synchronous area comparison
[6], [2], [8], [45], [46]
Nordic CE (Former UCTE) Great Britain Russia
Western
Interconnection
Eastern
Interconnection ERCOT Quebec China Chile Australia
Nominal freq (Hz) 50 50 50 50 60 60 60 60 50 50 50
Normal band (Hz) 49.9-50.1 49.95-50.05 49.8-50.2 49.95-50.05 59.856-60.144 59.95-60.05 49.8-50.2 49.8-50.2 49.85-50.15
Allowed annual minutes
outside normal band
10 000 min/year (in the
Grid Code LFCR the
default value 15000
minutes outside the
normal band is given,
but that value has not
been abreed on by the
Nordic TSOs)
2250 min/year (in the Grid
Code LFCR the target value
15000 minutes outside the
normal band is given) 26300 min/year 10500 min/year 5250-15800 min/year 5260 min/year
Allowed percentage of
time outside normal
band
1.9 % (2.9 % based on
the default value of NC
LFCR) 0,40 % 5 % 2 % 1-3 % 1 %
Allowed standard
deviation (Hz) 0,042 0,07 0,026 0,37037037 0,086 0.078 - 0.092 0,058
Allowed time deviation +/- 30 sec +/- 30 sec
+/- 30 sec (should be recovered
to 0 by the end of the day)
+/- 20 sec normal (+/- 30
sec max) +/- 5 sec - +/- 15 sec
Frequency Bias Factor
min requirement 6000 MW/Hz 15 000 MW/Hz
For 1000 MW loss at 50 GW
demand: 450 MW primary
response, for 1320 MW loss att
50 GW load 400 MW 14820 MW/ Hz 27600 MW/ Hz 6500 MW/ Hz 12000 MW/ Hz
Frequency Bias Factor
normal level 10000 MW/Hz 19 500 MW/Hz
Primary reserves
activation time
50 % in 5 sec 50-
100 % in 30 sec
50 % in 15 sec
50-100 % in 30 sec 100 % in 10 sec
50 % in 15 sec, 50-100 % in
30 sec
Minimum instantaneous
freq (Hz) 49.0 49.2
49.5 for loss of production <300
MW, 49.2 for loss of production
<1320 MW 49.2 48.3
Quasi-steady-state freq
(Hz) 49.5 49.8/50.2 49.5/50.5 49.8/50.2
Time correction method
Manual (is also
possible with FRR-A,
altering freq target set
point) Automatic using ACE
Altering target freq of the
generators Automatic using ACE
FREQUENCY QUALITY REPORT - NAG
79
Nordic Analysis Group
Annex C – Terms of reference
In the terms of reference the following aspects effecting frequency quality should be included
in the work:
Minutes outside the band
Frequency after disturbances
Frequency oscillations
Time deviation
Frequency containment reserves (FCR) means the Operational Reserves
activated automatically to contain System Frequency after the occurrence of
an imbalance
o Including governor settings in general
Frequency restoration reserves (FRR)
Inertia
Tertiary reserves
Load profile
Power plant and HVDC operation
Quarterly adjustment
What is included in the grid code
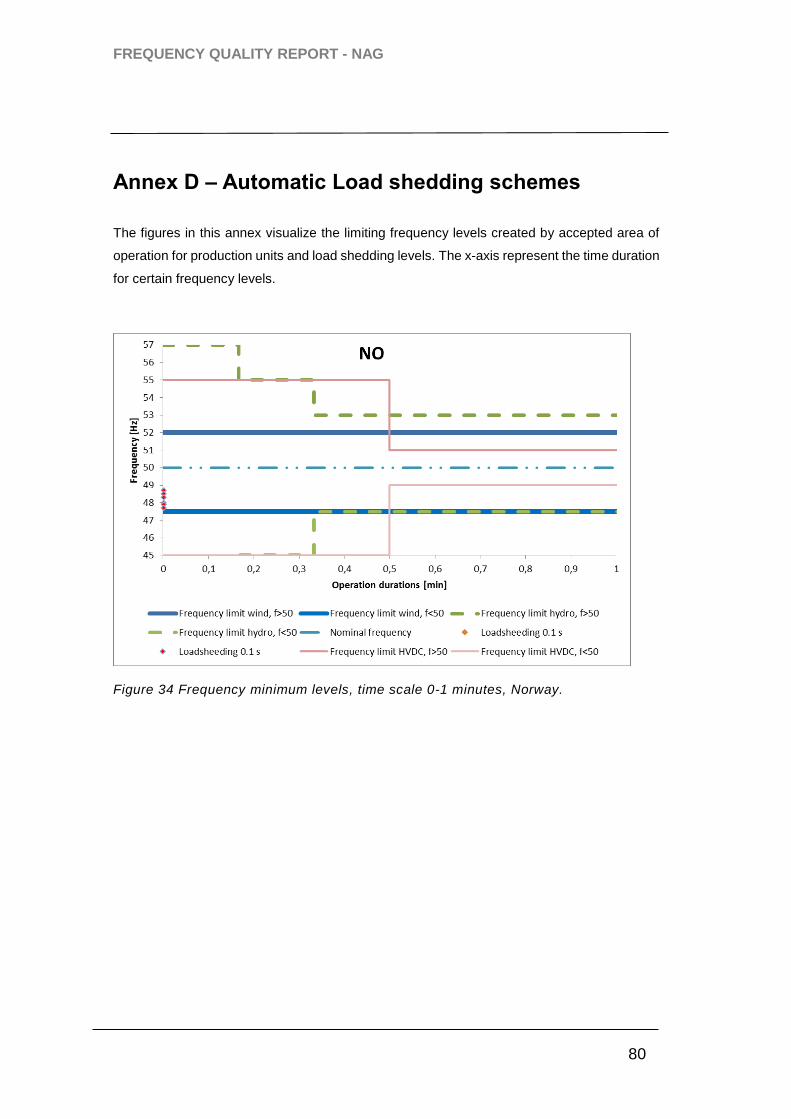
FREQUENCY QUALITY REPORT - NAG
80
Nordic Analysis Group
Annex D – Automatic Load shedding schemes
The figures in this annex visualize the limiting frequency levels created by accepted area of
operation for production units and load shedding levels. The x-axis represent the time duration
for certain frequency levels.
Figure 34 Frequency minimum levels, time scale 0-1 minutes, Norway.
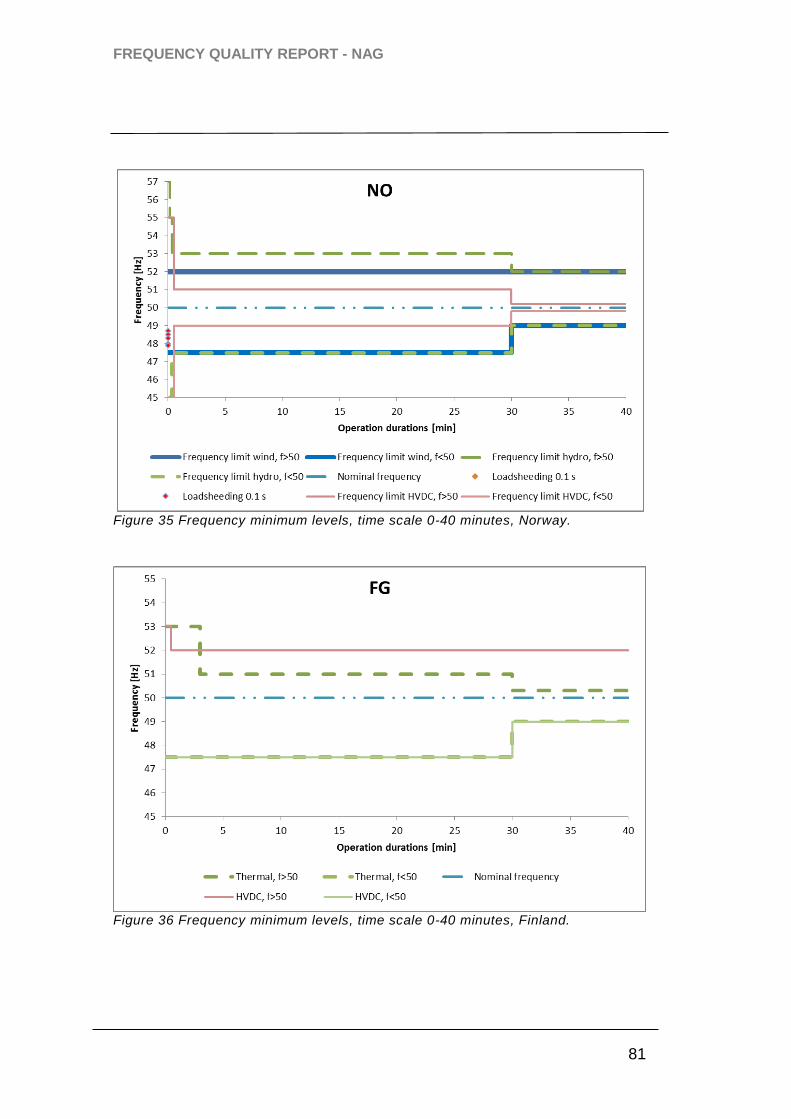
FREQUENCY QUALITY REPORT - NAG
81
Nordic Analysis Group
Figure 35 Frequency minimum levels, time scale 0-40 minutes, Norway.
Figure 36 Frequency minimum levels, time scale 0-40 minutes, Finland.

FREQUENCY QUALITY REPORT - NAG
82
Nordic Analysis Group
Figure 37 Frequency minimum levels, time scale 0-1 minutes, Denmark (DK2).
Figure 38 Frequency minimum levels, time scale 0-40 minutes, Denmark (DK2).
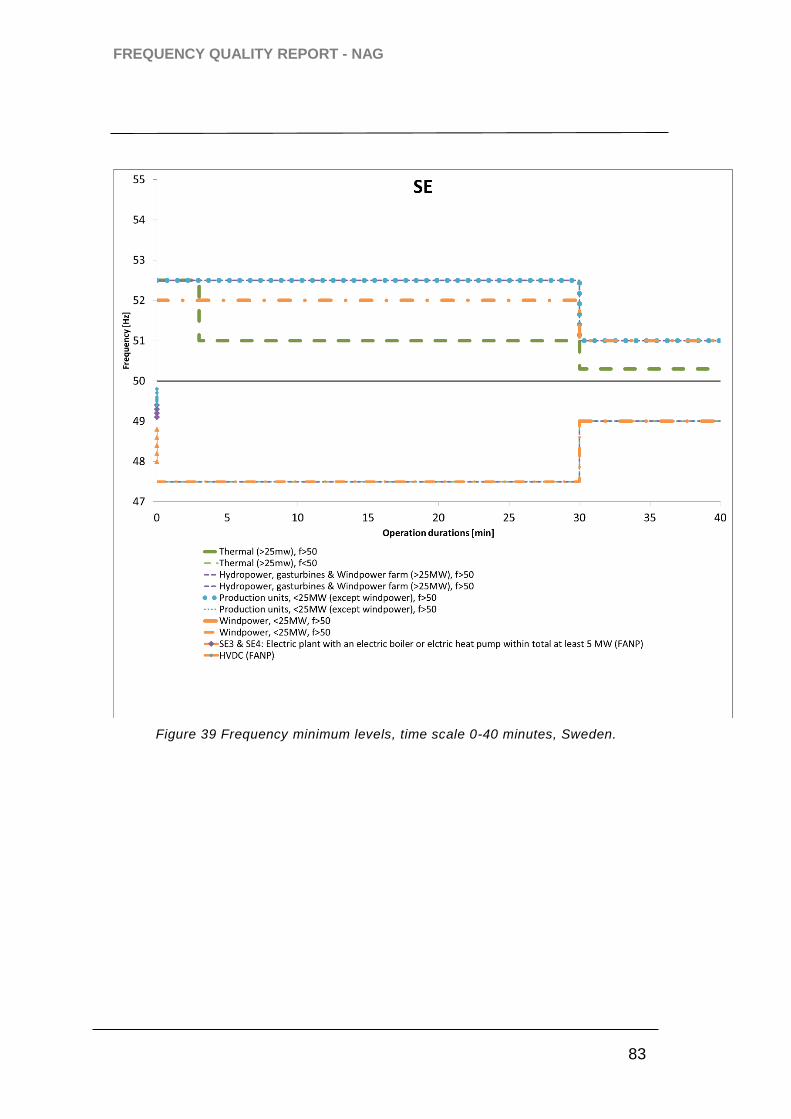
FREQUENCY QUALITY REPORT - NAG
83
Nordic Analysis Group
Figure 39 Frequency minimum levels, time scale 0-40 minutes, Sweden.

FREQUENCY QUALITY REPORT - NAG
84
Nordic Analysis Group
Figure 40 Frequency minimum levels, time scale 0-14 minutes, Sweden.