Embed Size (px)
Citation preview

NAI Houston Office Report | Second Quarter 2012
1900 West Loop South, Suite 500 Houston, TX 77027
tel 713 629 0500 www.naihouston.com

Houston: Office Report Q2-2012 Statistics
CITYWIDE OFFICE LEASING STATISTICS: ABSORPTION: Measure of Demand in Square Footage for Office Space (All Office Space) Total net absorption for 2012 YTD = +2,928,610 SF (up from 1.635M in Q1-2012)
• The Class A buildings recorded net positive absorption of 895,436 SF, while Class B buildings posted a positive absorption of 633,697 SF for the 2nd Quarter.
VACANCY:
• Decreased to 12.2% to end Q2-2012 citywide for all Class A, B &C buildings. • Vacancy Rates for the last 3 quarters have been as follows: Q1-2012 = 12.5% Q4-2011= 12.8% Q3-2011= 13.2% • Class A projects reported a 11.2% Vacancy Rate citywide. • Class B projects reported a 13.7% Vacancy Rate citywide. • Overall Vacancy Rates downtown remained at 12%.
RENTAL RATES: All Building Classes A, B, & C Combined
• Quoted rental rates up in last 12 months (from $22.42/SF in Q2 2011 to $23.64/SF ending Q2 2012) • Landlord concessions like free rent, parking charge abatements, etc. are on the decline.
NEW CONSTRUCTION: All Building Classes A, B, & C Combined
• Going into Q2 2012, there are 2,758,688* square feet of new office buildings under construction. • By comparison, Q2 2008 had 9,729,346* square feet of new office buildings under construction.
*This significant difference in new construction numbers between Q2 2008 and Q2 2012 is mostly attributed to lending restrictions during the last 4 years. SALES:
• Cap rates in Q1 2012 averaged 6.97% compared to 8.08% in Q1 2011. • Record breaking sale of the Hess Tower in Downtown Houston for $442.5 million at $523.81/SF at a
6.6% cap rate. SUBLEASE SPACE:
• In the last 12 months, inventory of sublease space available citywide has been reduced by 587,995
SF.
1900 West Loop South, Suite 500 Houston, TX 77027
tel 713 629 0500 www.naihouston.com
Source: CoStar Property®
Houston: Office Report Q2-2012 Statistics
1900 West Loop South, Suite 500 Houston, TX 77027
tel 713 629 0500 www.naihouston.com
Source: CoStar Property®
Houston, TX—Citywide for all classes of Office Space
Office space statistical changes year over year and quarter over quarter:
OFFICE SPACE STATISTICAL
CHANGES QUARTER Q1 2012
VS Q2 2012:
Net Absorption Vacancy Rate Construction Asking Rents
OFFICE SPACE STATISTICAL
CHANGES YEAR
Q2 2011 VS
Q2 2012:
Net Absorption Vacancy Rate Construction Asking Rents
Houston: Office Report Q2-2012 Statistics
1900 West Loop South, Suite 500 Houston, TX 77027
tel 713 629 0500 www.naihouston.com
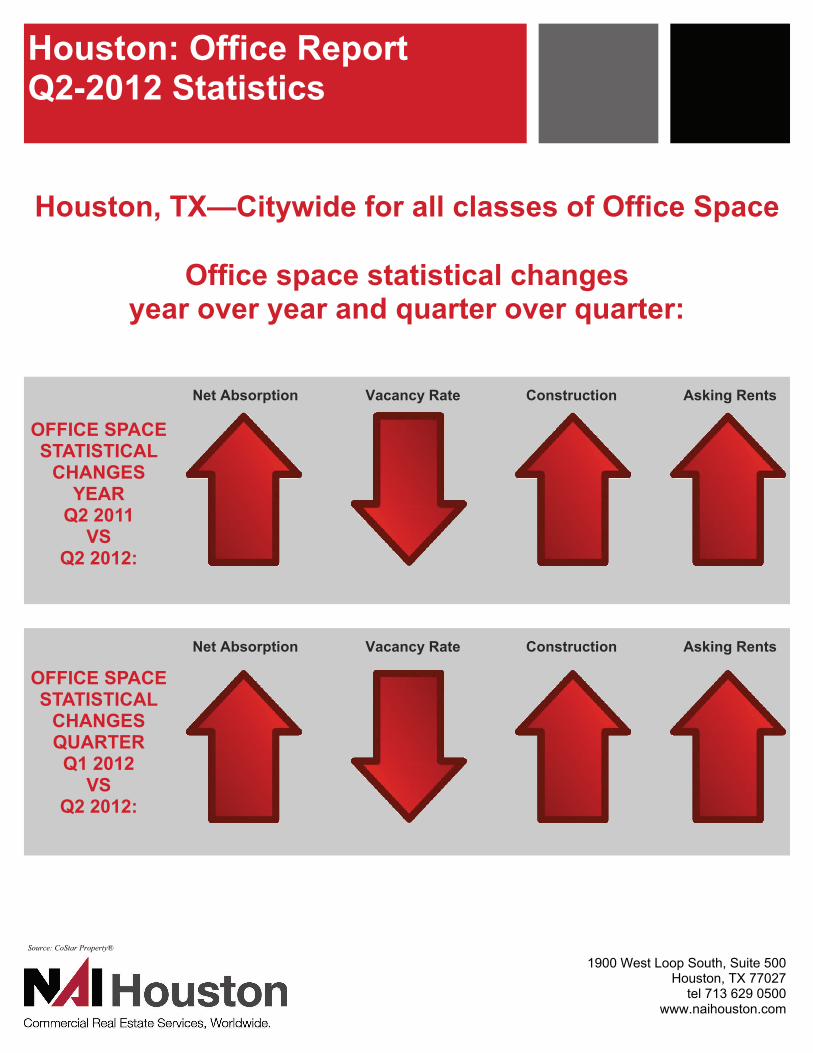
Total Employment Growth Highlight Total Number of Jobs Added Per Year
Recent Deliveries of Office Space (Houston, TX)
Source: CoStar Property®

Houston: Office Report Q2-2012 Statistics
1900 West Loop South, Suite 500 Houston, TX 77027
tel 713 629 0500 www.naihouston.com
Absorption & Deliveries for Class A, B & C Office Buildings City Wide Past 8 Quarters
Square Footage per Employee by Industry Based upon All Tenants
Source: CoStar Tenant®
* Measure of Demand
NAI Houston Office Report | Second Quarter 2012
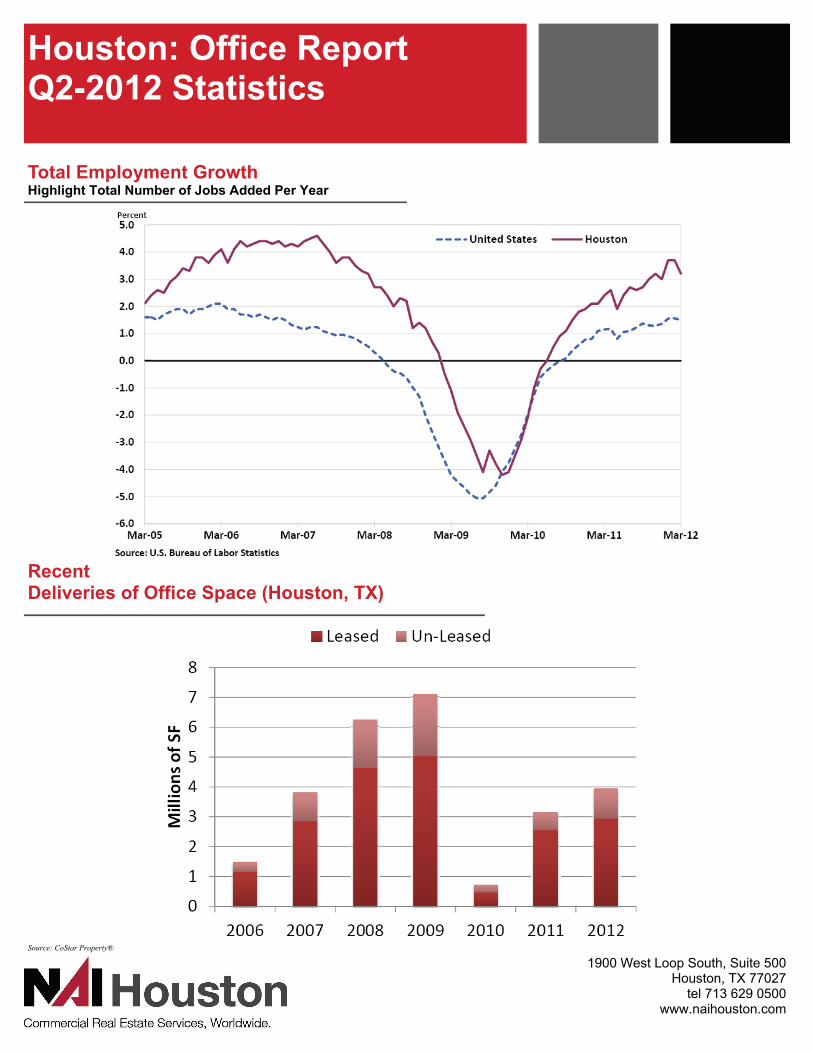
Submarket Reports

NAI Houston Office Report | Second Quarter 2012
Submarket Reports

Absorption (Net) The change in occupied space in a given time period. Available Square Footage Net rentable area considered available for lease; excludes sublease space. Average Asking Rental Rate Rental rate as quoted from each building’s owner/management company. For office space, a full service rate was requested; for retail, a triple net rate requested; for industrial, a NN basis. Building Class Class A Product is office space of steel and con-crete construction, built after 1980, quality ten-ants, excellent amenities & premium rates. Class B product is office space built after 1980, fair to good finishes & wide range of tenants. Direct Vacancy Space currently available for lease directly with the landlord or building owner. Market Size Includes all existing and under construction office buildings (office, office condo, office loft, office medical, all classes and all sizes, both multi-tenant and single-tenant, including owner-occupied buildings) within each market. Overall Vacancy All physically unoccupied lease space, either di-rect or sublease. SF/PSF Square foot/per square foot, used as a unit of measurement. Sublease Arrangement in which a tenant leases rental prop-erty to another, and the tenant becomes the land-lord to the subtenant. Sublease Space Total square footage being marketed for lease by the tenant. Sublease Vacancy Space currently available in the market for sub-lease with an existing tenant within a building act-ing as the landlord. Source: CoStar Property
Downtown 5.2 million SF vacant
12% vacancy rate $32.44/SF/YR avg. rental
West Loop
1.4 million SF vacant 10.1% vacancy rate
$30.35/SF/YR avg. rental
Greenway Plaza 1.0 million SF vacant 9.1% vacancy rate
$25.30/SF/YR avg. rental
The information contained herein has been given to us by sources we deem reliable. We have no reason to doubt its accuracy, however, we do not make any guarantees. All information should be verified before relying thereon.
NAI Houston Methodology / Definitions / Submarket Map