Embed Size (px)
Citation preview

FORMATS FOR ARR & TARIFF FILING BY DISTRIBUTION LICENSEES
SUMMARY FORMATS
1 S1 Annual Revenue Requirement
2 S2 Return on Equity
3 S3 Expenditure Allocation into Fixed, Variable & Other Costs
4 S4 Energy Balance5 S5 Truing Up
FINANCIAL FORMATS
6 F1 Revenue from Tariff and Charges
7 F1a Projection of sales,consumers & connected load
8 F2 Revenue Grants & subsidies
9 F3 Income from investments and Non-Tariff Income
10 F4 Summary of HP Own Generation & Power Purchase
11 F4a Power purchase Details
12 F4b Intra State Transmission (TRANSCO) Charges
13 F5 R&M Expenses
14 F6 Employees' Cost & Provisions
15 F6a Employee Strength
16 F7 Administration & General Expenses
17 F8 Statement of Fixed Assets and Depreciation
18 F9 Interest & Finance charges
19 F9a Domestic loans,bonds and financial leasing
20 F9b Details of Existing Loans
21 F9c Details of New Loans for each MYT Year
22 F10 Details of Expenses Capitalised
23 F11 Other Debits
24 F12 Statement of Sundry Debtors & provision for bad & doubtful debtors
25 F13 Extraordinary Items
26 F14 Net Prior Period Expenses/Income
27 F15 Contribution Grants & subsidies towards Capital assets
28 F16 Project-wise / Scheme-wise Capital Expenditure
29 F17 Statements of assets not in use
34 F18 Investments
35 F18A Investments in Non business related activities
36 F19 Current Assets and Liabilities
37 F20 Working Capital Requirement38 F21 Provison for Income Tax
TARIFF FORMATS
39 T1 Existing & Proposed Tariff
40 T2 Revenue from Current Tariffs in Ensuing Year41 T3 Revenue from Proposed Tariffs in Ensuing Year
QUALITY OF SERVICE FORMATS
42 P1 Revenue Arrears and Agewise Analysis43 P1a Revenue Arrears of Government and Agewise Analysis44 P2 T&D Losses in LT and HT System45 P2a Losses in 33 KV system46 P2b Losses in 22 KV system47 P2c Losses in 11 KV system48 P2d Losses in LT system49 P3 Consumer Complaint50 P4 Voltage Profile51 P5 Technical Parameters52 P6 Abstract of outages due to tripping in HT feeders53 P7 Failure of Transformers
54 P8 Billing Periodicity
55 P9 Electrical Accidents
56 P10 Peak Demand
57 P11 Release of Customer bills
58 P12 Key Ratios
59 P13 Debt Restructuring
60 P14 Release of New service Connections
61 P15 Status of Metering
62 P16 Materials Management
63 P17 Audit Details
64 P18 Status of Pre-paid Metering65 P19 Status of Unmanned sub-stations
Instructions for the Utility:
1
2
PY Previous Year, Past Year
CY Current Year
EY Ensuing Year
NAME OF DISTRIBUTION LICENSEE

Name of Distribution Licensee
Annual Revenue Requirement Form No: S1
All figures in Rs Crores
Particulars PY PY CY
FY (n-2) FY (n-1) FY (n) FY (n+1) FY (n+2) FY (n+3)
Power Purchase (MU)
Sale of Power (MU)
Loss %
1 Receipts
a Revenue from tariffs & Miscell. Charges
b Revenue subsidy from Govt.
Total
2 Expenditure
a Purchase of Power from Own Stations
b Purchase of Power from Other Sources
c Intra-State Transmission Charges
d R&M Expense
e Employee Expenses
f A&G Expense
g Depreciation
h Interest & Finance Charges
i Less: Interest & other expenses capitalised
j Other Debits (incl. Prov for Bad debts)
k Extraordinary Items
l Other (Misc.)-net prior period credit/ (charges)
Total
3 Reasonable Return
4 Other Income
5 Annual Revenue Requirement (2)+(3)-(4)
6 Surplus(+) / Shortfall(-) : (1)-(5)
before tariff revision
7 Tariff Revision Impact
8 Surplus(+) / Shortfall(-) : (6)-(7)
after tariff revision
Control Period

Form No: S2
All figures in Rs Crores
S. No Particulars PY PY CY
FY (n-2) FY (n-1) FY (n) FY (n+1) FY (n+2) FY (n+3)
1 Opening Balance of Equity
2 Net Additions during the Year
3 Less: Capitalization
4 Closing Balance of Equity
5 Rate of Return (%)
ROE
Name of Distribution Licensee
Return on Equity
Control Period

Name of Distribution Licensee
Expenditure Allocation into Fixed, Variable & Other Costs Form No: S3
All figures in Rs Crores
Particulars Previous Year Previous Year Current Year
Fixed Variable Others Total Fixed Variable Others Total Fixed Variable Others Total Fixed Variable Others Total Fixed Variable Others Total Fixed Variable Others Total
Expenditure
1 Power Purchase
2 Repairs and Maintenance
3 Employee Costs
4 Admin and General Expenses
5 Depreciation and related dts
6 Interest & Finance charges
Sub-Total
Less: Expenses capitalised
- Interest & Finance Charges capitalised
- Other Expenses capiatlised
Sub-Total
7 Return on Capital Employed
8 Other Debits (incl. Bad debts)
9 Extraordinary Items
10 Total Expenditure
Control Period
FY (n+2) FY (n+3)FY (n-2) FY (n-1) FY (n) FY (n+1)
Name of Distribution Licensee
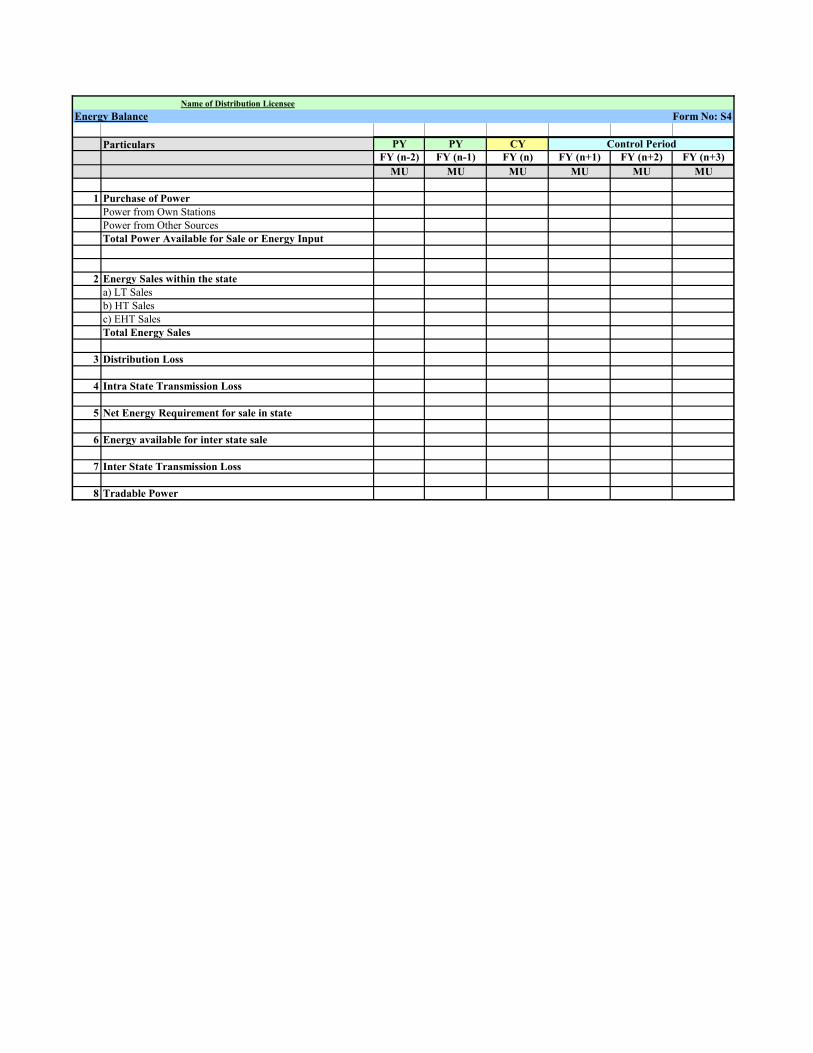
Energy Balance Form No: S4
Particulars PY PY CY
FY (n-2) FY (n-1) FY (n) FY (n+1) FY (n+2) FY (n+3)
MU MU MU MU MU MU
1 Purchase of Power
Power from Own Stations
Power from Other Sources
Total Power Available for Sale or Energy Input
2 Energy Sales within the state
a) LT Sales
b) HT Sales
c) EHT Sales
Total Energy Sales
3 Distribution Loss
4 Intra State Transmission Loss
5 Net Energy Requirement for sale in state
6 Energy available for inter state sale
7 Inter State Transmission Loss
8 Tradable Power
Control Period

Name of Distribution Licensee
Truing Up Form No: S5
All figures in Rs Crores
Particulars Approved Actual
PY PY
Power Purchase (MU)
Sale of Power (MU)
Loss %
1 Receipts
a Revenue from tariffs & Miscell. Charges
b Subsidy from Govt.
Total
2 Expenditure
a Purchase of Power from Own Stations
b Purchase of Power from Other Sources
c Intra-State Transmission Charges
d R&M Expense
e Employee Expenses
f A&G Expense
g Depreciation
h Interest & Finance Charges
i Less: Interest & other expenses capitalised
j Other Debits (incl. Prov for Bad debts)
k Extraordinary Items
l Other (Misc.)-net prior period credit
Total
3 Reasonable Return
4 Other Income
5 Annual Revenue Requirement (2)+(3)-(4)
6 Surplus(+) / Shortfall(-) : (1)-(5) before tariff revision
7 Tariff Revision Impact
8 Surplus(+) / Shortfall(-) : (6)-(7)after tariff revision
Note: This form should be filled up at the end of each year of the control period.
Name of
Distribution
Licensee
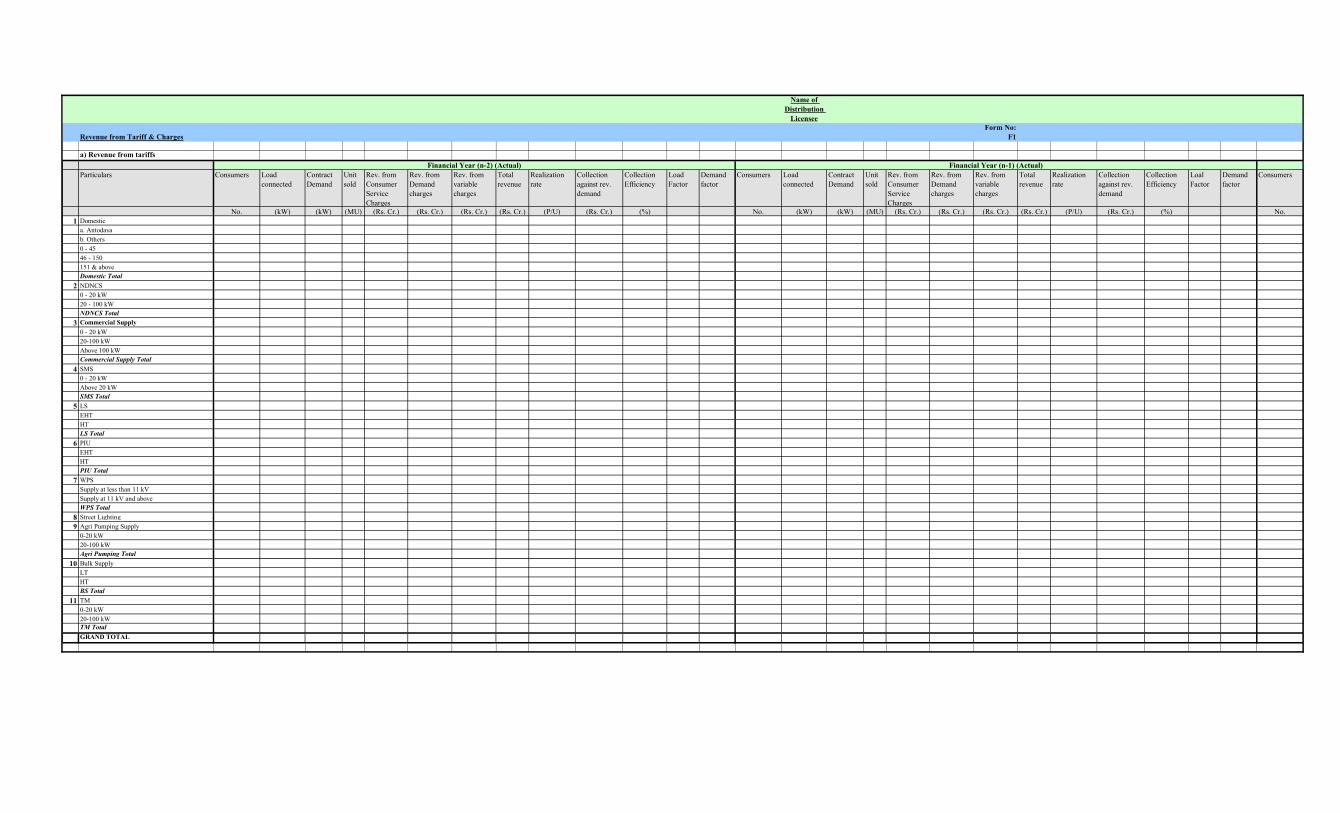
Revenue from Tariff & Charges
Form No:
F1
a) Revenue from tariffs
Particulars Consumers Load
connected
Contract
Demand
Unit
sold
Rev. from
Consumer
Service
Charges
Rev. from
Demand
charges
Rev. from
variable
charges
Total
revenue
Realization
rate
Collection
against rev.
demand
Collection
Efficiency
Load
Factor
Demand
factor
Consumers Load
connected
Contract
Demand
Unit
sold
Rev. from
Consumer
Service
Charges
Rev. from
Demand
charges
Rev. from
variable
charges
Total
revenue
Realization
rate
Collection
against rev.
demand
Collection
Efficiency
Loal
Factor
Demand
factor
Consumers
No. (kW) (kW) (MU) (Rs. Cr.) (Rs. Cr.) (Rs. Cr.) (Rs. Cr.) (P/U) (Rs. Cr.) (%) No. (kW) (kW) (MU) (Rs. Cr.) (Rs. Cr.) (Rs. Cr.) (Rs. Cr.) (P/U) (Rs. Cr.) (%) No.
1 Domestic
a. Antodaya
b. Others
0 - 45
46 - 150
151 & above
Domestic Total
2 NDNCS
0 - 20 kW
20 - 100 kW
NDNCS Total
3 Commercial Supply
0 - 20 kW
20-100 kW
Above 100 kW
Commercial Supply Total
4 SMS
0 - 20 kW
Above 20 kW
SMS Total
5 LS
EHT
HT
LS Total
6 PIU
EHT
HT
PIU Total
7 WPS
Supply at less than 11 kV
Supply at 11 kV and above
WPS Total
8 Street Lighting
9 Agri Pumping Supply
0-20 kW
20-100 kW
Agri Pumping Total
10 Bulk Supply
LT
HT
BS Total
11 TM
0-20 kW
20-100 kW
TM Total
GRAND TOTAL
Financial Year (n-2) (Actual) Financial Year (n-1) (Actual) Financial Year (n) (Estimated)
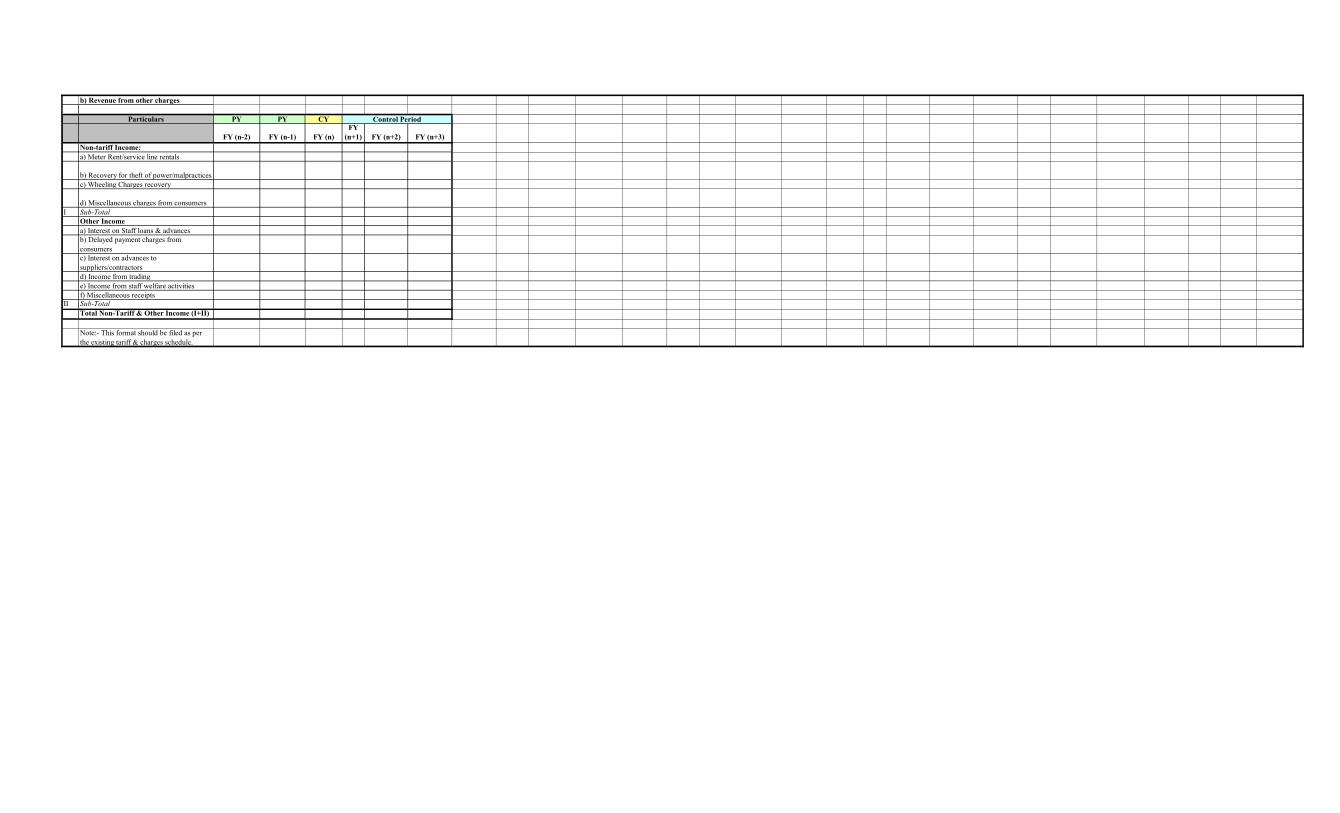
b) Revenue from other charges
Particulars PY PY CY
FY (n-2) FY (n-1) FY (n)
FY
(n+1) FY (n+2) FY (n+3)
Non-tariff Income:
a) Meter Rent/service line rentals
b) Recovery for theft of power/malpractices
c) Wheeling Charges recovery
d) Miscellaneous charges from consumers
I Sub-Total
Other Income
a) Interest on Staff loans & advances
b) Delayed payment charges from
consumers
c) Interest on advances to
suppliers/contractors
d) Income from trading
e) Income from staff welfare activities
f) Miscellaneous receiptsII Sub-Total
Total Non-Tariff & Other Income (I+II)
Note:- This format should be filed as per
the existing tariff & charges schedule.
Control Period

Revenue from Tariff & Charges
a) Revenue from tariffs
Particulars
Domestic
a. Antodaya
b. Others
0 - 45
46 - 150
151 & above
Domestic Total
NDNCS
0 - 20 kW
20 - 100 kW
NDNCS Total
Commercial Supply
0 - 20 kW
20-100 kW
Above 100 kW
Commercial Supply Total
SMS
0 - 20 kW
Above 20 kW
SMS Total
LS
EHT
HT
LS Total
PIU
EHT
HT
PIU Total
WPS
Supply at less than 11 kV
Supply at 11 kV and above
WPS Total
Street Lighting
Agri Pumping Supply
0-20 kW
20-100 kW
Agri Pumping Total
Bulk Supply
LT
HT
BS Total
TM
0-20 kW
20-100 kW
TM Total
GRAND TOTAL
Form No:
F1
Form No:
F1
Load
connected
Contract
Demand
Unit
sold
Rev. from
Consumer
Service
Charges
Rev. from
Demand
charges
Rev. from
variable
charges
Total
revenue
Realization
rate
Collection
against rev.
demand
Collection
Efficiency
Loal
Factor
Demand
factor
Consumers Load
connected
Contract
Demand
Unit
sold
Rev. from
Consumer
Service
Charges
Rev. from
Demand
charges
Rev. from
variable
charges
Total
revenue
Realization
rate
Collection
against rev.
demand
Collection
Efficiency
Loal
Factor
Demand
factor
Consumers Load
connected
(kW) (kW) (MU) (Rs. Cr.) (Rs. Cr.) (Rs. Cr.) (Rs. Cr.) (P/U) (Rs. Cr.) (%) No. (kW) (kW) (MU) (Rs. Cr.) (Rs. Cr.) (Rs. Cr.) (Rs. Cr.) (P/U) (Rs. Cr.) (%) No. (kW)
Financial Year (n) (Estimated) Financial Year (n+1) (Projected) Financial Year (n+2) (Projected)

b) Revenue from other charges
Particulars
Non-tariff Income:
a) Meter Rent/service line rentals
b) Recovery for theft of power/malpractices
c) Wheeling Charges recovery
d) Miscellaneous charges from consumers
Sub-Total
Other Income
a) Interest on Staff loans & advances
b) Delayed payment charges from
consumers
c) Interest on advances to
suppliers/contractors
d) Income from trading
e) Income from staff welfare activities
f) Miscellaneous receiptsSub-Total
Total Non-Tariff & Other Income (I+II)
Note:- This format should be filed as per
the existing tariff & charges schedule.

Revenue from Tariff & Charges
a) Revenue from tariffs
Particulars
Domestic
a. Antodaya
b. Others
0 - 45
46 - 150
151 & above
Domestic Total
NDNCS
0 - 20 kW
20 - 100 kW
NDNCS Total
Commercial Supply
0 - 20 kW
20-100 kW
Above 100 kW
Commercial Supply Total
SMS
0 - 20 kW
Above 20 kW
SMS Total
LS
EHT
HT
LS Total
PIU
EHT
HT
PIU Total
WPS
Supply at less than 11 kV
Supply at 11 kV and above
WPS Total
Street Lighting
Agri Pumping Supply
0-20 kW
20-100 kW
Agri Pumping Total
Bulk Supply
LT
HT
BS Total
TM
0-20 kW
20-100 kW
TM Total
GRAND TOTAL
Contract
Demand
Unit
sold
Rev. from
Consumer
Service
Charges
Rev. from
Demand
charges
Rev. from
variable
charges
Total
revenue
Realization
rate
Collection
against rev.
demand
Collection
Efficiency
Loal
Factor
Demand
factor
Consumers Load
connected
Contract
Demand
Unit
sold
Rev. from
Consumer
Service
Charges
Rev. from
Demand
charges
Rev. from
variable
charges
Total
revenue
Realization
rate
Collection
against rev.
demand
Collection
Efficiency
Loal
Factor
Demand
factor
(kW) (MU) (Rs. Cr.) (Rs. Cr.) (Rs. Cr.) (Rs. Cr.) (P/U) (Rs. Cr.) (%) No. (kW) (kW) (MU) (Rs. Cr.) (Rs. Cr.) (Rs. Cr.) (Rs. Cr.) (P/U) (Rs. Cr.) (%)
Financial Year (n+3) (Projected)Financial Year (n+2) (Projected)

b) Revenue from other charges
Particulars
Non-tariff Income:
a) Meter Rent/service line rentals
b) Recovery for theft of power/malpractices
c) Wheeling Charges recovery
d) Miscellaneous charges from consumers
Sub-Total
Other Income
a) Interest on Staff loans & advances
b) Delayed payment charges from
consumers
c) Interest on advances to
suppliers/contractors
d) Income from trading
e) Income from staff welfare activities
f) Miscellaneous receiptsSub-Total
Total Non-Tariff & Other Income (I+II)
Note:- This format should be filed as per
the existing tariff & charges schedule.
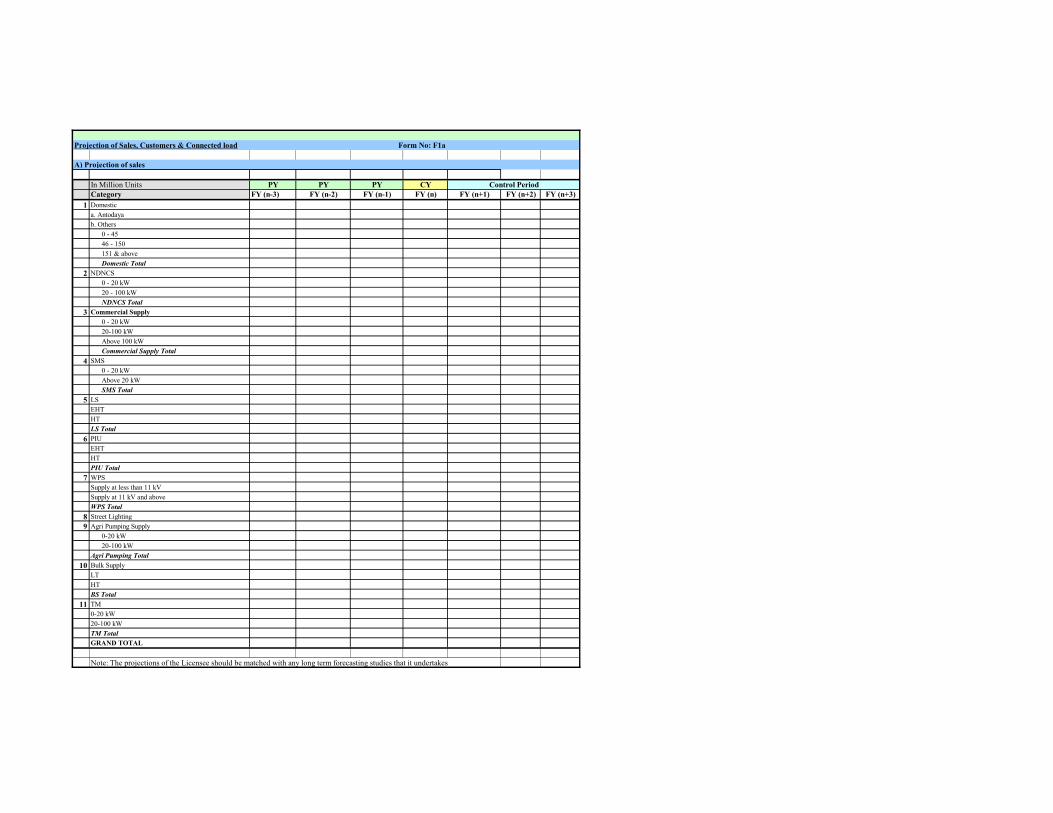
Projection of Sales, Customers & Connected load Form No: F1a
A) Projection of sales
In Million Units PY PY PY CY
Category FY (n-3) FY (n-2) FY (n-1) FY (n) FY (n+1) FY (n+2) FY (n+3)
1 Domestic
a. Antodaya
b. Others
0 - 45
46 - 150
151 & above
Domestic Total
2 NDNCS
0 - 20 kW
20 - 100 kW
NDNCS Total
3 Commercial Supply
0 - 20 kW
20-100 kW
Above 100 kW
Commercial Supply Total
4 SMS
0 - 20 kW
Above 20 kW
SMS Total
5 LS
EHT
HT
LS Total
6 PIU
EHT
HT
PIU Total
7 WPS
Supply at less than 11 kV
Supply at 11 kV and above
WPS Total
8 Street Lighting
9 Agri Pumping Supply
0-20 kW
20-100 kW
Agri Pumping Total
10 Bulk Supply
LT
HT
BS Total
11 TM
0-20 kW
20-100 kW
TM Total
GRAND TOTAL
Note: The projections of the Licensee should be matched with any long term forecasting studies that it undertakes
Control Period

B) Projection of Number of Customers
Actual Actual Actual Estimated
Category 2004-05 2005-06 2006-07 2007-08 2008-09 2009-10 2010-11
1 Domestic
a. Antodaya
b. Others
0 - 45
46 - 150
151 & above
Domestic Total
2 NDNCS
0 - 20 kW
20 - 100 kW
NDNCS Total
3 Commercial Supply
0 - 20 kW
20-100 kW
Above 100 kW
Commercial Supply Total
4 SMS
0 - 20 kW
Above 20 kW
SMS Total
5 LS
EHT
HT
LS Total
6 PIU
EHT
HT
PIU Total
7 WPS
Supply at less than 11 kV
Supply at 11 kV and above
WPS Total
8 Street Lighting
9 Agri Pumping Supply
0-20 kW
20-100 kW
Agri Pumping Total
10 Bulk Supply
LT
HT
BS Total
11 TM
0-20 kW
20-100 kW
TM Total
GRAND TOTAL
Note: The projections of the Licensee should be matched with any long term forecasting studies that it undertakes
Projected

C) Projection of Connected Load/Contracted Demand
Actual Actual Actual Estimated
Category 2004-05 2005-06 2006-07 2007-08 2008-09 2009-10 2010-11
1 Domestic
a. Antodaya
b. Others
0 - 45
46 - 150
151 & above
Domestic Total
2 NDNCS
0 - 20 kW
20 - 100 kW
NDNCS Total
3 Commercial Supply
0 - 20 kW
20-100 kW
Above 100 kW
Commercial Supply Total
4 SMS
0 - 20 kW
Above 20 kW
SMS Total
5 LS
EHT
HT
LS Total
6 PIU
EHT
HT
PIU Total
7 WPS
Supply at less than 11 kV
Supply at 11 kV and above
WPS Total
8 Street Lighting
9 Agri Pumping Supply
0-20 kW
20-100 kW
Agri Pumping Total
10 Bulk Supply
LT
HT
BS Total
11 TM
0-20 kW
20-100 kW
TM Total
GRAND TOTAL
Note: The projections of the Licensee should be matched with any long term forecasting studies that it undertakes
Projected

Name of Distribution Licensee
Revenue & Capital Subsidies Form No: F2
Particulars PY PY CY
In Rs Crores FY (n-2) FY (n-1) FY (n) FY (n+1) FY (n+2) FY (n+3)
A Revenue Subsidies And Grants
1
2
3
Sub-Total
B Capital Subsidies And Grants
1
2
3
Sub-Total
Total
Actual Flow of Funds PY PY CY
In Rs Crores FY (n-2) FY (n-1) FY (n) FY (n+1) FY (n+2) FY (n+3)
1 Balance Subsidy for Previous years Receivable
2 Subsidy Due for the year
3 Total Subsidy Receivable
4 Cash
5 ED Adjustment/Retained
6 Cess Adjustment/Retained
7 Central Assistance Adjustment
8 Adjustment of Penal intt on ED & Cess
9 Adjustment of Past Loans
10 Recievd as Adjustment from State Govt.
11 Adjustment of Interst on Loan
12 Total Subsidy Received
13 Balance Subsidy Receivable: (3)-(12)
Control Period
Control Period

Income from investments and Non-Tariff Income Form No: F3
Particulars PY PY CY
Figure in Rs Crore FY (n-2) FY (n-1) FY (n) FY (n+1) FY (n+2) FY (n+3)
A Income from Investment, Fixed & Call Deposits
1 Interest Income from Investments
2 Interest on fixed deposits
3 Interest from Banks other than Fixed Deposits
4 Interest on (any other items)
Sub-Total
B Non Tariff Income
1 Interest on loans and Advances to staff
2 Interest on Loans and Advances to Licensee
3 Interest on Loans and Advances to Lessors
4 Interest on Advances to Suppliers / Contractors
5 Income from Trading (other than Electricity)
6 Gain on Sale of Fixed Assets
7 Income/Fee/Collection against staff welfare activities
8 Miscellaneous receipts
9 Delayed payment charges from consumers
10 Meter Rent
11 Recovery from theft of energy
12 Wheeling charges
13 PLVC Charges
14 Misc. charges from consumers
15 Surcharge on Non Payment of subsidy by Govt
16 Surcharge for LVSS
17 Income from Other Business
18 Contract Demand Violation Charges
19 Harmonic Injection Violation Penalty
20 Disturbing Load Penalty
21 Less: Rebate for supply at higher voltage
Sub-Total
Total
Note: A report on Harmonics should also be enclosed
Control Period

Name of Distribution Licensee
Summary of Power Purchase from Own Stations and Other Sources Form No: F4
Sl
NoSource
Plant
Capacity
(MW)
HPSEB's
Share in %
HPSEB's
Share in
MW
Energy
Units (MU)Rs Crs. Paise/Unit
Energy
Units (MU)Rs Crs. Paise/Unit
Energy Units
(MU)Rs Crs. Paise/Unit
Energy
Units (MU)Rs Crs. Paise/Unit
Energy
Units (MU)Rs Crs. Paise/Unit
Energy
Units (MU)Rs Crs. Paise/Unit
HP Own Stations
Above 5 MW
1 Bhaba
2 Bassi
3 Giri
4 Andhra
5 Ghanvi
6 Baner
7 Gaj
8 Binwa
9 Thirot
10 Gumma
11 Holi
12 Larji
13 Khauli
Sub-Total
Mini Micros (5 MW & below)
1 Nogli
2 Rong-Tong
3 Sal-II
4 Chaba
5 Rukti
6 Chamba
7 Killar
8 Chakki-Nalla
9 Grola
Sub-Total
Total
Auxiliary Consumption
Generation Availability (Net of
Auxiliary Consumption)
POWER PURCHASE DETAILS
Bhakra Beas Management Board
Old HP
New HP
Dehar
NHPC
FY (n-2) FY (n+3)FY (n+1)FY (n-1) FY (n) FY (n+2)

Chamera - I State of Region
Share 2.90% (15.66 MW)
Chm II State of Region Share
2.75% (8.25 MW)
Chm II Unallocated 15% during
Winter
Salal
Uri (13.008 MW)
Tanakpur (3.14 MW)
Dhauli Ganga(7.7 MW)
PSEB
Shanan Share 45MU
Shanan Share, At Cost(1 MW)
Banking
Bilateral Purchase
UPSEB
UPSEB (Yamuna Share)
NTPC
Rihand-I (35 MW)
Rihand-II (16.5 MW)
Unchahar -I(7)
Unchahar -II(12)
Anta -I(14.2)
Auria-I(22.36)
Dadri(Gas)-(25.39)
Dadri Thermal
Singrauli
Narora
Private Sector
Baspa-II (300 MW)(Purchase)
Titang (0.9 MW)
Rasket (0.8MW)
Majhi (4.5 MW)
Dehar (5 MW)
Bada Garon (3.0 MW)
Aleo (3.0 MW)
Nathpa Jhakri (1500 MW)
Purchase 22%
State of Region 2.47%
Khara
Uttaranchal
Any Other/IPPs
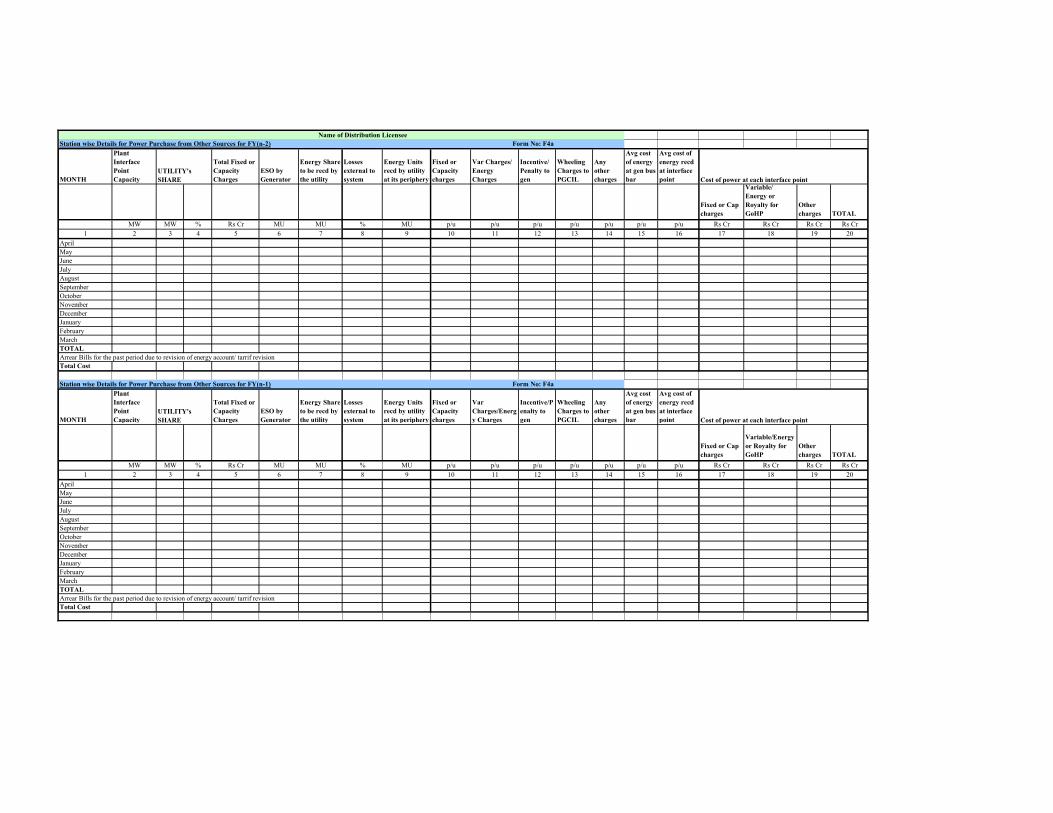
Name of Distribution Licensee
Station wise Details for Power Purchase from Other Sources for FY(n-2) Form No: F4a
MONTH
Plant
Interface
Point
Capacity
Total Fixed or
Capacity
Charges
ESO by
Generator
Energy Share
to be recd by
the utility
Losses
external to
system
Energy Units
recd by utility
at its periphery
Fixed or
Capacity
charges
Var Charges/
Energy
Charges
Incentive/
Penalty to
gen
Wheeling
Charges to
PGCIL
Any
other
charges
Avg cost
of energy
at gen bus
bar
Avg cost of
energy recd
at interface
point
Fixed or Cap
charges
Variable/
Energy or
Royalty for
GoHP
Other
charges TOTAL
MW MW % Rs Cr MU MU % MU p/u p/u p/u p/u p/u p/u p/u Rs Cr Rs Cr Rs Cr Rs Cr
1 2 3 4 5 6 7 8 9 10 11 12 13 14 15 16 17 18 19 20
April
May
June
July
August
September
October
November
December
January
February
March
TOTAL
Arrear Bills for the past period due to revision of energy account/ tarrif revision
Total Cost
Station wise Details for Power Purchase from Other Sources for FY(n-1) Form No: F4a
MONTH
Plant
Interface
Point
Capacity
Total Fixed or
Capacity
Charges
ESO by
Generator
Energy Share
to be recd by
the utility
Losses
external to
system
Energy Units
recd by utility
at its periphery
Fixed or
Capacity
charges
Var
Charges/Energ
y Charges
Incentive/P
enalty to
gen
Wheeling
Charges to
PGCIL
Any
other
charges
Avg cost
of energy
at gen bus
bar
Avg cost of
energy recd
at interface
point
Fixed or Cap
charges
Variable/Energy
or Royalty for
GoHP
Other
charges TOTAL
MW MW % Rs Cr MU MU % MU p/u p/u p/u p/u p/u p/u p/u Rs Cr Rs Cr Rs Cr Rs Cr
1 2 3 4 5 6 7 8 9 10 11 12 13 14 15 16 17 18 19 20
April
May
June
July
August
September
October
November
December
January
February
March
TOTAL
Arrear Bills for the past period due to revision of energy account/ tarrif revision
Total Cost
UTILITY's
SHARE Cost of power at each interface point
UTILITY's
SHARE Cost of power at each interface point

Station wise Details for Power Purchase from Other Sources for FY(n)
MONTH
Plant
Interface
Point
Capacity
Total Fixed or
Capacity
Charges
ESO by
Generator
Energy Share
to be recd by
the utility
Losses
external to
system
Energy Units
recd by utility
at its periphery
Fixed or
Capacity
charges
Var
Charges/Energ
y Charges
Incentive/P
enalty to
gen
Wheeling
Charges to
PGCIL
Any
other
charges
Avg cost
of energy
at gen bus
bar
Avg cost of
energy recd
at interface
point
Fixed or Cap
charges
Variable/Energy
or Royalty for
GoHP
Other
charges TOTAL
MW MW % Rs Cr MU MU % MU p/u p/u p/u p/u p/u p/u p/u Rs Cr Rs Cr Rs Cr Rs Cr
1 2 3 4 5 6 7 8 9 10 11 12 13 14 15 16 17 18 19 20
April
May
June
July
August
September
October
November
December
January
February
March
TOTAL
Arrear Bills for the past period due to revision of energy account/ tarrif revision
Total Cost
Station wise Details for Power Purchase from Other Sources for FY(n+1)
MONTH
Plant
Interface
Point
Capacity
Total Fixed or
Capacity
Charges
ESO by
Generator
Energy Share
to be recd by
the utility
Losses
external to
system
Energy Units
recd by utility
at its periphery
Fixed or
Capacity
charges
Var
Charges/Energ
y Charges
Incentive/P
enalty to
gen
Wheeling
Charges to
PGCIL
Any
other
charges
Avg cost
of energy
at gen bus
bar
Avg cost of
energy recd
at interface
point
Fixed or Cap
charges
Variable/Energy
or Royalty for
GoHP
Other
charges TOTAL
MW MW % Rs Cr MU MU % MU p/u p/u p/u p/u p/u p/u p/u Rs Cr Rs Cr Rs Cr Rs Cr
1 2 3 4 5 6 7 8 9 10 11 12 13 14 15 16 17 18 19 20
April
May
June
July
August
September
October
November
December
January
February
March
TOTAL
Arrear Bills for the past period due to revision of energy account/ tarrif revision
Total Cost
UTILITY's
SHARE Cost of power at each interface point
UTILITY's
SHARE Cost of power at each interface point

Station wise Details for Power Purchase from Other Sources for FY(n+2)
MONTH
Plant
Interface
Point
Capacity
Total Fixed or
Capacity
Charges
ESO by
Generator
Energy Share
to be recd by
the utility
Losses
external to
system
Energy Units
recd by utility
at its periphery
Fixed or
Capacity
charges
Var
Charges/Energ
y Charges
Incentive/P
enalty to
gen
Wheeling
Charges to
PGCIL
Any
other
charges
Avg cost
of energy
at gen bus
bar
Avg cost of
energy recd
at interface
point
Fixed or Cap
charges
Variable/Energy
or Royalty for
GoHP
Other
charges TOTAL
MW MW % Rs Cr MU MU % MU p/u p/u p/u p/u p/u p/u p/u Rs Cr Rs Cr Rs Cr Rs Cr
1 2 3 4 5 6 7 8 9 10 11 12 13 14 15 16 17 18 19 20
April
May
June
July
August
September
October
November
December
January
February
March
TOTAL
Arrear Bills for the past period due to revision of energy account/ tarrif revision
Total Cost
Station wise Details for Power Purchase from Other Sources for (n+3)
MONTH
Plant
Interface
Point
Capacity
Total Fixed or
Capacity
Charges
ESO by
Generator
Energy Share
to be recd by
the utility
Losses
external to
system
Energy Units
recd by utility
at its periphery
Fixed or
Capacity
charges
Var
Charges/Energ
y Charges
Incentive/P
enalty to
gen
Wheeling
Charges to
PGCIL
Any
other
charges
Avg cost
of energy
at gen bus
bar
Avg cost of
energy recd
at interface
point
Fixed or Cap
charges
Variable/Energy
or Royalty for
GoHP
Other
charges TOTAL
MW MW % Rs Cr MU MU % MU p/u p/u p/u p/u p/u p/u p/u Rs Cr Rs Cr Rs Cr Rs Cr
1 2 3 4 5 6 7 8 9 10 11 12 13 14 15 16 17 18 19 20
April
May
June
July
August
September
October
November
December
January
February
March
TOTAL
Arrear Bills for the past period due to revision of energy account/ tarrif revision
Total Cost
UTILITY's
SHARE Cost of power at each interface point
UTILITY's
SHARE Cost of power at each interface point
Name of Distribution Licensee
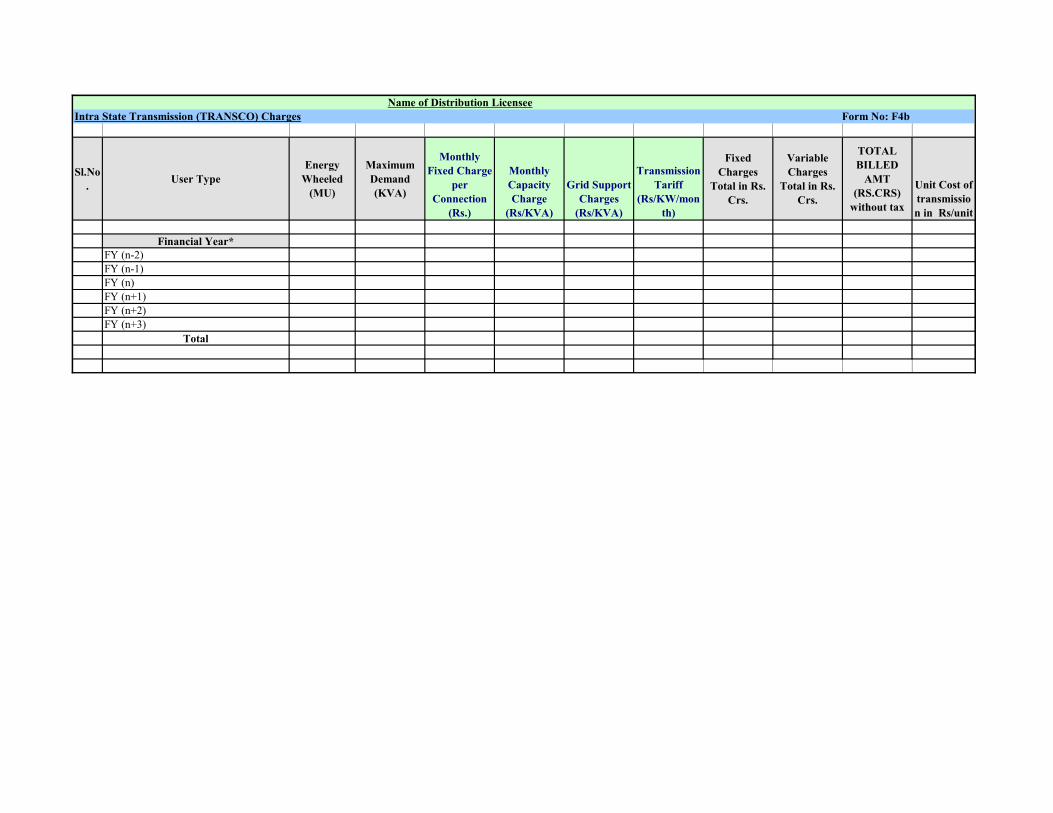
Intra State Transmission (TRANSCO) Charges Form No: F4b
Sl.No
.User Type
Energy
Wheeled
(MU)
Maximum
Demand
(KVA)
Monthly
Fixed Charge
per
Connection
(Rs.)
Monthly
Capacity
Charge
(Rs/KVA)
Grid Support
Charges
(Rs/KVA)
Transmission
Tariff
(Rs/KW/mon
th)
Fixed
Charges
Total in Rs.
Crs.
Variable
Charges
Total in Rs.
Crs.
TOTAL
BILLED
AMT
(RS.CRS)
without tax
Unit Cost of
transmissio
n in Rs/unit
Financial Year*
FY (n-2)
FY (n-1)
FY (n)
FY (n+1)
FY (n+2)
FY (n+3)
Total

Name of Distribution Licensee
Repair & Maintenance Expenditure Form No: F5
Sl.No. Particulars PY PY CY
Figure in Rs Crore FY (n-2) FY (n-1) FY (n) FY (n+1) FY (n+2) FY (n+3)
1 Plant and Machinery
2 Building
3 Civil Works
4 Hydraulic Works
5 Lines, Cables Net Works etc.
6 Vehicles
7 Furniture and Fixtures
8 Office Equipments
9 Spare Inventory for maintaining Transformer redundancy
10 Sub station maintenance by private agencies
11 Any other items (Capitalisation)
Total
Control Period

Name of Distribution Licensee
Employee Cost and Provisions Form No: F6
Particulars PY PY CY
FY (n-2) FY (n-1) FY (n) FY (n+1) FY (n+2) FY (n+3)
In Rs Cr
A Employee's Cost
1 Salaries
2 Dearness Allowance
3 Other Allowances & Relief
a Allowance details
b
c
d
4 Medical Expenses Reimbursement
5 Leave Travel Assistance
6 Fee & Honorarium
7Incentives/Awards Including That In Partnership Project (Specify
Items)
8 Earned Leave Encashment
9 Tution Fee Re-Imbursement
10 Leave Salary Contribution
11 Payment Under Workman'S Compensation And Gratuity
12 Subsidised Electricity To Employees
13 Staff Welfare Expenses
B Apprentice And Other Training Expenses
C Payment/Contribution To PF Staff Pension And Gratuity
1 Terminal Benefits
a) Provident Fund Contribution
b) Provision for PF Fund - Invested
Not Invested
c) Pension Payments
d) Gratuity Payment
e) Leave Encashment Payment
2 Any Other Items
Total C
D Bonus/Exgratia To Employees
E Grand Total
F Chargeable To Construction Works
Balance Item 'F' Apropriate For (E)-(F)
Relevant Indices Of Wages Increase (As At The Beginning & End Of The Year)
WPI
CPI
D.A Rate
Control Period
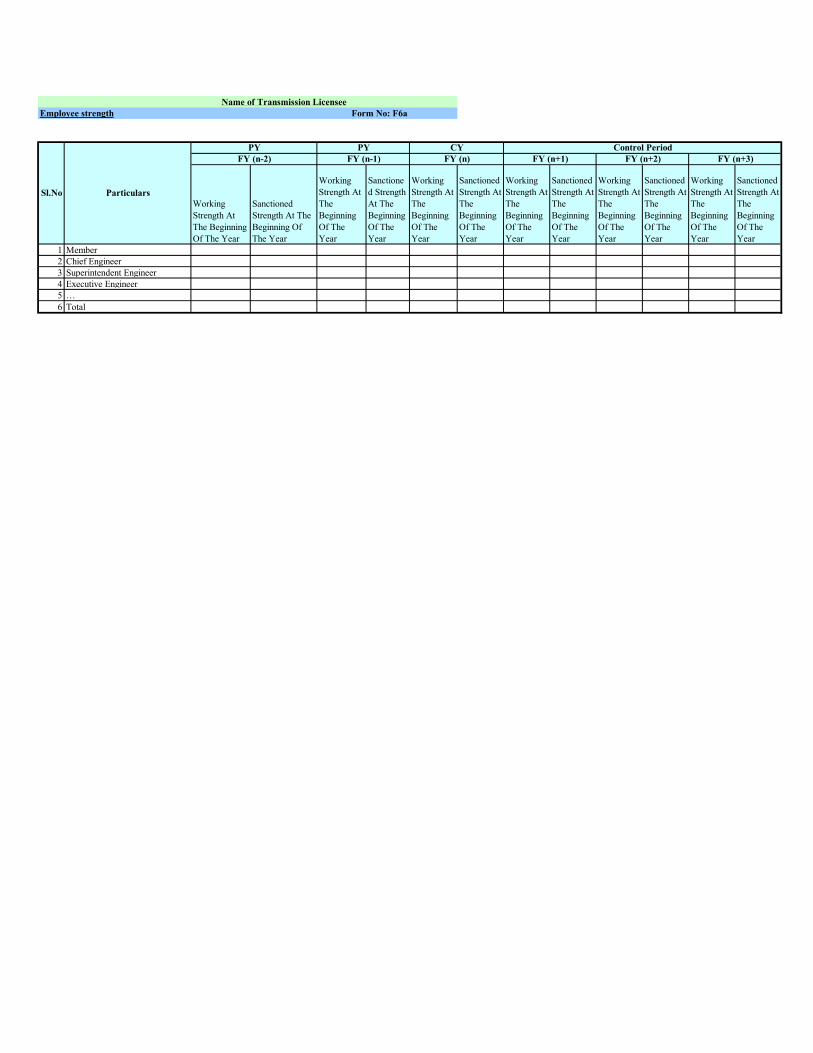
Name of Transmission Licensee
Employee strength Form No: F6a
Working
Strength At
The Beginning
Of The Year
Sanctioned
Strength At The
Beginning Of
The Year
Working
Strength At
The
Beginning
Of The
Year
Sanctione
d Strength
At The
Beginning
Of The
Year
Working
Strength At
The
Beginning
Of The
Year
Sanctioned
Strength At
The
Beginning
Of The
Year
Working
Strength At
The
Beginning
Of The
Year
Sanctioned
Strength At
The
Beginning
Of The
Year
Working
Strength At
The
Beginning
Of The
Year
Sanctioned
Strength At
The
Beginning
Of The
Year
Working
Strength At
The
Beginning
Of The
Year
Sanctioned
Strength At
The
Beginning
Of The
Year
1 Member
2 Chief Engineer
3 Superintendent Engineer
4 Executive Engineer
5 …
6 Total
Sl.No Particulars
PY PY
FY (n-2) FY (n-1)
CY Control Period
FY (n) FY (n+1) FY (n+2) FY (n+3)

Adminstration & General Expenses Form No: F7
In Rs Crores
S.No. Particulars PY PY CY
FY (n-2) FY (n-1) FY (n) FY (n+1) FY (n+2) FY (n+3)
A) Administration Expenses
1 Rent rates and taxes (Other than all taxes on income and profit)
2 Insurance of employees, assets, legal liability
3 Revenue Stamp Expenses Account
4 Telephone,Postage,Telegram, Internet Charges
5 Incentive & Award To Employees/Outsiders
6 Consultancy Charges
7 Technical Fees
8 Other Professional Charges
9 Conveyance And Travel (vehicle hiring, running)
10 HPERC License fee
11 Plant And Machinery
12 Security / Service Charges Paid To Outside Agencies
13 Regulatory Expenses
14 Ombudsman Expenses
15 Consumer Forum
Sub-Total of Administrative Expenses
B) Other Charges
1 Fee And Subscriptions Books And Periodicals
2 Printing And Stationery
3 Advertisement Expenses (Other Than Purchase Related) Exhibition & Demo.
4 Contributions/Donations To Outside Institute / Association
5 Electricity Charges To Offices
6 Water Charges
7 Any Study - As per requirements
8 Miscellaneous Expenses
9 Public Interraction Program
10 Any Other expenses
Sub-Total of other charges
C) Legal Charges
D) Auditor'S Fee
E) Frieght - Material Related Expenses
F) Departmental Charges
G) Total Charges
H) Total Charges Chargeable To Capital Works
I) Total Charges Chargeable to Revenue Expenses
Control Period

Fixed Assets and Provision for Depreciation
In Rs Crores
Sl.No Particulars
At
Beginning of
Year
Addition
During
Year
Adjustments &
Deduction
At End of
Year
Rate of
Depreciation
At
Beginning of
Year
Addition
During
Year
Adjustments &
Deduction
At End of
Year
At
Beginning of
Year
At End of
Year
1 Land & Land rights
2 Building and Civil Works
Others 1
Others 2
Others 3
Sub-Total
3 Line Cable Networks etc.
Towers, ploes, fixtures, overhead conductors, devices
Transformers
Switchgears, Control gear & Protection
Batteries
Others
4 Communication equipment
5 Meters
6 Vehicles
7 Furniture & fixtures
8 Office Equipments
9 Assets taken over & pending final valuation
10 Any other items
Total (1 to 10)
Note
1 Provide for fair value of assets if assessed
FY (n-2)
Gross Fixed Assets Provision For Depreciation Net Fixed Assets

Fixed Assets and Provision for Depreciation
In Rs Crores
Sl.No Particulars
1 Land & Land rights
2 Building and Civil Works
Others 1
Others 2
Others 3
Sub-Total
3 Line Cable Networks etc.
Towers, ploes, fixtures, overhead conductors, devices
Transformers
Switchgears, Control gear & Protection
Batteries
Others
4 Communication equipment
5 Meters
6 Vehicles
7 Furniture & fixtures
8 Office Equipments
9 Assets taken over & pending final valuation
10 Any other items
Total (1 to 10)
Note
1 Provide for fair value of assets if assessed
Name of Distribution Licensee
Form No: F8
At Beginning
of Year
Addition
During Year
Adjustments &
Deduction
At End of
Year
Rate of
Depreciation
At
Beginning of
Year
Addition
During
Year
Adjustments &
Deduction
At End of
Year
At
Beginning of
Year
At End of
Year
FY (n-1)
Gross Fixed Assets Provision For Depreciation Net Fixed Assets

Fixed Assets and Provision for Depreciation
In Rs Crores
Sl.No Particulars
1 Land & Land rights
2 Building and Civil Works
Others 1
Others 2
Others 3
Sub-Total
3 Line Cable Networks etc.
Towers, ploes, fixtures, overhead conductors, devices
Transformers
Switchgears, Control gear & Protection
Batteries
Others
4 Communication equipment
5 Meters
6 Vehicles
7 Furniture & fixtures
8 Office Equipments
9 Assets taken over & pending final valuation
10 Any other items
Total (1 to 10)
Note
1 Provide for fair value of assets if assessed
Form No: F8
At
Beginning of
Year
Addition
During
Year
Adjustments &
Deduction
At End of
Year
Rate of
Depreciation
At
Beginning of
Year
Addition
During
Year
Adjustments &
Deduction
At End of
Year
At
Beginning of
Year
At End of
Year
FY (n)
Gross Fixed Assets Provision For Depreciation Net Fixed Assets

Fixed Assets and Provision for Depreciation
In Rs Crores
Sl.No Particulars
1 Land & Land rights
2 Building and Civil Works
Others 1
Others 2
Others 3
Sub-Total
3 Line Cable Networks etc.
Towers, ploes, fixtures, overhead conductors, devices
Transformers
Switchgears, Control gear & Protection
Batteries
Others
4 Communication equipment
5 Meters
6 Vehicles
7 Furniture & fixtures
8 Office Equipments
9 Assets taken over & pending final valuation
10 Any other items
Total (1 to 10)
Note
1 Provide for fair value of assets if assessed
Form No: F8
At
Beginning of
Year
Addition
During
Year
Adjustments &
Deduction
At End of
Year
Rate of
Depreciation
At
Beginning of
Year
Addition
During
Year
Adjustments &
Deduction
At End of
Year
At
Beginning of
Year
At End of
Year
FY (n+1)
Gross Fixed Assets Provision For Depreciation Net Fixed Assets

Fixed Assets and Provision for Depreciation
In Rs Crores
Sl.No Particulars
1 Land & Land rights
2 Building and Civil Works
Others 1
Others 2
Others 3
Sub-Total
3 Line Cable Networks etc.
Towers, ploes, fixtures, overhead conductors, devices
Transformers
Switchgears, Control gear & Protection
Batteries
Others
4 Communication equipment
5 Meters
6 Vehicles
7 Furniture & fixtures
8 Office Equipments
9 Assets taken over & pending final valuation
10 Any other items
Total (1 to 10)
Note
1 Provide for fair value of assets if assessed
At
Beginning of
Year
Addition
During
Year
Adjustments &
Deduction
At End of
Year
Rate of
Depreciation
At
Beginning of
Year
Addition
During
Year
Adjustments &
Deduction
At End of
Year
At
Beginning of
Year
At End of
Year
FY (n+2)
Gross Fixed Assets Provision For Depreciation Net Fixed Assets

Fixed Assets and Provision for Depreciation
In Rs Crores
Sl.No Particulars
1 Land & Land rights
2 Building and Civil Works
Others 1
Others 2
Others 3
Sub-Total
3 Line Cable Networks etc.
Towers, ploes, fixtures, overhead conductors, devices
Transformers
Switchgears, Control gear & Protection
Batteries
Others
4 Communication equipment
5 Meters
6 Vehicles
7 Furniture & fixtures
8 Office Equipments
9 Assets taken over & pending final valuation
10 Any other items
Total (1 to 10)
Note
1 Provide for fair value of assets if assessed
At
Beginning of
Year
Addition
During
Year
Adjustments &
Deduction
At End of
Year
Rate of
Depreciation
At
Beginning of
Year
Addition
During
Year
Adjustments &
Deduction
At End of
Year
At
Beginning of
Year
At End of
Year
FY (n+3)
Provision For Depreciation Net Fixed AssetsGross Fixed Assets

Interest & Finance Charges Form No: F9
Particulars PY PY CY
In Rs Crores FY (n-2) FY (n-1) FY (n) FY (n+1) FY (n+2) FY (n+3)
A I
Interest and Finance Charges on Long Term Loans / Credits from the
FIs/banks/organisations approved by the State Government
1 LIC
2 REC
3 PFC
4 Bonds
5 Bank/FIIs
6 APDRP
7 Any Other
Total of I
II Interest on Working Capital Loans Or Short Term Loans
Total of A : I + II
B Other Interest & Finance Charges
1 Cost of raising Finance & Bank Charges etc.
2 Interest on Security Deposit
3 Penal Interest Charges
4 Lease Rentals
5 Penalty charges for delayed payment for power purchase
Total of B
C Grand Total Of Interest & Finance Charges: A + B
D
Less: Interest & Finance Charges Chargeble to Capital Account
E
Net Total Of Interest & Finance Charges : For Revenue Account: C-D
Control Period

Name of Distribution Licensee
Domestic loans, bonds and financial leasing Form No: F9a
All figures in Rs. Crore
Sl.
No. Particulars
Amount
received
during the
year
Principal repayment InterestClosing
BalancePrincipal not
overdue
Principal
overdue
Interest
overdue Total Due Paid Due Paid %
Financial Year*
A LONG-TERM
1 LIC
2 REC
3 PFC
4 Bonds
5 Bank
6 APDRP
7 Any Other
8
B SHORT-TERM
Total
*Note:- Loanwise information to be provided for Previous Two Years, Current Year & Ensuing Years
Opening Balance at the beginning of the year
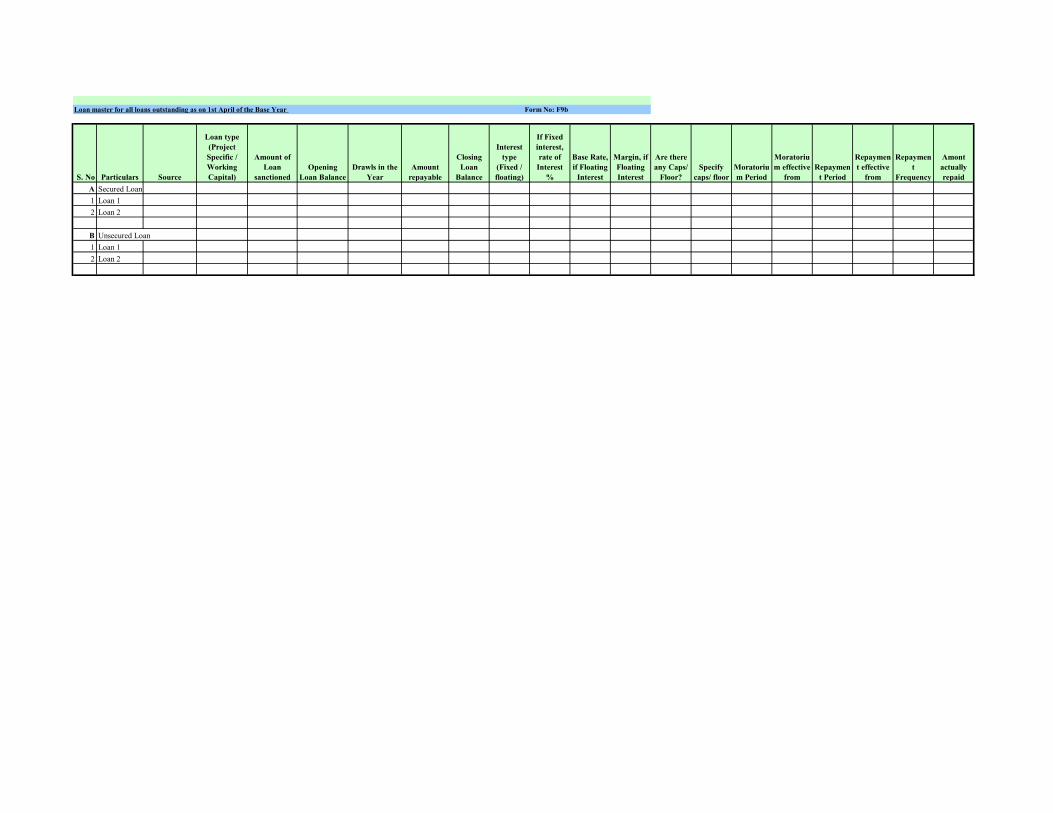
Loan master for all loans outstanding as on 1st April of the Base Year Form No: F9b
S. No Particulars Source
Loan type
(Project
Specific /
Working
Capital)
Amount of
Loan
sanctioned
Opening
Loan Balance
Drawls in the
Year
Amount
repayable
Closing
Loan
Balance
Interest
type
(Fixed /
floating)
If Fixed
interest,
rate of
Interest
%
Base Rate,
if Floating
Interest
Margin, if
Floating
Interest
Are there
any Caps/
Floor?
Specify
caps/ floor
Moratoriu
m Period
Moratoriu
m effective
from
Repaymen
t Period
Repaymen
t effective
from
Repaymen
t
Frequency
Amont
actually
repaid
A Secured Loan
1 Loan 1
2 Loan 2
B Unsecured Loan
1 Loan 1
2 Loan 2

Details of New Loans Form No: 9c
Sl. No. Particulars
Purpose of
the Loan
Loan Amount
(Rs. Crore)
Rate of
Interest
(%)
Moratorium
Period, if
any (no. of
yrs.)
A LONG-TERM
1 LIC
Loan 1
Loan 2
Loan 3
2 REC
Loan 1
Loan 2
Loan 3
3 PFC
Loan 1
Loan 2
Loan 3
4 Bonds
Loan 1
Loan 2
Loan 3
5 Bank
Loan 1
Loan 2
Loan 3
6 APDRP
Loan 1
Loan 2
Loan 3
7 Any Other
8
B SHORT-TERM
Loan 1
Loan 2
Loan 3
Total
Note: Distribution Licensee will require to fill up one sheet for each MYT year.

Name of Distribution Licensee
Details of Expenses Capitalised Form No: F10
All figures in Rs Crores
Sl.No. Particulars PY PY CY
FY (n-2) FY (n-1) FY (n) FY (n+1) FY (n+2) FY (n+3)
1 Interest & Finance charges Capitalised
2 Other expenses capitalised:
a. Employee expenses
b. R&M Expenses
c. A&G Expenses
d. Depreciation
e. Others, if any
Total of 2
Grand Total
Control Period
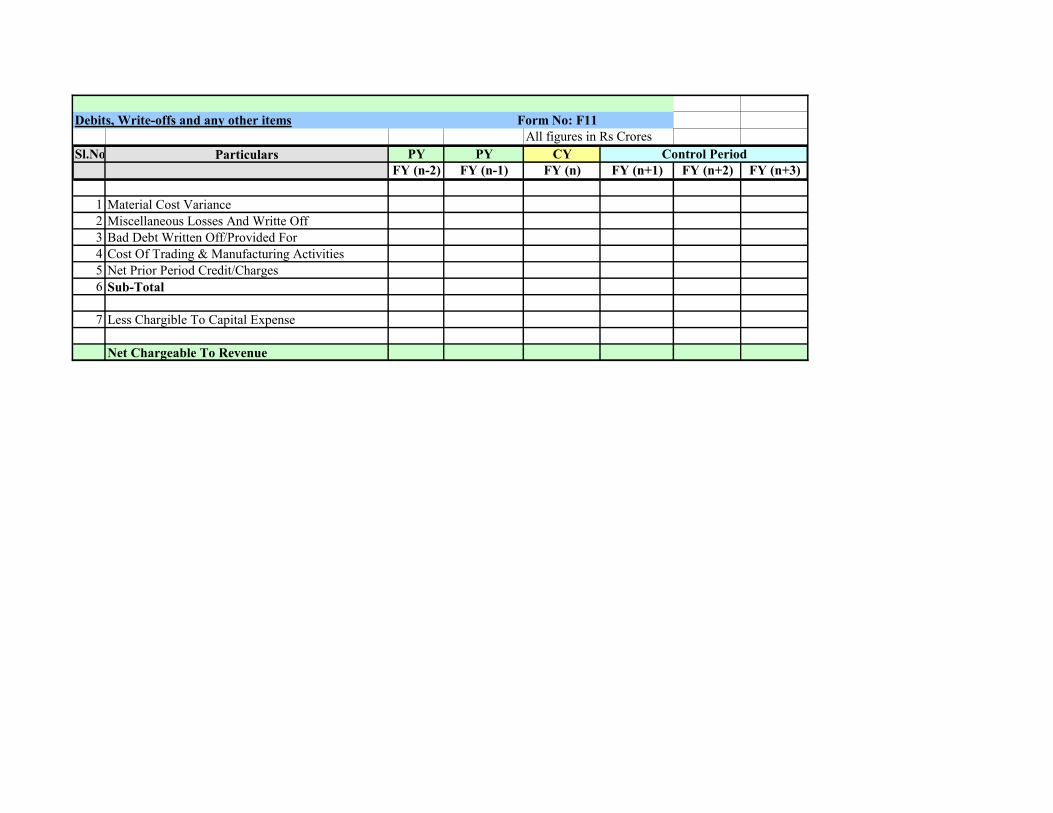
Debits, Write-offs and any other items Form No: F11
All figures in Rs Crores
Sl.No. Particulars PY PY CY
FY (n-2) FY (n-1) FY (n) FY (n+1) FY (n+2) FY (n+3)
1 Material Cost Variance
2 Miscellaneous Losses And Writte Off
3 Bad Debt Written Off/Provided For
4 Cost Of Trading & Manufacturing Activities
5 Net Prior Period Credit/Charges
6 Sub-Total
7 Less Chargible To Capital Expense
Net Chargeable To Revenue
Control Period

Name of Distribution Licensee
Statement of Sundry Debtors and provision for Bad & Doubtful Debts Form No: F12
All figures in Rs Crores
Sl.No. Particulars PY PY CY
FY (n-2) FY (n-1) FY (n) FY (n+1) FY (n+2) FY (n+3)
1 Receivable from customers as at the beginning of the year
2 Revenue billed for the year
3 Collection for the year
Against current dues
Against arrears upto previous year
4 Gross receivable from customers as at the end of the year
5 Receivables against permanently disconnected consumers
6 Receivables(4-5)
7 % of provision
8 Provision for bad and doubtful debts
Note: The details in Sundry debtors in MU should also be enclosed
Control Period

Name of Distribution Licensee
Extraordinary Items Form No: F13
All figures in Rs Crores
Sl.No. Particulars PY PY CY
FY (n-2) FY (n-1) FY (n) FY (n+1) FY (n+2) FY (n+3)
1 Extraordinary Credits(incl.
subsidies aganst losses due to natural disasters
TOTAL CREDITS
2 Extraordinary Debits (incl.
subsidies aganst losses due to natural disasters
TOTAL DEBITS
Grand Total
Control Period
Name of Distribution Licensee
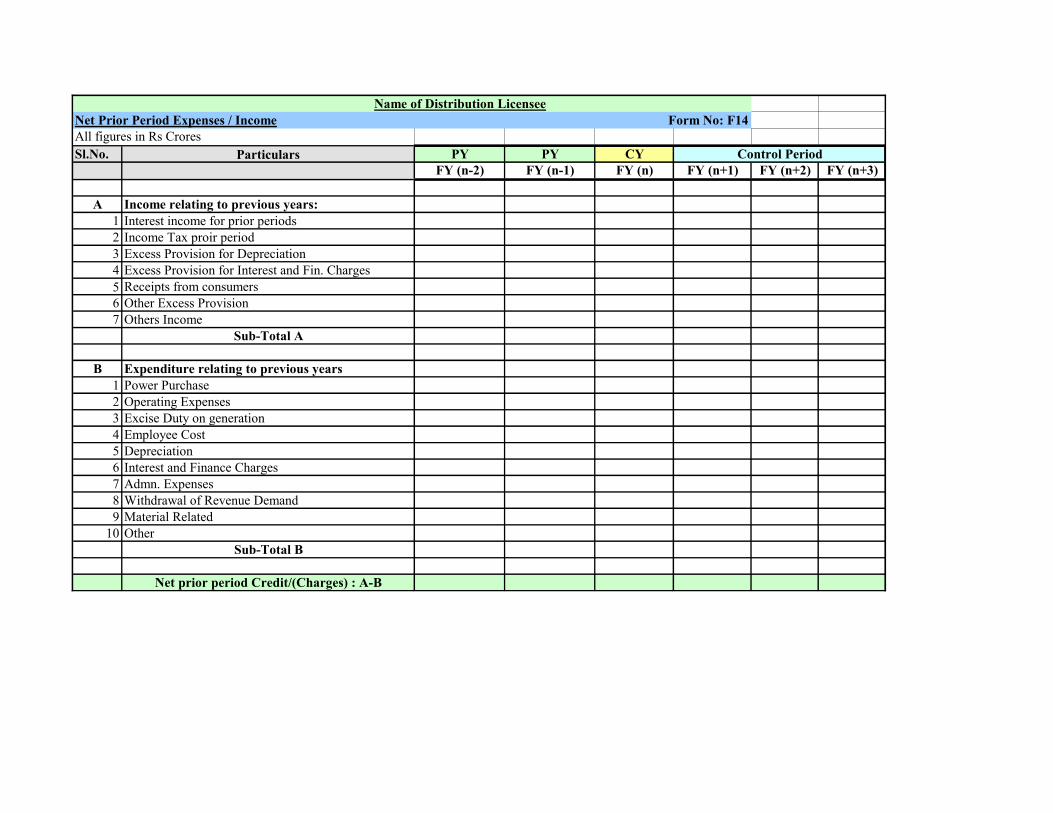
Net Prior Period Expenses / Income Form No: F14
All figures in Rs Crores
Sl.No. Particulars PY PY CY
FY (n-2) FY (n-1) FY (n) FY (n+1) FY (n+2) FY (n+3)
A Income relating to previous years:
1 Interest income for prior periods
2 Income Tax proir period
3 Excess Provision for Depreciation
4 Excess Provision for Interest and Fin. Charges
5 Receipts from consumers
6 Other Excess Provision
7 Others Income
Sub-Total A
B Expenditure relating to previous years
1 Power Purchase
2 Operating Expenses
3 Excise Duty on generation
4 Employee Cost
5 Depreciation
6 Interest and Finance Charges
7 Admn. Expenses
8 Withdrawal of Revenue Demand
9 Material Related
10 Other
Sub-Total B
Net prior period Credit/(Charges) : A-B
Control Period

Name of Distribution Licensee
Contributions, Grants and subsidies towards Cost of Capital Assets Form No: F15
All figures in Rs Crores
Sl No Particulars
Balance at the
beginning of
the year
Additions
during the
Year
Balance at
the end of
the Year
Additions
during the
Year
Balance at
the end of
the Year
Additions
during the
Year
Balance at
the end of the
Year
Additions
during the
Year
Balance at
the end of
the Year
Additions
during the
Year
Balance at
the end of
the Year
1 Consumer Contribution Towards Cost Of Capital Assets HT
2
Consumer Contribution For Good Quality Meters For EHT
Industries
3 Sub-Total
4 Subsidies Towards Cost Of Capital Asset
5 Grant Towards Cost Of Capital Assets
6 Sub-Total
Total
FY (n+3)FY (n-2) FY (n) FY (n+1) FY (n+2)FY (n-1)
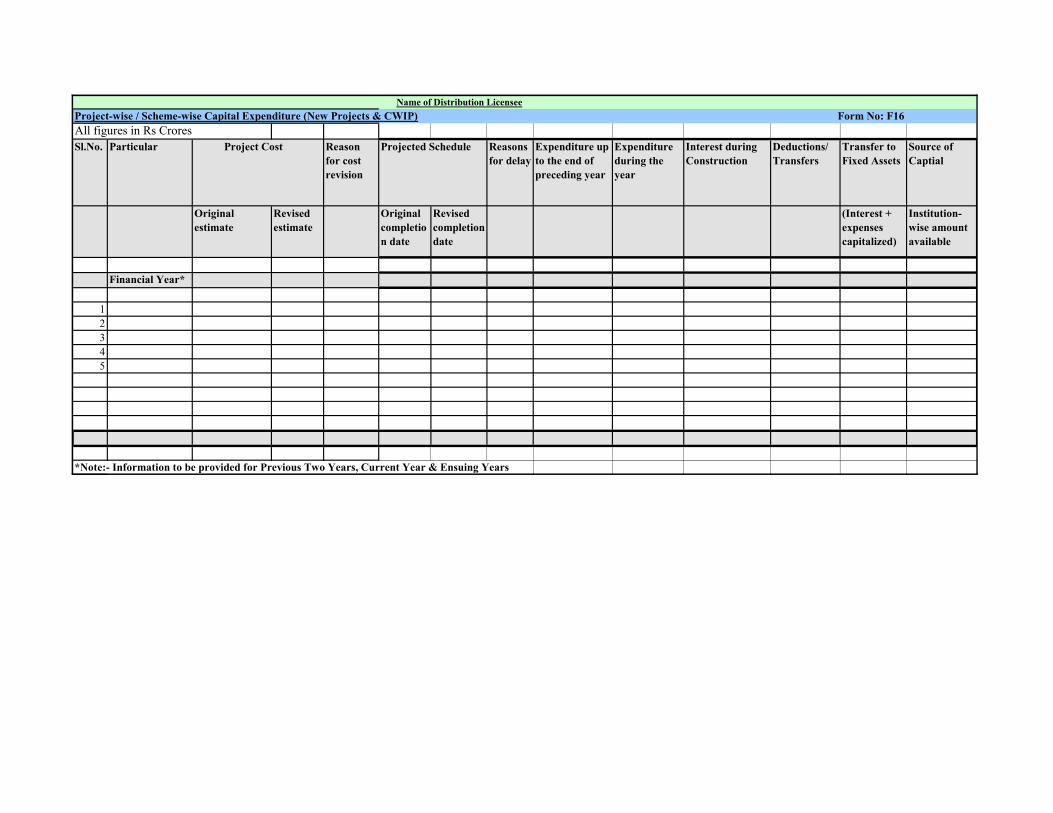
Name of Distribution Licensee
Project-wise / Scheme-wise Capital Expenditure (New Projects & CWIP) Form No: F16
All figures in Rs Crores
Sl.No. Particular Project Cost Reason
for cost
revision
Projected Schedule Reasons
for delay
Expenditure up
to the end of
preceding year
Expenditure
during the
year
Interest during
Construction
Deductions/
Transfers
Transfer to
Fixed Assets
Source of
Captial
Original
estimate
Revised
estimate
Original
completio
n date
Revised
completion
date
(Interest +
expenses
capitalized)
Institution-
wise amount
available
Financial Year*
1
2
3
4
5
*Note:- Information to be provided for Previous Two Years, Current Year & Ensuing Years

Name of Distribution Licensee
Statement of Assets Not in Use Form No: F17
All figures in Rs Crores
Financial Year*
Sl. No. Date of Acquisition/Installation Historical Cost/Cost
of Acquisition
Date of withdrawal
operations
Accumulated Depreciation on
date of withdrawal
Written down value on
date of withdrawal
*Note:- Information to be provided for Previous Two Years, Current Year & Ensuing Years

Investments
Financial Year
Sl. No.Description of
investment
Opening
Balance
Additional
Capitalisation
Investments
realised during the
year
Closing
Balance
Source of
Funding
1
2
3
Total
*Note:- Information to be provided for Previous Two Years, Current Year & Ensuing Years

Form No: F18
(Rs Crores)
Remarks

Name of Distribution Licensee
Investments in Non business related activities Form No: F18a
All figures in Rs Crores
Sl.No
. Description of investment
Balance at the
beginning of the
year
Further
Investments
during the year
Investments
realised during
the year
Balance at the
end of the year Remarks
*Note:- Information to be provided for Previous Two Years, Current Year & Ensuing Years

Name of Distribution Licensee
Current Assets & Liabilities Form No: F19
All figures in Rs Crores
Sl.No. Particulars PY PY CY
FY (n-2) FY (n-1) FY (n) FY (n+1) FY (n+2) FY (n+3)
A Current Assets, Loans and Advances
Sundry Debtors
Inventories
Cash and Bank Balances
Loans and Advances
Others
TOTAL OF 'A'
B Current Liabilities and Provisions
I Current Liabilities
Security Deposits from Consumers
Power Purchase Liabilities
Staff related Liabilities
Liabilities towards Suppliers
Deposits - Elect. Service Connect.
Interest accrued but not due
II Provisions
TOTAL OF 'B' (I+II)
C NET CURRENT ASSETS (= A - B)
Control Period

Working Capital Requirements
(Rs Crores)
PY PY CY
FY (n-2) FY (n-1) FY (n) FY (n+1) FY (n+2) FY (n+3)
1 O&M expenses
a. R&M expenses
b. A&G expenses
c. Employee expenses
d. 1/12th of total
2 Receivables
a. Annual revenues from tariffs and charges
b. Receivables equivalent to 2 months average billing
3 Maintenance Spares (40% of R&M Expense of 1 Month)
4 Less: Consumer Security Deposit
Total Working Capital
Form No: F20
Sl.No. ParticularsControl Period
Multi Year Tariff Petition (FY08 - FY11)

Form No: F21
(Rs Crores)
PY PY CY
FY (n-2) FY (n-1) FY (n) FY (n+1) FY (n+2) FY (n+3)
1 Provision Made/Proposed For The Year
2 As Per Return Filed For The Year
3 As Assessed For The Year
4 Credit/Debit Of Assessment Year(s) (Give Details)
Total
Note: ‘Income Tax Provisions’ details which could not be provided by the Transmission Company at the time of this filing shall be furnished as and when
they become due/ available.
Income Tax Provisions
Sl.No. ParticularsControl Period
Multi Year Tariff Petition (FY08 - FY11)

Name of Distribution Licensee
Form No: T1
Category Energy Charges
Consumer
Service
Charges
Demand Charges
Normal Peak Night Normal PLEC PLVC
(Rs/kWh) Rs/con./mth.
(Rs/
kVA/M) (Rs/kWh) (Rs/kWh)
1 2 3 4 5 6 7 8
Domestic (DS)
(a) Lifeline category (<45 units per month)
(b) Others
0 - 45
46 - 150
151 & above
Pre-paid Meter Consumer
NDNCS
0 - 20 kW
Above 20 kW
CS
0 - 20 kW
20 - 100 kW
Above 100 kW
SMS
0 - 20 kW
20-100 kW
Large Supply (LS)
EHT
HT
Power Intensive Units (PIU)
EHT
HT
Water Pumping Supply (WPS)
LT
HT
EHT
Street Lighting (SL)
Agri Pumping Supply (APS)
0 - 20 kW
20-100 kW
Bulk Supply (BS)
LT
HT
Temporary Supply - TM
0 - 20 kW
20-100 kW
Existing Component of tariff

Form No: T1
Category Energy Charges
Consumer
Service
Charges
Demand Charges
Normal Peak Night Normal PLEC PLVC
(Rs/kWh) Rs/con./mth.
(Rs/
kVA/M) (Rs/kWh) (Rs/kWh)
1 2 3 4 5 6 7 8
Domestic (DS)
(a) Lifeline category (<45 units per month)
(b) Others
0 - 45
46 - 150
151 & above
Pre-paid Meter Consumer
NDNCS
0 - 20 kW
Above 20 kW
CS
0 - 20 kW
20 - 100 kW
Above 100 kW
SMS
0 - 20 kW
20-100 kW
Large Supply (LS)
EHT
HT
Power Intensive Units (PIU)
EHT
HT
Water Pumping Supply (WPS)
LT
HT
EHT
Street Lighting (SL)
Agri Pumping Supply (APS)
0 - 20 kW
20-100 kW
Bulk Supply (BS)
LT
HT
Temporary Supply - TM
0 - 20 kW
20-100 kW
Proposed Component of tariff

Revenue from Current Tariffs in Ensuing Years* Form No: T2
Sl.No. Tariff CategoryNo. of
consumers
Consumption-
Slabwise (MU)
Contract
Demand/Connect
ed Load (KW
/KVA /HP)
Energy Charge
(Rs/KWh)
Monthly Demand
Charge
(Rs/KVA)
Monthly
Customer
Charge per
Connection
(Rs.)
Fixed
Charges
Total in Rs.
Crs.
Variable
Charges
Total in Rs.
Crs.
Consumer
Service Charges
in Rs. Crs.
TOTAL
BILLED
AMT
(RS.CRS)
Existing
Realization
Rate (Rs/u)
Cost of
Supply in
Rs/unit
Existing Cross
Subsidy
1 Domestic
a. Antodaya
b. Others
0 - 45
46 - 150
151 & above
Domestic Total
2 NDNCS
0 - 20 kW
20 - 100 kW
NDNCS Total
3 Commercial Supply
0 - 20 kW
20-100 kW
Above 100 kW
Commercial Supply Total
4 SMS
0 - 20 kW
Above 20 kW
SMS Total
5 LS
EHT
HT
LS Total
6 PIU
EHT
HT
PIU Total
7 WPS
Supply at less than 11 kV
Supply at 11 kV and above
WPS Total
8 Street Lighting
9 Agri Pumping Supply
0-20 kW
20-100 kW
Agri Pumping Total
10 Bulk Supply
LT
HT
BS Total
11 TM
0-20 kW
20-100 kW
TM Total
GRAND TOTAL
*Note: Licensee is required to fill up one sheet for each MYT year.
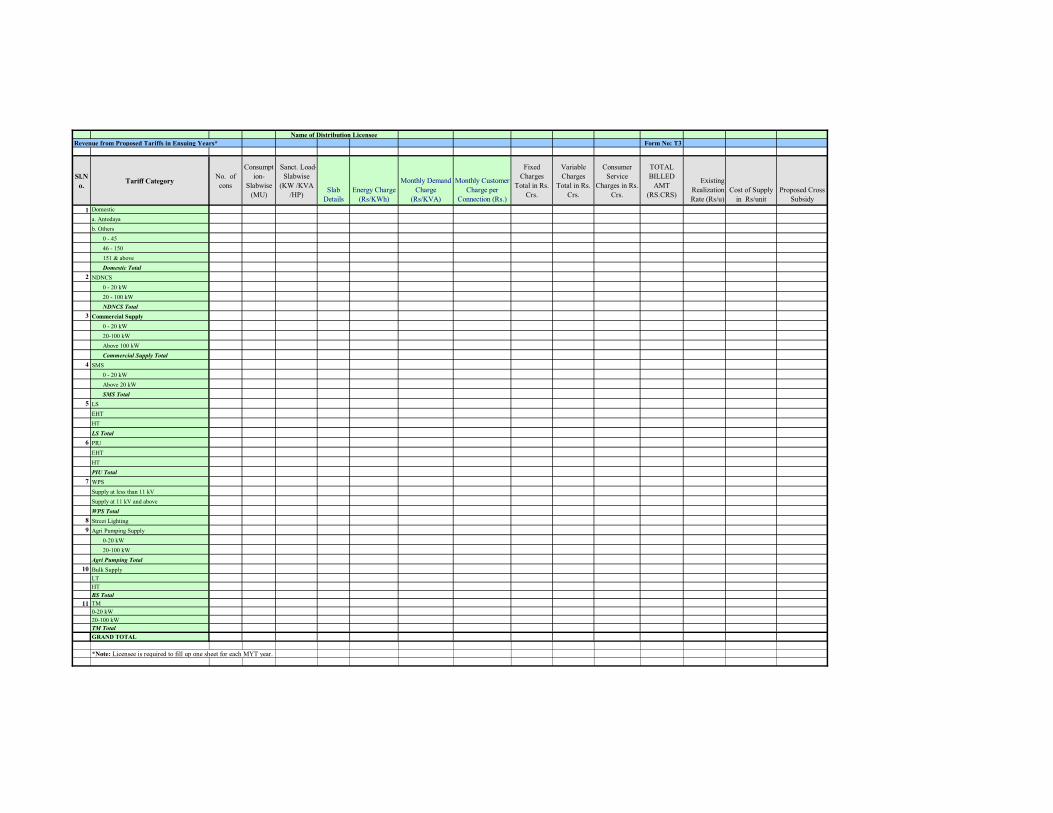
Name of Distribution Licensee
Revenue from Proposed Tariffs in Ensuing Years* Form No: T3
Sl.N
o.Tariff Category
No. of
cons
Consumpt
ion-
Slabwise
(MU)
Sanct. Load-
Slabwise
(KW /KVA
/HP)Slab
Details
Energy Charge
(Rs/KWh)
Monthly Demand
Charge
(Rs/KVA)
Monthly Customer
Charge per
Connection (Rs.)
Fixed
Charges
Total in Rs.
Crs.
Variable
Charges
Total in Rs.
Crs.
Consumer
Service
Charges in Rs.
Crs.
TOTAL
BILLED
AMT
(RS.CRS)
Existing
Realization
Rate (Rs/u)
Cost of Supply
in Rs/unit
Proposed Cross
Subsidy
1 Domestic
a. Antodaya
b. Others
0 - 45
46 - 150
151 & above
Domestic Total
2 NDNCS
0 - 20 kW
20 - 100 kW
NDNCS Total
3 Commercial Supply
0 - 20 kW
20-100 kW
Above 100 kW
Commercial Supply Total
4 SMS
0 - 20 kW
Above 20 kW
SMS Total
5 LS
EHT
HT
LS Total
6 PIU
EHT
HT
PIU Total
7 WPS
Supply at less than 11 kV
Supply at 11 kV and above
WPS Total
8 Street Lighting
9 Agri Pumping Supply
0-20 kW
20-100 kW
Agri Pumping Total
10 Bulk Supply
LT
HT
BS Total
11 TM
0-20 kW
20-100 kW
TM Total
GRAND TOTAL
*Note: Licensee is required to fill up one sheet for each MYT year.
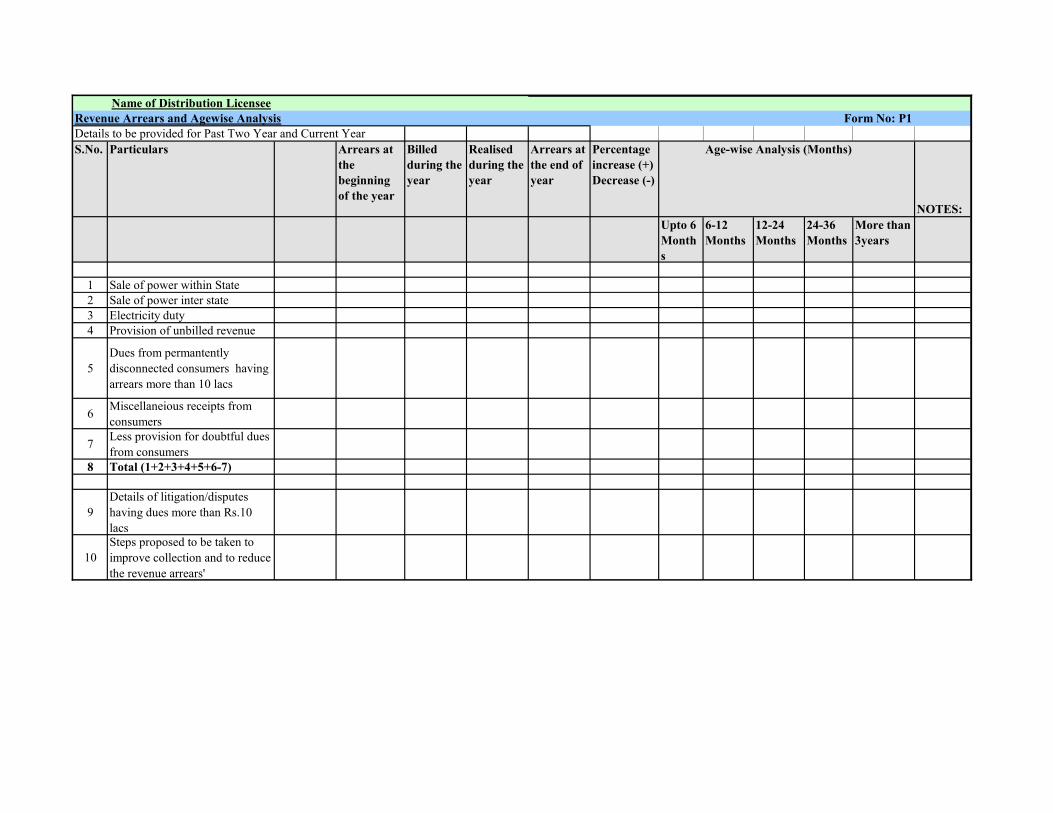
Name of Distribution Licensee
Revenue Arrears and Agewise Analysis Form No: P1
Details to be provided for Past Two Year and Current Year
S.No. Particulars Arrears at
the
beginning
of the year
Billed
during the
year
Realised
during the
year
Arrears at
the end of
year
Percentage
increase (+)
Decrease (-)
Age-wise Analysis (Months)
NOTES:
Upto 6
Month
s
6-12
Months
12-24
Months
24-36
Months
More than
3years
1 Sale of power within State
2 Sale of power inter state
3 Electricity duty
4 Provision of unbilled revenue
5
Dues from permantently
disconnected consumers having
arrears more than 10 lacs
6Miscellaneious receipts from
consumers
7Less provision for doubtful dues
from consumers
8 Total (1+2+3+4+5+6-7)
9
Details of litigation/disputes
having dues more than Rs.10
lacs
10
Steps proposed to be taken to
improve collection and to reduce
the revenue arrears'

Name of Distribution Licensee
Revenue Arrears of Government/ Local Bodies and Agewise Analysis Form No: P1
Details to be provided for Past Two Year and Current Year
S.No. Particulars Arrears at
the
beginning
of the year
Billed
during the
year
Realised
during the
year
Arrears at
the end of
year
Percentage
increase (+)
Decrease (-)
Age-wise Analysis (Months)
NOTES:
In Rs Crores
Upto 6
Months
6-12
Months
12-24
Months
24-36
Months
More than
3years
1 Sale of power to the Government deparments
2 Electricity duty
3 Provision of unbilled revenue
4Dues from permantently disconnected
consumers having arrears more than 10 lacs
5Dues from permantently disconnected
consumers having arrears less than 10 lacs
6 Miscellaneious receipts from Govt.
7 Less provision for doubtful dues from Govt.
8 Total (1+2+3+4+5+6-7)
9Details of litigation/disputes having dues more
than Rs.10 lacs
10Steps proposed to be taken to improve
collection and to reduce the revenue arrears'
Note: Formats should be separately provided for
Government and Local Bodies

Name of Distribution Licensee
T&D Losses in LT and HT system Form No: P2
All Figures in MU
Particulars PY PY CY Remarks
FY (n-2) FY (n-1) FY (n) FY (n+1) FY (n+2) FY (n+3)
A System Losses At 33 KV
1 Energy received into the system
2 Station consumption
3 Energy sold at this voltage level
4 Energy transmitted to the next (lower) voltage level
5 Energy Lost
6 Total Loss in the system (5/1)*100%
B System Losses At 22 KV
1 Energy received into the system
2 Station consumption
3 Energy sold at this voltage level
4 Energy transmitted to the next (lower) voltage level
5 Energy Lost
6 Total Loss in the system (5/1)*100%
C Losses At 11 KV
1 Energy received into the system
2 Station consumption
3 Energy sold at this voltage level
4 Energy transmitted to the next (lower) voltage level
5 Energy Lost
6 Total Loss in the system (5/1)*100%
D LT System Losses
1 Energy received into the system
2 Station consumption
3 Energy sold at this voltage level
4 Energy Lost
5 Total Loss in the system (4/1)*100%
E Overall Losses
1 Energy In (A1+B1+C1+D1)
2 Energy Out (A5+B5+C5+D4)
3 Total T&D Loss (2/1)*100%
Control Period

Name of Distribution Licensee
Losses in 33 kV Form No: P2a
Sl.No. Particulars PY PY CY
Units FY (n-2) FY (n-1) FY (n) FY (n+1) FY (n+2) FY (n+3)
1 Energy In
System Energy Delivered into 33 kV
Distribution System from EHT SSsAnd Other
Generators MU
2 Energy Out Energy Sold By HT Direct Sales at 33 kV MU
3 Energy Out
Energy Diverted into 22 kV, 15 kV, 11 kV
And LT System MU
4 Distribution Loss Energy In - Energy Output MU
Control Period
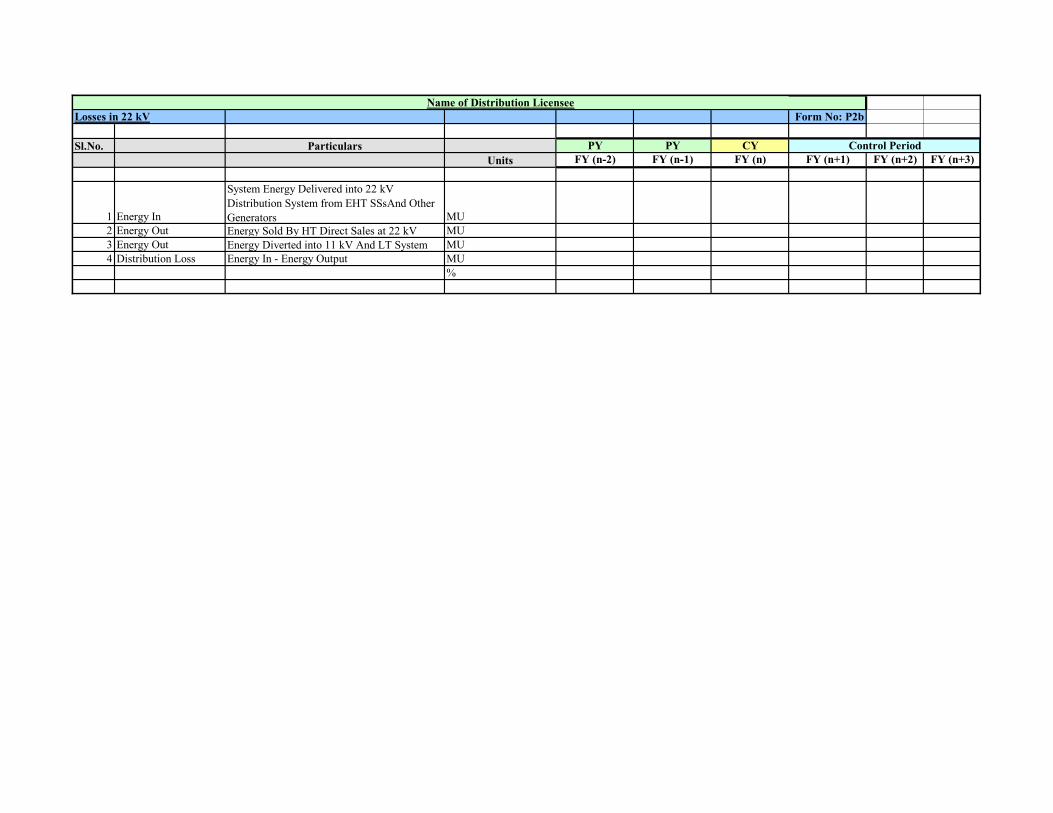
Name of Distribution Licensee
Losses in 22 kV Form No: P2b
Sl.No. Particulars PY PY CY
Units FY (n-2) FY (n-1) FY (n) FY (n+1) FY (n+2) FY (n+3)
1 Energy In
System Energy Delivered into 22 kV
Distribution System from EHT SSsAnd Other
Generators MU
2 Energy Out Energy Sold By HT Direct Sales at 22 kV MU
3 Energy Out Energy Diverted into 11 kV And LT System MU
4 Distribution Loss Energy In - Energy Output MU
%
Control Period

Name of Distribution Licensee
Losses in 11 kV Form No: P2c
Particulars PY PY CY
Units FY (n-2) FY (n-1) FY (n) FY (n+1) FY (n+2) FY (n+3)
1 Energy In Energy Delivered into 11 kV MU
Energy Delivered into 11 kV From EHT S/s And Other
Sources MU
Sub Total 1 MU
2 Energy Out Energy Sold By HT Direct Sales at 11 kV MU
Energy Diverted into LT System 11 kV SSs MU
Sub Total 2 MU
3 Distribution Loss Sub Total 1 - Sub Total 2 MU
Control Period
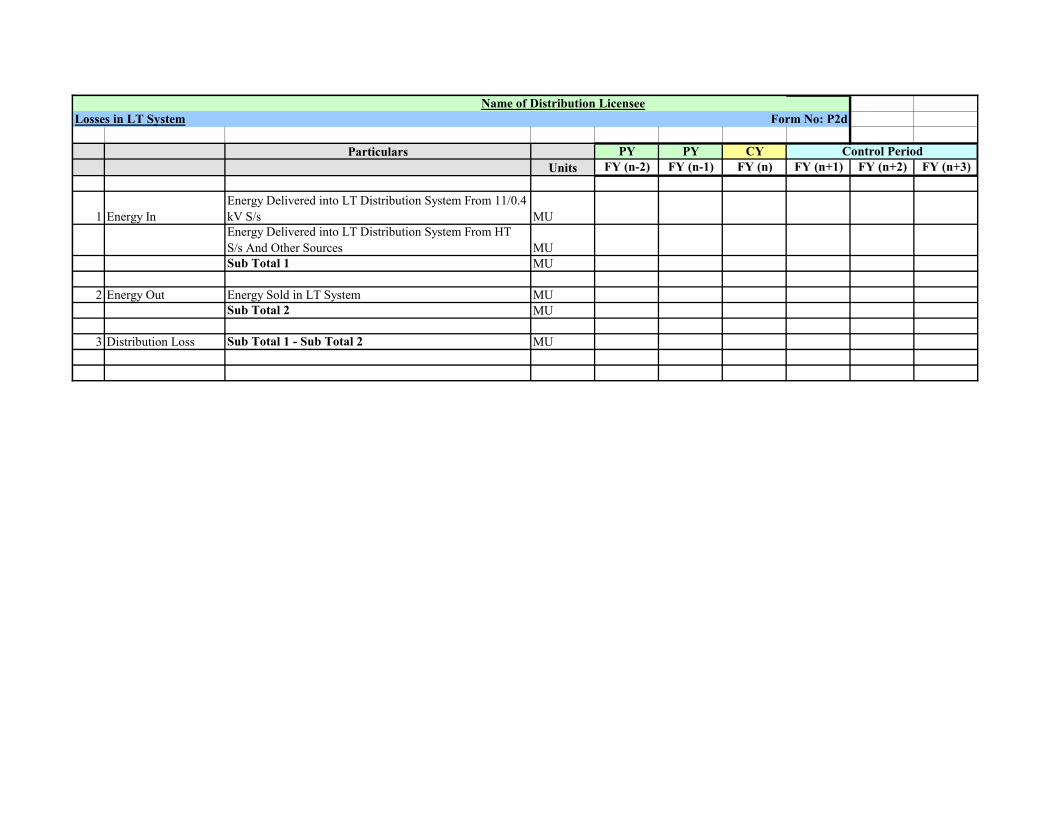
Name of Distribution Licensee
Losses in LT System Form No: P2d
Particulars PY PY CY
Units FY (n-2) FY (n-1) FY (n) FY (n+1) FY (n+2) FY (n+3)
1 Energy In
Energy Delivered into LT Distribution System From 11/0.4
kV S/s MU
Energy Delivered into LT Distribution System From HT
S/s And Other Sources MU
Sub Total 1 MU
2 Energy Out Energy Sold in LT System MU
Sub Total 2 MU
3 Distribution Loss Sub Total 1 - Sub Total 2 MU
Control Period
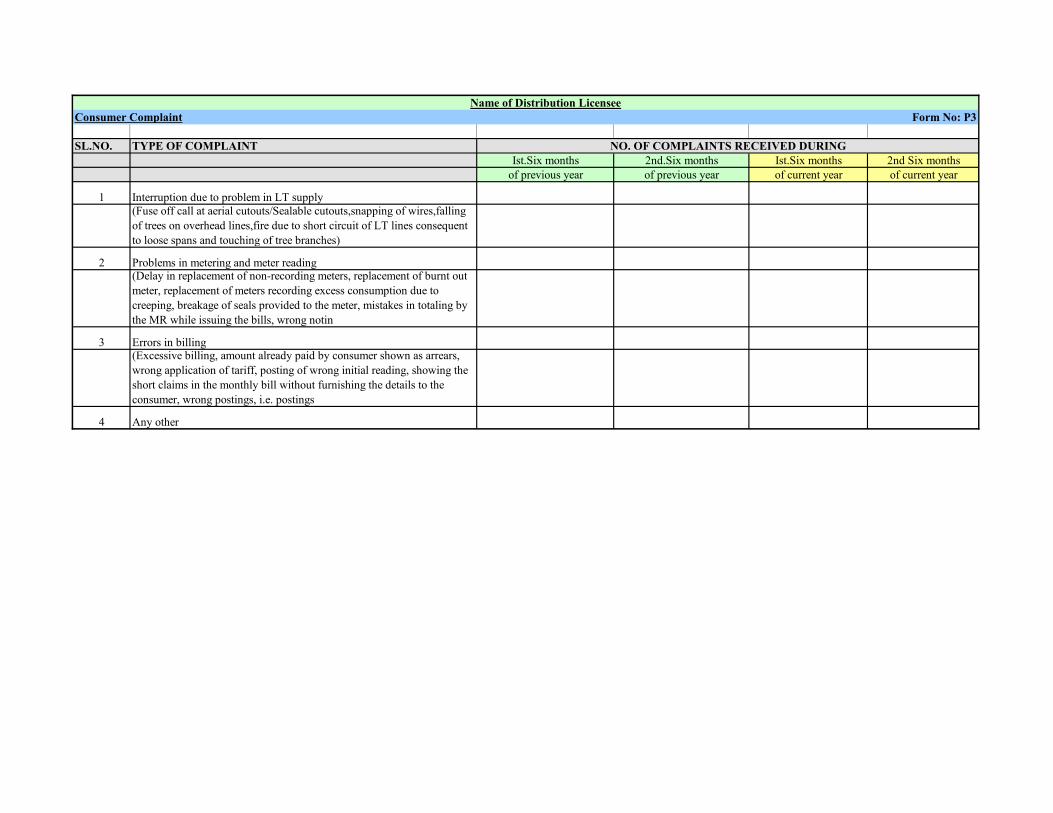
Name of Distribution Licensee
Consumer Complaint Form No: P3
SL.NO. TYPE OF COMPLAINT
Ist.Six months 2nd.Six months Ist.Six months 2nd Six months
of previous year of previous year of current year of current year
1 Interruption due to problem in LT supply
(Fuse off call at aerial cutouts/Sealable cutouts,snapping of wires,falling
of trees on overhead lines,fire due to short circuit of LT lines consequent
to loose spans and touching of tree branches)
2 Problems in metering and meter reading(Delay in replacement of non-recording meters, replacement of burnt out
meter, replacement of meters recording excess consumption due to
creeping, breakage of seals provided to the meter, mistakes in totaling by
the MR while issuing the bills, wrong notin
3 Errors in billing(Excessive billing, amount already paid by consumer shown as arrears,
wrong application of tariff, posting of wrong initial reading, showing the
short claims in the monthly bill without furnishing the details to the
consumer, wrong postings, i.e. postings
4 Any other
NO. OF COMPLAINTS RECEIVED DURING

Name of Distribution Licensee
Voltage Profile Form No: P4
Sl.No. Particulars Corrective
Substation wise Percentage of time Percentage of time Percentage of time measures proposed
At 33 kv side of transformer when voltage was when voltage was when voltage was
(incoming point of 33 kv bus) below above below above below above
Include all feeders (9%) (6%) (9%) (6%) (9%) (6%)
1
2
3
4
5
6
7
8
9
10
11
12
13
14
15
First six months of FY (n-1) Last six months of FY (n-1) For FY (n)

Name of Distribution Licensee
Technical Parameters Form No: P5
Sl. No Period Remarks
I Line Length
LT Line Length
HT Line Length
II No of Distribution Transformers
Single Phase
1 Rating Wise
2
3
Three Phase
1 Rating Wise
2
3
FY (n-2) FY (n-1) FY (n)

Name of Distribution Licensee
Abstract of outages due to tripping in HT feeders Form No: P6
S.No Particulars
Feeder & S/S details Time Of Outage Time Of Outage Time Of Outage
Number Hr Mins Total Mins Number Hr Mins Total Mins Number Hr Mins Total Mins
1 33 KV Feeders
2 22 KV Feeders
3 11 KV Feeders
4 Distribution Transformer
Corrective Measures
Proposed In the Ensuing
Year to Avoid Trippings
FY (n-2) FY (n-1) FY (n)

Name of Distribution Licensee
Failure of Transformers Form No: P7
S.No Particulars
Reasons For Failure & Corrective Actions
proposed to minimise
Number % Number % Number %
1 EHT Transformer Auto Transformer
Power Transformer
2 Power Transformer (HT)
3 Distribution Transformers
Note:- Provide the number of total and type of transformers
FY (n-2) FY (n)FY (n-1)

Name of Distribution Licensee
Billing Details - Periodicity as per regulations Form No: P8
1 Category Wise consumers Monthly Bi Monthly Quarterly Half Yearly
Note Security Deposit Regulations of HPERC, 2005

Name of Distribution Licensee
Electrical Accidents Form No: P9
Sl.No Particulars
Feeder & S/S details Non-Fatal Non-Fatal Non-Fatal
Human Animal Human Total Human Animal Human Total Human Animal Human Total
1 HV/LV (Distribution)
Total
Corrective Measures
Proposed In The Ensuing
Year to Avoid Accidents
Fatal FatalFatal
FY (n-2) FY (n-1) FY (n)
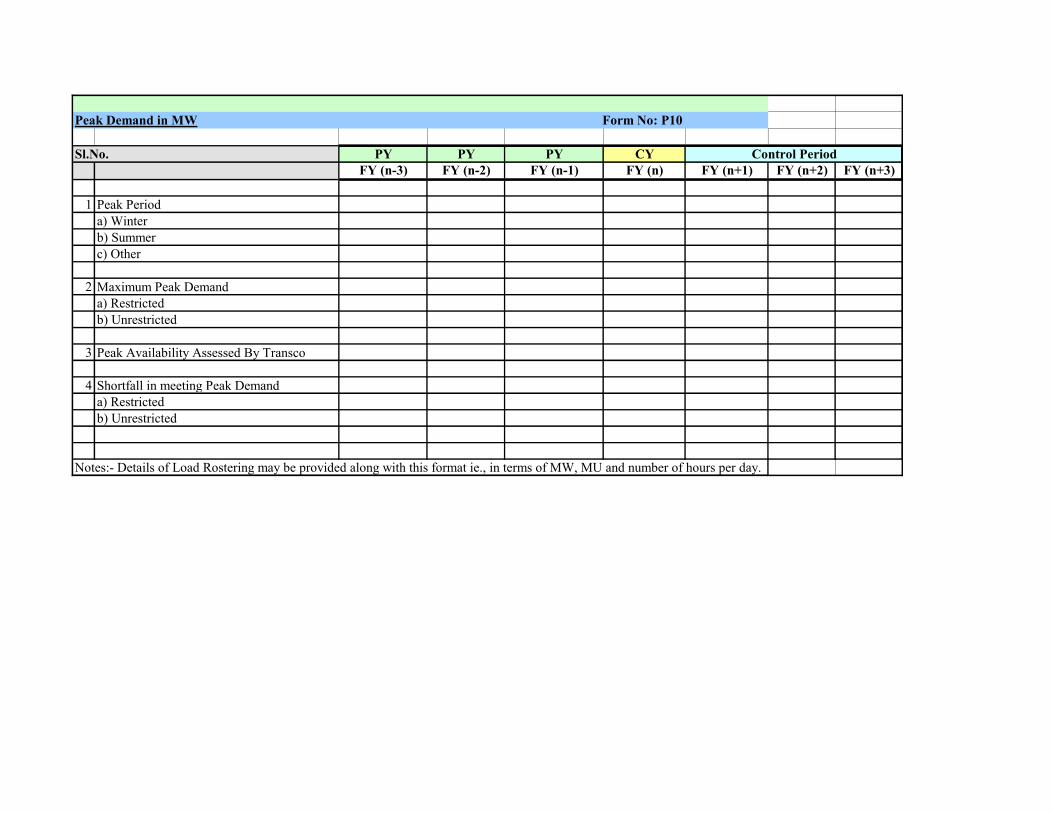
Peak Demand in MW Form No: P10
Sl.No. PY PY PY CY
FY (n-3) FY (n-2) FY (n-1) FY (n) FY (n+1) FY (n+2) FY (n+3)
1 Peak Period
a) Winter
b) Summer
c) Other
2 Maximum Peak Demand
a) Restricted
b) Unrestricted
3 Peak Availability Assessed By Transco
4 Shortfall in meeting Peak Demand
a) Restricted
b) Unrestricted
Notes:- Details of Load Rostering may be provided along with this format ie., in terms of MW, MU and number of hours per day.
Control Period

Name of Distribution Licensee
Release of Customer Bills Form No: P11
Details should be provided Circle-wise
S. No Particulars PY PY CY
Units FY (n-2) FY (n-1) FY (n) FY (n+1) FY (n+2) FY (n+3)
1 Determine The Time It Takes
a) In Taking The Meter Reading Days
b) Editing Of Data Days
c) Preparation Of Bill Days
d) Printing Of Bill And Date Of Issue Of Bill Days
e) From Issue Date To Delivery To Consumer Days
f) From Delivery Of Bill To Customer To The Due Date Of Bill Days
2.a. Number of consumers making payment:
a) Within The Due Date %
b) After The Due Date %
2.b. Disconnection Of The Consumers
a) Defaulters No
b) Actually Disconnected No
c) % Defaulters Disconnected %
3 Checking
a) % of Counters By AE / JE %
b) % of Bills By AE / JE / RA /Officials %
4
Bills That Are Disputed By The Customer to Total Bills Per Month per
Division%
5 Number Of Meters Found Defective Per Month %
6 Tampered Meters that Are Identified Per month. No
7 Average Time Taken To
a) Replace Defective/Disputed Meters Days
b) Replace The Tampered Meters Identified Days
c) Prepare And Deliver Supplementary Bills In Respect of Above Days
8 % Of Installed Meters That Are Tested Per Month. %
9
Average Time Taken For Connection Of Disconnected Meter After
Payment Of Dues/Charges%
Control Period

Name of Distribution Licensee
Key Ratios Form No: P12
S. No Particulars PY PY CY
FY (n-2) FY (n-1) FY (n) FY (n+1) FY (n+2) FY (n+3)
A Financial & Material Management
1 Annual capital expenditure/net book value
2 Distribution cost/Energy sales across consumer categories
3 Employee cost as a percentage of total cost
4 Operating expenses / Revenue from Sale of power
5 Cost of capital
6 Debt Service Coverage Ratio
7 Stores Inventory/1000 Km of distribution lines
9 Working Capital to Revenue from Sale of power
B HR Management
1 Employees per 1000 customers
2 Employee cost per unit of retail sales
3 Training participation days per employee
C Metering, Billing and Collection
Number of Meters per Meter Reader
a) Urban
b) Rural
Number of meter readings done per meter reader per month
a) Urban
b) Rural
3 Meters defective & damaged / Meters in service
4 Average level of customer arrears (days/ customer)
5 Amount (%) involved in customer litigation cases
6 Number (%) involved in customer litigation cases
7 Number of computerized bills/Number of manual bills
D Operational Performance
1 Unplanned outage/total outage (Fault breakdown / total outage)
2
Annual replacement rate of Distribution transformers (%): (Distribution
Transformers replaced / Transformers in service)
E Consumer Services
1 No. of complaint received per year to total number of consumers (%)
2
Ratio of staff attending complaints per thousand consumers (Skilled /Unskilled
staff separately identified)
1
2
Control Period

Name of Distribution Licensee
Debt Restructuring Form No: P13
S. No
Long Term Loans / Credits from the FIs/banks/
organisations approved by the State Government
Cost
of Debt before
restructuring
Interest
Burden
before
rest.
Cost
of Debt
after restr.
1 2 3
I
1 LIC
2 REC
3 PFC
4 Bonds
5 Bank/FIIs
6 APDRP
7 Any Other
Total of I
II Interest on Working Capital Loans Or Short Term Loans
1
2
3

Form No: P13
Interest
Burden
after rest.
Benefit
(2-4)
4 5

Name of Distribution Licensee
Release of New service Connections Form No: P14
Remarks
Period
No of service
Connections provided
with in 30 days of valid
requisition for power
supply
No of service
Connections provided
after 30 days of valid
requisition for power
supply
No of service
Connections provided
with in 30 days of valid
requisition for power
supply
No of service
Connections provided
after 30 days of valid
requisition for power
supply
No of service
Connections provided
with in 30 days of valid
requisition for power
supply
No of service
Connections provided
after 30 days of valid
requisition for power
supply
Action Proposed to be
taken for providing
service connections in
time
April
May
June
July
August
September
October
November
December
January
February
March
Total
FY (n-2) FY (n-1) FY (n)
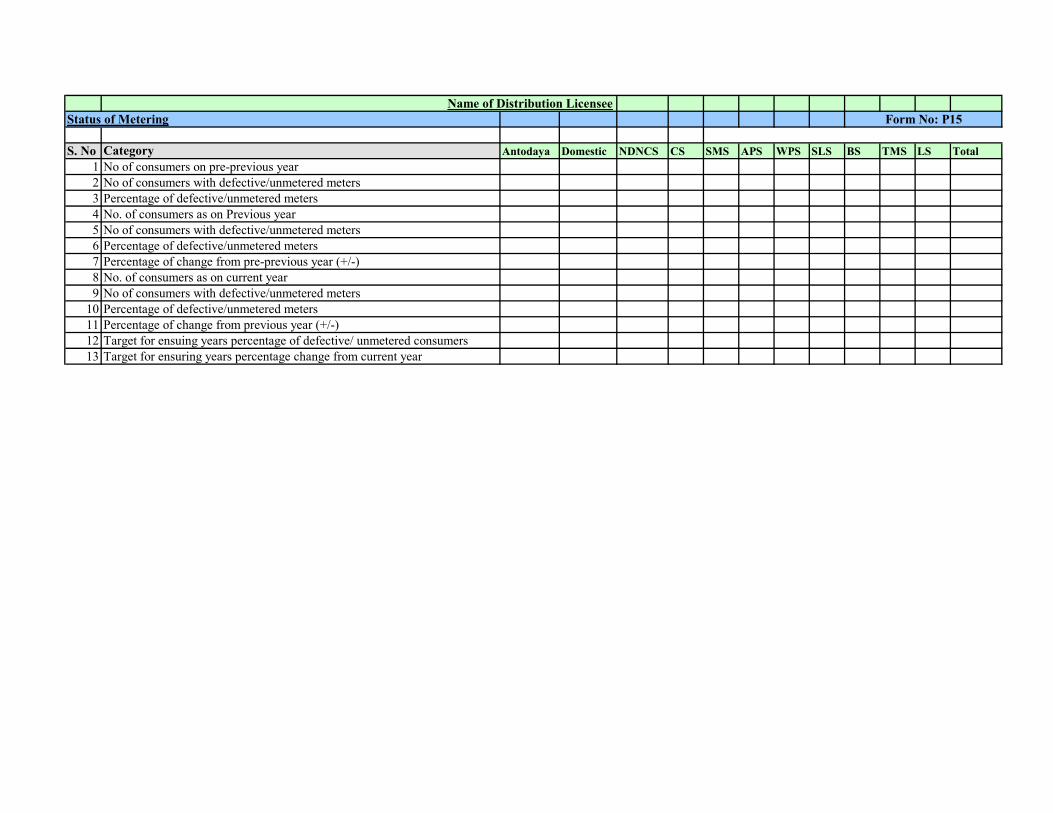
Name of Distribution Licensee
Status of Metering
S. No Category Antodaya Domestic NDNCS CS SMS APS WPS SLS BS TMS LS Total
1 No of consumers on pre-previous year
2 No of consumers with defective/unmetered meters
3 Percentage of defective/unmetered meters
4 No. of consumers as on Previous year
5 No of consumers with defective/unmetered meters
6 Percentage of defective/unmetered meters
7 Percentage of change from pre-previous year (+/-)
8 No. of consumers as on current year
9 No of consumers with defective/unmetered meters
10 Percentage of defective/unmetered meters
11 Percentage of change from previous year (+/-)
12 Target for ensuing years percentage of defective/ unmetered consumers
13 Target for ensuring years percentage change from current year
Form No: P15

Materials Management
S. No Category FY (n-2) FY (n-1) FY (n) FY (n+1) FY (n+2) FY (n+3)
1 Cost of material procurements (Centralized purchases)
Zone 1
Zone 2
Zone 3
Total
2 Cost of material procurements (Decentralized purchases)
Zone 1
Zone 2
Zone 3
Total
3 Decentralized purchases lying unutilized over 6 months
Zone 1
Zone 2
Zone 3
Total
4 Purchases made in packages
With labour
Without labour
Total
Name of Distribution Licensee
Form No: P16
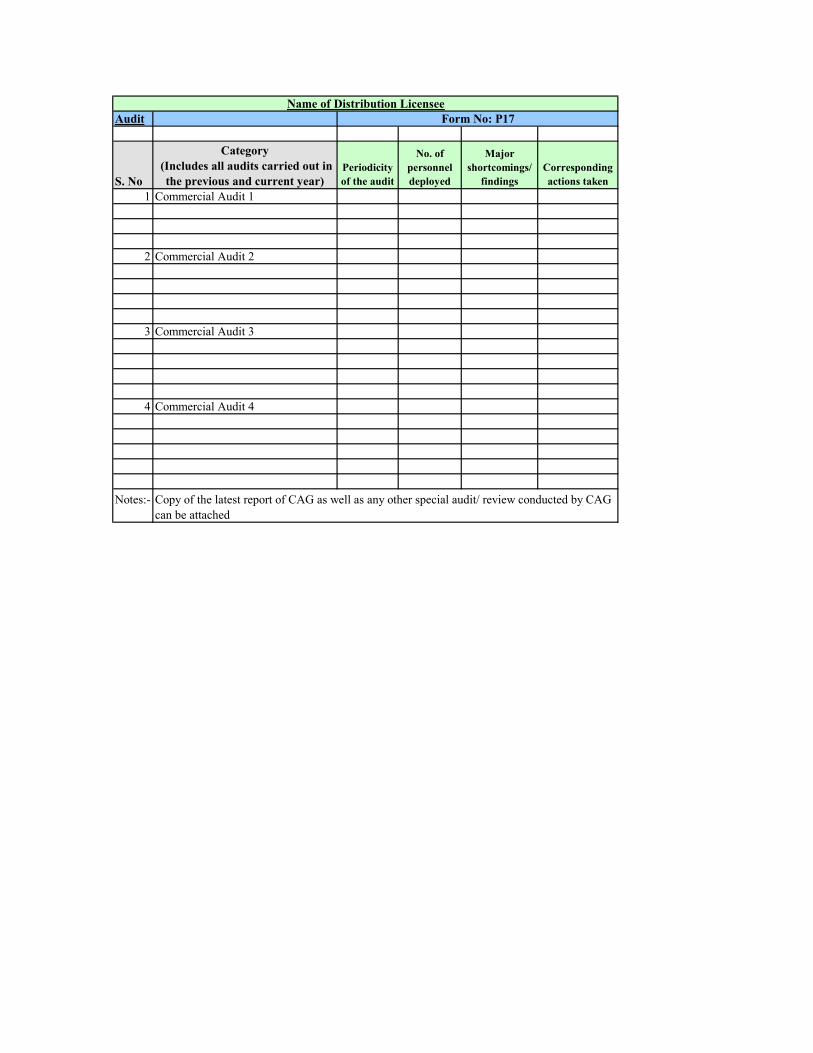
Audit
S. No
Category
(Includes all audits carried out in
the previous and current year)
Periodicity
of the audit
No. of
personnel
deployed
Major
shortcomings/
findings
Corresponding
actions taken
1 Commercial Audit 1
2 Commercial Audit 2
3 Commercial Audit 3
4 Commercial Audit 4
Notes:- Copy of the latest report of CAG as well as any other special audit/ review conducted by CAG
can be attached
Name of Distribution Licensee
Form No: P17

Pre-paid Metering
S. No Category FY (n-2) FY (n-1) FY (n) FY (n+1) FY (n+2) FY (n+3)
1 Number of pre-paid meters at the start of the year
2 Number of new installations targetted
3 Number of new installations achieved
4 Number of pre-paid meters at the end of the year
5 Number of defects reported during the year
6 Number of complaints received
7 Number of complaints attended
8 Number of complaints pending
9 Number of prepaid token vending sites at the start of the year
10 Number of new vending sites established
11 Number of prepaid token vending sites at the end of the year
Notes:-
Name of Distribution Licensee
Form No: P18
Details on the overall assessment of the pre-paid system may be provided along with this format, in terms of quality of meters supplied, etc.

Unmanned sub-stations Form No: P19
S. No Category FY (n-2) FY (n-1) FY (n) FY (n+1) FY (n+2) FY (n+3)
1 Number of unmanned sub-stations at the start of the year
2 Number of manned stations to be converted to unmanned (targetted)
3 Number of manned stations to be converted to unmanned (achieved)
4 Number of unmanned sub-stations at the end of the year
5 Number of personnel redeployed due to unmanning
6 Total outages (more than 10 mins) at unmanned sub-stations
Notes:-
Name of Distribution Licensee
Details on the voltage/MVA capacity, etc of converted substations, the major faults on unmanned substations and the list of companies providing the
technology can be provided