Embed Size (px)
Citation preview


Name of the SubSidiary CompaNy CouNtry page No.
AdA Cellworks Wireless Engineering Private Limited India . . . . . . . . . 01
International Global Tele-Systems Limited Mauritius . . . . . . . . . 22
GTL International Limited Bermuda . . . . . . . . . 39
GTL (Singapore) Pte. Ltd. Singapore . . . . . . . . . 66
GTL Overseas (Middle East) dMCC UAE . . . . . . . . . 90
GTL Europe Limited UK . . . . . . . . . 106
GTL Nepal Private Limited Nepal . . . . . . . . . 126
iGTL Myanmar Limited Myanmar . . . . . . . . . 141
CoNteNtS
29th Annual Report 2016-17

ADA CELLWORKS WIRELESS ENGINEERING PRIVATE LIMITED
29th Annual Report 2016-17 1
To
The Members,
Your Directors submit their Thirteenth Annual Report together with the Audited Financial Statements for the year ended March 31, 2017.
1. STATE OF COMPANY’S AFFAIRS
Financial Highlights: (Amount in `₹)
Particulars 2016-17 2015-16
Total Income NIL NIL
Loss Before Exceptional Items and Tax From Continuing Operations (221,728) (30,22,288)
Exceptional Item NIL NIL
Loss Before Tax From Continuing Operations (221,728) (30,22,288)
Tax Expenses
Current Tax NIL NIL
Adjustment of Tax Relating To Earlier Periods (60,778) NIL
Loss For The Year (282,506) (30,22,288)
Figures regrouped / reclassified wherever necessary to make them comparable.
2. RESULTS OF OPERATIONS AND BUSINESS OVERVIEW
The Company had been rendering telecom engineering services to telecom operators, OEMs and tower companies either directly or through its Holding Company - GTL Limited. Due to continuing recessionary condition in telecom industry and dearth of adequate business opportunity in the market, the Company is contemplating to undertake some new / additional business. Resultantly, during the year under review, the Company has posted income of ` Nil and Net Loss of `₹ (2,82,506) against the Net loss of `₹ (30, 22, 288) for the previous year.
3. DIVIDEND
Since your Company has posted losses during the year, your Directors express their inability to recommend any dividend on the paid up Equity Share Capital of the Company for the financial Year ended March 31, 2017.
4. SHARE CAPITAL
During the year under review, there was no movement in the Share capital of the Company, which stood at 90,000 Equity Shares as on March 31, 2017.
5. FIXED DEPOSITS
During the year under review, the Company has not accepted any fresh fixed deposits from Public or from its Shareholders.
6. DIRECTORS
The Board of Directors in its Meeting held on April 10, 2017 appointed Mr. Milind Bapat (DIN: 07788119) and Mr. Sanjay Advani (DIN: 07788948) as Additional Directors. Both the appointees hold office upto the date of the ensuing Annual General Meeting. The Company proposes appointment of Mr. Milind Bapat and Mr. Sanjay Advani as Non- Executive Directors and the required resolution for their respective appointment has been incorporated in Notice convening ensuing AGM for the consideration of the Members.
Mr. Milind Bengali (DIN: 02106224) and Mr. Laxmikant Desai (DIN: 01565599) have respectively relinquished office of Director with effect from April 11, 2017 due to pre-occupation and personal reasons. The Board places on record their deep appreciation and respect for the valuable advice and guidance received from them during their tenure as Directors of the Company.
7. DIRECTORS’ RESPONSIBILITY STATEMENT
Pursuant to the provisions of Section 134(3) (c) of the Companies Act, 2013 (the “Act”), the Board of Directors, to the best of their knowledge and ability in respect of the year ended March 31, 2017, confirm that:
a. in the preparation of the annual accounts, the applicable accounting standards had been followed and there are no material departures;
b. they had selected such accounting policies and applied them consistently and made judgments and estimates that are reasonable and prudent so as to give a true and fair view of the state of affairs of the Company at the end of the financial year and of the loss of the Company for that period;
c. they had taken proper and sufficient care for the maintenance of adequate accounting records in accordance with the provisions of the Companies Act, 2013 for safeguarding the assets of the Company and for preventing and detecting fraud and other irregularities;
d. they had prepared the annual accounts on a going concern basis; and
e. they had devised proper systems to ensure compliance with the provisions of all applicable laws and that such systems were adequate and operating effectively.
8. NUMBER OF MEETINGS OF THE BOARD
The Board of Directors met Four (4) times during the financial year 2016-17 on April 19, 2016, August 05, 2016, November 28, 2016 and March 22, 2017. The intervening gap between any two meetings was within the period prescribed under the Act.
9. AUDITOR AND AUDITOR’S REPORT
Pursuant to the provisions of Section 139 of the Act and rules framed there under, M/s V. Nair & Associates (FRN: 106835W), Chartered Accountants, Mumbai, were appointed as an Auditor at the Tenth (10th) AGM of the Company held on September 29, 2014 to hold office from conclusion of the said meeting till the conclusion of the Fifteenth (15th) AGM to be held in calendar year 2019, subject to ratification of their appointment at every AGM. The Company has received the necessary certificate from the Auditor pursuant to Sections 139 and 141 of the Act regarding their eligibility for appointment.
The resolution seeking approval of the Members for ratification of the appointment of M/s V. Nair & Associates (FRN: 106835W), Chartered Accountants, Mumbai, as an Auditor of the Company has been incorporated in the notice of the ensuing AGM of the Company.
The Audit Report does not contain any comments / observations.
10. PARTICULARS OF LOANS, GUARANTEES AND INVESTMENTS
During the year unnder review, the Company has not granted any loans, issued guarantees and made any investments.
11. PARTICULARS OF RELATED PARTY TRANSACTIONS
The particulars as required under the Act are furnished in Annexure A (Form No. AOC – 2) to this Report.
12. EXTRACT OF ANNUAL RETURN AS ON MARCH 31, 2017
The required details are furnished in Annexure B (Form No. MGT - 9) to this Report.
13. AMOUNT TRANSFERRED TO RESERVES
During the year under review, no amount was transferred to the reserves.
14. MATERIAL CHANGES AND COMMITMENTS, IF ANY, AFFECTING THE FINANCIAL POSITION OF THE COMPANY
There were no events occurred between the end of the financial year of the Company to which the financial statements relate and the date of the report, which may affect the financial position of the Company.
15. CONSERVATION OF ENERGY, TECHNOLOGY ABSORPTION AND FOREIGN EXCHANGE EARNINGS AND OUTGO
a. Conservation of energy:
1. The steps taken or impact on conservation of energy
:
}Since the Company had not carried out any business activity during the financial year the above mentioned details are not applicable to the Company.
2. The steps taken by the Company for utilizing alternate source of energy
:
3. The Capital investment on energy conservation equipments
:
DIRECTORS’ REPORT
GTL Limited2
ADA CELLWORKS WIRELESS ENGINEERING PRIVATE LIMITED
b. Technology Absorption:
1. Efforts made towards technology absorption :
} Not Applicable
2. The benefits derived like product improvement, cost reduction, product development or import substitution
:
3. In case of imported technology (imported during last 3 years reckoned from the beginning of the financial year)a. the details of technology imported:b. the year of import:c. whether the technology been fully absorbed?d. if not fully absorbed, areas where absorption
has not taken place, reasons thereof:
:
4. the expenditure incurred on Research and Development
: NIL
c. Foreign Exchange Earnings and Outgo: There were no actual inflow and outflow of Foreign Exchange during the
year under review.
16. GENERAL Notes forming parts of the Accounts are self – explanatory.
17. ACKNOWLEDGEMENT Your Directors wish to place on record their appreciation and acknowledge with
gratitude the support and cooperation extended by the clients, employees, vendors, bankers, financial institutions, investors, media and both the Central and State Governments and their Agencies and look forward to their continued support.
On behalf of the Board of Directors,
Milind Bapat Sanjay Advani Additional Director Additional DirectorNavi MumbaiApril 12, 2017
ANNEXURE A TO DIRECTORS’ REPORT
Form No. AOC-2
[Pursuant to clause (h) of sub-section (3) of section 134 of the Act and Rule 8(2) of the Companies (Accounts) Rules, 2014]
Form for disclosure of particulars of contracts/arrangements entered into by the Company with related parties referred to in sub-section (1) of section 188 of the Companies Act, 2013 including certain arms length transactions under third proviso thereto:
1. Details of contracts or arrangements or transactions not at arm’s length basis : Not Applicable
2. Details of material contracts or arrangement or transactions at arm’s length basis : Not Applicable
On behalf of the Board of Directors,
Milind Bapat Sanjay Advani Additional Director Additional Director
Navi Mumbai
April 12, 2017
ANNEXURE B TO DIRECTORS’ REPORT
FORM NO. MGT - 9EXTRACT OF ANNUAL RETURN
as on the financial year ended on March 31, 2017
[Pursuant to Section 92(3) of the Companies Act, 2013 and Rule 12(1) of the Companies (Management and Administration) Rules, 2014]
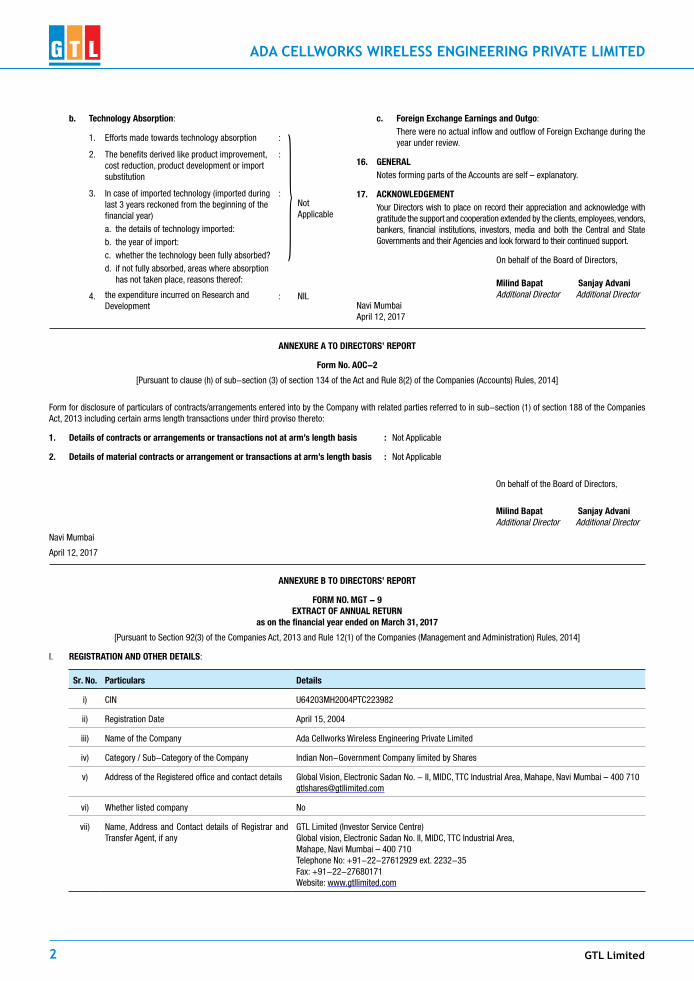
I. REGISTRATION AND OTHER DETAILS:
Sr. No. Particulars Details
i) CIN U64203MH2004PTC223982
ii) Registration Date April 15, 2004
iii) Name of the Company Ada Cellworks Wireless Engineering Private Limited
iv) Category / Sub-Category of the Company Indian Non-Government Company limited by Shares
v) Address of the Registered office and contact details Global Vision, Electronic Sadan No. - II, MIDC, TTC Industrial Area, Mahape, Navi Mumbai – 400 [email protected]
vi) Whether listed company No
vii) Name, Address and Contact details of Registrar and Transfer Agent, if any
GTL Limited (Investor Service Centre) Global vision, Electronic Sadan No. II, MIDC, TTC Industrial Area, Mahape, Navi Mumbai – 400 710Telephone No: +91-22-27612929 ext. 2232-35Fax: +91-22-27680171Website: www.gtllimited.com
ADA CELLWORKS WIRELESS ENGINEERING PRIVATE LIMITED
29th Annual Report 2016-17 3
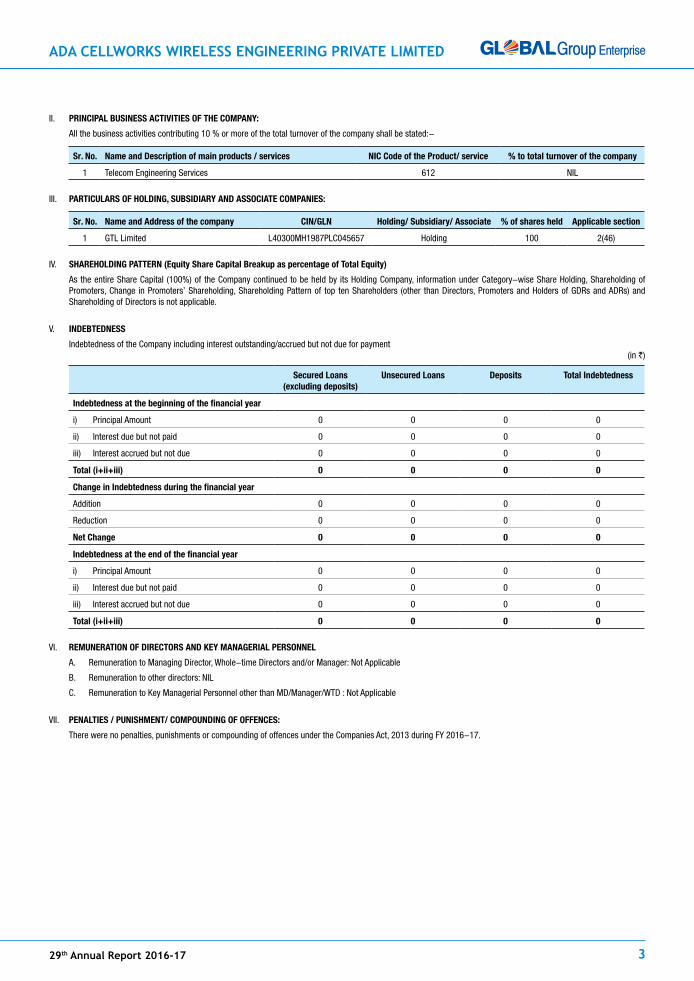
II. PRINCIPAL BUSINESS ACTIVITIES OF THE COMPANY:
All the business activities contributing 10 % or more of the total turnover of the company shall be stated:-
Sr. No. Name and Description of main products / services NIC Code of the Product/ service % to total turnover of the company
1 Telecom Engineering Services 612 NIL
III. PARTICULARS OF HOLDING, SUBSIDIARY AND ASSOCIATE COMPANIES:
Sr. No. Name and Address of the company CIN/GLN Holding/ Subsidiary/ Associate % of shares held Applicable section
1 GTL Limited L40300MH1987PLC045657 Holding 100 2(46)
IV. SHAREHOLDING PATTERN (Equity Share Capital Breakup as percentage of Total Equity)
As the entire Share Capital (100%) of the Company continued to be held by its Holding Company, information under Category-wise Share Holding, Shareholding of Promoters, Change in Promoters’ Shareholding, Shareholding Pattern of top ten Shareholders (other than Directors, Promoters and Holders of GDRs and ADRs) and Shareholding of Directors is not applicable.
V. INDEBTEDNESS
Indebtedness of the Company including interest outstanding/accrued but not due for payment (in `₹)
Secured Loans (excluding deposits)
Unsecured Loans Deposits Total Indebtedness
Indebtedness at the beginning of the financial year
i) Principal Amount 0 0 0 0
ii) Interest due but not paid 0 0 0 0
iii) Interest accrued but not due 0 0 0 0
Total (i+ii+iii) 0 0 0 0
Change in Indebtedness during the financial year
Addition 0 0 0 0
Reduction 0 0 0 0
Net Change 0 0 0 0
Indebtedness at the end of the financial year
i) Principal Amount 0 0 0 0
ii) Interest due but not paid 0 0 0 0
iii) Interest accrued but not due 0 0 0 0
Total (i+ii+iii) 0 0 0 0
VI. REMUNERATION OF DIRECTORS AND KEY MANAGERIAL PERSONNEL
A. Remuneration to Managing Director, Whole-time Directors and/or Manager: Not Applicable
B. Remuneration to other directors: NIL
C. Remuneration to Key Managerial Personnel other than MD/Manager/WTD : Not Applicable
VII. PENALTIES / PUNISHMENT/ COMPOUNDING OF OFFENCES:
There were no penalties, punishments or compounding of offences under the Companies Act, 2013 during FY 2016-17.

GTL Limited4
ADA CELLWORKS WIRELESS ENGINEERING PRIVATE LIMITED
INDEPENDENT AUDITOR’S REPORTTo The Members of ADA CELLWORKS WIRELESS ENGINEERING PRIVATE LIMITED
Report on Financial Statements
We have audited the accompanying standalone Ind AS financial statements of ADA CELLWORKS WIRELESS ENGINEERING PRIVATE LIMITED (“the Company”), which comprises the Balance Sheet as at March, 31, 2017, the Statement of Profit and Loss (including other comprehensive income) the statement of cash flow statement and the statement of changes in equity for the year then ended and a summary of significant accounting policies and other explanatory information (herein after referred to as “standalone Ind AS financial statements”).
Management’s Responsibility for the Financial Statements
The Company’s Board of Directors is responsible for the matters stated in Section 134(5) of the Companies Act, 2013 (“the Act”) with respect to the preparation of these standalone Ind AS financial statements that give a true and fair view of the financial position, financial performance including other comprehensive income, cash flows and changes in equity of the Company in accordance with the accounting principles generally accepted in India, including the Indian Accounting Standards (Ind AS) prescribed under Section 133 of the Act read with relevant rules issued thereunder.
This responsibility also includes maintenance of adequate accounting records in accordance with the provisions of the Act for safeguarding the assets of the Company and for preventing and detecting frauds and other irregularities; selection and application of appropriate accounting policies; making judgments and estimates that are reasonable and prudent; and design, implementation and maintenance of adequate internal financial controls, that were operating effectively for ensuring the accuracy and completeness of the accounting records, relevant to the preparation and presentation of the standalone Ind AS financial statements that give a true and fair view and are free from material misstatement, whether due to fraud or error.
Auditors’ Responsibility
Our responsibility is to express an opinion on these standalone Ind AS financial statements based on our audit.
We have taken into account the provisions of the Act, the accounting and auditing standards and matters which are required to be included in the audit report under the provisions of the Act and the Rules made thereunder.
We conducted our audit in accordance with the Standards on Auditing specified under Section 143(10) of the Act. Those Standards require that we comply with ethical requirements and plan and perform the audit to obtain reasonable assurance about whether the financial statements are free from material misstatement
An audit involves performing procedures to obtain audit evidence about the amounts and the disclosures in the standalone Ind AS financial statements. The procedures selected depend on the auditor’s judgment, including the assessment of the risks of material misstatement of the standalone Ind AS financial statements, whether due to fraud or error. In making those risk assessments, the auditor considers internal financial control relevant to the Company’s preparation of the standalone Ind AS financial statements that give a true and fair view in order to design audit procedures that are appropriate in the circumstances. An audit also includes evaluating the appropriateness of the accounting policies used and the reasonableness of the accounting estimates made by the Company’s Directors, as well as evaluating the overall presentation of the standalone Ind AS financial statements.
We believe that the audit evidence we have obtained is sufficient and appropriate to provide a basis for our audit opinion on the standalone Ind AS financial statements.
OpinionIn our opinion and to the best of our information and according to the explanations given to us, the aforesaid standalone Ind AS financial statements give the information required by the Act in the manner so required and give a true and fair view in conformity with the accounting principles generally accepted in India including the Ind AS, of the financial position of the Company as at 31 March, 2017, and its financial performance including other comprehensive income, its cash flows and the changes in equity for the year ended on that date.
Report on Other Legal and Regulatory Requirements 1. As required by the Companies (Auditor’s Report) Order, 2016 (“the Order”)
issued by the Central Government of India in terms of section 143(11) of the Act, we give in the Annexure A, a statement on the matters specified in the paragraph 3 and 4 of the order.
2. As required by Section 143(3) of the Act, we report that:
a) we have sought and obtained all the information and explanations which to the best of our knowledge and belief were necessary for the purpose of our audit;
b) in our opinion proper books of account as required by law have been kept by the Company so far as appears from our examination of those books;
c) the Balance Sheet, the Statement of Profit and Loss, the statement of cash flow statement and the statement of changes in equity dealt with by this Report are in agreement with the books of account;
d) in our opinion, the aforesaid Standalone Ind As financial statements comply with the applicable Accounting Standards specified under Section 133 of the Act, read with relevant rule issued thereunder;
e) on the basis of written representations received from the directors as on March 31, 2017, and taken on record by the Board of Directors, none of the directors is disqualified as on March 31, 2017, from being appointed as a director in terms of Section 164(2) of the Act
f) with respect to the adequacy of the internal financial controls over financial reporting of the Company and the operating effectiveness of such controls, refer to our separate report in “Annexure B”; and
g) with respect to the other matters to be included in the Auditor’s Report in accordance with Rule 11 of the Companies (Audit and Auditors) rules, 2014, in our opinion and to the best of our information and according to the explanations given to us :
i) The Company does not have any pending litigations which would impact its financial position
ii) The Company did not have any long-term contracts including derivative contracts; as such the question of commenting on any material foreseeable losses thereon does not arise
iii) There has not been as occasion in case of the Company during the year under report to transfer any sums to the Investor Education and Protection Fund. The question of delay in transferring such sums does not arise
For V Nair & AssociatesChartered Accountants
FRN: 106835W
Venugopal C. NairPlace : Mumbai (Proprietor)Date : 12.04.2017 Membership No: 039445
ANNEXURE – A TO THE AUDITORS REPORTThe Annexure referred to in Independent Auditors’ Report to the members of the Company on the standalone Ind AS financial statements for the year ended 31 March 2017, we report that:1 The Company does not have any fixed assets.2 The nature of business of the Company does not require it to have any
inventory. Hence, the requirement of clause (ii) of paragraph 3 of the said Order is not applicable to the Company
3 The company has not granted any loans, secured or unsecured to/from companies, firms or other parties covered in the register maintained under section 189 of the Act. Accordingly clause (iii) of Paragraph 3 of the Companies (Auditors Report) Order, 2015 is not applicable to the Company.
4 In our opinion and according to the information and explanations given to us, the Company has complied with the provisions of section 185 and 186 of the Act, with respect to the loans and investments made.
5 The Company has not accepted any deposits from the public. 6 As informed to us, the Central Government has not prescribed maintenance
of cost records for the nature of business of the company under sub-section (1) of Section 148 of the Act
7 a) According to the information and explanations given to us and on the basis of our examination of the records of the Company, amounts deducted/ accrued in the books of account in respect of undisputed statutory dues including provident fund, income-tax, sales tax, value added tax, duty of customs, service tax, cess and other material statutory dues have been regularly deposited during the year by the Company with the appropriate authorities. As explained to us, the Company did not have any dues on account of employees’ state insurance and duty of excise.
According to the information and explanations given to us, no undisputed amounts payable in respect of provident fund, income tax, sales tax, value added tax, duty of customs, service tax, cess and other material statutory dues were in arrears as at 31 March 2017 for a period of more than six months from the date they became payable.
(b) Details of dues of Income Tax, Sales Tax, Service Tax, Customs Duty, Excise Duty and Value Added Tax which have not been deposited as on March 31, 2017 on account of disputes are given below :

ADA CELLWORKS WIRELESS ENGINEERING PRIVATE LIMITED
29th Annual Report 2016-17 5
Nature of the Statute Nature of Dues
Amount Year to which
the amount relates
Forum where dispute
is pending
Duty of customs, Duty of Excise, Cess and other applicable statutory dues
Service Tax
886,694 2009-2010
1st Appellate Authority
Income Tax, Wealth-Tax, Duty of customs
Income Tax
55,611 2009-2010
1st Appellate Authority
Income Tax, Wealth-Tax, Duty of customs
Income Tax
564,750 2010-2011
1st Appellate Authority
Income Tax, Wealth-Tax, Duty of customs
Income Tax
959,629 2011-2012
1st Appellate Authority
Income Tax, Wealth-Tax, Duty of customs
Income Tax
82,77,190 2012-2013
1st Appellate Authority
Income Tax, Wealth-Tax, Duty of customs
Income Tax
10,77,670 2013-2014
1st Appellate Authority
8 The Company does not have any loans or borrowings from any financial institution, banks, government or debenture holders during the year. Accordingly, paragraph 3(viii) of the Order is not applicable.
9 The Company did not raise any money by way of initial public offer or further public offer (including debt instruments) and term loans during the year. Accordingly, paragraph 3 (ix) of the Order is not applicable.
10 According to the information and explanations given to us, no material fraud by the Company or on the Company by its officers or employees has been noticed or reported during the course of our audit.
11 According to the information and explanations give to us and based on our examination of the records of the Company, the Company has not paid/provided for managerial remuneration.
12 In our opinion and according to the information and explanations given to us, the Company is not a nidhi company. Accordingly, paragraph 3(xii) of the Order is not applicable.
13 According to the information and explanations given to us and based on our examination of the records of the Company, transactions with the related parties are in compliance with sections 177 and 188 of the Act where applicable and details of such transactions have been disclosed in the standalone Ind AS financial statements as required by the applicable accounting standards.
14 According to the information and explanations give to us and based on our examination of the records of the Company, the Company has not made any preferential allotment or private placement of shares or fully or partly convertible debentures during the year.
15 According to the information and explanations given to us and based on our examination of the records of the Company, the Company has not entered into non-cash transactions with directors or persons connected with him. Accordingly, paragraph 3(xv) of the Order is not applicable.
16 The Company is not required to be registered under section 45-IA of the Reserve Bank of India Act 1934.
For V. NAIR & ASSOCIATESCHARTERED ACCOUNTANTS
FRN 106835W
(VENUGOPAL C. NAIR)PLACE : MUMBAI PROPRIETORDATE : 12.04.2017 MEMBERSHIP NO. 39445
ANNEXURE - B TO THE AUDITORS’ REPORTReport on the Internal Financial Controls under Clause (i) of Sub-section 3 of Section 143 of the Companies Act, 2013 (“the Act”)
We have audited the internal financial controls over financial reporting of ADA Cellworks Wireless Engineering Private Limited (“the Company”) as of 31 March 2017 in conjunction with our audit of the standalone Ind AS financial statements of the Company for the year ended on that date.
Management’s Responsibility for Internal Financial Controls
The Company’s management is responsible for establishing and maintaining internal financial controls based on the internal control over financial reporting criteria established by the Company considering the essential components of internal control stated in the Guidance Note on Audit of Internal Financial Controls over Financial Reporting issued by the Institute of Chartered Accountants of India (‘ICAI’). These responsibilities include the design, implementation and maintenance of adequate internal financial controls that were operating effectively for ensuring the orderly and efficient conduct of its business, including adherence to company’s policies, the safeguarding of its assets, the prevention and detection of frauds and errors, the accuracy and completeness of the accounting records, and the timely preparation of reliable financial information, as required under the Companies Act, 2013.
Auditors’ Responsibility
Our responsibility is to express an opinion on the Company’s internal financial controls over financial reporting based on our audit. We conducted our audit in accordance with the Guidance Note on Audit of Internal Financial Controls over Financial Reporting (the “Guidance Note”) and the Standards on Auditing, issued by ICAI and deemed to be prescribed under section 143(10) of the Companies Act, 2013, to the extent applicable to an audit of internal financial controls, both applicable to an audit of Internal Financial Controls and, both issued by the Institute of Chartered Accountants of India. Those Standards and the Guidance Note require that we comply with ethical requirements and plan and perform the audit to obtain reasonable assurance about whether adequate internal financial controls over financial reporting was established and maintained and if such controls operated effectively in all material respects.
Our audit involves performing procedures to obtain audit evidence about the adequacy of the internal financial controls system over financial reporting and their operating effectiveness. Our audit of internal financial controls over financial reporting included obtaining an understanding of internal financial controls over financial reporting, assessing the risk that a material weakness exists, and testing and evaluating the design and operating effectiveness of internal control based on the assessed risk. The procedures selected depend on the auditor’s judgment, including the assessment of the risks of material misstatement of the financial statements, whether due to fraud or error.
We believe that the audit evidence we have obtained is sufficient and appropriate to provide a basis for our audit opinion on the Company’s internal financial controls system over financial reporting.
Meaning of Internal Financial Controls over Financial Reporting
A company’s internal financial control over financial reporting is a process designed to provide reasonable assurance regarding the reliability of financial reporting and the preparation of financial statements for external purposes in accordance with generally accepted accounting principles. A company’s internal financial control over financial reporting includes those policies and procedures that (1) pertain to the maintenance of records that, in reasonable detail, accurately and fairly reflect the transactions and dispositions of the assets of the company; (2) provide reasonable assurance that transactions are recorded as necessary to permit preparation of financial statements in accordance with generally accepted accounting principles, and that receipts and expenditures of the company are being made only in accordance with authorisations of management and directors of the company; and (3) provide reasonable assurance regarding prevention or timely detection of unauthorised acquisition, use, or disposition of the company’s assets that could have a material effect on the financial statements.
Inherent Limitations of Internal Financial Controls over Financial Reporting
Because of the inherent limitations of internal financial controls over financial reporting, including the possibility of collusion or improper management override of controls, material misstatements due to error or fraud may occur and not be detected. Also, projections of any evaluation of the internal financial controls over financial reporting to future periods are subject to the risk that the internal financial control over financial reporting may become inadequate because of changes in conditions, or that the degree of compliance with the policies or procedures may deteriorate.
Opinion
In our opinion, the Company has, in all material respects, an adequate internal financial controls system over financial reporting and such internal financial controls over financial reporting were operating effectively as at 31 March 2016, based on the internal control over financial reporting criteria established by the Company considering the essential components of internal control stated in the Guidance Note on Audit of Internal Financial Controls Over Financial Reporting issued by the Institute of Chartered Accountants of India.
For V Nair & AssociatesChartered Accountants
FRN: 106835W
Venugopal C. NairPlace : Mumbai (Proprietor)Date : 12.04.2017 Membership No: 039445

GTL Limited6
ADA CELLWORKS WIRELESS ENGINEERING PRIVATE LIMITED
BALANCE SHEET AS AT MARCH 31, 2017
Particulars Notes As at 31 March 2017
As at 31 March 2016
As at 1 April 2015
` ` ` AssetsNon-current assetsProperty, plant and equipment 3 NIL NIL NILCapital work-in-progress 3 NIL NIL NILInvestment properties NIL NIL NILIntangible assets NIL NIL NILFinancial assets Investments 4 NIL NIL NIL Loans 5 25,000 25,000 25,000 Other NIL NIL NILDeferred tax assets (net) NIL NIL NILOther non-current assets NIL NIL NIL
25,000 25,000 25,000Current assetsInventories NIL NIL NILFinancial assets Investments NIL NIL NIL Trade receivables 6 NIL NIL 2,206,123 Cash and cash equivalents 7 2,897,312 2,897,312 2,897,312 Bank balance other than included in Cash and cash equivalents above NIL NIL NIL Loans NIL NIL NIL Other 8 NIL NIL NIL Current Tax Assets (Net) 9 9,939,766 10,000,543 10,000,543 Other current assets 10 401,908 798,160 1,649,070
13,238,985 13,696,015 16,753,048 Total Assets 13,263,985 13,721,015 16,778,048
Equity and liabilitiesEquityEquity Share Capital 11 900,000 900,000 900,000Other Equity 12,238,985 12,521,490 15,543,778 Total Equity 13,138,985 13,421,490 16,443,778 Non-current liabilities:Financial liabilities Borrowings NIL NIL NIL Provisions NIL NIL NIL
NIL NIL NIL Current liabilities:Financial liabilities Trade payables 12 NIL 151,525 84,270 Other financial liabilities 13 125,000 125,000 250,000 Other current liabilities 14 NIL 23,000 NILProvisions NIL NIL NIL
125,000 299,525 334,270 Total liabilities 125,000 299,525 334,270 Total equity and liabilities 13,263,985 13,721,015 16,778,048
The accompanying notes form an integral part of the standalone financial StatementAs per our report of even date For and on behalf of the BoardFor V.NAIR & ASSOCIATES ADA Cellworks Wireless Engineering Private Limited Chartered AccountantsFirm Registration No. 106835W
VENUGOPAL NAIR Milind Bapat Sanjay AdvaniProprietor Director DirectorMembership No. 39445Mumbai, April 12,2017

ADA CELLWORKS WIRELESS ENGINEERING PRIVATE LIMITED
29th Annual Report 2016-17 7
STATEMENT OF PROFIT AND LOSS FOR THE YEAR ENDED MARCH 31, 2017
Particulars Notes Year ended 31st March, 2017
Year ended 31st March, 2016
` `
Continuing operationsRevenue from operations NIL NIL Other income NIL NIL
TOTAL INCOME NIL NIL
EXPENSESCost of Purchases / Services rendered NIL NIL Changes in inventories of finished goods, stock-in-trade and work-in-progress NIL NIL Employee benefits expenses NIL NIL Finance costs NIL NIL Depreciation and amortisation expenses NIL NIL Other expenses 15 221,728 3,022,288
TOTAL EXPENSES 221,728 3,022,288 Loss before exceptional items and tax from continuing operations (221,728) (3,022,288)Exceptional items NIL NIL
Loss before tax from continuing operations (221,728) (3,022,288)Tax expenses Current tax NIL NIL Adjustment of tax relating to earlier periods (60,778) NIL
Loss For The Year From Continuing Operations (282,506) (3,022,288)Discontinued operations:Loss before tax for the year from discontinued operations NIL NIL Tax expenses of discontinued operations NIL NIL
Loss for the year from discontinued operations NIL NIL
Loss for the year (282,506) (3,022,288)
Other Comprehensive IncomeA (i) Items that will not be reclassified to profit or loss NIL NIL (ii) Income tax relating to items that will not be reclassified to profit or loss NIL NIL
Net other comprehensive income not to be reclassified to profit or loss in subsequent periodsB (i) Items that will be reclassified to profit or loss NIL NIL (ii) Income tax relating to items that will be reclassified to profit or loss NIL NIL
Net other comprehensive income to be reclassified to profit or loss in subsequent periods NIL NIL
Other comprehensive income for the year, net of tax NIL NIL
Total Comprehensive Income for the period, net of tax (282,506) (3,022,288)Earnings per share ( in `) 16
Continuing operations Basic (3.14) (33.58) Diluted (3.14) (33.58)
Discontinued operations Basic NIL NIL Diluted NIL NIL
Continuing and discontinued operations Basic (3.14) (33.58) Diluted (3.14) (33.58)
The accompanying notes form an integral part of the standalone financial StatementAs per our report of even date For and on behalf of the BoardFor V.NAIR & ASSOCIATES ADA Cellworks Wireless Engineering Private Limited Chartered AccountantsFirm Registration No. 106835W
VENUGOPAL NAIR Milind Bapat Sanjay AdvaniProprietor Director DirectorMembership No. 39445Mumbai, April 12,2017

GTL Limited8
ADA CELLWORKS WIRELESS ENGINEERING PRIVATE LIMITED
STATEMENT OF CHANGES IN EqUITY FOR THE YEAR ENDED 31 MARCH 2017
a. Equity Share Capital:
Equity shares of INR 10 each issued, subscribed and fully paid (Refer Note 11.2 ) No of shares `
At 1 April 2015 90,000 900,000
At 31 March 2016 90,000 900,000
At 31 March 2017 90,000 900,000
b. Other Equity:
Particulars Equity component
of compound financial
instrument
Reserves & Surplus Items of OCI Total
Capital Reserve (Refer
Note 50)
Capital Redemption
Reserve
Securities premium account
Debenture Redemption
Reserve*
General reserve
Balance in Statement
of Profit and Loss
FVTOCI reserve
As at 31st March 2016 NIL NIL NIL 42,200,000 NIL NIL (29,678,510) NIL 12,521,490
Net loss for the period NIL NIL NIL NIL NIL NIL (282,506) NIL (282,506)
Other comprehensive income NIL NIL NIL NIL NIL NIL NIL -
Total comprehensive income NIL NIL NIL NIL NIL NIL (282,506) NIL (282,506)
Transfer from debenture redemption reserve / general reserve
NIL NIL NIL NIL NIL NIL NIL NIL NIL
As at 31 March 2017 NIL NIL NIL 42,200,000 NIL NIL (29,961,015) NIL 12,238,985
For the year ended 31 March 2016
As at 1st April 2015 NIL NIL NIL 42,200,000 NIL NIL (26,656,222) NIL 15,543,778
Net loss for the period NIL NIL NIL NIL NIL NIL (3,022,288) NIL (3,022,288)
Other comprehensive income NIL NIL NIL NIL NIL NIL NIL -
Total comprehensive income NIL NIL NIL NIL NIL NIL (3,022,288) NIL (3,022,288)
Transfer from debenture redemption reserve / general reserve
NIL NIL NIL NIL NIL NIL NIL NIL NIL
As at 31 March 2016 NIL NIL NIL 42,200,000 NIL NIL (29,678,510) NIL 12,521,490
The accompanying notes form an integral part of the standalone financial StatementAs per our report of even date For and on behalf of the BoardFor V.NAIR & ASSOCIATES ADA Cellworks Wireless Engineering Private Limited Chartered AccountantsFirm Registration No. 106835W
VENUGOPAL NAIR Milind Bapat Sanjay AdvaniProprietor Director DirectorMembership No. 39445Mumbai, April 12,2017
ADA CELLWORKS WIRELESS ENGINEERING PRIVATE LIMITED
29th Annual Report 2016-17 9
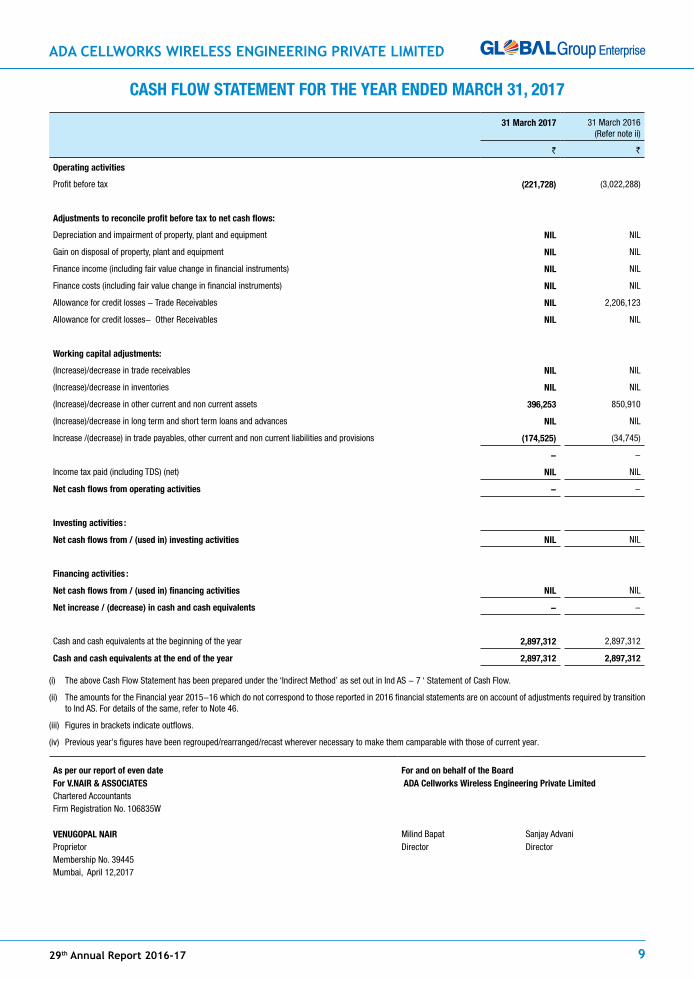
CASH FLOW STATEMENT FOR THE YEAR ENDED MARCH 31, 2017
31 March 2017 31 March 2016 (Refer note ii)
` `
Operating activities
Profit before tax (221,728) (3,022,288)
Adjustments to reconcile profit before tax to net cash flows:
Depreciation and impairment of property, plant and equipment NIL NIL
Gain on disposal of property, plant and equipment NIL NIL
Finance income (including fair value change in financial instruments) NIL NIL
Finance costs (including fair value change in financial instruments) NIL NIL
Allowance for credit losses - Trade Receivables NIL 2,206,123
Allowance for credit losses- Other Receivables NIL NIL
Working capital adjustments:
(Increase)/decrease in trade receivables NIL NIL
(Increase)/decrease in inventories NIL NIL
(Increase)/decrease in other current and non current assets 396,253 850,910
(Increase)/decrease in long term and short term loans and advances NIL NIL
Increase /(decrease) in trade payables, other current and non current liabilities and provisions (174,525) (34,745)
- -
Income tax paid (including TDS) (net) NIL NIL
Net cash flows from operating activities - -
Investing activities :
Net cash flows from / (used in) investing activities NIL NIL
Financing activities :
Net cash flows from / (used in) financing activities NIL NIL
Net increase / (decrease) in cash and cash equivalents - -
Cash and cash equivalents at the beginning of the year 2,897,312 2,897,312
Cash and cash equivalents at the end of the year 2,897,312 2,897,312
(i) The above Cash Flow Statement has been prepared under the ‘Indirect Method’ as set out in Ind AS - 7 ‘ Statement of Cash Flow.
(ii) The amounts for the Financial year 2015-16 which do not correspond to those reported in 2016 financial statements are on account of adjustments required by transition to Ind AS. For details of the same, refer to Note 46.
(iii) Figures in brackets indicate outflows.
(iv) Previous year’s figures have been regrouped/rearranged/recast wherever necessary to make them camparable with those of current year.
As per our report of even date For and on behalf of the BoardFor V.NAIR & ASSOCIATES ADA Cellworks Wireless Engineering Private Limited Chartered AccountantsFirm Registration No. 106835W
VENUGOPAL NAIR Milind Bapat Sanjay AdvaniProprietor Director DirectorMembership No. 39445Mumbai, April 12,2017

GTL Limited10
ADA CELLWORKS WIRELESS ENGINEERING PRIVATE LIMITED
1. CORPORATE INFORMATION The Company is Private Limited Company domiciled in India and is incorporated
under the provisions of the Companies Act, applicable in India.The registered office of the Company is located at Global Vision, Electronic Sadan II, MIDC, TTC Industrial Area, Mahape, Navi Mumbai. The Company engaged in providing network services to telecom operators, OEM’s and tower companies. The financial statements were authorised for issue in accordance with a resolution passed in the meeting of the Board of directors held on April 12, 2017.
2. SIGNIFICANT ACCOUNTING POLICIES 1. Basis for preparation of Financial Statements: The Financial Statements have been prepared on a going concern basis
under on accrual basis, in accordance with Indian Accounting Standards (Ind AS) notified under the Companies (Indian Accounting Standards) Rules, 2015 as amended by Companies (Indian Accounting standards) (Amendment) Rules, 2016.
For all periods up to and including the year ended 31 March 2016, the Company prepared its financial statements in accordance accounting standards notified under the section 133 of the Companies Act 2013, read together with paragraph 7 of the Companies (Accounts) Rules, 2014 (Indian GAAP). The Company’s first Ind AS compliant financial statements are for the year ended March 31, 2017 with restated comparative figures for the year ended March 31, 2016 and as on April 1, 2015 in compliance with Ind AS.. The date of transition is April 1, 2015.
The financial statements have been prepared on a historical cost basis, except for the following assets and liabilities which have been measured at fair value:
• Certain financial assets and liabilities measured at fair value (refer accounting policy regarding financial instruments)
The preparation of the financial statements requires management to make estimates and assumptions. Actual results could vary from these estimates. The estimates and underlying assumptions are reviewed on an ongoing basis. Revisions to accounting estimates are recognised in the period in which the estimate are revised if the revision affects only that period or in the period of the revision and future periods if the revision affects both current and future years (refer Note no. 17 on critical accounting estimates, assumptions and judgements).
2. Current versus non-current classification: The Company presents assets and liabilities in the balance sheet based
on current/ non-current classification. The Company has presented non-current assets and current assets before equity, non-current liabilities and current liabilities in accordance with Schedule III, Division II of Companies Act, 2013 notified by Ministry of Corporate Affairs (MCA).”
An asset is classified as current when it satisfies any of the following criteria: • Expected to be realised or intended to be sold or consumed in normal
operating cycle • Held primarily for the purpose of trading • Expected to be realised within twelve months after the reporting
period, or • Cash or cash equivalent unless restricted from being exchanged or used
to settle a liability for at least twelve months after the reporting period
All other assets are classified as non-current.
A liability is classified as current when: • It is expected to be settled in normal operating cycle • It is held primarily for the purpose of trading • It is due to be settled within twelve months after the reporting period,
or • There is no unconditional right to defer the settlement of the liability
for at least twelve months after the reporting period All other liabilities are classified as non-current. Deferred tax assets and liabilities are classified as non-current. The operating cycle is the time between the acquisition of assets for
processing and their realisation in cash and cash equivalents. The Company has considered a period of twelve months for classifying its
assets and liabilities as current and non-current.
3. Fair value measurement: Fair value is the price that would be received to sell an asset or paid to
transfer a liability in an orderly transaction between market participants at the measurement date. The fair value measurement is based on the
presumption that the transaction to sell the asset or transfer the liability takes place either:
• In the principal market for the asset or liability, or • In the absence of a principal market, in the most advantageous
market for the asset or liability
The fair value of an asset or a liability is measured using the assumptions that market participants would use when pricing the asset or liability, assuming that market participants act in their economic best interest.
A fair value measurement of a non-financial asset takes into account a market participant’s ability to generate economic benefits by using the asset in its highest and best use or by selling it to another market participant that would use the asset in its highest and best use.
The Company uses valuation techniques that are appropriate in the circumstances and for which sufficient data are available to measure fair value, maximising the use of relevant observable inputs and minimising the use of unobservable inputs.
All assets and liabilities for which fair value is measured or disclosed in the financial statements are categorised within the fair value hierarchy, described as follows, based on the lowest level input that is significant to the fair value measurement as a whole:
• Level 1 — Quoted / Published NAV (unadjusted) market prices in active markets for identical assets or liabilities
• Level 2 — Valuation techniques for which the lowest level input that is significant to the fair value measurement is directly or indirectly observable
• Level 3 — Valuation techniques for which the lowest level input that is significant to the fair value measurement is unobservable
For assets and liabilities that are recognised in the financial statements on a recurring basis, the Company determines whether transfers have occurred between levels in the hierarchy by re-assessing categorisation (based on the lowest level input that is significant to the fair value measurement as a whole) at the end of each reporting period.
External valuers are involved for valuation of significant assets, such as properties and unquoted financial assets, and significant liabilities.
For the purpose of fair value disclosures, the Company has determined classes of assets and liabilities on the basis of the nature, characteristics and risks of the asset or liability and the level of the fair value hierarchy as explained above.
This note summarises accounting policy for fair value. Other fair value related disclosures are given in the following notes:
• Disclosures for valuation methods, significant estimates and assumptions (note 17)
4. Revenue recognition: Revenue is recognised to the extent that it is probable that the economic
benefits will flow to the Company and the revenue can be reliably measured regardless of when the proceeds are being received . Revenue is measured at the fair value of the consideration received or receivable, taking into account contractually defined terms of payment and excluding taxes or duties collected on behalf of the government. The Company has concluded that it is the principal in all of its revenue arrangements since it is the primary obligor in all the revenue arrangements as it has pricing latitude and is also exposed to inventory and credit risks.
The specific revenue recognition policies are as under: a. Revenue from Turnkey Contracts, which are either Fixed Price or
Cost Plus contracts, is recognized based on work completion of activity or achievement of milestone.
b. Revenue from sale of products is recognized upon passing of the title of goods and/or on transfer of significant risk and rewards of ownership thereto.
c. Revenue from Services is recognized on performance of Service as per the contractual terms.
d. Dividend income is recognized when the right to receive dividend is established.
e. Income such as Interest, Rent is recognized as per contractually agreed terms on time proportion basis.
5. Property, plant and equipment : Tangible Assets are stated at the cost of acquisition less accumulated
depreciation and impairment losses, if any. The cost includes purchase price (after deducting trade discounts and rebates), including non-
ADA CELLWORKS WIRELESS ENGINEERING PRIVATE LIMITED
29th Annual Report 2016-17 11
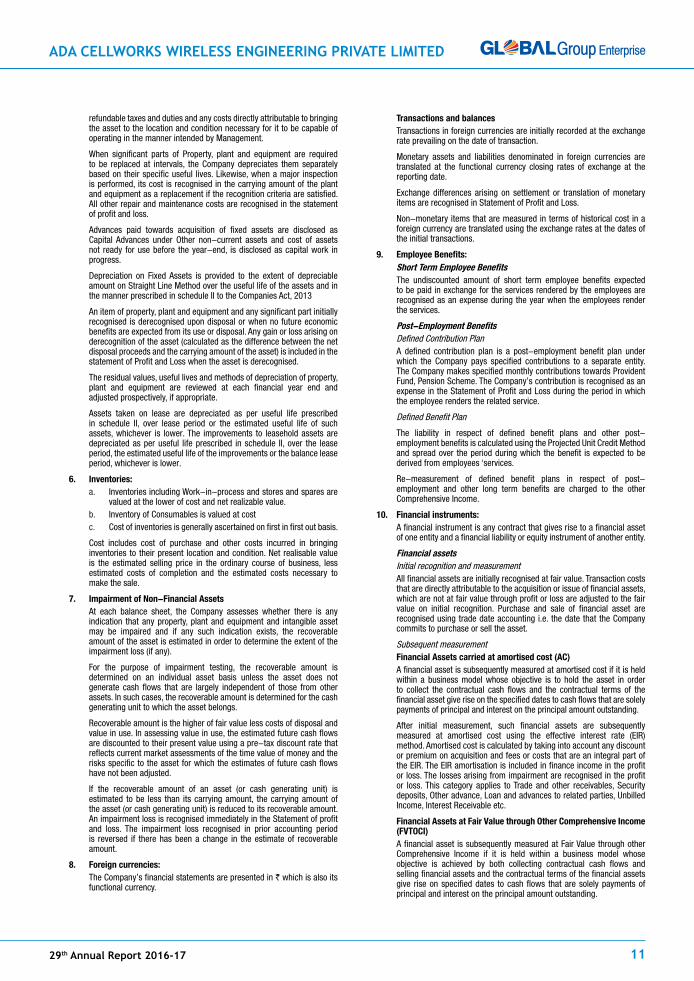
refundable taxes and duties and any costs directly attributable to bringing the asset to the location and condition necessary for it to be capable of operating in the manner intended by Management.
When significant parts of Property, plant and equipment are required to be replaced at intervals, the Company depreciates them separately based on their specific useful lives. Likewise, when a major inspection is performed, its cost is recognised in the carrying amount of the plant and equipment as a replacement if the recognition criteria are satisfied. All other repair and maintenance costs are recognised in the statement of profit and loss.
Advances paid towards acquisition of fixed assets are disclosed as Capital Advances under Other non-current assets and cost of assets not ready for use before the year-end, is disclosed as capital work in progress.
Depreciation on Fixed Assets is provided to the extent of depreciable amount on Straight Line Method over the useful life of the assets and in the manner prescribed in schedule II to the Companies Act, 2013
An item of property, plant and equipment and any significant part initially recognised is derecognised upon disposal or when no future economic benefits are expected from its use or disposal. Any gain or loss arising on derecognition of the asset (calculated as the difference between the net disposal proceeds and the carrying amount of the asset) is included in the statement of Profit and Loss when the asset is derecognised.
The residual values, useful lives and methods of depreciation of property, plant and equipment are reviewed at each financial year end and adjusted prospectively, if appropriate.
Assets taken on lease are depreciated as per useful life prescribed in schedule II, over lease period or the estimated useful life of such assets, whichever is lower. The improvements to leasehold assets are depreciated as per useful life prescribed in schedule II, over the lease period, the estimated useful life of the improvements or the balance lease period, whichever is lower.
6. Inventories: a. Inventories including Work-in-process and stores and spares are
valued at the lower of cost and net realizable value. b. Inventory of Consumables is valued at cost c. Cost of inventories is generally ascertained on first in first out basis.
Cost includes cost of purchase and other costs incurred in bringing inventories to their present location and condition. Net realisable value is the estimated selling price in the ordinary course of business, less estimated costs of completion and the estimated costs necessary to make the sale.
7. Impairment of Non-Financial Assets At each balance sheet, the Company assesses whether there is any
indication that any property, plant and equipment and intangible asset may be impaired and if any such indication exists, the recoverable amount of the asset is estimated in order to determine the extent of the impairment loss (if any).
For the purpose of impairment testing, the recoverable amount is determined on an individual asset basis unless the asset does not generate cash flows that are largely independent of those from other assets. In such cases, the recoverable amount is determined for the cash generating unit to which the asset belongs.
Recoverable amount is the higher of fair value less costs of disposal and value in use. In assessing value in use, the estimated future cash flows are discounted to their present value using a pre-tax discount rate that reflects current market assessments of the time value of money and the risks specific to the asset for which the estimates of future cash flows have not been adjusted.
If the recoverable amount of an asset (or cash generating unit) is estimated to be less than its carrying amount, the carrying amount of the asset (or cash generating unit) is reduced to its recoverable amount. An impairment loss is recognised immediately in the Statement of profit and loss. The impairment loss recognised in prior accounting period is reversed if there has been a change in the estimate of recoverable amount.
8. Foreign currencies: The Company’s financial statements are presented in ` which is also its
functional currency.
Transactions and balances Transactions in foreign currencies are initially recorded at the exchange
rate prevailing on the date of transaction.
Monetary assets and liabilities denominated in foreign currencies are translated at the functional currency closing rates of exchange at the reporting date.
Exchange differences arising on settlement or translation of monetary items are recognised in Statement of Profit and Loss.
Non-monetary items that are measured in terms of historical cost in a foreign currency are translated using the exchange rates at the dates of the initial transactions.
9. Employee Benefits: Short Term Employee Benefits The undiscounted amount of short term employee benefits expected
to be paid in exchange for the services rendered by the employees are recognised as an expense during the year when the employees render the services.
Post-Employment Benefits Defined Contribution Plan A defined contribution plan is a post-employment benefit plan under
which the Company pays specified contributions to a separate entity. The Company makes specified monthly contributions towards Provident Fund, Pension Scheme. The Company’s contribution is recognised as an expense in the Statement of Profit and Loss during the period in which the employee renders the related service.
Defined Benefit Plan
The liability in respect of defined benefit plans and other post-employment benefits is calculated using the Projected Unit Credit Method and spread over the period during which the benefit is expected to be derived from employees ‘services.
Re-measurement of defined benefit plans in respect of post-employment and other long term benefits are charged to the other Comprehensive Income.
10. Financial instruments: A financial instrument is any contract that gives rise to a financial asset
of one entity and a financial liability or equity instrument of another entity.
Financial assets Initial recognition and measurement All financial assets are initially recognised at fair value. Transaction costs
that are directly attributable to the acquisition or issue of financial assets, which are not at fair value through profit or loss are adjusted to the fair value on initial recognition. Purchase and sale of financial asset are recognised using trade date accounting i.e. the date that the Company commits to purchase or sell the asset.
Subsequent measurement Financial Assets carried at amortised cost (AC) A financial asset is subsequently measured at amortised cost if it is held
within a business model whose objective is to hold the asset in order to collect the contractual cash flows and the contractual terms of the financial asset give rise on the specified dates to cash flows that are solely payments of principal and interest on the principal amount outstanding.
After initial measurement, such financial assets are subsequently measured at amortised cost using the effective interest rate (EIR) method. Amortised cost is calculated by taking into account any discount or premium on acquisition and fees or costs that are an integral part of the EIR. The EIR amortisation is included in finance income in the profit or loss. The losses arising from impairment are recognised in the profit or loss. This category applies to Trade and other receivables, Security deposits, Other advance, Loan and advances to related parties, Unbilled Income, Interest Receivable etc.
Financial Assets at Fair Value through Other Comprehensive Income (FVTOCI)
A financial asset is subsequently measured at Fair Value through other Comprehensive Income if it is held within a business model whose objective is achieved by both collecting contractual cash flows and selling financial assets and the contractual terms of the financial assets give rise on specified dates to cash flows that are solely payments of principal and interest on the principal amount outstanding.

GTL Limited12
ADA CELLWORKS WIRELESS ENGINEERING PRIVATE LIMITED
The Company doesnt not have any financial assets which are fair valued through Other Comprehensive Income (FVTOCI).
Financial Assets at Fair Value through profit or loss (FVTPL) A financial asset which is not classified in any of the above categories is
subsequently fair valued through profit or loss
Equity investments All equity investments other than investment in Subsidiaries and
Associates are measured at fair value, with value changes recognised in Statement of Profit and loss except for those equity investments for which the Company has elected to present the value changes in ‘other comprehensive income’
The Company doesnt not have any equity investments which are fair value through Other Comprehensive Income (FVTOCI)
The Company makes such election on an instrument-by-instrument basis. The classification is made on initial recognition and is irrevocable.
Derecognition A financial asset (or, where applicable, a part of a financial asset or part
of a group of similar financial assets) is primarily derecognised (i.e. removed from the Company’s balance sheet) when:
The rights to receive cash flows from the asset have expired, or
The Company has transferred its rights to receive cash flows from the asset or has assumed an obligation to pay the received cash flows in full without material delay to a third party under a ‘pass-through’ arrangement₹ and either (a) the Company has transferred substantially all the risks and rewards of the asset, or (b) the Company has neither transferred nor retained substantially all the risks and rewards of the asset, but has transferred control of the asset.
Impairment of financial assets The Company assesses impairment based on expected credit loss (ECL)
model to the following
Financial assets at amortised cost
Financial assets measured at fair value through Profit or Loss Account
The Company follows simplified approach for recognition of impairment loss allowance. The application of simplified approach does not require the Company to track changes in credit risks. Rather, it recognises impairment loss allowance based on lifetime ECL at each reporting date, right from its initial recognition.
The Company uses historical cost experience to determine the impairment loss allowance on the portfolio of trade receivables. At every reporting date, the historically observed default rates are updated and changes in the forward looking estimates are analysed.
For recognition of impairment loss on other financial assets and risk exposure, the Company determines that whether there has been a significant increase in the credit risk since initial recognition. If credit risk has not increased significantly, 12-month ECL is used to provide for impairment loss. However, if credit risk has increased significantly, lifetime ECL is used. If, in a subsequent period, credit quality of instrument improves such that there is no longer a significant increase in credit risk since initial recognition, then the Company reverts to recognising impairment loss allowance based on 12-month ECL.
Financial liabilities Initial recognition and measurement Financial liabilities are classified, at initial recognition, as financial
liabilities at fair value through profit or loss, loans and borrowings, payables, or as derivatives designated as hedging instruments in an effective hedge, as appropriate.
All financial liabilities are recognised initially at fair value and, in the case of loans and borrowings and payables, net of directly attributable transaction costs.
The Company’s financial liabilities include trade and other payables, loans and borrowings including bank overdrafts, financial guarantee contracts and derivative financial instruments.
A. Subsequent measurement The measurement of financial liabilities depends on their
classification, as described below:
Financial liabilities at fair value through profit or loss
Financial li abilities at fair value through profit or loss include financial liabilities held for trading and financial liabilities designated upon initial recognition as at fair value through profit or loss. Financial liabilities are classified as held for trading if they are incurred for the purpose of repurchasing in the near term. This category also includes derivative financial instruments entered into by the Company that are not designated as hedging instruments in hedge relationships as defined by Ind AS 109. Separated embedded derivatives are also classified as held for trading unless they are designated as effective hedging instruments.
Gains or losses on financial liabilities held for trading are recognised in the profit or loss.
Financial liabilities designated upon initial recognition at fair value through profit or loss are designated as such at the initial date of recognition, and only if the criteria in Ind AS 109 are satisfied. For liabilities designated as FVTPL, fair value gains/ losses attributable to changes in own credit risk is recognized in OCI. These gains/ loss are not subsequently transferred to Profit and Loss . However, the Company may transfer the cumulative gain or loss within equity. All other changes in fair value of such liability are recognised in the statement of profit and loss. The Company has not designated any financial liability as at fair value through profit or loss.
Loans and borrowings After initial recognition, interest-bearing loans and borrowings are
subsequently measured at amortised cost using the EIR method. Gains and losses are recognised in profit or loss when the liabilities are derecognized.
Amortised cost is calculated by taking into account any discount or premium on acquisition and fees or costs that are an integral part of the EIR. The EIR amortisation is included as finance costs in the statement of profit and loss.
Financial guarantee contracts Financial guarantee contracts issued by the Company are those contracts
that require a payment to be made to reimburse the holder for a loss it incurs because the specified debtor fails to make a payment when due in accordance with the terms of a debt instrument. Financial guarantee contracts are recognised initially as a liability at fair value, adjusted for transaction costs that are directly attributable to the issuance of the guarantee. Subsequently, the liability is measured at the higher of the amount of loss allowance determined as per impairment requirements of Ind AS 109 and the amount recognised less cumulative amortisation.
Derecognition A financial liability is derecognised when the obligation under the liability
is discharged or cancelled or expires. When an existing financial liability is replaced by another, from the same lender on substantially different terms, or the terms of an existing liability are substantially modified, such an exchange or modification is treated as the derecognition of the original liability and the recognition of a new liability. The difference in the respective carrying amounts is recognised in the statement of profit and loss.
Embedded derivatives An embedded derivative is a component of a hybrid (combined) contract
that also includes a non-derivative host contract – with the effect that some of the cash flows of the combined instrument vary in a way similar to a stand-alone derivative. An embedded derivative causes some or all of the cash flows that otherwise would be required by the contract to be modified according to a specified interest rate, financial instrument price, commodity price, foreign exchange rate, index of prices or rates, credit rating or credit index, or other variable, provided in the case of a non-financial variable that the variable is not specific to a party to the contract. Reassessment only occurs if there is either a change in the terms of the contract that significantly modifies the cash flows that would otherwise be required or a reclassification of a financial asset out of the fair value through profit or loss.
If the hybrid contract contains a host that is a financial asset within the scope of Ind AS 109, the Company does not separate embedded derivatives. Rather, it applies the classification requirements contained in Ind AS 109 to the entire hybrid contract. Derivatives embedded in all other host contracts are accounted for as separate derivatives and recorded at fair value if their economic characteristics and risks are not closely related to those of the host contracts and the host contracts are not held for trading or designated at fair value though profit or loss. These embedded derivatives are measured at fair value with changes in fair

ADA CELLWORKS WIRELESS ENGINEERING PRIVATE LIMITED
29th Annual Report 2016-17 13
value recognised in profit or loss, unless designated as effective hedging instruments.
Reclassification of financial assets The Company determines classification of financial assets and liabilities
on initial recognition. After initial recognition, no reclassification is made for financial assets which are equity instruments and financial liabilities. For financial assets which are debt instruments, a reclassification is made only if there is a change in the business model for managing those assets. Changes to the business model are expected to be infrequent. The Company’s senior management determines change in the business model as a result of external or internal changes which are significant to the Company’s operations. Such changes are evident to external parties. A change in the business model occurs when the Company either begins or ceases to perform an activity that is significant to its operations. If the Company reclassifies financial assets, it applies the reclassification prospectively from the reclassification date which is the first day of the immediately next reporting period following the change in business model. The Company does not restate any previously recognised gains, losses (including impairment gains or losses) or interest.
Offsetting of financial instruments Financial assets and financial liabilities are offset and the net amount is
reported in the balance sheet if there is a currently enforceable legal right to offset the recognised amounts and there is an intention to settle on a net basis, to realise the assets and settle the liabilities simultaneously.
11. Provision for Current and Deferred Tax: a. Current Tax: Provision is made for income tax, under the tax
payable method, based on the liability as computed after taking credit for allowances, exemptions, and MAT credit entitlement for the year. Adjustments in books are made only after the completion of the assessment. In case of matters under appeal, due to disallowances or otherwise, full provision is made when the Company accepts the said liabilities.
Current income tax relating to items recognised outside profit or loss is recognised outside profit or loss (either in other comprehensive income or in equity). Current tax items are recognised in correlation to the underlying transaction either in OCI or directly in equity. Management periodically evaluates positions taken in the tax returns with respect to situations in which applicable tax regulations are subject to interpretation and establishes provisions where appropriate.The Company offsets current tax assets and current tax liabilities and presents the same net if and only if it has a legally enforceable right to set off current tax assets and current tax liabilities.
b. Deferred tax: Deferred tax is recognised on differences between the carrying amounts of assets and liabilities in the balance sheet and the corresponding tax bases used in the computation of taxable profit and thereafter a deferred tax asset or deferred tax liability is recorded for temporary differences, namely the differences that originate in one accounting period and reverse in another. Deferred tax is measured based on the tax rates and tax laws enacted or substantively enacted at the Balance Sheet date. Deferred tax asset is recognized only to the extent that it is probable that taxable profit will be available against which the deductible temporary differences, and the carry forward of unused tax credits and unused tax losses can be utilized. Carrying value of deferred tax asset is adjusted for its appropriateness at each balance sheet date.
Deferred tax relating to items recognised outside profit or loss is recognised outside profit or loss (either in other comprehensive income or in equity). Deferred tax items are recognised in correlation to the underlying transaction either in OCI or directly in equity.
The Company offsets and the deferred tax assets and deferred tax liabilities and presents the same net if the deferred tax assets and deferred tax liabilities relate to income taxes levied by the same tax authority.
c. Credit of MAT is recognised as an asset only when and to the extent there is convincing evidence that the Company will pay normal income tax during the specified period, i.e., the period for which MAT credit is allowed to be carried forward. In the year in which the MAT credit becomes eligible to be recognized as an asset, the said asset is created by way of a credit to the statement of profit and loss and shown as MAT credit entitlement. The Company reviews the same at each balance sheet date and writes down the carrying amount of MAT credit entitlement to the extent there is no longer
convincing evidence to the effect that the Company will pay normal income tax during the specified period.
12. Provisions, Contingent Liabilities and Contingent Assets Provisions are recognised when the Company has a present obligation
(legal or constructive) as a result of a past event. It is probable that an outflow of resources embodying economic benefits will be required to settle the obligation and a reliable estimate can be made of the amount of the obligation. If the effect of the time value of money is material, provisions are discounted using equivalent period government securities interest rate. Unwinding of the discount is recognised in the statement of profit and loss as a finance cost. Provisions are reviewed at each balance sheet date and are adjusted to reflect the current best estimate.Contingent liabilities are disclosed when there is a possible obligation arising from past events, the existence of which will be confirmed only by the occurrence or non-occurrence of one or more uncertain future events not wholly within the control of the Company or a present obligation that arises from past events where it is either not probable that an outflow of resources will be required to settle or a reliable estimate of the amount cannot be made. Information on contingent liability is disclosed in the Notes to the Financial Statements. Contingent assets are not recognised. However, when the realisation of income is virtually certain, then the related asset is no longer a contingent asset, but it is recognised as an asset.
13. Borrowing Cost: a. Borrowing costs, less any income on the temporary investment out
of those borrowings, that are directly attributable to acquisition of an asset that necessarily takes a substantial period of time to get ready for its intended use are capitalized as a part of the cost of that asset.
Borrowing costs consist of interest and other costs that an entity incurs in connection with the borrowing of funds. Interest income earned on the temporary investment of specific borrowings pending their expenditure on qualifying assets is deducted from the borrowing costs eligible for capitalisation. Borrowing cost also includes exchange differences to the extent regarded as an adjustment to the borrowing costs.
b. Other borrowing costs are recognized as expense in the period in which they are incurred.
14. Leases: Company as a lessee: a. Assets taken on lease, under which the lessor effectively retains
all the risks and rewards of ownership, are classified as operating lease. Operating lease payments are recognized as expense in the Statement of Profit and Loss on a straight-line basis over the lease term unless payments to the lessor are structured to increase in line with expected general inflation to compensate for the lessor’s expected inflationary cost increase; such increases are recognised in the year in which such benefits accrue.
b. Assets acquired under leases where all the risks and rewards incidental to ownership are substantially transferred to the Company are classified as Finance leases. Such leases are capitalized at the inception of the lease at the lower of fair value or the present value of minimum lease payments and liability is created for an equivalent amount. Each lease rental paid is allocated between the liability and interest cost so as to obtain a constant periodic rate of interest on the outstanding liability for each year.
15. Cash and Cash equivalents : Cash and cash equivalents comprise cash at bank and in hand, cheques
in hand and deposits with banks having maturity period less than three months from the date of acquisition, which are subject to an insignificant risk of changes in value
For the purpose of statement of cash flows, cash and cash equivalents consist of cash and short-term deposits as defined above net of outstanding bank overdrafts as they are considered an integral part of the Company’s cash management policy.
16. Earnings per share The earnings considered in ascertaining the Company’s Earnings Per
Share (EPS) is the net profit/ (loss) after tax. The number of shares used in computing basic EPS is the weighted average number of shares outstanding during the period/year. The diluted EPS is calculated on the same basis as basic EPS, after adjusting for the effects of potential dilutive equity shares unless the effect of the potential dilutive equity shares is anti-dilutive.

GTL Limited14
ADA CELLWORKS WIRELESS ENGINEERING PRIVATE LIMITED
3. PROPERTY, PLANT AND EqUIPMENT
Leasehold Improve-
ment
Furniture & fixtures
Office equipments
Computers Project Equipment / Tool kit
Total of Property, plant and
equipment
Capital Work in Progress
` ` ` ` ` ` `
Deemed Cost (Refer Note No 3.1) NIL NIL NIL NIL NIL NIL NIL
At 1 April 2015
Additions NIL NIL NIL NIL NIL NIL NIL
Disposals NIL NIL NIL NIL NIL NIL NIL
At 31 March 2016 NIL NIL NIL NIL NIL NIL NIL
Additions NIL NIL NIL NIL NIL NIL NIL
Disposals NIL NIL NIL NIL NIL NIL NIL
At 31 March 2017 NIL NIL NIL NIL NIL NIL NIL
Depreciation and impairment
At 1 April 2015 NIL NIL NIL NIL NIL NIL NIL
Depreciation charge for the year NIL NIL NIL NIL NIL NIL NIL
Disposals NIL NIL NIL NIL NIL NIL NIL
At 31 March 2016 NIL NIL NIL NIL NIL NIL NIL
Depreciation charge for the year NIL NIL NIL NIL NIL NIL NIL
Disposals NIL NIL NIL NIL NIL NIL NIL
At 31 March 2017 NIL NIL NIL NIL NIL NIL NIL
Net Book Value
At 31 March 2017 NIL NIL NIL NIL NIL NIL NIL
At 31 March 2016 NIL NIL NIL NIL NIL NIL NIL
At 1 April 2015 NIL NIL NIL NIL NIL NIL NIL
3.1 For Property, Plant and equipment and Capital work in progress as on 1 April 2015, i.e., its date of transition to Ind AS, the Company has used Indian GAAP carrying value as deemed costs.
3.2 In accordance with the Indian Accounting Standard (Ind AS 36) on “Impairment of Assets” the Management carried out an exercise of identifying assets that may have been impaired and on the basis of this review carried out by the Management, there was no impairment loss on Property, plant and equipment during the year ended March 31, 2017 and March 31, 2016
4. INVESTMENTS (NON CURRENT)
Particulars 31 March 2017 31 March 2016 01 April 2015
Numbers ` Numbers ` Numbers `
Investments at cost (fully paid)
Trade
Other
Investments in Corpxcel Advisory LLP (Face Value of Rs. 10/- each) 50000 - 50000 - 50000 -
Total of Un-quoted Investments in Equity Shares – Trade - - -
Total Investments - - -
Aggregate Amount of unquoted investments - - -

ADA CELLWORKS WIRELESS ENGINEERING PRIVATE LIMITED
29th Annual Report 2016-17 15
5. LOANS (NON CURRENT)
31 March 2017
31 March 2016
1 April 2015
` ` `
Unsecured, Considered good
Deposits with body corporates and others 25,000 25,000 25,000
Deposits with government authorities NIL NIL NIL
Total 25,000 25,000 25,000
6. TRADE RECEIVABLES
31 March 2017
31 March 2016
1 April 2015
` ` `
Trade receivables Unsecured,
considered good 2,206,123 2,206,123 2,206,123
Doubtful 73,162,089 73,162,089 70,955,966
75,368,212 75,368,212 73,162,089
Allowance for credit losses (73,162,089) (73,162,089) (70,955,966)
(73,162,089) (73,162,089) (70,955,966)
Total 2,206,123 2,206,123 2,206,123
6.1 The Company has sought the balance confirmations from the customers and has received such confirmations from some customers. In respect of remaining customers, balances are subject to confirmation and appropriate adjustment, if necessary, will be considered in the year of reconciliation.
7. CASH AND CASH EqUIVALENTS
31 March 2017
31 March 2016
1 April 2015
` ` `
Balances with banks
In current accounts 2,897,312 2,897,312 2,897,312
Cash on hand NIL NIL NIL
2,897,312 2,897,312 2,897,312
7.1 Details of Specified Bank Notes (SBN) held and transacted during the period from 8th November, 2016 to 30th December, 2016 is as provided in the Table below:
SBN’s Other Denomination
notes
Total
` ` `
Closing Balance in hand as on 08.11.2016 NIL NIL NIL
(+) Permitted receipts NIL NIL NIL
(-) Permitted payments NIL NIL NIL
(-) Amount deposited in Banks NIL NIL NIL
Closing cash in hand as on 30.12.2016 NIL NIL NIL
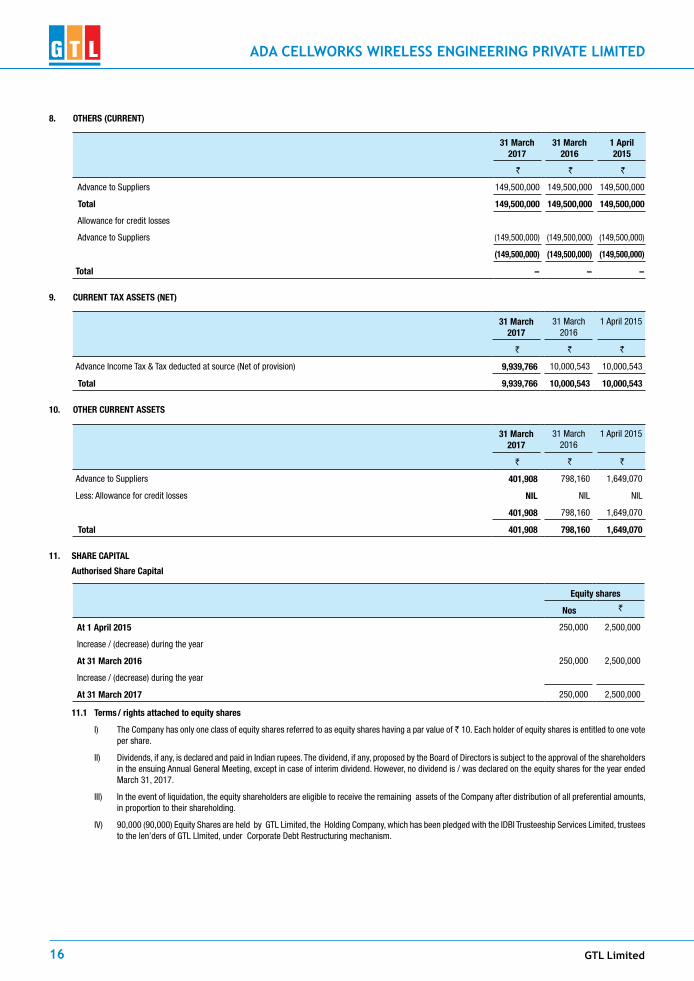
GTL Limited16
ADA CELLWORKS WIRELESS ENGINEERING PRIVATE LIMITED
8. OTHERS (CURRENT)
31 March 2017
31 March 2016
1 April 2015
` ` `
Advance to Suppliers 149,500,000 149,500,000 149,500,000
Total 149,500,000 149,500,000 149,500,000
Allowance for credit losses
Advance to Suppliers (149,500,000) (149,500,000) (149,500,000)
(149,500,000) (149,500,000) (149,500,000)
Total - - -
9. CURRENT TAX ASSETS (NET)
31 March 2017
31 March 2016
1 April 2015
` ` `
Advance Income Tax & Tax deducted at source (Net of provision) 9,939,766 10,000,543 10,000,543
Total 9,939,766 10,000,543 10,000,543
10. OTHER CURRENT ASSETS
31 March 2017
31 March 2016
1 April 2015
` ` `
Advance to Suppliers 401,908 798,160 1,649,070
Less: Allowance for credit losses NIL NIL NIL
401,908 798,160 1,649,070
Total 401,908 798,160 1,649,070
11. SHARE CAPITAL
Authorised Share Capital
Equity shares
Nos `
At 1 April 2015 250,000 2,500,000
Increase / (decrease) during the year
At 31 March 2016 250,000 2,500,000
Increase / (decrease) during the year
At 31 March 2017 250,000 2,500,000
11.1 Terms / rights attached to equity shares
I) The Company has only one class of equity shares referred to as equity shares having a par value of ` 10. Each holder of equity shares is entitled to one vote per share.
II) Dividends, if any, is declared and paid in Indian rupees. The dividend, if any, proposed by the Board of Directors is subject to the approval of the shareholders in the ensuing Annual General Meeting, except in case of interim dividend. However, no dividend is / was declared on the equity shares for the year ended March 31, 2017.
III) In the event of liquidation, the equity shareholders are eligible to receive the remaining assets of the Company after distribution of all preferential amounts, in proportion to their shareholding.
IV) 90,000 (90,000) Equity Shares are held by GTL Limited, the Holding Company, which has been pledged with the IDBI Trusteeship Services Limited, trustees to the len’ders of GTL LImited, under Corporate Debt Restructuring mechanism.

ADA CELLWORKS WIRELESS ENGINEERING PRIVATE LIMITED
29th Annual Report 2016-17 17
11.2 Issued equity capital
Equity shares of ` 10 each issued, subscribed and fully paid No. `
At 1 April 2015 90,000 900,000
Changes during the year
At 31 March 2016 90,000 900,000
Changes during the year
At 31 March 2017 90,000 900,000
11.3 Details of shareholders holding more than 5% shares in the company
Name of the shareholder As at 31 March 2017 As at 31 March 2016 As at 01 April 2015
No. in % holding in the class
No. in % holding in the class
No. in % holding in the class
Equity Shares
GTL Limited, the Holding Company 90,000 100% 90,000 100% 90,000 100%
12. TRADE PAYABLES
31 March 2017
31 March 2016
1 April 2015
` ` `
Trade payables NIL 151,525 84,270
Trade payables to related parties (refer note 23.1) NIL NIL NIL
NIL 151,525 84,270
12.1 The Company has sought the balance confirmations from the trade payable and has received such confirmations from some trade payable. In respect of remaining trade payable, balances are subject to confirmation and appropriate adjustment, if necessary, will be considered in the year of reconciliation.
12.2 Disclosure in accordance with Micro, Small and Medium Enterprises Development (MSMED) Act, 2006. The information required to be disclosed has been furnished to the extent parties have been identified as Micro, Small and Medium Enterprises on the basis of information available in this regard with the Company.
Particulars 31 March 2017
31 March 2016
1 April 2015
` ` `
Principal amount remaining unpaid NIL NIL NIL
Interest due thereon
The amount of interest paid in terms of section 16, along with the amounts of the payment made beyond the appointed day during accounting year
NIL NIL NIL
The amount of interest due and payable for the period (where the principal has been paid but interest under the MSMED Act, 2006 not paid);
NIL NIL NIL
The amount of interest accrued and remaining unpaid at the end of accounting year NIL NIL NIL
The amount of further interest due and payable even in the succeeding year, until such date when the interest dues as above are actually paid to the small enterprise, for the purpose of disallowance as a deductible expenditure under section 23.
NIL NIL NIL
13. OTHER FINANCIAL LIABILITIES
31 March 2017
31 March 2016
1 April 2015
` ` `
Accrued expenses 125,000 125,000 250,000
125,000 125,000 250,000

GTL Limited18
ADA CELLWORKS WIRELESS ENGINEERING PRIVATE LIMITED
14. OTHER CURRENT LIABILITIES
31 March 2017
31 March 2016
1 April 2015
` ` `
Withholding and other taxes payable NIL 23,000 NIL
NIL 23,000 NIL
15. OTHER EXPENSES
31 March 2017
31 March 2016
` `
Legal and Professional Fees 96,728 462,808
Auditor’s Remuneration 125,000 125,000
Allowance for credit losses - Trade Receivables NIL 2,206,123
Other Expenses NIL 228,357
221,728 3,022,288
15.1 Payments to the auditor:
31 March 2017
31 March 2016
` `
As auditor
Audit fee 125,000 125,000
Tax audit fee NIL NIL
VAT Audit Fees NIL NIL
In other capacity:
Other services (certification fees) NIL NIL
Reimbursement of expenses NIL NIL
125,000.00 125,000.00
16. EARNINGS PER SHARE (EPS)
31 March 2017
31 March 2016
` `
Loss after tax :
Continuing operations (282,506) (3,022,288)
Loss attributable to equity holders of continuing operations for basic earnings (282,506) (3,022,288)
Loss attributable to equity holders of discontinued operations for basic earnings NIL NIL
Loss attributable to equity holders total operations for basic earnings (282,506) (3,022,288)
Weighted average number of Equity shares for basic EPS 90,000 90,000
Weighted average earnings per share (basic and diluted) (continuing operations) (3.14) (33.58)
Weighted average earnings per share (basic and diluted) (discontinued operations) NIL NIL
Weighted average earnings per share (basic and diluted) (total operations) (3.14) (33.58)
16.1. There have been no other transactions involving Equity shares or potential Equity shares between the reporting date and the date of authorisation of these financial statements.
16.2. There were no potentially dilutive equity shares which would have been outstanding as at the year end

ADA CELLWORKS WIRELESS ENGINEERING PRIVATE LIMITED
29th Annual Report 2016-17 19
17. SIGNIFICANT ACCOUNTING jUDGEMENTS, ESTIMATES AND ASSUMPTIONS
The preparation of the Company’s Standalone financial statements requires management to make judgements, estimates and assumptions that affect the reported amounts of revenues, expenses, assets and liabilities and the accompanying disclosures, and the disclosure of contingent liabilities. Uncertainty about these assumptions and estimates could result in outcomes that require a material adjustment to the carrying amount of assets or liabilities affected in future periods.
judgements
In the process of applying the Company’s accounting policies, management has made the following judgements, which have the most significant effect on the amounts recognised in the Standalone financial statements:
Estimates and assumptions
The key assumptions concerning the future and other key sources of estimation uncertainty at the reporting date, that have a significant risk of causing a material adjustment to the carrying amounts of assets and liabilities within the next financial year, are described below. The Company based its assumptions and estimates on parameters available when the standalone financial statements were prepared. Existing circumstances and assumptions about future developments, however, may change due to market changes or circumstances arising that are beyond the control of the Company. Such changes are reflected in the assumptions when they occur.
The Management believes that the judgments and estimates used in preparation of financial statement are prudent and reasonable.
Taxes
Deferred tax assets are recognised for unused tax losses to the extent that it is probable that taxable profit will be available against which the losses can be utilised. Significant management judgement is required to determine the amount of deferred tax assets that can be recognised, based upon the likely timing and the level of future taxable profits.
Defined benefit plans (gratuity benefits)
The cost of the defined benefit gratuity plan and the present value of the gratuity obligation are determined using actuarial valuations. An actuarial valuation involves making various assumptions that may differ from actual developments in the future. These include the determination of the discount rate, future salary increases and mortality rates. Due to the complexities involved in the valuation and its long-term nature, a defined benefit obligation is highly sensitive to changes in these assumptions. All assumptions are reviewed at each reporting date.
Fair value measurement of financial instruments
When the fair values of financial assets and financial liabilities recorded in the balance sheet cannot be measured based on quoted prices in active markets, their fair value is measured using valuation techniques including the DCF model. The inputs to these models are taken from observable markets where possible, but where this is not feasible, a degree of judgement is required in establishing fair values. Judgements include considerations of inputs such as liquidity risk, credit risk and volatility. Changes in assumptions about these factors could affect the reported fair value of financial instruments. See Note 42 for further disclosures.
Allowances for credit loss on Trade Receivable, Advance to supplier and other receivable
The Provision for allowances for credit loss for Trade Receivable , Advance to supplier and other receivable are based on assumptions about the risk of defaults and expected credit loss. The Company uses judgment in making these assumption and selecting the inputs to the calculation of provision for allowance based on the Company past history, existing market conditions as well as forward looking estimates at the end of each reporting period.
Provisions for impairment loss on Investment
Provisions for impairment loss on Investment is based on evaluation of financial position of investee companies to meet their obligations for honouring their committements towards the investment held by the Company.
18. FAIR VALUES
Set out below, is a comparison by class of the carrying amounts and fair value of the Company’s financial instruments
Carrying value Fair value
31 Mar 2017 31 Mar 2016 01 Apr 2015 31 Mar 2017 31 Mar 2016 01 Apr 2015
` ` ` ` ` `
Financial assets
FVTPL financial investments
Investment in Equity Shares - Others
Investments in Corpxcel Advisory LLP - - - - - -
Financial assets designated at amortised cost
Non-current assets
Loans 25,000 25,000 25,000 25,000 25,000 25,000
Current assets
Trade receivables NIL NIL 2,206,123 NIL NIL 2,206,123
Cash and cash equivalents 2,897,312 2,897,312 2,897,312 2,897,312 2,897,312 2,897,312
Total 2,922,312 2,922,312 5,128,435 2,922,312 2,922,312 5,128,435

GTL Limited20
ADA CELLWORKS WIRELESS ENGINEERING PRIVATE LIMITED
Carrying value Fair value
31 Mar 2017 31 Mar 2016 01 Apr 2015 31 Mar 2017 31 Mar 2016 01 Apr 2015
` ` ` ` ` `
Financial liabilities designated at amortised cost
Trade payables NIL 151,525 84,270 NIL 151,525 84,270
Other Financial Liabilities 125,000 125,000 250,000 125,000 125,000 250,000
Total 125,000 276,525 334,270 125,000 276,525 334,270
19. Financial risk management objectives and policies
The Company’s principal financial liabilities comprise of loans and borrowings, trade and other payables, and financial guarantee contracts. The main purpose of these financial liabilities is to manage finance for the Company’s operations. The Company’s principal financial assets includes investments, trade and other receivables, supplier advance and cash and cash equivalents that derive directly from its operations.
The Company is exposed to market risk, credit risk and liquidity risk. The Company’s senior management oversees the management of these risks. The Company’s senior management is supported by Risk Management Group (RMG), Investment committee and Resource committee that advises on financial risks and the appropriate financial risk governance framework for the Company. The Risk Management Group, Investment committee and Resource committee provides assurance to the Company’s senior management that the Company’s financial risk activities are governed by appropriate policies and procedures and that financial risks are identified, measured and managed in accordance with the Company’s policies and risk objectives. It is the Company’s policy that no trading in derivatives for speculative purposes may be undertaken. The Audit Committe of the Board and the Board of Directors review and monitor risk management and mitigation plans. The financial risks are summarised below.
19.1 Market risk
Market risk is the risk that the fair value of future cash flows of a financial instrument will fluctuate because of changes in market prices. Market risk comprises three types of risk: interest rate risk, currency risk and other price risk, such as equity price risk and commodity risk.
19.2 Interest rate risk
Interest rate risk is the risk that the fair value or future cash flow of financial instrument will fluctuate because of changes in market interest rates. However the Company does not carry any loan laibility, therefore the Company is not exposed to significant interest rate risk.
19.3 Foreign currency risk
Foreign currency risk is the risk that the fair value or future cash flows of an exposure will fluctuate because of changes in foreign exchange rates. The Company does not carry any Foreign currancy Asset and liablity therefore the Company is not exposed to significant Foreign currency risk
19.4 Equity price risk
The Company’s investments are in unlisted entities. All the investments of the Company are trade and stratagic investments and therfore are not considered to be exposed or suscptible to market risk.
19.5 Credit risk
Credit risk is the risk that counterparty will not meet its obligations under a financial instrument or customer contract, leading to a financial loss. The Company is exposed to credit risk from its operating activities (primarily trade receivables), deposits with banks and other financial assets.
Trade receivables
Customer credit risk is managed subject to the Company’s established policy, procedures and control relating to customer credit risk management. Credit quality of a customer is assessed based on individual credit limits and defined in accordance with customer assessment. Outstanding customer receivables are regularly monitored.
The Company follows a ‘simplified approach’ (i.e. based on lifetime ECL) for recognition of impairment loss allowance on Trade receivables. For the purpose of measuring lifetime ECL allowance for trade receivables, the Company estimates irrecoverable amounts based on the ageing of the receivable balances. Individual trade receivables are written off when management deems them not to be collectible. The Company does not hold any collateral as security. The contractually agreed terms effectively manage the concentration risk.
Financial Assets
Credit risk from balances with banks is managed by the Company’s treasury department in accordance with the Company’s policy. The Company considers factors such as track record, size of the institution, market reputation and service standards to select the banks with which its balances and deposits are maintained. Generally, the balances are maintained with the institutions with which the Company has also availed borrowings. The Company does not maintain significant cash and deposit balances other than those required for its day to day operations.
19.6 Liquidity risk
Liquidity risk is that the Company will not be able to settle or meet its obligation on time or at reasonable price. Company’s principal sources of liquidity are cash flows generated from its operations.
The Company continues to take various measures such as cost optimisation, improving operating efficiency to increase Company’s operating results and cash flows. Further the Company has made a proposal for a negotiated settlement of debts which has been agreed in principle by all set of lenders.The management is

ADA CELLWORKS WIRELESS ENGINEERING PRIVATE LIMITED
29th Annual Report 2016-17 21
of the view that upon the implementation of the Company’s negotiated settlement proposal, the Company would be in a position to meet its liabilities and continue its operations.
20. Segment Reporting
The Company is engaged in one line of business activity, i.e. Network Planning and Designing and hence, it has only one reportable segment.
21. Related Party Disclosures
There are no transaction with related party during the financial year.
22. Going Concern
GTL Limited, the Holding Company, at its Board Meeting held on April 20, 2010, proposed to merge the Company into its fold. However, no action has so far been taken in this direction by the Holding Company. Since the holding company business operation in “ Network Services”, the company expect to have business opportunity based on past experience of telecom sector. Considering this , the company will be able to realised the asset & discharge the liabilities . Therefore the company prepared financials on “going concern basis” .
23. The previous year figures, wherever necessary, have been regrouped/rearranged/recast to make them comparable with those of the current year.
The accompanying notes form an integral part of the standalone financial StatementAs per our report of even date For and on behalf of the BoardFor V.NAIR & ASSOCIATES ADA Cellworks Wireless Engineering Private Limited Chartered AccountantsFirm Registration No. 106835W
VENUGOPAL NAIR Milind Bapat Sanjay AdvaniProprietor Director DirectorMembership No. 39445Mumbai, April 12,2017

GTL Limited22
INTERNATIONAL GLOBAL TELE-SYSTEMS LIMITED
COMMENTARY OF THE DIRECTORS FOR THE YEAR ENDED 31ST DECEMBER 2016
The directors present the audited financial statements of INTERNATIONAL GLOBAL TELE-SYSTEMS LIMITED (the “Company”) for the year ended 31 December 2016.
PRINCIPAL ACTIVITIES
The principal activities of the Company are to provide telecommunication network services and trading in telecommunication products.
RESULTS
The results for the year are shown in the statement of comprehensive income and related notes.
DIRECTORS
The directors remained in office for the year under review.
STATEMENT OF DIRECTORS’ RESPONSIBILTIES IN RESPECT OF THE FINANCIAL STATEMENTS
The Directors have the following responsibilities in the preparation of financial statements of a Company:
• selectsuitableaccountingpoliciesandapplythemconsistently,
• makejudgementsandestimatesthatarereasonableandprudent,and
• state whether International Financial Reporting Standards have beenfollowed,subjecttoanymaterialdeparturesdisclosedandexplainedinthe financial statements.
GOING CONCERN
Inthelastfewyears,theCompanyhasincurredcashlosses,resultingintheerosion of its entire net worth. The Company’s liabilities are higher than its assets. The Company has made a proposal for a negotiated settlement of its debts which is under discussion with its lenders. The management is of the view that upon the acceptance and implementation of the Company’s negotiatedsettlementproposal,theCompanywouldbeinapositiontomeetits liabilitiesandcontinue itsoperations. Inviewof theabove, theCompanywould be in a position to meet its liabilities and continue its operations. In viewoftheabove,theCompanycontinuestopreparetheresultsona“goingconcern’ basis.
AUDITORS
Theauditors,AccxpertsBusinessSolutionsPteLtd,Singapore,haveindicatedtheirwillingnesstocontinueinofficeuntilthenextAnnualMeeting.
For International Global Tele-Systems LimitedDirector

INTERNATIONAL GLOBAL TELE-SYSTEMS LIMITED
29th Annual Report 2016-17 23
INDEPENDENT AUDITORS’ REPORT
TO THE SHAREHOLDERS OF INTERNATIONAL GLOBAL TELE-SYSTEMS LIMITED
We have carried out a special purpose audit on the accompanying financial statements of INTERNATIONAL GLOBAL TELE-SYSTEMS LIMITED (the “Company”), which comprise of the statement offinancial position as at 31 December 2016, and the statementofprofitor lossandothercomprehensive income,statementofchanges in equity and statement of cash flows for the year then endedassetout inpages4to7,andasummaryofsignificantaccountingpoliciesandotherexplanatoryinformationassetouton pages 8 to 27.
Directors’ responsibilities for the financial statements
The directors are responsible for the preparation and fair presentation of these financial statements in accordance with theInternationalFinancialReportingStandardsandfordesigning,implementing and maintaining such internal control as they determine is necessary to enable the preparation of financial statementsthatarefreefrommaterialmis-statements,whetherdue to fraud or error. They are also responsible for keeping proper accounting records and selecting and applying appropriate accounting policies and making accounting estimates that are reasonable in the circumstances.
Auditors’ responsibility
Ourresponsibility istoexpressanopiniononthesefinancialstatements based on our audit. We conducted our audit in accordance with management requirements as this is a special audit. We comply with ethical requirements and plan and perform the audit to obtain reasonable assurance about whether the financial statements are free from material misstatements.
The auditors consider internal control relevant to the Company’s preparation and fair presentation of the financial statements in order to design audit procedures that are appropriate in the circumstances,butnotforthepurposeofexpressinganopinionon the effectiveness of the Company’s internal control. An audit also includes evaluating the appropriateness of the accounting estimatesmadebythedirectors,aswellasevaluatingtheoverallpresentation of the financial statements.
We believe that the audit evidence we have obtained is sufficient and appropriate to provide a basis for audit opinion.
Opinion
Inouropinion,thefinancialstatementsgiveatrueandfairviewof the financial position of the Company as at 31 December 2016 and of its financial performance and cash flows for the year then ended.
Emphasis of matters
Inherent uncertainty regarding going concernAsexplained inNote2(ii), thedirectorsstate thegoingconcernbasis is appropriate in the preparation of the financial statements on the basis that the Company can continue with its business operations once it is able to negotiate a one-time settlement proposal with the banks which has been made by them. In view of the significance of this uncertainty we consider that it should be drawn to your attention but our opinion is not qualified in this respect.
Other Matters
ThisreportismadesolelyfortheCompany’sshareholders,asabody. Our audit work has been undertaken so that we might state to the Company’s shareholders those matters we are required to state to them in our auditors’ report and for no other purpose. We do not accept or assume responsibility to anyone other than the CompanyandtheCompany’sshareholdersasabody,forourauditwork,forthisreport,orfortheopinionwehaveformed.
Informingouropinion,wereportasfollows:
• Wehavenorelationshipwith,oranyinterestin,theCompanyother than in our capacity as auditors;
• Wehaveobtainedalltheinformationandexplanationsthatwerequired; and
• Inouropinion,properaccountingrecordshavebeenkeptbythe Company as far as it appears from our examination ofthose records.
Priti LakhpatiAccxpertsBusinessSolutionsPteLtdChartered Accountants Date:6March,2017
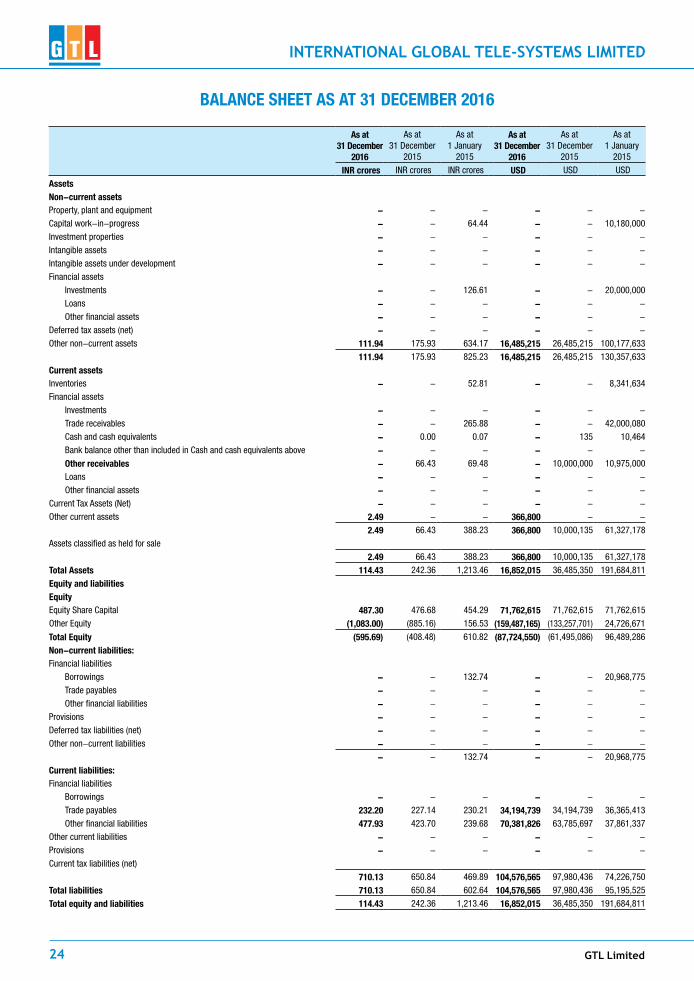
GTL Limited24
INTERNATIONAL GLOBAL TELE-SYSTEMS LIMITED
BALANCE SHEET AS AT 31 DECEMBER 2016
As at 31 December
2016
As at 31 December
2015
As at 1 January
2015
As at 31 December
2016
As at 31 December
2015
As at 1 January
2015
INR crores INR crores INR crores USD USD USD
AssetsNon-current assetsProperty,plantandequipment - - - - - -
Capital work-in-progress - - 64.44 - - 10,180,000
Investment properties - - - - - -
Intangible assets - - - - - -
Intangible assets under development - - - - - -
Financialassets
Investments - - 126.61 - - 20,000,000
Loans - - - - - -
Other financial assets - - - - - -
Deferredtaxassets(net) - - - - - -
Other non-current assets 111.94 175.93 634.17 16,485,215 26,485,215 100,177,633
111.94 175.93 825.23 16,485,215 26,485,215 130,357,633
Current assetsInventories - - 52.81 - - 8,341,634
Financialassets
Investments - - - - - -
Trade receivables - - 265.88 - - 42,000,080
Cash and cash equivalents - 0.00 0.07 - 135 10,464
Bank balance other than included in Cash and cash equivalents above - - - - - -
Other receivables - 66.43 69.48 - 10,000,000 10,975,000
Loans - - - - - -
Other financial assets - - - - - -
CurrentTaxAssets(Net) - - - - - -
Other current assets 2.49 - - 366,800 - -
2.49 66.43 388.23 366,800 10,000,135 61,327,178
Assets classified as held for sale
2.49 66.43 388.23 366,800 10,000,135 61,327,178
Total Assets 114.43 242.36 1,213.46 16,852,015 36,485,350 191,684,811
Equity and liabilitiesEquityEquity Share Capital 487.30 476.68 454.29 71,762,615 71,762,615 71,762,615
Other Equity (1,083.00) (885.16) 156.53 (159,487,165) (133,257,701) 24,726,671
Total Equity (595.69) (408.48) 610.82 (87,724,550) (61,495,086) 96,489,286
Non-current liabilities:Financialliabilities
Borrowings - - 132.74 - - 20,968,775
Trade payables - - - - - -
Other financial liabilities - - - - - -
Provisions - - - - - -
Deferredtaxliabilities(net) - - - - - -
Other non-current liabilities - - - - - -
- - 132.74 - - 20,968,775
Current liabilities:Financialliabilities
Borrowings - - - - - -
Trade payables 232.20 227.14 230.21 34,194,739 34,194,739 36,365,413
Other financial liabilities 477.93 423.70 239.68 70,381,826 63,785,697 37,861,337
Other current liabilities - - - - - -
Provisions - - - - - -
Currenttaxliabilities(net)
710.13 650.84 469.89 104,576,565 97,980,436 74,226,750
Total liabilities 710.13 650.84 602.64 104,576,565 97,980,436 95,195,525
Total equity and liabilities 114.43 242.36 1,213.46 16,852,015 36,485,350 191,684,811

INTERNATIONAL GLOBAL TELE-SYSTEMS LIMITED
29th Annual Report 2016-17 25
STATEMENT OF PROFIT AND LOSS FOR THE YEAR ENDED 31ST DECEMBER, 2016
Year ended Year ended Year ended Year ended
31st Dec., 2016 31stDec.,2015 Restated*
31st Dec., 2016 31stDec.,2015 Restated*
INR crores INR crores USD USD
Continuing operations
Revenue from operations - - - -
Other income 2.60 17.21 385,440 2,621,628
TOTAL INCOME 2.60 17.21 385,440 2,621,628
EXPENSES
Cost of materials consumed - - - -
Purchasesofstock-in-trade - - - -
Changesininventoriesoffinishedgoods,stock-in-tradeandwork-in-progress
- 54.75 - 8,341,634
Employeebenefitsexpenses - - - -
Financecosts 44.45 34.60 6,593,264 5,271,485
Depreciationandamortisationexpenses - - - -
Otherexpenses 134.97 964.76 20,021,640 146,992,881
TOTAL EXPENSES 179.42 1054.11 26,614,904 160,606,000
Profit/(loss) before exceptional items and tax from continuing operations
(176.82) (1036.90) (26,229,464) (157,984,372)
Exceptional items
(176.82) (1036.90) (26,229,464) (157,984,372)
Tax expenses
Profit/(loss) before tax from continuing operations
PROFIT FOR THE YEAR FROM CONTINUING OPERATIONS (176.82) (1036.90) (26,229,464) (157,984,372)
Discontinued operations:
Profit/(loss) for the year (176.82) (1036.90) (26,229,464) (157,984,372)
Other Comprehensive Income
Total Comprehensive Income for the period, net of tax (176.82) (1036.90) (26,229,464) (157,984,372)

GTL Limited26
INTERNATIONAL GLOBAL TELE-SYSTEMS LIMITEDST
ANDA
LONE
STA
TEM
ENT
OF C
HANG
ES IN
EqU
ITY
FOR
THE
YEAR
END
ED 3
1 DE
CEM
BER
2016
a.
Shar
e Ca
pita
l:
Shar
es o
f USD
1 e
ach
issu
ed, s
ubsc
ribed
and
fully
pai
d N
os U
SD IN
R cr
ores
At 1
Jan
uary
201
571,76
2,615
71,762,615
454
.29
Issu
e of
sha
re c
apita
l (No
te 1
7) -
-
At 3
1 De
cem
ber 2
015
71,76
2,615
71,762,615
476
.68
Issu
e of
sha
re c
apita
l (No
te 1
7) -
-
At 3
1 De
cem
ber 2
016
71,
762,
615
71,
762,
615
487
.30
b.
Othe
r Equ
ity:
Fo
r the
yea
r end
ed 3
1 De
cem
ber 2
016
Part
icul
ars
Equi
ty
com
pone
nt
of c
ompo
und
finan
cial
in
stru
men
t (N
ote
18)
Rese
rves
& S
urpl
usIte
ms
of O
CITo
tal e
quity
Capi
tal R
eser
ve
(Not
e 18
)Ca
pita
l Re
dem
ptio
n Re
serv
e (N
ote
18)
Secu
ritie
s pr
emiu
m a
ccou
nt
(Not
e 18
)
Debe
ntur
e Re
dem
ptio
n Re
serv
e (N
ote
18)
Gene
ral r
eser
ve
(Not
e 18
)Ba
lanc
e in
St
atem
ent o
f Pr
ofit
and
Loss
(N
ote
18)
FVTO
CI re
serv
e (N
ote
18)
INR
cror
esIN
R cr
ores
INR
cror
esIN
R cr
ores
INR
cror
esIN
R cr
ores
INR
cror
esIN
R cr
ores
INR
cror
es
As a
t 31s
t Dec
embe
r 201
5 -
- -
- -
-(8
85.1
6) -
(885
.16)
NetP
rofitfortheperiod
(176
.82)
(176
.82)
Foreigncurrencytranslationeffects
(21.
02)
(21.
02)
Tota
l com
preh
ensi
ve in
com
e -
- -
- -
-(1
97.8
4) -
(197
.84)
Tran
sfer
to
Bala
nce
in S
tate
men
t of
ProfitandLoss
- -
- -
- -
- -
-
As a
t 31
Dece
mbe
r 201
6 -
- -
- -
-(1
083.
00)
-(1
083.
00)
Fo
r the
yea
r end
ed 3
1 De
cem
ber 2
015
Part
icul
ars
Equi
ty
com
pone
nt
of c
ompo
und
finan
cial
in
stru
men
t (N
ote
18)
Rese
rves
& S
urpl
usIte
ms
of O
CITo
tal e
quity
Capi
tal R
eser
ve
(Not
e 18
)Ca
pita
l Re
dem
ptio
n Re
serv
e (N
ote
18)
Secu
ritie
s pr
emiu
m a
ccou
nt
(Not
e 18
)
Debe
ntur
e Re
dem
ptio
n Re
serv
e (N
ote
18)
Gene
ral r
eser
ve
(Not
e 18
)Ba
lanc
e in
St
atem
ent o
f Pr
ofit
and
Loss
(N
ote
18)
FVTO
CI re
serv
e (N
ote
18)
INR
cror
esIN
R cr
ores
INR
cror
esIN
R cr
ores
INR
cror
esIN
R cr
ores
INR
cror
esIN
R cr
ores
INR
cror
es
As a
t 1st
Jan
uary
201
5 -
- -
- -
-15
1.08
-15
1.08
NetP
rofitfortheperiod
(103
6.90
)(1
036.
90)
Foreigncurrencytranslationeffects
0.66
0.66
Tota
l com
preh
ensi
ve in
com
e -
- -
- -
-(1
036.
24)
-(1
036.
24)
Tran
sfer
to
Bala
nce
in S
tate
men
t of
ProfitandLoss
- -
- -
- -
- -
-
As a
t 31
Dece
mbe
r 201
6 -
- -
- -
-(8
85.1
6) -
(885
.16)

INTERNATIONAL GLOBAL TELE-SYSTEMS LIMITED
29th Annual Report 2016-17 27
31 December 2016 31 December 2015 31 December 2016 31 December 2015
INR crores INR crores USD USD
Operating activities
Profitbeforetaxfromcontinuingoperations (176.81) (1,036.90) (26,229,464) (157,984,372)
Profit/(loss)beforetaxfromdiscontinuedoperations
Profit before tax (176.81) (1,036.90) (26,229,464) (157,984,372)
Adjustmentstoreconcileprofitbeforetaxtonetcashflows:
Impairment losses 134.82 1,019.27 20,000,000 155,297,323
Liabilities/provisionsnolongerrequiredwrittenback (2.60) (17.21) (385,440) (2,621,628)
Workingcapitaladjustments:
Increase/(decrease)intradepayables,othercurrentandnoncurrentliabilities and provisions
44.44 34.60 6,593,129 5,271,485
(0.15) (0.24) (21,775) (37,192)
Incometaxpaid(includingTDS)(net)
Net cash flows from operating activities (0.15) (0.24) (21,775) (37,192)
Investing activities
Proceedsfromsaleofproperty,plantandequipment - - - -
Purchaseofproperty,plantandequipment(includingCWIP) - - - -
Interest received (finance income) - - - -
Net cash flows from / (used in) investing activities - - - -
Financing activities
Fundsreceivedfromrelatedcompanies 0.15 0.18 21,640 26,863
Dividenddistributiontax - - - -
Net cash flows from / (used in) financing activities 0.15 0.18 21,640 26,863
Net increase / (decrease) in cash and cash equivalents (0.00) (0.07) (135) (10,329)
Cash and cash equivalents at the beginning of the year 0.00 0.07 135 10,464
Cash and cash equivalents at the end - 0.00 - 135
STATEMENT OF CASH FLOwS FOR THE YEAR ENDED 31 DECEMBER 2016

GTL Limited28
INTERNATIONAL GLOBAL TELE-SYSTEMS LIMITED
Note 3: Property, plant and equipment
Freehold land
Leasehold land
Buildings Capital work in Progress
Total Capital work in Progress
Total
INR crores INR crores INR crores INR crores INR crores USD USD
Cost
At 1 January 2015 - - - 64.44 64.44 10,180,000 10,180,000
Additions - - - - - - -
Disposals - - - (64.44) (64.44) (10,180,000) (10,180,000)
At 31 December 2015 - - - - - - -
Additions - - - - - - -
Discontinued operations (Note XX) - - - - - - -
At 31 December 2016 - - - - - - -
Depreciation and impairment
At 1 January 2015 - - - - - - -
Depreciation charge for the year - - - - - - -
Disposals - - - - - - -
At 31 December 2015 - - - - - - -
Depreciation charge for the year** - - - - - - -
Discontinued operations - - - - - - -
At 31 December 2016 - - - - - - -
Net Book Value
At 31 December 2016 - - - - - - -
At 31 December 2015 - - - - - - -
At 1 January 2015 - - - 64.44 64.44 10,180,000 -
Net Book Value
At 31 December
2016
At 31 December
2015
At 1 January 2015
At 31 December
2016
At 31 December
2015
At 1 January 2015
INR crores INR crores INR crores USD USD USD
Plant,propertyandequipment - - - - - -
CapitalWorkinProgress - - 64.44 - - 10,180,000
SCHEDULES TO THE FINANCIAL STATEMENTS FOR THE YEAR ENDED AND AS AT 31 DECEMBER 2016

INTERNATIONAL GLOBAL TELE-SYSTEMS LIMITED
29th Annual Report 2016-17 29
Note 7: Financial assets 31 December
2016 31 December
2015 1 January 2015 31 December
2016 31 December
2015 1 January 2015
INR crores INR crores INR crores USD USD USDInvestmentsInvestments at cost (fully paid)InvestmentinPreferenceShares-Others3.5%PreferenceSharesofCityWindsorLtdofUSD1 each
135.81 132.85 126.61 20,000,000 20,000,000 20,000,000
Less: Diminution in value of investments (135.81) (132.85) - (20,000,000) (20,000,000) -
Total Investments - - 126.61 - - 20,000,000Aggregate value of unquoted investments - - 126.61 - - 20,000,000
Total financial assets - - 126.61 - - 20,000,000
Note 8: Other non-current assets 31 December
2016 31 December
2015 1 January 2015 31 December
2016 31 December
2015 1 January 2015
INR crores INR crores INR crores USD USD USDAdvance to Suppliers 680.26 665.43 634.17 100,177,633 100,177,633 100,177,633Less:Provisionfordoubtfuladvances (568.31) (489.50) - (83,692,418) (73,692,418) -
111.94 175.93 634.17 16,485,215 26,485,215 100,177,633
Note 9: Inventories 31 December
2016 31 December
2015 1 January 2015 31 December
2016 31 December
2015 1 January 2015
INR crores INR crores INR crores USD USD USDFinishedgoods(atlowerofcostandnetrealisablevalue)
- - 52.81 - - 8,341,634
Total inventories at the lower of cost and net realisable value
- - 52.81 - - 8,341,634
Note 11: Trade and other receivables 31 December
2016 31 December
2015 1 January 2015 31 December
2016 31 December
2015 1 January 2015
INR crores INR crores INR crores USD USD USDTrade receivables 458.10 448.11 420.89 67,461,673 67,461,673 66,486,673Total Trade and other receivables 458.10 448.11 420.89 67,461,673 67,461,673 66,486,673
31 December 2016
31 December 2015
1 January 2015 31 December 2016
31 December 2015
1 January 2015
INR crores INR crores INR crores USD USD USDTrade receivablesSecured,consideredgood - - 265.88 - - 42,000,080Doubtful 458.10 448.11 155.01 67,461,673 67,461,673 24,486,593
458.10 448.11 420.89 67,461,673 67,461,673 66,486,673
Impairment Allowance (allowance for bad and doubtful debts)Doubtful (458.10) (448.11) (155.01) (67,461,673) (67,461,673) (24,486,593)
(458.10) (448.11) (155.01) (67,461,673) (67,461,673) (24,486,593)
Total trade receivables - - 265.88 - - 42,000,080
Trade receivables are non-interest bearing and are generally on terms of 30 to 90 days.

GTL Limited30
INTERNATIONAL GLOBAL TELE-SYSTEMS LIMITED
Note 12: Cash and cash equivalents 31 December
2016 31 December
2015 1 January 2015 31 December
2016 31 December
2015 1 January 2015
INR crores INR crores INR crores USD USD USDBalances with banksIn current accounts - 0.00 0.07 135 10,464In deposit accountsCheques on handCash on hand
- 0.00 0.07 - 135 10,464
Note 14: Other receivables 31 December
2016 31 December
2015 1 January 2015 31 December
2016 31 December
2015 1 January 2015
INR crores INR crores INR crores USD USD USD Interest receivable - - 6.17 975,000 Share application monies 67.91 66.43 63.31 10,000,000 10,000,000 10,000,000 Less: allowance for doubtful advances (67.91) - - (10,000,000) - -
- 66.43 69.48 - 10,000,000 10,975,000
Note 16: Other current assets 31 December
2016 31 December
2015 1 January 2015 31 December
2016 31 December
2015 1 January 2015
INR crores INR crores INR crores USD USD USDPrepaidexpenses Deposit towards negotiated settlement - lenders 2.49 - - 366,800
2.49 - - 366,800 - -
Note 14: Share Capital
Authorised Share Capital
Equity shares Preference shares
Nos. INR crores Nos. INR crores
At 1 January 2015 2,762,615 17 69,000,000 436.80
Increase/(decrease)duringtheyear - 1 - 21.53
At 31 December 2016 2,762,615 18 69,000,000 458.33
Increase/(decrease)duringtheyear - 0 - 10.21
At 31 December 2017 2,762,615 19 69,000,000 468.54
Issued equity capital
Equity shares of USD 1 each issued, subscribed and fully paid
Nos. INR crores Nos. USD
At 1 January 2015 2,762,615 17.49 2,762,615 2,762,615.00
Changes during the year - - - -
At 31 December 2016 2,762,615 18.35 2,762,615 2,762,615.00
Changes during the year - - - -
At 31 December 2017 2,762,615 18.76 2,762,615 2,762,615.00
Note 15: Other equity
Translation Reserve
INR crores USD
At 1 January 2015 5.45 -
At 31 December 2015 0.66 -
At 31 December 2016 (20.36) -

INTERNATIONAL GLOBAL TELE-SYSTEMS LIMITED
29th Annual Report 2016-17 31
Balance in Statement of Profit and Loss
INR crores USD
At 1 January 2015 151.08 24,726,671
Add:Profitduringtheyear (1,036.90) (157,984,372)
At 31 December 2016 (885.82) (133,257,701)
Add:Profitduringtheyear (176.82) (26,229,464)
At 31 December 2017 (1,062.64) (159,487,165)
Total other equity
At 1 January 2015 156.53 24,726,671
At 31 December 2016 (885.16) (133,257,701)
At 31 December 2017 (1,083.00) (159,487,165)
Note 19: Borrowings
31 December 2016
31 December 2015
1 January 2015 31 December 2016
31 December 2015
1 January 2015
INR crores INR crores INR crores USD USD USD
Non-current borrowings
Non-current interest bearing loans and borrowings:
Secured Loans
Term loans - Bank of Baroda, Dubai - - 132.74 20,968,775
Total secured loans - - 132.74 - - 20,968,775
Total non-current interest bearing loans and borrowings
- - 132.74 - - 20,968,775
Note 25: Trade payables
31 December 2016
31 December 2015
1 January 2015 31 December 2016
31 December 2015
1 January 2015
INR crores INR crores INR crores USD USD USD
Trade payables - - - - - -
Trade payables to related parties 232.20 227.14 230.21 34,194,739 34,194,739 36,365,413
232.20 227.14 230.21 34,194,739 34,194,739 36,365,413
Note 26: Other financial liabilities
31 December 2016
31 December 2015
1 January 2015 31 December 2016
31 December 2015
1 January 2015
INR crores INR crores INR crores USD USD USD
Current maturities of long term debt
Credit facilities from bank - due 176.15 172.31 164.21 25,940,050 25,940,050 25,940,050
Loan from bank - due 142.39 139.29 - 20,968,775 20,968,775 -
Interest accrued and due on borrowings 159.34 112.07 73.44 23,465,001 16,871,872 11,600,387
ExpenseCreditors 0.05 0.03 2.03 8,000 5,000 320,900
477.93 423.70 239.68 70,381,826 63,785,697 37,861,337
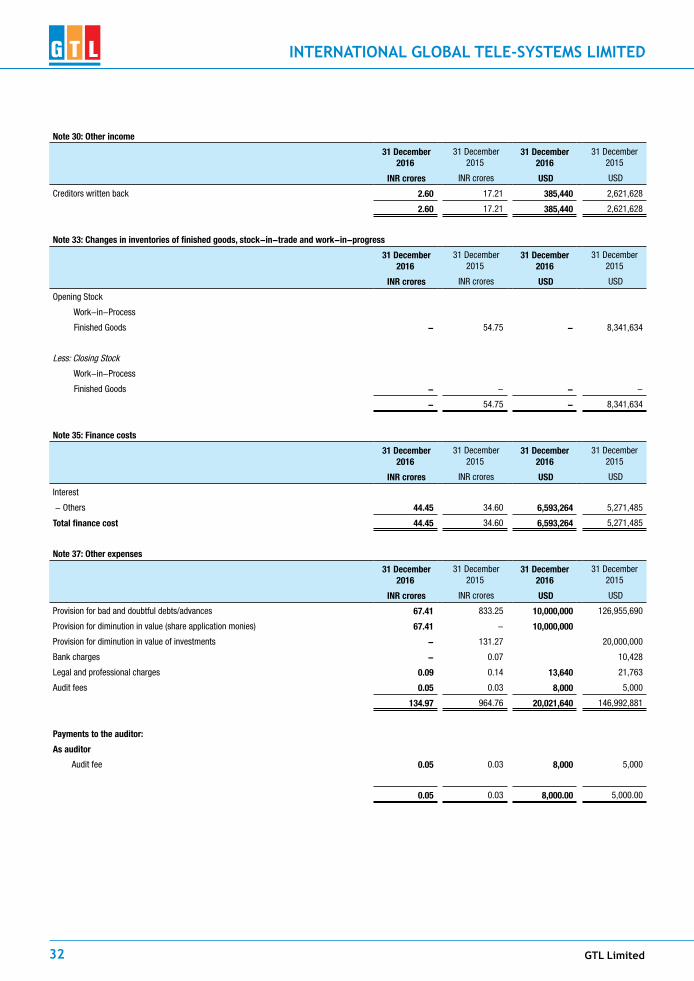
GTL Limited32
INTERNATIONAL GLOBAL TELE-SYSTEMS LIMITED
Note 30: Other income
31 December 2016
31 December 2015
31 December 2016
31 December 2015
INR crores INR crores USD USD
Creditors written back 2.60 17.21 385,440 2,621,628
2.60 17.21 385,440 2,621,628
Note 33: Changes in inventories of finished goods, stock-in-trade and work-in-progress
31 December 2016
31 December 2015
31 December 2016
31 December 2015
INR crores INR crores USD USD
Opening Stock
Work-in-Process
FinishedGoods - 54.75 - 8,341,634
Less: Closing Stock
Work-in-Process
FinishedGoods - - - -
- 54.75 - 8,341,634
Note 35: Finance costs
31 December 2016
31 December 2015
31 December 2016
31 December 2015
INR crores INR crores USD USD
Interest
- Others 44.45 34.60 6,593,264 5,271,485
Total finance cost 44.45 34.60 6,593,264 5,271,485
Note 37: Other expenses
31 December 2016
31 December 2015
31 December 2016
31 December 2015
INR crores INR crores USD USD
Provisionforbadanddoubtfuldebts/advances 67.41 833.25 10,000,000 126,955,690
Provisionfordiminutioninvalue(shareapplicationmonies) 67.41 - 10,000,000
Provisionfordiminutioninvalueofinvestments - 131.27 20,000,000
Bank charges - 0.07 10,428
Legal and professional charges 0.09 0.14 13,640 21,763
Audit fees 0.05 0.03 8,000 5,000
134.97 964.76 20,021,640 146,992,881
Payments to the auditor:
As auditor
Audit fee 0.05 0.03 8,000 5,000
0.05 0.03 8,000.00 5,000.00

INTERNATIONAL GLOBAL TELE-SYSTEMS LIMITED
29th Annual Report 2016-17 33
1. General information
The Company was incorporated in Mauritius on 10 July 1995 as a private company with limited liability. The Company held a Category 1 Global BusinessLicenseandafterconversionof thestatuson16February2010,itnowholdsinCategory2GlobalBusinessLicenseissuedbytheFinancialServicesCommission.TheCompany’sregisteredofficeisat5thFloor,BarklyWharf,LeCaudanWaterfront,PortLouis,Mauritius.
The principal activities of the Company are to provide telecommunication network services and also the trading of telecommunication products.
ThefinancialstatementsoftheCompanyareexpressedintheUnitedStatesdollar(“USD”).TheCompany’sfunctionalcurrencyistheUSD,thecurrencyof the primary economic environment in which it operates.
2. Basis of preparation of financial statements
(i) Statement of compliance
The financial statements are prepared in accordance with International Financial Reporting Standards (IFRS),which compriseof standard and interpretations approved by the International Accounting Standards Boards (IASB), and International AccountingStandards and interpretations issued by the International FinancialReporting Interpretations Committee (IFRIC) approved by theInternational Accounting Standards Committee (IASC) that remain in effect. The preparation of financial statements in accordance with IFRSrequirestheuseofestimatesandassumptionsthatcouldaffectthe reported amounts and disclosures in the financial statements. Actual result may differ from those estimates.
(ii) Basis of preparation
Inthelastfewyears,theCompanyhasincurredcashlosses,resultingin the erosion of its entire net worth. The Company’s liabilities are higher than its assets.
The Company has made a proposal for a negotiated settlement of its debts which is under discussion with its lenders. The management is of the view that upon the acceptance and the implementation of the Company’snegotiatedsettlementproposal,theCompanywouldbeina position to meet its liabilities and continue its operations. In view of theabove,theCompanycontinuestopreparetheresultsonagoingconcern basis.
(iii) Basis of accounting
There are no statutory requirements for the Company to have an audit carried out on its financial statements. The financial statements have been prepared and audited solely for the purpose of consolidation by the holding company.
(iv) Changes in accounting policies
(a) AdoptionofnewandrevisedInternationalFinancialReportingStandards(IFRS)
Inthecurrentyear,theCompanyhasadoptedallofthenewand revised Standards and Interpretations issued by the International Accounting Standards Board (“IASB”) and the International Financial Reporting Interpretations Committee(“IFRIC”)of the IASB thatare relevant to itsoperationsandeffective for accounting year beginning on or after 1 January 2016. The accounting policies are consistent with those of thepreviousfinancialyear,exceptforthefollowingnewandamendedIFRS:
Amendments to IAS 1 – The amendments to IAS 1 retain the option to present profit or loss and other comprehensive income in either a single statement or in two separate but consecutive statements. However, the amendments toIAS 1 require additional disclosures to be made in other comprehensive income section of a statement of profit and lossandothercomprehensiveincome,(a)theshareofothercomprehensive income of associates and joint venturesaccounted for using the equity method that will not be
reclassifed subsequently to profit or loss; and (b) the share of other comprehensive income of associates and jointventures accounted for using the hat will not be reclassified subsequently to profit and loss.
An entity need not provide a specific disclosure required by an IFRS if the information resulting from that disclosure isnot material. The amendments to IAS 1 have been applied retrospectively, and hence the presentation of items of theother comprehensive income has been modified to reflect the changes. Other than the above mentioned presentation changes, theapplicationof theamendments to IAS1doesnotresultinanyimpactonprofitorloss,othercomprehensiveincome and total comprehensive income.
(b) Newstandards,amendmentsandinterpretationsissuedandadopted with no effect on financial statements
IFRS5,‘Non-CurrentAssetsHeldforSaleandDiscontinuedOperations
IFRS5,‘Non-CurrentAssetsHeldforSaleandDiscontinuedOperations introducesspecificguidance in IFRS5forwhenan entity reclassifies an asset (or disposal group) from held forsaletoheldfordistributiontoowners(orviceversa),orwhen held for distribution accounting is discontinued.
IFRS7,‘FinancialInstrumentsDisclosures(withconsequentialamendmentstoIFRS1)
IFRS7,‘FinancialInstrumentsDisclosures(withconsequentialamendmentstoIFRS1)addressesamendmentspertaining
(i) provide additional guidance to clarify whether a servicing contract is continuing involvement in a transferred asset for the purpose of the disclosures required in relation to transferred assets; and
(ii) clarifythattheoffsettingdisclosuresarenotexplicitlyrequired for all interim periods.
However, the disclosures may need to be included in thecondensed interim financial statements to company with IAS 34InterimFinancialReporting.
IFRS14,‘RegulatoryDeferralAccounts’
IFRS 14 specifies the accounting for regulatory deferralaccount balances that arise from rate-regulated activities. The Standardisavailableonlytofirst-timeadoptersofIFRSswhorecognized regulatory deferral account balances under their previousGAAP. IFRS14permitseligible first-timeadoptersof IFRSs to continue their previous GAAP rate-regulatedaccounting policies, with limited changes, and requiresseparate presentation of regulatory deferral account balances in the statement of financial position and statement of profit and loss and other comprehensive income. Disclosures are also required to identify thenatureof,andrisksassociatedwith, the form of rate regulation that has given rise to therecognition of regulatory deferral account balances.
The company has not applied the following new and revised IFRSthathasbeenissuedbutisnotyeteffective:
IFRS9,‘Financialinstruments’
IFRS 9, ‘Financial instruments”, address the classification,measurement and recognition of financial assets and financial liabilities, IFRS 9 was issued in November, 2009,October, 2010, July, 2014. It replaces the parts of IAS 39that relate to the classification and measurement of financial instruments.IFRS9requiresfinancialassetstobeclassifiedinto two measurement categories namely those measured as at fair value and those measured at amortised cost. The determination is made at initial recognition. The classification depends on the Company’s business model for managing its financial instruments and the contractual cash flow
NOTES TO THE FINANCIAL STATEMENTS FOR THE YEAR ENDED 31 DECEMBER 2016

GTL Limited34
INTERNATIONAL GLOBAL TELE-SYSTEMS LIMITED
characteristics of the instrument. For financial liabilities,the standard remains most of the IAS 39 requirements. The mainchange is that, incasewhere the fair valueoption istakenfor financial liabilities, thepartofa fairvaluechangedue to a Company’s own credit risk is recorded in other comprehensiveincomeratherthanintheprofitorloss,unlessthis creates an accounting mismatch. The amendment does not result in any significant effect to the Company’s financial statement during the year.
KeyrequirementofIFRS9:
All recognized financial assets that are within the scope of IAS39Financial InstrumentsRecognitionandMeasurementare required to be measured at amortized cost or fair value. Specifically, debt investments that are heldwithin abusinessmodelwhoseobjectivesistocollectthecontractualcash flows, and that have contractual cash flows that aresolely payments of principal and interest on the principal outstanding are generally measured at amortized costs at the end of subsequent account periods. All other debt investments and equity investments are measured at their fair value at the end of subsequent accounting periods.
In addition, under IFRS 9. Entitiesmaymake an irrevocableelection to present subsequent changes in fair value of an equity investment (that is not held for trading), in othercomprehensive income,with only dividend incomegenerallyrecognized in profit or loss. With regard to the measurement of financial liabilities designated as at fair value through profit orloss,IFRS9requiresthattheamountofchangeinthefairvalue of the financial liability that is attributed to changes in the credit risk of that liability is presented in other comprehensive income,unlesstherecognitionoftheeffectofchangesintheliability’s credit risk in other comprehensive income would create or enlarge an accounting mismatch in profit or loss.
Changes in fair value attributable to a financial liability’s credit risk are not subsequently reclassified to profit or loss. UnderIAS39,theentireamountofthechangeinthefairvalueof the financial liability designated as fair value through profit or loss is presented in profit or loss.
The directors of the Company anticipate that the application of IFRS 9 in the future may have a significant impact onaccounts reported in respect of the Company’s financial assetsandfinancialliabilities.However,itisnotpracticabletoprovideareasonableestimateoftheeffectofIFRS9untiladetailed review has been completed.
3. Summary of accounting policies
The principal accounting policies set out below have been applied consistently to all periods presented in these financial statements.
(a) Revenue recognition
Revenue is recognized to the extent that it is probable that theeconomic benefit will flow to the Company and the revenue and costs,ifapplicable,canbemeasuredreliably.Revenueisrecognizedin the statement of comprehensive income as follows:
Revenue is recognized when the services are rendered to the customers which are taken to be the point in time when the customer has accepted the service and the related risks and reward of ownership.Revenueexcludesgoodsandserviceorothersalestaxesandisafterdeductionofanytradediscountsandsalestax.
Dividend income is recognized when the right to receive the payment is established.
Interest income is accounted for on an accrual basis.
(b) Expensesrecognition
AllexpensesoftheCompanyareaccountedforintheprofitorlossonan accrual basis.
(c) Foreigncurrencytransaction
(i) Functionalandpresentationcurrency
Items included in the financial statement of the Company are measured using the currency of the primary economic environmentinwhichitoperates(‘thefunctionalcurrency’).ThefinancialstatementsarepresentedinUSD,whichistheCompany’s functional and presentation currency.
(ii) Transactions and balances
Foreigncurrencytransactionsaretranslatedintothefinancialcurrencyusingtheexchangeratesprevailingatthedatesofthetransactionsorvaluationwhereitemsarere-measured.Foreignexchange gains and losses resulting from the settlement ofsuchtransactionandforthetranslationatperiodendexchangerates of monetary assets and liabilities denominated in foreign currencies are recognized in the profit or loss.
Foreignexchangegainsandlossesthatrelatetoborrowingsand cash and cash equivalents are presented in the profit or loss within ‘finance income or cost’. All other foreignexchangegainsandlossesarepresentedintheprofitorlosswithin‘other(losses)/gainsnet’.
Changes in the fair value of monetary securities denominated in foreign currency classified as available-for-sale are analyzed between translation differences resulting from changes in the amortized cost of the security and other changes in the carrying amount of the security. Translation differences related to changes in amortized cost are recognized in other comprehensive income, and otherchanges in carrying amount are recognized in equity.
Translation differences on non-monetary financial assets and liabilities such as equities held at fair value through profit or loss are recognized in other comprehensive income as part of the fair value gain or loss. Translation differences on non-monetary financial assets are included in equity under ‘Translationreserve’.
(d) Financialinstruments
Financial instruments are recognizedon the statement of financialposition when the Company has become a party to the contractual provisions of the instrument.
(e) Deposits
Deposits represent advances made for the purchase of capital equipment and are recognized at cost.
(f) Investment at fair values
Investments that the Company intends to hold for an indefinite period of time are classified as investment at fair values. These are includedinnon-currentassetsunlessmanagementhasexpresseditsintention of holding the investment for less than twelve months form thereportingdate,inwhichcasetheyareincludedincurrentassets.
Management decides the appropriate classification of its investments at the time of the purchase and re-evaluates the classification on a regular basis.
All purchases and sales of investments are recognized on the trade date,whichisthedatethattheCompanycommitstopurchaseorselltheassets.Costofpurchaseincludestransactioncosts.Fromtimetotime,thedirectorsmayadjustthebasisofthe
valuationoftheseinvestmentsiftheyconsidersuchadjustmentsarerequired to reflect more fairly the value of the investments.
(g) Inventories
Inventories are valued at cost. Cost includes freight and handling chargesandiscomputedonafirstinfirstoutbasis.Provisionismade,wherenecessary,forobsolete,slowmovinganddefectivestock.

INTERNATIONAL GLOBAL TELE-SYSTEMS LIMITED
29th Annual Report 2016-17 35
(h) Trade and other receivables
Trade and other receivables are stated at the principal amount outstanding,netofanyallowanceofuncollectableamount.
(i) Related parties
Related parties are individuals and companies where the individuals orcompanieshavetheability,directlyorindirectlytocontroltheotherpartyorexercisesignificantinfluenceovertheotherpartyinmakingfinancial or operating decisions.
(j) Cashandcashequivalents
Cashcompriseof cashatbanks.Cashequivalentsare short term,highly liquid investments that are readily convertible to known amount of cash and which are subject to an insignificant risk ofchange in value.
(k) Equity
Stated capital is determined using the nominal values of shares that have been disclosed in the profit or loss.
(l) Trade and other payables
Trade payables are obligations to pay for services that have been required in the ordinary course of business from suppliers. Accounts payable are classified as current liabilities if payment is due within one year or less (or in the normal operating cycle of the business (if longer).Ifnot,theyarepresentedasnon-currentliabilities.
Trade payables are recognized at the invoiced amount of goods and services received by the company.
(m) Borrowings
Borrowings have been stated at net amount received and include all borrowing costs.
4. Critical accounting estimates and judgements
Thefollowingarethemanagementjudgmentsmadeinapplyingtheaccountingpolicies of the Company that have the most significant effects on the financial statements. Critical estimation uncertainties are described in Note 5.
(i) Determination of functional currency
The determination of financial currency of the Company is critical since recording of transactions and exchange differences arisingthere are dependent on the functional currency selected. As described innote3c, thedirectorshaveconsideredthosefactorsthereinandhave determined that the functional currency of the Company is the United States dollar (USD)
(ii) Relevance of the going concern assertion
The Company’s activities have been curtailed significantly during the current period due to the adverse economic situation prevailing in thetelecommunicationsector.TheCompany,whichhasbeenintheserviceindustrysinceitsinception,wouldbeinapositiontocontinuewith its business operations.Accordingly, the financial statementshave been prepared on a going concern basis.
(iii) Impairment of financial assets
Management assesses at each reporting date whether there is any objectiveevidencethatafinancialassetorgroupoffinancialassetsis impaired. A financial asset or group of financial assets it deemed to beimpairedif,andonlyif,thereisobjectiveevidenceofimpairmentas a result of one or more events that has occurred after the initial recognitionoftheasset(anincurred‘lossevent’)andthatlossevent(or events) has an impact on the estimated future cash flows of the financial assets that can be reliably estimated. Due to downturn in the telecom industry the company has decided to stall its investment in assets and existing assets are not having economic useful life.Therefore adequate provision has been made for impairment of the said assets by the Company.
(iv) Inventories
TheitemsheldinstockareexclusivelyforprojectsidentifiedbytheCompany but the projects have not fructified. Over the years, duetochanges in technology,obsolescenceandbasedon itsexpected
realizable value, the Company has fully provided for diminution invalue of inventory during the current year.
(v) Advances and deposits
The Company made advance payments / deposits to its suppliersfor procurement of material. The downturn in telecom industry has substantially affected business operations and therefore took conscious decision for not procuring material against the said advances. The suppliers also made claims against the Company for losses incurred by them for not procuring material as per the contracts. The Company and suppliers had a series of meetings for arriving at an amicable solution to resolve the dispute. Under the current circumstances,the Company has done a fair value of the said advances based on expected realization and accordingly as a conservative accountingpractice,aprovisionhasbeenmadeinthebooks.
5. Estimation uncertainty
When preparing the financial statements, management undertakes anumber of judgments, estimates and assumptions about recognition andmeasurementofassets, liabilities, incomeandexpenses.Theactual resultmay differ from the judgments, estimates and assumptions made bymanagement and will seldom equal the estimated results.
6. Share application monies
GTLLimited is in thebusinessof‘networkservices’consistingofnetworkplanninganddesigning,networkrollout,professionalservicesandoperationand maintenance of telecom towers. The network services are provided to network operators and OEMs. The contracts with customers consist of supply ofmaterial,erectionoftowerandtelecomnetworkservices.
GTL Limited (GTL) has two international subsidiaries viz. GTL International Limited (GTIL) and International Global Tele-Systems Limited (iGTL). GTL’s international business is carried out through GTIL’s subsidiaries & iGTL. The GrouphaspresenceinNorthAmerica,Europe,Asia,SAARCandMiddleEast.Considering large opportunities in telecom, GTIL set up its subsidiaries inUSA,Canada,UK,Philippines,Indonesia,SriLanka,BangladeshandNepal.
The application money of US$ Nil (2015: US$ 10,000,000) shown underadvances given was investment made in a company named Global Infrastructure Services Ltd, a company incorporated in the British VirginIslands. The investment was made for inorganic growth of the Group mainly with an intent to later buy out existing network service companies in theAfrican Continent.
The application money was paid out in the year ended 31 March 2012. However, after this application money was invested the telecom marketinternationally has gone through a very bad phase. The global meltdown generally and more so in the telecom sector resulted in the company not having enough opportunities for such inorganic growth.
Inadditiontothatadmissionoftheparentcompany,GTLLimited,intoCDR,also drastically affected the relationship of the company with its customers. vendors and other network service operators. Taking these factors into account,theactualbusinesstake-offofthecompanywasdrasticallyaffected,factors which were beyond the control of the company and the management. Duringthelastfouryearsandmore,themanagementwastryingtorecoverthis amount. However, on account of the above factors and the furthercollapse in the telecom sector in succeeding years, themanagement hasnow taken a conscious decision to fully provide for this application money.
7. Advances on project
2016 2015
USD USD
Advancesonproject 16,485,215 26,485,215
The Company made advance payments to its suppliers for procurement of material. The downturn in telecom industry has substantially affected business operations and therefore the Company took a conscious decision for not procuring material against the said advances. The suppliers also made claims against the Company for losses incurred by them for not procuring material as per the contracts. The Company and the suppliers had a series

GTL Limited36
INTERNATIONAL GLOBAL TELE-SYSTEMS LIMITED
of meetings for arriving at an amicable solution to resolve the dispute. Under thecurrentcircumstances, theCompanyhasdonea fairvalueof thesaidadvances based on expected realization.The Company as a conservativeaccountingpolicyhaswrittenitdownfurtherbyUSD10,000,000(2015:USD73,692,418)duringthecurrentyear.
8. Advance paid
Inthecurrentyear,theCompanyhaspaidanadvanceofUS$366,800foraproposal of negotiated settlement of its debts which is under discussion with the lenders.
9. Amount due to related companies
2016 2015
USD USD
Amount due to related companies 34,194,740 34,194,740
Theamountsduetorelatedcompaniesareunsecured,interestfreeandarerepayable on demand.
10. Share capital
2016 2015
USD USD
Issued and fully paid:
2,762,615 ordinary shares of USD 1each
2,762,615 2,762,615
Cumulative Redeemable Preferenceshares(69,000,000ofUSD1each) 69,000,000 69,000,000
71,762,615 71,762,615
11. Trade and other payables
(a) Non-current liabilities
2015
USD
2014
USD
Interest payable to banks - 11,600,387
Sundry Creditors - 315,900
- 11,916,287
(b) Current liabilities
2016 2015
USD USD
Interest payable to banks 23,465,001 16,871,873
Accruals 8,000 5,000
23,473,001 16,876,873
12. Borrowings
(a) Bank Loan:
This represents bank loan amounting to USD 20,968,775 (USD20,968,775) received by the Company from Bank of Baroda,Dubai. The loan is partly secured by Corporate Guarantee from the holding Company GTL Limited. This loan and the interest thereon is already overdue and hence classified under Current Liabilities in the StatementofFinancialPosition.
(b) Bank credit facilities:
ThisrepresentscreditfacilitiesamountingtoUSD25,940,050(USD25,940,050) availed by the Company from State Bank of India,Mauritius. The Company had not made full repayment in respect of theavailed facilityon theagreedduedatesasoneof itsmajorclient–‘thedebtor’didnothonouritscommitmentforthesettlementof amount due to the Company on agreed dates. The Credit facility
proceeds were covered by an insurance company with the underlying policy assigned in favour of the said Bank as security for the facility availed of. The insurance company had also not settled the claim.
13. Financial instruments
Financialriskmanagementobjectivesandpolicies
Fairvalues
TheCompany’sfinancialassetsandliabilitiesincludeadvancesonprojects,investment,tradeandotherreceivables,shareapplicationmonies,cashandcash equivalents, trade and other payables, borrowings and amounts dueto related companies. The carrying amounts of these assets and liabilities approximatetheirfairvalues.
TheCompany’sactivitiesexposeittoavarietyoffinancialrisks,including;
- Credit risk;
- Interest rate risk;
- Liquidity risk; and
- Currency risk
A description of the significant risk factors is given together with the risk management policies applicable.
(i) Credit risk
The credit risk is primarily attributable to its receivables. The amounts presented in the statement of financial position are net of allowances fordoubtfulreceivables,estimatedbytheCompany’smanagementbasedonpriorexperienceandthecurrenteconomicenvironment.
(ii) Interest rate risk
TheCompanyborrowsatfixedinterestrates.Thefluctuationsintherates would not have any material impact on its financial position and cash flows.
(iii) Liquidity risk
Prudent liquidity risk management implies maintaining sufficientcash and the availability of funding through an adequate amount of committed credit facilities. The Company aims at maintaining flexibility in funding by keeping reliable credit lines available. TheCompany is taking appropriate steps to realize its current assets to service the borrowings.
The Company has contractual maturities which are summarized below.
31 December, 2016 within 1Year
After more than1 year
USD USD
CreditFacility 25,940,050 -
Borrowings 20,968,775 -
Interest accrued on borrowings 23,465,001 -
Trade and other payables 8,000 -
Amount due in related companies 34,194,740 -
104,576,566 -
31 December, 2015 within 1Year
After more than1 year
USD USD
CreditFacility 25,940,050 -
Borrowings 20,968,775 -
Interest accrued on borrowings 16,871,872 -
Trade and other payables 5,000 -
Amount due in related companies 34,194,740 -
97,980,437 -

INTERNATIONAL GLOBAL TELE-SYSTEMS LIMITED
29th Annual Report 2016-17 37
(iv) Currency risk
TheCompanytradeonlyinitsfunctionalcurrencythatis,inUSDandisnotexposedtocurrencyrisk.
CurrencyProfile
ThecurrencyprofileoftheCompany’sFinancialassetsandliabilitiesissummarizedasfollows:
Financial assets2016
Financial liabilities2016
Financialassets2015
Financialliabilities 2015
USD USD USD USD
United States dollar 16,852,015 104,576,566 36,485,350 97,980,437
Cash flow interest rate risk
Interest rate risk arises from the possibility that changes in interest rates will affect future cash flows or the fair values of financial instruments.
The Company’s income and operating cash flows are substantially independent of changes in interest rates. The Company’s only significant interest earning financial assetiscashandcashequivalents.Interestincomefromcashatbankmayfluctuateinamount,inparticularduetochangesinmarketinterestrates.
ThetablebelowanalysestheCompany’sinterestrateriskexposureintermsoftheremainingperiodtothenextcontractualrepricingdateortothematuritydate,whicheveristheearlier.Thefloatingratecolumnrepresentsthefinancialassetsandliabilitieswhichhavefloatingrateofinterestthatdonotrepriceatsetdate,butratherrepricewhenevertheunderlyinginterestrateindexchanges.
31 December, 2016 Floating within 1 Year After more than 1 year
USD USD USD
Financialassets
Deposits - - -
Advances - 366,800 -
Advancesonproject - - 16,485,215
Investment - - -
Share application monies - - -
Trade and other receivables - - -
Cash and cash equivalent - - -
- 366,800 16,485,215
Financialliabilities
Trade and other payables - 8,000 -
Borrowings - 20,968,775 -
Bank credit facilities - 25,940,050 -
Interest accrued on borrowings - 23,465,001 -
Amount due to related companies - 34,194,740 -
- 104,576,566 -
31December,2015 Floating Within 1Year After more than1 year
USD USD USD
Financialassets
Deposits - - -
Advancesonproject - - 26,485,215
Investment - - -
Share application monies - 10,000,000 -
Trade and other receivables - - -
Cash and cash equivalent 135 - -
135 10,000,000 26,485,215
Financialliabilities
Trade and other payables - 5,000 -
Borrowings - 20,968,775 -
Bank credit facilitiesInterest accrued on borrowings
--
25,940,05016,385,167
--
Amount due to related companies - 34,194,740 -
- 97,980,437 -

GTL Limited38
INTERNATIONAL GLOBAL TELE-SYSTEMS LIMITED
14. Inventories
2016 2015
USD USD
Opening Balance - 8,341,634
Less:Provisionfordiminutioninvalue - (8,341,634)
Closing Balance - -
15. Administrative and general expenses
Year ended December, 2016
YearendedDecember,2015
USD USD
Audit fee 8,000 5,000
Professionalfee 13,640 21,763
Provisionsmadeagainst:
Advances
Capital Advance
Trade and other receivables
Investments
10,366,800
-
-
-
73,800,610
10,180,000
42,975,080
20,000,000
Share application money 10,000,000 -
Inventories - 8,341,634
Total of provisions made 20,366,800 155,297,324
Less: Liabilities written back
Sundry Creditors - (325,275)
GTL International Limited (385,440) (2,296,353)
Total liabilities written back (385,440) (2,621,628)
Provisionsnetoffamountswrittenback 19,981,360 152,675,695
TotalAdministrativeandgeneralexpenses 20,003,000 152,702,458
16. Finance costs
Year ended December, 2016
YearendedDecember,2015
USD USD
Interest on loan 6,593,264 5,271,485
Bank charges - 10,429
6,593,264 5,281,914
17. Related party transactions
Duringtheyearended31December2016,theCompanytransactedwithrelatedcompanies.Thenature,volumeandtypeoftransactionswiththecompaniesareasfollows
Amount in USD
Name of related company Nature of transaction
2015 Movement during the year
2016 Receivable(R) / Payable (P)
GTL International Limited Loan NIL NIL NIL P
GTL Limited Loan 34,194,739 NIL 34,194,739 P
18. Holding and ultimate holding company
TheCompanyisawhollyownedsubsidiaryofGTLLimited,acompanyincorporatedinIndiaandlistedintheBombayStockExchange.ThedirectorsreportGTLLimitedas the immediate and ultimate holding company.
19. Events after the reporting period
Therehavebeennomaterialeventsafterthereportingdatewhichwouldrequiredisclosureoradjustmenttothefinancialstatementfortheyearended31December2016.

GTL INTERNATIONAL LIMITED
29th Annual Report 2016-17 39
Directors' report
For the year ended 31 December 2016
The Directors present their annual report together with the consolidated and the Company financial statements of GTL International Limited (the Company) and its Subsidiaries (collectively referred to as the Group) for the year ended 31 December 2016.
review of the Group’s activities and performance
The principal activities of the Company and its Subsidiaries are to provide network services and also trading in telecommunication products.
The Group has incurred a loss of USD 4,090,072 for the year before accounting for foreign currency translation adjustment gains of USD 1,019,485 under ‘Other comprehensive income’ and the Company incurred a loss of USD 4,858,652 for the year.
Directors’ responsibilities in respect of financial statements
The Directors are responsible for preparation of consolidated and the Company financial statements for each financial year, which present fairly the financial position, financial performance and cash flow of the Group and of the Company. In preparing those financial statements, the Directors are required to:
– select suitable accounting policies and then apply them consistently;
– make judgments and estimates that are reasonable and prudent;
– state whether International Financial Reporting Standards have been followed, subject to any material departures disclosed and explained in the financial statements; and
– prepare the financial statements on a going concern basis unless it is inappropriate to presume that the Group and the Company will continue in business.
The Directors confirm that they have complied with the above requirements in preparing the consolidated and the Company financial statements. The Directors are responsible for keeping proper accounting records, which disclose with reasonable accuracy at any time, the financial position, financial performance and cash flow of the Group and of the Company. They are also responsible for safeguarding the assets of the Group and of the Company, hence for taking reasonable steps for the prevention and detection of fraud and other irregularities.
Ultimate Holding company
The share capital of USD 8,000,000 of the Company comprising 3,000,000 ordinary shares of USD 1 each and 5,000,000, 3.5% redeemable preference shares of USD 1 each is entirely held by GTL Limited, India. Consequently, the Company is a wholly-owned subsidiary of the GTL Limited, India (the Ultimate Holding company).
subsequent events
We confirm that there are no subsequent events needing adjustments to or disclosures in the financial statements.
Auditors
We propose the reappointment of M/s. Behl, Lad & Al Sayegh - Chartered Accountants as auditors of the Group and of the Company for the next year.
Approved on behalf of the Directors on 7 March 2017.
________________ __________________Vipulkumar Patel Milind Vasant BapatDirector Director

GTL Limited40
GTL INTERNATIONAL LIMITED
inDepenDent AUDitors’ report
To the Shareholder of GTL International Limited
opinion
We have audited the financial statements of GTL International Limited (the Company), Bermuda and its Subsidiaries (collectively, the Group), which comprise the consolidated and the Company statements of financial position as at 31 December 2016 and the statements of profit and loss and other comprehensive income, changes in equity and cash flows for the year then ended, and notes to the consolidated financial statements, including a summary of significant accounting policies and other explanatory information contained in notes set out on pages 8 to 26.
In our opinion, the accompanying consolidated and the Company financial statements present fairly, in all material respects the consolidated and the Company financial position of GTL International Limited and its Subsidiaries as of 31 December 2016 and their respective financial performance and their respective cash flows for the year then ended in accordance with International Financial Reporting Standards.
Basis for opinion
We conducted our audit in accordance with International Standards on Auditing (ISAs). Our responsibilities under those standards are further described in the Auditor’s Responsibilities for the Audit of the Financial Statements section of our report. We are independent of the Company in accordance with the International Ethics Standards Board for Accountants’ Code of Ethics for Professional Accountants (IESBA Code) and have fulfilled our ethical responsibilities. We believe that the audit evidence we have obtained is sufficient and appropriate to provide a basis for our opinion.
emphasis of Matter
We draw our attention to Note 2(d) of the financial statements which explains the reasons for preparation of the financial statements on a going concern basis.
Key Audit MattersWe have determined that there are no key audit matters to communicate in this report.
Management’s responsibility for the Financial statementsThe Company’s Directors are responsible for the preparation and fair presentation of these consolidated and the Company financial statements in accordance with
the International Financial Reporting Standards and for such internal control as management determines is necessary to enable the preparation of consolidated and the Company financial statements that are free from material misstatement, whether due to fraud or error.
In preparing the consolidated and Company financial statements, management is responsible for assessing the Group and the Company’s abilities to continue as a going concern, disclosing, as applicable, matters relating to going concern and using the going concern basis of accounting unless management intends to liquidate the Company or the Group or to cease their operations, or has no realistic alternative but to do so.
Management and those charged with governance are responsible for overseeing the Company’s financial reporting process.
Auditors responsibility
The objectives of our audit are to obtain reasonable assurance about whether the consolidated and Company financial statements as a whole are free from material misstatement, whether due to fraud or error, and to issue an auditor’s report that includes our opinion. Reasonable assurance is a high level of assurance, but is not a guarantee that an audit is conducted in accordance with ISAs will always detect a material misstatement when it exists. Misstatements can arise from fraud or error and are considered material if, individually or in the aggregate, they could reasonably be expected to influence the economic decisions of users taken on the basis of these consolidated and Company financial statements.
Behl, Lad & Al sayeghsigned by: Vasant Ladpartnerregistration no. 299
Dubai, United Arab Emirates7 March, 2017
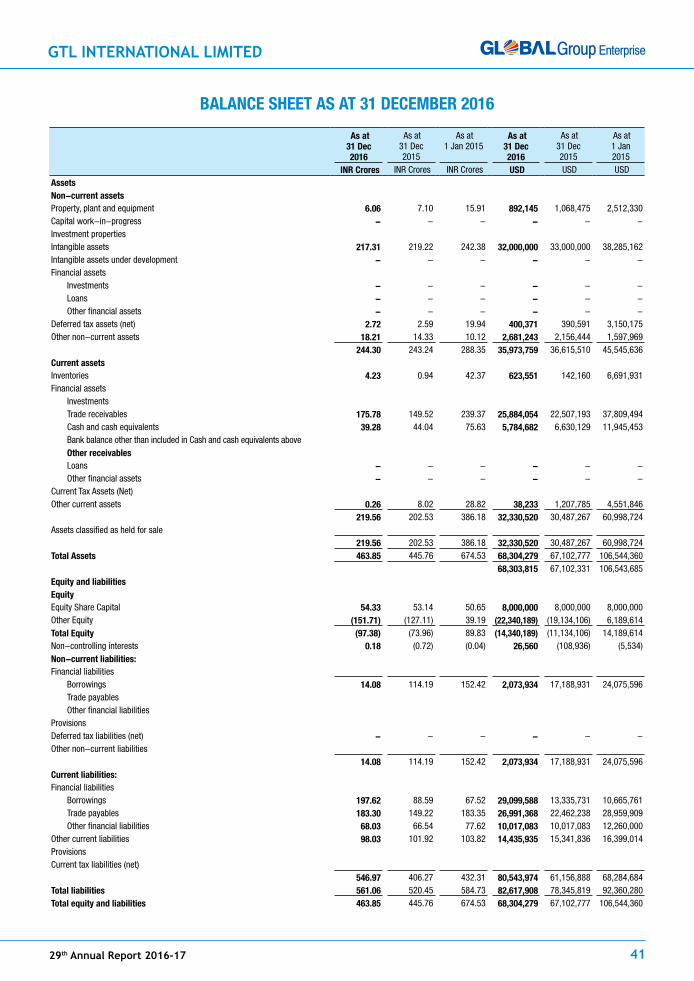
GTL INTERNATIONAL LIMITED
29th Annual Report 2016-17 41
BALAnce sHeet As At 31 DeceMBer 2016
As at 31 Dec 2016
As at 31 Dec 2015
As at 1 Jan 2015
As at 31 Dec 2016
As at 31 Dec 2015
As at 1 Jan 2015
inr crores INR Crores INR Crores UsD USD USD Assetsnon-current assetsProperty, plant and equipment 6.06 7.10 15.91 892,145 1,068,475 2,512,330 Capital work-in-progress - - - - - - Investment propertiesIntangible assets 217.31 219.22 242.38 32,000,000 33,000,000 38,285,162 Intangible assets under development - - - - - - Financial assets Investments - - - - - - Loans - - - - - - Other financial assets - - - - - - Deferred tax assets (net) 2.72 2.59 19.94 400,371 390,591 3,150,175 Other non-current assets 18.21 14.33 10.12 2,681,243 2,156,444 1,597,969
244.30 243.24 288.35 35,973,759 36,615,510 45,545,636 current assetsInventories 4.23 0.94 42.37 623,551 142,160 6,691,931 Financial assets Investments Trade receivables 175.78 149.52 239.37 25,884,054 22,507,193 37,809,494 Cash and cash equivalents 39.28 44.04 75.63 5,784,682 6,630,129 11,945,453 Bank balance other than included in Cash and cash equivalents above other receivables Loans - - - - - - Other financial assets - - - - - - Current Tax Assets (Net)Other current assets 0.26 8.02 28.82 38,233 1,207,785 4,551,846
219.56 202.53 386.18 32,330,520 30,487,267 60,998,724 Assets classified as held for sale
219.56 202.53 386.18 32,330,520 30,487,267 60,998,724 total Assets 463.85 445.76 674.53 68,304,279 67,102,777 106,544,360
68,303,815 67,102,331 106,543,685 equity and liabilitiesequityEquity Share Capital 54.33 53.14 50.65 8,000,000 8,000,000 8,000,000 Other Equity (151.71) (127.11) 39.19 (22,340,189) (19,134,106) 6,189,614 total equity (97.38) (73.96) 89.83 (14,340,189) (11,134,106) 14,189,614 Non-controlling interests 0.18 (0.72) (0.04) 26,560 (108,936) (5,534)non-current liabilities:Financial liabilities Borrowings 14.08 114.19 152.42 2,073,934 17,188,931 24,075,596 Trade payables Other financial liabilitiesProvisionsDeferred tax liabilities (net) - - - - - - Other non-current liabilities
14.08 114.19 152.42 2,073,934 17,188,931 24,075,596 current liabilities:Financial liabilities Borrowings 197.62 88.59 67.52 29,099,588 13,335,731 10,665,761 Trade payables 183.30 149.22 183.35 26,991,368 22,462,238 28,959,909 Other financial liabilities 68.03 66.54 77.62 10,017,083 10,017,083 12,260,000 Other current liabilities 98.03 101.92 103.82 14,435,935 15,341,836 16,399,014 ProvisionsCurrent tax liabilities (net)
546.97 406.27 432.31 80,543,974 61,156,888 68,284,684 total liabilities 561.06 520.45 584.73 82,617,908 78,345,819 92,360,280 total equity and liabilities 463.85 445.76 674.53 68,304,279 67,102,777 106,544,360

GTL Limited42
GTL INTERNATIONAL LIMITED
stAteMent oF proFit AnD Loss For tHe yeAr enDeD 31st DeceMBer, 2016
year ended 31st Dec,
2016
Year ended 31st Dec,
2015 Restated*
year ended 31st Dec,
2016
Year ended 31st Dec,
2015 Restated*
inr crores INR Crores UsD USD continuing operationsRevenue from operations 401.38 425.99 59,542,932 64,908,438 Other income 19.20 18.03 2,848,156 2,746,538 totAL incoMe 420.58 444.02 62,391,088 67,654,976
eXpensesCost of materials consumed 269.83 310.60 40,028,361 47,326,078 Purchases of stock-in-trade - - - - Changes in inventories of finished goods, stock-in-trade and work-in-progress - - - - Employee benefits expenses 69.53 100.40 10,314,031 15,298,209 Finance costs 12.92 19.06 1,916,333 2,904,322 Depreciation and amortisation expenses 9.12 37.06 1,352,238 5,646,786 Other expenses 77.23 117.38 11,456,040 17,885,727 totAL eXpenses 438.63 584.50 65,067,003 89,061,122
profit/(loss) before exceptional items and tax from continuing operations (18.05) (140.49) (2,675,915) (21,406,146)exceptional itemsprofit/(loss) before tax from continuing operations (18.05) (140.49) (2,675,915) (21,406,146)tax expenses Current tax / Subsidiary Disposed off + Retained earning of Subsidiary Dispose off 9.53 27.77 1,414,157 4,231,591 Adjustment of tax relating to earlier periods Deferred tax credit/(charge)
proFit For tHe yeAr FroM continUinG operAtions (27.58) (168.26) (4,090,072) (25,637,737)
Discontinued operations:Profit/(loss) before tax for the year from discontinued operations - (3.75) - (570,787)Tax Income/ (expense) of discontinued operations - - - - profit/ (loss) for the year from discontinued operations - (3.75) - (570,787)
profit/(loss) for the year (27.58) (172.00) (4,090,072) (26,208,524)other comprehensive incomeA (i) Items that will not be reclassified to profit or loss 6.87 5.13 1,019,485 781,402 (ii) Income tax relating to items that will not be reclassified to profit or loss - - - - net other comprehensive income not to be reclassified to profit or loss in subsequent periods 6.87 5.13 1,019,485 781,402
B (i) Items that will be reclassified to profit or loss (ii) Income tax relating to items that will be reclassified to profit or lossnet other comprehensive income to be reclassified to profit or loss in subsequent periods - - - -
other comprehensive income for the year, net of tax 6.87 5.13 1,019,485 781,402
total comprehensive income for the period, net of tax (20.71) (166.88) (3,070,587) (25,427,122)

GTL INTERNATIONAL LIMITED
29th Annual Report 2016-17 43
stAteMent oF cHAnGes in eqUity For tHe yeAr enDeD 31 DeceMBer, 2016
a. equity share capital:
no. inr crores
At 1 January 2015 3,000,000 50.65
Issue of share capital (Note 17) - -
At 31 December 2015 3,000,000 53.14
Issue of share capital (Note 17) - -
At 31 December 2016 3,000,000 54.33
b. other equity: For the year ended 31 December 2016
particulars equity component
of compound financial
instrument (note 18)
reserves & surplus items of oci total equity
capital reserve (note 18)
capital redemption
reserve (note 18)
securities premium account (note 18)
Debenture redemption
reserve (note 18)
translation reserve
(note 18)
Balance in statement of profit and Loss (note 18)
FVtoci reserve
(note 18)
inr in crores inr in crores inr in crores inr in crores inr in crores inr in crores inr in crores inr in crores inr in crores
As at 31st December 2015 - - - - - 0.54 (127.65) - (127.11)
Net Profit for the period (20.71) (20.71)
Other comprehensive income -
total comprehensive income - - - - - - (20.71) - (20.71)
Dividends - - - - - - - - -
Transfer from translation reserve - - - - - 6.93 (10.83) - (3.90)
Transfer from Balance in Statement of Profit and Loss
- - - - - - - - -
Transfer to general reserve - - - - - - - - -
Transfer to Balance in Statement of Profit and Loss
- - - - - - - - -
As at 31 December 2016 - - - - - 7.47 (159.19) - (151.72)
For the year ended 31 December 2015
particulars equity component
of compound financial
instrument (note 18)
reserves & surplus items of oci total equity
capital reserve (note 18)
capital redemption
reserve (note 18)
securities premium account (note 18)
Debenture redemption
reserve (note 18)
translation reserve
(note 18)
Balance in statement of profit and Loss (note 18)
FVtoci reserve
(note 18)
inr in crores inr in crores inr in crores inr in crores inr in crores inr in crores inr in crores inr in crores inr in crores
As at 1st January 2015 - - - - - (4.43) 43.62 - 39.19
Net Profit for the period - (166.88) - (166.88)
Other comprehensive income -
total comprehensive income - - - - - - (166.88) - (166.88)
Impact of translation of financials into INDAS
-
Dividends - - - - - - - - -
Transfer from translation reserve - - - - - 4.97 - - 4.97
Transfer from Balance in Statement of Profit and Loss
- - - - - - - - -
Transfer to general reserve - - - - - - - - -
Transfer to Balance in Statement of Profit and Loss
- - - - - - - - -
As at 31 December 2015 - - - - - 0.54 (127.65) - 127.11
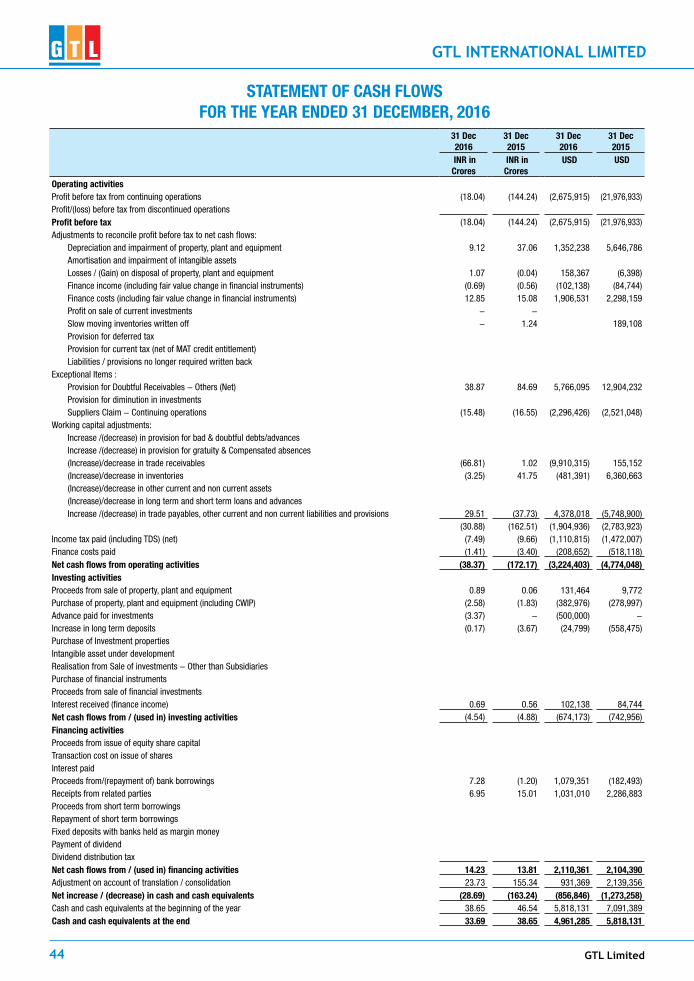
GTL Limited44
GTL INTERNATIONAL LIMITED
stAteMent oF cAsH FLows For tHe yeAr enDeD 31 DeceMBer, 2016
31 Dec 2016
31 Dec 2015
31 Dec 2016
31 Dec 2015
inr in crores
inr in crores
UsD UsD
operating activitiesProfit before tax from continuing operations (18.04) (144.24) (2,675,915) (21,976,933)Profit/(loss) before tax from discontinued operationsprofit before tax (18.04) (144.24) (2,675,915) (21,976,933)Adjustments to reconcile profit before tax to net cash flows: Depreciation and impairment of property, plant and equipment 9.12 37.06 1,352,238 5,646,786 Amortisation and impairment of intangible assets Losses / (Gain) on disposal of property, plant and equipment 1.07 (0.04) 158,367 (6,398) Finance income (including fair value change in financial instruments) (0.69) (0.56) (102,138) (84,744) Finance costs (including fair value change in financial instruments) 12.85 15.08 1,906,531 2,298,159 Profit on sale of current investments - - Slow moving inventories written off - 1.24 189,108 Provision for deferred tax Provision for current tax (net of MAT credit entitlement) Liabilities / provisions no longer required written backExceptional Items : Provision for Doubtful Receivables - Others (Net) 38.87 84.69 5,766,095 12,904,232 Provision for diminution in investments Suppliers Claim - Continuing operations (15.48) (16.55) (2,296,426) (2,521,048)Working capital adjustments: Increase /(decrease) in provision for bad & doubtful debts/advances Increase /(decrease) in provision for gratuity & Compensated absences (Increase)/decrease in trade receivables (66.81) 1.02 (9,910,315) 155,152 (Increase)/decrease in inventories (3.25) 41.75 (481,391) 6,360,663 (Increase)/decrease in other current and non current assets (Increase)/decrease in long term and short term loans and advances Increase /(decrease) in trade payables, other current and non current liabilities and provisions 29.51 (37.73) 4,378,018 (5,748,900)
(30.88) (162.51) (1,904,936) (2,783,923)Income tax paid (including TDS) (net) (7.49) (9.66) (1,110,815) (1,472,007)Finance costs paid (1.41) (3.40) (208,652) (518,118)net cash flows from operating activities (38.37) (172.17) (3,224,403) (4,774,048)investing activitiesProceeds from sale of property, plant and equipment 0.89 0.06 131,464 9,772 Purchase of property, plant and equipment (including CWIP) (2.58) (1.83) (382,976) (278,997)Advance paid for investments (3.37) - (500,000) - Increase in long term deposits (0.17) (3.67) (24,799) (558,475)Purchase of Investment propertiesIntangible asset under developmentRealisation from Sale of investments - Other than SubsidiariesPurchase of financial instrumentsProceeds from sale of financial investmentsInterest received (finance income) 0.69 0.56 102,138 84,744 net cash flows from / (used in) investing activities (4.54) (4.88) (674,173) (742,956)Financing activitiesProceeds from issue of equity share capitalTransaction cost on issue of sharesInterest paidProceeds from/(repayment of) bank borrowings 7.28 (1.20) 1,079,351 (182,493)Receipts from related parties 6.95 15.01 1,031,010 2,286,883 Proceeds from short term borrowingsRepayment of short term borrowingsFixed deposits with banks held as margin moneyPayment of dividendDividend distribution taxnet cash flows from / (used in) financing activities 14.23 13.81 2,110,361 2,104,390 Adjustment on account of translation / consolidation 23.73 155.34 931,369 2,139,356 net increase / (decrease) in cash and cash equivalents (28.69) (163.24) (856,846) (1,273,258)Cash and cash equivalents at the beginning of the year 38.65 46.54 5,818,131 7,091,389 cash and cash equivalents at the end 33.69 38.65 4,961,285 5,818,131

GTL INTERNATIONAL LIMITED
29th Annual Report 2016-17 45
scHeDULes to tHe FinAnciAL stAteMents For tHe yeAr enDeD AnD As At 31 DeceMBer, 2016
3. property, plant and equipment
Freehold land
Leasehold land
Buildings plant & machinery
Furniture & fixtures
office equipments
computers networking Assets
test and repair
equipments
Vehicles capital work in progress
total
inr in crores
inr in crores
inr in crores
inr in crores
inr in crores
inr in crores
inr in crores
inr in crores
inr in crores
inr in crores
inr in crores
inr in crores
cost
At 1 Jan 2015 - - - 23.98 4.45 2.79 7.34 - - 0.10 - 38.66
Additions - - - 0.10 1.04 0.16 0.20 - - 0.34 - 1.85
Disposals net of translation - - - (14.05) (2.09) (1.62) 0.29 - - 0.00 - (17.47)
At 31 Dec 2015 - - - 10.04 3.40 1.33 7.83 - - 0.44 - 23.04
Additions - - - 1.14 0.85 0.29 0.16 - - 0.15 - 2.60
Disposals - - - (0.55) (0.42) (0.07) (5.43) - - 0.00 - (6.47)
Discontinued operations (Note XX)
- - - - - - - - - - - -
At 31 Dec 2016 - - - 10.62 3.83 1.55 2.56 - - 0.60 - 19.17
Depreciation and impairment
At 1 Jan 2015 - - - 16.74 3.29 2.11 0.54 - - 0.07 - 22.75
Depreciation charge for the year
- - - 0.95 0.62 0.17 0.59 - - 0.07 - 2.40
Disposals - - - (10.03) (1.84) (1.52) 4.16 - - 0.03 - (9.21)
At 31 Dec 2015 - - - 7.66 2.08 0.76 5.29 - - 0.16 - 15.95
Depreciation charge for the year** - - - 0.46 0.92 0.18 0.74 - - 0.09 - 2.39
Disposals - - - (0.46) (0.39) - (4.37) - - - - (5.22)
Discontinued operations - - - - - - - - - - - -
At 31 Dec 2016 - - - 7.66 2.61 0.94 1.65 - - 0.25 - 13.12
Net Book Value
At 31 Dec 2016 - - - 2.96 1.22 0.61 0.92 - - 0.35 - 6.06
At 31 Dec 2015 - - - 2.38 1.32 0.57 2.55 - - 0.28 - 7.10
At 1 Jan 2015 - - - 7.24 1.16 0.68 6.80 - - 0.03 - 15.91
Freehold land
Leasehold land
Buildings plant & machinery
Furniture & fixtures
office equipments
computers networking Assets
test and repair
equipments
Vehicles capital work in progress
total
UsD UsD UsD UsD UsD UsD UsD UsD UsD UsD UsD UsDcostAt 1 Jan 2015 - - - 3,787,537 702,832 440,100 1,159,726 - - 15,890 - 6,106,085 Additions - - - 15,654 157,036 24,638 30,519 - - 51,150 - 278,997 Disposals net of translation - - - (2,292,355) (347,784) (264,561) (11,143) - - (252) - (2,916,095)At 31 Dec 2015 - - - 1,510,836 512,084 200,177 1,179,102 - - 66,788 - 3,468,987 Additions - - - 168,034 125,507 42,866 23,834 - - 22,735 - 382,976 Disposals - - - (114,350) (73,135) (14,446) (825,239) - - (1,262) - (1,028,432)Discontinued operations (Note XX)
-
At 31 Dec 2016 - - - 1,564,520 564,456 228,597 377,697 - - 88,261 - 2,823,531 Depreciation and impairmentAt 1 Jan 2015 - - - 2,644,404 520,358 333,408 84,997 - - 10,588 3,593,755 Depreciation charge for the year
- - - 142,731 93,660 25,983 89,024 - - 10,226 361,624
Disposals - - - (1,634,177) (301,095) (244,507) 621,610 - - 3,302 (1,554,867)At 31 Dec 2015 - - - 1,152,958 312,923 114,884 795,631 - - 24,116 - 2,400,512 Depreciation charge for the year** - - - 68,468 135,476 26,153 108,561 - - 13,580 352,238 Disposals - - - (93,157) (63,517) (2,719) (661,540) - - (431) (821,364)

GTL Limited46
GTL INTERNATIONAL LIMITED
Discontinued operations - At 31 Dec 2016 - - - 1,128,269 384,882 138,318 242,652 - - 37,265 - 1,931,386
Net Book ValueAt 31 Dec 2016 - - - 436,251 179,574 90,279 135,045 - - 50,996 - 892,145 At 31 Dec 2015 - - - 357,878 199,161 85,293 383,471 - - 42,672 - 1,068,475 At 1 Jan 2015 - - - 1,143,133 182,474 106,692 1,074,729 - - 5,302 - 2,512,330
net Book Value
At 31 Dec 2016
At 31 Dec 2015
At 1 Jan 2015
At 31 Dec 2016
At 31 Dec 2015
At 1 Jan 2015
inr in crores inr in crores inr in crores UsD UsD UsDPlant, property and equipment 6.06 7.10 15.91 892,145.00 1,068,475.00 2,512,330.00 Capital Work in Progress - - - - - -
5. intangible assets
networking software
other than networking
software
intangible asset under development
total networking software
other than networking
software
intangible asset under development
total
inr in crores inr in crores inr in crores inr in crores UsD UsD UsD UsDcostAt 1 Jan 2015 - 242.38 - 242.38 - 38,285,162.00 - 38,285,162.00 AdditionsDisposals net of translation - 45.91 - 45.91 - 5,113,511.00 - 5,113,511.00 At 31 Dec 2015 - 288.30 - 288.30 - 43,398,673.00 - 43,398,673.00 AdditionsDisposals net of translation - 6.42 - 6.42 - - - -At 31 Dec 2016 - 294.72 - 294.72 - 43,398,673.00 - 43,398,673.00 Amortization and impairmentAt 1 Jan 2015 - 32.37 - 32.37 - 5,113,511.00 - 5,113,511.00 Amortisation - 35.11 - 35.11 - 5,285,162.00 - 5,285,162.00 Disposals net of translation - 1.60 - 1.60 - - - -At 31 Dec 2015 - 69.08 - 69.08 - 10,398,673.00 - 10,398,673.00 Amortisation - 6.79 - 6.79 - 1,000,000.00 - 1,000,000.00 Disposals net of translation - 1.54 - 1.54 -At 31 Dec 2016 - 77.41 - 77.41 - 11,398,673.00 - 11,398,673.00
Net Book ValueAt 31 Dec 2016 - 217.31 - 217.31 - 32,000,000.00 - 32,000,000.00 At 31 Dec 2015 - 219.22 - 219.22 - 33,000,000.00 - 33,000,000.00 At 1 Jan 2015 - 242.38 - 242.38 - 38,285,162.00 - 38,285,162.00
net Book Value
At 31 Dec 2016
At 31 Dec 2015
At 1 Jan 2015
At 31 Dec 2016
At 31 Dec 2015
At 1 Jan 2015
inr in crores inr in crores inr in crores UsD UsD UsDIntangible assets 217.31 219.22 242.38 32,000,000.00 33,000,000.00 38,285,162.00 Intangible assets under development - - - - - -
8. other non-current assets
31 March 2017
31 March 2016
1 April 2015
31 March 2017
31 March 2016
1 April 2015
inr in crores inr in crores inr in crores UsD UsD UsD
Advances other than capital advances
Security Deposits 14.81 14.33 9.12 2,181,243.00 2,156,444.00 1,440,668.00
Other advances 3.40 - 1.00 500,000.00 - 157,301.00
18.21 14.33 10.12 2,681,243.00 2,156,444.00 1,597,969.00
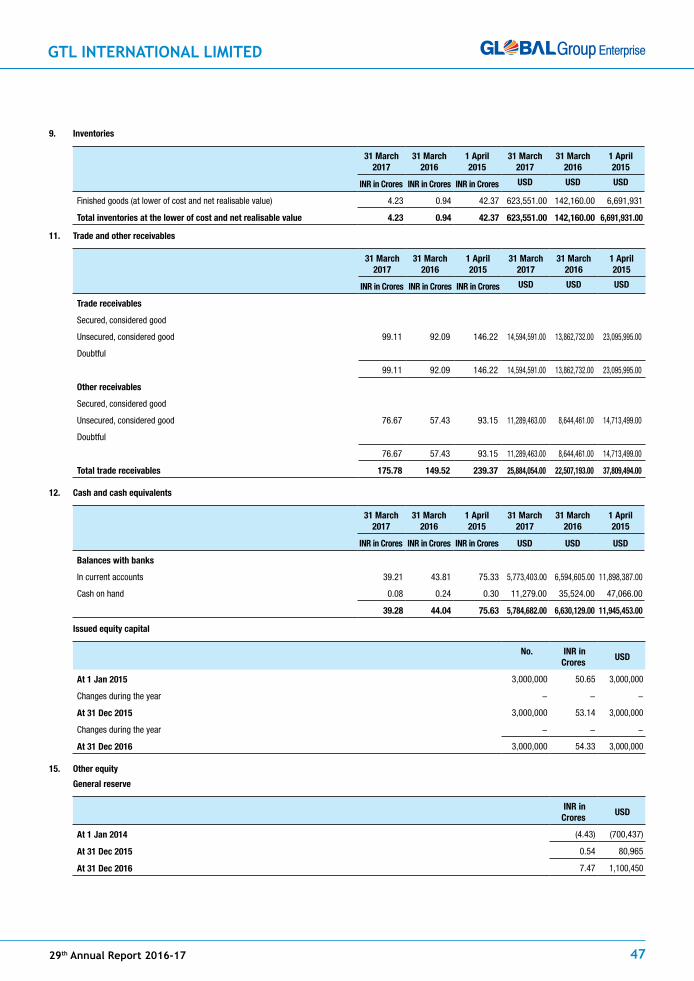
GTL INTERNATIONAL LIMITED
29th Annual Report 2016-17 47
9. inventories
31 March 2017
31 March 2016
1 April 2015
31 March 2017
31 March 2016
1 April 2015
inr in crores inr in crores inr in crores UsD UsD UsD
Finished goods (at lower of cost and net realisable value) 4.23 0.94 42.37 623,551.00 142,160.00 6,691,931
total inventories at the lower of cost and net realisable value 4.23 0.94 42.37 623,551.00 142,160.00 6,691,931.00
11. trade and other receivables
31 March 2017
31 March 2016
1 April 2015
31 March 2017
31 March 2016
1 April 2015
inr in crores inr in crores inr in crores UsD UsD UsD
trade receivables
Secured, considered good
Unsecured, considered good 99.11 92.09 146.22 14,594,591.00 13,862,732.00 23,095,995.00
Doubtful
99.11 92.09 146.22 14,594,591.00 13,862,732.00 23,095,995.00
other receivables
Secured, considered good
Unsecured, considered good 76.67 57.43 93.15 11,289,463.00 8,644,461.00 14,713,499.00
Doubtful
76.67 57.43 93.15 11,289,463.00 8,644,461.00 14,713,499.00
total trade receivables 175.78 149.52 239.37 25,884,054.00 22,507,193.00 37,809,494.00
12. cash and cash equivalents
31 March 2017
31 March 2016
1 April 2015
31 March 2017
31 March 2016
1 April 2015
inr in crores inr in crores inr in crores UsD UsD UsD
Balances with banks
In current accounts 39.21 43.81 75.33 5,773,403.00 6,594,605.00 11,898,387.00
Cash on hand 0.08 0.24 0.30 11,279.00 35,524.00 47,066.00
39.28 44.04 75.63 5,784,682.00 6,630,129.00 11,945,453.00
issued equity capital
no. inr in crores
UsD
At 1 Jan 2015 3,000,000 50.65 3,000,000
Changes during the year - - -
At 31 Dec 2015 3,000,000 53.14 3,000,000
Changes during the year - - -
At 31 Dec 2016 3,000,000 54.33 3,000,000
15. other equity
General reserve
inr in crores
UsD
At 1 Jan 2014 (4.43) (700,437)
At 31 Dec 2015 0.54 80,965
At 31 Dec 2016 7.47 1,100,450

GTL Limited48
GTL INTERNATIONAL LIMITED
Dec-14 63.31 Ex Rate Dec-14 63.31 USDDec-15 66.43 Dec-15 66.43Dec-16 67.91 Dec-16 67.91 GTL
International Limited
Balance in statement of profit and Loss
inr in crores
UsD
At 1 Jan 2014 43.62 6,890,051
Add: Profit during the year (166.88) (25,427,122)
Translation reserve - (678,000)
At 31 Dec 2015 (127.65) (19,215,071)
Add: Profit during the year (20.71) (3,070,587)
Translation reserve - (1,154,981)
At 31 Dec 2016 (159.19) (23,440,639)
total other equity
inr in crores
UsD
At 1 April 2015 39.19 6,189,614
At 31 March 2016 (127.11) (19,134,106)
At 31 March 2017 (151.71) (22,340,189)
16. other current assets
31 December 2016
31 December 2015
1 January 2015
31 December 2016
31 December 2015
1 January 2015
inr in crores inr in crores inr in crores UsD UsD UsD
Others 0.26 8.02 28.82 38,233.00 1,207,785.00 4,551,846.00
0.26 8.02 28.82 38,233.00 1,207,785.00 4,551,846.00
19. Borrowings
31 December 2016
31 December 2015
1 January 2015
31 December 2016
31 December 2015
1 January 2015
inr in crores inr in crores inr in crores UsD UsD UsD
non-current borrowings
Unsecured loans
- Cash Credit / Overdraft 14.08 114.19 152.42 2,073,934.00 17,188,931.00 24,075,596.00
total unsecured loans 14.08 114.19 152.42 2,073,934.00 17,188,931.00 24,075,596.00
Loans repayable on demand from Banks
- Cash Credit 197.62 88.59 67.52 29,099,588.00 13,335,731.00 10,665,761.00
197.62 88.59 67.52 29,099,588.00 13,335,731.00 10,665,761.00
21. other financial liabilities
Break up of financial liabilities carried at amortised cost
31 December 2016
31 December 2015
1 January 2015
31 December 2016
31 December 2015
1 January 2015
inr in crores inr in crores inr in crores UsD UsD UsD
Borrowings (current maturities) 197.62 88.59 67.52 29,099,588.00 13,335,731.00 10,665,761.00
total financial liabilities carried at amortised cost 197.62 88.59 67.52 29,099,588.00 13,335,731.00 10,665,761.00
Deferred tax:
Deferred tax assets 2.72 2.59 19.94 400,371.00 390,591.00 3,150,175.00
Deferred tax liabilities, net 2.72 2.59 19.94 400,371.00 390,591.00 3,150,175.00
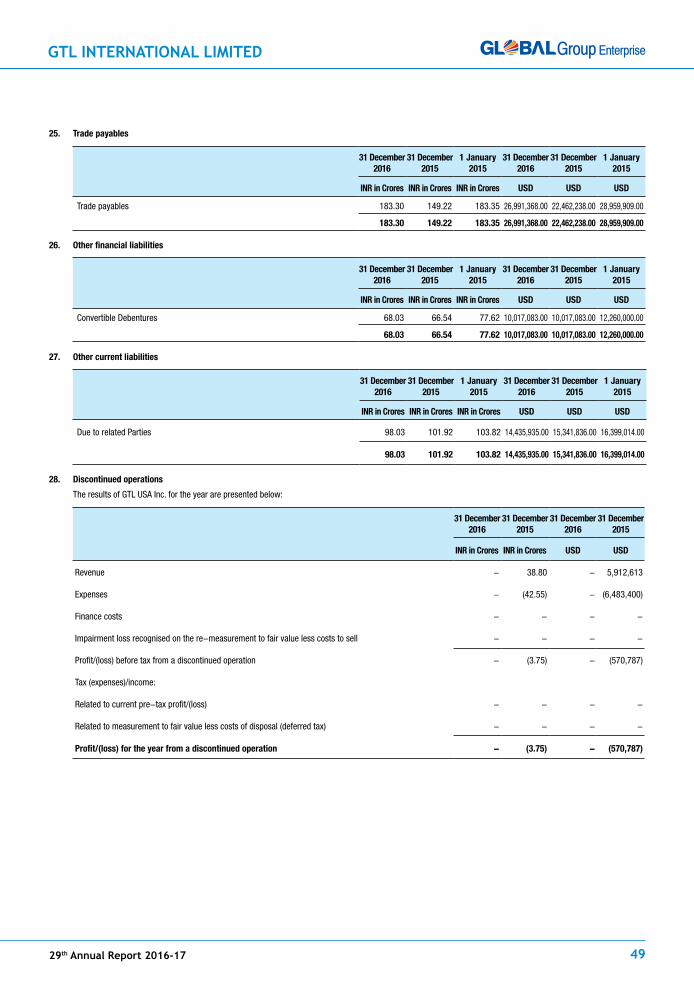
GTL INTERNATIONAL LIMITED
29th Annual Report 2016-17 49
25. trade payables
31 December 2016
31 December 2015
1 January 2015
31 December 2016
31 December 2015
1 January 2015
inr in crores inr in crores inr in crores UsD UsD UsD
Trade payables 183.30 149.22 183.35 26,991,368.00 22,462,238.00 28,959,909.00
183.30 149.22 183.35 26,991,368.00 22,462,238.00 28,959,909.00
26. other financial liabilities
31 December 2016
31 December 2015
1 January 2015
31 December 2016
31 December 2015
1 January 2015
inr in crores inr in crores inr in crores UsD UsD UsD
Convertible Debentures 68.03 66.54 77.62 10,017,083.00 10,017,083.00 12,260,000.00
68.03 66.54 77.62 10,017,083.00 10,017,083.00 12,260,000.00
27. other current liabilities
31 December 2016
31 December 2015
1 January 2015
31 December 2016
31 December 2015
1 January 2015
inr in crores inr in crores inr in crores UsD UsD UsD
Due to related Parties 98.03 101.92 103.82 14,435,935.00 15,341,836.00 16,399,014.00
98.03 101.92 103.82 14,435,935.00 15,341,836.00 16,399,014.00
28. Discontinued operations
The results of GTL USA Inc. for the year are presented below:
31 December 2016
31 December 2015
31 December 2016
31 December 2015
inr in crores inr in crores UsD UsD
Revenue - 38.80 - 5,912,613
Expenses - (42.55) - (6,483,400)
Finance costs - - - -
Impairment loss recognised on the re-measurement to fair value less costs to sell - - - -
Profit/(loss) before tax from a discontinued operation - (3.75) - (570,787)
Tax (expenses)/income:
Related to current pre-tax profit/(loss) - - - -
Related to measurement to fair value less costs of disposal (deferred tax) - - - -
profit/(loss) for the year from a discontinued operation - (3.75) - (570,787)
Dec-14 63.31 Ex Rate Dec-14 63.31 USDDec-15 66.43 Dec-15 66.43Dec-16 67.91 Dec-16 67.91 GTL
International Limited

GTL Limited50
GTL INTERNATIONAL LIMITED
29. revenue from operations
31 December 2016
31 December 2015
31 December 2016
31 December 2015
inr in crores inr in crores UsD UsD
Sale of products (including excise duty)
Telecom products 401.38 425.99 59,542,932 64,908,438
Others - - - -
401.38 425.99 59,542,932 64,908,438
30. other income
31 December 2016
31 December 2015
31 December 2016
31 December 2015
inr in crores inr in crores UsD UsD
Interest income 0.69 0.56 102,138 84,744
Gain on foreign currency transactions (Net) - 0.04 - 5,807
Profit on sale of current investments - 0.04 - 6,398
Other non-operating income 18.51 17.39 2,746,018 2,649,589
19.20 18.03 2,848,156 2,746,538
Government grants have been received for the purchase of certain items of property, plant and equipment. There are no unfulfilled conditions or contingencies attached to these grants.
31. cost of materials consumed
31 December 2016
31 December 2015
31 December 2016
31 December 2015
inr in crores inr in crores UsD UsD
Raw Material Consumed
Inventory at the beginning of the year 0.96 43.92 142,160 6,691,931
Add: Purchases 273.08 267.61 40,509,752 40,776,307
274.03 311.53 40,651,912 47,468,238
Less: inventory at the end of the year 4.20 0.93 623,551 142,160
Cost of raw material and components consumed 269.83 310.60 40,028,361 47,326,078

GTL INTERNATIONAL LIMITED
29th Annual Report 2016-17 51
34. employee benefits expenses
31 December 2016
31 December 2015
31 December 2016
31 December 2015
inr in crores inr in crores UsD UsD
Salaries, wages and bonus 69.17 99.64 10,260,458 15,182,171
Staff welfare expense 0.36 0.76 53,573 116,038
69.53 100.40 10,314,031 15,298,209
35. Finance costs
31 December 2016
31 December 2015
31 December 2016
31 December 2015
inr in crores inr in crores UsD UsD
Interest
- Others 12.73 14.77 1,888,587 2,250,259
Exchange difference to the extent considered as an adjustment to borrowing cost 0.19 4.29 27,746 654,063
total finance cost 12.92 19.06 1,916,333 2,904,322
36. Depreciation and amortization expense
31 Dec 2016
31 Dec 2015
31 Dec 2016
31 Dec 2015
inr in crores inr in crores UsD UsD
Amortization of intangible assets (note 3) 6.74 34.69 1,000,000 5,285,162
Depreciation of tangible assets (note 5) 2.37 2.37 352,238 361,624
9.12 37.06 1,352,238 5,646,786
37. other expenses
31 Dec 2016
31 Dec 2015
31 Dec 2016
31 Dec 2015
inr in crores inr in crores UsD UsD
Repairs and maintenance
- Plant and machinery 0.66 0.09 98,417 13,871
- Others - - - -
Rates and taxes 2.44 3.15 362,087 479,319
Electricity 0.27 0.29 40,497 44,148
Communication expenses 0.66 0.63 98,158 96,507
Travelling and conveyance 1.75 6.88 259,961 1,048,235
Bad debts / advances written off 30.96 29.39 4,592,206 4,478,791
Provision for bad and doubtful debts/advances 7.91 55.30 1,173,889 8,425,441
Bank charges 0.12 0.31 17,944 47,900
Legal and professional charges 14.55 9.03 2,157,889 1,375,491
Loss/(Gain) on sale of fixed assets/asset disposed off (net) 1.07 - 158,367 -
Miscellaneous expenses 16.83 12.31 2,496,625 1,876,024
77.23 117.38 11,456,040 17,885,727
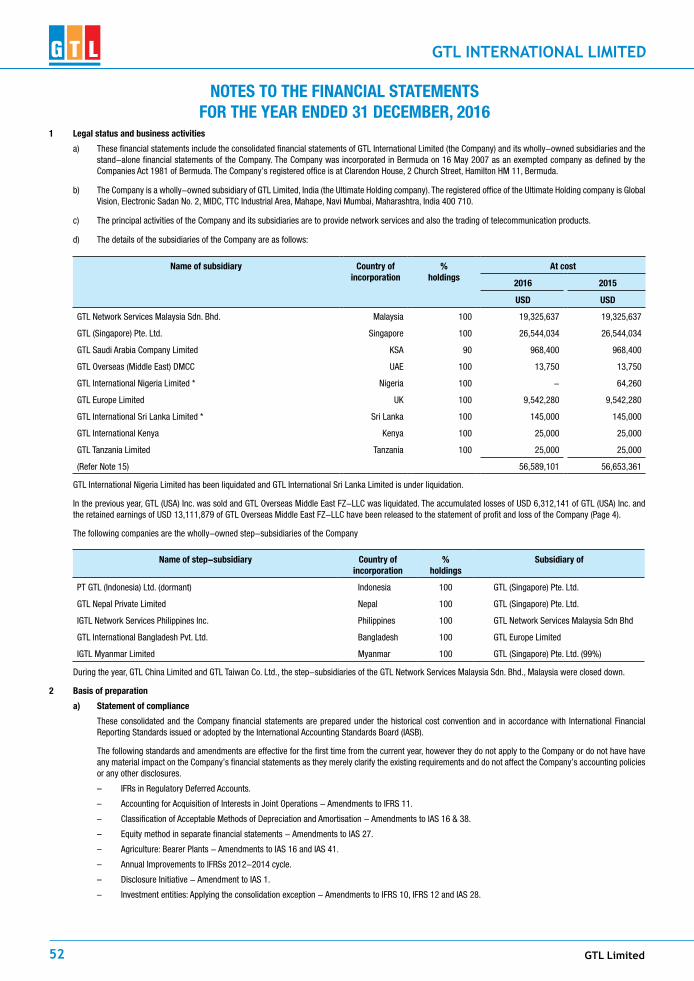
GTL Limited52
GTL INTERNATIONAL LIMITED
1 Legal status and business activities
a) These financial statements include the consolidated financial statements of GTL International Limited (the Company) and its wholly-owned subsidiaries and the stand-alone financial statements of the Company. The Company was incorporated in Bermuda on 16 May 2007 as an exempted company as defined by the Companies Act 1981 of Bermuda. The Company’s registered office is at Clarendon House, 2 Church Street, Hamilton HM 11, Bermuda.
b) The Company is a wholly-owned subsidiary of GTL Limited, India (the Ultimate Holding company). The registered office of the Ultimate Holding company is Global Vision, Electronic Sadan No. 2, MIDC, TTC Industrial Area, Mahape, Navi Mumbai, Maharashtra, India 400 710.
c) The principal activities of the Company and its subsidiaries are to provide network services and also the trading of telecommunication products.
d) The details of the subsidiaries of the Company are as follows:
name of subsidiary country ofincorporation
%holdings
At cost
2016 2015
UsD UsD
GTL Network Services Malaysia Sdn. Bhd. Malaysia 100 19,325,637 19,325,637
GTL (Singapore) Pte. Ltd. Singapore 100 26,544,034 26,544,034
GTL Saudi Arabia Company Limited KSA 90 968,400 968,400
GTL Overseas (Middle East) DMCC UAE 100 13,750 13,750
GTL International Nigeria Limited * Nigeria 100 - 64,260
GTL Europe Limited UK 100 9,542,280 9,542,280
GTL International Sri Lanka Limited * Sri Lanka 100 145,000 145,000
GTL International Kenya Kenya 100 25,000 25,000
GTL Tanzania Limited Tanzania 100 25,000 25,000
(Refer Note 15) 56,589,101 56,653,361
GTL International Nigeria Limited has been liquidated and GTL International Sri Lanka Limited is under liquidation.
In the previous year, GTL (USA) Inc. was sold and GTL Overseas Middle East FZ-LLC was liquidated. The accumulated losses of USD 6,312,141 of GTL (USA) Inc. and the retained earnings of USD 13,111,879 of GTL Overseas Middle East FZ-LLC have been released to the statement of profit and loss of the Company (Page 4).
The following companies are the wholly-owned step-subsidiaries of the Company
name of step-subsidiary country ofincorporation
%holdings
subsidiary of
PT GTL (Indonesia) Ltd. (dormant) Indonesia 100 GTL (Singapore) Pte. Ltd.
GTL Nepal Private Limited Nepal 100 GTL (Singapore) Pte. Ltd.
IGTL Network Services Philippines Inc. Philippines 100 GTL Network Services Malaysia Sdn Bhd
GTL International Bangladesh Pvt. Ltd. Bangladesh 100 GTL Europe Limited
IGTL Myanmar Limited Myanmar 100 GTL (Singapore) Pte. Ltd. (99%)
During the year, GTL China Limited and GTL Taiwan Co. Ltd., the step-subsidiaries of the GTL Network Services Malaysia Sdn. Bhd., Malaysia were closed down.
2 Basis of preparation
a) statement of compliance
These consolidated and the Company financial statements are prepared under the historical cost convention and in accordance with International Financial Reporting Standards issued or adopted by the International Accounting Standards Board (IASB).
The following standards and amendments are effective for the first time from the current year, however they do not apply to the Company or do not have have any material impact on the Company’s financial statements as they merely clarify the existing requirements and do not affect the Company’s accounting policies or any other disclosures.
– IFRs in Regulatory Deferred Accounts.
– Accounting for Acquisition of Interests in Joint Operations - Amendments to IFRS 11.
– Classification of Acceptable Methods of Depreciation and Amortisation - Amendments to IAS 16 & 38.
– Equity method in separate financial statements - Amendments to IAS 27.
– Agriculture: Bearer Plants - Amendments to IAS 16 and IAS 41.
– Annual Improvements to IFRSs 2012-2014 cycle.
– Disclosure Initiative - Amendment to IAS 1.
– Investment entities: Applying the consolidation exception - Amendments to IFRS 10, IFRS 12 and IAS 28.
notes to tHe FinAnciAL stAteMents For tHe yeAr enDeD 31 DeceMBer, 2016

GTL INTERNATIONAL LIMITED
29th Annual Report 2016-17 53
b) Basis of consolidation
i) The consolidated financial statements include the financial statements of the Company and its subsidiaries (collectively, the Group) on the basis of their
audited financial statements.
ii) Control is achieved by the Parent company when it is exposed, or has rights, to variable returns from its involvement with the investee; and has the ability to
use its power to affect those returns through its power over the investee. The financial statements of subsidiaries are included in the consolidated financial
statements from the date on which control commences until the date on which it ceases.
iii) The like items of assets, liabilities, equity, income and expenses and cash flows of the Parent company with those of the subsidiaries are added together.
The carrying amount of the Parent company’s investment in each subsidiary and the Parent company’s portion of equity of each subsidiary are offset.
Intra-group transactions, balances and profits / losses on transactions are eliminated on consolidation and all figures relate to external transactions and
balances only.
iv) The reporting dates of all the subsidiaries mentioned in {Note 1 (d)} above are co-terminus with that of the Company except GTL Saudi Arabia Company
Limited, KSA, which follows 31 March, in which case additional financial information of the intervening period is obtained and adjusted in the consolidation
so that the figures of this subsidiary are co-terminus with the Group financial statements.
v) Non-controlling interest represents the share of the non-controlling Shareholder in the share capital of the subsidiary, namely, GTL Saudi Arabia Co. Ltd.,
its reserve and profits less dividends paid and each component of other comprehensive income.
c) presentation currency
These consolidated and the Company financial statements have been presented in USD (US Dollar), being the currency of the primary economic environment in
which is the Group and the Company operate.
The figures of the subsidiaries and step-subsidiaries have been converted into USD (US Dollar) at the average rate for the balances in the consolidated statement
of profit or loss and other comprehensive income and consolidated statement of financial position. The differences arising are accounted through the ‘Other
comprehensive income’ in the ‘Foreign currency translation reserve’ in the consolidated statement of changes in equity. As at the end of the reporting period the
average rate for balances conversion to 1 USD as follows:
2016 2015
UsD USD
Bangladeshi Taka 76.951 76.758
Myanmar Kyat 1,339.580 1,292.250
Great Britain Pound Sterling (GBP) 0.814 0.657
Indonesian Rupiah 13,440.900 13,793.100
Kenyan Shilling 100.589 100.518
Malaysian Ringit 4.482 4.294
Nepalese Rupee 106.586 104.754
Philippine Peso 49.478 46.846
Saudi Riyal 3.750 3.750
Tanzanian Shilling 2,121.750 2,115.920
UAE Dirham 3.650 3.650
The figures have been rounded off to the nearest US Dollar.
GTL Limited54
GTL INTERNATIONAL LIMITED
d) Going concern basis of accounting
In the last few years, the Company has been incurring cash losses, which have resulted in erosion of its entire share capital and the Group’s and the
Company’s current liabilities exceeded current assets by USD 39,505,863 and USD 41,865,704 respectively. However, the operations of the Company
are expected to be profitable in the foreseeable future. The Parent company has confirmed its intention to continue with the operations of the Group
companies and it has undertaken to provide its continuing financial support to the Company to enable it to meet its payment obligations as and
when they fall due for payment. The Company has made a proposal for settlement of its borrowings from the lenders and is under discussion. The
management is of the view that upon the acceptance and implementation of the Company’s negotiated settlement proposal, it would be in a position
to meets its liabilities and continue its operations. In view of the above, the Company continues to prepare the financial statements on a going concern
basis.
e) Accrual basis of accounting
The financial statements are prepared using the accrual basis of accounting, except for cash flows information, i.e. all items of assets, liabilities, equity, income
and expenses are recognised as they arise.
f) Use of significant estimates, assumptions and judgements
Based on the historical experience and reasonable expectations of future events, the management makes judgements, estimates and assumptions that
affect the application of accounting policies and the reported amounts of assets and liabilities, income and expenses and disclosure of contingencies
and commitments. These relate to lives of items of property and equipment and their residual values, write-down of the value of inventories and
provision for doubtful trade receivables and dues from related parties and impairment in the carrying values of the subsidiaries in the stand-alone
financial statements of the Company.
impairment of assets
Financial assets are assessed at each reporting date to determine whether there is any evidence of impairment which is judged by default or delinquency by a
debtor, the age of the debts, management experience and assessed creditworthiness of the debtor.
In the case of non-financial assets a review is made to determine whether there is any indication of impairment. If any such indication exists, then the asset’s
recoverable amount is estimated. An impairment loss is recognised in the profit or loss, if the carrying amount of the asset exceeds its recoverable amount.
g) new and amended standards
The Group intends to adopt the following new standards, if applicable when they become effective.
– IFRS 15 - Revenue from contracts with customers and associated amendments to various other standards. This establishes a comprehensive framework
for determining whether, how much and when revenue is recognized. It replaces existing revenue recognition guidance, including IAS 18 - revenue, IAS
11 - Construction Contracts and IFIRC 13 - Customer Loyalty Programmes - Effective 1 January 2018.
– IFRS 16 - Leases - Effective date 1 January 2019.
– Recognition of Deferred Tax Assets for Unrealized losses - Amendments to IAS 12 - Effective 1 January 2017.
– Disclosure Initiative - Amendments to IAS 1 - Effective 1 January 2017.
– IFRS 9 Financial Instruments and associated amendments to various other standards - This standard published in July 2014 replaces the existing
guidance in IAS 39 - Financial Instruments, Recognition and Measurements. This includes revised guidance on the classification and measurement of
financial instruments, including a new expected credit loss model for calculating impairment on financial assets, and the new general hedge accounting
requirements. It also carries forward the guidance on recognition and derecognition of financial instruments from IAS 39 - Effective 1 January 2018.

GTL INTERNATIONAL LIMITED
29th Annual Report 2016-17 55
3 summary of significant accounting policies
The significant accounting policies adopted and which have been consistently applied are as follows:
a) revenue and direct costs recognition
- Revenue
Sales represents the amount invoiced for goods delivered and services rendered during the year, net of discounts and returns. Sale of goods is recognised when significant risks and rewards relating to the ownership of goods concerned are transferred to the customer. Revenue from services is recognised by reference to the stage of completion. Stage of completion is measured with reference to surveys of work performed. When the contract outcome cannot be measured reliably, revenue is recognised only to the extent that the expenses incurred are eligible to be recovered.
- Dividend income
Dividend income from investee companies is recognized in the year in which the Company’s right to receive is established.
- Cost of revenue
Direct costs of purchases includes costs of direct materials, direct labour and other direct costs which are directly identifiable with the costs of revenue generated.
b) Borrowing costs
Borrowing costs incurred on funds obtained from banks/financial institutions/related parties is accrued and expensed out on period basis.
c) Discontinued operations
A discontinued operation is a component of the Group’s business, the operations and cash flows which can be clearly distinguished from the rest of the Group and which:
- represents a separate major line of business or geographical area of operations:
- is part of a single coordinated plan to dispose of a separate major line of business or geographical area of operations; or
- is a subsidiary acquired exclusively with a view to re-sale.
Classification as discontinued operation occurs on disposal or when the operation meets the criteria to be classified as held-for-sale, if earlier.
When an operation is classified as a discontinued operation, the comparative statement of comprehensive income is re-presented as if the operation had been discontinued from the start of the comparative year.
d) Leases
Leases under which substantially all the risks and rewards of ownership of the related asset remain with the lessor are classified as operating leases and the lease payments are charged to the statement of profit or loss on a straight-line basis over the period of the lease.
e) Foreign currency transactions and balances
Transactions in foreign currencies are translated into US Dollar (USD) at the rate of exchange ruling on the date of the transactions.
Monetary assets and liabilities expressed in foreign currencies are translated into US Dollar (USD) at the rate of exchange ruling at the end of the reporting period. Non-monetary items that are measured at historical cost in a foreign currency are not translated. These items that are measured at a fair value in a foreign currency are translated into the functional currency at the exchange rate when the fair value was determined.
Gains or losses resulting from settlement of foreign currency transactions and from the translation at the year-end exchange rates of monetary assets and liabilities are recognized in the statement of profit or loss on net basis as either foreign exchange gains or foreign exchange losses and included in other income or other expenses respectively.
f) property and equipment
recognition and measurement
Items of property and equipment are stated at cost or valuation less accumulated depreciation and any accumulated impairment losses.
Gains/losses on disposal are determined by reference to their carrying amount and are included in the statement of profit or loss.
An assessment of residual values is undertaken at each end of the reporting period and if there is a change in estimate, an appropriate adjustment is made to the depreciation charge.
Depreciation
The cost of plant and equipment, furniture and fittings, office equipment, computer equipment and motor vehicles less estimated residual value, where material, is depreciated using the straight-line method from the date of acquisition to the estimated useful lives are as follows:
Plant and equipment 5 years
Furniture and fittings 2 - 10 years
Office equipment 2 - 10 years
Computer equipment 5 - 10 years
Motor vehicles 4 years
Impairment

GTL Limited56
GTL INTERNATIONAL LIMITED
At each end of the reporting period, management assesses the property and equipment to determine whether there are any indications that they may be impaired. In the absence of such indications, no further action is taken. If such indications do exist, an analysis of each asset is undertaken to determine its net recoverable amount and, if this is below its carrying amount, a provision is made.
g) intangible assets
Goodwill
Goodwill represents the excess of the cost of acquisition over the fair value of the Company’s share of the net identifiable assets of the acquired subsidiaries at the date of acquisition and is tested annually for impairment and carried at cost less accumulated impairment losses.
h) subsidiaries
In the stand-alone financial statements of the Company, the subsidiaries are stated at cost less impairment loss, if any.
i) inventories
Inventories are stated at the lower of cost and net realizable value. Cost is determined using the First-In-First-Out (FIFO) method and comprises invoice value plus applicable landing charges. In the work-in progress the cost includes direct costs plus attributable overhead expenses without any element of profit. Net realizable value is based on estimated selling price less any estimated selling expenses and cost of completion and disposal.
Estimate for inventory write-down and reversals
Based on an annual review of the Group’s inventories the management assesses the likely realization proceeds by taking into account the purchase and replacement prices of goods, technological changes, age, likely obsolescence and physical damage to the goods and the price at which they are being invoiced to estimate the write-down required.
Inventory write-downs or reversals of write-downs are included in ‘Cost of sales’.
j) cash and cash equivalents
Cash and cash equivalents comprise cash, balances in bank current accounts and bank deposits free of encumbrance with a maturity date of three months or less from the date of deposit.
k) Borrowings
Borrowings are initially recognised at fair value, net of transaction costs incurred and subsequently measured at amortised cost. Any difference between the proceeds (net of transaction costs) and the redemption amount is recognised in profit or loss over the period of the borrowings using the effective interest method. Fees paid on the establishment of the borrowing facilities are recognised as transaction costs to the extent the facility will be drawn down. In the case, the fee is deferred until the draw down occurs. To the extent there is no such evidence, the fee is capitalised as a prepayment for liquidity services and amortised over the period of the facility to which it relates.
Borrowings are removed from the statement of financial position when the obligation specified in the contract is discharged, cancelled or expired. The difference between the carrying amount of a financial liability that has been extinguished or transferred to another party and the consideration paid, including any non-cash assets transferred or liabilities assumed, is recognised in profit or loss as other income or finance costs, as applicable. Where the terms of a financial liability are renegotiated a gain or loss is recognised in the statement of profit or loss, which is measured as the difference between the carrying amount of the financial liability and the fair value of the financial liability agreed.
Borrowings are classified as current liabilities unless the Company has an unconditional right to defer settlement of the liability for atleast 12 months after the reporting period.
l) current and deferred income tax
The Company is not liable to income tax as there is no corporate taxation in Bermuda where the Company is based.
The tax expense for the year which relate to the operations of the subsidiaries comprises of current and deferred tax. Tax is recognised in the consolidated statement of profit or loss, except to the extent that it relates to item recognised in other comprehensive income or directly in equity. In this case the tax is also recognised in other comprehensive income or directly in equity, respectively.
The current income tax charge is calculated on the basis of the tax laws enacted or substantively enacted at the reporting date in the countries where the subsidiaries operate and generate taxable income. Management periodically evaluates positions taken in tax returns with respect to situations in which applicable tax regulation is subject to interpretation. It establishes provisions where appropriate on the basis of amounts expected to be paid to the tax authorities.
Deferred income tax is recognised, using the liability method, on temporary differences arising between the tax bases of assets and liabilities and their carrying amounts in the consolidated financial statements. However, the deferred income tax is not accounted for that arises from initial recognition of an asset or liability in a transaction other than a business combination that at the time of the transaction affects neither accounting nor table profit or loss.
Deferred income tax is determined using tax rates (and laws) that have been enacted or substantially enacted by the reporting date and are expected to apply when the related deferred income tax asset is realised or the deferred income tax liability is settle.
Deferred income tax assets are recognised only to the extent that it is probable that future taxable profit will be available against which the temporary differences can be utilised. Deferred income tax is provided on temporary differences arising on investments in subsidiaries and associates, except where the timing of the reversal of the temporary difference is controlled by the Group and it is probable that the temporary difference will not reverse in the foreseeable future.
Deferred income tax assets and liabilities are offset when there is a legally enforceable right to offset current tax assets against current tax liabilities and when the deferred income taxes assets and liabilities relate to income taxes levied by the same taxation authority on either the taxable entity or different taxable entities where there is an intention to settle the balances on a net basis.

GTL INTERNATIONAL LIMITED
29th Annual Report 2016-17 57
m) convertible debentures
Convertible debentures are stated at the net amount received.
n) trade payables, provisions and accruals
Liabilities are recognized for amounts to be paid in future for goods and services rendered, whether or not billed to the Group.
Provisions are recognized when the Group has a present legal or constructive obligation as a result of past events, it is probable that an outflow of resources embodying economic benefits will be required to settle the obligation, and a reliable estimate of the amount of the obligation can be made.
o) staff end-of-service benefits
Provision is made for end-of-service benefits payable to the staff at the end of the reporting period in accordance with the labour laws prevailing in the respective jurisdictions where the Group entities are based assuming that all employees were to leave as at the end of the reporting period (Note 25).
p) statement of cash flows
Statement of cash flows is prepared segregating the cash flows from operating, investing and financing activities based on the nature of items. Cash flows under the operating activities are reported using the indirect method, whereby profit/(loss) is adjusted for the effects of transactions of non-cash nature, any deferrals or accruals of past or future of cash receipts and payments and for items of income and expenses which are reflected in investing or financial activities.
q) non-derivative financial assets and liabilities
receivables
Receivables are those financial assets that have fixed or determinable payments and for which there is no active market are initially recognised at fair value plus any directly attributable transactions costs. Subsequent to initial recognition they are measured at amortised cost using the effective interest method. These comprise trade and other receivables, bank balances and dues from related parties.
Trade receivables represent amounts due from customers for services performed in the ordinary course of business. If collection is expected in one year or less they are classified as current assets otherwise as non-current assets. These are carried at the invoiced amounts less an estimate of provision for doubtful receivables based on a review of all outstanding amounts at the year-end. Bad debts are written off when identified.
non-derivative financial liabilities
The non-derivative financial liabilities comprise bank borrowings, trade and other payables and related party payables.
Derecognition of financial assets and liabilities
The Group derecognizes a financial asset when its contractual rights to cash flows from the assets cease and any interest in such derecognised financial assets that is created or retained by the Group is recognised as a separate asset. The Group derecognises a financial liability when its contractual obligations are discharged or cancelled or expire.
Offsetting of financial assets and liabilities
Financial assets and financial liabilities are offset and the net amount presented in the statement of financial position when, and only when, the Group has a legal right to offset the amounts and intends either to settle them on a net basis or to realise the asset and settle the liability simultaneously.
4 risk management
The Group’s activities expose it to a variety of financial risks such as credit risk, market prices risk and liquidity risks as follows:
a) credit risk
This is the risk of financial loss to the Group if a customer or a counterparty to a financial instrument fails to meet its contractual obligations and arises principally from the Group’s customers, related parties and banks. The credit risk, where relevant is explained in the notes on the related account balances, namely trade receivables {Note 20 (d)}, dues from related parties (Note 29) and bank balances {Notes 18 & 21 (a)}.
b) Market price risk
These are the risks arising from changes in market prices, such as foreign exchange rates and interest rates which would affect the Group’s income or the value of its holdings of financial instruments. The management strives to manage market risk exposures within acceptable parameters, while optimising the return.
- Currency risk
The currency risk, where relevant is explained in the note on the related account balances, namely trade receivables {Note 20 (e)}.
c) Liquidity risk
This is the risk where the Company may encounter difficulty in meeting its financial liabilities that are either settled in cash or exchange of another financial asset.
Management monitors its cash requirements to ensure adequacy of funding from the Parent Company. If necessary, funds are arranged from the Shareholders/related parties to ensure that the payment obligations are met on time. For the purpose of effective management of the working capital, the Company strives to strike a balance between the credit period allowed by its suppliers with that allowed to its customers and the inventory holding levels are also kept under constant review to ensure their optimum levels.
5 capital management
Capital of Group consists of share capital (ordinary as well as convertible preference share capital), statutory reserve net of foreign currency adjustment deficit and accumulated losses attributable to the Ultimate Holding company plus the non-controlling interest in the Group which aggregated to deficit in equity of USD 14,313,629

GTL Limited58
GTL INTERNATIONAL LIMITED
for the Group and USD 13,986,981 for the Company, as at the end of the reporting period. The Capital is managed with an objective that adequate funds are available to the Group and the Company on an on-going basis to operate them as going concerns.
6 revenue
the Group the company
2016 2015 2016 2015
UsD UsD UsD UsD
Progressive billings 58,392,899 - 891,154 863,476
Add: Closing work-in-progress (Note 20) 1,150,033 - - -
59,542,932 - 891,154 863,476
7 cost of revenue
the Group the company
2016 2015 2016 2015
UsD UsD UsD UsD
Opening inventories 142,160 6,691,931 - -
Add: Purchases during the year 4,473,451 2,543,564 - -
Less: Closing inventories (Note 19) (623,551) (142,160) - -
Less: Slow-moving inventories written off - 189,108 - -
Cost of inventories consumed 3,992,060 9,282,443 - -
Turnkey project costs 13,043,884 11,383,318 - -
Subcontracting charges 19,955,361 20,704,445 - -
Vehicle hiring charges 1,805,548 5,112,893 - -
Delivery staff salaries 7,541,722 11,675,241 - -
Others 1,231,508 842,979 - -
47,570,083 59,001,319 - -
8 other income
the Group the company
2016 2015 2016 2015
UsD UsD UsD UsD
Dividend income - - 2,110,276 2,557,158
Credit balances written back 2,296,426 2,521,048 - 88,286
Gains on disposal of property, plant and equipment (Note 14) - 6,398 - -
Foreign exchange gains (net) - 5,807 - -
Miscellaneous income 449,592 128,541 - -
2,746,018 2,661,794 2,110,276 2,645,444
9. selling expenses
the Group the company
2016 2015 2016 2015
UsD UsD UsD UsD
S & M staff salaries 1,639,761 2,464,757 - -
S & M staff expenses 4,206 81,119 - -
Business promotion expenses 468,022 744,111 1,343,537 683,132
Travelling and vehicle charges 91,607 150,543 - -
Others 1,267,592 535,067 9,028 -
3,471,188 3,975,597 1,352,565 683,132
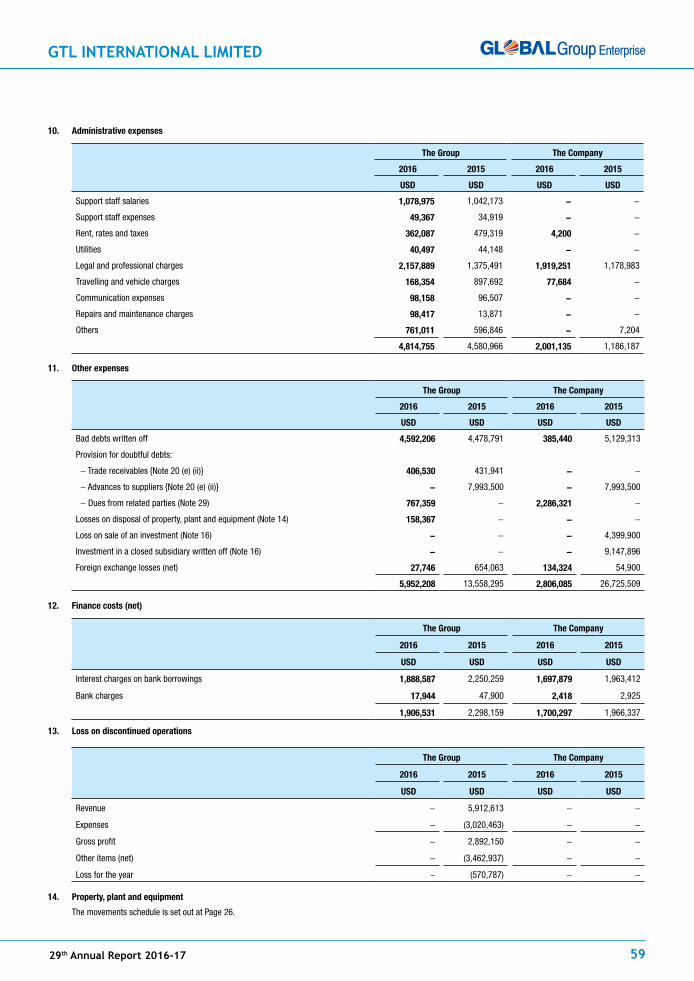
GTL INTERNATIONAL LIMITED
29th Annual Report 2016-17 59
10. Administrative expenses
the Group the company
2016 2015 2016 2015
UsD UsD UsD UsD
Support staff salaries 1,078,975 1,042,173 - -
Support staff expenses 49,367 34,919 - -
Rent, rates and taxes 362,087 479,319 4,200 -
Utilities 40,497 44,148 - -
Legal and professional charges 2,157,889 1,375,491 1,919,251 1,178,983
Travelling and vehicle charges 168,354 897,692 77,684 -
Communication expenses 98,158 96,507 - -
Repairs and maintenance charges 98,417 13,871 - -
Others 761,011 596,846 - 7,204
4,814,755 4,580,966 2,001,135 1,186,187
11. other expenses
the Group the company
2016 2015 2016 2015
UsD UsD UsD UsD
Bad debts written off 4,592,206 4,478,791 385,440 5,129,313
Provision for doubtful debts:
- Trade receivables {Note 20 (e) (ii)} 406,530 431,941 - -
- Advances to suppliers {Note 20 (e) (ii)} - 7,993,500 - 7,993,500
- Dues from related parties (Note 29) 767,359 - 2,286,321 -
Losses on disposal of property, plant and equipment (Note 14) 158,367 - - -
Loss on sale of an investment (Note 16) - - - 4,399,900
Investment in a closed subsidiary written off (Note 16) - - - 9,147,896
Foreign exchange losses (net) 27,746 654,063 134,324 54,900
5,952,208 13,558,295 2,806,085 26,725,509
12. Finance costs (net)
the Group the company
2016 2015 2016 2015
UsD UsD UsD UsD
Interest charges on bank borrowings 1,888,587 2,250,259 1,697,879 1,963,412
Bank charges 17,944 47,900 2,418 2,925
1,906,531 2,298,159 1,700,297 1,966,337
13. Loss on discontinued operations
the Group the company
2016 2015 2016 2015
UsD UsD UsD UsD
Revenue - 5,912,613 - -
Expenses - (3,020,463) - -
Gross profit - 2,892,150 - -
Other items (net) - (3,462,937) - -
Loss for the year - (570,787) - -
14. property, plant and equipment
The movements schedule is set out at Page 26.
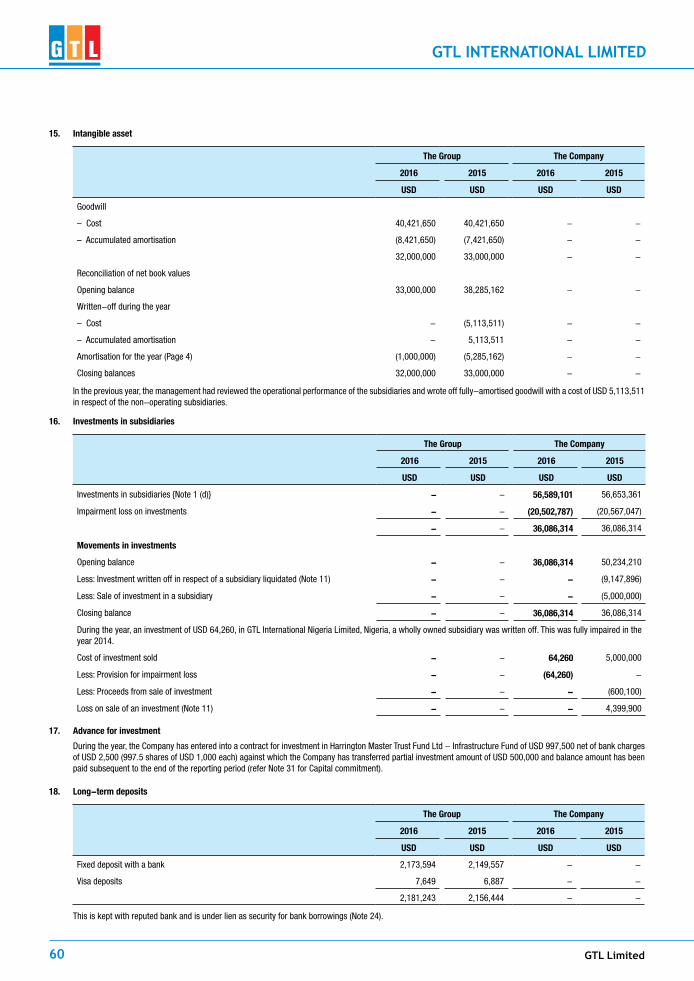
GTL Limited60
GTL INTERNATIONAL LIMITED
15. intangible asset
the Group the company
2016 2015 2016 2015
UsD UsD UsD UsD
Goodwill
– Cost 40,421,650 40,421,650 - -
– Accumulated amortisation (8,421,650) (7,421,650) - -
32,000,000 33,000,000 - -
Reconciliation of net book values
Opening balance 33,000,000 38,285,162 - -
Written-off during the year
– Cost - (5,113,511) - -
– Accumulated amortisation - 5,113,511 - -
Amortisation for the year (Page 4) (1,000,000) (5,285,162) - -
Closing balances 32,000,000 33,000,000 - -
In the previous year, the management had reviewed the operational performance of the subsidiaries and wrote off fully-amortised goodwill with a cost of USD 5,113,511 in respect of the non-operating subsidiaries.
16. investments in subsidiaries
the Group the company
2016 2015 2016 2015
UsD UsD UsD UsD
Investments in subsidiaries {Note 1 (d)} - - 56,589,101 56,653,361
Impairment loss on investments - - (20,502,787) (20,567,047)
- - 36,086,314 36,086,314
Movements in investments
Opening balance - - 36,086,314 50,234,210
Less: Investment written off in respect of a subsidiary liquidated (Note 11) - - - (9,147,896)
Less: Sale of investment in a subsidiary - - - (5,000,000)
Closing balance - - 36,086,314 36,086,314
During the year, an investment of USD 64,260, in GTL International Nigeria Limited, Nigeria, a wholly owned subsidiary was written off. This was fully impaired in the year 2014.
Cost of investment sold - - 64,260 5,000,000
Less: Provision for impairment loss - - (64,260) -
Less: Proceeds from sale of investment - - - (600,100)
Loss on sale of an investment (Note 11) - - - 4,399,900
17. Advance for investment
During the year, the Company has entered into a contract for investment in Harrington Master Trust Fund Ltd - Infrastructure Fund of USD 997,500 net of bank charges of USD 2,500 (997.5 shares of USD 1,000 each) against which the Company has transferred partial investment amount of USD 500,000 and balance amount has been paid subsequent to the end of the reporting period (refer Note 31 for Capital commitment).
18. Long-term deposits
the Group the company
2016 2015 2016 2015
UsD UsD UsD UsD
Fixed deposit with a bank 2,173,594 2,149,557 - -
Visa deposits 7,649 6,887 - -
2,181,243 2,156,444 - -
This is kept with reputed bank and is under lien as security for bank borrowings (Note 24).
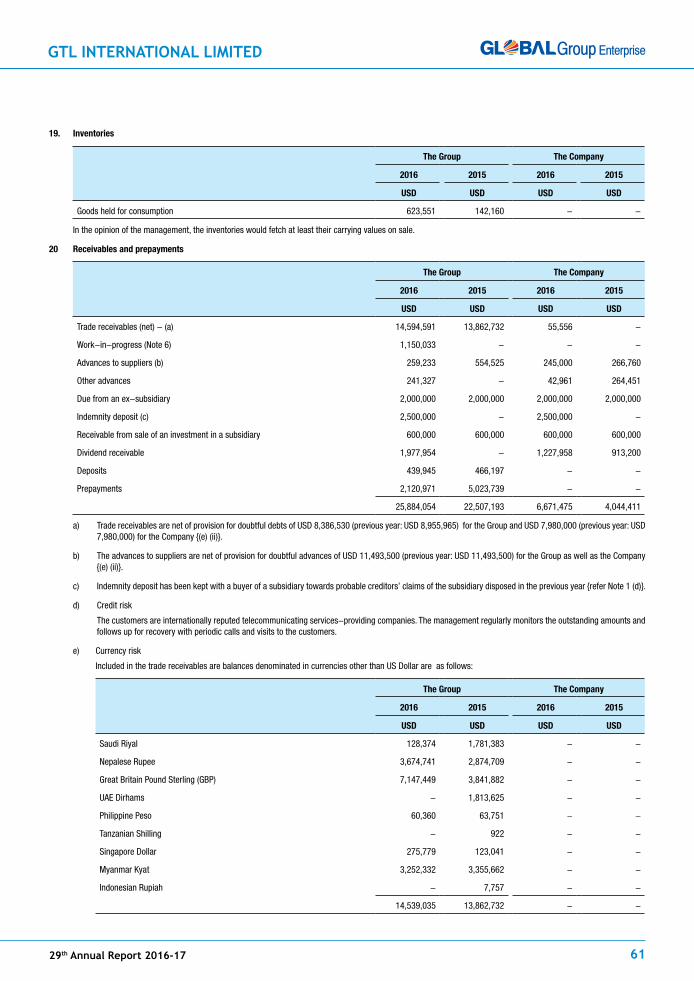
GTL INTERNATIONAL LIMITED
29th Annual Report 2016-17 61
19. inventories
the Group the company
2016 2015 2016 2015
UsD UsD UsD UsD
Goods held for consumption 623,551 142,160 - -
In the opinion of the management, the inventories would fetch at least their carrying values on sale.
20 receivables and prepayments
the Group the company
2016 2015 2016 2015
UsD UsD UsD UsD
Trade receivables (net) - (a) 14,594,591 13,862,732 55,556 -
Work-in-progress (Note 6) 1,150,033 - - -
Advances to suppliers (b) 259,233 554,525 245,000 266,760
Other advances 241,327 - 42,961 264,451
Due from an ex-subsidiary 2,000,000 2,000,000 2,000,000 2,000,000
Indemnity deposit (c) 2,500,000 - 2,500,000 -
Receivable from sale of an investment in a subsidiary 600,000 600,000 600,000 600,000
Dividend receivable 1,977,954 - 1,227,958 913,200
Deposits 439,945 466,197 - -
Prepayments 2,120,971 5,023,739 - -
25,884,054 22,507,193 6,671,475 4,044,411
a) Trade receivables are net of provision for doubtful debts of USD 8,386,530 (previous year: USD 8,955,965) for the Group and USD 7,980,000 (previous year: USD 7,980,000) for the Company {(e) (ii)}.
b) The advances to suppliers are net of provision for doubtful advances of USD 11,493,500 (previous year: USD 11,493,500) for the Group as well as the Company {(e) (ii)}.
c) Indemnity deposit has been kept with a buyer of a subsidiary towards probable creditors’ claims of the subsidiary disposed in the previous year {refer Note 1 (d)}.
d) Credit risk
The customers are internationally reputed telecommunicating services-providing companies. The management regularly monitors the outstanding amounts and follows up for recovery with periodic calls and visits to the customers.
e) Currency risk
Included in the trade receivables are balances denominated in currencies other than US Dollar are as follows:
the Group the company
2016 2015 2016 2015
UsD UsD UsD UsD
Saudi Riyal 128,374 1,781,383 - -
Nepalese Rupee 3,674,741 2,874,709 - -
Great Britain Pound Sterling (GBP) 7,147,449 3,841,882 - -
UAE Dirhams - 1,813,625 - -
Philippine Peso 60,360 63,751 - -
Tanzanian Shilling - 922 - -
Singapore Dollar 275,779 123,041 - -
Myanmar Kyat 3,252,332 3,355,662 - -
Indonesian Rupiah - 7,757 - -
14,539,035 13,862,732 - -

GTL Limited62
GTL INTERNATIONAL LIMITED
e) Impairment
the Group the company
2016 2015 2016 2015
UsD UsD UsD UsD
i) The age analysis of total trade receivables receivables (gross) was as follows:
Less than one year 14,438,716 12,035,806 55,556 -
Over one year 8,542,405 10,782,891 7,980,000 7,980,000
total 22,981,121 22,818,697 8,035,556 7,980,000
ii) The movements in provision for doubtful debts and advances during the year was as follows:
Opening balance 20,449,465 12,024,024 19,473,500 11,480,000
Provision for the year (Note 11):
- Against trade receivables 406,530 431,941 - -
- Against advances to suppliers - 7,993,500 - 7,993,500
Utilised for balances written off (975,965) - - -
Closing balance 19,880,030 20,449,465 19,473,500 19,473,500
The closing balance comprises as follows:
Provision against trade receivables 8,386,530 8,955,965 7,980,000 7,980,000
Provision against advances to suppliers 11,493,500 11,493,500 11,493,500 11,493,500
19,880,030 20,449,465 19,473,500 19,473,500
21. cash and cash equivalents
the Group the company
2016 2015 2016 2015
UsD UsD UsD UsD
Cash in hand 11,279 35,524 - -
Cash at bank and cash in hand 5,773,403 6,594,605 804,130 290,608
5,784,682 6,630,129 804,130 290,608
a) The bank accounts are placed with reputed banks.
b) For the purpose of the statement of cash flows, the cash and cash equivalents have been arrived as below:
the Group the company
2016 2015 2016 2015
UsD UsD UsD UsD
Cash and cash equivalents as above 5,784,682 6,630,129 804,130 290,608
Less: Bank overdraft (823,497) (812,098) - -
4,961,185 5,818,031 804,130 290,608
22. capital and reserve
a) share capital
the Group the company
2016 2015 2016 2015
UsD UsD UsD UsD
Authorised
76,000,000 ordinary shares of USD 1 each 76,000,000 76,000,000 76,000,000 76,000,000
120,000,000 preference shares of USD 1 each 120,000,000 120,000,000 120,000,000 120,000,000
196,000,000 196,000,000 196,000,000 196,000,000
issued and fully paid
3,000,000 ordinary shares of USD 1 each 3,000,000 3,000,000 3,000,000 3,000,000
5,000,000, 3.5% redeemable preference shares of USD 1 each 5,000,000 5,000,000 5,000,000 5,000,000
8,000,000 8,000,000 8,000,000 8,000,000
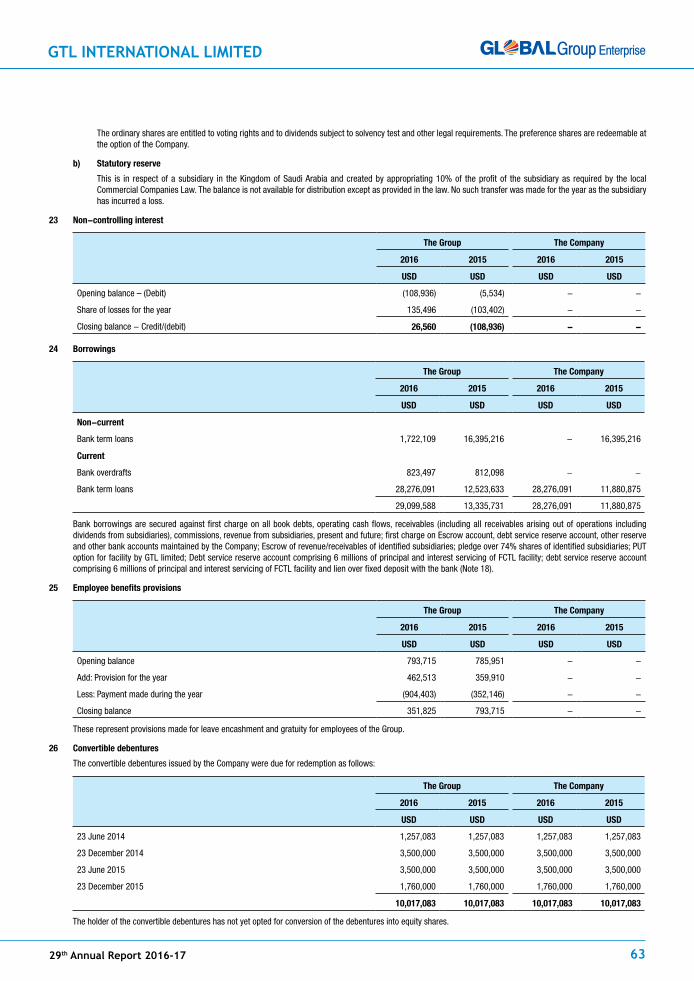
GTL INTERNATIONAL LIMITED
29th Annual Report 2016-17 63
The ordinary shares are entitled to voting rights and to dividends subject to solvency test and other legal requirements. The preference shares are redeemable at the option of the Company.
b) statutory reserve
This is in respect of a subsidiary in the Kingdom of Saudi Arabia and created by appropriating 10% of the profit of the subsidiary as required by the local Commercial Companies Law. The balance is not available for distribution except as provided in the law. No such transfer was made for the year as the subsidiary has incurred a loss.
23 non-controlling interest
the Group the company
2016 2015 2016 2015
UsD UsD UsD UsD
Opening balance – (Debit) (108,936) (5,534) - -
Share of losses for the year 135,496 (103,402) - -
Closing balance - Credit/(debit) 26,560 (108,936) - -
24 Borrowings
the Group the company
2016 2015 2016 2015
UsD UsD UsD UsD
non-current
Bank term loans 1,722,109 16,395,216 - 16,395,216
current
Bank overdrafts 823,497 812,098 - -
Bank term loans 28,276,091 12,523,633 28,276,091 11,880,875
29,099,588 13,335,731 28,276,091 11,880,875
Bank borrowings are secured against first charge on all book debts, operating cash flows, receivables (including all receivables arising out of operations including dividends from subsidiaries), commissions, revenue from subsidiaries, present and future; first charge on Escrow account, debt service reserve account, other reserve and other bank accounts maintained by the Company; Escrow of revenue/receivables of identified subsidiaries; pledge over 74% shares of identified subsidiaries; PUT option for facility by GTL limited; Debt service reserve account comprising 6 millions of principal and interest servicing of FCTL facility; debt service reserve account comprising 6 millions of principal and interest servicing of FCTL facility and lien over fixed deposit with the bank (Note 18).
25 employee benefits provisions
the Group the company
2016 2015 2016 2015
UsD UsD UsD UsD
Opening balance 793,715 785,951 - -
Add: Provision for the year 462,513 359,910 - -
Less: Payment made during the year (904,403) (352,146) - -
Closing balance 351,825 793,715 - -
These represent provisions made for leave encashment and gratuity for employees of the Group.
26 convertible debentures
The convertible debentures issued by the Company were due for redemption as follows:
the Group the company
2016 2015 2016 2015
UsD UsD UsD UsD
23 June 2014 1,257,083 1,257,083 1,257,083 1,257,083
23 December 2014 3,500,000 3,500,000 3,500,000 3,500,000
23 June 2015 3,500,000 3,500,000 3,500,000 3,500,000
23 December 2015 1,760,000 1,760,000 1,760,000 1,760,000
10,017,083 10,017,083 10,017,083 10,017,083
The holder of the convertible debentures has not yet opted for conversion of the debentures into equity shares.

GTL Limited64
GTL INTERNATIONAL LIMITED
27 taxation
income tax
Per the existing tax regulations in Bermuda, no tax is payable on the income of the Company. The subsidiaries are liable to income tax according to the tax legislations of the countries in which they operate.
the Group the company
2016 2015 2016 2015
UsD UsD UsD UsD
income tax expense (net)
Income tax expense 1,418,584 1,472,007 - -
Deferred tax (4,427) (75,127) - -
Deferred tax of a subsidiary sold - 2,834,711 - -
1,414,157 4,231,591 - -
Deferred tax asset
Opening balance 390,591 3,150,175 - -
Movements during the year 4,427 (2,759,584) - -
Foreign currency translation reserve {Note 2 (b)} 5,353 - - -
Closing balance 400,371 390,591 - -
28 trade and other payables
the Group the company
2016 2015 2016 2015
UsD UsD UsD UsD
Trade payables 5,958,066 5,542,461 - -
Advances from customers 322,152 152,300 - -
Accrued interest expense 8,119,495 6,421,616 8,119,495 6,421,616
Accrued and deferred income 4,657,962 3,287,544 - -
Tax payable 1,400,705 1,092,936 - -
Sundry creditors & accruals 6,532,988 5,965,381 1,242,524 242,525
26,991,368 22,462,238 9,362,019 6,664,141
29 related parties
Related parties which fall within the definition of a related party as contained in International Accounting Standard 24 comprise companies under common ownership and common management control. At the end of the reporting period significant balances with related parties were as follows:
Companies under common ownership and management control
the Group the company
2016 2015 2016 2015
UsD UsD UsD UsD
Disclosed as dues from related parties:
- Parent company - 1,150,794 - 767,359
- Other related parties 38,233 56,991 4,076,322 7,720,588
38,233 1,207,785 4,076,322 8,487,947
Due from related parties are net of provision for doubtful debts of USD 767,359 for the Group and USD 2,286,321 for the Company (Note 11). In the opinion of the management, all these related party balances are fully recoverable.

GTL INTERNATIONAL LIMITED
29th Annual Report 2016-17 65
the Group the company
2016 2015 2016 2015
UsD UsD UsD UsD
Disclosed as dues to related parties:
- Parent company 14,404,788 15,310,690 11,305,593 11,306,302
- Other related parties 31,147 31,146 3,164,436 1,773,992
14,435,935 15,341,836 14,470,029 13,080,294
All the above balances are interest-free and payable on demand, hence classified as current assets and current liabilities as applicable.
Significant transactions with related parties during the year which the management considers to be in the normal course of business and at terms which correspond with the terms with third parties were as follows:
Companies under common ownership and management control
the Group the company
2016 2015 2016 2015
UsD UsD UsD UsD
Dividend income - - 2,110,276 2,557,158
Marketing fees - - 546,488 963,876
Bad debts written off and
provision for doubtful debts 1,152,799 - 2,671,761 5,129,313
Administrative expenses - - - 895,040
Interest recharge - - - 333,676
30 operating lease commitments
GTL Europe Limited has entered into non-cancellable operating leases and hire purchase contracts for the period of five years. The total of the future lease payments is as follows:
the Group the company
2016 2015 2016 2015
UsD UsD UsD UsD
Not later than one year 12,863 48,470 - -
Between one and five years 42,395 66,702 - -
55,258 115,172 - -
31. capital commitment
the Group the company
2016 2015 2016 2015
UsD UsD UsD UsD
For purchase of investment (Note 17) 497,500 - 497,500 -
32 Fair values of financial instruments
The fair value of a financial instrument is the amount for which an asset could be exchanged, or a liability settled, between knowledgeable, willing parties in an arm’s length transaction.
The fair value of the financial assets and financial liabilities which are required to be carried at cost or at amortised cost approximates to their carrying values.
33 Approval of financial statements
These financial statements were approved by the Directors on 7 March 2017.
For GTL International Limited
Vipulkumar patel Milind Vasant Bapat Director Director

GTL Limited66
GTL (SINGAPORE) PTE. LTD.
Directors’ report
The directors are pleased to present their statement to the members together with the audited financial statements of GTL (Singapore) Pte. Ltd. (the “Company”) for the financial year ended 31 December 2016.
1 opiNioN oF tHe Directors
In the opinion of the directors,
(a) the financial statements of the Company are drawn up so as to give a true and fair view of the financial position of the Company as at 31 December 2016 and the financial performance, changes in equity and cash flows of the Company for the year then ended; and
(b) at the date of this statement, there are reasonable grounds to believe that the Company will be able to pay its debt as and when they fall due.
2 Directors
The directors of the Company in office at the date of this statement are: Sukanta Kumar Roy Milind Vasant Bapat Mayekar Shivani Shailesh
3 ArrANGeMeNts to eNABLe Directors to AcQUire sHAres or DeBeNtUres
Neither at the end of nor at any time during the financial year was the Company a party to any arrangement whose objects are, or one of whose objects is, to enable the directors of the Company to acquire benefits by means of the acquisition of shares in, or debentures of the Company or any other body corporate.
4 Directors’ iNterests iN sHAres or DeBeNtUres
According to the register of directors’ shareholdings kept by the Company under section 164 of the Singapore Companies Act, Chapter 50 (the “Act”), the directors of the Company who held office at the end of the financial year had no interests in the shares or debentures of the Company and its related corporations except as stated below:
Name of Directors Direct interest
At the beginning of financial year At the end of financial year
ordinary shares of the Ultimate Holding company
Sukanta Kumar Roy 594 594
Milind Vasant Bapat 15,100 15,100
By virtue of Section 7 of the Companies Act, the above directors with shareholdings are deemed to have an interest in the Company and in all the related corporations of the Company.
5 sHAre optioNs
There were no options granted during the financial year to subscribe for unissued shares of the Company.
No shares have been issued during the financial year by virtue of the exercise of options to take up unissued shares of the Company.
There were no unissued shares of the Company under option at the end of the financial year.
6 AUDitors
Theauditors,Rohan•Mah&PartnersLLPhaveexpressedtheirwillingnesstoacceptreappointmentasauditor.
oN BeHALF oF tHe BoArD oF Directors
Milind Vasant Bapat
Director
Mayekar shivani shailesh
Director
Singapore,3 March 2017

GTL (SINGAPORE) PTE. LTD.
29th Annual Report 2016-17 67
iNDepeNDeNt AUDitors’ report
TO THE MEMBERS OF
GtL (siNGApore) pte. LtD.(incorporated in the republic of singapore)
opinion
We have audited the accompanying financial statements of GTL (Singapore) Pte. Ltd. (“the Company’’), which comprise the statement of financial position as at 31 December 2016, and the statement of comprehensive income, statement of changes in equity and statement of cash flows for the year then ended, and notes to the financial statements, including a summary of significant accounting policies.
In our opinion, the accompanying financial statements are properly drawn up in accordance with the provisions of the Companies Act, Chapter 50 (the Act) and Financial Reporting Standards in Singapore (FRSs) so as to give a true and fair view of the financial position of the Company as at 31 December 2016 and of the financial performance, changes in equity and cash flows of the Company for the year ended on that date.
Basis for opinion
We conducted our audit in accordance with Singapore Standards on Auditing (SSAs). Our responsibilities under those standards are further described in the Auditor’s Responsibilities for the Audit of the Financial Statements section of our report. We are independent of the Company in accordance with the Accounting and Corporate Regulatory Authority (ACRA) Code of Professional Conduct and Ethics for Public Accountants and Accounting Entities (ACRA Code) together with the ethical requirements that are relevant to our audit of the financial statements in Singapore, and we have fulfilled our other ethical responsibilities in accordance with these requirements and the ACRA Code. We believe that the audit evidence we have obtained is sufficient and appropriate to provide a basis for our opinion.
other information
Management is responsible for the other information. The other information comprises the Directors’ Statement [set out on pages 1 to 2].
Our opinion on the financial statements does not cover the other information and we do not express any form of assurance conclusion thereon.
In connection with our audit of the financial statements, our responsibility is to read the other information and, in doing so, consider whether the other information is materially inconsistent with the financial statements or our knowledge obtained in the audit or otherwise appears to be materially misstated. If, based on the work we have performed, we conclude that there is a material misstatement of this other information, we are required to report that fact. We have nothing to report in this regard.
responsibilities of Management and Directors for the Financial statements
Management is responsible for the preparation of financial statements that give a true and fair view in accordance with the provisions of the Act and FRSs, and for devising and maintaining a system of internal accounting controls sufficient to provide a reasonable assurance that assets are safeguarded against loss from unauthorised use or disposition; and transactions are properly authorised and that they are recorded as necessary to permit the preparation of true and fair financial statements and to maintain accountability of assets.
In preparing the financial statements, management is responsible for assessing the Company’s ability to continue as a going concern, disclosing, as applicable, matters related to going concern and using the going concern basis of accounting unless management either intends to liquidate the Company or to cease operations, or has no realistic alternative but to do so.
The directors’ responsibilities include overseeing the Company’s financial reporting process.
Auditor’s responsibilities for the Audit of the Financial statements
Our objectives are to obtain reasonable assurance about whether the financial statements as a whole are free from material misstatement, whether due to fraud or error, and to issue an auditor’s report that includes our opinion. Reasonable assurance is a high level of assurance, but is not a guarantee that an audit conducted in accordance with SSAs will always detect a material misstatement when it exists. Misstatements can arise from fraud or error and are considered material if, individually or in the aggregate, they could reasonably be expected to influence the economic decisions of users taken on the basis of these financial statements.
As part of an audit in accordance with SSAs, we exercise professional judgement and maintain professional scepticism throughout the audit. We also:
• Identifyandassesstherisksofmaterialmisstatementofthefinancialstatements,whetherduetofraudorerror,designandperformauditproceduresresponsivetothoserisks, and obtain audit evidence that is sufficient and appropriate to provide a basis for our opinion. The risk of not detecting a material misstatement resulting from fraud is higher than for one resulting from error, as fraud may involve collusion, forgery, intentional omissions, misrepresentations, or the override of internal control.
• Obtainanunderstandingofinternalcontrolrelevanttotheauditinordertodesignauditproceduresthatareappropriateinthecircumstances,butnotforthepurposeof expressing an opinion on the effectiveness of the Company’s internal control.
• Evaluatetheappropriatenessofaccountingpoliciesusedandthereasonablenessofaccountingestimatesandrelateddisclosuresmadebymanagement.
• Concludeon theappropriatenessofmanagement’suseof thegoingconcernbasisof accountingand,basedon theaudit evidenceobtained,whetheramaterialuncertainty exists related to events or conditions that may cast significant doubt on the Company’s ability to continue as a going concern. If we conclude that a material uncertainty exists, we are required to draw attention in our auditor’s report to the related disclosures in the financial statements or, if such disclosures are inadequate, to modify our opinion. Our conclusions are based on the audit evidence obtained up to the date of our auditor’s report. However, future events or conditions may cause the Company to cease to continue as a going concern.
• Evaluate theoverallpresentation,structureandcontentof the financial statements, including thedisclosures,andwhether the financial statements represent theunderlying transactions and events in a manner that achieves fair presentation.
We communicate with the directors regarding, among other matters, the planned scope and timing of the audit and significant audit findings, including any significant deficiencies in internal control that we identify during our audit.
report on other Legal and regulatory requirements
In our opinion, the accounting and other records required by the Act to be kept by the Company have been properly kept in accordance with the provisions of the Act.
ROHAN•MAH&PARTNERSLLPPublic Accountants andChartered Accountants
Singapore3 March 2017(RK/MA./SR/HL/JS/FC/ns)
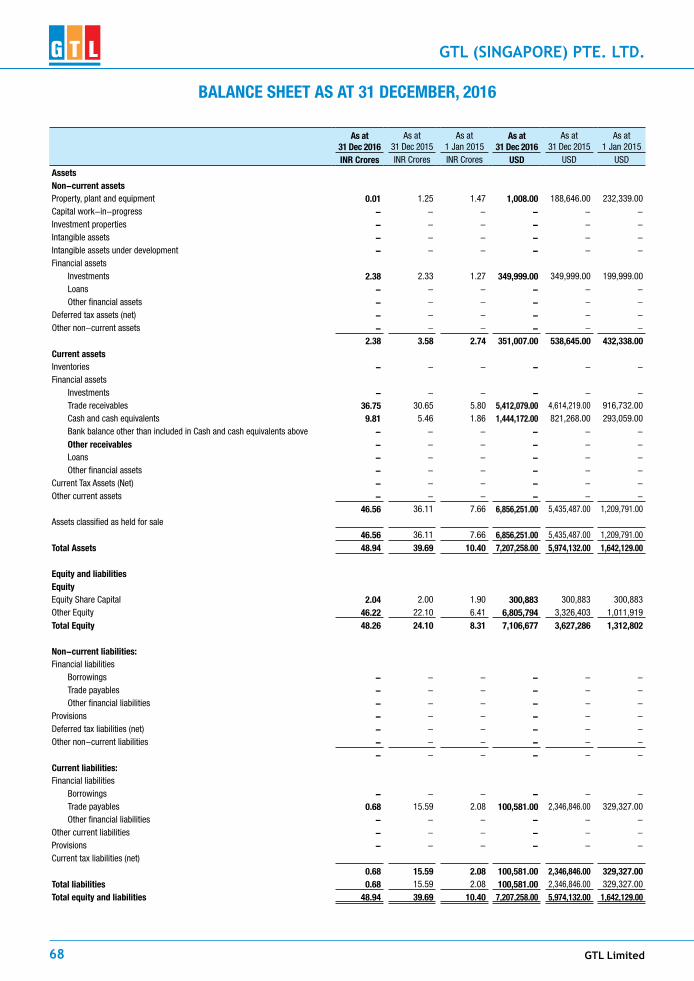
GTL Limited68
GTL (SINGAPORE) PTE. LTD.
BALANce sHeet As At 31 DeceMBer, 2016
As at31 Dec 2016
As at31 Dec 2015
As at 1 Jan 2015
As at31 Dec 2016
As at31 Dec 2015
As at 1 Jan 2015
iNr crores INR Crores INR Crores UsD USD USDAssetsNon-current assetsProperty, plant and equipment 0.01 1.25 1.47 1,008.00 188,646.00 232,339.00 Capital work-in-progress - - - - - - Investment properties - - - - - - Intangible assets - - - - - - Intangible assets under development - - - - - - Financial assets Investments 2.38 2.33 1.27 349,999.00 349,999.00 199,999.00 Loans - - - - - - Other financial assets - - - - - - Deferred tax assets (net) - - - - - - Other non-current assets - - - - - -
2.38 3.58 2.74 351,007.00 538,645.00 432,338.00 current assetsInventories - - - - - - Financial assets Investments - - - - - - Trade receivables 36.75 30.65 5.80 5,412,079.00 4,614,219.00 916,732.00 Cash and cash equivalents 9.81 5.46 1.86 1,444,172.00 821,268.00 293,059.00 Bank balance other than included in Cash and cash equivalents above - - - - - - other receivables - - - - - - Loans - - - - - - Other financial assets - - - - - - Current Tax Assets (Net) - - - - - - Other current assets - - - - - -
46.56 36.11 7.66 6,856,251.00 5,435,487.00 1,209,791.00 Assets classified as held for sale
46.56 36.11 7.66 6,856,251.00 5,435,487.00 1,209,791.00 total Assets 48.94 39.69 10.40 7,207,258.00 5,974,132.00 1,642,129.00
equity and liabilitiesequityEquity Share Capital 2.04 2.00 1.90 300,883 300,883 300,883 Other Equity 46.22 22.10 6.41 6,805,794 3,326,403 1,011,919 total equity 48.26 24.10 8.31 7,106,677 3,627,286 1,312,802
Non-current liabilities:Financial liabilities Borrowings - - - - - - Trade payables - - - - - - Other financial liabilities - - - - - - Provisions - - - - - - Deferred tax liabilities (net) - - - - - - Other non-current liabilities - - - - - -
- - - - - - current liabilities:Financial liabilities Borrowings - - - - - - Trade payables 0.68 15.59 2.08 100,581.00 2,346,846.00 329,327.00 Other financial liabilities - - - - - - Other current liabilities - - - - - - Provisions - - - - - - Current tax liabilities (net)
0.68 15.59 2.08 100,581.00 2,346,846.00 329,327.00 total liabilities 0.68 15.59 2.08 100,581.00 2,346,846.00 329,327.00 total equity and liabilities 48.94 39.69 10.40 7,207,258.00 5,974,132.00 1,642,129.00
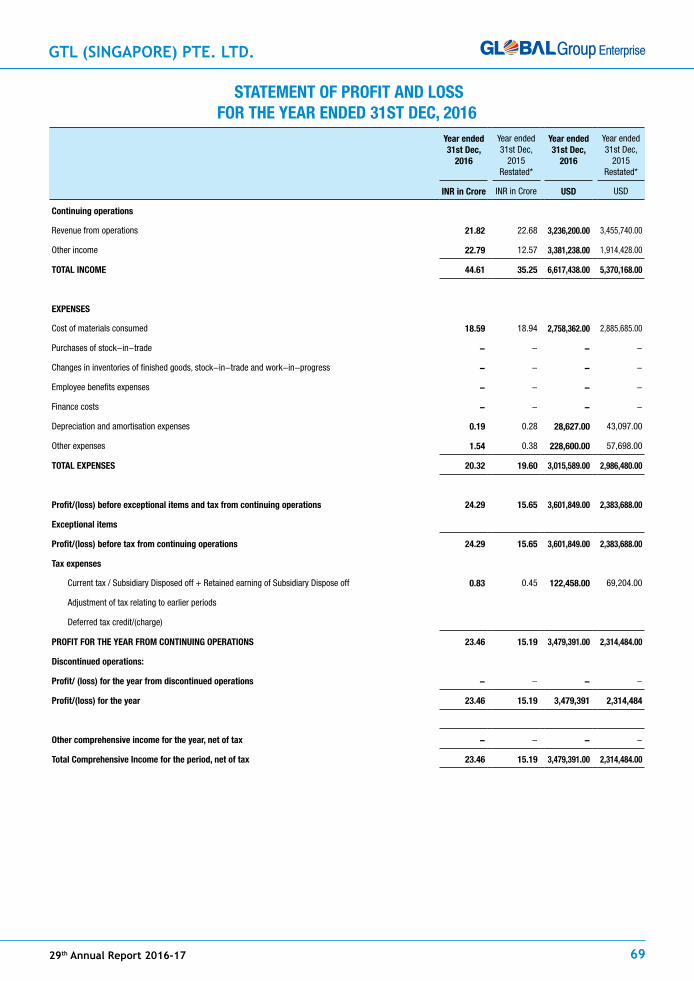
GTL (SINGAPORE) PTE. LTD.
29th Annual Report 2016-17 69
stAteMeNt oF proFit AND Loss For tHe yeAr eNDeD 31st Dec, 2016
year ended31st Dec,
2016
Year ended31st Dec,
2015 Restated*
year ended31st Dec,
2016
Year ended31st Dec,
2015 Restated*
iNr in crore INR in Crore UsD USD
continuing operations
Revenue from operations 21.82 22.68 3,236,200.00 3,455,740.00
Other income 22.79 12.57 3,381,238.00 1,914,428.00
totAL iNcoMe 44.61 35.25 6,617,438.00 5,370,168.00
eXpeNses
Cost of materials consumed 18.59 18.94 2,758,362.00 2,885,685.00
Purchases of stock-in-trade - - - -
Changes in inventories of finished goods, stock-in-trade and work-in-progress - - - -
Employee benefits expenses - - - -
Finance costs - - - -
Depreciation and amortisation expenses 0.19 0.28 28,627.00 43,097.00
Other expenses 1.54 0.38 228,600.00 57,698.00
totAL eXpeNses 20.32 19.60 3,015,589.00 2,986,480.00
profit/(loss) before exceptional items and tax from continuing operations 24.29 15.65 3,601,849.00 2,383,688.00
exceptional items
profit/(loss) before tax from continuing operations 24.29 15.65 3,601,849.00 2,383,688.00
tax expenses
Current tax / Subsidiary Disposed off + Retained earning of Subsidiary Dispose off 0.83 0.45 122,458.00 69,204.00
Adjustment of tax relating to earlier periods
Deferred tax credit/(charge)
proFit For tHe yeAr FroM coNtiNUiNG operAtioNs 23.46 15.19 3,479,391.00 2,314,484.00
Discontinued operations:
profit/ (loss) for the year from discontinued operations - - - -
profit/(loss) for the year 23.46 15.19 3,479,391 2,314,484
other comprehensive income for the year, net of tax - - - -
total comprehensive income for the period, net of tax 23.46 15.19 3,479,391.00 2,314,484.00

GTL Limited70
GTL (SINGAPORE) PTE. LTD.
stAteMeNt oF cHANGes iN eQUity For tHe yeAr eNDeD 31 DeceMBer 2016
a. equity share capital:
Nos. iNr crores
UsD
At 1 January 2015 500,000 1.90 300,883
issue of share capital - -
At 31 December 2015 500,000 2.00 300,883
issue of share capital - -
At 31 December 2016 500,000 2.04 300,883
b. other equity:
For the year ended 31 December 2016
particulars equity component
of compound financial
instrument (Note 18)
reserves & surplus items of oci total equity
capital reserve (Note 18)
capital redemption
reserve (Note 18)
securities premium account (Note 18)
Debenture redemption
reserve (Note 18)
General reserve
(Note 18)
Balance in statement of profit and Loss (Note 18)
FVtoci reserve
(Note 18)
iNr in crores
iNr in crores
iNr in crores
iNr in crores
iNr in crores
iNr in crores
iNr in crores
iNr in crores
iNr in crores
As at 31 December 2015 - - - - - - 22.10 - 22.10
Net profit for the period 23.46 23.46
other comprehensive income
total comprehensive income - - - - - - 23.46 - 23.46
translation reserves - - - - - - 0.66 - 0.66
As at 31 December 2016 - - - - - - 46.22 - 46.22
For the year ended 31 December 2015
particulars equity component
of compound financial
instrument (Note 18)
reserves & surplus items of oci total equity
capital reserve (Note 18)
capital redemption
reserve (Note 18)
securities premium account (Note 18)
Debenture redemption
reserve (Note 18)
General reserve
(Note 18)
Balance in statement of profit and Loss (Note 18)
FVtoci reserve
(Note 18)
iNr in crores
iNr in crores
iNr in crores
iNr in crores
iNr in crores
iNr in crores
iNr in crores
iNr in crores
iNr in crores
As at 1 January 2015 - - - - - - 6.41 - 6.41
Net profit for the period 15.19 15.19
other comprehensive income
total comprehensive income - - - - - - 15.19 - 15.19
translation reserves - - - - - - 0.50 - 0.50
As at 31 December 2015 - - - - - - 22.10 - 22.10

GTL (SINGAPORE) PTE. LTD.
29th Annual Report 2016-17 71
stAteMeNt oF cAsH FLows For tHe perioD eNDeD 31 DeceMBer 2016
31 Dec 2016 31 Dec 2015 31 Dec 2016 31 Dec 2015
iNr in crores INR in Crores UsD USD
operating activities
Profit before tax from continuing operations 24.46 15.83 3,601,849.00 2,383,688.00
Adjustments to reconcile profit before tax to net cash flows:
Depreciation and impairment of property, plant and equipment 0.19 0.29 28,627.00 43,097.00
Gain/Loss on disposal of property, plant and equipment 1.08 0.00 159,011.00 596.00
Finance income (including fair value change in financial instruments)_Dividend Income (22.96) (12.68) (3,381,238.00) (1,908,621.00)
working capital adjustments:
(Increase)/decrease in trade receivables 7.51 (9.61) 1,106,201.00 (1,446,290.00)
Increase /(decrease) in trade payables, other current and non current liabilities and provisions (15.23) 13.95 (2,243,044.00) 2,099,284.00
(4.95) 7.78 (728,594.00) 1,171,754.00
Income tax paid (including TDS) (net) (0.83) (0.46) (122,458.00) (69,204.00)
Net cash flows from operating activities (5.78) 7.32 (851,052.00) 1,102,550.00
investing activities
Purchase of Investment Subsidiary - (1.00) - (150,000.00)
Amount due from ultimate holding company - Non-trade (7.67) (8.75) (1,129,020.00) (1,317,505.00)
Amount due from Subsidiaries _ Trade 4.90 (4.80) 722,261.00 (722,261.00)
Divdend Received 12.79 11.27 1,883,936 1,697,190
Net cash flows from / (used in) investing activities 10.03 (3.27) 1,477,177.00 (492,576.00)
Financing activities
Amount due to Ultimate holding Company - None Trade (0.02) - (3,221.00) -
Amount due to Subsiary - None Trade - (0.54) - (81,765.00)
Net cash flows from / (used in) financing activities (0.02) (0.54) (3,221.00) (81,765.00)
Net increase / (decrease) in cash and cash equivalents 4.23 3.51 622,904.00 528,209.00
Translation differences - - - -
Cash and cash equivalents at the beginning of the year 5.36 1.86 821,268.00 293,059.00
Cash and cash equivalents at the end 9.59 5.36 1,444,172.00 821,268.00

GTL Limited72
GTL (SINGAPORE) PTE. LTD.
scHeDULes to tHe FiNANciALs For tHe yeAr eNDeD AND As At DeceMBer 31, 2016
3.
prop
erty
, pLA
Nt A
ND e
QUip
MeN
t
Free
hold
land
Leas
ehold
lan
dBu
ilding
spla
nt &
ma
chi-
nery
Furn
iture
& fix
ture
s
offic
e eq
uip-
ment
s
comp
uters
Net
work
ing
Asse
ts
test a
nd
repai
r equ
ipment
s
Vehic
lesca
pital
work
in
prog
ress
total
Free
hold
land
Leas
e- hold
land
Build
ings
plant
&
mach
i-ne
ry
Furn
iture
& fix
ture
s
offic
e eq
uip-
ment
s
comp
uter
sNe
t wo
rking
As
sets
test a
nd
repai
r equ
ipment
s
Vehic
lesca
pital
work
in
prog
ress
total
iNr
in cr
ores
iNr
in cr
ores
iNr
in cr
ores
iNr
in cr
ores
iNr
in cr
ores
iNr
in cr
ores
iNr
in cr
ores
iNr
in cr
ores
iNr
in cr
ores
iNr
in cr
ores
iNr
in cr
ores
iNr
in cr
ores
UsD
UsD
UsD
UsD
UsD
UsD
UsD
UsD
UsD
UsD
UsD
UsD
cost
At 1
Jan
201
5 -
-
-
-
-
-
5.
20
-
-
-
-
5.20
82
1,324
.00
821,3
24.00
Addi
tions
-
-
-
-
-
-
-
-
-
-
-
-
-
Disp
osal
s -
-
-
-
-
-
(0
.01)
-
-
-
-
(0.01
) (1
,773.0
0) (1
,773.0
0)
At 3
1 De
c 20
15 -
-
-
-
-
-
5.
44
-
-
-
-
5.44
-
-
-
-
-
-
81
9,551
.00
-
-
-
-
819,5
51.00
Addi
tions
-
-
-
-
-
-
-
-
-
-
-
-
-
Disp
osal
s -
-
-
-
-
-
(5
.54)
-
-
-
-
(5.54
) (8
16,46
3.00)
(816
,463.0
0)
Disc
ontin
ued
oper
atio
ns (
Note
XX)
-
-
-
-
-
-
-
-
-
-
-
-
-
At 3
1 De
c 20
16 -
-
-
-
-
-
0.
02
-
-
-
-
0.02
-
-
-
-
-
-
3,
088.0
0 -
-
-
-
3,
088.0
0
Depr
ecia
tion
and
impa
irmen
t
At 1
Jan
201
5 -
-
-
-
-
-
3.
73
-
-
-
-
3.73
58
8,985
.00
588,9
85.00
Depr
ecia
tion
char
ge
for t
he y
ear
-
-
-
-
-
-
0.29
-
-
-
-
0.29
43,09
7.00
43,09
7.00
Disp
osal
s -
-
-
-
-
-
(0
.01)
-
-
-
-
(0.01
) (1
,177.0
0) (1
,177.0
0)
At 3
1 De
c 20
15 -
-
-
-
-
-
4.
19
-
-
-
-
4.19
-
-
-
-
-
-
63
0,905
.00
-
-
-
-
630,9
05.00
Depr
ecia
tion
char
ge
for t
he y
ear*
* -
-
-
-
-
-
0.
19
-
-
-
-
0.19
28
,627.0
0 28
,627.0
0
Disp
osal
s -
-
-
-
-
-
(4
.46)
-
-
-
-
(4.46
) (6
57,45
2.00)
(657
,452.0
0)
Disc
ontin
ued
oper
atio
ns -
-
-
-
-
-
-
-
-
-
-
-
-
At 3
1 De
c 20
16 -
-
-
-
-
-
0.
01
-
-
-
-
0.01
-
-
-
-
-
-
2,
080.0
0 -
-
-
-
2,
080.0
0
Net B
ook
Valu
e -
At 3
1 De
c 20
16 -
-
-
-
-
-
0.
01
-
-
-
-
0.01
-
-
-
-
-
-
1,
008.0
0 -
-
-
-
1,
008.0
0
At 3
1 De
c 20
15 -
-
-
-
-
-
1.
25
-
-
-
-
1.25
-
-
-
-
-
-
18
8,646
.00
-
-
-
-
188,6
46.00
At 1
Jan
201
5 -
-
-
-
-
-
1.
47
-
-
-
-
1.47
-
-
-
-
-
-
23
2,339
.00
-
-
-
-
232,3
39.00
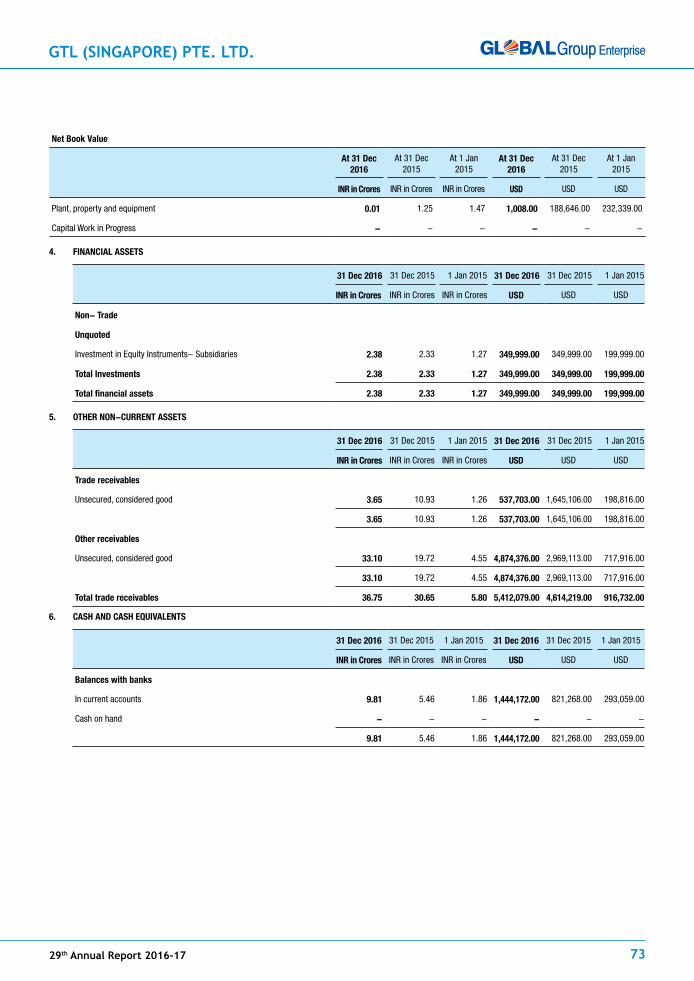
GTL (SINGAPORE) PTE. LTD.
29th Annual Report 2016-17 73
Net Book Value
At 31 Dec 2016
At 31 Dec 2015
At 1 Jan 2015
At 31 Dec 2016
At 31 Dec 2015
At 1 Jan 2015
iNr in crores INR in Crores INR in Crores UsD USD USD
Plant, property and equipment 0.01 1.25 1.47 1,008.00 188,646.00 232,339.00
Capital Work in Progress - - - - - -
4. FiNANciAL Assets
31 Dec 2016 31 Dec 2015 1 Jan 2015 31 Dec 2016 31 Dec 2015 1 Jan 2015
iNr in crores INR in Crores INR in Crores UsD USD USD
Non- trade
Unquoted
Investment in Equity Instruments- Subsidiaries 2.38 2.33 1.27 349,999.00 349,999.00 199,999.00
total investments 2.38 2.33 1.27 349,999.00 349,999.00 199,999.00
total financial assets 2.38 2.33 1.27 349,999.00 349,999.00 199,999.00
5. otHer NoN-cUrreNt Assets
31 Dec 2016 31 Dec 2015 1 Jan 2015 31 Dec 2016 31 Dec 2015 1 Jan 2015
iNr in crores INR in Crores INR in Crores UsD USD USD
trade receivables
Unsecured, considered good 3.65 10.93 1.26 537,703.00 1,645,106.00 198,816.00
3.65 10.93 1.26 537,703.00 1,645,106.00 198,816.00
other receivables
Unsecured, considered good 33.10 19.72 4.55 4,874,376.00 2,969,113.00 717,916.00
33.10 19.72 4.55 4,874,376.00 2,969,113.00 717,916.00
total trade receivables 36.75 30.65 5.80 5,412,079.00 4,614,219.00 916,732.00
6. cAsH AND cAsH eQUiVALeNts
31 Dec 2016 31 Dec 2015 1 Jan 2015 31 Dec 2016 31 Dec 2015 1 Jan 2015
iNr in crores INR in Crores INR in Crores UsD USD USD
Balances with banks
In current accounts 9.81 5.46 1.86 1,444,172.00 821,268.00 293,059.00
Cash on hand - - - - - -
9.81 5.46 1.86 1,444,172.00 821,268.00 293,059.00
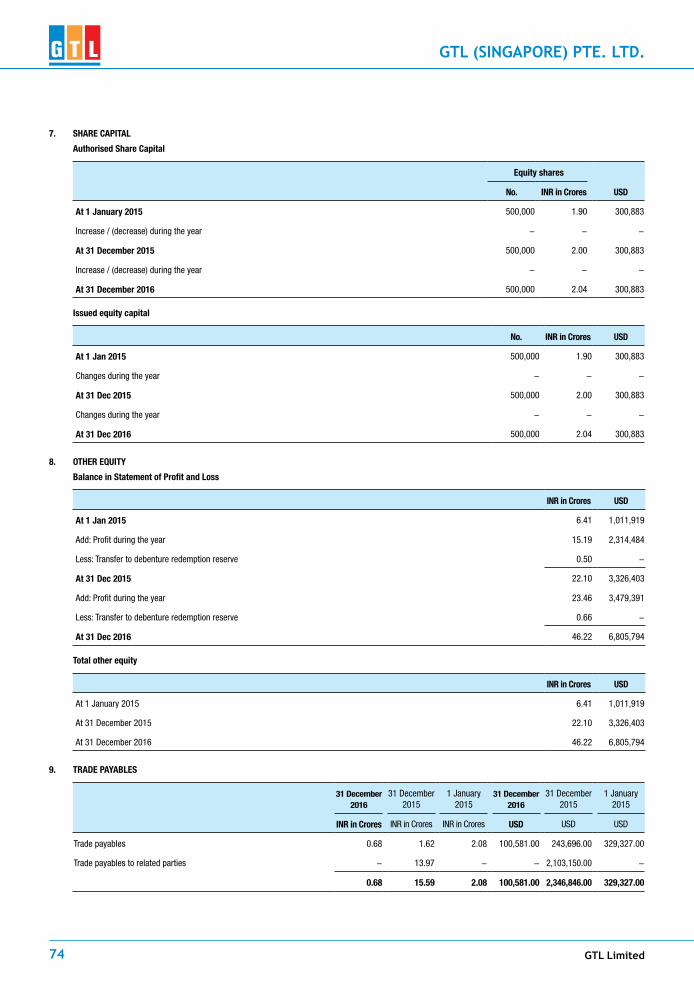
GTL Limited74
GTL (SINGAPORE) PTE. LTD.
7. sHAre cApitAL
Authorised share capital
equity shares
No. iNr in crores UsD
At 1 January 2015 500,000 1.90 300,883
Increase / (decrease) during the year - - -
At 31 December 2015 500,000 2.00 300,883
Increase / (decrease) during the year - - -
At 31 December 2016 500,000 2.04 300,883
issued equity capital
No. iNr in crores UsD
At 1 Jan 2015 500,000 1.90 300,883
Changes during the year - - -
At 31 Dec 2015 500,000 2.00 300,883
Changes during the year - - -
At 31 Dec 2016 500,000 2.04 300,883
8. otHer eQUity
Balance in statement of profit and Loss
iNr in crores UsD
At 1 Jan 2015 6.41 1,011,919
Add: Profit during the year 15.19 2,314,484
Less: Transfer to debenture redemption reserve 0.50 -
At 31 Dec 2015 22.10 3,326,403
Add: Profit during the year 23.46 3,479,391
Less: Transfer to debenture redemption reserve 0.66 -
At 31 Dec 2016 46.22 6,805,794
total other equity
iNr in crores UsD
At 1 January 2015 6.41 1,011,919
At 31 December 2015 22.10 3,326,403
At 31 December 2016 46.22 6,805,794
9. trADe pAyABLes
31 December 2016
31 December 2015
1 January 2015
31 December 2016
31 December 2015
1 January 2015
iNr in crores INR in Crores INR in Crores UsD USD USD
Trade payables 0.68 1.62 2.08 100,581.00 243,696.00 329,327.00
Trade payables to related parties - 13.97 - - 2,103,150.00 -
0.68 15.59 2.08 100,581.00 2,346,846.00 329,327.00

GTL (SINGAPORE) PTE. LTD.
29th Annual Report 2016-17 75
10. reVeNUe FroM operAtioNs
31 Dec 2016
31 Dec 2015
31 Dec 2016
31 Dec 2015
iNr in crores iNr in crores UsD UsD
Sale of products (including excise duty)
Telecom products - 11.12 - 1,694,570.00
Rendering of Services
Telecom services 21.82 11.56 3,236,200.00 1,761,170.00
21.82 22.68 3,236,200.00 3,455,740.00
11. otHer iNcoMe
31 Dec 2016
31 Dec 2015
31 Dec 2016
31 Dec 2015
iNr in crores iNr in crores UsD UsD
Gain on foreign currency transactions (Net) - 0.04 - 5,807.00
Other non-operating income ( Dividend ) 22.79 12.53 3,381,238.00 1,908,621.00
22.79 12.57 3,381,238.00 1,914,428.00
Government grants have been received for the purchase of certain items of property, plant and equipment. There are no unfulfilled conditions or contingencies attached to these grants.
12. cost oF MAteriALs coNsUMeD
31 Dec 2016
31 Dec 2015
31 Dec 2016
31 Dec 2015
iNr in crores iNr in crores UsD UsD
raw Material consumed 18.59 18.94 2,758,362.00 2,885,685.00
Inventory at the beginning of the year - -
Add: Purchases - -
18.59 18.94 2,758,362.00 2,885,685.00
Less: inventory at the end of the year - -
Cost of raw material and components consumed 18.59 18.94 2,758,362.00 2,885,685.00
13. DepreciAtioN AND AMortizAtioN eXpeNse
31 Dec 2016
31 Dec 2015
31 Dec 2016
31 Dec 2015
iNr in crores iNr in crores UsD UsD
Depreciation of tangible assets (note 3) 0.19 0.28 28,627.00 43,097.00
0.19 0.28 28,627.00 43,097.00
14. otHer eXpeNses
31 Dec 2016
31 Dec 2015
31 Dec 2016
31 Dec 2015
iNr in crores iNr in crores UsD UsD
Communication expenses - 0.03 - 4,598.00
Legal and professional charges 0.09 0.04 13,340.00 6,598.00
Loss/(Gain) on sale of fixed assets/asset disposed off (net) 1.07 - 159,011.00
Miscellaneous expenses 0.38 0.31 56,249.00 46,502.00
1.54 0.38 228,600.00 57,698.00

GTL Limited76
GTL (SINGAPORE) PTE. LTD.
1 orporAte iNForMAtioN
GTL (Singapore) Pte. Ltd. is a limited liability company incorporated in Singapore with its registered office at 8 Shenton Way #21-07, AXA Tower, Singapore 068811.
The principal activities of the Company are to carry on the business of information technology and telecommunications and to act as importers, exporters, advisers and consultants of information technology and telecommunication hardware and software, information technology and telecommunications requisites and supplies of all kinds and to identify sources for equipment and services for specific information technology and telecommunication projects.
The Company is a wholly-owned subsidiary of GTL International Limited, incorporated in Bermuda. The ultimate holding company is GTL Limited, a company incorporated in India. Related corporations in these financial statements refer to members of ultimate holding company’s group of companies.
The financial statements of the Company for the year ended 31 December 2016 were authorised for issue in accordance with a resolution of the Directors on 3 March 2017.
2 sUMMAry oF siGNiFicANt AccoUNtiNG poLicies
2.1 Basis of preparation
The financial statements are prepared in accordance with Singapore Financial Reporting Standards (“FRS”). The financial statements, expressed in United States Dollar (USD or US$) are prepared based on the historical cost convention, except as disclosed in the accounting policies below.
The preparation of financial statements in conformity with FRS requires management to exercise its judgement in the process of applying the Company’s accounting policies. It also requires the use of accounting estimates and assumptions that affect the reported amounts of assets and liabilities and disclosure of contingent assets and liabilities at the date of the financial statements, and the reported amounts of revenues and expenses during the financial year. Although these estimates are based on management’s best knowledge of current events and actions, actual results may ultimately differ from those estimates. There are no critical accounting estimates and assumptions used that are significant to the financial statements, and areas involving a higher degree of judgement or complexity except as disclosed in Note 17.
In the current financial year, the Company has adopted all the new and revised FRSs and Interpretations of FRS (“INT FRS”) that are relevant to its operations and effective for annual periods beginning on or after 1 January 2016. The adoption of these new/revised FRSs and INT FRSs does not result in changes to the Company’s accounting policies and has no material effect on the amounts reported for the current or prior years.
The adoption of the above FRSs did not result in substantial changes to the Company’s accounting policies.
The Company has not applied any new standard or interpretation that has been issued but is not yet effective. The new standards that have been issued and not yet effective do not have any impact on the results of current or prior years.
2.2 plant And equipment
2.2.1 Measurement
Items of plant and equipment are initially recognised at cost and subsequently carried at cost less accumulated depreciation and accumulated impairment losses.
2.2.2 components of costs
The cost of an item of plant and equipment includes its purchase price and any cost that is directly attributable to bringing the asset to the location and condition necessary for it to be capable of operating in the manner intended by management.
2.2.3 Depreciation
Depreciation is provided on the reducing balance method so as to write off the cost of plant and equipment over their estimated useful lives as follows:
Years
Computers 5
The useful lives of plant and equipment are reviewed and adjusted as appropriate at each balance sheet date.
Fully depreciated assets are retained in the financial statements until they are no longer in use.
Capital work-in-progress is not depreciated as the asset is not yet available for use.
2.2.4 subsequent expenditure
Subsequent expenditure relating to plant and equipment that has already been recognised is added to the carrying amount of the asset only when it is probable that future economic benefits associated with the item will flow to the Company and the cost of the item can be measured reliably. Other subsequent expenditure is recognised as repair and maintenance expense in the Statement of comprehensive income during the financial year in which it is incurred.
2.2.5 Disposal
On disposal of an item of plant and equipment, the difference between the net disposal proceeds and its carrying amount is taken to the Statement of comprehensive income.
2.3 subsidiaries
Subsidiaries are entities (including special purpose entities) over which the Company has power to govern the financial and operating policies so as to obtain benefits from its activities.
Investment in subsidiaries is accounted for at cost less any impairment losses.
Consolidated financial statements have not been prepared as the Company is itself a wholly-owned subsidiary of GTL International Limited, incorporated in Bermuda. The ultimate holding company, GTL Limited, a company incorporated in India produces consolidated financial statements that are available for public use and its registered office is at GTL Limited, Global Vision, Electronic Sadan II, MIDC, TTC Industrial Area, Mahape, Navi Mumbai - 400710, India.
Notes oN tHe AccoUNts For tHe perioD eNDiNG DeceMBer 31, 2016

GTL (SINGAPORE) PTE. LTD.
29th Annual Report 2016-17 77
2.4 impairment of Non-Financial Assets
2.4.1 investment in subsidiaries
Investment in subsidiary is stated at cost less accumulated impairment losses in the Company’s statement of financial position. Where an indication of impairment exists, the carrying amount of the investment is assessed and written down immediately to its recoverable amount.
On disposal of an investment in subsidiary, the difference between net disposal proceeds and its carrying amount is taken to the statement of comprehensive income.
2.4.2 plant And equipment
Plant and equipment are reviewed for impairment whenever there is any indication that these assets may be impaired. If any such indication exists, the recoverable amount (i.e. the higher of the fair value less cost to sell and value in use) of the asset is estimated to determine the amount of impairment loss.
For the purpose of impairment testing of these assets, recoverable amount is determined on an individual asset basis unless the asset does not generate cash flows that are largely independent of those from other assets. If this is the case, recoverable amount is determined for the Cash Generating Unit to which the asset belongs to.
If the recoverable amount of the asset (or CGU) is estimated to be less than its carrying amount, the carrying amount of the asset (or CGU) is reduced to its recoverable amount. The impairment loss is recognised in the income statement unless the asset is carried at revalued amount, in which case, such impairment loss is treated as a revaluation decrease.
An impairment loss for an asset other than goodwill is reversed if, and only if, there has been a change in the estimates used to determine the assets’ recoverable amount since the last impairment loss was recognised. The carrying amount of an asset is increased to its revised recoverable amount, provided that this amount does not exceed the carrying amount that would have been determined (net of amortisation or depreciation) had no impairment loss been recognised for the asset in prior years. A reversal of impairment loss for an asset is recognised in the income statement, unless the asset is carried at revalued amount, in which case, such reversal is treated as a revaluation increase.
2.5 Financial Assets
2.5.1 initial recognition and Measurement
Financial assets are recognised on the statement of financial position when, and only when, the Company becomes a party to the contractual provisions of the financial instrument. The Company determines the classification of its financial assets at initial recognition.
When financial assets are recognised initially, they are measured as fair value, plus, in the case of financial assets not at fair value through profit or loss, directly attributable transaction costs.
2.5.2 subsequent Measurement
The subsequent measurement of financial assets depends on their classification as follows:
(i) Financial assets at fair value through profit or loss
Financial assets at fair value through profit or loss include financial assets held for trading and financial assets designated upon initial recognition at fair value through profit or loss. Financial assets are classified as held for trading if they are acquired for the purpose of selling or repurchasing in the near term. This category includes derivative financial instruments entered into by the Company that are not designated as hedging instruments in hedge relationships as defined by FRS 39. Derivatives, including separated embedded derivatives are also classified as held for trading unless they are designated as effective hedging instruments.
The Company has not designated any financial assets upon initial recognition at fair value through profit or loss.
Subsequent to initial recognition, financial assets at fair value through profit or loss are measured at fair value. Any gains or losses arising from changes in fair value of the financial assets are recognised in profit or loss. Net gains or net losses on financial assets at fair value through profit or loss include exchange differences, interest and dividend income.
Derivatives embedded in host contracts are accounted for as separate derivatives and recorded at fair value if their economic characteristics and risks are not closely related to those of the host contracts and the host contracts are not held for trading or designated at fair value through profit or loss. These embedded derivatives are measured at fair value with changes in fair value recognised in profit or loss. Reassessment only occurs if there is a change in the terms of the contract that significantly modifies the cash flows that would otherwise be required.
(ii) Loans and receivables
Non-derivative financial assets with fixed or determinable payments that are not quoted in an active market are classified as loans and receivables. Subsequent to initial recognition, loans and receivables are measured at amortised cost using the effective interest method, less impairment. Gains and losses are recognised in profit or loss when the loans and receivables are derecognised or impaired, and through the amortisation process.
(iii) Held-to-maturity investments
Non-derivative financial assets with fixed or determinable payments and fixed maturity are classified as held-to-maturity when the Company has the positive intention and ability to hold the investment to maturity. Subsequent to initial recognition, held-to-maturity investments are measured at amortised cost using the effective interest method, less impairment. Gains and losses are recognised in profit or loss when the held-to-maturity investments are derecognised or impaired, and through the amortisation process.
(iv) Available-for-sale financial assets
Available-for-sale financial assets include equity and debts securities. Equity investments classified as available-for-sale are those, which are neither classified as held for trading nor designated at fair value through profit or loss. Debt securities in this category are those which are intended to be held for an indefinite period of time and which may be sold in response to needs for liquidity or in response to changes in the market conditions.

GTL Limited78
GTL (SINGAPORE) PTE. LTD.
After initial recognition, available-for-sale financial assets are subsequently measured at fair value. Any gains or losses from changes in fair value of the financial asset are recognised in other comprehensive income, except that impairment losses, foreign exchange gains and losses on monetary instruments and interest calculated using the effective interest method are recognised in profit or loss. The cumulative gain or loss previously recognised in other comprehensive income is reclassified from equity to profit or loss as a reclassification adjustment when the financial asset is derecognised.
Investments in equity instruments whose fair value cannot be reliably measured are measured at cost less impairment loss.
2.5.3 Derecognition
A financial asset is derecognised where the contractual right to receive cash flows from the asset has expired. On derecognition of a financial asset in its entirety, the difference between the carrying amount and the sum of the consideration received and any cumulative gain or loss that had been recognised in other comprehensive income is recognised in profit or loss.
All regular way purchases and sales of financial assets are recognised or derecognised on the trade date i.e., the date that the Company commits to purchase or sell the asset. Regular way purchases or sales are purchases or sales of financial assets that require delivery of assets within the period generally established by regulation or convention in the marketplace concerned.
2.6 impairment of Financial Assets
The Company assesses at each end of the reporting period whether there is any objective evidence that a financial asset is impaired.
2.6.1 Financial Assets carried at Amortised cost
For financial assets carried at amortised cost, the Company first assesses individually whether objective evidence of impairment exists individually for financial assets that are individually significant, or collectively for financial assets that are not individually significant. If the Company determines that no objective evidence of impairment exists for an individually assessed financial asset, whether significant or not, it includes the asset in a group of financial assets with similar credit risk characteristics and collectively assesses them for impairment. Assets that are individually assessed for impairment and for which an impairment loss is, or continues to be recognised are not included in a collective assessment of impairment.
If there is objective evidence that an impairment loss on financial assets carried at amortised cost has incurred, the amount of the loss is measured as the difference between the asset’s carrying amount and the present value of estimated future cash flows discounted at the financial asset’s original effective interest rate. If a loan has a variable interest rate, the discount rate for measuring any impairment loss is the current effective interest rate. The carrying amount of the asset is reduced through the use of an allowance account. The impairment loss is recognised in profit or loss.
When the asset becomes uncollectible, the carrying amount of impaired financial assets is reduced directly or if an amount was charged to the allowance account, the amounts charged to the allowance account are written off against the carrying value of the financial asset.
To determine whether there is objective evidence that an impairment loss on financial assets has incurred, the Company considers factors such as the probability of insolvency or significant financial difficulties of the debtor and default or significant delay in payments.
If in a subsequent period, the amount of the impairment loss decreases and the decrease can be related objectively to an event occurring after the impairment was recognised, the previously recognised impairment loss is reversed to the extent that the carrying amount of the asset does not exceed its amortised cost at the reversal date. The amount of reversal is recognised in profit or loss.
2.6.2 Financial Assets carried at cost
If there is objective evidence (such as significant adverse changes in the business environment where the issuer operates, probability of insolvency or significant financial difficulties of the issuer) that an impairment loss on financial assets carried at cost has been incurred, the amount of the loss is measured as the difference between the asset’s carrying amount and the present value of estimated future cash flows discounted at the current market rate of return for a similar financial asset. Such impairment losses are not reversed in subsequent periods.
2.6.3 Available-For-sale Financial Assets
In the case of equity investments classified as available-for-sale, objective evidence of impairment include
(i) significant financial difficulty of the issuer or obligor,
(ii) information about significant changes with an adverse effect that have taken place in the technological, market, economic or legal environment in which the issuer operates, and indicates that the cost of the investment in equity instrument may not be recovered; and
(iii) a significant or prolonged decline in the fair value of the investment below its costs. ‘Significant’ is to be evaluated against the original cost of the investment and ‘prolonged’ against the period in which the fair value has been below its original cost.
If an available-for-sale financial asset is impaired, an amount comprising the difference between its acquisition cost (net of any principal repayment and amortisation) and its current fair value, less any impairment loss previously recognised in profit or loss, is transferred from other comprehensive income and recognised in profit or loss. Reversals of impairment losses in respect of equity instruments are not recognised in profit or loss; increase in their fair value after impairment are recognised directly in other comprehensive income.
In the case of debt instruments classified as available-for-sale, impairment is assessed based on the same criteria as financial assets carried at amortised cost. However, the amount recorded for impairment is the cumulative loss measured as the difference between the amortised cost and the current fair value, less any impairment loss on that investment previously recognised in profit or loss. Future interest income continues to be accrued based on the reduced carrying amount of the asset and is accrued using the rate of interest used to discount the future cash flows for the purpose of measuring the impairment loss. The interest income is recorded as part of finance income. If, in a subsequent year, the fair value of a debt instrument increases and the increases can be objectively related to an event occurring after the impairment loss was recognised in profit or loss, the impairment loss is reversed in profit or loss.
GTL (SINGAPORE) PTE. LTD.
29th Annual Report 2016-17 79
2.7 Financial Liabilities
2.7.1 initial recognition and Measurement
Financial liabilities are recognised on the statement of financial position when, and only when, the Company becomes a party to the contractual provisions of the financial instrument. The Company determines the classification of its financial liabilities at initial recognition.
All financial liabilities are recognised initially at fair value and in the case of other financial liabilities, plus directly attributable transaction costs.
2.7.2 subsequent Measurement
The measurement of financial liabilities depends on their classification as follows:
(i) Financial liabilities at fair value through profit or loss
Financial liabilities at fair value through profit or loss includes financial liabilities held for trading and financial liabilities designated upon initial recognition as at fair value. Financial liabilities are classified as held for trading if they are acquired for the purpose of selling in the near term. This category includes derivative financial instruments entered into by the Company that are not designated as hedging instruments in hedge relationships. Separated embedded derivatives are also classified as held for trading unless they are designated as effective hedging instruments.
Subsequent to initial recognition, financial liabilities at fair value through profit or loss are measured at fair value. Any gains or losses arising from changes in fair value of the financial liabilities are recognised in profit or loss.
The Company has not designated any financial liabilities upon initial recognition at fair value through profit or loss.
(ii) Other financial liabilities
After initial recognition, other financial liabilities are subsequently measured at amortised cost using the effective interest rate method. Gains and losses are recognised in profit or loss when the liabilities are derecognised, and through the amortization process.
2.7.3 Derecognition
A financial liability is derecognised when the obligation under the liability is discharged or cancelled or expires. When an existing financial liability is replaced by another from the same lender on substantially different terms, or the terms of an existing liability are substantially modified, such an exchange or modification is treated as a derecognition of the original liability and the recognition of a new liability, and the difference in the respective carrying amounts is recognised in profit or loss.
2.8 inventories
Inventories are carried at the lower of cost and net realisable value.
Cost is calculated using the weighted average cost formula and comprises all costs of purchase, costs of conversion and other costs incurred in bringing the inventories to their present location and condition.
For raw material, cost comprises of raw material purchase cost. For finished goods and work-in-progress, cost comprises of raw material cost, direct labour cost and a proportion of production overheads based on normal operating capacity but excludes borrowing costs.
Net realisable value is the estimated selling price in the ordinary course of business less the estimated costs of completion and the estimated costs necessary to make the sale.
When inventories are sold, the carrying amount of those inventories is recognised as an expense in the period in which the related revenue is recognised. The amount of any write-down of inventories to net realisable value and all losses of inventories are recognised as an expense in the period the write-down or loss occurs. The amount of any reversal of any write-down of inventories, arising from an increase in net realisable value, is recognised as a reduction in the amount of inventories recognised as an expense in the period in which the reversal occurs.
2.9 Foreign currency
2.9.1 Functional And presentation currency
Items included in the financial statements of the Company are measured using the currency of the primary economic environment in which the Company operates (“the functional currency”). The financial statements are presented in United States Dollar, which is the Company’s functional and presentation currency.
2.9.2 Foreign currencies transactions
Foreign currency transactions during the year are translated into recording currencies at the exchange rates ruling at the transaction dates. Monetary assets and liabilities denominated in foreign currencies are translated into United States Dollar at the exchange rates ruling at balance sheet date. Exchange gains and losses are dealt with in the Statement of comprehensive income.
2.10 related parties
A related party is defined as follows:
(a) A person or a close member of that person’s family is related to the Company if that person:
(i) Has control or joint control over the Company; (ii) Has significant influence over the Company; or
(iii) Is a member of the key management personnel of the Company or of a parent of the Company.
(b) An entity is related to the Company if any of the following conditions applies:
(i) The entity and the Company are members of the same group (which means that each parent, subsidiary and fellow subsidiary is related to the others);
(ii) One entity is an associate or joint venture of the other entity (or and associate or joint venture of a member of a group of which the other entity is a member);
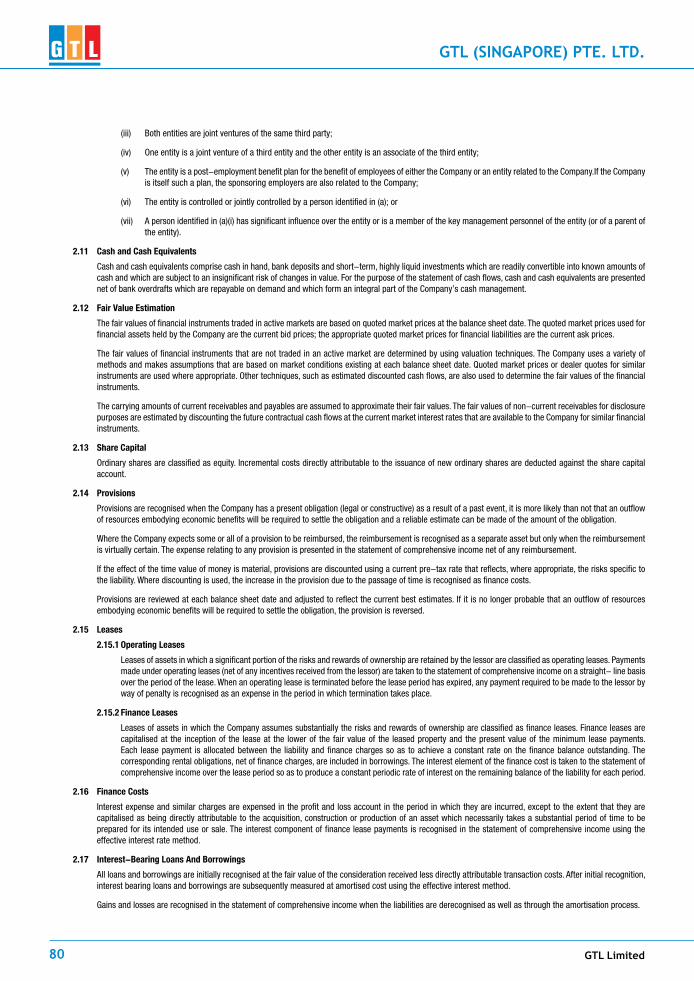
GTL Limited80
GTL (SINGAPORE) PTE. LTD.
(iii) Both entities are joint ventures of the same third party;
(iv) One entity is a joint venture of a third entity and the other entity is an associate of the third entity;
(v) The entity is a post-employment benefit plan for the benefit of employees of either the Company or an entity related to the Company.If the Company is itself such a plan, the sponsoring employers are also related to the Company;
(vi) The entity is controlled or jointly controlled by a person identified in (a); or
(vii) A person identified in (a)(i) has significant influence over the entity or is a member of the key management personnel of the entity (or of a parent of the entity).
2.11 cash and cash equivalents
Cash and cash equivalents comprise cash in hand, bank deposits and short-term, highly liquid investments which are readily convertible into known amounts of cash and which are subject to an insignificant risk of changes in value. For the purpose of the statement of cash flows, cash and cash equivalents are presented net of bank overdrafts which are repayable on demand and which form an integral part of the Company’s cash management.
2.12 Fair Value estimation
The fair values of financial instruments traded in active markets are based on quoted market prices at the balance sheet date. The quoted market prices used for financial assets held by the Company are the current bid prices; the appropriate quoted market prices for financial liabilities are the current ask prices.
The fair values of financial instruments that are not traded in an active market are determined by using valuation techniques. The Company uses a variety of methods and makes assumptions that are based on market conditions existing at each balance sheet date. Quoted market prices or dealer quotes for similar instruments are used where appropriate. Other techniques, such as estimated discounted cash flows, are also used to determine the fair values of the financial instruments.
The carrying amounts of current receivables and payables are assumed to approximate their fair values. The fair values of non-current receivables for disclosure purposes are estimated by discounting the future contractual cash flows at the current market interest rates that are available to the Company for similar financial instruments.
2.13 share capital
Ordinary shares are classified as equity. Incremental costs directly attributable to the issuance of new ordinary shares are deducted against the share capital account.
2.14 provisions
Provisions are recognised when the Company has a present obligation (legal or constructive) as a result of a past event, it is more likely than not that an outflow of resources embodying economic benefits will be required to settle the obligation and a reliable estimate can be made of the amount of the obligation.
Where the Company expects some or all of a provision to be reimbursed, the reimbursement is recognised as a separate asset but only when the reimbursement is virtually certain. The expense relating to any provision is presented in the statement of comprehensive income net of any reimbursement.
If the effect of the time value of money is material, provisions are discounted using a current pre-tax rate that reflects, where appropriate, the risks specific to the liability. Where discounting is used, the increase in the provision due to the passage of time is recognised as finance costs.
Provisions are reviewed at each balance sheet date and adjusted to reflect the current best estimates. If it is no longer probable that an outflow of resources embodying economic benefits will be required to settle the obligation, the provision is reversed.
2.15 Leases
2.15.1 operating Leases
Leases of assets in which a significant portion of the risks and rewards of ownership are retained by the lessor are classified as operating leases. Payments made under operating leases (net of any incentives received from the lessor) are taken to the statement of comprehensive income on a straight- line basis over the period of the lease. When an operating lease is terminated before the lease period has expired, any payment required to be made to the lessor by way of penalty is recognised as an expense in the period in which termination takes place.
2.15.2 Finance Leases
Leases of assets in which the Company assumes substantially the risks and rewards of ownership are classified as finance leases. Finance leases are capitalised at the inception of the lease at the lower of the fair value of the leased property and the present value of the minimum lease payments. Each lease payment is allocated between the liability and finance charges so as to achieve a constant rate on the finance balance outstanding. The corresponding rental obligations, net of finance charges, are included in borrowings. The interest element of the finance cost is taken to the statement of comprehensive income over the lease period so as to produce a constant periodic rate of interest on the remaining balance of the liability for each period.
2.16 Finance costs
Interest expense and similar charges are expensed in the profit and loss account in the period in which they are incurred, except to the extent that they are capitalised as being directly attributable to the acquisition, construction or production of an asset which necessarily takes a substantial period of time to be prepared for its intended use or sale. The interest component of finance lease payments is recognised in the statement of comprehensive income using the effective interest rate method.
2.17 interest-Bearing Loans And Borrowings
All loans and borrowings are initially recognised at the fair value of the consideration received less directly attributable transaction costs. After initial recognition, interest bearing loans and borrowings are subsequently measured at amortised cost using the effective interest method.
Gains and losses are recognised in the statement of comprehensive income when the liabilities are derecognised as well as through the amortisation process.

GTL (SINGAPORE) PTE. LTD.
29th Annual Report 2016-17 81
2.18 revenue recognition
Provided it is probable that the economic benefits will flow to the Company and the revenue and costs, if applicable, can be measured reliably, revenue is recognised in the statement of comprehensive incomes as follows:
2.18.1 sale of Goods
Revenue is recognised when goods are delivered at the customers’ premise which is taken to be the point in time when the customer has accepted the goods and the related risks and rewards of ownership. Revenue excludes goods and services or other sales taxes and is after deduction of any trade discounts.
2.18.2 rendering of service
Revenue is recognised when the services have been performed and rendered.
2.18.3 Dividend income
Dividend income is recognised when the shareholding’s right to receive has been established.
2.19 employee Benefits
2.19.1 Defined contribution pension costs
Defined contribution plans are post-employment benefit plans under which the Company pays fixed contributions into separate entities such as the Central Provident Fund, and will have no legal or constructive obligation to pay further contributions if any of the funds do not hold sufficient assets to pay all employee benefits relating to employee services in the current and preceding financial years. The Company’s contribution to defined contribution plans are recognised in the financial year to which they relate.
2.19.2 employee Leave entitlement
Employee entitlements to annual leave are recognised when they accrue to employees. A provision is made for the estimated liability for leave as a result of services rendered by employees up to balance sheet date.
2.20 income taxes
Current income tax liabilities (and assets) for the current and prior periods are recognised at the amounts expected to be paid to (or recovered from) the tax authorities. The tax rates and tax laws used to compute the amounts are those that are enacted or substantively enacted by the balance sheet date.
Deferred income tax assets/liabilities are recognised for all deductible taxable temporary differences arising between the tax bases of assets and liabilities and their carrying amounts in the financial statements except when the deferred income tax assets/liabilities arise from the initial recognition of an asset or liability in a transaction that is not a business combination and at the time of the transaction, affects neither accounting nor taxable profit or loss.
Deferred income tax asset is recognised to the extent that it is probable that future taxable profit will be available against which the temporary differences can be utilised. Deferred income tax assets and liabilities are measured at:
(i) the tax rates that are expected to apply when the related deferred income tax asset is realised or the deferred income tax liability is settled, based on tax rates (and tax laws) that have been enacted or substantially enacted by the balance sheet date; and
(ii) the tax consequence that would follow from the manner in which the Company expects, at the balance sheet date, to recover or settle the carrying amounts of its assets and liabilities.
Current and deferred income taxes are recognised as income or expenses in the statement of comprehensive income for the period, except to the extent that the tax arises from a business combination or a transaction which is recognised directly in equity. Deferred tax on temporary differences arising from the revaluation gains and losses on land and buildings, fair value gains and losses on available-for-sale financial assets and cash flow hedges, and the liability component of convertible debts are charged or credited directly to equity in the same period the temporary differences arise. Deferred tax arising from a business combination is adjusted against goodwill on acquisition.
2.21 Government Grants
Grants from the government are recognised as a receivable at their fair value when there is reasonable assurance that the grant will be received and the Company will comply with all the attached conditions.
Government grants receivable are recognised as income over the periods necessary to match them with the related costs which they are intended to compensate, on a systematic basis. Government grants relating to expenses are shown separately as other income.
Government grants relating to assets are deducted against the carrying amount of the assets. Jobs credit grants, which are government grants given to match staff and business costs, are recognised in the month of payment only as certain conditions have to be fulfilled before payment.
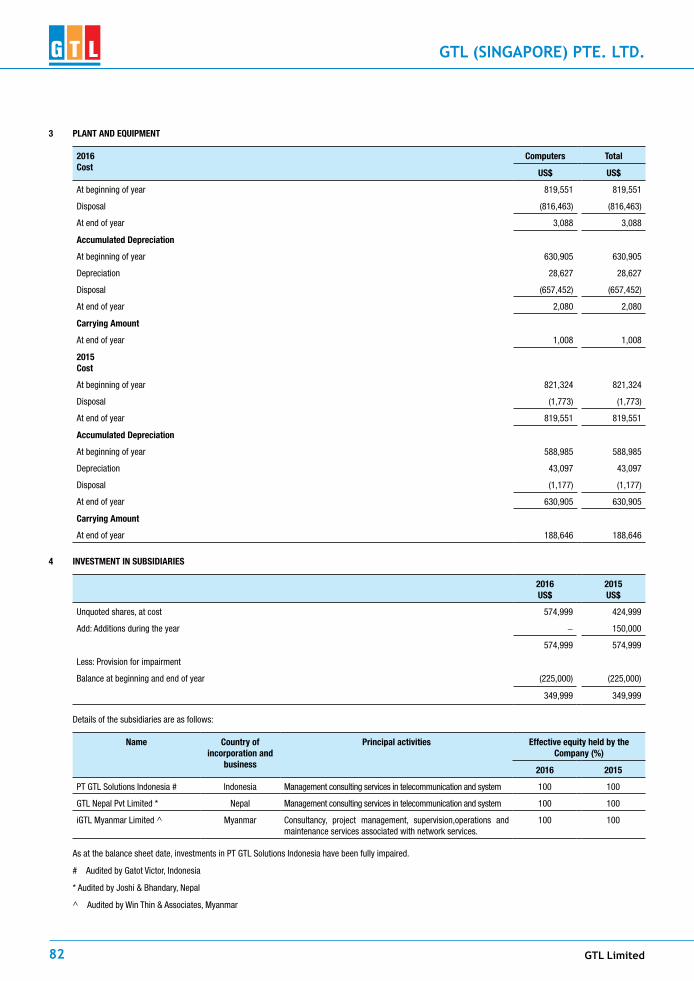
GTL Limited82
GTL (SINGAPORE) PTE. LTD.
3 pLANt AND eQUipMeNt
2016cost
computers total
Us$ Us$
At beginning of year 819,551 819,551
Disposal (816,463) (816,463)
At end of year 3,088 3,088
Accumulated Depreciation
At beginning of year 630,905 630,905
Depreciation 28,627 28,627
Disposal (657,452) (657,452)
At end of year 2,080 2,080
carrying Amount
At end of year 1,008 1,008
2015cost
At beginning of year 821,324 821,324
Disposal (1,773) (1,773)
At end of year 819,551 819,551
Accumulated Depreciation
At beginning of year 588,985 588,985
Depreciation 43,097 43,097
Disposal (1,177) (1,177)
At end of year 630,905 630,905
carrying Amount
At end of year 188,646 188,646
4 iNVestMeNt iN sUBsiDiAries
2016Us$
2015Us$
Unquoted shares, at cost 574,999 424,999
Add: Additions during the year - 150,000
574,999 574,999
Less: Provision for impairment
Balance at beginning and end of year (225,000) (225,000)
349,999 349,999
Details of the subsidiaries are as follows:
Name country of incorporation and
business
principal activities effective equity held by the company (%)
2016 2015
PT GTL Solutions Indonesia # Indonesia Management consulting services in telecommunication and system 100 100
GTL Nepal Pvt Limited * Nepal Management consulting services in telecommunication and system 100 100
iGTL Myanmar Limited ^ Myanmar Consultancy, project management, supervision,operations and maintenance services associated with network services.
100 100
As at the balance sheet date, investments in PT GTL Solutions Indonesia have been fully impaired.
# Audited by Gatot Victor, Indonesia
*AuditedbyJoshi&Bhandary,Nepal
^ AuditedbyWinThin&Associates,Myanmar

GTL (SINGAPORE) PTE. LTD.
29th Annual Report 2016-17 83
5 trADe AND otHer receiVABLes
2016Us$
2015Us$
Trade receivables (Note 6) 537,703 1,645,106
Other receivables (Note 7) 4,874,376 2,969,113
5,412,079 4,614,219
The carrying amounts of trade and other receivables approximate their fair values and are denominated in the following currencies:
2016Us$
2015Us$
Nepalese Rupee 958,737 211,431
Singapore Dollar 1,201 -
United States Dollar 4,452,141 4,402,788
5,412,079 4,614,219
6. trADe receiVABLes
2016
Us$
2015
Us$
Trade receivables 275,779 123,041
Amount due from subsidiaries 261,924 1,522,065
537,703 1,645,106
Less : Allowance for doubtful debts
Balance at beginning of year - (55,399)
Written off - 55,399
Balance at end of year - -
537,703 1,645,106
Trade receivables are non-interest bearing and are generally on 0 - 60 days’ terms. They are recognised at their original invoice amounts which represent their fair values on initial recognition.
The maximum exposure of credit risk for trade receivables at the reporting date is US$537,703 (2015: US$1,645,106).
The aging of trade receivables at the reporting date is:
Gross 2016 impairment losses 2016
Gross 2015 impairment losses 2015
Us$ Us$ Us$ Us$
Current 288,188 - 1,450,750 -
Past due 1 - 30 days - - 41,341 -
Past due 31 - 120 days - - - -
Past due 121 - 365 days 193,000 - 153,015 -
Past due 365 days 56,515 - - -
537,703 - 1,645,106 -
Based on historical default rates, the Company believes that no impairment allowance is necessary in respect of trade receivables not past due and past due up to 365 days. These receivables are mainly arising by customers that have good record with the Company.
7 otHer receiVABLes
2016Us$
2015Us$
Amount due from immediate holding company 3,164,441 2,035,421
Amount due from subsidiaries - 722,261
Dividend receivable 1,708,733 211,431
GST receivables 1,202 -
4,874,376 2,969,113
The non-trade portion of the amount due from immediate holding company and subsidiaries are unsecured, non-interest bearing and repayable on demand.
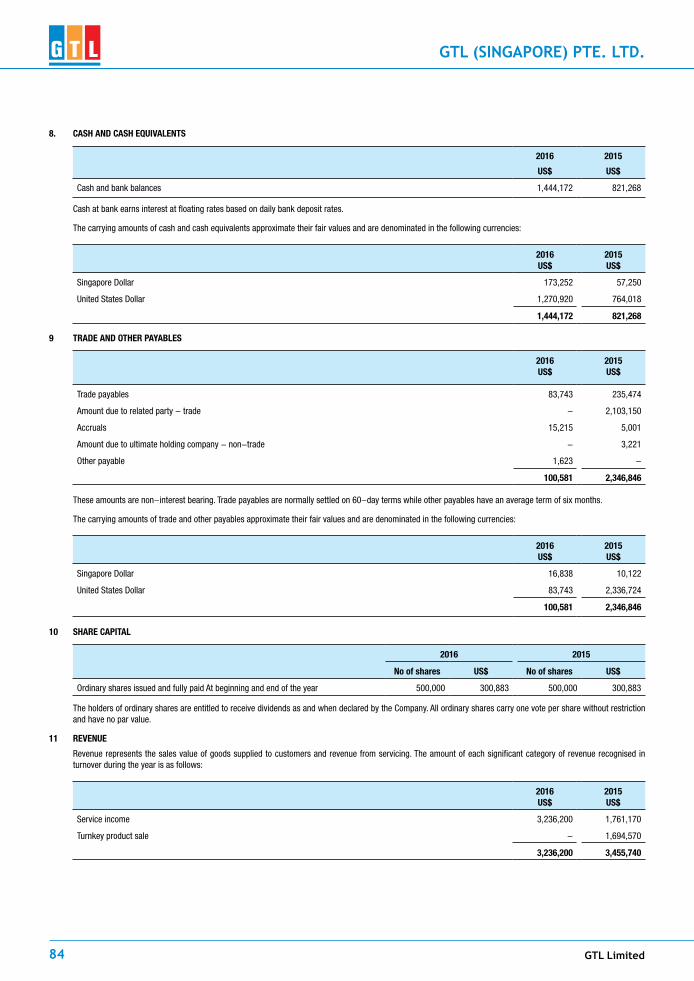
GTL Limited84
GTL (SINGAPORE) PTE. LTD.
8. cAsH AND cAsH eQUiVALeNts
2016
Us$
2015
Us$
Cash and bank balances 1,444,172 821,268
Cash at bank earns interest at floating rates based on daily bank deposit rates.
The carrying amounts of cash and cash equivalents approximate their fair values and are denominated in the following currencies:
2016Us$
2015Us$
Singapore Dollar 173,252 57,250
United States Dollar 1,270,920 764,018
1,444,172 821,268
9 trADe AND otHer pAyABLes
2016Us$
2015Us$
Trade payables 83,743 235,474
Amount due to related party - trade - 2,103,150
Accruals 15,215 5,001
Amount due to ultimate holding company - non-trade - 3,221
Other payable 1,623 -
100,581 2,346,846
These amounts are non-interest bearing. Trade payables are normally settled on 60-day terms while other payables have an average term of six months.
The carrying amounts of trade and other payables approximate their fair values and are denominated in the following currencies:
2016Us$
2015Us$
Singapore Dollar 16,838 10,122
United States Dollar 83,743 2,336,724
100,581 2,346,846
10 sHAre cApitAL
2016 2015
No of shares Us$ No of shares Us$
Ordinary shares issued and fully paid At beginning and end of the year 500,000 300,883 500,000 300,883
The holders of ordinary shares are entitled to receive dividends as and when declared by the Company. All ordinary shares carry one vote per share without restriction and have no par value.
11 reVeNUe
Revenue represents the sales value of goods supplied to customers and revenue from servicing. The amount of each significant category of revenue recognised in turnover during the year is as follows:
2016Us$
2015Us$
Service income 3,236,200 1,761,170
Turnkey product sale - 1,694,570
3,236,200 3,455,740

GTL (SINGAPORE) PTE. LTD.
29th Annual Report 2016-17 85
12 otHer iNcoMe
2016Us$
2015Us$
Dividend income 3,381,238 1,908,621
Foreign exchange gain - 5,807
3,381,238 1,914,428
13 otHer eXpeNses
Other expenses include:
2016Us$
2015Us$
Foreign exchange loss 7,258 -
Legal and professional fee 13,340 6,598
Loss on disposal of plant and equipment 159,011 -
Postage and courier - 4,598
Subscription fee 1,383 13,241
14, tAXAtioN
Major components of income tax expense are as follows:
2016Us$
2015Us$
Current year taxation - -
Withholding tax 122,458 69,204
122,458 69,204
A reconciliation between the tax expense and the product of accounting profit and loss multiplied by the applicable tax rate are as follows:
2016Us$
2015Us$
Profit before taxation 3,601,849 2,383,688
Income tax on profit before tax at 17% 612,314 405,227
Adjustments:
Non-deductible expenses 31,898 7,428
Income not subjected to tax (574,810) (324,466)
Utilisation of capital allowances (69,402) (88,189)
Withholding tax 122,458 69,204
tax expense 122,458 69,204
Unrecognised deferred tax assets:
Deferred tax assets in respect of the following items have not been recognised in the financial statements as the probability of future taxable profits being available to utilise such benefits cannot be reliably established:
2016Us$
2015Us$
Differences in tax written down value and net book value of plant and equipment (171) (32,171)
Unutilised capital allowances 138,016 144,529
Unutilised tax losses 232,639 232,639
370,484 344,997
The company’s unutilised capital allowances and tax losses are available for offset against future taxable profits subject to the agreement of the tax authorities and compliance with certain provisions of the Singapore Income Tax Act, Cap.134.
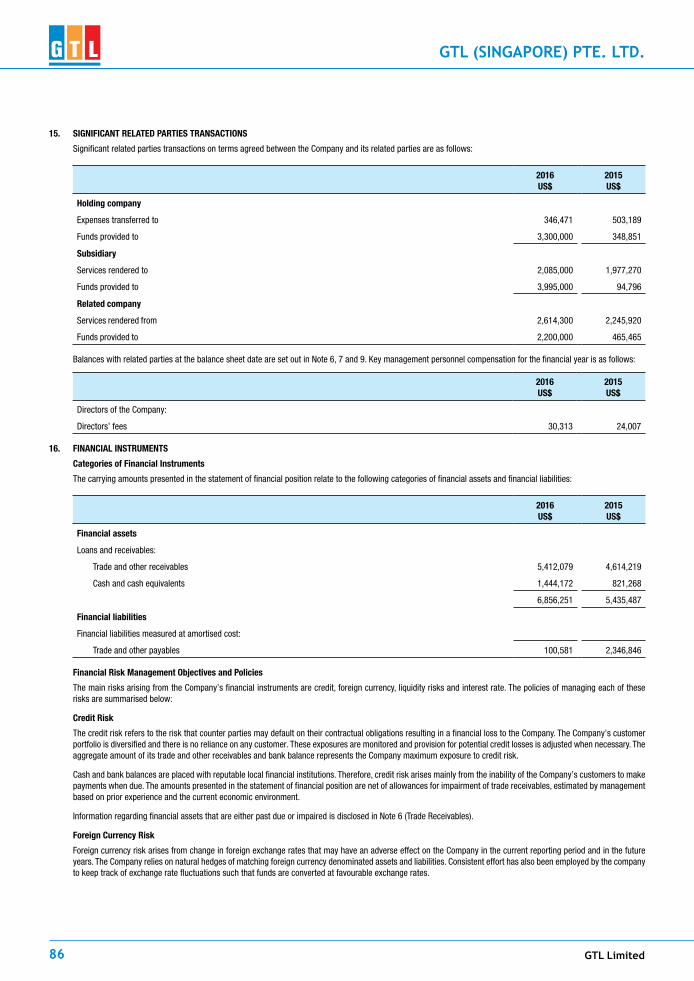
GTL Limited86
GTL (SINGAPORE) PTE. LTD.
15. siGNiFicANt reLAteD pArties trANsActioNs
Significant related parties transactions on terms agreed between the Company and its related parties are as follows:
2016Us$
2015Us$
Holding company
Expenses transferred to 346,471 503,189
Funds provided to 3,300,000 348,851
subsidiary
Services rendered to 2,085,000 1,977,270
Funds provided to 3,995,000 94,796
related company
Services rendered from 2,614,300 2,245,920
Funds provided to 2,200,000 465,465
Balances with related parties at the balance sheet date are set out in Note 6, 7 and 9. Key management personnel compensation for the financial year is as follows:
2016Us$
2015Us$
Directors of the Company:
Directors’ fees 30,313 24,007
16. FiNANciAL iNstrUMeNts
categories of Financial instruments
The carrying amounts presented in the statement of financial position relate to the following categories of financial assets and financial liabilities:
2016Us$
2015Us$
Financial assets
Loans and receivables:
Trade and other receivables 5,412,079 4,614,219
Cash and cash equivalents 1,444,172 821,268
6,856,251 5,435,487
Financial liabilities
Financial liabilities measured at amortised cost:
Trade and other payables 100,581 2,346,846
Financial risk Management objectives and policies
The main risks arising from the Company’s financial instruments are credit, foreign currency, liquidity risks and interest rate. The policies of managing each of these risks are summarised below:
credit risk
The credit risk refers to the risk that counter parties may default on their contractual obligations resulting in a financial loss to the Company. The Company’s customer portfolio is diversified and there is no reliance on any customer. These exposures are monitored and provision for potential credit losses is adjusted when necessary. The aggregate amount of its trade and other receivables and bank balance represents the Company maximum exposure to credit risk.
Cash and bank balances are placed with reputable local financial institutions. Therefore, credit risk arises mainly from the inability of the Company’s customers to make payments when due. The amounts presented in the statement of financial position are net of allowances for impairment of trade receivables, estimated by management based on prior experience and the current economic environment.
Information regarding financial assets that are either past due or impaired is disclosed in Note 6 (Trade Receivables).
Foreign currency risk
Foreign currency risk arises from change in foreign exchange rates that may have an adverse effect on the Company in the current reporting period and in the future years. The Company relies on natural hedges of matching foreign currency denominated assets and liabilities. Consistent effort has also been employed by the company to keep track of exchange rate fluctuations such that funds are converted at favourable exchange rates.

GTL (SINGAPORE) PTE. LTD.
29th Annual Report 2016-17 87
The Company’s exposure to foreign currency is as follows:
Nepalese Rupee Singapore Dollar
US$ US$
2016
Trade and other receivables 958,737 -
Cash and cash equivalents - 173,252
Trade and other payables - (16,838)
958,737 156,414
2015
Trade and other receivables 211,431 -
Cash and cash equivalents - 57,250
Trade and other payables - (10,122)
211,431 47,128
sensitivity analysis
A 5% strengthening of United States Dollar against the following currencies at the reporting date would increase/(decrease) profit or loss (before tax) by the amounts shown below. This analysis assumes that all other variables, in particular interest rates, remain constant.
statement of comprehensive income
Us$
2016
Nepalese Rupee (47,937)
Singapore Dollar (7,821)
(55,758)
2015
Nepalese Rupee (10,572)
Singapore Dollar (2,356)
(12,928)
A 5% weakening of United States Dollar against the above currencies would have had the equal but opposite effect on the above currencies to the amounts shown above, on the basis that all other variables remain constant.
Liquidity risk
Liquidity risk is the risk that the Company will encounter difficulty in meeting financial obligations due to shortage of funds. The Company’s exposure to liquidity risk arises primarily from mismatches of the maturities of financial assets and liabilities. The Company’s objective is to maintain a balance between continuity of funding and flexibility through the use of stand-by credit facilities.
To manage liquidity risk, the Company monitors its net operating cash flow and maintains an adequate level of cash and cash equivalent.
The table below summarises the maturity profile of the Company’s financial assets and liabilities at the end of the reporting period based on contractual undiscounted repayment obligations.
2016 within 1 year
within 2 to 5 years
More than 5 years
total
Us$ Us$ Us$ Us$
Financial Assets
Trade and other receivables 5,412,079 - - 5,412,079
Cash and cash equivalents 1,444,172 - - 1,444,172
total undiscounted financial assets 6,856,251 - - 6,856,251
Financial Liabilities
Trade and other payables 100,581 - - 100,581
Total undiscounted financial liabilities 100,581 100,581
total net undiscounted financial assets 6,755,670 - - 6,755,670

GTL Limited88
GTL (SINGAPORE) PTE. LTD.
2015 within 1 year
within 2 to 5 years
More than 5 years
total
Us$ Us$ Us$ Us$
Financial Assets
Trade and other receivables 4,614,219 - - 4,614,219
Cash and cash equivalents 821,268 - - 821,268
total undiscounted financial assets 5,435,487 - - 5,435,487
Financial Liabilities
Trade and other payables 2,346,846 - - 2,346,846
Total undiscounted financial liabilities 2,346,846 - - 2,346,846
total net undiscounted financial assets 3,088,641 - - 3,088,641
interest rate risk
Interest rate risk is the risk that the fair value or future cash flows of a financial instrument will fluctuate because of changes in market interest rates.
Cash flow interest rate risk is the risk that the future cash flows of a financial instrument will fluctuate because of changes in market interest rates. Fair value interest rate risk is the risk that the value of a financial instrument will fluctuate due to changes in market interest rates. As the Company has no significant interest-bearing assets, the Company’s income and operating cash flows are substantially independent of changes in market interest rates.
Fair Value of Financial instruments
As at the end of the financial year, the Company has no financial assets or financial liabilities that are carried at fair value measurements.
The carrying amounts of financial assets and financial liabilities of the Company recorded at amortised cost in the financial statements approximate their fair values due to their short term nature
17 criticAL AccoUNtiNG estiMAtes AND JUDGeMeNt
Estimates and judgement are continually evaluated and are based on historical experience and other factors, including expectations of future events that are believed to be reasonable under the circumstances.
The Company makes estimates and assumptions concerning the future. The resulting accounting estimates will, by definition, seldom equal the related actual results. The estimates and assumptions that have a significant risk of causing a material adjustment to the carrying amounts of assets and liabilities within the next financial year are discussed below.
Allowance for Doubtful Debts
Allowance for bad and doubtful debts are based on an assessment of the recoverability of trade and other receivables. Allowances are applied to trade and other receivables where events or changes in circumstances indicate that the balances may not be collectible. The indication of bad and doubtful debts requires the use of judgement and estimates. Where the expected outcome is different from the original estimate, such difference will impact the carrying value of the trade and other receivables and doubtful debts expenses in the period in which such estimates has been changed.
estimated Useful Life for plant and equipment
Estimated useful life for plant and equipment is based on the Company’s assessment of the expected usage of the asset and expect wear and tear of the asset. The depreciation is charged against the fixed assets to show utilisation of the assets. The estimation of depreciation and useful life requires use of judgement and estimates. Where the expected outcome is different from the original estimate, such difference will impact carrying value of plant and equipment and depreciation expenses in the period in which such estimates has been changed.
Depreciation of plant and equipment
Plant, property and equipment are depreciated on a straight-line basis over their estimated useful lives. Management estimates the useful lives of plant, property and equipment to be 5 years. The carrying amount of the Company’s plant, property and equipment as at 31 December 2016 is US$1,008 (2015: US$188,646). Changes in the expected level of usage and technological developments could impact the economic useful lives and the residual lives of these assets, therefore future depreciation charges could be revised.
18. cApitAL MANAGeMeNt
The primary objective of the Company’s capital management is to maximise shareholder’s value.
The Company manages its capital structure and make adjustments to it, in light of changes in the working capital requirements, business performance and economic conditions. To maintain or adjust the capital structure, the Company may adjust the dividend payment to shareholders, return capital to shareholders or issue new shares. No changes were made in the objectives, policies or processes during the period ended 31 December 2016 and 31 December 2015.
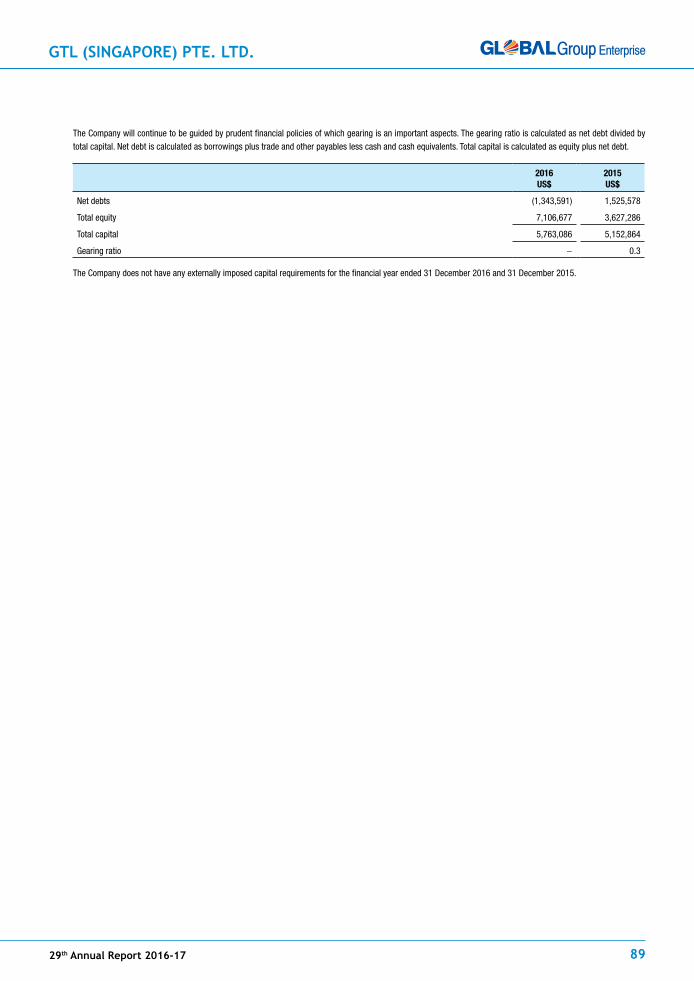
GTL (SINGAPORE) PTE. LTD.
29th Annual Report 2016-17 89
The Company will continue to be guided by prudent financial policies of which gearing is an important aspects. The gearing ratio is calculated as net debt divided by total capital. Net debt is calculated as borrowings plus trade and other payables less cash and cash equivalents. Total capital is calculated as equity plus net debt.
2016Us$
2015Us$
Net debts (1,343,591) 1,525,578
Total equity 7,106,677 3,627,286
Total capital 5,763,086 5,152,864
Gearing ratio - 0.3
The Company does not have any externally imposed capital requirements for the financial year ended 31 December 2016 and 31 December 2015.

GTL Limited90
GTL Overseas (MiddLe easT) dMCC
Directors’ report
We submit our report and the audited financial statements for the year ended 31 December 2016.
review of business and performance
The Company is engaged in the business of rendering telecommunication services.
The Company achieved revenue of AED 9.55 million as compared to AED 14.28 million in the previous period and an overall gross profit margin of 40.9% as compared to 35.1% in the previous year. The overhead expenses of AED 5,894,133 incurred during the year include bad debts of AED 2,258,831 written off and provision for doubtful debts of AED 1,451,766.
Consequently, the Company incurred a loss of AED 1,957,703 for the year against a profit of AED 1,501,180 in the previous year.
events since the end of the year
There are no significant events since the end of the year.
shareholder and its interest
The Shareholder as at 31 December 2016 and its interest in the share capital of the Company as at that date was as follows:
Name Number AeD
of shares
GTL International Limited, Bermuda 50 50,000
Management responsibilities
The Implementing Regulations No. 1/03 of the Dubai Multi Commodities Centre Authority, requires the Directors to prepare the financial statements in accordance with the International Financial Reporting Standards which give a true and fair view of the state of affairs of the Company and of profit/loss for each financial year. We confirm that we are responsible for these financial statements, which have been prepared in conformity with the statutory requirements and the International Financial Reporting Standards, including selecting the accounting policies and making the judgements underlying them. We confirm that we have made available all relevant accounting records and information for compilation of these financial statements and that all transactions have been recorded and are reflected in the financial statements.
Auditors
M/s. Behl, Lad & Al Sayegh - Chartered Accountants are proposed as auditors of the Company for the next year.
_______________ _______________
Vipulkumar patel sandhya patel
Director Director
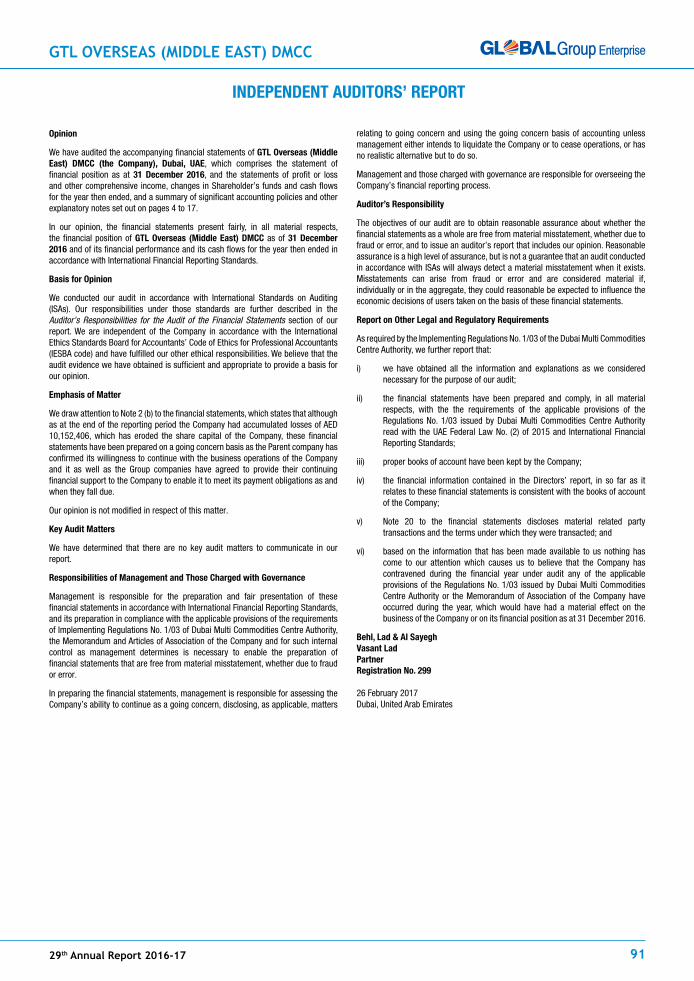
GTL Overseas (MiddLe easT) dMCC
29th annual report 2016-17 91
iNDepeNDeNt AuDitors’ report
opinion
We have audited the accompanying financial statements of GtL overseas (Middle east) DMcc (the company), Dubai, uAe, which comprises the statement of financial position as at 31 December 2016, and the statements of profit or loss and other comprehensive income, changes in Shareholder’s funds and cash flows for the year then ended, and a summary of significant accounting policies and other explanatory notes set out on pages 4 to 17.
In our opinion, the financial statements present fairly, in all material respects, the financial position of GtL overseas (Middle east) DMcc as of 31 December 2016 and of its financial performance and its cash flows for the year then ended in accordance with International Financial Reporting Standards.
Basis for opinion
We conducted our audit in accordance with International Standards on Auditing (ISAs). Our responsibilities under those standards are further described in the Auditor’s Responsibilities for the Audit of the Financial Statements section of our report. We are independent of the Company in accordance with the International Ethics Standards Board for Accountants’ Code of Ethics for Professional Accountants (IESBA code) and have fulfilled our other ethical responsibilities. We believe that the audit evidence we have obtained is sufficient and appropriate to provide a basis for our opinion.
emphasis of Matter
We draw attention to Note 2 (b) to the financial statements, which states that although as at the end of the reporting period the Company had accumulated losses of AED 10,152,406, which has eroded the share capital of the Company, these financial statements have been prepared on a going concern basis as the Parent company has confirmed its willingness to continue with the business operations of the Company and it as well as the Group companies have agreed to provide their continuing financial support to the Company to enable it to meet its payment obligations as and when they fall due.
Our opinion is not modified in respect of this matter.
Key Audit Matters
We have determined that there are no key audit matters to communicate in our report.
responsibilities of Management and those charged with Governance
Management is responsible for the preparation and fair presentation of these financial statements in accordance with International Financial Reporting Standards, and its preparation in compliance with the applicable provisions of the requirements of Implementing Regulations No. 1/03 of Dubai Multi Commodities Centre Authority, the Memorandum and Articles of Association of the Company and for such internal control as management determines is necessary to enable the preparation of financial statements that are free from material misstatement, whether due to fraud or error.
In preparing the financial statements, management is responsible for assessing the Company’s ability to continue as a going concern, disclosing, as applicable, matters
relating to going concern and using the going concern basis of accounting unless management either intends to liquidate the Company or to cease operations, or has no realistic alternative but to do so.
Management and those charged with governance are responsible for overseeing the Company’s financial reporting process.
Auditor’s responsibility
The objectives of our audit are to obtain reasonable assurance about whether the financial statements as a whole are free from material misstatement, whether due to fraud or error, and to issue an auditor’s report that includes our opinion. Reasonable assurance is a high level of assurance, but is not a guarantee that an audit conducted in accordance with ISAs will always detect a material misstatement when it exists. Misstatements can arise from fraud or error and are considered material if, individually or in the aggregate, they could reasonable be expected to influence the economic decisions of users taken on the basis of these financial statements.
report on other Legal and regulatory requirements
As required by the Implementing Regulations No. 1/03 of the Dubai Multi Commodities Centre Authority, we further report that:
i) we have obtained all the information and explanations as we considered necessary for the purpose of our audit;
ii) the financial statements have been prepared and comply, in all material respects, with the the requirements of the applicable provisions of the Regulations No. 1/03 issued by Dubai Multi Commodities Centre Authority read with the UAE Federal Law No. (2) of 2015 and International Financial Reporting Standards;
iii) proper books of account have been kept by the Company;
iv) the financial information contained in the Directors’ report, in so far as it relates to these financial statements is consistent with the books of account of the Company;
v) Note 20 to the financial statements discloses material related party transactions and the terms under which they were transacted; and
vi) based on the information that has been made available to us nothing has come to our attention which causes us to believe that the Company has contravened during the financial year under audit any of the applicable provisions of the Regulations No. 1/03 issued by Dubai Multi Commodities Centre Authority or the Memorandum of Association of the Company have occurred during the year, which would have had a material effect on the business of the Company or on its financial position as at 31 December 2016.
Behl, Lad & Al sayeghVasant Ladpartnerregistration No. 299
26 February 2017Dubai, United Arab Emirates
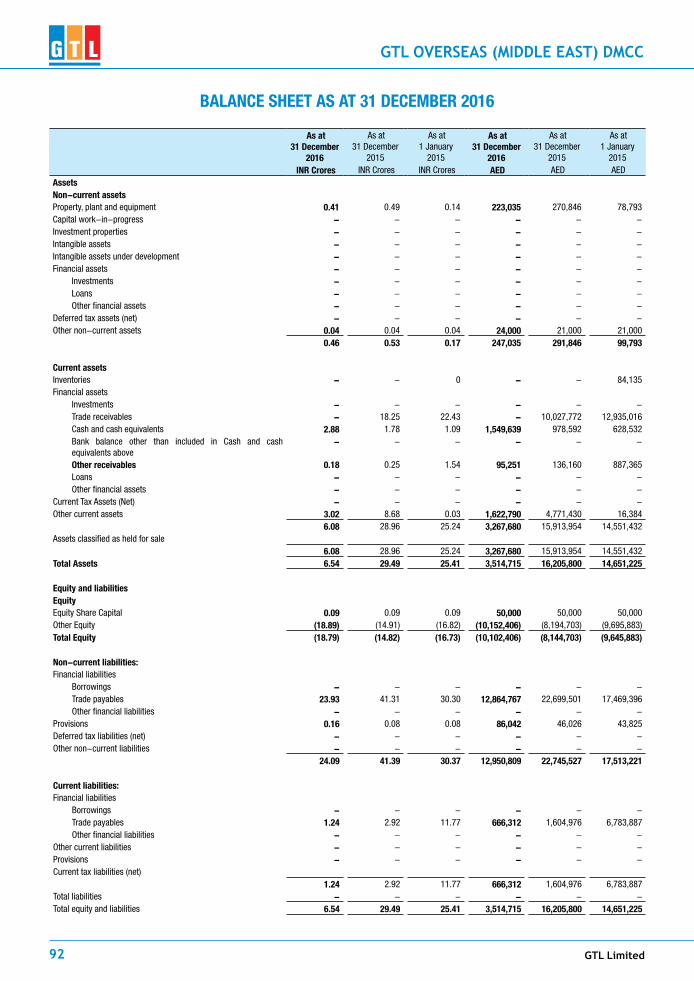
GTL Limited92
GTL Overseas (MiddLe easT) dMCC
As at 31 December
2016
As at 31 December
2015
As at 1 January
2015
As at 31 December
2016
As at 31 December
2015
As at 1 January
2015 iNr crores INR Crores INR Crores AeD AED AED
AssetsNon-current assetsProperty, plant and equipment 0.41 0.49 0.14 223,035 270,846 78,793Capital work-in-progress - - - - - -Investment properties - - - - - -Intangible assets - - - - - -Intangible assets under development - - - - - -Financial assets - - - - - -
Investments - - - - - -Loans - - - - - -Other financial assets - - - - - -
Deferred tax assets (net) - - - - - -Other non-current assets 0.04 0.04 0.04 24,000 21,000 21,000
0.46 0.53 0.17 247,035 291,846 99,793
current assetsInventories - - 0 - - 84,135Financial assets
Investments - - - - - -Trade receivables - 18.25 22.43 - 10,027,772 12,935,016Cash and cash equivalents 2.88 1.78 1.09 1,549,639 978,592 628,532Bank balance other than included in Cash and cash equivalents above
- - - - - -
other receivables 0.18 0.25 1.54 95,251 136,160 887,365Loans - - - - - -Other financial assets - - - - - -
Current Tax Assets (Net) - - - - - -Other current assets 3.02 8.68 0.03 1,622,790 4,771,430 16,384
6.08 28.96 25.24 3,267,680 15,913,954 14,551,432Assets classified as held for sale
6.08 28.96 25.24 3,267,680 15,913,954 14,551,432total Assets 6.54 29.49 25.41 3,514,715 16,205,800 14,651,225
equity and liabilitiesequityEquity Share Capital 0.09 0.09 0.09 50,000 50,000 50,000Other Equity (18.89) (14.91) (16.82) (10,152,406) (8,194,703) (9,695,883)total equity (18.79) (14.82) (16.73) (10,102,406) (8,144,703) (9,645,883)
Non-current liabilities:Financial liabilities
Borrowings - - - - - -Trade payables 23.93 41.31 30.30 12,864,767 22,699,501 17,469,396Other financial liabilities - - - - - -
Provisions 0.16 0.08 0.08 86,042 46,026 43,825Deferred tax liabilities (net) - - - - - -Other non-current liabilities - - - - - -
24.09 41.39 30.37 12,950,809 22,745,527 17,513,221
current liabilities:Financial liabilities
Borrowings - - - - - -Trade payables 1.24 2.92 11.77 666,312 1,604,976 6,783,887Other financial liabilities - - - - - -
Other current liabilities - - - - - -Provisions - - - - - -Current tax liabilities (net)
1.24 2.92 11.77 666,312 1,604,976 6,783,887Total liabilities - - - - - -Total equity and liabilities 6.54 29.49 25.41 3,514,715 16,205,800 14,651,225
BALANce sheet As At 31 DeceMBer 2016

GTL Overseas (MiddLe easT) dMCC
29th annual report 2016-17 93
stAteMeNt of profit AND Loss for the yeAr eNDeD 31st DeceMBer, 2016
year ended Year ended year ended Year ended
31st Dec, 2016
31st Dec, 2015
Restated*
31st Dec, 2016
31st Dec, 2015
Restated*
iNr crores INR Crores AeD AED
continuing operations
Revenue from operations 17.63 25.67 9,548,351 14,276,738
Other income (0.65) 0.18 (350,605) 98,303
totAL iNcoMe 16.98 25.85 9,197,746 14,375,041
eXpeNses
Cost of materials consumed - - - -
Purchases of stock-in-trade 8.14 10.02 4,407,945 5,574,823
Changes in inventories of finished goods, stock-in-trade and work-in-progress - - - -
Employee benefits expenses 3.39 8.86 1,833,561 4,926,161
Finance costs - - - -
Depreciation and amortisation expenses 0.14 0.23 75,384 125,596
Other expenses 8.93 4.03 4,838,559 2,247,281
totAL eXpeNses 20.60 23.14 11,155,449 12,873,861
profit/(loss) before exceptional items and tax from continuing operations (3.62) 2.70 (1,957,703) 1,501,180
exceptional items - - - -
profit/(loss) before tax from continuing operations (3.62) 2.70 (1,957,703) 1,501,180
profit for the yeAr froM coNtiNuiNG operAtioNs (3.62) 2.70 (1,957,703) 1,501,180
Discontinued operations:
profit/ (loss) for the year from discontinued operations - - - -
profit/(loss) for the year (3.62) 2.70 (1,957,703) 1,501,180
other comprehensive income for the year, net of tax - - - -
total comprehensive income for the period, net of tax (3.62) 2.70 (1,957,703) 1,501,180

GTL Limited94
GTL Overseas (MiddLe easT) dMCCa.
equ
ity s
hare
cap
ital:
equi
ty s
hare
s is
sued
, sub
scrib
ed a
nd fu
lly p
aid
Nos
. iN
r cr
ores
AeD
At 1
Jan
uary
201
5 5
0,00
0 0
.09
50,
000
Issu
e of
sha
re c
apita
l (No
te 1
7) -
-At
31
Dece
mbe
r 201
5 5
0,00
0 0
.09
50,
000
Issu
e of
sha
re c
apita
l (No
te 1
7) -
-At
31
Dece
mbe
r 201
6 5
0,00
0 0
.09
50,
000
b. o
ther
equ
ity:
for t
he y
ear e
nded
31
Dece
mbe
r 201
6
part
icul
ars
equi
ty c
ompo
nent
of
com
poun
d fin
anci
al
inst
rum
ent
(Not
e 18
)
rese
rves
& s
urpl
usite
ms
of o
cito
tal e
quity
capi
tal r
eser
ve
(Not
e 18
)ca
pita
l re
dem
ptio
n re
serv
e (N
ote
18)
secu
ritie
s pr
emiu
m a
ccou
nt
(Not
e 18
)
Debe
ntur
e re
dem
ptio
n re
serv
e (N
ote
18)
Gene
ral r
eser
ve
(Not
e 18
)Ba
lanc
e in
st
atem
ent o
f pr
ofit
and
Loss
(N
ote
18)
fVto
ci re
serv
e (N
ote
18)
INR
in C
rore
sIN
R in
Cro
res
INR
in C
rore
sIN
R in
Cro
res
INR
in C
rore
sIN
R in
Cro
res
INR
in C
rore
sIN
R in
Cro
res
INR
in C
rore
sAs
at 3
1st D
ecem
ber 2
015
- -
- -
- -
(14.
91)
- (1
4.91
)Ne
t Pro
fit fo
r the
per
iod
(3.6
2) (3
.62)
Tran
slat
ion
rese
rve
(0.3
6) (0
.36)
tota
l com
preh
ensi
ve in
com
e -
- -
- -
- (3
.97)
- (3
.97)
Divi
dend
s -
- -
- -
- -
- -
Tran
sfer
from
deb
entu
re re
dem
ptio
n re
serv
e -
- -
- -
- -
- -
Tran
sfer
from
Bal
ance
in S
tate
men
t of P
rofit
and
Los
s -
- -
- -
- -
- -
Tran
sfer
to g
ener
al re
serv
e -
- -
- -
- -
- -
Tran
sfer
to B
alan
ce in
Sta
tem
ent o
f Pro
fit a
nd L
oss
- -
- -
- -
- -
-
As a
t 31
Dece
mbe
r 201
6 -
- -
- -
- (1
8.89
) -
(18.
89)
for t
he y
ear e
nded
31
Mar
ch 2
016
part
icul
ars
equi
ty c
ompo
nent
of
com
poun
d fin
anci
al
inst
rum
ent
(Not
e 18
)
rese
rves
& s
urpl
usite
ms
of o
ci t
otal
equ
ityca
pita
l res
erve
(N
ote
18)
capi
tal
rede
mpt
ion
rese
rve
(Not
e 18
)
secu
ritie
s pr
emiu
m a
ccou
nt
(Not
e 18
)
Debe
ntur
e re
dem
ptio
n re
serv
e (N
ote
18)
Gene
ral r
eser
ve
(Not
e 18
)Ba
lanc
e in
st
atem
ent o
f pr
ofit
and
Loss
(N
ote
18)
fVto
ci re
serv
e (N
ote
18)
INR
in C
rore
sIN
R in
Cro
res
INR
in C
rore
sIN
R in
Cro
res
INR
in C
rore
sIN
R in
Cro
res
INR
in C
rore
sIN
R in
Cro
res
INR
in C
rore
sAs
at 1
st J
anua
ry 2
015
- -
- -
- -
(16.
82)
- (1
6.82
)Ne
t Pro
fit fo
r the
per
iod
2.7
0 2
.70
Othe
r com
preh
ensi
ve in
com
e (0
.80)
(0.8
0)to
tal c
ompr
ehen
sive
inco
me
- -
- -
- -
1.9
0 -
1.9
0Im
pact
of t
rans
latio
n of
fina
ncia
ls in
to IN
DAS
-Di
vide
nds
- -
- -
- -
- -
-Tr
ansf
er fr
om d
eben
ture
rede
mpt
ion
rese
rve
- -
- -
- -
- -
-Tr
ansf
er fr
om B
alan
ce in
Sta
tem
ent o
f Pro
fit a
nd L
oss
- -
- -
- -
- -
-Tr
ansf
er to
gen
eral
rese
rve
- -
- -
- -
- -
-Tr
ansf
er to
Bal
ance
in S
tate
men
t of P
rofit
and
Los
s -
- -
- -
- -
- -
As a
t 31
Dece
mbe
r 201
5 -
- -
- -
- (1
4.91
) -
(14.
91)
stAN
DALo
Ne s
tAte
MeN
t of
chA
NGes
iN e
quit
y fo
r th
e ye
Ar e
NDeD
31
Dece
MBe
r 20
16

GTL Overseas (MiddLe easT) dMCC
29th annual report 2016-17 95
stAteMeNt of cAsh fLows for the yeAr eNDeD 31 DeceMBer 2016
31 March 2017 31 March 2016 31 March 2017 31 March 2016
iNr in crores INR in Crores AeD AED
profit before tax (3.62) 2.70 (1,957,703.00) 1,501,180.00
Adjustments to reconcile profit before tax to net cash flows:
Provision for slowmoving inventories - 0.15 - 84,135.00
Gain on disposal of property, plant and equipment (0.00) (0.08) (2,350.00) (46,400.00)
Excess provision written back - (0.41) - (228,184.00)
Depreciation on plant & equipment 0.14 0.23 75,384.00 125,596.00
Bad debts written off and provision for doubtful debts 6.90 - 3,710,597
Working capital adjustments:
(Increase)/decrease in trade receivables (6.63) (23.32) -3564900 -12970469
Decrease in prepayments 0.04 0.50 19928 277344
(Increase)/decrease in staff end of service gratuity provision 0.07 0.00 40016 2201
Increase /(decrease) in trade payables, other current and non current liabilities and provisions
6.40 (3.61) 3,440,762.00 (2,006,036.00)
Net cash flows from operating activities 3.30 (23.84) 1,761,734.00 (13,260,633.00)
investing activities
Proceeds from sale of property, plant and equipment 0.06 0.03 33,900.00 14,850.00
Purchase of property, plant and equipment (including CWIP) (0.05) (0.57) (27,573.00) (317,649.00)
Deposits placed during the year (0.01) - (3,000.00) -
Net cash flows from / (used in) investing activities 0.01 (0.54) 3,327.00 (302,799.00)
financing activities
(Payments to) / receipts from Parent Company (6.40) 12.06 (3,439,989.00) 6,705,229.00
Receipts from related parties 4.18 12.96 2,245,975.00 7,208,263.00
Net cash flows from / (used in) financing activities (2.22) 25.02 (1,194,014.00) 13,913,492.00
Net increase / (decrease) in cash and cash equivalents 1.09 0.63 571,047.00 350,060.00
translation effects 0.01 0.06 - -
Cash and cash equivalents at the beginning of the year 1.78 1.09 978,592.00 628,532.00
cash and cash equivalents at the end 2.88 1.78 1,549,639.00 978,592.00
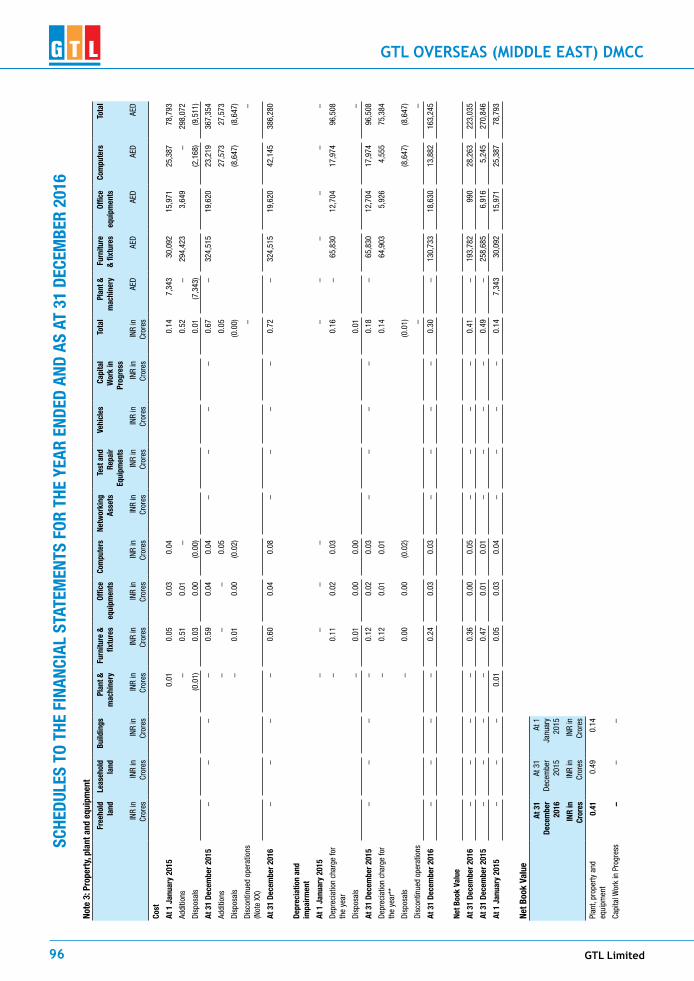
GTL Limited96
GTL Overseas (MiddLe easT) dMCCsc
heDu
Les
to t
he f
iNAN
ciAL
stA
teM
eNts
for
the
yeA
r eN
DeD
AND
As A
t 31
Dec
eMBe
r 20
16No
te 3
: pro
pert
y, pl
ant a
nd e
quip
men
tfr
eeho
ld
land
Leas
ehol
d la
ndBu
ildin
gspl
ant &
m
achi
nery
furn
iture
&
fixtu
res
offic
e eq
uipm
ents
com
pute
rsNe
twor
king
As
sets
test
and
re
pair
equi
pmen
ts
Vehi
cles
capi
tal
wor
k in
pr
ogre
ss
tota
lpl
ant &
m
achi
nery
furn
iture
&
fixtu
res
offic
e eq
uipm
ents
com
pute
rsto
tal
INR
in
Cror
esIN
R in
Cr
ores
INR
in
Cror
esIN
R in
Cr
ores
INR
in
Cror
esIN
R in
Cr
ores
INR
in
Cror
esIN
R in
Cr
ores
INR
in
Cror
esIN
R in
Cr
ores
INR
in
Cror
esIN
R in
Cr
ores
AED
AED
AED
AED
AED
cost
At 1
Jan
uary
201
5 0
.01
0.0
5 0
.03
0.0
4 0
.14
7,3
43
30,
092
15,
971
25,
387
78,
793
Addi
tions
-
0.5
1 0
.01
-
0.5
2 -
2
94,4
23
3,6
49
-
298
,072
Disp
osal
s (0
.01)
0.0
3 0
.00
(0.0
0) 0
.01
(7,3
43)
(2,1
68)
(9,5
11)
At 3
1 De
cem
ber 2
015
-
-
-
-
0.5
9 0
.04
0.0
4 -
-
-
-
0
.67
-
324
,515
1
9,62
0 2
3,21
9 3
67,3
54
Addi
tions
-
-
-
0.0
5 0
.05
27,
573
27,
573
Disp
osal
s -
0
.01
0.0
0 (0
.02)
(0.0
0) (8
,647
) (8
,647
)
Disc
ontin
ued
oper
atio
ns
(Not
e XX
) -
-
At 3
1 De
cem
ber 2
016
-
-
-
-
0.6
0 0
.04
0.0
8 -
-
-
-
0
.72
-
324
,515
1
9,62
0 4
2,14
5 3
86,2
80
Depr
ecia
tion
and
impa
irmen
t
At 1
Jan
uary
201
5 -
-
-
-
-
-
-
-
-
-
Depr
ecia
tion
char
ge fo
r th
e ye
ar -
0
.11
0.0
2 0
.03
0.1
6 -
6
5,83
0 1
2,70
4 1
7,97
4 9
6,50
8
Disp
osal
s -
0
.01
0.0
0 0
.00
0.0
1 -
At 3
1 De
cem
ber 2
015
-
-
-
-
0.1
2 0
.02
0.0
3 -
-
-
-
0
.18
-
65,
830
12,
704
17,
974
96,
508
Depr
ecia
tion
char
ge fo
r th
e ye
ar**
-
0.1
2 0
.01
0.0
1 0
.14
64,
903
5,9
26
4,5
55
75,
384
Disp
osal
s -
0
.00
0.0
0 (0
.02)
(0.0
1) (8
,647
) (8
,647
)
Disc
ontin
ued
oper
atio
ns -
-
At 3
1 De
cem
ber 2
016
-
-
-
-
0.2
4 0
.03
0.0
3 -
-
-
-
0
.30
-
130
,733
1
8,63
0 1
3,88
2 1
63,2
45
Net B
ook
Valu
e
At 3
1 De
cem
ber 2
016
-
-
-
-
0.3
6 0
.00
0.0
5 -
-
-
-
0
.41
-
193
,782
9
90
28,
263
223
,035
At 3
1 De
cem
ber 2
015
-
-
-
-
0.4
7 0
.01
0.0
1 -
-
-
-
0
.49
-
258
,685
6
,916
5
,245
2
70,8
46
At 1
Jan
uary
201
5 -
-
-
0
.01
0.0
5 0
.03
0.0
4 -
-
-
-
0
.14
7,3
43
30,
092
15,
971
25,
387
78,
793
Net B
ook
Valu
eAt
31
Dece
mbe
r 20
16
At 3
1 De
cem
ber
2015
At 1
Ja
nuar
y 20
15
iNr
in
cror
esIN
R in
Cr
ores
INR
in
Cror
es
Plan
t, pr
oper
ty a
nd
equi
pmen
t 0
.41
0.4
9 0
.14
Capi
tal W
ork
in P
rogr
ess
-
-
-

GTL Overseas (MiddLe easT) dMCC
29th annual report 2016-17 97
Note 8: other non-current assets31 December
201631 December
20151 January
201531 December
201631 December
20151 January
2015iNr in crores INR in Crores INR in Crores AeD AED AED
Advances other than capital advancesSecurity Deposits 0.04 0.04 0.04 24,000 21,000 21,000Others
0.04 0.04 0.04 24,000 21,000 21,000
Note 9: inventories31 December
201631 December
20151 January
2015 31 December
2016 31 December
2015 1 January
2015iNr in crores INR in Crores INR in Crores AeD AED AED
Finished goods (at lower of cost and net realisable value) 0.15 84,135total inventories at the lower of cost and net realisable value - - 0.15 - - 84,135
Note 11: trade and other receivables31 December
201631 December
20151 January
2015 31 December
2016 31 December
2015 1 January
2015iNr in crores INR in Crores INR in Crores AeD AED AED
trade receivablesReceivables from an associateReceivables from other related parties 4.09 13.93 2,245,401 8,033,479total trade and other receivables - 4.09 13.93 - 2,245,401 8,033,479
trade receivablesSecured, considered goodUnsecured, considered good 14.16 8.50 7,782,371 4,901,537Doubtful 2.70 - 1,451,766
2.70 14.16 8.50 1,451,766 7,782,371 4,901,537other receivablesSecured, considered goodUnsecured, considered goodDoubtful - - - - - -
impairment Allowance (allowance for bad and doubtful debts)Unsecured, considered good (2.70) - (1,451,766)Doubtful
(2.70) - - (1,451,766) - -total trade receivables - 18.25 22.43 - 10,027,772 12,935,016
Note 12: cash and cash equivalents31 December
201631 December
20151 January
2015 31 December
2016 31 December
2015 1 January
2015iNr in crores INR in Crores INR in Crores AeD AED AED
Balances with banksIn current accounts 2.88 1.78 1.09 1,549,639 978,592 628,532
2.88 1.78 1.09 1,549,639 978,592 628,532
Note 14: other receivables31 December
201631 December
20151 January
2015 31 December
2016 31 December
2015 1 January
2015 iNr in crores INR in Crores INR in Crores AeD AED AED
Other receivables - 0.06 - 31,550 -Other loans and advances 0.18 0.19 1.54 95,251 104,610 887,365
0.18 0.25 1.54 95,251 136,160 887,365
Note 16: other current assets31 December
201631 December
20151 January
2015 31 December
2016 31 December
2015 1 January
2015 iNr in crores INR in Crores INR in Crores AeD AED AED
Others 3.02 8.68 0.03 1,622,790 4,771,430 16,384 3.02 8.68 0.03 1,622,790 4,771,430 16,384
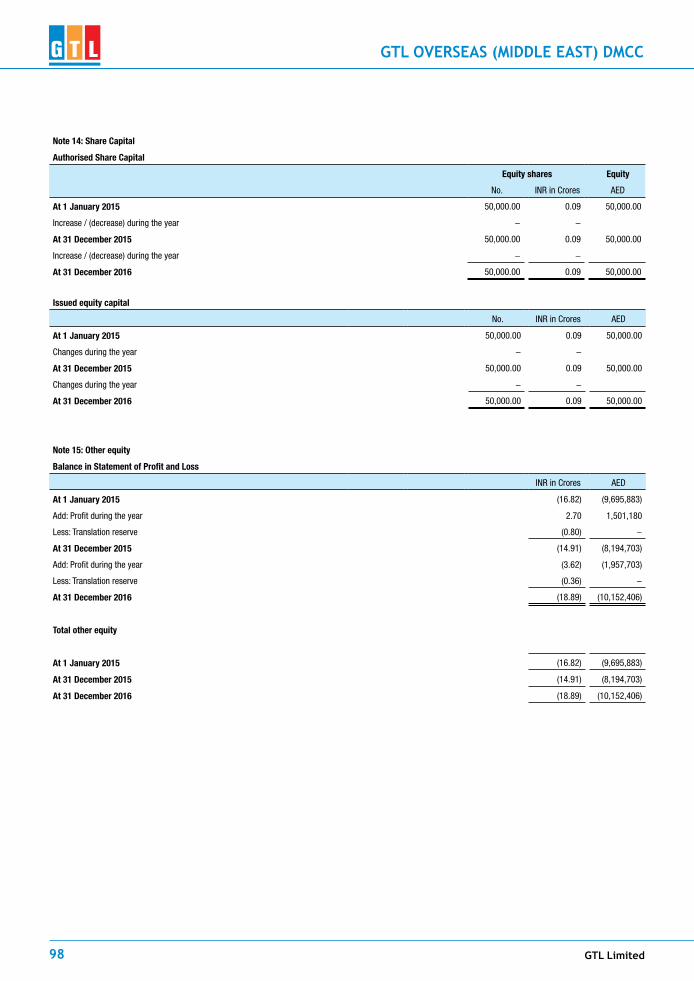
GTL Limited98
GTL Overseas (MiddLe easT) dMCC
Note 14: share capital
Authorised share capital
equity shares equity
No. INR in Crores AED
At 1 January 2015 50,000.00 0.09 50,000.00
Increase / (decrease) during the year - -
At 31 December 2015 50,000.00 0.09 50,000.00
Increase / (decrease) during the year - -
At 31 December 2016 50,000.00 0.09 50,000.00
issued equity capital
No. INR in Crores AED
At 1 January 2015 50,000.00 0.09 50,000.00
Changes during the year - -
At 31 December 2015 50,000.00 0.09 50,000.00
Changes during the year - -
At 31 December 2016 50,000.00 0.09 50,000.00
Note 15: other equity
Balance in statement of profit and Loss
INR in Crores AED
At 1 January 2015 (16.82) (9,695,883)
Add: Profit during the year 2.70 1,501,180
Less: Translation reserve (0.80) -
At 31 December 2015 (14.91) (8,194,703)
Add: Profit during the year (3.62) (1,957,703)
Less: Translation reserve (0.36) -
At 31 December 2016 (18.89) (10,152,406)
total other equity
At 1 January 2015 (16.82) (9,695,883)
At 31 December 2015 (14.91) (8,194,703)
At 31 December 2016 (18.89) (10,152,406)

GTL Overseas (MiddLe easT) dMCC
29th annual report 2016-17 99
Note 20: trade payables
31 Dec 2016 31 Dec 2015 1 Jan 2015 31 Dec 2016 31 Dec 2015 1 Jan 2015
INR in Crores INR in Crores INR in Crores AeD AED AED
Trade payables to related parties 23.93 41.31 30.30 12,864,767 22,699,501 17,469,396
23.93 41.31 30.30 12,864,767 22,699,501 17,469,396
Note 22: provisions
31 Dec 2016 31 Dec 2015 1 Jan 2015 31 Dec 2016 31 Dec 2015 1 Jan 2015
INR in Crores INR in Crores INR in Crores AeD AED AED
Provision for Employee Benefits
- Gratuity 0.16 0.08 0.08 86,042 46,026 43,825
0.16 0.08 0.08 86,042 46,026 43,825
Note 25: trade payables
31 Dec 2016 31 Dec 2015 1 Jan 2015 31 Dec 2016 31 Dec 2015 1 Jan 2015
INR in Crores INR in Crores INR in Crores AeD AED AED
Trade payables 0.61 2.31 6.07 327,848 1,267,086 3,501,306
Trade payables to related parties 0.63 0.61 5.69 338,464 337,890 3,282,581
1.24 2.92 11.77 666,312 1,604,976 6,783,887
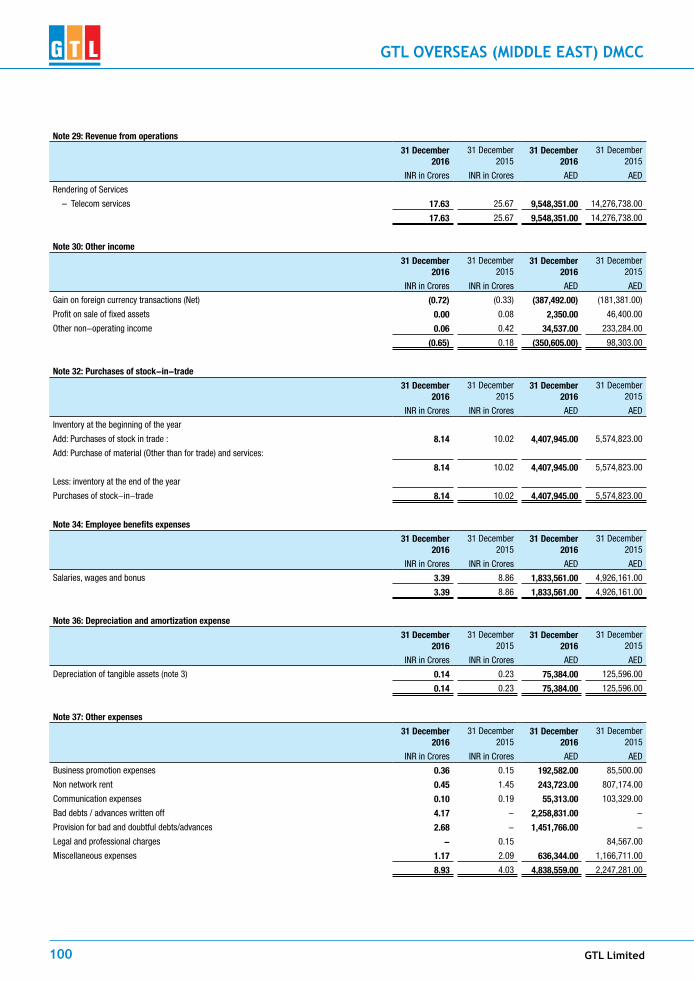
GTL Limited100
GTL Overseas (MiddLe easT) dMCC
Note 29: revenue from operations
31 December 2016
31 December 2015
31 December 2016
31 December 2015
INR in Crores INR in Crores AED AED
Rendering of Services
– Telecom services 17.63 25.67 9,548,351.00 14,276,738.00
17.63 25.67 9,548,351.00 14,276,738.00
Note 30: other income
31 December 2016
31 December 2015
31 December 2016
31 December 2015
INR in Crores INR in Crores AED AED
Gain on foreign currency transactions (Net) (0.72) (0.33) (387,492.00) (181,381.00)
Profit on sale of fixed assets 0.00 0.08 2,350.00 46,400.00
Other non-operating income 0.06 0.42 34,537.00 233,284.00
(0.65) 0.18 (350,605.00) 98,303.00
Note 32: purchases of stock-in-trade
31 December 2016
31 December 2015
31 December 2016
31 December 2015
INR in Crores INR in Crores AED AED
Inventory at the beginning of the year
Add: Purchases of stock in trade : 8.14 10.02 4,407,945.00 5,574,823.00
Add: Purchase of material (Other than for trade) and services:
8.14 10.02 4,407,945.00 5,574,823.00
Less: inventory at the end of the year
Purchases of stock-in-trade 8.14 10.02 4,407,945.00 5,574,823.00
Note 34: employee benefits expenses
31 December 2016
31 December 2015
31 December 2016
31 December 2015
INR in Crores INR in Crores AED AED
Salaries, wages and bonus 3.39 8.86 1,833,561.00 4,926,161.00
3.39 8.86 1,833,561.00 4,926,161.00
Note 36: Depreciation and amortization expense
31 December 2016
31 December 2015
31 December 2016
31 December 2015
INR in Crores INR in Crores AED AED
Depreciation of tangible assets (note 3) 0.14 0.23 75,384.00 125,596.00
0.14 0.23 75,384.00 125,596.00
Note 37: other expenses
31 December 2016
31 December 2015
31 December 2016
31 December 2015
INR in Crores INR in Crores AED AED
Business promotion expenses 0.36 0.15 192,582.00 85,500.00
Non network rent 0.45 1.45 243,723.00 807,174.00
Communication expenses 0.10 0.19 55,313.00 103,329.00
Bad debts / advances written off 4.17 - 2,258,831.00 -
Provision for bad and doubtful debts/advances 2.68 - 1,451,766.00 -
Legal and professional charges - 0.15 84,567.00
Miscellaneous expenses 1.17 2.09 636,344.00 1,166,711.00
8.93 4.03 4,838,559.00 2,247,281.00

GTL Overseas (MiddLe easT) dMCC
29th annual report 2016-17 101
Notes to the fiNANciAL stAteMeNts yeAr eNDeD 31 DeceMBer 2016
1 Legal status and business activities
a) GtL overseas (Middle east) DMcc (the company) is a limited liability company registered under Service Licence No. DMCC-33830 and Registration No. DMCC 4921 issued by the Dubai Multi Commodities Centre Authority, Dubai on 30 March 2014, in accordance with the provisions of Dubai Multi Commodities Centre Authority. The registered office of the Company is Office No. 2405, Mazaya Business Avenue BB1, Plot No. JLTE-PH2-BB1, Jumeirah Lakes Towers, Dubai, UAE.
b) The Company’s licensed activities are rendering of telecommunication services.
c) The Company is a wholly-owned subsidiary of GTL International Limited (the Parent company), registered in Bermuda.
d) The Ultimate Holding company is GtL Limited, India, a public limited liability company in India. The registered office of the Ultimate Holding company is Global Vision, Electronic Sadan No. 2, MIDC, TTC Industrial Area, Mahape, Navi Mumbai, Maharashtra, India 400 710.
2 Basis of preparation
a) statement of compliance
These financial statements are prepared under the historical cost convention and in conformity with International Financial Reporting Standards issued or adopted by the International Accounting Standards Board (IASB) and the requirements of Regulations No. 1/03 issued by Dubai Multi Commodities Centre Authority and International Financial Reporting Standards, read with UAE Federal Law No. (2) of 2015.
The following standards and amendments are effective for the first time from the current year, however they do not apply to the Company or do not have any material impact on the Company’s financial statements as they merely clarify the existing requirements and do not affect the Company’s accounting policies or any other dislcosures.
- IFRSs in Regulatory Deferred Accounts.
- Accounting for Acquisition of Interests in Joint Operations - Amendments to IFRS 11.
- Classification of Acceptable Methods of Depreciation and Amortisation - Amendments to IAS 16 & 38.
- Equity method in separate financial statements - Amendments to IAS 27.
- Agriculture: Bearer Plants - Amendments to IAS 16 and IAS 41.
- Annual Improvements to IFRSs 2012-2014 cycle.
- Disclosure Initiative - Amendment to IAS 1.
- Investment entities: Applying the consolidation exception - Amendments to IFRS 10, IFRS 12 and IAS 28.
b) Going concern basis of accounting
At the end of the period, the Company had accumulated losses of AED 10,152,406, which has eroded its entire share capital. However, the Parent company has confirmed its intention to continue with the operations of the Company and it as well as the Group companies have undertaken to provide their continuing financial support to the Company to meet is payment obligations as and when they fall due for payment. Accordingly, the financial statements have been prepared on a going concern basis.
c) functional and presentation currency
These financial statements have been presented in UAE Dirham (AED), being the currency of the primary economic environment in which the Company operates. The figures have been rounded off to the nearest UAE Dirham.
d) use of significant estimates, assumptions and judgements
Based on the historical experience and reasonable expectations of future events, the management makes judgements, estimates and assumptions that affect the application of accounting policies and the reported amounts of assets and liabilities, income and expenses and disclosure of contingencies and commitments. These relate to lives of items of property and equipment and their residual values, provision for doubtful trade receivables and provisions for staff end-of-service gratuity.
impairment of assets
At each reporting date, financial assets are assessed to determine whether there is any evidence of impairment which is judged by default or delinquency by a debtor, its creditworthiness, the age of the debts and the management experience.
In the case of non-financial assets a review is made to determine whether there is any indication of impairment. If any such indication exists, then the assets’ recoverable amount is estimated and impairment loss is recognised in the statement of profit or loss, if the carrying amount of the asset exceeds its recoverable amount.
e) New and amended standards
Applicable from the current year
The Company intends to adopt the following new standards, if applicable when they become effective.
- IFRS 15 - Revenue from contracts with customers and associated amendments to various other standards. This establishes a comprehensive framework for determining whether, how much and when revenue is recognized. It replaces existing revenue recognition guidance, including IAS 18 - Revenue, IAS 11 - Construction Contracts and IFRIC 13 - Customer Loyalty Programmes - Effective 1 January 2018.
- IFRS 16 - Leases - Effective date 1 January 2019.
- Recognition of Deferred Tax Assets for Unrealized losses - Amendments to IAS 12 - Effective Date 1 January 2017.
- Disclosure Initiative - Amendments to IAS 1.
- Sale or contribution of assets between an investor and its associate or joint venture - Amendments to IFRS 10 and IAS 28.
- IFRS 9 Financial Instruments and associated amendments to various other standards - This standard published in July 2014 replaces the existing guidance in IAS 39 - Financial Instruments, Recognition and Measurements. This includes revised guidance on the classification and measurement of financial instruments, including a new expected credit loss model for calculating impairment on financial assets, and the new general hedge accounting requirements. It also carries forward the guidance on recognition and derecognition of financial instruments from IAS 39 - Effective 1 January 2018.
3 summary of significant accounting policies
The significant accounting policies adopted and which have been consistently applied are as follows:
a) revenue and direct costs recognition
- revenue
Sales represents the amount invoiced for goods delivered and services rendered during the year, net of discounts and returns. Sale of goods is recognised when significant risks and rewards relating to the ownership of goods concerned are transferred to the customer. Revenue from services is recognised by reference to the stage of completion. Stage of completion is measured with reference to surveys of work performed. When the contract outcome cannot be measured reliably, revenue is recognised only to the extent that the expenses incurred are eligible to be recovered.
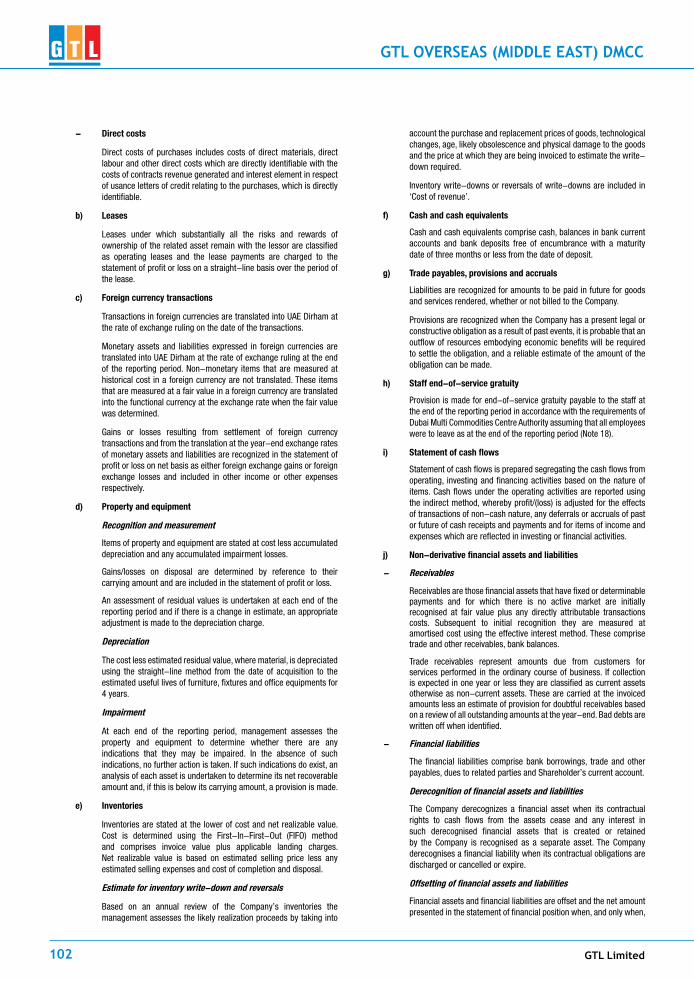
GTL Limited102
GTL Overseas (MiddLe easT) dMCC
- Direct costs
Direct costs of purchases includes costs of direct materials, direct labour and other direct costs which are directly identifiable with the costs of contracts revenue generated and interest element in respect of usance letters of credit relating to the purchases, which is directly identifiable.
b) Leases
Leases under which substantially all the risks and rewards of ownership of the related asset remain with the lessor are classified as operating leases and the lease payments are charged to the statement of profit or loss on a straight-line basis over the period of the lease.
c) foreign currency transactions
Transactions in foreign currencies are translated into UAE Dirham at the rate of exchange ruling on the date of the transactions.
Monetary assets and liabilities expressed in foreign currencies are translated into UAE Dirham at the rate of exchange ruling at the end of the reporting period. Non-monetary items that are measured at historical cost in a foreign currency are not translated. These items that are measured at a fair value in a foreign currency are translated into the functional currency at the exchange rate when the fair value was determined.
Gains or losses resulting from settlement of foreign currency transactions and from the translation at the year-end exchange rates of monetary assets and liabilities are recognized in the statement of profit or loss on net basis as either foreign exchange gains or foreign exchange losses and included in other income or other expenses respectively.
d) property and equipment
recognition and measurement
Items of property and equipment are stated at cost less accumulated depreciation and any accumulated impairment losses.
Gains/losses on disposal are determined by reference to their carrying amount and are included in the statement of profit or loss.
An assessment of residual values is undertaken at each end of the reporting period and if there is a change in estimate, an appropriate adjustment is made to the depreciation charge.
Depreciation
The cost less estimated residual value, where material, is depreciated using the straight-line method from the date of acquisition to the estimated useful lives of furniture, fixtures and office equipments for 4 years.
impairment
At each end of the reporting period, management assesses the property and equipment to determine whether there are any indications that they may be impaired. In the absence of such indications, no further action is taken. If such indications do exist, an analysis of each asset is undertaken to determine its net recoverable amount and, if this is below its carrying amount, a provision is made.
e) inventories
Inventories are stated at the lower of cost and net realizable value. Cost is determined using the First-In-First-Out (FIFO) method and comprises invoice value plus applicable landing charges. Net realizable value is based on estimated selling price less any estimated selling expenses and cost of completion and disposal.
estimate for inventory write-down and reversals
Based on an annual review of the Company’s inventories the management assesses the likely realization proceeds by taking into
account the purchase and replacement prices of goods, technological changes, age, likely obsolescence and physical damage to the goods and the price at which they are being invoiced to estimate the write-down required.
Inventory write-downs or reversals of write-downs are included in ‘Cost of revenue’.
f) cash and cash equivalents
Cash and cash equivalents comprise cash, balances in bank current accounts and bank deposits free of encumbrance with a maturity date of three months or less from the date of deposit.
g) trade payables, provisions and accruals
Liabilities are recognized for amounts to be paid in future for goods and services rendered, whether or not billed to the Company.
Provisions are recognized when the Company has a present legal or constructive obligation as a result of past events, it is probable that an outflow of resources embodying economic benefits will be required to settle the obligation, and a reliable estimate of the amount of the obligation can be made.
h) staff end-of-service gratuity
Provision is made for end-of-service gratuity payable to the staff at the end of the reporting period in accordance with the requirements of Dubai Multi Commodities Centre Authority assuming that all employees were to leave as at the end of the reporting period (Note 18).
i) statement of cash flows
Statement of cash flows is prepared segregating the cash flows from operating, investing and financing activities based on the nature of items. Cash flows under the operating activities are reported using the indirect method, whereby profit/(loss) is adjusted for the effects of transactions of non-cash nature, any deferrals or accruals of past or future of cash receipts and payments and for items of income and expenses which are reflected in investing or financial activities.
j) Non-derivative financial assets and liabilities
- receivables
Receivables are those financial assets that have fixed or determinable payments and for which there is no active market are initially recognised at fair value plus any directly attributable transactions costs. Subsequent to initial recognition they are measured at amortised cost using the effective interest method. These comprise trade and other receivables, bank balances.
Trade receivables represent amounts due from customers for services performed in the ordinary course of business. If collection is expected in one year or less they are classified as current assets otherwise as non-current assets. These are carried at the invoiced amounts less an estimate of provision for doubtful receivables based on a review of all outstanding amounts at the year-end. Bad debts are written off when identified.
- financial liabilities
The financial liabilities comprise bank borrowings, trade and other payables, dues to related parties and Shareholder’s current account.
Derecognition of financial assets and liabilities
The Company derecognizes a financial asset when its contractual rights to cash flows from the assets cease and any interest in such derecognised financial assets that is created or retained by the Company is recognised as a separate asset. The Company derecognises a financial liability when its contractual obligations are discharged or cancelled or expire.
offsetting of financial assets and liabilities
Financial assets and financial liabilities are offset and the net amount presented in the statement of financial position when, and only when,

GTL Overseas (MiddLe easT) dMCC
29th annual report 2016-17 103
the Company has a legal right to offset the amounts and intends either to settle them on a net basis or to realise the asset and settle the liability simultaneously.
4 risk management
The Company’s activities expose it to a variety of financial risks such as credit risk, market prices risk and liquidity risks as follows:
a) credit risk
This is the risk of financial loss to the Company if a customer or a counterparty to a financial instrument fails to meet its contractual obligations and arises principally from the Company’s customers, related parties and banks.
The credit risk, where relevant is explained in the notes on the related account balances, namely trade receivables {Note 15 (a)}, dues from related parties (Note 20) and cash and bank (Note 16).
b) Market price risk
These are the risks arising from changes in market prices, such as foreign exchange rates and interest rates which would affect the Company’s income or the value of its holdings of financial instruments. The management strives to manage market risk exposures within acceptable parameters, while optimising the return.
- currency risk
The currency risk, where relevant is explained in the note on the related account balances, namely trade receivables {Note 15 (b)} and bank balances (Note 16).
c) Liquidity risk
This is the risk where the Company may encounter difficulty in meeting its financial liabilities that are either settled in cash or exchange of another financial asset.
Management monitors its cash requirements to ensure adequacy of funding from the Parent company. If necessary, funds are arranged from the Shareholder and Group companies to ensure that the payment obligations are met on time. For the purpose of effective management of the working capital, the Company strives to strike a balance between the credit period allowed by its suppliers with that allowed to its customers and the inventory holding levels are also kept under constant review to ensure their optimum levels.
5 capital management
Capital consists of share capital, Shareholder’s current account net of accumulated losses, which measured at AED 2,762,361 as at the end of the reporting period. The Company strives to maintain financial ratios at acceptable levels under the prevailing economic conditions and the risks encountered and to achieve reasonable rate of return to the Parent company.
6 cost of revenue
2016 2015
AeD AED
Direct turnkey project expenses (Note 20) 4,406,606 3,878,117
Provision for slow-moving inventories (Note 14)
- 84,135
Direct labour costs (Note 10) 1,240,863 3,694,621
Vehicle rental charges 1,339 1,612,571
5,648,808 9,269,444
7 other income
2016 2015
AeD AED
Excess provision written back - 228,184
Gain on disposal of property and equipment 2,350 46,400
Miscellaneous income 34,537 5,100
36,887 279,684
8 selling expenses
2016 2015
AeD AED
Staff salaries and benefits (Note 10) 414,213 492,616
Business promotion expenses 192,582 85,500
606,795 578,116
9 Administrative expenses
2016 2015
AeD AED
Staff salaries and benefits (Note 10) 178,485 738,924
Rent 243,723 807,174
Depreciation of property and equipment (Note 12)
75,384 125,596
Communication expenses 55,313 103,329
Group administrative overhead expenses allocated - (Note 20)
- 84,567
Other administrative expenses 636,344 1,166,711
1,189,249 3,026,301
10 staff costs
2016 2015
AeD AED
Staff salaries and benefits 1,793,545 4,888,980
Staff end-of-service gratuity (Note 18) 40,016 37,181
1,833,561 4,926,161
included under:
Cost of revenue (Note 6) 1,240,863 3,694,621
Selling expenses (Note 8) 414,213 492,616
Administrative expenses (Note 9) 178,485 738,924
1,833,561 4,926,161
11 Other expenses
2016 2015
AeD AED
Bad debts written off 2,258,831 -
Provision for doubtful debts {Note 15 (c)} 1,451,766 -
Foreign exchange losses (net) 387,492 181,381
4,098,089 181,381

GTL Limited104
GTL Overseas (MiddLe easT) dMCC
12 property and equipment
(furniture, fixtures and office equipment)
2016 2015
AeD AED
Opening balance 386,280 367,354
Accumulated depreciation (163,245) (96,508)
Closing balance 223,035 270,846
reconciliation of net book values
Opening balance 270,846 78,793
Additions during the year 27,573 317,649
Disposal during the year
- Cost (8,647) (59,028)
- Accumulated depreciation 8,647 59,028
Depreciation for the year (Note 9) (75,384) (125,596)
Closing balance 223,035 270,846
13 Non-current financial assets
These represent deposits with the DMCC for issuance of staff visas. These deposits are intended to be held for period longer than one year from the end of reporting period.
14 inventories
2016 2015
AeD AED
Goods held for consumption 84,135 84,135
Less: Provision for slow-moving inventories (Note 6)
(84,135) (84,135)
- -
15 trade and other receivables
2016 2015
AeD AED
Trade receivables 1,451,766 7,782,371
Less: Provision for doubtful debts (1,451,766) -
Trade receivables (net) - 7,782,371
Deposits 1,573,790 1,652,500
Advance to a supplier {(a) (iii)} 49,000 3,118,930
Staff advances 22,498 11,929
Receivables from disposal of property and equipment
- 31,550
1,645,288 12,597,280
a) credit risk
i) The Company’s customers are internationally reputed telecommunication services-providing companies. The management regularly monitors the outstanding amounts and follows up for recovery with periodic calls and visits to the customers.
ii) At the end of reporting period, the trade receivables were due from a customer situated in Sultanate of Oman (previous year: five customers, out of which 77% due from a related party and 19% was due from a customer situated in Sultanate
of Oman). During the year, an amount of AED 10,774,745 due from a related party based in Singapore (in the previous year: an amount of AED 5,840,000 due from a related party based in Kingdom of Saudi Arabia) was transferred to the Shareholder (Note 20 & Page 6).
iii) The advance to a supplier has been cleared subsequent to the end of reporting period on receipt of goods.
b) currency risk
The Company sells services in foreign currencies. Exposure is minimized where possible by denominating such transactions in US Dollar to which the UAE Dirham is fixed. At the end of the reporting period, there was no exchange rate risk as all trade receivables are either denominated in UAE Dirham or US Dollar.
c) impairment
The age analysis of trade receivables as at the end of the reporting period was as follows:
2016 2015
AeD AED
Neither past-due nor impaired (0-180 days)
- 6,295,205
Past-due but not considered impaired
- 180 - 365 days - 28,749
Above one year (refer Note below) 1,451,766 1,458,417
total 1,451,766 7,782,371
The balance of AED 1,451,766 in the age-band of ‘Above one year’ is due from a customer in the Sultanate of Oman and the management has decided to provide for this debt as doubtful of recovery.
16 cash and cash equivalents
2016 2015
AeD AED
Cash on hand 11,310 17,882
Bank balances in current accounts 1,538,329 960,710
1,549,639 978,592
The Company’s bank accounts are placed with reputed banks. Bank balances include AED 160,599 denominated in Great Britain Pound Sterling (previous year: AED 49,511).
17 share capital
2016 2015
AeD AED
50 shares of AED 1,000 each 50,000 50,000
18 provision for staff-of-service gratuity
2016 2015
AeD AED
Opening balance 46,026 43,825
Add: Provision for the year (Note 10) 40,016 37,181
Less: Paid during the year - (34,980)
Closing balance 86,042 46,026

GTL Overseas (MiddLe easT) dMCC
29th annual report 2016-17 105
19 trade and other payables
2016 2015
AeD AED
Trade payables 21,603 818,871
Other payables and accrued expenses 306,245 448,215
327,848 1,267,086
Other payables and accrued expenses includes provision for cost of revenue of AED 120,202 (previous year: AED 215,547).
20 related parties
Related parties which fall within the definition of a related party as contained in International Accounting Standard 24 comprises the Parent company, the Ultimate Holding company and fellow subsidiaries, being the companies under common ownership and common management control. At the end of the reporting period, significant balances with related parties were as follows:
fellow subsidiaries
Included in trade receivables:
GTL Singapore Pte. Ltd., Singapore {Note 15 (a) (ii)}
- 5,977,550
Disclosed as due from a related party:
GTL Saudi Arabia Company Limited, KSA - 2,245,401
Disclosed as dues to related parties:
GTL Limited, India (Ultimate Holding company)
224,778 224,204
GTL ADACELL India Limited, India 113,686 113,686
338,464 337,890
All the related party balances are interest-free and payable on demand, hence classified as current assets and current liabilities as applicable.
parent company
Current account (Page 6) 12,864,767 22,699,501
Significant transactions with related parties during the year which the management considers to be in the normal course of business and at terms which correspond with the terms with third parties were as follows:
fellow subsidiaries
Revenue 9,548,351 8,197,608
parent company
Direct turnkey project expenses included in cost of revenue (Note 6)
4,380,000 -
Fellow subsidiary balance included in trade receivables transferred {Note 15 (a) (ii) & Page 6}
10,774,745 5,840,000
Group administrative overhead expenses allocated (Note 9)
- 84,567
Credit balance of a fellow subsidiary assumed (Page 6)
- 18,551,691
21 fair values of financial instruments
The fair value of a financial instrument is the amount for which an asset could be exchanged, or a liability settled, between knowledgeable, willing parties in an arm’s length transaction.
The fair value of the financial assets and financial liabilities which are required to be carried at cost or at amortised cost approximates to their carrying values.
22 Approval of financial statements
These financial statements were approved by the Board of Directors and authorised for issue on 26 February 2017.
For GtL overseas (Middle east) DMcc
_______________ _______________
Vipulkumar patel sandhya patel
Director Director

GTL Limited106
GTL EuropE LimiTEd
Strategic report for the Year ended 31 december 2016The Directors present their strategic report for the year ended 31 December 2016.
principal activity
The principal activity of the company is telecommunication engineering services and consultancy.
fair review of the business
Throughout the year, even though there have been challenges in the market place as a result of Operator strategy changes, price pressure and technology deployment delays, the Company has performed well by having a stable business. The existing contracts have been sustained, and new customers added, giving a sound platform for next level of growth.
The turnover of the Company increased from £22,423,090 in year 2015 to £24,472,232 in year 2016, with operating profit increasing from £1,686,333 to £1,813,256.
Key performance indicators (Kpis)
KPIs used by Management are Gross Margin and Operating Profit, which can be determined from the information on Page 8.
marketplace overview
There has been significant amount of business available through network change in addition to new technology being implemented – such as 4G / LTE. This includes re-dimensioning the existing networks, or changing the current infrastructure to meet increasing customer needs. There has been lot of buzz around 5G, though it is assumed that this will not be rolled out until 2018 at the earliest. The market is seen bracing for IOT and it will be an interesting area for the Company to carve a niche in the sphere of Device Management, Sensor Management, Data Analytics etc.
The Company has focussed particularly this year on expanding its customer base and also defending numerous rounds of pricing pressures from its customers. In continuation from the previous year where we are now focussed on supporting Tier 1 Operators, particularly where we grew EE as a direct customer for significant business levels as compared to previous years.
Nokia remains the largest customer to date in the UK, though EE has overtaken Ericsson as our second largest customer.
The Company is extremely pleased to have Telefónica (O2) & Sure Telecom as new direct customers.
market risk
The main risks facing the Company are:
• Continualpricepressurefromendcustomers
• Lackofnewbusinessenteringthemarket-newtechnologydeployment5Getc.
• Existingcustomersoffshoringorsettingupsubsidiarycompaniestosupportthe work in direct competition
• Theextendedpaymenttermsrequestedbycustomers
financial risk
The Company has got positive cash flow and payment terms with major customers as well as with contractors are fixed. The Company is not expecting a change to those payment terms, hence do not foresee any major financial risk in the immediate future.
principal risks and uncertainties
The directors monitor performance through the production of management accounts on a monthly basis. Additionally, the directors monitor key performance indicators on a monthly basis to ensure they are within acceptable parameters. These include gross margins, operating profits, earnings before interest, tax, working capital, customer service and cash flows from operating activities.
future developments
There is consolidation happening in the telecom sector. Although we do not expect any reduction in spending by telecom operators, we are not expecting a major surge either, because most operators are have been cautious in spending money for new technology roll out. Operators will be looking to consolidate to fewer vendors, but the Company is well placed to take advantage of any opportunities arising out of these developments.
Strategy
InthesubsequentyearstheCompanywillfocusonstability,growthandinnovationon a strategic level as follows:
Stability
The company aims to:
• Ensuresecurityandstabilityofexistingprojects
• Expandtheexistingmodeltochallengecompetitorscarryingoutsimilarbusiness
• Identifynewareasofbusinessandshapethebusinessaccordingly
growth
The company aims to:
• Set up a Professional Services Division to addressmanpower requirementsacross diverse projects
• Sellsimilarservicestoothercustomers
• Expandoncurrentprojects
• Focusonhigh-endservicesinNetworkPlanning,Design&Optimisation
• Tie-upsinpipelinewithApplicationProviders
innovation
The Company aims to:
• Beatruewhitelabelserviceprovider
• Position new offerings in liaison with software/application providers forOptimisation,BenchmarkingandCustomer
experience management
• IdentifySynergiesandConsolidateManagedServices
• Preparecutting-edgeofferingsinthefieldofIOTandAutomation
ApprovedbytheBoardon8March2017andsignedonitsbehalfby:
mr neeraj SatpallDirector

GTL EuropE LimiTEd
29th Annual report 2016-17 107
directorS’ report for the Year ended 31 december 2016The Directors present their report and the financial statements for the year ended 31 December 2016.
directors of the company
The directors who held office during the year were as follows:
Mr Neeraj Satpall
Mr Pinakin Gandhi
dividends
Dividends proposed at the year end date amounted to £1,000,000 (2015: £600,000).
future developments
Please refer to the Strategic Report on page 3.
financial instruments
Please refer to the Accounting policies.
disclosure of information to the auditors
Each Director has taken steps that they ought to have taken as a Director in order to make themselves aware of any relevant audit information and to establish that the Company’s auditors are aware of that information. The Directors confirm that there is no relevant information that they know of and of which they know the auditors are unaware.
reappointment of auditors
In accordance with section 485 of the Companies Act 2006, a resolution for the re-appointment of Kajaine Limited as auditors of the company is to be proposed at the forthcoming Annual General Meeting.
ApprovedbytheBoardon8March2017andsignedonitsbehalfby:
mr neeraj SatpallDirector
The Directors acknowledge their responsibilities for preparing the Strategic Report, Directors’ Report and the financial statements in accordance with applicable law and regulations.
Company law requires the Directors to prepare financial statements for eachfinancial year. Under that law the Directors have elected to prepare the financial statements in accordance with United Kingdom Generally Accepted Accounting Practice (United Kingdom Accounting Standards and applicable law), including FinancialReportingStandard102,‘TheFinancialReportingStandardapplicableinthe UK and Republic of Ireland’. Under company law the Directors must not approve the financial statements unless they are satisfied that they give a true and fair view of the state of affairs of the Company and of the profit or loss of the Company for thatperiod.Inpreparingthesefinancialstatements,theDirectorsarerequiredto:
• selectsuitableaccountingpoliciesandapplythemconsistently;
Statement of directorS’ reSponSibilitieS in reSpect of Strategic report, directorS’ report and the financial StatementS
• makejudgementsandaccountingestimatesthatarereasonableandprudent;
• statewhetherapplicableUKAccountingStandardshavebeenfollowed,subjecttoanymaterialdeparturesdisclosedandexplainedinthefinancialstatements;and
• prepare the financial statements on the going concern basis unless it isinappropriate to presume that the Company will continue in business.
The Directors are responsible for keeping adequate accounting records thatare sufficient to show and explain the Company’s transactions and disclose with reasonable accuracy at any time the financial position of the Company and enable them to ensure that the financial statements comply with the Companies Act 2006. They are also responsible for safeguarding the assets of the Company and hence for taking reasonable steps for the prevention and detection of fraud and other irregularities.

GTL Limited108
GTL EuropE LimiTEd
independent auditorS’ reportto the members of gtl europe limited
We have audited the financial statements of GTL Europe Limited for the year ended 31 December 2016, set out on pages 8 to 22. The financial reporting framework that has been applied in their preparation is applicable law and United Kingdom Accounting Standards (United Kingdom Generally Accepted Accounting Practice) including Financial Reporting Standard 102, ‘ The Financial Reporting Standardapplicable in the UK and Republic of Ireland’.
This report is made solely to the Company’s members, as a body, in accordance with Chapter 3 of Part 16 of the Companies Act 2006. Our audit work has been undertaken sothatwemightstatetotheCompany’smembersthosematterswearerequiredto state to them in an auditor’s report and for no other purpose. To the fullest extent permitted by law, we do not accept or assume responsibility to anyone other than the Company and the Company’s members as a body, for our audit work, for this report, or for the opinions we have formed.
respective responsibilities of directors and auditor
As explained more fully in the Statement of Directors’ Responsibilities in respect of Strategicreport,Directors’ReportandtheFinancialstatements(setoutonpage5),the Directors are responsible for the preparation of the financial statements and for being satisfied that they give a true and fair view. Our responsibility is to audit and express an opinion on the financial statements in accordance with applicable law andInternationalStandardsonAuditing(UKandIreland).ThosestandardsrequireustocomplywiththeAuditingPracticesBoard’s(APB’s)EthicalStandardsforAuditorsto the financial statements.
Scope of the audit of the financial statements
An audit involves obtaining evidence about the amounts and disclosures in the financial statements sufficient to give reasonable assurance that the financial statements are free from material misstatement, whether caused by fraud or error. This includes an assessment of: whether the accounting policies are appropriate to theCompany’scircumstancesandhavebeenconsistentlyappliedandadequatelydisclosed; the reasonableness of significant accounting estimates made by theDirectors;and theoverallpresentationof the financialstatements. Inaddition,weread all the financial and non-financial information in the Annual Report to identify material inconsistencies with the audited financial statements and to identify any information that is apparently materially incorrect based on, or materially inconsistent with, the knowledge acquired by us in the course of performing the audit. If webecome aware of any apparent material misstatements or inconsistencies we consider the implications for our report.
opinion on the financial statements
In our opinion the financial statements:
• give a true and fair view of the state of the Company’s affairs as at 31December2016andofitsprofitfortheyearthenended;
• have been properly prepared in accordancewith United KingdomGenerallyAcceptedAccountingPractice;and
• havebeenpreparedinaccordancewiththerequirementsoftheCompaniesAct2006.
opinion on other matter prescribed by the companies act 2006
In our opinion the information given in the Strategic Report and Directors’ Report for the financial year for which the financial statements are prepared is consistent with the financial statements.
matters on which we are required to report by exception
We have nothing to report in respect of the following matters where the Companies Act2006requiresustoreporttoyouif,inouropinion:
• adequateaccountingrecordshavenotbeenkept,orreturnsadequateforouraudithavenotbeenreceivedfrombranchesnotvisitedbyus;or
• thefinancialstatementsarenotinagreementwiththeaccountingrecordsandreturns;or
• certaindisclosuresofDirectors’remunerationspecifiedbylawarenotmade;or
• wehavenotreceivedalltheinformationandexplanationswerequireforouraudit.
amanjit Singh fca(Senior Statutory Auditor)
ForandonbehalfofKajaine Limited,Statutory AuditorKajaine House57-67 High StreetEdgware, HA8 7DD
8 March 2017

GTL EuropE LimiTEd
29th Annual report 2016-17 109
balance Sheet aS at 31 december, 2016
as at 31 dec 2016
As at31 Dec 2015
As at 1 Jan 2015
as at 31 dec 2016
As at31 Dec 2015
As at 1 Jan 2015
inr crores INR Crores INR Crores gbp GBP GBPassetsnon-current assetsProperty,plantandequipment 0.40 0.18 0.10 59,316.00 26,778.00 15,047.00 Capital work-in-progress - - - - - - Investment properties - - - - - - Intangible assets - - - - - - Intangible assets under development - - - - - - Financialassets Investments 0.00 0.00 0.00 2.00 2.00 2.00 Loans - - - - - - Other financial assets - - - - - - Deferred tax assets (net) - - - - - - Other non-current assets - - - - - -
0.40 0.18 0.10 59,318.00 26,780.00 15,049.00
current assetsInventories - 0.02 0.04 - 3,243.00 6,348.00 Financialassets Investments - - - - - - Trade receivables 39.53 23.11 9.15 5,820,597.00 3,478,157.00 1,444,942.00 Cashandcashequivalents 12.02 16.29 34.35 1,770,263.00 2,452,846.00 5,424,943.00 BankbalanceotherthanincludedinCashandcashequivalentsabove - - - - - - Other receivables - - - - - - Loans - - - - - - Other financial assets - - - - - - Current Tax Assets (Net) - - - - - - Other current assets - - - - - -
51.55 39.42 43.53 7,590,860.00 5,934,246.00 6,876,233.00 Assets classified as held for sale
51.55 39.42 43.53 7,590,860.00 5,934,246.00 6,876,233.00 total assets 51.95 39.60 43.63 7,650,178.00 5,961,026.00 6,891,282.00
7,650,126.05 5,960,986.40 6,891,238.37 equity and liabilitiesequityEquityShareCapital 3.40 3.32 3.17 500,000 500,000 500,000 OtherEquity 2.36 3.99 5.75 347,533 601,230 907,679 total equity 5.76 7.32 8.91 847,533 1,101,230 1,407,679
non-current liabilities:Financialliabilities Borrowings - - - - - - Trade payables - - - - - - Other financial liabilities - - - - - - Provisions - - - - - - Deferred tax liabilities (net) - - - - - - Other non-current liabilities - - - - - -
- - - - - -
current liabilities:Financialliabilities Borrowings - - - - - - Trade payables 46.20 32.28 34.72 6,802,645.00 4,859,796.00 5,483,603.00 Other financial liabilities - - - - - - Other current liabilities - - - - - - Provisions - - - - - - Current tax liabilities (net)
46.20 32.28 34.72 6,802,645.00 4,859,796.00 5,483,603.00 total liabilities 46.20 32.28 34.72 6,802,645.00 4,859,796.00 5,483,603.00 total equity and liabilities 51.95 39.60 43.63 7,650,178.00 5,961,026.00 6,891,282.00
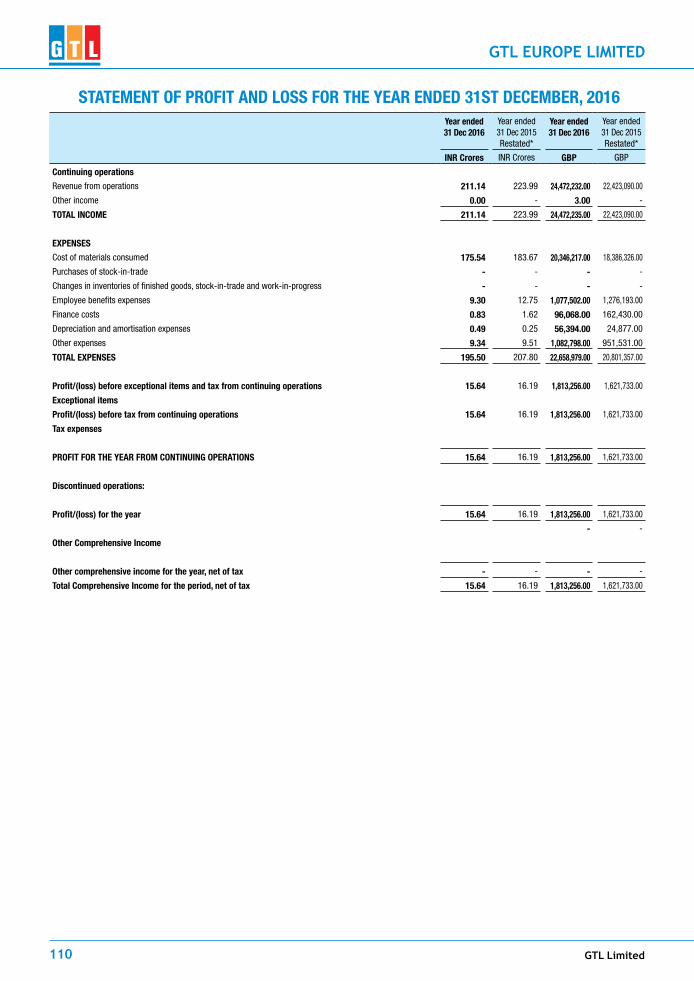
GTL Limited110
GTL EuropE LimiTEd
Statement of Profit and LoSS for the year ended 31St december, 2016 year ended31 dec 2016
Year ended31 Dec 2015 Restated*
year ended31 dec 2016
Year ended31 Dec 2015 Restated*
inr crores INR Crores GbP GBP
continuing operations
Revenue from operations 211.14 223.99 24,472,232.00 22,423,090.00
Other income 0.00 - 3.00 -
totaL income 211.14 223.99 24,472,235.00 22,423,090.00
eXPenSeS
Cost of materials consumed 175.54 183.67 20,346,217.00 18,386,326.00
Purchases of stock-in-trade - - - -
Changes in inventories of finished goods, stock-in-trade and work-in-progress - - - -
Employee benefits expenses 9.30 12.75 1,077,502.00 1,276,193.00
Finance costs 0.83 1.62 96,068.00 162,430.00
Depreciation and amortisation expenses 0.49 0.25 56,394.00 24,877.00
Other expenses 9.34 9.51 1,082,798.00 951,531.00
totaL eXPenSeS 195.50 207.80 22,658,979.00 20,801,357.00
Profit/(loss) before exceptional items and tax from continuing operations 15.64 16.19 1,813,256.00 1,621,733.00
exceptional items
Profit/(loss) before tax from continuing operations 15.64 16.19 1,813,256.00 1,621,733.00
tax expenses
Profit for the year from continUinG oPerationS 15.64 16.19 1,813,256.00 1,621,733.00
discontinued operations:
Profit/(loss) for the year 15.64 16.19 1,813,256.00 1,621,733.00
- -
other comprehensive income
other comprehensive income for the year, net of tax - - - -
total comprehensive income for the period, net of tax 15.64 16.19 1,813,256.00 1,621,733.00

GTL EuropE LimiTEd
29th Annual report 2016-17 111
Statement of changeS in equitY for the Year ended 31 december 2016a. equity Share capital:
no. inr crores
at 1 april 2015 500,000 3.17
Issue of share capital (Note 17) - -
at 31 march 2016 500,000 3.32
Issue of share capital (Note 17) - -
at 31 march 2017 500,000 3.40
b. other equity:
for the year ended 31 december 2016
particulars equity component
of compound financial
instrument (note 18)
reserves & Surplus items of oci
total equity
capital reserve (note 18)
capital redemption
reserve (note 18)
Securities premium account (note 18)
debenture redemption
reserve (note 18)
general reserve
(note 18)
balance in Statement of profit and loss (note 18)
fVtoci reserve
(note 18)
as at 31st december 2015 - - - - - - 3.99 - -
Net Profit for the period 15.64 -
Other comprehensive income -
total comprehensive income - - - - - - 15.64 - -
Dividends - - - - - - 17.27 - -
Transfer from debenture redemption reserve - - - - - - - - -
TransferfromBalanceinStatementofProfitandLoss - - - - - - - - -
Transfer to general reserve - - - - - - - - -
TransfertoBalanceinStatementofProfitandLoss - - - - - - - - -
as at 31 december 2016 - - - - - - 2.36 - -
for the year ended 31 december 2015
particulars equity component
of compound financial
instrument (note 18)
reserves & Surplus items of oci total equitycapital
reserve (note 18)
capital redemption
reserve (note 18)
Securities premium account (note 18)
debenture redemption
reserve (note 18)
general reserve
(note 18)
balance in Statement of profit and loss (note 18)
fVtoci reserve
(note 18)
inr in crores
inr in crores
inr in crores
inr in crores
inr in crores
inr in crores
inr in crores
inr in crores
inr in crores
as at 1st January 2015 - - - - - - 5.75 - -
Net Profit for the period 16.19 -
Other comprehensive income -
total comprehensive income - - - - - - 16.19 - -
Impact of translation of financials into INDAS -
Dividends - - - - - - 17.95 - -
Transfer from debenture redemption reserve - - - - - - - - -
TransferfromBalanceinStatementofProfitandLoss - - - - - - - - -
Transfer to general reserve - - - - - - - - -
TransfertoBalanceinStatementofProfitandLoss - - - - - - - - -
as at 31 december 2015 - - - - - - 3.99 - -
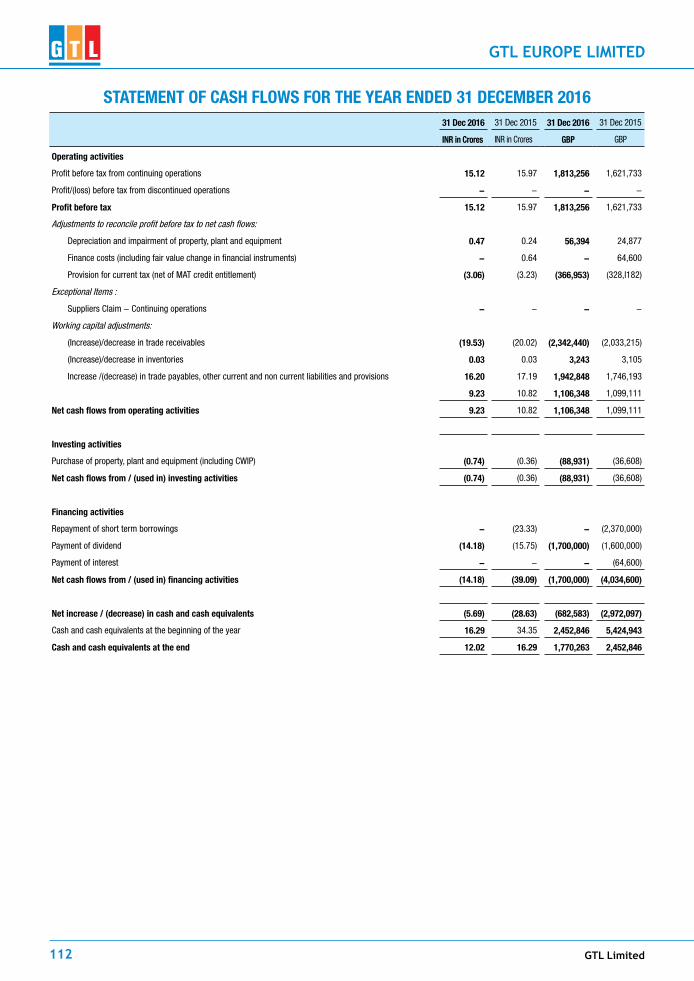
GTL Limited112
GTL EuropE LimiTEd
31 dec 2016 31 Dec 2015 31 dec 2016 31 Dec 2015
inr in crores INR in Crores gbp GBP
operating activities
Profit before tax from continuing operations 15.12 15.97 1,813,256 1,621,733
Profit/(loss) before tax from discontinued operations - - - -
profit before tax 15.12 15.97 1,813,256 1,621,733
Adjustments to reconcile profit before tax to net cash flows:
Depreciationandimpairmentofproperty,plantandequipment 0.47 0.24 56,394 24,877
Financecosts(includingfairvaluechangeinfinancialinstruments) - 0.64 - 64,600
Provision for current tax (net of MAT credit entitlement) (3.06) (3.23) (366,953) (328,l182)
Exceptional Items :
Suppliers Claim - Continuing operations - - - -
Working capital adjustments:
(Increase)/decrease in trade receivables (19.53) (20.02) (2,342,440) (2,033,215)
(Increase)/decrease in inventories 0.03 0.03 3,243 3,105
Increase /(decrease) in trade payables, other current and non current liabilities and provisions 16.20 17.19 1,942,848 1,746,193
9.23 10.82 1,106,348 1,099,111
net cash flows from operating activities 9.23 10.82 1,106,348 1,099,111
investing activities
Purchaseofproperty,plantandequipment(includingCWIP) (0.74) (0.36) (88,931) (36,608)
net cash flows from / (used in) investing activities (0.74) (0.36) (88,931) (36,608)
financing activities
Repayment of short term borrowings - (23.33) - (2,370,000)
Payment of dividend (14.18) (15.75) (1,700,000) (1,600,000)
Payment of interest - - - (64,600)
net cash flows from / (used in) financing activities (14.18) (39.09) (1,700,000) (4,034,600)
net increase / (decrease) in cash and cash equivalents (5.69) (28.63) (682,583) (2,972,097)
Cashandcashequivalentsatthebeginningoftheyear 16.29 34.35 2,452,846 5,424,943
cash and cash equivalents at the end 12.02 16.29 1,770,263 2,452,846
Statement of caSh flowS for the Year ended 31 december 2016
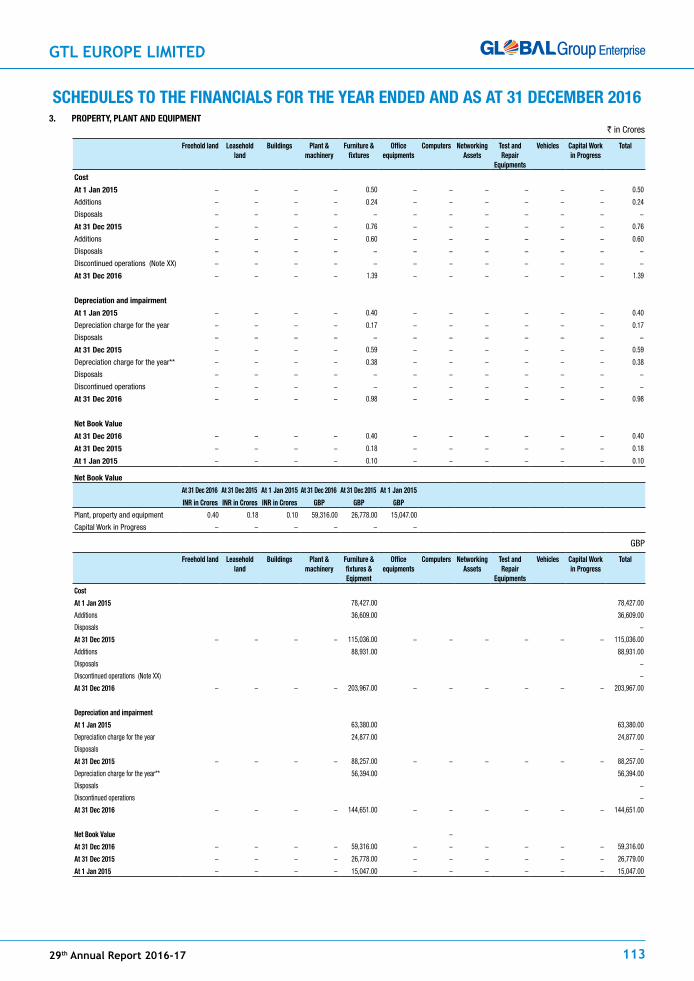
GTL EuropE LimiTEd
29th Annual report 2016-17 113
ScheduleS to the financialS for the Year ended and aS at 31 december 20163. propertY, plant and equipment
` in Crores
freehold land leasehold land
buildings plant & machinery
furniture & fixtures
office equipments
computers networking assets
test and repair
equipments
Vehicles capital work in progress
total
cost
at 1 Jan 2015 - - - - 0.50 - - - - - - 0.50
Additions - - - - 0.24 - - - - - - 0.24
Disposals - - - - - - - - - - - -
at 31 dec 2015 - - - - 0.76 - - - - - - 0.76
Additions - - - - 0.60 - - - - - - 0.60
Disposals - - - - - - - - - - - -
Discontinued operations (Note XX) - - - - - - - - - - - -
at 31 dec 2016 - - - - 1.39 - - - - - - 1.39
depreciation and impairment
at 1 Jan 2015 - - - - 0.40 - - - - - - 0.40
Depreciation charge for the year - - - - 0.17 - - - - - - 0.17
Disposals - - - - - - - - - - - -
at 31 dec 2015 - - - - 0.59 - - - - - - 0.59
Depreciation charge for the year** - - - - 0.38 - - - - - - 0.38
Disposals - - - - - - - - - - - -
Discontinued operations - - - - - - - - - - - -
at 31 dec 2016 - - - - 0.98 - - - - - - 0.98
net book Value
at 31 dec 2016 - - - - 0.40 - - - - - - 0.40
at 31 dec 2015 - - - - 0.18 - - - - - - 0.18
at 1 Jan 2015 - - - - 0.10 - - - - - - 0.10
net book Value
at 31 dec 2016 at 31 dec 2015 at 1 Jan 2015 at 31 dec 2016 at 31 dec 2015 at 1 Jan 2015
inr in crores inr in crores inr in crores gbp gbp gbp
Plant,propertyandequipment 0.40 0.18 0.10 59,316.00 26,778.00 15,047.00
Capital Work in Progress - - - - - -
GBP
freehold land leasehold land
buildings plant & machinery
furniture & fixtures & eqipment
office equipments
computers networking assets
test and repair
equipments
Vehicles capital work in progress
total
cost
at 1 Jan 2015 78,427.00 78,427.00
Additions 36,609.00 36,609.00
Disposals -
at 31 dec 2015 - - - - 115,036.00 - - - - - - 115,036.00
Additions 88,931.00 88,931.00
Disposals -
Discontinued operations (Note XX) -
at 31 dec 2016 - - - - 203,967.00 - - - - - - 203,967.00
depreciation and impairment
at 1 Jan 2015 63,380.00 63,380.00
Depreciation charge for the year 24,877.00 24,877.00
Disposals -
at 31 dec 2015 - - - - 88,257.00 - - - - - - 88,257.00
Depreciation charge for the year** 56,394.00 56,394.00
Disposals -
Discontinued operations -
at 31 dec 2016 - - - - 144,651.00 - - - - - - 144,651.00
net book Value -
at 31 dec 2016 - - - - 59,316.00 - - - - - - 59,316.00
at 31 dec 2015 - - - - 26,778.00 - - - - - - 26,779.00
at 1 Jan 2015 - - - - 15,047.00 - - - - - - 15,047.00

GTL Limited114
GTL EuropE LimiTEd
7. financial aSSetS
31 dec 2016 31 Dec 2015 1 Jan 2015 31 dec 2016 31 Dec 2015 1 Jan 2015
inr in crores INR in Crores INR in Crores gbp GBP GBP
investments
non- trade
unquoted
InvestmentinEquityInstruments-Subsidiaries(iGTLMyanmar:Ltd) 0.00 0.00 0.00 2.00 2.00 2.00
total investments 0.00 0.00 0.00 2.00 2.00 2.00
9. inVentorieS
31 dec 2016 31 Dec 2015 1 Jan 2015 31 dec 2016 31 Dec 2015 1 Jan 2015
inr in crores INR in Crores INR in Crores gbp GBP GBP
Finishedgoods(atlowerofcostandnetrealisablevalue) - 0.02 0.04 - 3,243.00 6,348
total inventories at the lower of cost and net realisable value - 0.02 0.04 - 3,243.00 6,348.00
11. trade and other receiVableS
31 dec 2016 31 Dec 2015 1 Jan 2015 31 dec 2016 31 Dec 2015 1 Jan 2015
inr in crores INR in Crores INR in Crores gbp GBP GBP
trade receivables
Secured, considered good
Unsecured, considered good 31.87 17.09 5.82 4,693,262.00 2,572,085.00 919,620.00
31.87 17.09 5.82 4,693,262.00 2,572,085.00 919,620.00
other receivables
Secured, considered good
Unsecured, considered good 7.66 6.02 3.33 1,127,335.00 906,072.00 525,322.00
7.66 6.02 3.33 1,127,335.00 906,072.00 525,322.00
total trade receivables 39.53 23.11 9.15 5,820,597.00 3,478,157.00 1,444,942.00
12. caSh and caSh equiValentS
31 dec 2016 31 Dec 2015 1 Jan 2015 31 dec 2016 31 Dec 2015 1 Jan 2015
inr in crores INR in Crores INR in Crores gBP GBP GBP
Balanceswithbanks
In current accounts 12.02 16.29 34.35 1,770,263.00 2,452,846.00 5,424,943.00
12.02 16.29 34.35 1,770,263.00 2,452,846.00 5,424,943.00
14. Share capital
authorised Share capital
equity shares
no. inr in crores gbp
at 1 January 2015 500,000 3.17 500,000
Increase / (decrease) during the year - - -
at 31 december 2015 500,000 3.32 500,000
Increase / (decrease) during the year - - -
at 31 december 2016 500,000 3.40 500,000

GTL EuropE LimiTEd
29th Annual report 2016-17 115
issued equity capital
no. inr in crores gbp
at 1 Jan 2015 500,000 3.17 500,000
Changes during the year - - -
at 31 dec 2015 500,000 3.32 500,000
Changes during the year - - -
at 31 dec 2016 500,000 3 .40 500,000
15. other equitY
balance in Statement of profit and loss
inr in crores gbp
at 1 Jan 2015 5.75 907,679
Add: Profit during the year (2.04) (306,449)
at 31 dec 2015 3.99 601,230
Add: Profit during the year (1.72) (253,697)
at 31 dec 2016 2.36 347,533
total other equity
at 1 Jan 2015 5.75 907,679
at 31 dec 2015 3.99 601,230
at 31 dec 2016 2.36 347,533
20. trade paYableS
31 december 2016
31 december 2015
31 december 2016
31 december 2015
inr in crores inr in crores gbp gbp
Trade payables 32.28 34.72 6,802,645 4,859,796
32.28 34.72 6,802,645 4,859,796

GTL Limited116
GTL EuropE LimiTEd
29. reVenue from operationS
31 dec 2016
31 dec 2015
31 dec 2016
31 dec 2015
inr in crores inr in crores gbp gbp
Rendering of Services - -
Telecom services 211.14 223.99 24,472,232.00 22,423,090.00
Others - -
211.14 223.99 24,472,232.00 22,423,090.00
30. other income
31 dec 2016
31 dec 2015
31 dec 2016
31 dec 2015
inr in crores inr in crores gbp gbp
Other non-operating income ( Dividend ) 0.00 - 3.00 -
0.00 - 3.00 -
31. coSt of materialS conSumed
31 dec 2016
31 dec 2015
31 dec 2016
31 dec 2015
inr in crores inr in crores gbp gbp
raw material consumed - - - -
Inventory at the beginning of the year - - - -
Add: Purchases 175.54 183.67 20,346,217.00 18,386,326.00
175.54 183.67 20,346,217.00 18,386,326.00
Less: inventory at the end of the year - - - -
Cost of raw material and components consumed 175.54 183.67 20,346,217.00 18,386,326.00
34. emploYee benefitS eXpenSeS
31 dec 2016
31 dec 2015
31 dec 2016
31 dec 2015
inr in crores inr in crores gbp gbp
Salaries, wages and bonus 7.93 11.13 919,658.00 1,114,573.00
Contribution to provident and other funds 0.97 1.12 112,567.00 111,921.00
Staff welfare expense 0.26 0.34 30,482.00 33,864.00
Recruitment and training 0.13 0.16 14,795.00 15,835.00
9.30 12.75 1,077,502.00 1,276,193.00
35. finance coStS
31 dec 2016
31 dec 2015
31 dec 2016
31 dec 2015
inr in crores inr in crores gbp gbp
Interest
- On fixed period loan - 0.65 - 64,600.00
- Others 0.83 0.98 95,856.00 97,790.00
Exchange difference to the extent considered as an adjustment to borrowing cost 0.00 0.00 212.00 40.00
total finance cost 0.83 1.62 96,068.00 162,430.00

GTL EuropE LimiTEd
29th Annual report 2016-17 117
36. depreciation and amortization eXpenSe
31 dec 2016
31 dec 2015
31 dec 2016
31 dec 2015
inr in crores inr in crores gbp gbp
Depreciation of tangible assets (note 3) 0.49 0.25 56,394.00 24,877.00
0.49 0.25 56,394.00 24,877.00
37. other eXpenSeS
31 dec 2016
31 dec 2015
31 dec 2016
31 dec 2015
inr in crores inr in crores gbp gbp
Repairs and maintenance
Plant and machinery 0.47 0.57 54,268.00 56,739.00
Others 0.40 0.20 46,462.00 20,277.00
Other insurance 0.31 0.34 35,934.00 34,034.00
Non network rent 1.11 1.09 129,000.00 109,305.00
Rates and taxes 0.19 0.22 21,505.00 21,823.00
Electricity 0.04 0.03 4,689.00 3,328.00
Printing and stationery 0.06 0.12 6,613.00 12,169.00
Communication expenses 0.26 0.29 29,692.00 28,749.00
Travelling and conveyance 0.38 0.65 44,353.00 65,227.00
Bankcharges 0.00 0.12 15.00 11,780.00
Directors’ sitting fees / Management Charges 3.63 4.54 420,626.00 454,882.00
Legal and professional charges 1.74 0.65 201,893.00 64,603.00
Audit fees 0.19 0.27 21,750.00 27,300.00
Miscellaneous expenses 0.57 0.41 65,998.00 41,315.00
9.34 9.51 1,082,798.00 951,531.00
payments to the auditor:
as auditor
Audit fee 0.15 0.16 17,500.00 16,500.00
in other capacity:
Taxation matters 0.01 0.00 750.00 500.00
Company law matters 0.03 0.03 3,500.00 3,000.00
Other services (certification fees) - 0.07 7,300.00
0.19 0.27 21,750.00 27,300.00

GTL Limited118
GTL EuropE LimiTEd
1 general information\
The company is a private company limited by share capital incorporated in UK.
The address of its registered office is:
Global House, Spitfire Close ErmineBusinessPark Huntingdon PE29 6YA
ThesefinancialstatementswereauthorisedforissuebytheBoardon8March2017.
2 accounting policies
Summary of significant accounting policies and key accounting estimates
The principal accounting policies applied in the preparation of these financial statements are set out below. These policies have been consistently applied to all the years presented, unless otherwise stated.
Statement of compliance
ThesefinancialstatementshavebeenpreparedinaccordancewithapplicableUnitedKingdomaccountingstandards,includingFinancialReportingStandard102‘TheFinancialReportingStandardapplicableintheUKandRepublicofIreland’(FRS102),andtheCompaniesAct2006.
ThisisthefirstyearinwhichthefinancialstatementshavebeenpreparedunderFRS102.Refertonote24foranexplanationofthetransition.
ThecompanyhastakenadvantageoftheexemptioninFRS102fromtherequirementtoproduceacashflowstatementonthegroundsthatitisasubsidiaryundertakingwhere 90% or more of the voting rights are held within the group.
basis of preparation
These financial statements have been prepared using the historical cost convention except that as disclosed in the accounting policies certain items are shown at fair value.
exemption from preparing group accounts
The financial statements contain information about GTL Europe Limited as an individual company and do not contain consolidated financial information as the parent of a group.
Thecompany isexemptundersection401of theCompaniesAct2006 fromtherequirement toprepareconsolidated financialstatementsas itand itssubsidiaryundertakings are included by full consolidation in the consolidated financial statements of its parent, GTL International Limited, a company incorporated in India.
revenue recognition
The turnover shown in the profit and loss account represents amounts invoiced during the year exclusive of Value Added Tax. Revenue from services rendered is recognised as the service is performed. Income from Turnkey projects is recognised as a percentage and in proportion to work completion. However, in cases of contracts where consideration is separately defined/identified for supply of goods/materials whose distinct identity remains even after project completion, revenue is recognised based on delivery at site to the customers. In case of fixed-price contracts, revenue is recognised based on the milestones achieved as specified in the contracts.
foreign currency transactions and balances
functional and presentational currency
The company’s functional and presentational currency is UK Sterling.
transactions and balances
Transactions in foreign currencies are recorded at the exchange rate ruling at the date of the transaction. Monetary assets and liabilities denominated in foreign currencies are retranslated at the closing rates at the balance sheet date. All exchange differences are included in the profit and loss account.
tax
The tax expense for the period comprises current tax. Tax is recognised in profit or loss, except that a change attributable to an item of income or expense recognised as other comprehensive income is also recognised directly in other comprehensive income.
The current income tax charge is calculated on the basis of tax rates and laws that have been enacted or substantively enacted by the reporting date in the countries where the company operates and generates taxable income.
tangible assets
Tangibleassetsarestatedinthestatementoffinancialpositionatcost,lessanysubsequentaccumulateddepreciationandsubsequentaccumulatedimpairmentlosses.
Thecostoftangibleassetsincludesdirectlyattributableincrementalcostsincurredintheiracquisitionandinstallation.
depreciation
Depreciation is charged so as to write off the cost of assets, other than land and properties under construction over their estimated useful lives, as follows:
asset class depreciation method and rate
Fixtures,fittingsandequipment 50% Straight line basis
investments
Fixedassetinvestmentsarestatedathistoricalcostlessprovisionforanydiminutioninvalue.
noteS on the accountS for the Year ending december 31,2016

GTL EuropE LimiTEd
29th Annual report 2016-17 119
cash and cash equivalents
Cashandcashequivalentscomprisecashonhandandcalldeposits,andothershort-termhighlyliquidinvestmentsthatarereadilyconvertibletoaknownamountofcash and are subject to an insignificant risk of change in value.
trade debtors
Trade debtors are amounts due from customers for merchandise sold or services performed in the ordinary course of business.
Tradedebtorsarerecognisedinitiallyatthetransactionprice.Theyaresubsequentlymeasuredatamortisedcostusingtheeffectiveinterestmethod,lessprovisionforimpairment. A provision for the impairment of trade debtors is established when there is objective evidence that the Company will not be able to collect all amounts due according to the original terms of the receivables.
Stocks
Stock is valued at the lower of cost and net realisable value, after due regard for obsolete and slow moving stocks. Net realisable value is based on selling price less anticipated costs to completion and selling costs
trade creditors
Tradecreditorsareobligationstopayforgoodsorservicesthathavebeenacquiredintheordinarycourseofbusinessfromsuppliers.Accountspayableareclassifiedas current liabilities if the Company does not have an unconditional right, at the end of the reporting period, to defer settlement of the creditor for at least twelve months after the reporting date. If there is an unconditional right to defer settlement for at least twelve months after the reporting date, they are presented as non-current liabilities.
Tradecreditorsarerecognisedinitiallyatthetransactionpriceandsubsequentlymeasuredatamortisedcostusingtheeffectiveinterestmethod.
Share capital
Ordinarysharesareclassifiedasequity.Equityinstrumentsaremeasuredatthefairvalueofthecashorotherresourcesreceivedorreceivable,netofthedirectcostsofissuingtheequityinstruments.Ifpaymentisdeferredandthetimevalueofmoneyismaterial,theinitialmeasurementisonapresentvaluebasis.
dividends
Dividend distribution to the company’s shareholders is recognised as a liability in the financial statements in the reporting period in which the dividends are declared.
defined contribution pension obligation
A defined contribution plan is a pension plan under which fixed contributions are paid into a pension fund and the Company has no legal or constructive obligation to pay further contributions even if the fund does not hold sufficient assets to pay all employees the benefits relating to employee service in the current and prior periods.
Contributions to defined contribution plans are recognised as employee benefit expense when they are due. If contribution payments exceed the contribution due for service, the excess is recognised as a prepayment.
financial instruments
The company only enters into basic financial instruments transactions that result in the recognition of financial assets and liabilities like trade and other debtors and creditors, loans from banks and other third parties and loans from related parties.
Debt instruments (other than those wholly repayable or receivable within one year), including loans and other debtors and creditors, are initially measured at present valueofthefuturecashflowsandsubsequentlyatamortisedcostusingtheeffectiveinterestmethod.
Debtinstrumentsthatarepayableorreceivablewithinoneyear,typicallytradecreditorsordebtors,aremeasured,initiallyandsubsequently,attheundiscountedamountof the cash or other consideration, expected to be paid or received. However, if the arrangements of a short-term instrument constitute a financing transaction, like the payment of a trade debt deferred beyond normal business terms of financed at a rate of interest that is not a market rate or in case of an out-right short term loan not at a market rate, the financial asset or liability is measured, initially, at the present value of the future cash flow discounted at a market rate of interest for a similar debt instrumentandsubsequentlyatamortisedcost.
Financialassets thataremeasuredatcostandamortisedcostareassessedat theendofeachreportingperiod forobjectiveevidenceof impairment. Ifobjectiveevidence of impairment is found, an impairment loss if recognised in the Profit and loss account.
Forfinancialassetsmeasuredasamortisedcost,theimpairmentlossismeasuredasthedifferencebetweenanasset’scarryingamountandthepresentvalueofestimated cash flows discounted at the asset’s original effective interest rate. If a financial asset has a variable interest rate, the discounted rate for measuring any impairment loss is the current effective interest rate determined under the contract.
Forfinancialassetsmeasuredascostlessimpairment,theimpairmentlossismeasuredasthedifferencebetweenanasset’scarryingamountandbestestimate,whichis an approximation of the amount that the company would receive for the asset if it were to be sold at the balance sheet date.
FinancialassetsandliabilitiesareoffsetandthenetamountreportedintheBalancesheetwhenthereisanenforceablerighttosetofftherecognisedamountsandthere is an intention to settle on a net basis or to realise the asset and settle the liability simultaneously.
3 revenue
The analysis of the company’s revenue for the year from continuing operations is as follows:
Year ended 31 december 2016
£
31 december 2014 to
31 december 2015 £
Rendering of services 24,472,232 22,423,090

GTL Limited120
GTL EuropE LimiTEd
The analysis of the company’s turnover for the year by market is as follows:
Year ended 31 december 2016
£
31 december 2014 to
31 december 2015 £
UK 8,422,233 5,019,455
Europe 16,049,999 17,403,635
24,472,232 22,423,090
4 operating profit
arrived at after charging/(crediting)
Year ended 31 december 2016
£
31 december 2014to
31 december 2015 £
Depreciation expense 56,394 24,877
Foreignexchangelosses 212 40
Operating lease expense - plant and machinery 33,131 42,553
5 interest payable and similar charges
Year ended 31 december 2016
£
31 december 2014to
31 december 2015 £
Interest expense on other finance liabilities - 64,600
6 Staff costs
The aggregate payroll costs (including directors’ remuneration) were as follows:
Year ended 31 december 2016
£
31 december 2014to
31 december 2015 £
Wages and salaries 3,555,560 3,773,660
Social security costs 412,513 411,346
Other short-term employee benefits 22,471 17,606
Pension costs, defined contribution scheme 31,541 31,817
Redundancy costs 12,793 13,400
Other employee expense 10,013 18,693
4,044,891 4,266,522
The average number of persons employed by the company (including directors) during the year, analysed by category was as follows:
Year ended 31 december 2016
£
31 december 2014to
31 december 2015 £
Production 62 65
Administration and support 11 9
Sales 4 5
77 79

GTL EuropE LimiTEd
29th Annual report 2016-17 121
7 directors’ remuneration
The directors’ remuneration for the year was as follows:
Year ended 31 december 2016
£
31 december 2014to
31 december 2015 £
Remuneration 221,371 219,182
In respect of the highest paid director:
Year ended 31 december 2016
£
31 december 2014to
31 december 2015 £
Remuneration 221,371 219,182
8 auditors’ remuneration
Year ended 31 december 2016
£
31 december 2014to
31 december 2015 £
Audit of the financial statements 17,500 16,500
Other fees to auditors
Taxation compliance services 750 500
All other assurance services 3,500 3,000
4,250 3,500
9 taxation
Tax charged/(credited) in the income statement
Year ended 31 december 2016
£
31 december 2014to
31 december 2015 £
Current taxation
UK corporation tax 366,953 328,182
The tax on profit before tax for the year is higher than the standard rate of corporation tax in the UK (2015 - higher than the standard rate of corporation tax in the UK) of 20% (2015 - 20%).
The differences are reconciled below:
Year ended 31 december 2016
£
31 december 2014to
31 december 2015 £
Profit before tax 1,813,256 1,621,733
Corporation tax at standard rate 362,651 324,347
Effect of expense not deductible in determining taxable profit (tax loss) 13,326 5,027
Tax increase (decrease) from effect of capital allowances and depreciation (8,976) (5,232)
Other tax effects for reconciliation between accounting profit and tax expense (income) (48) 4,040
total tax charge 366,953 328,182

GTL Limited122
GTL EuropE LimiTEd
10 tangible assets
furniture, fittings and equipment
£
total £
cost or valuation
at 1 January 2016 115,036 115,036
Additions 88,931 88,931
at 31 december 2016 203,967 203,967
depreciation
at 1 January 2016 88,257 88,257
Charge for the period 56,394 56,394
at 31 december 2016 144,651 144,651
carrying amount
at 31 december 2016 59,316 59,316
at 31 december 2015 26,778 26,778
11 investments held as fixed assets
31 december 2016 £
31 december 2015 £
Investments in subsidiaries 1 1
Other investments 1 1
2 2
Subsidiaries £
cost or valuation
At 1 January 2016 1
provision
carrying amount
At 31 December 2016 1
At 31 December 2015 1
details of undertakings
Details of the investments in which the company holds 20% or more of the nominal value of any class of share capital are as follows:
undertaking country of incorporation holding proportion of voting rights and shares held
2016 2015
Subsidiary undertakings
GTLInternationalBangladeshPrivateLimited Bangladesh Ordinary share capital 100% 100%
TheprincipalactivityofGTLInternationalBangladeshPrivateLimitedistelecommunicationengineeringservicesandconsultancy
Under the provisions of S401 of the Companies Act 2006, the company is exempt from preparing consolidated financial statements and has not done so, therefore the financial statements show information about the company as an individual entity.
12 other financial assets (current and non-current)
31 december 2016 £
31 december 2015 £
non-current financial assets
Financialassetsatcostlessimpairment 1 1

GTL EuropE LimiTEd
29th Annual report 2016-17 123
13. Stocks
31 december 2016 £
31 december 2015 £
Raw materials - 3,243
14 debtors
note 31 december 2016 £
31 december 2015 £
Trade debtors 4,693,262 2,572,085
Amounts owed by group undertakings 21 - 90,395
Other debtors 64,747 19,818
Prepayments and accrued income 1,062,588 795,859
total current trade and other debtors 5,820,597 3,478,157
15 cash and cash equivalents
31 december 2016 £
31 december 2015 £
Cash at bank 1,770,263 2,452,846
16 creditors
note 31 december 2016 £
31 december 2015 £
Due within one year
Trade creditors 2,650,022 1,858,025
Amounts due to group undertakings 21 148,325 -
Social security and other taxes 99,178 443,345
Other creditors 45,726 12,272
Accruals and deferred income 3,492,441 2,217,972
Corporation tax 9 366,953 328,182
6,802,645 4,859,796
17 pension and other schemes
defined contribution pension scheme
The company operates a defined contribution pension scheme. The pension cost charge for the year represents contributions payable by the company to the scheme and amounted to £31,541 (2015 - £31,817).
18 Share capital
allotted, called up and fully paid shares
31 december 2016 31 december 2015
no. £ no. £
Ordinary shares of £1 each 500,000 500,000 500,000 500,000
19 obligations under leases and hire purchase contracts
operating leases
The total of future minimum lease payments is as follows:
2016 £
2015 £
Not later than one year 10,475 32,700
Later than one year and not later than five years 45,000 45,000
55,475 77,700
The amount of non-cancellable operating lease payments recognised as an expense during the year was £55,475 (2015 - £77,700).
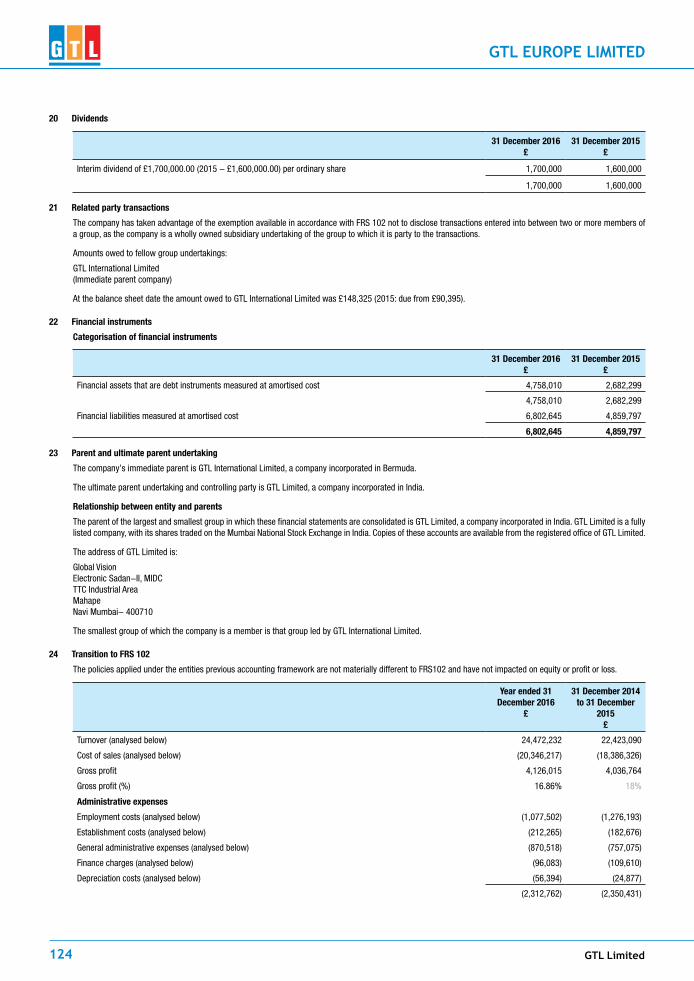
GTL Limited124
GTL EuropE LimiTEd
20 dividends
31 december 2016£
31 december 2015£
Interim dividend of £1,700,000.00 (2015 - £1,600,000.00) per ordinary share 1,700,000 1,600,000
1,700,000 1,600,000
21 related party transactions
ThecompanyhastakenadvantageoftheexemptionavailableinaccordancewithFRS102nottodisclosetransactionsenteredintobetweentwoormoremembersofa group, as the company is a wholly owned subsidiary undertaking of the group to which it is party to the transactions.
Amounts owed to fellow group undertakings:
GTL International Limited (Immediate parent company)
At the balance sheet date the amount owed to GTL International Limited was £148,325 (2015: due from £90,395).
22 financial instruments
categorisation of financial instruments
31 december 2016 £
31 december 2015 £
Financialassetsthataredebtinstrumentsmeasuredatamortisedcost 4,758,010 2,682,299
4,758,010 2,682,299
Financialliabilitiesmeasuredatamortisedcost 6,802,645 4,859,797
6,802,645 4,859,797
23 parent and ultimate parent undertaking
Thecompany’simmediateparentisGTLInternationalLimited,acompanyincorporatedinBermuda.
The ultimate parent undertaking and controlling party is GTL Limited, a company incorporated in India.
relationship between entity and parents
The parent of the largest and smallest group in which these financial statements are consolidated is GTL Limited, a company incorporated in India. GTL Limited is a fully listed company, with its shares traded on the Mumbai National Stock Exchange in India. Copies of these accounts are available from the registered office of GTL Limited.
The address of GTL Limited is:
Global Vision Electronic Sadan-II, MIDC TTC Industrial Area Mahape Navi Mumbai- 400710
The smallest group of which the company is a member is that group led by GTL International Limited.
24 transition to frS 102
ThepoliciesappliedundertheentitiespreviousaccountingframeworkarenotmateriallydifferenttoFRS102andhavenotimpactedonequityorprofitorloss.
Year ended 31 december 2016
£
31 december 2014 to 31 december
2015 £
Turnover (analysed below) 24,472,232 22,423,090
Cost of sales (analysed below) (20,346,217) (18,386,326)
Gross profit 4,126,015 4,036,764
Gross profit (%) 16.86% 18%
administrative expenses
Employment costs (analysed below) (1,077,502) (1,276,193)
Establishment costs (analysed below) (212,265) (182,676)
General administrative expenses (analysed below) (870,518) (757,075)
Financecharges(analysedbelow) (96,083) (109,610)
Depreciation costs (analysed below) (56,394) (24,877)
(2,312,762) (2,350,431)

GTL EuropE LimiTEd
29th Annual report 2016-17 125
Year ended 31 december 2016
£
31 december 2014 to 31 december
2015 £
Operating profit 1,813,253 1,686,333
Income from shares in group undertakings (analysed below) 3 -
Interest payable and similar charges (analysed below) - (64,600)
3 (64,600)
profit before tax 1,813,256 1,621,733

GTL Limited126
GTL NEPAL PrivATE LimiTEd
Independent AudItors’ reportIndependent AudItors’ report to tHe sHAreHoLders oF GtL nepal pvt Limited, Balkumari Kathmandu
report on the Financial statements
We have audited the accompanying financial statements of GTL Nepal Pvt Limited which comprise the statement of financial position as at December 31, 2016, and the income statement for the period January 01, 2016 to December 31, 2016, statement of changes in equity and cash flow statement for the year then ended, and a summary of significant accounting policies and notes.
Management’s responsibility for the Financial statements
Management is responsible for the preparation and fair presentation of these financial statements in accordance with Nepal Accounting Standards. This responsibility includes: designing, implementing and maintaining internal control relevant to preparation and fair presentation of financial statements that are free from material misstatement, whether due to fraud or error; selecting and applying appropriate accounting policies; and making accounting estimates that are reasonable in the circumstances.
Auditor’s responsibility
Our responsibility is to express an opinion on these financial statements based on our audit. We conducted our audit in accordance with Nepal Standards on Auditing. Those standards require that we comply with ethical requirements and plan and perform the audit to obtain reasonable assurance whether the financial statements are free from material misstatements. An audit involves performing procedures to obtain audit evidence about the amounts and disclosures in the financial statements. The procedures selected depend on the auditor’s judgment, including the assessments of the risks of material misstatement of the financial statements, whether due to fraud or error. In making those risk assessments; the auditor considers internal control relevant to the entity’s preparation and fair presentation of the financial statements in order to design audit procedures that are appropriate in the circumstances, but not for the purpose of expressing an opinion on the effectiveness of the entity’s internal control. An audit also includes evaluating the appropriateness of accounting policies used and the reasonableness of accounting estimates made by management, as well as evaluating the overall presentation of the financial statement. We believe that the audit evidence we have obtained is sufficient and appropriate to provide a basis for our audit opinion.
opinion
In our opinion, the financial statements give a true and fair view of, in all material respects, the financial position of GTL Nepal Pvt Limited as of December 31, 2016 and of its financial performance and its cash flows for the year then ended in accordance with Nepal Accounting Standards.
report on other Legal and regulatory reforms
As per Companies Act 2063, we report that, in our opinion:
1. We have obtained all the information and explanations, which, to the best of our knowledge and belief, were considered necessary for the purposes of our audit;
2. Proper books of account as required by law have been kept by the Company as far as appears from our examination of such books;
3. The Statement of Financial Position, Income Statement and the Cash Flow Statement are prepared as per the provisions of the Companies Act 2063 and the same are in agreement with the books of account maintained by the Company;
4. The business of the Company has been conducted satisfactorily;
5. To the best of our knowledge and in accordance with explanations given to us and from our examination of the books of accounts of the Company, necessary for the purpose of our audit, we have not come across cases where the Board of Directors, representative or any employee of the Company has committed any misappropriation or caused loss or damage to the Company deliberately.
prabin K. Jha FCA
Partner
Dillibazar, KathmanduDate : January 30, 2017
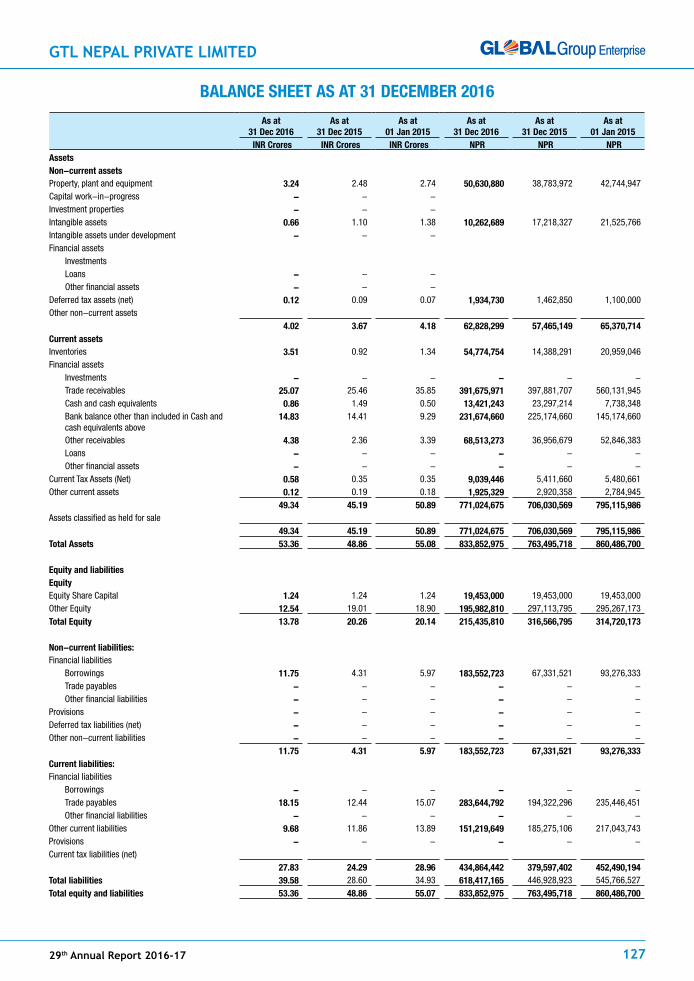
GTL NEPAL PrivATE LimiTEd
29th Annual report 2016-17 127
BALAnCe sHeet As At 31 deCeMBer 2016
As at 31 dec 2016
As at 31 dec 2015
As at 01 Jan 2015
As at 31 dec 2016
As at 31 dec 2015
As at 01 Jan 2015
Inr Crores Inr Crores Inr Crores npr npr npr Assetsnon-current assetsProperty, plant and equipment 3.24 2.48 2.74 50,630,880 38,783,972 42,744,947 Capital work-in-progress - - - Investment properties - - - Intangible assets 0.66 1.10 1.38 10,262,689 17,218,327 21,525,766 Intangible assets under development - - - Financial assets Investments Loans - - - Other financial assets - - - Deferred tax assets (net) 0.12 0.09 0.07 1,934,730 1,462,850 1,100,000 Other non-current assets
4.02 3.67 4.18 62,828,299 57,465,149 65,370,714 Current assetsInventories 3.51 0.92 1.34 54,774,754 14,388,291 20,959,046 Financial assets Investments - - - - - - Trade receivables 25.07 25.46 35.85 391,675,971 397,881,707 560,131,945 Cash and cash equivalents 0.86 1.49 0.50 13,421,243 23,297,214 7,738,348 Bank balance other than included in Cash and
cash equivalents above 14.83 14.41 9.29 231,674,660 225,174,660 145,174,660
Other receivables 4.38 2.36 3.39 68,513,273 36,956,679 52,846,383 Loans - - - - - - Other financial assets - - - - - - Current Tax Assets (Net) 0.58 0.35 0.35 9,039,446 5,411,660 5,480,661 Other current assets 0.12 0.19 0.18 1,925,329 2,920,358 2,784,945
49.34 45.19 50.89 771,024,675 706,030,569 795,115,986 Assets classified as held for sale
49.34 45.19 50.89 771,024,675 706,030,569 795,115,986 total Assets 53.36 48.86 55.08 833,852,975 763,495,718 860,486,700
equity and liabilitiesequityEquity Share Capital 1.24 1.24 1.24 19,453,000 19,453,000 19,453,000 Other Equity 12.54 19.01 18.90 195,982,810 297,113,795 295,267,173 total equity 13.78 20.26 20.14 215,435,810 316,566,795 314,720,173
non-current liabilities:Financial liabilities Borrowings 11.75 4.31 5.97 183,552,723 67,331,521 93,276,333 Trade payables - - - - - - Other financial liabilities - - - - - - Provisions - - - - - - Deferred tax liabilities (net) - - - - - - Other non-current liabilities - - - - - -
11.75 4.31 5.97 183,552,723 67,331,521 93,276,333 Current liabilities:Financial liabilities Borrowings - - - - - - Trade payables 18.15 12.44 15.07 283,644,792 194,322,296 235,446,451 Other financial liabilities - - - - - - Other current liabilities 9.68 11.86 13.89 151,219,649 185,275,106 217,043,743 Provisions - - - - - - Current tax liabilities (net)
27.83 24.29 28.96 434,864,442 379,597,402 452,490,194 total liabilities 39.58 28.60 34.93 618,417,165 446,928,923 545,766,527 total equity and liabilities 53.36 48.86 55.07 833,852,975 763,495,718 860,486,700
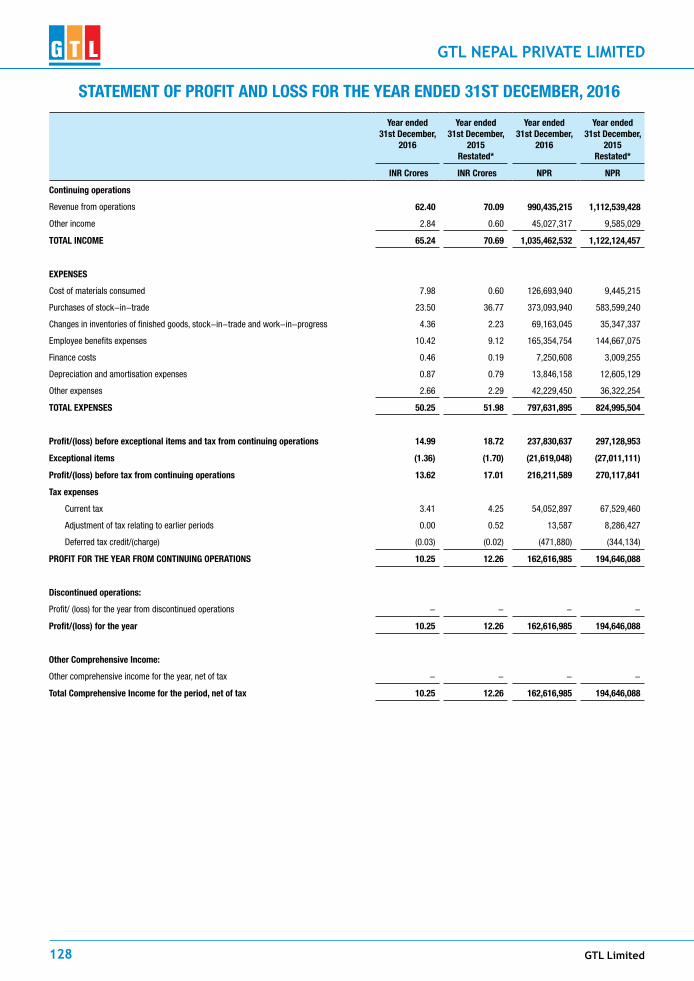
GTL Limited128
GTL NEPAL PrivATE LimiTEd
stAteMent oF proFIt And Loss For tHe yeAr ended 31st deCeMBer, 2016
year ended31st december,
2016
year ended31st december,
2015 restated*
year ended31st december,
2016
year ended31st december,
2015 restated*
Inr Crores Inr Crores npr npr
Continuing operations
Revenue from operations 62.40 70.09 990,435,215 1,112,539,428
Other income 2.84 0.60 45,027,317 9,585,029
totAL InCoMe 65.24 70.69 1,035,462,532 1,122,124,457
eXpenses
Cost of materials consumed 7.98 0.60 126,693,940 9,445,215
Purchases of stock-in-trade 23.50 36.77 373,093,940 583,599,240
Changes in inventories of finished goods, stock-in-trade and work-in-progress 4.36 2.23 69,163,045 35,347,337
Employee benefits expenses 10.42 9.12 165,354,754 144,667,075
Finance costs 0.46 0.19 7,250,608 3,009,255
Depreciation and amortisation expenses 0.87 0.79 13,846,158 12,605,129
Other expenses 2.66 2.29 42,229,450 36,322,254
totAL eXpenses 50.25 51.98 797,631,895 824,995,504
profit/(loss) before exceptional items and tax from continuing operations 14.99 18.72 237,830,637 297,128,953
exceptional items (1.36) (1.70) (21,619,048) (27,011,111)
profit/(loss) before tax from continuing operations 13.62 17.01 216,211,589 270,117,841
tax expenses
Current tax 3.41 4.25 54,052,897 67,529,460
Adjustment of tax relating to earlier periods 0.00 0.52 13,587 8,286,427
Deferred tax credit/(charge) (0.03) (0.02) (471,880) (344,134)
proFIt For tHe yeAr FroM ContInuInG operAtIons 10.25 12.26 162,616,985 194,646,088
discontinued operations:
Profit/ (loss) for the year from discontinued operations - - - -
profit/(loss) for the year 10.25 12.26 162,616,985 194,646,088
other Comprehensive Income:
Other comprehensive income for the year, net of tax - - - -
total Comprehensive Income for the period, net of tax 10.25 12.26 162,616,985 194,646,088

GTL NEPAL PrivATE LimiTEd
29th Annual report 2016-17 129
stAteMent oF CHAnGes In equIty For tHe yeAr ended 31 deCeMBer 2016
a. equity share Capital:
no. in Crores Inr Crores npr
At 1st January 2015 0.02 1.24 19,453,000
Issue of share capital (Note 17) - -
At 31st december 2015 0.02 1.24 19,453,000
Issue of share capital (Note 17) - -
At 31st december 2016 0.02 1.24 19,453,000
b. other equity:
For the year ended 31 december 2016
particulars equity component
of compound financial
instrument (note 18)
reserves & surplus Items of oCI total equityCapital
reserve (note 18)
Capital redemption
reserve (note 18)
securities premium account (note 18)
debenture redemption
reserve (note 18)
General reserve
(note 18)
Balance in statement
of profit and Loss
(note 18)
FVtoCI reserve
(note 18)
Inr in Crores Inr in Crores Inr in Crores Inr in Crores Inr in Crores Inr in Crores Inr in Crores Inr in Crores Inr in Crores
As at 01st January 2016 - - - - - - 19.02 - 19.02
Net Profit for the period 10.41 10.41
Other comprehensive income 2.16 2.16
total comprehensive income - - - - - - 12.57 - 12.57
Dividends - - - - - - (19.04) - (19.04)
Transfer to general reserve - - - - - - - - -
As at 31 december 2016 - - - - - - 12.54 - 12.54
For the year ended 31 december 2015
particulars equity component
of compound financial
instrument (note 18)
reserves & surplus Items of oCI total equity
Capital reserve (note 18)
Capital redemption
reserve (note 18)
securities premium account (note 18)
debenture redemption
reserve (note 18)
General reserve
(note 18)
Balance in statement
of profit and Loss
(note 18)
FVtoCI reserve
(note 18)
Inr in Crores Inr in Crores Inr in Crores Inr in Crores Inr in Crores Inr in Crores Inr in Crores Inr in Crores Inr in Crores
As at 01st January 2015 - - - - - - 18.90 - 18.90
Net Profit for the period 12.46 12.46
Other comprehensive income 1.26 1.26
total comprehensive income - - - - - - 13.72 - 13.72
Impact of translation of financials into INDAS
Dividends - - - - - - (13.59) - (13.59)
Transfer to general reserve - - - - - - - - -
As at 31 december 2015 - - - - - - 19.02 - 19.02
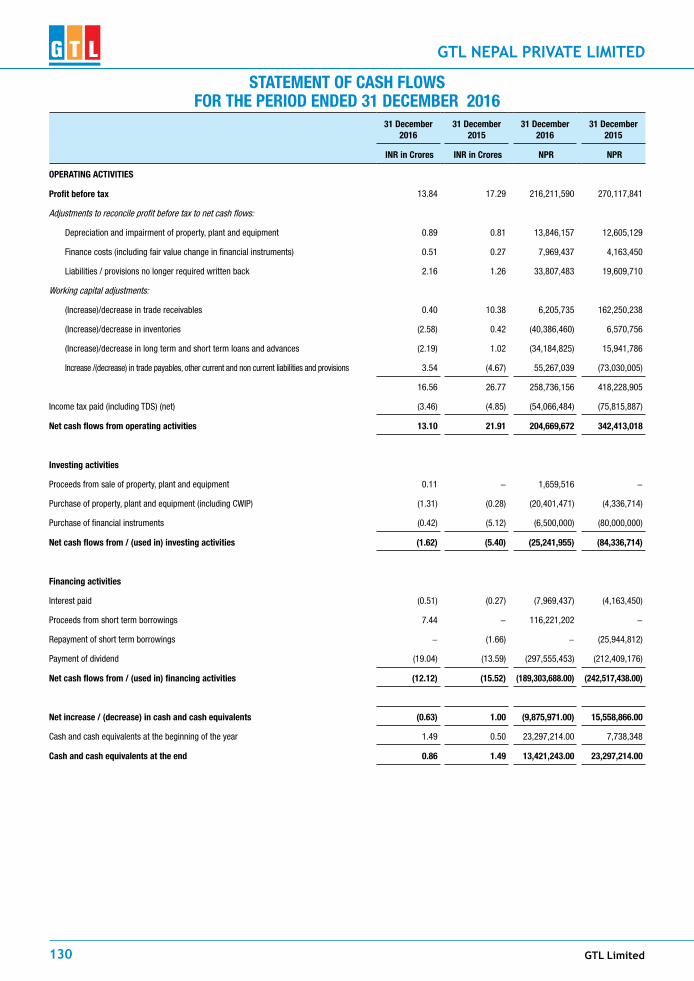
GTL Limited130
GTL NEPAL PrivATE LimiTEd
stAteMent oF CAsH FLows For tHe perIod ended 31 deCeMBer 2016
31 december 2016
31 december 2015
31 december 2016
31 december 2015
Inr in Crores Inr in Crores npr npr
operAtInG ACtIVItIes
profit before tax 13.84 17.29 216,211,590 270,117,841
Adjustments to reconcile profit before tax to net cash flows:
Depreciation and impairment of property, plant and equipment 0.89 0.81 13,846,157 12,605,129
Finance costs (including fair value change in financial instruments) 0.51 0.27 7,969,437 4,163,450
Liabilities / provisions no longer required written back 2.16 1.26 33,807,483 19,609,710
Working capital adjustments:
(Increase)/decrease in trade receivables 0.40 10.38 6,205,735 162,250,238
(Increase)/decrease in inventories (2.58) 0.42 (40,386,460) 6,570,756
(Increase)/decrease in long term and short term loans and advances (2.19) 1.02 (34,184,825) 15,941,786
Increase /(decrease) in trade payables, other current and non current liabilities and provisions 3.54 (4.67) 55,267,039 (73,030,005)
16.56 26.77 258,736,156 418,228,905
Income tax paid (including TDS) (net) (3.46) (4.85) (54,066,484) (75,815,887)
net cash flows from operating activities 13.10 21.91 204,669,672 342,413,018
Investing activities
Proceeds from sale of property, plant and equipment 0.11 - 1,659,516 -
Purchase of property, plant and equipment (including CWIP) (1.31) (0.28) (20,401,471) (4,336,714)
Purchase of financial instruments (0.42) (5.12) (6,500,000) (80,000,000)
net cash flows from / (used in) investing activities (1.62) (5.40) (25,241,955) (84,336,714)
Financing activities
Interest paid (0.51) (0.27) (7,969,437) (4,163,450)
Proceeds from short term borrowings 7.44 - 116,221,202 -
Repayment of short term borrowings - (1.66) - (25,944,812)
Payment of dividend (19.04) (13.59) (297,555,453) (212,409,176)
net cash flows from / (used in) financing activities (12.12) (15.52) (189,303,688.00) (242,517,438.00)
net increase / (decrease) in cash and cash equivalents (0.63) 1.00 (9,875,971.00) 15,558,866.00
Cash and cash equivalents at the beginning of the year 1.49 0.50 23,297,214.00 7,738,348
Cash and cash equivalents at the end 0.86 1.49 13,421,243.00 23,297,214.00
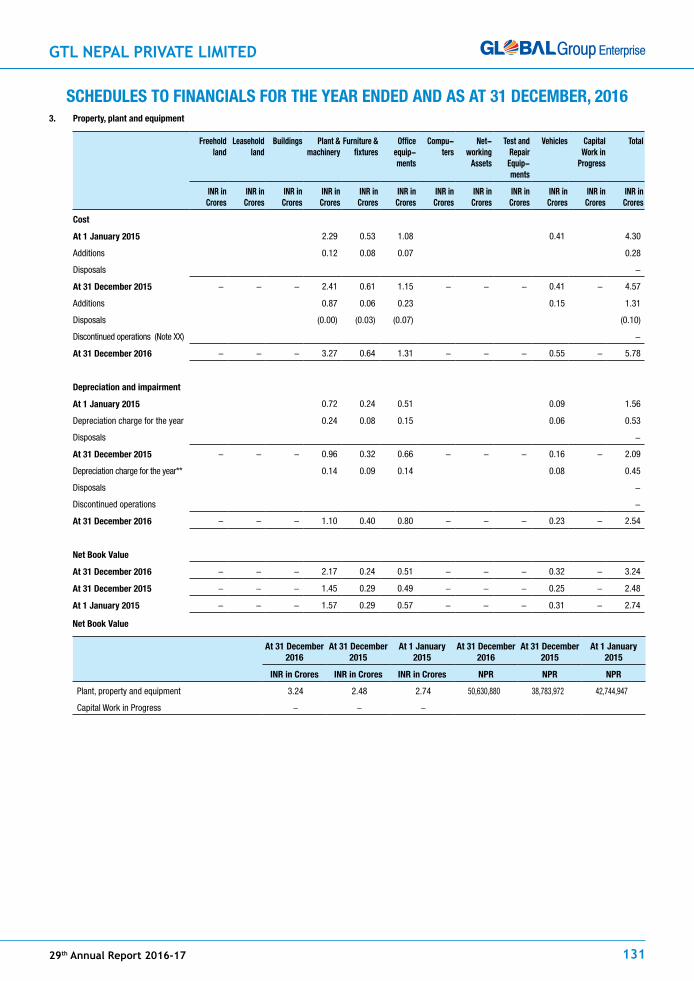
GTL NEPAL PrivATE LimiTEd
29th Annual report 2016-17 131
sCHeduLes to FInAnCIALs For tHe yeAr ended And As At 31 deCeMBer, 20163. property, plant and equipment
Freehold land
Leasehold land
Buildings plant & machinery
Furniture & fixtures
office equip-ments
Compu-ters
net-working
Assets
test and repair
equip-ments
Vehicles Capital work in
progress
total
Inr in Crores
Inr in Crores
Inr in Crores
Inr in Crores
Inr in Crores
Inr in Crores
Inr in Crores
Inr in Crores
Inr in Crores
Inr in Crores
Inr in Crores
Inr in Crores
Cost
At 1 January 2015 2.29 0.53 1.08 0.41 4.30
Additions 0.12 0.08 0.07 0.28
Disposals -
At 31 december 2015 - - - 2.41 0.61 1.15 - - - 0.41 - 4.57
Additions 0.87 0.06 0.23 0.15 1.31
Disposals (0.00) (0.03) (0.07) (0.10)
Discontinued operations (Note XX) -
At 31 december 2016 - - - 3.27 0.64 1.31 - - - 0.55 - 5.78
depreciation and impairment
At 1 January 2015 0.72 0.24 0.51 0.09 1.56
Depreciation charge for the year 0.24 0.08 0.15 0.06 0.53
Disposals -
At 31 december 2015 - - - 0.96 0.32 0.66 - - - 0.16 - 2.09
Depreciation charge for the year** 0.14 0.09 0.14 0.08 0.45
Disposals -
Discontinued operations -
At 31 december 2016 - - - 1.10 0.40 0.80 - - - 0.23 - 2.54
net Book Value
At 31 december 2016 - - - 2.17 0.24 0.51 - - - 0.32 - 3.24
At 31 december 2015 - - - 1.45 0.29 0.49 - - - 0.25 - 2.48
At 1 January 2015 - - - 1.57 0.29 0.57 - - - 0.31 - 2.74
net Book Value
At 31 december 2016
At 31 december 2015
At 1 January 2015
At 31 december 2016
At 31 december 2015
At 1 January 2015
Inr in Crores Inr in Crores Inr in Crores npr npr npr
Plant, property and equipment 3.24 2.48 2.74 50,630,880 38,783,972 42,744,947
Capital Work in Progress - - -

GTL Limited132
GTL NEPAL PrivATE LimiTEd
5 Intangible assets
networking software
total
Inr in Crores Inr in Crores
Cost
At 1 January 2015 1.96 1.96
Additions
Disposals
At 31 december 2015 1.96 1.96
Additions
Disposals (0.01) (0.01)
At 31 december 2016 1.95 1.95
Amortization and impairment
At 1 January 2015 0.58 0.58
Amortisation 0.28 0.28
Disposals
At 31 december 2015 0.86 0.86
Amortisation 0.22 0.22
Disposals 0.22 0.22
At 31 december 2016 1.30 1.30
net Book Value
At 31 december 2016 0.66 0.66
At 31 december 2015 1.10 1.10
At 1 January 2015 1.38 1.38
net Book Value
At 31 december 2016
At 31 december 2015
At 1 January 2015
At 31 december 2016
At 31 december 2015
At 1 January 2015
Inr in Crores Inr in Crores Inr in Crores npr npr npr
Intangible assets 0.66 1.10 1.38 10,262,689 17,218,327 21,525,766
Intangible assets under development - - -
7. Loans
31 december 2016
31 december 2015
1 January 2015
31 december 2016
31 december 2015
1 January 2015
Inr in Crores Inr in Crores Inr in Crores npr npr npr
Deposits with body corporates and others
Secured, considered good 11.75 4.31 5.97 183,552,723 67,331,521 93,276,333
total Loans (before allowance for impairment) 11.75 4.31 5.97 183,552,723 67,331,521 93,276,333
total financial assets 11.75 4.31 5.97 183,552,723 67,331,521 93,276,333
8. other non-current assets
31 december 2016
31 december 2015
1 January 2015
31 december 2016
31 december 2015
1 January 2015
Inr in Crores Inr in Crores Inr in Crores npr npr npr
Prepaid expenses 0.11 0.10 0.14 1,696,745 1,510,689 2,183,704
Others - - - - - -
0.11 0.10 0.14 1,696,745 1,510,689 2,183,704

GTL NEPAL PrivATE LimiTEd
29th Annual report 2016-17 133
9. Inventories
31 december 2016
31 december 2015
1 January 2015
31 december 2016
31 december 2015
1 January 2015
Inr in Crores Inr in Crores Inr in Crores npr npr npr
Work in progress (at cost) 1.37 0.31 0.25 21,336,421 4,779,373 3,904,913
Finished goods (at lower of cost and net realisable value) 2.14 0.61 1.09 33,438,333 9,608,918 17,054,133
total inventories at the lower of cost and net realisable value 3.51 0.92 1.34 54,774,754 14,388,291 20,959,046
11. trade and other receivables
31 december 2016
31 december 2015
1 January 2015
31 december 2016
31 december 2015
1 January 2015
Inr in Crores Inr in Crores Inr in Crores npr npr npr
Trade receivables 25.07 25.46 35.85 391,675,971 397,881,707 560,131,945
total trade and other receivables 25.07 25.46 35.85 391,675,971 397,881,707 560,131,945
12. Cash and cash equivalents
31 december 2016
31 december 2015
1 January 2015
31 december 2016
31 december 2015
1 January 2015
Inr in Crores Inr in Crores Inr in Crores npr npr npr
Balances with banks
In current accounts 0.86 1.45 0.47 13,407,594 22,670,585 7,297,680
Cash on hand 0.00 0.04 0.03 13,649 626,629 440,668
0.86 1.49 0.50 13,421,243 23,297,214 7,738,348
13. Bank balance other than cash and cash equivalents
31 december 2016
31 december 2015
1 January 2015
31 december 2016
31 december 2015
1 January 2015
Inr in Crores Inr in Crores Inr in Crores npr npr npr
Margin money with banks 14.83 14.41 9.29 231,674,660 225,174,660 145,174,660
14.83 14.41 9.29 231,674,660 225,174,660 145,174,660
14. other receivables
31 december 2016
31 december 2015
1 January 2015
31 december 2016
31 december 2015
1 January 2015
Inr in Crores Inr in Crores Inr in Crores npr npr npr
other loans and advances
Considered good 4.38 2.36 3.39 68,513,273 36,956,679 52,846,383
4.38 2.36 3.39 68,513,273 36,956,679 52,846,383
15. Current tax Assets (net)
31 december 2016
31 december 2015
1 January 2015
31 december 2016
31 december 2015
1 January 2015
Inr in Crores Inr in Crores Inr in Crores npr npr npr
Advance Income Tax & Tax deducted at source (Net of provision)
0.58 0.35 0.35 9,039,446 5,411,660 5,480,661
0.58 0.35 0.35 9,039,446 5,411,660 5,480,661
16. other current assets
31 december 2016
31 december 2015
1 January 2015
31 december 2016
31 december 2015
1 January 2015
Inr in Crores Inr in Crores Inr in Crores npr npr npr
Prepaid expenses 0.11 0.10 0.14 1,696,745 1,510,689 2,183,704
Others 0.01 0.09 0.04 228,583 1,409,668 601,240
0.12 0.19 0.18 1,925,329 2,920,358 2,784,945

GTL Limited134
GTL NEPAL PrivATE LimiTEd
14. share Capital
Authorised share Capital
equity shares
no. in Crores Inr in Crores
At 1 January 2015 0.04 2.49
Increase / (decrease) during the year - -
At 31 december 2015 0.04 2.49
Increase / (decrease) during the year - -
At 31 december 2016 0.04 2.49
Issued equity capital
equity shares of Inr 1 each issued, subscribed and fully paid
no. in Crores Inr in Crores npr
At 1 January 2015 0.02 1.24 19,453,000
Changes during the year - -
At 31 december 2015 0.02 1.24 19,453,000
Changes during the year - -
At 31 december 2016 0.02 1.24 19,453,000
details of shareholders holding more than 5% shares in the company
name of the shareholder As at 31 december 2016 As at 31 december 2015
no. in Crores % holding in the class
no. in Crores % holding in the class
Equity shares of INR 64 each fully paid
GTL Singapore PTE Ltd, holding company 0.02 100% 0.02 100%
Balance in statement of profit and Loss
Inr in Crores npr
At 1 January 2015 18.90 295,267,173
Add: Profit during the year 12.45 194,646,088
Add: Prior year adjustments and provision write off 1.25 19,609,710
Less: Dividend payout 13.59 212,409,176
At 31 december 2015 19.01 297,113,795
Add: Profit during the year 10.41 162,616,985
Add: Prior year adjustments and provision write off 2.16 33,807,483
Less: Dividend payout 19.05 297,555,453
At 31 december 2016 12.54 195,982,810
total other equity
Inr in Crores npr
At 1 January 2015 18.90 295,267,173
At 31 december 2015 19.01 297,113,795
At 31 december 2016 12.54 195,982,810

GTL NEPAL PrivATE LimiTEd
29th Annual report 2016-17 135
19. Borrowings
31 december 2016
31 december 2015
1 January 2015
31 december 2016
31 december 2015
1 January 2015
Inr in Crores Inr in Crores Inr in Crores npr npr npr
non-current borrowings
Non-current interest bearing loans and borrowings:
Secured Loans 11.75 4.31 5.97 183,552,723 67,331,521 93,276,333
total secured loans 11.75 4.31 5.97 183,552,723 67,331,521 93,276,333
31 december 2016
31 december 2015
1 January 2015
31 december 2016
31 december 2015
1 January 2015
Inr in Crores Inr in Crores Inr in Crores npr npr npr
Deferred tax assets 0.12 0.09 0.07 1,934,730 1,462,850 1,100,000
deferred tax liabilities, net 0.12 0.09 0.07 1,934,730 1,462,850 1,100,000
25. trade payables
31 december 2016
31 december 2015
1 January 2015
31 december 2016
31 december 2015
1 January 2015
Inr in Crores Inr in Crores Inr in Crores npr npr npr
Trade payables 8.59 4.95 7.77 134,143,859 77,265,627 121,383,181
Trade payables to related parties 9.57 7.49 7.30 149,500,934 117,056,669 114,063,269
18.15 12.44 15.07 283,644,792 194,322,296 235,446,451
27. other current liabilities
31 december 2016
31 december 2015
1 January 2015
31 december 2016
31 december 2015
1 January 2015
Inr in Crores Inr in Crores Inr in Crores npr npr npr
Advance from customers and unearned income 1.38 1.02 1.83 21,596,400 15,954,021 28,606,243
Unearned Revenue
Taxes and other liabilities 5.79 8.08 9.60 90,486,523 126,198,538 150,000,000
Accrued salaries and Employee benefits 2.50 2.76 2.46 39,136,726 43,122,547 38,437,500
Lease equalisation reserve
9.68 11.86 13.89 151,219,649 185,275,106 217,043,743
29. revenue from operations
31 december 2016
31 december 2015
31 december 2016
31 december 2015
Inr in Crores Inr in Crores npr npr
Rendering of Services
Telecom services 62.40 70.09 990,435,215 1,112,539,428
Others - - - -
62.40 70.09 990,435,215 1,112,539,428
30. other income
31 december 2016
31 december 2015
31 december 2016
31 december 2015
Inr in Crores Inr in Crores npr npr
Interest income 0.69 0.56 10,886,481 8,877,275
Gain on foreign currency transactions (Net) (0.00) 0.03 (734) 521,354
Other non-operating income 2.15 0.01 34,141,570 186,400
2.84 0.60 45,027,317 9,585,029
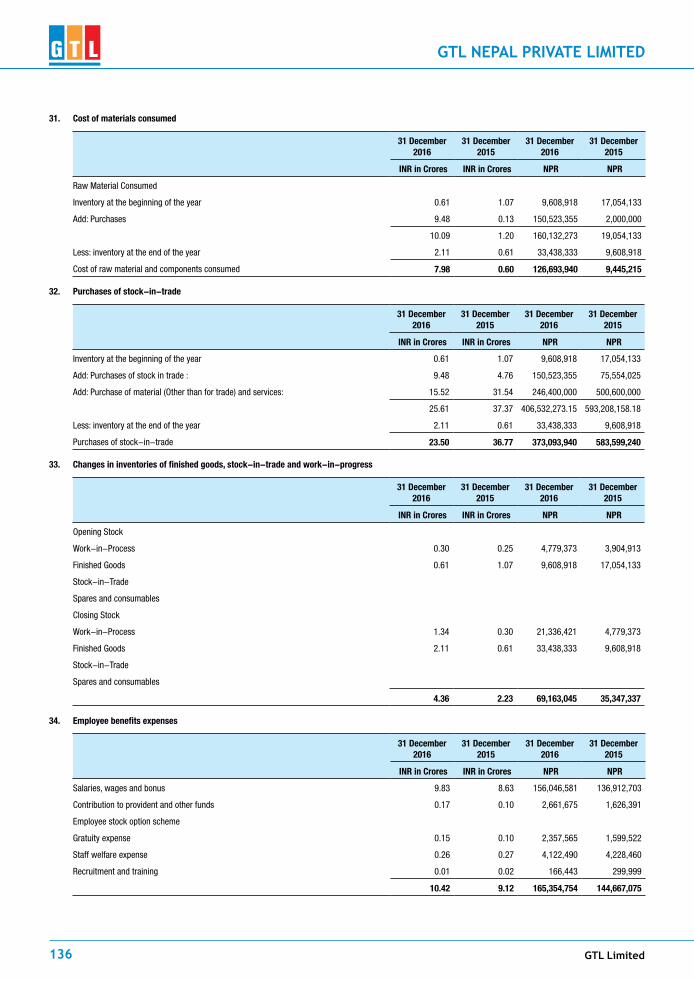
GTL Limited136
GTL NEPAL PrivATE LimiTEd
31. Cost of materials consumed
31 december 2016
31 december 2015
31 december 2016
31 december 2015
Inr in Crores Inr in Crores npr npr
Raw Material Consumed
Inventory at the beginning of the year 0.61 1.07 9,608,918 17,054,133
Add: Purchases 9.48 0.13 150,523,355 2,000,000
10.09 1.20 160,132,273 19,054,133
Less: inventory at the end of the year 2.11 0.61 33,438,333 9,608,918
Cost of raw material and components consumed 7.98 0.60 126,693,940 9,445,215
32. purchases of stock-in-trade
31 december 2016
31 december 2015
31 december 2016
31 december 2015
Inr in Crores Inr in Crores npr npr
Inventory at the beginning of the year 0.61 1.07 9,608,918 17,054,133
Add: Purchases of stock in trade : 9.48 4.76 150,523,355 75,554,025
Add: Purchase of material (Other than for trade) and services: 15.52 31.54 246,400,000 500,600,000
25.61 37.37 406,532,273.15 593,208,158.18
Less: inventory at the end of the year 2.11 0.61 33,438,333 9,608,918
Purchases of stock-in-trade 23.50 36.77 373,093,940 583,599,240
33. Changes in inventories of finished goods, stock-in-trade and work-in-progress
31 december 2016
31 december 2015
31 december 2016
31 december 2015
Inr in Crores Inr in Crores npr npr
Opening Stock
Work-in-Process 0.30 0.25 4,779,373 3,904,913
Finished Goods 0.61 1.07 9,608,918 17,054,133
Stock-in-Trade
Spares and consumables
Closing Stock
Work-in-Process 1.34 0.30 21,336,421 4,779,373
Finished Goods 2.11 0.61 33,438,333 9,608,918
Stock-in-Trade
Spares and consumables
4.36 2.23 69,163,045 35,347,337
34. employee benefits expenses
31 december 2016
31 december 2015
31 december 2016
31 december 2015
Inr in Crores Inr in Crores npr npr
Salaries, wages and bonus 9.83 8.63 156,046,581 136,912,703
Contribution to provident and other funds 0.17 0.10 2,661,675 1,626,391
Employee stock option scheme
Gratuity expense 0.15 0.10 2,357,565 1,599,522
Staff welfare expense 0.26 0.27 4,122,490 4,228,460
Recruitment and training 0.01 0.02 166,443 299,999
10.42 9.12 165,354,754 144,667,075

GTL NEPAL PrivATE LimiTEd
29th Annual report 2016-17 137
35. Finance costs
31 december 2016
31 december 2015
31 december 2016
31 december 2015
Inr in Crores Inr in Crores npr npr
Interest
- On fixed period loan 0.46 0.19 7,250,608 3,009,255
- Others - - - -
total finance cost 0.46 0.19 7,250,608 3,009,255
36. depreciation and amortization expense
31 december 2016
31 december 2015
31 december 2016
31 december 2015
Inr in Crores Inr in Crores npr npr
Depreciation of tangible assets (note 3) 0.87 0.79 13,846,157 12,605,129
0.87 0.79 13,846,158 12,605,129
37. other expenses
31 december 2016
31 december 2015
31 december 2016
31 december 2015
Inr in Crores Inr in Crores npr npr
Repairs and maintenance
Plant and machinery 0.11 0.11 1,740,170 1,744,355
Others 0.01 0.03 171,492 436,214
Other insurance 0.18 0.15 2,854,434 2,420,524
Non network rent 0.46 0.42 7,342,379 6,664,760
Electricity 0.03 0.03 555,188 422,336
Printing and stationery 0.16 0.08 2,571,188 1,235,554
Communication expenses 0.15 0.16 2,359,876 2,598,909
Travelling and conveyance 0.88 0.83 13,922,638 13,208,475
Bank charges 0.05 0.07 718,829 1,154,195
Legal and professional charges 0.11 0.09 1,694,622 1,378,486
Audit fees 0.01 0.01 225,000 225,000
Loss/(Gain) on sale of fixed assets/asset disposed off (net) 0.01 - 135,119 -
Miscellaneous expenses 0.50 0.30 7,938,516 4,833,447
2.66 2.29 42,229,450 36,322,254
payments to the auditor:
As auditor
Audit fee 0.01 0.01 225,000 225,000
0.01 0.01 225,000 225,000

GTL Limited138
GTL NEPAL PrivATE LimiTEd
notes on tHe ACCounts For tHe perIod endInG deCeMBer 31, 2016A. significant Accounting policies and notes to Accounts
1. Basic Information
GTL Nepal P Ltd. is a company registered in Nepal since 17 September 2009 pursuant to Companies Act 2006 with principal place of business at Balkumari, Kathmandu. It is mainly involved in operation of various network related services to telecommunication companies in Nepal. The total number of employees working for GTL Nepal P Limited at the close of current reporting period is 375, out of which 115 is direct and 260 is locally outsourced employees.
2. Basis of preparation
The financial statements are prepared under the historical cost convention on accrual basis of accounting, in accordance with the generally accepted accounting principles in Nepal including accounting standards notified there under. The accounts are prepared under historical cost convention unless otherwise indicated.
3. use of estimate
The preparation of financial statements in conformity with the Nepal Accounting Standards requires management to make estimates and assumptions to be made that affect the reported amount of assets and liabilities on the date of the financial statements and the reported amount of revenues and expenses during the reporting period. The difference between the actual result and estimates are recognized in the period in which the results are known / materialized.
4. revenue recognition
Revenues are recognized when it is earned and when there is no significant uncertainty as to its measurement and realization. The specific revenue recognition policies are as under:
a. Revenue from turnkey contracts, which are either fixed price or cost plus contracts, is recognized based on work completion of activity or achievement of milestone duly certified by customer.
b. Revenue from sale of products is recognized upon passing of title of goods and/or on transfer of significant risk and rewards of ownership thereto.
c. Revenue from services is recognized based on performance of service that are recoverable.
d. Other income is recognized when the right to receive is established.
5. employee Benefits
a. Short-term employee benefits are recognized as an expense at the undiscounted amount in the Income Statement of the year in which the related service is rendered.
b. Post-employment and other long-term employee benefits are recognized as an expense in the Income Statement of the year in which the employee has rendered services. The expense is recognized at the undiscounted value of the amount payable determined using employee benefits provided at the end of each reporting period.
6. property, plant and equipment
a. Property, plant and equipment is stated at cost less depreciation and impairment. Depreciation is provided on diminishing balance method at percentages and classes (group) of assets as determined by Income Tax Act 2058.
b. The rates of depreciation by major class of assets [ Rates prescribed by Income Tax Act 2058] are as follows:
Furniture and Fittings 25%
Office Equipment 25%
Tools & Equipments 15%
Plant 15%
Software 20%
Vehicle 20%
For the purpose of calculation of depreciation, depreciable base of assets have been considered as per the provisions of Income Tax Act 2058. Further, rate of depreciation has been applied on individual assets of respective blocks of assets as per the Act.
c. Property, plant and equipment are subject to review for impairment if triggering events or circumstances indicate the requirement. Any impairment is charged to the income statement as it arises. There is no impairment of assets during the current period covering 1 January 2016 to 31 December 2016.
7. Inventories
Inventories are valued at the lower of cost and net realizable value on specific identification basis. Cost comprises all direct costs. In case of identified obsolete/ surplus/ non-moving items, necessary provision is made and charged to revenue. Cost of consumption, generally charged to WIP, are determined by subtracting value of inventory lying at the stores as certified by management from the total cost of inventory that include opening inventory and purchases.
8. Cash and cash equivalents
For the purpose of preparation of the cash flow statement, cash and cash equivalents include cash at bank and in hand.
9. taxation
a. Income tax on the profit or loss for the year comprises current and deferred tax. Income tax is recognized in the income statement.
b. Current tax is the expected tax payable on the taxable income for the year, using applicable tax rates at the Statement of Financial Position date and any adjustments to tax payable in respect of previous years.
c. Deferred taxation is recognized using the liability method on taxable temporary differences between the tax base and the accounting base of items included in the Statement of Financial Position of the company. The amount of deferred tax provided is based on the expected manner of realization or settlement of the carrying amount of assets and liabilities, using tax rates prevailing at the year end.
d. A deferred tax asset is recognized only to the extent that it is probable that future taxable profits will be available against which the asset can be utilized. Deferred tax assets are reduced to the extent that it is no longer probable that the related tax benefit will be realized.
10. provisions
Provisions are recognized when either a legal or constructive obligation, as a result of a past event, exists at the Statement of Financial Position date and where the amount of the obligation can be reliably estimated.
11. Foreign currency transactions
a. Transactions in foreign currencies are normally recorded at the exchange rate prevailing on the date of the transaction.
b. Monetary foreign currency items are reported at the exchange rates as at Statement of Financial Position date.
c. Non-monetary foreign currency itqems are carried at cost.
d. Any gains or losses on account of exchange difference either on settlement or on translation are recognized in the Income Statement.
12. Adjustments pertaining to earlier years and provision write back
Income and expenditure relating to prior period including provision write backs pertaining to FY 2015 are disclosed separately as adjustment to prior period profit in Profit and Loss Appropriation account.
B. notes to Accounts
1. ownership
The company is wholly owned by GTL (Singapore) Pte, Singapore while the ultimate parent of the company is GTL International Ltd, Bermuda.

GTL NEPAL PrivATE LimiTEd
29th Annual report 2016-17 139
2. revenue recognition
Accrued revenue of INR 28,663,370 has been recorded in the books of accounts for the period. Amount pertaining to accrued revenue has been disclosed under Account receivable.
3. Income taxes
The provision for current tax has been made based on the estimated taxable income of the Company for the period January 01, 2016 till December 31, 2016. While making estimation for depreciation claim, the amount has been derived after prorating the amount of annual depreciation calculated as per Nepalese FY [ending Mid July 16] for the period up to December 31, 2016. The amount of provision for depreciation and consequently current taxes is likely to change based on the actual results till Mid July 2017. The effect due to these on the financials for the period ending December 31, 2016 will not be significant.
Provision for tax created as at December 31, 2016 is disclosed for group reporting (consolidation) purposes only. Balance under the head as on December 31, 2016 shall not be considered for Nepalese Tax purposes since Nepalese Income year (IY) ends of Mid July and the period under current audit covers two Nepalese Income years.
Payment of tax made with respect to tax provision including tax deposited by others adjusted to the extent of payment made with respect to self-assessment tax on July 16, 2016 as per Nepalese IY. The balances are accounted separately and adjustments with tax provisions are already made in the books.
Further, provision with respect to Tax Liability that is linked with profit earned during the period is determined applying prescribed rate of 25% on profit after bonus before tax. Any difference between provision for tax accounted for in books for local requirements and provision for tax that should be created based on profit for the group reporting period [January – December 2016] are adjusted in the provision for tax for group reporting purposes. As a result of this adjustment, total provision for tax as provided during the period in the Income Statement would not necessarily match with total tax provision in the Statement of Financial Position. Details are as follows.
particulars Amount(Inr)
Opening Income Tax Provision 9,044,023.04
Add: Provision from Jan 1 2016 to Dec 31 2016 34,593,854.32
Less: Income Tax Provision as per income tax assessment 39,219,905.04
Add: Adjustment/Reversal of previous tax payment 1,544,237.44
Closing Balance of Income tax provision 5,962,209.62
4. provision for employee bonus
The amount of provision for employee bonus has been calculated @ 10% of net profit before tax as per provisions of the Bonus Act 1974. Certain adjustments to the extent of INR 22027028.56 pertaining to payments made to employees, based on provision for bonus as determined for local purposes, are disclosed as payment of employee bonus.
Provision for bonus created as at 31 December 2016 is disclosed for group reporting (consolidation) purposes only. Balance under the head as on 31 December 2015 shall not be considered for Nepalese perspective since Nepalese Income year (IY) ends of Mid July and the period under current audit covers two Nepalese Income years. As per local law, the company shall only be legally liable to settle provision of bonus created as per Nepalese IY hence provision created in the books for December would have to be adjusted at the time of making payment.
Any difference between provision for employee bonus (statutory provisions) accounted for in books for local requirements and provision for employee bonus that should be created based on profit for the current group reporting period [i.e. January – December 2016] is adjusted in the provision for bonus. As a result of this adjustment, total provision for bonus as depicted in the Income Statement would not necessarily match with the percentages for bonus as prescribed by the Bonus Act 1974. Details are as follows
Status of Provision for Bonus as at 31 December 2016 is as follows:
provision for Bonus Amount(Inr)
opening as per Corporate reporting 20,635,473.92
Provision for bonus as per local reporting 15,439,310.08
Provision pertaing to period Jan 01 to Dec 31, 2016 13,837,541.76
Adjustment for excess provision as per local reporting and corporate reporting
(1,601,768.32)
Adjustment (Payment) made during the year (22,127,599.36)
Closing Balance of provision for Bonus 12,345,416.32
5. deferred tax Assets
The amount of deferred tax income and deferred tax assets have been calculated applying prevailing Income Tax Rate of 25% as detailed below.
particulars Carrying Amount(Inr)
tax Base
deductible temporary
difference(Inr)
tax rate
deferred tax Assets
(Inr)
Provision for Gratuity 4,952,908 - 4,952,908 25% 1,238,227
Total to be maintain 1,238,227
Opening Deferred Tax Assets
936,224
Difference as deferred tax Income
302,003
6. provision for staff quarter
No provision for Staff Quarter [5%] as required by Labor Act 1992 is provided for since majority of direct staffs are Non Nepalese.
7. provision for expense
Provision for expenses created as at 31 December 2016 are disclosed for group reporting purposes only. Balance under these head as on 31 December 2015 shall not be considered for Nepalese Tax purposes since Nepalese Income year ends of Mid July and the period under current audit covers two Nepalese Income years. The provisions thus reported under these heads are adjusted as per Nepalese IY financials.
8. no Impairment of Account receivable
No provision of bad or doubtful debts are provided for in the financials in spite of having significant account receivable as on 31 December 2016 that amounts to INR 218,048,015 since no debt is considered doubtful.
9. provision for warranty Cost
Amount of Warranty claim estimated to be made on the company during the warranty period to be insignificant as such no provision for warranty cost are made as at 31 December 2016.
10. previous period information
The previous year’s figures have been regrouped wherever required.
11. revenue from supply of goods and services are as follows.
description Amount (in Inr)
Revenue from Supply of Goods 109,999,750
Revenue from Services 513,155,435
Revenue from sale of fixed asset 819,000
total 623,974,185
12. Information about key Management personnel are as follows:
Mr. Vatan Singh Rana- Country Manager is overall responsible for the country office. . Total personnel compensation made by the company to Mr. Rana during the period amounted to INR 7,081,628.
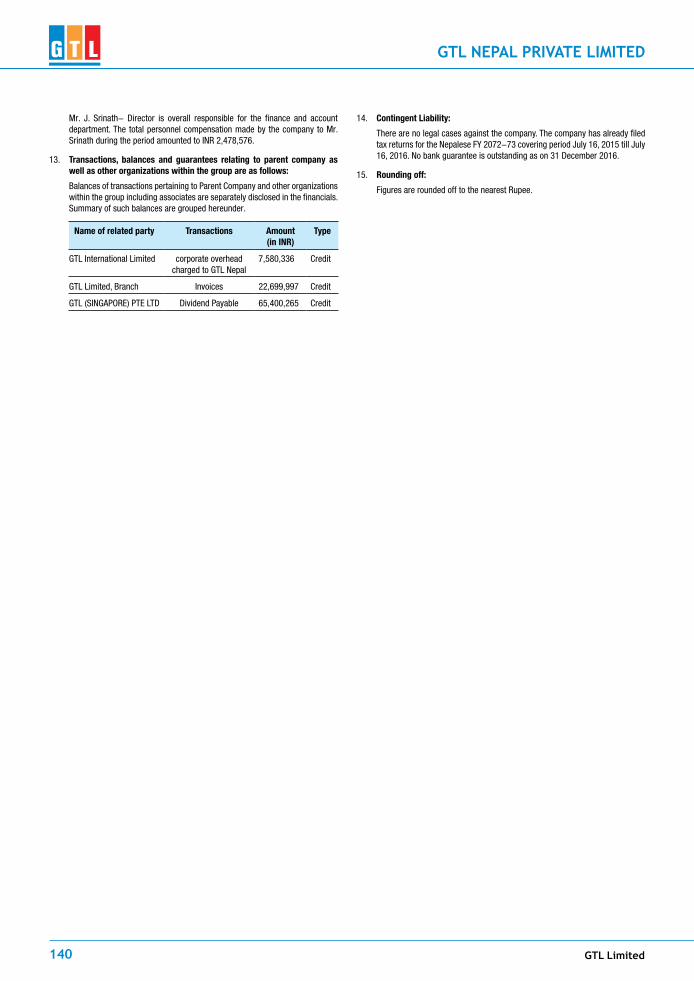
GTL Limited140
GTL NEPAL PrivATE LimiTEd
Mr. J. Srinath- Director is overall responsible for the finance and account department. The total personnel compensation made by the company to Mr. Srinath during the period amounted to INR 2,478,576.
13. transactions, balances and guarantees relating to parent company as well as other organizations within the group are as follows:
Balances of transactions pertaining to Parent Company and other organizations within the group including associates are separately disclosed in the financials. Summary of such balances are grouped hereunder.
name of related party transactions Amount(in Inr)
type
GTL International Limited corporate overhead charged to GTL Nepal
7,580,336 Credit
GTL Limited, Branch Invoices 22,699,997 Credit
GTL (SINGAPORE) PTE LTD Dividend Payable 65,400,265 Credit
14. Contingent Liability:
There are no legal cases against the company. The company has already filed tax returns for the Nepalese FY 2072-73 covering period July 16, 2015 till July 16, 2016. No bank guarantee is outstanding as on 31 December 2016.
15. rounding off:
Figures are rounded off to the nearest Rupee.
iGTL MyanMar LiMiTed
29th annual report 2016-17 141
STATEMENT OF MANAGEMENT’S RESPONSIBILITY
It is the responsibility of the management to prepare the financial statements for each financial year which give a true and fair view of the financial position of iGTL MYANMAR Limited as at the end of the year and the income for that year. In preparing these financial statements, the management is required to:
- Select suitable accounting policies and then apply them consistently: and
- Make judgement and estimates that are reasonable and prudent.
The management is responsible for keeping proper accounting records which disclose with reasonable accuracy at any time the financial position of the Company. We, as the Management Committee, have general responsibility for taking such steps as are reasonably open to them to safeguard the assets of the Company and to prevent and detect fraud and other irregularities.
On behalf of Management
Mr: Mahesh Singh Mr: Sanjay HirparaFinance Director Country HeadiGTL MYANMAR Limited iGTL MYANMAR Limited
April 7, 2017
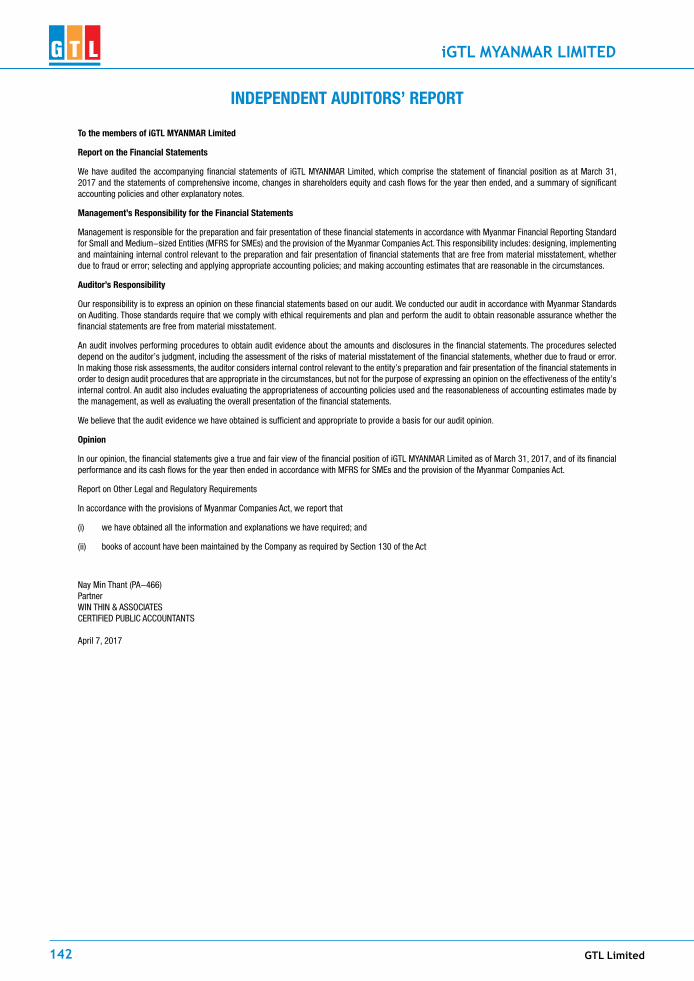
GTL Limited142
iGTL MyanMar LiMiTed
INdEPENdENT AudITORS’ REPORT
To the members of iGTL MYANMAR Limited
Report on the Financial Statements
We have audited the accompanying financial statements of iGTL MYANMAR Limited, which comprise the statement of financial position as at March 31, 2017 and the statements of comprehensive income, changes in shareholders equity and cash flows for the year then ended, and a summary of significant accounting policies and other explanatory notes.
Management’s Responsibility for the Financial Statements
Management is responsible for the preparation and fair presentation of these financial statements in accordance with Myanmar Financial Reporting Standard for Small and Medium-sized Entities (MFRS for SMEs) and the provision of the Myanmar Companies Act. This responsibility includes: designing, implementing and maintaining internal control relevant to the preparation and fair presentation of financial statements that are free from material misstatement, whether due to fraud or error; selecting and applying appropriate accounting policies; and making accounting estimates that are reasonable in the circumstances.
Auditor’s Responsibility
Our responsibility is to express an opinion on these financial statements based on our audit. We conducted our audit in accordance with Myanmar Standards on Auditing. Those standards require that we comply with ethical requirements and plan and perform the audit to obtain reasonable assurance whether the financial statements are free from material misstatement.
An audit involves performing procedures to obtain audit evidence about the amounts and disclosures in the financial statements. The procedures selected depend on the auditor’s judgment, including the assessment of the risks of material misstatement of the financial statements, whether due to fraud or error. In making those risk assessments, the auditor considers internal control relevant to the entity’s preparation and fair presentation of the financial statements in order to design audit procedures that are appropriate in the circumstances, but not for the purpose of expressing an opinion on the effectiveness of the entity’s internal control. An audit also includes evaluating the appropriateness of accounting policies used and the reasonableness of accounting estimates made by the management, as well as evaluating the overall presentation of the financial statements.
We believe that the audit evidence we have obtained is sufficient and appropriate to provide a basis for our audit opinion.
Opinion
In our opinion, the financial statements give a true and fair view of the financial position of iGTL MYANMAR Limited as of March 31, 2017, and of its financial performance and its cash flows for the year then ended in accordance with MFRS for SMEs and the provision of the Myanmar Companies Act.
Report on Other Legal and Regulatory Requirements
In accordance with the provisions of Myanmar Companies Act, we report that
(i) we have obtained all the information and explanations we have required; and
(ii) books of account have been maintained by the Company as required by Section 130 of the Act
Nay Min Thant (PA-466)PartnerWIN THIN & ASSOCIATESCERTIFIED PUBLIC ACCOUNTANTS
April 7, 2017

iGTL MyanMar LiMiTed
29th annual report 2016-17 143
BALANcE SHEET AS AT 31 MARcH 2017
As at31 March 2017
As at31 March 2016
As at 1 April 2015
As at31 March 2017
As at31 March 2016
As at 1 April 2015
INR in crore INR in crore INR in crore MMK MMK MMK Assets - - -
Non-current assets - - -
Property, plant and equipment 0.59 0.70 0.30 119,094,567 125,617,918 48,065,960
Capital work-in-progress - - - - - -
Investment properties - - - - - -
Intangible assets - - - - - -
Intangible assets under development - - - - - -
Financial assets - - -
Investments - - - - - -
Loans - - - - - -
Other financial assets - - - - - -
Deferred tax assets (net) - - - - - -
Other non-current assets 0.04 0.03 0.01 8,835,000 6,040,000 1,040,000
0.64 0.73 0.30 127,929,567 131,657,918 49,105,960 current assets - - -
Inventories 5.93 8.93 - 1,191,655,697 1,606,692,177 -
Financial assets - - -
Investments - - - - - -
Trade receivables 20.09 24.02 4.51 4,037,360,939 4,323,685,884 729,382,029
Cash and cash equivalents 3.33 3.92 0.58 669,088,744 704,934,363 93,738,355
Bank balance other than included in Cash and cash equivalents above
- - - - - -
Other receivables 1.04 0.58 0.30 208,273,690 104,253,474 48,891,116
Loans - - - - - -
Other financial assets - - - - - -
Current Tax Assets (Net) 4.94 2.94 0.19 992,443,133 529,181,551 30,481,454
Other current assets 3.26 1.52 1.37 655,263,261 273,770,881 220,981,335
38.58 41.90 6.94 7,754,085,464 7,542,518,330 1,123,474,289 Assets classified as held for sale - - -
38.58 41.90 6.94 7,754,085,464 7,542,518,330 1,123,474,289 Total Assets 39.22 42.63 7.25 7,882,015,031 7,674,176,248 1,172,580,249 Equity and liabilities - - -
Equity - - -
Equity Share Capital 1.15 1.29 0.31 232,025,000 232,025,000 50,000,000
Other Equity 9.32 8.60 0.57 1,873,340,532 1,547,325,978 91,834,229
Total Equity 10.47 9.89 0.88 2,105,365,532 1,779,350,978 141,834,229 Non-current liabilities: - - -
Financial liabilities - - -
Borrowings - - - - - -
Trade payables - - - - - -
Other financial liabilities - - - - - -
Provisions - - - - - -
Deferred tax liabilities (net) - - - - - -
Other non-current liabilities - - - - - -
- - - - - -
current liabilities: - - -
Financial liabilities - - -
Borrowings - - - - - -
Trade payables 20.57 22.37 5.73 4,135,202,061 4,026,581,279 926,562,205
Other financial liabilities - - - - - -
Other current liabilities 2.80 6.75 0.45 563,547,801 1,215,648,699 73,572,405
Provisions 5.36 3.63 0.19 1,077,899,637 652,595,292 30,611,410
Current tax liabilities (net) - - -
28.74 32.75 6.37 5,776,649,499 5,894,825,270 1,030,746,020
Total liabilities 28.74 32.75 6.37 5,776,649,499 5,894,825,270 1,030,746,020
Total equity and liabilities 39.22 42.63 7.25 7,882,015,031 7,674,176,248 1,172,580,249

GTL Limited144
iGTL MyanMar LiMiTed
STATEMENT OF PROFIT ANd LOSS FOR THE YEAR ENdEd 31ST MARcH, 2017
Year ended 31st March,
2017
Year ended 31st March,
2016 Restated*
Year ended 31st March,
2017
Year ended 31st March,
2016 Restated*
INR in crore INR in crore MMK MMK
Continuing operations
Revenue from operations 104.36 90.96 21,691,866,354 16,300,399,206
Other income 0.41 1.25 84,519,279 223,393,628
TOTAL INcOME 104.76 92.21 21,776,385,633 16,523,792,834
EXPENSES
Cost of materials consumed - - - -
Purchases of stock-in-trade 76.42 63.82 16,092,346,632 11,444,433,121
Changes in inventories of finished goods, stock-in-trade and work-in-progress 3.00 (8.93) 415,036,480 (1,606,692,177)
Employee benefits expenses 7.57 5.58 1,573,060,460 999,152,096
Finance costs - - - -
Depreciation and amortisation expenses 0.46 0.24 95,310,096 42,432,768
Other expenses 9.46 20.76 1,790,945,893 3,703,811,360
TOTAL EXPENSES 96.90 81.47 19,966,699,561 14,583,137,169
- -
Profit/(loss) before exceptional items and tax from continuing operations 7.86 10.74 1,809,686,072 1,940,655,665
Exceptional items - -
Profit/(loss) before tax from continuing operations 7.86 10.74 1,809,686,072 1,940,655,665
Tax expenses - -
Current tax 2.18 2.71 452,421,518 485,163,916
PROFIT FOR THE YEAR FROM cONTINuING OPERATIONS 5.69 8.03 1,357,264,554 1,455,491,749
discontinued operations: - -
Profit/ (loss) for the year from discontinued operations - - - -
Profit/(loss) for the year 5.69 8.03 1,357,264,554 1,455,491,749
Other comprehensive Income - -
Other comprehensive income for the year, net of tax - - - -
Total comprehensive Income for the period, net of tax 5.69 8.03 1,357,264,554 1,455,491,749

iGTL MyanMar LiMiTed
29th annual report 2016-17 145
STATEMENT OF cHANGES IN EquITY FOR THE YEAR ENdEd 31 MARcH 2017
a. Equity Share capital:
No. INR crores
At 1 April 2015 50, 000 0.31
Issue of share capital (Note 17) 150,000 1.01
At 31 March 2016 200,000 1.32
Issue of share capital (Note 17) - -
At 31 March 2017 200,000 1.32
b. Other Equity:
For the year ended 31 March 2017
Particulars Equity component
of compound financial
instrument (Note 18)
Reserves & Surplus Items of OcI Total equitycapital
Reserve (Note 18)
capital Redemption
Reserve (Note 18)
Securities premium account (Note 18)
debenture Redemption
Reserve (Note 18)
General reserve
(Note 18)
Balance in Statement of Profit and Loss (Note 18)
FVTOcI reserve
(Note 18)
INR in crores INR in crores INR in crores INR in crores INR in crores INR in crores INR in crores INR in crores INR in crores
As at 31st March 2016 - - - - - - 8.60 - -
Net Profit for the period 5.69 -
Other comprehensive income -
Total comprehensive income - - - - - - 5.69 - -
Dividends - - - - - - 4.96 - -
Transfer from debenture redemption reserve
- - - - - - - - -
Transfer from Balance in Statement of Profit and Loss
- - - - - - - - -
Transfer to general reserve - - - - - - - - -
Transfer to Balance in Statement of Profit and Loss
- - - - - - - - -
As at 31 March 2017 - - - - - - 9.32 - -
For the year ended 31 March 2016
Particulars Equity component
of compound financial
instrument (Note 18)
Reserves & Surplus Items of OcI Total equitycapital
Reserve (Note 18)
capital Redemption
Reserve (Note 18)
Securities premium account (Note 18)
debenture Redemption
Reserve (Note 18)
General reserve
(Note 18)
Balance in Statement of Profit and Loss (Note 18)
FVTOcI reserve
(Note 18)
INR in crores INR in crores INR in crores INR in crores INR in crores INR in crores INR in crores INR in crores INR in crores
As at 1st April 2015 - - - - - - 0.57 - -
Net Profit for the period 8.03 -
Other comprehensive income -
Total comprehensive income - - - - - - 8.03 - -
Impact of translation of financials into INDAS
-
Dividends - - - - - - - - -
Transfer from debenture redemption reserve
- - - - - - - - -
Transfer from Balance in Statement of Profit and Loss
- - - - - - - - -
Transfer to general reserve - - - - - - - - -
Transfer to Balance in Statement of Profit and Loss
- - - - - - - - -
As at 31 March 2016 - - - - - - 8.60 - -

GTL Limited146
iGTL MyanMar LiMiTed
STATEMENT OF cASH FLOwS FOR THE YEAR ENdEd 31 MARcH 2017
31 March 2017 31 March 2016 31 March 2017 31 March 2016
INR in crores INR in crores MMK MMK
Operating activities
Profit before tax from continuing operations 9.00 10.83 1,809,686,072 1,940,655,665
Profit/(loss) before tax from discontinued operations
Profit before tax 9.00 10.83 1,809,686,072 1,940,655,665
Adjustments to reconcile profit before tax to net cash flows:
Depreciation and impairment of property, plant and equipment 0.47 0.24 95,310,096 42,432,768
Gain on disposal of property, plant and equipment 0.01 - 1,277,811
Provision for current tax (net of MAT credit entitlement) - (2.71) (485,163,916)
Liabilities / provisions no longer required written back (0.13) - (27,122,281)
(Increase)/decrease in other current and non current assets (0.92) (31.38) (185,917,753) (5,622,848,032)
Increase /(decrease) in trade payables, other current and non current liabilities and provisions
(2.70) 27.14 (543,480,116) 4,864,079,250
14.72 14.95 1,149,753,829 739,155,735
Dividend paid (5.13) - (1,031,244,892) -
Income tax paid (including TDS) (net) (0.32) (1.06) (64,290,000) (190,000,000)
Net cash flows from operating activities 14.40 13.89 54,218,937 549,155,735
Proceeds from sale of property, plant and equipment
Purchase of property, plant and equipment (including CWIP) (0.45) (0.67) (90,064,556.00) (119,984,727.00)
Net cash flows from / (used in) investing activities (0.45) (0.67) (90,064,556.00) (119,984,727.00)
Financing activities
Proceeds from issue of equity share capital - 1.02 182,025,000.00
Net cash flows from / (used in) financing activities - 1.02 - 182,025,000.00
Net increase / (decrease) in cash and cash equivalents 13.96 14.24 (35,845,619.00) 611,196,008.00
Adjustment on account of translation (14.54) (10.90)
Cash and cash equivalents at the beginning of the year 3.92 0.58 704,934,363 93,738,355.00
cash and cash equivalents at the end 3.33 3.92 669,088,744.00 704,934,363.00

iGTL MyanMar LiMiTed
29th annual report 2016-17 147
3. Property, plant and equipment
Freehold land
Leasehold land
Buildings Plant & machinery
Furniture & fixtures
Office equipments
computers Vehicles Total
MMK MMK MMK MMK MMK MMK MMK MMK MMK
cost
At 1 April 2015 51,574,710.00 - - - 2,025,000.00 53,599,710.00
Additions 24,474,425.00 25,380,615.00 8,664,600.00 44,300,015.00 7,474,100.00 120,293,755.00
Disposals (590,000.00) 155,000.00 (435,000.00)
At 31 March 2016 - - - 75,459,135.00 25,380,615.00 8,819,600.00 44,300,015.00 9,499,100.00 173,458,465.00
Additions 48,348,960.00 8,265,000.00 2,491,058.00 29,499,538.00 1,460,000.00 90,064,556.00
Disposals (3,283,000.00) (1,350,000.00) (4,633,000.00)
At 31 March 2017 - - - 120,525,095.00 33,645,615.00 1,310,658.00 73,799,553.00 9,609,100.00 258,890,021.00
depreciation and impairment
At 1 April 2015 5,397,825.00 135,925.00 5,533,750.00
Depreciation charge for the year 20,384,888.00 7,684,775.00 4,382,027.00 8,272,698.00 1,761,053.00 42,485,441.00
Disposals (143,253.00) - (35,391.00) (178,644.00)
At 31 March 2016 - - - 25,639,460.00 7,684,775.00 4,382,027.00 8,237,307.00 1,896,978.00 47,840,547.00
Depreciation charge for the year** 48,099,413.00 10,211,701.00 8,355,845.00 24,028,947.00 4,614,190.00 95,310,096.00
Disposals (2,365,528.00) - (989,661.00) (3,355,189.00)
At 31 March 2017 - - - 71,373,345.00 17,896,476.00 12,737,872.00 32,266,254.00 5,521,507.00 139,795,454.00
Net Book Value
At 31 March 2017 - - - 49,151,750.00 15,749,139.00 8,572,786.00 41,533,299.00 4,087,593.00 119,094,567.00
At 31 March 2016 - - - 49,819,675.00 17,695,840.00 14,437,573.00 36,062,708.00 7,602,122.00 125,617,918.00
At 1 April 2015 - - - 46,176,885.00 - - - 1,889,075.00 48,065,960.00
Net Book Value
At 31 March 2017
At 31 March 2016
At 1 April 2015
INR in crores INR in crores INR in crores
Plant, property and equipment 119,094,567.00 125,617,918.00 48,065,960.00
Capital Work in Progress - - -
ScHEduLES TO FINANcIALS FOR THE YEAR ENdEd ANd AS AT 31 MARcH 2017
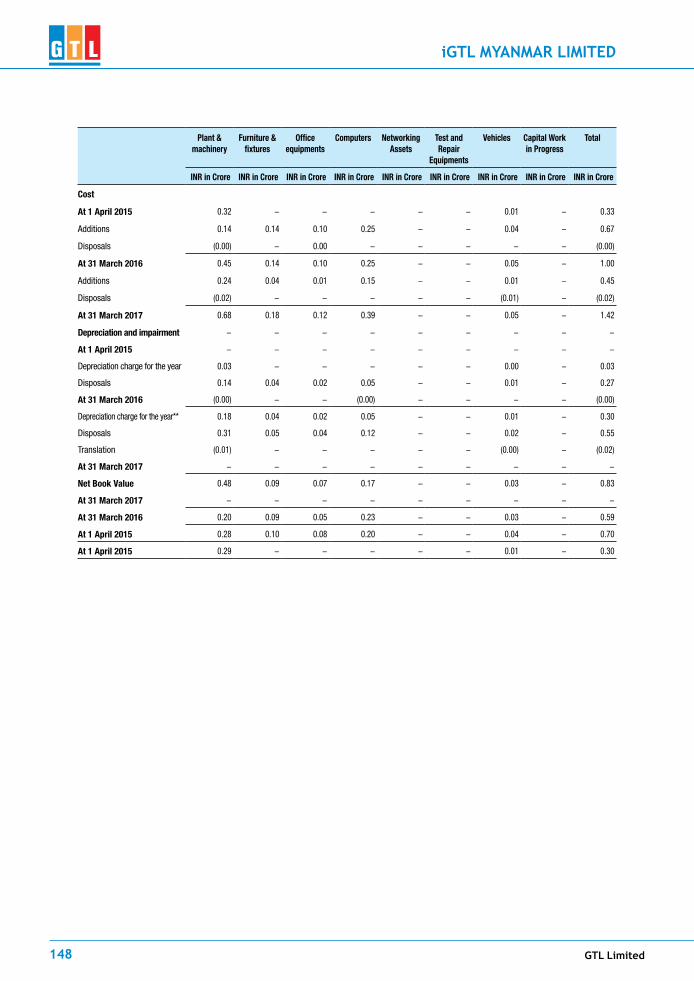
GTL Limited148
iGTL MyanMar LiMiTed
Plant & machinery
Furniture & fixtures
Office equipments
computers Networking Assets
Test and Repair
Equipments
Vehicles capital work in Progress
Total
INR in crore INR in crore INR in crore INR in crore INR in crore INR in crore INR in crore INR in crore INR in crore
cost
At 1 April 2015 0.32 - - - - - 0.01 - 0.33
Additions 0.14 0.14 0.10 0.25 - - 0.04 - 0.67
Disposals (0.00) - 0.00 - - - - - (0.00)
At 31 March 2016 0.45 0.14 0.10 0.25 - - 0.05 - 1.00
Additions 0.24 0.04 0.01 0.15 - - 0.01 - 0.45
Disposals (0.02) - - - - - (0.01) - (0.02)
At 31 March 2017 0.68 0.18 0.12 0.39 - - 0.05 - 1.42
depreciation and impairment - - - - - - - - -
At 1 April 2015 - - - - - - - - -
Depreciation charge for the year 0.03 - - - - - 0.00 - 0.03
Disposals 0.14 0.04 0.02 0.05 - - 0.01 - 0.27
At 31 March 2016 (0.00) - - (0.00) - - - - (0.00)
Depreciation charge for the year** 0.18 0.04 0.02 0.05 - - 0.01 - 0.30
Disposals 0.31 0.05 0.04 0.12 - - 0.02 - 0.55
Translation (0.01) - - - - - (0.00) - (0.02)
At 31 March 2017 - - - - - - - - -
Net Book Value 0.48 0.09 0.07 0.17 - - 0.03 - 0.83
At 31 March 2017 - - - - - - - - -
At 31 March 2016 0.20 0.09 0.05 0.23 - - 0.03 - 0.59
At 1 April 2015 0.28 0.10 0.08 0.20 - - 0.04 - 0.70
At 1 April 2015 0.29 - - - - - 0.01 - 0.30
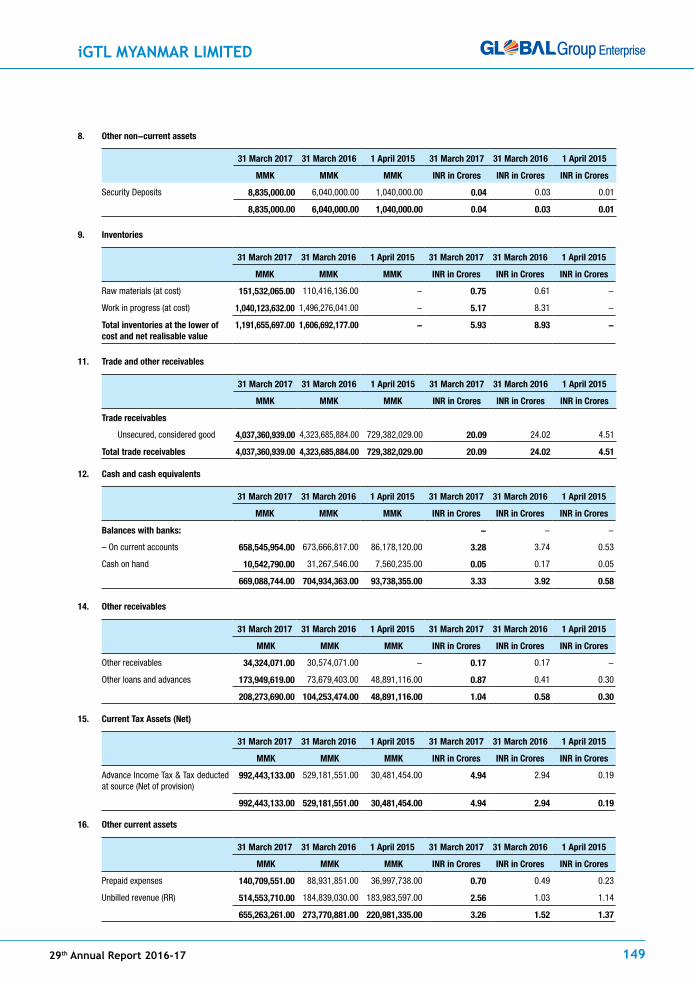
iGTL MyanMar LiMiTed
29th annual report 2016-17 149
8. Other non-current assets
31 March 2017 31 March 2016 1 April 2015 31 March 2017 31 March 2016 1 April 2015
MMK MMK MMK INR in crores INR in crores INR in crores
Security Deposits 8,835,000.00 6,040,000.00 1,040,000.00 0.04 0.03 0.01
8,835,000.00 6,040,000.00 1,040,000.00 0.04 0.03 0.01
9. Inventories
31 March 2017 31 March 2016 1 April 2015 31 March 2017 31 March 2016 1 April 2015
MMK MMK MMK INR in crores INR in crores INR in crores
Raw materials (at cost) 151,532,065.00 110,416,136.00 - 0.75 0.61 -
Work in progress (at cost) 1,040,123,632.00 1,496,276,041.00 - 5.17 8.31 -
Total inventories at the lower of cost and net realisable value
1,191,655,697.00 1,606,692,177.00 - 5.93 8.93 -
11. Trade and other receivables
31 March 2017 31 March 2016 1 April 2015 31 March 2017 31 March 2016 1 April 2015
MMK MMK MMK INR in crores INR in crores INR in crores
Trade receivables
Unsecured, considered good 4,037,360,939.00 4,323,685,884.00 729,382,029.00 20.09 24.02 4.51
Total trade receivables 4,037,360,939.00 4,323,685,884.00 729,382,029.00 20.09 24.02 4.51
12. cash and cash equivalents
31 March 2017 31 March 2016 1 April 2015 31 March 2017 31 March 2016 1 April 2015
MMK MMK MMK INR in crores INR in crores INR in crores
Balances with banks: - - -
– On current accounts 658,545,954.00 673,666,817.00 86,178,120.00 3.28 3.74 0.53
Cash on hand 10,542,790.00 31,267,546.00 7,560,235.00 0.05 0.17 0.05
669,088,744.00 704,934,363.00 93,738,355.00 3.33 3.92 0.58
14. Other receivables
31 March 2017 31 March 2016 1 April 2015 31 March 2017 31 March 2016 1 April 2015
MMK MMK MMK INR in crores INR in crores INR in crores
Other receivables 34,324,071.00 30,574,071.00 - 0.17 0.17 -
Other loans and advances 173,949,619.00 73,679,403.00 48,891,116.00 0.87 0.41 0.30
208,273,690.00 104,253,474.00 48,891,116.00 1.04 0.58 0.30
15. current Tax Assets (Net)
31 March 2017 31 March 2016 1 April 2015 31 March 2017 31 March 2016 1 April 2015
MMK MMK MMK INR in crores INR in crores INR in crores
Advance Income Tax & Tax deducted at source (Net of provision)
992,443,133.00 529,181,551.00 30,481,454.00 4.94 2.94 0.19
992,443,133.00 529,181,551.00 30,481,454.00 4.94 2.94 0.19
16. Other current assets
31 March 2017 31 March 2016 1 April 2015 31 March 2017 31 March 2016 1 April 2015
MMK MMK MMK INR in crores INR in crores INR in crores
Prepaid expenses 140,709,551.00 88,931,851.00 36,997,738.00 0.70 0.49 0.23
Unbilled revenue (RR) 514,553,710.00 184,839,030.00 183,983,597.00 2.56 1.03 1.14
655,263,261.00 273,770,881.00 220,981,335.00 3.26 1.52 1.37

GTL Limited150
iGTL MyanMar LiMiTed
14. Share capital
Authorised Share capital
Equity shares
Numbers MMK
At 1 April 2015 50,000.00 50,000,000.00
Increase / (decrease) during the year 150,000.00 182,025,000.00
At 31 March 2016 200,000.00 232,025,000.00
Increase / (decrease) during the year - -
At 31 March 2017 200,000.00 232,025,000.00
Equity shares Preference shares
Numbers INR in crore No. in crores INR in crore
At 1 April 2015 50,000.00 0.31 - -
Increase / (decrease) during the year 150,000.00 1.01 - -
At 31 March 2016 200,000.00 1.32 - -
Increase / (decrease) during the year - - - -
At 31 March 2017 200,000.00 1.32 - -
Issued equity capital
Equity shares of INR 1 each issued, subscribed and fully paid Numbers MMK INR in crore
At 1 April 2015 50,000 50,000,000.00 0.28
Changes during the year 150,000 182,025,000.00 1.01
At 31 March 2016 200,000 232,025,000.00 1.29
Changes during the year - - (0.13)
At 31 March 2017 200,000 232,025,000.00 1.15
15. Other equity
Balance in Statement of Profit and Loss
MMK INR in crore
At 1 April 2015 91,834,229.00 0.57
Add: Profit during the year 1,455,491,749.00 8.03
Less: Transfer to debenture redemption reserve - -
At 31 March 2016 1,547,325,978.00 8.60
Add: Profit during the year 1,357,264,554.00 5.69
Less: Dividend paid 1,031,250,000.00 4.96
At 31 March 2017 1,873,340,532.00 9.32
Total other equity
At 1 April 2015 91,834,229.00 0.57
At 31 March 2016 1,547,325,978.00 8.60
At 31 March 2017 1,873,340,532.00 9.32

iGTL MyanMar LiMiTed
29th annual report 2016-17 151
22. Provisions
31 March 2017 31 March 2016 1 April 2015 31 March 2017 31 March 2016 1 April 2015
MMK MMK MMK INR in crore INR in crore INR in crore
Other provisions 1,077,899,637.00 652,595,292.00 30,611,410.00 5.36 3.63 0.19
1,077,899,637.00 652,595,292.00 30,611,410.00 5.36 3.63 0.19
25. Trade payables
31 March 2017 31 March 2016 1 April 2015 31 March 2017 31 March 2016 1 April 2015
MMK MMK MMK INR in crore INR in crore INR in crore
Trade payables 4,135,202,061.00 4,026,581,279.00 753,963,205.00 20.57 22.37 4.66
Trade payables to related parties 172,599,000.00 1.07
4,135,202,061.00 4,026,581,279.00 926,562,205.00 20.57 22.37 5.73
27. Other current liabilities
31 March 2017 31 March 2016 1 April 2015 31 March 2017 31 March 2016 1 April 2015
MMK MMK MMK INR in crore INR in crore INR in crore
Advance from customers and unearned income
199,301,293.00 167,283,096.00 - 0.99 0.93 -
Unearned Revenue 204,610,916.00 852,218,596.00 18,754,235.00 1.02 4.73 0.12
Taxes and other liabilities 47,492,173.00 141,437,271.00 13,103,912.00 0.24 0.79 0.08
Accrued salaries and Employee benefits
112,143,419.00 54,709,736.00 41,714,258.00 0.56 0.30 0.26
563,547,801.00 1,215,648,699.00 73,572,405.00 2.80 6.75 0.45

GTL Limited152
iGTL MyanMar LiMiTed
29. Revenue from operations
31 March 2017 31 March 2016 31 March 2017 31 March 2016
MMK MMK INR in crore INR in crore
Rendering of Services
Telecom services 21,691,866,354.00 16,300,399,206.00 104.36 90.96
21,691,866,354.00 16,300,399,206.00 104.36 90.96
30. Other income
31 March 2017 31 March 2016 31 March 2017 31 March 2016
MMK MMK INR in crore INR in crore
Interest income 84,519,279.00 223,393,628.00 0.41 1.25
84,519,279.00 223,393,628.00 0.41 1.25
32. Purchases of stock-in-trade
31 March 2017 31 March 2016 31 March 2017 31 March 2016
MMK MMK INR in crore INR in crore
Inventory at the beginning of the year
Add: Purchase of material (Other than for trade) and services: 16,092,346,632.00 11,444,433,121.47 76.42 63.82
16,092,346,632.00 11,444,433,121.47 76.42 63.82
Less: inventory at the end of the year
Purchases of stock-in-trade 16,092,346,632.00 11,444,433,121.47 76.42 63.82
33. changes in inventories of finished goods, stock-in-trade and work-in-progress
31 March 2017 31 March 2016 31 March 2017 31 March 2016
MMK MMK INR in crore INR in crore
Opening Stock
Work-in-Process 1,496,276,041.00 - 8.32 -
Spares and consumables 110,416,136.00 - 0.61 -
Less: Closing Stock
Work-in-Process 1,040,123,632.00 (1,496,276,041.00) (5.17) (8.32)
Spares and consumables 151,532,065.00 (110,416,136.00) (0.75) (0.61)
2,798,347,874.00 (1,606,692,177.00) 3.00 (8.93)
34. Employee benefits expenses
31 March 2017 31 March 2016 31 March 2017 31 March 2016
MMK MMK INR in crore INR in crore
Salaries, wages and bonus 1,471,808,950.00 880,170,969.05 7.08 4.91
Staff welfare expense 101,251,510.00 118,981,127.00 0.49 0.66
1,573,060,460.00 999,152,096.05 7.57 5.58
36. depreciation and amortization expense
31 March 2017 31 March 2016 31 March 2017 31 March 2016
MMK MMK INR in crore INR in crore
Depreciation of tangible assets (note 3) 95,310,096.00 42,432,768.00 0.46 0.24
95,310,096.00 42,432,768.00 0.46 0.24
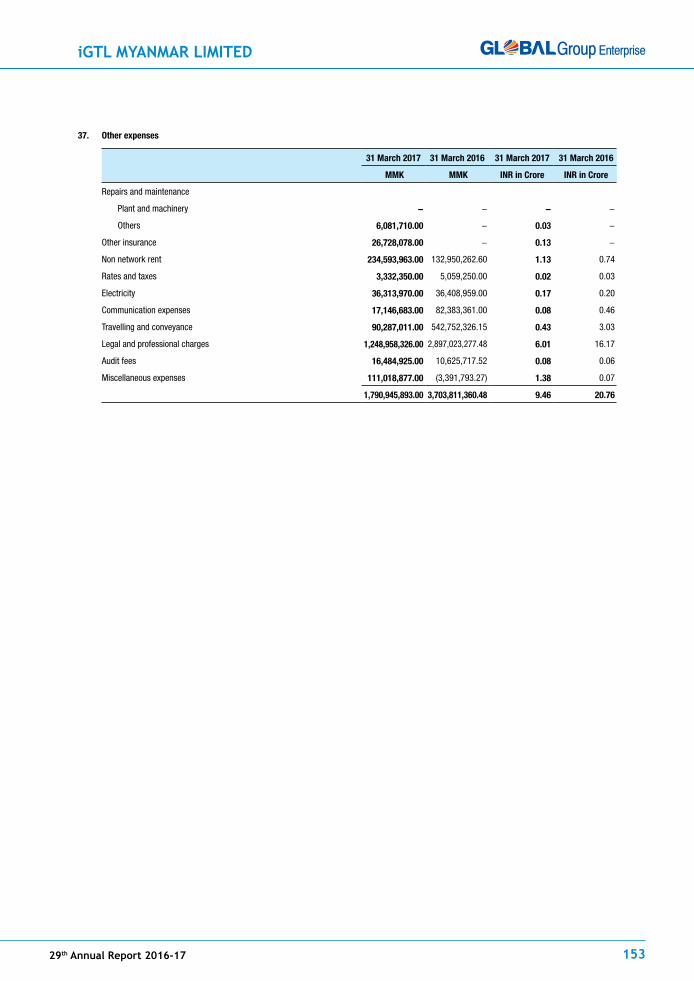
iGTL MyanMar LiMiTed
29th annual report 2016-17 153
37. Other expenses
31 March 2017 31 March 2016 31 March 2017 31 March 2016
MMK MMK INR in crore INR in crore
Repairs and maintenance
Plant and machinery - - - -
Others 6,081,710.00 - 0.03 -
Other insurance 26,728,078.00 - 0.13 -
Non network rent 234,593,963.00 132,950,262.60 1.13 0.74
Rates and taxes 3,332,350.00 5,059,250.00 0.02 0.03
Electricity 36,313,970.00 36,408,959.00 0.17 0.20
Communication expenses 17,146,683.00 82,383,361.00 0.08 0.46
Travelling and conveyance 90,287,011.00 542,752,326.15 0.43 3.03
Legal and professional charges 1,248,958,326.00 2,897,023,277.48 6.01 16.17
Audit fees 16,484,925.00 10,625,717.52 0.08 0.06
Miscellaneous expenses 111,018,877.00 (3,391,793.27) 1.38 0.07
1,790,945,893.00 3,703,811,360.48 9.46 20.76
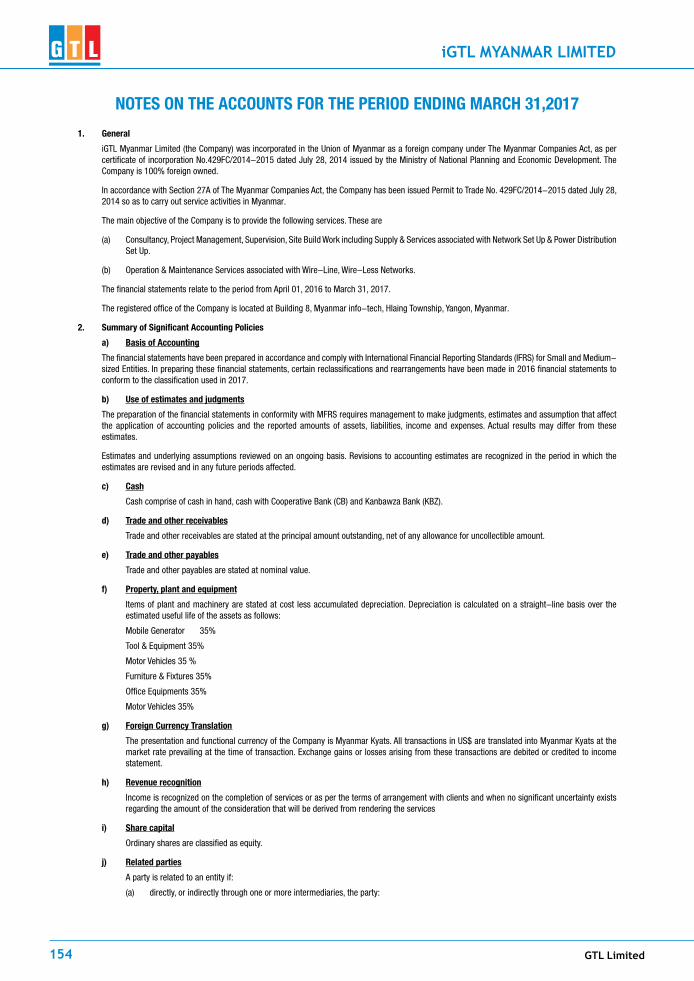
GTL Limited154
iGTL MyanMar LiMiTed
NOTES ON THE AccOuNTS FOR THE PERIOd ENdING MARcH 31,2017
1. General
iGTL Myanmar Limited (the Company) was incorporated in the Union of Myanmar as a foreign company under The Myanmar Companies Act, as per certificate of incorporation No.429FC/2014-2015 dated July 28, 2014 issued by the Ministry of National Planning and Economic Development. The Company is 100% foreign owned.
In accordance with Section 27A of The Myanmar Companies Act, the Company has been issued Permit to Trade No. 429FC/2014-2015 dated July 28, 2014 so as to carry out service activities in Myanmar.
The main objective of the Company is to provide the following services. These are
(a) Consultancy, Project Management, Supervision, Site Build Work including Supply & Services associated with Network Set Up & Power Distribution Set Up.
(b) Operation & Maintenance Services associated with Wire-Line, Wire-Less Networks.
The financial statements relate to the period from April 01, 2016 to March 31, 2017.
The registered office of the Company is located at Building 8, Myanmar info-tech, Hlaing Township, Yangon, Myanmar.
2. Summary of Significant Accounting Policies
a) Basis of Accounting
The financial statements have been prepared in accordance and comply with International Financial Reporting Standards (IFRS) for Small and Medium-sized Entities. In preparing these financial statements, certain reclassifications and rearrangements have been made in 2016 financial statements to conform to the classification used in 2017.
b) use of estimates and judgments
The preparation of the financial statements in conformity with MFRS requires management to make judgments, estimates and assumption that affect the application of accounting policies and the reported amounts of assets, liabilities, income and expenses. Actual results may differ from these estimates.
Estimates and underlying assumptions reviewed on an ongoing basis. Revisions to accounting estimates are recognized in the period in which the estimates are revised and in any future periods affected.
c) cash
Cash comprise of cash in hand, cash with Cooperative Bank (CB) and Kanbawza Bank (KBZ).
d) Trade and other receivables
Trade and other receivables are stated at the principal amount outstanding, net of any allowance for uncollectible amount.
e) Trade and other payables
Trade and other payables are stated at nominal value.
f) Property, plant and equipment
Items of plant and machinery are stated at cost less accumulated depreciation. Depreciation is calculated on a straight-line basis over the estimated useful life of the assets as follows:
Mobile Generator 35%
Tool & Equipment 35%
Motor Vehicles 35 %
Furniture & Fixtures 35%
Office Equipments 35%
Motor Vehicles 35%
g) Foreign currency Translation
The presentation and functional currency of the Company is Myanmar Kyats. All transactions in US$ are translated into Myanmar Kyats at the market rate prevailing at the time of transaction. Exchange gains or losses arising from these transactions are debited or credited to income statement.
h) Revenue recognition
Income is recognized on the completion of services or as per the terms of arrangement with clients and when no significant uncertainty exists regarding the amount of the consideration that will be derived from rendering the services
i) Share capital
Ordinary shares are classified as equity.
j) Related parties
A party is related to an entity if:
(a) directly, or indirectly through one or more intermediaries, the party:
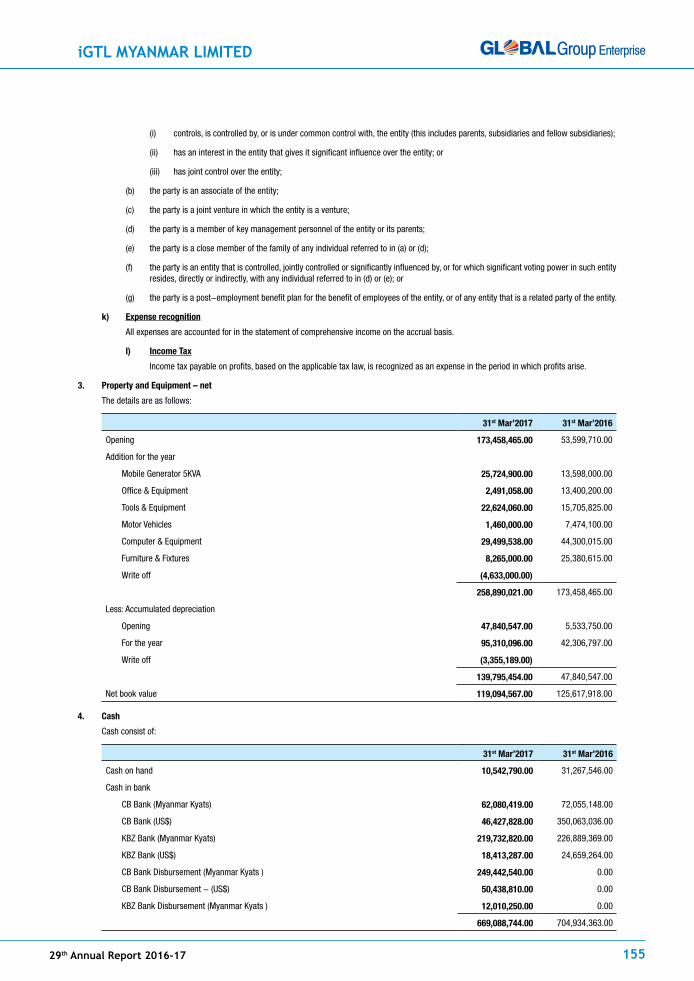
iGTL MyanMar LiMiTed
29th annual report 2016-17 155
(i) controls, is controlled by, or is under common control with, the entity (this includes parents, subsidiaries and fellow subsidiaries);
(ii) has an interest in the entity that gives it significant influence over the entity; or
(iii) has joint control over the entity;
(b) the party is an associate of the entity;
(c) the party is a joint venture in which the entity is a venture;
(d) the party is a member of key management personnel of the entity or its parents;
(e) the party is a close member of the family of any individual referred to in (a) or (d);
(f) the party is an entity that is controlled, jointly controlled or significantly influenced by, or for which significant voting power in such entity resides, directly or indirectly, with any individual referred to in (d) or (e); or
(g) the party is a post-employment benefit plan for the benefit of employees of the entity, or of any entity that is a related party of the entity.
k) Expense recognition
All expenses are accounted for in the statement of comprehensive income on the accrual basis.
l) Income Tax
Income tax payable on profits, based on the applicable tax law, is recognized as an expense in the period in which profits arise.
3. Property and Equipment – net
The details are as follows:
31st Mar’2017 31st Mar’2016
Opening 173,458,465.00 53,599,710.00
Addition for the year
Mobile Generator 5KVA 25,724,900.00 13,598,000.00
Office & Equipment 2,491,058.00 13,400,200.00
Tools & Equipment 22,624,060.00 15,705,825.00
Motor Vehicles 1,460,000.00 7,474,100.00
Computer & Equipment 29,499,538.00 44,300,015.00
Furniture & Fixtures 8,265,000.00 25,380,615.00
Write off (4,633,000.00)
258,890,021.00 173,458,465.00
Less: Accumulated depreciation
Opening 47,840,547.00 5,533,750.00
For the year 95,310,096.00 42,306,797.00
Write off (3,355,189.00)
139,795,454.00 47,840,547.00
Net book value 119,094,567.00 125,617,918.00
4. cash
Cash consist of:
31st Mar’2017 31st Mar’2016
Cash on hand 10,542,790.00 31,267,546.00
Cash in bank
CB Bank (Myanmar Kyats) 62,080,419.00 72,055,148.00
CB Bank (US$) 46,427,828.00 350,063,036.00
KBZ Bank (Myanmar Kyats) 219,732,820.00 226,889,369.00
KBZ Bank (US$) 18,413,287.00 24,659,264.00
CB Bank Disbursement (Myanmar Kyats ) 249,442,540.00 0.00
CB Bank Disbursement - (US$) 50,438,810.00 0.00
KBZ Bank Disbursement (Myanmar Kyats ) 12,010,250.00 0.00
669,088,744.00 704,934,363.00
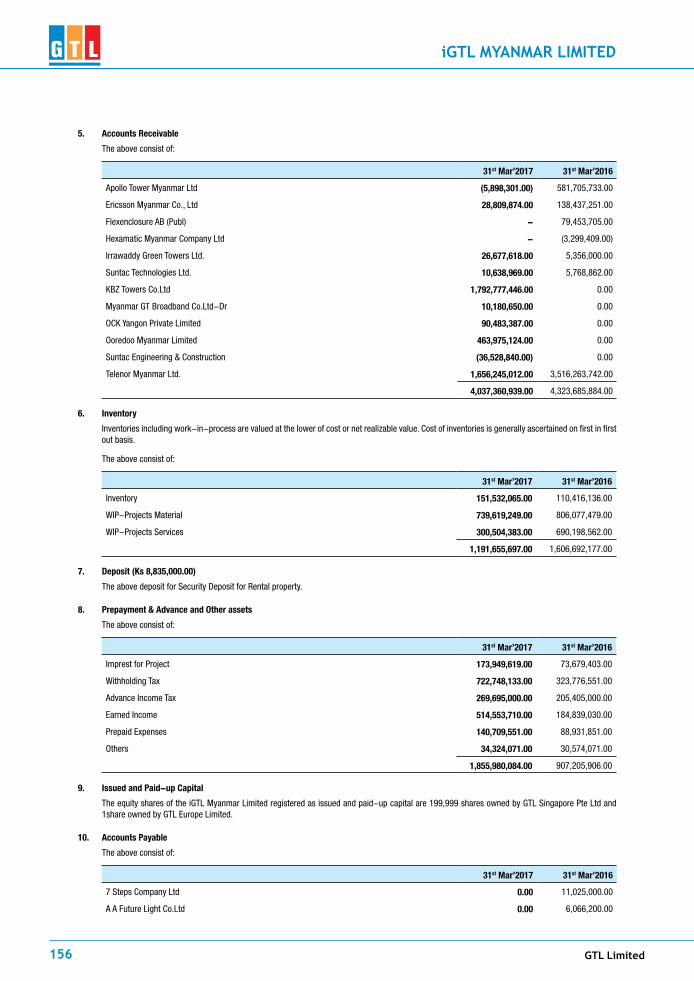
GTL Limited156
iGTL MyanMar LiMiTed
5. Accounts Receivable
The above consist of:
31st Mar’2017 31st Mar’2016
Apollo Tower Myanmar Ltd (5,898,301.00) 581,705,733.00
Ericsson Myanmar Co., Ltd 28,809,874.00 138,437,251.00
Flexenclosure AB (Publ) - 79,453,705.00
Hexamatic Myanmar Company Ltd - (3,299,409.00)
Irrawaddy Green Towers Ltd. 26,677,618.00 5,356,000.00
Suntac Technologies Ltd. 10,638,969.00 5,768,862.00
KBZ Towers Co.Ltd 1,792,777,446.00 0.00
Myanmar GT Broadband Co.Ltd-Dr 10,180,650.00 0.00
OCK Yangon Private Limited 90,483,387.00 0.00
Ooredoo Myanmar Limited 463,975,124.00 0.00
Suntac Engineering & Construction (36,528,840.00) 0.00
Telenor Myanmar Ltd. 1,656,245,012.00 3,516,263,742.00
4,037,360,939.00 4,323,685,884.00
6. Inventory
Inventories including work-in-process are valued at the lower of cost or net realizable value. Cost of inventories is generally ascertained on first in first out basis.
The above consist of:
31st Mar’2017 31st Mar’2016
Inventory 151,532,065.00 110,416,136.00
WIP-Projects Material 739,619,249.00 806,077,479.00
WIP-Projects Services 300,504,383.00 690,198,562.00
1,191,655,697.00 1,606,692,177.00
7. deposit (Ks 8,835,000.00)
The above deposit for Security Deposit for Rental property.
8. Prepayment & Advance and Other assets
The above consist of:
31st Mar’2017 31st Mar’2016
Imprest for Project 173,949,619.00 73,679,403.00
Withholding Tax 722,748,133.00 323,776,551.00
Advance Income Tax 269,695,000.00 205,405,000.00
Earned Income 514,553,710.00 184,839,030.00
Prepaid Expenses 140,709,551.00 88,931,851.00
Others 34,324,071.00 30,574,071.00
1,855,980,084.00 907,205,906.00
9. Issued and Paid-up capital
The equity shares of the iGTL Myanmar Limited registered as issued and paid-up capital are 199,999 shares owned by GTL Singapore Pte Ltd and 1share owned by GTL Europe Limited.
10. Accounts Payable
The above consist of:
31st Mar’2017 31st Mar’2016
7 Steps Company Ltd 0.00 11,025,000.00
A A Future Light Co.Ltd 0.00 6,066,200.00

iGTL MyanMar LiMiTed
29th annual report 2016-17 157
31st Mar’2017 31st Mar’2016
A R Tel (Myanmar) Limited 26,991,052.00 0.00
Ajay Singh Group 0.00 300,000.00
Akbar Travels of India Pvt Limited 26,483,905.00 52,342,787.69
AnJ Tele Logistics Limited 1,450,700.00 9,806,300.00
Apparent Power Engineering General Trading Co.Ltd 0.00 1,524,660.00
Arkar Sun Co.Ltd 0.00 165,000.00
Arvensis Dhanyataa Co.Ltd 1,959,872.00 0.00
Arvensis Energy Pvt.Ltd 0.00 (1,464,432.24)
Asia Forward Co.Ltd Construction 3,466,700.00 7,128,670.00
Asia Golden Family Group Co.Ltd 1,604,080.00 3,746,500.00
Asia Sonyan Construction 0.00 3,472,538.00
ASM Construction Material 270,000.00 36,811,400.00
Aung Ko Latt 0.00 1,145,430.00
Aung Myo Oo (300,002.00) 1,392,838.50
Aung Pyitan 0.00 2,646,000.00
Aung Soe Moe Car Rental Service 700,000.00 0.00
Aung Thazin Khant Co.Ltd 0.00 3,162,900.00
Aung Thein Than Co.Ltd 8,450,050.00 365,000.00
Aung Zaw Than 0.00 806,490.00
Ausnet Engineering Services (Pty)Ltd 0.00 1,874,640.00
Ayar Thaw Construction Company Limited 0.00 2,015,823.00
Aye Mya Chan Thar 0.00 3,136,000.00
Beautiful Days Co.Ltd (1,520,000.00) 7,552,493.18
Best Passage Co.Ltd 0.00 1,150,000.00
Bhartiya Infrastructure Co.Ltd 0.00 700,000.00
Black Hawk Security Services 29,200.00 29,200.00
Bluewave Broadband Limited 2,529,248.00 0.00
BNU Myanmar Co.Ltd 0.00 1,380,000.00
Building & Land Leader Group Company Limited 0.00 695,950.00
CAM Construction & Decoration 4,333,259.00 1,042,644.80
Cattleya Company Limited 787,700.00 10,340,534.00
Cellex Myanmar Ltd 664,000.00 0.00
Cherry Power Co.Ltd 0.00 848,000.00
Chin Su (Myanmar) Co.Ltd 0.00 (2,500,000.00)
Chit Moe Hein 0.00 1,205,000.00
Classic Electrical & Engineering Co.Ltd 31,488,977.00 29,696,448.50
Classic Wire & Cable Co. Ltd 0.00 (999.92)
Clover Solutions Co.Ltd 9,919,950.00 7,152,877.16
Conca Myanmar Engineering Co.Ltd 18,871,223.00 0.00
Concordia Intl Co.Ltd 0.00 1,470,000.00
Daw Htay Company Limited 766,000.00 33,868,680.00
Daw Sandar (3,098,080.00) 0.00
Daw Tin Kyi 0.00 288,000.00
Day to Day -Motel 0.00 (2,352,000.00)
Diamond Delta Company Limited 0.00 140,000.00
Dollar Mandalay Company Limited 0.00 26,591,040.00

GTL Limited158
iGTL MyanMar LiMiTed
31st Mar’2017 31st Mar’2016
Durang Company Limited 520,716.00 0.00
E21 International Co.Ltd 0.00 721,907.00
EGV Engineering Co.Ltd 3,289,300.00 0.00
EKS Company Limited 1,683,000.00 14,657,026.00
Etaha Company Limited 0.00 276,000.00
Extreme Company Limited (100,000.00) 18,986,810.00
Family Constriction Group 0.00 (136,500.00)
Future Soiltechnics Co Ltd 0.00 686,000.00
GCI (Hongkong)Limited 2,534,137.00 0.00
Genius Infotek 101,973.00 0.00
Genno Safety & PPE Sales Centre 0.00 1,666,160.00
GH Services Myanmar Pvt Ltd 171,745.00 3,901,000.00
Global Crop Construction Co Ltd 1,229,401.00 4,916,495.00
Global Link Myanmar Construction Group.Ltd 0.00 92,000.00
Gold Tower Telecom Services 53,800.00 1,557,800.00
Golden Ariya Company Limited 0.00 1,000,000.00
Golden Four Stars Construction Co.Ltd 0.00 143,000.00
Golden Gate Global Myanmar Pte.Ltd 0.00 (3,700.00)
Golden Infra Co.Ltd 1,594,300.00 0.00
Golden Myanmar Crystal Co. Ltd 120,000.00 0.00
Golden Sea & Land Forwarding Co.Ltd (5,048,943.00) 2,622,241.00
Golden Seven Arrow 0.00 553,000.00
Golden Sparrow Trading Co Ltd 0.00 420,000.00
GTL (Singapore) Pte Ltd-AP 1,539,638,850.00 1,187,838,108.20
GTL India 0.00 3,029,709.07
Haha Travels & Tours 1,149,528.00 1,264,640.00
Hardware World 0.00 (1,260.00)
Hein Min Tun 0.00 830,900.00
High Aims (ASIA) Co.Ltd 4,574,829.00 3,188,303.00
High Power Group Engineering Company Limited (155,000.00) 1,697,000.00
Highlandz Group of Services (144,050.00) 10,917,250.00
Hla Min 0.00 1,999,200.00
Hlwann Htet Aung Co.Ltd 0.00 4,341,250.00
HO Brothers Holdings Limited (27,500.00) 10,482,000.00
Hsu Hlan Phyo Co.Ltd 620,000.00 0.00
Htein Lin 0.00 563,538.00
Htet Hlyan Toeconstruction Co.Ltd 4,996,750.00 0.00
Htet Kyaw Construction Co.Ltd 0.00 3,575,375.00
Htet Nandar Aung Construction Co.Ltd 970,000.00 0.00
Htun Yay Chan Co.Ltd 599,400.00 0.00
Iceberg Myanmar Co.Ltd 5,368,724.00 0.00
IMA Executive Search (17,850,754.00) 151,611,858.00
Immortal Myanmar Power 5,248,400.00 0.00
Inn Thar 0.00 341,650.00
Intelux Electronics Pvt Ltd 65,419,298.00 0.00

iGTL MyanMar LiMiTed
29th annual report 2016-17 159
31st Mar’2017 31st Mar’2016
Inya Land Co.Ltd (436.00) 0.00
Jai Ram & Comapny 380,300.00 3,395,200.00
James & Associate Electrical Engineering 0.00 8,279,980.00
Jhamuna Tower Tech(Madras)PVT LTD 9,770,650.00 37,035,057.79
Kanni Petroleum 6,231,280.00 0.00
Kaung Thant Hein Construction Co.Ltd 0.00 2,275,303.00
Key Link Business Services Co.Ltd 10,213,934.00 3,647,300.00
Khin Zaw Technology 0.00 10,200.00
King Janaka Natural Resources & Technology Company 10,846,258.00 33,867,400.00
Ko Babu Car Service Centre 1,646,000.00 4,789,200.00
Ko Htet Maung Kyaw 0.00 979,900.00
Ko Kyaw Thu 0.00 360,000.00
Ko Taung Htike Group 0.00 1,551,894.00
Ko Thant Zin Electrical Service Centre 0.00 3,490,000.00
KST Engineering Services 3,728,790.00 0.00
KTZ & ASG Co Ltd 3,498,984.00 0.00
Kunjankishor Trading Co.Ltd (311,400.00) 2,398,680.00
Kyaw 0.00 880.00
Kyaw Kyar @ Aung Aye Oo 4,380,578.00 20,582,500.00
Kyaw Kyaw Tun 0.00 61,800.00
Kyaw Oo Lwin 0.00 101,150.00
Kyaw Swar Lynn 4,445,434.00 1,475,841.58
Kyaw Than Htike 0.00 2,049.00
Kyi Zaw Moe Construction Co.Ltd 0.00 3,372,567.02
Lin Htit Tay Za Company Ltd 2,385,950.00 0.00
M.A.N Family Engineer Service Group 438,600.00 1,163,504.00
Man Myo Thu Company Limited 0.00 1,083,000.00
Mar Tar Thiri Construction Co.Ltd 0.00 3,484,250.00
Maung Chit (Roshan) 0.00 1,211,886.00
Max & Best Co.Ltd 5,695,111.00 0.00
Max Integrate Co.Ltd 1,998,852.00 0.00
May Pan Chi 0.00 16,106,250.00
Mega Cosmos Construction Co.Ltd (42,000.00) 915,500.00
Mega Thirty Nine Development Co.Ltd 529,000.00 0.00
Metal Prince Co.Ltd 3,133,502.00 4,885,330.00
Mg Pyae Phyo Wai 0.00 244,040.00
MHM Electrical Group 0.00 127,400.00
Min Lwin 0.00 300,000.00
Mistral Company Limited 9,112,500.00 0.00
Mithi Software Technologies Pvt Ltd (2,256,834.00) 0.00
Mizima Limited 0.00 2,646,000.00
MK Kazee Company Limited 270,000.00 0.00
MN Infrastructure Private Limited 22,995,328.00 0.00
Moe De 0.00 170,000.00
Moe Myint Moul Aung & Company Family Limited (26,000.00) 4,867,209.14
Moe Yan Min Pyae 0.00 892,200.00

GTL Limited160
iGTL MyanMar LiMiTed
31st Mar’2017 31st Mar’2016
Mon Yazar Co.Ltd 0.00 1,037,944.00
Moon Ray Towers Company Ltd (10,800.00) 22,255,850.00
My Asia Consulting Co Ltd 0.00 (213.50)
My Tech Company Limited 0.00 878,400.00
Myan Shwe Pyi Tractors Ltd 0.00 (80.00)
Myanmar GT Broadband Co Ltd 4,998,000.00 0.00
Myanmar HEMAS Power Co.Ltd 0.00 1,639,446.44
Myanmar Idel Group 0.00 1,372,000.00
Myanmar K Block Company Linited 0.00 320,000.00
Myay Latt Htar Ni Co.Ltd (2,920,000.00) 1,545,000.00
Myayarpin Engineering & Trading Co.Ltd 0.00 475,000.00
Myint Soe & Friends Group 0.00 960,000.00
Nadi Oo Trading Co.Ltd 1,000.00 841,000.00
Naing Lin Tun 0.00 790,000.00
Nay Win 0.00 100,000.00
New Blaze Co.Ltd 370,000.00 0.00
Nilar Shwe Sin Trading Co.Ltd 3,229,000.00 0.00
Nyein Chan Tower Insatallation Services 0.00 455,000.00
OK Kaung Pyae Company Ltd 4,066,250.00 447,000.80
Olympic ( Battery Trading Ship) 0.00 (260,000.00)
One Cloud Co.Ltd (953.00) 1,513,121.40
Pan Taw Oo Company Limited 5,097,650.00 1,128,920.00
Panache Service Company Limited 5,032,575.00 0.00
Patel Tele Networking Co.Ltd 1,344,400.00 7,946,000.00
Peace & Fine Construction Commpany 32,915,915.00 100,190,300.00
Perfect Ambition Group (199,300.00) 2,779,600.00
Perspective Engineering Co.Ltd 0.00 2,846,000.00
Phone Lattyar Construction Co.Ltd 4,218,400.00 1,960,000.00
Phyo Htet Paing Engineering Group Co.Ltd (3,056,083.00) 0.00
Pioneer Power Tools Co.Ltd 1,307,320.00 0.00
Popa Myanmar Alliance Company Limited 173,795.00 6,578,550.00
Power Link Investment Co.Ltd 194,303.00 0.00
Pro JS-Techno Co. Ltd 182,238.00 0.00
Professional Connect 613.00 0.00
Promers Company Limited 260,000.00 920,000.00
Pyae Maung Maung Family Co.Ltd 491,150.00 0.00
Pyi Shwe Bo Multi Development Public Co.Ltd (275,993.00) 0.00
Qingdao Huijintong Power Equipment Co.Ltd 11,661,101.00 142,287,039.58
Ra B Kan 0.00 239,000.00
Rajar Telecommunications Limited 180,500.00 0.00
Rajgar Telecommunications Limited 0.00 2,223,800.00
Rangooners Co.Ltd 350,000.00 0.00
Rohan Infotech (15,746,082.00) 0.00
Rosenberger Technology(Kunshan)Co Ltd 1,103.00 0.00
Royal Construction Group 0.00 1,723,000.00
Royal Green Light Co.Ltd 0.00 1,320,000.00

iGTL MyanMar LiMiTed
29th annual report 2016-17 161
31st Mar’2017 31st Mar’2016
Royal Kaung Mon Co.Ltd 2,477,250.00 0.00
Royal Lotus Hotel 0.00 3,671,184.05
Royal Marine Trading Co.Ltd 0.00 (8,000.00)
Royal Techno Net Group 512,000.00 5,558,200.00
RR Infra Ltd 2,702,481.00 0.00
RYNSB Engineering Company Limited 0.00 140,000.00
Salween Motors Pte Ltd 2,117,800.00 6,135,330.00
San Lwin 0.00 881,000.00
San San Aye 0.00 1,026,623.00
Saw Khine Trading Co.Ltd 0.00 62,365,050.00
SD Zay Yar Lwin Co.Ltd 0.00 5,811,560.00
Sense Capital Company Limited (451,068.00) 0.00
Shan Thit Sar Co.Ltd 175,000.00 1,510,000.00
Sharma Jit Family 0.00 285,000.00
Shein Htet Zaw 0.00 3,312,000.00
Shilpa Design & Building Services Co.Ltd 1,401,400.00 238,000.00
Shukhintha Construction Co.Ltd 0.00 574,320.00
Shwe Ein Machinery Ltd 11,618,693.00 8,851,961.57
Shwe Hnin Satt Co.Ltd 4,849,600.00 0.00
Shwe Htee Ngwe Htee Co.Ltd 0.00 330,000.00
Shwe Lu Pyan Construction & Decoration 196,000.00 22,573,500.00
Shyam Services (151,136.00) 5,744,580.42
Smile Mann Myot Taw Co.Ltd 1,066,550.00 28,528,640.00
Soe Win Aung Engineering Group 0.00 700,000.00
Solusys Consulting Myanmar Limited 5,516,165.00 0.00
Speed Net Co.Ltd 7,862,101.00 32,811,014.00
SRI V.M.M Trading Company Ltd 28,371,651.00 0.00
Steel World Construction Group 0.00 250,000.00
Success Glory 0.00 7,816,714.00
Sule Tech Solutions Co.Ltd 733,796.00 2,129,559.14
Suntac Engineering & Construction-CRS (7,968,477.00) 17,377,706.00
Suntac Technologies(CR) 0.00 2208510.77
Sweet Furniture Mart 0.00 (27,900.00)
Sxila Engineering Group 240,000.00 0.00
Synergy Seven Co.Ltd 0.00 240,000.00
Tai An Hubang Communications Technology 0.00 11,096,160.00
Taw Win Tun 0.00 1470000
Tet Nay Lin Company Limited 0.00 466,000.00
Than & Chan Co.Ltd 1,749,492.00 0.00
Than Naing Soe 2,156,000.00 0.00
The Sun Circle Engi & Construction Co Ltd 1,332,500.00 0.00
Thein Toe Aung Co Ltd 0.00 100,000.00
Thein Tun Aung (1,500,655.00) 6,080,810.00
Thet Naung Soe Group 0.00 1,542,048.00
Thet Paing Soe Transport Services 0.00 (20,000.00)
Thiha Salt & Sugar Trading 0.00 300,000.00

GTL Limited162
iGTL MyanMar LiMiTed
31st Mar’2017 31st Mar’2016
Thiri Cho Trading Co.Ltd 2,957,180.00 0.00
Three Gems Co.Ltd 1,749,492.00 0.00
Tin Yu 0.00 500,000.00
Titan Star Co.Ltd 2,626,500.00 0.00
Top Trust Travels & Tours Co.Ltd 250,000.00 0.00
Traditional Land Co.Ltd 0.00 500,000.00
Triple Gems Development Company Limited 4,515,861.00 11,278,471.00
True Myanmar Co.Ltd 0.00 669,200.00
Trust Technologies Limited 0.00 2,891,000.00
Tun Shwe 0.00 790,780.00
Tun Tun Aung 0.00 1,584,720.00
U Hla Myo Aung 0.00 890,000.00
U Khin Maung Oo 0.00 550,000.00
U Ngwe San 0.00 190,300.00
U Than Htike 0.00 416,840.00
U Than Ohn & Sons Co.Ltd 0.00 479,520.00
U Yay Chann Construction Groups 0.00 770,000.00
Union Power Team Company 18,412,305.00 24,308,630.00
Unique Standard Co.Ltd 2,255,960.00 0
United Technical Power Engineering Co.Ltd 0.00 3,118,000.00
Vandana Co Ltd 3,549,000.00 0.00
Vidath Engineering Services Myanmar Co.Ltd 0.00 2,596,000.00
Wai Hin Yan Transportation & Construction Co.Ltd 53,972,677.00 0.00
Wai Lin Aung 0.00 593,700.00
Wai Yan 0.00 689740
Win Myint (500,000.00) 0.00
Win Thin & Associates (68,100.00) (693311.60)
Wincom Workforce Solutions 17,758,915.00 0.00
Yadanar Thiengi Construction Group 0.00 1,392,300.00
Yadanar Thukha Company Limited 346,500.00 26,863,580.00
Yaung Sin Ni Construction Co Ltd 1,428,292.00 0.00
Yaung Chi Linn Thit Co.Ltd 0.00 690,000.00
Yaw Ayar(SU PAUNG)CO.LTD 110,000.00 500,000.00
Ye Kyaw Win (140,000.00) 450,000.00
Ye Yint Aung Transport & Service 0.00 2,058,000.00
Zalatni Stationery 0.00 181,560.60
Zaw Min Oo 0.00 1,313,400.00
Zaw Myo Aye 3,976,000.00 19,372,700.00
Zaw Win Than 0.00 1,037,210.00
Zaw Zaw 190,000.00 190,000.00
Zayar Lwin Company Limited 23,889,725.00 0.00
Zayar Star Co.Ltd 3,518,050.00 10,682,000.00
Zenith Infrastructure Co.Ltd 3,754,574.00 0.00
Zenith Trust Group Company Ltd 0.00 2,639,910.00
Zin Myint Aung (8,008.00) 816,030.86
2,114,888,287.00 2,535,171,375.00

iGTL MyanMar LiMiTed
29th annual report 2016-17 163
11. Others
The above consist of:
31st Mar’2017 31st Mar’2016
Project Management Support Services-Payable 0.00 203,770,882.00
Salary Payable 302,574.00 54,709,736.00
Retention Payable 111,840,845.00 0.00
Disputed Creditors Payable 26,955,599.00 0.00
Advances From Customers 199,301,293.00 167,283,096.00
Un-Earned Income 177,655,317.00 648,447,714.00
516,055,628.00 1,074,211,428.00
12. Provisions
Provisions involving substantial degree of estimation in measurement are recognized when there is a present obligation as a result of past events and it is probable that there will be an outflow of resources
The above consist of:
31st Mar’2017 31st Mar’2016
Provision of income Tax 2016-17 452,421,518.00 0.00
Provision of income Tax 2015-16 485,163,916.00 485,163,916.00
Provision of Income Tax 2014-15 30,611,410.00 30,611,410.00
Contingency Provision for 2015-16 0.00 136,819,966.00
Contingency Provision for 2016-17 109,697,685.00 0.00
Provision For Dividend 5,108.00 0.00
Provision for Expenses 964,547,436.00 472,091,388.00
Provision COGS Projects Material 35,387,686.00 80,088,410.00
Provision COGS Projects Services 1,020,378,652.00 939,230,106.00
3,098,213,411.00 2,144,005,196.00
13. Revenue (Ks 21,692,716,354.00)
The above represents the revenues earned from Installation & Transport Service, Site Maintenance service, Power Installation service, Telecom Site building, Professional Services & In-building solutions to Apollo Tower Myanmar Ltd, Ericsson Myanmar Co. Ltd, Irrawaddy Green Towers Ltd, Telenor Myanmar Limited, Ooredoo Myanmar Limited and KBZ Getway.
Revenue Recognition:
Revenues are recognized when it is earned and when there is no significant uncertainty as to its measurement and realization. The specific revenue recognition policies are as under:
a. Revenue from turnkey contracts, which are either fixed price or cost plus contracts, is recognized based on work completion of activity or achievement of milestone duly certified by customer.
b. Revenue from sale of products is recognized upon passing of title of goods and/or on transfer of significant risk and rewards of ownership thereto.
c. Revenue from services is recognized based on performance of service that are recoverable.
d. Other income is recognized when the right to receive is established.
14. cost of Sale
The details are as follows:
31st Mar’2017 31st Mar’2016
Opening Stock 110,416,136.00 -
Air Fare – Delivery 17,960,581.00 1,489,789.61
Bonus / Incentive – Delivery 301,150,000.00 208,571,501.00
BTS & MICROWAVE Installation 0.00 125,924,393.00
Clearing And Forwarding Charges 7,250,802.00 25,734,568.00
Contingency 155,156,991.00 136,819,966.00

GTL Limited164
iGTL MyanMar LiMiTed
31st Mar’2017 31st Mar’2016
Conveyance – Delivery 280,820,674.00 159,024,355.00
Cost Of Services/Cos Turnkey 5,352,737,684.00 4,493,874,593.11
Custom Duty 82,876,108.00 -
DG Charges 0.00 3,154,000.00
DG R&M Materials 0.00 12,178,725.00
Employees Salary – Delivery 385,588,629.00 619,378,955.05
Entertainment Expenses – Delivery 818,465.00 -
Equipment Hire Charges 9,992,000.00 3,040,000.00
Fooding Charges – Delivery 11,952,757.00 4,225,796.00
Freight Charges 0.00 45,225.00
Fuel Expenses – Project 6,553,961.00 -
Fuel Filling Charges 0.00 62,562,096.00
Guesthouse Expenses 59,147,730.00 -
Imprest Expenses Provision Fy 16-17 (425,398.00) 62,627,492.00
Income Tax Paid – Delivery 2,344,083.00 -
Inland Travelling – Delivery 193,016,263.00 12,463,410.00
Insurance Premium 26,728,078.00 -
Labour Charges 50,323,880.00 66,409,390.00
Lodging Charges Projects Team 0.00 137,479,046.25
Material Purchases 2,678,567,792.00 2,097,151,465.21
Other Service Charges 405,178,565.00 -
Outsourced Manpower Charges – Delivery 1,021,495,334.00 2,747,842,213.00
Outsourced Service Charges 43,432,600.00 121,316,644.58
Professional & Consultancy Charges 0.00 27,864,419.90
Project Execution Expense 0.00 226,079,718.29
Project Management Charges – Delivery 2,437,493,406.00 -
Project Management Expenses 3,471,050,000.00 1,215,764,000.00
Project Penalities/Damages 2,066,305.00 -
Rent Guest House 128,753,334.00 -
Rent Ware House 36,645,916.00 -
Repairs & Maintenance – Project 653,600.00 5,352,760.00
Security Charges 12,987,849.00 -
Social Security Benefit Paid 0.00 455,500.00
Ssb Paid – Delivery 882,045.00 -
Staff Welfare Expense – Delivery 19,374,730.00 3,477,680.00
Subscription And Membership Fees 9,927,665.00 -
Telephone & Internet – Delivery 61,006,491.00 -
Toll & Parking Charges – Project 5,783,259.00 5,273,389.00
Transportation Expenses 268,498,311.00 233,636,202.00
Vehicle Hire Charges – Project 547,190,636.00 534,005,942.00
Visa Exps – Delivery 113,727,203.00 5,190,963.00
With Holding Tax Expense Out 56,697,638.00 -
Less: Closing Stock (151,532,065.00) -
18,224,290,038.00 13,358,414,198.00

iGTL MyanMar LiMiTed
29th annual report 2016-17 165
15. Administration Expenses
General and administration expenses consist of:
31st Mar’2017 31st Mar’2016
Air Fare - Admin & Support 10,216,811.00 239,727,383.39
Air Fare - Sales & Mktg. 7,448,959.00 -
Audit Fees 14,850,600.00 9,154,500.00
Auditors Remuneration Out Of Pocket 1,634,325.00 -
Bank Charges 15,514,572.00 8,536,886.39
Bonus / Incentive - Admin & Support 45,000,000.00 -
Bonus / Incentive - Sales & Mktg. 431,534,322.00 123,437,662.00
Bonus / Incentive To Outsourced - Sales & Mktg. 0.00 -
Books And Periodicals 25,500.00 -
Business Promotion 0.00 5,072,402.00
Car Hire - Admin & Support 20,735,774.00 1,890,600.00
Car Hire - Sales & Mktg. 9,224,293.00 -
Commission /Brokerage 7,605,000.00 13,887,900.04
Conveyance - Admin & Support 13,987,750.00 134,057,670.65
Conveyance - Sales & Mktg. 273,500.00 -
Cook & Cleaning Expenses 0.00 24,555,497.00
Depreciation P&L A/c 95,310,096.00 42,432,768.00
Donation 0.00 10,131,000.00
Electricity Charges 36,313,970.00 36,408,959.00
Employee Welfare 0.00 2,093,920.00
Employees Salary - Admin & Support 198,160,594.00 -
Employees Salary - Sales & Mktg. 391,355,171.00 -
Entertainment Expenses - Admin & Support 347,500.00 -
Entertainment Expenses - Sales & Mktg. 4,912,771.00 -
Fees & Subscriptions 0.00 350,000.00
Fooding Charges - Admin & Support 100,000.00 23,712,477.00
Godown Rent 0.00 2,335,246.00
Guesthouse Expenses 0.00 86,796,162.00
Guesthouse Rent 0.00 57,057,842.60
Hotel Charges( Corporate) 0.00 5,600,069.70
Income Tax Paid - Admin & Support 1,463,267.00 109,416,079.00
Income Tax Paid - Sales And Mkt 3,322,292.00 -
Inland Travelling - Admin & Support 2,529,335.00 9,426,885.07
Inland Travelling - Corporate 35,990,977.00 -
Inland Travelling - Sales & Mktg. 8,000,433.00 -
Lodging Charges 0.00 60,905,009.00
Loss of Assets 0.00 309,029.00
Medical Reimbursement 0.00 1,657,810.00
Miscellaneous Charges 0.00 1,774,160.00
Office Expenses 34,234,179.00 -
Out of Pocket Expenses 0.00 1,471,217.52
Outsourced Manpower Charges - Admin & Support 49,842,850.00 -
Outsourced Manpower Charges - Sales & Mktg. 5,038,741.00 -

GTL Limited166
iGTL MyanMar LiMiTed
31st Mar’2017 31st Mar’2016
Printing And Stationery 25,890,690.00 22,900,081.00
Professional And Consultancy 49,750,618.00 -
Project Management Charges - Admin & Support 65,696,604.00 -
Project Management Charges - Sales & Mktg. 13,701,579.00 -
Reimbursable Diesel Expenses 0.00 -
Rent Office Premises 69,194,713.00 60,068,879.00
Repairs And Maintenance 6,081,710.00 -
Rounding Off 8,773.00 -
Ssb Paid - Admin & Support 771,870.00 -
Ssb Paid - Sales And Mkt 215,965.00 -
Staff Welfare Expense - Admin & Support 40,464,130.00 28,433,235.00
Staff Welfare Expense - Sales & Mktg. 1,639,650.00 -
Stamp Duty Charges 3,332,350.00 5,059,250.00
Telephone & Internet - Admin & Support 16,850,350.00 82,383,361.00
Telephone & Internet - Sales & Mktg. 296,333.00 -
Visa Exps - Admin & Support 10,236,902.00 93,035,308.34
Visa Exps - Sales & Mktg. 1,602,344.00 -
Warehouse Rent 0.00 13,488,295.00
Warehouse Security Charges 0.00 1,050,000.00
With Holding Tax Borne by Us 3.5% 0.00 22,784,037.47
Written Off Bal (1,061,877.00) (234,780.17)
1,749,646,286.00 1,341,166,802.00
16. Related Party Transaction
The Company had carried out the following related party transactions during the year:
Particular Amount (Ks)
Transactions with:
GTL Singapore Pte Ltd.
Shares 232,024,000.00
Services 3,471,050,000.00
Dividend 1,031,244,892.00
Accounts payable 1,539,638,850.00
GTL Europe Limited
Shares 1,000.00
Dividend 5,156.25
17. Authorization of Financial Statements
The financial statements of the entity for the year ended March 31, 2017 were authorized for issue on April 7, 2017.


prin
t@pa
rkso
nsgr
aphi
cs.c
om
gtL Limited
“Global Vision”, Electronic Sadan-||, MIdC, TTC Industrial Area,
Mahape, Navi Mumbai - 400 710, Maharashtra, India. Tel: +91 22 2761 2929 | Fax: +91 22 2768 9990
CIN No. : L40300MH1987PLC045657
www.gtllimited.com

![Shareholders’ Agreement of [Company name] company. 1 … · 2018-02-15 · 3 Shareholders’ Agreement of [Company Name] [Company name] [Document ID] [company URL] purpose is to](https://img.pdfslide.net/doc/110x75/5d207b4788c993ec448d2654/shareholders-agreement-of-company-name-company-1-2018-02-15-3-shareholders.jpg)


![Shareholders’ Agreement of [Company name] company. 1 ... - … · Shareholders’ Agreement of [Company name] company. 1 Partners to the Agreement [Company Name] [Company Type]](https://img.pdfslide.net/doc/110x75/5f04671f7e708231d40dcc32/shareholdersa-agreement-of-company-name-company-1-shareholdersa-agreement.jpg)
![beta.traficom.fi · Web view[Company Name] Part 1 - Organisation . M. anagement [Company Name] Part . 4 – Appendices [Company Name] Part . 4 – Appendices [Company Name] Part 1](https://img.pdfslide.net/doc/110x75/5e756308be844a460746d897/beta-web-view-company-name-part-1-organisation-m-anagement-company-name.jpg)