Embed Size (px)
Citation preview

August 2008 This publication was produced for review by the United States Agency for International Development. It was prepared by the Republic of Namibia and the Health Systems 20/20 Project.
NAMIBIA NATIONAL HEALTH ACCOUNTS 2001/02–2006/07
REPUBLIC OF NAMIBIA Ministry of Health and Social Services

Mission
The Health Systems 20/20 cooperative agreement, funded by the U.S. Agency for International Development (USAID) for the period 2006-2011, helps USAID-supported countries address health system barriers to the use of life-saving priority health services. Health Systems 20/20 works to strengthen health systems through integrated approaches to improving financing, governance, and operations, and building sustainable capacity of local institutions.
August 2008
For additional copies of this report, please email [email protected] or visit our website at www.healthsystems2020.org
Cooperative Agreement No.: GHS-A-00-06-00010-00
Submitted to: Karen Cavanaugh, CTO
Yogesh Rajkotia, co-CTO Health Systems Division Office of Health, Infectious Disease and Nutrition Bureau for Global Health United States Agency for International Development
Recommended Citation: Republic of Namibia and the Health Systems 20/20 Project August 2008. Namibia National Health Accounts 2001/02–2006/07. Bethesda, MD: Health Systems 20/20 project, Abt Associates Inc.
Abt Associates Inc. I 4550 Montgomery Avenue I Suite 800 North I Bethesda, Maryland 20814 I P: 301.347.5000 I F: 301.913.9061 I www.healthsystems2020.org I www.abtassociates.com
In collaboration with:
I Aga Khan Foundation I BearingPoint I Bitrán y Asociados I BRAC University I Broad Branch Associates I Forum One Communications I RTI International I Training Resources Group I Tulane University School of Public Health and Tropical Medicine

NAMIBIA NATIONAL HEALTH ACCOUNTS 2001/02–2006/07

DISCLAIMER The author’s views expressed in this publication do not necessarily reflect the views of the United States Agency for International Development (USAID) or the United States Government.

CONTENTS V
CONTENTS
Acronyms...................................................................................... ix
Preface........................................................................................... xi
Executive Summary................................................................... xiii
1. Introduction and Background .................................................. 1
1.1 Concept of National Health Accounts ..............................................1 1.1.1 Purpose of NHA ......................................................................1 1.1.2 What Questions Could NHA Answer? .............................1 1.1.3 Dimensions of NHA ...............................................................2 1.1.4 What NHA Measures.............................................................3
1.2 History of NHA in Namibia .................................................................3 1.3 NHA Objectives .....................................................................................4 1.4 Health Status of Namibia ......................................................................4
1.4.1 Trends in Major Health Indicators ......................................4 1.4.2 Major Health Issues.................................................................4
1.5 Namibian Health System.......................................................................5 1.5.1 National Goals and Vision .....................................................5 1.5.2 Organization .............................................................................5
1.5.2.1 Public Sector............................................................ 5 1.5.2.2 Private Not-for-Profit Sector (NGOs).............. 6 1.5.2.3 Private For-Profit Sector ...................................... 6
2. Methodology .............................................................................. 7
2.1 Overview of Approach..........................................................................7 2.2 Data Sources............................................................................................7
2.2.1 Secondary Data ........................................................................7 2.2.2 Primary Data.............................................................................8
2.2.2.1 Survey Instruments ................................................ 8 2.2.2.2 Questionnaire Administration............................. 8 2.2.2.3 Sampling .................................................................... 8
2.3 Data Entry and Analysis ........................................................................9 2.3.1 Government..............................................................................9 2.3.2 Providers..................................................................................10 2.3.3 Private Employers ..................................................................10 2.3.4 Insurance..................................................................................10 2.3.5 Donors and NGOs................................................................11 2.3.6 Household Out-of-Pocket ...................................................12
2.4 Limitations ..............................................................................................13

NAMIBIA NATIONAL HEALTH ACCOUNTS 2001/02-2006/07 VI
3. Findings .................................................................................... 15
3.1 Total Resource Envelope for Health: Who Finances Health Care?........................................................................................................15
3.2 Financing Sources..................................................................................18 3.3 Financing Agents of Health Care: Who Manages Health Funds?.........................................................................................21 3.4 Providers of Health Care: Who Uses Health Funds to Deliver Care?....................................................................................26 3.5 Functions: Services and Products Purchased with ........................... Health Funds ..........................................................................................30 3.6 Financing Sources by Functions: Who Spends on What? ...........33
4. Conclusion and Recommendations ....................................... 35
Annex A: Bibliography................................................................ 37
Annex B: NHA Tables 2001/02 – 2006/07 ................................. 39
LIST OF TABLES Table ES-1: NHA Summary Statistics, 2001/02–2006/07: ......................... xiv Table 1: Breakdown of Organizations from which Data Were Collected
........................................................................................................................... 9 Table 2: Insurance Weighting Plan...................................................................11 Table 3: Magnitude of Change among Financing Sources, 2001/02 and
2006/07 ..........................................................................................................19 Table 4: Magnitude of Change among Financing Agents, 2001/02 and
2006/07 ..........................................................................................................26 Table 5: Magnitude of Change among Providers, 2001/02 and 2006/07 29 Table 6: Provision of Public Health Programs by Financing Agent,
2001/02 and 2006/07..................................................................................29 Table 7: Breakdown of Public Health Programs, 2006/07 .........................33
LIST OF FIGURES Figure 1: Total Health Expenditure, 2001/02−2006/07 ..............................15 Figure 2: Per Capita Spending on Health, 2001/02−2006/07 ....................16 Figure 3: Total Expenditure on Health as a Percentage of GDP..............17 Figure 4: THE as Percentage of GDP of BNLSS Countries, 2005............17 Figure 5: THE Breakdown by Financing Source, 2001/02−2006/07.........18 Figure 6: THE Breakdown by Financing Source ...........................................19 Figure 7: Donor Spending on Health as a Percentage of Total Donor
Disbursements .............................................................................................20 Figure 8: Government Spending on Health as a Percentage of Total
Government Spending................................................................................21 Figure 9: Breakdown of THE by Financing Agent ........................................22

VII
Figure 10: Financing Agent Contribution to THE ........................................23 Figure 11: Trends in MoHSS Financing ...........................................................24 Figure 12: Breakdown of Insurance by Financier as Percentage of Total
Insurance Expenditure................................................................................25 Figure 13: THE Breakdown by Provider 2001/02-2006/07 .......................27 Figure 14: Percent Share of THE by Provider Category, 2001/02–
2006/07 ..........................................................................................................28 Figure 15: Share of Financing Agents that Manage Provision of Public
Health Programs Funds..............................................................................30 Figure 16: THE Breakdown by Functional Category...................................31 Figure 17: Percent Breakdown by Type of Public Health Program .........32 Figure 18: Allocation of Health Funds from Financing Sources to
Functions, 2001/02......................................................................................33 Figure 19: Allocation of Health Funds from Financing Sources to
Functions, 2006/07......................................................................................34


ACRONYMS IX
ACRONYMS
AIDS Acquired Immune Deficiency Syndrome
BNLSS Botswana, Namibia, Lesotho, South Africa & Swaziland
DHS Demographic and Health Survey
EPI Expanded Program on Immunization
FP Family Planning
FS Financing Sources
FY Financial Year
GDP Gross Domestic Product
GF Global Fund to Fight AIDS, Tuberculosis and Malaria
HC Health Care Functions
HH Households
HIS Health Information System
HIV Human Immunodeficiency Virus
ICHA International Classifications for Health Accounts
MCH Maternal and Child Health
MoF Ministry of Finance
MoHSS Ministry of Health and Social Services
NAMFISA Namibia Financial Institutions Supervisory Authority
N$ Namibian Dollar
NCD Noncommunicable Disease
NDHS Namibia Demographic and Health Survey
NGO Nongovernmental Organization
NHA National Health Account
OOP Out-of-pocket
PSEMAS Public Service Employees Medical Aid Scheme
PEPFAR President’s Emergency Plan for AIDS Relief
SSA Sub-Sahara Africa
SSC Social Security Commission
TB Tuberculosis
THE Total Health Expenditure
US$ United States Dollar

NAMIBIA NATIONAL HEALTH ACCOUNTS 2001/02-2006/07 X
USAID United States Agency for International Development
WHO World Health Organization
WHS World Health Survey
PREFACE XI
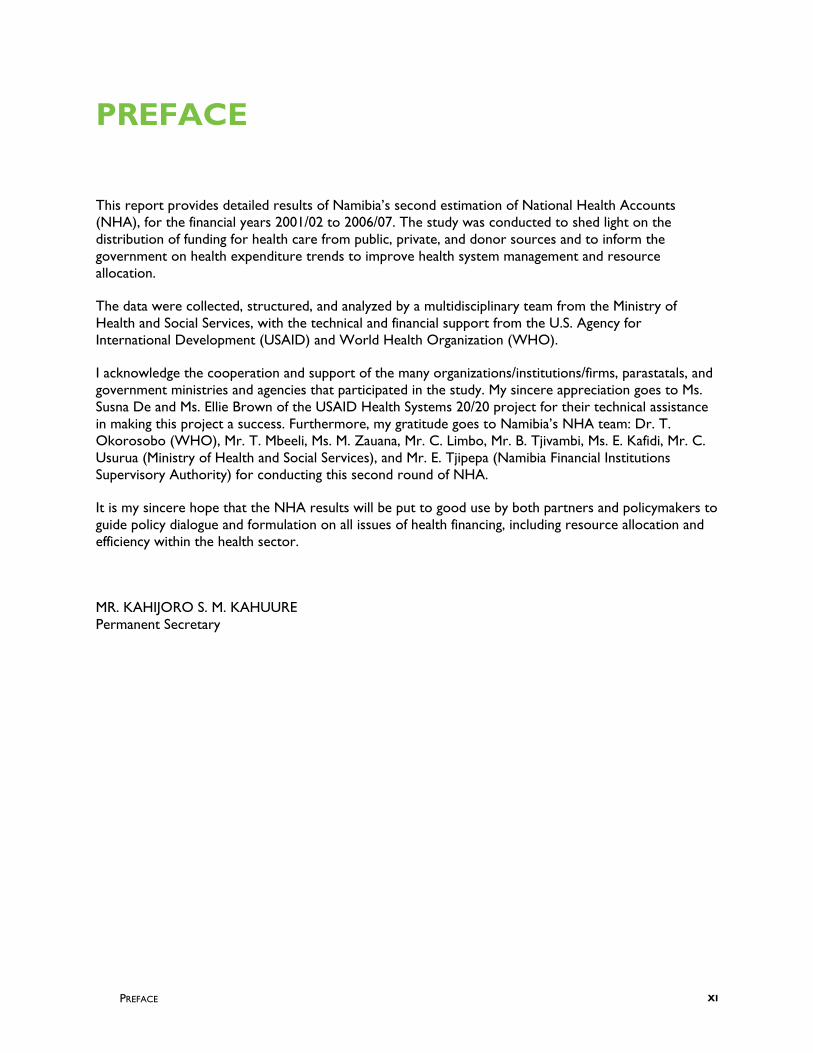
PREFACE
This report provides detailed results of Namibia’s second estimation of National Health Accounts (NHA), for the financial years 2001/02 to 2006/07. The study was conducted to shed light on the distribution of funding for health care from public, private, and donor sources and to inform the government on health expenditure trends to improve health system management and resource allocation.
The data were collected, structured, and analyzed by a multidisciplinary team from the Ministry of Health and Social Services, with the technical and financial support from the U.S. Agency for International Development (USAID) and World Health Organization (WHO).
I acknowledge the cooperation and support of the many organizations/institutions/firms, parastatals, and government ministries and agencies that participated in the study. My sincere appreciation goes to Ms. Susna De and Ms. Ellie Brown of the USAID Health Systems 20/20 project for their technical assistance in making this project a success. Furthermore, my gratitude goes to Namibia’s NHA team: Dr. T. Okorosobo (WHO), Mr. T. Mbeeli, Ms. M. Zauana, Mr. C. Limbo, Mr. B. Tjivambi, Ms. E. Kafidi, Mr. C. Usurua (Ministry of Health and Social Services), and Mr. E. Tjipepa (Namibia Financial Institutions Supervisory Authority) for conducting this second round of NHA.
It is my sincere hope that the NHA results will be put to good use by both partners and policymakers to guide policy dialogue and formulation on all issues of health financing, including resource allocation and efficiency within the health sector.
MR. KAHIJORO S. M. KAHUURE Permanent Secretary


EXECUTIVE SUMMARY XIII
EXECUTIVE SUMMARY
BACKGROUND
The 2001/02-2006/07 Namibia National Health Accounts (NHA) describes financial flows for health care, including public, private, and donor contributions. NHA is an internationally accepted framework used to comprehensively track expenditures for a given year. Specifically, it details financial transactions between financing sources (e.g., donors, Ministry of Finance, households), financing agents (e.g., Ministry of Health and Social Services, nongovernmental organizations [NGOs], insurance), providers (e.g., health centers, hospitals), and associated functions (health services or products rendered, e.g., inpatient and outpatient curative care). In short, NHA tracks the flow of health funds through the system, from their sources to their end uses.
This report is the second round of NHA in Namibia, the first one having been conducted in 2002 for the years 1998/99-2000/01. This 2001/02-2006/07 round, led by the Ministry of Health and Social Services with support from World Health Organization (WHO) and the United States Agency for International Development (USAID)’s Health Systems 20/20 project, aims to inform the policy process so that stakeholders, including the Government of Namibia, donors, and the private sector, may develop evidenced-based policies concerning resource allocation and use. By understanding the status of resource flows, stakeholders are better able to evaluate the strengths and weaknesses of current financial arrangements. In so doing, NHA can serve a monitoring purpose, as part of the routine function of government and not as a one-time study.
METHODOLOGY
The estimates were developed following a comprehensive data collection effort to triangulate both primary and secondary data. Attempts were first made to identify secondary data (e.g., government executed budgets, World Health Survey for household estimates) and, where they were missing, primary data from donors, NGOs, insurance firms, companies, and ministries were collected to fill in the gaps. For each expenditure transaction, every effort was made to validate the estimate from more than one data source. Reported expenditure transactions were then classified and analyzed in accordance with the Guide to producing National Health Accounts; with special application for low-income and middle-income countries (WHO, World Bank, and USAID 2003), commonly referred to as the Producers’ Guide. The information was then organized into a series of four standard tables (that show the flow of funds between two health care dimensions) for each year.

NAMIBIA NATIONAL HEALTH ACCOUNTS 2001/02-2006/07 XIV
FINDINGS
Table ES-1 offers summary statistics from the 2001/02-2006/07 NHA estimate.
Note: GDP=gross domestic product, THE=total health expenditure, OOP=out-of-pocket
TABLE ES-1: NHA SUMMARY STATISTICS, 2001/02–2006/07:
Indicator 2001/02 2002/03 2003/04 2004/05 2005/06 2006/07 Total population 1830290 1860145 1890486 1921510 1953207 1985538 Exchange rate US 1$= 9.64 9.53 7.04 6.23 6.39 7.09 Total GDP (real 2006 N$ million) 28,347 33,433 34,275 36,819 39,913 46,971 Total govt expenditure (real 2006 N$ million) 10,016 10,958 12,413 12,806 12,868 15,155 THE (real 2006 N$ million) 1,854 2,176 2,453 2,787 3,397 3,890 THE (real 2006 US$ million) 261 307 346 393 479 549 THE per capita (real 2006 N$) 1013 1170 1297 1450 1739 1959 THE per capita (real 2006 US$) 143 165 183 205 245 276 THE as a % of GDP 6.5% 6.5% 7.2% 7.6% 8.5% 8.3% Govt health expenditures as a % of total govt expenditures
11.7% 12.7% 12.3% 12.4% 12.7% 11.3%
Donor health expenditures as a % of total donor expenditures
7.2% 6.4% 7.9% 30.4% 77.3% 79.4%
Financing sources as a % of THE Public 63.3% 64.1% 62.4% 57.0% 48.2% 44.0% Companies 14.3% 12.0% 12.0% 10.9% 9.4% 8.9% Households 18.6% 20.8% 22.6% 22.4% 25.5% 24.7% Donor 3.8% 3.2% 3.0% 9.7% 16.9% 22.4%
Financing agents as a % of THE Govt 56.9% 58.1% 56.1% 47.9% 47.3% 42.2% Public insurance 17.3% 17.5% 18.1% 20.6% 16.9% 15.8% Private insurance 20.2% 19.0% 19.5% 18.3% 22.0% 21.7% OOP 3.1% 4.0% 5.1% 3.7% 3.7% 3.2% Companies 0.9% 0.9% 0.9% 1.0% 0.8% 0.8% Donor and NGO 1.6% 0.5% 0.3% 8.4% 9.4% 16.3%
Provider as a % of THE Public facilities 52.5% 53.9% 52.7% 48.2% 45.9% 40.0% Private facilities 22.1% 20.8% 22.0% 21.9% 23.1% 22.1% Dispensing chemist 6.2% 7.2% 7.4% 7.2% 6.6% 6.3% Provision of public health programs 5.3% 3.9% 3.5% 8.5% 11.5% 15.6% General administration 11.7% 12.1% 12.0% 11.2% 10.4% 14.0% Other 2.2% 2.1% 2.4% 3.0% 2.5% 2.0%
Functions as a % of THE Inpatient care 39.5% 36.3% 36.0% 34.9% 32.1% 31.8% Outpatient care 31.3% 34.5% 35.2% 32.7% 33.2% 30.0% Medicine at private pharmacies and shops 6.6% 7.6% 7.8% 7.6% 6.9% 6.3% Other medical care 2.2% 2.0% 2.3% 2.8% 3.4% 2.1% Prevention and public and health programs 3.7% 3.5% 3.5% 8.1% 10.0% 14.5% General administration 12.9% 12.0% 11.6% 11.6% 11.9% 14.4% Capital formation 3.7% 3.9% 3.5% 2.1% 2.4% 0.8% Other 0.0% 0.1% 0.1% 0.1% 0.1% 0.1%

EXECUTIVE SUMMARY XV
The availability of trend data on financing facilitated observations about the evolution of financing in Namibia during the five-year period as well as its current pattern of spending on health. The principal findings of this round of NHA are as follows:
• Total health spending doubled over the five-year period.
The total resource envelope for health in 2006/07 was N$3.9 billion (US$548.6 million), accounting for 8.3 percent of GDP, the second-highest level among countries in the BNLSS (Botswana, Namibia, Lesotho, South Africa, and Swaziland) region, following only South Africa.
• The share of public financing for health (the largest contributor in Namibia) decreased from 63 percent in 2001/02 to 44 percent of total health expenditure (THE) in 2006/07. This is due to increased levels of financing by households (from 19 percent to 25 percent) and donors (4 percent to 22 percent).
In absolute terms (after accounting for inflation), government financing over the five-year period increased by 1.5-fold, household spending by threefold, donor spending by twelvefold, and companies by 1.2-fold.
• Government investment in health as a percentage of total government spending averaged 12.2 percent over the five-year period, short of the commitment of African governments at the Abuja summit to achieve 15 percent allocation to health by 2015.
• More entities managed and controlled health funds (i.e., acted as financing agents) in 2006/07 than in 2001/02.
In particular, the role of implementing agencies, namely NGOs and donors, grew sizably. Implementing agencies spent 22-fold more in 2006/07 than in 2001/02.
• Public providers consumed the largest share (40 percent of THE) of health funds followed by private providers (22 percent of THE) in 2006/07.
Provision of public health programs and provision of administration increased by six- and threefold, respectively, over the five-year period.
• Public health programs have become increasingly focused on prevention and control of communicable diseases, increasing from 51 percent in 2001/02 to 97 percent of program spending in 2006/07. At the same time, investment in maternal and child health (MCH) and family planning (FP) programs and noncommunicable diseases (NCDs) decreased significantly, from 44 percent to 3 percent for MCH/FP and 5 percent to 0.5 percent for NCD.
This represents a sizeable shift in absolute terms. Spending on communicable disease programs in 2006/07 increased by 15-fold, while MCH/FP program spending was halved, and NCD program spending, which was low in 2001/02, decreased further (by 10 percent) in 2006/07.
• In 2006/07, public funds were the largest financier of curative care – inpatient and outpatient – while donors were the largest financier of public health programs.

NAMIBIA NATIONAL HEALTH ACCOUNTS 2001/02-2006/07 XVI
RECOMMENDATIONS
Based on the findings, their implications, and the experience of implementing NHA, the following recommendations are made:
1. Increase government stewardship and coordination of all entities (donors, NGOs, insurance schemes) involved in financing and management of health funds. Given the increasingly pluralistic nature of Namibia’s health system, the Government has an important role to play in coordinating the various players that determine where health resources are used, such that all health stakeholders are working toward common national goals in a complementary manner, avoiding duplicative and parallel efforts.
2. Monitor intrasectoral allocations (by all stakeholders) across health programs to ensure that spending is in accordance with national priorities. While the increased financial support for communicable disease programs like HIV/AIDS is a welcome and much needed development, care must be taken not to neglect other critical areas, such as MCH care, FP, and NCDs, which have experienced a considerable drop in financing over the five-year period studied.
3. Monitor household expenditures to assess their financing burden (particularly given their tripling of spending on health during the five-year period) to maintain equitable access for all Namibians to health care.
In this regard, collection of regular and routine household health and expenditure data is warranted.
4. Strengthen links with the private sector, particularly companies and insurance schemes. Encouragement of companies to invest in the health care of their employees can be a possible area of resource mobilization.
5. Work to improve resource tracking mechanisms of health, such that NHA becomes a routine function of government and more directly linked to budgeting and planning processes
Institutionalization of NHA will require routine resource tracking efforts particularly for donors, NGOs, and households whose investment is critical to monitor whether funds are being spent as intended (particularly in line with national priorities) and to flag any inequities.
1. INTRODUCTION AND BACKGROUND 1
1. INTRODUCTION AND BACKGROUND
1.1 CONCEPT OF NATIONAL HEALTH ACCOUNTS
National Health Accounts (NHA) is an internationally accepted tool for measuring, summarizing, and analyzing the sources and uses of financing in national health systems. NHA examines total health spending in a country including public, private, and donor expenditure. By describing the flow of funds through the health system, from their sources to financing agents to health care providers and finally to functions (rendered services and/or products), NHA provides a comprehensive picture of the financial status of a country’s health system.
The International Classification for Health Accounts (ICHA) provides a basis for NHA. It categorizes health expenditures among fundamental dimensions, such as financing agents, providers, and functions. It is compatible with a number of other existing classification schemes and practices in international economics statistics. Use of international classification schemes facilitates cross-country comparisons among countries of similar socioeconomic status.
1.1.1 PURPOSE OF NHA
The principal goal of NHA is to support health system governance and decision making. NHA contributes to the health policy process by providing a comprehensive study of health spending in the country that leads to better-informed health policy decisions and avoids potentially adverse policy choices.
NHA is all-inclusive and presented in a format that is easy to understand. The framework provides evidence for policy decisions for the entire health sector, and is useful for improving system performance.
NHA not only contributes to policy design and implementation, but also monitors resource flows from their sources to end uses, informing donor funding decisions and the general health policy dialogue.
NHA’s international standardization allows policymakers to compare their health spending patterns and outcomes with other countries of similar socioeconomic status.
1.1.2 WHAT QUESTIONS COULD NHA ANSWER?
NHA has been found to be useful in answering a number of key policy questions such as:
Who pays and how much is paid for health care?
• Knowing who finances health care provides valuable information for the design of policies and interventions. In particular, should a detailed household expenditure survey be available, NHA can show how large the financial burden is relative to households’ means, illuminates the nature of protection and the fairness of their financial burden.

NAMIBIA NATIONAL HEALTH ACCOUNTS 2001/02-2006/07 2
Who provides goods and services, and what resources do they use?
• Answers to these questions describe the allocation of expenditure across different types of providers and possibly production factors used in the system. These are dimensions of economic efficiency that are important focuses of decision making.
• These answers also shed light on how expenditures are distributed among different financing entities and health care providers.
How are health funds distributed across different services, interventions, and activities that the health system produces?
• NHA shows what is produced in the health system and what is spent on different services and products. The commitment of resources to health functions is a valuable measure of actual priorities of a health system. Such information indicates whether or not an allocation reflects actual priorities.
• NHA also highlights the equity imbalances in distribution of health expenditures.
Who benefits from health expenditures?
• Knowing where the benefits from health expenditure fall in terms of their financial value is an important measure of assessing fairness in financing distributions across population groups (again, if a detailed household survey is available).
1.1.3 DIMENSIONS OF NHA
The NHA framework has been designed to include at a minimum four dimensions of expenditure classifications. Health expenditures are tracked though the health system from financing sources, to financing agents, to providers, and finally to uses.
a. Financing sources
Institutions or entities that provide funds used in the health system by financing agents.
b. Financing agents
Institutions or entities that receive funds from financing sources and have programmatic control over their use.
c. Providers
Entities that receive funds from financing agents and provide or deliver the health care service. Providers are the end users of funds.
d. Functions
The actual goods and services delivered and activities performed within the health system boundary.

1. INTRODUCTION AND BACKGROUND 3
1.1.4 WHAT NHA MEASURES
The goal of NHA is to capture all actual expenditures for activities whose primary purpose is to restore, improve, and maintain health for the country and for individuals during a defined period. Expenditures measure, in monetary terms, the value of consumption of the goods and services of interest. This is distinct from commitments where funds are legally promised to recipients but not necessarily transferred to recipients. Expenditures are also distinct from disbursements in which funds are transferred from the funding mechanism (e.g., donor) to a recipient (e.g., nongovernmental organizations [NGOs]), but not necessarily spent by the recipient. NHA attempts to track spending on rendered health services and products. If donated commodities are shipped to a country but not distributed to the population during the year of interest, the value of commodities are not included in that year’s NHA.
NHA defines boundaries in terms of space and time. While the review captures health expenditures for a country, this measure is not limited to the activities that take place within the national borders. Rather, it is defined in terms of nation’s citizens and residents. This means that the review includes spending on health care by citizens and residents who are temporarily abroad, as well as spending of external agencies (such as bilateral agencies) on inputs to health care within that country. The review attempts to exclude spending in the country by foreign nationals.
The time boundary of the review has two elements. Firstly, a particular period must be chosen within which the activities took place. This usually is a fiscal year or calendar year. The other element of the time boundary is the distinction between when the activity took place and when the transaction of payment took place. NHA uses the method in which expenditures are captured in the year they were actually incurred rather than when commitments were made.
1.2 HISTORY OF NHA IN NAMIBIA
The World Health Report 2000 (WHO 2000) revealed that the Namibian health system consumed around 7.5 percent of gross domestic product (GDP), but the health outcomes in terms of disability-adjusted life expectancy were poor compared with other countries at similar levels of development and with similar levels of health expenditure per capita. Furthermore, the country had high levels of inequalities in health and access to resources. Therefore policymakers deemed it imperative to address the weaknesses of the health system. In doing this, there is a need for reliable information on the sources and use of funds for health in the country.
In 2002, the Ministry of Health and Social Services (MoHSS) undertook the first round of NHA, which covered financial years 1998/99 to 2000/01. The exercise was a collaborative effort between the MoHSS and the World Health Organization (WHO). The results were used by the Government in the budgeting process, in particular to inform regional directorates’ budgetary allocations, and to serve as the starting point for research on formulation of a needs-based resource allocation formula. Furthermore, it was anticipated that NHA would be institutionalized to serve as basis for evaluating ongoing health reform strategies as part of the routine health information systems (HIS).
However, following this initial round, NHA was not conducted until the current round in 2007, which covers financial years 2001/02-2006/07. This NHA exercise has encompassed a greater number of stakeholders from the public and private sectors, which will help facilitate the process for institutionalizing NHA.

NAMIBIA NATIONAL HEALTH ACCOUNTS 2001/02-2006/07 4
1.3 NHA OBJECTIVES
The purpose of the second round of the NHA exercise is to assess the current usage of resources in order to fill existing gaps. The specific objectives are:
• Quantify the financial flows of distribution of funding between public, private, and donor sources and calculate the total health expenditure (THE) as a proportion of GDP,
• Inform the government on health expenditure trends to enable health system management and resource allocation,
• Review the role of stakeholders in addressing health issues,
• Advance the process of institutionalization of NHA.
1.4 HEALTH STATUS OF NAMIBIA
The Government recognizes health as both a resource for and outcome of development, and has therefore committed itself to the achievement of health for all Namibians, through the provision of health care that is accessible, affordable, and equitable based on the primary health care approach.
1.4.1 TRENDS IN MAJOR HEALTH INDICATORS
Trends in Namibia’s major health indicators create a health profile that has seen reversals in the improvements of people’s health status, owing primarily to the impact of the HIV/AIDS pandemic. This is seen in indicators such as the infant mortality rate of 46 per 1,000 live births in 2006 (MoHSS 2008), compared with 38 per 1,000 live births reported in the 2000 Namibia Demographic and Health Survey (NDHS) (MoHSS 2003) and an under-five mortality rate that increased slightly, from 62 per 1,000 live births in 2000 to 69 per 1,000 live births in 2006. The causes of the high infant and under-five mortality include immediate causes such as diarrhea, pneumonia, malaria, and perinatal causes and underlying issues such as malnutrition and HIV/AIDS.
The HIS further shows that other respiratory system diseases, diarrhea without blood, common cold, nose/throat disease/disorder, and malaria are the five main causes of outpatient visits among under-five children. Additional causes are skin diseases, pneumonia, other syndrome/diagnosis, other gastrointestinal disease/disorder, and trauma/injury.
In the recent past, HIV, diarrhea, pulmonary tuberculosis (TB), pneumonia, and malaria have been the top causes of death in all health facilities in the country. Other leading causes of mortality are other respiratory system diseases, anemia, heart failure, malnutrition, and hypertension. The HIS data also reveal a growing threat of noncommunicable diseases (NCDs).
1.4.2 MAJOR HEALTH ISSUES
Maternal mortality increased sharply between 2000 and 2006. The 2006 NDHS (MoHSS 2008) estimated the maternal mortality ratio at 449 per 100,000 live births, up from 225 per 100,000 live births in 2000. An assessment of emergency obstetric care in the country showed that the main direct causes of maternal mortality are hemorrhage, eclampsia, obstructed labor, and sepsis, with HIV/AIDS as the principal indirect cause. There is however good access to antenatal and delivery services in all

1. INTRODUCTION AND BACKGROUND 5
regions of the country. Overall antenatal care attendance is high at 94.6 percent in 2006. In addition, there was a notable increase in the proportion of deliveries attended by skilled personnel between 1992 (68.2 percent) and 2006 (81.4 percent).
Namibia was on the verge of eliminating polio until the outbreak in 2006, following importation of wild polio virus. Following the successful outbreak response, no cases of polio have been reported since 2007. The Expanded Program on Immunization (EPI), which aims to achieve and maintain vaccine coverage above 90 percent for all antigens in every district, achieved vaccination coverage of 84 percent against measles for children age 12 months in 2006.
The HIV/AIDS pandemic has had a major impact on the life expectancy of Namibians and continues to threaten the socioeconomic fabric of the country. Overall, HIV prevalence has continued to rise, from 4.2 percent in 1992 to 19.9 percent in 2006 (MoHSS 2007). A national multi-sectoral response is in place, guided by the national AIDS policy and the third Medium-Term Strategic Plan (Republic of Namibia 2007). Significant resources have been mobilized from the Government, the U.S. President’s Emergency Plan for AIDS Relief (PEPFAR), and the Global Fund to Fight AIDS, Tuberculosis and Malaria (GF), among others, to address the AIDS pandemic.
TB is also a major public health problem in Namibia and is compounded by the HIV epidemic. With a TB prevalence rate of 765 cases per 100,000, Namibia has one of the highest case notification rates in the world. The emergence of drug-resistant strains of the disease imposes additional challenges for infection control in health facilities.
A number of factors have been identified as contributing to the high burden of TB in the country, including overcrowding and poor ventilation, poor nutrition, alcoholism, the HIV-TB co-infection rate (59 percent), and inadequate infection control/prevention.
1.5 NAMIBIAN HEALTH SYSTEM
1.5.1 NATIONAL GOALS AND VISION
The goals of sustainable development cannot be achieved when there is a high prevalence of debilitating illnesses. Hence, a responsive health system and its environment are of paramount importance to support the health of a population. Sufficient nutrition, quality health care, safe water, and adequate sanitary facilities are thus essential for the people’s quality of life. In this context, Vision 2030 envisages a Namibia where all preventable, infectious, and parasitic diseases are under secure control.
The MoHSS’s vision, as stated in the Health Policy Framework of 1998, is the attainment of a level of health and social well being by all Namibians, which will enable them to lead economically and socially productive lives. In line with this, the main objective of the Government is to make the provision of relevant preventive, promotional, curative, and rehabilitative health services affordable and accessible to all Namibians.
1.5.2 ORGANIZATION
1.5.2.1 PUBLIC SECTOR
The public health sector in Namibia is structured in a three-tier hierarchy, with central, regional, and district levels. In the context of the decentralization policy aimed at improving service provision and

NAMIBIA NATIONAL HEALTH ACCOUNTS 2001/02-2006/07 6
management, the central level has devolved authority to 13 MoHSS regional directorates. The central level has responsibility for policy formulation, regulation, planning, management development, and support for service provision for the entire health sector. The regional directorates oversee a total of 34 health districts, which are responsible for service delivery.
In 2006/07, there were 30 public district hospitals providing institutional medical and nursing care, including preventive, promotive, primary, and secondary curative health care. They also provide technical and referral support to 44 health centers and 265 clinics.
To support the districts, three intermediate hospitals have been designated, in Oshakati, Rundu, and Katutura, while the Windhoek Central Hospital performs the role of overall national referral hospital.
1.5.2.2 PRIVATE NOT-FOR-PROFIT SECTOR (NGOS)
Churches and NGOs play a significant role in protecting and promoting the health and social welfare of the Namibian people. Churches manage mission health facilities under contractual arrangements with the government in some districts. Many of the NGOs are involved in the delivery of community-based health care. Of these organizations, few are actually involved in the MoHSS planning processes, with the exception of NGOs that participate in the HIV/AIDS programs.
1.5.2.3 PRIVATE FOR-PROFIT SECTOR
The private health sector is regulated by the Hospital and Health Facilities Act of 1994. Private health facilities are licensed to provide health services to all patients and they complement the services of the public sector.
In 2006, there were a total of 844 private health facilities registered or licensed with the MoHSS. These facilities include 13 hospitals, 75 primary care clinics, eight health centers, and 75 pharmacies. There are 557 medical practitioners including dentists, psychologists, and physiotherapists. The majority of these facilities and practitioners are located in urban areas.

2. METHODOLOGY 7
2. METHODOLOGY
2.1 OVERVIEW OF APPROACH
The second round of NHA was designed to build upon lessons learned from the first round. It started with the constitution of a technical team from the MoHSS, National Planning Commission, and Namibia Financial Institutions Supervisory Authority (NAMFISA). The team undertook a one-week orientation seminar on the NHA framework and its application for informing policy. This was followed by a half-day sensitization meeting with stakeholders, chaired by the Deputy Minister of Health and Social Services.
For this estimation, the NHA framework was used to calculate the total financial expenditure on health care in Namibia. The framework is based on ICHA-defined classifications for health care expenditures and is presented in the form of matrices linking sources of funding, financing agents, providers and a breakdown of the uses of health services. In estimating health expenditures, primary and secondary data were collected. The primary data collection entailed the administration of questionnaires by enumerators to government ministries, employers including parastatals, donors, private insurance (medical schemes) such as the Public Service Employee Medical Aid Scheme (PSEMAS) and workman’s compensation from the Social Security Commission (SSC), and NGOs. The out-of-pocket (OOP) spending by households was estimated from the World Health Survey (WHS).
2.2 DATA SOURCES
As just noted, the data collection process for this NHA estimation relied extensively on primary data collected from questionnaires distributed to government ministries, employers, donors, and medical schemes. Secondary data were used for the estimation of household expenditures, collation and triangulation of primary data, and determining health expenditure ratios.
2.2.1 SECONDARY DATA
The secondary data used for the estimation were obtained from:
• Estimate of Revenue and Expenditures for the period 1 April 2001–30 March 2008, Ministry of Finance (MoF)
• Medium-Term Expenditure Frameworks for the period 2004/05–2009/10, MoF
• National Accounts 1996–2006, Central Bureau of Statistics and National Planning Commission
• Populations Projections 2001–2031, Central Bureau of Statistics and National Planning Commission
• Year-on-year average consumer price inflation, Central Bureau of Statistics and National Planning Commission
• Year-on-year average exchange rate, Bank of Namibia

NAMIBIA NATIONAL HEALTH ACCOUNTS 2001/02-2006/07 8
2.2.2 PRIMARY DATA
2.2.2.1 SURVEY INSTRUMENTS
To collect the primary data used for the estimation of health expenditure, a number of questionnaires were developed. The questionnaires were based on the first round of NHA, adjusted to account for the shortcomings in the data collection and analysis during that estimation. The questionnaires targeted government ministries, employers, donors, medical schemes, and NGOs.
2.2.2.2 QUESTIONNAIRE ADMINISTRATION
Preceding the data collection, the survey enumerators underwent three days of training, acquiring basic appreciation of NHA and understanding the design and purpose of the different questionnaires. Under the supervision of the technical team, the enumerators distributed the questionnaires by hand to selected organizations located in Windhoek. Each questionnaire was left with the respondent to complete over the course of three weeks. For organizations located outside of Windhoek, the questionnaires were distributed through fax and email. However, because there were a large number of organizations located in Walvis Bay and Swakopmund, questionnaires were delivered in person. Efforts were made to encourage complete reporting of expenditures in the questionnaires for all organizations.
The data collection was conducted in November and December 2007 and in part of January 2008.
2.2.2.3 SAMPLING
The sampling of institutions was primarily informed by the first round of NHA. This database of donors and NGOs was adjusted to take into account new entities involved in the health sector. The total number of insurance schemes in Namibia is small, so complete coverage was attempted.
With regard to the private employers and parastatals where the number of institutions is large, complete survey coverage was not attempted. The inventory of all registered employers was sourced from the SSC, which registers all employers. A sample was drawn from the list using the following criteria:
• The company must at least have 50 or more employees and
• The company identified has the potential to fund, be an agent of, or provide health services.
In all, 195 organizations were identified for the study with relevant questionnaires distributed to them. A total of 160 organizations responded (Table 1). The number of organizations that were identified and that responded to the questionnaire was greater than that of the first round of NHA (111 and 106, respectively).

2. METHODOLOGY 9
TABLE 1: BREAKDOWN OF ORGANIZATIONS FROM WHICH DATA WERE COLLECTED
Categories Number of targeted organizations Number of respondents Health insurance 11 10 Donors 18 12 Employers 154 127 NGOs 5 4 Government ministries 7 7 Total 195 160
2.3 DATA ENTRY AND ANALYSIS
Data collected from the questionnaires were entered into Epi Info using predefined data entry screens. The Epi Info files were then converted to Microsoft Excel for entry into the NHA tables.
Data analysis took place in April through June 2008. The data were edited and reviewed to verify the consistency of received information. During this process, it was necessary to contact some of the respondents for data verification. Data from primary and secondary sources including government ministries, employers, donors, and medical schemes, and household expenditure surveys were analyzed.
It was observed that respondents reported their expenditures using their own financial years. The financial years of a number of organizations did not match that of the government, which runs from April to March. Prior to data analysis, those different financial years had to be adjusted to coincide with the government financial year for consistency of information. This adjustment was made by adding the expenditure of the months overlapping with the target financial year (April to March) to the total expenditure of the missing months from the previous target year. It is, recommended that a standard reporting format be clearly outlined for the next round of NHA.
The analysis produced the following four standard tables for each financial year over the period 2001/02 - 2006/07:
• Financing Sources to Financing Agents (FS X HF)
• Financing Agents to Providers (HF X HP)
• Financing Agents to Functions (HF X HC)
• Providers to Functions (HP X HC)
2.3.1 GOVERNMENT
The information on government expenditures on health was collected from the following six ministries: Health and Social Services, Gender Equality and Child Welfare, Safety and Security, Defence, Regional Local Government and Housing, and Rural Development and Education. The selection of the ministries was based on the first round of NHA.
Due to the lack of disaggregated data, the expenditures on administration and public health programs were computed using ratios. The ratios for administration were derived at by incorporating national-level directorate expenditures and 11 percent of regional directorates’ expenditures, while the

NAMIBIA NATIONAL HEALTH ACCOUNTS 2001/02-2006/07 10
outpatient and inpatient ratios were derived using the HIS utilization rates of health facilities and the estimated cost of these services as determined from costing studies in the region. Hence, the expenditure for inpatients was assumed to be 50.3 percent, while that for outpatients was assumed to be 49.7 percent. For health programs, the discussion with key informants revealed that 60 percent of all expenditure went toward prevention of communicable diseases, 30 percent for maternal and child health (MCH) care, and 10 percent for NCDs.
2.3.2 PROVIDERS
In the collection of information on expenditure by provider type, the study set out to cover as many categories commonly used in NHA as possible. Although the study design had a long list of providers, in analyzing the expenditures, a minimal level of aggregation of the providers was carried out leading to seven categories for reporting.
The public facilities include expenditures of government clinics, health centers, district, intermediate and referral hospitals, mission hospitals that provide inpatient and outpatient services, as well as all pharmaceuticals and administrative costs associated with the operation of these institutions. Data obtained from the public facilities were not disaggregated into outpatient and inpatient expenditures. By utilizing information from the HIS and evidence from the literature, the study computed a weighting plan in line with that developed for the Government.
2.3.3 PRIVATE EMPLOYERS
Private employers, including parastatals, make up an important category that provides health care financing for their employees. The report covers expenditure data collected from employers for the period 2001/02–2006/07 on their contribution to health expenses of their employees and onsite health facilities. As indicated earlier, not all companies registered with the SSC were surveyed.
Although the team made attempts to obtain complete data from each company for each financial year, some questionnaires were either not returned (see Table 1 above) or were returned incomplete. To represent employer expenditures as accurately as possible for each questionnaire that was returned, the NHA team applied weights to the data collected. To apply the weights to the employer data, the total number of full-time employees for each company with available data was divided by an estimated total number of full-time employees surveyed, bringing the weighting factor to 52 percent. Hence, the reported expenditures of each employer are adjusted upward by 52 percent.
It should be noted that, due to the incompleteness of data from employers, their reported data for employee contributions were not used for analysis. The NHA team used the data received from medical aid schemes because there was a greater response rate and their data were considered more reliable.
2.3.4 INSURANCE
Information was obtained from nine private health insurance schemes registered under the Medical Aid Funds Act: Namibia Health Plan, Namibia Medical Care, Namdeb, Woermann Brock, Nammed Medical Aid Fund, Renaissance, NAPOTEL, Social Security, and Bankmed. In addition, the study obtained information from PSEMAS for public service employees and from the SSC, which includes workman’s compensation. It is essential to mention that there were no new entrants in terms of the private funds over the period under review.

2. METHODOLOGY 11
Although attempts were made to obtain complete data from each insurance company for the period under review, questionnaires were returned with information from earlier financial years missing. To represent insurance expenditures accurately for each questionnaire that was returned, the NHA team applied weights to the data collected. Complete data were collected for social security and PSEMAS, so those expenditures were not weighted.
To apply the weights to the insurance company data, each year the total number of beneficiaries for each company with available data was divided by an estimated total number of beneficiaries for all nine companies. This weighting factor was then applied to all the data collected for that year. The number of beneficiaries for companies with incomplete data was estimated using factors obtained from historical data as well as using judgment from NHA team members knowledgeable about the insurance setting in Namibia.
Due to a lack of required detailed information in some of the questionnaires completed by the private insurance companies, the study determined and utilized various ratios for the relative employer/employee contributions, provider contributions, and contributions to health services through consultation with experts from NAMFISA who were on the NHA team (Table 2).
TABLE 2: INSURANCE WEIGHTING PLAN
No. of estimated beneficiaries
No. of known beneficiaries
Weighting factor
2006/07 95,821 93,857 97.95% 2005/06 91,656 89,692 97.86% 2004/05 87,121 69,875 80.20% 2003/04 85,737 68,893 80.35% 2002/03 85,918 69,476 80.86% 2001/02 90,302 47,372 52.46%
2.3.5 DONORS AND NGOS
Donors finance public health services through extra budgetary resources (funds that go directly to the financing agent without passing through the government budget books).
To capture the extra budgetary resources, a questionnaire was sent to major donors involved in the Namibian health sector. This was followed by personal visits by the enumerators and interviews with key informants; however, only a few donors provided information as far back as financial year 2002/03 and 2001/02. Data on donors’ contributions to the government was triangulated from the Medium-Term Expenditure Framework documents.
In computing the contributions of donors for each financial year, a weighting formula was developed that took into consideration the number of responding donors, their relative sizes, the known total number of donors in the health sector, and trends of donor support from preceding years. An attempt was made to group all the active donors into quartiles for the weighting plan. For the earlier years of the study (2001/02-2003/04), a number of the responding donors did not provide the requested expenditure data. With the relative sizes of the active donors being similar, the study assigned constant weighting factors of 5, 0.4, and 2 to scale up the expenditures of the responding donors in 2001/02, 2002/03, and 2003/04, respectively. In the later years, from 2004/05 to 2006/07, the presence of two substantially large donors, the GF and the United States Government (through PEPFAR), significantly lessened the impact of data not obtained from the non-responding donors, resulting in smaller weights

NAMIBIA NATIONAL HEALTH ACCOUNTS 2001/02-2006/07 12
assigned to the responding donors. Weighting factors of 0.05, 0.05, and 0.012 were thus utilized for 2004/05, 2005/06, and 2006/07, respectively.
The NGOs in Namibia function as financing agents and providers of health services. The information obtained from the NGOs surveyed was incomplete and insufficient for effective analysis. Given that the principal source of funds for NGOs in Namibia is donors, the study has utilized the information obtained from the donors to represent the NGO contributions to the health sector.
2.3.6 HOUSEHOLD OUT-OF-POCKET
OOP spending refers to expenditures made directly to the provider by a household member. Due to limited available and accessible household studies with health expenditure modules, national annual OOP spending for the five years under review (2001/02-2006/07) was derived using the 2002 WHS dataset. This dataset is based on a WHO-designed study implemented by the MoHSS and WHO, which was conducted nationwide with 4,656 households (in 229 primary sampling units). The questionnaire covered several health-related topics, including OOP spending. Interviewed adults were asked to provide information about themselves or their children age 12 or younger. It should be noted that the WHS was not designed to provide annual OOP expenditures as per NHA needs but was the only accessible dataset to the team; consequently, some adjustments were made for NHA estimation purposes.
For inpatient care, estimates were based on events said to have occurred within the four weeks preceding the interview. These estimates were then multiplied by 13 to convert four weeks to 52 weeks for annualization purposes. For outpatient care, estimates were based on a 30-day recall period. Outpatient estimates (at various health facilities and private pharmacy/shops) were produced by multiplying the average expenditure for each visit at a given provider type by the total number of visits in a month and 13 to produce annual spending.
The 2002 WHS estimates were then mapped to NHA classification categories. To extrapolate the estimates for 2001/02, 2003/04, 2004/05, 2005/06, 2006/07, the 2002 WHS figures were adjusted for annual population growth and inflation rates. Inflation rates were determined from the Central Bureau of Statistics’ Consumer Price Index. Specifically, financial year rates (April 1-March 31) were calculated from monthly inflation rates published in the Consumer Price Index. Population growth rates for each year were derived from the Population by Projection 2001/2031 (Central Bureau of Statistics 2006).
When compared with government-published estimates (Estimates of revenue and expenditures for the financial years (1 April 2007-31 March 2010)) of patient revenue received at public facilities, the WHS estimates (real and adjusted) of OOP spending at public providers were significantly larger for all years studied. After careful assessment of the quality of both data sources, the NHA team agreed that the government produced annual records of patient revenue were more robust than the WHS dataset, which had some analysis limitations and challenges in terms of NHA needs.
Nevertheless, government-published estimates did not provide data on OOP spending at private providers and so it was necessary to use the WHS estimates. To do this, WHS estimates were scaled back by a factor of approximately fivefold, representing the magnitude of difference between the original WHS estimates and the government-published revenue records. These scaled-back estimates were then used to populate the NHA matrices.

2. METHODOLOGY 13
2.4 LIMITATIONS
Overall, the financial information from primary and secondary data sources was aggregated, which presented a lack of disaggregated financial information necessary to determine certain sub-classifications, such as the distinction of facilities by public and mission management as well as by hospital and clinics. Due to a lack of detailed information from respondents, the study utilized ratios to determine the relative employer/employee contributions, provider contributions and contributions to health programs. Although an effort was made through confirming the ratios with existing literature and individual consultations in the health sector, they may not reflect the realities.
Additionally, the study did not undertake a survey on providers, so the information included on providers was based on the assumptions and ratios as described in the data analysis section. Had information been obtained directly from the providers, it would have been easy to triangulate the data with that obtained from the financing agents. This study has had to use data from only one source for providers. It is recommended that future NHA estimations include provider expenditure modules, with efforts put into ensuring routine facilities reporting systems collect information in forms that will facilitate NHA analysis.
The team acknowledges the limitations in the OOP estimation approach as detailed in the data analysis section, and, for future estimations, it will be important to base OOP estimates on more up-to-date and rigorous household health and expenditure surveys.
Although the general approach to NHA is to use secondary data collected from existing sources, the health expenditure information needed for the NHA estimation was not readily available. Health expenditure questions should be included on routine surveys to help facilitate the institutionalization of NHA in the country.
The study has not made a consistent attempt to benchmark the results of this round of the NHA as there are not many countries that have recently conducted studies in the BNLSS (Botswana, Namibia, Lesotho, South Africa, and Swaziland) sub-region.


3. FINDINGS 15
3. FINDINGS
To accurately compare findings across the years, the numbers reported in this section have been adjusted for inflation and are reflective of real 2006 Namibian dollars. The NHA tables included in the annexes have not been adjusted and are reported in nominal amounts for their respective years.
3.1 TOTAL RESOURCE ENVELOPE FOR HEALTH: WHO FINANCES HEALTH CARE?
Total health expenditure
Figure 1 indicates the THE trends for the period of study. THE was estimated at N$1,854 million (US$192 million) in 2001/02, rising for every year of the study and reaching N$3,890 million (US$549 million) in 2006/07. It is significant that THE grew over the study period both in nominal and real terms. Between 2001/02 and 2006/07, THE increased 2.1-fold in real terms.
FIGURE 1: TOTAL HEALTH EXPENDITURE, 2001/02−2006/07
$1,854
$2,176
$2,453
$2,787
$3,397
$3,890
$1,000
$1,500
$2,000
$2,500
$3,000
$3,500
$4,000
$4,500
2001/02 2002/03 2003/04 2004/05 2005/06 2006/07Year
TH
E in
200
6 re
al N
$ (m
illio
ns)
NAMIBIA NATIONAL HEALTH ACCOUNTS 2001/02-2006/07 16
Per capita spending on health
The per capita expenditure on health is shown in Figure 2. The chart shows a steady increase in per capita health expenditures over the period studied. In 2001/2002, the total expenditure on health per person was N$1,013 (US$143). In 2006/07, the total expenditure per person on health was N$1,959 (US$276). Health investment per capita in 2006/07 has almost doubled from the level in 2001/2002.
FIGURE 2: PER CAPITA SPENDING ON HEALTH, 2001/02−2006/07
Total expenditure on health as a percentage of GDP
Figure 3 shows total health expenditure as a percentage of GDP. In 2001/02, the country spent 6.5 percent of its GDP on health. By the end of 2006/07, the percentage was 8.3 percent. However, it should be noted that steady growth until 2005/06 (8.5 percent of GDP) reversed slightly to 8.3 percent in 2006/07.
143
165
183
205
245
276
1,013
1,170
1,297
1,450
1,737
1,959
0 500 1,000 1,500 2,000
2001/02
2002/03
2003/04
2004/05
2005/06
2006/07
Yea
r
Per Capita THE in 2006 real N$
per capita THE, N$
per capita THE, US$

3. FINDINGS 17
FIGURE 3: TOTAL EXPENDITURE ON HEALTH AS A PERCENTAGE OF GDP
.
THE as percentage of GDP of BNLSS countries, 2005
Namibia compares well with other countries in the BNLSS sub-region in terms of the proportion of the national GDP devoted to health (Figure 4). Namibia has the second highest percentage of GDP (8.5 percent) going to health, after South Africa (8.7 percent).
FIGURE 4: THE AS PERCENTAGE OF GDP OF BNLSS COUNTRIES, 2005
7.6
6.5 6.5
7.2
8.58.3
6.06.57.07.58.08.59.0
2001/02 2002/03 2003/04 2004/05 2005/06 2006/07Year
Per
cent
age
of G
DP
8.3
5.5
8.5
8.7
6.3
4 5 6 7 8 9
Botswana
Lesotho
Namibia*
South Africa
Swaziland
Coun
tries
Percentage of GDP
NAMIBIA NATIONAL HEALTH ACCOUNTS 2001/02-2006/07 18
3.2 FINANCING SOURCES
The health sector in Namibia is financed by the traditional sources: public (government), companies, households, and donors. Over the period covered by the second NHA, these entities contributed varying levels of resources for health.
THE breakdown by financing source, 2001/02−2006/07
Figure 5 shows the trends in THE broken down by financing source. The public and household spending steadily increased over the years, while companies’ investment in health was relatively constant. Donor spending was constant from 2001/02 to 2003/04 and increased sharply in 2004/05 with the advent of the GF. Donor spending has continued to increase since then.
FIGURE 5: THE BREAKDOWN BY FINANCING SOURCE, 2001/02−2006/07
264 260 293 304 316 346344452
555626
868959
71 70 73
574
1,174
1,3951,532
1,587 1,6361,713
269
872
-50
01,
000
1,50
02,
000
2001/02 2002/03 2003/04 2004/05 2005/06 2006/07
Year
in re
al N
$ (M
illio
ns)
Public Companies Households Donor
3. FINDINGS 19
Magnitude of increase between 2001/02 and 2006/07
The magnitude increase in absolute terms of the contributions of the different entities to health financing is shown in Table 3. Public spending increased 1.5-fold, while company spending remained relatively constant over the five years. Household contributions nearly tripled and donor investment increased by 12.3-fold.
TABLE 3: MAGNITUDE OF CHANGE AMONG FINANCING SOURCES, 2001/02 AND 2006/07
Financing sources
2001/02 (N$) 2006/07 (N$) Magnitude of Change
Public 1,174,387,258 1,712,593,763 1.5
Companies 264,490,485 346,313,196 1.3 Households 344,255,887 959,147,623 2.8
Donor 70,851,277 871,785,555 12.3
THE breakdown by financing source
Figure 6 illustrates the analysis of health financing by source. Of the total amount of funds spent on health in 2006/07, 44.0 percent came from public sources, 24.7 percent from households (largely through insurance), 22.4 percent from donors, and 8.9 percent from companies. The greater proportion of household health expenditures came from their contribution to health insurance schemes, with OOP constituting about 13 percent total household spending.
FIGURE 6: THE BREAKDOWN BY FINANCING SOURCE
63.3%
64.1%
62.4%
57.0%
48.2%
44.0%
14 .3 %
12 .0 %
12 .0 %
10 .9 %
9 .3 %
8 .9 %
18.6%
20.8%
22.6%
22.4%
25.6%
24.7%
16.9%
22.4%
3.8%
3.2%
3.0%
9.7%
0% 20% 40% 60% 80% 100%
2001/02
2002/03
2003/04
2004/05
2005/06
2006/07
% o f T H E
Public Companies Households Donor

NAMIBIA NATIONAL HEALTH ACCOUNTS 2001/02-2006/07 20
In relative terms, donor and household contributions to health sector financing in Namibia increased significantly, while government contributions decreased. In 2001/02, donors contributed 3.8 percent; by 2006/07, their share had increased to 22.4 percent. Nevertheless, in 2006/07, the public sector remained the biggest financier of health, followed by households and donors (in that order).
Donor spending on health as a percentage of total donor disbursements
Donor spending on health as a percentage of total donor disbursements is depicted in Figure 7. As the figure shows, investment in health has become the largest priority area for donors. In 2001/02, 7.2 percent of donor spending went to health, while in 2006/07, this share increased to 79.4 percent. A sharp increase in donor spending occurred in 2004/05, when the GF and PEPFAR started to provide funds for the health sector and, consequently, considerably increased the donor contribution to health. Donor spending has continued to increase since that time. The NHA team noted that, during the period covered by the study, a number of donors were scaling down their activities in Namibia, given the country’s classification as a middle-income country. The total donor contributions might have dropped significantly but for the arrival of the GF and PEPFAR resources.
FIGURE 7: DONOR SPENDING ON HEALTH AS A PERCENTAGE OF TOTAL DONOR DISBURSEMENTS
30.4
77.3
7.96.47.2
79.4
0
20
40
60
80
100
2001
/02
2002
/03
2003
/04
2004
/05
2005
/06
2006
/07
Financial Year
Perc
enta
ge

3. FINDINGS 21
Government spending on health as a percentage of total government spending
Figure 8 shows government spending on health as a percentage of total government spending over the five-year period studied. The average percentage, 12.2 percent, fell short of the expenditure levels pledged in the Abuja declaration, in which heads of state committed to spending 15 percent of their countries’ total public expenditure on health.
FIGURE 8: GOVERNMENT SPENDING ON HEALTH AS A PERCENTAGE OF TOTAL GOVERNMENT SPENDING
A close look at the government ministries that receive funds for health show that over the five-year period, the MoF allocated (through the MoHSS) an average 10.2 percent of government expenditures to health. (The Ministries of Education and Defence are the two other significant recipients of MoF funds for health.) In 2006/07, 11.3 percent of the government budget went to health. This is a slight decline from the 11.7 percent in 2001/02.
3.3 FINANCING AGENTS OF HEALTH CARE: WHO MANAGES HEALTH FUNDS?
Financing agents receive funds from financing sources and exercise programmatic control over their deployment for the provision of health services and products. During the period under review, the major financing agents in Namibia were the MoHSS and Ministries of Education, Defense, and Safety and Security. Others were the SSC, private social insurance, private companies, households, and NGOs.
From 2001/02 to 2006/07, government as a financing agent managed the largest amount of health resources, with its share of THE managed slightly increasing over the period. Household OOP spending remained relatively constant over the years.
11.3
12.3
12.7
11.7
12.412.7
10
10.5
11
11.5
12
12.5
13
13.5
14
2001/02 2002/03 2003/04 2004/05 2005/06 2006/07Year
% o
f Go
v't S
pend
ing

NAMIBIA NATIONAL HEALTH ACCOUNTS 2001/02-2006/07 22
The share of THE managed by private insurance increased over the period, as seen in Figure 9. This is attributable to increased contributions from households. The public insurance share gradually increased over the years, while the company management of funds remained constant for the same period.
FIGURE 9: BREAKDOWN OF THE BY FINANCING AGENT
1,3761,491 1,519
1,422
1,678 1,642
487 488 528 544
781 843
75 103 139 111 132 12638 13 8
250333
636
0
500
1,000
1,500
2,000
2,500
2001/02 2002/03 2003/04 2004/05 2005/06 2006/07
In 2
006
real
N$
Mill
ions
Government Public Insurance Private InsuranceOut-of-Pocket Companies NGOs (including donors)
3. FINDINGS 23
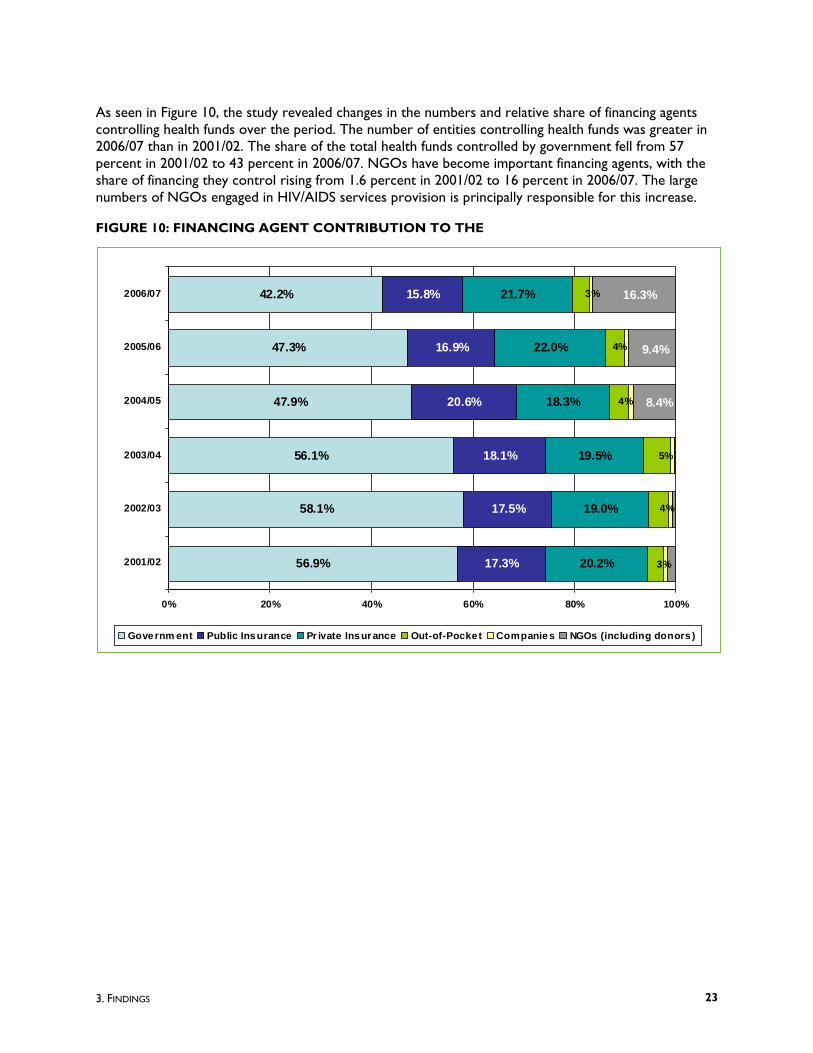
As seen in Figure 10, the study revealed changes in the numbers and relative share of financing agents controlling health funds over the period. The number of entities controlling health funds was greater in 2006/07 than in 2001/02. The share of the total health funds controlled by government fell from 57 percent in 2001/02 to 43 percent in 2006/07. NGOs have become important financing agents, with the share of financing they control rising from 1.6 percent in 2001/02 to 16 percent in 2006/07. The large numbers of NGOs engaged in HIV/AIDS services provision is principally responsible for this increase.
FIGURE 10: FINANCING AGENT CONTRIBUTION TO THE
56.9%
58.1%
56.1%
47.9%
47.3%
42.2%
17.3%
17.5%
18.1%
20.6%
16.9%
15.8%
20.2%
19.0%
19.5%
18.3%
22.0%
21.7% 3%
4%
4%
5%
4%
3%
8.4%
9.4%
16.3%
0% 20% 40% 60% 80% 100%
2001/02
2002/03
2003/04
2004/05
2005/06
2006/07
Governm ent Public Insurance Pr ivate Insur ance Out-of-Pocket Companies NGOs (including donors )

NAMIBIA NATIONAL HEALTH ACCOUNTS 2001/02-2006/07 24
In terms of where funding for the financing agents came from, the MoHSS funding came principally from central government revenue and donors. Donors contributed less than 5 percent to the MoHSS from 2001/02 to 2004/05, but in 2006/07, this figure increased dramatically to 14 percent, as seen in Figure 11.
FIGURE 11: TRENDS IN MOHSS FINANCING
96.0%
95.3%
95.2%
97.4%
86.2%
86.1%
13.8%
13.9%
2.6%
4.8%
4.7%
4.0%
0% 10% 20% 30% 40% 50% 60% 70% 80% 90% 100%
2001/02
2002/03
2003/04
2004/05
2005/06
2006/07
Central Government Revenue Donors
3. FINDINGS 25
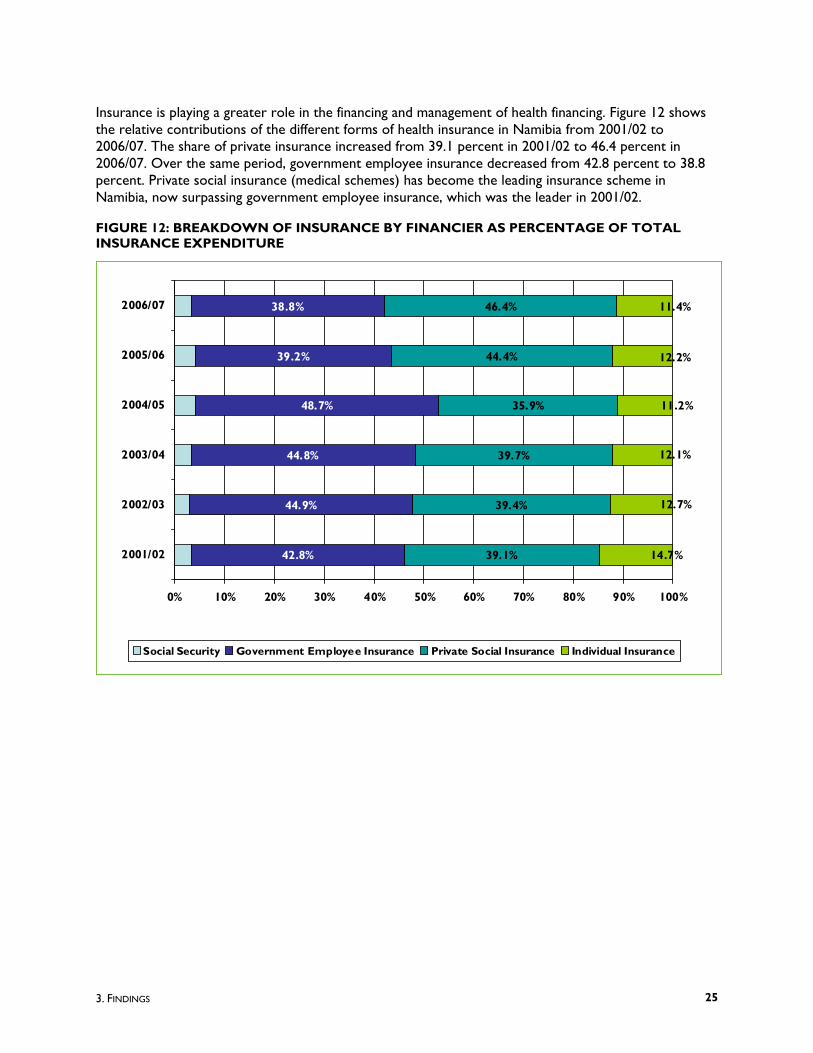
Insurance is playing a greater role in the financing and management of health financing. Figure 12 shows the relative contributions of the different forms of health insurance in Namibia from 2001/02 to 2006/07. The share of private insurance increased from 39.1 percent in 2001/02 to 46.4 percent in 2006/07. Over the same period, government employee insurance decreased from 42.8 percent to 38.8 percent. Private social insurance (medical schemes) has become the leading insurance scheme in Namibia, now surpassing government employee insurance, which was the leader in 2001/02.
FIGURE 12: BREAKDOWN OF INSURANCE BY FINANCIER AS PERCENTAGE OF TOTAL INSURANCE EXPENDITURE
42.8%
44.9%
44.8%
48.7%
39.2%
38.8%
39.1%
39.4%
39.7%
35.9%
44.4%
46.4%
14.7%
12.7%
12.1%
11.4%
12.2%
11.2%
0% 10% 20% 30% 40% 50% 60% 70% 80% 90% 100%
2001/02
2002/03
2003/04
2004/05
2005/06
2006/07
Social Security Government Employee Insurance Private Social Insurance Individual Insurance

NAMIBIA NATIONAL HEALTH ACCOUNTS 2001/02-2006/07 26
Table 4 shows the magnitude of increase in the relative share of THE managed by the different financing agents between 2001/02 and 2006/07. NGOs, including donors, managed 22-fold more funds in 2006/07 than they did in 2001/02. The magnitude of increase for all other financing agents approximately doubled.
TABLE 4: MAGNITUDE OF CHANGE AMONG FINANCING AGENTS, 2001/02 AND 2006/07
Financing agent 2001/02 (N$) 2006/07 (N$) Magnitude of Change
Government 1,055,730,913 1,641,597,829 1.55
Public insurance 321,127,930 614,222,886 1.91
Private insurance 373,967,669 842,723,230 2.25
Out-of-pocket 57,491,032 126,080,880 2.19
Companies 16,693,706 29,545,265 1.77
Donors (including NGOs) 28,943,658 635,670,045 21.96 Total 1,853,954,908 3,889,840,136 2.10
3.4 PROVIDERS OF HEALTH CARE: WHO USES HEALTH FUNDS TO DELIVER CARE?
The major providers that received funds from the financing agents for the delivery of health services during the period under review are categorized as public facilities, private facilities, other facilities, dispensing chemists, public health programs, administration, and others as described in this section. More specifically, public facilities include government and mission hospitals; private facilities include private hospitals and offices of private physicians; and other facilities include medical and diagnostic laboratories, ambulance services, and blood banks. Public health programs refer to the provision and administrative costs associated with the implementation of programs such as health promotion and protection programs. General health administration is separate from administration costs associated with public health programs. General administration refers specifically to costs incurred for the overall regulation of activities of agencies that provide health care.

3. FINDINGS 27
Share of provider categories of total health expenditures
With the public health sector providing services for about 85 percent of the population, it is not surprising that public facilities consumed the largest amount of health expenditures in all years under review. In real terms, the total expenditures of public facilities grew from N$972 million (US$101 million) in 2001/02 to N$1,561 million (US$220 million) in 2006/07, as seen in Figure 13.
FIGURE 13: THE BREAKDOWN BY PROVIDER 2001/02-2006/07
Private facilities are the second largest recipients of health funds, and their share of health expenditures grew steadily increased from N$410 million (US$43 million) in 2001/02 to N$858 million (US$121 million) in 2006/07.
Expenditures on the provision of public health programs and provision of administration categories were relatively constant in the early part of the period studied; then they experienced sharp increases from 2003/04 and 2005/06 respectively. The increases in the expenditures for these categories can be attributed to the arrival of more partners and their focus on the provision of public health programs.
972
1,1741,293 1,343
1,561 1,561
410 453540
611785
858
114 156 181 201 224 245217 262 294 313 353
546
0
200
400
600
800
1000
1200
1400
1600
1800
2001/02 2002/03 2003/04 2004/05 2005/06 2006/07
Financial Year
In 2
006
real
N $
(Mill
ions
)
Public facilities (incl. Mission) Private facilitiesOther facilities Dispensing chemistsProvision of public health programs Provision of AdministrationOthers

NAMIBIA NATIONAL HEALTH ACCOUNTS 2001/02-2006/07 28
In terms of the relative shares of the different provider categories, Figure 14 shows that the public facilities’ share decreased from 53 percent in 2001/02 to 41 percent in 2006/07. The shares of private facilities, dispensing chemists, and administration remained relatively stable at 22 percent, 6.5 percent, and 12 percent, respectively, over the period studied.
FIGURE 14: PERCENT SHARE OF THE BY PROVIDER CATEGORY, 2001/02–2006/07
Figure 14 reveals that expenditure on provision of public health programs experienced the greatest rate of increase in share of total expenditure, with its share rising from 5.3 percent in 2001/02 to 15.6 percent in 2006/07. A significant number of the implementing partners of the GF and PEPFAR are involved in the provision of public health programs.
52.5
53.9
48.2
48.2
46.0
40.1
22.1
20.8
21.9
21.9
23.1
22.1
6.2
7.2
7.2
7.2
6.6
6.3
5.3
3.9
8.5
8.5
11.5
15.6
11.7
12.1
11.2
11.2
10.4
14.0
0 20 40 60 80 100
2001/02
2002/03
2003/04
200405
2005/06
2006/07
Fina
ncia
l Yea
r
Percentage Contribution
Public facilities (incl. Mission)Private facilitiesOther facilitiesDispensing chemistsProvision of public health programsProvision of AdministrationOthers

3. FINDINGS 29
Table 5 presents the magnitude of the change in the shares of the different providers. Expenditures on provision of public health programs and provision of administration increased fivefold and twofold, respectively, between 2001/02 and 2006/07. Other providers’ shares increased by less than twofold over the same period. While the “others” category (not specified by any kind and donor facilities) increased sizably, it is not a major consumer of provider expenditure.
TABLE 5: MAGNITUDE OF CHANGE AMONG PROVIDERS, 2001/02 AND 2006/07
2001/02 (N$) 2006/07 (N$) Magnitude of Change
Public facilities (incl. mission) 972,405,639 1,561,492,789 1.6 Private facilities 410,320,372 857,795,490 2.1 Other facilities 41,180,125 68,906,239 1.7 Dispensing chemists 114,419,381 244,773,269 2.1
Provision of public health programs 97,928,036 607,475,308 6.2 Provision of administration 217,234,235 545,850,919 2.5 Others 467,119 3,546,123 7.6
Financing agents share of provision of public health programs
The study analyzed the expenditures on provision of public health programs by different financing agents and found that the total expenditure had grown from N$98 million (US$10 million) in 2001/02 to N$607 million (US$86 million) in 2006/07 (Table 6). The MoHSS expenditure on public health programs doubled between 2001/02 and 2006/07. In 2001/02, NGOs and donors, as financing agents, spent N$29 million (US$3 million) on provision of public health program, with the amount rising to N$462 million (US$65 million) in 2006/07, a 16-fold increase. In 2006/07, more ministries, including those of Gender Equality and Child Welfare and of Education, started to contribute to health programs.
TABLE 6: PROVISION OF PUBLIC HEALTH PROGRAMS BY FINANCING AGENT, 2001/02 AND 2006/07
2001/02 (N$) 2006/07 (N$) Magnitude of change
MoHSS 68,984,378 133,070,210 1.9
Donors (including NGOs) 28,943,658 461,521,189 15.9 Ministry of Gender Equality and Child Welfare 1,208,394 - Ministry of Education 11,675,515 - Total 97,928,036 607,475,308 6.2

NAMIBIA NATIONAL HEALTH ACCOUNTS 2001/02-2006/07 30
In terms of the relative shares of the financing agents that manage the funds for the provision of public health programs, Figure 15 shows that the MoHSS share declined from over 70 percent in the early years of the study – in fact, in 2003/04, it was virtually the only financing agent of public health funds – to only 22 percent in 2006/07. Conversely, the NGO share rose from 30 percent in 2001/02 to 76 percent in 2006/07.
FIGURE 15: SHARE OF FINANCING AGENTS THAT MANAGE PROVISION OF PUBLIC HEALTH PROGRAMS FUNDS
3.5 FUNCTIONS: SERVICES AND PRODUCTS PURCHASED WITH HEALTH FUNDS
Health funds that financing agents pay to providers are used by the providers to deliver a range of services and/or facilitate program activities. Recognizing the limitations in levels of disaggregation of expenditure data collected from the survey, the study reports on 15 selected functional categories, up from the 11 categories reported on in the first Namibia NHA study. For the period of estimation, inpatient care, outpatient care, preventive and public health services, and health administration were the primary uses of health funding in Namibia.
Inpatient care includes services delivered to inpatients during overnight stays at health providers. This classification includes total expenditures occurred throughout the inpatient visit including medical and diagnostic labs, hospital fees, and salaries of doctors and nurses. Outpatient care refers to services delivered to outpatients by physicians usually included in the ambulatory care system such as private offices and clinics. Preventive and public health services refer to MCH care, family planning and counseling, social health programs, and prevention of communicable and noncommunicable diseases. The health administration classification comprises administrative activities of private insurers and the planning and management of health funds by providers and financing agents.
70.4%
89.6%
99.7%
19.9%
16.2%
21.9%
29.6%
80.1%
72.8%
76.0%
10.4%
10.4%
0% 20% 40% 60% 80% 100%
2001/02
2002/03
2003/04
2004/05
2005/06
2006/07
Ministry of Health & Social Services NGOs (including donors)
Ministry of Gender Equality and Child Welfare Ministry of Education
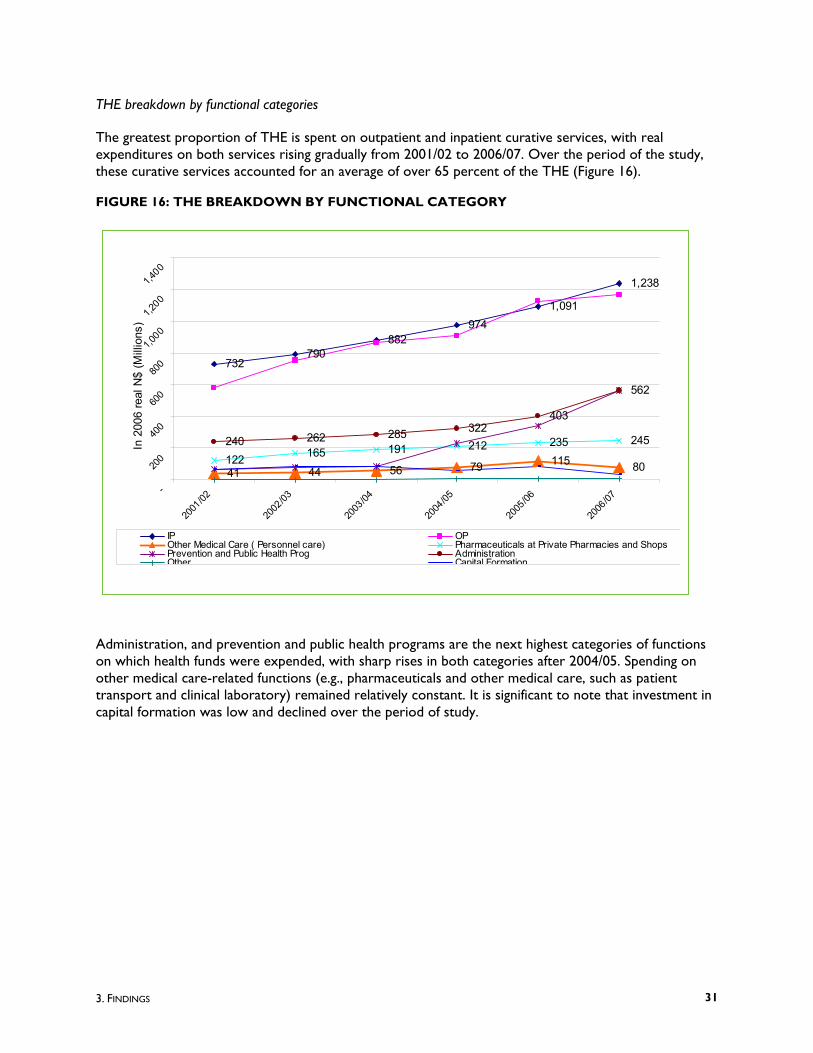
3. FINDINGS 31
THE breakdown by functional categories
The greatest proportion of THE is spent on outpatient and inpatient curative services, with real expenditures on both services rising gradually from 2001/02 to 2006/07. Over the period of the study, these curative services accounted for an average of over 65 percent of the THE (Figure 16).
FIGURE 16: THE BREAKDOWN BY FUNCTIONAL CATEGORY
Administration, and prevention and public health programs are the next highest categories of functions on which health funds were expended, with sharp rises in both categories after 2004/05. Spending on other medical care-related functions (e.g., pharmaceuticals and other medical care, such as patient transport and clinical laboratory) remained relatively constant. It is significant to note that investment in capital formation was low and declined over the period of study.
732790
882974
1,091
1,238
41 44 56 79 115 80122 165 191 212 235 245240 262 285 322403
562
-
200
400
600
800
1,00
0 1,
200
1,40
0
2001
/02
2002
/03
2003
/04
2004
/05
2005
/06
2006
/07
In 2
006
real
N$
(Mill
ions
)
IP OPOther Medical Care ( Personnel care) Pharmaceuticals at Private Pharmacies and Shops Prevention and Public Health Prog AdministrationOther Capital Formation

NAMIBIA NATIONAL HEALTH ACCOUNTS 2001/02-2006/07 32
The analysis of the breakdown of expenditures on public health programs revealed a sharp reversal of spending in MCH, NCDs, and school health programs (Figure 17).
FIGURE 17: PERCENT BREAKDOWN BY TYPE OF PUBLIC HEALTH PROGRAM
Investment in MCH programs decreased steadily, from 44 percent in 2001/02 to less than 3 percent in 2006/07. NCD programs accounted for the lowest share of programmatic spending throughout the period and decreased from 5 percent in 2001/02 to 0.5 percent in 2006/07. With the preliminary results of the 2006 NDHS as well as HIS reports indicating increasing levels of maternal mortality and higher incidence of NCDs, this expenditure pattern needs to be carefully monitored.
The study revealed that, as a percentage of programmatic spending, investment in the prevention and management of communicable diseases increased from 51 percent in 2001/02 to 96.8 percent in 2006/07.
With respect to the magnitude of change in spending of the different programs between 2001/02 and 2006/07, the analysis showed that investment in MCH programs in 2006/07 were only 50 percent of the spending levels in 2001/02, as seen in Table 7.
Investment in communicable diseases programs increased by almost 15-fold from 2001/02 levels, while expenditure levels on NCDs declined marginally. The absence of data for school health services in 2006/07 could reflect lack of disaggregated data at this level.
43.9%
39.4%
26.6%
7.1%
5.8%
2.7%
51.2%
60.2%
70.8%
91.9%
93.6%
96.8%
4.7 %
0.3 %
2.6 %
1.1%
0.6 %
0.5 %
0% 10% 20% 30% 40% 50% 60% 70% 80% 90% 100%
2001/02
2002/03
2003/04
2004/05
2005/06
2006/07
% of Public Health Program
M aternal and child care, family planning and counseling Scho ol health servicesP reventio n of co mmunicable disease P revention of nonco mmunicable diseases

3. FINDINGS 33
TABLE 7: BREAKDOWN OF PUBLIC HEALTH PROGRAMS, 2006/07
Public Health Program 2001/02 (N$) 2006/07 (N$) Magnitude of change
Maternal and child care, family planning 30,252,180 15,303,792 0.5
School health services 149,457 - Prevention of communicable disease 35,346,819 544,193,899 - Prevention of noncommunicable disease 3,239,680 2,838,945 0.9
3.6 FINANCING SOURCES BY FUNCTIONS: WHO SPENDS ON WHAT?
Figures 18 and 19 show the functional (end service/product rendered) use of financiers’ funds in 2001/02 and 2006/07.
In both years, public funds were used to finance all major functions and were the largest overall financier of health in Namibia. While the relative share of public contribution to each functional category decreased between 2001/02 and 2006/07, in 2006/07, public resources were still financing appreciably larger shares of curative care (inpatient, outpatient, and other medical care) and capital formation than were other financiers. Also in 2006/07, public and donor resources contributed the same share of administrative expenses and were the leading financiers for this functional category.
FIGURE 18: ALLOCATION OF HEALTH FUNDS FROM FINANCING SOURCES TO FUNCTIONS, 2001/02
24.0% 21.4%
2.0% 1.2% 3.6%7.7%
3.6%
6.4%3.1%
2.9%
1.8%
8.3%
6.0%
2.6%
1.6%1.9%
0.0%
5.0%
10.0%
15.0%
20.0%
25.0%
30.0%
35.0%
40.0%
45.0%
IP OP Othermedical care
Drugs atpriv. Pharm.
& shops
Preventionand Public
HealthPrograms
HealthAdmin
CapitalFormation
Other
Function
% o
f TH
E
Public Companies HH Donors

NAMIBIA NATIONAL HEALTH ACCOUNTS 2001/02-2006/07 34
FIGURE 19: ALLOCATION OF HEALTH FUNDS FROM FINANCING SOURCES TO FUNCTIONS, 2006/07
The pattern of donor spending changed significantly between 2001/02 and 2006/07. In 2001/02, donors contributed little to health care and most of those funds went to inpatient and outpatient curative care, along with some for health administration. In 2006/07, donor contributions increased sizably − donors became the largest financier of public health programs and began covering a significant share of administrative expenses.
Compared with 2001/02, household contributions in 2006/07 to health increased substantially. In both years, households were the second largest financiers of inpatient and outpatient care (second to the government). In 2006/07, households became the leading payer of pharmaceuticals purchased at private pharmacies/shops in Namibia, surpassing the contribution of companies, the former leader in 2001/02. Finally, household funds were also used to cover insurance administrative expenses in both years.
As mentioned earlier, company spending on health has remained relatively constant over the five years of estimation. With increased contributions from donors, households, and government in 2006/07, the share contributed by companies to various functional categories has decreased. Their funds are largely used to finance curative care, administration, and medicines purchased at private pharmacies and shops. Little or no spending was reported for public health programs and capital formation.
17.8% 14.9%
1.5% 1.1% 2.6% 5.4%0.0%
2.7%3.5%
1.5%
1.2%
9.1%9.3%
3.7%2.5%
2.3%2.3%
5.4%
0.7%
11.8%
0.0%
5.0%
10.0%
15.0%
20.0%
25.0%
30.0%
35.0%
IP OP Othermedical
(personal)care
Pharm. andother
nondurablesat private
pharmacies& shops
Preventionand Public
HealthPrograms
HealthAdmin
CapitalFormation
Other
Function
% o
f TH
E
Public Companies HH Donors

4. CONCLUSION AND RECOMMENDATIONS 35
4. CONCLUSION AND RECOMMENDATIONS
The 2001/02-2006/07 NHA estimation revealed significant developments and changes in the Namibian health system. It is the intention of the MoHSS that these findings be used by all health stakeholders to improve evidence-based policymaking, planning, and implementation.
As shown in the previous chapter, health spending has doubled over the five-year period studied. Namibia now spends 8.3 percent of its GDP on health, which, among BNLSS countries, is second only to South Africa. This increase in spending is largely due to a tripling of spending by household contributions to insurance and a twelvefold increase in contributions from donors. It should be noted that spending on health is now the leading priority area for donors, accounting for 79 percent of all donor disbursements in Namibia.
While in 2006/07 the Government continued as the leading financier and manager of health, the Namibian health system is benefiting from increased contributions and involvement of other stakeholders, particularly donors and their implementing agencies, as well as households.
With respect to household spending, these funds are channeled largely through risk-protection mechanisms, particularly private insurance, and not as direct OOP payments (which represent only 13 percent of household spending on health in 2006/07) to providers. While company contributions to insurance have remained relatively stable over the years, the surge in insurance expenditures may be due to a number of reasons, including increasing costs of new medical technology, increased demand by consumers for health care particularly specialized services, over-prescription of services by providers if a patient is covered by health insurance, higher administration costs, and an aging population.
Donor financing of health care has been channeled largely through NGOs (although some flows through the MoHSS, which in 2006/07 received 14 percent of its funds from donors), whose spending has increased by 22-fold from 2001/02 levels. These entities play a significant role in health care organization and delivery and, given the increasingly pluralistic nature of Namibia’s health system, the Government has an important role to play in coordinating the various players that determine where health resources are used, so that all health stakeholders are working toward common national goals in a complementary manner, avoiding duplicative and parallel efforts.
Much donor funding was on public health programs, particularly on the prevention and management of communicable diseases like HIV/AIDS. While this is a welcome and needed development, care must be taken not to neglect other critical areas, such as MCH care, family planning, and NCDs, which have seen a considerable drop in financing over the five-year period studied – for example, in 2006/07, MCH and family planning expenditures were only 50 percent those of 2001/02.
Government’s contribution to health increased by 1.5-fold between 2001/02 and 2006/07. This represents a significant investment by the Government for health, averaging 12.2 percent of total government expenditures. This is just short of the Abuja declaration, which states that governments in Africa should spend 15 percent of their funds on health by the year 2015. Public funds in Namibia were

NAMIBIA NATIONAL HEALTH ACCOUNTS 2001/02-2006/07 36
spent on all major health functions and represent the largest source of financing for inpatient and outpatient care.
Based on the findings, their implications, and the experience of implementing NHA, the following recommendations are made:
1. Increase government stewardship and coordination of all entities (donors, NGOs, insurance schemes, etc.) involved in financing and management of health funds.
2. Monitor intrasectoral allocations (by all stakeholders) across health programs to ensure that spending is in accordance with national priorities.
3. Monitor household expenditures to assess their financing burden to maintain equitable access for all Namibians to health care.
In this regard, regular and routine household health and expenditure data is warranted.
4. Strengthen links with the private sector, particularly companies and insurance schemes. Encouraging companies to invest in their employees’ health care is a possible area of resource mobilization.
5. Work to improve resource tracking mechanisms of health, so that NHA becomes a routine government function and more directly linked to budgeting and planning processes.
Institutionalization of NHA will require routine resource tracking efforts, particularly for donors, NGOs, and households, whose investment is critical to monitor whether funds are being spent as intended (particularly along national goals) and to flag any inequities.

NAMIBIA NHA TABLES 37
ANNEX A: BIBLIOGRAPHY
Adams, T, Evans, D, and Murray, C. 2003. Econometric Estimates of country specific hospital costs. Cost Effectiveness and Resource Allocation Journal. Volume 1.
Central Bureau of Statistics and National Planning Commission. 2006. Population Projections 2001-2031.
Central Bureau of Statistics and National Planning Commission. Average Consumer Price Inflation Rate.
Ministry of Finance. 2008. Estimate of Revenue and Expenditures for the period 1 April 2001- 30. March 2008.
Ministry of Health and Social Services. 1998. Towards Achieving Health and Social Well Being for All Namibians: A Policy Framework.
Ministry of Health and Social Services. 2003. Namibia National Health Accounts Report.
Ministry of Health and Social Services. 2003. Namibia Demographic Health Survey 2000.
Ministry of Health and Social Services. 2004: The National Strategic Plan on HIV/AIDS. Third Medium Term Plan 2004-2009.
Ministry of Health and Social Services. 2007. Report of the 2006 National HIV Sentinel Survey.
Ministry of Health and Social Services. 2008. Namibia Demographic Health Survey 2006 (preliminary).
Ministry of Health and Social Services. Various years. Health Information System Report.
National Planning Commission. 2005. Consumer Price Index. www.npc.gov.na.
Organisation for Economic Co-operation and Development (OECD). 2000. A System of Health Accounts. Geneva: OECD.
Republic of Namibia: Namibia Vision 2030. 2004. Policy Framework for Long-term National Development.
Republic of Namibia. Medium Term Expenditure Framework for the period 2004/05-2006/07.
Republic of Namibia. Medium Term Expenditure Framework for the period 2006/07-2008/09.

NAMIBIA NATIONAL HEALTH ACCOUNTS 2001/02-2006/07 38
Republic of Namibia. Medium Term Expenditure Framework for the period 2007/08-2009/10.
World Health Organization, World Bank, and United States Agency for International Development. 2003. Guide to Producing National Health Accounts: with special applications for low- and middle-income countries. Geneva: WHO.
World Health Organization. 2000. World Health Report 2000 Health Systems: Improving Performance. Geneva: WHO. http://www.who.int/whr/2000/en/index.html

NAMIBIA NHA TABLES 39
ANNEX B: NHA TABLES 2001/02 – 2006/07
NAMIBIA NHA 2006/07 TABLES
• Financing Source X Financing Agent (FSxHF)
• Financing Agent X Provider (HF x HP)
• Financing Agent X Function (HF x HC)
• Provider X Function (HP x HC)
NAMIBIA NHA 2005/06 TABLES
• Financing Source X Financing Agent (FSxHF)
• Financing Agent X Provider (HF x HP)
• Financing Agent X Function (HF x HC)
• Provider X Function (HP x HC)
NAMIBIA NHA 2004/05 TABLES
• Financing Source X Financing Agent (FSxHF)
• Financing Agent X Provider (HF x HP)
• Financing Agent X Function (HF x HC)
• Provider X Function (HP x HC)
NAMIBIA NHA 2003/04 TABLES
• Financing Source X Financing Agent (FSxHF)
• Financing Agent X Provider (HF x HP)
• Financing Agent X Function (HF x HC)
• Provider X Function (HP x HC)

NAMIBIA NATIONAL HEALTH ACCOUNTS 2001/02-2006/07 40
NAMIBIA NHA 2002/03 TABLES
• Financing Source X Financing Agent (FSxHF)
• Financing Agent X Provider (HF x HP)
• Financing Agent X Function (HF x HC)
• Provider X Function (HP x HC)
NAMIBIA NHA 2001/02 TABLES
• Financing Source X Financing Agent (FSxHF)
• Financing Agent X Provider (HF x HP)
• Financing Agent X Function (HF x HC)
• Provider X Function (HP x HC)

NAMIBIA NHA TABLES 41
NAMIBIA NHA 2006/07 TABLES
Financing Source X Financing Agent (FSxHF)
FS.2 Private Funds FS.3 FS.nsk
FS.1.1.1 Central Gov Revenue
FS.2.1.1 Govt as Employer
FS.2.1.2 Other Employers
FS.2.2 Households
Rest of the World (Donors)
Not specified by any kind
HF as a % of THE
HF.1.1.1.1 Ministry of Health & Social Services 1,386,754,435 223,231,600 1,609,986,035 41%
HF.1.1.1.2 Ministry of Gender Equality and Child Welfare 12,000 1,208,394 1,220,394 0%
HF.1.1.1.3 Ministry of Regional Local Government and Housing and Rural Development 41,004 41,004 0%
HF.1.1.1.4 Ministry of Education 2,566,115 11,675,515 14,241,630 0%HF.1.1.1.5 Ministry of Defense 15,299,445 15,299,445 0%HF.1.1.1.6 Ministry of Safety and Security 809,321 809,321 0%HF.1.1.3 Municipal Government 0 0%HF.1.2 Social Security funds 24,603,715 24,603,715 49,207,430 1%
HF.2.1.1 Private social insurance (gov't employees) 282,507,728 282,507,728 565,015,456 15%
HF.2.1.2Private social insurance (private insurance covered by other employers - parastatal and private
316,767,930 359,394,161 676,162,091 17%
HF.2.2Private insurance enterprises (other than social insurance)-- (individual/supplemental insurance)
166,561,139 166,561,139 4%
HF.2.3. Household Out-of-Pocket 126,080,880 126,080,880 3%HF.2.4 Non profit institutions (NGOs) 627,177,126 627,177,126 16%HF.2.5 Employers (parastatal and private) 29,545,265 29,545,265 1%HF.3 Rest of World 8,492,919 8,492,919 0%HF.nsk Not specified by any kind 0 0%
Column Total (THE) 1,405,482,320 307,111,443 346,313,196 959,147,623 871,785,555 0 3,889,840,136
HF.4 Financing Agents spending on Health Related Items
8,561,565 1,065,314 9,626,879
Column Total (NHE) 1,414,043,885 307,111,443 346,313,196 959,147,623 872,850,869 0 3,899,467,015FS % of THE 36% 8% 9% 25% 22% 0%
Row Total
Financing Source (FS)FS.1 Public Funds
Code Financing Agent (HF)
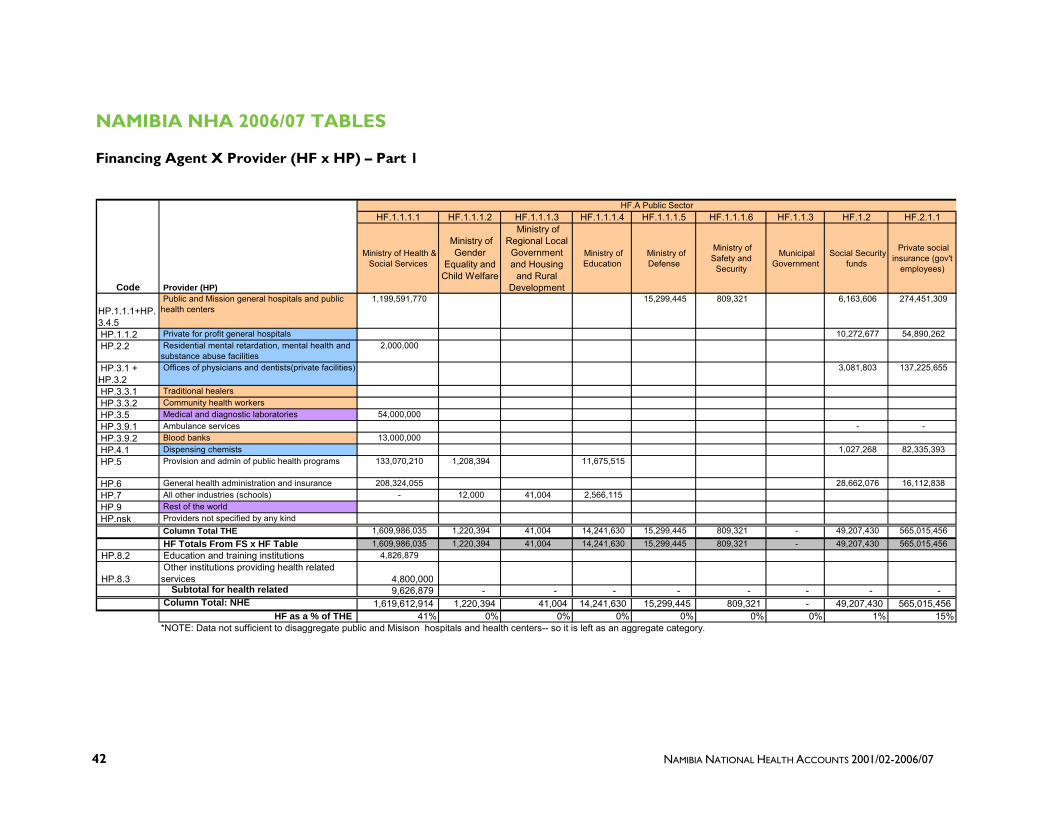
NAMIBIA NATIONAL HEALTH ACCOUNTS 2001/02-2006/07 42
NAMIBIA NHA 2006/07 TABLES
Financing Agent X Provider (HF x HP) – Part 1
HF.1.1.1.1 HF.1.1.1.2 HF.1.1.1.3 HF.1.1.1.4 HF.1.1.1.5 HF.1.1.1.6 HF.1.1.3 HF.1.2 HF.2.1.1
Ministry of Health & Social Services
Ministry of Gender
Equality and Child Welfare
Ministry of Regional Local Government and Housing
and Rural Development
Ministry of Education
Ministry of Defense
Ministry of Safety and
Security
Municipal Government
Social Security funds
Private social insurance (gov't
employees)
HP.1.1.1+HP.3.4.5
Public and Mission general hospitals and public health centers
1,199,591,770 15,299,445 809,321 6,163,606 274,451,309
HP.1.1.2 Private for profit general hospitals 10,272,677 54,890,262 HP.2.2 Residential mental retardation, mental health and
substance abuse facilities 2,000,000
HP.3.1 + HP.3.2
Offices of physicians and dentists(private facilities) 3,081,803 137,225,655
HP.3.3.1 Traditional healers HP.3.3.2 Community health workers HP.3.5 Medical and diagnostic laboratories 54,000,000 HP.3.9.1 Ambulance services - - HP.3.9.2 Blood banks 13,000,000 HP.4.1 Dispensing chemists 1,027,268 82,335,393 HP.5 Provision and admin of public health programs 133,070,210 1,208,394 11,675,515
HP.6 General health administration and insurance 208,324,055 28,662,076 16,112,838 HP.7 All other industries (schools) - 12,000 41,004 2,566,115 HP.9 Rest of the world HP.nsk Providers not specified by any kind
Column Total THE 1,609,986,035 1,220,394 41,004 14,241,630 15,299,445 809,321 - 49,207,430 565,015,456 HF Totals From FS x HF Table 1,609,986,035 1,220,394 41,004 14,241,630 15,299,445 809,321 - 49,207,430 565,015,456
HP.8.2 Education and training institutions 4,826,879
HP.8.3 Other institutions providing health related services 4,800,000 Subtotal for health related 9,626,879 - - - - - - - - Column Total: NHE 1,619,612,914 1,220,394 41,004 14,241,630 15,299,445 809,321 - 49,207,430 565,015,456
HF as a % of THE 41% 0% 0% 0% 0% 0% 0% 1% 15%*NOTE: Data not sufficient to disaggregate public and Misison hospitals and health centers-- so it is left as an aggregate category.
HF.A Public Sector
Code Provider (HP)

NAMIBIA NHA TABLES 43
Financing Agent X Provider (HF x HP) – Part 2
HF.3 ROW HF.nskHF.2.1.2 HF.2.2 HF.2.3. HF.2.4 HF.2.5 HF.3 HF.nsk
Private social insurance (private insurance covered by other
employers - parastatal and private
Private insurance enterprises (other
than social insurance)--
(individual/supplemental insurance)
Household Out-of-Pocket
Non profit institutions
(NGOs)
Employers (parastatal and private)
Rest of World
Not specified by any kind
Row Total
HP.1.1.1+HP.3.4.5
Public and Mission general hospitals and public health centers
27,976,759 201,277 30,464,036 1,792,550 123,596
1,556,873,670 40% HP.1.1.2 Private for profit general hospitals 212,327,747 42,222,317 290,679 61,798 320,065,481 8% HP.2.2 Residential mental retardation, mental health and
substance abuse facilities 2,000,000 0% HP.3.1 + HP.3.2
Offices of physicians and dentists(private facilities) 215,656,348 66,162,152 89,700,349 25,903,701 537,730,008 14%
HP.3.3.1 Traditional healers - 0% HP.3.3.2 Community health workers - 0% HP.3.5 Medical and diagnostic laboratories 1,431,808 55,431,808 1% HP.3.9.1 Ambulance services 458,238 16,194 474,431 0% HP.3.9.2 Blood banks 13,000,000 0% HP.4.1 Dispensing chemists 127,827,159 28,047,588 5,535,862 244,773,269 6% HP.5 Provision and admin of public health programs 454,581,456
6,939,733 607,475,308 16% HP.6 General health administration and insurance 91,915,840 29,911,611 169,371,313 1,553,186 545,850,919 14% HP.7 All other industries (schools) 2,619,119 0% HP.9 Rest of the world 49,344 49,344 0% HP.nsk Providers not specified by any kind 89,954 3,406,826 3,496,779 0%
Column Total THE 676,162,091 166,561,139 126,080,880 627,177,126 29,545,265 8,492,919 - 3,889,840,136 HF Totals From FS x HF Table 676,162,091 166,561,139 126,080,880 627,177,126 29,545,265 8,492,919 -
HP.8.2 Education and training institutions 4,826,879
HP.8.3 Other institutions providing health related services 4,800,000 Subtotal for health related - - - - - - - 9,626,879 Column Total: NHE 676,162,091 166,561,139 126,080,880 627,177,126 29,545,265 8,492,919 - 3,899,467,015
HF as a % of THE 17% 4% 3% 16% 1% 0% 0%
HF.B Non Public Sector
Code Provider (HP)
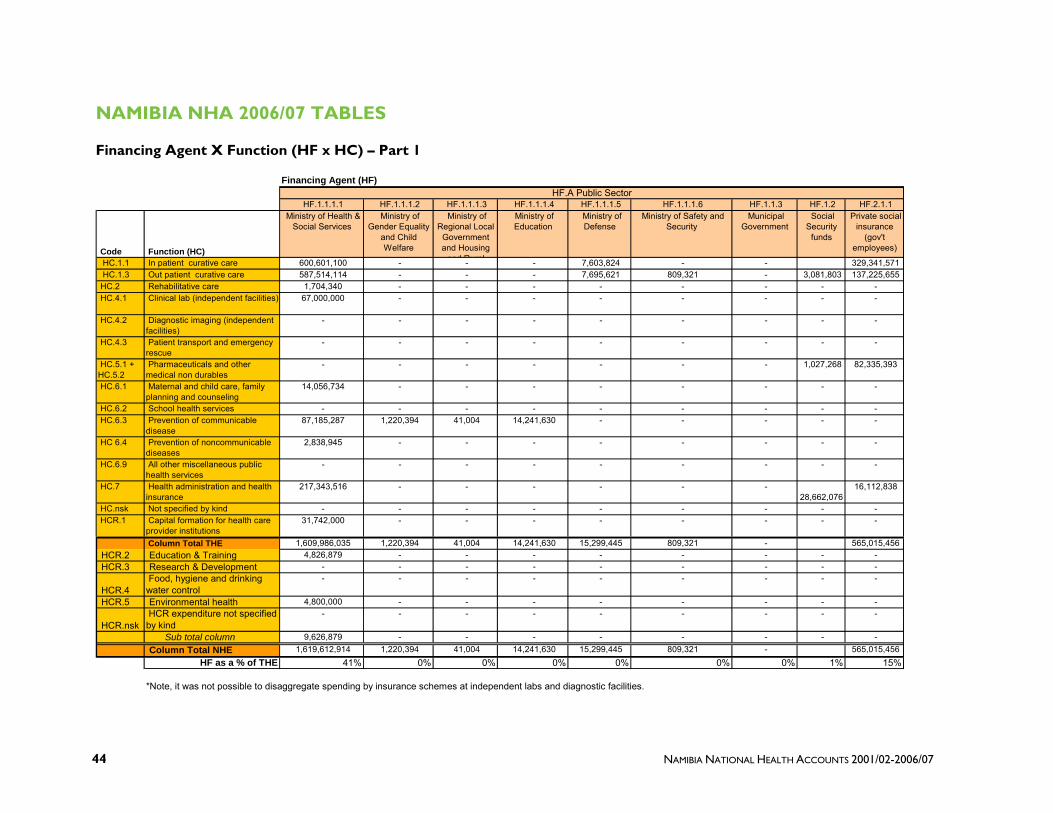
NAMIBIA NATIONAL HEALTH ACCOUNTS 2001/02-2006/07 44
NAMIBIA NHA 2006/07 TABLES
Financing Agent X Function (HF x HC) – Part 1
Financing Agent (HF)
HF.1.1.1.1 HF.1.1.1.2 HF.1.1.1.3 HF.1.1.1.4 HF.1.1.1.5 HF.1.1.1.6 HF.1.1.3 HF.1.2 HF.2.1.1
Code Function (HC)
Ministry of Health & Social Services
Ministry of Gender Equality
and Child Welfare
Ministry of Regional Local
Government and Housing
and Rural
Ministry of Education
Ministry of Defense
Ministry of Safety and Security
Municipal Government
Social Security
funds
Private social insurance
(gov't employees)
HC.1.1 In patient curative care 600,601,100 - - - 7,603,824 - - 329,341,571 HC.1.3 Out patient curative care 587,514,114 - - - 7,695,621 809,321 - 3,081,803 137,225,655 HC.2 Rehabilitative care 1,704,340 - - - - - - - - HC.4.1 Clinical lab (independent facilities) 67,000,000 - - - - - - - -
HC.4.2 Diagnostic imaging (independent facilities)
- - - - - - - - -
HC.4.3 Patient transport and emergency rescue
- - - - - - - - -
HC.5.1 + HC.5.2
Pharmaceuticals and other medical non durables
- - - - - - - 1,027,268 82,335,393
HC.6.1 Maternal and child care, family planning and counseling
14,056,734 - - - - - - - -
HC.6.2 School health services - - - - - - - - - HC.6.3 Prevention of communicable
disease 87,185,287 1,220,394 41,004 14,241,630 - - - - -
HC 6.4 Prevention of noncommunicable diseases
2,838,945 - - - - - - - -
HC.6.9 All other miscellaneous public health services
- - - - - - - - -
HC.7 Health administration and health insurance
217,343,516 - - - - - - 28,662,076
16,112,838
HC.nsk Not specified by kind - - - - - - - - - HCR.1 Capital formation for health care
provider institutions 31,742,000 - - - - - - - -
Column Total THE 1,609,986,035 1,220,394 41,004 14,241,630 15,299,445 809,321 - 565,015,456 HCR.2 Education & Training 4,826,879 - - - - - - - - HCR.3 Research & Development - - - - - - - - -
HCR.4 Food, hygiene and drinking water control
- - - - - - - - -
HCR.5 Environmental health 4,800,000 - - - - - - - -
HCR.nsk HCR expenditure not specified by kind
- - - - - - - - -
Sub total column 9,626,879 - - - - - - - - Column Total NHE 1,619,612,914 1,220,394 41,004 14,241,630 15,299,445 809,321 - 565,015,456
HF as a % of THE 41% 0% 0% 0% 0% 0% 0% 1% 15%
*Note, it was not possible to disaggregate spending by insurance schemes at independent labs and diagnostic facilities.
HF.A Public Sector

NAMIBIA NHA TABLES 45
Financing Agent X Function (HF x HC) – Part 2
HF.3 ROW HF.nsk HF.2.1.2 HF.2.2 HF.2.3. HF.2.4 HF.2.5 HF.3 HF.nsk
Code Function (HC)
Private social insurance (private insurance covered by other
employers - parastatal and private
Private insurance enterprises (other than
social insurance)-- (individual/supplementa
l insurance)
Household Out-of-Pocket
Non profit institutions
(NGOs)
Employers (parastatal and
private)
Rest of World Not specified by any kind
Row Total
HC as a % of THE
HC.1.1 In patient curative care 225,095,571 42,291,497 13,441,639 - 2,833,862 - - 1,237,645,348 31.8% HC.1.3 Out patient curative care 230,865,283 66,294,250 107,103,379 4,209,337 23,182,775 - - 1,167,981,537 30.0% HC.2 Rehabilitative care - - - 9,412,027 - - - 11,116,367 0.3% HC.4.1 Clinical lab (independent facilities) - - - 1,431,808 - - - 68,431,808
1.8% HC.4.2 Diagnostic imaging (independent
facilities) - - - - - - - -
0.0% HC.4.3 Patient transport and emergency
rescue 458,238 16,194 - - - - - 474,431
0.0% HC.5.1 + HC.5.2
Pharmaceuticals and other medical non durables
127,827,159 28,047,588 5,535,862 - - - - 244,773,269 6.3%
HC.6.1 Maternal and child care, family planning and counseling
- - - 1,247,058 - - - 15,303,792 0.4%
HC.6.2 School health services - - - - - - - - 0.0% HC.6.3 Prevention of communicable
disease - - - 441,505,584 - - - 544,193,899
14.0% HC 6.4 Prevention of noncommunicable
diseases - - - - - - - 2,838,945
0.1% HC.6.9 All other miscellaneous public
health services - - - - - - - -
0.0% HC.7 Health administration and health
insurance 91,915,840 29,911,611 - 169,371,313 - 8,492,919 - 561,810,113
14.4% HC.nsk Not specified by kind - - - - 3,406,826 - - 3,406,826 0.1% HCR.1 Capital formation for health care
provider institutions - - - - 121,802 - - 31,863,802
0.8% Column Total THE 676,162,091 166,561,139 126,080,880 627,177,126 29,545,265 8,492,919 - 3,889,840,136
HCR.2 Education & Training - - - - - - - 4,826,879 HCR.3 Research & Development - - - - - - - -
HCR.4 Food, hygiene and drinking water control
- - - - - - - -
HCR.5 Environmental health - - - - - - - 4,800,000
HCR.nsk HCR expenditure not specified by kind
- - - - - - - -
Sub total column - - - - - - - 9,626,879 Column Total NHE 676,162,091 166,561,139 126,080,880 627,177,126 29,545,265 8,492,919 - 3,899,467,015
HF as a % of THE 17% 4% 3% 16% 1% 0% 0%
HF.B Non Public Sector

NAMIBIA NATIONAL HEALTH ACCOUNTS 2001/02-2006/07 46
NAMIBIA NHA 2006/07 TABLES
Provider X Function (HP x HC) – Part 1
HP.1.1.1+HP.3.4.5 HP.1.1.2 HP.2.2 HP.3.1 + HP.3.2 HP.3.3.1 HP.3.3.2 HP.3.5 HP.3.9.1 HP.3.9.2 HP.4.1
Code Function (HC)
Public and Mission general hospitals and public health centers
Private for profit general
hospitals
Residential mental retardation, mental
health and substance abuse facilities
Offices of physicians and dentists(private
facilities)
Traditional healers
Community health workers
Medical and diagnostic
laboratories
Ambulance services
Blood banks
Dispensing chemists
HC.1.1 In patient curative care 928,220,765 305,388,740 500,000 3,401,180 - - - - - - HC.1.3 Out patient curative care 608,402,905 14,676,741 1,500,000 534,207,026 - - - - - - HC.2 Rehabilitative care - - - - - - - - - - HC.4.1 Clinical lab (independent
facilities) - - - - - - 55,431,808 -
13,000,000 -
HC.4.2 Diagnostic imaging (independent facilities)
- - - - - - - - - -
HC.4.3 Patient transport and emergency rescue
- - - - - - - 474,431 - -
HC.5.1 + HC.5.2 Pharmaceuticals and other medical non durables
- - - - - - - - - 244,773,269
HC.6.1 Maternal and child care, family planning and counseling
- - - - - - - - - -
HC.6.2 School health services - - - - - - - - - - HC.6.3 Prevention of communicable
disease - - - - - - - - - -
HC 6.4 Prevention of noncommunicable diseases
- - - - - - - - - -
HC.6.9 All other miscellaneous public health services
- - - - - - - - - -
HC.7 Health administration and health insurance
- - - - - - - - - -
HC.nsk Not specified by kind - - - - - - - - - - HCR.1 Capital formation for health
care provider institutions 20,250,000 - - 121,802 - - - - - -
Column Total-THE 1,556,873,670 320,065,481 2,000,000 537,730,008 - - 55,431,808 474,431 244,773,269 HCR.2 Education & TrainingHCR.3 Research & Development
HCR.4 Food, hygiene and drinking water control
HCR.5 Environmental health
HCR.nsk HCR expenditure not specified by kind Column Total-NHE HP as a % of THE 40.0% 8.2% 0.1% 13.8% 0.0% 0.0% 1.4% 0.0% 6.3%*NOTE: Data not sufficient to disaggregate public and Misison hospitals and health centers-- so it is left as an aggregate category.
Provider (HP)

NAMIBIA NHA TABLES 47
Provider X Function (HP x HC) – Part 2
HP.5 HP.6 HP.7 HP.9 HP.nsk HP.8.2 HP.8.3
Code Function (HC)
Provision and admin of public health
programs
General health administration and insurance
All other industries (schools)
Rest of the world
Providers not
specified by any kind
THE Row Total Education and
training institutions
Other institutions providing
health related services
NHE Row Total HC as a % of THE
HC.1.1 In patient curative care - - - 49,344 85,320 1,237,645,348 31.8% HC.1.3 Out patient curative care 9,190,231 - - - 4,634 1,167,981,537 30.0% HC.2 Rehabilitative care - - - - 11,116,367 0.3% HC.4.1 Clinical lab (independent
facilities) - - - - - 68,431,808
1.8% HC.4.2 Diagnostic imaging
(independent facilities) - - - - - -
0.0% HC.4.3 Patient transport and
emergency rescue - - - - - 474,431
0.0% HC.5.1 + HC.5.2 Pharmaceuticals and other
medical non durables - - - - - 244,773,269
6.3% HC.6.1 Maternal and child care, family
planning and counseling
15,303,792 - - - - 15,303,792
0.4% HC.6.2 School health services - - - - - - 0.0% HC.6.3 Prevention of communicable
disease
541,574,78 - 2,619,119 - - 544,193,899
14.0% HC 6.4 Prevention of
noncommunicable diseases 2,838,945 - - - - 2,838,945
0.1% HC.6.9 All other miscellaneous public
health services - - - - - -
0.0% HC.7 Health administration and
health insurance
17,959,194 543,850,919 - - - 561,810,113
14.4% HC.nsk Not specified by kind - - - - 3,406,826 3,406,826 0.1% HCR.1 Capital formation for health
care provider institutions 9,492,000 2,000,000 - - - 31,863,802
0.8% Column Total-THE 545,850,919 2,619,119 49,344 3,496,779 3,889,840,136 100.0%
HCR.2 Education & Training 4,826,879 0 4,826,879 HCR.3 Research & Development 0 0 -
HCR.4 Food, hygiene and drinking water control 0 0
-
HCR.5 Environmental health 0 4,800,000 4,800,000
HCR.nsk HCR expenditure not specified by kind 0 0
-
Column Total-NHE 4,826,879 4,800,000 3,899,467,015 HP as a % of THE 15.6% 14.0% 0.1% 0.0% 0.1%

NAMIBIA NATIONAL HEALTH ACCOUNTS 2001/02-2006/07 48
NAMIBIA NHA 2005/06 TABLES
Financing Source X Financing Agent (FSxHF)
FS.2 Private Funds FS.3 FS.nsk
FS.1.1.1 Central Gov Revenue
FS.2.1.1 Govt as Employer
FS.2.1.2 Other Employers
FS.2.2 Households
Rest of the World (Donors)
Not specified by any kind
HF as a % of THE
HF.1.1.1.1 Ministry of Health & Social Services 1,330,246,083 212,097,018 1,542,343,101 46%
HF.1.1.1.2 Ministry of Gender Equality and Child Welfare 10,500 2,360,772 2,371,272 0%
HF.1.1.1.3 Ministry of Regional Local Government and Housing and Rural Development 0 0%
HF.1.1.1.4 Ministry of Education 40,333,144 40,333,144 1%HF.1.1.1.5 Ministry of Defense 11,213,665 11,213,665 0%HF.1.1.1.6 Ministry of Safety and Security 677,425 677,425 0%HF.1.1.3 Municipal Government 0 0%HF.1.2 Social Security funds 28,021,888 28,021,888 56,043,776 2%
HF.2.1.1 Private social insurance (gov't employees) 257,686,510 257,686,510 515,373,020 15%
HF.2.1.2Private social insurance (private insurance covered by other employers - parastatal and private
291,308,563 291,812,694 583,121,257 17%
HF.2.2Private insurance enterprises (other than social insurance)-- (individual/supplemental insurance)
159,966,303 159,966,303 5%
HF.2.3. Household Out-of-Pocket 125,711,692 125,711,692 4%HF.2.4 Non profit institutions (NGOs) 310,367,066 310,367,066 9%HF.2.5 Employers (parastatal and private) 25,893,011 25,893,011 1%HF.3 Rest of World 6,185,433 6,185,433 0%HF.nsk Not specified by any kind 0 0%
Column Total (THE) 1,342,147,673 285,708,398 317,201,574 863,199,088 571,343,431 0 3,379,600,164
HF.4 Financing Agents spending on Health Related Items
4,611,952 5,173,248 9,785,200
Column Total (NHE) 1,346,759,625 285,708,398 317,201,574 863,199,088 576,516,680 0 3,389,385,364FS % of THE 40% 8% 9% 26% 17% 0%
Row Total
Financing Source (FS)FS.1 Public Funds
Code Financing Agent (HF)

NAMIBIA NHA TABLES 49
NAMIBIA NHA 2005/06 TABLES
Financing Agent X Provider (HF x HP) – Part 1
Financing Agent (HF)
HF.1.1.1.1 HF.1.1.1.2 HF.1.1.1.3 HF.1.1.1.4 HF.1.1.1.5 HF.1.1.1.6 HF.1.1.3 HF.1.2 HF.2.1.1
Ministry of Health & Social Services
Ministry of Gender
Equality and Child Welfare
Ministry of Regional Local Government and Housing
and Rural Development
Ministry of Education
Ministry of Defense
Ministry of Safety and
Security
Municipal Government
Social Security funds
Private social insurance (gov't
employees)
HP.1.1.1+HP.3.4.5
Public and Mission general hospitals and public health centers
1,235,793,285 11,213,665 677,425 5,263,838 249,630,091
HP.1.1.2 Private for profit general hospitals 4,386,532 49,926,018 HP.2.2 Residential mental retardation, mental health and
substance abuse facilities 1,900,000
HP.3.1 + HP.3.2
Offices of physicians and dentists(private facilities) 7,018,451 124,815,046
HP.3.3.1 Traditional healers HP.3.3.2 Community health workers HP.3.5 Medical and diagnostic laboratories 51,801,160 HP.3.9.1 Ambulance services HP.3.9.2 Blood banks 12,400,927 HP.4.1 Dispensing chemists 877,306 74,889,027 HP.5 Provision and admin of public health programs 63,144,692 2,360,772 40,333,144
HP.6 General health administration and insurance 177,303,037 38,497,650 16,112,838 HP.7 All other industries (schools) 10,500 HP.9 Rest of the world HP.nsk Providers not specified by any kind
Column Total THE 1,542,343,101 2,371,272 - 40,333,144 11,213,665 677,425 - 56,043,776 515,373,020 HF Totals From FS x HF Table 1,542,343,101 2,371,272 - 40,333,144 11,213,665 677,425 - 56,043,776 515,373,020
HP.8.2 Education and training institutions 1,067,665
HP.8.3 Other institutions providing health related services 3,544,287 Subtotal for health related 4,611,952 - - - - - - - - Column Total: NHE 1,546,955,053 2,371,272 - 40,333,144 11,213,665 677,425 - 56,043,776 515,373,020
HF as a % of THE 46% 0% 0% 1% 0% 0% 0% 2% 15%*NOTE: Data not sufficient to disaggregate public and Misison hospitals and health centers-- so it is left as an aggregate category.
HF.A Public Sector
Code Provider (HP)

NAMIBIA NATIONAL HEALTH ACCOUNTS 2001/02-2006/07 50
Financing Agent X Provider (HF x HP) – Part 2
HF.3 ROW HF.nskHF.2.1.2 HF.2.2 HF.2.3. HF.2.4 HF.2.5 HF.3 HF.nsk
Private social insurance (private insurance covered by other
employers - parastatal and private
Private insurance enterprises (other
than social insurance)--
(individual/supplemental insurance)
Household Out-of-Pocket
Non profit institutions
(NGOs)
Employers (parastatal
and private)
Rest of World
Not specified by any kind
Row Total
HP.1.1.1+HP.3.4.5
Public and Mission general hospitals and public health centers
18,303,513 249,901 30,374,832
1,551,506,550 46% HP.1.1.2 Private for profit general hospitals 181,265,044 42,018,536 289,828 217,069 278,103,026 8% HP.2.2 Residential mental retardation, mental health and
substance abuse facilities 1,900,000 0% HP.3.1 + HP.3.2
Offices of physicians and dentists(private facilities) 198,523,844 60,579,222 89,437,690 22,550,343 502,924,596 15%
HP.3.3.1 Traditional healers - 0% HP.3.3.2 Community health workers - 0% HP.3.5 Medical and diagnostic laboratories 9,758,801 61,559,961 2% HP.3.9.1 Ambulance services 3,066,340 1,261,506 4,327,846 0% HP.3.9.2 Blood banks 12,400,927 0% HP.4.1 Dispensing chemists 109,277,752 32,463,380 5,519,652 223,027,117 7% HP.5 Provision and admin of public health programs 277,161,300
6,084,425 389,084,332 12% HP.6 General health administration and insurance 72,684,765 23,393,758 23,446,965 101,008 351,540,020 10% HP.7 All other industries (schools) 10,500 0% HP.9 Rest of the world - 0% HP.nsk Providers not specified by any kind 89,690 3,125,599 3,215,289 0%
Column Total THE 583,121,257 159,966,303 125,711,692 310,367,066 25,893,011 6,185,433 - 3,379,600,164 HF Totals From FS x HF Table 583,121,257 159,966,303 125,711,692 310,367,066 25,893,011 6,185,433 -
HP.8.2 Education and training institutions 1,067,665
HP.8.3 Other institutions providing health related services
5,173,248 8,717,535
Subtotal for health related - - - 5,173,248 - - - 9,785,200 Column Total: NHE 583,121,257 159,966,303 125,711,692 315,540,314 25,893,011 6,185,433 - 3,389,385,364
HF as a % of THE 17% 5% 4% 9% 1% 0% 0%
HF.B Non Public Sector
Code Provider (HP)

NAMIBIA NHA TABLES 51
NAMIBIA NHA 2005/06 TABLES
Financing Agent X Function (HF x HC) – Part 1
Financing Agent (HF)
HF.1.1.1.1 HF.1.1.1.2 HF.1.1.1.3 HF.1.1.1.4 HF.1.1.1.5 HF.1.1.1.6 HF.1.1.3 HF.1.2 HF.2.1.1
Code Function (HC)
Ministry of Health & Social Services
Ministry of Gender Equality
and Child Welfare
Ministry of Regional Local
Government and Housing and Rural
Development
Ministry of Education
Ministry of Defense
Ministry of Safety and Security
Municipal Government
Social Security
funds
Private social insurance
(gov't employees)
HC.1.1 In patient curative care 522,232,364 - - - 5,573,192 - - 299,556,109 HC.1.3 Out patient curative care 595,705,704 - - - 5,640,473 677,425 - 2,631,919 124,815,046 HC.2 Rehabilitative care 5,455,378 - - - - - - - - HC.4.1 Clinical lab (independent facilities) 64,202,087 - - - - - - - -
HC.4.2 Diagnostic imaging (independent facilities)
- - - - - - - - -
HC.4.3 Patient transport and emergency rescue
- - - - - - - - -
HC.5.1 + HC.5.2
Pharmaceuticals and other medical non durables
- - - - - - - 877,306 74,889,027
HC.6.1 Maternal and child care, family planning and counseling
14,660,031 - - - - - - - -
HC.6.2 School health services - - - - - - - - - HC.6.3 Prevention of communicable
disease 35,080,691 2,371,272 - 40,333,144 - - - - -
HC 6.4 Prevention of noncommunicable diseases
1,910,528 - - - - - - - -
HC.6.9 All other miscellaneous public health services
- - - - - - - - -
HC.7 Health administration and health insurance
221,136,638 - - - - - - 38,497,650
16,112,838
HC.nsk Not specified by kind - - - - - - - - - HCR.1 Capital formation for health care
provider institutions 81,959,680 - - - - - - - -
Column Total THE 1,542,343,101 2,371,272 - 40,333,144 11,213,665 677,425 - 515,373,020 HCR.2 Education & Training 1,067,665 - - - - - - - - HCR.3 Research & Development - - - - - - - - -
HCR.4 Food, hygiene and drinking water control
- - - - - - - - -
HCR.5 Environmental health - - - - - - - - -
HCR.nsk HCR expenditure not specified by kind
3,544,287 - - - - - - - -
Sub total column 4,611,952 - - - - - - - - Column Total NHE 1,546,955,053 2,371,272 - 40,333,144 11,213,665 677,425 - 515,373,020
HF as a % of THE 46% 0% 0% 1% 0% 0% 0% 2% 15%
*Note, it was not possible to disaggregate spending by insurance schemes at independent labs and diagnostic facilities.
HF.A Public Sector

NAMIBIA NATIONAL HEALTH ACCOUNTS 2001/02-2006/07 52
Financing Agent X Function (HF x HC ) Part 2
HF.3 ROW HF.nsk HF.2.1.2 HF.2.2 HF.2.3. HF.2.4 HF.2.5 HF.3 HF.nsk
Code Function (HC)
Private social insurance (private insurance covered by other
employers - parastatal and private
Private insurance enterprises (other than
social insurance)-- (individual/supplementa
l insurance)
Household Out-of-Pocket
Non profit institutions
(NGOs)
Employers (parastatal and
private)
Rest of World Not specified by any kind
Row Total
HC as a % of THE
HC.1.1 In patient curative care 184,617,383 42,152,433 13,402,280 - 3,918,472 - - 1,085,489,133 32.1% HC.1.3 Out patient curative care 213,475,018 60,695,227 106,789,761 3,521,128 7,599,394 - - 1,121,551,093 33.2% HC.2 Rehabilitative care - - - 30,520,923 - - - 35,976,301 1.1% HC.4.1 Clinical lab (independent facilities) - - - 9,758,801 - - - 73,960,888
2.2% HC.4.2 Diagnostic imaging (independent
facilities) - - - - - - - -
0.0% HC.4.3 Patient transport and emergency
rescue 3,066,340 1,261,506 - - - - - 4,327,846
0.1% HC.5.1 + HC.5.2
Pharmaceuticals and other medical non durables
109,277,752 32,463,380 5,519,652 - 11,059,467 - - 234,086,584 6.9%
HC.6.1 Maternal and child care, family planning and counseling
- - - 4,862,713 - - - 19,522,744 0.6%
HC.6.2 School health services - - - - - - - - 0.0% HC.6.3 Prevention of communicable
disease - - - 238,256,536 - - - 316,041,642
9.4% HC 6.4 Prevention of noncommunicable
diseases - - - - - - - 1,910,528
0.1% HC.6.9 All other miscellaneous public
health services - - - - - - - -
0.0% HC.7 Health administration and health
insurance 72,684,765 23,393,758 - 23,446,965 - 6,185,433 - 401,458,047
11.9% HC.nsk Not specified by kind - - - - 3,125,599 - - 3,125,599 0.1% HCR.1 Capital formation for health care
provider institutions - - - - 190,080 - - 82,149,760
2.4% Column Total THE 583,121,257 159,966,303 125,711,692 310,367,066 25,893,011 6,185,433 - 3,379,600,164
HCR.2 Education & Training - - - 5,173,248 - - - 6,240,913 HCR.3 Research & Development - - - - - - - -
HCR.4 Food, hygiene and drinking water control
- - - - - - - -
HCR.5 Environmental health - - - - - - - -
HCR.nsk HCR expenditure not specified by kind
- - - - - - - 3,544,287
Sub total column - - - 5,173,248 - - - 6,240,913 Column Total NHE 583,121,257 159,966,303 125,711,692 315,540,314 25,893,011 6,185,433 - 3,389,385,364
HF as a % of THE 17% 5% 4% 9% 1% 0% 0% 100%
HF.B Non Public Sector

NAMIBIA NHA TABLES 53
NAMIBIA NHA 2005/06 TABLES
Provider X Function (HP x HC) – Part 1
HP.1.1.1+HP.3.4.5 HP.1.1.2 HP.2.2 HP.3.1 + HP.3.2 HP.3.3.1 HP.3.3.2 HP.3.5 HP.3.9.1 HP.3.9.2 HP.4.1
Code Function (HC)
Public and Mission general hospitals and public health centers
Private for profit general
hospitals
Residential mental retardation, mental
health and substance abuse facilities
Offices of physicians and dentists(private
facilities)
Traditional healers
Community health workers
Medical and diagnostic
laboratories
Ambulance services Blood banks Dispensing
chemists
HC.1.1 In patient curative care 812,443,345 264,397,784 475,000 8,087,934 - - - - - - HC.1.3 Out patient curative care 611,719,574 13,705,242 1,425,000 483,587,115 - - - - - - HC.2 Rehabilitative care 5,455,378 - - - - - - - - - HC.4.1 Clinical lab (independent
facilities) - - - - - - 61,559,961 - 12,400,927 -
HC.4.2 Diagnostic imaging (independent facilities)
- - - - - - - - - -
HC.4.3 Patient transport and emergency rescue
- - - - - - - 4,327,846 - -
HC.5.1 + HC.5.2 Pharmaceuticals and other medical non durables
- - - 11,059,467 - - - - - 223,027,117
HC.6.1 Maternal and child care, family planning and counseling
1,497,155 - - - - - - - - -
HC.6.2 School health services - - - - - - - - - - HC.6.3 Prevention of communicable
disease - - - - - - - - - -
HC 6.4 Prevention of noncommunicable diseases
- - - - - - - - - -
HC.6.9 All other miscellaneous public health services
- - - - - - - - - -
HC.7 Health administration and health insurance
48,841,724 - - - - - - - - -
HC.nsk Not specified by kind - - - - - - - - - - HCR.1 Capital formation for health
care provider institutions 71,549,374 - - 190,080 - - - - - -
Column Total-THE 1,551,506,550 278,103,026 1,900,000 502,924,596 - - 61,559,961 4,327,846 12,400,927 223,027,117 HCR.2 Education & TrainingHCR.3 Research & Development
HCR.4 Food, hygiene and drinking water control
HCR.5 Environmental health
HCR.nsk HCR expenditure not specified by kind Column Total-NHE HP as a % of THE 45.9% 8.2% 0.1% 14.9% 0.0% 0.0% 1.8% 0.1% 0.4% 6.6%*NOTE: Data not sufficient to disaggregate public and Misison hospitals and health centers-- so it is left as an aggregate category.
Provider (HP)

NAMIBIA NATIONAL HEALTH ACCOUNTS 2001/02-2006/07 54
Provider X Function (HP x HC) – Part 2
HP.5 HP.6 HP.7 HP.9 HP.nsk HP.8.2 HP.8.3
Code Function (HC)
Provision and admin of
public health programs
General health administration and insurance
All other industries (schools)
Rest of the world
Providers not
specified by any kind
THE Row Total Education and
training institutions
Other institutions
providing health related services
NHE Row Total HC as a % of THE
HC.1.1 In patient curative care - - - - 85,070 1,085,489,133 32.1% HC.1.3 Out patient curative care 11,109,542 - - - 4,620 1,121,551,093 33.2% HC.2 Rehabilitative care 30,520,923 - - - - 35,976,301 1.1% HC.4.1 Clinical lab (independent
facilities) - - - - - 73,960,888
2.2% HC.4.2 Diagnostic imaging
(independent facilities) - - - - - -
0.0% HC.4.3 Patient transport and
emergency rescue - - - - - 4,327,846
0.1% HC.5.1 + HC.5.2 Pharmaceuticals and other
medical non durables - - - - - 234,086,584
6.9% HC.6.1 Maternal and child care, family
planning and counseling 18,025,588 - - - - 19,522,744
0.6% HC.6.2 School health services - - - - - - 0.0% HC.6.3 Prevention of communicable
disease 316,031,142 - 10,500 - - 316,041,642
9.4% HC 6.4 Prevention of
noncommunicable diseases 1,910,528 - - - - 1,910,528
0.1% HC.6.9 All other miscellaneous public
health services - - - - - -
0.0% HC.7 Health administration and
health insurance 6,084,425 346,531,897 - - - 401,458,047
11.9% HC.nsk Not specified by kind - - - - 3,125,599 3,125,599 0.1% HCR.1 Capital formation for health
care provider institutions 5,402,183 5,008,123 - - - 82,149,760
2.4% Column Total-THE 389,084,332 351,540,020 10,500 - 3,215,289 3,379,600,164
HCR.2 Education & Training 1,067,665 5,173,248 6,240,913 HCR.3 Research & Development 0 0 -
HCR.4 Food, hygiene and drinking water control 0 0
-
HCR.5 Environmental health 0 0 -
HCR.nsk HCR expenditure not specified by kind 0 3,544,287
3,544,287
Column Total-NHE 1,067,665 8,717,535 3,389,385,364 HP as a % of THE 11.5% 10.4% 0.0% 0.0% 0.1%

NAMIBIA NHA TABLES 55
NAMIBIA NHA 2004/05 TABLES
Financing Source X Financing Agent (FSxHF)
FS.2 Private Funds FS.3 FS.nsk
FS.1.1.1 Central Gov Revenue
FS.2.1.1 Govt as Employer
FS.2.1.2 Other Employers
FS.2.2 Households
Rest of the World (Donors)
Not specified by any kind
HF as a % of THE
HF.1.1.1.1 Ministry of Health & Social Services 1,281,181,385 34,232,789 1,315,414,174 48%
HF.1.1.1.2 Ministry of Gender Equality and Child Welfare 10,000 10,000 0%
HF.1.1.1.3 Ministry of Regional Local Government and Housing and Rural Development 0 0%
HF.1.1.1.4 Ministry of Education 0 0%HF.1.1.1.5 Ministry of Defense 7,857,282 7,857,282 0%HF.1.1.1.6 Ministry of Safety and Security 490,908 490,908 0%HF.1.1.3 Municipal Government 0 0%HF.1.2 Social Security funds 22,461,205 22,461,205 44,922,409 2%
HF.2.1.1 Private social insurance (gov't employees) 261,385,445 261,385,445 522,770,889 19%
HF.2.1.2Private social insurance (private insurance covered by other employers - parastatal and private
273,560,897 112,142,169 385,703,066 14%
HF.2.2Private insurance enterprises (other than social insurance)-- (individual/supplemental insurance)
120,535,179 120,535,179 4%
HF.2.3. Household Out-of-Pocket 103,513,117 103,513,117 4%HF.2.4 Non profit institutions (NGOs) 223,239,112 223,239,112 8%HF.2.5 Employers (parastatal and private) 28,228,201 28,228,201 1%HF.3 Rest of World 9,431,978 9,431,978 0%HF.nsk Not specified by any kind 0 0%
Column Total (THE) 1,289,539,575 283,846,649 301,789,098 620,037,114 266,903,879 0 2,762,116,315
HF.4 Financing Agents spending on Health Related Items
477,837,329 477,837,329
Column Total (NHE) 1,767,376,904 283,846,649 301,789,098 620,037,114 266,903,879 0 3,239,953,644FS % of THE 47% 10% 11% 22% 10% 0%
Row Total
Financing Source (FS)FS.1 Public Funds
Code Financing Agent (HF)

NAMIBIA NATIONAL HEALTH ACCOUNTS 2001/02-2006/07 56
NAMIBIA NHA 2004/05 TABLES
Financing Agent X Provider (HF x HP) – Part 1
Financing Agent (HF)
HF.1.1.1.1 HF.1.1.1.2 HF.1.1.1.3 HF.1.1.1.4 HF.1.1.1.5 HF.1.1.1.6 HF.1.1.3 HF.1.2 HF.2.1.1
Ministry of Health & Social Services
Ministry of Gender
Equality and Child Welfare
Ministry of Regional Local Government and Housing
and Rural Development
Ministry of Education
Ministry of Defense
Ministry of Safety and
Security
Municipal Government
Social Security funds
Private social insurance (gov't
employees)
HP.1.1.1+HP.3.4.5
Public and Mission general hospitals and public health centers
1,017,178,678 7,857,282 490,908 4,730,523 253,329,026
HP.1.1.2 Private for profit general hospitals 3,942,103 50,665,805 HP.2.2 Residential mental retardation, mental health and
substance abuse facilities HP.3.1 + HP.3.2
Offices of physicians and dentists(private facilities) 6,307,364 126,664,513
HP.3.3.1 Traditional healers HP.3.3.2 Community health workers HP.3.5 Medical and diagnostic laboratories 47,524,000 HP.3.9.1 Ambulance services HP.3.9.2 Blood banks 10,248,700 HP.4.1 Dispensing chemists 788,421 75,998,708 HP.5 Provision and admin of public health programs 46,502,417
HP.6 General health administration and insurance 193,960,380 29,153,999 16,112,838 HP.7 All other industries (schools) 10,000 HP.9 Rest of the world HP.nsk Providers not specified by any kind - Column Total THE 1,315,414,174 10,000 - - 7,857,282 490,908 - 44,922,409 522,770,889
HF Totals From FS x HF Table 1,315,414,174 10,000 - - 7,857,282 490,908 - 44,922,409 522,770,889 HP.8.2 Education and training institutions 1,344,329
HP.8.3 Other institutions providing health related services 476,493,000 Subtotal for health related 477,837,329 - - - - - - - - Column Total: NHE 1,793,251,503 10,000 - - 7,857,282 490,908 - 44,922,409 522,770,889
HF as a % of THE 48% 0% 0% 0% 0% 0% 0% 2% 19%*NOTE: Data not sufficient to disaggregate public and Misison hospitals and health centers-- so it is left as an aggregate category.
HF.A Public Sector
Code Provider (HP)

NAMIBIA NHA TABLES 57
Financing Agent X Provider (HF x HP) – Part 2
HF.3 ROW HF.nskHF.2.1.2 HF.2.2 HF.2.3. HF.2.4 HF.2.5 HF.3 HF.nsk
Private social insurance (private insurance covered by other
employers - parastatal and private
Private insurance enterprises (other
than social insurance)--
(individual/supplemental insurance)
Household Out-of-Pocket
Non profit institutions
(NGOs)
Employers (parastatal and
private)
Rest of World
Not specified by
any kind Row Total
HP.1.1.1+HP.3.4.5
Public and Mission general hospitals and public health centers
15,873,120 322,159 25,010,562 6,228,287
1,331,020,545 48% HP.1.1.2 Private for profit general hospitals 118,511,558 28,316,905 238,632 115,462 201,790,465 7% HP.2.2 Residential mental retardation, mental health and
substance abuse facilities - 0% HP.3.1 + HP.3.2
Offices of physicians and dentists(private facilities) 125,140,780 46,934,527 73,645,425 24,857,105 403,549,714 15%
HP.3.3.1 Traditional healers - 0% HP.3.3.2 Community health workers - 0% HP.3.5 Medical and diagnostic laboratories 18,780,806 66,304,806 2% HP.3.9.1 Ambulance services 1,681,506 461,110 2,142,616 0% HP.3.9.2 Blood banks 10,248,700 0% HP.4.1 Dispensing chemists 88,457,101 29,781,838 4,544,650 199,570,717 7% HP.5 Provision and admin of public health programs 178,373,501
8,824,866 233,700,784 8% HP.6 General health administration and insurance 36,039,001 14,718,640 19,856,517 607,112 310,448,488 11% HP.7 All other industries (schools) 10,000 0% HP.9 Rest of the world - 0% HP.nsk Providers not specified by any kind 73,848 3,255,634 3,329,481 0% - Column Total THE 385,703,066 120,535,179 103,513,117 223,239,112 28,228,201 9,431,978 - 2,762,116,315
HF Totals From FS x HF Table 385,703,066 120,535,179 103,513,117 223,239,112 28,228,201 9,431,978 - HP.8.2 Education and training institutions 1,344,329
HP.8.3 Other institutions providing health related services 476,493,000 Subtotal for health related - - - - - - - 477,837,329 Column Total: NHE 385,703,066 120,535,179 103,513,117 223,239,112 28,228,201 9,431,978 - 3,239,953,644
HF as a % of THE 14% 4% 4% 8% 1% 0% 0%
HF.B Non Public Sector
Code Provider (HP)

NAMIBIA NATIONAL HEALTH ACCOUNTS 2001/02-2006/07 58
NAMIBIA NHA 2004/05 TABLES
Financing Agent X Function (HF x HC) – Part 1
Financing Agent (HF)
HF.1.1.1.1 HF.1.1.1.2 HF.1.1.1.3 HF.1.1.1.4 HF.1.1.1.5 HF.1.1.1.6 HF.1.1.3 HF.1.2 HF.2.1.1
Code Function (HC)
Ministry of Health & Social Services
Ministry of Gender Equality
and Child Welfare
Ministry of Regional Local
Government and Housing
and Rural
Ministry of Education
Ministry of Defense
Ministry of Safety and Security
Municipal Government
Social Security
funds
Private social insurance
(gov't employees)
HC.1.1 In patient curative care 482,702,260 - - - 3,905,069 - - 303,994,831 HC.1.3 Out patient curative care 477,420,972 - - - 3,952,213 490,908 - 2,365,262 126,664,513 HC.2 Rehabilitative care - - - - - - - - - HC.4.1 Clinical lab (independent facilities) 57,772,700 - - - - - - - -
HC.4.2 Diagnostic imaging (independent facilities)
- - - - - - - - -
HC.4.3 Patient transport and emergency rescue
- - - - - - - - -
HC.5.1 + HC.5.2
Pharmaceuticals and other medical non durables
- - - - - - - 788,421 75,998,708
HC.6.1 Maternal and child care, family planning and counseling
15,882,065 - - - - - - - -
HC.6.2 School health services - - - - - - - - - HC.6.3 Prevention of communicable
disease 28,376,536 10,000 - - - - - - -
HC 6.4 Prevention of noncommunicable diseases
2,446,169 - - - - - - - -
HC.6.9 All other miscellaneous public health services
- - - - - - - - -
HC.7 Health administration and health insurance
193,960,380 - - - - - - 29,153,999
16,112,838
HC.nsk Not specified by kind - - - - - - - - - HCR.1 Capital formation for health care
provider institutions 56,853,093 - - - - - - - -
Column Total THE 1,315,414,174 10,000 - - 7,857,282 490,908 - 522,770,889 HCR.2 Education & Training 1,344,329 - - - - - - - - HCR.3 Research & Development - - - - - - - - -
HCR.4 Food, hygiene and drinking water control
- - - - - - - - -
HCR.5 Environmental health - - - - - - - - -
HCR.nsk HCR expenditure not specified by kind
476,493,000 - - - - - - - -
Sub total column 477,837,329 - - - - - - - - Column Total NHE 1,793,251,503 10,000 - - 7,857,282 490,908 - 522,770,889
HF as a % of THE 48% 0% 0% 0% 0% 0% 0% 2% 19%
*Note, it was not possible to disaggregate spending by insurance schemes at independent labs and diagnostic facilities.
HF.A Public Sector

NAMIBIA NHA TABLES 59
Financing Agent X Function (HF x HC) – Part 2
HF.3 ROW HF.nsk HF.2.1.2 HF.2.2 HF.2.3. HF.2.4 HF.2.5 HF.3 HF.nsk
Code Function (HC)
Private social insurance (private insurance covered by other
employers - parastatal and private
Private insurance enterprises (other than
social insurance)-- (individual/supplementa
l insurance)
Household Out-of-Pocket
Non profit institutions
(NGOs)
Employers (parastatal and
private)
Rest of World Not specified by any kind
Row Total
HC as a % of THE
HC.1.1 In patient curative care 118,647,494 28,452,160 11,034,875 - 3,682,785 - - 965,034,203 34.9% HC.1.3 Out patient curative care 140,877,964 47,121,431 87,933,591 6,228,287 10,352,206 - - 903,407,346 32.7% HC.2 Rehabilitative care - - - - - - - - 0.0% HC.4.1 Clinical lab (independent facilities) - - - 18,780,806 - - - 76,553,506
2.8% HC.4.2 Diagnostic imaging (independent
facilities) - - - - - - - -
0.0% HC.4.3 Patient transport and emergency
rescue 1,681,506 461,110 - - - - - 2,142,616
0.1% HC.5.1 + HC.5.2
Pharmaceuticals and other medical non durables
88,457,101 29,781,838 4,544,650 - 10,747,496 - - 210,318,213 7.6%
HC.6.1 Maternal and child care, family planning and counseling
- - - - - - - 15,882,065 0.6%
HC.6.2 School health services - - - - - - - - 0.0% HC.6.3 Prevention of communicable
disease - - - 178,373,501 - - - 206,760,037
7.5% HC 6.4 Prevention of noncommunicable
diseases - - - - - - - 2,446,169
0.1% HC.6.9 All other miscellaneous public
health services - - - - - - - -
0.0% HC.7 Health administration and health
insurance 36,039,001 14,718,640 - 19,856,517 - 9,431,978 - 319,273,354
11.6% HC.nsk Not specified by kind - - - - 3,255,634 - - 3,255,634 0.1% HCR.1 Capital formation for health care
provider institutions - - - - 190,080 - - 57,043,173
2.1% Column Total THE 385,703,066 120,535,179 103,513,117 223,239,112 28,228,201 9,431,978 - 2,762,116,315
HCR.2 Education & Training - - - - - - - 1,344,329 HCR.3 Research & Development - - - - - - - -
HCR.4 Food, hygiene and drinking water control
- - - - - - - -
HCR.5 Environmental health - - - - - - - -
HCR.nsk HCR expenditure not specified by kind
- - - - - - - 476,493,000
Sub total column - - - - - - - 1,344,329 Column Total NHE 385,703,066 120,535,179 103,513,117 223,239,112 28,228,201 9,431,978 - 3,239,953,644
HF as a % of THE 14% 4% 4% 8% 1% 0% 0%
HF.B Non Public Sector

NAMIBIA NATIONAL HEALTH ACCOUNTS 2001/02-2006/07 60
NAMIBIA NHA 2004/05 TABLES
Provider X Function (HP x HC) – Part 1
HP.1.1.1+HP.3.4.5 HP.1.1.2 HP.2.2 HP.3.1 + HP.3.2 HP.3.3.1 HP.3.3.2 HP.3.5 HP.3.9.1 HP.3.9.2 HP.4.1
Code Function (HC)
Public and Mission general hospitals and public health
centers
Private for profit general
hospitals
Residential mental retardation, mental
health and substance abuse facilities
Offices of physicians and dentists(private
facilities)
Traditional healers
Community health workers
Medical and diagnostic
laboratories
Ambulance services
Blood banks
Dispensing chemists
HC.1.1 In patient curative care 770,090,021 187,364,713 - 7,509,426 - - - - - - HC.1.3 Out patient curative care 503,875,078 14,425,752 - 385,102,712 - - - - - - HC.2 Rehabilitative care - - - - - - - - - - HC.4.1 Clinical lab (independent
facilities) - - - - - - 66,304,806 -
10,248,700 -
HC.4.2 Diagnostic imaging (independent facilities)
- - - - - - - - - -
HC.4.3 Patient transport and emergency rescue
- - - - - - - 2,142,616 - -
HC.5.1 + HC.5.2 Pharmaceuticals and other medical non durables
- - - 10,747,496 - - - - - 199,570,717
HC.6.1 Maternal and child care, family planning and counseling
202,353 - - - - - - - - -
HC.6.2 School health services - - - - - - - - - - HC.6.3 Prevention of communicable
disease - - - - - - - - - -
HC 6.4 Prevention of noncommunicable diseases
- - - - - - - - - -
HC.6.9 All other miscellaneous public health services
- - - - - - - - - -
HC.7 Health administration and health insurance
- - - - - - - - - -
HC.nsk Not specified by kind - - - - - - - - - - HCR.1 Capital formation for health
care provider institutions 56,853,093 - - 190,080 - - - - - -
Column Total-THE 1,331,020,545 201,790,465 - 403,549,714 - - 66,304,806 2,142,616 199,570,717 HCR.2 Education & TrainingHCR.3 Research & Development
HCR.4 Food, hygiene and drinking water control
HCR.5 Environmental health
HCR.nsk HCR expenditure not specified by kind Column Total-NHE HP as a % of THE 48.2% 7.3% 0.0% 14.6% 0.0% 0.0% 2.4% 0.1% 7.2%*NOTE: Data not sufficient to disaggregate public and Misison hospitals and health centers-- so it is left as an aggregate category.
Provider (HP)
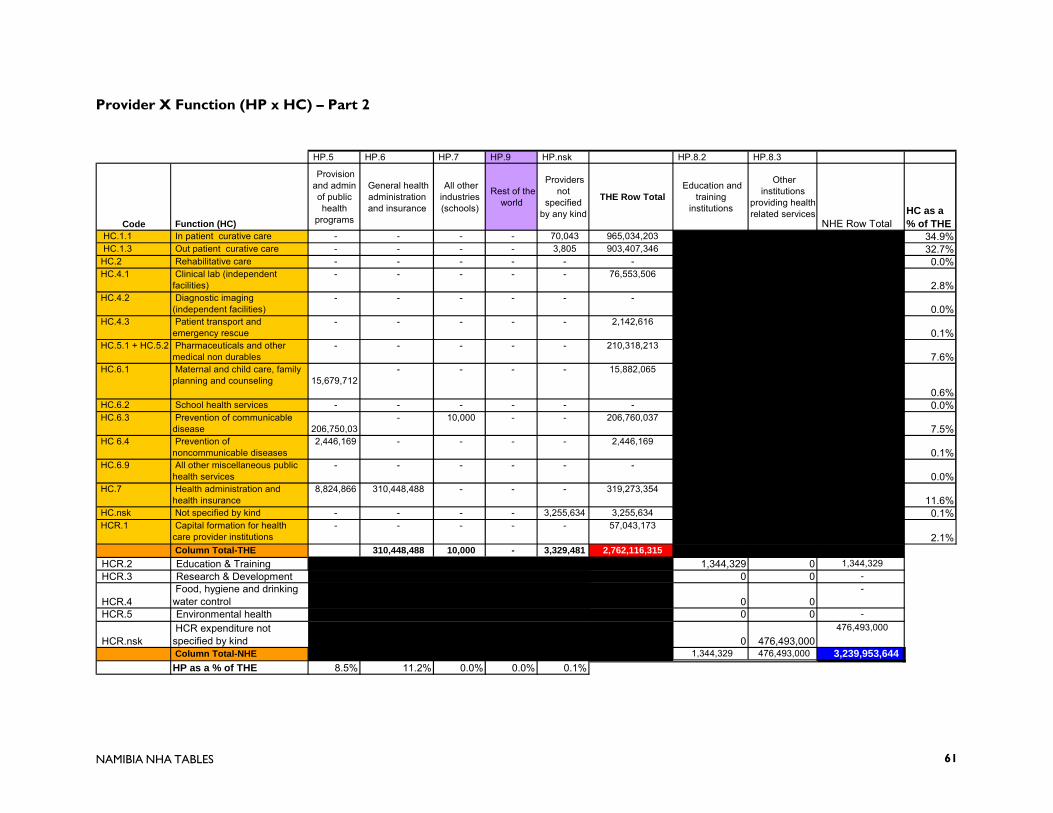
NAMIBIA NHA TABLES 61
Provider X Function (HP x HC) – Part 2
HP.5 HP.6 HP.7 HP.9 HP.nsk HP.8.2 HP.8.3
Code Function (HC)
Provision and admin of public health
programs
General health administration and insurance
All other industries (schools)
Rest of the world
Providers not
specified by any kind
THE Row Total Education and
training institutions
Other institutions
providing health related services
NHE Row Total HC as a % of THE
HC.1.1 In patient curative care - - - - 70,043 965,034,203 34.9% HC.1.3 Out patient curative care - - - - 3,805 903,407,346 32.7% HC.2 Rehabilitative care - - - - - - 0.0% HC.4.1 Clinical lab (independent
facilities) - - - - - 76,553,506
2.8% HC.4.2 Diagnostic imaging
(independent facilities) - - - - - -
0.0% HC.4.3 Patient transport and
emergency rescue - - - - - 2,142,616
0.1% HC.5.1 + HC.5.2 Pharmaceuticals and other
medical non durables - - - - - 210,318,213
7.6% HC.6.1 Maternal and child care, family
planning and counseling
15,679,712 - - - - 15,882,065
0.6% HC.6.2 School health services - - - - - - 0.0% HC.6.3 Prevention of communicable
disease
206,750,03 - 10,000 - - 206,760,037
7.5% HC 6.4 Prevention of
noncommunicable diseases 2,446,169 - - - - 2,446,169
0.1% HC.6.9 All other miscellaneous public
health services - - - - - -
0.0% HC.7 Health administration and
health insurance 8,824,866 310,448,488 - - - 319,273,354
11.6% HC.nsk Not specified by kind - - - - 3,255,634 3,255,634 0.1% HCR.1 Capital formation for health
care provider institutions - - - - - 57,043,173
2.1% Column Total-THE 310,448,488 10,000 - 3,329,481 2,762,116,315
HCR.2 Education & Training 1,344,329 0 1,344,329 HCR.3 Research & Development 0 0 -
HCR.4 Food, hygiene and drinking water control 0 0
-
HCR.5 Environmental health 0 0 -
HCR.nsk HCR expenditure not specified by kind 0 476,493,000
476,493,000
Column Total-NHE 1,344,329 476,493,000 3,239,953,644 HP as a % of THE 8.5% 11.2% 0.0% 0.0% 0.1%

NAMIBIA NATIONAL HEALTH ACCOUNTS 2001/02-2006/07 62
NAMIBIA NHA 2003/04 TABLES
Financing Source X Financing Agent (FSxHF)
FS.2 Private Funds FS.3 FS.nsk
FS.1.1.1 Central Gov Revenue
FS.2.1.1 Govt as Employer
FS.2.1.2 Other Employers
FS.2.2 Households
Rest of the World (Donors)
Not specified by any kind
HF as a % of THE
HF.1.1.1.1 Ministry of Health & Social Services 1,283,894,043 64,649,660 1,348,543,703 56%
HF.1.1.1.2 Ministry of Gender Equality and Child Welfare 10,000 10,000 0%
HF.1.1.1.3 Ministry of Regional Local Government and Housing and Rural Development 0 0%
HF.1.1.1.4 Ministry of Education 0 0%HF.1.1.1.5 Ministry of Defense 8,166,451 8,166,451 0%HF.1.1.1.6 Ministry of Safety and Security 863,799 863,799 0%HF.1.1.3 Municipal Government 0 0%HF.1.2 Social Security funds 15,499,115 15,499,115 30,998,230 1%
HF.2.1.1 Private social insurance (gov't employees) 203,839,136 203,839,136 407,678,271 17%
HF.2.1.2Private social insurance (private insurance covered by other employers - parastatal and private
267,697,150 94,025,721 361,722,871 15%
HF.2.2Private insurance enterprises (other than social insurance)-- (individual/supplemental insurance)
110,514,099 110,514,099 5%
HF.2.3. Household Out-of-Pocket 123,841,840 123,841,840 5%HF.2.4 Non profit institutions (NGOs) 0 0%HF.2.5 Employers (parastatal and private) 22,088,492 22,088,492 1%HF.3 Rest of World 7,206,786 7,206,786 0%HF.nsk Not specified by any kind 0 0%
Column Total (THE) 1,292,934,293 219,338,250 289,785,642 547,719,910 71,856,446 0 2,421,634,542
HF.4 Financing Agents spending on Health Related Items
405,810,281 405,810,281
Column Total (NHE) 1,698,744,574 219,338,250 289,785,642 547,719,910 71,856,446 0 2,827,444,823FS % of THE 53% 9% 12% 23% 3% 0%
Row Total
Financing Source (FS)FS.1 Public Funds
Code Financing Agent (HF)

NAMIBIA NHA TABLES 63
NAMIBIA NHA 2003/04 TABLES
Financing Agent X Provider (HF x HP) – Part 1
Financing Agent (HF)
HF.1.1.1.1 HF.1.1.1.2 HF.1.1.1.3 HF.1.1.1.4 HF.1.1.1.5 HF.1.1.1.6 HF.1.1.3 HF.1.2 HF.2.1.1
Ministry of Health & Social Services
Ministry of Gender
Equality and Child Welfare
Ministry of Regional Local Government and Housing
and Rural Development
Ministry of Education
Ministry of Defense
Ministry of Safety and
Security
Municipal Government
Social Security funds
Private social insurance (gov't
employees)
HP.1.1.1+HP.3.4.5
Public and Mission general hospitals and public health centers
1,021,902,498 8,166,451 863,799 1,837,313 197,918,445
HP.1.1.2 Private for profit general hospitals 1,531,094 39,583,689 HP.2.2 Residential mental retardation, mental health and
substance abuse facilities HP.3.1 + HP.3.2
Offices of physicians and dentists(private facilities) 2,449,750 98,959,223
HP.3.3.1 Traditional healers HP.3.3.2 Community health workers HP.3.5 Medical and diagnostic laboratories 43,600,000 HP.3.9.1 Ambulance services HP.3.9.2 Blood banks 8,470,000 HP.4.1 Dispensing chemists 306,219 59,375,534 HP.5 Provision and admin of public health programs 84,794,145
HP.6 General health administration and insurance 189,777,060 24,873,854 11,841,381 HP.7 All other industries (schools) 10,000 HP.9 Rest of the world HP.nsk Providers not specified by any kind - Column Total THE 1,348,543,703 10,000 - - 8,166,451 863,799 - 30,998,230 407,678,271
HF Totals From FS x HF Table 1,348,543,703 10,000 - - 8,166,451 863,799 - 30,998,230 407,678,271 HP.8.2 Education and training institutions
HP.8.3 Other institutions providing health related services 405,810,281 Subtotal for health related Column Total: NHE 1,754,353,984 10,000 - - 8,166,451 863,799 - 30,998,230 407,678,271
HF as a % of THE 56% 0% 0% 0% 0% 0% 0% 1% 17%*NOTE: Data not sufficient to disaggregate public and Misison hospitals and health centers-- so it is left as an aggregate category.
HF.A Public Sector
Code Provider (HP)

NAMIBIA NATIONAL HEALTH ACCOUNTS 2001/02-2006/07 64
Financing Agent X Provider (HF x HP) – Part 2
HF.3 ROW HF.nskHF.2.1.2 HF.2.2 HF.2.3. HF.2.4 HF.2.5 HF.2.4 HF.nsk
Private social insurance (private insurance covered by other
employers - parastatal and private
Private insurance enterprises (other
than social insurance)--
(individual/supplemental insurance)
Household Out-of-Pocket
Non profit institutions
(NGOs)
Employers (parastatal and
private)
Non profit institutions
(NGOs)
Not specified by any kind
Row Total
HP.1.1.1+HP.3.4.5
Public and Mission general hospitals and public health centers
15,509,332 250,830 29,768,219
1,276,216,887 53% HP.1.1.2 Private for profit general hospitals 110,061,667 25,645,115 281,010 48,238 177,150,813 7% HP.2.2 Residential mental retardation, mental health and
substance abuse facilities - 0% HP.3.1 + HP.3.2
Offices of physicians and dentists(private facilities) 105,090,928 41,523,774 88,353,863 19,590,524 355,968,061 15%
HP.3.3.1 Traditional healers - 0% HP.3.3.2 Community health workers - 0% HP.3.5 Medical and diagnostic laboratories 43,600,000 2% HP.3.9.1 Ambulance services 2,881,533 761,177 3,642,710 0% HP.3.9.2 Blood banks 8,470,000 0% HP.4.1 Dispensing chemists 87,755,290 26,015,288 5,351,702 178,804,032 7% HP.5 Provision and admin of public health programs
259,096 85,053,241 4% HP.6 General health administration and insurance 40,424,120 16,317,916 6,947,690 290,182,021 12% HP.7 All other industries (schools) 10,000 0% HP.9 Rest of the world - 0% HP.nsk Providers not specified by any kind 87,046 2,449,731 2,536,776 0% - Column Total THE 361,722,871 110,514,099 123,841,840 - 22,088,492 7,206,786 - 2,421,634,542
HF Totals From FS x HF Table 361,722,871 110,514,099 123,841,840 - 22,088,492 7,206,786 - HP.8.2 Education and training institutions -
HP.8.3 Other institutions providing health related services 405,810,281 Subtotal for health related 405,810,281 Column Total: NHE 361,722,871 110,514,099 123,841,840 - 22,088,492 7,206,786 - 2,827,444,823
HF as a % of THE 15% 5% 5% 0% 1% 0% 0%
HF.B Non Public Sector
Code Provider (HP)

NAMIBIA NHA TABLES 65
NAMIBIA NHA 2003/04 TABLES
Financing Agent X Function (HF x HC) – Part 1
Financing Agent (HF)
HF.1.1.1.1 HF.1.1.1.2 HF.1.1.1.3 HF.1.1.1.4 HF.1.1.1.5 HF.1.1.1.6 HF.1.1.3 HF.1.2 HF.2.1.1
Code Function (HC)
Ministry of Health & Social Services
Ministry of Gender Equality
and Child Welfare
Ministry of Regional Local
Government and Housing
and Rural
Ministry of Education
Ministry of Defense
Ministry of Safety and Security
Municipal Government
Social Security
funds
Private social insurance
(gov't employees)
HC.1.1 In patient curative care 470,183,591 - - - 4,058,726 - - 4,899,500 237,502,134 HC.1.3 Out patient curative care 475,859,852 - - - 4,107,725 863,799 - 918,656 98,959,223 HC.2 Rehabilitative care - - - - - - - - - HC.4.1 Clinical lab (independent facilities) 52,070,000 - - - - - - - -
HC.4.2 Diagnostic imaging (independent facilities)
- - - - - - - - -
HC.4.3 Patient transport and emergency rescue
- - - - - - - - -
HC.5.1 + HC.5.2
Pharmaceuticals and other medical non durables
- - - - - - - 306,219 59,375,534
HC.6.1 Maternal and child care, family planning and counseling
22,636,159 - - - - - - - -
HC.6.2 School health services - - - - - - - - - HC.6.3 Prevention of communicable
disease 60,353,270 10,000 - - - - - - -
HC 6.4 Prevention of noncommunicable diseases
2,200,038 - - - - - - - -
HC.6.9 All other miscellaneous public health services
- - - - - - - - -
HC.7 Health administration and health insurance
180,849,482 - - - - - - 24,873,854
11,841,381
HC.nsk Not specified by kind - - - - - - - - - HCR.1 Capital formation for health care
provider institutions 84,391,311 - - - - - - - -
Column Total THE 1,348,543,703 10,000 - - 8,166,451 863,799 - 407,678,271 HCR.2 Education & Training - - - - - - - - - HCR.3 Research & Development - - - - - - - - -
HCR.4 Food, hygiene and drinking water control
- - - - - - - - -
HCR.5 Environmental health - - - - - - - - -
HCR.nsk HCR expenditure not specified by kind
405,810,281 - - - - - - - -
Sub total column 405,810,281 - - - - - - - - Column Total NHE 1,754,353,984 10,000 - - 8,166,451 863,799 - 407,678,271
HF as a % of THE 56% 0% 0% 0% 0% 0% 0% 1% 17%
*Note, it was not possible to disaggregate spending by insurance schemes at independent labs and diagnostic facilities.
HF.A Public Sector

NAMIBIA NATIONAL HEALTH ACCOUNTS 2001/02-2006/07 66
Financing Agent X Function (HF x HC) – Part 2
HF.3 ROW HF.nsk HF.2.1.2 HF.2.2 HF.2.3. HF.2.4 HF.2.5 HF.2.4 HF.nsk
Code Function (HC)
Private social insurance (private insurance covered by other
employers - parastatal and private
Private insurance enterprises (other than
social insurance)-- (individual/supplementa
l insurance)
Household Out-of-Pocket
Non profit institutions
(NGOs)
Employers (parastatal and
private)
Non profit institutions
(NGOs)
Not specified by any kind
Row Total
HC as a % of THE
HC.1.1 In patient curative care 113,163,983 25,776,795 12,994,480 - 2,482,844 - - 871,062,055 36.0% HC.1.3 Out patient curative care 117,497,944 41,642,924 105,495,658 - 7,725,005 - - 853,070,785 35.2% HC.2 Rehabilitative care - - - - - - - - 0.0% HC.4.1 Clinical lab (independent facilities) - - - - - - - 52,070,000
2.2% HC.4.2 Diagnostic imaging (independent
facilities) - - - - - - - -
0.0% HC.4.3 Patient transport and emergency
rescue 2,881,533 761,177 - - - - - 3,642,710
0.2% HC.5.1 + HC.5.2
Pharmaceuticals and other medical non durables
87,755,290 26,015,288 5,351,702 - 9,430,912 - - 188,234,944 7.8%
HC.6.1 Maternal and child care, family planning and counseling
- - - - - - - 22,636,159 0.9%
HC.6.2 School health services - - - - - - - - 0.0% HC.6.3 Prevention of communicable
disease - - - - - - - 60,363,270
2.5% HC 6.4 Prevention of noncommunicable
diseases - - - - - - - 2,200,038
0.1% HC.6.9 All other miscellaneous public
health services - - - - - - - -
0.0% HC.7 Health administration and health
insurance 40,424,120 16,317,916 - - - 7,206,786 - 281,513,539
11.6% HC.nsk Not specified by kind - - - - 2,449,731 - - 2,449,731 0.1% HCR.1 Capital formation for health care
provider institutions - - - - - - - 84,391,311
3.5% Column Total THE 361,722,871 110,514,099 123,841,840 - 22,088,492 7,206,786 - 2,421,634,542
HCR.2 Education & Training - - - - - - - - HCR.3 Research & Development - - - - - - - -
HCR.4 Food, hygiene and drinking water control
- - - - - - - -
HCR.5 Environmental health - - - - - - - -
HCR.nsk HCR expenditure not specified by kind
- - - - - - - 405,810,281
Sub total column - - - - - - - - Column Total NHE 361,722,871 110,514,099 123,841,840 - 22,088,492 7,206,786 - 2,827,444,823
HF as a % of THE 15% 5% 5% 0% 1% 0% 0%
HF.B Non Public Sector

NAMIBIA NHA TABLES 67
NAMIBIA NHA 2003/04 TABLES
Provider X Function (HP x HC) – Part 1
HP.1.1.1+HP.3.4.5 HP.1.1.2 HP.2.2 HP.3.1 + HP.3.2 HP.3.3.1 HP.3.3.2 HP.3.5 HP.3.9.1 HP.3.9.2 HP.4.1
Code Function (HC)
Public and Mission general hospitals and public health
centers
Private for profit general
hospitals
Residential mental retardation, mental
health and substance abuse facilities
Offices of physicians and dentists(private
facilities)
Traditional healers
Community health workers
Medical and diagnostic
laboratories
Ambulance services
Blood banks
Dispensing chemists
HC.1.1 In patient curative care 701,236,158 165,777,715 - 3,965,700 - - - - - - HC.1.3 Out patient curative care 499,121,674 11,373,098 - 342,571,449 - - - - - - HC.2 Rehabilitative care - - - - - - - - - - HC.4.1 Clinical lab (independent
facilities) - - - - - - 43,600,000 - 8,470,000 -
HC.4.2 Diagnostic imaging (independent facilities)
- - - - - - - - - -
HC.4.3 Patient transport and emergency rescue
- - - - - - - 3,642,710 - -
HC.5.1 + HC.5.2 Pharmaceuticals and other medical non durables
- - - 9,430,912 - - - - - 178,804,032
HC.6.1 Maternal and child care, family planning and counseling
395,322 - - - - - - - - -
HC.6.2 School health services - - - - - - - - - - HC.6.3 Prevention of communicable
disease - - - - - - - - - -
HC 6.4 Prevention of noncommunicable diseases
- - - - - - - - - -
HC.6.9 All other miscellaneous public health services
- - - - - - - - - -
HC.7 Health administration and health insurance
- - - - - - - - - -
HC.nsk Not specified by kind - - - - - - - - - - HCR.1 Capital formation for health
care provider institutions 75,463,733 - - - - - - - - -
Column Total-THE 1,276,216,887 177,150,813 - 355,968,061 - - 43,600,000 3,642,710 8,470,000 178,804,032 HCR.2 Education & TrainingHCR.3 Research & Development
HCR.4 Food, hygiene and drinking water control
HCR.5 Environmental health
HCR.nsk HCR expenditure not specified by kind Column Total-NHE HP as a % of THE 52.7% 7.3% 0.0% 14.7% 0.0% 0.0% 1.8% 0.2% 7.4%*NOTE: Data not sufficient to disaggregate public and Misison hospitals and health centers-- so it is left as an aggregate category.
Provider (HP)

NAMIBIA NATIONAL HEALTH ACCOUNTS 2001/02-2006/07 68
Provider X Function (HP x HC) – Part 2
HP.5 HP.6 HP.7 HP.9 HP.nsk HP.8.2 HP.8.3
Code Function (HC)
Provision and admin of public health
programs
General health administration and insurance
All other industries (schools)
Rest of the world
Providers not
specified by any kind
THE Row Total Education and
training institutions
Other institutions providing
health related services NHE Row Total
HC as a % of THE
HC.1.1 In patient curative care - - - - 82,481 871,062,055 36.0% HC.1.3 Out patient curative care - - - - 4,564 853,070,785 35.2% HC.2 Rehabilitative care - - - - - - 0.0% HC.4.1 Clinical lab (independent
facilities) - - - - - 52,070,000
2.2% HC.4.2 Diagnostic imaging
(independent facilities) - - - - - -
0.0% HC.4.3 Patient transport and
emergency rescue - - - - - 3,642,710
0.2% HC.5.1 + HC.5.2 Pharmaceuticals and other
medical non durables - - - - - 188,234,944
7.8% HC.6.1 Maternal and child care, family
planning and counseling
22,240,837 - - - - 22,636,159
0.9% HC.6.2 School health services - - - - - - 0.0% HC.6.3 Prevention of communicable
disease
60,353,270 - 10,000 - - 60,363,270
2.5% HC 6.4 Prevention of
noncommunicable diseases 2,200,038 - - - - 2,200,038
0.1% HC.6.9 All other miscellaneous public
health services - - - - - -
0.0% HC.7 Health administration and
health insurance 259,096 281,254,443 - - - 281,513,539
11.6% HC.nsk Not specified by kind - - - - 2,449,731 2,449,731 0.1% HCR.1 Capital formation for health
care provider institutions - 8,927,578 - - - 84,391,311
3.5% Column Total-THE 290,182,021 10,000 - 2,536,776 2,421,634,542
HCR.2 Education & Training 0 0 - HCR.3 Research & Development 0 0 -
HCR.4 Food, hygiene and drinking water control 0 0
-
HCR.5 Environmental health 0 0 -
HCR.nsk HCR expenditure not specified by kind 0 405,810,281
405,810,281
Column Total-NHE - 405,810,281 2,827,444,823HP as a % of THE 3.5% 12.0% 0.0% 0.0% 0.1%
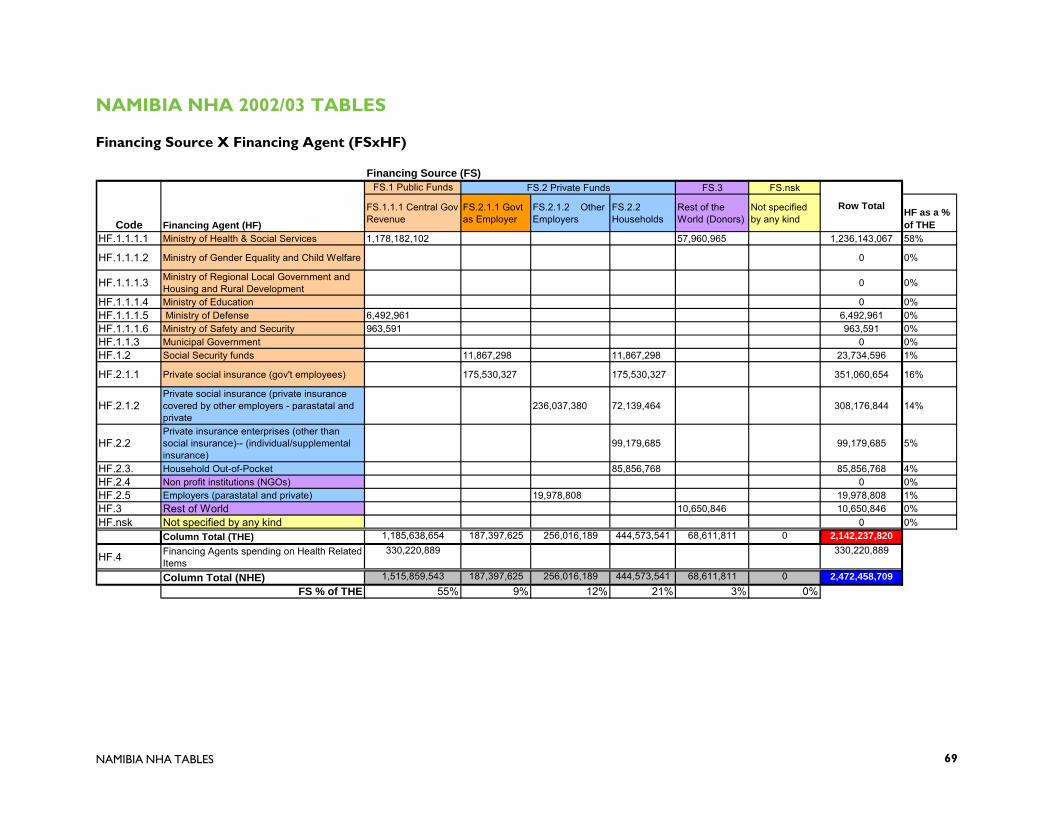
NAMIBIA NHA TABLES 69
NAMIBIA NHA 2002/03 TABLES
Financing Source X Financing Agent (FSxHF)
FS.2 Private Funds FS.3 FS.nsk
FS.1.1.1 Central Gov Revenue
FS.2.1.1 Govt as Employer
FS.2.1.2 Other Employers
FS.2.2 Households
Rest of the World (Donors)
Not specified by any kind
HF as a % of THE
HF.1.1.1.1 Ministry of Health & Social Services 1,178,182,102 57,960,965 1,236,143,067 58%
HF.1.1.1.2 Ministry of Gender Equality and Child Welfare 0 0%
HF.1.1.1.3 Ministry of Regional Local Government and Housing and Rural Development 0 0%
HF.1.1.1.4 Ministry of Education 0 0%HF.1.1.1.5 Ministry of Defense 6,492,961 6,492,961 0%HF.1.1.1.6 Ministry of Safety and Security 963,591 963,591 0%HF.1.1.3 Municipal Government 0 0%HF.1.2 Social Security funds 11,867,298 11,867,298 23,734,596 1%
HF.2.1.1 Private social insurance (gov't employees) 175,530,327 175,530,327 351,060,654 16%
HF.2.1.2Private social insurance (private insurance covered by other employers - parastatal and private
236,037,380 72,139,464 308,176,844 14%
HF.2.2Private insurance enterprises (other than social insurance)-- (individual/supplemental insurance)
99,179,685 99,179,685 5%
HF.2.3. Household Out-of-Pocket 85,856,768 85,856,768 4%HF.2.4 Non profit institutions (NGOs) 0 0%HF.2.5 Employers (parastatal and private) 19,978,808 19,978,808 1%HF.3 Rest of World 10,650,846 10,650,846 0%HF.nsk Not specified by any kind 0 0%
Column Total (THE) 1,185,638,654 187,397,625 256,016,189 444,573,541 68,611,811 0 2,142,237,820
HF.4 Financing Agents spending on Health Related Items
330,220,889 330,220,889
Column Total (NHE) 1,515,859,543 187,397,625 256,016,189 444,573,541 68,611,811 0 2,472,458,709FS % of THE 55% 9% 12% 21% 3% 0%
Row Total
Financing Source (FS)FS.1 Public Funds
Code Financing Agent (HF)

NAMIBIA NATIONAL HEALTH ACCOUNTS 2001/02-2006/07 70
NAMIBIA NHA 2002/03 TABLES
Financing Agent X Provider (HF x HP) – Part 1
Financing Agent (HF)
HF.1.1.1.1 HF.1.1.1.2 HF.1.1.1.3 HF.1.1.1.4 HF.1.1.1.5 HF.1.1.1.6 HF.1.1.3 HF.1.2 HF.2.1.1
Ministry of Health & Social Services
Ministry of Gender
Equality and Child Welfare
Ministry of Regional
Local Government and Housing
Ministry of Education
Ministry of Defense
Ministry of Safety and
Security
Municipal Government
Social Security funds
Private social insurance (gov't
employees)
HP.1.1.1+HP.3.4.5
Public and Mission general hospitals and public health centers
944,291,287 6,492,961 963,591 2,404,273 168,691,947
HP.1.1.2 Private for profit general hospitals 2,003,561 33,738,389 HP.2.2 Residential mental retardation, mental health and
substance abuse facilities HP.3.1 + HP.3.2
Offices of physicians and dentists(private facilities) 3,205,698 84,345,974
HP.3.3.1 Traditional healers HP.3.3.2 Community health workers HP.3.5 Medical and diagnostic laboratories 36,400,000 HP.3.9.1 Ambulance services HP.3.9.2 Blood banks 5,530,000 HP.4.1 Dispensing chemists 400,712 50,607,584 HP.5 Provision and admin of public health programs 75,012,894
HP.6 General health administration and insurance 174,908,886 15,720,352 13,676,760 HP.7 All other industries (schools) HP.9 Rest of the world HP.nsk Providers not specified by any kind
Column Total THE 1,236,143,067 - - - 6,492,961 963,591 - 23,734,596 351,060,654 HF Totals From FS x HF Table 1,236,143,067 - - - 6,492,961 963,591 - 23,734,596 351,060,654
HP.8.2 Education and training institutions
HP.8.3 Other institutions providing health related services 330,220,889 Subtotal for health related 330,220,889 - - - - - - - - Column Total: NHE 1,566,363,956 - - - 6,492,961 963,591 - 23,734,596 351,060,654
HF as a % of THE 58% 0% 0% 0% 0% 0% 0% 1% 16%*NOTE: Data not sufficient to disaggregate public and Misison hospitals and health centers-- so it is left as an aggregate category.
HF.A Public Sector
Code Provider (HP)
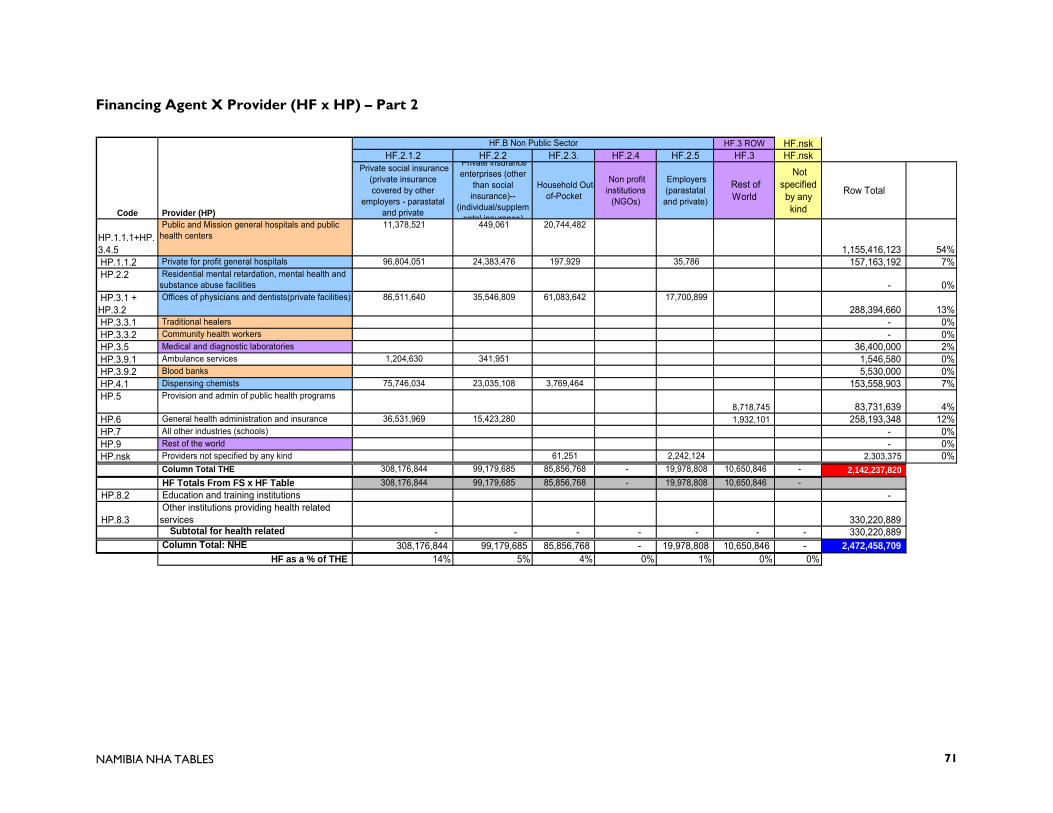
NAMIBIA NHA TABLES 71
Financing Agent X Provider (HF x HP) – Part 2
HF.3 ROW HF.nskHF.2.1.2 HF.2.2 HF.2.3. HF.2.4 HF.2.5 HF.3 HF.nsk
Private social insurance (private insurance covered by other
employers - parastatal and private
Private insurance enterprises (other
than social insurance)--
(individual/supplemental insurance)
Household Out-of-Pocket
Non profit institutions
(NGOs)
Employers (parastatal and private)
Rest of World
Not specified by any kind
Row Total
HP.1.1.1+HP.3.4.5
Public and Mission general hospitals and public health centers
11,378,521 449,061 20,744,482
1,155,416,123 54% HP.1.1.2 Private for profit general hospitals 96,804,051 24,383,476 197,929 35,786 157,163,192 7% HP.2.2 Residential mental retardation, mental health and
substance abuse facilities - 0% HP.3.1 + HP.3.2
Offices of physicians and dentists(private facilities) 86,511,640 35,546,809 61,083,642 17,700,899 288,394,660 13%
HP.3.3.1 Traditional healers - 0% HP.3.3.2 Community health workers - 0% HP.3.5 Medical and diagnostic laboratories 36,400,000 2% HP.3.9.1 Ambulance services 1,204,630 341,951 1,546,580 0% HP.3.9.2 Blood banks 5,530,000 0% HP.4.1 Dispensing chemists 75,746,034 23,035,108 3,769,464 153,558,903 7% HP.5 Provision and admin of public health programs
8,718,745 83,731,639 4% HP.6 General health administration and insurance 36,531,969 15,423,280 1,932,101 258,193,348 12% HP.7 All other industries (schools) - 0% HP.9 Rest of the world - 0% HP.nsk Providers not specified by any kind 61,251 2,242,124 2,303,375 0%
Column Total THE 308,176,844 99,179,685 85,856,768 - 19,978,808 10,650,846 - 2,142,237,820 HF Totals From FS x HF Table 308,176,844 99,179,685 85,856,768 - 19,978,808 10,650,846 -
HP.8.2 Education and training institutions -
HP.8.3 Other institutions providing health related services 330,220,889 Subtotal for health related - - - - - - - 330,220,889 Column Total: NHE 308,176,844 99,179,685 85,856,768 - 19,978,808 10,650,846 - 2,472,458,709
HF as a % of THE 14% 5% 4% 0% 1% 0% 0%
HF.B Non Public Sector
Code Provider (HP)

NAMIBIA NATIONAL HEALTH ACCOUNTS 2001/02-2006/07 72
NAMIBIA NHA 2002/03 TABLES
Financing Agent X Function (HF x HC) – Part 1
Financing Agent (HF)
HF.1.1.1.1 HF.1.1.1.2 HF.1.1.1.3 HF.1.1.1.4 HF.1.1.1.5 HF.1.1.1.6 HF.1.1.3 HF.1.2 HF.2.1.1
Code Function (HC)
Ministry of Health & Social Services
Ministry of Gender Equality
and Child Welfare
Ministry of Regional Local
Government and Housing
and Rural
Ministry of Education
Ministry of Defense
Ministry of Safety and Security
Municipal Government
Social Security
funds
Private social insurance
(gov't employees)
HC.1.1 In patient curative care 431,935,158 - - - 3,227,002 - - 6,411,395 202,430,336 HC.1.3 Out patient curative care 437,149,666 - - - 3,265,959 963,591 - 1,202,137 84,345,974 HC.2 Rehabilitative care - - - - - - - - - HC.4.1 Clinical lab (independent facilities) 41,930,000 - - - - - - - -
HC.4.2 Diagnostic imaging (independent facilities)
- - - - - - - - -
HC.4.3 Patient transport and emergency rescue
- - - - - - - - -
HC.5.1 + HC.5.2
Pharmaceuticals and other medical non durables
- - - - - - - 400,712 50,607,584
HC.6.1 Maternal and child care, family planning and counseling
29,679,420 - - - - - - - -
HC.6.2 School health services 46,637 - - - - - - - - HC.6.3 Prevention of communicable
disease 45,351,768 - - - - - - - -
HC 6.4 Prevention of noncommunicable diseases
207,603 - - - - - - - -
HC.6.9 All other miscellaneous public health services
- - - - - - - - -
HC.7 Health administration and health insurance
165,464,204 - - - - - - 15,720,352
13,676,760
HC.nsk Not specified by kind - - - - - - - - - HCR.1 Capital formation for health care
provider institutions 84,378,611 - - - - - - - -
Column Total THE 1,236,143,067 - - - 6,492,961 963,591 - 351,060,654 HCR.2 Education & Training - - - - - - - - - HCR.3 Research & Development - - - - - - - - -
HCR.4 Food, hygiene and drinking water control
- - - - - - - - -
HCR.5 Environmental health - - - - - - - - -
HCR.nsk HCR expenditure not specified by kind
330,220,889 - - - - - - - -
Sub total column 330,220,889 - - - - - - - - Column Total NHE 1,566,363,956 - - - 6,492,961 963,591 - 351,060,654
HF as a % of THE 58% 0% 0% 0% 0% 0% 0% 1% 16%
*Note, it was not possible to disaggregate spending by insurance schemes at independent labs and diagnostic facilities.
HF.A Public Sector

NAMIBIA NHA TABLES 73
Financing Agent X Function (HF x HC) – Part 2
HF.3 ROW HF.nsk HF.2.1.2 HF.2.2 HF.2.3. HF.2.4 HF.2.5 HF.3 HF.nsk
Code Function (HC)
Private social insurance (private insurance covered by other
employers - parastatal and private
Private insurance enterprises (other than
social insurance)-- (individual/supplementa
l insurance)
Household Out-of-Pocket
Non profit institutions
(NGOs)
Employers (parastatal and
private)
Rest of World Not specified by any kind
Row Total
HC as a % of THE
HC.1.1 In patient curative care 98,317,502 24,558,384 9,152,644 - 1,566,317 - - 777,598,739 36.3% HC.1.3 Out patient curative care 96,376,709 35,820,962 72,931,504 - 7,498,305 - - 739,554,807 34.5% HC.2 Rehabilitative care - - - - - - - - 0.0% HC.4.1 Clinical lab (independent facilities) - - - - - - - 41,930,000
2.0% HC.4.2 Diagnostic imaging (independent
facilities) - - - - - - - -
0.0% HC.4.3 Patient transport and emergency
rescue 1,204,630 341,951 - - - - - 1,546,580
0.1% HC.5.1 + HC.5.2
Pharmaceuticals and other medical non durables
75,746,034 23,035,108 3,769,464 - 8,669,993 - - 162,228,896 7.6%
HC.6.1 Maternal and child care, family planning and counseling
- - - - - - - 29,679,420 1.4%
HC.6.2 School health services - - - - - - - 46,637 0.0% HC.6.3 Prevention of communicable
disease - - - - - - - 45,351,768
2.1% HC 6.4 Prevention of noncommunicable
diseases - - - - - - - 207,603
0.0% HC.6.9 All other miscellaneous public
health services - - - - - - - -
0.0% HC.7 Health administration and health
insurance 36,531,969 15,423,280 - - - 10,650,846 - 257,467,411
12.0% HC.nsk Not specified by kind - - - - 2,242,124 - - 2,242,124 0.1% HCR.1 Capital formation for health care
provider institutions - - - - 2,069 - - 84,380,680
3.9% Column Total THE 308,176,844 99,179,685 85,853,613 - 19,978,808 10,650,846 - 2,142,234,664
HCR.2 Education & Training - - - - - - - - HCR.3 Research & Development - - - - - - - -
HCR.4 Food, hygiene and drinking water control
- - - - - - - -
HCR.5 Environmental health - - - - - - - -
HCR.nsk HCR expenditure not specified by kind
- - - - - - - 330,220,889
Sub total column - - - - - - - - Column Total NHE 308,176,844 99,179,685 85,853,613 - 19,978,808 10,650,846 - 2,472,455,553
HF as a % of THE 14% 5% 4% 0% 1% 0% 0%
HF.B Non Public Sector
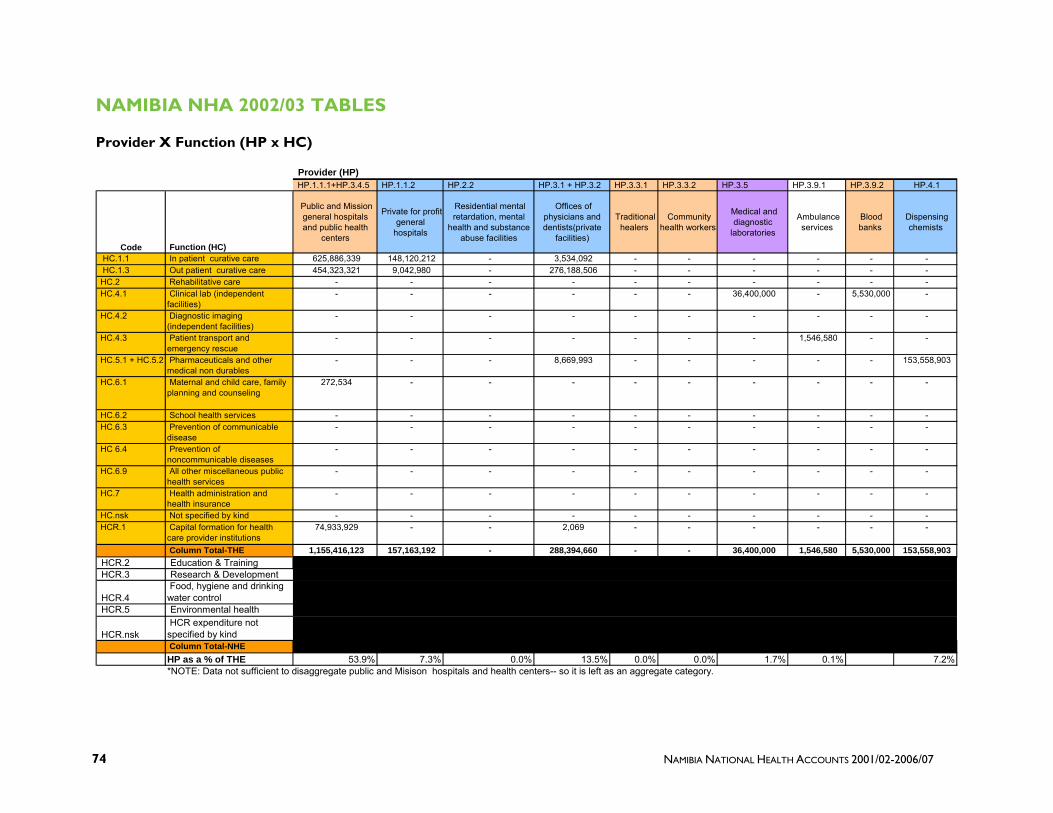
NAMIBIA NATIONAL HEALTH ACCOUNTS 2001/02-2006/07 74
NAMIBIA NHA 2002/03 TABLES
Provider X Function (HP x HC)
HP.1.1.1+HP.3.4.5 HP.1.1.2 HP.2.2 HP.3.1 + HP.3.2 HP.3.3.1 HP.3.3.2 HP.3.5 HP.3.9.1 HP.3.9.2 HP.4.1
Code Function (HC)
Public and Mission general hospitals and public health
centers
Private for profit general
hospitals
Residential mental retardation, mental
health and substance abuse facilities
Offices of physicians and dentists(private
facilities)
Traditional healers
Community health workers
Medical and diagnostic
laboratories
Ambulance services
Blood banks
Dispensing chemists
HC.1.1 In patient curative care 625,886,339 148,120,212 - 3,534,092 - - - - - - HC.1.3 Out patient curative care 454,323,321 9,042,980 - 276,188,506 - - - - - - HC.2 Rehabilitative care - - - - - - - - - - HC.4.1 Clinical lab (independent
facilities) - - - - - - 36,400,000 - 5,530,000 -
HC.4.2 Diagnostic imaging (independent facilities)
- - - - - - - - - -
HC.4.3 Patient transport and emergency rescue
- - - - - - - 1,546,580 - -
HC.5.1 + HC.5.2 Pharmaceuticals and other medical non durables
- - - 8,669,993 - - - - - 153,558,903
HC.6.1 Maternal and child care, family planning and counseling
272,534 - - - - - - - - -
HC.6.2 School health services - - - - - - - - - - HC.6.3 Prevention of communicable
disease - - - - - - - - - -
HC 6.4 Prevention of noncommunicable diseases
- - - - - - - - - -
HC.6.9 All other miscellaneous public health services
- - - - - - - - - -
HC.7 Health administration and health insurance
- - - - - - - - - -
HC.nsk Not specified by kind - - - - - - - - - - HCR.1 Capital formation for health
care provider institutions 74,933,929 - - 2,069 - - - - - -
Column Total-THE 1,155,416,123 157,163,192 - 288,394,660 - - 36,400,000 1,546,580 5,530,000 153,558,903 HCR.2 Education & TrainingHCR.3 Research & Development
HCR.4 Food, hygiene and drinking water control
HCR.5 Environmental health
HCR.nsk HCR expenditure not specified by kind Column Total-NHE HP as a % of THE 53.9% 7.3% 0.0% 13.5% 0.0% 0.0% 1.7% 0.1% 7.2%*NOTE: Data not sufficient to disaggregate public and Misison hospitals and health centers-- so it is left as an aggregate category.
Provider (HP)

NAMIBIA NHA TABLES 75
Provider X Function (HP x HC)
HP.5 HP.6 HP.7 HP.9 HP.nsk HP.8.2 HP.8.3
Code Function (HC)
Provision and admin of public health
programs
General health administration and insurance
All other industries (schools)
Rest of the world
Providers not
specified by any kind
THE Row Total Education and
training institutions
Other institutions providing
health related services NHE Row Total
HC as a % of THE
HC.1.1 In patient curative care - - - - 58,096 777,598,739 36.3% HC.1.3 Out patient curative care - - - - - 739,554,807 34.5% HC.2 Rehabilitative care - - - - - - 0.0% HC.4.1 Clinical lab (independent
facilities) - - - - - 41,930,000
2.0% HC.4.2 Diagnostic imaging
(independent facilities) - - - - - -
0.0% HC.4.3 Patient transport and
emergency rescue - - - - - 1,546,580
0.1% HC.5.1 + HC.5.2 Pharmaceuticals and other
medical non durables - - - - - 162,228,896
7.6% HC.6.1 Maternal and child care, family
planning and counseling
29,406,886 - - - - 29,679,420
1.4% HC.6.2 School health services 46,637 - - - - 46,637 0.0% HC.6.3 Prevention of communicable
disease
45,351,768 - - - - 45,351,768
2.1% HC 6.4 Prevention of
noncommunicable diseases 207,603 - - - - 207,603
0.0% HC.6.9 All other miscellaneous public
health services - - - - - -
0.0% HC.7 Health administration and
health insurance 8,718,745 248,748,666 - - - 257,467,411
12.0% HC.nsk Not specified by kind - - - - 2,242,124 2,242,124 0.1% HCR.1 Capital formation for health
care provider institutions - 9,444,682 - - - 84,380,680
3.9% Column Total-THE 258,193,348 - - 2,300,219 2,142,234,664
HCR.2 Education & Training 0 0 - HCR.3 Research & Development 0 0 -
HCR.4 Food, hygiene and drinking water control 0 0
-
HCR.5 Environmental health 0 0 -
HCR.nsk HCR expenditure not specified by kind 0 330,220,889
330,220,889
Column Total-NHE - 330,220,889 2,472,455,553 HP as a % of THE 3.9% 12.1% 0.0% 0.0% 0.1%

NAMIBIA NATIONAL HEALTH ACCOUNTS 2001/02-2006/07 76
NAMIBIA NHA 2001/02 TABLES
Financing Source X Financing Agent (FSxHF)
FS.2 Private Funds FS.3 FS.nsk
FS.1.1.1 Central Gov Revenue
FS.2.1.1 Govt as Employer
FS.2.1.2 Other Employers
FS.2.2 Households
Rest of the World (Donors)
Not specified by any kind
HF as a % of THE
HF.1.1.1.1 Ministry of Health & Social Services 983,782,000 40,929,795 1,024,711,795 57%
HF.1.1.1.2 Ministry of Gender Equality and Child Welfare 0 0%
HF.1.1.1.3 Ministry of Regional Local Government and Housing and Rural Development 0 0%
HF.1.1.1.4 Ministry of Education 0 0%HF.1.1.1.5 Ministry of Defense 5,910,693 5,910,693 0%HF.1.1.1.6 Ministry of Safety and Security 475,195 475,195 0%HF.1.1.3 Municipal Government 0 0%HF.1.2 Social Security funds 11,434,599 11,434,599 22,869,198 1%
HF.2.1.1 Private social insurance (gov't employees) 145,382,948 145,382,948 290,765,896 16%
HF.2.1.2Private social insurance (private insurance covered by other employers - parastatal and private
242,014,969 23,573,264 265,588,234 15%
HF.2.2Private insurance enterprises (other than social insurance)-- (individual/supplemental insurance)
99,653,697 99,653,697 6%
HF.2.3. Household Out-of-Pocket 56,149,601 56,149,601 3%HF.2.4 Non profit institutions (NGOs) 0 0%HF.2.5 Employers (parastatal and private) 16,304,194 16,304,194 1%HF.3 Rest of World 28,268,319 28,268,319 2%HF.nsk Not specified by any kind 0 0%
Column Total (THE) 990,167,888 156,817,547 258,319,164 336,194,110 69,198,114 0 1,810,696,822
HF.4 Financing Agents spending on Health Related Items
324,205,000 324,205,000
Column Total (NHE) 1,314,372,888 156,817,547 258,319,164 336,194,110 69,198,114 0 2,134,901,822FS % of THE 55% 9% 14% 19% 4% 0%
Row Total
Financing Source (FS)FS.1 Public Funds
Code Financing Agent (HF)

NAMIBIA NHA TABLES 77
NAMIBIA NHA 2001/02 TABLES
Financing Agent X Provider (HF x HP) – Part 1
Financing Agent (HF)
HF.1.1.1.1 HF.1.1.1.2 HF.1.1.1.3 HF.1.1.1.4 HF.1.1.1.5 HF.1.1.1.6 HF.1.1.3 HF.1.2 HF.2.1.1
Ministry of Health & Social Services
Ministry of Gender
Equality and Child Welfare
Ministry of Regional Local
Government and Housing and
Rural Development
Ministry of Education
Ministry of Defense
Ministry of Safety and
Security
Municipal Government
Social Security funds
Private social insurance (gov't
employees)
HP.1.1.1+HP.3.4.5
Public and Mission general hospitals and public health centers
782,007,595 5,910,693 475,195 1,635,486 140,770,000
HP.1.1.2 Private for profit general hospitals 1,362,905 28,154,000 HP.2.2 Residential mental retardation, mental health and
substance abuse facilities HP.3.1 + HP.3.2 Offices of physicians and dentists(private facilities) 2,180,648 70,385,000
HP.3.3.1 Traditional healers HP.3.3.2 Community health workers HP.3.5 Medical and diagnostic laboratories 33,124,000 HP.3.9.1 Ambulance services HP.3.9.2 Blood banks 4,368,700 HP.4.1 Dispensing chemists 272,581 42,231,000 HP.5 Provision and admin of public health programs 67,374,775
HP.6 General health administration and insurance 137,836,725 17,417,578 9,225,896 HP.7 All other industries (schools) HP.9 Rest of the world HP.nsk Providers not specified by any kind - Column Total THE 1,024,711,795 - - - 5,910,693 475,195 - 22,869,198 290,765,896
HF Totals From FS x HF Table 1,024,711,795 - - - 5,910,693 475,195 - 22,869,198 290,765,896 HP.8.2 Education and training institutions
HP.8.3 Other institutions providing health related services 324,205,000 Subtotal for health related 324,205,000 - - - - - - - - Column Total: NHE 1,348,916,795 - - - 5,910,693 475,195 - 22,869,198 290,765,896
HF as a % of THE 57% 0% 0% 0% 0% 0% 0% 1% 16%*NOTE: Data not sufficient to disaggregate public and Misison hospitals and health centers-- so it is left as an aggregate category.
HF.A Public Sector
Code Provider (HP)

NAMIBIA NATIONAL HEALTH ACCOUNTS 2001/02-2006/07 78
Financing Agent X Provider (HF x HP) – Part 2
HF.3 ROW HF.nskHF.2.1.2 HF.2.2 HF.2.3. HF.2.4 HF.2.5 HF.3 HF.nsk
Private social insurance (private insurance covered by other
employers - parastatal and private
Private insurance enterprises (other
than social insurance)--
(individual/supplemental insurance)
Household Out-of-Pocket
Non profit institutions
(NGOs)
Employers (parastatal and
private)
Rest of World
Not specified by any kind
Row Total
HP.1.1.1+HP.3.4.5
Public and Mission general hospitals and public health centers
5,138,605 212,336 13,566,716
949,716,626 52% HP.1.1.2 Private for profit general hospitals 138,239,135 43,004,779 129,444 3,237 210,893,500 12% HP.2.2 Residential mental retardation, mental health and
substance abuse facilities - 0% HP.3.1 + HP.3.2 Offices of physicians and dentists(private facilities) 36,471,099 24,983,193 39,948,186 15,884,796
189,852,921 10% HP.3.3.1 Traditional healers - 0% HP.3.3.2 Community health workers - 0% HP.3.5 Medical and diagnostic laboratories 33,124,000 2% HP.3.9.1 Ambulance services 2,121,646 604,929 2,726,575 0% HP.3.9.2 Blood banks 4,368,700 0% HP.4.1 Dispensing chemists 49,752,589 17,028,282 2,465,198 111,749,649 6% HP.5 Provision and admin of public health programs
28,268,319 95,643,094 5% HP.6 General health administration and insurance 33,865,160 13,820,179 212,165,538 12% HP.7 All other industries (schools) - 0% HP.9 Rest of the world - 0% HP.nsk Providers not specified by any kind 40,058 416,162 456,220 0% - Column Total THE 265,588,234 99,653,697 56,149,601 - 16,304,194 28,268,319 - 1,810,696,822
HF Totals From FS x HF Table 265,588,234 99,653,697 56,149,601 - 16,304,194 28,268,319 - HP.8.2 Education and training institutions -
HP.8.3 Other institutions providing health related services 324,205,000 Subtotal for health related - - - - - - - 324,205,000 Column Total: NHE 265,588,234 99,653,697 56,149,601 - 16,304,194 28,268,319 - 2,134,901,822
HF as a % of THE 15% 6% 3% 0% 1% 2% 0%
HF.B Non Public Sector
Code Provider (HP)

NAMIBIA NHA TABLES 79
NAMIBIA NHA 2001/02 TABLES
Financing Agent X Function (HF x HC) – Part 1
Financing Agent (HF)
HF.1.1.1.1 HF.1.1.1.2 HF.1.1.1.3 HF.1.1.1.4 HF.1.1.1.5 HF.1.1.1.6 HF.1.1.3 HF.1.2 HF.2.1.1
Code Function (HC)
Ministry of Health & Social Services
Ministry of Gender Equality
and Child Welfare
Ministry of Regional Local
Government and Housing
and Rural
Ministry of Education
Ministry of Defense
Ministry of Safety and Security
Municipal Government
Social Security
funds
Private social insurance
(gov't employees)
HC.1.1 In patient curative care 358,510,429 - - - 2,937,614 - - 4,361,296 168,924,000 HC.1.3 Out patient curative care 362,775,404 - - - 2,973,079 475,195 - 817,743 70,385,000 HC.2 Rehabilitative care - - - - - - - - - HC.4.1 Clinical lab (independent facilities) 37,492,700 - - - - - - - -
HC.4.2 Diagnostic imaging (independent facilities)
- - - - - - - - -
HC.4.3 Patient transport and emergency rescue
- - - - - - - - -
HC.5.1 + HC.5.2
Pharmaceuticals and other medical non durables
- - - - - - - 272,581 42,231,000
HC.6.1 Maternal and child care, family planning and counseling
29,546,310 - - - - - - - -
HC.6.2 School health services 145,970 - - - - - - - - HC.6.3 Prevention of communicable
disease 34,522,077 - - - - - - - -
HC 6.4 Prevention of noncommunicable diseases
3,164,089 - - - - - - - -
HC.6.9 All other miscellaneous public health services
- - - - - - - - -
HC.7 Health administration and health insurance
131,386,461 - - - - - - 17,417,578
9,225,896
HC.nsk Not specified by kind - - - - - - - - - HCR.1 Capital formation for health care
provider institutions 67,168,355 - - - - - - - -
Column Total THE 1,024,711,795 - - - 5,910,693 475,195 - 290,765,896 HCR.2 Education & Training - - - - - - - - - HCR.3 Research & Development - - - - - - - - -
HCR.4 Food, hygiene and drinking water control
- - - - - - - - -
HCR.5 Environmental health - - - - - - - - -
HCR.nsk HCR expenditure not specified by kind
324,205,000 - - - - - - - -
Sub total column 324,205,000 - - - - - - - - Column Total NHE 1,348,916,795 - - - 5,910,693 475,195 - 290,765,896
HF as a % of THE 57% 0% 0% 0% 0% 0% 0% 1% 16%*Note, it was not possible to disaggregate spending by insurance schemes at independent labs and diagnostic facilities.
HF.A Public Sector

NAMIBIA NATIONAL HEALTH ACCOUNTS 2001/02-2006/07 80
Financing Agent X Function (HF x HC) – Part 2
HF.3 ROW HF.nsk HF.2.1.2 HF.2.2 HF.2.3. HF.2.4 HF.2.5 HF.3 HF.nsk
Code Function (HC)
Private social insurance (private insurance covered by other
employers - parastatal and private
Private insurance enterprises (other than
social insurance)-- (individual/supplementa
l insurance)
Household Out-of-Pocket
Non profit institutions
(NGOs)
Employers (parastatal and
private)
Rest of World Not specified by any kind
Row Total
HC as a % of THE
HC.1.1 In patient curative care 129,996,835 43,217,115 5,985,752 - 1,233,498 - - 715,166,539 39.5% HC.1.3 Out patient curative care 49,852,004 24,983,193 47,698,652 - 6,911,324 - - 566,871,594 31.3% HC.2 Rehabilitative care - - - - - - - - 0.0% HC.4.1 Clinical lab (independent facilities) - - - - - - - 37,492,700
2.1% HC.4.2 Diagnostic imaging (independent
facilities) - - - - - - - -
0.0% HC.4.3 Patient transport and emergency
rescue 2,121,646 604,929 - - - - - 2,726,575
0.2% HC.5.1 + HC.5.2
Pharmaceuticals and other medical non durables
49,752,589 17,028,282 2,465,198 - 7,743,210 - - 119,492,859 6.6%
HC.6.1 Maternal and child care, family planning and counseling
- - - - - - - 29,546,310 1.6%
HC.6.2 School health services - - - - - - - 145,970 0.0% HC.6.3 Prevention of communicable
disease - - - - - - - 34,522,077
1.9% HC 6.4 Prevention of noncommunicable
diseases - - - - - - - 3,164,089
0.2% HC.6.9 All other miscellaneous public
health services - - - - - - - -
0.0% HC.7 Health administration and health
insurance 33,865,160 13,820,179 - - - 28,268,319 - 233,983,593
12.9% HC.nsk Not specified by kind - - - - 416,162 - - 416,162 0.0% HCR.1 Capital formation for health care
provider institutions - - - - - - - 67,168,355
3.7% Column Total THE 265,588,234 99,653,697 56,149,601 - 16,304,194 28,268,319 - 1,810,696,822
HCR.2 Education & Training - - - - - - - - HCR.3 Research & Development - - - - - - - -
HCR.4 Food, hygiene and drinking water control
- - - - - - - -
HCR.5 Environmental health - - - - - - - -
HCR.nsk HCR expenditure not specified by kind
- - - - - - - 324,205,000
Sub total column - - - - - - - 324,205,000 Column Total NHE 265,588,234 99,653,697 56,149,601 - 16,304,194 28,268,319 - 2,134,901,822
HF as a % of THE 15% 6% 3% 0% 1% 2% 0%
HF.B Non Public Sector

NAMIBIA NHA TABLES 81
NAMIBIA NHA 2001/02 TABLES
Provider X Function (HP x HC) – Part 1
HP.1.1.1+HP.3.4.5 HP.1.1.2 HP.2.2 HP.3.1 + HP.3.2 HP.3.3.1 HP.3.3.2 HP.3.5 HP.3.9.1 HP.3.9.2 HP.4.1
Code Function (HC)
Public and Mission general hospitals and public health
centers
Private for profit general
hospitals
Residential mental retardation, mental
health and substance abuse facilities
Offices of physicians and dentists(private
facilities)
Traditional healers
Community health workers
Medical and diagnostic
laboratories
Ambulance services
Blood banks
Dispensing chemists
HC.1.1 In patient curative care 513,907,709 198,627,670 - 2,593,166 - - - - - - HC.1.3 Out patient curative care 375,087,155 12,265,830 - 179,516,545 - - - - - - HC.2 Rehabilitative care - - - - - - - - - - HC.4.1 Clinical lab (independent
facilities) - - - - - - 33,124,000 - 4,368,700 -
HC.4.2 Diagnostic imaging (independent facilities)
- - - - - - - - - -
HC.4.3 Patient transport and emergency rescue
- - - - - - - 2,726,575 - -
HC.5.1 + HC.5.2 Pharmaceuticals and other medical non durables
- - - 7,743,210 - - - - - 111,749,649
HC.6.1 Maternal and child care, family planning and counseling
912,300 - - - - - - - - -
HC.6.2 School health services - - - - - - - - - - HC.6.3 Prevention of communicable
disease - - - - - - - - - -
HC 6.4 Prevention of noncommunicable diseases
- - - - - - - - - -
HC.6.9 All other miscellaneous public health services
- - - - - - - - - -
HC.7 Health administration and health insurance
- - - - - - - - - -
HC.nsk Not specified by kind - - - - - - - - - - HCR.1 Capital formation for health
care provider institutions 59,809,462 - - - - - - - - -
Column Total-THE 949,716,626 210,893,500 - 189,852,921 - - 33,124,000 2,726,575 4,368,700 111,749,649 HCR.2 Education & TrainingHCR.3 Research & Development
HCR.4 Food, hygiene and drinking water control
HCR.5 Environmental health
HCR.nsk HCR expenditure not specified by kind Column Total-NHE HP as a % of THE 52.5% 11.6% 0.0% 10.5% 0.0% 0.0% 1.8% 0.2% 6.2%*NOTE: Data not sufficient to disaggregate public and Misison hospitals and health centers-- so it is left as an aggregate category.
Provider (HP)

NAMIBIA NATIONAL HEALTH ACCOUNTS 2001/02-2006/07 82
Provider X Function (HP x HC) – Part 2
HP.5 HP.6 HP.7 HP.9 HP.nsk HP.8.2 HP.8.3
Code Function (HC)
Provision and admin of public health
programs
General health administration and insurance
All other industries (schools)
Rest of the world
Providers not
specified by any kind
THE Row Total Education and
training institutions
Other institutions providing
health related services NHE Row Total
HC as a % of THE
HC.1.1 In patient curative care - - - - 37,994 715,166,539 39.5% HC.1.3 Out patient curative care - - - - 2,064 566,871,594 31.3% HC.2 Rehabilitative care - - - - - - 0.0% HC.4.1 Clinical lab (independent
facilities) - - - - - 37,492,700
2.1% HC.4.2 Diagnostic imaging
(independent facilities) - - - - - -
0.0% HC.4.3 Patient transport and
emergency rescue - - - - - 2,726,575
0.2% HC.5.1 + HC.5.2 Pharmaceuticals and other
medical non durables - - - - - 119,492,859
6.6% HC.6.1 Maternal and child care, family
planning and counseling
28,634,010 - - - - 29,546,310
1.6% HC.6.2 School health services 145,970 - - - - 145,970 0.0% HC.6.3 Prevention of communicable
disease
34,522,077 - - - - 34,522,077
1.9% HC 6.4 Prevention of
noncommunicable diseases 3,164,089 - - - - 3,164,089
0.2% HC.6.9 All other miscellaneous public
health services - - - - - -
0.0% HC.7 Health administration and
health insurance
29,176,948 204,806,645 - - - 233,983,593
12.9% HC.nsk Not specified by kind - - - - 416,162 416,162 0.0% HCR.1 Capital formation for health
care provider institutions - 7,358,893 - - - 67,168,355
3.7% Column Total-THE 212,165,538 - - 456,220 1,810,696,822
HCR.2 Education & Training 0 0 - HCR.3 Research & Development 0 0 -
HCR.4 Food, hygiene and drinking water control 0 0
-
HCR.5 Environmental health 0 0 -
HCR.nsk HCR expenditure not specified by kind 324,205,000 0
324,205,000
Column Total-NHE 324,205,000 - 2,134,901,822 HP as a % of THE 5.3% 11.7% 0.0% 0.0% 0.0%