Embed Size (px)
Citation preview
Namibia
Windhoek
key figures• Land area, thousands of km2: 823• Population, thousands (2000): 1 757• GDP per capita, $ (2000): 1 955• Life expectancy (1995-2000): 45.1• Illiteracy rate (2001): 17.3
NAMIBIA 10/01/02 15:13 Page 229

NAMIBIA 10/01/02 15:13 Page 230
African Economic Outlook© OECD/BAD 2002
231
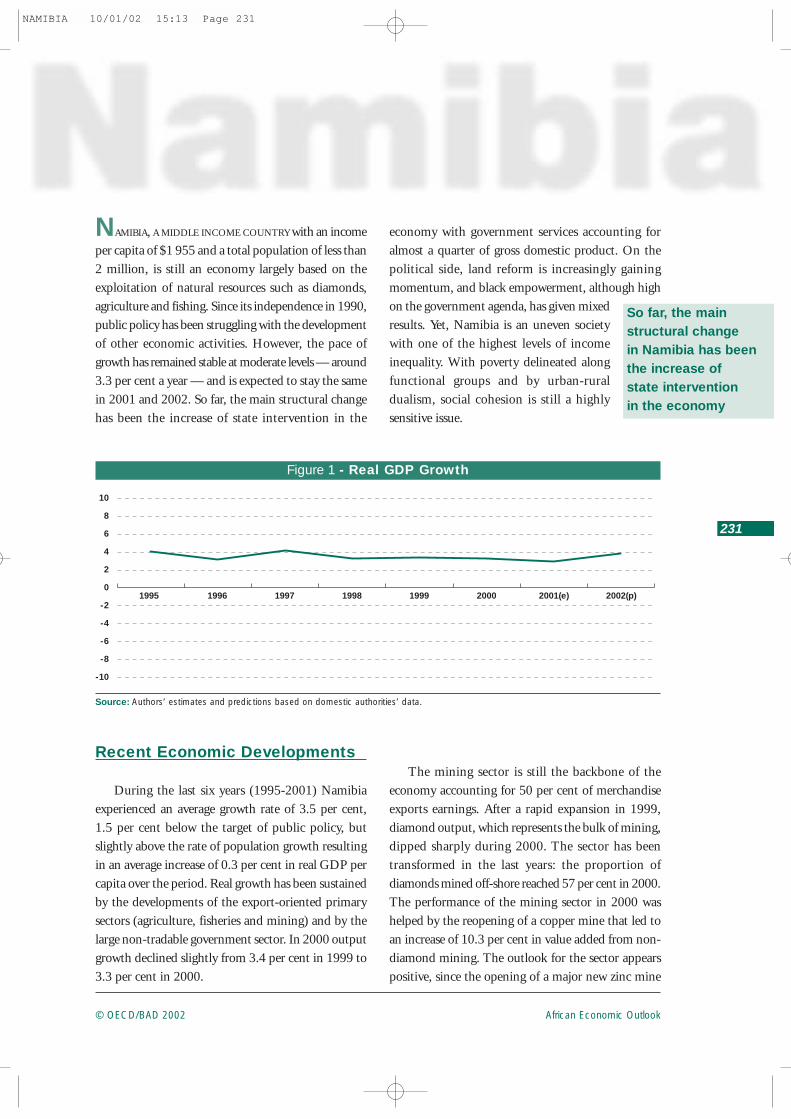
NAMIBIA, A MIDDLE INCOME COUNTRY with an incomeper capita of $1 955 and a total population of less than2 million, is still an economy largely based on theexploitation of natural resources such as diamonds,agriculture and fishing. Since its independence in 1990,public policy has been struggling with the developmentof other economic activities. However, the pace ofgrowth has remained stable at moderate levels — around3.3 per cent a year — and is expected to stay the samein 2001 and 2002. So far, the main structural changehas been the increase of state intervention in the
economy with government services accounting foralmost a quarter of gross domestic product. On thepolitical side, land reform is increasingly gainingmomentum, and black empowerment, although highon the government agenda, has given mixedresults. Yet, Namibia is an uneven societywith one of the highest levels of incomeinequality. With poverty delineated alongfunctional groups and by urban-ruraldualism, social cohesion is still a highlysensitive issue.
So far, the main structural change in Namibia has beenthe increase of state intervention in the economy
1995 1996 1997 1998 1999 2000 2001(e) 2002(p)
-10
-8
-6
-4
-2
0
2
4
6
8
10
Figure 1 - Real GDP Growth
Source: Authors’ estimates and predictions based on domestic authorities’ data.
Recent Economic Developments
During the last six years (1995-2001) Namibiaexperienced an average growth rate of 3.5 per cent,1.5 per cent below the target of public policy, butslightly above the rate of population growth resultingin an average increase of 0.3 per cent in real GDP percapita over the period. Real growth has been sustainedby the developments of the export-oriented primarysectors (agriculture, fisheries and mining) and by thelarge non-tradable government sector. In 2000 outputgrowth declined slightly from 3.4 per cent in 1999 to3.3 per cent in 2000.
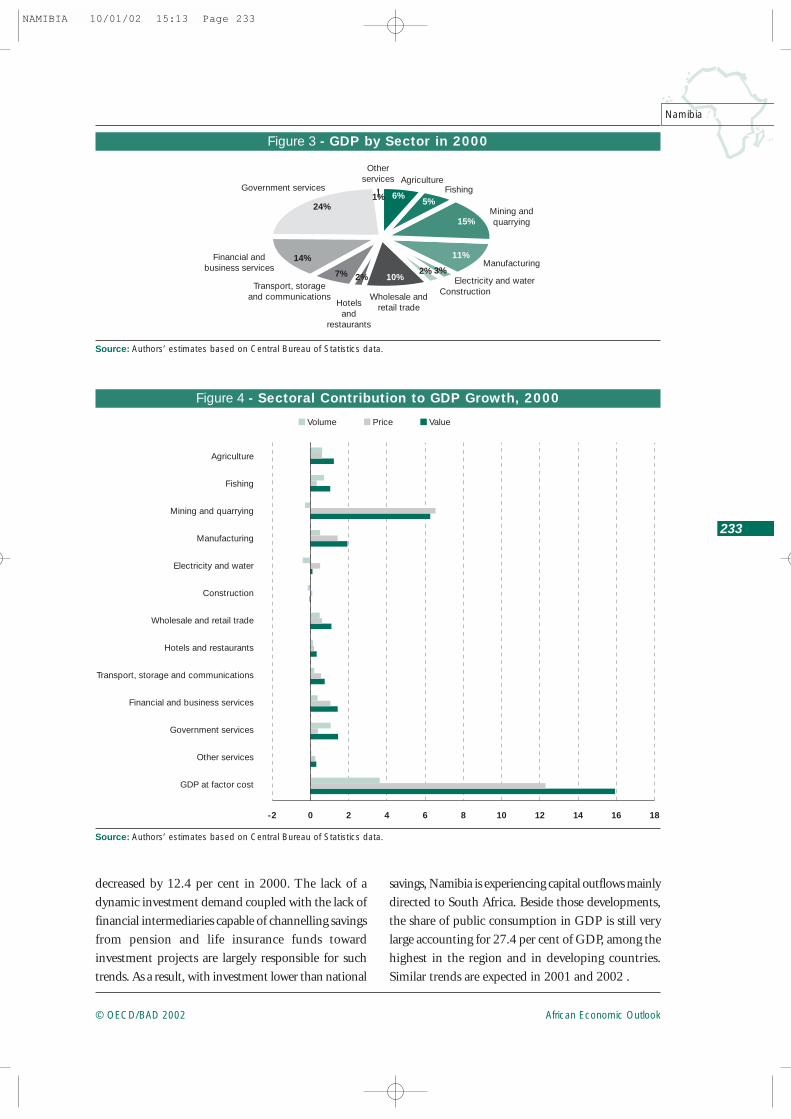
The mining sector is still the backbone of theeconomy accounting for 50 per cent of merchandiseexports earnings. After a rapid expansion in 1999,diamond output, which represents the bulk of mining,dipped sharply during 2000. The sector has beentransformed in the last years: the proportion ofdiamonds mined off-shore reached 57 per cent in 2000.The performance of the mining sector in 2000 washelped by the reopening of a copper mine that led toan increase of 10.3 per cent in value added from non-diamond mining. The outlook for the sector appearspositive, since the opening of a major new zinc mine
NAMIBIA 10/01/02 15:13 Page 231
African Economic Outlook © OECD/BAD 2002
232
Namibia
at the end of 2002 is likely to have an enormous impacton the country’s economic growth.
After a two-year period of decline, the agriculturesector made a significant turnaround in 1999 and2000 registering an average growth rate of 10.7 percent. This good performance was largely the outcomeof the recovery in livestock. However, sectoralperformance remains volatile owing to climaticconditions. The fishing sector, after a poor year in1999, grew by 13.3 per cent in 2000 with white fishperforming especially well.
The role of the government in the economy hascontinuously expanded since independence in 1990:excluding parastatals — for which statistics are notavailable on an aggregated basis — government services
in 2000 accounted for almost a fourth of GDP. In2000 the sector grew by 4.2 per cent, much higherthan the average for the last five years.
The manufacturing industry — a priority forgovernment policy — has not increased significantlyduring the last five years, although in 2000 the sector’soutput increased by 4.5 per cent. Its contribution togrowth is still unstable given that almost 80 per centof the sector is engaged in food-related industries (foodprocessing, fish processing and brewing). However,the good performance of the non-food processing sub-sector was largely the cause of the encouraging growthin 2000.
The structure of domestic demand is changing asa result of declining investment. Indeed, investment
1990 1991 1992 1993 1994 1995 1996 1997 1998 1999 2000
■ Africa ■ Namibia
0
500
1000
1500
2000
2500
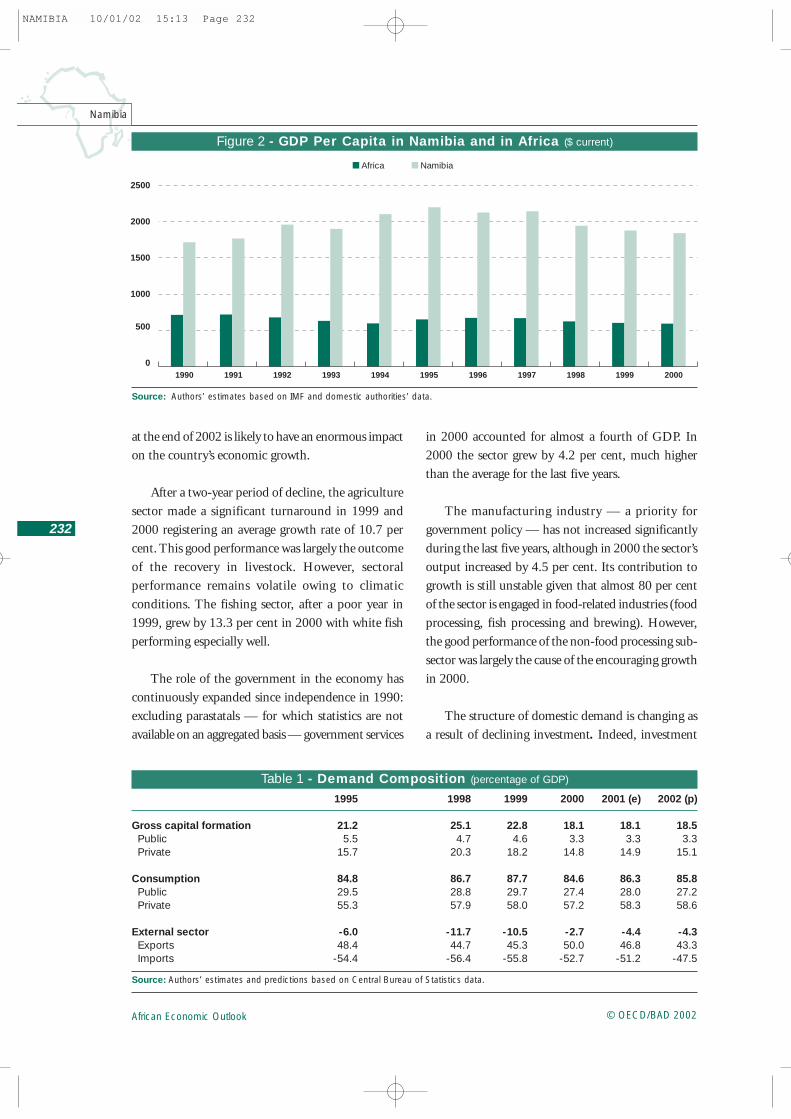
Figure 2 - GDP Per Capita in Namibia and in Africa ($ current)
Source: Authors’ estimates based on IMF and domestic authorities’ data.
Table 1 - Demand Composition (percentage of GDP)
Source: Authors’ estimates and predictions based on Central Bureau of Statistics data.
1995 1998 1999 2000 2001 (e) 2002 (p)
Gross capital formation 21.2 25.1 22.8 18.1 18.1 18.5Public 5.5 4.7 4.6 3.3 3.3 3.3Private 15.7 20.3 18.2 14.8 14.9 15.1
Consumption 84.8 86.7 87.7 84.6 86.3 85.8Public 29.5 28.8 29.7 27.4 28.0 27.2Private 55.3 57.9 58.0 57.2 58.3 58.6
External sector -6.0 -11.7 -10.5 -2.7 -4.4 -4.3Exports 48.4 44.7 45.3 50.0 46.8 43.3Imports -54.4 -56.4 -55.8 -52.7 -51.2 -47.5
NAMIBIA 10/01/02 15:13 Page 232
African Economic Outlook© OECD/BAD 2002
233
Namibia
-2 0 2 4 6 8 10 12 14 16 18
Agriculture
Fishing
Mining and quarrying
Manufacturing
Electricity and water
Construction
Wholesale and retail trade
Hotels and restaurants
Transport, storage and communications
Financial and business services
Government services
Other services
GDP at factor cost
■ Volume ■ Price ■ Value
Figure 4 - Sectoral Contribution to GDP Growth, 2000
Source: Authors’ estimates based on Central Bureau of Statistics data.
Otherservices Agriculture
Fishing
Mining andquarrying
Manufacturing
Electricity and waterConstruction
Wholesale andretail tradeHotels
andrestaurants
Transport, storageand communications
Financial andbusiness services
Government services6%
5%
15%
3%2%
11%
10%2%7%
14%
24%1%
Figure 3 - GDP by Sector in 2000
Source: Authors’ estimates based on Central Bureau of Statistics data.
decreased by 12.4 per cent in 2000. The lack of adynamic investment demand coupled with the lack offinancial intermediaries capable of channelling savingsfrom pension and life insurance funds towardinvestment projects are largely responsible for suchtrends. As a result, with investment lower than national
savings, Namibia is experiencing capital outflows mainlydirected to South Africa. Beside those developments,the share of public consumption in GDP is still verylarge accounting for 27.4 per cent of GDP, among thehighest in the region and in developing countries.Similar trends are expected in 2001 and 2002 .
NAMIBIA 10/01/02 15:13 Page 233
African Economic Outlook © OECD/BAD 2002
234
Namibia
Macroeconomic Policy
Fiscal and Monetary Policies
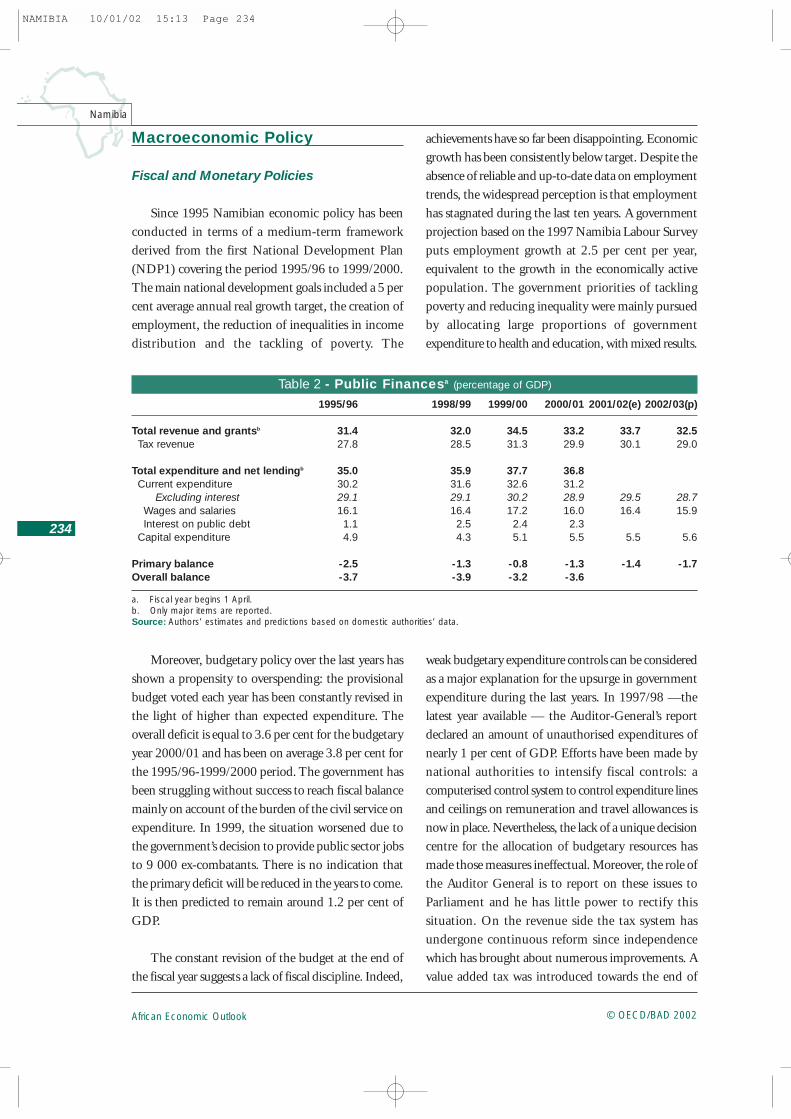
Since 1995 Namibian economic policy has beenconducted in terms of a medium-term frameworkderived from the first National Development Plan(NDP1) covering the period 1995/96 to 1999/2000.The main national development goals included a 5 percent average annual real growth target, the creation ofemployment, the reduction of inequalities in incomedistribution and the tackling of poverty. The
achievements have so far been disappointing. Economicgrowth has been consistently below target. Despite theabsence of reliable and up-to-date data on employmenttrends, the widespread perception is that employmenthas stagnated during the last ten years. A governmentprojection based on the 1997 Namibia Labour Surveyputs employment growth at 2.5 per cent per year,equivalent to the growth in the economically activepopulation. The government priorities of tacklingpoverty and reducing inequality were mainly pursuedby allocating large proportions of governmentexpenditure to health and education, with mixed results.
Table 2 - Public Financesa (percentage of GDP)
a. Fiscal year begins 1 April.b. Only major items are reported.Source: Authors’ estimates and predictions based on domestic authorities’ data.
1995/96 1998/99 1999/00 2000/01 2001/02(e) 2002/03(p)
Total revenue and grantsb 31.4 32.0 34.5 33.2 33.7 32.5Tax revenue 27.8 28.5 31.3 29.9 30.1 29.0
Total expenditure and net lendingb 35.0 35.9 37.7 36.8Current expenditure 30.2 31.6 32.6 31.2
Excluding interest 29.1 29.1 30.2 28.9 29.5 28.7Wages and salaries 16.1 16.4 17.2 16.0 16.4 15.9Interest on public debt 1.1 2.5 2.4 2.3
Capital expenditure 4.9 4.3 5.1 5.5 5.5 5.6
Primary balance -2.5 -1.3 -0.8 -1.3 -1.4 -1.7Overall balance -3.7 -3.9 -3.2 -3.6
Moreover, budgetary policy over the last years hasshown a propensity to overspending: the provisionalbudget voted each year has been constantly revised inthe light of higher than expected expenditure. Theoverall deficit is equal to 3.6 per cent for the budgetaryyear 2000/01 and has been on average 3.8 per cent forthe 1995/96-1999/2000 period. The government hasbeen struggling without success to reach fiscal balancemainly on account of the burden of the civil service onexpenditure. In 1999, the situation worsened due tothe government’s decision to provide public sector jobsto 9 000 ex-combatants. There is no indication thatthe primary deficit will be reduced in the years to come.It is then predicted to remain around 1.2 per cent ofGDP.
The constant revision of the budget at the end ofthe fiscal year suggests a lack of fiscal discipline. Indeed,
weak budgetary expenditure controls can be consideredas a major explanation for the upsurge in governmentexpenditure during the last years. In 1997/98 —thelatest year available — the Auditor-General’s reportdeclared an amount of unauthorised expenditures ofnearly 1 per cent of GDP. Efforts have been made bynational authorities to intensify fiscal controls: acomputerised control system to control expenditure linesand ceilings on remuneration and travel allowances isnow in place. Nevertheless, the lack of a unique decisioncentre for the allocation of budgetary resources hasmade those measures ineffectual. Moreover, the role ofthe Auditor General is to report on these issues toParliament and he has little power to rectify thissituation. On the revenue side the tax system hasundergone continuous reform since independencewhich has brought about numerous improvements. Avalue added tax was introduced towards the end of
NAMIBIA 10/01/02 15:13 Page 234
African Economic Outlook© OECD/BAD 2002
235
Namibia
2000 but it is a little premature to judge how successfulit has been. In his last budget speech the Minister ofFinance announced his intention to conduct acomprehensive study on further tax reform.
Two other trends worthy of note are the rise inpublic spending on defence and the proliferation ofparastatals. Defence spending as a proportion of GDPhas risen significantly since the mid-1990s owing to thecombination of three main factors: the implementationof the 1993 Defence White Paper, the employment ofex-fighters and the military intervention in the DRC.Relative to GDP, defence spending now stands towardsthe higher end of the international spectrum. Thenumber of parastatals has risen as a result of thegovernment’s policy of commercialisation — turningwhat were government departments into SOEs. Whilethe government has talked of its desire to privatisesome of these entities, so far it has stopped short ofaction. Most parastatals remain publicly ownedmonopolies exposed neither to competition nor toprice regulation.
As a consequence of the persistent budget deficit,the government continued to issue public domesticdebt, which stood at a level of 23.5 per cent of GDPin the fiscal year 1999/2000. The annual rate of increase,15 per cent in 1999, raises some concerns for the future:a rough estimate suggests that debt will be around60 per cent of GDP in 2010 if it continues to increaseat this pace. Nevertheless, due to the integration ofNamibia into South Africa’s monetary system, publicdebt is unlikely to crowd out private investment.
Monetary policy is characterised by a fixed exchangerate of the national currency — the Namibia dollar —with the South African rand. Therefore, monetaryconditions and interest rate movements follow closelythose in South Africa. The improved market conditionsand the low level of inflation in South Africa during1999 have led the South African monetary authoritiesto relax their policy throughout 1999 and 2000. Tostimulate investment and economic growth the Bankof Namibia lowered the bank rate from 18.8 inDecember 1998 to 11.5 in December 1999. However,during 2000 the Bank of Namibia decided to keep
interest rates stable in the wake of the pick-up ofinflation.
Inflation increased in 2000 reaching 9.2 per cent,mainly owing to a rise of inflationary pressure fromimported goods. The Namibian inflation rate remainedsignificantly higher than those of its trading partnerswith potentially negative implications on the country’sinternational competitiveness. It should howeverexperience a significant slowdown in the years to comein line with a similar move in South Africa. It is thenexpected to reach 6.0 per cent in 2001 and 5.8 per centin 2002.
External Position
Namibia is an open economy with trade accountingfor more than 100 per cent of gross domestic product.Namibia’s trade is closely linked to South Africa. Theshare of imports from South Africa has increased in thelast years from 80 per cent in 1993 to 95 per cent in1997. The share of exports to South Africa— accounting for 18 per cent of total exports in 1997 —is also remarkable. However, the main market forNamibian exports is the European Union, whichaccounted for 50 per cent of total exports in 1997.
The composition of exports — largely in rawmaterials — has not changed significantly in the lastfive years and Namibia is still highly vulnerable toexternal shocks such as terms of trade changes, externaldemand and climatic variations. Mineral products stillrepresent the bulk of exports. Diamonds in particularaccounted for 70 per cent of mineral exports and35.7 per cent of total exports in 1999. However, thesector remains largely an enclave with few backwardand forward linkages to other economic sectors.Manufactured products — mainly processed fish andmeat preparations — are the second main category ofexports.
The main aim of trade policy in Namibia has beenthe diversification of the export base through variousinvestment packages. The key government policy wasthe establishment in 1995 of the EPZ programme withgenerous tax incentives to attract investors. However,
NAMIBIA 10/01/02 15:13 Page 235
African Economic Outlook © OECD/BAD 2002
236
Namibia
the scheme has yet to fulfil its expectations. So far theassessment of the impact of this strategy has been mixedsince only 18 firms have started operations creating lessthan 500 jobs. This may be about to change with thearrival of a major new manufacturing investment as theannouncement of a new foreign investment in textilesconfirms.
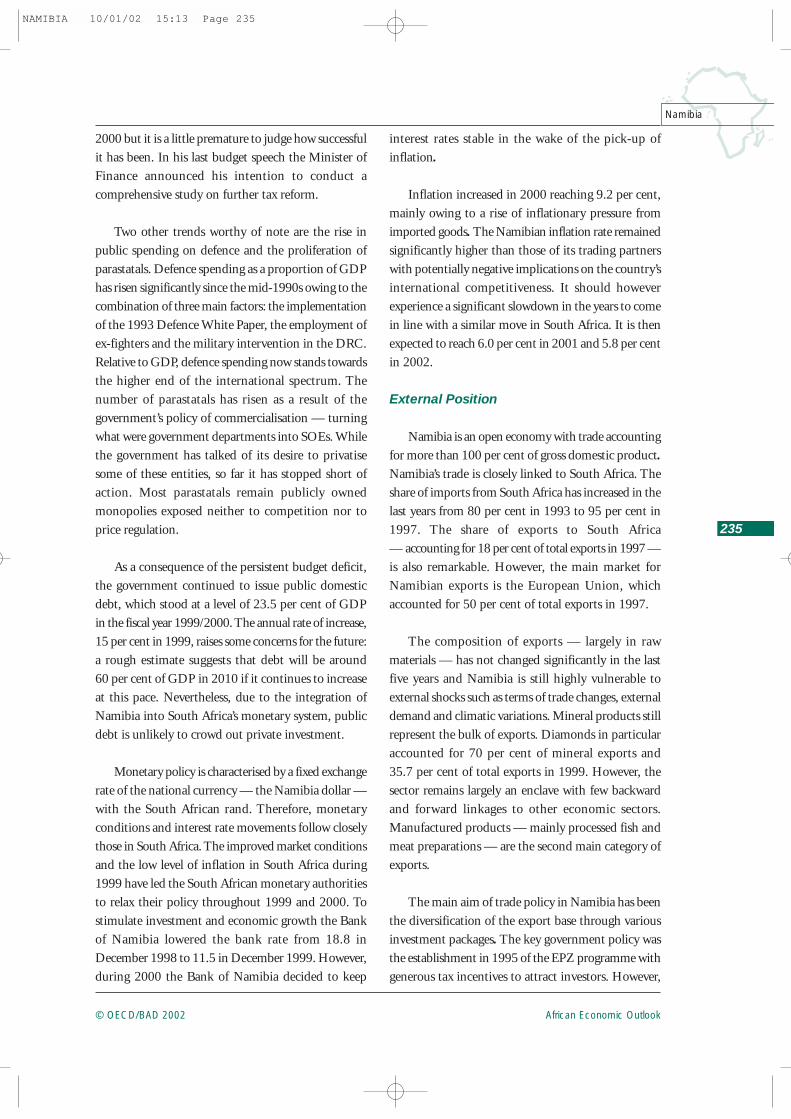
The structure of Namibia’s current account in thelast five years has been characterised by a negative tradebalance coupled with sizeable transfers from the SACUrevenue pool. However, in the last two years the tradebalance deficit narrowed owing to an acceleration ofexports, mainly primary commodities such as diamondsand beef. In the short run, the trade balance is expected
to remain stable around –4 per cent of GDP. Theincreased exports in the diamond sector — equal to35.4 per cent in 2000 — are the result of an increaseof international prices, which outweighed the 7 per centloss in real term of the sector. Agriculture exportsbenefited particularly from an increase of beef exportsto the European Union. The other key-exportingsector — manufacturing — contributed to this higherpath even if the expansion was at a lower pace. Amongthe manufactured products, fish-processing has displayedthe highest growth. SACU receipts — 86 per cent(1999 data from Central Bureau of Statistics) of thecurrent transfers — are the main contributors to thesurplus of the current account and in 2000 increasedby 28.4 per cent compared with an increase of 24.1 per
Table 3 - Current Account (percentage of GDP)
Source: Authors’ estimates and predictions based on Central Bureau of Statistics data.
1995 1998 1999 2000 2001 (e) 2002 (p)
Trade balance -3.6 -8.2 -3.8 -4.1 -4.0 -3.8Exports of goods (f.o.b.) 39.6 34.5 39.8 42.4 41.1 38.0Imports of goods (f.o.b.) -43.2 -42.6 -43.6 -46.4 -45.1 -41.9
Services balance -6.7 -4.5 -3.9 -3.3Factor income 4.5 2.6 -0.5 -0.3Current transfers 11.4 12.5 11.8 13.3
Current account balance 5.6 2.4 3.6 5.7
199519941993199219911990 1996 1997 1998 1999 20000
2
4
6
8
10
12
14
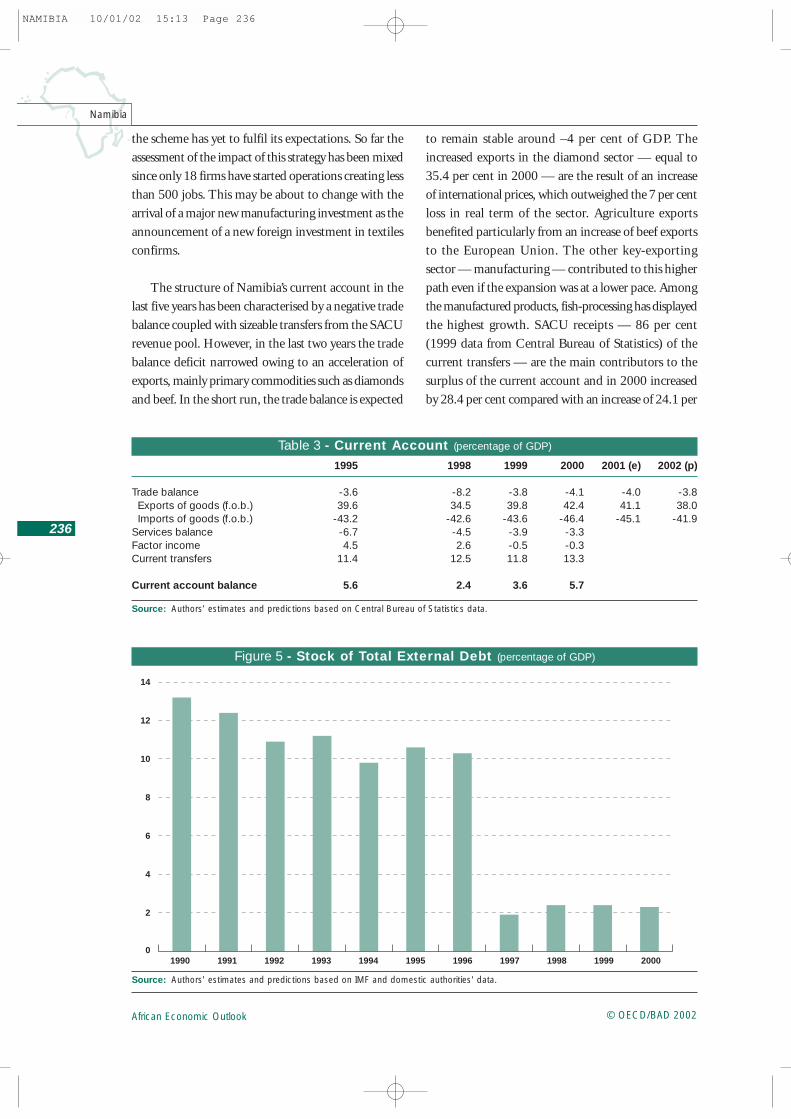
Figure 5 - Stock of Total External Debt (percentage of GDP)
Source: Authors’ estimates and predictions based on IMF and domestic authorities' data.
NAMIBIA 10/01/02 15:13 Page 236

African Economic Outlook© OECD/BAD 2002
237
Namibia
cent in 1999. The planned revision of the SACU sharingformula for 2002 highlights the need to change thestructure of the current account through an expansionof alternative sources of revenues. Moreover, furthertrade liberalisation in line with WTO obligations andthe EU-South Africa agreement1, together with theratification of the SADC protocol, will have additionalnegative effects on SACU revenues.
The level of Namibia’s external debt is low comparedto other SSA or low middle income countries. In 1997South Africa wrote off Namibia’s external debt to SouthAfrica slashing Namibia’s stock of external debt to a mere2 per cent of GDP. Although the external debt is stillmanageable and low compared with the GDP, its rateof increase contributes to the steady expansion of totalpublic debt.
Structural Issues
The structure of Namibia’s economy is still highlycharacterised by the legacy of colonial status of SouthAfrica until the late 1980s. Indeed, Namibia displaysdeveloped basic and modern infrastructure with goodtransport and financial systems, while its economy isstill characterised by an uneven distribution of resources.Mobilising the available resources for creating newactivities that would improve income distributionproves to be difficult.
Namibian transport infrastructure is fairly developedand does not represent a bottleneck for economicexpansion. A well-maintained road network has beenfurther improved with the construction of two majorhighways, the Trans Caprivi and Trans KalahariHighways. The Namibian Ports Authority (Namport)has initiated several large development projects topromote greater usage of Walvis Bay as a regional hubport. Upgrading of the port facilities has started andthe Coast-2-Coast Spatial Development Initiative (SDI,see South Africa country note) — at an early stage —will generate regional co-operation between Maputo
and Walvis Bay. The ability to stimulate new industrialactivity through these infrastructure developments ishowever still uncertain.
The Namibian financial sector is fairly welldeveloped compared with other sub-Saharan countriesand it is closely linked to South Africa. The bankingsystem started to grow in 1993, and registered anannual increase in total assets of 38 per cent between1994 and 1996 following the steady opening of theSouth African economy in 1994. The BankingInstitutions Act came into force in 1998 as the legalframework for the development of effective bankingsupervision. The Bank of Namibia has been given newpowers in line with international banking andsupervisory standards.
The Namibian Stock Exchange (NSX) has becomethe second largest stock exchange in sub-Saharan Africain terms of market capitalisation after the JohannesburgStock Exchange thanks to the many dual-listedcompanies on the exchange. Like the financial sector,the stock market is closely related to South Africa:South African stock represented 98 per cent of totalcapitalisation in 1999.
There is a widespread perception that the Namibianfinancial sector lacks institutions that can effectively lendto longer-term and higher risk projects. Publicly-owneddevelopment finance institutions are considered tohave failed, partly because they are subject to politicalinfluence. Government is now reacting to this situationby creating a new institution — the NamibiaDevelopment Bank (NDB) — in place of existingDevelopment Finance Institutions. At this stage thereare some signs that government is learning from itsprevious experiences with development lending andthe intention is to bring in majority non-governmentshareholders. The central problem remains to encouragethe private sector to enter the market through thecreation of innovative vehicles such as private equityand venture capital funds appropriate to Namibianrequirements. Until this happens the government will
1. South Africa will eliminate tariffs for 86 per cent of EU imports to South Africa in the next 12 years, with about three-quarters within the
next three years.
NAMIBIA 10/01/02 15:13 Page 237
African Economic Outlook © OECD/BAD 2002
238
Namibia
continue to try to play a role for which it will alwaysbe unsuited.
There are signs that the government’s ratherpiecemeal approach to changing patterns of ownershipand management in the Namibian economy in favourof the black majority is beginning to harden. Increasingly,the government is using its power to allocate rights ofexploitation over natural resources, outsourcing andcommercialisation to accelerate the process of blackeconomic empowerment, with mixed results. Opinionsare divided over how transparent and competitive theseinitiatives have been and whether they have been pursuedin a way that does not discourage foreign investmentor jeopardise longer-term growth. There is little doubt,however, that this process is set to continue althoughthere is no sign at present that it will take place withina clear and explicit policy framework.
The need for land reform is mounting after theupheaval over the land issue in Zimbabwe and sinceagriculture employs nearly 50 per cent of the labourforce. Land in Namibia is held 52 per cent underfreehold title while the remaining 48 per cent iscommunally held. Land is unequally distributed since4 300 farmers, mainly white, own the commercialland, compared with 140 000 families, almost half ofthe population, living in the communal areas.Nevertheless, it should be noted that the commercialland, located in the south and in the centre of thecountry, is mainly of poorer quality compared withcommunal land. The land reform debate is focused onresettlement on commercial land, and on the allocationof individual rights and the establishment of an effectiveadministration in the communal areas. As a result ofa market-based policy pursued by the government,redistribution of commercial land has evolved at aslow pace. By mid-2000 only 300 black farmers hadbeen able to purchase commercial land, and thegovernment had purchased 0.6 per cent of land. Whitefarmers are seen by many as deliberately slowing theprocess of reform and demanding high prices for landbought by the government. Although the SWAPOsecretary-general has warned white commercial farmersthat the government’s patience was running out, andpressure has arisen from subsistence farmers asking
for an acceleration of land redistribution, it is unlikelythat land disputes in Zimbabwe will spread intoNamibia.
Political and Social Context
Namibia enjoys political stability and a multi-partysystem is in place. In the 1999 national elections thedominance of South West Africa Peoples’ Organisation(SWAPO), which has been the ruling party sinceindependence in 1990, was confirmed. SWAPO won76 per cent of the vote and President Nujoma, leaderof SWAPO, was re-elected for a third presidential termafter the amendment of the Constitution allowed himto stand for a third electoral term. The fragmentedopposition does not represent a serious threat toSWAPO. Moreover, a problem of governmentaccountability could potentially arise since the numberof cabinet ministers, all MPs, represents a majority inthe Parliament itself.
Since August 1998 Namibia has been engaged inthe military conflict in the DRC in support of thegovernment, and by mid-1999 an estimated 2 000Namibian troops had been sent to the DRC. Theongoing military involvement has given rise tointernational criticism, and on the domestic front acertain amount of criticism in the press and inParliament. With the peace process now in motion,almost all Namibian troops have now returned accordingto official sources.
Namibia is characterised by one of the highest levelsof income inequality in the world. According to the1998 National Human Development Report, Namibiahas a Gini index of 0.70 for 1993/94, the highestrecorded anywhere. A two-tier dualistic society clearlyreflects the social and economic inequalities. Povertyis delineated along functional groups and by the urban-rural dualism. Wages and salaries received by urbanemployees are almost two-and-a-half times those inrural areas, reflecting the stark urban-rural inequalities.Differences within functional groups are exemplifiedby commercial farmers with incomes eight times higherthan those of subsistence farmers.
NAMIBIA 10/01/02 15:13 Page 238
African Economic Outlook© OECD/BAD 2002
239
Namibia
Namibia’s development is hampered by a scarcityof skilled labour. Despite major efforts to increase themanufacturing base through various policies, skillshortages remain an issue in Namibia. Ten per cent ofall positions are not occupied by people with the rightskills or remain unfilled. In the medium to long term,efforts to increase educational attainment shouldcontinue to be a priority. Despite the high share ofexpenditure on education — at 27.5 per cent of totalgovernment expenditure in 1999 — the net enrolmentratio decrease from 91.5 per cent to 45.5 per centbetween primary and secondary levels and efficiencyremains limited. Indeed, several issues are hamperingthe efficiency of the educational system: as an inheritanceof the pre-independence period the northern regionsperform badly since teachers are not adequately trained,the pupil-teacher ratio is much higher compared withthe central and southern regions, and the infrastructurein the north much less developed.
Since the first victim was identified in 1986,HIV/AIDS has become the most serious problem for
Namibian society. Namibia has one of the highest ratesof infection in the world with 19.5 per cent of adults(defined as 15-49 year-olds) carrying the disease, asreported in the 1999 UNAIDS Report. Moreover, in1999 AIDS claimed the lives of 1 per cent of thepopulation, becoming the principal cause of death.Life expectancy at birth declined from 61 years in 1991to 45 years in 1998 and is projected to reach a low of40 years by 2005. Aside from the human aspects, theeconomic and social costs of the epidemic are massive.Direct health expenditures on HIV/AIDS have risenfrom 1.8 per cent of government spending in 1996 to2.5 per cent of GDP in 2000 accounting for 20 percent of the health budget. Hospitalisation of infectedpeople increased 20-fold between 1993 and 1999.According to a recent World Bank study, HIV/AIDSwill reduce real GDP growth by 1.1 percentage pointin the period 2002-2010 (from an average rate ofgrowth of 4.1 per cent without HIV/AIDS to an averagerate of growth of 3 per cent with HIV/AIDS).
NAMIBIA 10/01/02 15:13 Page 239

.
NAMIBIA 10/01/02 15:13 Page 240