Embed Size (px)
Citation preview
Fluorescence Enhancement in HotSpots of AFM-Designed GoldNanoparticle SandwichesAlpan Bek, † Reiner Jansen, Moritz Ringler, Sergiy Mayilo, Thomas A. Klar,* ,‡ andJochen Feldmann*
Photonics and Optoelectronics Group, Physics Department and CENS,Ludwig-Maximilians-UniVersitat Munchen, Amalienstrasse 54,80799 Munich, Germany
Received October 9, 2007; Revised Manuscript Received November 26, 2007
ABSTRACT
We observe an enhancement of fluorescence from a single fluorescent sphere, which is sandwiched between two individual gold nanoparticles,forming a hot spot of strong field enhancement. The fluorescence enhancing hot spot is custom-designed by the deliberate assembly of goldnanoparticles with an atomic force microscope cantilever. The fluorescence intensity is monitored while the separation between the two goldnanoparticles is reduced by gradually pushing the gold nanoparticles closer to the fluorescent sphere. The fluorescence enhancement ismaximal when the distance between the two gold nanoparticles is smallest, when the excitation polarization is parallel to the axis of thesandwich, and when the fluorescent sphere is positioned exactly on the axis connecting the two gold nanoparticles.
Spontaneous emission of fluorescence can be modified bythe resonant coupling of fluorescent molecules to the externalelectromagnetic environment.1 Many devices based on modi-fied spontaneous emission have been demonstrated withinthe past decade.2,3 Resonant cavities,4 whispering galleries,5
photonic crystals,6 planar metal surfaces7,8 or metallicnanoparticles9-12 are examples of devices that modify theelectromagnetic environment. Rough metal film surfaces areobserved to enhance Raman scattering,13-18 resonant Ramanscattering,15 and fluorescence from adsorbed molecules.19,20
Single metal nanoparticles have been reported to decisivelyinfluence Raman scattering and fluorescence, as well.9-12,17
To bridge these two extremes of single nanoparticles andrough films, it is of utmost importance for the understandingof so-called hot spot effects to study simple aggregates ofnoble metal nanoparticles. The simplest system in which fieldenhancement effects can be studied is the nanoparticledimer.21 The enhancement of Raman scattering in the centerof noble metal nanoparticle dimers has been investigated.22-26
Much less is known about the fluorescence of moleculesbetween two noble metal nanoparticles. Only very recently,reports addressed this question and fluorescence enhancementwas found when semiconductor nanocrystals or fluorophoresare placed between two metal nano-objects.27-29 The pairednano-objects were a bowtie antenna fabricated by e-beam
lithography30 or focused ion beam milling,27 rod-like nanoan-tennas fabricated by e-beam lithography,28 or pairs of goldnanoparticles tethered together with DNA of a certainlength.29 With all these techniques, a survey about how thefluorescence enhancement depends on the distance of thetwo metal nano-objects is in principle possible, but it wouldrequire a time-consuming sample preparation for eachspecific distance, and the fluorescing object would not beidentical on each sample.
In contrast to the previously mentioned approaches to formsandwiches of metal nanoparticles, we present targetedfabrication of hot spots by organizing the spatial configu-ration of plasmonic nanoparticles around a nanosized,spherical, fluorescent bead using atomic force microscopy(AFM) manipulation.31,32 When a single gold nanoparticle(AuNP) is approached to a fluorescent sphere (FS), thefluorescence decreases by 30% up to a AuNP-FS separationof 90 nm. For an even closer approach, the fluorescenceincreases to 150% of the original value. Upon the approachof the second gold nanoparticle, the fluorescence increasesfurther to 270%, which is more than the sum of the effectsof the two noninteracting AuNPs. Our AFM manipulationalso allows us to conveniently design geometries other thanthe straight AuNP-FS-AuNP sandwich. If, however, theFS is not placed right in line with the connecting axis of thetwo AuNPs, the fluorescence enhancement is weakened,which proves that the hot spot is formed right between thetwo AuNPs.
* Corresponding authors. E-mail: [email protected],[email protected].
† Present address: CBM, AREA Science Park, Trieste, Italy.‡ Present address: Dept. of Physics, TU Ilmenau, Germany.
NANOLETTERS
2008Vol. 8, No. 2
485-490
10.1021/nl072602n CCC: $40.75 © 2008 American Chemical SocietyPublished on Web 01/04/2008
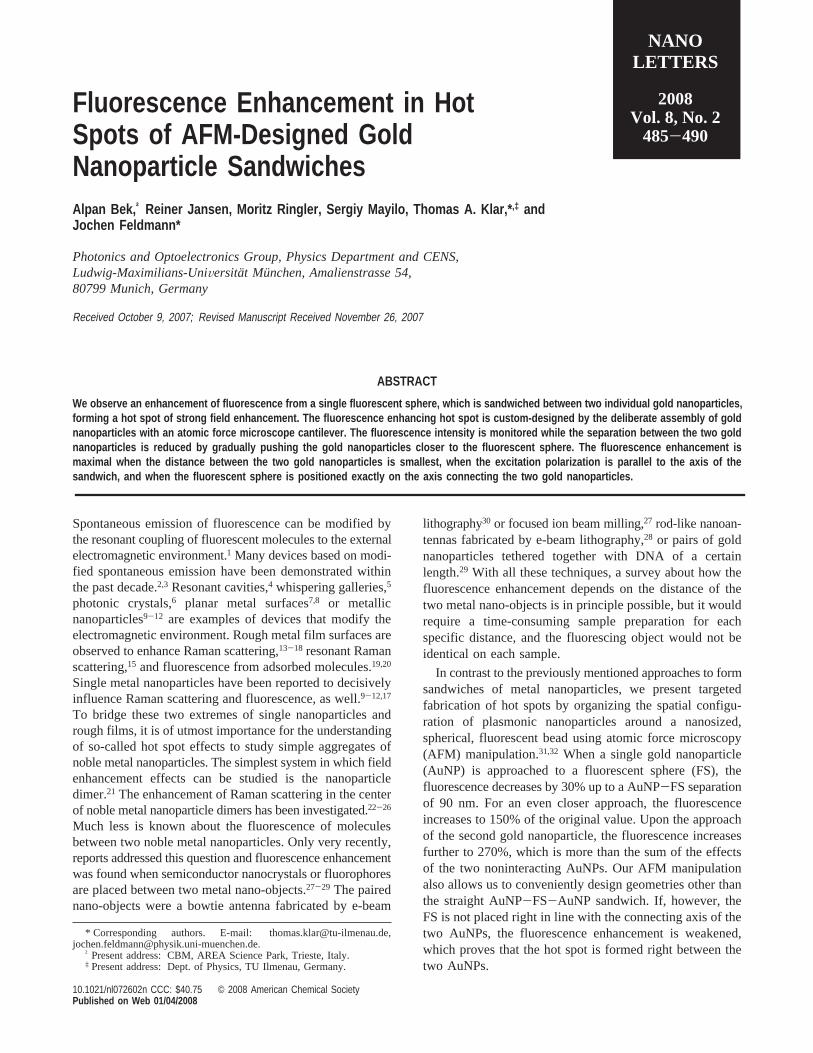
The in situ manipulation of the AuNPs and the detectionof the fluorescence is realized by an AFM (jpk Instruments)placed on top of an inverted optical microscope (Zeiss)(Figure 1a).33 In addition to the three closed-loop, piezo-driven axes of the AFM, a two-axis, closed-loop, piezo-driven sample stage is employed. The two lateral scan axesof the AFM head are used to confocalize the AFM tip withthe focus of the inverted microscope, while the two-axessample stage and the vertical feedback piezo of the AFMhead are used to perform AFM imaging (in tapping mode)and to laterally push gold nanoparticles lying on the substrate(in contact mode). The beam of an unpolarized laser (532nm) is expanded and directed into the side port of themicroscope. The beam overilluminates the 100×, 1.45 NAoil immersion lens that focuses the laser beam to a diffractionlimited spot of ∼200 nm diameter. The back-scatteredfluorescence is long-pass-filtered, confocalized by a pinhole,and detected by an avalanche photodiode detector (APD,EG&G). The APD signal is fed into an auxiliary inputchannel of the AFM electronics.
Fluorescent polystyrene beads (40 nm) (FluoSpheres,Invitrogen) and 60 nm Au nanoparticles (BBI) are subse-quently spread on a clean microscope cover slip by spin-coating and drop-casting methods, respectively. The 40 nmFSs contain∼350 orange fluorophores (Invitrogen, CatalogNo. F8792) with a quantum efficiency near unity (measuredto be 98%). The final surface coverage is in the range of0.1-0.5 particles/µm2 and 0.5-5.0 particles/µm2 for the FSsand AuNPs, respectively. The excitation and emission spectraof the 40 nm FS are shown in Figure 1b, lower panel. Thelaser wavelength of 532 nm (green vertical line) coincideswith the absorption band of the fluorophore. The emissionband of the fluorophore is centered around 560 nm at thepeak maximum and extends to 650 nm. The extinction
spectrum of an aqueous solution of 60 nm AuNPs (Figure1b, upper panel) shows that the plasmon resonance bandoverlaps well with the emission spectrum of the fluorophoreand the excitation wavelength. The sample surface is purgedwith a minute amount of nitrogen during the fluorescencemeasurement to avoid photo-oxidative bleaching effects onthe fluorophores by ambient oxygen.
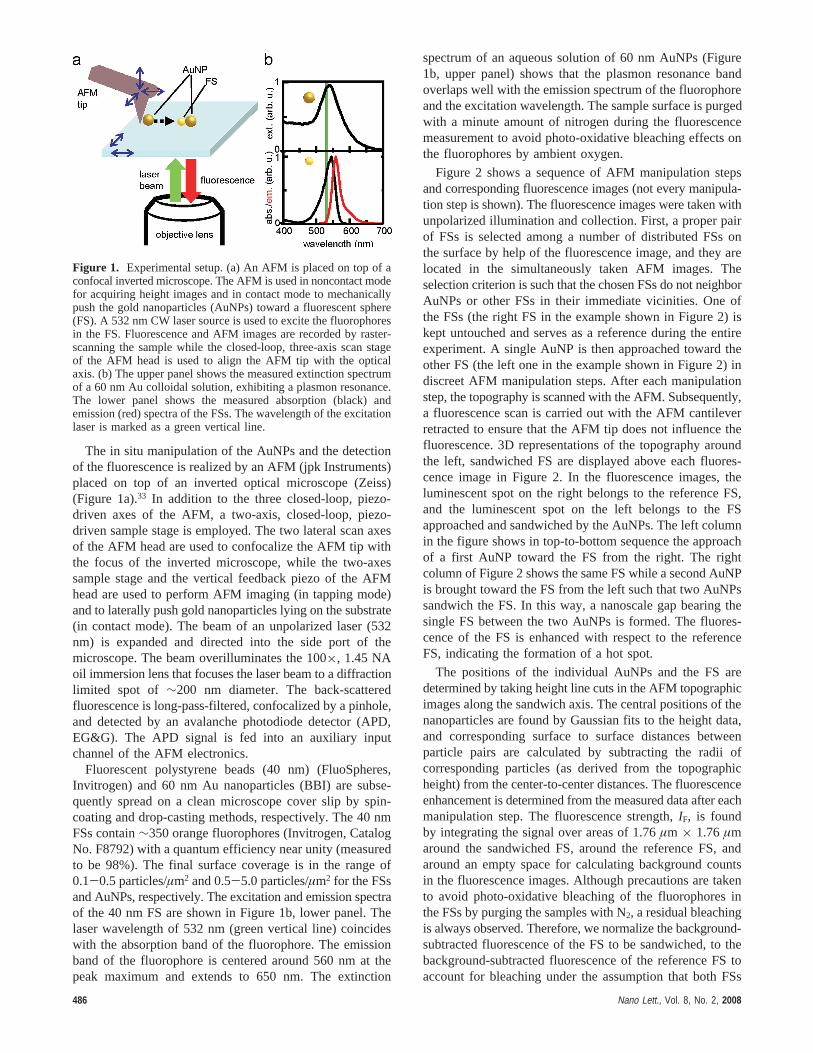
Figure 2 shows a sequence of AFM manipulation stepsand corresponding fluorescence images (not every manipula-tion step is shown). The fluorescence images were taken withunpolarized illumination and collection. First, a proper pairof FSs is selected among a number of distributed FSs onthe surface by help of the fluorescence image, and they arelocated in the simultaneously taken AFM images. Theselection criterion is such that the chosen FSs do not neighborAuNPs or other FSs in their immediate vicinities. One ofthe FSs (the right FS in the example shown in Figure 2) iskept untouched and serves as a reference during the entireexperiment. A single AuNP is then approached toward theother FS (the left one in the example shown in Figure 2) indiscreet AFM manipulation steps. After each manipulationstep, the topography is scanned with the AFM. Subsequently,a fluorescence scan is carried out with the AFM cantileverretracted to ensure that the AFM tip does not influence thefluorescence. 3D representations of the topography aroundthe left, sandwiched FS are displayed above each fluores-cence image in Figure 2. In the fluorescence images, theluminescent spot on the right belongs to the reference FS,and the luminescent spot on the left belongs to the FSapproached and sandwiched by the AuNPs. The left columnin the figure shows in top-to-bottom sequence the approachof a first AuNP toward the FS from the right. The rightcolumn of Figure 2 shows the same FS while a second AuNPis brought toward the FS from the left such that two AuNPssandwich the FS. In this way, a nanoscale gap bearing thesingle FS between the two AuNPs is formed. The fluores-cence of the FS is enhanced with respect to the referenceFS, indicating the formation of a hot spot.
The positions of the individual AuNPs and the FS aredetermined by taking height line cuts in the AFM topographicimages along the sandwich axis. The central positions of thenanoparticles are found by Gaussian fits to the height data,and corresponding surface to surface distances betweenparticle pairs are calculated by subtracting the radii ofcorresponding particles (as derived from the topographicheight) from the center-to-center distances. The fluorescenceenhancement is determined from the measured data after eachmanipulation step. The fluorescence strength,IF, is foundby integrating the signal over areas of 1.76µm × 1.76µmaround the sandwiched FS, around the reference FS, andaround an empty space for calculating background countsin the fluorescence images. Although precautions are takento avoid photo-oxidative bleaching of the fluorophores inthe FSs by purging the samples with N2, a residual bleachingis always observed. Therefore, we normalize the background-subtracted fluorescence of the FS to be sandwiched, to thebackground-subtracted fluorescence of the reference FS toaccount for bleaching under the assumption that both FSs
Figure 1. Experimental setup. (a) An AFM is placed on top of aconfocal inverted microscope. The AFM is used in noncontact modefor acquiring height images and in contact mode to mechanicallypush the gold nanoparticles (AuNPs) toward a fluorescent sphere(FS). A 532 nm CW laser source is used to excite the fluorophoresin the FS. Fluorescence and AFM images are recorded by raster-scanning the sample while the closed-loop, three-axis scan stageof the AFM head is used to align the AFM tip with the opticalaxis. (b) The upper panel shows the measured extinction spectrumof a 60 nm Au colloidal solution, exhibiting a plasmon resonance.The lower panel shows the measured absorption (black) andemission (red) spectra of the FSs. The wavelength of the excitationlaser is marked as a green vertical line.
486 Nano Lett., Vol. 8, No. 2, 2008
bleach at the same rate. The integrated fluorescence strengthIF is then divided by the initial fluorescence strengthIF
0
taken before the first AuNP has been approached. Theresulting quantityIF/IF
0 is called the normalized fluores-cence enhancement.
Figure 3a shows the dependence of the normalizedfluorescence enhancement on the AuNP-FS separation. Theplot is divided into left and right parts by a vertical, dashedline. The left side of the plot shows the fluorescenceenhancement as a function of the interparticle distance,d1,during the approach of the first AuNP (see upper left sketchin the figure). During this approach, the fluorescence intensityinitially decreases by 30% and reaches a minimum at aAuNP-FS distance of∼90 nm. When the AuNP is ap-proached even further, the fluorescence signal rises again,finally reaching 150% of the signal without AuNP (Figure3a, left part). This dependence of the fluorescence enhance-ment on the single AuNP approach is similar to previousreports.10,11 The right side of Figure 3a shows the fluores-cence intensity as a function of the surface-to-surfacedistance,d2, between two AuNPs as a second AuNP isapproached from the opposite side, establishing thereby aAuNP-FS-AuNP sandwich (see upper right sketch in thefigure). The fluorescence enhancement reaches a value of2.72 (Figure 3a, right part), which is more than the simpleproduct of two times the effect of a single AuNP (1.52 )2.25< 2.72). This indicates a hot spot effect, although thetwo AuNPs are still 40 nm apart, which is subideal for theformation of a strong hot spot. Nevertheless, the cooperativeeffect of two nanoparticles enhances the fluorescence morestrongly than expected by two noninteracting AuNPs. Arecent theoretical survey also found hot spot effects at AuNPswith larger separation.34
In a next series of experiments, we deliberately stoppedthe approach of the first AuNP at a distance of∼(40 ( 10)nm; that is, at a distance, where the first AuNP quenchesthe fluorescence of the FS by 30% (Figure 3b). However,the subsequently approached second AuNP provokes anincrease in the fluorescence intensity up to 2.15. This is lessthan in the case of the symmetrically assembled sandwich(2.72, right part of Figure 3a) but substantially more than afactor of 1.5 which is the maximum that can be achievedwith a single fully approached AuNP (Figure 3a, left part).This is a remarkable result, because sandwiches consistingof a fully approached AuNP (which alone would increasethe fluorescence by a factor of 1.5) and a AuNP separatedby (40( 10) nm from the FS (which alone would result ina fluorescence quenching of 30%) show a net effect of afluorescence increase by a factor of 2.15.
We have performed two further experiments that provideproof that the fluorescence enhancement is facilitated by thefield enhancement in the center of the hot spot. First, weinvestigated the importance of the straight lineup of the threespheres. Figure 4a shows fluorescence intensities obtainedfrom two different geometries. First, the geometry where allthree particles are strictly lined up on a straight line, andsecond, a geometry where the FS is not on the lineconnecting the two AuNPs. The two upper insets show theAFM topographical images, and the two lower insets showthe corresponding fluorescence images. The exact positionsof the AuNPs and the FS are indicated by solid black dotsand asterisks, respectively. The axis connecting the twoAuNP centers is also indicated. In the case shown by theleft insets, the FS is sandwiched straight between the twoAuNPs, which leads to a strong fluorescence enhancement.The main graph of Figure 4a shows a line cut through the
Figure 2. Series of manipulation steps. 3D AFM images of the sandwiched FS are displayed above each fluorescence image. In thefluorescence images, the luminescent spot on the right belongs to the reference FS, and the luminescent spot on the left belongs to theapproached and sandwiched FS. The left column in the figure shows in top-to-bottom sequence the approach of a first AuNP toward theFS from the right; the right column shows the same FS as a second AuNP is brought toward the FS from the left such that two AuNPssandwich the FS. When the sandwich is fully formed (in the last manipulation step), the fluorescence of the FS is substantially enhancedas compared to the reference FS.
Nano Lett., Vol. 8, No. 2, 2008 487
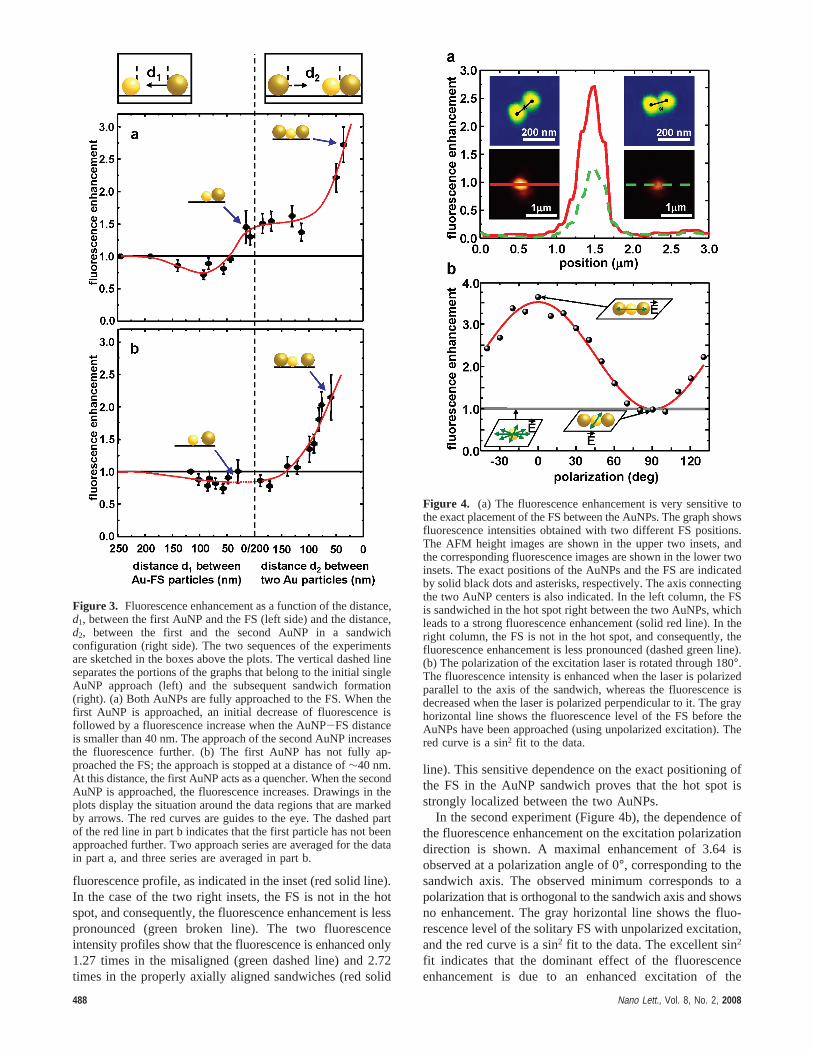
fluorescence profile, as indicated in the inset (red solid line).In the case of the two right insets, the FS is not in the hotspot, and consequently, the fluorescence enhancement is lesspronounced (green broken line). The two fluorescenceintensity profiles show that the fluorescence is enhanced only1.27 times in the misaligned (green dashed line) and 2.72times in the properly axially aligned sandwiches (red solid
line). This sensitive dependence on the exact positioning ofthe FS in the AuNP sandwich proves that the hot spot isstrongly localized between the two AuNPs.
In the second experiment (Figure 4b), the dependence ofthe fluorescence enhancement on the excitation polarizationdirection is shown. A maximal enhancement of 3.64 isobserved at a polarization angle of 0°, corresponding to thesandwich axis. The observed minimum corresponds to apolarization that is orthogonal to the sandwich axis and showsno enhancement. The gray horizontal line shows the fluo-rescence level of the solitary FS with unpolarized excitation,and the red curve is a sin2 fit to the data. The excellent sin2
fit indicates that the dominant effect of the fluorescenceenhancement is due to an enhanced excitation of the
Figure 3. Fluorescence enhancement as a function of the distance,d1, between the first AuNP and the FS (left side) and the distance,d2, between the first and the second AuNP in a sandwichconfiguration (right side). The two sequences of the experimentsare sketched in the boxes above the plots. The vertical dashed lineseparates the portions of the graphs that belong to the initial singleAuNP approach (left) and the subsequent sandwich formation(right). (a) Both AuNPs are fully approached to the FS. When thefirst AuNP is approached, an initial decrease of fluorescence isfollowed by a fluorescence increase when the AuNP-FS distanceis smaller than 40 nm. The approach of the second AuNP increasesthe fluorescence further. (b) The first AuNP has not fully ap-proached the FS; the approach is stopped at a distance of∼40 nm.At this distance, the first AuNP acts as a quencher. When the secondAuNP is approached, the fluorescence increases. Drawings in theplots display the situation around the data regions that are markedby arrows. The red curves are guides to the eye. The dashed partof the red line in part b indicates that the first particle has not beenapproached further. Two approach series are averaged for the datain part a, and three series are averaged in part b.
Figure 4. (a) The fluorescence enhancement is very sensitive tothe exact placement of the FS between the AuNPs. The graph showsfluorescence intensities obtained with two different FS positions.The AFM height images are shown in the upper two insets, andthe corresponding fluorescence images are shown in the lower twoinsets. The exact positions of the AuNPs and the FS are indicatedby solid black dots and asterisks, respectively. The axis connectingthe two AuNP centers is also indicated. In the left column, the FSis sandwiched in the hot spot right between the two AuNPs, whichleads to a strong fluorescence enhancement (solid red line). In theright column, the FS is not in the hot spot, and consequently, thefluorescence enhancement is less pronounced (dashed green line).(b) The polarization of the excitation laser is rotated through 180°.The fluorescence intensity is enhanced when the laser is polarizedparallel to the axis of the sandwich, whereas the fluorescence isdecreased when the laser is polarized perpendicular to it. The grayhorizontal line shows the fluorescence level of the FS before theAuNPs have been approached (using unpolarized excitation). Thered curve is a sin2 fit to the data.
488 Nano Lett., Vol. 8, No. 2, 2008
fluorophores (which must scale with the square of the electricfield), whereas quenching of the fluorescence due to theneighboring gold nanoparticles is less important.10,11,28
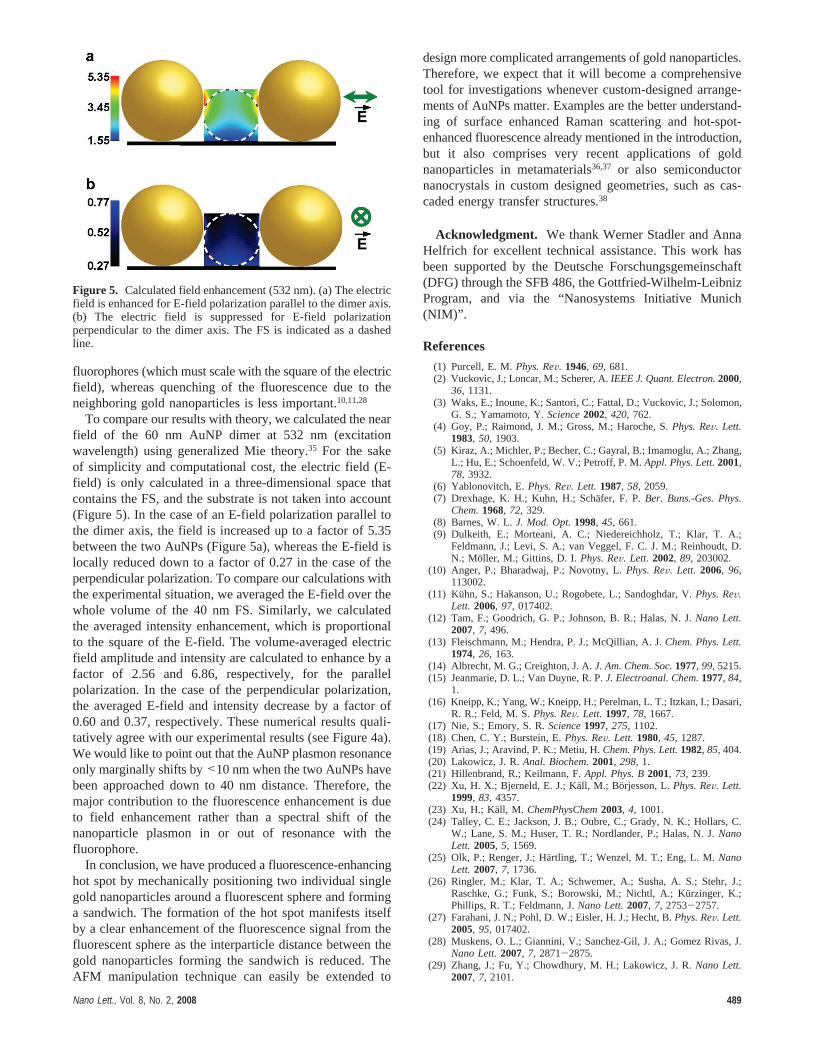
To compare our results with theory, we calculated the nearfield of the 60 nm AuNP dimer at 532 nm (excitationwavelength) using generalized Mie theory.35 For the sakeof simplicity and computational cost, the electric field (E-field) is only calculated in a three-dimensional space thatcontains the FS, and the substrate is not taken into account(Figure 5). In the case of an E-field polarization parallel tothe dimer axis, the field is increased up to a factor of 5.35between the two AuNPs (Figure 5a), whereas the E-field islocally reduced down to a factor of 0.27 in the case of theperpendicular polarization. To compare our calculations withthe experimental situation, we averaged the E-field over thewhole volume of the 40 nm FS. Similarly, we calculatedthe averaged intensity enhancement, which is proportionalto the square of the E-field. The volume-averaged electricfield amplitude and intensity are calculated to enhance by afactor of 2.56 and 6.86, respectively, for the parallelpolarization. In the case of the perpendicular polarization,the averaged E-field and intensity decrease by a factor of0.60 and 0.37, respectively. These numerical results quali-tatively agree with our experimental results (see Figure 4a).We would like to point out that the AuNP plasmon resonanceonly marginally shifts by<10 nm when the two AuNPs havebeen approached down to 40 nm distance. Therefore, themajor contribution to the fluorescence enhancement is dueto field enhancement rather than a spectral shift of thenanoparticle plasmon in or out of resonance with thefluorophore.
In conclusion, we have produced a fluorescence-enhancinghot spot by mechanically positioning two individual singlegold nanoparticles around a fluorescent sphere and forminga sandwich. The formation of the hot spot manifests itselfby a clear enhancement of the fluorescence signal from thefluorescent sphere as the interparticle distance between thegold nanoparticles forming the sandwich is reduced. TheAFM manipulation technique can easily be extended to
design more complicated arrangements of gold nanoparticles.Therefore, we expect that it will become a comprehensivetool for investigations whenever custom-designed arrange-ments of AuNPs matter. Examples are the better understand-ing of surface enhanced Raman scattering and hot-spot-enhanced fluorescence already mentioned in the introduction,but it also comprises very recent applications of goldnanoparticles in metamaterials36,37 or also semiconductornanocrystals in custom designed geometries, such as cas-caded energy transfer structures.38
Acknowledgment. We thank Werner Stadler and AnnaHelfrich for excellent technical assistance. This work hasbeen supported by the Deutsche Forschungsgemeinschaft(DFG) through the SFB 486, the Gottfried-Wilhelm-LeibnizProgram, and via the “Nanosystems Initiative Munich(NIM)”.
References
(1) Purcell, E. M.Phys. ReV. 1946, 69, 681.(2) Vuckovic, J.; Loncar, M.; Scherer, A.IEEE J. Quant. Electron.2000,
36, 1131.(3) Waks, E.; Inoune, K.; Santori, C.; Fattal, D.; Vuckovic, J.; Solomon,
G. S.; Yamamoto, Y.Science2002, 420, 762.(4) Goy, P.; Raimond, J. M.; Gross, M.; Haroche, S.Phys. ReV. Lett.
1983, 50, 1903.(5) Kiraz, A.; Michler, P.; Becher, C.; Gayral, B.; Imamoglu, A.; Zhang,
L.; Hu, E.; Schoenfeld, W. V.; Petroff, P. M.Appl. Phys. Lett.2001,78, 3932.
(6) Yablonovitch, E.Phys. ReV. Lett. 1987, 58, 2059.(7) Drexhage, K. H.; Kuhn, H.; Scha¨fer, F. P.Ber. Buns.-Ges. Phys.
Chem.1968, 72, 329.(8) Barnes, W. L.J. Mod. Opt.1998, 45, 661.(9) Dulkeith, E.; Morteani, A. C.; Niedereichholz, T.; Klar, T. A.;
Feldmann, J.; Levi, S. A.; van Veggel, F. C. J. M.; Reinhoudt, D.N.; Moller, M.; Gittins, D. I. Phys. ReV. Lett. 2002, 89, 203002.
(10) Anger, P.; Bharadwaj, P.; Novotny, L.Phys. ReV. Lett. 2006, 96,113002.
(11) Kuhn, S.; Hakanson, U.; Rogobete, L.; Sandoghdar, V.Phys. ReV.Lett. 2006, 97, 017402.
(12) Tam, F.; Goodrich, G. P.; Johnson, B. R.; Halas, N. J.Nano Lett.2007, 7, 496.
(13) Fleischmann, M.; Hendra, P. J.; McQillian, A. J.Chem. Phys. Lett.1974, 26, 163.
(14) Albrecht, M. G.; Creighton, J. A.J. Am. Chem. Soc.1977, 99, 5215.(15) Jeanmarie, D. L.; Van Duyne, R. P.J. Electroanal. Chem.1977, 84,
1.(16) Kneipp, K.; Yang, W.; Kneipp, H.; Perelman, L. T.; Itzkan, I.; Dasari,
R. R.; Feld, M. S.Phys. ReV. Lett. 1997, 78, 1667.(17) Nie, S.; Emory, S. R.Science1997, 275, 1102.(18) Chen, C. Y.; Burstein, E.Phys. ReV. Lett. 1980, 45, 1287.(19) Arias, J.; Aravind, P. K.; Metiu, H.Chem. Phys. Lett.1982, 85, 404.(20) Lakowicz, J. R.Anal. Biochem.2001, 298, 1.(21) Hillenbrand, R.; Keilmann, F.Appl. Phys. B2001, 73, 239.(22) Xu, H. X.; Bjerneld, E. J.; Ka¨ll, M.; Borjesson, L.Phys. ReV. Lett.
1999, 83, 4357.(23) Xu, H.; Kall, M. ChemPhysChem2003, 4, 1001.(24) Talley, C. E.; Jackson, J. B.; Oubre, C.; Grady, N. K.; Hollars, C.
W.; Lane, S. M.; Huser, T. R.; Nordlander, P.; Halas, N. J.NanoLett. 2005, 5, 1569.
(25) Olk, P.; Renger, J.; Ha¨rtling, T.; Wenzel, M. T.; Eng, L. M.NanoLett. 2007, 7, 1736.
(26) Ringler, M.; Klar, T. A.; Schwemer, A.; Susha, A. S.; Stehr, J.;Raschke, G.; Funk, S.; Borowski, M.; Nichtl, A.; Ku¨rzinger, K.;Phillips, R. T.; Feldmann, J.Nano Lett.2007, 7, 2753-2757.
(27) Farahani, J. N.; Pohl, D. W.; Eisler, H. J.; Hecht, B.Phys. ReV. Lett.2005, 95, 017402.
(28) Muskens, O. L.; Giannini, V.; Sanchez-Gil, J. A.; Gomez Rivas, J.Nano Lett.2007, 7, 2871-2875.
(29) Zhang, J.; Fu, Y.; Chowdhury, M. H.; Lakowicz, J. R.Nano Lett.2007, 7, 2101.
Figure 5. Calculated field enhancement (532 nm). (a) The electricfield is enhanced for E-field polarization parallel to the dimer axis.(b) The electric field is suppressed for E-field polarizationperpendicular to the dimer axis. The FS is indicated as a dashedline.
Nano Lett., Vol. 8, No. 2, 2008 489
(30) Fromm, D. P.; Sundaramurthy, A.; Schuck, P. J.; Kino, G.; Moerner,W. E. Nano Lett.2004, 4, 957.
(31) Schaefer, D. M.; Reifenberger, R.; Patil, A.; Andres, R. P.Appl. Phys.Lett. 1995, 66, 1012.
(32) Junno, T.; Deppert, K.; Montelius, L.; Samuelson, L.Appl. Phys.Lett. 1995, 66, 3627.
(33) Kassies, R.; van der Werf, K. O.; Lenferink, A.; Hunter, C. N.; Olsen,J. D.; Subrahmanyam, V.; Otto, C.J. Microsc.2005, 217, 109.
(34) Dahmen, C.; Schmidt, B.; von Plessen, G.Nano Lett.2007, 7, 318.
(35) Xu, Y. Appl. Opt.1995, 34, 4573.(36) Podolskiy, V. A.; Sarychev, A. K.; Shalaev, V. M.J. Nonlinear Opt.
Phys. Mater.2002, 11, 65.(37) Engheta, N.; Salandrino, A.; Alu, A.Phys. ReV. Lett. 2005, 95,
095504.(38) Franzl, T.; Klar, T. A.; Schietinger, S.; Rogach, A. L.; Feldmann, J.
Nano Lett.2004, 4, 1599.
NL072602N
490 Nano Lett., Vol. 8, No. 2, 2008