Embed Size (px)
Citation preview
1
Nanocellulose Fragmentation Mechanisms and Inversion of Chirality from
the Single Particle to the Cholesteric Phase
Gustav Nyström1, Jozef Adamcik1, Ivan Usov2, Mario Arcari1 and Raffaele Mezzenga1,3*
1. ETH Zurich, Department of Health Science & Technology, Schmelzbergstrasse 9, 8092
Zurich, Switzerland
2. Paul Scherrer Institute, 5232 Villigen PSI, Switzerland
3. ETH Zurich, Department of Materials, Wolfgang-Pauli-Strasse 10, 8093 Zurich, Switzerland
*Correspondence to: [email protected]
Keywords: nanocellulose, fibril, kink, hydrolysis, chirality, liquid crystal, handedness
Understanding how nanostructure and nanomechanics influence physical material
properties on the micro- and macroscale is an essential goal in soft condensed matter
research. Mechanisms governing fragmentation and chirality inversion of filamentous
colloids are of specific interest because of their critical role in load-bearing and self-
organizing functionalities of soft nanomaterials. Here we provide a fundamental insight
into the self-organization across several length scales of nanocellulose, an important bio-
colloid system with wide-ranging applications as structural, insulating and functional
material. Through a combined microscopic and statistical analysis of nanocellulose fibrils
at the single particle level, we show how mechanically and chemically induced
fragmentation proceed in this system. Moreover, by studying the bottom-up self-assembly
of fragmented carboxylated cellulose nanofibrils into cholesteric liquid crystals, we show
via direct microscopic observations, that the chirality is inverted from right-handed at the

2
nanofibril level to left-handed at the level of the liquid crystal phase. These results improve
our fundamental understanding of nanocellulose and provide an important rationale for
their application in colloidal systems, liquid crystals and nanomaterials.
The increasing global population and improved living standards demand a more efficient use of
available resources and energy1. Improving the use of sustainable resources without sacrificing
the final materials performance is therefore critical2. Nanocellulose represents an important class
of sustainable bio-colloids with great promise for use in new high strength3, energy storage4 and
insulation5 nanomaterials. To understand and identify nanostructural and nanomechanical details,
including the processing-structure relationship, is essential for advancing the understanding of
these bio-colloids and their application in new materials. Specifically, investigating how these
nanoparticles kink6 and break is of fundamental interest for their load bearing7, gel forming8 and
self-organizing9–11 functionalities.
It is well known that mechanical energy (sonication) breaks cellulose nanofibrils (CNF)7 and
cellulose nanocrystals (CNC)12 resulting in shorter particles. It is also well known that acid
hydrolyzes cellulose resulting in short CNC particles13. However, the mechanisms behind these
nanocellulose fragmentation processes remains, to the best of our knowledge, largely unknown.
In this paper we set out to answer the open questions whether or not fibril breakage occurs at
positions of kinks or along rigid segments, if kinks can be introduced mechanically7,14 and if acid
hydrolysis occurs, as previously suggested15–18, preferentially at positions of kinks.
Nanocellulose, mainly in the form of sulfate half-ester modified CNC, is known to self-
assemble into cholesteric liquid crystalline phases9. This discovery has opened up an entire field
of research on sulfated nanocellulose cholesterics10,19–24. While the results are impressive, the

3
detailed mechanism behind the formation of the cholesteric phase remains unresolved25. One
hypothesis is that the cholesteric phase forms as a result of the twisted shape of the cellulose
particle26. Unfortunately, the nanostructure of sulfated CNC is highly irregular and the chirality
of single CNC particles is difficult to unambiguously determine. Twisting has, however,
previously been observed on thicker cellulose fibril aggregates,26,27 but until recently, the
chirality of the single cellulose nanoparticle remained unknown. Recent results revealed that
single carboxylated nanocellulose particles have a well-defined right-handed chirality14, opening
up the unprecedented possibility to shed light on how chirality transfers across length scales in
the nanocellulose system. Understanding the underlying mechanisms of chirality and how it
transfers between different hierarchical levels is a fundamental research challenge with important
implications spanning from self-assembled biological nanomaterials to biochemistry, biophysics
and nanotechnology.
In the present study, we chose carboxylated CNF as model system for the following three
reasons. First, it allows us to study nanocellulose fragmentation mechanisms and cholesteric self-
assembly behavior on a single well-defined system. Second, this approach gives us, discussed in
the first part of the paper, the possibility to control the detailed sample nanostructure before and
after fragmentation making it possible to draw conclusions about how fibrils break as a result of
mechanical and acid treatment. Third, the carboxylated CNF and CNC have a well-defined right-
handed chirality. This gives us, disclosed in the second part of the paper, the possibility to
explicitly study how the chirality of the single particle transfers to the chirality of the cholesteric
liquid crystal phase.

4
RESULTS
Mechanically induced fragmentation of carboxylated CNF. To investigate the effects of
mechanical treatment (sonication) on the nanostructure of single cellulose nanofibrils (CNF)
atomic force microscopy (AFM) imaging was performed on samples collected after different
sonication times, see Fig. 1a–c. Directly evident from these images are the right-handed chirality
(bottom left corner of panel a) of the ~2 nm thin fibrils, in agreement with our earlier report14,
and an apparent shortening of the fibrils as a result of the increased sonication time. To gain
more insight into the nanostructural changes of the fibrils, statistical image analysis was
performed using our own-developed open-source code FiberApp28, allowing collection and
analysis of the fibril contours, including the number and position of the kinks (defined using
white square masks), see Fig. 1d. Using the positions of the masks, fibril contours could be
artificially split into shorter rigid contours, called segments. The tracked data from 2628 fibrils
were then used to extract three arithmetically averaged parameters for each sonication time,
namely the contour length of the whole fibril, the inverse linear kink density (equivalent to the
average distance between kinks) and the segment length. As a result of the sonication treatment,
we propose that three different events could occur, either: i) a new kink could appear, ii) the
fibril breaks at the position of a kink or iii) the fibril breaks along a rigid segment. These possible
events and their hypothetical, ensued influence on the parameters of interest are summarized in
Fig. 1e. For instance, breakage at the position of a kink would lead to a decreased average
contour length, an increased average inverse kink density (this event is statistically equivalent to
repairing a kink) and an unchanged average segment length. In Fig. 1f the averages of the
contour length, the inverse kink density and the segment length are plotted for four different
sonication times (0 s, 60 s, 240 s and 420 s). The data, found to be largely invariant as to whether

5
or not fibrils only containing kinks were included in the analysis, shows that the average contour
length significantly decreases (unpaired t-test, p-value (P) < 0.0001) with increasing sonication
times. This is in agreement with previous results7 and the visual comparison in Fig. 1a–c. Within
the first 60 seconds, the rapid decrease in the average contour length is followed by a decrease in
the average segment length (P < 0.0001), but no statistically significant change in the inverse
kink density. In combination, this would indicate that the initial mechanical breakage occurs
along a segment and not, as one might assume, at a position of a kink. We note, however, that the
breakage along rigid segments can be seen as a superposition of the other two events, meaning
that we can also not discard the possibility that this breakage occurs by first introducing a new
transient kink followed by breakage at the same kink position. For longer sonication times the
data indicates further breaking along the segments, based on the significant decrease of both the
contour length and the segment length (P < 0.0001). Although no change was found during the
initial 60 s of sonication, for longer sonication times there is also a significant (P < 0.0001)
decrease in the inverse kink density. While in general all three events are expected to occur
simultaneously, only introduction of new kinks can explain a decrease in inverse kink density.
These data are therefore conclusively inferring, in line with previous results7,14, that the observed
kinks are a result of the mechanical treatment of the sample rather than the presence of
amorphous regions along the fibril contour.
Comparing the relative values for the arithmetic and the weight average of the segment length
before and after sonication treatment, a 47% decrease is found for the number averaged mean
compared to a 65% decrease obtained for the weight averaged mean. This difference supports the
interpretation that rigid segments are broken and highlights that longer segments are

6
preferentially broken, as would be expected based on energy considerations where the
probability for breakage increase with L for sufficiently large energies (P ~ e-(E/kT) * L for E > Ec).
Figure 1. Influence of sonication on carboxylated cellulose nanofibril (CNF) nanostructure. Tapping mode
AFM-images of cellulose nanofibrils before (a) and after being subjected to 60 s (b) and 240 s (c) of sonication
treatment. (d) Magnified section from one of the AFM images highlighting the tracking of one cellulose nanofibril
including its tracked contour (blue line), masks to treat the kink region (white squares) and splitting of the contour in
the middle of the masks into three segments (red lines). (e) Table summarizing the possible events that could occur
to cellulose nanofibrils during sonication (column 1) and its expected influence on the nanofibril parameters of the
nanofibrils (columns 2–4). (f) Plot of the arithmetic averages of the contour length (black squares), the inverse kink
density (blue diamonds) and the segment length (red circles) as a function of sonication time with 95% confidence
interval error bars.
Hydrochloric acid induced fragmentation of carboxylated CNF. Besides mechanical
treatment, it is also well known that mineral acids can cause hydrolysis of cellulose, resulting in
a cleaving of the cellulose chains15 as well as a shortening of the cellulose nanofibrils29. A
7
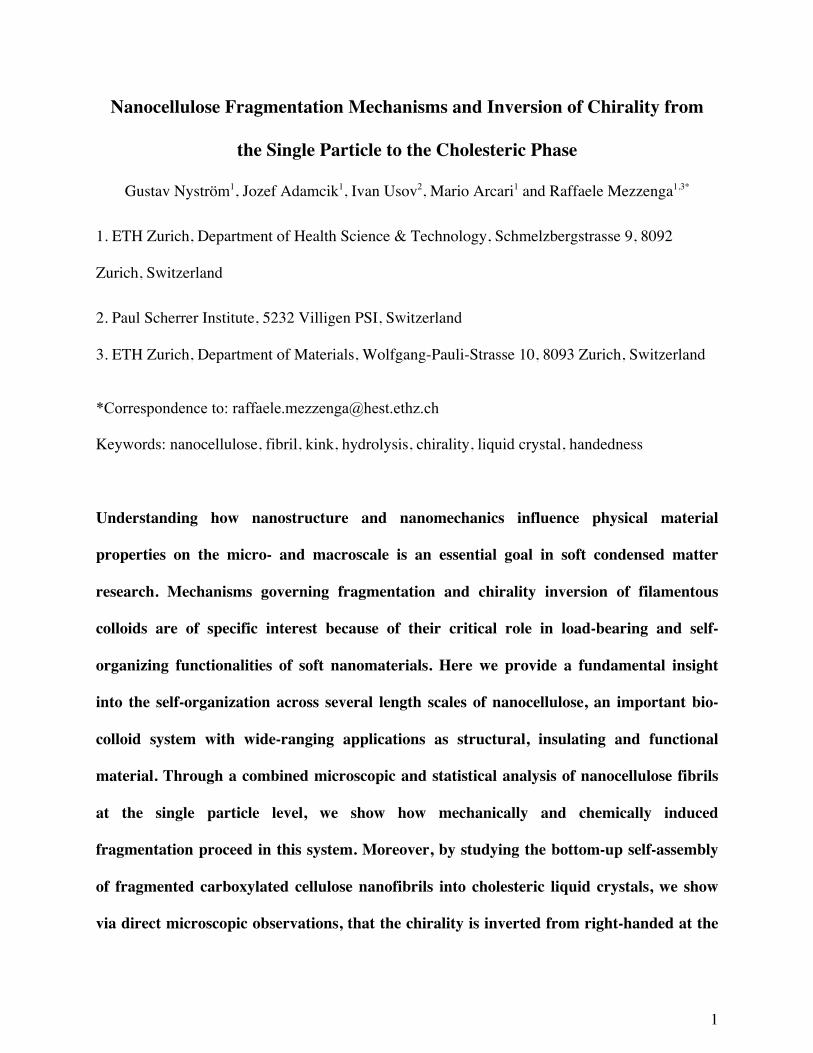
commonly held belief is that the hydrolysis of cellulose nanofibrils occurs preferentially at
positions of disordered cellulose chains, ascribed to regions at which the fibrils kink 17. In order
to test whether or not this hypothesis holds true, we first envision three different possible
outcomes of the hydrolysis of kinked cellulose nanofibrils as schematically indicated in Fig. 2a.
The hydrolysis would occur either i) only at kinks, ii) preferentially at kinks or iii) at random
positions along the nanofibril contour. To study the effects of acid hydrolysis, kinked fibrils were
imaged using AFM before and after hydrolysis with hydrochloric acid (see Methods for details),
as shown in Fig. 2b–c. As the images show, only in rare cases are there kinks still present in the
hydrolyzed sample. This effectively rules out the scenario of a random hydrolysis process, but is
compatible with both a hydrolysis process occurring only or preferentially at kinks. To
distinguish between these two scenarios the length distribution of hydrolyzed particles is
compared to the distribution of rigid segments in the non-hydrolyzed sample, see Fig. 2d. From
this comparison it is evident that the distribution after hydrolysis is shifted to shorter lengths
compared to the original rigid segment distribution. Moreover, a large amount of particles with a
length shorter than the minimum distance between kinks in the non-hydrolyzed sample is
observed. Combined with the relative absence of kinks, we conclude that the acid hydrolysis
occurs according to mechanism ii) preferentially but also in between kinks. With short, mainly
unkinked, right-handed chiral cellulose nanoparticles at hand, we now turn to the question of
how the chirality is transferred from the single particle to the liquid crystal phase.

8
Figure 2. Hydrolysis of carboxylated cellulose nanofibrils (CNF) into carboxylated cellulose nanocrystals
(CNC). (a) Schematic describing possible results of cutting the cellulose nanofibril into shorter cellulose
nanocrystals. AFM images of cellulose nanofibrils before (b) and after (c) acid hydrolysis. Only segments with the
same thickness (indicated by the dashed white line) as the untreated fibrils were included in the analysis. (d)
Segment length distribution before (black bars) and after (red bars) acid hydrolysis. The data has been binned
equally and is plotted around the center of each bin position (the red data shifted to the left) for clarity.

9
Nematic and cholesteric phases of carboxylated CNC. With an increasing concentration, the
system of the hydrolyzed short cellulose fibrils, CNC, undergoes an isotropic-nematic phase
transition9,12,20,26,30 as indicated schematically in Fig. 3a. For the present carboxylated CNC
system the aspect ratio is ~95 meaning that the Onsager formalism31 can be applied
quantitatively. Taking also the charges on the particles into account32, the isotropic-nematic
phase transition is given by:
(1)
where D is the diameter, Deff the effective diameter and L is the length of the CNC (see Methods
for details). For the effective linear surface charge density νeff = 0.26 e/nm, <D> = 3.8 nm, Deff =
17.9 nm and <L> = 366 nm a transition at a volume fraction of ϕIN,pred. = 0.0132 is predicted.
Considering the polydispersity of the particles and the approximations used to estimate their
effective charge density, this is in reasonably good agreement with the observed transition at ~8
g/L (Fig. 3b) or ϕIN,exp. = 0.0053. This concentration is also in perfect agreement with previous
observations of ordering of similar particles using small angle neutron scattering11. Under the
present experimental conditions, where the system is close to the isotropic-nematic phase
transition, both phases coexist and the phase separation is proceeding via nucleation of small
nematic liquid crystal tactoids that grow in size over time (see Fig. 3b–e), from an initially
isotropic metastable dispersion. At a certain critical tactoid volume33, the surface energy
constraints on the structure within the tactoids are sufficiently relaxed, allowing a cholesteric
phase to develop (see Fig. 3e). Over time, these cholesteric tactoids grow and eventually merge30
to a bulk cholesteric phase (see Fig. 3f).
φIN = 6D2
Deff L

10
Figure 3. Carboxylated CNC assembly in nematic and cholesteric phases. (a) Schematic describing the entropic
ordering of rod-like particles in nematic and cholesteric liquid crystal phases. Nucleation of small nematic tactoids
out of the surrounding isotropic phase (b) that grow in size with time (c, d) eventually displaying the cholesteric
liquid crystalline phase (e). (f) Bulk cholesteric phase observed after all initially metastable isotropic phase has been
converted into a cholesteric phase.
Transfer of chirality from particle to cholesteric phase for carboxylated CNC. Although the
formation of the cholesteric liquid crystal phase is well known for nanocellulose9, the general
underlying mechanism behind the formation of the cholesteric phase is still not completely
resolved25. Chirality on the single particle level is a necessary but not sufficient condition to
develop a cholesteric phase since also the thermodynamic state of the system34 and molecular
scale variations play a role. For instance filamentous bacteriophage Pf1 and fd viruses both have
a right-handed chirality, but Pf1 displays only a nematic phase whereas fd virus develops a
cholesteric phase35. Furthermore, a single point mutation of the major coat protein was found to

11
change the chirality of the cholesteric phase from left-handed (for fd wt virus) to right-handed
(for fd Y21M)36. Our previous results14 conclusively showed that the single chirality of
carboxylated nanocellulose particles is right-handed. This is very valuable information, which is
not available for the more commonly studied cholesteric system of sulfated cellulose
nanocrystals, and which allows us, for the first time, to study how the chirality is transferred
from the single nanocellulose particle to the cholesteric phase. For this purpose we designed an
experimental setup based on polarized optical microscopy where the handedness of the
cholesteric tactoids could be directly determined, see Fig. 4a. By orienting the sample cuvette at
a 45 degree angle to the polarizer and analyzer (x- and y-axis in Fig. 4a), tactoids with their
cholesteric axis parallel to the y'-axis will display a maximum cholesteric band intensity.
Rotating the cuvette around the y'-axis will therefore also cause a rotation of y'-aligned tactoids
around their cholesteric axis. This tactoid rotation allows us to determine the handedness of the
cholesteric phase by following the rotation-induced movement of the cholesteric bands. When
rotating the sample clockwise (right-handed), we observe an upward movement of the maximum
intensity bands (Fig. 4b). This observation is in agreement with the right-handed rotation of the
left-handed schematic helix in Fig. 4c. For the present system we accordingly observe a left-
handed chirality for the cholesteric droplet and further, during a rotation of ~90° the bands of
maximum intensity shift, as expected, by a distance corresponding to P/4, where P is the
cholesteric pitch. Remembering the right-handed chirality of the cellulose nanofibrils, a chirality
inversion to left-handedness is observed for the nanocellulose cholesteric liquid crystalline
phase. This follows a similar mechanism of chirality inversion compared to DNA37 and virus38
and similar but opposite to that of amyloid fibrils33 where left-handed particles develop right-
handed cholesteric phases. Additionally, the effect of the temperature on the equilibrium bulk

12
pitch of the carboxylated CNC cholesteric phase was investigated, see Fig. 4d. Unlike the
systems of virus35 and DNA39 that show an increase and decrease respectively of the pitch with
increasing temperature, but in accordance with previous results on sulfated CNC40, the
carboxylated CNC shows a cholesteric pitch that is not influenced by the change in temperature,
at least in the range explored. This suggests that the cholesteric phase develops mainly as a result
of entropic hard-core interactions between the chiral rod-like particles26 in line with the model of
Straley41, allowing a chiral inversion for sufficiently large (> 45°) particle twist angles38 (Fig.
4e). While it is difficult to define an exact twist angle for the present system, it is reasonable,
based on the AFM images, to assume large values for the particle twist angle. The large twist
angle may also, in part, explain why a defined twist and handedness are difficult to be assigned
for the shorter particle sulfated CNC system.

13
Figure 4. Determination of handedness and temperature dependence of the cholesteric phase. (a) Schematic
describing the right-handed rotation of the sample around its long axis (y') and the resulting rotation angles in the x'-
z plane. (b) Corresponding rotation of a cholesteric tactoid, and translation of bands of maximum intensity, as
observed between crossed polarizers in the optical microscope. (c) Comparing schematic of a right-handed rotation
of a left-handed rod-helix. The blue rods correspond to positions on the helix with maximum intensity. (d) Influence
of the bulk cholesteric pitch as a function of temperature. The error bars represent the standard deviation of 5
independent measurement of the pitch each averaged over 8–10 cholesteric bands. (e) Zoomed schematic illustrating
the steric (left-handed) interaction of the cholesteric phase between two adjacent right-handed rods.

14
Chirality of solid-state carboxylated CNC films. As a further demonstration of the (bulk)
chirality of the system, dry films, cut along an angle from the film surface, were imaged with
AFM as shown in Fig. 5. These images, for both the carboxylated CNC of the present study (Fig.
5a) as well as the sulfated CNC added as a control sample (Fig. 5b), show an arc pattern
characteristic of the cholesteric phase. The carboxylated CNC sample, although less regular,
shows the same arcing behavior as the sulfated CNC. This counter-clockwise rotation of the
local director, while moving from the top (upper left corner) to the bottom (lower right corner) of
the film corresponds to a left-handed cholesteric phase, and is in agreement with both the present
direct observation of single cholesteric tactoids using the polarized light microscope and
previous results based on electron microscopy10.
Figure 5. AFM of solid-state CNC films. Scans across inclined surfaces in (a) CNC-COOH and (b) CNC-SO3H
films oriented with the top left corner away from the observer showing arc patterns indicative of a left-handed
cholesteric phase.
In summary, we have studied the fragmentation of nanocellulose using sonication and acid
hydrolysis and found that there is a rapid initial breakage due to sonication that occurs at rigid

15
segments along the fibril contour. For longer sonication times, the data shows a continued
fracturing of the fibrils at the rigid segments as well as an increased density of kinks inferring
that the presence of kinks is – at least partially –a result of the mechanical sample treatment. The
results based on acid hydrolysis demonstrated that the cutting of fibrils occurs preferentially at
kinks but also at random position in between kinks, creating a lower particle length distribution
than what would be expected based on the original rigid segment length distribution only. By
direct microscopic observation, we finally showed that right-handed carboxylated CNC self-
organize into cholesteric tactoids and films of a left-handed handedness, demonstrating an
inversion of the chirality between the single particle and the liquid crystal phase level. Not only
do these results provide important structural information and an improved understanding of
nanocellulose on the fundamental level, but they also offer a critical step forward in their
application in new nanomaterials and nanotechnologies.
REFERENCES
1. Sorrell, S. Reducing energy demand: A review of issues, challenges and approaches. Renew. Sustain. Energy Rev. 47, 74–82 (2015).
2. Allwood, J. M. Sustainable materials. Nat. Rev. Mater. 1, 15009 (2016). 3. Håkansson, K. M. O. et al. Hydrodynamic alignment and assembly of nanofibrils resulting
in strong cellulose filaments. Nat. Commun. 5, 4018 (2014). 4. Nyström, G. et al. Self-assembled three-dimensional and compressible interdigitated thin-
film supercapacitors and batteries. Nat. Commun. 6, 7259 (2015). 5. Wicklein, B. et al. Thermally insulating and fire-retardant lightweight anisotropic foams
based on nanocellulose and graphene oxide. Nat. Nanotechnol. 10, 277–283 (2015). 6. Ciesielski, P. N. et al. 3D electron tomography of pretreated biomass informs atomic
modeling of cellulose microfibrils. ACS Nano 7, 8011–8019 (2013). 7. Saito, T., Kuramae, R., Wohlert, J., Berglund, L. A. & Isogai, A. An ultrastrong
nanofibrillar biomaterial: The strength of single cellulose nanofibrils revealed via sonication-induced fragmentation. Biomacromolecules 14, 248–253 (2013).
8. Fall, A. B., Lindström, S. B., Sundman, O., Ödberg, L. & Wågberg, L. Colloidal stability of aqueous nanofibrillated cellulose dispersions. Langmuir 27, 11332–11338 (2011).

16
9. Revol, J., Bradford, H., Giasson, J., Marchessault, R. H. & Gray, D. Helicoidal self-ordering of cellulose microfibrils in aqueous suspension. Int. J. Biol. Macromol. 14, 170–172 (1992).
10. Shopsowitz, K. E., Qi, H., Hamad, W. Y. & Maclachlan, M. J. Free-standing mesoporous silica films with tunable chiral nematic structures. Nature 468, 422–425 (2010).
11. Uhlig, M. et al. Two-Dimensional Aggregation and Semidilute Ordering in Cellulose Nanocrystals. Langmuir 32, 442–450 (2016).
12. Dong, X. M., Revol, J.-F. & Gray, D. Effect of microcrystallite preparation conditions on the formation of colloid crystals of cellulose. Cellulose 5, 19–32 (1998).
13. Rånby, G. Cellulose and Muscle - The Colloidal Properties of Cellulose Micelles. Discuss. Faraday Soc. 11, 158–164 (1951).
14. Usov, I. et al. Understanding nanocellulose chirality and structure–properties relationship at the single fibril level. Nat. Commun. 6, 7564 (2015).
15. Battista, O. Hydrolysis and crystallization of cellulose. Ind. Eng. Chem. 42, 502–507 (1950).
16. Eichhorn, S. J. et al. Review: Current international research into cellulose nanofibres and nanocomposites. J. Mater. Sci. 45, 1–33 (2010).
17. Habibi, Y., Lucia, L. A. & Rojas, O. J. Cellulose nanocrystals: chemistry, self-assembly, and applications. Chem. Rev. 110, 3479–3500 (2010).
18. Klemm, D. et al. Nanocelluloses: a new family of nature-based materials. Angew. Chemie Int. Ed. 50, 5438–5466 (2011).
19. Orts, W. J., Godbout, L. & Marchessault, R. H. Enhanced Ordering of Liquid Crystalline Suspensions of Cellulose Microfibrils : A Small Angle Neutron Scattering Study. Macromolecules 31, 5717–5725 (1998).
20. Araki, J., Wada, M. & Kuga, S. Steric stabilization of a cellulose microcrystal suspension by poly(ethylene glycol) grafting. Langmuir 17, 21–27 (2001).
21. Cranston, E. D. & Gray, D. Morphological and optical characterization of polyelectrolyte multilayers incorporating nanocrystalline cellulose. Biomacromolecules 7, 2522–2530 (2006).
22. Lagerwall, J. P. F. et al. Cellulose nanocrystal-based materials: from liquid crystal self-assembly and glass formation to multifunctional thin films. NPG Asia Mater. 6, e80 (2014).
23. Parker, R. M. et al. Hierarchical Self-Assembly of Cellulose Nanocrystals in a Confined Geometry. ACS Nano 10, 8443–8449 (2016).
24. Li, Y. et al. Colloidal cholesteric liquid crystal in spherical confinement. Nat. Commun. 7, 12520 (2016).
25. Dussi, S. & Dijkstra, M. Entropy-driven formation of chiral nematic phases by computer simulations. Nat. Commun. 7, 11175 (2016).
26. Araki, J. & Kuga, S. Effect of Trace Electrolyte on Liquid Crystal Type of Cellulose Microcrystals. 17, 4493–4496 (2001).

17
27. Hanley, S. J., Revol, J.-F., Godbout, L. & Gray, D. Atomic force microscopy and transmission electron microscopy of cellulose from Micrasterias denticulata; evidence for a chiral helical microfibril twist. Cellulose 4, 209–220 (1997).
28. Usov, I. & Mezzenga, R. FiberApp: An Open-Source Software for Tracking and Analyzing Polymers, Filaments, Biomacromolecules, and Fibrous Objects. Macromolecules 48, 1269–1280 (2015).
29. Salajkova, M., Berglund, L. A. & Zhou, Q. Hydrophobic cellulose nanocrystals modified with quaternary ammonium salts. J. Mater. Chem. 22, 19798 (2012).
30. Wang, P.-X., Hamad, W. Y. & MacLachlan, M. J. Structure and transformation of tactoids in cellulose nanocrystal suspensions. Nat. Commun. 7, 11515 (2016).
31. Onsager, L. The effects of shape on the interaction of colloidal particles. Ann. N. Y. Acad. Sci. 51, 627–659 (1949).
32. Mezzenga, R., Jung, J.-M. & Adamcik, J. Effects of charge double layer and colloidal aggregation on the isotropic-nematic transition of protein fibers in water. Langmuir 26, 10401–10405 (2010).
33. Nyström, G., Arcari, M. & Mezzenga, R. Confinement-Induced Liquid Crystalline Transitions and Chirality Inversion in Amyloid Fibril Cholesteric Tactoids. arXiv 1704.04936
34. Belli, S., Dussi, S., Dijkstra, M. & van Roij, R. Density functional theory for chiral nematic liquid crystals. Phys. Rev. E 90, 20503 (2014).
35. Dogic, Z. & Fraden, S. Cholesteric Phase in Virus Suspensions. Langmuir 16, 7820–7824 (2000).
36. Barry, E., Beller, D. & Dogic, Z. A model liquid crystalline system based on rodlike viruses with variable chirality and persistence length. Soft Matter 5, 2563–2570 (2009).
37. Livolant, F. & Leforestier, A. Condensed phases of DNA: Structures and phase transitions. Prog. Polym. Sci. 21, 1115–1164 (1996).
38. Tombolato, F., Ferrarini, A. & Grelet, E. Chiral Nematic Phase of Suspensions of Rodlike Viruses: Left-Handed Phase Helicity from a Right-Handed Molecular Helix. Phys. Rev. Lett. 96, 258302 (2006).
39. De Michele, C., Zanchetta, G., Bellini, T., Frezza, E. & Ferrarini, A. Hierarchical Propagation of Chirality through Reversible Polymerization: The Cholesteric Phase of DNA Oligomers. ACS Macro Lett. 5, 208–212 (2016).
40. Dong, X. M. & Gray, D. Effect of Counterions on Ordered Phase Formation in Suspensions of Charged Rodlike Cellulose Crystallites. Langmuir 13, 2404–2409 (1997).
41. Straley, J. P. Theory of piezoelectricity in nematic liquid crystals, and of the cholesteric ordering. Phys. Rev. A 14, 1835–1841 (1976).
42. Saito, T., Kimura, S., Nishiyama, Y. & Isogai, A. Cellulose Nanofibers Prepared by TEMPO-Mediated Oxidation of Native Cellulose. Biomacromolecules 8, 2485–2491 (2007).
18
ACKNOWLEDGEMENTS
G.N. acknowledges funding from the Gunnar Sundblad Research Foundation and from the Swiss
National Science Foundation Ambizione Grant No. PZ00P2_168023/1.
AUTHOR CONTRIBUTIONS
G.N., I.U., J. A. and R.M. designed the study. G.N., J.A. and M.A. performed the experiments.
G.N., I.U. and R.M. analyzed data. G.N., M.A. and R.M. wrote the paper.
METHODS
Preparation of carboxylated cellulose nanofibrils (CNF). Carboxylated cellulose nanofibrils
were prepared from never-dried softwood pulp using TEMPO-mediated oxidation42 combined
with mechanical treatment (ultrasonication) and centrifugation to remove larger fibril aggregates.
The total amount of charge (0.67 mmol/g) was measured using conductometric titration on the
oxidized pulp. The oxidized pulp was then dispersed at a concentration of 1 g/L and cellulose
nanofibrils were extracted using probe ultrasonication for 2 minutes (Hielscher UP200S,
operated at 200 W and 20% amplitude setting) followed by centrifugation at 12 000 g for 30
minutes.
Preparation of carboxylated CNF for sonication experiment. A common 1 g/L stock
dispersion of CNF with 0.67 mmol/g charge density was split into three identical 20 mL glass
vials each filled with 5 mL of dispersion. Probe ultrasonication (Hielscher UP200S, operated at
200 W and 20% amplitude setting) was thereafter performed using a 7 mm probe immersed in
the middle of the dispersions for 60, 240 and 420 s respectively. To avoid heating the vials, these
were placed in an ice bath during the sonication treatment.

19
Preparation of carboxylated cellulose nanocrystals (CNC). Cellulose nanocrystals were
prepared by heating 80 mL of 0.5 g/L of the carboxylated CNF dispersion with a charge density
of 1.5 mmol/g at 105 °C and 2.5 M HCl under stirring at 200 rpm and reflux conditions for 3
hours. The sample was collected by centrifugation (30 minutes and 12 000 g) and dialyzed
against MQ-water for 3 days after which a final pH of 4.6 was reached. To disperse the CNC, the
sample was sonicated for 2 min at 40% amplitude with a 7 mm probe followed by centrifugation
(30 minutes and 12 000 g). The CNC concentration was measured gravimetrically and adjusted
using reverse osmosis against a 10 wt% PEG 35 kDa solution. The samples that were used for
analysis of the particle length distribution after hydrolysis were collected after dialysis and only
briefly sonicated for 20 s at 20% amplitude settings to assist the dispersion of single CNC
particles.
Characterization by optical microscopy. The samples for optical microscopy were prepared in
square cross section (0.20 x 4.00 mm) glass cuvettes (VitroTubes, Vitrocom) and sealed with
epoxy glue. The cuvettes were stored horizontally until the epoxy glue had hardened completely,
at least 30 minutes. After that they were labeled and stored vertically at room temperature.
Polarized optical microscopy was performed using a Zeiss Axioscope 2 microscope using 5x and
10x air objectives to image the samples between crossed linear polarizers. An in-house made
rotation stage was used to rotate the sample in the horizontal sample plane and around the long
axis of the sample. To determine the handedness of the cholesteric pitch, the cholesteric tactoid
was oriented at a 45-degree angle to the crossed polarizers with the cholesteric bands at a right
angle to the polarization plane. The rotation was then performed along the helical axis of the
sample and the resulting movement of the position of the cholesteric bands was used to
determine the handedness of the cholesteric phase. If the cholesteric tactoid is rotated in a right-

20
handed fashion, a movement of the bands in the opposite direction of the helix corresponds to a
right-handed cholesteric phase, while an opposite motion corresponds to a left-handed
cholesteric. It is at this point very important to take the transformation between the sample and
the image plane in the microscope into account. In our setup there is a 180-degree rotation
between the sample and the image plane leaving the observation of the handedness unchanged.
Characterization with atomic force microscopy. A droplet of 0.01 g/L dispersion was
deposited on freshly cleaved mica and allowed to adsorb for 60 s before rinsing with MQ-water
and drying with pressurized air. AFM measurements were performed using a MultiMode VIII
Scanning Probe Microscope (Bruker, USA) covered with an acoustic hood to minimize
vibrational noise. AFM images were acquired continuously in the tapping mode under ambient
conditions using commercial cantilevers (Bruker).
Statistical image analysis. The high resolution (5120 x 5120 pixels) AFM images were
analyzed using FiberApp28 which allows each fibril to be represented by its contour – a sequence
of points connected with straight segments that are positioned along the fibril maximum height
on an AFM image. All contours acquired in this study have a constant distance between
projections of these points on the image plane, which is the step size s = 1 pixel. The regions
around kinks were treated using the previously described mask method,14 which allows to set
more flexible tracking parameters in the vicinity of kinks and more stiff parameters along rigid
segments.
For the contour length, rigid segment and inverse kink density analysis after sonication was run
on a total of 2628 fibrils, 657 for each sample set. Both fibrils with and without kinks were
included in the analysis. To avoid any bias, the relative number of unkinked fibrils was kept

21
within 14–20 % for all sample sets. For the rigid segment distributions before and after acid
hydrolysis a total of 662 fibrils were analyzed. 200 fibrils before hydrolysis were analyzed
containing a total number of 441 rigid segments. These were compared to the length distribution
of 462 fibrils after hydrolysis. While doing the analysis care was taken to only include particles
with a height comparable to that of the original particle.
To estimate the aspect ratio of the CNC sample forming the nematic and cholesteric phase, 407
particles were analyzed, and the arithmetically averaged lengths (366 nm) and heights (3.8 nm)
were used giving an aspect ratio of ~95.
The rigid segment and contour length distributions were fitted using a log-normal probability
density function f(L; µ, σ):
where L is either the rigid segment or the total contour length, µ and σ are the mean value and
the standard distribution of the length’s natural logarithm, respectively, and A is a distribution
normalizing constant.
f (L;µ,σ ) = ALσ 2π
e−ln(L )−µ( )2
2σ 2