Embed Size (px)
Citation preview
NANOCOMPOSITE NAFION AND HETEROPOLYACID INCORPORATED MESOPOROUS CATALYSTS FOR DIMETHYL ETHER SYNTHESIS FROM
METHANOL
A THESIS SUBMITTED TO THE GRADUATE SCHOOL OF NATURAL AND APPLIED SCIENCES
OF MIDDLE EAST TECHNICAL UNIVERSITY
BY
AYŞEGÜL ÇĐFTÇĐ
IN PARTIAL FULFILLMENT OF THE REQUIREMENTS FOR
THE DEGREE OF MASTER OF SCIENCE IN
CHEMICAL ENGINEERING
AUGUST 2009
Approval of the thesis:
NANOCOMPOSITE NAFION AND HETEROPOLYACID INCORPORATED MESOPOROUS CATALYSTS FOR DIMETHYL ETHER SYNTHESIS
FROM METHANOL
submitted by AYŞEGÜL ÇĐFTÇĐ in partial fullfillment of the requirements for the degree of Master of Science in Chemical Engineering Department, Middle East Technical University by,
Prof. Dr. Canan Özgen ____________________ Dean, Graduate School of Natural and Applied Sciences Prof. Dr. Gürkan Karakaş ____________________ Head of Department, Chemical Engineering Prof. Dr. Timur Doğu Supervisor, Chemical Engineering Dept., METU ____________________ Assoc. Prof. Dr. Naime A. Sezgi Co-Supervisor, Chemical Engineering Dept., METU ____________________ Examining Committee Members: Prof. Dr. H. Önder Özbelge Chemical Engineering Dept., METU ____________________ Prof. Dr. Timur Doğu Chemical Engineering Dept., METU ____________________ Prof. Dr. Gürkan Karakaş Chemical Engineering Dept., METU ____________________ Prof. Dr. Güzide Çalık Chemical Engineering Dept., Ankara University ____________________ Assoc. Prof. Dr. Nuray Oktar Chemical Engineering Dept., Gazi University ____________________ Date: 21.08.2009

iii
I hereby declare that all information in this document has been obtained and presented in accordance with academic rules and ethical conduct. I also declare that, as required by these rules and conduct, I have fully cited and referenced all material and results that are not original to this work.
Name, Last name: Ayşegül ÇĐFTÇĐ
Signature :
iv
ABSTRACT
NANOCOMPOSITE NAFION AND HETEROPOLYACID INCORPORATED MESOPOROUS CATALYSTS FOR DIMETHYL
ETHER SYNTHESIS FROM METHANOL
Çiftçi, Ayşegül
M.Sc., Department of Chemical Engineering
Supervisor: Prof. Dr. Timur Doğu
Co-Supervisor: Assoc. Prof. Dr. Naime A. Sezgi
August 2009, 135 pages
The need for alternative transportation fuels is rising with the rapid depletion
of oil reserves and the simultaneous growth of the world’s population. Production of
dimethyl ether, a non-petroleum derived attractive fuel-alternate for the future, is a
challenging research area. Different routes and various solid-acid catalysts are being
developed in order to achieve the most efficient way of synthesizing this potential
diesel alternative fuel. The focus of heterogeneous catalysis is to convert renewable
feed stocks to valuable chemicals. Nafion resin and heteropolyacid compounds are
active acidic catalysts with significantly low surface areas, which act as a strong
barrier limiting their catalytic activity. Synthesizing solid-acid catalysts by
incorporation of nonporous active compounds into mesoporous silicate structured
materials opens a door to producing valuable chemicals by heterogeneous catalysis.
The objective of this work was to synthesize and characterize nafion and
heteropolyacid incorporated nanocomposite catalysts and to catalyze DME synthesis

v
by dehydration of methanol at different temperatures. The interactions of methanol
and DME with these catalysts were also investigated by in situ FT-IR.
Silicotungstic acid (STA)/Silica and Tungstophosphoric acid (TPA)/Silica
catalysts were synthesized by following a one-pot hydrothermal route. These
mesoporous catalysts had surface area values of 143-252 m2/g. The STA/SiO2
nanocomposite catalyst having a W/Si atomic ratio of 0.33 showed the highest
activity, with a DME selectivity approaching to 100% and a methanol conversion of
60% at 250°C at a space time of 0.27 s.g.cm-3. Effects of W/Si atomic ratio and the
synthesis procedure on the performance of these novel materials were investigated.
Nanocomposite Nafion/SiO2 solid-acid catalysts having high surface area
values (595-792 m2/g) and narrow pore size distributions (4.3 nm) were successfully
synthesized by a one-pot hydrothermal procedure. Effects of the modifications in the
synthesis procedure concerning the surfactant removal, nafion loading, etc. were
investigated based on the characterization results and activity tests. Nafion was
observed to be uniformly distributed within these mesoporous catalysts. Nafion resin
was also impregnated into aluminosilicate and α-alumina, but one-pot synthesis was
concluded to be better for obtaining well dispersed, nafion incorporated active
catalysts. The Nafion/Silica catalyst synthesized by a nafion/silica weight ratio of
0.15 and washed with 2M sulfuric acid-ethanol solution exhibited the highest activity
due to its highest Brönsted, as well as Lewis acidity. A methanol conversion of 40%
at 300°C, 0.27 s.g.cm-3 and DME selectivity values approaching to 100% over 180°C
were very promising for the synthesis of this green fuel alternate over the new
catalysts synthesized.
Keywords: Dimethyl ether, methanol dehydration, heteropolyacid, nafion,
mesoporous catalyst

vi
ÖZ
METANOLDEN DĐMETĐL ETER SENTEZĐ ĐÇĐN NANOKOMPOZĐT YAPIDA MEZOGÖZENEKLĐ NAFYON VE HETEROPOLĐASĐT
ĐÇEREN KATALĐZÖRLER
Çiftçi, Ayşegül
Yüksek Lisans, Kimya Mühendisliği
Tez Yöneticisi: Prof. Dr. Timur Doğu
Ortak Tez Yöneticisi: Doç. Dr. Naime A. Sezgi
Ağustos 2009, 135 sayfa
Petrol kaynaklarının hızla tükenmesi ve dünya nüfusunun eş zamanlı artışı
sebebiyle alternatif ulaşım yakıtlarına olan ihtiyaç artmaktadır. Hammaddesi petrol
olmayan ve geleceğin cazip alternatif yakıtı olarak kabul edilen dimetil eterin üretimi
çok ilgi çeken bir araştırma alanıdır. Bu potansiyel dizel yakıt alternatifini en verimli
şekilde sentezlemek için farklı yollar ve çeşitli katı asit katalizörler geliştirilmektedir.
Heterojen katalizin amacı yenilenebilir kaynakları değerli kimyasallara
dönüştürmektir. Nafyon reçinesi ve heteropoliasit bileşikleri önemli ölçüde düşük
yüzey alanına sahip etkin asidik katalizörlerdir. Düşük yüzey alanları bu
katalizörlerin katalitik etkinliğini büyük ölçüde sınırlamaktadır. Gözeneksiz etkin
bileşikleri mezogözenekli silika içerikli malzemelerin yapısına katarak katı-asit
katalizörler sentezlemek heterojen kataliz ile değerli kimyasallar üretmeye olanak
vermektedir.
Bu çalışmanın amacı nafyon ve heteropoliasit içerikli nanokompozit
katalizörler sentezlemek, karakterize etmek ve bu malzemeleri kullanarak metanol
vii
dehidrasyonu ile dimetil eter sentezini farklı sıcaklıklarda katalizlemektir. Ayrıca,
metanol ve DME’nin bu katalizörlerle etkileşimi oluştuğu yerde FT-IR çalışmaları
ile incelenmiştir.
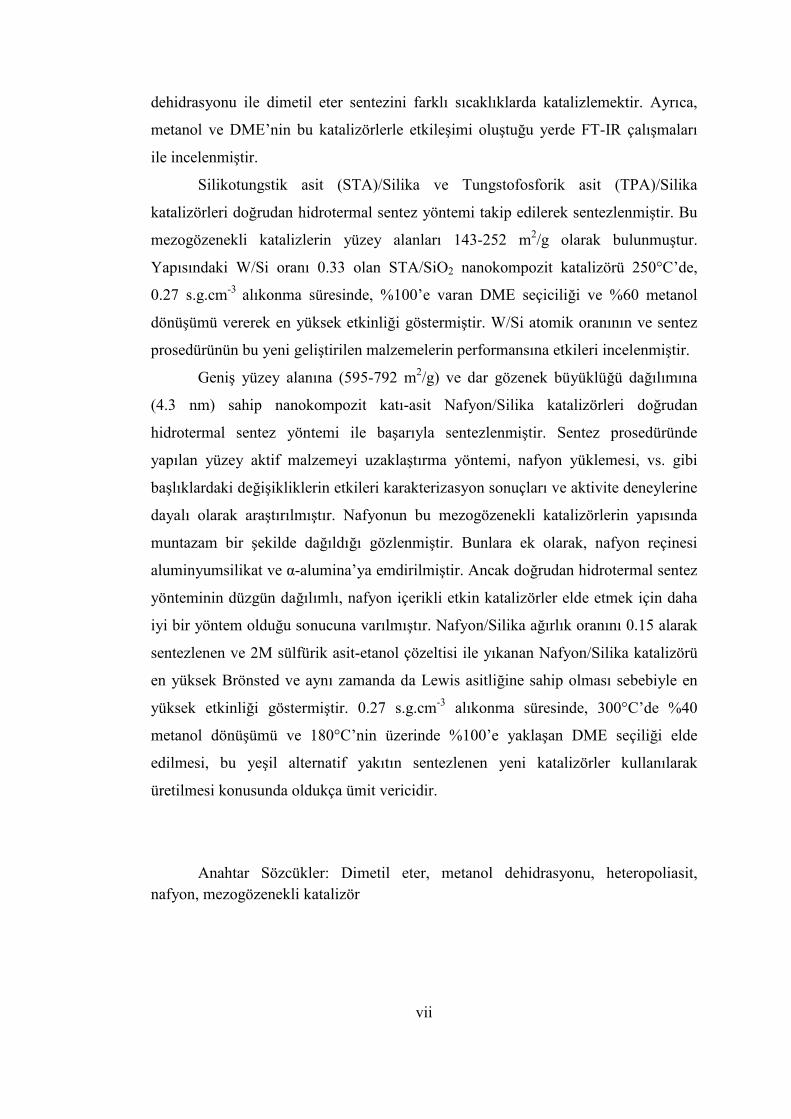
Silikotungstik asit (STA)/Silika ve Tungstofosforik asit (TPA)/Silika
katalizörleri doğrudan hidrotermal sentez yöntemi takip edilerek sentezlenmiştir. Bu
mezogözenekli katalizlerin yüzey alanları 143-252 m2/g olarak bulunmuştur.
Yapısındaki W/Si oranı 0.33 olan STA/SiO2 nanokompozit katalizörü 250°C’de,
0.27 s.g.cm-3 alıkonma süresinde, %100’e varan DME seçiciliği ve %60 metanol
dönüşümü vererek en yüksek etkinliği göstermiştir. W/Si atomik oranının ve sentez
prosedürünün bu yeni geliştirilen malzemelerin performansına etkileri incelenmiştir.
Geniş yüzey alanına (595-792 m2/g) ve dar gözenek büyüklüğü dağılımına
(4.3 nm) sahip nanokompozit katı-asit Nafyon/Silika katalizörleri doğrudan
hidrotermal sentez yöntemi ile başarıyla sentezlenmiştir. Sentez prosedüründe
yapılan yüzey aktif malzemeyi uzaklaştırma yöntemi, nafyon yüklemesi, vs. gibi
başlıklardaki değişikliklerin etkileri karakterizasyon sonuçları ve aktivite deneylerine
dayalı olarak araştırılmıştır. Nafyonun bu mezogözenekli katalizörlerin yapısında
muntazam bir şekilde dağıldığı gözlenmiştir. Bunlara ek olarak, nafyon reçinesi
aluminyumsilikat ve α-alumina’ya emdirilmiştir. Ancak doğrudan hidrotermal sentez
yönteminin düzgün dağılımlı, nafyon içerikli etkin katalizörler elde etmek için daha
iyi bir yöntem olduğu sonucuna varılmıştır. Nafyon/Silika ağırlık oranını 0.15 alarak
sentezlenen ve 2M sülfürik asit-etanol çözeltisi ile yıkanan Nafyon/Silika katalizörü
en yüksek Brönsted ve aynı zamanda da Lewis asitliğine sahip olması sebebiyle en
yüksek etkinliği göstermiştir. 0.27 s.g.cm-3 alıkonma süresinde, 300°C’de %40
metanol dönüşümü ve 180°C’nin üzerinde %100’e yaklaşan DME seçiliği elde
edilmesi, bu yeşil alternatif yakıtın sentezlenen yeni katalizörler kullanılarak
üretilmesi konusunda oldukça ümit vericidir.
Anahtar Sözcükler: Dimetil eter, metanol dehidrasyonu, heteropoliasit, nafyon, mezogözenekli katalizör

viii
To my parents Nejla & Mustafa Çiftçi

ix
ACKNOWLEDGEMENTS
I owe my deepest gratitude to my supervisor Prof. Dr. Timur Doğu who
supported and guided me throughout my studies. He inspired me in a number of
ways including not only my thesis work but also my future career as a chemical
engineer. I cannot thank him enough for his encouragement, his kindly attitude in
every aspect and for these enlightening two years during which I had the chance to
work with him.
I would like to express my sincere thanks to Prof. Dr. Gülşen Doğu and her
research group in Gazi University Chemical Engineering Department for their
support in this work.
I would like to thank my co-supervisor Assoc. Prof. Dr. Naime A. Sezgi for
her positive attitude and help in this study. I am thankful to Assist. Prof. Dr. Dilek
Varışlı for her invaluable guidance and friendly manner throughout my thesis.
I would like to offer my sincere thanks to Prof. Dr. Emiel Hensen from
Eindhoven University of Technology for providing research opportunities in his
laboratory. His help, advice, supervision and the research experience I had in the
Netherlands were priceless. Thanks are not enough to Dr. Volkan Değirmenci for
providing me with all kinds of technical assistance, always sparing time for
discussions and of course his friendship.
I would like to thank Assist. Prof. Dr. Emrah Özensoy and Seda Şentürk from
Bilkent University Chemistry Department for the EDX analyses.
Concerning the characterization analyses, technical assistance of METU
Central Laboratory, Metallurgical and Materials Engineering and Chemical
Engineering staff are greatly appreciated.
Thanks are also due to my friends in Kinetic Lab; Zeynep Obalı, Canan
Martı, Kenan Cem Tokay, Ayça Arınan, Buğçe Aydemir, Sultan Orman and Seval
Gündüz who helped me in many ways. My special thanks go to Zeynep Obalı for
always being so helpful in every technical issue and being so patient in answering all
x
my questions. I am grateful to Canan Martı and Kenan Cem Tokay for their help and
assistance. I would like to thank Ayça Arınan for her help, friendship and all the nice
memories we had in these two years.
I am grateful to my sister, Emel Çiftçi, who has always been supportive and
encouraging in all stages of my life. My aunt, Sema Çiftçi, deserves a special thanks
as she always gave moral support to keep me motivated. I am also thankful to my
parents for their perpetual love and for being understanding and supportive all the
time. I dedicate my thesis to them.
I would like to thank all my friends for always standing by me. Finally, words
alone cannot express the thanks I owe to Selçuk Sandıkcı, who has been my greatest
motivation all the way through my masters studies, for his endless support and faith
in me.
The support received from TÜBĐTAK through BĐDEB scholarship
programme is gratefully acknowledged.
xi
TABLE OF CONTENTS
ABSTRACT ................................................................................................................ iv
ÖZ ............................................................................................................................... vi
ACKNOWLEDGEMENTS ........................................................................................ ix
TABLE OF CONTENTS ............................................................................................ xi
LIST OF TABLES ..................................................................................................... xv
LIST OF FIGURES ................................................................................................. xvii
NOMENCLATURE .................................................................................................. xxi
CHAPTERS
1. INTRODUCTION ................................................................................................. 1
2. DIMETHYL ETHER (DME) AS A DIESEL ALTERNATE FUEL .................... 3
3. DME SYNTHESIS BY DEHYDRATION OF METHANOL .............................. 9
4. MESOPOROUS MATERIALS ........................................................................... 12
5. HETEROPOLYACID (HPA) CATALYSTS ...................................................... 18
5.1. GENERAL PROPERTIES AND CLASSIFICATION OF HPA’S ............ 18
5.2. CATALYTIC APPLICATIONS OF PURE HPA’S ................................... 21
5.3. SALTS OF HPA’S AND THEIR CATALYTIC APPLICATIONS ........... 22
5.4. SUPPORTED HPA’S AND THEIR APPLICATIONS IN ALCOHOL
DEHYDRATION ............................................................................................... 23
6. NAFION RESIN AS A CATALYST .................................................................. 25
6.1. GENERAL PROPERTIES OF NAFION RESIN ....................................... 25
6.2. SUPPORTED NAFION CATALYSTS ...................................................... 27
6.3. CATALYTIC APPLICATIONS OF NAFION BASED CATALYSTS ..... 29
7. THERMODYNAMIC ANALYSIS ..................................................................... 31
8. EXPERIMENTAL ............................................................................................... 36
8.1. SYNTHESIS OF STA/SILICA MESOPOROUS CATALYSTS ............... 36
8.2. SYNTHESIS OF TPA/SILICA MESOPOROUS CATALYSTS ............... 39
8.3. SYNTHESIS OF NAFION/SILICA MESOPOROUS CATALYSTS ........ 40

xii
8.4. SYNTHESIS OF NAFION IMPREGNATED CATALYSTS .................... 44
8.5. MATERIAL CHARACTERIZATION ....................................................... 45
8.5.1. X-Ray Diffraction (XRD) ..................................................................... 45
8.5.2. N2 Physisorption ................................................................................... 46
8.5.3. Scanning Electron Microscopy (SEM) ................................................. 46
8.5.4. Energy Dispersive X-Ray Spectroscopy (EDS-EDX) .......................... 47
8.5.5. X-Ray Photoelectron Spectroscopy (XPS) ........................................... 48
8.5.6. Fourier Transform Infrared Spectroscopy (FTIR) ................................ 48
8.5.7. Thermal Analyses (TGA-DTA) ............................................................ 49
8.5.8. Diffuse Reflectance Infrared Fourier Transform Spectroscopy
(DRIFTS) of Pyridine Adsorption .................................................................. 49
8.6. EXPERIMENTAL SET-UP OF THE METHANOL DEHYDRATION
REACTION SYSTEM ....................................................................................... 50
9. RESULTS AND DISCUSSION .......................................................................... 53
9.1. CHARACTERIZATION OF STA/SILICA CATALYSTS ........................ 53
9.1.1. X-Ray Diffraction (XRD) ..................................................................... 53
9.1.2. Energy Dispersive Spectroscopy (EDS) ............................................... 54
9.1.3. Scanning Electron Microscopy (SEM) ................................................. 55
9.1.4. Energy Dispersive X-Ray Spectroscopy (EDX) ................................... 56
9.1.5. Nitrogen Physisorption ......................................................................... 57
9.1.6. Fourier Transform Infrared Spectroscopy (FTIR) ................................ 60
9.1.7. DRIFTS of Pyridine Adsorbed Samples ............................................... 60
9.2. CHARACTERIZATION OF TPA/SILICA CATALYSTS ........................ 61
9.2.1. Thermal Analyses (TGA-DTA) ............................................................ 61
9.2.2. X-Ray Diffraction (XRD) ..................................................................... 62
9.2.3. Energy Dispersive Spectroscopy (EDS) ............................................... 63
9.2.4. Scanning Electron Microscopy (SEM) ................................................. 63
9.2.5. Nitrogen Physisorption ......................................................................... 64
9.2.6. Fourier Transform Infrared Spectroscopy (FTIR) ................................ 66
9.2.7. DRIFTS of Pyridine Adsorbed Samples ............................................... 66
9.3. CHARACTERIZATION OF NAFION/SILICA CATALYSTS ................. 67
9.3.1. Thermal Analyses (TGA-DTA) ............................................................ 67
9.3.2. X-Ray Diffraction (XRD) ..................................................................... 69
xiii
9.3.3. Energy Dispersive Spectroscopy (EDS) ............................................... 69
9.3.4. Scanning Electron Microscopy (SEM) ................................................. 70
9.3.5. Energy Dispersive X-Ray Spectroscopy (EDX) ................................... 71
9.3.6. X-Ray Photoelectron Spectroscopy (XPS) ........................................... 72
9.3.7. Nitrogen Physisorption ......................................................................... 75
9.3.8. DRIFTS of Pyridine Adsorbed Samples ............................................... 78
9.4. CHARACTERIZATION OF NAFION IMPREGNATED CATALYSTS . 79
9.5. ACTIVITY RESULTS OF STA/SILICA CATALYSTS ........................... 81
9.5.1. The effect of the W/Si ratio ................................................................... 81
9.5.2. The effect of the surfactant removal step .............................................. 83
9.5.3. The effect of space time ........................................................................ 84
9.6. ACTIVITY RESULTS OF TPA/SILICA CATALYSTS ........................... 86
9.7. ACTIVITY RESULTS OF AN STA/ALUMINOSILICATE CATALYST 88
9.8. ACTIVITY RESULTS OF NAFION/SILICA CATALYSTS .................... 90
9.8.1. The comparison of calcination and washing with SAE solution .......... 90
9.8.2. The effect of different washing conditions ........................................... 92
9.8.3. The effect of nafion loading .................................................................. 93
9.9. ACTIVITY RESULTS OF NAFION IMPREGNATED CATALYSTS .... 97
9.9.1. Activity Results of Nafion/Aluminosilicate Catalysts .......................... 97
9.9.2. Activity Results of Nafion/α-Alumina Catalysts .................................. 98
9.10. IN-SITU INFRARED STUDIES : METHANOL AND DME
ADSORPTION AND DESORPTION ON THE CATALYSTS SYNTHESIZED
............................................................................................................................ 99
9.10.1. Methanol Adsorption on Nafion/Silica Catalysts ............................. 100
9.10.2. Methanol Adsorption on Nafion/Aluminosilicate Catalyst .............. 105
9.10.3. Methanol Adsorption on STA/Silica Catalyst .................................. 106
9.10.4. Methanol Adsorption on STA/Aluminosilicate Catalyst .................. 108
9.10.5. DME Adsorption on the Nafion/Silica Catalyst................................ 110
9.10.6. DME Adsorption on the STA/Silica Catalyst ................................... 111
10. CONCLUSIONS AND RECOMMENDATIONS .......................................... 113
REFERENCES ......................................................................................................... 117
APPENDICES
A. PARAMETERS FOR THE REACTION SYSTEM ......................................... 125

xiv
A.1. GC CALIBRATION FACTORS AND RETENTION TIMES OF THE
SPECIES ........................................................................................................... 125
A.2. CALCULATION OF FLOW RATES ...................................................... 125
A.3. EQUATIONS FOR METHANOL CONVERSION, DME YIELD AND
DME SELECTIVITY ....................................................................................... 126
B. SEM IMAGES OF THE MATERIALS ............................................................ 128
C. CALCULATION OF THE EXPECTED F/Si RATIOS FOR NAFION/SILICA
CATALYSTS ................................................................................................... 132
D. SINGLE POINT SURFACE AREAS OF THE CATALYSTS ........................ 133
E. FT-IR SPECTRA OF DEHYDRATED CATALYSTS .................................... 134
xv
LIST OF TABLES
TABLES
Table 1. Physical properties of dimethyl ether [6] ...................................................... 4
Table 2. Properties of dimethyl ether in comparison with diesel oil, methanol and
some other transportation fuel alternates [10] .............................................................. 6
Table 3. The reactions occurring in DME synthesis [7] .............................................. 8
Table 4. The molar heat capacity coefficients of species in the Cp = a + bT + cT2,
where Cp is in J/mol.K ............................................................................................... 32
Table 5. Standard Enthalpies and Gibbs Energies of Formation at 298.15 K for one
mole of Each Substance from its Elements ................................................................ 32
Table 6. Critical temperature (K) and critical pressure (MPa) values for methanol,
DME and water vapor. ............................................................................................... 33
Table 7. Flow rates and molar compositions of the species at equilibrium conversion
.................................................................................................................................... 34
Table 8. Denotation of the synthesized STA/Silica catalysts .................................... 38
Table 9. The nafion sources, starting Nafion/Silica weight ratios and pH of the
synthesis mixtures ...................................................................................................... 43
Table 10. Applied treatments and the denotation of the samples .............................. 43
Table 11. The nafion impregnated catalysts and their nafion/support starting ratios 45
Table 12. The catalysts and the conditions used in the activity tests ........................ 52
Table 13. EDS results of the STA/Silica catalysts .................................................... 55
Table 14. Physical properties of the STA/Silica catalysts ......................................... 58
Table 15. The comparison of the EDS results of TPA-75(L) and TRC-75(L).......... 63
Table 16. Physical properties of TPA-75(L) and TRC-75(L) ................................... 65
Table 17. Starting nafion/silica ratios of the catalysts and their nafion contents ...... 68
Table 18. EDS analysis of NS1 ................................................................................. 70
Table 19. XPS results of the as-synthesized catalysts ............................................... 74
Table 20. XPS results of the final form of the catalysts (after surfactant removal) .. 74
Table 21. Physical properties of the as-synthesized catalysts ................................... 76

xvi
Table 22. Physical properties of the final form of the catalysts (after surfactant
removal) ..................................................................................................................... 76
Table 23. Physical properties of the nafion impregnated catalysts ........................... 80
Table 24. Results of the stability tests and regeneration experiments over TRC-75(L)
at 0.27 s.g.cm-3 ........................................................................................................... 86
Table 25. GC calibration factors and retention times .............................................. 125
Table 26. Single point surface areas of some of the catalysts ................................. 133
xvii
LIST OF FIGURES
FIGURES
Figure 1. The chemical structure of dimethyl ether [6]............................................... 4
Figure 2. Multiple uses of dimethyl ether [8].............................................................. 5
Figure 3. DME synthesis by methanol dehydration (conventional process) [13] ....... 7
Figure 4. Direct synthesis of DME (Haldor Topsoe or JFE Holdings) [13] ............... 8
Figure 5. Formation pathway of ordered mesoporous materials [22] ....................... 13
Figure 6. TEM micrograph of MCM-41 [23] ........................................................... 14
Figure 7. Powder X-Ray diffraction pattern of MCM-41 [24] ................................. 15
Figure 8. Nitrogen adsorption/desorption isotherm of MCM-41 [25] ...................... 16
Figure 9. The primary structure of Keggin HPA’s. [31] ........................................... 19
Figure 10. Keggin structure [30] ............................................................................... 19
Figure 11. The primary structure of Wells-Dawson HPA’s. [31] ............................. 19
Figure 12. Structure of nafion resin [50] ................................................................... 25
Figure 13. The equilibrium curves for methanol dehydration at 1 bar and 30 bars .. 35
Figure 14. Synthesis procedure of STA/Silica catalysts ........................................... 38
Figure 15. Synthesis procedure of TPA/Silica catalysts ........................................... 39
Figure 16. Synthesis procedure of the Nafion/Silica catalysts .................................. 42
Figure 17. Synthesis procedure of nafion impregnated catalysts ............................. 44
Figure 18. Experimental set-up of the methanol dehydration reaction system ......... 51
Figure 19. XRD patterns of STA/Silica catalysts ..................................................... 54
Figure 20. SEM image of TRC-75(L) ....................................................................... 55
Figure 21. SEM image of TRC-75(L) ....................................................................... 56
Figure 22. SEM image of TRC-75-400 ..................................................................... 56
Figure 23. EDX elemental mapping analysis of TRC-75(L) .................................... 57
Figure 24. EDX elemental mapping analysis of TRC-75-400 .................................. 57
Figure 25. Nitrogen adsorption-desorption isotherm of TRC-75(L)........................ 59
Figure 26. Pore size distributions of the STA/Silica catalysts .................................. 59
Figure 27. FTIR spectra of STA/Silica catalysts and pure STA ............................... 60

xviii
Figure 28. DRIFTS spectra of the STA/Silica catalysts............................................ 61
Figure 29. TGA-DTA analysis of TPA-75(L) .......................................................... 62
Figure 30. X-ray diffraction pattern of TPA-75(L) ................................................... 62
Figure 31. SEM image of TPA-75(L) ....................................................................... 64
Figure 32. SEM image of TPA-75(L) ....................................................................... 64
Figure 33. Nitrogen adsorption-desorption isotherm of TPA-75(L) ......................... 65
Figure 34. Pore size distribution of TPA-75(L) ........................................................ 65
Figure 35. FTIR spectra of pure TPA and TPA-75(L) .............................................. 66
Figure 36. DRIFTS spectra of TPA-75(L) ................................................................ 67
Figure 37. TGA-DTA analysis of NS3 ..................................................................... 68
Figure 38. XRD patterns of NS1, NS1R and NS1350 catalysts .............................. 69
Figure 39. SEM image of NS3R1 ............................................................................. 70
Figure 40. SEM image of NS4R2 ............................................................................. 71
Figure 41. SEM image of NS4R2 ............................................................................. 71
Figure 42. EDX elemental mapping of Nafion/Silica nanocomposite (NS1R) ........ 72
Figure 43. XPS spectrum of NS4R2 ......................................................................... 73
Figure 44. Nitrogen adsorption-desorption isotherm of NS3R2 ............................... 77
Figure 45. Nitrogen adsorption-desorption isotherm of NS4R2 ............................... 77
Figure 46. Pore size distributions of Nafion/Silica catalysts .................................... 78
Figure 47. DRIFTS spectra of the Nafion/Silica catalysts ........................................ 79
Figure 48. MeOH conversion over TRC-62(L), TRC-75(L), TRC-82(L) and TRC-
92(L) at 0.27 s.g/cm3 between 180-350°C ................................................................. 82
Figure 49. DME selectivities over TRC-62(L), TRC-75(L), TRC-82(L) and TRC-
92(L) at 0.27 s.g/cm3 between 180-350°C ................................................................. 82
Figure 50. MeOH conversion over TRC-75(L), TRC-75(L)-CO2 and TRC-75-400
at 0.27 s.g/cm3 between 180-350°C ........................................................................... 83
Figure 51. DME selectivities over TRC-75(L), TRC-75(L)-CO2 and TRC-75-400 at
0.27 s.g/cm3 between 180-350°C ............................................................................... 84
Figure 52. MeOH conversion over TRC-75(L) at different space times between 180-
350°C ......................................................................................................................... 85
Figure 53. DME selectivities over TRC-75(L) at different space times between 180-
350°C ......................................................................................................................... 85
xix
Figure 54. MeOH conversion over TPA-75(L) and TRC-75(L) at 0.27 s.g/cm3
between 180-250°C .................................................................................................... 87
Figure 55. DME selectivities over TPA-75(L) and TRC-75(L) at 0.27 s.g/cm3
between 180-250°C .................................................................................................... 87
Figure 56. Methanol conversion over STAMAS at 0.27 s.g/cm3 between 180-350°C
.................................................................................................................................... 88
Figure 57. DME selectivities over STAMAS at 0.27 s.g/cm3 between 180-350°C .. 89
Figure 58. Stability test over STAMAS at 250°C at 0.27 s.g.cm-3 ........................... 89
Figure 59. MeOH conversion over NS1R, NS1250, NS1350 and NS1 at 0.27 s.g/cm3
between 120-300°C .................................................................................................... 91
Figure 60. DME selectivities over NS1R, NS1250, NS1350 and NS1 at 0.27 s.g/cm3
between 120-300°C .................................................................................................... 91
Figure 61. MeOH conversion over NS3R2, NS3R1 and NS3A at 0.27 s.g/cm3
between 120-300°C .................................................................................................... 92
Figure 62. DME selectivities over NS3R2, NS3R1 and NS3A at 0.27 s.g/cm3
between 120-300°C .................................................................................................... 92
Figure 63. MeOH conversion over NS5R2, NS4R2, NS3R2 and NS1R at 0.27
s.g/cm3 between 120-300°C ....................................................................................... 94
Figure 64. DME selectivities over NS5R2, NS4R2, NS3R2 and NS1R at 0.27
s.g/cm3 between 120-300°C ....................................................................................... 94
Figure 65. Stability test over NS4R2 at 300°C at 0.27 s.g.cm-3 ................................ 95
Figure 66. Reproducibility check over NS4R2 at 0.27 s.g.cm-3................................ 96
Figure 67. DME yield over nafion/aluminosilicate catalysts at 0.27 s.g/cm3 between
120-300°C .................................................................................................................. 97
Figure 68. DME yield over nafion/aluminosilicate catalysts at 0.27 s.g/cm3 between
120-400°C .................................................................................................................. 98
Figure 69. DME yield over nafion/α-alumina and pure α-alumina at 0.27 s.g/cm3
between 180-400°C .................................................................................................... 99
Figure 70. Hydrate structres in Nafion membrane swollen with water [73] ........... 100
Figure 71. FT-IR spectra for methanol adsorption and desorption on NS4R2 catalyst
.................................................................................................................................. 102

xx
Figure 72. FT-IR spectra for methanol adsorption and desorption on NS3R1 catalyst
at different temperatures : RT, 120°C, 150°C, 200°C, 250°C, 300°C, 350°C, 400°C,
500°C ....................................................................................................................... 104
Figure 73. Proposed reaction mechanism for methanol dehydration ...................... 105
Figure 74. FT-IR spectra for methanol adsorption and desorption on NFMAS3
catalyst at different temperatures : RT, 120°C, 150°C, 200°C, 250°C, 300°C, 350°C,
400°C ....................................................................................................................... 106
Figure 75. FT-IR spectra for methanol adsorption and desorption on TRC-75-400
catalyst at different temperatures : RT, 100°C, 200°C, 250°C, 300°C, 350°C, 400°C,
500°C ....................................................................................................................... 108
Figure 76. FT-IR spectra for methanol adsorption and desorption on STAMAS
catalyst at different temperatures : RT, 100°C, 200°C, 250°C, 300°C, 350°C, 500°C
.................................................................................................................................. 109
Figure 77. FT-IR spectra for DME adsorption and desorption on catalyst at NS4R2
different temperatures : RT, 5 min. after evacuation (RT-2), 120°C, 150°C, 200°C
.................................................................................................................................. 110
Figure 78. FT-IR spectra for DME adsorption and desorption on TRC-75-400
catalyst at different temperatures : RT, 100°C, 200°C, 250°C, 300°C, 350°C, 400°C,
500°C ....................................................................................................................... 112
Figure 79. SEM images of the nafion/silica catalyst (NS1R) ................................. 128
Figure 80. SEM images of the nafion/silica catalyst (NS3A) ................................. 128
Figure 81. SEM images of the nafion/silica catalyst (NS3R2) ............................... 129
Figure 82. SEM images of the nafion/silica catalyst (NS1) .................................... 129
Figure 83. SEM images of the nafion/aluminosilicate catalyst (NFMAS2) ........... 130
Figure 84. SEM image of the nafion/aluminosilicate catalyst (NFMAS3) ............. 130
Figure 85. SEM images of the nafion/α-alumina catalyst (NFALFA1).................. 131
Figure 86. SEM image of the STA/Silica catalyst (TRC-75-400) .......................... 131
Figure 87. FT-IR spectra of dehydrated Nafion incorporated catalysts .................. 134
Figure 88. FT-IR spectra of dehydrated STA incorporated catalysts ..................... 135
xxi
NOMENCLATURE
Cp: Heat Capacity (J/mol.K)
DME: Dimethyl Ether
DTA: Differential Thermal Analysis
DRIFTS: Diffuse Reflectance Infrared Fourier Transform Spectroscopy
EDS-EDX: Energy Dispersive X-Ray Spectroscopy
f: Fugacity (bar)
F: Molar flow rate (mol/hr)
FA: Formaldehyde
FT-IR: Fourier Transform Infrared Spectroscopy
G: Gibbs Free Energy (kJ/mol)
H: Enthalpy (kJ/mol)
IUPAC: International Union of Pure and Applied Chemistry
K: Equilibrium Constant
MW: Molecular weight (g/mol)
MCM: Mobil Composition of Matter
MeOH: Methanol
n: Mole
P: Pressure (bar)
Q: Volumetric flow rate (ml/min)
R: Gas constant (8.314 J/mol.K)
S: Selectivity
SEM: Scanning Electron Microscopy
T: Temperature (°C)
TGA: Thermogravimetric Analysis
X: Conversion
XPS: X-Ray Photoelectron Spectroscopy
XRD: X-Ray Diffraction
y: Molar composition

xxii
Y: Yield
ρ: Density (g/cm3)
1
CHAPTER 1
INTRODUCTION
Due to the fast depletion of oil reserves and increasing rate of global
warming, researchers have been seeking for environmentally friendly non-petroleum
derived fuel alternatives. Alcohols and ethers are considered as alternative fuels due
to their good burning characteristics and environmentally friendly aspects. Among
them, dimethyl ether (DME) is considered as a clean alternative transportation fuel
having excellent qualities as a diesel fuel alternate with very low NOx emissions, no
black smoke formation and with a significantly high cetane number (55-60) [1].
Presently, the commercial method for DME synthesis is by dehydration of methanol.
This reaction is carried out in the presence of solid acid catalysts like H-ZSM-5 [2],
γ-Al2O3 [3], Amberlyst-35 [4], etc. at atmospheric pressure.
Heteropolyacids and nafion are two types of acidic catalysts which are known
to catalyze alcohol dehydration reactions. However, both of them have low surface
areas; hence their catalytic activity in vapor phase dehydration of methanol is
limited. High surface area silicate structured mesoporous molecular sieves with
narrow pore size distributions are considered to be excellent support materials. By
incorporation of metals and metal oxides into their structures following one-pot or
impregnation procedures, novel heterogeneous catalysts with high surface areas and
active acidic sites are obtained.
In this study, nafion and heteropolyacids incorporated silicate structured
mesoporous catalysts having high surface areas were synthesized, characterized and
their catalytic activities in methanol dehydration reaction to synthesize DME were
tested in a fixed bed flow reactor system.
In the Chapters 2, 3, 4, 5 and 6 a detailed literature survey is provided. In
Chapter 2, general information on dimethyl ether is given. Green aspects of DME are
2
explained and its advantages as a diesel-alternate fuel are presented by comparison
with other fuels based on various physical properties of DME. Moreover,
information on the chemistry of different DME synthesis routes is given. Chapter 3
summarizes the related work in literature concerning the different types of solid acid
catalysts and reaction conditions used in methanol dehydration reaction. Chapter 4
focuses on mesoporous materials. Catalytic aspects, synthesis and characterization of
the M41S family are discussed in detail. In Chapter 5, heteropolyacids are explained
in all aspects. Supported forms and salts of HPA’s are presented. The use of them in
catalytic reactions is explained by giving examples from the previous studies.
Chapter 6 focuses on the nafion resin as an acidic catalyst in heterogeneous catalysis.
Information on the catalytic properties of nafion resin is given. Furthermore, details
about the synthesis of supported nafion catalysts and their use in catalytic reactions,
although very few, are discussed.
In Chapter 7, thermodynamic analysis of the reaction system is done. The
equilibrium curve for the methanol dehydration reaction is given as a function of
temperature at different pressures.
Chapter 8 presents experimental procedures concerning the synthesis of the
novel catalytic materials produced in this work. The different characterization
techniques applied to the synthesized catalysts are explained and the instruments
used are presented. The experimental set-up of the methanol dehydration reaction
system is explained in detail.
In Chapter 9, the results related to the characterization analyses of the
catalysts and the activity tests in DME synthesis from methanol are given. The
catalysts are compared based on their characteristics and catalytic activities. The
effect of temperature on methanol conversion and DME selectivities are investigated.
Also, results of the in situ infrared studies of methanol and DME adsorption and
desorption on the synthesized catalysts are presented and the obtained FT-IR spectra
are discussed. Finally, conclusions and recommendations on the work done are given
in Chapter 10.

3
CHAPTER 2
DIMETHYL ETHER (DME) AS A DIESEL ALTERNATE FUEL
The two conventional transportation fuels in use today are gasoline and diesel
oil. Gasoline is a petroleum-derived mixture consisting mostly of aliphatic
hydrocarbons enhanced with aromatic hydrocarbons. Similarly diesel oil is known as
a hydrocarbon mixture produced from petroleum. It contains more carbon atoms in
longer chains than gasoline. It is heavier, evaporates more slowly and has a higher
energy density than gasoline. Thus, the efficiency of diesel oil as a fuel is higher than
gasoline. Diesel engines are different from gasoline engines. In conventional
gasoline engines sparkplugs are used to ignite the fuel/air mixture in the engine’s
cylinders, whereas in diesel engines ignition is achieved by the self-ignition
properties of the fuel under specific high-temperature and high-pressure conditions.
The compression ratio of a gasoline engine is generally around 8-9 to 1, whereas the
compression ratio of a diesel engine is about 17 to 1. In the early 1970s, diesel
engines were started to be used to power personal automobiles due to their better fuel
economy when compared to gasoline engines. However, with the use of diesel fuel
high amounts of nitrogen compounds and particulate matter are released to the
atmosphere, which lead to acid rain and poor health conditions. Also, emissions due
to the combustion of fossil fuels such as carbon dioxide, sulfur oxides and nitrogen
oxides, etc. contribute to global warming. Therefore, a clean alternative fuel is
desired and dimethyl ether (DME) is considered as an environmentally benign
transportation fuel alternate due to its characteristics as a high quality fuel [5].
The chemical structure of dimethyl ether, also known as methyl ether, methyl
oxide and wood ether is given in Figure 1.
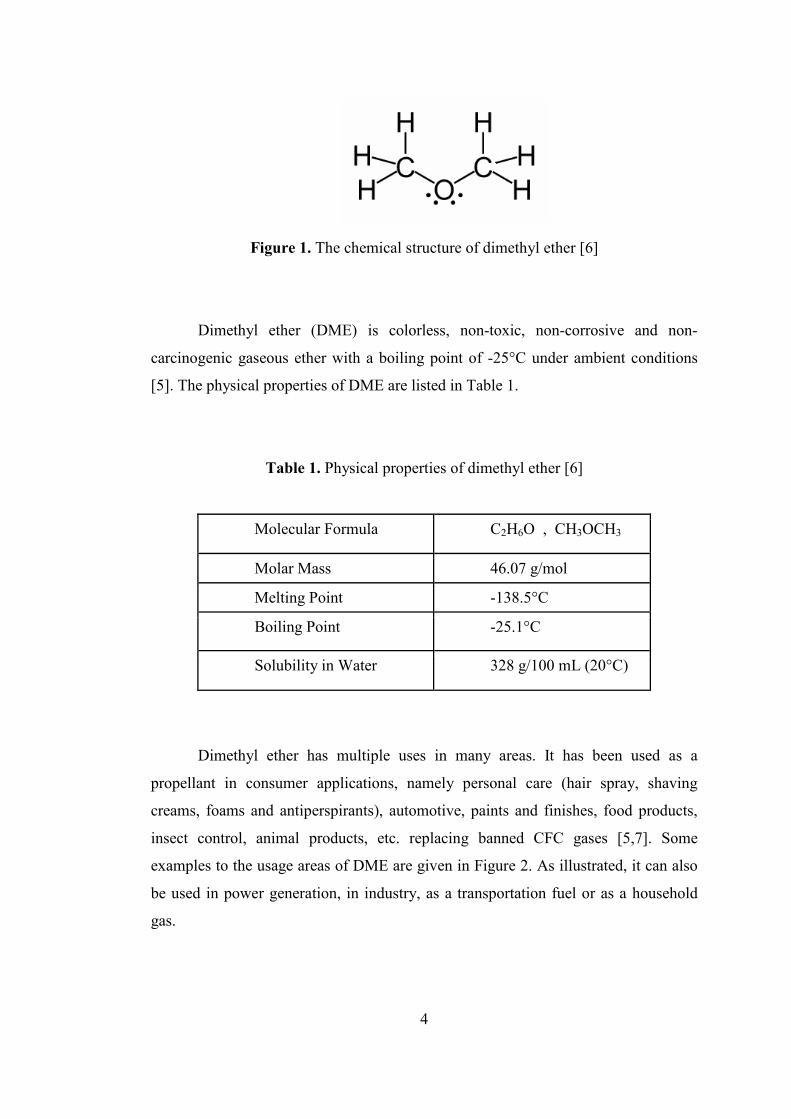
4
Figure 1. The chemical structure of dimethyl ether [6]
Dimethyl ether (DME) is colorless, non-toxic, non-corrosive and non-
carcinogenic gaseous ether with a boiling point of -25°C under ambient conditions
[5]. The physical properties of DME are listed in Table 1.
Table 1. Physical properties of dimethyl ether [6]
Molecular Formula C2H6O , CH3OCH3
Molar Mass 46.07 g/mol
Melting Point -138.5°C
Boiling Point -25.1°C
Solubility in Water 328 g/100 mL (20°C)
Dimethyl ether has multiple uses in many areas. It has been used as a
propellant in consumer applications, namely personal care (hair spray, shaving
creams, foams and antiperspirants), automotive, paints and finishes, food products,
insect control, animal products, etc. replacing banned CFC gases [5,7]. Some
examples to the usage areas of DME are given in Figure 2. As illustrated, it can also
be used in power generation, in industry, as a transportation fuel or as a household
gas.

5
Figure 2. Multiple uses of dimethyl ether [8]
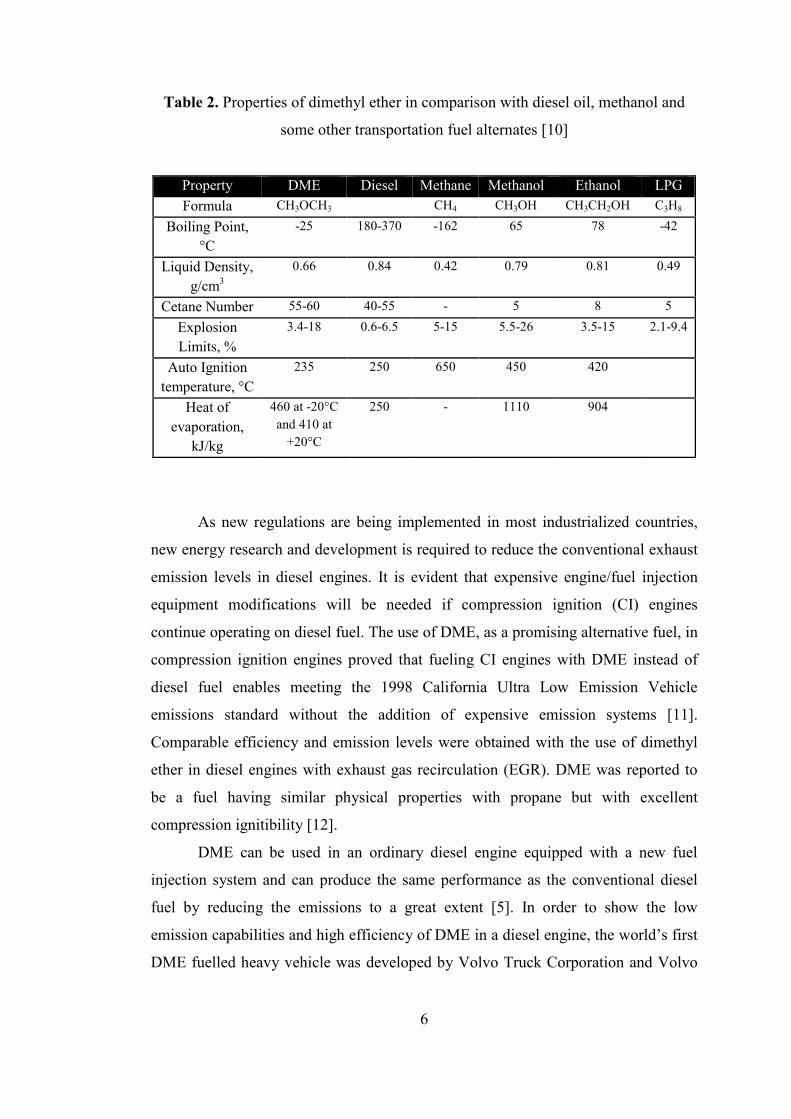
Dimethyl ether is considered as a green diesel-alternate fuel with excellent
clean burning properties. It is compared with other fuel alternatives in Table 2.
Cetane number of a fuel is the indication of its auto-ignition property under high heat
and pressure and it is the key parameter for a diesel fuel. The cetane number of the
conventional diesel fuel is about 40-55. As can be seen in Table 2, the cetane number
of DME is greater than 55, which is higher than the cetane number of conventional
diesel oil. This is the main reason why DME is considered as an excellent substitute
for diesel fuel. Also, ignition point of DME is very close to the ignition point of
diesel fuel.
In addition to these, DME is a clean-burning fuel and has no negative effects
on health and on ozone layer depletion. Different from petroleum derived diesel fuel,
DME produces no soot, black smoke or particulate matter emission. It causes no SOx
emissions, low amounts of CO2 emissions, very low NOx emissions and other
emissions even without exhaust gas after-treatment [5]. Also, use of dimethyl ether
in diesel engines leads to low engine noise. Moreover, DME as a transportation fuel
is highly economical when compared to the other alternative fuels. In terms of fuel
distribution, since it can easily be liquefied and can be stored and transported in
pressurized tanks like LPG, distribution of DME is rather easy [9].
Boiler Turbines
Diesel engines
Fuel cells
Industrial furnaces, boilers
Chemical feedstock
Household gas
Regional heating/cooling
cogeneration
Diesel vehicles
Fuel Cell Vehicles
6
Table 2. Properties of dimethyl ether in comparison with diesel oil, methanol and
some other transportation fuel alternates [10]
Property DME Diesel Methane Methanol Ethanol LPG Formula CH3OCH3 CH4 CH3OH CH3CH2OH C3H8
Boiling Point, °C
-25 180-370 -162 65 78 -42
Liquid Density, g/cm3
0.66 0.84 0.42 0.79 0.81 0.49
Cetane Number 55-60 40-55 - 5 8 5
Explosion Limits, %
3.4-18 0.6-6.5 5-15 5.5-26 3.5-15 2.1-9.4
Auto Ignition temperature, °C
235 250 650 450 420
Heat of evaporation,
kJ/kg
460 at -20°C and 410 at
+20°C
250 - 1110 904
As new regulations are being implemented in most industrialized countries,
new energy research and development is required to reduce the conventional exhaust
emission levels in diesel engines. It is evident that expensive engine/fuel injection
equipment modifications will be needed if compression ignition (CI) engines
continue operating on diesel fuel. The use of DME, as a promising alternative fuel, in
compression ignition engines proved that fueling CI engines with DME instead of
diesel fuel enables meeting the 1998 California Ultra Low Emission Vehicle
emissions standard without the addition of expensive emission systems [11].
Comparable efficiency and emission levels were obtained with the use of dimethyl
ether in diesel engines with exhaust gas recirculation (EGR). DME was reported to
be a fuel having similar physical properties with propane but with excellent
compression ignitibility [12].
DME can be used in an ordinary diesel engine equipped with a new fuel
injection system and can produce the same performance as the conventional diesel
fuel by reducing the emissions to a great extent [5]. In order to show the low
emission capabilities and high efficiency of DME in a diesel engine, the world’s first
DME fuelled heavy vehicle was developed by Volvo Truck Corporation and Volvo

7
Bus Corporation in 1996-1998. DME was seen to have unique auto-ignition
capabilities due to its high cetane number with much less amount of pollution
produced as a result of combustion when compared to diesel fuel. The European
Union, Japan and China have buses which can technically run on DME. Based on
Nissan’s DME technology, Japan has introduced the DME technology for trucks into
US for pilot trials [10].
Dimethyl ether production requires minimum two steps. First step is the
conversion of hydrocarbons into synthesis gas, which consists of a combination of
carbon monoxide and hydrogen. The synthesis gas is then converted to DME by
following two possible routes. Conventional method is by methanol dehydration as
shown in Figure 3. In this route, syngas (containing carbon monoxide and hydrogen)
is converted to methanol. Then methanol is converted to DME by methanol
dehydration reaction. Currently, DME production is achieved by methanol
dehydration.
Figure 3. DME synthesis by methanol dehydration (conventional process) [13]
Second method is the direct synthesis of DME from synthesis gas (Figure 4).
In this route, methanol dehydration step is eliminated and syngas is directly
converted to DME. DME production by combining the methanol synthesis and
dehydration steps in a single process (direct synthesis procedure) is under
development.
NG
Coal
Biomass
Syngas
(CO+H2) Methanol
(CH3OH)
DME
+
H2O
water
DME

8
Figure 4. Direct synthesis of DME (Haldor Topsoe or JFE Holdings) [13]
The reactions involved in DME synthesis are given in Table 3. Being directly
derived from methanol, a variety of feedstocks can be used in DME production such
as coal, natural gas, biomass, etc. or reductive CO2 recycling. The widely used
feedstock for DME production is natural gas. The global demand for DME was given
as 150000 tons per year by Olah et al. (2006) [5]. However, it was stated that if large
quantities of DME was to be used as fuels the demand would be much higher.
Table 3. The reactions occurring in DME synthesis [7]
Reaction Chemistry ∆H°298K (kJ/mol)
Partial oxidation reforming
CH4 + ½ O2
CO + 2 H2 -36.0
Steam reforming CH4 + H2O CO + 3 H2 206.0
Gas/water shift reaction
CO + H2O
CO2 + H2 -40.9
Methanol synthesis
CO + 2 H2 CH3OH -50.1 CO2 + 3H2 CH3OH + H2O -50.1
Methanol dehydration
2 CH3OH
CH3―O―CH3 + H2O -23.3
DME direct synthesis
2 CO + 4 H2 3 CO + 3 H2
CH3―O― CH3 + H2O CH3―O― CH3 + CO2
-205.0 -246.2
Overall DME synthesis
2 CH4 + O2
CH3―O― CH3 + H2O
NG
Coal
Biomass
Syngas
(CO+H2) Methanol
(CH3OH)
DME
+
CO2
CO2
DME

9
CHAPTER 3
DME SYNTHESIS BY DEHYDRATION OF METHANOL
Dimethyl ether (DME) synthesis by methanol dehydration is a heterogeneous
catalytic reaction. The gas phase reaction is exothermic (∆HR~ -23 kJ/mol) and
reversible. It takes place in the presence of solid acid catalysts at atmospheric
pressure and in a wide temperature range (up to 400ºC) depending on the type of the
solid acid catalyst used. The reaction is shown below.
OHOCHCHOHCH 23332 +→← (1)
Up to now, many different types of catalysts have been tested in DME
synthesis by methanol dehydration.
Fu et al. [2] studied the activity of H-ZSM-5 and SDY catalysts in methanol
dehydration. Also the activity of γ-alumina (γ-Al2O3) and Ti(SO4)2 modified γ-Al2O3
were tested between 127ºC-327ºC at atmospheric pressure in a stainless steel fixed
bed reactor. They concluded that H-ZSM-5 showed the highest activity in methanol
dehydration. However, it was reported that H-ZSM-5, due to its high acidity also
caused conversion of methanol to hydrocarbons and resulted in coking on the
catalyst surface. Coking is the formation of hydrocarbons on the strong acid sites on
the surface of the catalyst which appears to be a serious problem since it inhibits the
catalytic activity of the catalysts by causing deactivation. It was found that the
addition of Ti(SO4)2 increased the catalytic activity of γ-Al2O3 by increasing the
number and strength of Brönsted acid sites in the catalyst structure. A methanol
conversion of 0.85 could be obtained 227ºC. Another conclusion reached in this
study was that Brönsted acid sites might be more active than Lewis acid sites in
methanol dehydration reaction.
10
In another study by Vishwanathan et al. [14], highly acidic H-ZSM-5
catalysts were modified by Na at different loadings (up to 80 mol%) and tested in
reaction in a fixed-bed micro-reactor between 230-340ºC. It was concluded that
increasing the Na loading of the catalysts led to a decrease in the strength of the acid
sites and increased the resistance of the catalyst against hydrocarbon formation.
Yaripour et al. [3] prepared solid-acid catalysts by sol-gel method.
Specifically, they worked on γ-Al2O3 and silica modified γ-Al2O3 (at 1,3,6,9,15 wt%
loading). Methanol dehydration reactions were carried out at 300ºC in a quartz fixed
bed reactor at atmospheric pressure. As for the catalytic activity, silica modified γ-
Al2O3 showed better results than untreated γ-Al2O3. With increasing silica loading
surface areas and surface acidity values of the catalysts increased. Catalysts with
surface areas higher than 250 m2/g were synthesized and the one with 6 wt% silica
loading showed the best conversion (85%) without leading to formation of any side
product during the reaction. According to this study, DME synthesis takes place on
sites with weak and medium acidity. Again, the dependence of methanol dehydration
on Brönsted acid sites is emphasized here.
In another study of Yaripour et al. [15], aluminum phosphates with Al/P
molar ratio of 1,2,3 and silica-titania (SiO2-TiO2) catalysts with 25,50,75 wt% silica
loading were synthesized. Catalytic activities of phosphorus modified γ-Al2O3
catalysts were found to be higher than the untreated γ-Al2O3. AlPO4 (with Al/P=2)
showed 83.3% conversion without leading to formation of any side products. An
increase in surface area values and a decrease in the surface acidities of the catalysts
were observed with increasing Al/P molar ratio. Silica-titania catalysts showed low
activity and it was attributed to their low surface areas (below 60 m2/g) and low
concentration of the acid sites on their surface. An important conclusion reached in
this study concerning the aluminosilicate type catalysts was that the strength of the
acid sites of γ-Al2O3 should be reduced in order to prevent coke formation. In
phosphorus modified alumina catalysts reduction in coking, hence decrease in the
amount of by-products was achieved.
Fei et al. [16] studied HY zeolite and modified forms of HY zeolite in
methanol dehydration. Reaction was carried out at 245ºC in a stainless-steel fixed
bed reactor. Fe, Co, Ni, Cr and Zr modified HY zeolites were prepared and it was
found that all the catalysts except the Fe modified zeolite exhibited high initial
11
activity (86% conversion). Zr-HY and Ni-HY catalysts were observed to be more
stable than the rest of the samples. This advantage resulted from the lower
concentration of acid sites on their surface. On the other hand, Fe-HY, Co-HY, Cr-
HY and HY itself were observed to deactivate during methanol dehydration reaction.
Xu et al. [17] used γ-Al2O3, H-ZSM-5, amorphous silica-alumina and titania
modified zirconia. The reactions were carried out in a plug flow reactor made of
fused quartz. It was observed that all the catalysts were active and selective towards
dimethyl ether formation. Silica-alumina catalysts were tested in a temperature range
of 140-190ºC. As the silica content increased the activity of the catalysts decreased.
Among the catalysts tested at 280ºC, the highest activity was achieved with the
amorphous silica-alumina catalyst with 20 wt% silica content.
In the study of Khom-in et al. [18], methanol dehydration to synthesize
dimethyl ether was carried out in the presence of nanocrystalline alumina with mixed
γ and χ phases. The catalysts were synthesized by solvothermal method. The γ-Al2O3
catalyst containing 20 wt% χ-phase showed the highest catalytic activity when
compared to pure γ and χ phases. The DME yield obtained with this catalyst was
86%.
12
CHAPTER 4
MESOPOROUS MATERIALS
Heterogeneous catalysis has a very important role in the development and
application of green processes. In order to eliminate toxic wastes produced as a result
of harmful, environmentally hazardous processes, solid materials can be utilized
instead of liquid acid catalysts. Porous materials received great attention in the past
years owing to their useful applications as catalysts and catalyst supports.
Based on the IUPAC definition, porous materials can be classified as
microporous (pore size less than 2 nm), mesoporous (pore size between 2-50 nm)
and macroporous (pore size higher than 50 nm) materials. Zeolites are the most well-
known member of the microporous materials family. They have very narrow and
uniform micropore size distribution. Although it is possible to synthesize very stable
zeolites, they have a serious disadvantage which limits their applications in catalytic
reactions. Since their pore diameters are very narrow, they lose their efficiency when
large reactant molecules with pore diameters larger than theirs are present in the
reaction medium. Mass transfer limitations are dominant in such cases. For this
reason, it was aimed to synthesize crystalline materials with increased pore sizes.
The discovery of ordered mesoporous materials is considered as the
beginning of a new era in catalysis. In 1992, Mobile Research and Development
Corporation used the surfactant templating method to synthesize a new family of
ordered mesoporous silicates called as M41S. This new type of mesoporous
structures have large surface areas and very narrow pore size distributions. The pore
diameters can be tuned from 15 to 100 Å. Changing the synthesis conditions,
different materials can be obtained. The class consisting of a hexagonal phase is
known as MCM-41. Another class which is formed of a cubic phase is referred to as
13
MCM-48. An unstable lamellar phase which can be stabilized by post-synthesis
treatment with tetraethylorthosilicate (TEOS) is called as MCM-50 [19,20,21].
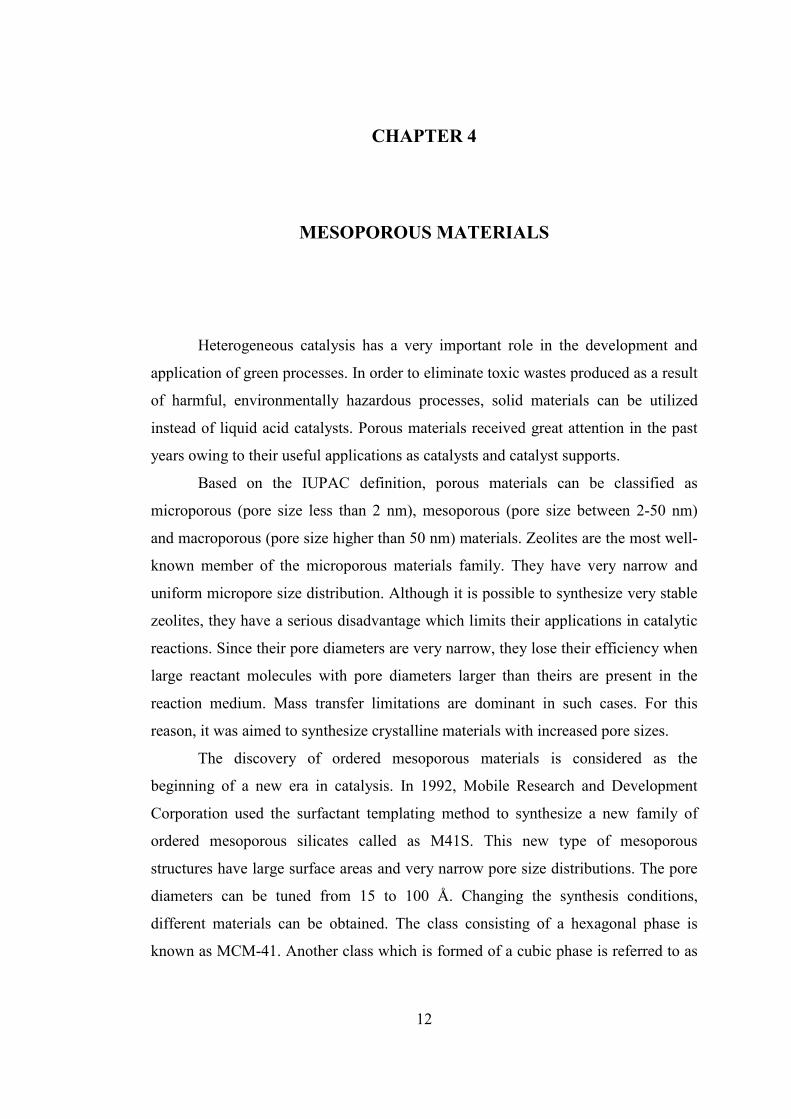
Figure 5. Formation pathway of ordered mesoporous materials [22]
Figure 5 shows the formation of MCM-41, a highly ordered hexagonal array
of unidimensional pores with a very narrow pore size distribution. The Mobile group
has two proposals for the formation mechanism of M41S silicates. In the first
pathway, it is proposed that by self organization of the surfactant molecules a liquid
crystalline phase is formed which acts as the template. The silicates polymerize to
form a rigid shell around the hydrophilic parts of the aggregated surfactant. The
second pathway suggests that silicate species in solution direct the formation of the
organic-inorganic mesophase with the help of the charge balance with the surfactant
ions [20].
Basically, four components are used in the synthesis of M41S type materials.
Structure directing surfactants, a source of silica, a solvent and an acidic or basic
catalyst. Researchers at Mobile R&D group used alkyl trimethyl ammonium halides
as the surfactant. As the source of silica sodium silicate, tetraethoxy silicate (TEOS),
fumed silica and Ludox were used. Sodium hydroxide and tetraethyl ammonium
hydroxide were also added to the solution. When it was aimed to synthesize
aluminosilicate materials, an aluminum source was also used. The aqeuos synthesis
solutions were kept at temperatures of 100-150°C for 24-144 hours. After filtering,

14
washing and drying the solid products, the materials were calcined at 540°C under
the flow of air or nitrogen. Porous structures were obtained as final products [19].
In order to observe the ordered mesoporous structures of the materials,
Transmission Electron Microscopy (TEM) is used. The ordered hexagonal pore
shape of MCM-41 can be clearly observed by TEM in Figure 6.
Figure 6. TEM micrograph of MCM-41 [23]
The powder X-ray diffraction (XRD) pattern of MCM-41 is shown in Figure
7. It is assigned to a hexagonal unit cell. In the typical XRD pattern of MCM-41,
three to five reflections at 2Θ values between 2-5° are observed. The X-Ray
diffraction patterns of mesoporous materials have reflection peaks only in the low-
angle range, at 2θ less than 10. Thus, it is concluded that their pore walls are mainly
amorphous [19]. The sharp peak at 2° and the reflections are indexed as (100), (110),
(200) and (210), respectively.

15
Figure 7. Powder X-Ray diffraction pattern of MCM-41 [24]
The nitrogen adsorption-desorption isotherms of an ordered mesoporous
material is presented in Figure 8. According to the IUPAC definition, mesoporous
materials show Type IV adsorption-desorption isotherm. At low relative pressures
(P/Po), nitrogen is adsorbed only as a thin layer on the walls, called monolayer
coverage [19].
Depending on the pore size, the isotherm for the mesoporous molecular sieve
shows a sharp inflection at relative pressures 0.25 to 0.50, which is characteristic of
capillary condensation of nitrogen within the uniform mesopores, where the P/Po
position of the inflection point is related to the diameter of the pore. The sharpness of
the inflection is a measure of the uniformity of pore sizes and its height is related to
the amount of pore volume. A hysteresis effect is observed for nitrogen adsorption-
desorption isotherms when the pore diameter is larger than ~ 40 Å [19].

16
0
100
200
300
400
500
600
700
800
0.0 0.1 0.2 0.3 0.4 0.5 0.6 0.7 0.8 0.9 1.0
Relative Pressure (p/po)
Quantity Adsorbed (cm3/g STP)
Adsorption
Desorption
Figure 8. Nitrogen adsorption/desorption isotherm of MCM-41 [25]
For the use of ordered mesoporous materials in heterogeneous catalysis,
additional catalytic functions are introduced into their structure. This is achieved by
the incorporation of active sites in the silica walls or by deposition of active species
on the inner surface of the material. The large, adjustable pores of the ordered silicas
permit bulky organometallic precursors to be uniformly attached on their inner walls.
Their high surface areas and relatively large pores are advantageous since they
enable mass transfer and allow a high concentration of active sites per mass of
material. By substituting silicon atoms in the framework with metal ions active acidic
or redox sites can be created and the resulting materials can be used for various
catalytic reactions. However, the wall structure of ordered mesoporous silicate type
materials is more like amorphous silica. Thus, the incorporation of metals or metal
oxides does not result in the formation of defined structures as in zeolites. Indeed, a
variety of different sites with different local environments are created. The active
sites in mesoporous materials can be created by direct synthesis, from mixtures
containing both silicon and the heteroelement to be incorporated, or by post-
synthesis, by treatment of an initially prepared mesoporous silica material. These
procedures may be applied by following many pathways. Hence, the properties of the

17
active sites are variable and can easily be controlled depending on the synthesis
procedure applied [19, 26].
There are many studies in literature about the incorporation of Al and also
heteroatoms, like B, Fe, Ga, Ti, V, Sn into the siliceous framework in order to
modify the composition of the inorganic walls and introduce active sites into the
mesoporous material. Some examples would be the incorporation of V [27], Ni [28]
and Pd [29] into the mesoporous framework of MCM-41 achieved by direct
synthesis.
18
CHAPTER 5
HETEROPOLYACID (HPA) CATALYSTS
5.1. GENERAL PROPERTIES AND CLASSIFICATION OF HPA’S
Heteropoly compounds (heteropolyacids and their salts) have received a great
attention in catalysis which resulted in the invention of new industrial processes.
Heteropoly acid catalysts show higher catalytic activity than conventional
solid-acid catalysts. They are condensed materials which consist of inorganic
oxyacids of P, W, Mo, V, etc. In their structure, HPA’s contain an element such as
Si, P or As (hetero atom); metals such as W, Mo or V (addenda atom); oxygen and
acidic hydrogen atoms [30].
There are many types of heteropoly compounds. The most import three
classes of HPA’s are listed below [31].
• Keggin HPA’s have the general formula Xn+M12O40(8-n)- (M/X=12). They are
the most well-known type of heteropoly compounds. The Keggin
heteropolyacids are the most important for catalysis since they are the most
thermally stable and more easily available. The fact that they are easier for
operation and their high acidic and redox properties also make them
favorable. The primary structure of Keggin HPA’s is presented in Figures 9
and 10.
• Wells-Dawson HPA’s have the general formula X2n+M18O62
(2n-16)- (X is P5+,
S6+, As5+; M may be either W6+ or Mo6+) (M/X=9). The primary structure of
Wells-Dawson heteropoly compounds is shown in Figure 11.

19
• Anderson HPC’s have the general formula. XM6O24n- (M/X=6)
(X=Mn4+,Ni4+,Pt4+,Te6+; M=Mo6+,W6+). They have a planar structure.
Figure 11. The primary structure of Wells-Dawson HPA’s. [31]
The advantages of heteropoly compounds as efficient catalysts in industrial
applications may be listed as follows:
• Acidic and redox properties: An advantage of heteropolyacids is that it is
possible to control the acidic and redox properties of them at the atomic and
molecular level [32]. Heteropolyacids have strong Brönsted acid sites. They are
stronger than the well-known inorganic acids like H2SO4, HCl, HBr, HNO3, etc. [33]
Acid strength of tungstophosphoric acid (H3PW12O40) was found to be higher than
Figure 9. The primary structure of Keggin HPA’s. [31] Figure 10. Keggin structure [30]

20
sulfuric acid and acetic acid. The three protons in the structure of tungstophosphoric
acid (TPA) are as strong as sulfuric acid and perchloric acid [32]. Acidity function
measured by Hammett indicator test shows that for TPA H0a = -13.16, whereas for H-
ZSM-5 and Silica-Alumina H0a = -12.70 [34]. In addition to these, TPA is known to
have the highest acidity among the heteropolyacids.
By modifications in the chemical composition of the heteropoly compound, the
type of the carrier, the conditions in the preliminary treatment of the catalyst, etc. the
nature, strength, and number of the acid sites on the HPA catalyst can be altered [33].
• High catalytic activity: As they are stronger acids, heteropolyacids possess
high catalytic activity. Solid HPA’s show pure Brönsted acidity, whereas oxide
systems have both Brönsted and Lewis acid sites. Thus HPA’s are stronger than the
usual acid catalysts like aluminosilicates, H3PO4,/SiO2, HX and HY zeolites [33].
Owing to the acid strength and oxidizing properties of heteropoly compounds and the
unique basic behavior of the polyanions, HPA’s are very important in heterogeneous
and homogeneous catalysis. Moreover, it is possible to introduce various elements
into the structure of the polyanions and the countercations, and the oxidative stability
of HPA’s is a significant advantage in catalysis [32,35]. Catalytic reactions can take
place in various phases such as homogenous liquid, liquid/liquid, liquid/solid,
gas/solid systems, etc. [35].
• Pseudo-liquid phase behaviour: A very important characteristic of HPA’s
which contribute to their superior catalytic properties is that they show pseudo-liquid
behavior. In spite of their low surface areas certain heteropoly acids, like H3PW12O40,
and H3PMo12O40, in their solid state may easily absorb a large amount of water,
alcohols, and ethers. Rather than adsorption in micropores, this is absorption of
molecules between the lattice polyanions, which may even expand the lattice. Due to
their flexible lattice (variable secondary structure), reactant molecules are absorbed
into the three-dimensional solid bulk and the catalytic reaction takes place in this
novel bulk phase which can be described as a three-dimensional field. This state is
called the “pseudo-liquid phase”. This property of HPA’s result in high catalytic
activities and selectivity values [36,37].
21
• Green aspects of HPA’s: HPA’s do not lead to any production of toxic wastes
and they are considered to be green catalysts. It is possible to work at milder
experimental conditions with HPA’s with a low proportion of side reactions. Green
and sustainable aspects of HPA’s have been summarized by Misono et al. [38] by
referring to some of their applications such as water-tolerant acid catalysis, catalysis
in pseudoliquid phase, solid-phase catalysis, bi-functional catalysis in combination
with noble metals, and green processes in bi-phase systems.
5.2. CATALYTIC APPLICATIONS OF PURE HPA’S
In their pure form, HPA’s have been used in many types of catalytic reactions
They are considered as effective catalysts in alkylation of benzene and alkybenzenes
by olefins, synthesis of ethers and esters, acylation of aromatic compounds,etc. [33]
Varisli et al. [39] observed the catalytic activity of tungstophosphoric acid (TPA),
silicotungstic acid (STA) and molybdophosphoric acid (MPA) in ethanol dehydration
to synthesize diethyl ether. Reactions were carried out between 140-250°C at a space
time of 0.27 s.g.cm-3. Main products were ethylene and diethyl ether. The trend in
catalytic activity was found as STA>TPA>MPA. Also the activities of
heteropolyacid catalysts in methanol dehydration reaction to produce dimethyl ether
were tested [25]. It was found that with TPA, 15% methanol conversion and 80%
dimethyl ether selectivity was obtained 250°C, whereas with STA, 30% methanol
conversion and 100% dimethyl ether selectivity could be obtained. Obviously, pure
STA was found to be more active than pure TPA in dehydration of methanol.
However, from the results of this work it can be concluded that both of these pure
heteropolyacid catalysts showed relatively low activity when it is considered that the
equilibrium conversion of methanol dehydration reaction at 250°C is about 90% (as
shown in Chapter 7). This low catalytic activity of HPA’s is due to some features of
them which are given below.
Although they are considered as highly acidic solid acid catalysts which open
ways to green and sustainable processes, heteropoly acid catalysts have some major
drawbacks [40].
22
• Low surface area : Pure heteropoly acids have surface areas as low as 1-5
m2/g, which hinders accessibility to their strong acid sites. Due to their
relatively low specific surface area, catalytic activity of HPA’s is limited in
gas-solid phase reactions.
• Solubility in polar solvents : Heteropoly acids in their pure form are very
soluble in polar solvents such as alcohols, water, ethers. This property of
HPA’s causes them to be leached during catalytic reactions involving polar
molecules as reactants or products.
5.3. SALTS OF HPA’S AND THEIR CATALYTIC APPLICATIONS
In order to increase the efficiency of HPA-catalyzed processes these
disadvantages have to be overcome. One of the possible solutions is synthesizing
salts of them. In this way, a partial neutralization of HPA’s with cations such as K+,
Ag+ is achieved and insoluble salts of HPA’s are obtained. Haber et al. [41] studied
the synthesis of metal salts of HPA’s in pure form and also supported them on silica
and tested them in dehydration of ethanol and hydration of ethylene. It was reported
that the structure of salts of heteropolyacids were affected by the type of
countercation present. Salts with small cations like Fe, Co, Ni or Na resembled the
parent HPA, as they were water soluble, nonporous and had low surface areas. On
the other hand, salts of HPA with large monovalent cations such as NH4+, K+, and
Cs+ were water insoluble, had rigid micro/mesoporous tertiary structure and had high
surface areas [41,42]. Allaoui et al. [43] prepared copper salts of molybdophosphoric
acid and compared its catalytic activity in methanol conversion to formaldehyde,
dimethyl ether, dimethyl carbonate and methyl formate in the presence of CO2.
Okuhara et al. [34] reported the acidity, micropore structure and catalytic activity of
Cs salts. The conclusions achieved in this study showed that the pore size of the
acidic Cs salts (CsxH3-xPW12040) was controlled by the Cs content. Also, shape
selective catalysis was observed for the Cs salts of TPA. As for the acidity, it was
concluded that the acidic Cs salts as well as H3PW12040 were strongly acidic and
when compared to the zeolites SO42-/ZRO2, they were more catalytically active for

23
decomposition of esters and alkylation in liquid-solid reaction system. Soled et al.
[42] synthesized water-insoluble ammonium and cesium heteropolyacid salts of 12-
tungstophosphoric acid by gas phase reaction, hydrothermal synthesis, precursor
decomposition, in situ reaction and precipitation. Tungsten heteropolyacids are
reported to be stable up to around 400ºC. When in the form of salts, thermal stability
of heteropolyacids is higher than their acid forms [33].
A second solution is to support heteropolyacids on high surface area supports
such as silica, alumina or mesoporous molecular sieves like MCM-41, SBA-15. In
doing so, both the surface area of the active HPA is increased and compounds which
are insoluble in polar solvents are obtained. Examples of related work involving
supported HPA’s are given in the following section.
5.4. SUPPORTED HPA’S AND THEIR APPLICATIONS IN ALCOHOL
DEHYDRATION
The discovery of mesoporous MCM-41 type materials was a great
improvement in catalysis. Incorporation of transition metal ions into the silicate
network of such mesoporous materials is the idea which enabled the use of high
surface area active catalytic materials in many catalytic processes [44]. Based on this
view, dispersing heteropolyacids on high surface area supports is a way of increasing
their surface area, thus catalytic activity. Several studies were done on
immobilization of HPA’s into the silicate matrix of mesoporous materials.
Following a hydrothermal route, Taguchi et al. [44] synthesized new
mesoporous materials composed of PW11O397- cluster anions and
dodecyltrimethylammonium cations with hexagonal phase. Nowinska et al. [45]
synthesized tungstophosphoric acid (TPA) modified SBA-13 catalysts with 20%
TPA loading. The calcination temperature was changed between 400°C-500°C. The
synthesized catalysts had surface area values between 785-1126 m2/g and pore
diameters in the range 2.1-3.2 nm. Said et al. [46] synthesized supported
heteropolyacids by impregnation of TPA on silica by varying the TPA loading on the
catalyst between 5-30% and the calcination temperature was changed between 300-
500°C. The resulting catalysts had surface areas changing between 166-288 m2/g and

24
pore diameters varied between 33-49 nm. Soled et al. [42] synthesized supported
tungstophosphoric acid catalysts by incipient wetness impregnation method. The
supports were silica powder and γ-Al2O3. Calcination was carried out at 300°C and
500°C. The surface areas of the catalysts varied between 102-155 m2/g.
Vazquez et al. [47] prepared molybdophosphoric acid and tungstophosphoric
acid supported on silica by equilibrium impregnation technique. They were tested in
the dehydration of 1,2-diphenylethanol, 1-(3,4-dimethoxyphenyl-2-phenylethanol
and cholesterol. Alcohol dehydration reactions were carried out in liquid phase.
Herrera et al. [40] supported TPA on unmodified MCM-41, SBA-15 and also on
alumina, zirconia and titania coated MCM-41 and SBA-15 by impregnation. They
were tested in 2-butanol and methanol dehydration. Dimethyl ether formation was
observed in methanol dehydration. Different from 2-butanol dehydration, significant
amount of coke formation was observed after methanol dehydration. It was stated
that above 300°C, in the absence of cleaning agents such as oxygen or hydrogen,
carbonaceous species could accumulate on the surface of strong acidic catalysts.
Carbonaceous deposits on the catalysts were indicated to be a reason for catalyst
deactivation during methanol dehydration. Varisli et al. [48] synthesized silica
supported silicotungstic acid catalysts by direct hydrothermal synthesis route. W/Si
ratios of the catalysts were taken as 0.25 and 0.50. BET surface areas of the samples
were found as 393 m2/g (pore diameter as 5.5 nm) and 179 m2/g (pore diameter as 10
nm), respectively. These catalysts were tested in ethanol dehydration to produce
ethylene and diethyl ether. The WOx-Silicate acidic catalysts synthesized in this
work were found to be much more active when compared to pure HPA’s [39]. In
another work of Varisli et al. [49] STA incorporated MCM-41 and aluminosilicate
catalysts were synthesized by impregnation route and were again tested in
dehydration of ethanol.
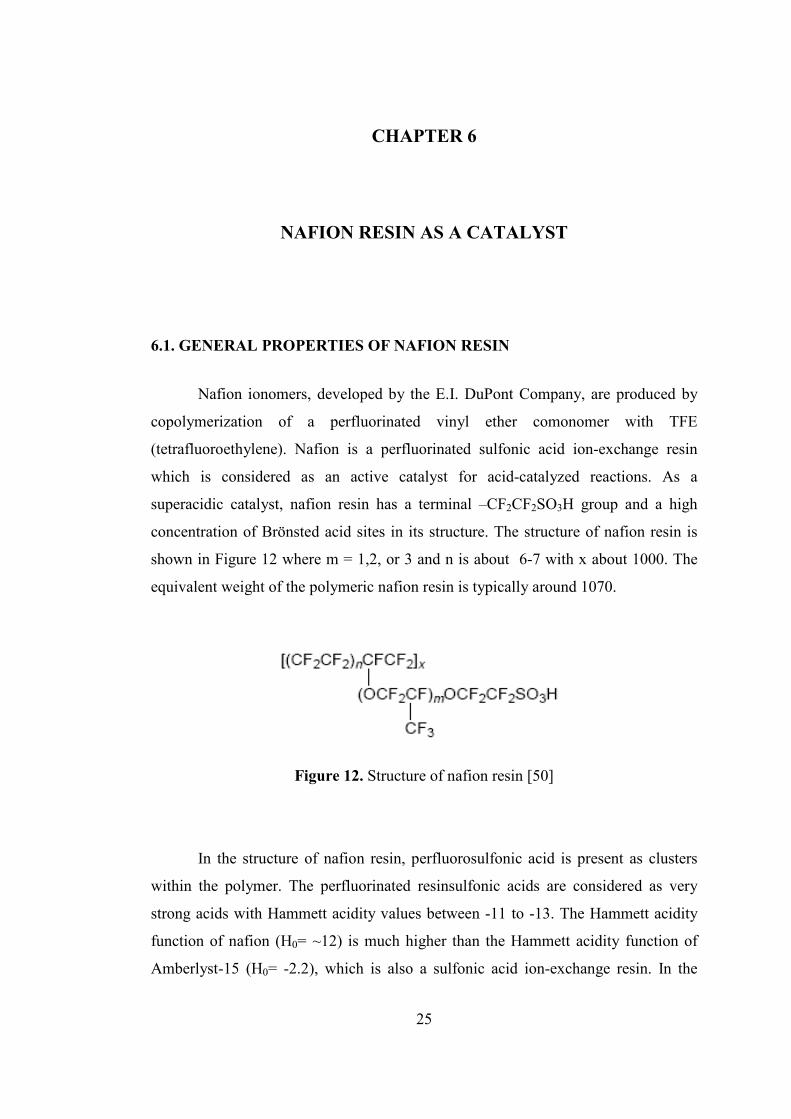
25
CHAPTER 6
NAFION RESIN AS A CATALYST
6.1. GENERAL PROPERTIES OF NAFION RESIN
Nafion ionomers, developed by the E.I. DuPont Company, are produced by
copolymerization of a perfluorinated vinyl ether comonomer with TFE
(tetrafluoroethylene). Nafion is a perfluorinated sulfonic acid ion-exchange resin
which is considered as an active catalyst for acid-catalyzed reactions. As a
superacidic catalyst, nafion resin has a terminal –CF2CF2SO3H group and a high
concentration of Brönsted acid sites in its structure. The structure of nafion resin is
shown in Figure 12 where m = 1,2, or 3 and n is about 6-7 with x about 1000. The
equivalent weight of the polymeric nafion resin is typically around 1070.
Figure 12. Structure of nafion resin [50]
In the structure of nafion resin, perfluorosulfonic acid is present as clusters
within the polymer. The perfluorinated resinsulfonic acids are considered as very
strong acids with Hammett acidity values between -11 to -13. The Hammett acidity
function of nafion (H0= ~12) is much higher than the Hammett acidity function of
Amberlyst-15 (H0= -2.2), which is also a sulfonic acid ion-exchange resin. In the

26
structure of nafion resin, there exist terminal sulfonic acid groups attached to a
perfluoro polymeric backbone. The presence of electron withdrawing F atoms in the
structure increases the acid strength of the terminal sulfonic acid groups to a great
extent. Due to this, the acidity of nafion is considered to be comparable to that of
pure sulfuric acid. Indeed, the H0 value of nafion resin was found to be much higher
than the acidity of 40% sulfuric acid (H0= -2.4) and close to the acidity of 100%
sulfuric acid (H0= -12.3). The acid content of nafion resin is about 0.95 meq/g. Due
to its superacidic characteristics, nafion has been used as a heterogeneous strong acid
catalyst for a wide range of chemical reactions.
The property of nafion resin which widens its application areas is that it is
insoluble in polar solvents. Because of this, it can be used in liquid phase reactions
and can be treated with polar solvents without being affected. Another advantage of
nafion is that it is extremely resistant to chemical attack. Owing to its fluorocarbon
backbone, it has a superior chemical stability. Besides, it has a high mechanical
strength and thermal stability. Perfluorinated resinsulfonic acids are known to be
much more stable than styrene-based resinsulfonic acid catalysts. Nafion resin is
thermally stable up to 280°C. Above this temperature the sulfonic acid groups start to
decompose. However, the thermal stability of styrene based resinsulfonic acid
catalysts is limited to 120-140°C.
Nafion is commercially available in the form of millimeter sized beads known
as NR-50. The specific surface area of NR-50 is about 0.02 m2/g. The nonporous
nature of the pure nafion resin is its major disadvantage which limits its applications
in catalysis. The acid sites in nafion, namely the sulfonic acid groups are buried in
the bulk of the resin and its nonporous structure leads to poor accessibility to the acid
sites on the catalyst. Due to diffusion limitations, the catalytic acitivity of the resin is
decreased to a great extent.
Nafion resin is considered to be an effective acidic catalyst for many
reactions such as isomerizations, esterifications, alkylations, acylations, hydrations
and dehydrations, nitrations and etherifications. However, as explained above the
observed activity of nafion resin in catalytic applications is very low due to its low
specific surface area and nonporous structure. To overcome this disadvantage,
supported nafion resin catalysts should be prepared by dispersing it on high surface
area mesoporous materials in order to increase its efficiency in catalysis [50,51,52].
27
6.2. SUPPORTED NAFION CATALYSTS
Dispersing nafion resin on high surface area supports was first achieved by
Harmer et al. [50]. Nafion-silica nanocomposites were synthesized by following a
sol-gel synthesis route. The procedure included mixing Si(OMe)4, deionized water
and HCl with a mixture of NaOH and 5 wt% Nafion solution. The mixture gelled in a
few seconds and then was exposed to nitrogen flow to remove the volatiles. After
drying at 95°C, the solid product was reacidified by stirring with an aqueous HCl
solution and then washed with deionized water. Finally, the sample was treated with
nitric acid at 75°C, washed again with DI water and dried in vacuum. The nafion-
silica nanocomposites obtained by sol-gel synthesis route had nafion contents of 8 –
80 wt%. Surface area values of the nanocomposites depended on the nafion loading.
For example, the catalyst with a nafion loading of 8 wt% had surface area of 412
m2/g and the one with nafion content of 60 wt% had a surface area of 34 m2/g. Pore
volumes were in the range of 0.15-1.05 cm3/g and the pore diameters of the catalysts
were changing between 6.5-15 nm.
Fujiwara et al. [53] prepared MCM-41/nafion composites by the following
synthesis route. Nafion gel was dissolved in ethanol and it was added to a mixture of
tetramethyl ammonium hydroxide and cetyltrimethylammonium bromide in distilled
water. To this mixture, tetraethoxy silane was added. The material was synthesized
in an autoclave at 130°C for 24 hours. The white solid product was washed with
distilled water, dried and then refluxed in sulfuric acid solution in ethanol for 18
hours. After two further refluxes in ethanol the product was dried at 150°C. The X-
ray diffraction peaks of the catalyst revealed that the MCM-41 structure was
preserved. The BET surface area of the catalyst was 619 m2/g and the pore volume
was 0.64 cm3/g.
In another work of Fujiwara et al. [54], by following three different synthesis
procedures, polymer sulfonates like nafion were incorporated into the mesoporous
silica framework. Firstly, to an aqueous solution of NaOH and
hexadecetyltrimethylammonium bromide, 5 wt% nafion solution was added. Then
tetraethoxy silane was added and the mixture was stirred at room temperature. After
filtering and washing, the product was dried at 80°C. The sample was refluxed with
1M of sulfuric acid solution of ethanol for 12 hours and then filtered. The resulting

28
material was further refluxed with pure ethanol for 12 hours. In this work, in addition
to the mesoporous silica-nafion nanocomposite material, a nafion-silica composite
was prepared from the amorphous nafion-silica composite (SAC-13) produced by
Harmer et al. [50]. To an aqueous solution of NaOH and
hexadecetyltrimethylammonium bromide, appropriate amount of SAC-13 was added
and stirred for 1 hour. The synthesis was carried out in an autoclave at 110°C for 24
hours. The rest of the procedure is similar to the procedure described for the
mesoporous nafion-silica composite above. Thirdly, a mesoporous silica-poly (4-
styrenesulfonate) composite material was synthesized by adding poly(sodium 4-
styrenesulfonate) and TEOS to the solution of NaOH and
hexadecetyltrimethylammonium bromide. The nanocomposites synthesized in this
work had nafion contents of 5-25 wt%. The BET specific surface areas of the
catalysts changed between 1239-333 m2/g, pore volumes were in the range 0.26-1.26
and BJH adsorption pore diameters varied between 2.52-2.75 nm depending on the
nafion loading and synthesis procedure of the catalysts.
By following impregnation technique, Wang et al. [55] synthesized supported
nafion catalysts. 5 wt % nafion in water-alcohol solution was impregnated on various
supports by stirring at 60°C for 2 hours. After evaporating the water and alcohols the
sample was dried at 60°C. Török et al. [56] also synthesized 10 % Nafion-H/Silica
nanocomposites by impregnation method. Silica was dispersed in 2-propanol/1-
propanol/water mixture which contained the appropriate amount of nafion-H. After
stirring at room temperature for 2 hours, the solvents were evaporated and the sample
was dried under vacuum. Bringué et al. [57] used silica, alumina and silica-alumina
as carriers. In the impregnation procedure, the carrier was washed, dried and then
mixed with a solution of 2-propanol:water. Commercial nafion resin solution was
added and the mixture was stirred for 6 hours. After evaporating the solvents, the
impregnated catalyst was dried and washed with methanol to get rid of the non-
bonded nafion.
In the work of Alvaro et al. [58], by a condensation reaction between the
surface silanol groups of the mesoporous silicas and 1,2,2-trifluoro-2-hydroxy-1-
trifluoromethyl-ethane sulfonic acid beta-sultone hybrid organic–inorganic MCM-41
silicas were functionalized with perfluoroalkylsulfonic acid groups analogous to
Nafion. The XRD analysis indicated that the ordered mesoporous structure of MCM-

29
41 was not affected with the incorporation of perfluoroalkyl sulfonic acid groups.
But it was also observed that at higher loading (more than 2wt%) of perfluoralkyl
sulfonic acid groups, the mesoporous structure was destroyed and the materials had
an amorphous structure. This was attributed to the high concentration of Brönsted
acid sites formed on the catalyst. The resulting materials had surface areas between
680-912 m2/g. Sulfur content of the final solid was found to be between 0.12-0.45
mmol/g depending on the 1,2,2-trifluoro-2-hydroxy-1-trifluoromethyl-ethane
sulfonic acid beta-sultone added per gram of solid (0.5-1.5 mmol/g). The C/S ratios
were found as approximately 3.0 for all the samples. In another work of Alvaro et al.
[59], in addition to MCM-41, functionalization of SBA-15 type mesoporous
materials with 1,2,2-trifluoro-2-hydroxy-1-trifluoromethyl-ethane sulfonic acid
sultone was also described. Martinez et al. [60] synthesized Nafion/SBA-15 catalysts
by following impregnation route. Nafion alcoholic solution was added to the
dispersion of powder SBA-15. The synthesis was carried out at 60°C by stirring for 2
hours at atmospheric pressure. Nafion loadings of the catalysts changed between 10-
20 wt% and the surface areas decreased from 601 m2/g to 432 m2/g with an increase
in nafion loading.
6.3. CATALYTIC APPLICATIONS OF NAFION BASED CATALYSTS
In the majority of the kinetic studies where nafion-silica nanocomposites
were used as catalysts, the synthesis procedure described by Harmer et al. [50] was
applied and the synthesized nafion-silica nanocomposites were tested in a range of
chemical reactions. In some of the studies, commercialized SAC-13 (13wt% nafion
containing nafion-silica nanocomposite produced by DuPont synthesized based on
the study of Harmer et al. (1996)) and pure Nafion NR-50 were purchased and used
in the kinetic studies.
Sun et al. [61] used the 13 wt% nafion-silica nanocomposite in Friedel-Crafts
benzylation of benzene at 80°C and p-xylene at 100°C with methylbenzeyl alcohol at
ambient pressure. The novel composite was found to be twice as active as the nafion
resin beads (NR–50). The activity of nafion-silica nanocomposites were tested in
liquid phase alkylation of isobutene [62], in the reaction of resorcinol with ethyl

30
acetoacetate or with acrylic acid [63], in the alkylation of benzene with linear C9-C13
alkenes [64] and in the acylation of anisole with acetic anhydride [65].
The catalytic activity of nafion resin in methanol dehydration reaction was
presented in the work of Varisli and Dogu [66]. The commercial nafion resin beads
(NR-50) were used as catalyst and the methanol dehydration experiments were
carried out in vapor phase at atmospheric pressure. The catalytic activity of nafion
resin was observed as a function of temperature in the range of 120-220°C. To
observe the effect of space time on the methanol conversion and DME yield, the
amount of catalyst loaded to the differential reactor was changed from 0.2 g to 1.0.
At a space time of 1.35 s.g.cm-3, about 0.4 methanol conversion was achieved at
220°C. DME selectivity reached to 1.0 at temperatures over 200°C and the
selectivity of the by-product formaldehyde decreased with an increase in
temperature.
31
CHAPTER 7
THERMODYNAMIC ANALYSIS
The chemical reaction which occurs during the vapor phase methanol
dehydration process is;
OHOCHCHOHCH 23332 +→← (1)
In this chapter, theoretical information about the thermodynamic analysis and
the results concerning equilibrium curves at different pressures (1 bar and 30 bar) are
presented.
To analyse the thermodynamics of this reaction, at first heat capacity, Cp
values were calculated. Cp is a function of temperature and it is written for one
substance in the form;
Cp,i (T) = a + bT + cT2 + ….. (2)
The molar heat capacity coefficients of the species involved in the methanol
dehydration reaction are presented in Table 4.
For the enthalpy of the reaction, the summation of the constants in Cp
equation was used, as it is in equation 3.
Cp (T) = ∆a + ∆bT + ∆cT2 +… (3)
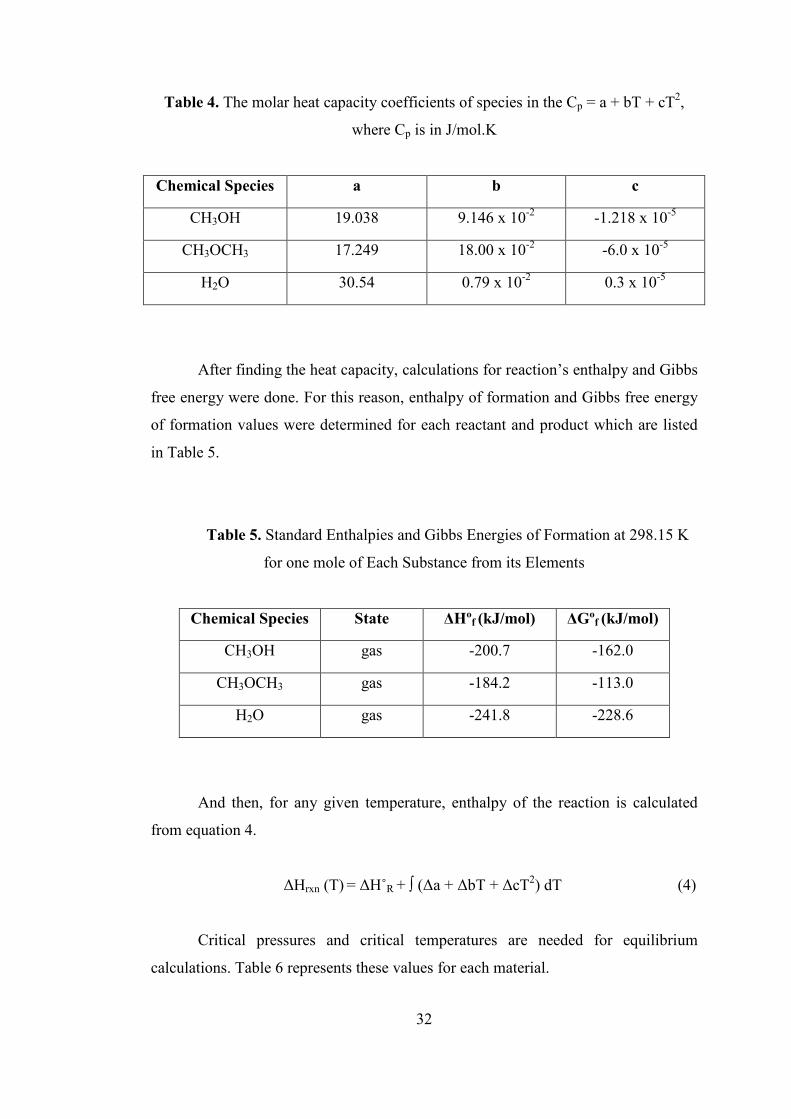
32
Table 4. The molar heat capacity coefficients of species in the Cp = a + bT + cT2,
where Cp is in J/mol.K
Chemical Species a b c
CH3OH 19.038 9.146 x 10⁻² -1.218 x 10⁻⁵
CH3OCH3 17.249 18.00 x 10⁻² -6.0 x 10⁻⁵
H2O 30.54 0.79 x 10⁻² 0.3 x 10⁻⁵
After finding the heat capacity, calculations for reaction’s enthalpy and Gibbs
free energy were done. For this reason, enthalpy of formation and Gibbs free energy
of formation values were determined for each reactant and product which are listed
in Table 5.
Table 5. Standard Enthalpies and Gibbs Energies of Formation at 298.15 K
for one mole of Each Substance from its Elements
Chemical Species State ∆Hºf (kJ/mol) ∆Gºf (kJ/mol)
CH3OH gas -200.7 -162.0
CH3OCH3 gas -184.2 -113.0
H2O gas -241.8 -228.6
And then, for any given temperature, enthalpy of the reaction is calculated
from equation 4.
∆Hrxn (T) = ∆H˚R + ∫ (∆a + ∆bT + ∆cT2) dT (4)
Critical pressures and critical temperatures are needed for equilibrium
calculations. Table 6 represents these values for each material.
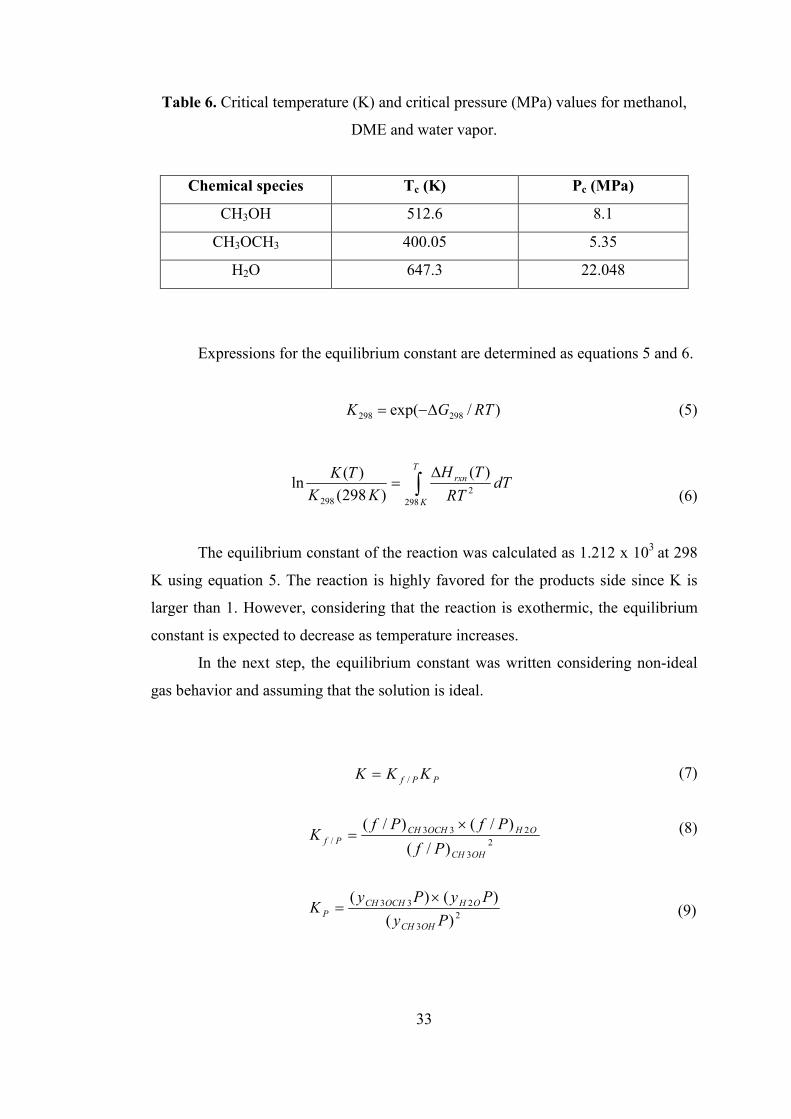
33
Table 6. Critical temperature (K) and critical pressure (MPa) values for methanol,
DME and water vapor.
Chemical species Tc (K) Pc (MPa)
CH3OH 512.6 8.1
CH3OCH3 400.05 5.35
H2O 647.3 22.048
Expressions for the equilibrium constant are determined as equations 5 and 6.
)/exp( 298298 RTGK ∆−= (5)
∫∆
=T
K
rxn dTRT
TH
KK
TK
2982
298
)(
)298(
)(ln
(6)
The equilibrium constant of the reaction was calculated as 1.212 x 10³ at 298
K using equation 5. The reaction is highly favored for the products side since K is
larger than 1. However, considering that the reaction is exothermic, the equilibrium
constant is expected to decrease as temperature increases.
In the next step, the equilibrium constant was written considering non-ideal
gas behavior and assuming that the solution is ideal.
(7)
(8)
(9)
23
233
23
233/
/
)(
)()(
)/(
)/()/(
Py
PyPyK
Pf
PfPfK
KKK
OHCH
OHOCHCH
P
OHCH
OHOCHCH
Pf
PPf
×=
×=
=
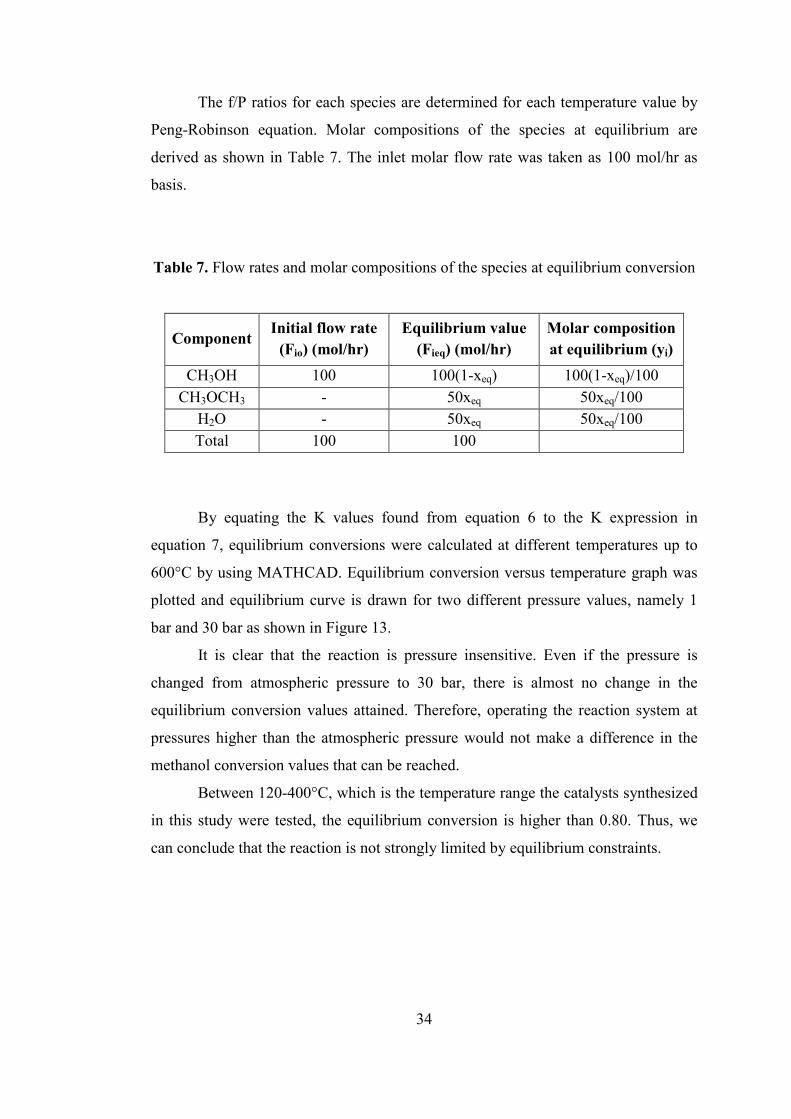
34
The f/P ratios for each species are determined for each temperature value by
Peng-Robinson equation. Molar compositions of the species at equilibrium are
derived as shown in Table 7. The inlet molar flow rate was taken as 100 mol/hr as
basis.
Table 7. Flow rates and molar compositions of the species at equilibrium conversion
Component Initial flow rate
(Fio) (mol/hr) Equilibrium value
(Fieq) (mol/hr) Molar composition at equilibrium (yi)
CH3OH 100 100(1-xeq) 100(1-xeq)/100 CH3OCH3 - 50xeq 50xeq/100
H2O - 50xeq 50xeq/100 Total 100 100
By equating the K values found from equation 6 to the K expression in
equation 7, equilibrium conversions were calculated at different temperatures up to
600°C by using MATHCAD. Equilibrium conversion versus temperature graph was
plotted and equilibrium curve is drawn for two different pressure values, namely 1
bar and 30 bar as shown in Figure 13.
It is clear that the reaction is pressure insensitive. Even if the pressure is
changed from atmospheric pressure to 30 bar, there is almost no change in the
equilibrium conversion values attained. Therefore, operating the reaction system at
pressures higher than the atmospheric pressure would not make a difference in the
methanol conversion values that can be reached.
Between 120-400°C, which is the temperature range the catalysts synthesized
in this study were tested, the equilibrium conversion is higher than 0.80. Thus, we
can conclude that the reaction is not strongly limited by equilibrium constraints.

35
Figure 13. The equilibrium curves for methanol dehydration at 1 bar and 30 bars
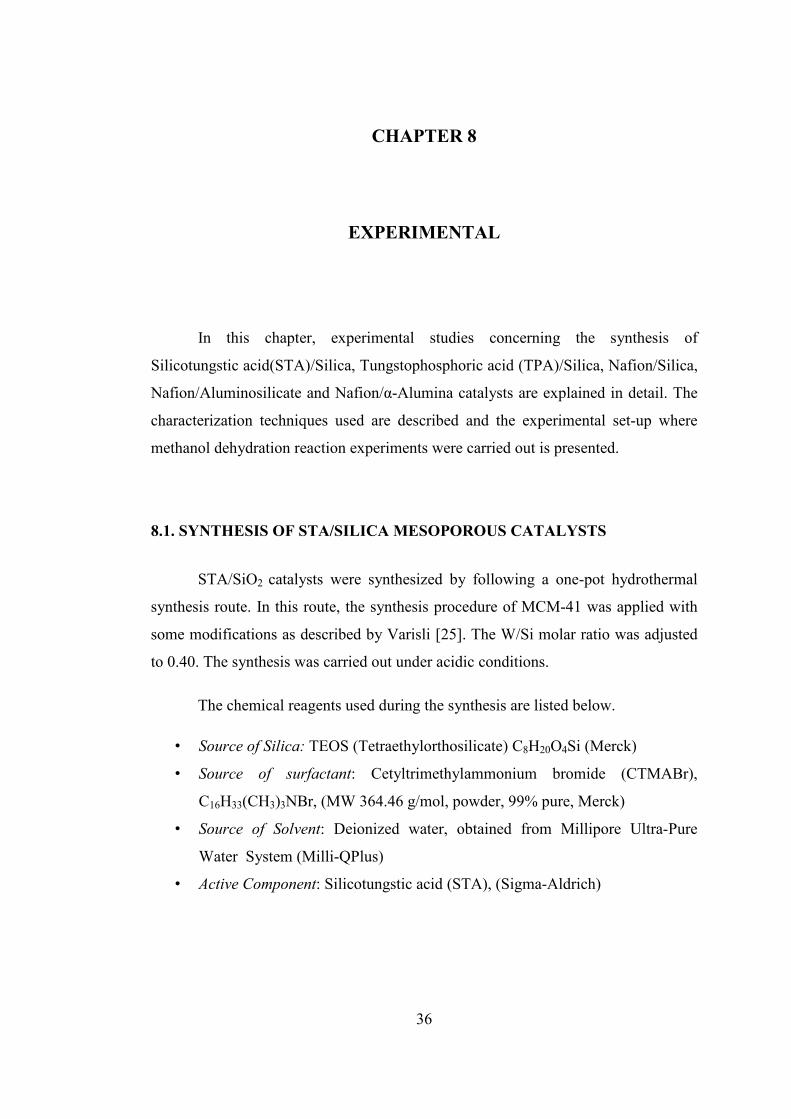
36
CHAPTER 8
EXPERIMENTAL
In this chapter, experimental studies concerning the synthesis of
Silicotungstic acid(STA)/Silica, Tungstophosphoric acid (TPA)/Silica, Nafion/Silica,
Nafion/Aluminosilicate and Nafion/α-Alumina catalysts are explained in detail. The
characterization techniques used are described and the experimental set-up where
methanol dehydration reaction experiments were carried out is presented.
8.1. SYNTHESIS OF STA/SILICA MESOPOROUS CATALYSTS
STA/SiO2 catalysts were synthesized by following a one-pot hydrothermal
synthesis route. In this route, the synthesis procedure of MCM-41 was applied with
some modifications as described by Varisli [25]. The W/Si molar ratio was adjusted
to 0.40. The synthesis was carried out under acidic conditions.
The chemical reagents used during the synthesis are listed below.
• Source of Silica: TEOS (Tetraethylorthosilicate) C8H20O4Si (Merck)
• Source of surfactant: Cetyltrimethylammonium bromide (CTMABr),
C16H33(CH3)3NBr, (MW 364.46 g/mol, powder, 99% pure, Merck)
• Source of Solvent: Deionized water, obtained from Millipore Ultra-Pure
Water System (Milli-QPlus)
• Active Component: Silicotungstic acid (STA), (Sigma-Aldrich)

37
The steps followed in the synthesis of STA/Silica catalysts can be
summarized as follows.
• Preparation of the Synthesis Solution: 13.2 grams of surfactant was
dissolved in 87 mL of deionized water and mixed with a magnetic stirrer at
30°C. When a clear mixture was obtained, 15.64 mL TEOS was added. A few
minutes later, predetermined amount of silicotungstic acid (STA) dissolved in
5 mL of deionized water was added dropwise to the solution and it was mixed
for 1 hour. The pH of the synthesis mixture was measured as 1.0.
• Hydrothermal Synthesis: The mixture was transferred into a Teflon bottle
which was placed in a stainless steel autoclave. Hydrothermal synthesis was
carried out at 120°C for 96 hours.
• Washing with deionized water: The material obtained after 96 hours was
washed with deionized water and filtered. For each washing step, 300 mL of
deionized water was added and the mixture was mixed for about 30 minutes.
Filtering and washing of the material was continued until a constant pH value
of the residual washing liquid was obtained. The resulting solid material was
dried in a vacuum oven at 40°C. After the material was dried, it was obtained
as a white block. Since it was not in powder form, it could be crushed into
smaller pieces to be used in the reactions in desired size.
• Calcination: Calcination was carried out in a quartz tubular reactor placed in
a temperature controlled tubular furnace. Dry air was passed over the sample
at 350°C for 8 hours with a flow rate of about 1 dm3/min. The synthesized
catalyst was denoted as TRC-75(L). To compare the effect of calcination
temperature, a part of the material was calcined at 400°C and named as TRC-
75-400. Alternatively, to see the effect of supercritical carbon dioxide
extraction on the activity of the catalyst, to a part of the sample supercritical
CO2 extraction was applied at 350 bar, 100°C for 3 hours with a carbon
dioxide flow of 1 mL/min based on the study of Kawi et al. [67]. The
experiment was carried out with a SFX 3560 extractor in METU Central
Laboratory.
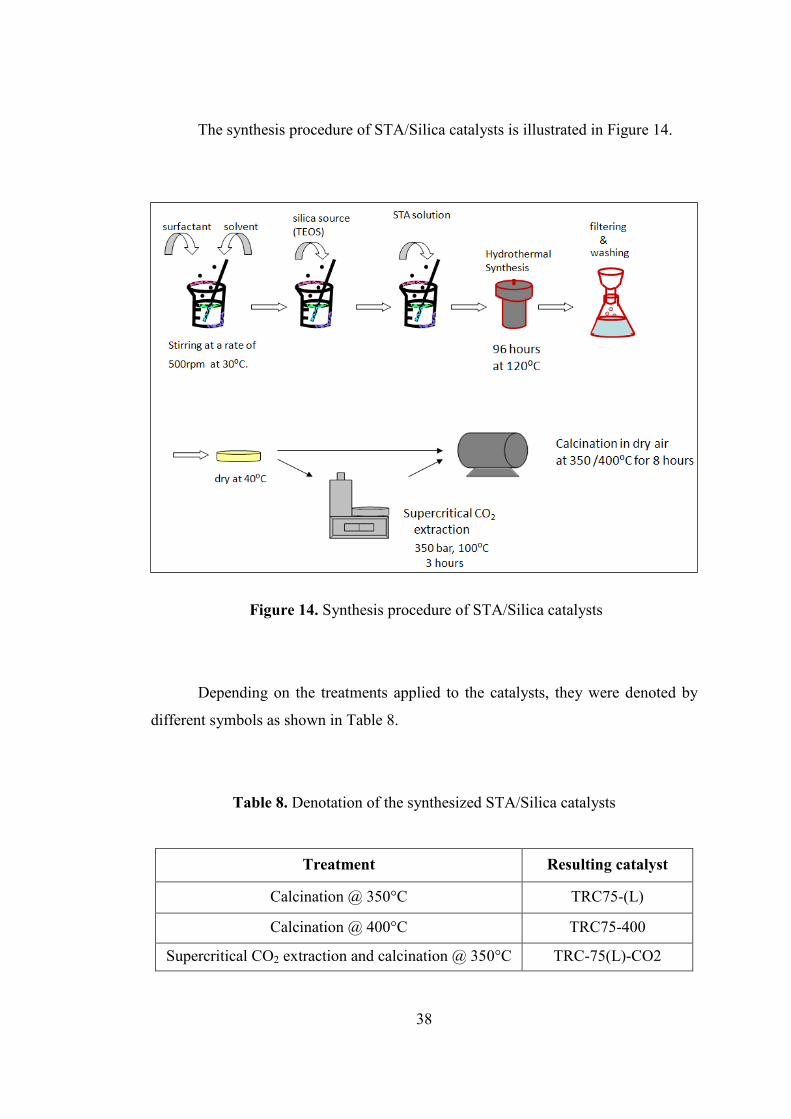
38
The synthesis procedure of STA/Silica catalysts is illustrated in Figure 14.
Figure 14. Synthesis procedure of STA/Silica catalysts
Depending on the treatments applied to the catalysts, they were denoted by
different symbols as shown in Table 8.
Table 8. Denotation of the synthesized STA/Silica catalysts
Treatment Resulting catalyst
Calcination @ 350°C TRC75-(L)
Calcination @ 400°C TRC75-400
Supercritical CO2 extraction and calcination @ 350°C TRC-75(L)-CO2
39
8.2. SYNTHESIS OF TPA/SILICA MESOPOROUS CATALYSTS
For the synthesis of TPA/SiO2 catalysts one-pot hydrothermal route was
applied. The synthesis procedure developed for these materials is similar to that of
the STA/SiO2 catalysts. The W/Si molar ratio was again adjusted to 0.40.
The chemical reagents used during the synthesis are listed.
• Source of Silica: TEOS (Tetraethylorthosilicate) C8H20O4Si (Merck)
• Source of surfactant: Cetyltrimethylammonium bromide (CTMABr),
C16H33(CH3)3NBr, (MW 364.46 g/mol, powder, 99% pure, Merck)
• Source of Solvent: Deionized water, obtained from Millipore Ultra-Pure
Water System (Milli-QPlus)
• Active Component: Tungstophosphoric acid (TPA), (Acros Organics)
The steps applied during the synthesis are similar to those applied for
STA/Silica catalysts. The drawing is shown below in Figure 15. The synthesis
mixture was quite acidic with a pH below 0.5. The material was again obtained as a
white solid block and crushed into smaller pieces prior to calcination.
Figure 15. Synthesis procedure of TPA/Silica catalysts
40
Different from the synthesis of STA/Silica catalysts, TPA/Silica catalysts
were calcined at 270°C based on the thermogravimetric analysis (TGA) which is
discussed later in Section 9.2.1.
8.3. SYNTHESIS OF NAFION/SILICA MESOPOROUS CATALYSTS
Novel Nafion/SiO2 catalysts were synthesized by following a one-pot
hydrothermal route.
The chemical reagents used during the synthesis are listed below.
• Source of Silica: TEOS (Tetraethylorthosilicate) C8H20O4Si (Merck)
• Source of surfactant: Cetyltrimethylammonium bromide (CTMABr),
C16H33(CH3)3NBr, (MW 364.46 g/mol, powder, 99% pure, Merck)
• Source of Solvent: Deionized water, obtained from Millipore Ultra-Pure
Water System (Milli-QPlus)
• Nafion source: Two different nafion sources were used.
1. Nafion® 117 solution, ~5% in mixture of lower aliphatic alcohols and
water (Fluka). Nafion 117 is the commonly available Nafion film having a
nominal thickness of 0.007 in. and EW of 1100.
2. Nafion perfluorinated ion-exchange resin, 5 wt% in mixture of lower
aliphatic alcohols and water (Aldrich)
The studies in literature on supported nafion catalysts (as discussed in Section
6.2) were mainly based on sol-gel synthesis procedure. Direct synthesis was also
followed, but either a solution of hexadecetyltrimethylammonium bromide and
sodium hydroxide or a solution of cetyltrimethylammonium bromide and
tetramethylammonium hydroxide were used while preparing the precursor solution.
In this study, acidic hydrothermal synthesis procedure was followed since the
resulting catalysts are aimed to have strong acid sites for obtaining high catalytic
activity in alcohol dehydration reactions. As listed above, a solution of cetyltrimethyl
ammonium bromide and deionized water were used as the sources of surfactant and
solvent. Furthermore, different conditions and methods were applied in surfactant
41
removal to compare the effect of alternative routes on the characteristics of the
resulting material.
The steps followed in the synthesis of Nafion/Silica catalysts are explained
below.
• Preparation of the Synthesis Solution: 13.2 grams of surfactant was
dissolved in 87 mL of deionized water and mixed on a magnetic stirrer at
30°C. When a clear mixture was obtained, predetermined amount of nafion
source was added dropwise to the mixture. A few minutes later, 15.64 mL
TEOS was added and the mixture was mixed for 1 hours. For NS1 the pH
was measured as 1.6. The pH of NS3 was adjusted to 1.6 by addition of a few
drops of 1 N NaOH. The pH values of NS4 and NS5 were found as 0.9 and
0.7, respectively.
• Hydrothermal Synthesis: The mixture was transferred into a Teflon bottle
placed in a stainless steel autoclave. Hydrothermal synthesis was carried out
at 120°C for 96 hours.
• Washing with deoized water: The material obtained after 96 hours was
washed with deionized water and filtered. For each washing step, 300 mL of
deionized water was added and the mixture was mixed for about 30 minutes.
The resulting solid material was dried in a vacuum oven at 50°C and before
any treatment was applied it was dried at 110°C for 2 hours. After drying, the
materials were obtained as one-piece, hard, white solid blocks and were
crushed to get smaller pieces.
• Calcination: For surfactant removal, the materials were calcined at 350°C
based on the thermogravimetric analysis of the samples which is discussed in
Section 9.3.1. To compare the effect of temperature, calcination at 250°C was
also applied.
• Washing in Sulfuric Acid Solution of Ethanol (SAE): As an alternative
technique, surfactant removal by washing in sulfuric acid-ethanol (SAE)
mixture was applied. Different conditions were used during the washing

42
procedure. Some of the catalysts were refluxed in 1 M of SAE solution for 12
hours (1 g/ 150 mL solution) based on the study of Fujiwara et al. [54]. In the
case of using 2 M of SAE solution, the materials were refluxed for 6 hours.
Also keeping in 2 M of SAE solution for 24 hours at room temperature was
applied to some part of the catalysts. After treatment with SAE solution, in
order to get rid of the remaining sulfuric acid at the surface of the catalysts,
the samples were further washed in pure ethanol. Finally, they were dried at
100°C for 8 hours. The synthesis procedure is illustrated in Figure 16. The
different types of catalysts synthesized, their nafion sources, nafion loadings
and pH of the synthesis mixtures are listed in Table 9. The different
treatments applied to the Nafion/Silica catalysts are shown in Table 10.
Figure 16. Synthesis procedure of the Nafion/Silica catalysts
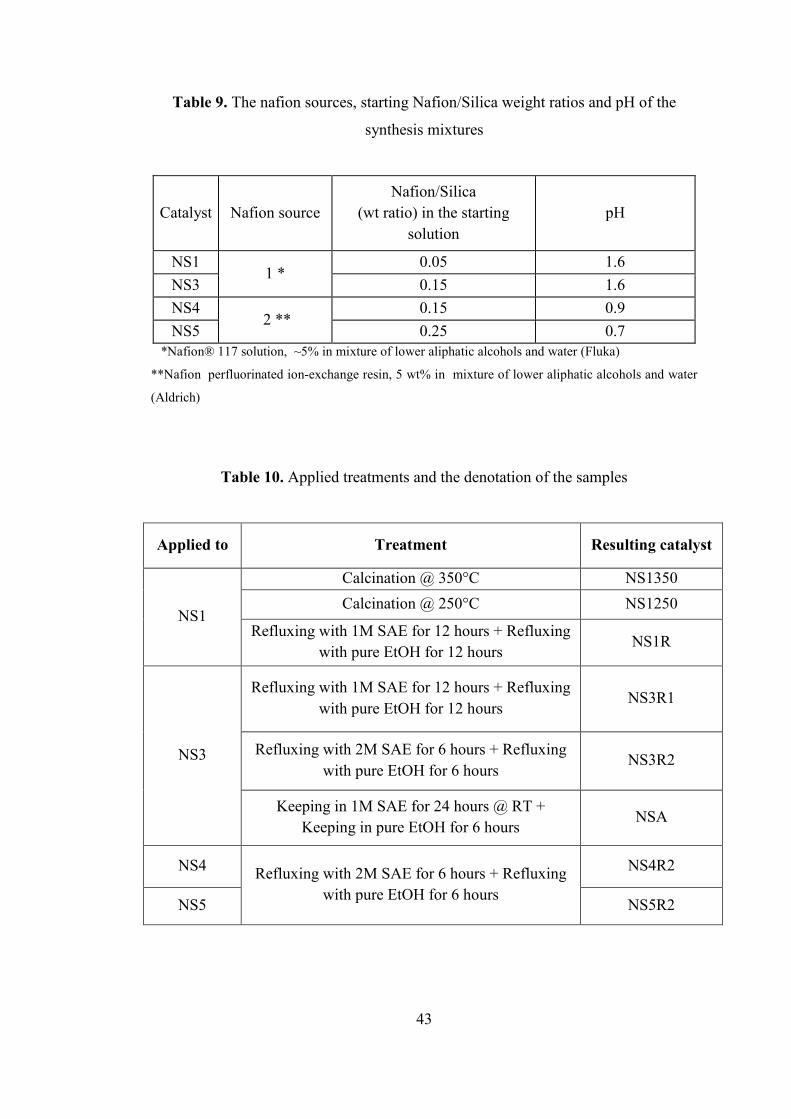
43
Table 9. The nafion sources, starting Nafion/Silica weight ratios and pH of the
synthesis mixtures
Catalyst Nafion source Nafion/Silica
(wt ratio) in the starting solution
pH
NS1 1 *
0.05 1.6
NS3 0.15 1.6
NS4 2 **
0.15 0.9
NS5 0.25 0.7 *Nafion® 117 solution, ~5% in mixture of lower aliphatic alcohols and water (Fluka)
**Nafion perfluorinated ion-exchange resin, 5 wt% in mixture of lower aliphatic alcohols and water
(Aldrich)
Table 10. Applied treatments and the denotation of the samples
Applied to Treatment Resulting catalyst
NS1
Calcination @ 350°C NS1350
Calcination @ 250°C NS1250
Refluxing with 1M SAE for 12 hours + Refluxing with pure EtOH for 12 hours
NS1R
NS3
Refluxing with 1M SAE for 12 hours + Refluxing with pure EtOH for 12 hours
NS3R1
Refluxing with 2M SAE for 6 hours + Refluxing with pure EtOH for 6 hours
NS3R2
Keeping in 1M SAE for 24 hours @ RT + Keeping in pure EtOH for 6 hours
NSA
NS4 Refluxing with 2M SAE for 6 hours + Refluxing with pure EtOH for 6 hours
NS4R2
NS5 NS5R2
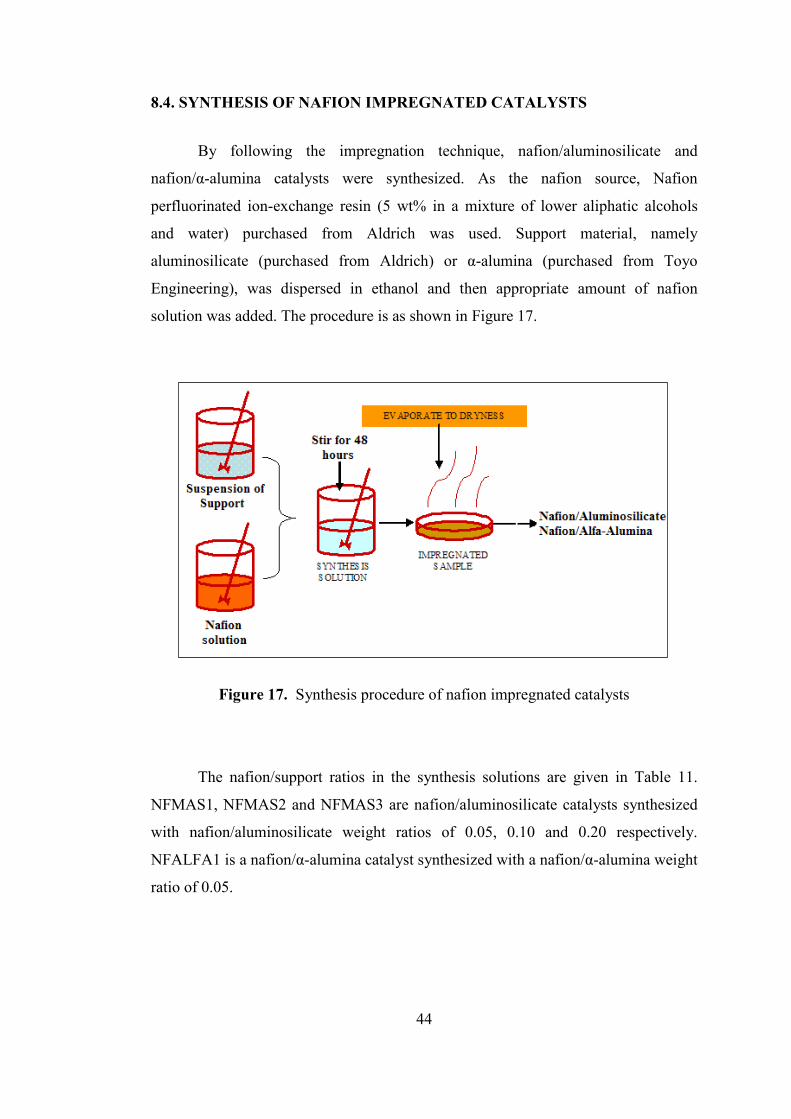
44
8.4. SYNTHESIS OF NAFION IMPREGNATED CATALYSTS
By following the impregnation technique, nafion/aluminosilicate and
nafion/α-alumina catalysts were synthesized. As the nafion source, Nafion
perfluorinated ion-exchange resin (5 wt% in a mixture of lower aliphatic alcohols
and water) purchased from Aldrich was used. Support material, namely
aluminosilicate (purchased from Aldrich) or α-alumina (purchased from Toyo
Engineering), was dispersed in ethanol and then appropriate amount of nafion
solution was added. The procedure is as shown in Figure 17.
Figure 17. Synthesis procedure of nafion impregnated catalysts
The nafion/support ratios in the synthesis solutions are given in Table 11.
NFMAS1, NFMAS2 and NFMAS3 are nafion/aluminosilicate catalysts synthesized
with nafion/aluminosilicate weight ratios of 0.05, 0.10 and 0.20 respectively.
NFALFA1 is a nafion/α-alumina catalyst synthesized with a nafion/α-alumina weight
ratio of 0.05.
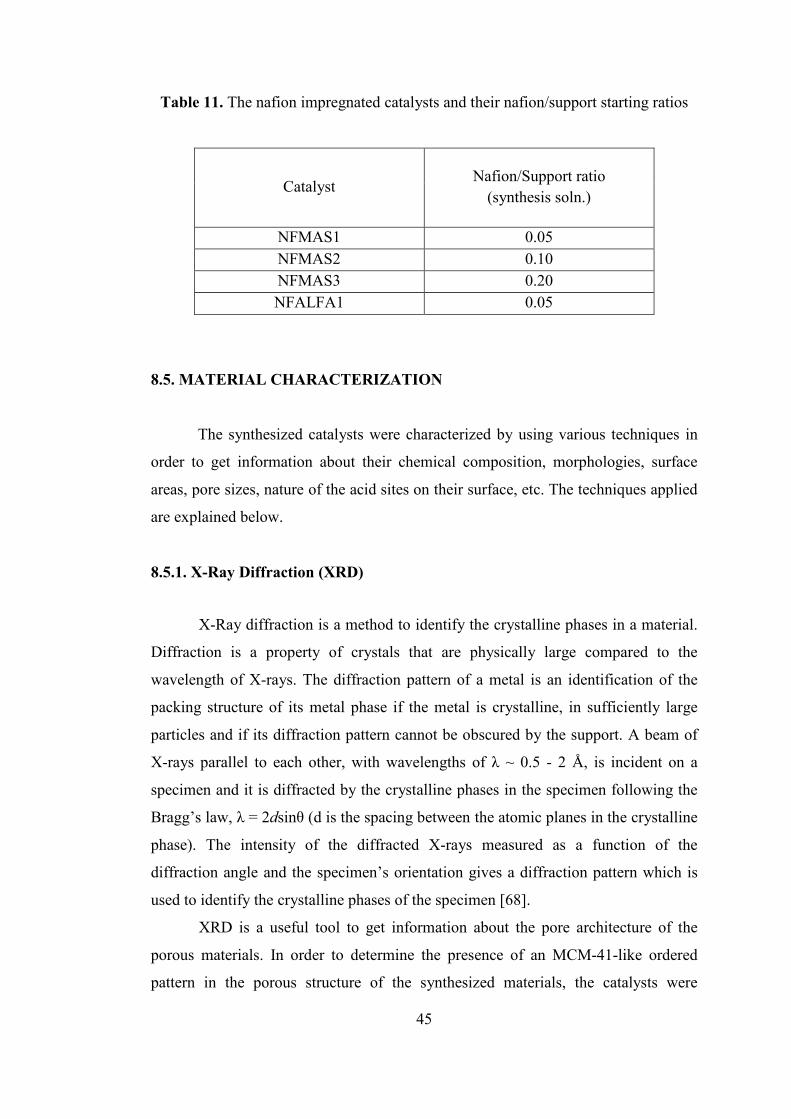
45
Table 11. The nafion impregnated catalysts and their nafion/support starting ratios
Catalyst Nafion/Support ratio
(synthesis soln.)
NFMAS1 0.05 NFMAS2 0.10 NFMAS3 0.20 NFALFA1 0.05
8.5. MATERIAL CHARACTERIZATION
The synthesized catalysts were characterized by using various techniques in
order to get information about their chemical composition, morphologies, surface
areas, pore sizes, nature of the acid sites on their surface, etc. The techniques applied
are explained below.
8.5.1. X-Ray Diffraction (XRD)
X-Ray diffraction is a method to identify the crystalline phases in a material.
Diffraction is a property of crystals that are physically large compared to the
wavelength of X-rays. The diffraction pattern of a metal is an identification of the
packing structure of its metal phase if the metal is crystalline, in sufficiently large
particles and if its diffraction pattern cannot be obscured by the support. A beam of
X-rays parallel to each other, with wavelengths of λ ~ 0.5 - 2 Å, is incident on a
specimen and it is diffracted by the crystalline phases in the specimen following the
Bragg’s law, λ = 2dsinθ (d is the spacing between the atomic planes in the crystalline
phase). The intensity of the diffracted X-rays measured as a function of the
diffraction angle and the specimen’s orientation gives a diffraction pattern which is
used to identify the crystalline phases of the specimen [68].
XRD is a useful tool to get information about the pore architecture of the
porous materials. In order to determine the presence of an MCM-41-like ordered
pattern in the porous structure of the synthesized materials, the catalysts were

46
characterized by X-Ray Diffraction (XRD) analysis in METU Metallurgical and
Materials Engineering Department using the Rigaku D/MAX2200 diffractometer
with a CuK radiation source with a 2θ scanning range between 1° and 50°.
8.5.2. N2 Physisorption
Adsorption techniques are applied to determine the porosity and specific
surface area of the catalytic materials. Surface area determination by using nitrogen
as the molecular probe is a common technique for measuring the amount of catalyst
surface available for interaction with the reactant molecules. Different models have
been developed for calculating the pore size distribution such as BET (Brunauer,
Emmett, Teller), BJH (Barrett, Joyner, Halenda), etc. [19,68].
Nitrogen adsorption analyses were done by a Quantachrome Autosorb-1-
C/MS instrument in the METU Central Laboratory. Before the analyses, the samples
were degassed at 100°C for 16 hours and the analyses were performed at a relative
pressure range of 5x10⁻² to 0.99 at liquid nitrogen temperature. Multipoint BET
surface area values, BJH adsorption and desorption pore diameters and pore volumes
of the samples were determined by this characterization technique. Nitrogen
adsorption and desorption isotherms were plotted and the pore size distributions were
determined. Additionally, single point BET surface area analyses were done by using
a Quantachrome Autosorb 1C instrument in the Chemical Engineering Department
of Gazi University. Before the analyses, degassing was performed at 140°C for 30
minutes under the flow of N2-He gas mixture. Measurements were done at liquid
nitrogen temperature (77 K) under the flow of a gas mixture composed of 30%
nitrogen and 70% helium.
8.5.3. Scanning Electron Microscopy (SEM)
SEM is an analytical instrument which provides a high magnification imaging
of a material. In Scanning Electron Microscopy, an electron beam is focused into a
fine probe and scanned over a small rectangular area of the sample. As a result of the
interaction between the beam and the sample, various signals are created. These
signals are used to modulate the brightness of a cathode ray tube, which is also
47
scanned with the electron beam at the same time and an image is observed on the
screen. This is a highly magnified image with a much greater depth than the
traditional microscopic image [19].
Scanning Electron Microscopy (SEM) analyses were done in Middle East
Technical University (METU) Central Laboratory by a Quanta 400F Field Emission
SEM instrument and in Metallurgical and Materials Engineering Department by
using JSM-6400 (JEOL) equipped with NORAN system Six. Samples were coated
with gold for the analyses. Morphologies of the materials were observed by this
technique.
8.5.4. Energy Dispersive X-Ray Spectroscopy (EDS-EDX)
The atoms in a material emit characteristic X rays when they are ionized by a
high energy radiation. EDS is a technique which is based on the collection and
energy dispersion of characteristic X rays. The elements in an EDS unit are a source
of high-energy radiation (electrons), a sample, a solid state detector and signal
processing electronics. The resulting X-ray spectrum contains a series of peaks
which represent the type and relative amount of each element in the sample [68].
Energy Dispersive X-Ray Spectroscopy (EDS) analyses were carried out in
METU Metallurgical and Materials Engineering Department by a JSM-6400 (JEOL)
instrument equipped with NORAN System Six. Samples were coated with gold
before the analyses. Bulk chemical composition of the synthesized materials were
determined by EDS.
The dispersion of specific elements on the surface of the catalysts were
observed by Energy Dispersive X-Ray (EDX) elemental mapping. The analyses were
perfomed in the Bilkent University Chemistry Department, using a scanning electron
(SE) microscope, equipped with an EDX spectrometer. SEM and EDX data were
acquired using a Zeiss EVO40 environmental SEM that is equipped with a LaB6
electron gun, a vacuum SE detector, an elevated pressure SE detector, a
backscattering electron detector (BSD), and a Bruker AXS XFlash 4010 detector.
Samples were prepared by grinding the particles into fine powder and mechanically
dispersing them on an electrically conductive carbon film which was placed on an
aluminum sample holder. SEM images were obtained using a vacuum SE detector
48
where electron acceleration voltage of the incident beam was varied within 10-20 kV
and the samples were kept at 5 × 10⁻⁵ Torr inside the SEM. EDX data were
collected using an electron acceleration voltage of 20 kV and a working distance of
15 mm. EDX revealed the elemental surface distribution of the samples on the order
of a few micrometers.
8.5.5. X-Ray Photoelectron Spectroscopy (XPS)
In XPS, the sample is bombarded with monoenergetic soft X-rays and
electrons are ejected. The elements present in the sample are identified from the
kinetic energies of the ejected photoelectrons. Also, the chemical states of the
elements present can be identified from the small variations in the determined kinetic
energies. The measured photoelectron intensities gives information about the relative
concentrations of the elements. XPS is useful in determining the elemental and
chemical state compositions in the top 30 Å [68].
In order to get information about the surface composition of the materials,
XPS analyses were done with the SPECS EA-200 instrument in the METU Cental
Laboratory by using Al as the X-ray anode, with an excitation power of 260 W, step
size of 0.10 eV, dwell time of 1 s and pass energy of 96 eV.
8.5.6. Fourier Transform Infrared Spectroscopy (FTIR)
The use of FTIR as a characterization technique is based on the vibrational
frequencies of the chemical bonds. The vibrational motions of the chemical bonds in
a material have frequencies in the infrared regime. In the infrared technique, the
intensity of a beam of infrared radiation is measured before (IO) and after (I) its
interaction with the sample as a function of light frequency. The plot of I/ IO versus
frequency is the “infrared spectrum”. By using FTIR, information about the
identities, surrounding environments, and concentrations of the chemical bonds in
the material can be obtained [68].
Fourier Transform Infrared Spectroscopy analyses of the HPA/Silica catalysts
were done by a Bruker FTIR-IFS66/S instrument in METU Central Laboratory. The

49
samples were grinded and mixed with KBr (1 mg sample, 300 mg KBr) and pressed
to obtain pellets. The chemical bonds present in the structure of the materials were
identified by this analysis technique.
8.5.7. Thermal Analyses (TGA-DTA)
In thermal analyses the sample is exposed to a gaseous environment and the
temperature is increased with time. The response of the system is monitored by
measuring the sample weight change by thermogravimetric analysis (TGA) and by
measuring the change in temperature for constant heating by differential thermal
analysis (DTA) [68].
Thermal analyses (TGA and DTA) of the synthesized materials were done by
the Dupont 951 thermal analyses system found in the METU Chemical Engineering
Department by passing air over the samples. The analyses were carried out by
increasing the temperature of the samples from room temperature to 600°C with a
heating rate of 10°C/min. This technique gave information for the selection of the
calcination temperature of the HPA/Silica materials. Results of the
thermogravimetric analyses were also used to determine the nafion content in the
Nafion/Silica catalysts.
8.5.8. Diffuse Reflectance Infrared Fourier Transform Spectroscopy (DRIFTS)
of Pyridine Adsorption
DRIFTS of pyridine adsorption is a technique to determine the nature of acid
sites on a catalyst. The synthesized materials were dried at 110°C for 16 hours and
then 1 mL of pyridine was adsorbed on them. Samples were prepared by mixing
0.035 g of the pyridine adsorbed or fresh catalysts with 0.07 g KBr. A reference
spectrum was recorded with KBr. For the acid site determination, the spectra of the
clean samples were subtracted from the spectra of the pyridine adsorbed samples.
DRIFTS analyses of pyridine adsorption were carried out by using a Perkin
Elmer Spectrum One instrument in the Kinetic Laboratory in METU Chemical
Engineering Department in order to get information about the Brönsted and Lewis
acid sites of the synthesized catalysts.
50
8.6. EXPERIMENTAL SET-UP OF THE METHANOL DEHYDRATION
REACTION SYSTEM
The vapor phase methanol dehydration reaction was carried out in a fixed bed
flow reactor system. Helium was used as the carrier gas and also as the reference gas
for the gas chromotograph. Liquid methanol was fed through a syringe pump to an
evaporator where it was mixed with helium. Gaseous methanol and helium were fed
to a stainless steel differential reactor (1/4 in.) placed in a temperature controlled
tubular furnace. The catalyst was placed in the middle of the stainless steel reactor
and fixed by quartz wool. Flow rate of helium and the total flow rate were 23 ml/min
and 44.42 ml/min, respectively. The ratio of the volumetric flow rate of methanol to
the total volumetric flow rate in the system was adjusted as 0.48. The products and
the unreacted gases were analyzed on-line by a Varian CP 3800 GC equipped with
Porapak T and a thermal conductivity detector (TCD). The TCD detector and the gas
sampling valve were heated to 225°C and 200°C, respectively. A temperature
ramped-program was used in order to separate the species involved in the reaction.
The column was heated to 75°C and it was held at this temperature for 2 minutes.
Then the temperature was increased to 170°C with a ramp of 10°C/min and held
there for 3 minutes. The connection lines were kept at 150°C in order to avoid any
condensation of the reactants or products. After finishing each experiment, the whole
system was purged with helium for 1 hour. The drawing of the experimental set-up is
shown in Figure 18. GC calibration factors and the retention times of the species
involved in the reaction are presented in Appendix A.1. Calculations for the flow
rates of methanol and helium are given in Appendix A.2 and the equations derived
for methanol conversion, product selectivities and yields are shown in Appendix A.3.
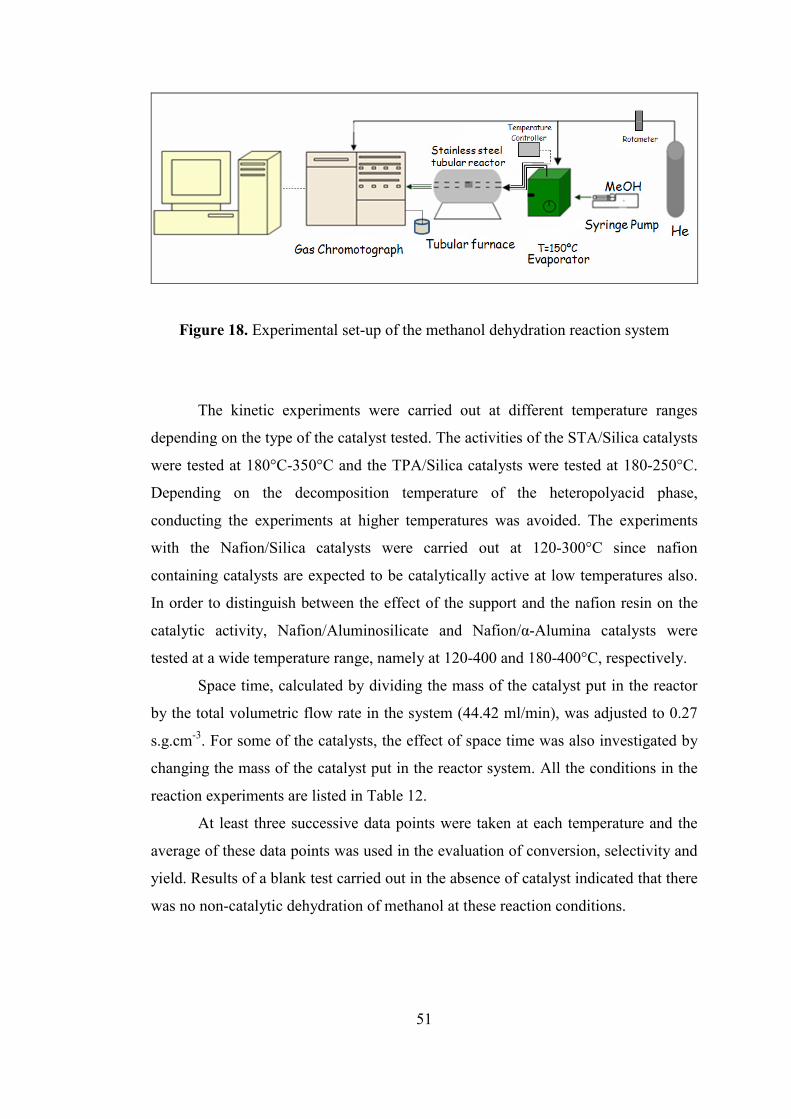
51
Figure 18. Experimental set-up of the methanol dehydration reaction system
The kinetic experiments were carried out at different temperature ranges
depending on the type of the catalyst tested. The activities of the STA/Silica catalysts
were tested at 180°C-350°C and the TPA/Silica catalysts were tested at 180-250°C.
Depending on the decomposition temperature of the heteropolyacid phase,
conducting the experiments at higher temperatures was avoided. The experiments
with the Nafion/Silica catalysts were carried out at 120-300°C since nafion
containing catalysts are expected to be catalytically active at low temperatures also.
In order to distinguish between the effect of the support and the nafion resin on the
catalytic activity, Nafion/Aluminosilicate and Nafion/α-Alumina catalysts were
tested at a wide temperature range, namely at 120-400 and 180-400°C, respectively.
Space time, calculated by dividing the mass of the catalyst put in the reactor
by the total volumetric flow rate in the system (44.42 ml/min), was adjusted to 0.27
s.g.cm-3. For some of the catalysts, the effect of space time was also investigated by
changing the mass of the catalyst put in the reactor system. All the conditions in the
reaction experiments are listed in Table 12.
At least three successive data points were taken at each temperature and the
average of these data points was used in the evaluation of conversion, selectivity and
yield. Results of a blank test carried out in the absence of catalyst indicated that there
was no non-catalytic dehydration of methanol at these reaction conditions.
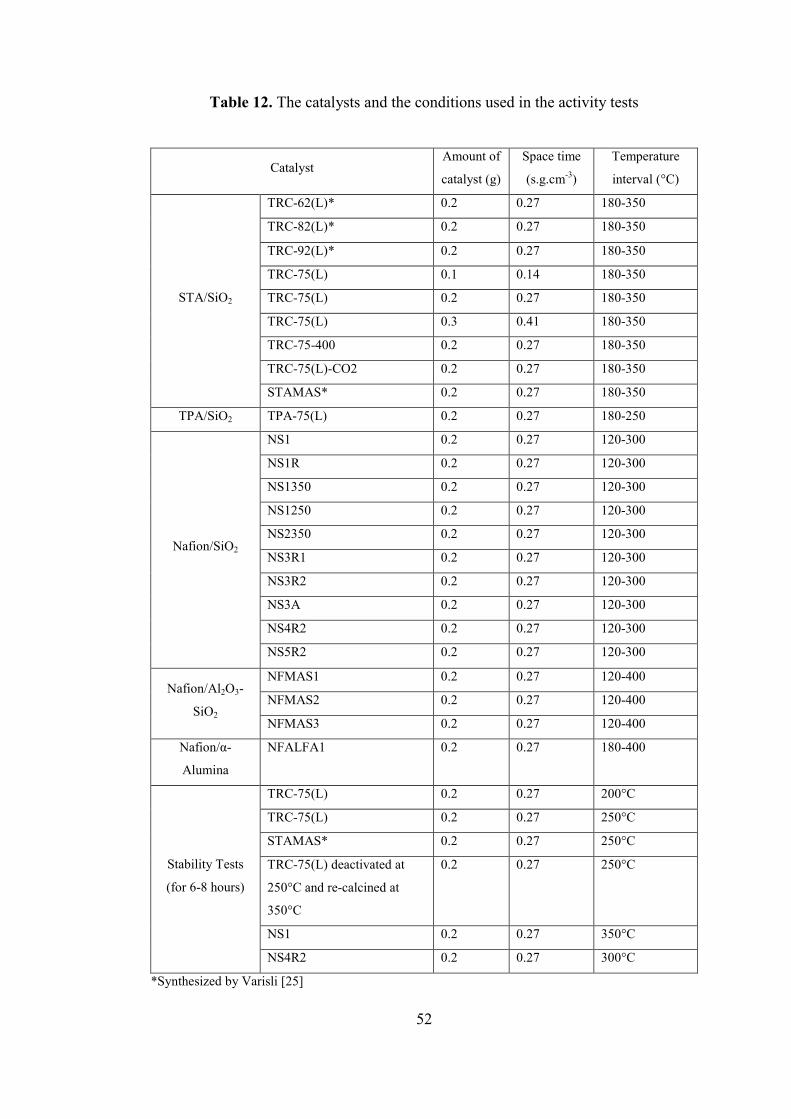
52
Table 12. The catalysts and the conditions used in the activity tests
Catalyst Amount of
catalyst (g)
Space time
(s.g.cm-3)
Temperature
interval (°C)
STA/SiO2
TRC-62(L)* 0.2 0.27 180-350
TRC-82(L)* 0.2 0.27 180-350
TRC-92(L)* 0.2 0.27 180-350
TRC-75(L) 0.1 0.14 180-350
TRC-75(L) 0.2 0.27 180-350
TRC-75(L) 0.3 0.41 180-350
TRC-75-400 0.2 0.27 180-350
TRC-75(L)-CO2 0.2 0.27 180-350
STAMAS* 0.2 0.27 180-350
TPA/SiO2 TPA-75(L) 0.2 0.27 180-250
Nafion/SiO2
NS1 0.2 0.27 120-300
NS1R 0.2 0.27 120-300
NS1350 0.2 0.27 120-300
NS1250 0.2 0.27 120-300
NS2350 0.2 0.27 120-300
NS3R1 0.2 0.27 120-300
NS3R2 0.2 0.27 120-300
NS3A 0.2 0.27 120-300
NS4R2 0.2 0.27 120-300
NS5R2 0.2 0.27 120-300
Nafion/Al2O3-
SiO2
NFMAS1 0.2 0.27 120-400
NFMAS2 0.2 0.27 120-400
NFMAS3 0.2 0.27 120-400
Nafion/α-
Alumina
NFALFA1 0.2 0.27 180-400
Stability Tests
(for 6-8 hours)
TRC-75(L) 0.2 0.27 200°C
TRC-75(L) 0.2 0.27 250°C
STAMAS* 0.2 0.27 250°C
TRC-75(L) deactivated at
250°C and re-calcined at
350°C
0.2 0.27 250°C
NS1 0.2 0.27 350°C
NS4R2 0.2 0.27 300°C
*Synthesized by Varisli [25]

53
CHAPTER 9
RESULTS AND DISCUSSION
9.1. CHARACTERIZATION OF STA/SILICA CATALYSTS
9.1.1. X-Ray Diffraction (XRD)
The X-ray diffraction patterns of the STA/Silica catalysts synthesized by
taking the W/Si molar ratios as 0.4 are shown in Figure 19. From 1°-10°, diffraction
peaks belonging to the 100 plane of MCM-41 and its reflections are observed but
there is a significant loss in the sharpness of the peaks when compared with the XRD
pattern of pure MCM-41. These patterns imply the existence of a mesoporous
structure but it is clear that the MCM-41 structure was destructed and the catalysts
are rather amorphous. No peak was observed related to the presence of WOx in the
structure of the catalysts synthesized in the present study, which suggest that the new
STA/Silica catalysts have well-dispersed structures. The XRD patterns of the
previously synthesized STA/Silica catalysts (TRC-62(L), TRC-82(L) and TRC-
92(L)) by Varisli [25] on the other hand, showed the presence of sharp peaks
corresponding to W20O58 dispersed within the mesoporous silicate matrix of the
materials.
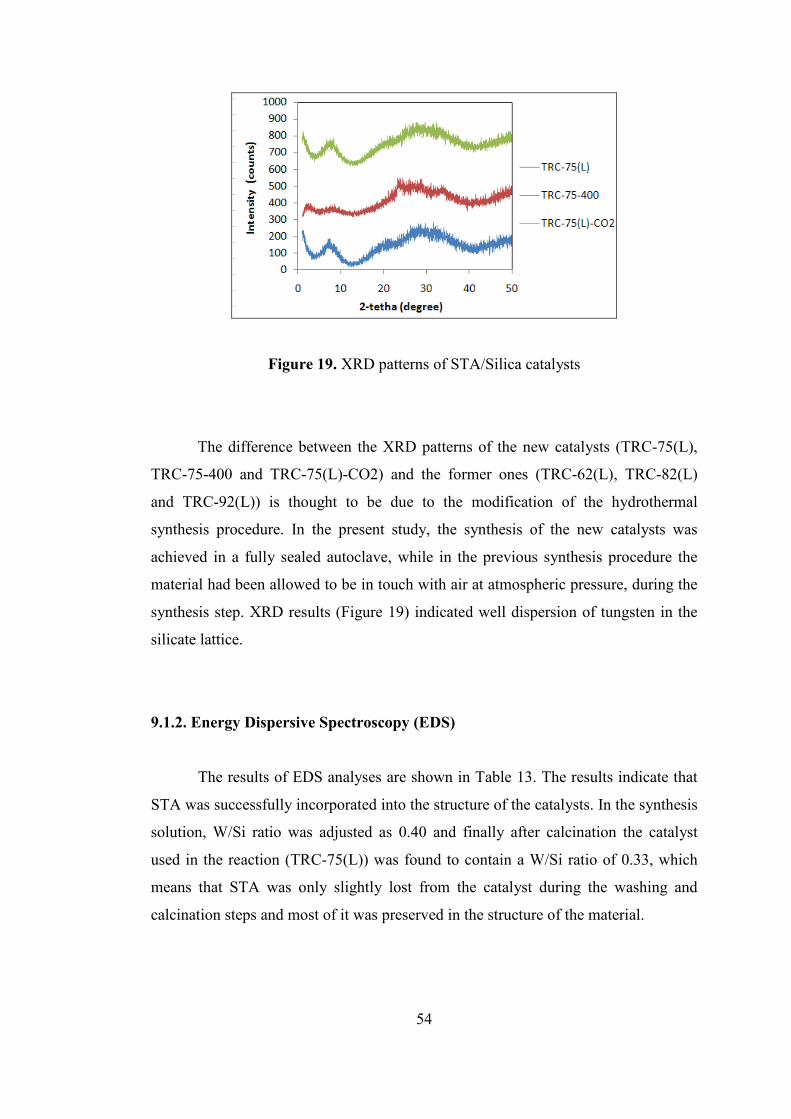
54
Figure 19. XRD patterns of STA/Silica catalysts
The difference between the XRD patterns of the new catalysts (TRC-75(L),
TRC-75-400 and TRC-75(L)-CO2) and the former ones (TRC-62(L), TRC-82(L)
and TRC-92(L)) is thought to be due to the modification of the hydrothermal
synthesis procedure. In the present study, the synthesis of the new catalysts was
achieved in a fully sealed autoclave, while in the previous synthesis procedure the
material had been allowed to be in touch with air at atmospheric pressure, during the
synthesis step. XRD results (Figure 19) indicated well dispersion of tungsten in the
silicate lattice.
9.1.2. Energy Dispersive Spectroscopy (EDS)
The results of EDS analyses are shown in Table 13. The results indicate that
STA was successfully incorporated into the structure of the catalysts. In the synthesis
solution, W/Si ratio was adjusted as 0.40 and finally after calcination the catalyst
used in the reaction (TRC-75(L)) was found to contain a W/Si ratio of 0.33, which
means that STA was only slightly lost from the catalyst during the washing and
calcination steps and most of it was preserved in the structure of the material.
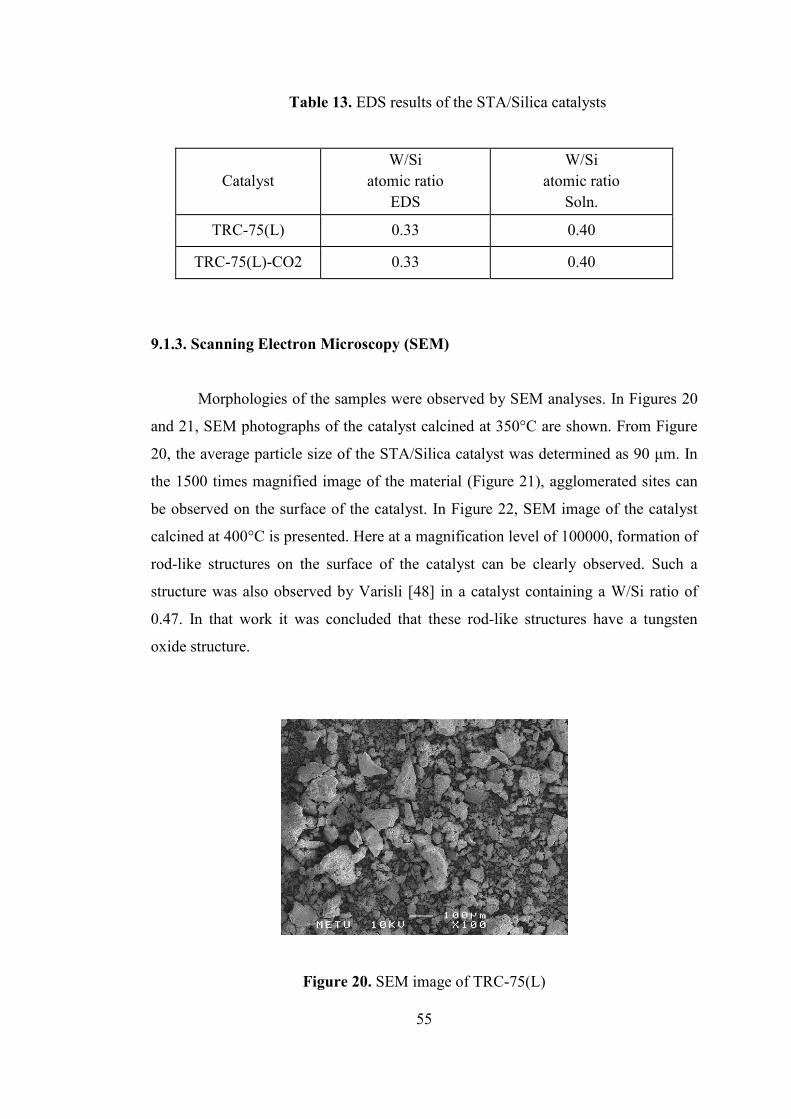
55
Table 13. EDS results of the STA/Silica catalysts
Catalyst W/Si
atomic ratio EDS
W/Si atomic ratio
Soln.
TRC-75(L) 0.33 0.40
TRC-75(L)-CO2 0.33 0.40
9.1.3. Scanning Electron Microscopy (SEM)
Morphologies of the samples were observed by SEM analyses. In Figures 20
and 21, SEM photographs of the catalyst calcined at 350°C are shown. From Figure
20, the average particle size of the STA/Silica catalyst was determined as 90 µm. In
the 1500 times magnified image of the material (Figure 21), agglomerated sites can
be observed on the surface of the catalyst. In Figure 22, SEM image of the catalyst
calcined at 400°C is presented. Here at a magnification level of 100000, formation of
rod-like structures on the surface of the catalyst can be clearly observed. Such a
structure was also observed by Varisli [48] in a catalyst containing a W/Si ratio of
0.47. In that work it was concluded that these rod-like structures have a tungsten
oxide structure.
Figure 20. SEM image of TRC-75(L)

56
Figure 21. SEM image of TRC-75(L)
Figure 22. SEM image of TRC-75-400
9.1.4. Energy Dispersive X-Ray Spectroscopy (EDX)
The elemental mapping analyses of the catalysts are presented in Figures 23
and 24. The images show EDX mapping of single catalyst particles. It is observed
that W (shown in red) and Si (shown in yellow) are very well dispersed in the
structure of the STA/Silica catalysts synthesized by following a one-pot
hydrothermal procedure. The even distribution of W in the porous network of silica

57
proves the success of the synthesis method in obtaining STA incorporated silica
supported catalysts.
Figure 23. EDX elemental mapping analysis of TRC-75(L)
Figure 24. EDX elemental mapping analysis of TRC-75-400
9.1.5. Nitrogen Physisorption
The nitrogen physisorption analyses gave information about the multipoint
BET surface areas, pore volumes and average pore diameters of the catalysts. The
results obtained are shown in Table 14.
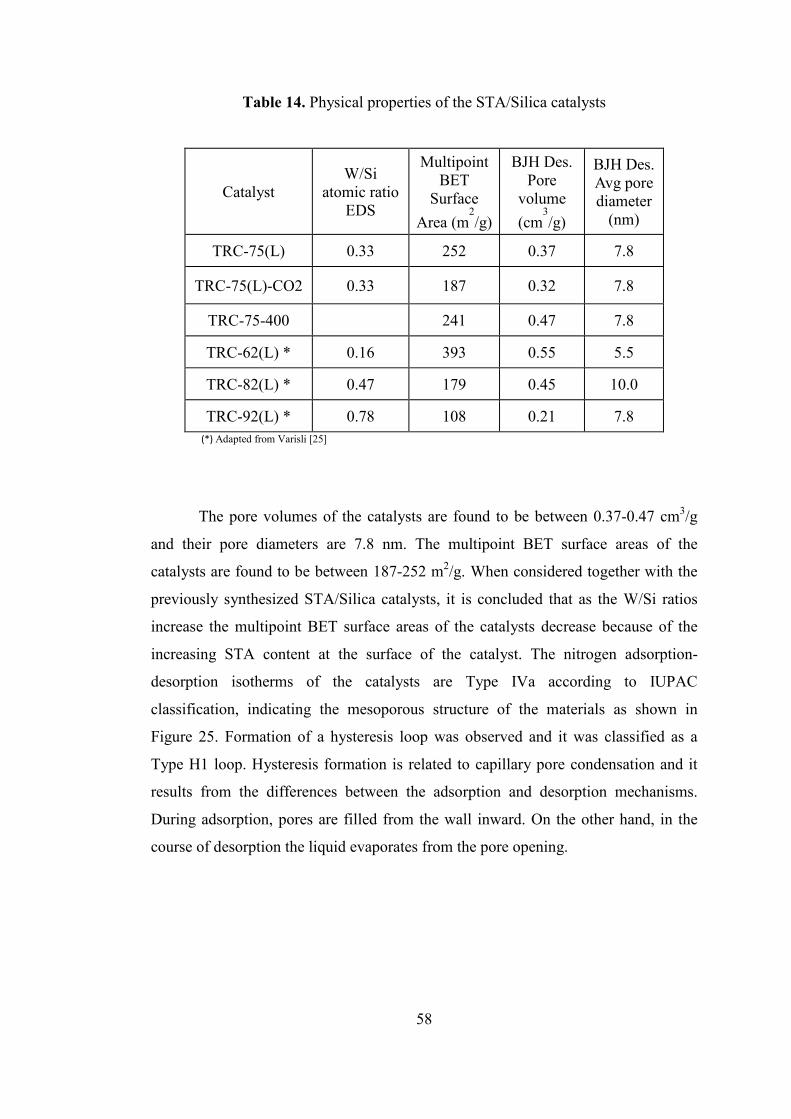
58
Table 14. Physical properties of the STA/Silica catalysts
Catalyst W/Si
atomic ratio EDS
Multipoint BET
Surface
Area (m2/g)
BJH Des. Pore
volume
(cm3/g)
BJH Des. Avg pore diameter
(nm)
TRC-75(L) 0.33 252 0.37 7.8
TRC-75(L)-CO2 0.33 187 0.32 7.8
TRC-75-400 241 0.47 7.8
TRC-62(L) * 0.16 393 0.55 5.5
TRC-82(L) * 0.47 179 0.45 10.0
TRC-92(L) * 0.78 108 0.21 7.8 (*) Adapted from Varisli [25]
The pore volumes of the catalysts are found to be between 0.37-0.47 cm3/g
and their pore diameters are 7.8 nm. The multipoint BET surface areas of the
catalysts are found to be between 187-252 m2/g. When considered together with the
previously synthesized STA/Silica catalysts, it is concluded that as the W/Si ratios
increase the multipoint BET surface areas of the catalysts decrease because of the
increasing STA content at the surface of the catalyst. The nitrogen adsorption-
desorption isotherms of the catalysts are Type IVa according to IUPAC
classification, indicating the mesoporous structure of the materials as shown in
Figure 25. Formation of a hysteresis loop was observed and it was classified as a
Type H1 loop. Hysteresis formation is related to capillary pore condensation and it
results from the differences between the adsorption and desorption mechanisms.
During adsorption, pores are filled from the wall inward. On the other hand, in the
course of desorption the liquid evaporates from the pore opening.
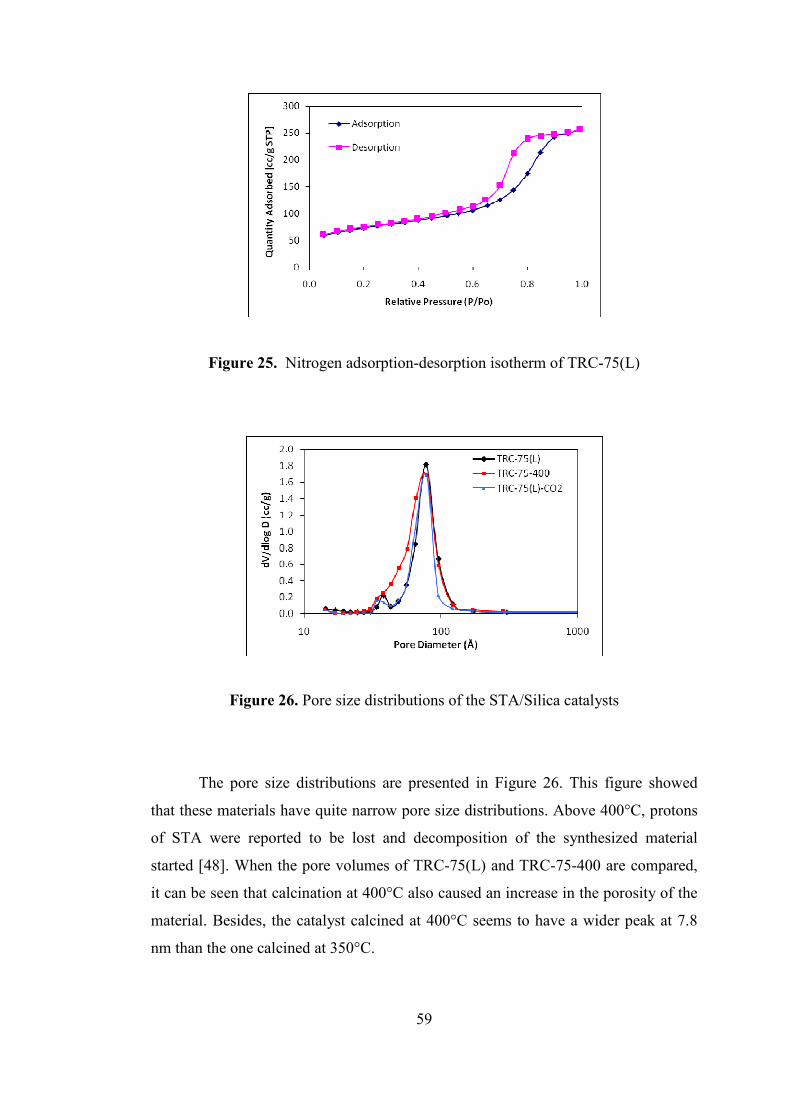
59
Figure 25. Nitrogen adsorption-desorption isotherm of TRC-75(L)
Figure 26. Pore size distributions of the STA/Silica catalysts
The pore size distributions are presented in Figure 26. This figure showed
that these materials have quite narrow pore size distributions. Above 400°C, protons
of STA were reported to be lost and decomposition of the synthesized material
started [48]. When the pore volumes of TRC-75(L) and TRC-75-400 are compared,
it can be seen that calcination at 400°C also caused an increase in the porosity of the
material. Besides, the catalyst calcined at 400°C seems to have a wider peak at 7.8
nm than the one calcined at 350°C.
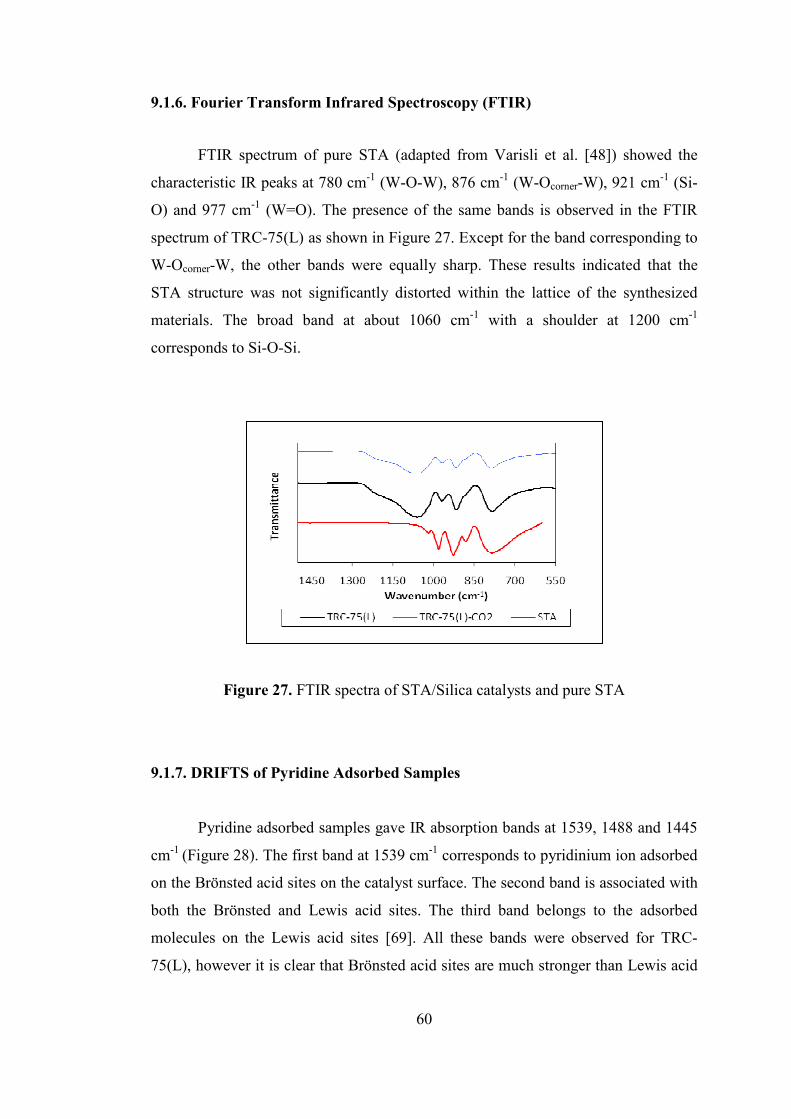
60
9.1.6. Fourier Transform Infrared Spectroscopy (FTIR)
FTIR spectrum of pure STA (adapted from Varisli et al. [48]) showed the
characteristic IR peaks at 780 cm-1 (W-O-W), 876 cm-1 (W-Ocorner-W), 921 cm-1 (Si-
O) and 977 cm-1 (W=O). The presence of the same bands is observed in the FTIR
spectrum of TRC-75(L) as shown in Figure 27. Except for the band corresponding to
W-Ocorner-W, the other bands were equally sharp. These results indicated that the
STA structure was not significantly distorted within the lattice of the synthesized
materials. The broad band at about 1060 cm-1 with a shoulder at 1200 cm-1
corresponds to Si-O-Si.
Figure 27. FTIR spectra of STA/Silica catalysts and pure STA
9.1.7. DRIFTS of Pyridine Adsorbed Samples
Pyridine adsorbed samples gave IR absorption bands at 1539, 1488 and 1445
cm-1 (Figure 28). The first band at 1539 cm-1 corresponds to pyridinium ion adsorbed
on the Brönsted acid sites on the catalyst surface. The second band is associated with
both the Brönsted and Lewis acid sites. The third band belongs to the adsorbed
molecules on the Lewis acid sites [69]. All these bands were observed for TRC-
75(L), however it is clear that Brönsted acid sites are much stronger than Lewis acid

61
sites. In the case of the material prepared with supercritical CO2 extraction, the
relative intensity of the Brönsted acid sites is even stronger. Presence of Brönsted
acid sites is the major indication of the catalytic activities of these catalysts for
alcohol dehydration reactions.
Figure 28. DRIFTS spectra of the STA/Silica catalysts
9.2. CHARACTERIZATION OF TPA/SILICA CATALYSTS
9.2.1. Thermal Analyses (TGA-DTA)
The result of the thermal analysis of the uncalcined TPA/Silica catalyst is
shown in Figure 29. It was observed that over 300°C, TPA structure started to
decompose based on the presence of two sharp peaks at 378°C and 493°C on the
DTA curve. The major weight loss between 200-300°C corresponds to the removal
of surfactant. Based on this result, the material was calcined at 270°C in dry air.
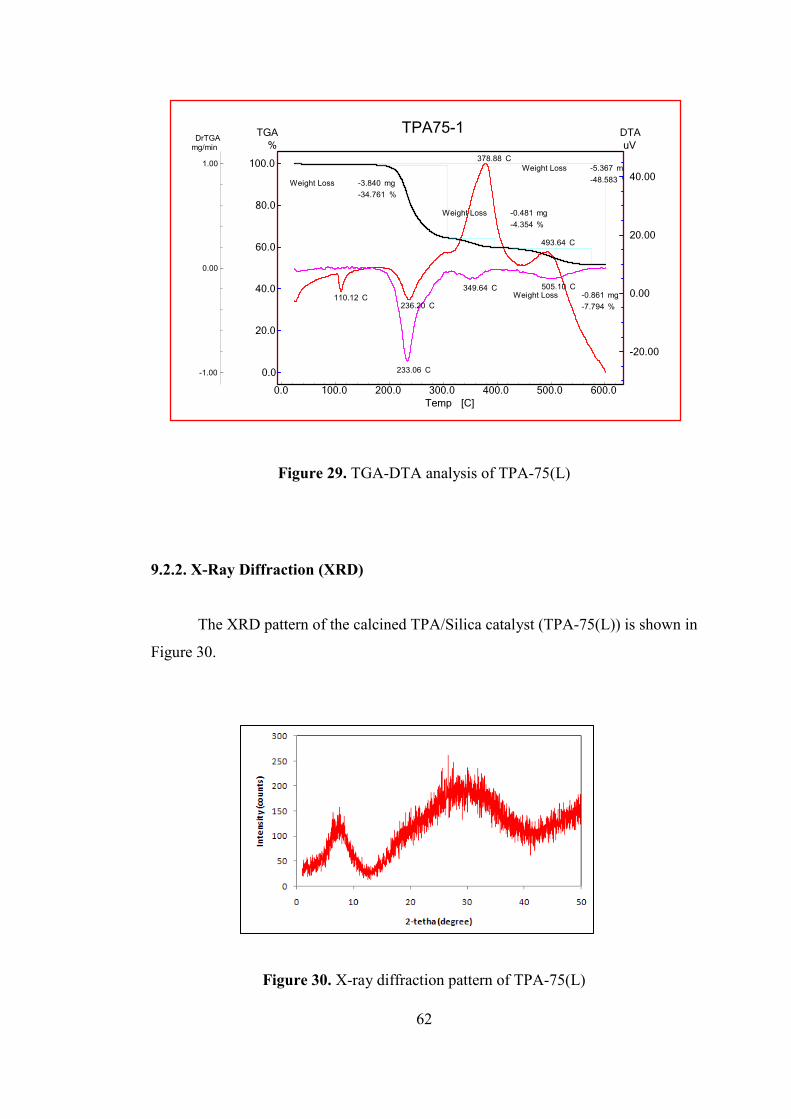
62
0.0 100.0 200.0 300.0 400.0 500.0 600.0
Temp [C]
0.0
20.0
40.0
60.0
80.0
100.0
%
TGA
-1.00
0.00
1.00
mg/minDrTGA
-20.00
0.00
20.00
40.00
uV
DTA
110.12 C
378.88 C
236.20 C
493.64 C
-5.367 mg
-48.583 %
Weight Loss
-3.840 mg
-34.761 %
Weight Loss
-0.481 mg
-4.354 %
Weight Loss
-0.861 mg
-7.794 %
Weight Loss
233.06 C
349.64 C 505.10 C
TPA75-1
Figure 29. TGA-DTA analysis of TPA-75(L)
9.2.2. X-Ray Diffraction (XRD)
The XRD pattern of the calcined TPA/Silica catalyst (TPA-75(L)) is shown in
Figure 30.
Figure 30. X-ray diffraction pattern of TPA-75(L)

63
Similar to TRC-75(L), TPA-75(L) is also amorphous with a rather destructed
mesoporous framework and a well-dispersed structure.
9.2.3. Energy Dispersive Spectroscopy (EDS)
TPA-75(L) was prepared by taking the same W/Si molar ratio of 0.40 in the
synthesis solution as TRC-75(L) in order to compare the effect of TPA and STA as
the active phase on the characteristics and catalytic activity of the resulting silicate
structured catalyst. The comparison of the W/Si ratios for TPA-75(L) and TRC-
75(L) are shown in Table 15. The EDS results show that TPA-75(L) has a higher
W/Si ratio (0.52). Therefore, it can be concluded that when TPA is used as the active
phase, it better incorporates into the material.
Table 15. The comparison of the EDS results of TPA-75(L) and TRC-75(L)
9.2.4. Scanning Electron Microscopy (SEM)
SEM images of TPA-75(L) are presented in Figures 31 and 32. From Figure
31, the average particle size of the catalyst was determined as 110 µm.
Catalyst Active Phase W/Si
atomic ratio EDS
W/Si atomic ratio
Soln.
TPA-75(L) TPA 0.52 0.40
TRC-75(L) STA 0.33 0.40

64
Figure 31. SEM image of TPA-75(L)
Figure 32. SEM image of TPA-75(L)
9.2.5. Nitrogen Physisorption
The Multipoint BET surface area, pore volume and pore diameter of the
samples were characterized by N2 physisorption (Table 16). When compared with
the STA/Silica catalyst, TPA/Silica has a lower multipoint BET surface area (143
m2/g), and a smaller pore volume (0.23 cm3/g) with narrower pores (5.6 nm). This
supports our previous conclusion that when TPA is used as the active phase it seems
to incorporate better than STA into the silicate network.
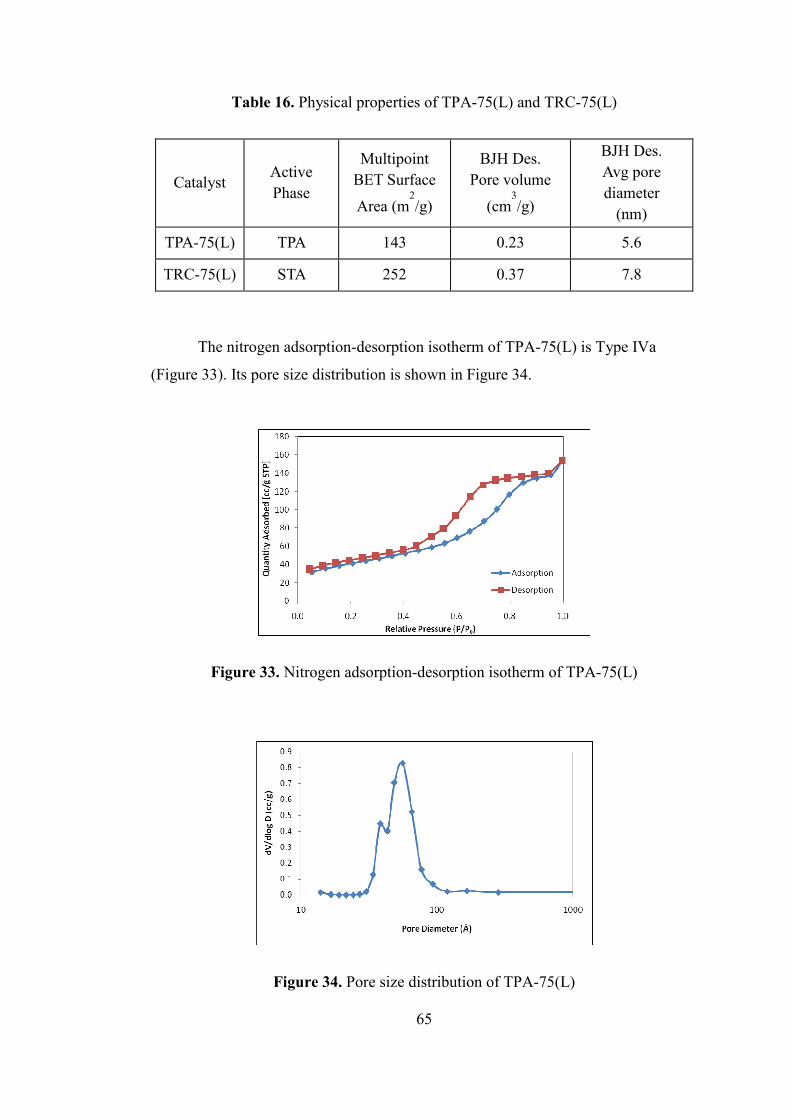
65
Table 16. Physical properties of TPA-75(L) and TRC-75(L)
Catalyst Active Phase
Multipoint BET Surface
Area (m2/g)
BJH Des. Pore volume
(cm3/g)
BJH Des. Avg pore diameter
(nm)
TPA-75(L) TPA 143 0.23 5.6
TRC-75(L) STA 252 0.37 7.8
The nitrogen adsorption-desorption isotherm of TPA-75(L) is Type IVa
(Figure 33). Its pore size distribution is shown in Figure 34.
Figure 33. Nitrogen adsorption-desorption isotherm of TPA-75(L)
Figure 34. Pore size distribution of TPA-75(L)

66
9.2.6. Fourier Transform Infrared Spectroscopy (FTIR)
The FTIR spectra of pure TPA and the TPA-75(L) catalyst are given together
in Figure 35. The pure TPA showed IR peaks at 1080, 981, 889, 796, 594, 522 cm-1.
The first five bands are due to the stretching vibrations P-Oa, W-Od, W-Ob-W, W-
Oc-W, and to the bending vibration Oa-P-Oa, respectively. The subscripts signify
oxygen bridging the W and the heteroatom (a), corner-sharing (b) and edge-sharing
oxygen(c) belonging to octahedral WO6 and terminal oxygen (d) [47].
The peaks belonging to the pure TPA were observed in the case of TPA-
75(L) but there seems to be a decrease in their intensities, which imply some
distortion of the TPA phase in the lattice of the material. The broad band at about
1075 cm-1 with a shoulder at 1200 cm-1 corresponds to Si-O-Si.
Figure 35. FTIR spectra of pure TPA and TPA-75(L)
9.2.7. DRIFTS of Pyridine Adsorbed Samples
Pyridine adsorbed samples gave two distinct IR absorption bands at 1537 and
1488 cm-1 (Figure 36). The broad band at 1442 cm-1, which belonged to pyridinium
ion adsorbed on the Lewis acid sites, was observed to be quite low in intensity.
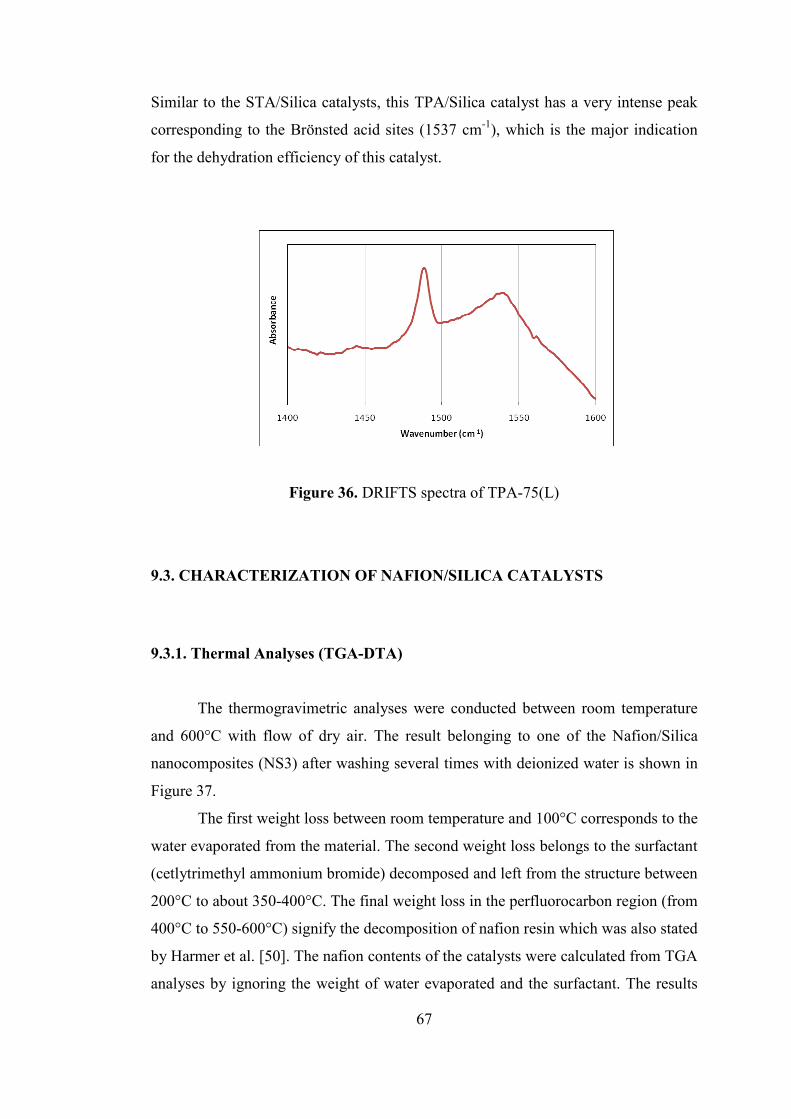
67
Similar to the STA/Silica catalysts, this TPA/Silica catalyst has a very intense peak
corresponding to the Brönsted acid sites (1537 cm-1), which is the major indication
for the dehydration efficiency of this catalyst.
Figure 36. DRIFTS spectra of TPA-75(L)
9.3. CHARACTERIZATION OF NAFION/SILICA CATALYSTS
9.3.1. Thermal Analyses (TGA-DTA)
The thermogravimetric analyses were conducted between room temperature
and 600°C with flow of dry air. The result belonging to one of the Nafion/Silica
nanocomposites (NS3) after washing several times with deionized water is shown in
Figure 37.
The first weight loss between room temperature and 100°C corresponds to the
water evaporated from the material. The second weight loss belongs to the surfactant
(cetlytrimethyl ammonium bromide) decomposed and left from the structure between
200°C to about 350-400°C. The final weight loss in the perfluorocarbon region (from
400°C to 550-600°C) signify the decomposition of nafion resin which was also stated
by Harmer et al. [50]. The nafion contents of the catalysts were calculated from TGA
analyses by ignoring the weight of water evaporated and the surfactant. The results
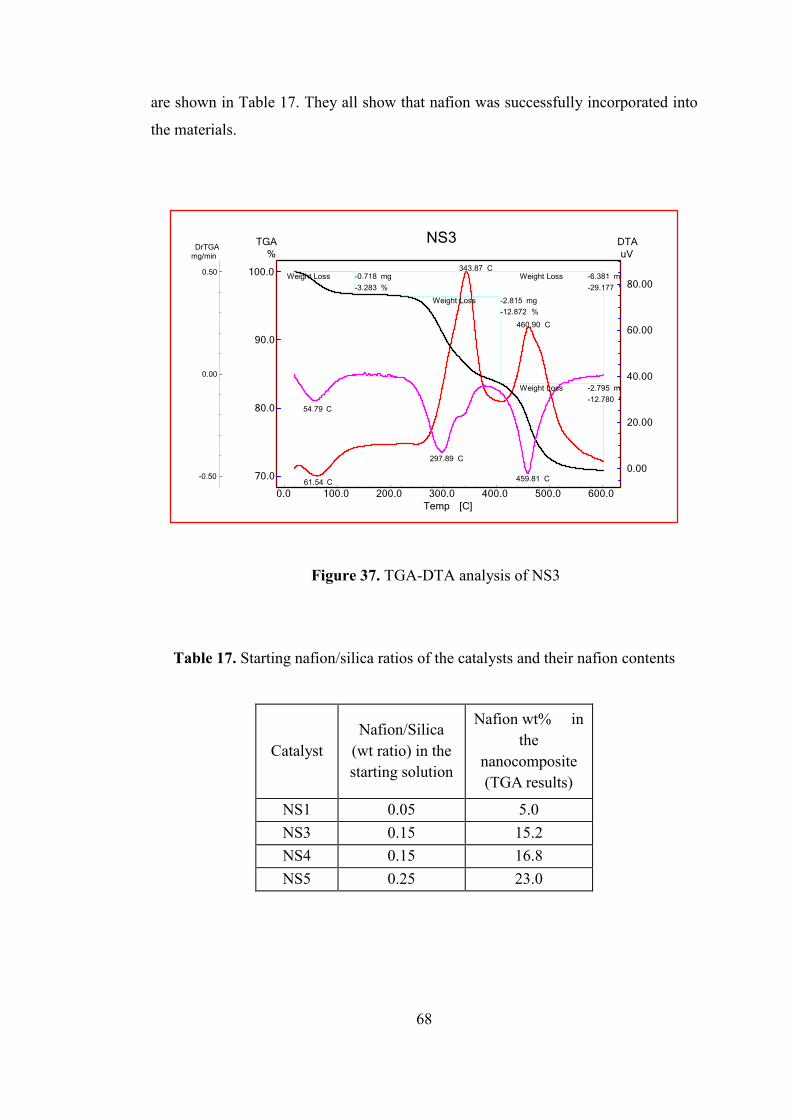
68
are shown in Table 17. They all show that nafion was successfully incorporated into
the materials.
0.0 100.0 200.0 300.0 400.0 500.0 600.0
Temp [C]
70.0
80.0
90.0
100.0
%
TGA
-0.50
0.00
0.50
mg/min
DrTGA
0.00
20.00
40.00
60.00
80.00
uV
DTA
343.87 C
460.90 C
61.54 C
-0.718 mg
-3.283 %
Weight Loss
-2.815 mg
-12.872 %
Weight Loss
-2.795 mg
-12.780 %
Weight Loss
-6.381 mg
-29.177 %
Weight Loss
54.79 C
297.89 C
459.81 C
NS3
Figure 37. TGA-DTA analysis of NS3
Table 17. Starting nafion/silica ratios of the catalysts and their nafion contents
Catalyst Nafion/Silica
(wt ratio) in the starting solution
Nafion wt% in the
nanocomposite (TGA results)
NS1 0.05 5.0
NS3 0.15 15.2
NS4 0.15 16.8
NS5 0.25 23.0
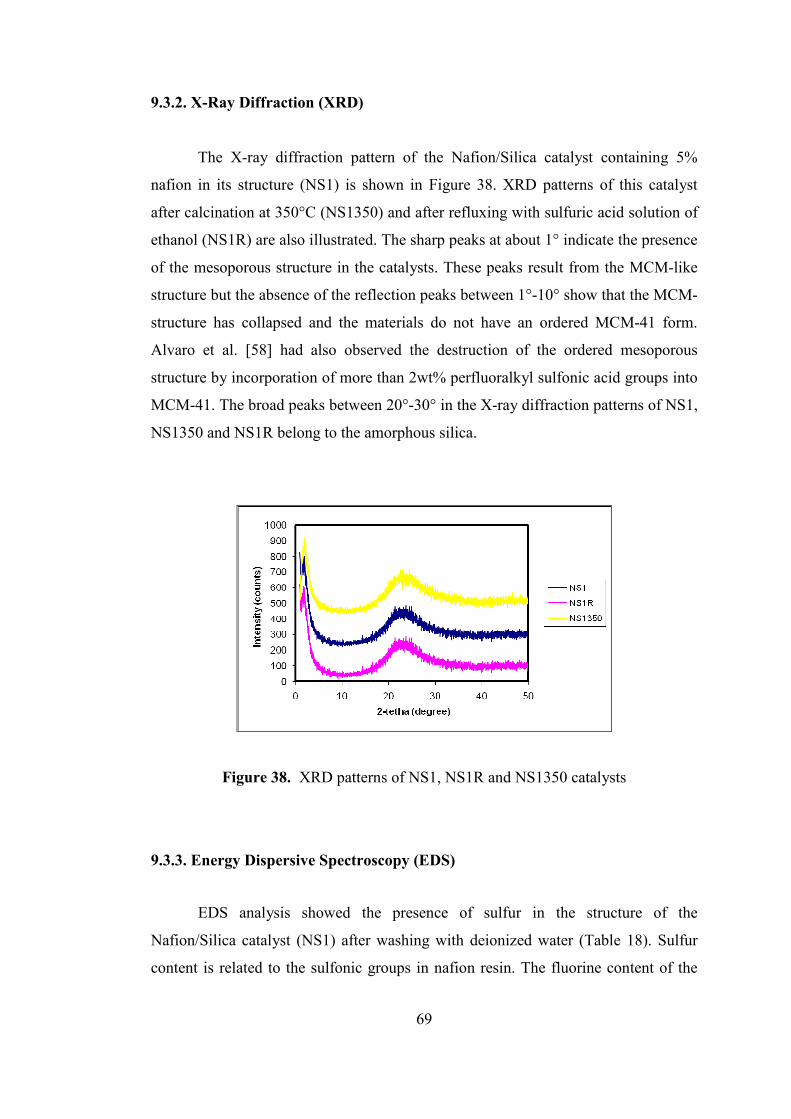
69
9.3.2. X-Ray Diffraction (XRD)
The X-ray diffraction pattern of the Nafion/Silica catalyst containing 5%
nafion in its structure (NS1) is shown in Figure 38. XRD patterns of this catalyst
after calcination at 350°C (NS1350) and after refluxing with sulfuric acid solution of
ethanol (NS1R) are also illustrated. The sharp peaks at about 1° indicate the presence
of the mesoporous structure in the catalysts. These peaks result from the MCM-like
structure but the absence of the reflection peaks between 1°-10° show that the MCM-
structure has collapsed and the materials do not have an ordered MCM-41 form.
Alvaro et al. [58] had also observed the destruction of the ordered mesoporous
structure by incorporation of more than 2wt% perfluoralkyl sulfonic acid groups into
MCM-41. The broad peaks between 20°-30° in the X-ray diffraction patterns of NS1,
NS1350 and NS1R belong to the amorphous silica.
Figure 38. XRD patterns of NS1, NS1R and NS1350 catalysts
9.3.3. Energy Dispersive Spectroscopy (EDS)
EDS analysis showed the presence of sulfur in the structure of the
Nafion/Silica catalyst (NS1) after washing with deionized water (Table 18). Sulfur
content is related to the sulfonic groups in nafion resin. The fluorine content of the
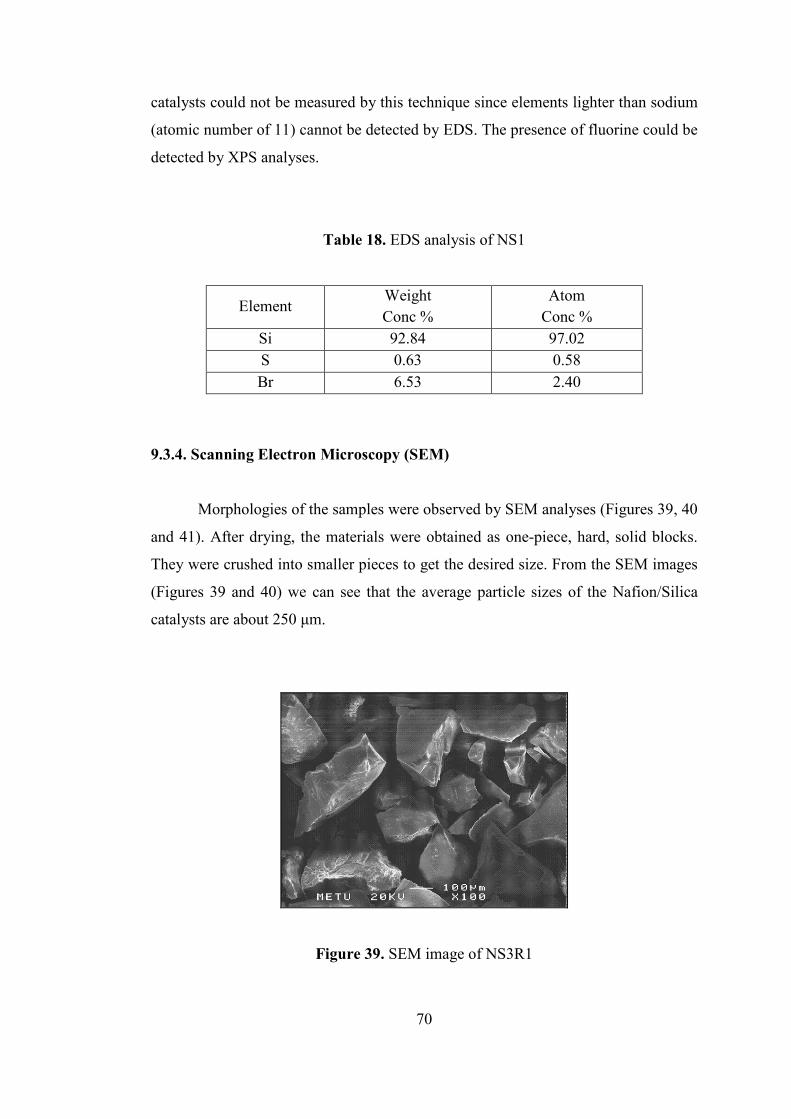
70
catalysts could not be measured by this technique since elements lighter than sodium
(atomic number of 11) cannot be detected by EDS. The presence of fluorine could be
detected by XPS analyses.
Table 18. EDS analysis of NS1
Element Weight Conc %
Atom Conc %
Si 92.84 97.02 S 0.63 0.58 Br 6.53 2.40
9.3.4. Scanning Electron Microscopy (SEM)
Morphologies of the samples were observed by SEM analyses (Figures 39, 40
and 41). After drying, the materials were obtained as one-piece, hard, solid blocks.
They were crushed into smaller pieces to get the desired size. From the SEM images
(Figures 39 and 40) we can see that the average particle sizes of the Nafion/Silica
catalysts are about 250 µm.
Figure 39. SEM image of NS3R1

71
Figure 40. SEM image of NS4R2
Figure 41. SEM image of NS4R2
The rest of the SEM images for all the catalysts synthesized are presented in
Appendix B.
9.3.5. Energy Dispersive X-Ray Spectroscopy (EDX)
The elemental mapping analysis of NS1R is shown in Figure 42. EDX images
show that the single catalyst particles have very well dispersed F (shown in green)
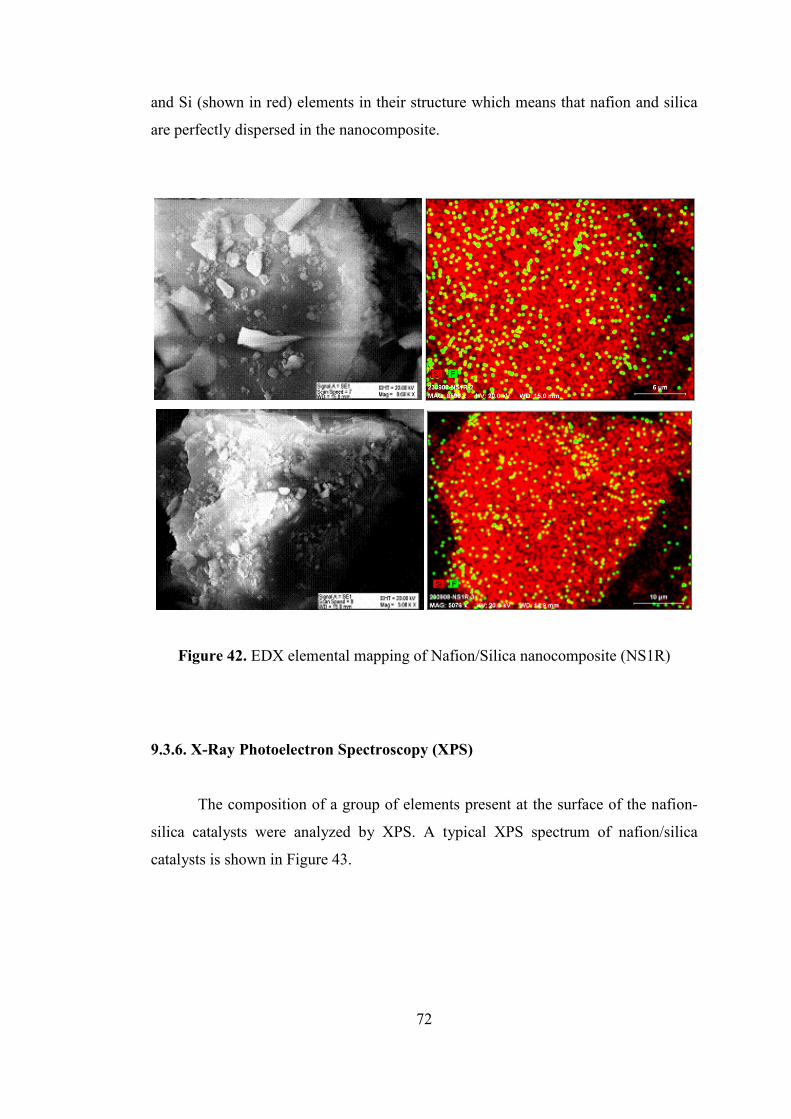
72
and Si (shown in red) elements in their structure which means that nafion and silica
are perfectly dispersed in the nanocomposite.
Figure 42. EDX elemental mapping of Nafion/Silica nanocomposite (NS1R)
9.3.6. X-Ray Photoelectron Spectroscopy (XPS)
The composition of a group of elements present at the surface of the nafion-
silica catalysts were analyzed by XPS. A typical XPS spectrum of nafion/silica
catalysts is shown in Figure 43.
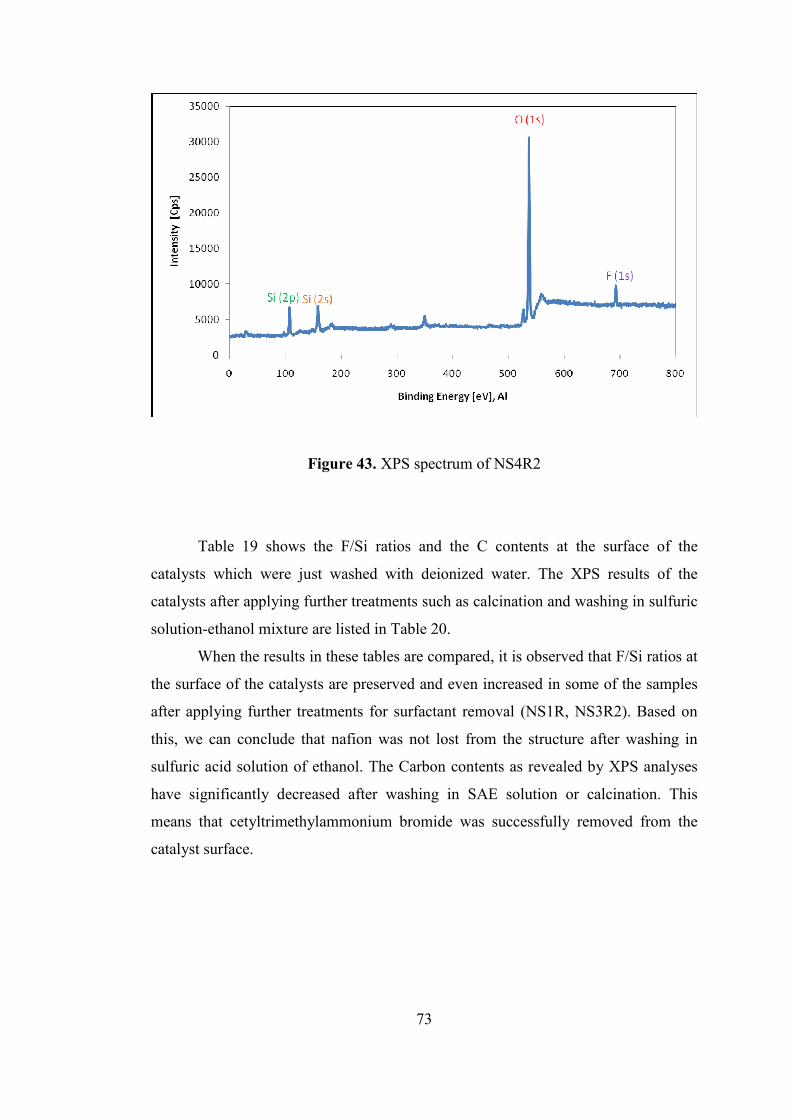
73
Figure 43. XPS spectrum of NS4R2
Table 19 shows the F/Si ratios and the C contents at the surface of the
catalysts which were just washed with deionized water. The XPS results of the
catalysts after applying further treatments such as calcination and washing in sulfuric
solution-ethanol mixture are listed in Table 20.
When the results in these tables are compared, it is observed that F/Si ratios at
the surface of the catalysts are preserved and even increased in some of the samples
after applying further treatments for surfactant removal (NS1R, NS3R2). Based on
this, we can conclude that nafion was not lost from the structure after washing in
sulfuric acid solution of ethanol. The Carbon contents as revealed by XPS analyses
have significantly decreased after washing in SAE solution or calcination. This
means that cetyltrimethylammonium bromide was successfully removed from the
catalyst surface.
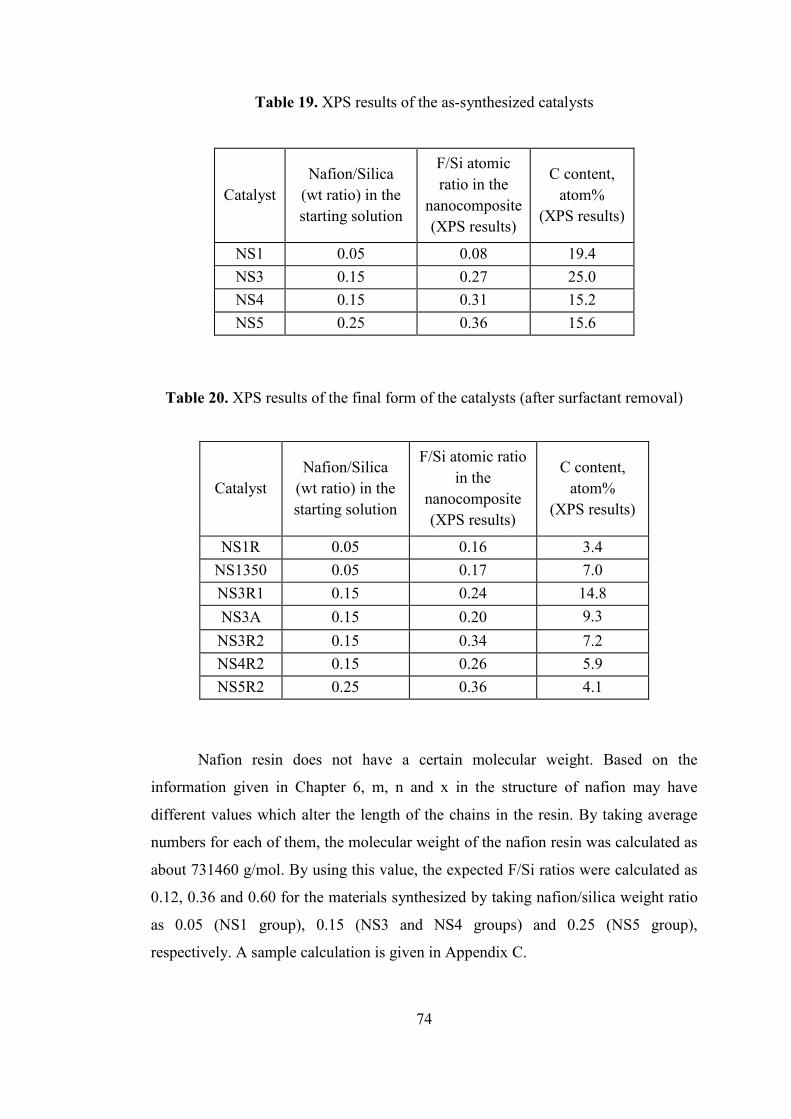
74
Table 19. XPS results of the as-synthesized catalysts
Catalyst Nafion/Silica
(wt ratio) in the starting solution
F/Si atomic ratio in the
nanocomposite (XPS results)
C content, atom%
(XPS results)
NS1 0.05 0.08 19.4
NS3 0.15 0.27 25.0
NS4 0.15 0.31 15.2
NS5 0.25 0.36 15.6
Table 20. XPS results of the final form of the catalysts (after surfactant removal)
Catalyst Nafion/Silica
(wt ratio) in the starting solution
F/Si atomic ratio in the
nanocomposite (XPS results)
C content, atom%
(XPS results)
NS1R 0.05 0.16 3.4
NS1350 0.05 0.17 7.0
NS3R1 0.15 0.24 14.8
NS3A 0.15 0.20 9.3
NS3R2 0.15 0.34 7.2
NS4R2 0.15 0.26 5.9
NS5R2 0.25 0.36 4.1
Nafion resin does not have a certain molecular weight. Based on the
information given in Chapter 6, m, n and x in the structure of nafion may have
different values which alter the length of the chains in the resin. By taking average
numbers for each of them, the molecular weight of the nafion resin was calculated as
about 731460 g/mol. By using this value, the expected F/Si ratios were calculated as
0.12, 0.36 and 0.60 for the materials synthesized by taking nafion/silica weight ratio
as 0.05 (NS1 group), 0.15 (NS3 and NS4 groups) and 0.25 (NS5 group),
respectively. A sample calculation is given in Appendix C.

75
For NS1R and NS1350, XPS results gave the F/Si ratios as 0.16 and 0.17,
respectively. They are higher than the expected value of 0.12, which may be an
indication of silica loss from the structure of the catalyst during synthesis. However,
we also know that XPS gives information about the elemental composition at the
surface of the catalyst up to a depth of 3 nm. So, we may also conclude that most of
the incorporated nafion resin is located at the surface of the catalyst rather than being
hidden in the bulk of the material, which enables a good interaction between the
reactants and the active nafion species. Therefore, this is desired in terms of
obtaining good catalytic activity. In the case of NS3 group (NS3R1, NS3A, NS3R2)
the highest F/Si ratio was obtained with NS3R2 as 0.34 which is very close to the
expected value of 0.36. This can be explained by an increase in the F/Si at the
catalyst surface with an increase in nafion content and also with an increase of acid
strength of the SAE solution used in washing. For NS4R2, XPS results showed a
slight decrease in F/Si ratio at the surface. Finally, NS5R2 had an F/Si ratio of 0.36
which is much less than the expected value of 0.60. This is probably because there is
an optimum value of nafion loading for the hydrothermally synthesized nafion/silica
catalysts developed in this work. Even if the nafion/silica weight ratio was increased
up to 0.25 in the synthesis solution, it did not have an effect in the resulting nafion
content of the synthesized material.
9.3.7. Nitrogen Physisorption
The results of the nitrogen physisorption analyses of the catalysts are given in
Tables 21 and 22. Even before calcination or washing in SAE solution, the
multipoint BET surface areas of the catalysts were around 300 m2/g which is quite
high when compared to the surface area of pure nafion resin (0.02 m2/g). Further
increase in multipoint BET surface areas and pore volumes were observed for the
catalysts after applying treatments for surfactant template removal (Table 22).

76
Table 21. Physical properties of the as-synthesized catalysts
Catalyst Nafion/Silica
(wt ratio) in the starting solution
Multipoint BET surface
area (m2/g)
BJH Des. Pore
Volume
(cm3/g)
BJH Des. Avg Pore Diameter
(nm)
NS1 0.05 313.9 0.48 4.3
NS3 0.15 277.6 0.45 4.3
NS4 0.15 274.1 0.42 4.3
NS5 0.25 282.7 0.44 4.3
Table 22. Physical properties of the final form of the catalysts (after surfactant
removal)
Catalyst Nafion/Silica
(wt ratio) in the starting solution
Multipoint BET surface
area (m2/g)
BJH Des. Pore
Volume
(cm3/g)
BJH Des. Avg Pore Diameter
(nm)
NS1R 0.05 792.4 0.97 4.3
NS1350 0.05 658.8 0.83 4.3
NS3R1 0.15 678.3 0.87 4.3
NS3A 0.15 678.8 0.88 4.3
NS3R2 0.15 658.7 0.84 4.3
NS4R2 0.15 594.8 0.71 4.3
NS5R2 0.25 745.8 0.93 4.3
The final catalysts obtained after washing in SAE solution had surface areas
in the range 594.8-792.4 m2/g. This is an indication of the effectiveness of the
surfactant removal technique. Calcination also seems to have increased the surface
area of the catalyst (658.8 m2/g). Pore volumes of the catalysts were in the range
0.71-0.97 cm3/g.
The BJH adsorption-desorption isotherms of the catalysts are Type IVb
according to the IUPAC classification (Figures 44 and 45), indicating the

77
mesoporous structure of the materials. Type H2 hysteresis loops were observed. The
steep desorption branch signifies that there is interconnectivity in the porous network
of the nanocomposite [70].
Single point surface areas of some of the catalysts were determined and they
are presented in Appendix D. They are in agreement with the multipoint BET surface
areas.
Figure 44. Nitrogen adsorption-desorption isotherm of NS3R2
Figure 45. Nitrogen adsorption-desorption isotherm of NS4R2

78
The pore size distributions of the catalysts are given in Figure 46. As
observed from the figure, pore size distributions show that the pore diameters of all
the materials are in the mesoporous range giving a peak at 4.3 nm. All the samples
had average BJH desorption pore diameters of 4.3 nm.
Figure 46. Pore size distributions of Nafion/Silica catalysts
9.3.8. DRIFTS of Pyridine Adsorbed Samples
Pyridine adsorbed samples gave IR absorption bands at 1598, 1543, 1490 and
1446 cm-1 as presented in Figure 47. The band at 1543 cm-1 corresponds to
pyridinium ion adsorbed on the Brönsted acid sites on the catalyst surface. The band
at 1490 cm-1 is associated with both the Brönsted and Lewis acid sites. The bands at
1598 and 1446 cm-1 belong to the adsorbed molecules on the Lewis acid sites.
NS4R2 has the most intense peaks when compared to the other catalysts. The
Brönsted acidities of the catalysts are increasing in the following order : NS1R,
NS5R2, NS3A, NS3R1, NS3R2, NS4R2. Since Brönsted acidity is the key parameter
for the activity of a catalyst in methanol dehydration reactions, highest DME yield in
methanol dehydration is expected to be obtained in the presence of NS4R2.
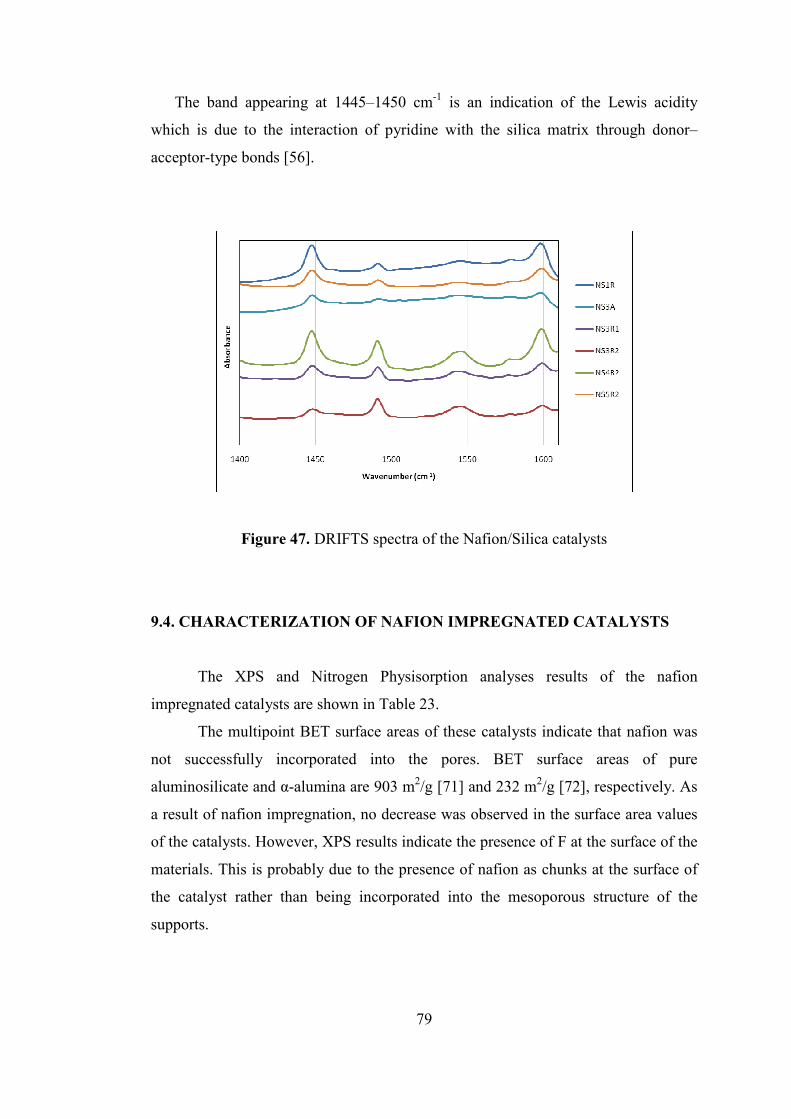
79
The band appearing at 1445–1450 cm-1 is an indication of the Lewis acidity
which is due to the interaction of pyridine with the silica matrix through donor–
acceptor-type bonds [56].
Figure 47. DRIFTS spectra of the Nafion/Silica catalysts
9.4. CHARACTERIZATION OF NAFION IMPREGNATED CATALYSTS
The XPS and Nitrogen Physisorption analyses results of the nafion
impregnated catalysts are shown in Table 23.
The multipoint BET surface areas of these catalysts indicate that nafion was
not successfully incorporated into the pores. BET surface areas of pure
aluminosilicate and α-alumina are 903 m2/g [71] and 232 m2/g [72], respectively. As
a result of nafion impregnation, no decrease was observed in the surface area values
of the catalysts. However, XPS results indicate the presence of F at the surface of the
materials. This is probably due to the presence of nafion as chunks at the surface of
the catalyst rather than being incorporated into the mesoporous structure of the
supports.

Tab
le 2
3. P
hysi
cal p
rope
rtie
s of
the
nafi
on im
preg
nate
d ca
taly
sts
80
Cat
alys
t
Naf
ion/
Alu
min
osi
licat
e or
α-
Alu
min
a w
t ra
tio
(syn
thes
is s
oln.
)
XPS
(A
tom
%)
N2
Phys
isor
ptio
n
C
1s
F 1s
Al
2p
Si
2p
S 3s
Mul
tipoi
nt
BE
T
surf
ace
area
(m
2 /g)
BJH
Des
. Po
re
Vol
ume
(cm
3 /g)
BJH
Des
. A
vg P
ore
Dia
met
er
(nm
)
NFM
AS1
0.
05
19.2
25
.3
0.0
55.5
0.
0 12
62
1.54
3.
05
NFM
AS2
0.
10
8.4
19.1
4.
3 68
.0
0.2
1385
1.
77
3.04
N
FMA
S3
0.20
24
.8
6.2
4.6
64.3
0.
1 10
89
1.38
2.
72
NFA
LFA
1 0.
05
- -
- -
- 39
1.6
0.72
5.
64
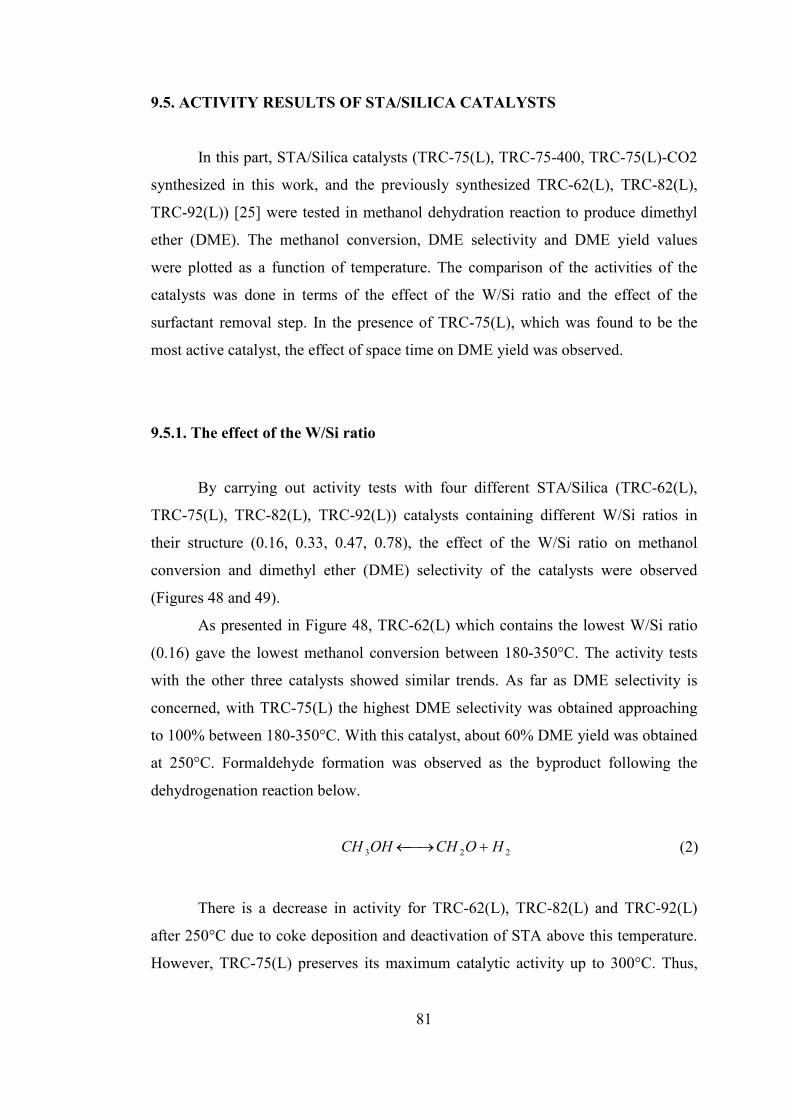
81
9.5. ACTIVITY RESULTS OF STA/SILICA CATALYSTS
In this part, STA/Silica catalysts (TRC-75(L), TRC-75-400, TRC-75(L)-CO2
synthesized in this work, and the previously synthesized TRC-62(L), TRC-82(L),
TRC-92(L)) [25] were tested in methanol dehydration reaction to produce dimethyl
ether (DME). The methanol conversion, DME selectivity and DME yield values
were plotted as a function of temperature. The comparison of the activities of the
catalysts was done in terms of the effect of the W/Si ratio and the effect of the
surfactant removal step. In the presence of TRC-75(L), which was found to be the
most active catalyst, the effect of space time on DME yield was observed.
9.5.1. The effect of the W/Si ratio
By carrying out activity tests with four different STA/Silica (TRC-62(L),
TRC-75(L), TRC-82(L), TRC-92(L)) catalysts containing different W/Si ratios in
their structure (0.16, 0.33, 0.47, 0.78), the effect of the W/Si ratio on methanol
conversion and dimethyl ether (DME) selectivity of the catalysts were observed
(Figures 48 and 49).
As presented in Figure 48, TRC-62(L) which contains the lowest W/Si ratio
(0.16) gave the lowest methanol conversion between 180-350°C. The activity tests
with the other three catalysts showed similar trends. As far as DME selectivity is
concerned, with TRC-75(L) the highest DME selectivity was obtained approaching
to 100% between 180-350°C. With this catalyst, about 60% DME yield was obtained
at 250°C. Formaldehyde formation was observed as the byproduct following the
dehydrogenation reaction below.
223 HOCHOHCH +→←
There is a decrease in activity for TRC-62(L), TRC-82(L) and TRC-92(L)
after 250°C due to coke deposition and deactivation of STA above this temperature.
However, TRC-75(L) preserves its maximum catalytic activity up to 300°C. Thus,
(2)
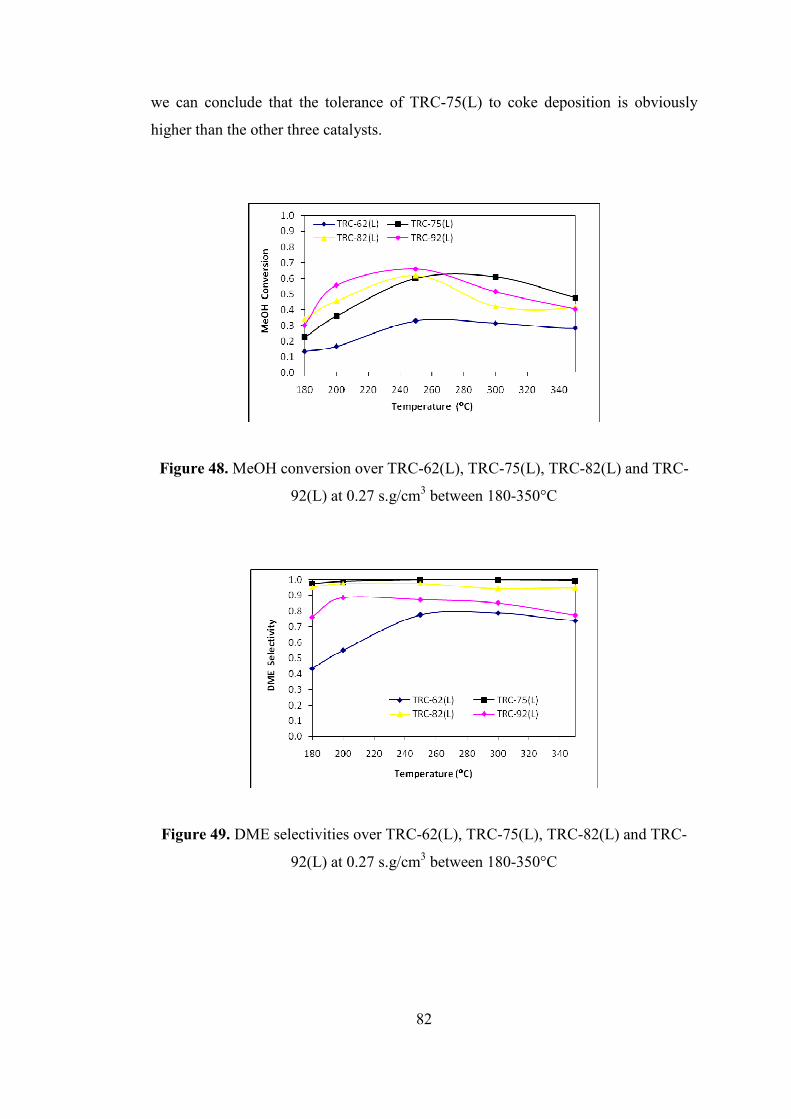
82
we can conclude that the tolerance of TRC-75(L) to coke deposition is obviously
higher than the other three catalysts.
Figure 48. MeOH conversion over TRC-62(L), TRC-75(L), TRC-82(L) and TRC-
92(L) at 0.27 s.g/cm3 between 180-350°C
Figure 49. DME selectivities over TRC-62(L), TRC-75(L), TRC-82(L) and TRC-
92(L) at 0.27 s.g/cm3 between 180-350°C

83
9.5.2. The effect of the surfactant removal step
The catalytic activity tests of TRC-75(L) which was calcined at 350°C, TRC-
75-400 which was calcined at 400°C and TRC-75(L)-CO2 to which supercritical
carbon dioxide extraction was applied as an alternative technique are compared in
Figure 50. Methanol conversion values seem to be very close for all three catalysts.
However, a slight decrease is observed for TRC-75-400, which indicates that by
calcining the catalyst at 400°C some decrease in activity was observed. This is due to
the fact that over 350°C, STA structure begins to decompose and protons of the
active STA phase are partly lost.
Figure 50. MeOH conversion over TRC-75(L), TRC-75(L)-CO2 and TRC-75-400
at 0.27 s.g/cm3 between 180-350°C
Supercritical CO2 seems to cause no loss in activity which means that the
structure of the catalyst was not destructed by applying this technique.
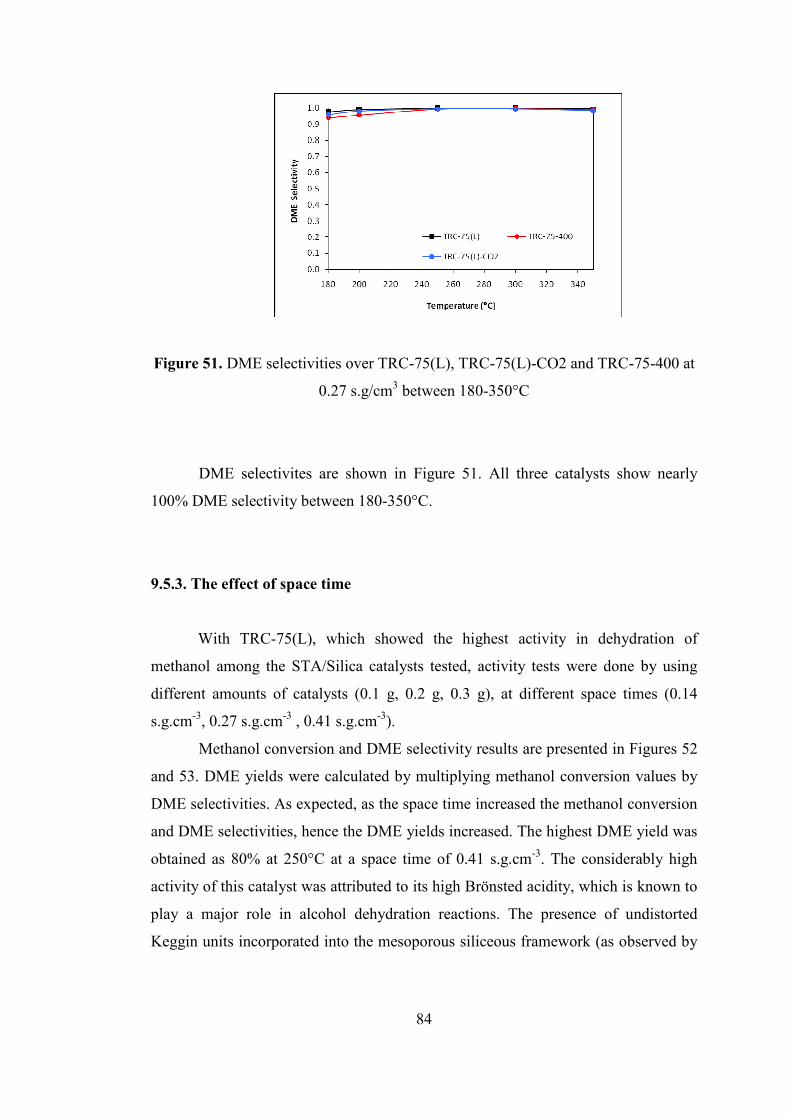
84
Figure 51. DME selectivities over TRC-75(L), TRC-75(L)-CO2 and TRC-75-400 at
0.27 s.g/cm3 between 180-350°C
DME selectivites are shown in Figure 51. All three catalysts show nearly
100% DME selectivity between 180-350°C.
9.5.3. The effect of space time
With TRC-75(L), which showed the highest activity in dehydration of
methanol among the STA/Silica catalysts tested, activity tests were done by using
different amounts of catalysts (0.1 g, 0.2 g, 0.3 g), at different space times (0.14
s.g.cm-3, 0.27 s.g.cm-3 , 0.41 s.g.cm-3).
Methanol conversion and DME selectivity results are presented in Figures 52
and 53. DME yields were calculated by multiplying methanol conversion values by
DME selectivities. As expected, as the space time increased the methanol conversion
and DME selectivities, hence the DME yields increased. The highest DME yield was
obtained as 80% at 250°C at a space time of 0.41 s.g.cm-3. The considerably high
activity of this catalyst was attributed to its high Brönsted acidity, which is known to
play a major role in alcohol dehydration reactions. The presence of undistorted
Keggin units incorporated into the mesoporous siliceous framework (as observed by

85
FTIR) is the main reason for the high Brönsted acidity and the enhanced catalytic
activity of this STA/Silica catalyst.
Figure 52. MeOH conversion over TRC-75(L) at different space times between 180-
350°C
Figure 53. DME selectivities over TRC-75(L) at different space times between 180-
350°C

86
The stability of the activity of TRC-75(L) in methanol dehydration reaction
was tested by carrying out two reaction experiments at 200°C and 250°C for 6 hours.
Some decrease in activity was observed due to coke formation. Carbon deposition on
the catalyst surface was proved by XPS analyses. After 6 hours of reaction, the C/Si
ratio at the surface of the catalyst increased from 1.2 to 1.5. Catalyst deactivation due
to coke formation was also observed in the work of Herrera et al. [40] on TPA
impregnated mesoporous silica catalysts used in methanol dehydration. However, in
this work TRC-75(L) was successfully regenerated. By re-calcining in dry air at
350°C the spent catalyst could easily be reactivated to its original activity. The
results of the stability tests and the catalytic activity obtained after regeneration are
given in Table 24. DME selectivity was found to be almost 100% between 180-
350°C at the space time of 0.27 s.g.cm-3 and no significant decrease was observed
during the stability tests.
Table 24. Results of the stability tests and regeneration experiments over TRC-75(L)
at 0.27 s.g.cm-3
Methanol conversion (%)
During the 1st hour at 250°C (Averaged over 3 data points)
60
At the end of 6 hours at 250°C 22 During the 1st hour at 200°C
(Averaged over 3 data points) 36
At the end of 6 hours at 200°C 13 During the 1st hour at 250°C
After regeneration 58
9.6. ACTIVITY RESULTS OF TPA/SILICA CATALYSTS
By synthesizing two types of HPA/Silica catalysts each containing W/Si
ratios of 0.40 but prepared by using two different HPA’s, namely STA and TPA, the
effect of the active heteropoly compound phase was tested on the catalytic activity of
the materials in DME synthesis by dehydration of methanol.
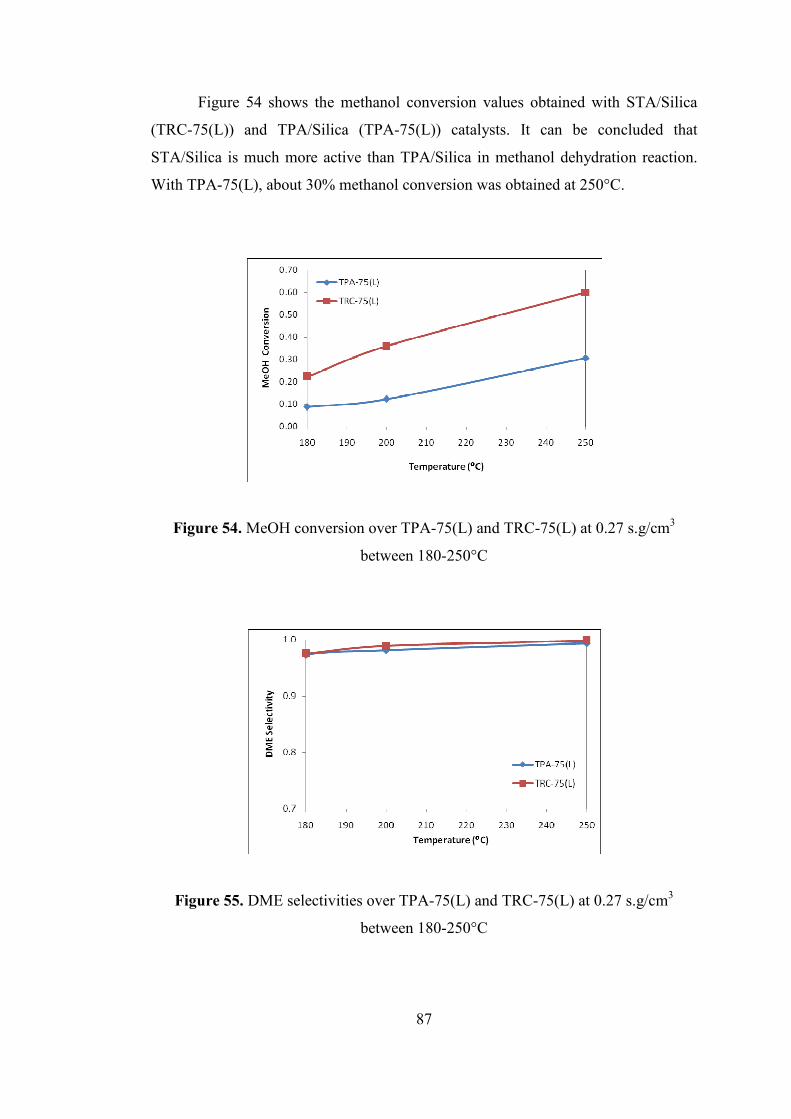
87
Figure 54 shows the methanol conversion values obtained with STA/Silica
(TRC-75(L)) and TPA/Silica (TPA-75(L)) catalysts. It can be concluded that
STA/Silica is much more active than TPA/Silica in methanol dehydration reaction.
With TPA-75(L), about 30% methanol conversion was obtained at 250°C.
Figure 54. MeOH conversion over TPA-75(L) and TRC-75(L) at 0.27 s.g/cm3
between 180-250°C
Figure 55. DME selectivities over TPA-75(L) and TRC-75(L) at 0.27 s.g/cm3
between 180-250°C
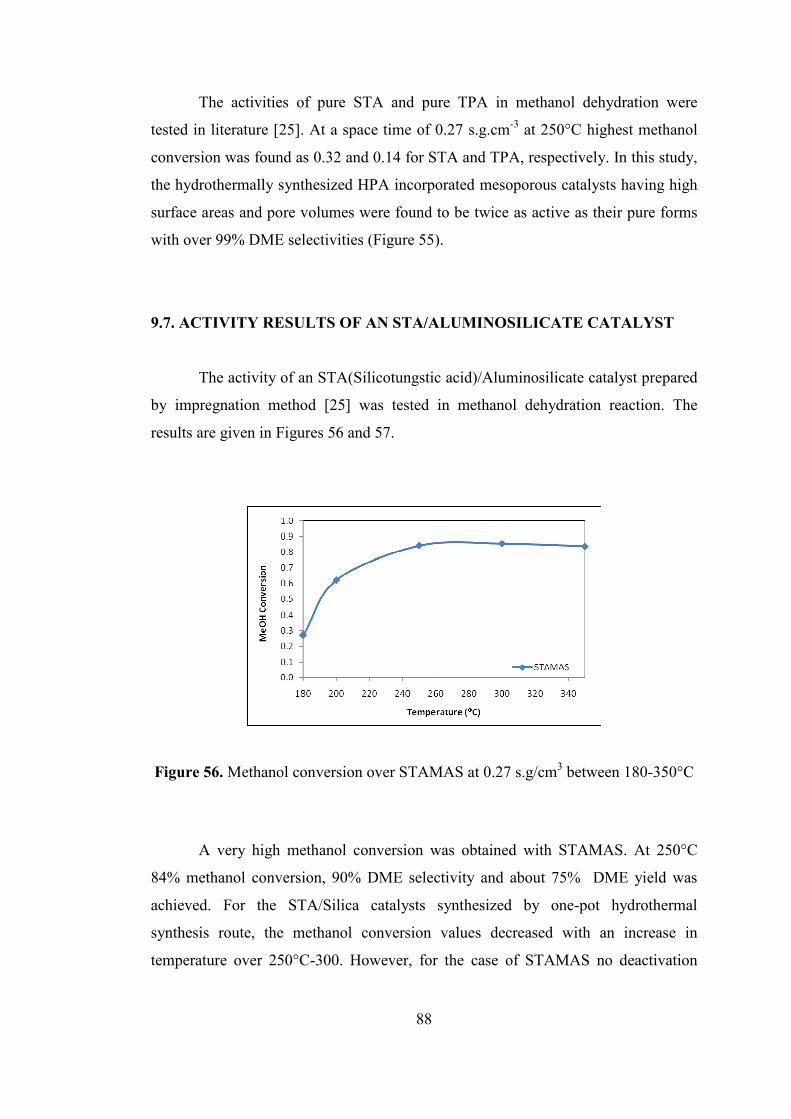
88
The activities of pure STA and pure TPA in methanol dehydration were
tested in literature [25]. At a space time of 0.27 s.g.cm-3 at 250°C highest methanol
conversion was found as 0.32 and 0.14 for STA and TPA, respectively. In this study,
the hydrothermally synthesized HPA incorporated mesoporous catalysts having high
surface areas and pore volumes were found to be twice as active as their pure forms
with over 99% DME selectivities (Figure 55).
9.7. ACTIVITY RESULTS OF AN STA/ALUMINOSILICATE CATALYST
The activity of an STA(Silicotungstic acid)/Aluminosilicate catalyst prepared
by impregnation method [25] was tested in methanol dehydration reaction. The
results are given in Figures 56 and 57.
Figure 56. Methanol conversion over STAMAS at 0.27 s.g/cm3 between 180-350°C
A very high methanol conversion was obtained with STAMAS. At 250°C
84% methanol conversion, 90% DME selectivity and about 75% DME yield was
achieved. For the STA/Silica catalysts synthesized by one-pot hydrothermal
synthesis route, the methanol conversion values decreased with an increase in
temperature over 250°C-300. However, for the case of STAMAS no deactivation
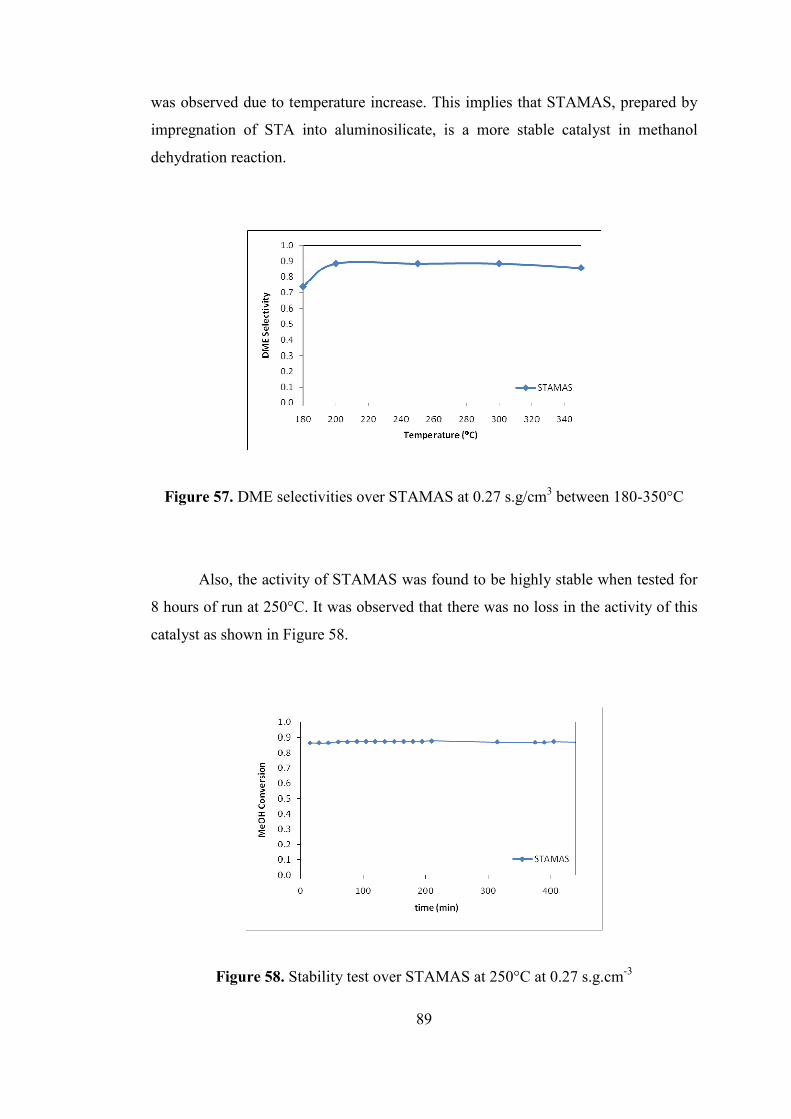
89
was observed due to temperature increase. This implies that STAMAS, prepared by
impregnation of STA into aluminosilicate, is a more stable catalyst in methanol
dehydration reaction.
Figure 57. DME selectivities over STAMAS at 0.27 s.g/cm3 between 180-350°C
Also, the activity of STAMAS was found to be highly stable when tested for
8 hours of run at 250°C. It was observed that there was no loss in the activity of this
catalyst as shown in Figure 58.
Figure 58. Stability test over STAMAS at 250°C at 0.27 s.g.cm-3

90
9.8. ACTIVITY RESULTS OF NAFION/SILICA CATALYSTS
In this part, activity results of the nafion/silica catalysts synthesized by
following a one-pot hydrothermal synthesis procedure is presented. The results of the
activity tests in methanol dehydration reaction are compared in terms of the
difference between calcination and washing with sulfuric acid-ethanol mixture as
surfactant removal techniques, different washing conditions (changes in the molarity
of the SAE solution used, temperature, time, etc.), nafion loading on the catalyst and
nafion source used during the synthesis of the materials.
9.8.1. The comparison of calcination and washing with SAE solution
By carrying out activity tests with NS1 catalysts which contain 5% nafion in
their structure, the effects of calcination and refluxing on the catalytic activity of the
materials was compared. As shown in Figures 59 and 60, NS1R which was refluxed
with 1M sulfuric acid solution of ethanol for 12 hours seems to be much more active
than the catalysts which were calcined at 250°C and 350°C with dry air. Also the
activity of the untreated NS1, which was only washed with deionized water after
hydrothermal synthesis, was tested. This catalyst as well showed very low methanol
conversion and DME selectivity when compared to NS1R.
In fact, the low DME selectivity values of NS1250, NS1350 and NS1
especially below 250°C showed that the trace amount of methanol conversion
obtained with these catalysts belonged to the formation of formaldehyde as a result
of methanol dehydrogenation. Methanol dehydration capacities of these catalysts
were very low when compared to NS1R.
The surface area of NS1 is limited (314 m2/g) due to the unremoved
surfactant template on its surface. The surface area of the calcined N1350 was found
to be 659 m2/g, which is comparable to the surface area of NS1R (792 m2/g).
However, the active sulfonic acid groups of the nafion resin decompose over 280°C.
[50] Thus, the catalytic activity of NS1350 was significantly inhibited by exposure to
high temperature during calcination. As a result, refluxing in SAE solution proved to
be the best treatment in terms of catalytic activity and NS1R, which has the highest

91
surface area and active sulfonic acid groups in its structure, showed the highest
methanol conversion and DME selectivity among these catalysts.
Figure 59. MeOH conversion over NS1R, NS1250, NS1350 and NS1 at 0.27 s.g/cm3
between 120-300°C
Figure 60. DME selectivities over NS1R, NS1250, NS1350 and NS1 at 0.27 s.g/cm3
between 120-300°C
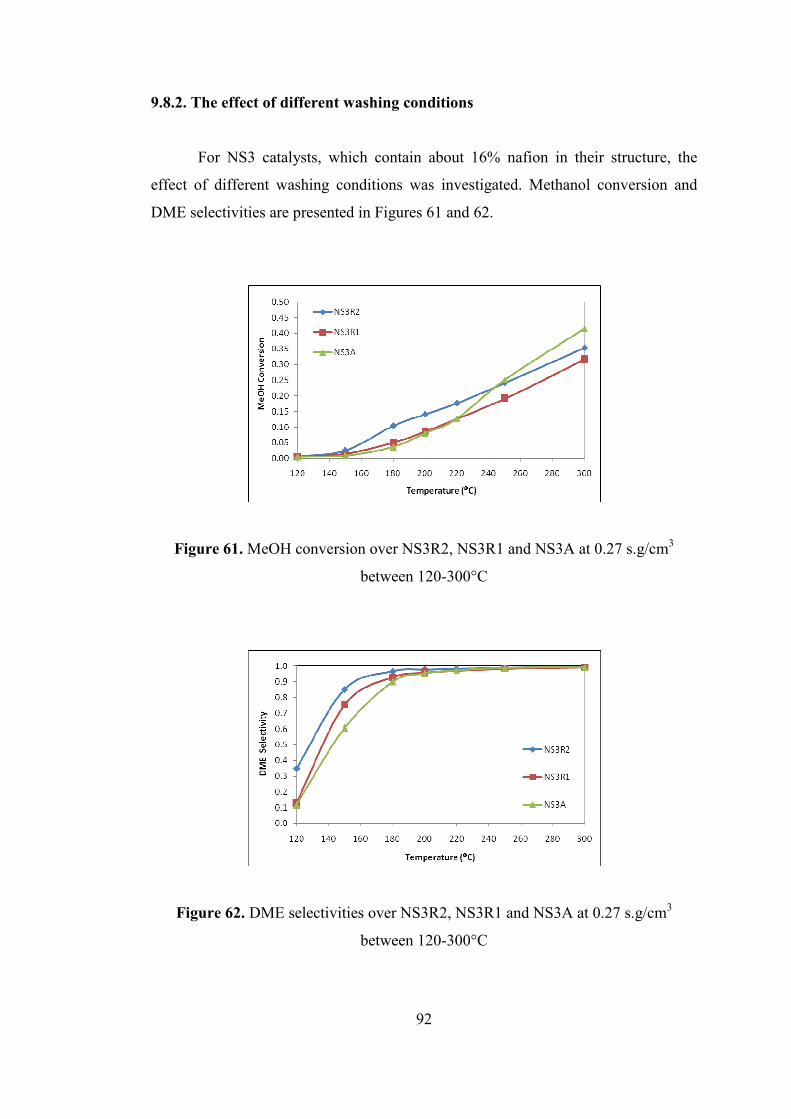
92
9.8.2. The effect of different washing conditions
For NS3 catalysts, which contain about 16% nafion in their structure, the
effect of different washing conditions was investigated. Methanol conversion and
DME selectivities are presented in Figures 61 and 62.
Figure 61. MeOH conversion over NS3R2, NS3R1 and NS3A at 0.27 s.g/cm3
between 120-300°C
Figure 62. DME selectivities over NS3R2, NS3R1 and NS3A at 0.27 s.g/cm3
between 120-300°C
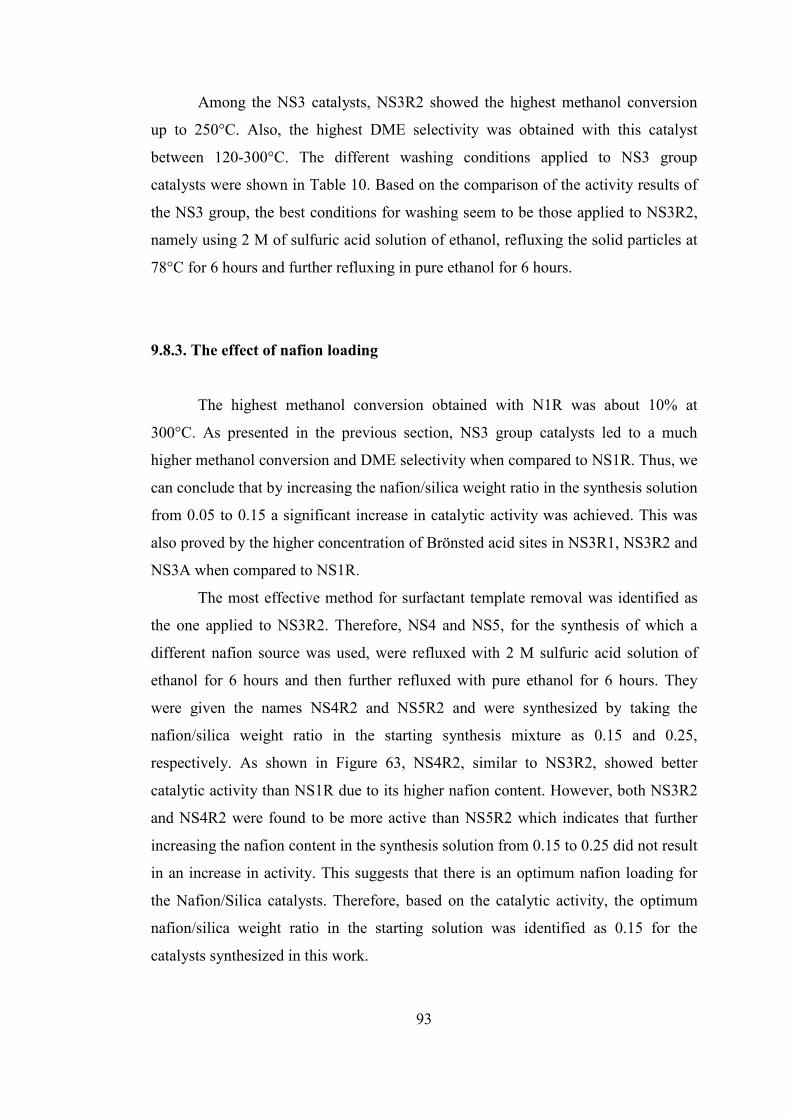
93
Among the NS3 catalysts, NS3R2 showed the highest methanol conversion
up to 250°C. Also, the highest DME selectivity was obtained with this catalyst
between 120-300°C. The different washing conditions applied to NS3 group
catalysts were shown in Table 10. Based on the comparison of the activity results of
the NS3 group, the best conditions for washing seem to be those applied to NS3R2,
namely using 2 M of sulfuric acid solution of ethanol, refluxing the solid particles at
78°C for 6 hours and further refluxing in pure ethanol for 6 hours.
9.8.3. The effect of nafion loading
The highest methanol conversion obtained with N1R was about 10% at
300°C. As presented in the previous section, NS3 group catalysts led to a much
higher methanol conversion and DME selectivity when compared to NS1R. Thus, we
can conclude that by increasing the nafion/silica weight ratio in the synthesis solution
from 0.05 to 0.15 a significant increase in catalytic activity was achieved. This was
also proved by the higher concentration of Brönsted acid sites in NS3R1, NS3R2 and
NS3A when compared to NS1R.
The most effective method for surfactant template removal was identified as
the one applied to NS3R2. Therefore, NS4 and NS5, for the synthesis of which a
different nafion source was used, were refluxed with 2 M sulfuric acid solution of
ethanol for 6 hours and then further refluxed with pure ethanol for 6 hours. They
were given the names NS4R2 and NS5R2 and were synthesized by taking the
nafion/silica weight ratio in the starting synthesis mixture as 0.15 and 0.25,
respectively. As shown in Figure 63, NS4R2, similar to NS3R2, showed better
catalytic activity than NS1R due to its higher nafion content. However, both NS3R2
and NS4R2 were found to be more active than NS5R2 which indicates that further
increasing the nafion content in the synthesis solution from 0.15 to 0.25 did not result
in an increase in activity. This suggests that there is an optimum nafion loading for
the Nafion/Silica catalysts. Therefore, based on the catalytic activity, the optimum
nafion/silica weight ratio in the starting solution was identified as 0.15 for the
catalysts synthesized in this work.
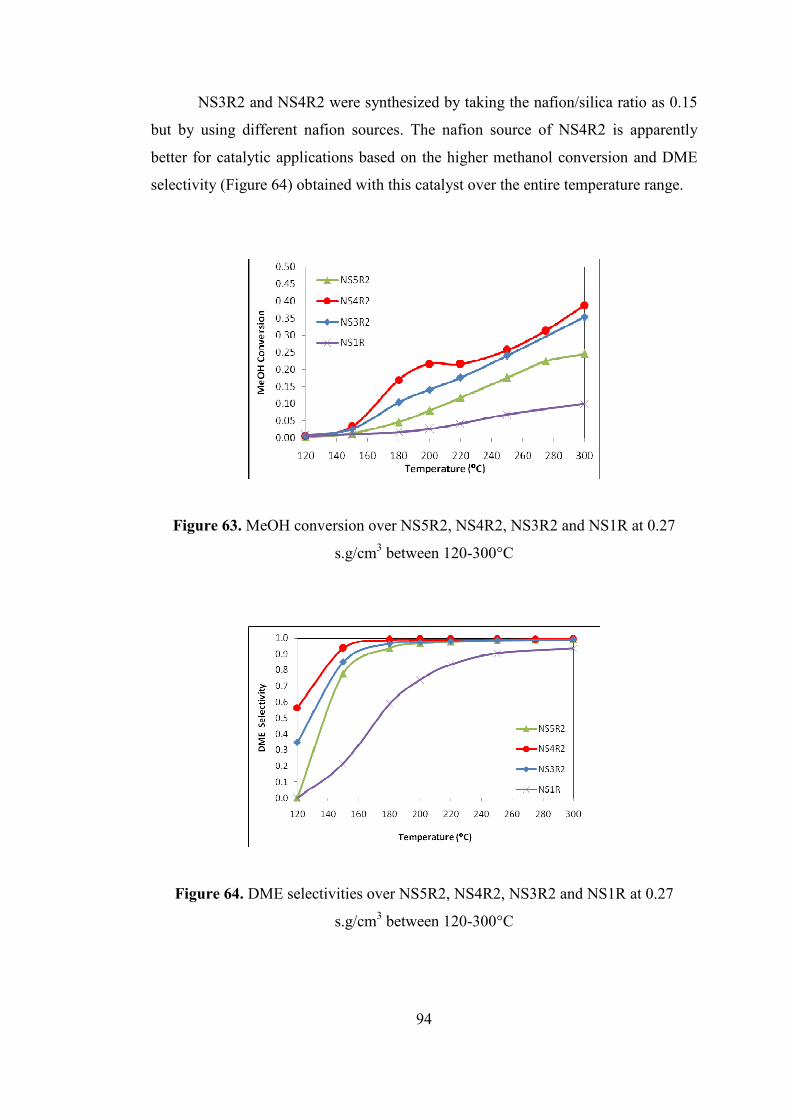
94
NS3R2 and NS4R2 were synthesized by taking the nafion/silica ratio as 0.15
but by using different nafion sources. The nafion source of NS4R2 is apparently
better for catalytic applications based on the higher methanol conversion and DME
selectivity (Figure 64) obtained with this catalyst over the entire temperature range.
Figure 63. MeOH conversion over NS5R2, NS4R2, NS3R2 and NS1R at 0.27
s.g/cm3 between 120-300°C
Figure 64. DME selectivities over NS5R2, NS4R2, NS3R2 and NS1R at 0.27
s.g/cm3 between 120-300°C
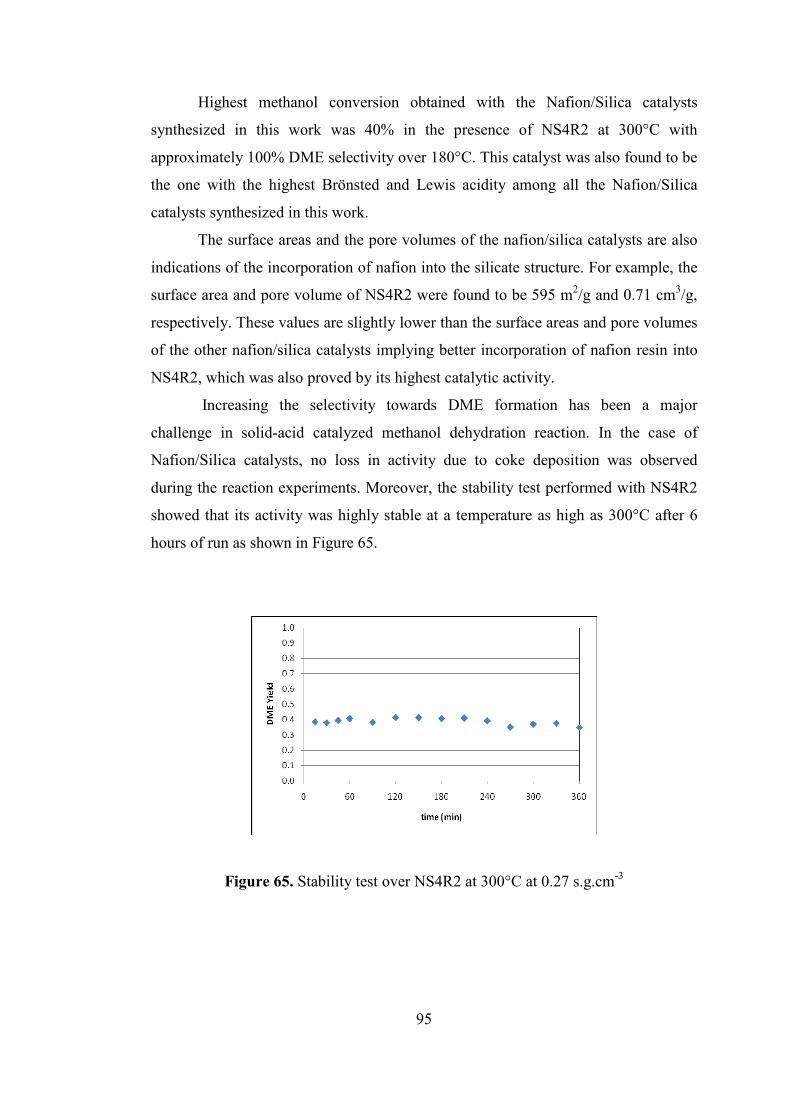
95
Highest methanol conversion obtained with the Nafion/Silica catalysts
synthesized in this work was 40% in the presence of NS4R2 at 300°C with
approximately 100% DME selectivity over 180°C. This catalyst was also found to be
the one with the highest Brönsted and Lewis acidity among all the Nafion/Silica
catalysts synthesized in this work.
The surface areas and the pore volumes of the nafion/silica catalysts are also
indications of the incorporation of nafion into the silicate structure. For example, the
surface area and pore volume of NS4R2 were found to be 595 m2/g and 0.71 cm3/g,
respectively. These values are slightly lower than the surface areas and pore volumes
of the other nafion/silica catalysts implying better incorporation of nafion resin into
NS4R2, which was also proved by its highest catalytic activity.
Increasing the selectivity towards DME formation has been a major
challenge in solid-acid catalyzed methanol dehydration reaction. In the case of
Nafion/Silica catalysts, no loss in activity due to coke deposition was observed
during the reaction experiments. Moreover, the stability test performed with NS4R2
showed that its activity was highly stable at a temperature as high as 300°C after 6
hours of run as shown in Figure 65.
Figure 65. Stability test over NS4R2 at 300°C at 0.27 s.g.cm-3
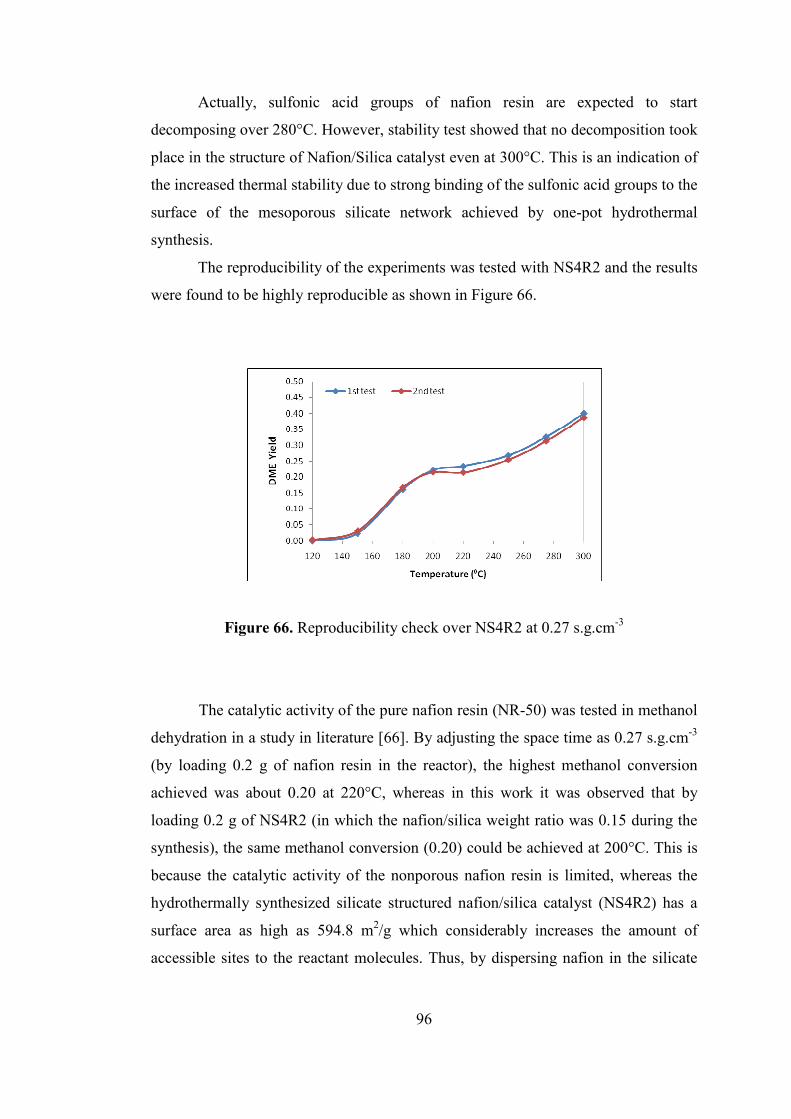
96
Actually, sulfonic acid groups of nafion resin are expected to start
decomposing over 280°C. However, stability test showed that no decomposition took
place in the structure of Nafion/Silica catalyst even at 300°C. This is an indication of
the increased thermal stability due to strong binding of the sulfonic acid groups to the
surface of the mesoporous silicate network achieved by one-pot hydrothermal
synthesis.
The reproducibility of the experiments was tested with NS4R2 and the results
were found to be highly reproducible as shown in Figure 66.
Figure 66. Reproducibility check over NS4R2 at 0.27 s.g.cm-3
The catalytic activity of the pure nafion resin (NR-50) was tested in methanol
dehydration in a study in literature [66]. By adjusting the space time as 0.27 s.g.cm-3
(by loading 0.2 g of nafion resin in the reactor), the highest methanol conversion
achieved was about 0.20 at 220°C, whereas in this work it was observed that by
loading 0.2 g of NS4R2 (in which the nafion/silica weight ratio was 0.15 during the
synthesis), the same methanol conversion (0.20) could be achieved at 200°C. This is
because the catalytic activity of the nonporous nafion resin is limited, whereas the
hydrothermally synthesized silicate structured nafion/silica catalyst (NS4R2) has a
surface area as high as 594.8 m2/g which considerably increases the amount of
accessible sites to the reactant molecules. Thus, by dispersing nafion in the silicate
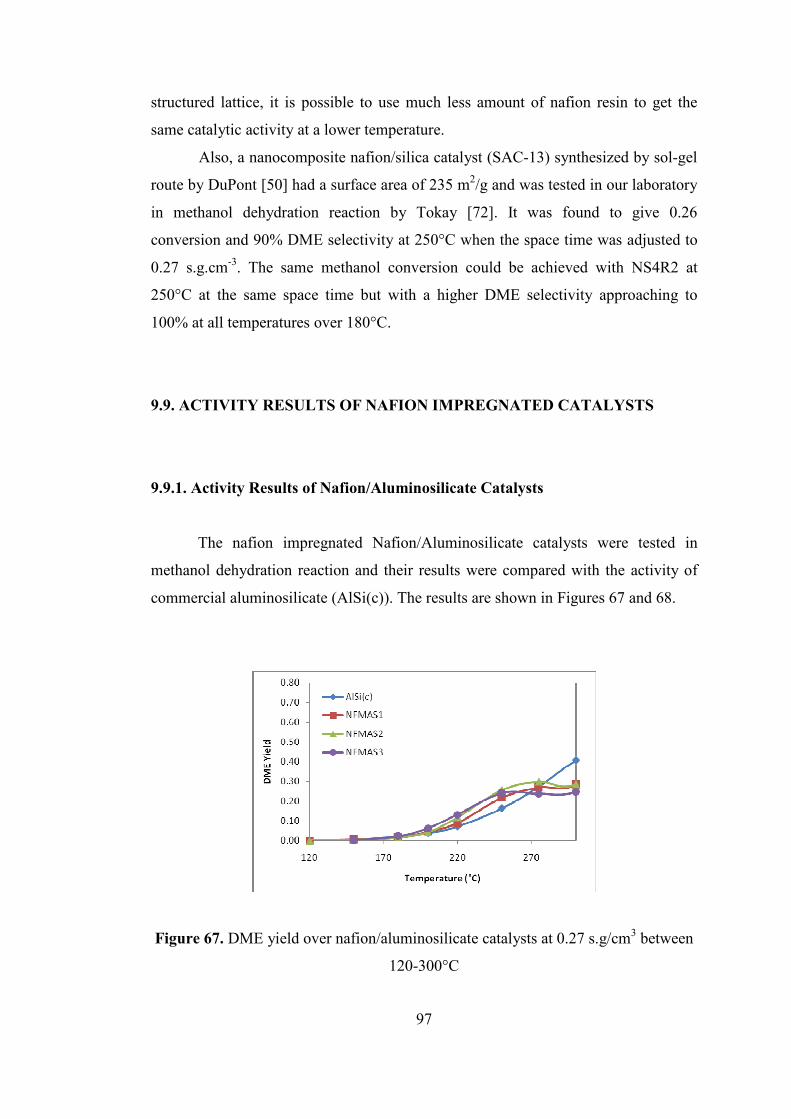
97
structured lattice, it is possible to use much less amount of nafion resin to get the
same catalytic activity at a lower temperature.
Also, a nanocomposite nafion/silica catalyst (SAC-13) synthesized by sol-gel
route by DuPont [50] had a surface area of 235 m2/g and was tested in our laboratory
in methanol dehydration reaction by Tokay [72]. It was found to give 0.26
conversion and 90% DME selectivity at 250°C when the space time was adjusted to
0.27 s.g.cm-3. The same methanol conversion could be achieved with NS4R2 at
250°C at the same space time but with a higher DME selectivity approaching to
100% at all temperatures over 180°C.
9.9. ACTIVITY RESULTS OF NAFION IMPREGNATED CATALYSTS
9.9.1. Activity Results of Nafion/Aluminosilicate Catalysts
The nafion impregnated Nafion/Aluminosilicate catalysts were tested in
methanol dehydration reaction and their results were compared with the activity of
commercial aluminosilicate (AlSi(c)). The results are shown in Figures 67 and 68.
Figure 67. DME yield over nafion/aluminosilicate catalysts at 0.27 s.g/cm3 between
120-300°C
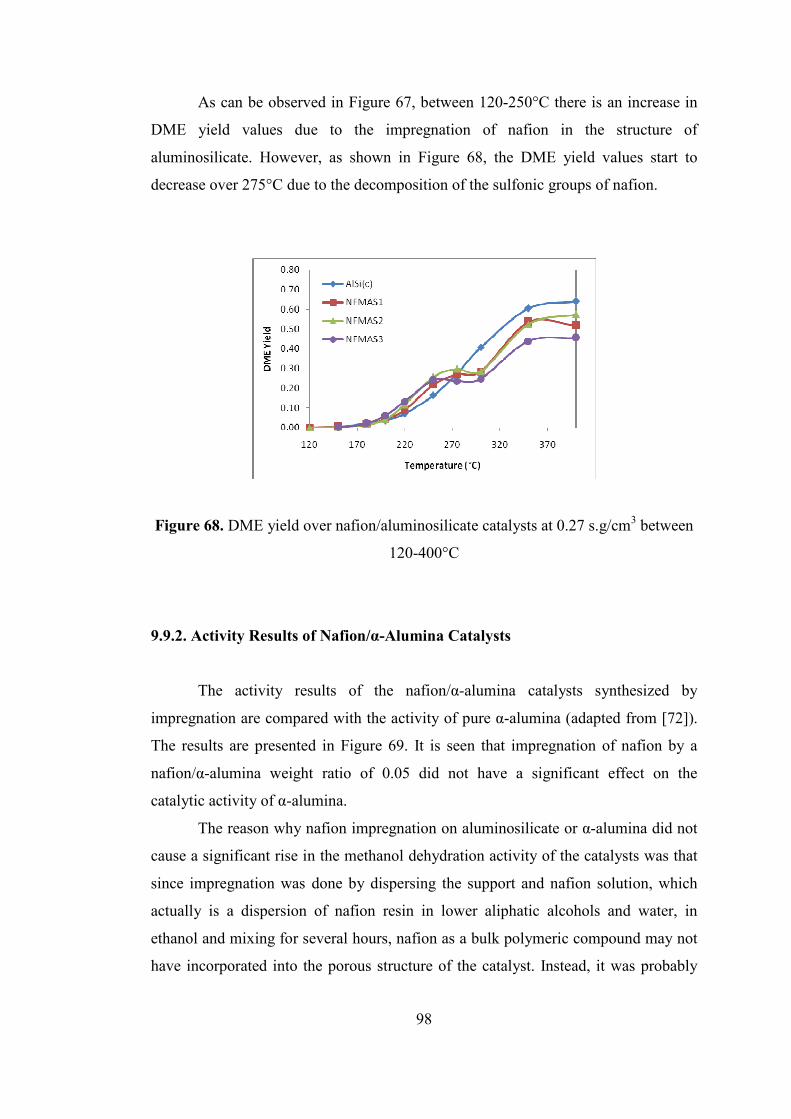
98
As can be observed in Figure 67, between 120-250°C there is an increase in
DME yield values due to the impregnation of nafion in the structure of
aluminosilicate. However, as shown in Figure 68, the DME yield values start to
decrease over 275°C due to the decomposition of the sulfonic groups of nafion.
Figure 68. DME yield over nafion/aluminosilicate catalysts at 0.27 s.g/cm3 between
120-400°C
9.9.2. Activity Results of Nafion/α-Alumina Catalysts
The activity results of the nafion/α-alumina catalysts synthesized by
impregnation are compared with the activity of pure α-alumina (adapted from [72]).
The results are presented in Figure 69. It is seen that impregnation of nafion by a
nafion/α-alumina weight ratio of 0.05 did not have a significant effect on the
catalytic activity of α-alumina.
The reason why nafion impregnation on aluminosilicate or α-alumina did not
cause a significant rise in the methanol dehydration activity of the catalysts was that
since impregnation was done by dispersing the support and nafion solution, which
actually is a dispersion of nafion resin in lower aliphatic alcohols and water, in
ethanol and mixing for several hours, nafion as a bulk polymeric compound may not
have incorporated into the porous structure of the catalyst. Instead, it was probably

99
located at the surface as chunks because as discussed before, no significant decrease
in surface areas of nafion impregnated aluminosilicate or α-alumina catalysts was
observed due to nafion loading. Consequently, one-pot hydrothermal synthesis
proved to be a better technique for incorporation of nafion resin into mesoporous
silicates.
Figure 69. DME yield over nafion/α-alumina and pure α-alumina at 0.27 s.g/cm3
between 180-400°C
9.10. IN-SITU INFRARED STUDIES : METHANOL AND DME
ADSORPTION AND DESORPTION ON THE CATALYSTS SYNTHESIZED
Adsorption and desorption of methanol and dimethyl ether on the
mesoporous catalysts synthesized in this work were studied by in situ FT-IR. The
experiments were done in the Laboratory of Heterogeneous Catalysis of Eindhoven
University of Technology by using a Bruker IFS 113v instrument. The spectra were
recorded at a 2 cm-1 resolution and averaged over 30 scans. Prior to each experiment,
the following steps were applied.
First the sample was prepared as a thin self-supporting wafer of about 10
mg/cm2. Then the wafer was placed inside a controlled environment infrared
transmission cell and out-gassed until the residual pressure was below 5x10⁻⁵ mbar.

100
The sample was dried at appropriate conditions before being exposed to methanol or
DME and a spectrum was recorded at room temperature (30°C) as the reference
spectrum. Then the wafer was exposed to 5 mbar of methanol or DME for 15
minutes. Afterwards the chamber was evacuated to get rid of the unadsorbed gas and
a spectrum was recorded at room temperature (RT). Desorption was carried out by
evacuation at the desired temperatures (100°C-500°C) for 30 minutes and spectra
were recorded at room temperature after desorption at each temperature. The spectra
presented in this section are subtracted from the reference spectra of the clean dried
wafers recorded at room temperature.
9.10.1. Methanol Adsorption on Nafion/Silica Catalysts
Hydrated nafion resin contains dissociated and strongly hydrated sulfonic
acid groups, which upon drying transform into undissociated sulfonic groups,
associated by hydrogen bonds [73]. The hdyrated form of Nafion is shown in Figure
70.
Figure 70. Hydrate structres in Nafion membrane swollen with water [73]
101
Two of the nafion/silica catalysts synthesized by one-pot hydrothermal
synthesis route, namely NS4R2 and NS3R1, were tested in in-situ methanol
adsorption and desorption experiments. Dehydration was carried out at 150°C for 60
minutes. The FT-IR spectra of the samples after dehydration are given in Figure 87
in Appendix E. The dried samples, NS4R2 and NS3R1, gave absorption bands at
1401 cm-1 and 1399 cm-1, respectively. These bands are due to the ν(S=O) stretching
vibrations of undissociated sulfonic acid groups(-SO3H) present in the structure of
nafion [73]. As a result of drying, the network of hydrate structures are broken and
the association of sulfonic groups is observed by the emergence of the peaks around
1400 cm-1. The FT-IR spectra of the commercial nafion-silica nanocomposite (SAC-
13) was also recorded and the ν(S=O) stretching vibration for this catalyst was
observed at 1414 cm-1. The bands around 3740 cm-1 for the hydrothermally
synthesized Nafion/Silica catalysts are due to the lone silanol groups (SiO-H stretch)
on the surface of the silica network [74].
In Figure 71, the spectra of methanol adsorbed on NS4R2 are shown. The
bands observed in the C-H stretching region, 2854 cm-1, 2928 cm-1, 2955 cm-1 and
2994 cm-1 suggest the dissociative adsorption of methanol and the formation of
methoxy functional groups (CH3-O) on the surface of the catalyst. These bands
belong to asymmetric and symmetric C-H stretching bands of CH3-O groups [74].
The bands 2854 cm-1, 2955 cm-1 and 2994 cm-1 are in agreement with the previous
studies in literature where they were assigned to methoxide on silica (CH3O-Si) [75].
In the study of Fisher and Bell [75], the peak at 2926 cm-1 was attributed to
methoxide on Cu for the Cu/SiO2 catalyst and the peak at 2933 cm-1 was said to be
due to methoxide on Zr for the Cu/ZrO2/SiO2 catalyst. Thus, the additional band at
2928 cm-1 in the C-H stretching region may be due to the methanol adsorbed on the
active nafion sites on the catalyst.
The broad band (between 3000-3400 cm-1) is due to the O-H stretch of
hydrogen-bonded network of adsorbed methanol molecules [74]. The OH groups of
alcohols form hydrogen bridges with the –SO3H groups of the catalyst and also
among themselves. Alcohols enter between the hydrogen bonded network of –SO3H
groups and cause swelling [76]. A large fraction of the acid sites are expected to be
covered by these physically adsorbed methanol molecules. By desorption with
increasing temperature, the intensity of this broad band decreases due to methanol
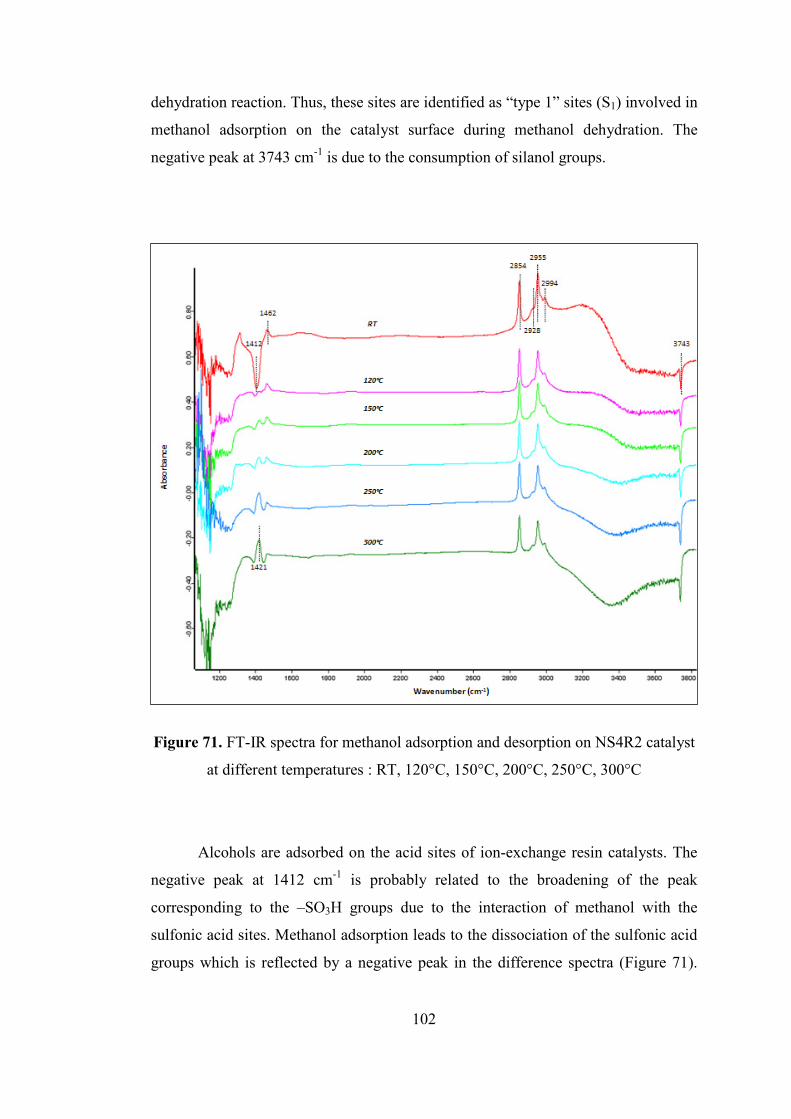
102
dehydration reaction. Thus, these sites are identified as “type 1” sites (S1) involved in
methanol adsorption on the catalyst surface during methanol dehydration. The
negative peak at 3743 cm-1 is due to the consumption of silanol groups.
Figure 71. FT-IR spectra for methanol adsorption and desorption on NS4R2 catalyst
at different temperatures : RT, 120°C, 150°C, 200°C, 250°C, 300°C
Alcohols are adsorbed on the acid sites of ion-exchange resin catalysts. The
negative peak at 1412 cm-1 is probably related to the broadening of the peak
corresponding to the –SO3H groups due to the interaction of methanol with the
sulfonic acid sites. Methanol adsorption leads to the dissociation of the sulfonic acid
groups which is reflected by a negative peak in the difference spectra (Figure 71).
103
This is due to the disappearance of the S=O bonds, hence the disappearance of the
undissociated groups upon methanol adsorption [77]. As temperature increases, by
desorption of methanol the peak corresponding to the sulfonic acid groups reemerge
but a shift to the right is observed. This suggests an increase in the S=O bond
strength due to the interaction of methanol with the proton of the sulfonic group. As
temperature increases the SO−H bond in interaction with methanol weakens and
consequently an increase in the S=O bond strength is expected. Also, a second peak
at 1462 cm-1 is identified at all temperatures, which is thought to be due to the
formation of methoxy species for DME synthesis related to methanol adsorbed on
sulfonic acid sites. It is also in agreement with literature since the CH3 umbrella
mode for the methoxy groups are expected to be observed between 1440-1470 cm-1
[74]. At higher temperatures this peak decreases in intensity due to DME release.
This idea was supported by DME adsorption on the same catayst, results of which
will be presented in the next sections. These suggest that methanol is probably
adsorbed in methoxy form on the sulfonic acid sites by dissociation of one hydrogen
atom. These sites are identified as “type 2” sites (S2).
Similar peaks were observed for methanol adsorption and desorption on
NS3R1 as shown in Figure 72. Same conclusions can be drawn for this catalyst also.
The negative peak appearing at 1405 cm-1, which is thought to be due to the
dissociation of sulfonic acid groups with methanol adsorption, is relatively small in
intensity when compared with the intensity of the negative peak appearing at 1412
cm-1 for NS4R2. This is because the strength of the sulfonic acid groups in NS3R1 is
lower due to the differences in the synthesis procedure which were discussed before.
Also, the methanol dehydration activity of NS4R2 was found to be higher than that
of NS3R1.

104
Figure 72. FT-IR spectra for methanol adsorption and desorption on NS3R1 catalyst
at different temperatures : RT, 120°C, 150°C, 200°C, 250°C, 300°C, 350°C, 400°C,
500°C
Based on the results of the in situ FT-IR analyses of methanol adsorption and
desorption on Nafion/Silica catalysts, we may suggest that DME is formed by the
reaction of methoxy species adsorbed on the catalyst surface and the physisorbed
methanol in molecular form. A possible reaction mechanism for methanol
dehydration reaction to produce DME is proposed in Figure 73.

105
CH3OH + S1 CH3OH―S1 (Type 1 Sites)
CH3―OH + S2―O―H CH3―O―S2 + H2O (Type 2 Sites) methoxy
Figure 73. Proposed reaction mechanism for methanol dehydration
9.10.2. Methanol Adsorption on Nafion/Aluminosilicate Catalyst
A nafion impregnated aluminosilicate catalyst (NFMAS3) synthesized by a
nafion/aluminosilicate ratio of 0.20 was tested in in situ methanol adsorption. After
drying, a peak at 1374 cm-1 appeared (Figure 87 in Appendix E), which was
attributed to the undissociated sulfonic acid groups on the dehydrated nafion resin
impregnated into the mesoporous aluminosilicate. The spectra of methanol
adsorption and desorption with respect to temperature is shown in Figure 74.
Between 3000-3400 cm-1 OH stretch of hydrogen-bonded network of physically
adsorbed methanol molecules are observed. The peaks at 2853, 2957 and 2997 cm-1
are again assigned to CH3O-Si groups. The peak at 2923 cm-1 may due to the
methanol adsorbed on the active sites of the catalyst. The negative peak at 1376 cm-1
signify dissociation of sulfonic groups upon methanol adsorption and the appearance
of the peaks at 1466 cm-1 is related to the methoxy functional groups formed on the
surface, which later take place in DME formation with an increase in temperature.

106
Figure 74. FT-IR spectra for methanol adsorption and desorption on NFMAS3
catalyst at different temperatures : RT, 120°C, 150°C, 200°C, 250°C, 300°C, 350°C,
400°C
9.10.3. Methanol Adsorption on STA/Silica Catalyst
Prior to methanol exposure, the STA/Silica catalyst, TRC-75-400, was dried
at 300°C for 30 minutes. The resulting spectrum is shown in Figure 88 in Appendix
E. Figure 75 shows the methanol adsorption and desorption spectra of TRC-75-400
at different temperatures.
Similar to nafion incorporated catalysts, the FT-IR spectrum of methanol
adsorption on TRC-75-400 shows a broad band (between 3000-3400 cm-1), which is
due to the OH stretch of hydrogen-bonded network of adsorbed methanol molecules.

107
The intensity of this broad band decreases with temperature. The sites covered by
these physically adsorbed methanol molecules are identified as “type 1” sites (S1).
Here, in addition to the peaks at 2855, 2956 and 2995 cm-1 which are due to
the methoxide adsorbed on silica, two distinct peaks were observed at 2833 and 2932
cm-1. Based on the study of Fisher and Bell [75], where the additional peaks in the C-
H stretching region at 2830 and 2933 cm-1 were assigned to CH3O-Zr for methanol
adsorption on a Cu/ZrO2/SiO2 catalyst, these peaks in the FT-IR spectra of TRC-75-
400 are thought to be due to the methoxy species formed on the tungsten/tungsten
oxide sites related to the silicotungstic acid units. A similar observation was also
reported in the study of Kumar et al. [78], where additional peaks (at 2837 cm-1 and
2929 cm-1) observed in the C-H stretching region upon methanol adsorption on
U3O8/MCM-48 samples were assigned to methoxy groups bonded to uranium sites
(U-OCH3). The intensities of these peaks (2833 and 2932 cm-1) in Figure 75 are
nearly half the intensities of the peaks belonging to methoxide on silica (2855 and
2956 cm-1). This supports our suggestion since the atomic ratio of W/Si was adjusted
as 0.40 in the synthesis of the STA/Silica catalysts. As temperature increased, a
continuous decrease was observed in the intensities of the methoxy bands at 2833
and 2932 cm-1, which is probably due to the involvement of these sites in methanol
dehydration reaction. Thus, these sites were identified as “type 2” sites (S2).
Peaks at 1437 and 1454 cm-1, related to the CH3 umbrella mode of methoxy
species, were observed with a decreasing intensity as temperature rises. Over 250°C,
where the maximum activity was observed with the STA/Silica catalysts, these peaks
almost disappear due to the increasing rate of methanol dehydration reaction to form
and release DME. A reaction mechanism similar to that of Nafion/Silica catalysts is
possible for methanol dehydration on STA/Silica catalysts.
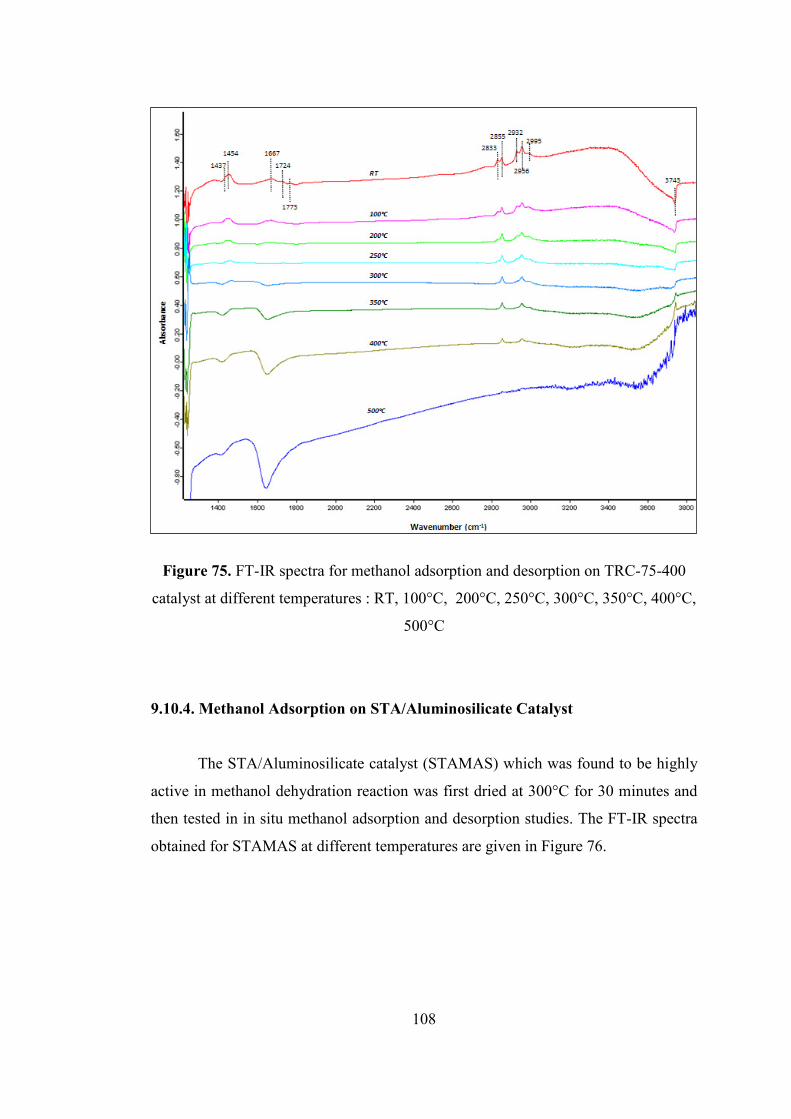
108
Figure 75. FT-IR spectra for methanol adsorption and desorption on TRC-75-400
catalyst at different temperatures : RT, 100°C, 200°C, 250°C, 300°C, 350°C, 400°C,
500°C
9.10.4. Methanol Adsorption on STA/Aluminosilicate Catalyst
The STA/Aluminosilicate catalyst (STAMAS) which was found to be highly
active in methanol dehydration reaction was first dried at 300°C for 30 minutes and
then tested in in situ methanol adsorption and desorption studies. The FT-IR spectra
obtained for STAMAS at different temperatures are given in Figure 76.

109
Figure 76. FT-IR spectra for methanol adsorption and desorption on STAMAS
catalyst at different temperatures : RT, 100°C, 200°C, 250°C, 300°C, 350°C, 500°C
The spectra are quite similar to those obtained for NFMAS3. Except that, the
negative peak belonging to the methanol adsorbed on the sulfonic groups are absent
for the case of STAMAS. The broad band between 3000-3400 cm-1 is due to the OH
stretch of hydrogen-bonded network of adsorbed methanol molecules and the
intensity of this broad band again decreases with temperature. The broad bands at
2569 and 2800 cm-1 are identical to the bands at 2572 and 2800 cm-1 observed for
NFMAS3 (Figure 74). They are thought to be due to the aluminosilicate support. The
peak at 1462 cm-1 is much higher in intensity for STAMAS which may be explained
by the much higher activity of STAMAS when compared to NFMAS3 and it again
supports our idea that this band is related to the methoxy species involved in
methanol dehydration reaction to form DME. Similar to the previous catalysts, the
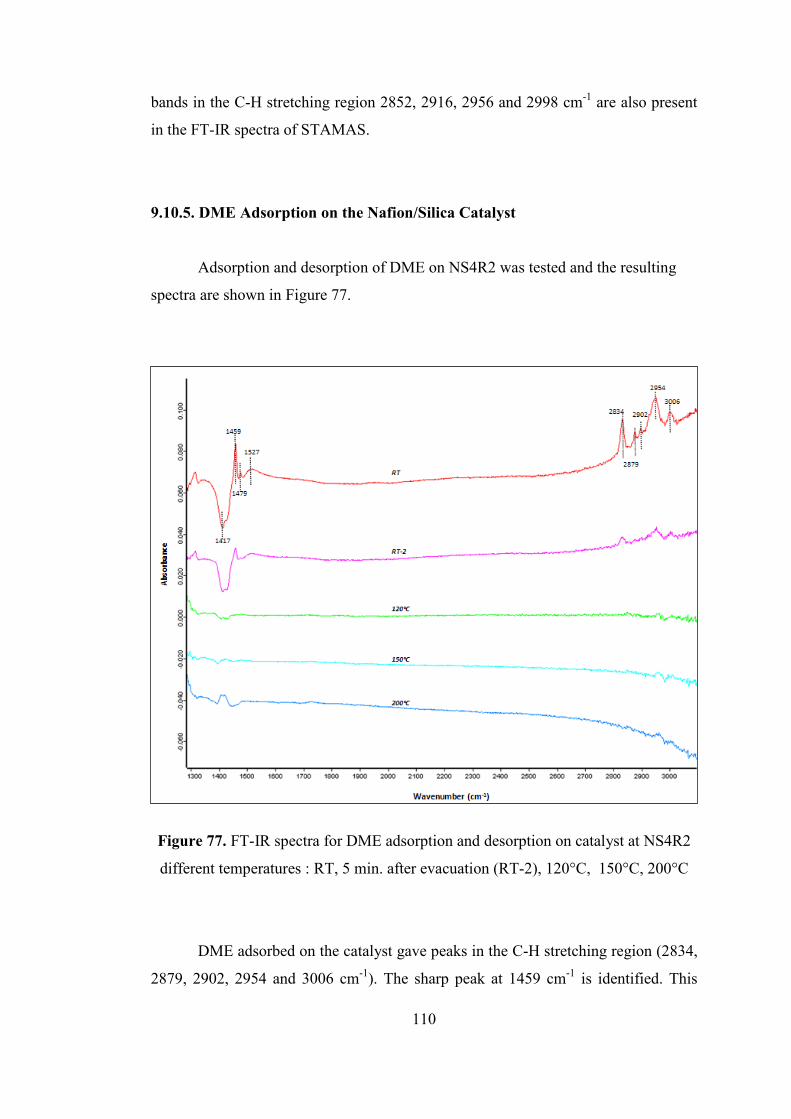
110
bands in the C-H stretching region 2852, 2916, 2956 and 2998 cm-1 are also present
in the FT-IR spectra of STAMAS.
9.10.5. DME Adsorption on the Nafion/Silica Catalyst
Adsorption and desorption of DME on NS4R2 was tested and the resulting
spectra are shown in Figure 77.
Figure 77. FT-IR spectra for DME adsorption and desorption on catalyst at NS4R2
different temperatures : RT, 5 min. after evacuation (RT-2), 120°C, 150°C, 200°C
DME adsorbed on the catalyst gave peaks in the C-H stretching region (2834,
2879, 2902, 2954 and 3006 cm-1). The sharp peak at 1459 cm-1 is identified. This
111
proves our previous conclusions derived from the methanol adsorption spectra that
this peak is related to the formation of methoxy functional groups for DME
synthesis. In the study of Tanaka [79] also, a band near 1460 cm-1 was assigned to
the methyl deformation vibration in O-CH3 group referring to the wavenumber of
that found in dimethyl ether (1466 cm-1). An additional small peak at 1479 cm-1 and
a broad peak at 1527 cm-1 was also observed in this region. It was observed that
DME was quickly desorbed from the catalyst even at room temperature 5 minutes
after evacuation (spectrum RT-2). When temperature was increased to 120°C or
higher, the peaks in the C-H stretching region and the sharp peak at 1459 cm-1
completely disappeared. This shows that our product, dimethyl ether, is not being
adsorbed on the nafion/silica catalyst (NS4R2) synthesized.
9.10.6. DME Adsorption on the STA/Silica Catalyst
FT-IR spectra of DME adsorption on STA/Silica catalyst (TRC-75-400) is
given in Figure 78. In the C-H stretching region peaks at 2840, 2877, 2956 and 2982
cm-1 were observed. They are in agreement with the data given in literature [80] for
DME adsorption on Nb2O5 and NbOPO4. The sharp peak at 1459 cm-1 is again
identified. With an increase in temperature complete desorption of DME takes place.
Similar to our previous conclusion for the nafion/silica catalyst, for the STA/silica
catalyst also we can conclude that DME is not being strongly adsorbed on the
surface.
On the other hand, the temperature dependent in situ methanol desorption
spectra of all the catalysts revealed that methanol was strongly adsorbed on all the
catalysts synthesized and tested in this work.

112
Figure 78. FT-IR spectra for DME adsorption and desorption on TRC-75-400
catalyst at different temperatures : RT, 100°C, 200°C, 250°C, 300°C, 350°C, 400°C,
500°C
113
CHAPTER 10
CONCLUSIONS AND RECOMMENDATIONS
In this study, novel nafion and heteropolyacids (silicotungstic acid and
tungstophosphoric acid) incorporated mesoporous catalytic materials were
synthesized by one-pot hydrothermal and impregnation procedures. The synthesized
materials were characterized by using a variety of techniques including XRD, BET,
EDS, XPS, TGA-DTA, SEM, FTIR, EDX elemental mapping and DRIFTS of
pyridine adsorption. The activities of these catalysts were tested in the synthesis of
diesel-fuel alternate dimethyl ether from methanol dehydration and they were
compared in terms of their nafion or heteropolyacid loading, techniques and
conditions applied during surfactant removal step, etc. In addition, in situ infrared
studies were done by adsorbing methanol and DME on the samples and spectra was
recorded to observe the desorption of them with an increase in temperature. The
conclusions achieved based on these experimental studies are summarized as
follows.
The synthesized STA/Silica catalysts were found to have well dispersed
structures with no formation of tungsten oxide crystals different from the previously
synthesized STA/Silica catalysts in literature, which is thought to be due to carrying
out the hydrothermal synthesis in a fully sealed autoclave under autogeneous
pressure. STA was successfully incorporated and the elemental mapping analysis of
W and Si proved that these elements were perfectly dispersed in the structure of the
catalyst. FTIR analyses showed that the chemical bonds belonging to the Keggin
units of STA were preserved and DRIFTS of pyridine adsorption analyses showed
the presence of strong Brönsted acid sites. Pure heteropolyacids are nonporous and
have extremely low specific surface areas (1-5 m2/g). According to nitrogen
adsorption analyses the surface areas of the novel catalysts were between 187-252

114
m2/g. Catalytic activity tests of these materials in methanol dehydration reaction
revealed that in the presence of the STA/Silica catalyst containing a W/Si ratio of
0.33 and calcined at 350°C (TRC-75(L)), a methanol conversion of 60% and a DME
selectivity of about 100% could be obtained at 250°C at a space time of 0.27 s.g.cm-
3. This catalyst showed to be more active and more resistant to coke formation than
the previously synthesized WOX-Silicate structured catalysts. Formaldehyde
formation was observed as the main byproduct at lower temperatures. Calcination at
400°C decreased the activity due to the deactivation of STA phase at this
temperature. Applying supercritical carbon dioxide extraction after washing with
deionized water seemed to have no effect on the catalytic activity. Carrying out the
reaction at a higher space time (0.41 s.g.cm-3) resulted in an increase in DME yield
(80% at 250°C) as expected.
By synthesizing a TPA/Silica catalyst following a similar synthesis procedure
with the same W/Si molar ratio of 0.40, the effect of TPA was compared as an active
component. The surface area of this catalyst was found as 143 m2/g. About 30%
methanol conversion was obtained at 250°C at a space time of 0.27 s.g.cm-3. The
activity of TPA/Silica (TPA-75(L)) catalyst was lower than that of the STA/Silica
catalyst (TRC-75(L)).
In addition, a STA/Aluminosilicate catalyst (STAMAS) prepared by
impregnation procedure was tested in methanol dehydration and this catalyst was
found to be quite active. 75% DME yield was obtained at 250°C when the space time
was adjusted to 0.27 s.g.cm-3. Although its catalytic activity was found to be higher
than TRC-75(L), STAMAS has a drawback due to its synthesis procedure. This
catalyst is expected to lose impregnated STA if it is washed with polar solvents. So it
cannot be used in liquid phase reactions.
The second part of this work consists of synthesizing nafion incorporated
mesoporous catalysts. First, nafion/silica catalysts were prepared by one-pot
hydrothermal synthesis method. Cetyltrimethylammonium bromide was used as the
surfactant, TEOS was used as the silica source and two different nafion sources were
used each containing 5% nafion resin. In surfactant removal step, different treatments
were applied including calcination at 250°C and 350°C or washing with 1 M or 2 M
of sulfuric acid solution of ethanol for 6 or 12 hours by using refluxing technique or
by keeping at room temperature. The surface araes of the materials were found to
115
vary between 595-792 m2/g, which is quite high when compared to the surface area
of pure nonporous nafion resin (0.02 m2/g). All the catalysts had pore diameters of
4.3 nm. As far as the catalytic activity of the materials were concerned, the best
treatment was found to be refluxing in SAE solution for 6 hours and further refluxing
in pure ethanol for another 6 hours. Optimum nafion loading on the catalyst could be
achieved when the nafion/silica weight ratio in the synthesis solution was adjusted to
0.15. The highest methanol conversion obtained with the Nafion/Silica catalysts was
40% at 300°C at 0.27 s.g.cm-3 achieved in the presence NS4R2 with a DME
selectivity approaching to 100%. Indeed, the concentration of Brönsted acid sites in
the structure of NS4R2 was found to be the highest among the Nafion/Silica catalysts
synthesized. Furthermore, nafion/aluminosilicate and nafion/α-alumina catalysts
were prepared by following impregnation route. Their catalytic activities in methanol
dehydration showed that when compared to the pure aluminosilicate and α-alumina,
use of these novel nafion impregnated catalysts did not result in a significant increase
in methanol conversion. One-pot hydrothermal synthesis proved to be a much better
method to obtain nafion incorporated porous catalysts.
Among the hydrothermally synthesized catalysts in this work, TRC-75(L)
(the most active STA/Silica catalyst) showed higher activity than NS4R2 (the most
active Nafion/Silica catalyst). However, in terms of stability and tolerance to coke
formation, Nafion/Silica catalysts are more suitable for catalytic applications
showing considerable activity even at low temperatures.
Some of the catalysts synthesized in this work (hydrothermally synthesized
Nafion/Silica, STA/Silica and STA/Aluminosilicate, Nafion/Aluminosilicate by
impregnation) were tested in in situ infrared methanol and DME adsorption-
desorption studies. Due to methanol adsorption, several peaks were observed in the
C-H stretching region in the spectra of all the catalysts, which were assigned to
methoxide on silica based on the studies in literature. The in situ FT-IR spectra
showed that methanol was adsorbed by the formation of methoxy species on the
active sites and was also physically adsorbed in molecular form. A possible reaction
mechanism was proposed based on these results. Desorption of methanol with
temperature showed that methanol was strongly adsorbed on all types of catalysts
used in this work through the Brönsted and Lewis sites present at the surfaces of the
catalysts, existance of which were proved by DRIFTS of pyridine adsorption
116
analyses. Bands related to the formation and release of DME were identified and
their positions were proved by adsorbing DME on the samples. By observing the
desorption of DME with temperature, it was also concluded that our product,
dimethyl ether was not being strongly adsorbed on the catalysts synthesized in this
work.
Concerning the synthesis of nafion and heteropolyacid incorporated
mesoporous catalysts, some modifications in the sythesis procedure can be done. In
this work, the surfactant, silica source and the procedure in synthesizing the catalysts
were based on the synthesis route of MCM-41. In the future studies, these active
components may be incorporated into the structure of mesoporous SBA-15 by again
following an acidic one-pot hydrothermal synthesis route and can be tested in DME
synthesis from methanol. SBA-15 is known to have a thicker wall with a larger pore
size and is more stable than MCM-41. Thus, solid-acid catalysts prepared by adding
nafion or heteropolyacids during the one-pot synthesis of SBA-15 may lead to the
formation of novel catalytic materials highly active in methanol dehydration to
produce DME.
To sum up, in this work it was shown that dimethyl ether, which is a
promising transportation fuel alternate for the future, can be produced at high yields
in the presence of the silicotungstic acid, tungstophosphoric acid and nafion
incorporated catalysts synthesized here. The mesoporous catalysts had high surface
areas and pore volumes with nafion and heteropolyacids successfully incorporated
into their structure. In addition to their capability of synthesizing this
environmentally friendly diesel-alternate fuel from methanol, these novel catalysts
may open a pathway in catalyzing many other acid-catalyzed reactions.

117
REFERENCES
[1] Dogu, T., Varisli, D., “Alcohols as Alternatives to Petroleum for Environmentally Clean Fuels and Petrochemicals”, 2007, Turkish Journal of Chemistry, 31, 551-567. [2] Fu, Y., Hong, T., Chen, J., Auroux, A., Shen, J., “Surface acidity and the dehydration of methanol to dimethyl ether”, Thermochimica Acta, 2005, 434, 22-26. [3] Yaripour, F., Baghaei, F., Schmidt, I., Perregaard, J., “Catalytic dehydration of methanol to dimethyl ether over solid acid catalysts”, Catalysis Communications, 2005, 6, 147-152. [4] An, W., Chuang, K. T., Sanger, A. R., “Dehydration of methanol to dimethyl ether by catalytic distillation”, The Canadian Journal of Chemical Engineering, 2004, 82, 948-955. [5] Olah, G.A., Goeppert, A., Prakash, G.K.S., “Beyond Oil and Gas: The Methanol Economy”, Wiley-VCH, 2006, Weinheim. [6] Wikipedia the Free Encylopedia, http://www.wikipedia.org/Main_Page, http://en.wikipedia.org/wiki/Dimethyl_ether, Last Access Date: June 2009. [7] Nexant, ChemSystems Process Evaluation/Research Planning Program, Report Abstract, Dimethyl Ether Technology and Markets, 2008, 07/08-S3. [8] JFE Holdings Inc., http://www.jfe-holdings.co.jp/en/index.html, http://www.jfe-holdings.co.jp/en/dme/03-yoto.html, Last Access Date: June 2009. [9] International DME Association, http://www.aboutdme.org/index.asp?sid=1, http://www.aboutdme.org/index.asp?bid=219#Cooking%20&%20Heating, Last Access Date:March 2009. [10] Garimella, S., DME-The Next Gen Fuel, Enzen Global, 2007.
118
[11] Gray, C., Webster G., A Study of Dimethyl Ether (DME) as an Alternative Fuel for Diesel Engine Applications, CANMET Energy Technology Centre, Natural Resources Canada and Transportation Development Centre, Transport Canada, Advanced Engine Technology Ltd., 2001. [12] Eberhardt, J.J., Future Fuels for Heavy-Duty Trucks, Alternative Fuels in Trucking, 1997, 6, 2.
[13] Bourg, H.M., “Future Prospective of DME”, 23rd World Gas Conference, 2006, Amsterdam. [14] Vishwanathan, V., Jun, K.W., Kim, J.W., Roh, H.S., “Vapour phase dehydration of crude methanol to dimethyl ether over Na-modified H-ZSM-5 catalysts”, Applied Catalysis A: General, 2004, 276, 251-255. [15] Yaripour, F., Baghaei, F., Schmidt, I., Perregaard, J., “Synthesis of dimethyl ether from methanol over aluminium phosphate and silica-titania catalysts”, Catalysis Communications, 2005, 6, 542-549. [16] Fei, J., Hou, Z., Zhu, B., Lou, H., Zheng, X., “Synthesis of dimethyl ether (DME) on modified HY zeolite and modified HY zeolite-supported Cu-Mn-Zn catalysts”, Applied Catalysis A: General, 2006, 304, 49-54. [17] Xu, M., Lunsford, J.H., Goodman, D.W., Bhattacharyya, A., “Synthesis of dimethyl ether (DME) from methanol over solid-acid catalysts”, Applied Catalysis A: General, 1997, 149, 289-301. [18] Khom-in, J., Praserthdam, P, Panpranot, J., Mekasuwandumrong, O., “Dehydration of methanol to dimethyl ether over nanocrystalline Al2O3 with mixed γ- and χ- crystalline phases”, Catalysis Communications, 2008, 9, 1955–1958. [19] Oye, G., Sjöblom, J., Stöcker, M., “Synthesis, characterization and potential applications of new materials in the mesoporous range”, Advances in Colloid and Interface Science, 2001, 89-90, 439-466. [20] Sayari, A., Liu, P., “Non-silica periodic mesostructured materials: recent progress”, Microporous Materials, 1997, 12, 149-177.

119
[21] Taguchi, A., Schuth, F., “Ordered mesoporous materials in catalysis”, Microporous and Mesoporous Materials, 2005, 77, 1-45. [22] Roth, W.J. and Vartuli, J.C, “Synthesis of mesoporous molecular sieves”, Studies in Surface Science and Catalysis, 2005, 157, 91-110. [23] Alfredsson, V., Keung, M., Monnier, A., Stucky, G.D., Ungerb, K.K., Schuth, F., “High-resolution Transmission Electron Microscopy of Mesoporous MCM-41 Type Materials”, J. Chem. Soc., Chem. Commun., 1994, 921-922. [24] Beck, J.S., Vartuli, J.C., Roth, W. J., Leonowicz, M. E., Kresge, C. T., Schmitt, K. D., Chu, C. T.W., Olson, D. H., Sheppard, E. W., McKullen, S.B., Higgins, J.B., Schlenker, J.L., “A new family of mesoporous molecular sieves prepared with liquid crystal templates”, J. Am. Chem. Soc., 1992, 114, 10834-10843. [25] Varisli, D., “Kinetic Studies for Dimethyl ether and Diethyl ether Production”, Ph.D. Thesis, Middle East Technical University, Ankara, Turkey, September 2007. [26] Terasaki, O., “Mesoporous Crystals and Related Nano-Structured Materials”, Studies in Surface Science and Catalysis, 2004, 148. [27] Gucbilmez, Y., Dogu, T., Balci, S., “Ethylene and Acetaldehyde Production by Selective Oxidation of Ethanol Using Mesoporous V-MCM-41 Catalysts”, Ind. Eng. Chem. Res., 2006, 45, 3496-3502. [28] Ozdogan, E., Dogu, T., Dogu, G., “Ni-MCM-41 type mesoporous catalysts synthesızed by one-pot hydrothermal procedure for steam reformıng of ethanol”, Int. J. Chem. Reactor Eng., 2008, 5, A111. [29] Sener, C., Dogu, T., Dogu, G., “Effects of synthesis conditions on the structure of Pd incorporated MCM-41 type mesoporous nanocomposite catalytic materials with high Pd/Si ratios”, Microporous and Mesoporous Materials, 2006, 94, 89-98. [30] Wikipedia the Free Encylopedia, http://www.wikipedia.org/Main_Page, http://en.wikipedia.org/wiki/Heteropolyacid, Last Access Date: July 2009. [31] Cavani, F., “Heteropolycompound-based catalysts: A blend of acid and oxidizing properties”, Catalysis Today, 1998, 41, 73-86.
120
[32] Okuhara, T., Mizuno, N., Misono, M., “Catalysis by heteropoly compounds- recent developments”, Applied Catalysis A: General, 2001, 222, 63–77. [33] Kozhevnikov, I.V., “Fine organic synthesis with the aid of heteropolycompounds”, Russian Chemical Reviews, 1993, 62 (5), 473-491. [34] Okuhara, T., Nishimura, T., Misono, M., “Novel Microporous Solid "Superacids":CsxH3-x PW12040 (2<x<3)”, 1l th International Congress on Catalysis - 40th Anniversary, Studies in Surface Science and Catalysis, 1996, 101, 581-590. [35] Mizuno, N., Misono, M., “Heteropolyanions in catalysis”, Journal of Molecular Catalysis, 1994, 86, 319-342. [36] Misono, M., Ono, I., Koyano, G., Aoshima, A., “Heteropolyacids. Versatile green catalysts usable in a variety of reaction media”, Pure Appl. Chem., 2000, 72, 7, 1305-1311. [37] Misono, M., Okuhara, T., Ichiki, T., Arai, T., Kanda, Y., “Pseudoliquid Behavior of Heteropoly Compound Catalysts. Unusual Pressure Dependencies of the Rate and Selectivity for Ethanol Dehydration”, J. Am. Chem.Soc., 1987, 109 (18), 5535-5536. [38] Misono, M., “Acid catalysts for clean production. Green aspects of heteropolyacid catalysts”, C. R. Acad. Sci. Paris, Série Ilc, Chimie/Chemistry, 2000, 3, 471–475. [39] Varisli, D., Dogu, T., Dogu, G., “Ethylene and diethyl-ether production by dehydration reaction of ethanol over different heteropolyacid catalysts”, Chemical Engineering Science, 2007, 62, 5349-5352. [40] Herrera, J.E., Kwak, J.H., Hu, J.Z., Wang, Y., Peden, C.H.F., “Effects of novel supports on the physical and catalytic properties of tungstophosphoric-acid for alcohol dehydration reactions”, Top. Catal., 2008, 49, 259-267. [41] Haber, J., Pamin, K., Matachowski, L., Napruszewska, B., Poltowicz, J., “Potassium and Silver Salts of Tungstophosphoric Acid as Catalysts in Dehydration of Ethanol and Hydration of Ethylene”, Journal of Catalysis, 2002, 207, 296–306.
121
[42] Soled, S., Miseo, S., McVicker, G., Gates, W.E., Gutierrez, A., Paes, J., “Preparation of bulk and supported heteropolyacid salts”, Catalysis Today, 1997, 36, 441-450. [43] Allaoui, L.A., Aoussi, A., “Effect of the Brønsted acidity on the behavior of CO2 methanol reaction”, Journal of Molecular Catalysis A: Chemical, 2006, 259, 281–285. [44] Taguchi, A., Abe, T., Iwamoto, M., “Non-silica-based mesostructured material. 2 Synthesis of hexagonal superstructure consisting of 11 -tungstophosphate anions and dodecyltrimethylammonium cations”, Microporous and Mesoporous Materials, 1998, 21, 387-393. [45] Nowinska, K., Fórmaniak, R., Kaleta, W., Waclaw, A., “Heteropoly compounds incorporated into mesoporous material structure”, Applied Catalysis A: General, 2003, 256 115–123. [46] Said, A.E.A., El-Wahab, M.M.A., Alian, A.M., “Perspective catalytic performance of Brønsted acid sites during esterification of acetic acid with ethyl alcohol over phosphotungestic acid supported on silica”, J Chem Technol Biotechnol, 2007, 82, 513–523. [47] Vazquez, P., Pizzio, L., Caceres, C., Blanco, M., Thomas, H., Alesso, E., Finkielsztein, L., Lantano, B., Moltrasio, G., Aguirre, J., “Silica-supported heteropolyacids as catalysts in alcohol dehydration reactions”, Journal of Molecular Catalysis A: Chemical, 2000, 161, 223–232. [48] Varisli, D., Dogu, T., Dogu, G., “Novel Mesoporous Nanocomposite WOx-Silicate Acidic Catalysts: Ethylene and Diethylether from Ethanol”, Ind. Eng. Chem. Res. (doi:10.1021/ie8008154, in press). [49] Varisli, D., Dogu, T., Dogu, G., “Silicotungstic Acid Impregnated MCM-41-like Mesoporous Solid Acid Catalysts for Dehydration of Ethanol”, Ind. Eng. Chem. Res., 2008, 48, 4071. [50] Harmer, M.A., Farneth, W.E., Sun, Q., “High Surface Area Nafion Resin/Silica Nanocomposites: A New Class of Solid Acid Catalyst”, J. Am. Chem. Soc., 1996, 118, 7708-7715.
122
[51] Harmer, M.A., Sun, Q., Vega, J.A., Farneth, W.E., Heidekum, A., Hoelderich, W.F., “Nafion resin-silica nano-composite solid acid catalysts microstructure-processing-property correlations”, The Royal Society of Chemistry, 2000, 7-14. [52] Wang, H., Xu, B.Q.,“Catalytic performance of Nafion/SiO2 nanocomposites for the synthesis of a-tocopherol”, Applied Catalysis A: General, 2004, 275, 247–25. [53] Fujiwara, M., Kuraoka, K., Yazawa, T., Xu, Q., Tanaka, M., Souma, Y., “Preparation of an MCM-41/Nafion® composite material; a selective catalyst for α-methylstyrene dimerization”, Chem. Commun., 2000, 1523–1524. [54] Fujiwara, M., Shiokawa, K., Zhub, Y., “Preparation of Mesoporous Silica/Polymer Sulfonate Composite Materials,” Journal of Molecular Catalysis A: Chemical, 2007, 264, 153–161. [55] Wang, S., Guin, J.A., “Si-MCM41 supported sulfated zirconia and nafion for ether production”, Energy&Fuels, 2001, 15, 666-670. [56] Török, B., Kiricsi, I., Molnar, A., Olah, G.A., “Acidity and Catalytic Activity of a Nafion-H/Silica Nanocomposite Catalyst Compared with a Silica-Supported Nafion Sample”, Journal of Catalysis, 2000, 193, 132–138. [57] Bringué, R., Tejero, J., Iborra, M., Izquierdo, J.F., Fité, C., Cunill, F., “Supported Nafion catalyst for 1-pentanol dehydration reaction in liquid phase”, Chemical Engineering Journal, 2008, 145, 135–141. [58] Alvaro, M., Corma, A., Das, D., Fornés, V., García, H., “Nafion”-functionalized mesoporous MCM-41 silica shows high activity and selectivity for carboxylic acid esterification and Friedel–Crafts acylation reactions”, Journal of Catalysis, 2005, 231, 48–55. [59] Alvaro, M., Corma, A., Das, D., Fornés, V., García, H, “Single-step preparation and catalytic activity of mesoporous MCM-41 and SBA-15 silicas functionalized with perfluoroalkylsulfonic acid groups analogous to Nafion”, Chem.Commun., 2004, 956–957. [60] Martinez, F., Morales, G., Martin, A., van Grieken, R. “Perfluorinated Nafion-modified SBA-15 materials for catalytic acylation of anisole”, Applied Catalysis A: General, 2008, 347, 169–178.

123
[61] Sun, Q., Harmer, M.A., Farneth, W.E., “An Extremely Active Solid Acid Catalyst, Nafion Resin/Silica Composite, for the Friedel-Crafts Benzylation of Benzene and p-Xylene with Benzyl Alcohol”, Ind. Eng. Chem. Res., 1997, 36, 5541-5544. [62] Botella, P., Corma, A., Lopez-Nieto, J.M., “The Influence of Textural and Compositional Characteristics of Nafion/Silica Composites on Isobutane/2-Butene Alkylation”, Journal of Catalysis, 1999, 185, 371–377. [63] Laufer, M.C., Hausmann, H., Hölderich, W.F., “Synthesis of 7-hydroxycoumarins by Pechmann reaction using Nafion resin/silica nanocomposites as catalysts”, Journal of Catalysis, 2003, 218, 315–320. [64] Wang, H., Xu, B.Q., Han, M.H., Xu, C., Min, E.,Z., “Nafion/SiO2 Nanocomposites: High Potential Catalysts for Alkylation of Benzene with Linear C9-C13 Alkenes”, Chinese Chemical Letters, 2002, 13, 11, 1121 – 1124. [65] Sarsani, V.S.R., Lyon, C.J., Hutchenson, K.W., Harmer, M.A., Subramaniam, B., “Continuous acylation of anisole by acetic anhydride in mesoporous solid acid catalysts: Reaction media effects on catalyst deactivation”, Journal of Catalysis, 2007, 245 184–190. [66] Varisli, D., Dogu, T., “Production of Clean Transportation Fuel Dimethylether by Dehydration of Methanol Over Nafion Catalyst”, G.U. Journal of Science, 2008, 21(2), 37-41. [67] Kawi, S., Lai, M.W., “Supercritical fluid extraction of surfactant template from MCM-41”, Chem. Commun., 1998, 1407-1408. [68] Wachs, I.E., Fitzpatrick, L.E., “Characterization of Catalytic Materials”, Manning Publications Co., 1992, Greenwich. [69] Damyanova, S., Fierro, J.L., Sobrados, I., Sanz, J., “Surface Behavior of Supported 12-Heteropoly Acid As Revealed by Nuclear Magnetic Resonance, X-ray Photoelectron Spectroscopy, and Fourier Transform Infrared Techniques”, Langmuir, 1999, 15(2), 469-476. [70] Hogarth, W.H.J., Costa, J.C.D., Drennan, J., Lu, G.Q., “Proton conductivity of mesoporous sol–gel zirconium phosphates for fuel cell applications”, J. Mater. Chem., 2004, DOI: 10.1039/b413413n.
124
[71] Varisli, D., Tokay, K.C., Ciftci, A., Dogu, T., Dogu, G., “Methanol Dehydration Reaction to Produce Clean Diesel Alternative Dimethylether over Mesoporous Aluminosilicate-Based Catalysts”, Turkish Journal of Chemistry, 2009, 33, 355-366. [72] Tokay, K.C. “Dimethyl Ether (DME) Synthesis over Novel Mesoporous Catalysts”, M.Sc. Thesis, Middle East Technical University, Ankara, Turkey, August 2008. [73] Ostrowska, J., Narebska, A., “Infrared study of hydration and association of functional groups in a perfluorinated Nafion membrane”, Part 1, Colloid&Polymer Sci., 1983, 261,93-98. [74] Smith B., “Infrared Spectral Interpretation, A Systematic Approach”, CRC Press, 1999, Boca Raton. [75] Fisher, I.A., Bell, A.T., “A mechanistic study of methanol decomposition over Cu/SiO2, ZrO2/SiO2, and Cu/ZrO2/SiO2”, Journal of Catalysis, 1999, 184, 357-376. [76] Dogu, T., Boz, N., Aydın, E., Oktar, N., Murtezaoglu, K., Dogu, G., “DRIFT Studies for the Reaction and Adsorption of Alcohols and Isobutylene on Acidic Resin Catalysts and the Mechanism of ETBE and MTBE Synthesis”, Ind. Eng. Chem. Res., 2001, 40, 5044-5051. [77] Thornton, R., Gates, B.C., “Catalysis by Matrix-Bound Sulfonic Acid Groups: Olefin and Paraffin Formation from Butyl Alcohols”, Journal of Catalysis, 1974, 34, 275-287. [78] Kumar D., Varma S., Kamble V.S., Gupta N.M., “The selective adsorption/desorption of methanol over nanosize uranium oxide crystallites dispersed in MCM-48: FT-IR and TPD studies” Journal of Molecular Catalysis A:Chemical, 2004, 223, 251-257. [79] Tanaka T., “The Infrared Spectra of Methoxy-, Methylmethoxy- and Methoxy Endblocked Dimethyl-polysiloxanes”, Bulletin of the Chemical Society of Japan, 1958, 31, 762-766. [80] Sun, Q., Fu, Y., Yang, H., Auroux, A., Shen, J., “Dehydration of methanol to dimethyl ether over Nb2O5 and NbOPO4 catalysts: Microcalorimetric and FT-IR studies”, Journal of Molecular Catalysis A: Chemical, 2007, 275, 183-193.
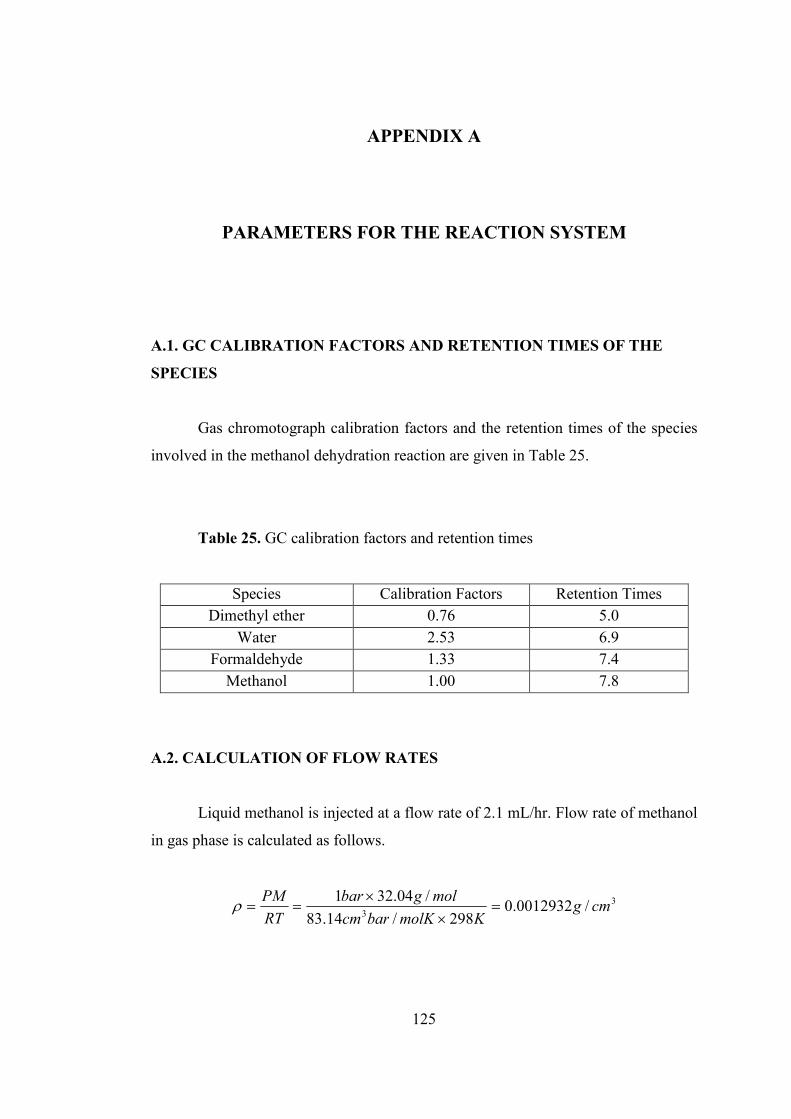
125
APPENDIX A
PARAMETERS FOR THE REACTION SYSTEM
A.1. GC CALIBRATION FACTORS AND RETENTION TIMES OF THE
SPECIES
Gas chromotograph calibration factors and the retention times of the species
involved in the methanol dehydration reaction are given in Table 25.
Table 25. GC calibration factors and retention times
Species Calibration Factors Retention Times Dimethyl ether 0.76 5.0
Water 2.53 6.9 Formaldehyde 1.33 7.4
Methanol 1.00 7.8
A.2. CALCULATION OF FLOW RATES
Liquid methanol is injected at a flow rate of 2.1 mL/hr. Flow rate of methanol
in gas phase is calculated as follows.
33
/0012932.0298/14.83
/04.321cmg
KmolKbarcm
molgbar
RT
PM=
×
×==ρ

126
min/42.21min/42.21min/035.0612
min/035.0min60/1/1/1.2
6120012932.0
79180.0
33
33
mlcmcm
cmhrmLcmhrml
vap
liq
==×
=××
==ρ
ρ
By measuring with a soap flow meter, flow rate of helium is adjusted to
10mL / 26sec.
min/00.23minsec/60sec26
10ml
ml=×
The total flow rate in the system is calculated as follows.
min/42.44min/00.23min/42.21 mlmlmlQQ HeMeOH =+=+
The ratio of the flow rate of methanol to the total flow rate is found as 0.48 as
shown below.
48.0min/42.44
min/42.21==
+ ml
ml
Q
HeMeOH
MeOH
A.3. EQUATIONS FOR METHANOL CONVERSION, DME YIELD AND
DME SELECTIVITY
DMEmethanoldeFormaldehyoT nnnn ⋅++= 2,

127
oT
methanoloT
methanoln
nnx
,
, −=
methanoloT
DMEDME
nn
nS
−
⋅=
,
2
methanoloT
FAFA
nn
nS
−=
,
DMEmethanolDME SXY ×=
FAmethanolFA SXY ×=
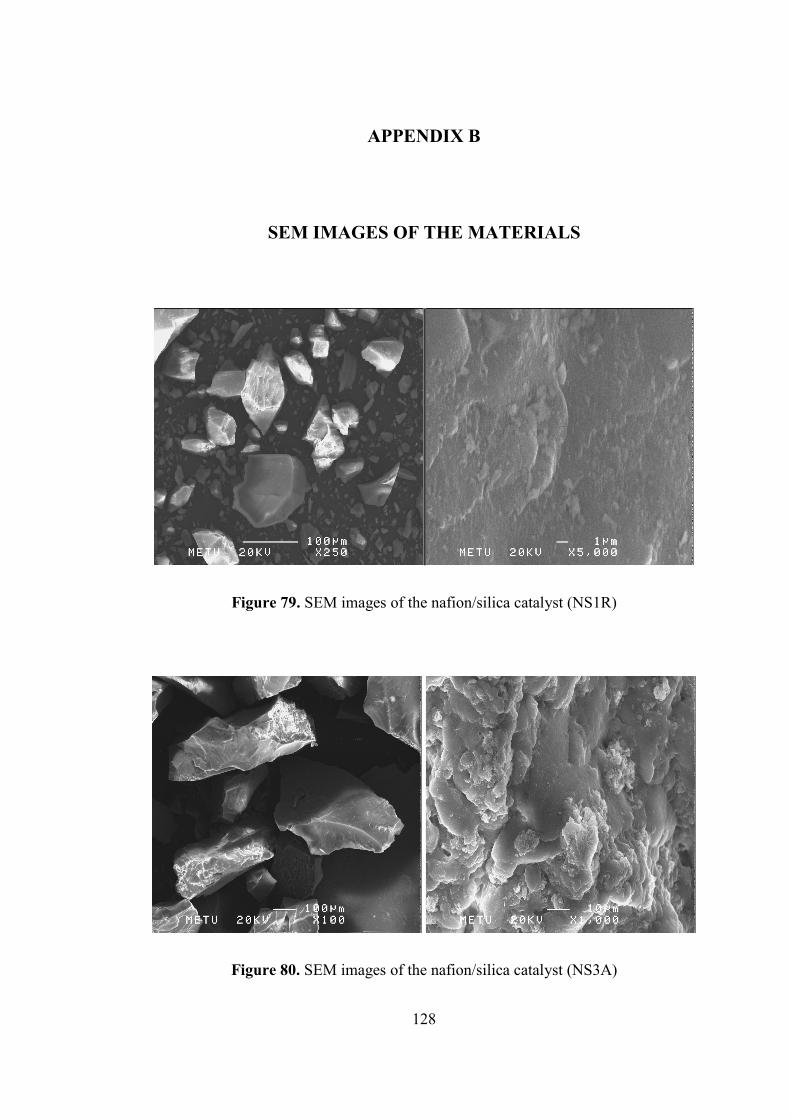
128
APPENDIX B
SEM IMAGES OF THE MATERIALS
Figure 79. SEM images of the nafion/silica catalyst (NS1R)
Figure 80. SEM images of the nafion/silica catalyst (NS3A)
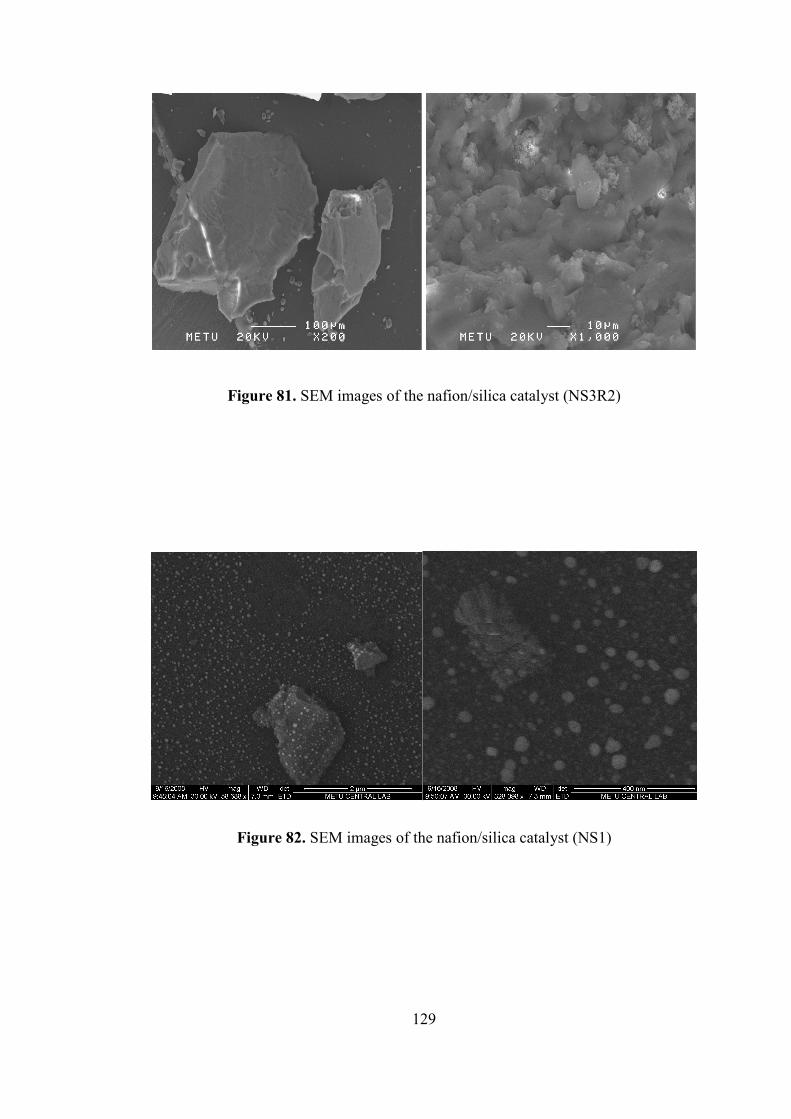
129
Figure 81. SEM images of the nafion/silica catalyst (NS3R2)
Figure 82. SEM images of the nafion/silica catalyst (NS1)
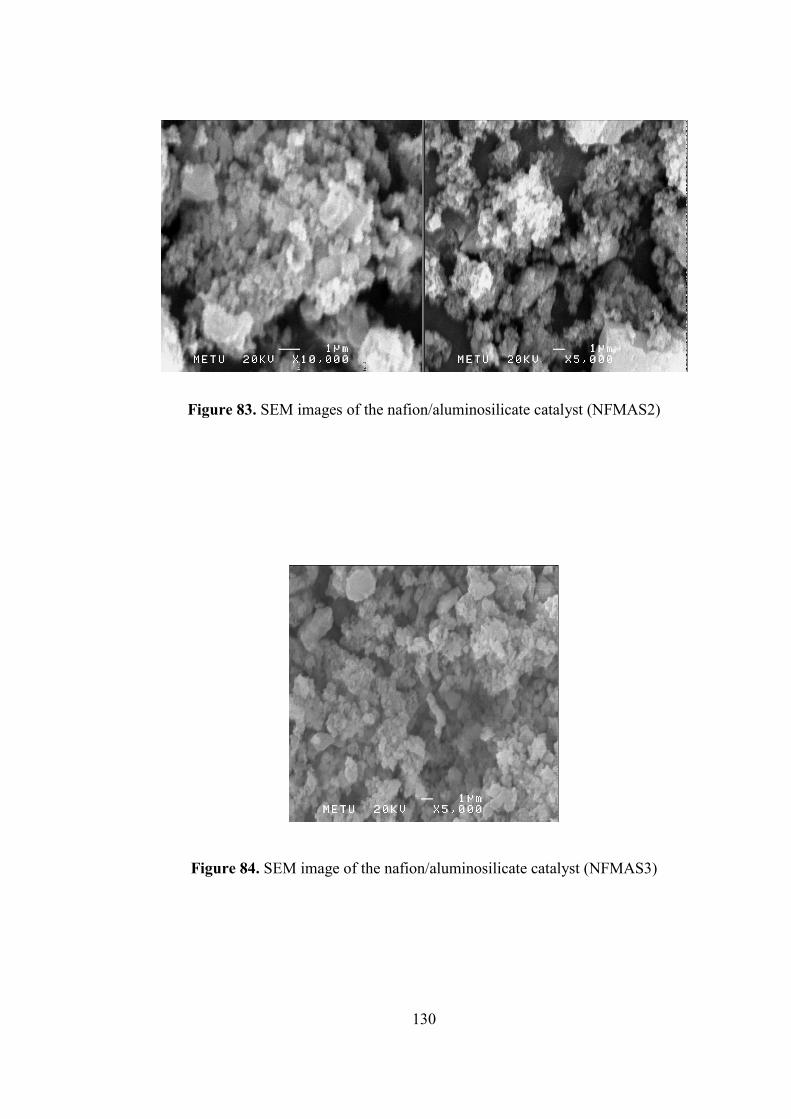
130
Figure 83. SEM images of the nafion/aluminosilicate catalyst (NFMAS2)
Figure 84. SEM image of the nafion/aluminosilicate catalyst (NFMAS3)
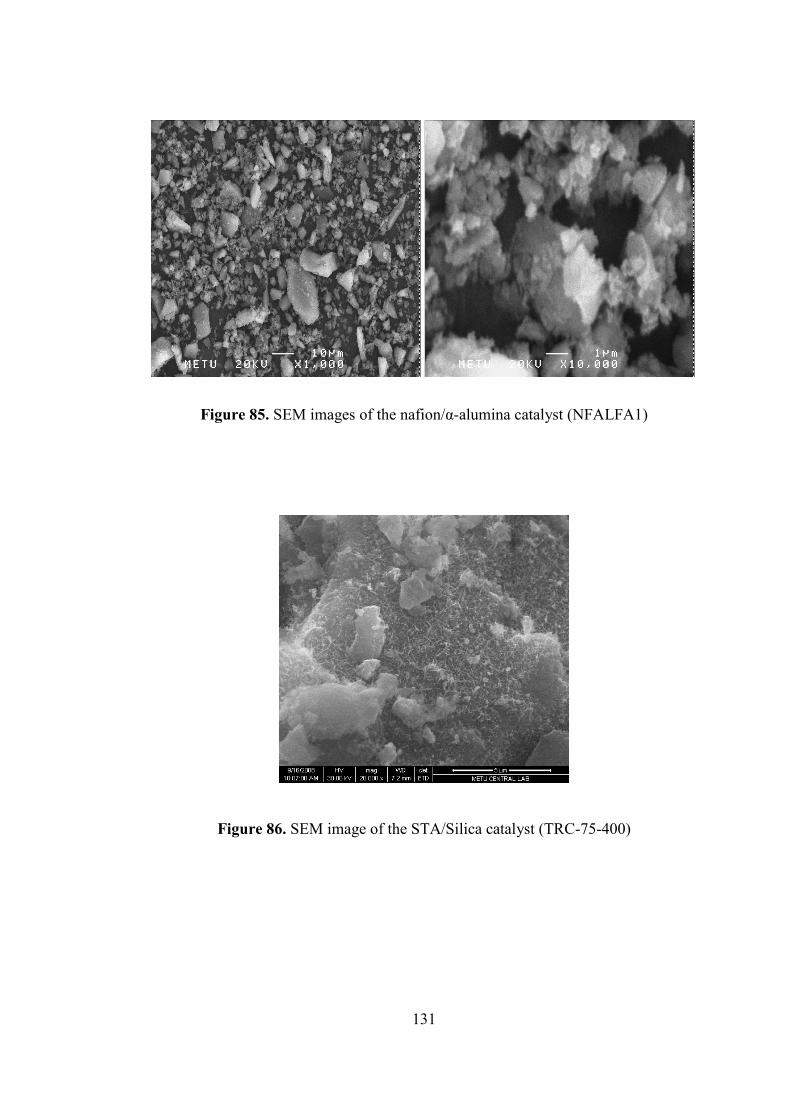
131
Figure 85. SEM images of the nafion/α-alumina catalyst (NFALFA1)
Figure 86. SEM image of the STA/Silica catalyst (TRC-75-400)
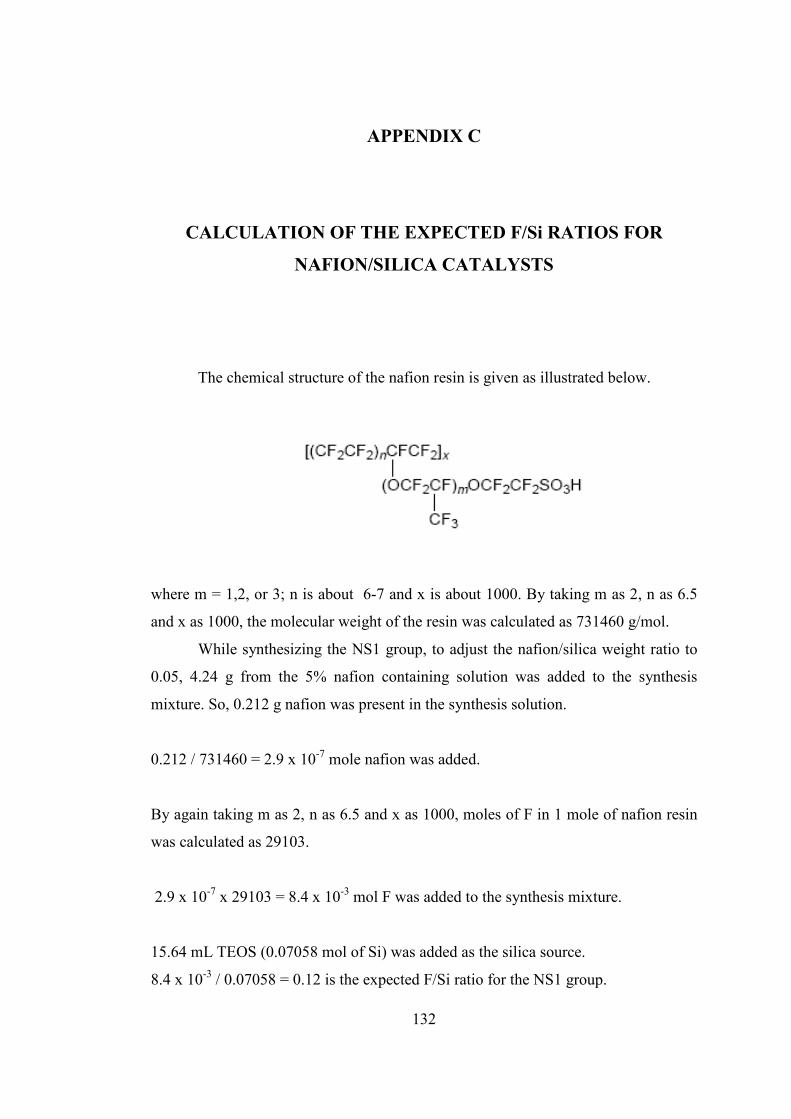
132
APPENDIX C
CALCULATION OF THE EXPECTED F/Si RATIOS FOR
NAFION/SILICA CATALYSTS
The chemical structure of the nafion resin is given as illustrated below.
where m = 1,2, or 3; n is about 6-7 and x is about 1000. By taking m as 2, n as 6.5
and x as 1000, the molecular weight of the resin was calculated as 731460 g/mol.
While synthesizing the NS1 group, to adjust the nafion/silica weight ratio to
0.05, 4.24 g from the 5% nafion containing solution was added to the synthesis
mixture. So, 0.212 g nafion was present in the synthesis solution.
0.212 / 731460 = 2.9 x 10⁻⁷ mole nafion was added.
By again taking m as 2, n as 6.5 and x as 1000, moles of F in 1 mole of nafion resin
was calculated as 29103.
2.9 x 10-7 x 29103 = 8.4 x 10⁻³ mol F was added to the synthesis mixture.
15.64 mL TEOS (0.07058 mol of Si) was added as the silica source.
8.4 x 10⁻³ / 0.07058 = 0.12 is the expected F/Si ratio for the NS1 group.
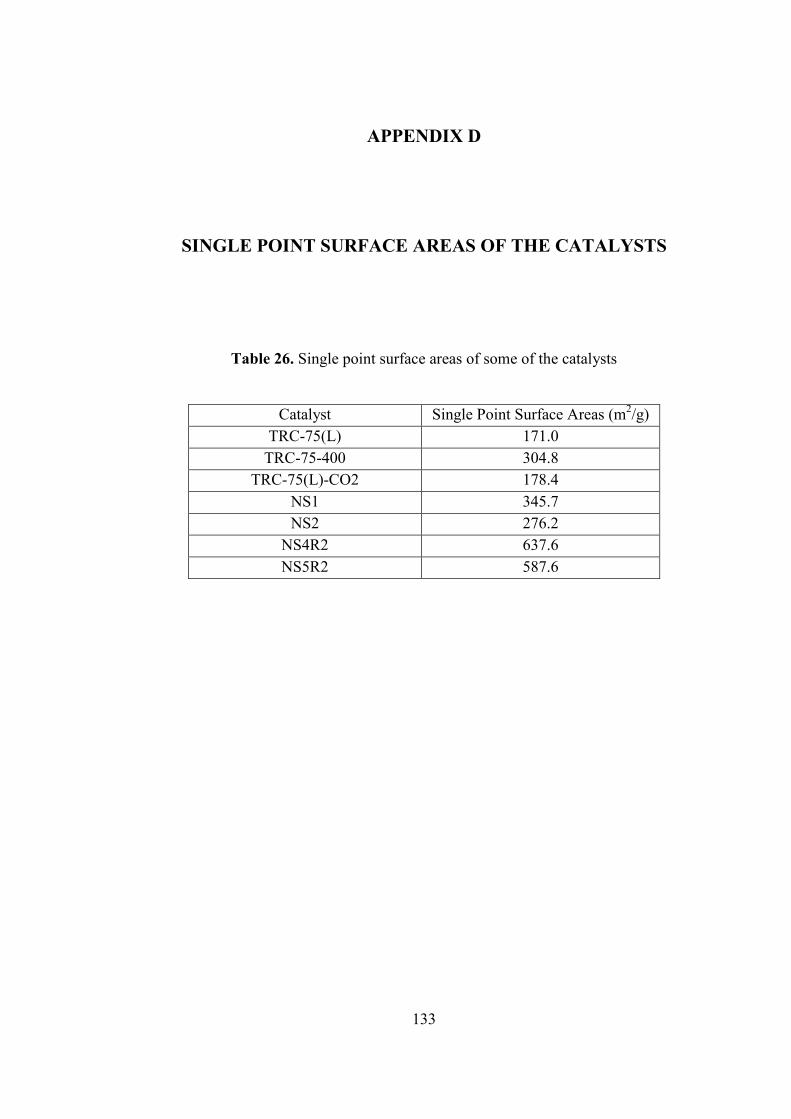
133
APPENDIX D
SINGLE POINT SURFACE AREAS OF THE CATALYSTS
Table 26. Single point surface areas of some of the catalysts
Catalyst Single Point Surface Areas (m2/g) TRC-75(L) 171.0
TRC-75-400 304.8 TRC-75(L)-CO2 178.4
NS1 345.7 NS2 276.2
NS4R2 637.6 NS5R2 587.6
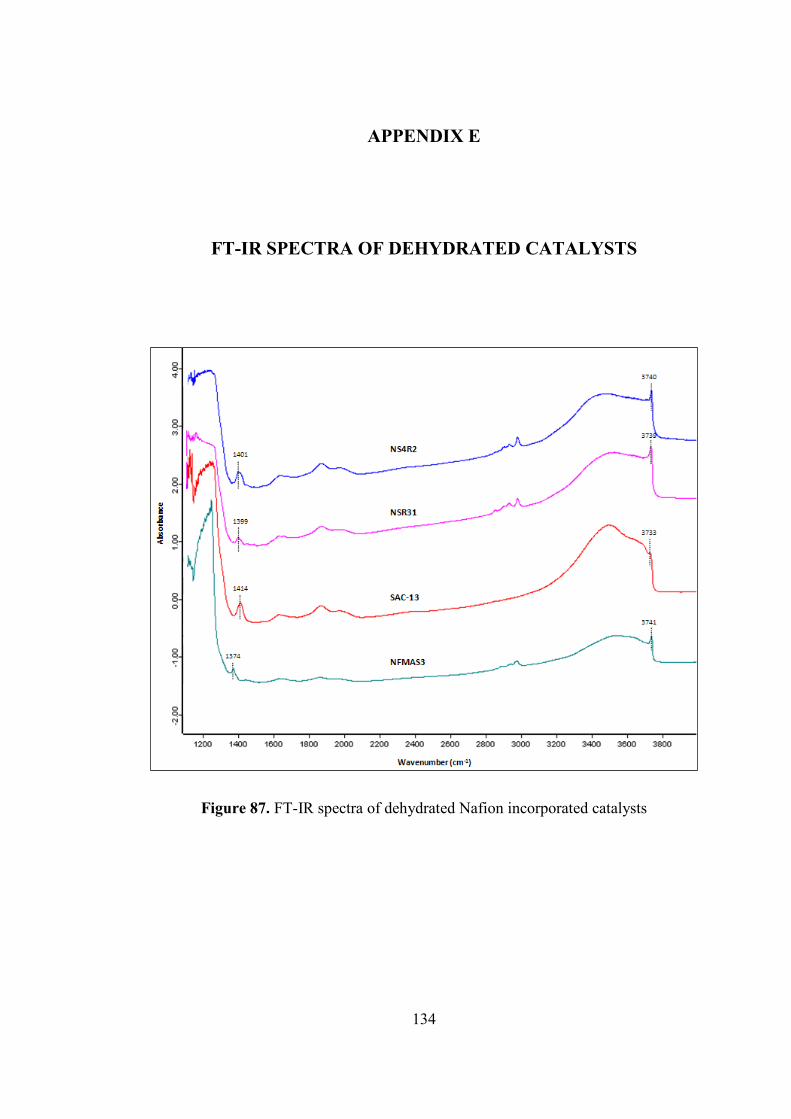
134
APPENDIX E
FT-IR SPECTRA OF DEHYDRATED CATALYSTS
Figure 87. FT-IR spectra of dehydrated Nafion incorporated catalysts
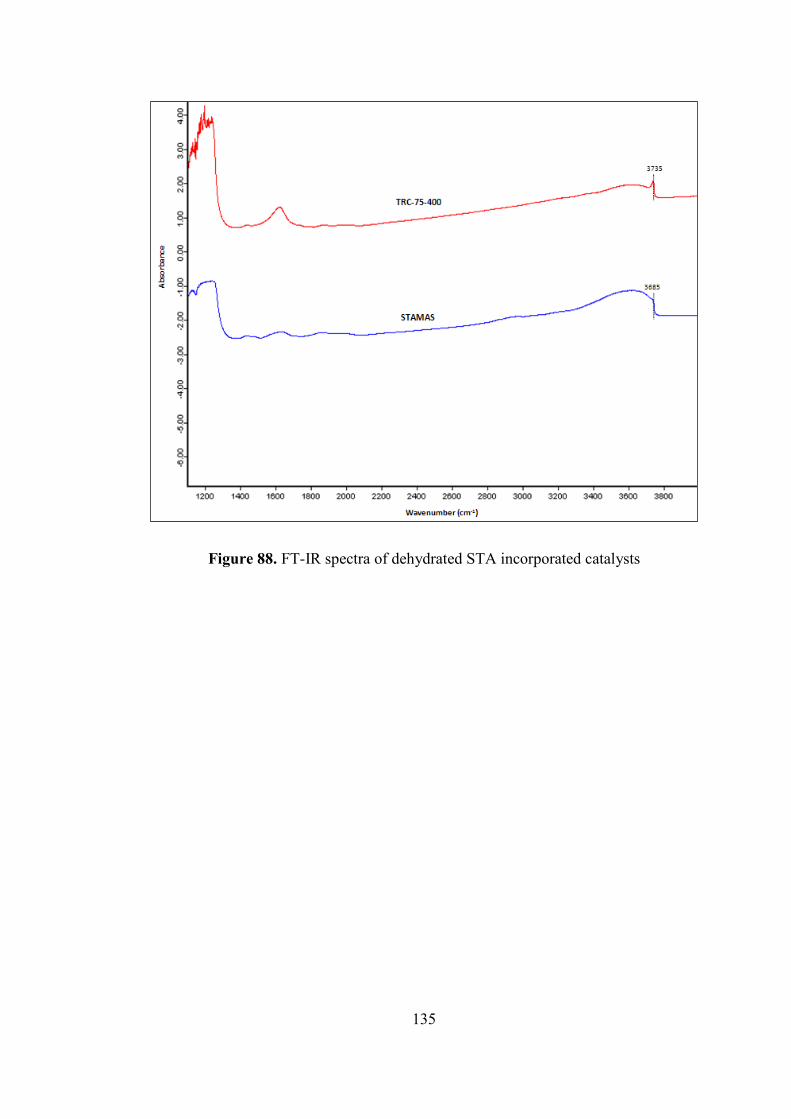
135
Figure 88. FT-IR spectra of dehydrated STA incorporated catalysts