Embed Size (px)
Citation preview
1
Nanofiller in aircraft and heavy vehicles tyre rubber compounds
S. Ostad Movahed1*, A. Ansarifar2
1 Faculty of Sciences, Ferdowsi University of Mashhad, Mashhad,Iran
2 Institute of Polymer Technology and Materials Engineering (Department of Materials)Loughborough
University, Leicestershire, LE11 3TU, UK
ABSTRACT Natural rubber is the main polymeric base of aircraft and heavy vehicles tyre rubber compounds. The effect of the same amount of a silica nanofiller on the curing, mechanical and dynamic properties of natural rubber compounds was investigated. The silica surfaces were pre-treated with bis[3-triethoxysilylpropyl] tetrasulfide (TESPT) to chemically bond silica to rubber. The rubbers were primarily cured by using sulfur in TESPT, and the cure was optimized by the addition of accelerator and activator, which helped to form sulfur chemical bonds between the rubber and filler. Different amounts of accelerator and activator were needed to fully crosslink the filled rubbers. The mechanical and dynamical properties of the vulcanizates improved substantially by the incorporation of the filler in the rubber. This was due to high level of rubber-filler adhesion and formation of chemical bonds between the rubber and TESPT. Keywords: Nanofiller , Rubber, Mechanical properties, Dynamical properties
INTRODUCTION
The expansion and success of the rubber industry world-wide owes a great deal to the hard work and brilliance of rubber experts who over the years produced a wide range of rubber articles. On tapping the Hevea brasiliensis tree, natural rubber latex exudes, which has a rubber content between 25 to 40 per cent by weight.
The solid rubber or cis-1-4 polyisoprene (NR) is extracted from the latex. The useful properties of NR include high gum and tear strength, high abrasion resistance, long flex life and high resilience. Because of these excellent properties, NR is used in many industrial applications for example, tyres, belting, anti-vibration mountings, and bridge bearings. Synthetic polyisoprene (IR) is the synthetic analogue of NR, and is

2
chemically and structurally similar to it. IR has been used in the same applications as NR such as in blends with styrene-butadiene rubber and polybutadiene rubber to improve their processibility, and also mineral filled IR is used in footwear, sponge, and sporting goods [1]. Raw rubbers often possess weak mechanical properties, and must be reinforced with fillers. Reinforcement increases properties for example * Correspondence to: S .Ostad Movahed ( [email protected])
hardness, abrasion resistance, and tensile strength. Carbon blacks, synthetic silicas, quartz, and metal oxides, which have large surface areas ranging from 150 to 400 m2/g are very effective in improving the rubber properties [2]. The major disadvantage of silicas is their acidity [3] and polarity [4], which is caused by the presence of silanol groups on the silicas surfaces. This causes unacceptably long cure times and slow cure rates [5], and also loss of crosslink density in sulfur-cured rubbers [6]. Moreover, processing becomes more difficult when a large amount of silica is added because the viscosity increases significantly [7,8]. The availability of the coupling agent bis(3-triethoxysilylpropyl-)tetrasulfide (TESPT) has provided a better opportunity for using synthetic silicas to crosslink and reinforce rubbers. TESPT possesses tertrasulfane and ethoxy reactive groups (Scheme 1). The tetrasulfane groups react with the rubber in the presence of accelerators at elevated temperatures, i.e. 140-240oC, with or without elemental sulphur being present, to form crosslinks in unsaturated rubbers. The
ethoxy groups react with the silanol groups on the surfaces of silicas to form stable filler/TESPT bonds. Moreover, the number of silanol groups decreases after reaction with TESPT, and the remaining groups become less accessible to the rubber because of steric hindrance [5]. This weakens the strong interaction between silica particles [5], which reduces the viscosity of rubber compounds, and also improves cure properties by preventing acidic silicas from interfering with the curing reactions in sulfur-cured rubbers. It has been reported [9] that TESPT is a satisfactory property promoter in silica/NR composites through C-S bonding with rubber molecules.Precipitated silica pre-treated with TESPT is classified as a “crosslinking” filler Parker and KOENIC [10] evaluated effects of silane pre-treated silica, and silica and liquid silane mixture on the crosslink density of a sulfur-cured rubber and concluded that the rubber with silane pre-treated silica had a higher crosslink density and increased filler-rubber adhesion. Ansarifar and co-workers [11 ,12] carried out a similar study and reached to the same conclusion. They also found that the mechanical properties of rubber improved more substantially with TESPT pre-treated silica nanofiller. The aim of this study was to crosslink and reinforce the mechanical and dynamical properties of NR with the same loading of TESPT pre-tread silica nanofiller. The bound rubber content and crosslink density of the rubbers were also measured to assess the extent of rubber-filler adhesion and chemical bonding between the rubber and filler, respectively.

3
EXPERIMENTAL Materials - Rubber, filler and
rubber chemicals
The raw rubbers used were standard Malaysian natural rubber grade L (98 wt % cis-1-4 content; SMRL) and synthetic polyisoprene (minimum 96 wt % cis-1-4 content; Kraton IR-307, Kraton Polymers, USA). The reinforcing filler was Coupsil 8113 (Degussa Ltd., Hanau, Germany). Coupsil 8113 is precipitated amorphous white silica-type Ultrasil VN3 surfaces of which had been pre-treated with TESPT. It has 11.3% by weight TESPT, 2.5% by weight sulfur (included in TESPT), 175 m2/g surface area (measured by N2 adsorption), and a 20-54 nm particle size. Curing chemicals, antidegradants
and processing oil
In addition to the raw rubbers and filler, the other ingredients were N-t-butyl-2-benzothiazole sulfenamide (Santocure TBBS, Woluwe, Belgium; a safe- processing delayed action accelerator), zinc oxide (Harcros Durham Chemicals, UK; activator), stearic acid (Anchor Chemical ltd, UK; activator), elemental sulur (Solvay Barium Strontium, Hannover, Germany; curing agent), N-(1,3-
dimethylbutyl)-N′-phenyl-p phenylenediamine (Santoflex 13, Brussels, Germany; antidegradant). The cure system consisted of TBBS, zinc oxide, stearic acid, and elemental sulfur. TBBS, zinc oxide, and stearic acid were added to optimize the chemical bonding or crosslinks between the rubber and filler. Accelerators are ingredients used to control the onset and rate of cure and the crosslink density in rubber. Activators are chemicals used to enhance the effectiveness of the accelerators during the curing reaction in rubber. Elemental sulfur is a curing agent used to crosslink rubbers with unsaturation sites or chemically active double bonds such as natural rubber. In total, 58 compounds were prepared for this study. Mixing
The compounds were prepared in a Haake Rheocord 90 (Berlin, Germany), a small size laboratory mixer with counter rotating rotors. In these experiments, the Banbury rotors and the mixing chamber were maintained at 24oC and 48oC for making the IR and NR compounds, respectively, and the rotor speed was 45 r.p.m. The volume of the mixing chamber was 78 cm3, and it was half full. Haake Software Version 1.9.1. was used for controlling the mixing condition and storing data. Assessment of the silica dispersion in
the rubbers
In order to select a suitable mixing time for incorporating the filler in the rubber,the rubber and filler were mixed together for different times. The filler was introduced first in the mixer, and then the raw rubber was added. The filler was added when the viscosity of

4
the rubber was still relatively high, which lead to an improved dispersion[13]. Following the previous findings [14] the mixing time was increased to 13 min to disperse the silica particles fully in the rubber. The temperature of the rubber compounds during mixing was 50-62oC. Twenty four hours after mixing ended, the rubbers were examined in an scanning electron microscope (SEM) to assess the filler dispersion. Dispersion of the silica particles in the rubber was assessed by a LEO 1530 VP Field emission gun scanning electron microscope (SEM). Small pieces of the uncured rubber were placed in liquid nitrogen for 3 min, and then fractured to create two fresh surfaces. The samples, 60 mm2 in area and 5 mm thick, were coated with gold, and then examined and photographed in the SEM. The degree of dispersion of the silica particles in the rubber was subsequently studied from SEM photographs. After the SEM photos were examined, suitable mixing times were used for adding the filler to the rubbers. Cure properties of the rubber
compounds
The viscosity of the rubber compounds was measured at 100oC in a single-speed rotational Mooney viscometer (Wallace Instruments, Surrey, UK) according to the British Standard [15]. The results were expressed in Mooney Units (MU). The scorch time, which is the time for the onset of cure, and the optimum cure time, which is the time for the completion of cure, were determined from the cure traces generated at 140 ± 2 oC by an oscillating disc rheometer curemeter (ODR, Monsanto, Swindon, UK) at an angular displacement of ± 3 o and a
test frequency of 1.7 Hz. [16] The cure rate index, which is a measure of the rate of cure in the rubber, was calculated using the method described in the British Standard [17]. The rheometer tests ran for up to three hours. The cure traces of the compounds which were subsequently used in this study are shown in Table 1.
Table 1: Formulations, Mooney viscosities and the ODR test results for the three compounds.
Compound No. 1* 2 3
NR(phr) 100 100 100 Coupsil (phr) --- 60 60 TBBS (phr) 6 6 6 ZnO (phr) 0.3 0.3 0.3 Sulphur (phr) 1.5 -- 1.5 Santoflex 13 1 1 1 Min.Torque(dN.m) 12.2 25.8 26.8 Max.Torque (dN.m) 71.1 106.9 135.1
torque∆ (dN.m) 58.9 81.3 108.3
1st (min) 21 8.1 5.5
90t (min) 32.5 23.5 9.1
95t (min) 34.3 26.6 9.2
CRI(min-1) 8.7 6.52 28.33 Mooney viscosity (MU) 49 97 106
*Compound 1 is the control compound.
Test pieces and test procedure
After these measurements were completed, the rubber compounds were cured in a compression mould at 140 oC with a pressure of 11 MPa. Pieces of rubber, each approximately 140 g in weight, were cut from the milled sheet. Each piece was placed in the centre of the mould to enable it to flow in all the directions when pressure was applied. This prevented anisotropy from forming in the cured rubber. For

5
determining the mechanical properties of the rubber, sheets 23 cm by 23 cm by approximately 2.4 mm thick were used, from which various samples for further tests were cut. Bound rubber and crosslink density
measurement
The solvent used for the bound rubber and crosslink density determination was toluene. For the determination, 1.7 g (control compound) and 2 g (filled compound) of the rubber compounds were cured in a compression mould to produce cylindrical samples, 15.6 mm in diameter and 9.5 mm in height. The samples were then placed individually in 70 ml of the solvent in labelled bottles, and allowed to swell for 16 days at 21 oC. The weight of the samples was measured every day until it reached an equilibrium. It took approximately 8 days for the control compound and 5 days for the filled compounds to reach equilibrium. The solvent was removed after this time elapsed, and the samples were dried in air for 9 h. The samples were subsequently dried in an oven at 85 oC for 24 h, and allowed to stand for an extra 24 h at 23 oC before they were re-weighed. The bound rubber and crosslink density were then calculated using the expressions in References 18 and 19, respectively (Table 2). Hardness
For measuring the hardness of the rubbers, cylindrical samples 12 mm thick and 28 mm in diameter, were used. The samples were then placed in a Shore A durometer hardness tester (The Shore Instrument & MFG, Co., New York) and the hardness of the rubber was measured at 23.5 oC over a 15-second interval after which a reading was taken. This was repeated at three different positions on the
sample, and median of the three readings calculated (Table 2)[20]. Table 2: Crosslink Density, Bound Rubber, and Mechanical Properties of the NR Rubber Vulcanizates Compound No. 1 2 3 Hardness (Shore A) 52 77 75 Tensile strength (MPa) 18 34 37 Elongation at break (%) 1100 700 837 Stored energy density at break (MJ/m3) 59 109 137 T (kJ/m2) 15 57 58 Bound rubber (%) - 94 94 Crosslink density (mol/m3) 96 178 149 ∆v (mm3/mg) 453 122 73 Modulus at different strain amplitudes (MPa) Strain amplitude (%) 100 0.54 3.15 2.23 200 0.44 4.83 3.16 300 0.54 5.32 4.23
Cohesive tear strength
Rectangular strips, 100 mm long and 30 mm wide, were cut from the cured sheets of rubber and a sharp crack, approximately 30 mm in length, was introduced into the strips half way along the width and parallel to the length of the strip, to form the trouser test pieces for the tear experiments. The tear tests were performed at an angle of 180o, at ambient temperature (21oC) and at a constant cross-head speed of 50 mm/min [21] in a Lloyd mechanical testing machine (Hampshire, UK). The tears produced in the rubber after the test pieces were fractured were 14 to 79 mm in length.

6
In each experiment, the tearing force was recorded to produce traces from which an average force was measured. The first peak corresponds to the onset of crack-growth, where the tearing force was still rising, and the last peak corresponds to when test stopped or the sample broke. These were not considered. The remaining peaks on the trace were utilised for calculating an average tearing force for the rubber . In some cases, the test produced only one peak from which a tearing force was calculated. For each rubber, five test pieces were used. After these measurements were completed, and following the procedure described previously [22]. The force values were placed in Equation 1 T=2F/t (1) where F is the force, and t the thickness of the test piece, to calculate tearing energies, T, for the rubbers. The median values of the tearing energies were subsequently noted (Table 2). Tensile properties The tensile stress, elongation at break, and stored energy density at break of the rubbers were determined in uniaxial tension in a Lloyd mechanical testing machine, using dumbbell test pieces 75 mm long with a central neck 25 mm long and 3.6 mm wide. The test pieces were die-stamped from the sheets of cured rubber. The tests were performed at 21oC and at a cross-head speed of 50 mm/min [23]. Lloyd DAPMAT computer software was used for storing and processing the data (Table 2). Abrasion resistance For determining the abrasion resistance of the rubbers, moulded cylindrical test pieces, 8 mm thick and
16 mm in diameter, were cured. The tests were performed at 23 oC in accordance with BS 903: Part A9:1995 using method A.1 (Zwick abrasion tester 6102 and abrasion standard rubber S1) [24]. For each rubber, three samples were tested to calculate the relative volume loss (∆v; Table 2). Loss tangent (tan δ), Loss and
storage modulus
Tan δ is the ratio between loss modulus and elastic modulus. The loss modulus represents the viscous component of modulus and includes all the energy dissipation processes during dynamic strain. The tan δ was measured in DMAQ800 model CFL- 50 (TA Instruments, USA), using Universal Analysis 2000 Software Version 4.3A. Test pieces 35 mm long, 13 mm wide and approximately 2.40 mm thick were used. The tests were performed at 1,10 and 100 Hz frequencies. The samples were deflected by 15, 256, 500 and 1000 µm (nominal peak to peak displacement) during the test, and the sample temperature was raised from - 80oC to 100oC at 3oC/min steps. Modulus at different strain
amplitudes
The modulus of the vulcanizates was measured at 100%, 200% and 300% strain amplitudes in uniaxial tension, using dumbbell test-pieces. The tests were carried out at ambient temperature ( ∼28oC) at a cross head speed of 50 mm/min in a Hounsfield mechanical testing machine (Hounsfield, Surrey, UK). QMAT-DONGLE version 2003 computer software was used to process the data (Table 2). RESULTS AND DISCUSSION

Silica dispersion and effect of the
filler on the rubber viscosity
To disperse the silica particles fully in the rubbers, the mixing time was increased to 13 min. Large silica aggregates were seen in the rubber matrix after short mixing timesmin (Fig. 1), and the filler dispersion improved as mixing time was increased to 13 min (Fig. 2), the silica particles were fully dispersed, and the size of the particles was down to about 60 nm. This was similar to the actual particle size of the filler, 20before it was mixed with the rubber. It was concluded that minimum mtimes of 13 min was sufficient to fully disperse the silica particles in the NR rubbers. The full dispersion of the silica particles in the rubber helped to maximize the reinforcing effect of the filler on the mechanical properties of the vulcanizates [25]. Long mixing time breaks down the rubber and causes reduction in molecular weight and viscosity [13,26]. The reddue to chain scission [27,28mechanical rupture of the primary carbon-carbon bonds that are present along the backbone of the rubber chains. This is often compensated by the reinforcing effect of the filler. The viscosity of the NR rubber increased from 97 to 106 MU when the filler and curing chemicals were added (compound 2 and 3; Tablecontrol NR compound had a viscosity of 49 MU (compound 1; Table Viscosity increases when additives such as fillers, elemental sulfur aactivators are mixed with NR [ Effect of nanofiller on the
mechanical properties of the cured
rubbers
7
Silica dispersion and effect of the
filler on the rubber viscosity
o disperse the silica particles fully in the rubbers, the mixing time was
min. Large silica aggregates were seen in the rubber matrix after short mixing times, e.g. 8
), and the filler dispersion mixing time was
, the silica particles were fully dispersed, and the size of the particles was down to about
This was similar to the actual 20-54 nm,
before it was mixed with the rubber. It was concluded that minimum mixing
sufficient to fully disperse the silica particles in the NR
. The full dispersion of the silica particles in the rubber helped to
orcing effect of the properties of Long mixing
time breaks down the rubber and lar weight
The reduction is 27,28] or the
pture of the primary carbon bonds that are present
along the backbone of the rubber chains. This is often compensated by the reinforcing effect of the filler. The viscosity of the NR rubber increased
MU when the filler and micals were added
; Table 1).The control NR compound had a viscosity
Table 1). Viscosity increases when additives such as fillers, elemental sulfur and
[13].
on the
mechanical properties of the cured
The addition of the filler influenced the mechanical properties of the NR vulcanizates (cf. compounds and 3; Table 2). The hardness and tensile strength increased from Shore A and from 18 to respectively. The modulus increased by a factor of 4 at 100%approximately 8 at 200% and strain amplitudes. This indicated a much stiffer rubber because of the filler. The abrasion resistance improved quite significantly with decreasing from 453 to 73 mmand stored energy density at break were also up from 15 to 58 kJfrom 59 to 137 MJ/m3, respectively, but elongation at break decreased from 1100 to 837% when the filler was added.
Figure 1. SEM photograph showing the dispersion of the silica in the rubber. Data for the NR rubber. Mixing time = poor dispersion.
The addition of the filler influenced the mechanical properties of the NR
compounds 1 with 2 ). The hardness and
increased from 52 to 75 to 37 MPa,
respectively. The modulus increased 100% and and 300%
strain amplitudes. This indicated a much stiffer rubber because of the filler. The abrasion resistance improved quite significantly with ∆v
mm3/mg. T and stored energy density at break
kJ/m2 and , respectively,
but elongation at break decreased from when the filler was
SEM photograph showing the dispersion of the silica in the rubber. Data for
= 8 min with

Figure 2. SEM photograph showing the dispersion of the silica particles in the rubber. Data for the NR rubber. Mixing time with good dispersion.
Effect of elemental sulfur on the
mechanical properties of the filled
NR rubber The addition of elemental sulfur affected the rubber properties, although there was no overall advantage, as some properties improved and others deteriorated (cf.compound 2 with Table 2). The hardness increased from 75 to 78 Shore A, and T remained almost unchanged at 57However the remaining properties were adversely affected. For example, the tensile strength decreased from to 34 MPa, elongation at break from 837 to 700%, and stored energy density at break from 137MJ/m3, respectively. Likewise, increased from 73 to 122 mmwhich indicated a significant deterioration in the resistance of the rubber to abrasion, and the modulus reduced by a factor of approximately 1.5 over a 300% increase in the strain amplitude. Dynamic properties of the nano
filled NR compounds
Although static mechanical properties have a great role in service life enough attention should be paid to dynamic properties. In fact, wearing of the tyre along with its performance are two sides of the same coin. shows tan δ versus temperature Hz frequency for compound 21.
8
SEM photograph showing the dispersion of the silica particles in the rubber.
Mixing time = 13 min
Effect of elemental sulfur on the
mechanical properties of the filled
The addition of elemental sulfur affected the rubber properties, although there was no overall advantage, as
improved and others with 3;
). The hardness increased from and T remained
57 kJ/m2. However the remaining properties were adversely affected. For example,
ed from 37 elongation at break from
and stored energy 137 to 109
, respectively. Likewise, ∆v mm3/mg,
which indicated a significant deterioration in the resistance of the
o abrasion, and the modulus reduced by a factor of approximately
increase in the strain
nanosilica
Although static mechanical properties have a great role in service life of tyre, enough attention should be paid to dynamic properties. In fact, wearing of
along with its performance are Figure 3
versus temperature at 1 2 in Table
Figure 3: Tan δ versus temperature for compound 2 in Table 1.
The regions were tan δcorrespond to ice-grip, wetrolling resistance of tyres are shown on the figure. From the viscoelastic property point of view [29], an ideal material, which is able to meet the requirement of a high-performance tyre should give low tan δ values at a temperature range of 50-80oC in order to reduce rolling resistance and save energy. The ideal material shouldhave high tan δ values or high hysteresis at lower temperatures for example less than -20oC in order to obtain high skid resistance and wet grip. However, the factors involved in skid resistance are recognized to be more complex than a single compound property. It is therefore evident that compound 2 satisfies all the requirements mentioned abovbe seen in Figure 3, at sufficiently low temperatures, i.e. less than the Tg of the rubber, the tan δ value is very low (here about 0.05). This is due to the fact that the viscosity of the rubber is so high and the free volume in the polymer is so small that the movement of the polymer chain segments and the adjustment of their relative positions can hardly take place in the time scale involved in these experiments. Therefore, this results in a low energy
versus temperature for
δ values -grip and
tyres are shown From the viscoelastic
], an ideal material, which is able to meet the
performance tyre values at a
C in order to reduce rolling resistance and save energy. The ideal material should also
values or high hysteresis at lower temperatures for
C in order to obtain high skid resistance and wet grip. However, the factors involved in skid resistance are recognized to be
than a single compound herefore evident that
satisfies all the requirements mentioned above. As can
, at sufficiently low temperatures, i.e. less than the Tg of
is very low This is due to the
fact that the viscosity of the rubber is so high and the free volume in the polymer is so small that the movement of the polymer chain segments and the adjustment of their relative positions
e place in the time scale involved in these experiments. Therefore, this results in a low energy
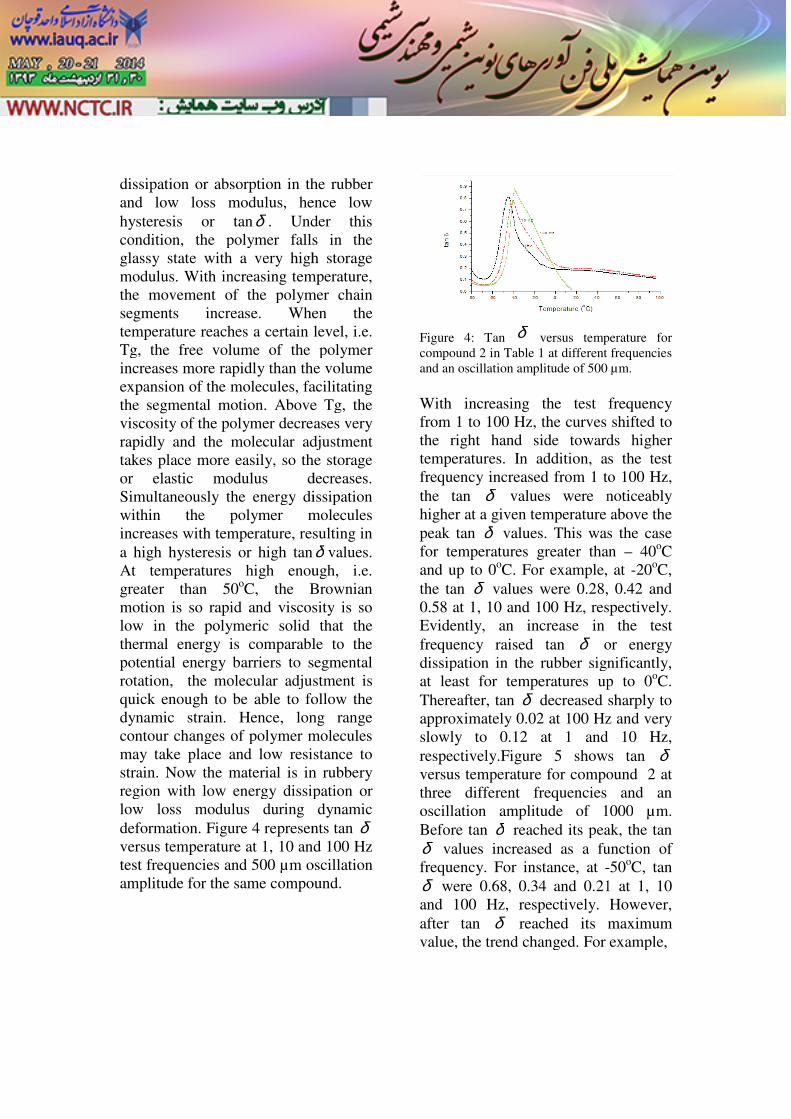
dissipation or absorption in the rubber and low loss modulus, hence low hysteresis or tanδ . Under this condition, the polymer falls in theglassy state with a very high storage modulus. With increasing temperature, the movement of the polymer chain segments increase. When the temperature reaches a certain level, i.e. Tg, the free volume of the polymer increases more rapidly than the volume expansion of the molecules, facilitating the segmental motion. Above Tg, the viscosity of the polymer decreases very rapidly and the molecular adjustment takes place more easily, so the storage or elastic modulus decreases. Simultaneously the energy dissipwithin the polymer molecules increases with temperature, resulting in a high hysteresis or high tanAt temperatures high enough, i.e. greater than 50oC, the Brownian motion is so rapid and viscosity is so low in the polymeric solid that the thermal energy is comparable to the potential energy barriers to segmental rotation, the molecular adjustment is quick enough to be able to follow the dynamic strain. Hence, long range contour changes of polymer molecules may take place and low resistance to strain. Now the material is in rubbery region with low energy dissipation or low loss modulus during dynamic deformation. Figure 4 representversus temperature at 1, 10 and test frequencies and 500 µm oscillation amplitude for the same compound.
9
dissipation or absorption in the rubber and low loss modulus, hence low
. Under this condition, the polymer falls in the glassy state with a very high storage
With increasing temperature, the movement of the polymer chain segments increase. When the temperature reaches a certain level, i.e. Tg, the free volume of the polymer increases more rapidly than the volume xpansion of the molecules, facilitating
Above Tg, the viscosity of the polymer decreases very rapidly and the molecular adjustment takes place more easily, so the storage or elastic modulus decreases. Simultaneously the energy dissipation within the polymer molecules increases with temperature, resulting in
δ values. At temperatures high enough, i.e.
C, the Brownian motion is so rapid and viscosity is so
meric solid that the thermal energy is comparable to the potential energy barriers to segmental rotation, the molecular adjustment is quick enough to be able to follow the dynamic strain. Hence, long range contour changes of polymer molecules
ce and low resistance to strain. Now the material is in rubbery region with low energy dissipation or low loss modulus during dynamic
represents tan δ and 100 Hz
µm oscillation litude for the same compound.
Figure 4: Tan δ versus temperature for compound 2 in Table 1 at different frequencies and an oscillation amplitude of 500 µm
With increasing the test frequency from 1 to 100 Hz, the curves shifted to the right hand side towards higher temperatures. In addition, as the frequency increased from 1 to the tan δ values were noticeably higher at a given temperature above the peak tan δ values. This was the case for temperatures greater than and up to 0oC. For example, at the tan δ values were 0.28, 0.58 at 1, 10 and 100 Hz, respectivelyEvidently, an increase in the test frequency raised tan δ or energy dissipation in the rubber significantly, at least for temperatures up to Thereafter, tan δ decreased sharply to approximately 0.02 at 100 Hz and very slowly to 0.12 at 1 and respectively.Figure 5 shows tan versus temperature for compound three different frequencies and an oscillation amplitude of 1000Before tan δ reached its peak, the tan δ values increased as a function of frequency. For instance, at -δ were 0.68, 0.34 and 0.21and 100 Hz, respectively. after tan δ reached its maximum value, the trend changed. For example,
versus temperature for at different frequencies
µm.
With increasing the test frequency the curves shifted to
the right hand side towards higher temperatures. In addition, as the test
to 100 Hz, values were noticeably
higher at a given temperature above the values. This was the case
for temperatures greater than – 40oC le, at -20oC,
, 0.42 and respectively.
Evidently, an increase in the test or energy
dissipation in the rubber significantly, at least for temperatures up to 0oC.
decreased sharply to Hz and very
and 10 Hz, shows tan δ
rsus temperature for compound 2 at three different frequencies and an
1000 µm. reached its peak, the tan
values increased as a function of -50oC, tan
0.21 at 1, 10 . However,
reached its maximum value, the trend changed. For example,

Figure 5: Tanδ versus temperature for compound 2 in Table 1 at different frequencies at an oscillation amplitude of 1000 µm
at -30oC tan δ were 0.58, 0.760.79 as the test frequency was increased from 1 to 100respectively. It was also noted that at about -8 oC tan δ at 100 Hz continued decreasing sharply to 0. At 1Hz, tan δ reduced at a slower rate to 0.14 and 0.19, respectively as the temperature reached 100oC. The peak tan δ values as a function of test frequency for 500 and 1000oscillation amplitudes are summarised in Table 3.
Table 3- Peak tanδ values as a function of test frequency. Data taken from Figures 5.
Test frequency
1 Hz 10 Hz
At 500 µm oscillation amplitude
Peak tan δ value
0.85 0.76
At 1000 µm oscillation amplitude
Peak tan δ value
0.82 0.82
At 500 µm oscillation amplitudeproperty was frequency dependent and decreased from 0.85 to 0.76frequency was increased from Hz, and then rose to 0.87 at 1001000 µm oscillation amplitude
10
temperature for
at different frequencies µm.
0.76, and as the test frequency was
100 Hz, respectively. It was also noted that at
Hz continued 1 and 10
at a slower rate to respectively as the
C. The peak values as a function of test
1000 µm des are summarised
values as a function of Data taken from Figures 4 and
100 Hz
0.87
0.86
µm oscillation amplitude, this property was frequency dependent and
0.76 as the frequency was increased from 1 to 10
100 Hz. At µm oscillation amplitude, this
property was unchanged with test frequency and was at 0.82, increased to 0.86 when the frequency was increased to 100 Hz. It seemed that increasing the test frequency and oscillation amplitude in some cases raises tan δ or energy dissipation in the rubber as a function of temperature. For example, at 500 µm, the peak tan δ value increased from 0.85when the test frequency was raised from 1 to 100 Hz. It was also noted that the results at 10 Hz did not follow the trend. Similarly, when the oscillation amplitude was increased from 500 to 1000 µm, the peak tan value reduced from 0.85 to Hz, and from 0.87 to 0.86 at The result at 10 Hz followed an opposite trend, and it increased from 0.76 to 0.82.This is explained in terms of filler-filler and polymernetwork break down and re-formation, which causes heat dissipation in the rubber. It means that as the test frequency and oscillation amplitude increase, the filler-polymer network breaks down and reforms more rapidly, and consequently more energy is dissipated in the rubber, giving rise to higher tan δ values. However, the exact reason for the unusual trend at Hz is not immediately clear. that at sufficiently low temperatures for example at -50oC, the tan at 1 Hz and oscillation amplitudes of 500 and 1000 µm were 0.65 and respectively. At 10 Hz, these values were almost the same at 0.34-at 100 Hz, they were 0.17 and respectively. At the same temperature above approximately -30oC, the tan values were higher at higher frequencies and oscillation amplitudes. Clearly, the oscillation amplitude has a major effect on these measurements.
property was unchanged with test , and then
when the frequency It seemed
that increasing the test frequency and oscillation amplitude in some cases
or energy dissipation in a function of temperature.
the peak tan 0.85 to 0.87
when the test frequency was raised It was also noted Hz did not follow
the trend. Similarly, when the oscillation amplitude was increased
the peak tan δ to 0.82 at 1
at 100 Hz. Hz followed an
opposite trend, and it increased from This is explained in terms
filler and polymer-filler formation,
which causes heat dissipation in the rubber. It means that as the test frequency and oscillation amplitude
polymer network breaks down and reforms more rapidly, and consequently more energy is
giving rise to values. However, the
exact reason for the unusual trend at 10 Note also
that at sufficiently low temperatures
δ values and oscillation amplitudes of
and 0.69, these values
-0.35, and and 0.22,
respectively. At the same temperature C, the tan δ
values were higher at higher frequencies and oscillation amplitudes. Clearly, the oscillation amplitude has a major effect on these measurements.

This will be investigated further. When the tanδ increments (were measured at the same oscillation amplitude and at different frequencies, for example at 500 µm and at 100 Hz, at high temperatures10oC, they were 0.09 and 0.17low temperatures, e.g. -50oC, 0.46, respectively, which showed larger ∆tanδ increases in the latter case. This is because at sufficiently low temperatures, in addition to heat dissipation produced by filler-filler-polymer networks break down and reformation, polymer in situ, also has an important role in the processes causing heat dissipation. This can be further confirmed when we examine the tan δ results at 1Hz and an increasing oscillation amplitudes. Figure 6 represents tan δtemperature at 1 Hz and 15, and 1000 µm oscillation amplitudes for compound 2 in Table1.
Figure 6: Tan δ versus temperature at and 15, 256, 500 and 1000 µm oscillation amplitudes. Data for compound 2 in Table
It is clear that at higher temperatures, i.e. approximately above -50oC, tan increases as a function of the oscillation amplitude a lot more significantly than it does at lower temperatures, i.e. below -50
11
This will be investigated further. increments (∆tanδ )
were measured at the same oscillation amplitude and at different frequencies,
µm and at 1, 10 and at high temperatures, e.g. -
0.17, and at , 0.13 and
respectively, which showed increases in the latter
case. This is because at sufficiently low temperatures, in addition to heat
-filler and polymer networks break down
lymer in situ, also has an important role in the processes causing heat dissipation. This can be further confirmed when we examine
Hz and an increasing oscillation amplitudes.
δ versus , 256, 500
lation amplitudes for
versus temperature at 1 Hz µm oscillation
in Table 1.
It is clear that at higher temperatures, C, tan δ
increases as a function of the on amplitude a lot more
significantly than it does at lower 50oC. This
confirms our previous findings namely that the oscillation amplitude as well as the test frequency affect the tan values. Figure 7 represents tan versus oscillation amplitude at and at -50, -35, -20, 0, 25, 4585oC for compound 2 in Table evident that the rate of increase of tan δ as a function of the oscillation amplitude depends on temperature. At
Figure 7 - Tan δ versus oscillation amplitude at 1 Hz at different temperatures for compound 2 in Table 1.
low temperatures, i.e. 0 - -50o
increases at a faster rate. The lowest rate of increase occurs at 65 and At high temperatures the polymer matrix is too rubbery to resist imposed strains. Indeed, polymer chains move in the same direction of the applied strain with the least resistaconsequently the heat dissipation in the rubber will be minimum. Hence, increasing the oscillation amplitude has little or no effect on the tanmeasurements. Figure 8 represents loss modulus, G '' as a function of the oscillation amplitude at 1 Hz and 35, -20, 0, 25, 45, 65 and temperatures for compound 21.
confirms our previous findings namely that the oscillation amplitude as well as the test frequency affect the tan δ
represents tan δ versus oscillation amplitude at 1 Hz
45, 65 and in Table 1. It is
evident that the rate of increase of tan as a function of the oscillation
tude depends on temperature. At
versus oscillation amplitude Hz at different temperatures for compound
oC, tan δ increases at a faster rate. The lowest
and 85oC. At high temperatures the polymer matrix is too rubbery to resist imposed strains. Indeed, polymer chains move in the same direction of the applied strain with the least resistance and consequently the heat dissipation in the rubber will be minimum. Hence, increasing the oscillation amplitude has little or no effect on the tan δ
represents loss as a function of the
Hz and -50, - and 85oC
2 in Table

Figure 8 - Loss modulus versus oscillation amplitude for compound 2 in Table and different temperatures.
As it is evident, the loss modulus of the rubber reaches a maximum value at 500 µm oscillation amplitude irrespective of the temperature value. The loss modulus has the highest values at -35oC, reaching a peak and then dropping to lower values. This trend was also present at -20oC. As the temperature increases to 85oC, the loss modulus decreases progressively. Note also that the lowest values were recorded at 85oC. This bahaviour confirms that at high temperatures heat dissipation is minimum because of the rubbery state of the material. shows storage modulus, G '
oscillation amplitude at 1 Hz and 35, -20, 0, 25, 45, 65 and temperatures for compound 2 1.
12
Loss modulus versus oscillation
in Table 1 at 1 Hz
it is evident, the loss modulus of the rubber reaches a maximum value at
µm oscillation amplitude irrespective of the temperature value. The loss modulus has the highest
C, reaching a peak and then dropping to lower values. This
C. As the C, the loss
modulus decreases progressively. Note also that the lowest values were
This bahaviour confirms that at high temperatures heat dissipation is minimum because of the
Figure 9 ' , versus
Hz and -50, - and 85oC
in Table
Figure 9 - Storage modulus versus oscillation amplitude of compound 2 in Table frequency and different temperatures.
It is interesting that the storage modulus decreases as the oscillation amplitude reaches 256 µm and thenincreases when the oscillation amplitude reaches 500 µm. Thereafit continues decreasing at different rates depending on the temperature value. For example, the largest decrease is recorded at -35oC and the smallest at 45-65oC. The only exception is at 65 and 85oC, where the storage modulus keeps increasing until the oscillation amplitude reaches µm. Clearly, both temperature and oscillation amplitude have a large effect on the storage modulus. 10 and 11 represent loss and storage modulus (G '' and G ' ) versus temperature at 1, 10 and 100500 µm oscillation amplitude for compound 2 in Table 1.
Storage modulus versus oscillation in Table 1 at 1 Hz
frequency and different temperatures.
It is interesting that the storage modulus decreases as the oscillation
µm and then, it increases when the oscillation
Thereafter, it continues decreasing at different rates depending on the temperature value. For example, the largest
C and the C. The only
C, where the storage modulus keeps increasing until
ion amplitude reaches 500 Clearly, both temperature and
oscillation amplitude have a large effect on the storage modulus. Figures
represent loss and storage ) versus
100 Hz and llation amplitude for

Figure 10 - Loss modulus versus temperature at different test frequencies. Data for compound 2 in Table1 and oscillation amplitude of 500 µm.
Figure 11 - Storage modulus versus temperature at different test frequencies and oscillation amplitude of 500 µm. compound 2 in Table 1.
Increases in test frequency shifts the storage and loss modulus to the right hand side or higher temperatures. The loss modulus decreases first as temperature increases to about and then it rises sharply, reaching a peak at approximately -55 to Thereafter, it drops to a much lower value at temperatures above where temperature differences no longer affect it. Note that the peak values of the loss modulus were test frequency and temperature dependent and the lowest and highest values were at 1 and 100 Hz, respectivelydifferent way, storage modulus rises up to reach to a peak at -65 oC and then drops sharply for all studied frequencies. Figure 12 shows a function of temperature for compounds 1, 2 and 3 at 1 Hz and an oscillation amplitude of 256Compound 1 being the control compound(Table-1).
13
Loss modulus versus temperature at different test frequencies. Data for
and oscillation
Storage modulus versus temperature at different test frequencies and
. Data for
Increases in test frequency shifts the storage and loss modulus to the right hand side or higher temperatures. The
odulus decreases first as temperature increases to about -70oC and then it rises sharply, reaching a
to -40oC. Thereafter, it drops to a much lower value at temperatures above -20oC where temperature differences no
t. Note that the peak values of the loss modulus were test frequency and temperature dependent and the lowest and highest values were
respectively. In different way, storage modulus rises up
C and then ply for all studied
tan δ as n of temperature for
Hz and an 256 µm.
the control
Figures 12: Tanδ versus temperature for compounds 1(control compound), 2Hz and an oscillation amplitude of 256
As it is clear from this figure, compound 1 has the largest peak tan value followed by compound also noted that the compounds have the same tan δ values at about -these values decrease slowly as the temperature was raised to 100this temperature range, compound has the lowest tan δ values.Compound 3 had extra crosslinks by the addition of elemental sulphur, whereas, compound 2 was cured primarily by the tetrasulphane groups of TESPT. Hence, the polymer chains were less mobile in compound 3 affected the tan δ of the compound at temperatures below and above At low temperatures up to Tg, the bulk of polymer (polymer in situ) is the dominant factor in its dynamic bahaviour and responsible for most of the energy dissipation processes. When polymer is replaced with solid filler in compounds 2 and 3, at low temperatures, the low energy dissipation is due to the polymer chains trapped in the polymerand filler-filler networks. In fact, trapped rubber at low temperature acts as a rigid glass substance and therefore is not rubbery, and the individual solid filler particles in the filler
versus temperature for
2 and 3 at 1 256 µm.
ear from this figure, has the largest peak tan δ
value followed by compound 2.It is also noted that the compounds have the
-20oC and these values decrease slowly as the
100oC. Over compound 1
Compound had extra crosslinks by the addition
tal sulphur, whereas, was cured primarily by
the tetrasulphane groups of TESPT. s were less and this
of the compound at temperatures below and above -20oC. At low temperatures up to Tg, the bulk of polymer (polymer in situ) is the dominant factor in its dynamic bahaviour and responsible for most of the energy dissipation processes. When
with solid filler in , at low
temperatures, the low energy dissipation is due to the polymer chains trapped in the polymer-filler
filler networks. In fact, trapped rubber at low temperature acts
ce and therefore is not rubbery, and the individual solid filler particles in the filler-filler

14
network in the polymer matrix do not absorb energy significantly. In contrast, at high temperatures the polymer-filler and filler-filler networks have significant effect on the energy dissipation processes in the rubber. There are two mechanisms involved in the filler-filler network behaviour as discussed by Wolff and Wang [30]. They named it ‘direct contact mode’ and ‘joint shell mechanism’ or ‘junction rubber mechanism’. In most cases, both of these mechanisms are responsible for the filler-filler network dynamic behaviour. In direct contact mode, the break down and reformation of the filler network dissipate energy and consequently increase tanδ . For joint shell mechanism, at high temperatures the polymer matrix is in the rubbery state but the polymer in the rubber shell is in it’s transition zone caused by the adsorption of the polymer molecules on the filler surfaces or the interaction between the polymer chains and filler. In this case, the joint shell rubber would absorb more energy, resulting in higher hysteresis or tanδ due to an increase in energy dissipation in the rubber shell as well as in polymer matrix. CONCLUSIONS
From this study, it can be concluded that 1) The addition of elemental sulfur to the filled NR rubber with 6 phr TBBS and 0.3 phr zinc oxide increased the ∆torque value, which indicated benefit for the crosslink density of the rubber. However, there was no overall advantage for the mechanical properties as some properties improved and others deteriorated. 2)The hardness, tensile strength, elongation at break, stored energy
density at break, T, abrasion resistance, and modulus of the rubber vulcanizates increased substantially when the filler was added. The improvement in the mechanical properties of the rubbers was mainly due to high level of rubber-filler adhesion and high crosslink density that was produced by the chemical bonding between the rubber and TESPT. The bound rubber measurements also confirmed a strong rubber-filler adhesion. 3) The dynamic properties of all the compounds were affected by the addition of silanized silica nanofiller. This fact was more evident when the glass transition temperatures of the gum (unfilled) NR with value −64oC was compared with that of the filled rubber, which was −45oC. 4) The superior mechanical and dynamical properties of filled rubbers make them a potential use in aircraft and heavy vehicles tyre rubber compounds. ACKNOWLEDGEMNT
The authors thank Loughborough Materials Characterisation Centre for performing the SEM of the samples. They also thank Degussa, Ltd., of Germany for supplying the filler and providing technical information on their product. The abrasion tests were carried out at COOPER TIRES, Ltd. (United Kingdom). REFERENCES 1. Hoffman, W. Rubber Technology Handbook; Carl Hanser Verlag, Munich, Germany, 1989. 2. Warrick, E. L.; Pierce, O. R.; Polmanteer, K. E.; Saam, J. C. Rubber
Chem
Technol 1979, 52, 437. 3. Hair, M. L.; Hertl, W. J Phys Chem 1970, 74, 91.

15
4. Hockley, J. A.; Pethica, B. A. Trans Faraday Soc 1961, 57, 2247. 5. Wolff, S.; GÖrl, U.; Wang, M. J.; Wolff, W., Eur Rubber J 1994, 16, 16. 6. Wolff, S. Rubber Chem Technol 1996, 69, 325. 7. Tan, E. H.; Wolff, S.; Haddeman, S. M.; Gretwatta, H. P.; Wang, M. J, Rubber
Chem Technol 1993, 66, 594. 8 . Dannenberg, E. M. , Rubber Chem
Technol 1975, 48, 410. 9. Thongsang, S.; Sombatsompop, N., Polymer Composites, 2006, 27, 30. 10. Parker, D. D.; KOENIC, J. L., J Adhes 2000, 73, 299. 11. Ansarifar, A.; Nijhawan, R.; Nanapoolsin, T.; Song, M., Rubber Chem
Technol 2003, 76, 1290. 12. Ansarifar, A.; Azhar, A.; Song, M., J
Rubber Res 2003, 6, 129. 13. Fries, H.; Pandit, R. R. Rubber Chem
Technol 1982, 55, 309. 14. Cochet, P.; Barruel, P.; Barriquand, L.; Grobert, Y.; Bomal, Y.; PRat, E.; Rhone Poulenc, E., Rubber World 1994, 219, 20. 15. British Standards Institution, Methods of testing raw rubber and unvulcanized compounded rubber: Methods of physical testing. British Standard 1673: Part 3; London, UK, 1969. 16.British Standards Institution, Methods of test for raw rubber and unvulcanized compounded rubber: Measurement of pre-vulcanizing and curing characteristics by means of curemeter. British Standard 1673: Part 10; London, UK, 1977. 17. British Standards Institution, Methods of test for raw rubber and unvlucanized compounded rubber: Measurement of pre-vulcanizing and curing characteristics by means of curementer. British Standard 903: Part A60: Section 60.1; London, UK, 1996. 18. Wolff, S.; Wang, M.; Tan, E. H., Rubber Chem Technol 1993, 66, 163. 19. Hamed, G. R.; Rattanasom, N., Rubber Chem Technol 2002, 75, 323.
20. British Standards Institution, Physical testing of rubber: Method for determination of hardness. British Standard 903: Part A26; London, UK, 1995. 21. British Standards Institution, Physical testing of rubber: Method for determination of tear strength trousers, angle and crescent test pieces. British Standard 903: Part A3; London, UK, 1995. 22. Greensmith, H. V.; Thomas, A. G., J
Polym Sci 1955, 43, 189. 23. British Standards Institution, Physical testing of rubber: Method for determination of tensile stress strain properties. British Standard 903: Part A2; London, UK, 1995. 24. British Standards Institution, Method of testing vulcanized rubber. Determination of resistance to abrasion. British Standard 903: Part A9: Method A:1; London, UK, 1995. 25. Polmanteer, K. E. Lentz, C. W. Rubber Chem Technol 1975, 48, 795. 26. Harmon, D. J.; Jacobs, H. L., J Appl
Polym Sci 1966, 10, 253. 27. Pike, M.; Watson, W. F., J Polym Sci 1952, 9, 229. 28. Ahagon, A. Rubber Chem Technol 1996, 69, 742. 29. Wang M J, Rubber
Chem.Technol.1998, 71,521. 30. Wolff S , Wang M J., Rubber Chem.
Technol.1992, 65,329.

16

17

18