Embed Size (px)
Citation preview
Part fourStatistical informationon narcotic drugs
Quatrième partieRenseignements statistiquessur les stupéfiants
Cuarta parteInformación estadísticasobre estupefacientes
122
Notes:
Part four presents the statistical information on narcotic drugs furnished to the Board by countries and territories. It is entitled “Tables of reported statistics”.
This part shows the actual movement of narcotic drugs and poppy straw, as applicable, for the five-year period 2007-2011, except in the following tables: table XIV.1, containing the data on levels of consumption of narcotic drugs, and table XIV.3, containing the data on global consumption of opioids, which refers to the 20-year period 1992-2011. Explanatory notes for each of the statistical tables are on pages 123-126 below.
Notes:
La quatrième partie présente les renseignements statistiques sur les stupéfiants communiqués à l’Organe par les pays et territoires. Elle est intitulée “Tableaux des statistiques communiquées”.
Cette partie montre le mouvement effectif de stupéfiants et de paille de pavot, selon qu’il conviendra, pour la période de cinq ans
allant de 2007 à 2011, à l’exception du tableau XIV.1 (données rela-tives aux niveaux de consommation de stupéfiants); du tableau XIV.3 (données relatives à la consommation mondiale d’opioïdes), qui concerne la période de vingt ans qui va de 1992 à 2011. Des notes explicatives sur chaque tableau statistique figurent aux pages 127 à 130 ci-après.
Notas:
En la cuarta parte se presenta la información estadística relativa a los estupefacientes que los países y territorios han suministrado a la Junta. Está titulada “Cuadros de las estadísticas comunicadas”.
La parte muestra el movimiento efectivo de los estupefacientes y la paja de adormidera, según corresponda, durante el quinquenio 2007-2011, con excepción de los datos sobre los niveles de consumo de estupefacientes (cuadro XIV.1) y los datos sobre el consumo mun-dial de opioides, que se refieren al período veinteñal 1992-2011 (cuadro XIV.3). En las páginas 130 a 134 infra se encontrarán notas explicativas que se refieren específicamente a cada uno de los cuadros estadísticos.
123
Notes:
For general remarks on the tables of reported statistics presented below, including an explanation of the signs used in the tables, see the section entitled “Remarks on the statistical tables” in part one of the present publication.
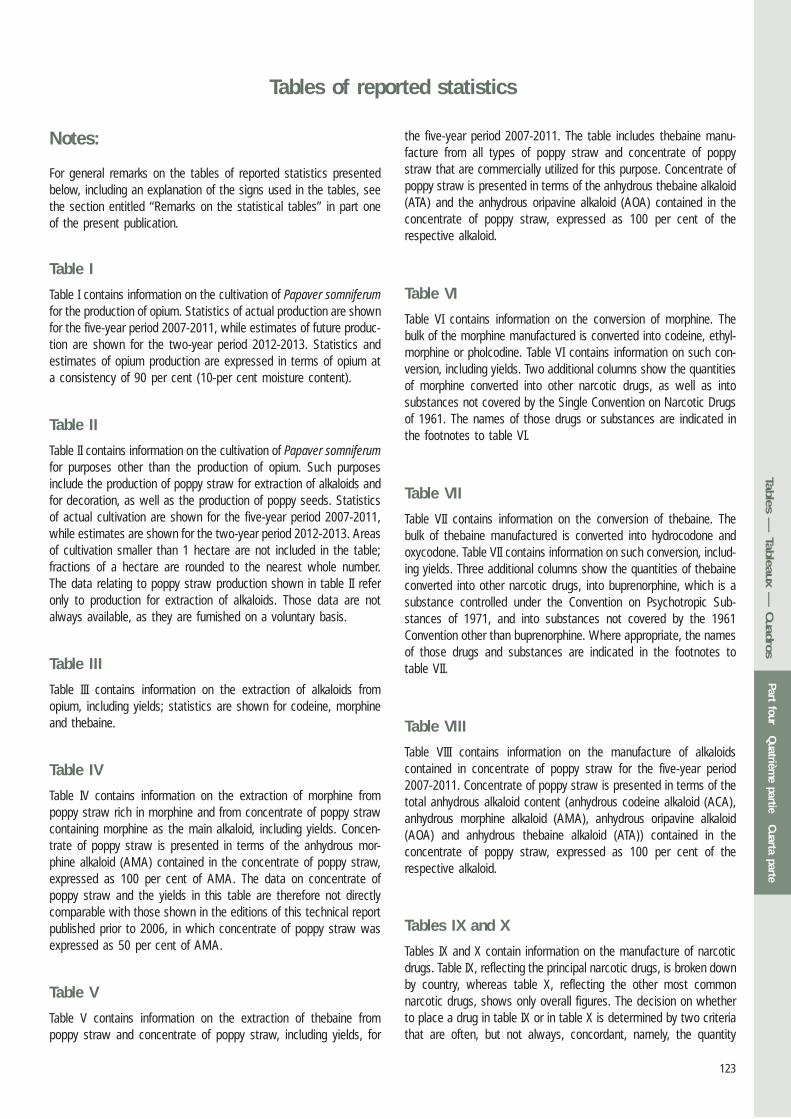
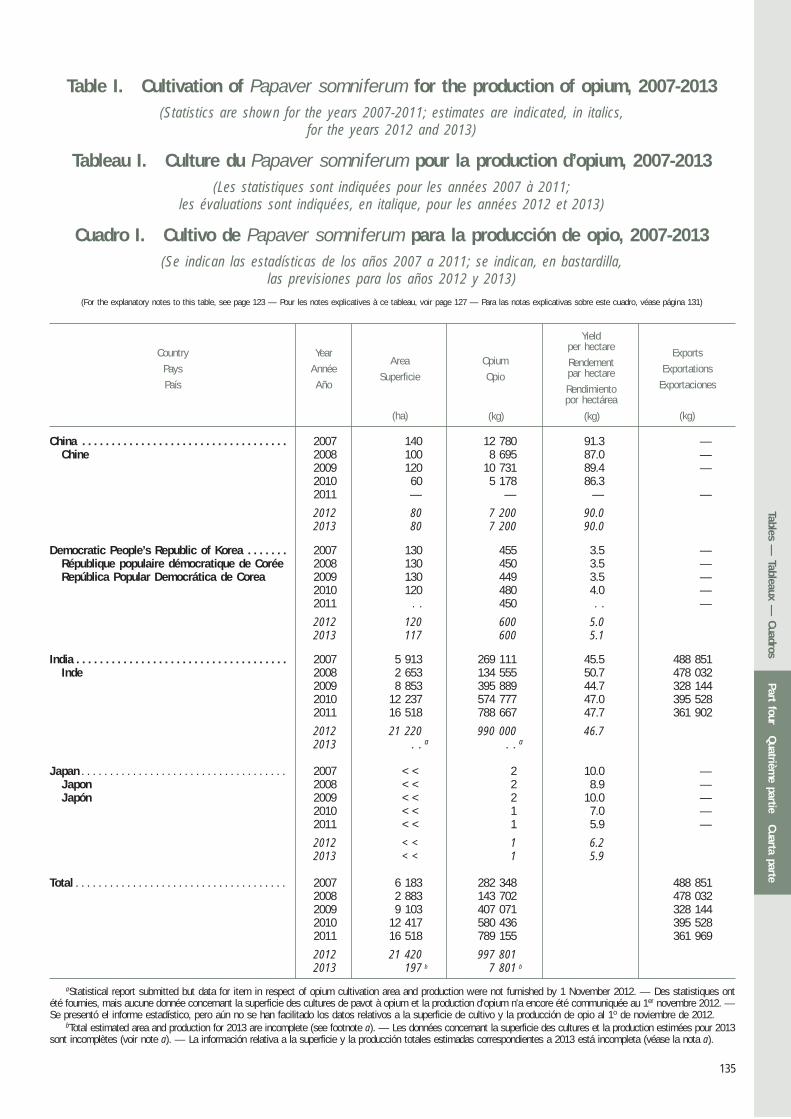
Table I
Table I contains information on the cultivation of Papaver somniferum for the production of opium. Statistics of actual production are shown for the five-year period 2007-2011, while estimates of future produc-tion are shown for the two-year period 2012-2013. Statistics and estimates of opium production are expressed in terms of opium at a consistency of 90 per cent (10-per cent moisture content).
Table II
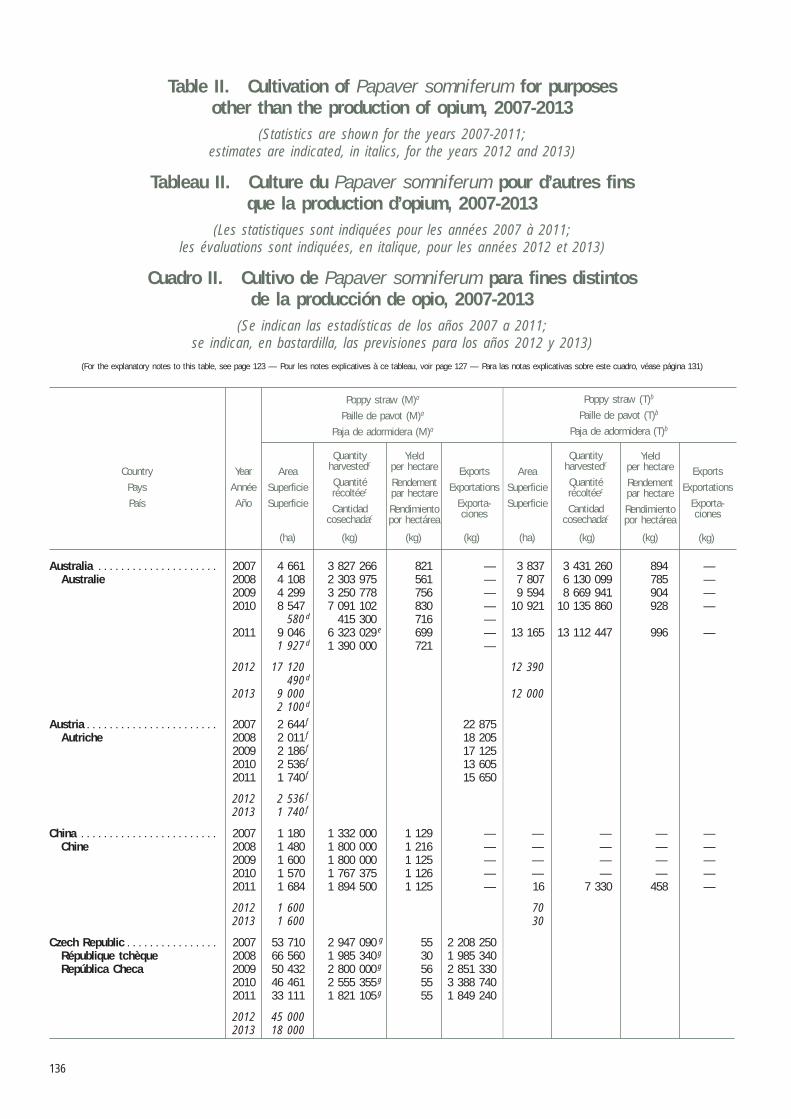
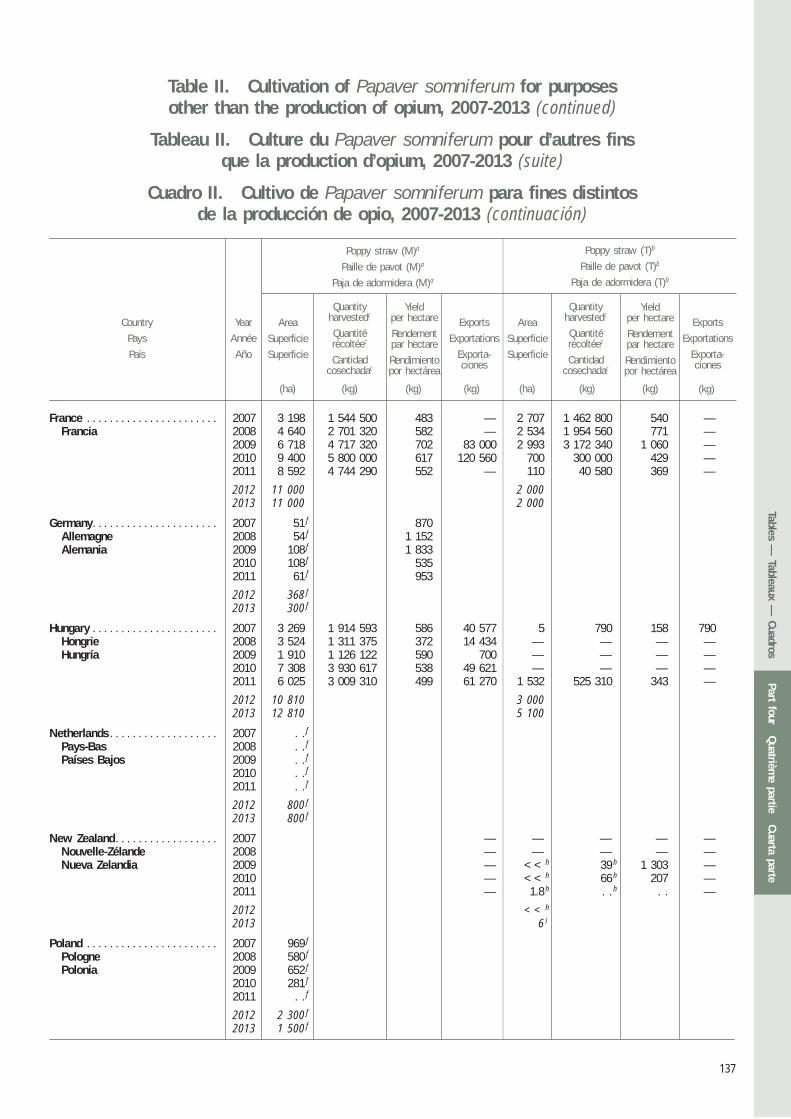
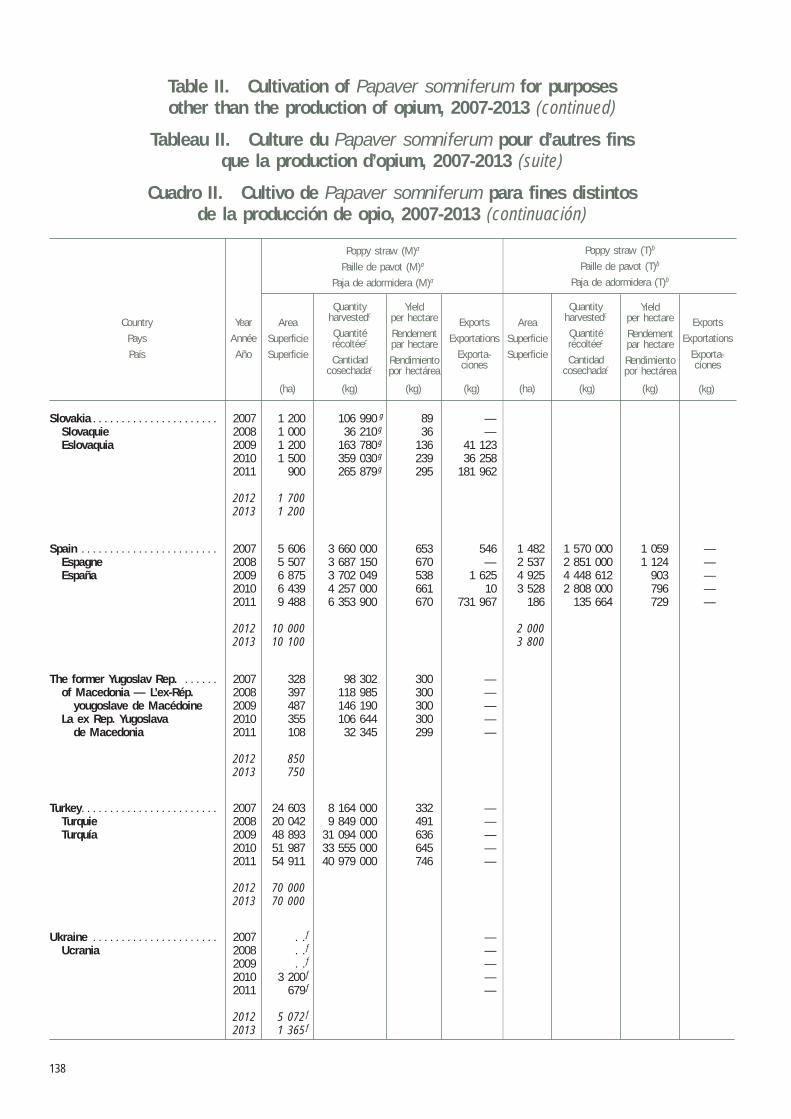
Table II contains information on the cultivation of Papaver somniferum for purposes other than the production of opium. Such purposes include the production of poppy straw for extraction of alkaloids and for decoration, as well as the production of poppy seeds. Statistics of actual cultivation are shown for the five-year period 2007-2011, while estimates are shown for the two-year period 2012-2013. Areas of cultivation smaller than 1 hectare are not included in the table; fractions of a hectare are rounded to the nearest whole number. The data relating to poppy straw production shown in table II refer only to production for extraction of alkaloids. Those data are not always available, as they are furnished on a voluntary basis.
Table III
Table III contains information on the extraction of alkaloids from opium, including yields; statistics are shown for codeine, morphine and thebaine.
Table IV
Table IV contains information on the extraction of morphine from poppy straw rich in morphine and from concentrate of poppy straw containing morphine as the main alkaloid, including yields. Concen-trate of poppy straw is presented in terms of the anhydrous mor-phine alkaloid (AMA) contained in the concentrate of poppy straw, expressed as 100 per cent of AMA. The data on concentrate of poppy straw and the yields in this table are therefore not directly comparable with those shown in the editions of this technical report published prior to 2006, in which concentrate of poppy straw was expressed as 50 per cent of AMA.
Table V
Table V contains information on the extraction of thebaine from poppy straw and concentrate of poppy straw, including yields, for
Tables of reported statistics
the five-year period 2007-2011. The table includes thebaine manu-facture from all types of poppy straw and concentrate of poppy straw that are commercially utilized for this purpose. Concentrate of poppy straw is presented in terms of the anhydrous thebaine alkaloid (ATA) and the anhydrous oripavine alkaloid (AOA) contained in the concentrate of poppy straw, expressed as 100 per cent of the respective alkaloid.
Table VI
Table VI contains information on the conversion of morphine. The bulk of the morphine manufactured is converted into codeine, ethyl-morphine or pholcodine. Table VI contains information on such con-version, including yields. Two additional columns show the quantities of morphine converted into other narcotic drugs, as well as into substances not covered by the Single Convention on Narcotic Drugs of 1961. The names of those drugs or substances are indicated in the footnotes to table VI.
Table VII
Table VII contains information on the conversion of thebaine. The bulk of thebaine manufactured is converted into hydrocodone and oxycodone. Table VII contains information on such conversion, includ-ing yields. Three additional columns show the quantities of thebaine converted into other narcotic drugs, into buprenorphine, which is a substance controlled under the Convention on Psychotropic Sub-stances of 1971, and into substances not covered by the 1961 Convention other than buprenorphine. Where appropriate, the names of those drugs and substances are indicated in the footnotes to table VII.
Table VIII
Table VIII contains information on the manufacture of alkaloids contained in concentrate of poppy straw for the five-year period 2007-2011. Concentrate of poppy straw is presented in terms of the total anhydrous alkaloid content (anhydrous codeine alkaloid (ACA), anhydrous morphine alkaloid (AMA), anhydrous oripavine alkaloid (AOA) and anhydrous thebaine alkaloid (ATA)) contained in the concentrate of poppy straw, expressed as 100 per cent of the respective alkaloid.
Tables IX and X
Tables IX and X contain information on the manufacture of narcotic drugs. Table IX, reflecting the principal narcotic drugs, is broken down by country, whereas table X, reflecting the other most common narcotic drugs, shows only overall figures. The decision on whether to place a drug in table IX or in table X is determined by two criteria that are often, but not always, concordant, namely, the quantity
Part fourQuatrièm
e partieCuarta parte
Tables — Tableau
x —
Cuadro
s
124
manufactured and the number of manufacturing countries. Accord-ingly, narcotic drugs manufactured in large quantities by several countries appear in table IX.
Also included in table IX is information on the manufacture of buprenorphine, an opiate currently included in Schedule III of the 1971 Convention. Pursuant to the provisions of article 16 of that Convention, the parties have an obligation to report to the Inter-national Narcotics Control Board on quantities of buprenorphine manufactured, as well as on total quantities exported and imported. The statistics on exports and imports of buprenorphine can be found in the technical report of the Board on psychotropic substances: Psychotropic Substances: Statistics for 2011, Assessments of Annual Medical and Scientific Requirements for Substances in Schedules II, III and IV of the Convention on Psychotropic Substances of 1971 (United Nations publication, Sales No. T.13.XI.3).
Table XI
Table XI contains information relating to the production, utilization, import and export of coca leaf and to the manufacture of cocaine. The table also includes information on the amounts of cocaine obtained through purification of seized materials.
Tables XII and XIII.1-XIII.3
Tables XII and XIII.1-XIII.3 contain information on the consumption of narcotic drugs in quantities equal to or exceeding 1 kg in one of the given years. Table XII, reflecting the consumption of the principal narcotic drugs, is broken down by country. Buprenorphine consump-tion data are displayed in that table. Buprenorphine is an opiate currently included in Schedule III of the 1971 Convention, covering substances for which Governments have no obligation to report statistics on consumption to INCB. The data for buprenorphine pub-lished in table XII are calculated by INCB using statistical information on manufacture, import, export and, when available, stocks of buprenorphine furnished by Governments. Conclusions on actual con-sumption of buprenorphine should therefore be drawn with caution. Owing to an ongoing follow-up process launched by INCB to clarify data inconsistencies with Governments, figures published for the consumption of buprenorphine for a given year may change from one edition of this annual technical report to the next as information is revised. Table XIII.1, reflecting synthetic opioids that are consumed in quantities measurable in milligrams, such as fentanyl and its ana-logues, and that are administered in very small doses (for example, 0.005-0.1 mg in injectable form) owing to their high potency, is also broken down by country, whereas tables XIII.2 and XIII.3, presenting other opium derivates and synthetic opioids, respectively, show only global totals.
Data for consumption presented in tables XII, XIII.2 and XIII.3 include the quantities of narcotic drugs reported by Governments as utilized in a country or territory for the manufacture of the prepara-tions listed in Schedule III of the 1961 Convention. It should be noted, however, that some preparations in Schedule III may have been exported from the country or territory of their manufacture and consumed in another country or territory. The Board has no
information on the actual consumption of those preparations in indi-vidual countries or territories, since Governments have no obligation to report on their export and import of preparations in Schedule III and should not include data on consumption of preparations in Schedule III in their estimates and statistics regarding consumption. The estimates and statistics for preparations included in Schedule III should be limited to the quantities used for their manufacture. Therefore, data presented in tables XII, XIII.2 and XIII.3, which refer to narcotic drugs that are used for the manufacture of preparations in Schedule III, should be considered with great care when compar-ing consumption levels of narcotic drugs. The information contained in table XIV may be more appropriate for such comparisons.
The drugs for which preparations in Schedule III exist are:
Acetyldihydrocodeine Dihydrocodeine NicodicodineCocaine Diphenoxylate NorcodeineCodeine Ethylmorphine OpiumDextropropoxyphene Morphine PholcodineDifenoxin Nicocodine Propiram
For a precise definition of these preparations, see the “List of narcoticdrugs under international control” (“Yellow List”), which is published annually by the Board.
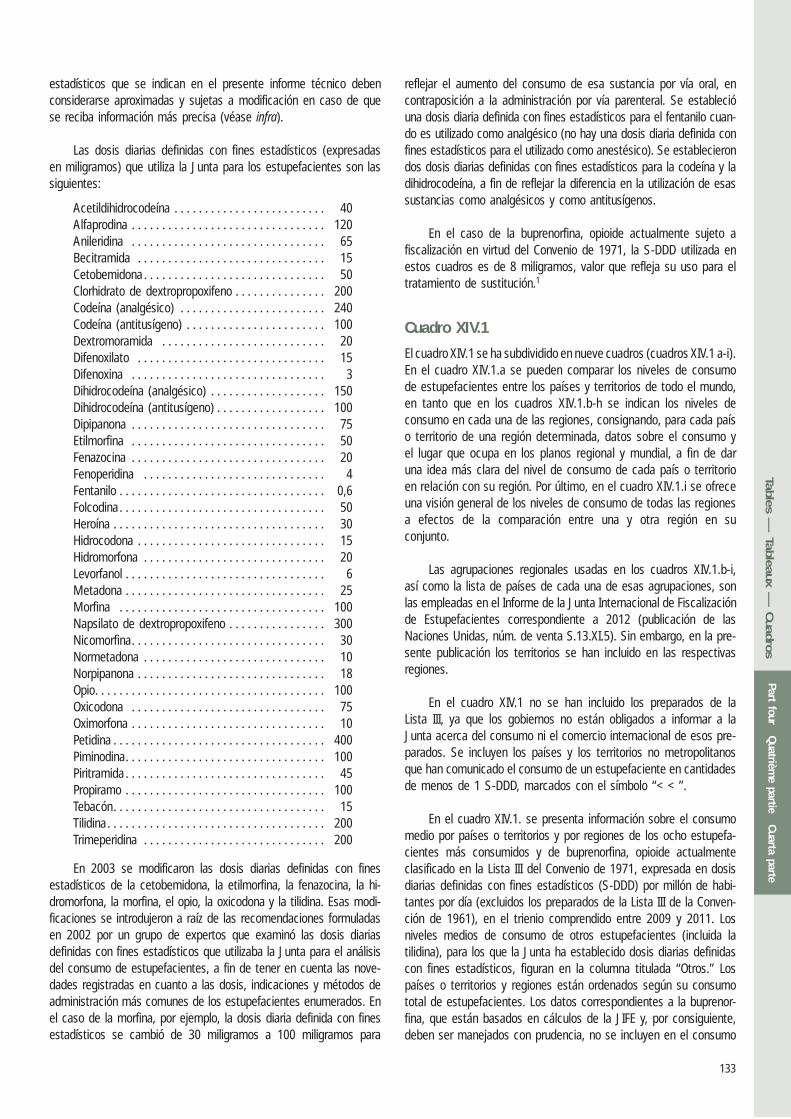
Tables XIV.1.a-i, XIV.2 and XIV.3.Tables XIV.1 and XIV.2 changed significantly in the 2003 edition of this technical report. Thus, direct comparison with the data published in the editions prior to 2003 is not possible. Table XIV.3 was intro-duced for the first time in the 2007 edition. Tables XIV.1, XIV.2 and XIV.3 provide information on levels of consumption of narcotic drugs using the concept of defined daily doses for statistical purposes. The term “defined daily doses for statistical purposes” (S-DDD) replaced the term “defined daily doses” (DDD), which had previously been used by the Board in its publications. The defined daily doses for statistical purposes are technical units of measurement for the pur-pose of statistical analysis and are not recommended prescription doses. Their definitions are not free of a certain degree of arbitrari-ness. Certain narcotic drugs may be used in certain countries for different treatments or in accordance with different medical practices and, therefore, a different daily dose could be more appropriate. The defined daily doses for statistical purposes indicated should be considered approximate and subject to modification if more precise information becomes available (see below).
The defined daily doses for statistical purposes used by the Board for narcotic drugs (in milligrams) are as follows:
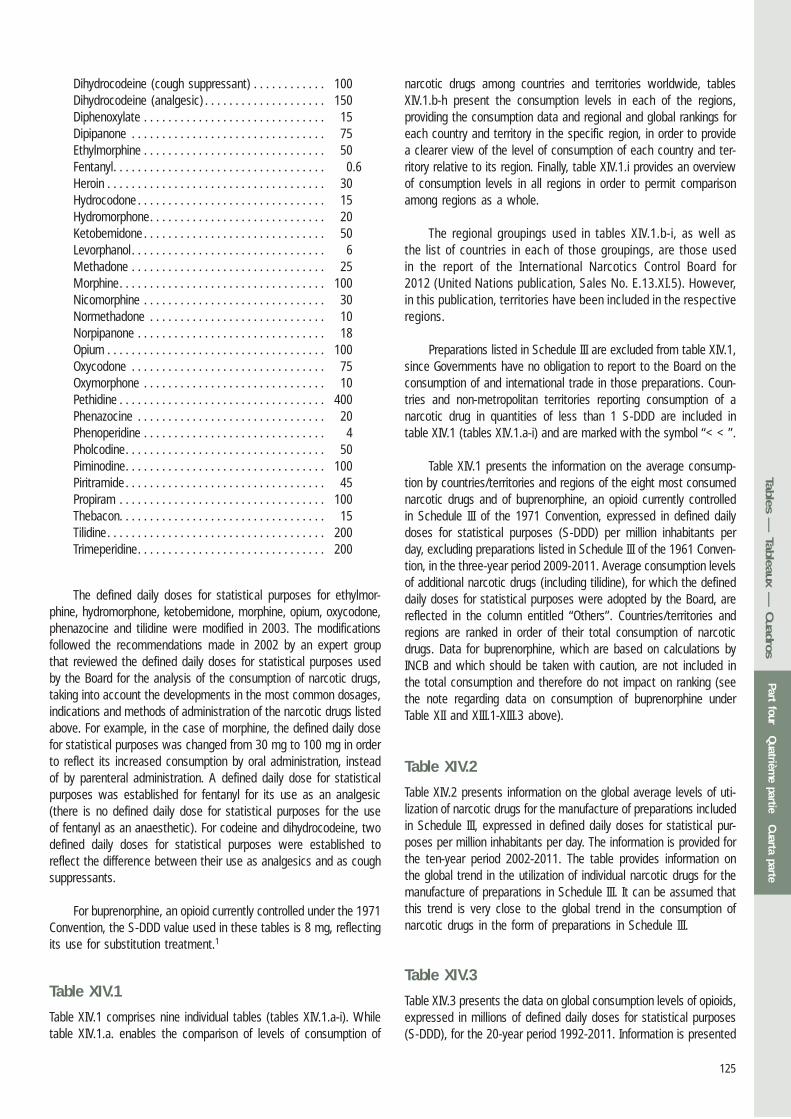
Acetyldihydrocodeine . . . . . . . . . . . . . . . . . . . . . . . . 40Alphaprodine . . . . . . . . . . . . . . . . . . . . . . . . . . . . . . . 120Anileridine . . . . . . . . . . . . . . . . . . . . . . . . . . . . . . . . . 65Bezitramide . . . . . . . . . . . . . . . . . . . . . . . . . . . . . . . . 15Codeine (cough suppressant) . . . . . . . . . . . . . . . . . . 100Codeine (analgesic). . . . . . . . . . . . . . . . . . . . . . . . . . 240Dextromoramide . . . . . . . . . . . . . . . . . . . . . . . . . . . . 20Dextropropoxyphene hydrochloride . . . . . . . . . . . . . . 200Dextropropoxyphene napsylate . . . . . . . . . . . . . . . . . 300Difenoxin . . . . . . . . . . . . . . . . . . . . . . . . . . . . . . . . . . 3
125
Dihydrocodeine (cough suppressant) . . . . . . . . . . . . 100Dihydrocodeine (analgesic) . . . . . . . . . . . . . . . . . . . . 150Diphenoxylate . . . . . . . . . . . . . . . . . . . . . . . . . . . . . . 15Dipipanone . . . . . . . . . . . . . . . . . . . . . . . . . . . . . . . . 75Ethylmorphine . . . . . . . . . . . . . . . . . . . . . . . . . . . . . . 50Fentanyl. . . . . . . . . . . . . . . . . . . . . . . . . . . . . . . . . . . 0.6Heroin . . . . . . . . . . . . . . . . . . . . . . . . . . . . . . . . . . . . 30Hydrocodone . . . . . . . . . . . . . . . . . . . . . . . . . . . . . . . 15Hydromorphone. . . . . . . . . . . . . . . . . . . . . . . . . . . . . 20Ketobemidone . . . . . . . . . . . . . . . . . . . . . . . . . . . . . . 50Levorphanol . . . . . . . . . . . . . . . . . . . . . . . . . . . . . . . . 6Methadone . . . . . . . . . . . . . . . . . . . . . . . . . . . . . . . . 25Morphine. . . . . . . . . . . . . . . . . . . . . . . . . . . . . . . . . . 100Nicomorphine . . . . . . . . . . . . . . . . . . . . . . . . . . . . . . 30Normethadone . . . . . . . . . . . . . . . . . . . . . . . . . . . . . 10Norpipanone . . . . . . . . . . . . . . . . . . . . . . . . . . . . . . . 18Opium . . . . . . . . . . . . . . . . . . . . . . . . . . . . . . . . . . . . 100Oxycodone . . . . . . . . . . . . . . . . . . . . . . . . . . . . . . . . 75Oxymorphone . . . . . . . . . . . . . . . . . . . . . . . . . . . . . . 10Pethidine . . . . . . . . . . . . . . . . . . . . . . . . . . . . . . . . . . 400Phenazocine . . . . . . . . . . . . . . . . . . . . . . . . . . . . . . . 20Phenoperidine . . . . . . . . . . . . . . . . . . . . . . . . . . . . . . 4Pholcodine. . . . . . . . . . . . . . . . . . . . . . . . . . . . . . . . . 50Piminodine. . . . . . . . . . . . . . . . . . . . . . . . . . . . . . . . . 100Piritramide . . . . . . . . . . . . . . . . . . . . . . . . . . . . . . . . . 45Propiram . . . . . . . . . . . . . . . . . . . . . . . . . . . . . . . . . . 100Thebacon. . . . . . . . . . . . . . . . . . . . . . . . . . . . . . . . . . 15Tilidine. . . . . . . . . . . . . . . . . . . . . . . . . . . . . . . . . . . . 200Trimeperidine. . . . . . . . . . . . . . . . . . . . . . . . . . . . . . . 200
The defined daily doses for statistical purposes for ethylmor-phine, hydromorphone, ketobemidone, morphine, opium, oxycodone, phenazocine and tilidine were modified in 2003. The modifications followed the recommendations made in 2002 by an expert group that reviewed the defined daily doses for statistical purposes used by the Board for the analysis of the consumption of narcotic drugs, taking into account the developments in the most common dosages, indications and methods of administration of the narcotic drugs listed above. For example, in the case of morphine, the defined daily dose for statistical purposes was changed from 30 mg to 100 mg in order to reflect its increased consumption by oral administration, instead of by parenteral administration. A defined daily dose for statistical purposes was established for fentanyl for its use as an analgesic (there is no defined daily dose for statistical purposes for the use of fentanyl as an anaesthetic). For codeine and dihydrocodeine, two defined daily doses for statistical purposes were established to reflect the difference between their use as analgesics and as cough suppressants.
For buprenorphine, an opioid currently controlled under the 1971 Convention, the S-DDD value used in these tables is 8 mg, reflecting its use for substitution treatment.1
Table XIV.1
Table XIV.1 comprises nine individual tables (tables XIV.1.a-i). While table XIV.1.a. enables the comparison of levels of consumption of
narcotic drugs among countries and territories worldwide, tables XIV.1.b-h present the consumption levels in each of the regions, providing the consumption data and regional and global rankings for each country and territory in the specific region, in order to provide a clearer view of the level of consumption of each country and ter-ritory relative to its region. Finally, table XIV.1.i provides an overview of consumption levels in all regions in order to permit comparison among regions as a whole.
The regional groupings used in tables XIV.1.b-i, as well as the list of countries in each of those groupings, are those used in the report of the International Narcotics Control Board for 2012 (United Nations publication, Sales No. E.13.XI.5). However, in this publication, territories have been included in the respective regions.
Preparations listed in Schedule III are excluded from table XIV.1, since Governments have no obligation to report to the Board on the consumption of and international trade in those preparations. Coun-tries and non-metropolitan territories reporting consumption of a narcotic drug in quantities of less than 1 S-DDD are included in table XIV.1 (tables XIV.1.a-i) and are marked with the symbol “<<”.
Table XIV.1 presents the information on the average consump-tion by countries/territories and regions of the eight most consumed narcotic drugs and of buprenorphine, an opioid currently controlled in Schedule III of the 1971 Convention, expressed in defined daily doses for statistical purposes (S-DDD) per million inhabitants per day, excluding preparations listed in Schedule III of the 1961 Conven-tion, in the three-year period 2009-2011. Average consumption levels of additional narcotic drugs (including tilidine), for which the defined daily doses for statistical purposes were adopted by the Board, are reflected in the column entitled “Others”. Countries/territories and regions are ranked in order of their total consumption of narcotic drugs. Data for buprenorphine, which are based on calculations by INCB and which should be taken with caution, are not included in the total consumption and therefore do not impact on ranking (see the note regarding data on consumption of buprenorphine under Table XII and XIII.1-XIII.3 above).
Table XIV.2
Table XIV.2 presents information on the global average levels of uti-lization of narcotic drugs for the manufacture of preparations included in Schedule III, expressed in defined daily doses for statistical pur-poses per million inhabitants per day. The information is provided for the ten-year period 2002-2011. The table provides information on the global trend in the utilization of individual narcotic drugs for the manufacture of preparations in Schedule III. It can be assumed that this trend is very close to the global trend in the consumption of narcotic drugs in the form of preparations in Schedule III.
Table XIV.3
Table XIV.3 presents the data on global consumption levels of opioids, expressed in millions of defined daily doses for statistical purposes (S-DDD), for the 20-year period 1992-2011. Information is presented
Part fourQuatrièm
e partieCuarta parte
Tables — Tableau
x —
Cuadro
s
126
separately for opiate analgesics, synthetic analgesics and other opiates controlled under the 1961 Convention. The table also includes separate information on buprenorphine, an opioid currently control-led under the Convention on Psychotropic Substances of 1971, and on methadone, an opioid controlled under the 1961 Convention. Some opioids are used for various indications. For example, the opiates codeine, dihydrocodeine, ethylmorphine and hydrocodone can be used as analgesics, but they are predominantly used for purposes other than the treatment of pain. Buprenorphine, heroin, methadone and morphine are analgesics, but in some countries they are used also or exclusively in the substitution treatment of addicts. The statistical information provided to the Board by Governments does not enable the distinction of the quantities used for different purposes. For that reason, the table shows opiates and synthetic opioids grouped according to their main use, as reported to the Board. The distribution of opioids and preparations containing those opioids among the groups is explained in the footnotes to the table.
Global consumption levels of buprenorphine and methadone, for which no assumption on the main indication could be made, are shown separately. Heroin is included in the group of other opiates.
Table XV
Table XV contains information on global stocks of narcotic drugs. The stocks of concentrate of poppy straw are presented in terms of the total anhydrous alkaloid content (anhydrous codeine alkaloid (ACA), anhydrous morphine alkaloid (AMA), anhydrous oripavine alkaloid (AOA) and anhydrous thebaine alkaloid (ATA)) in the con-centrate of poppy straw, expressed as 100 per cent of the respectivealkaloid. The data on stocks of concentrate of poppy straw are there-fore not directly comparable with those shown in the editions of this technical report published prior to 2005, in which concentrate of poppy straw was expressed as 50 per cent of the main alkaloid contained in it.
1Psychotropic Substances: Statistics for 2011: Assessments of Annual Medical and Scientific Requirements for Substances in Schedules II, III and IV of the Convention on Psychotropic Substances of 1971 (United Nations publication, Sales No. T.13.XI.3), table IV, “Levels of consumption of groups of psychotropic substances in defined daily doses for statistical purposes (S-DDD) per thousand inhabitants per day”.
127
Tableaux des statistiques communiquées
Notes:
Pour les observations d’ordre général concernant les tableaux des statistiques communiquées présentés ci-après, y compris l’explica-tion des signes qui y sont employés, voir le chapitre intitulé “Obser-vations sur les tableaux statistiques” dans la première partie de la présente publication.
Tableau I
Le tableau I contient des informations sur la culture de Papaver somniferum pour la production d’opium. Les statistiques relatives à la production réelle sont données pour la période de cinq ans allant de 2007 à 2011, alors que les évaluations pour l’avenir concernent les deux années 2012 et 2013. Les statistiques et évaluations concernant la production d’opium sont exprimées en opium ayant une consistance de 90 % (10 % d’humidité).
Tableau II
Le tableau II contient des informations sur la culture de Papaver somniferum à des fins autres que la production d’opium. Il s’agit notamment de la production de paille de pavot pour l’extraction d’alcaloïdes et pour la décoration ainsi que de la production de graines de pavot. Les statistiques relatives à la culture réelle portent sur la période de cinq ans allant de 2007 à 2011, alors que les évaluations présentées concernent les deux années 2012 et 2013. Les cultures occupant une superficie inférieure à 1 hectare n’appa-raissent pas dans ce tableau; les fractions d’hectare sont arrondies à l’unité la plus proche. L’information relative à la production de paille de pavot figurant dans ce tableau se réfère uniquement à la pro-duction pour l’extraction d’alcaloïdes. Ces données ne sont pas toujours disponibles car elles sont fournies à titre volontaire.
Tableau III
Le tableau III contient des informations sur l’extraction des alcaloïdes de l’opium, notamment sur les rendements correspondants; les sta-tistiques données concernent la codéine, la morphine et la thébaïne.
Tableau IV
Le tableau IV contient les informations relatives à l’extraction de morphine de la paille de pavot riche en morphine et du concentré de paille de pavot contenant de la morphine comme principal alca-loïde, notamment aux rendements correspondants. Le concentré de paille de pavot est présenté comme ayant une teneur en morphine anhydre (AMA) de 100 %. Par conséquent, les informations relatives au concentré de paille de pavot et aux rendements respectifs pré-sentées dans ce tableau ne sont pas directement comparables à celles figurant dans les éditions du présent rapport technique préa-lables à 2005, dans lequel le concentré de paille de pavot était présenté comme ayant une teneur en morphine anhydre de 50 %.
Tableau V
Le tableau V contient des informations sur l’extraction de thébaïne de la paille de pavot et du concentré de paille de pavot, notamment sur les rendements respectifs, pour la période de cinq ans allant de 2007 à 2011. Le tableau porte sur la fabrication de thébaïne à partir de tout type de paille de pavot et de concentré de paille de pavot utilisé commercialement à cette fin. Le concentré de paille de pavot est présenté comme ayant une teneur en thébaïne anhydre (ATA) ou en oripavine anhydre (AOA) de 100 %.
Tableau VI
Le tableau VI contient des informations sur la transformation de la morphine. La majeure partie de la morphine fabriquée est transformée en codéine, en éthylmorphine ou en pholcodine. Le tableau VI contient des informations sur cette transformation, notamment les rendements correspondants. Deux colonnes supplémentaires montrent les quan-tités de morphine transformées en d’autres stupéfiants ou en subs-tances non visées par la Convention unique sur les stupéfiants de 1961. Les noms de ces stupéfiants ou substances sont indiqués dans les notes de bas de page se rapportant audit tableau.
Tableau VII
Le tableau VII porte sur la transformation de la thébaïne. La majeure partie de la thébaïne fabriquée est transformée en hydrocodone et en oxycodone. Le tableau VII contient des informations sur cette transformation, notamment les rendements correspondants. Trois colonnes supplémentaires montrent les quantités de thébaïne trans-formées en d’autres stupéfiants, en buprénorphine (substance placée sous contrôle en vertu de la Convention de 1971 sur les substances psychotropes) ou en substances autres que la buprénorphine qui ne sont pas visées par la Convention de 1961. Selon qu’il convient, les noms de ces stupéfiants ou substances sont indiqués dans les notes de bas de page se rapportant audit tableau.
Tableau VIII
Le tableau VIII présente des informations sur la fabrication d’alca-loïdes contenus dans le concentré de paille de pavot pour la période de cinq ans allant de 2007 à 2011. Les données relatives au concen-tré de la paille de pavot correspondent à une teneur totale de 100 %en alcaloïde anhydre [codéine anhydre (ACA), morphine anhydre (AMA), oripavine anhydre (AOA) ou thébaïne anhydre (ATA)].
Tableaux IX et X
Les tableaux IX et X contiennent des informations sur la fabrication de stupéfiants. Le tableau IX, relatif aux principaux stupéfiants, contient des données ventilées par pays, tandis que le tableau X, sur les autres stupéfiants les plus courants, présente seulement des chiffres globaux. Le classement d’un stupéfiant dans le tableau IX ou dans le tableau X est déterminé par deux critères qui sont
Part fourQuatrièm
e partieCuarta parte
Tables — Tableau
x —
Cuadro
s
128
souvent, mais pas toujours, concordants: la quantité fabriquée et le nombre de pays fabricants. Ainsi, les stupéfiants fabriqués en grande quantité par plusieurs pays apparaissent au tableau IX.
Le tableau IX contient également des informations sur la fab-rication de buprénorphine, opiacé actuellement inscrit au Tableau III de la Convention de 1971. Conformément aux dispositions de l’article 16 de cette convention, les Parties sont tenues de fournir à l’Organe international de contrôle des stupéfiants des rapports sur les quantités de buprénorphine fabriquées, ainsi que sur les quantités totales exportées et importées. Les statistiques relatives aux exportations et aux importations de buprénorphine figurent dans le rapport technique de l’OICS sur les substances psychotropes intitulé: Substances psychotropes: Statistiques pour 2011; Prévisions des besoins annuels médicaux et scientifiques concernant les sub-stances des Tableaux II, III et IV de la Convention de 1971 sur les substances psychotropes (publication des Nations Unies, numéro de vente: T.13 .XI.3).
Tableau XI
Le tableau XI porte sur la production, l’utilisation, l’importation et l’exportation de la feuille de coca et la fabrication de cocaïne. Il porte également sur les quantités de cocaïne obtenues par la purification de matières saisies.
Tableaux XII et XIII.1 à XIII.3
Les tableaux XII et XIII.1 à XIII.3 contiennent des informations sur les stupéfiants consommés en quantités égales ou supérieures à 1 kilogramme au cours de l’une des années considérées. Le tab-leau XII, sur la consommation des principaux stupéfiants, présente les données par pays. Il comprend des données relatives à la con-sommation de buprénorphine, opiacé actuellement inscrit au Tableau III de la Convention de 1971, qui vise des substances pour lesquelles les gouvernements ne sont pas tenus de communiquer à l’OICS de chiffres de la consommation. Les données relatives à la buprénor-phine qui sont publiées dans le tableau XII ont été calculées par l’OICS à partir des informations statistiques fournies par les gou-vernements sur la fabrication, l’importation, l’exportation et, le cas échéant, les stocks de buprénorphine. La prudence est donc de mise quant aux conclusions qui peuvent en être tirées concernant la consommation effective. Du fait que l’OICS suit en permanence la question avec les gouvernements en vue d’éclaircir les incohé-rences dans les données, les chiffres relatifs à la consommation de buprénorphine sont susceptibles d’évoluer sensiblement d’une ver-sion à l’autre de la présente publication à mesure que les données sont révisées.
Le tableau XIII.1, sur les opioïdes synthétiques dont la consom-mation se mesure en milligrammes, tels que le fentanyl et ses ana-logues, et qui sont administrés en doses infimes (par exemple de 0,005 mg à 0,1 mg sous forme injectable) à cause de leur grande puissance, présente aussi des données ventilées par pays, alors que les tableaux XIII.2 et XIII.3, relatifs aux autres dérivés de l’opium et aux opioïdes synthétiques, respectivement, ne donnent que les totaux mondiaux.
Les données relatives à la consommation présentées dans les tableaux XII, XIII.2 et XIII.3 incluent les quantités de stupéfiants dé-clarées par les gouvernements comme ayant été utilisées dans le pays ou territoire respectif pour la fabrication de préparations inscrites au Tableau III de la Convention de 1961. Il convient de noter, toutefois, que certaines préparations inscrites au Tableau III peuvent avoir été exportées du pays ou territoire où elles ont été fabriquées et consom-mées dans un autre pays ou territoire. L’OICS ne dispose d’aucune information sur la consommation réelle de ces préparations dans les différents pays ou territoires, étant donné que les gouvernements ne sont pas tenus de faire rapport sur l’exportation et l’importation des préparations du Tableau III et ne devraient pas inclure de données sur la consommation des préparations du Tableau III dans leurs évalu-ations et statistiques relatives à la consommation. Les évaluations et les statistiques concernant les préparations du Tableau III devraient uniquement porter sur les quantités utilisées pour les fabriquer. Par conséquent, les données présentées dans les tableaux XII, XIII.2 et XIII.3, qui se rapportent aux stupéfiants utilisés pour la fabrication de préparations du Tableau III, devraient être considérées avec beaucoup de circonspection lorsqu’on compare les niveaux de consommation de stupéfiants. Les informations qui figurent au tableau XIV peuvent mieux se prêter à de telles comparaisons.
Les stupéfiants pour lesquels des préparations du Tableau III existent sont les suivants:
Acétyldihydrocodéine Dihydrocodéine NicodicodineCocaïne Diphénoxylate NorcodéineCodéine Éthylmorphine OpiumDextropropoxyphène Morphine PholcodineDifénoxine Nicocodine Propiram
Pour une définition précise de ces préparations, se reporter à la “Liste des stupéfiants placés sous contrôle international” (“Liste jaune”), qui est publiée chaque année par l’OICS.
Tableaux XIV.1 a à i, XIV.2 et XIV.3
Les tableaux XIV.1 et XIV.2 ont été considérablement modifiés dans l’édition de 2003 du présent rapport technique. Il n’est donc pas possible d’établir de comparaison directe avec les données publiées dans les éditions antérieures à 2003. Le tableau XIV.3 n’a été intro-duit que dans l’édition de 2007. Les tableaux XIV.1, XIV.2 et XIV.3 contiennent des informations sur les niveaux de consommation de stupéfiants exprimés en doses quotidiennes déterminées à des fins statistiques. Le terme “doses quotidiennes déterminées à des fins statistiques (S-DDD)” remplace le terme “doses quotidiennes déter-minées (DDD)” qui était employé auparavant par l’OICS dans ses publications. Les doses quotidiennes déterminées à des fins statis-tiques sont des unités techniques de mesure utilisées pour l’analyse statistique et non des posologies recommandées. Leur définition n’est pas exempte d’un certain arbitraire. Certains stupéfiants peuvent être utilisés dans certains pays pour différents traitements ou selon diverses pratiques médicales, et une dose quotidienne dif-férente pourrait être plus appropriée. Les doses quotidiennes déter-minées à des fins statistiques indiquées devraient être considérées comme approximatives et susceptibles d’être modifiées si des renseignements plus précis sont disponibles (voir ci-après).
129
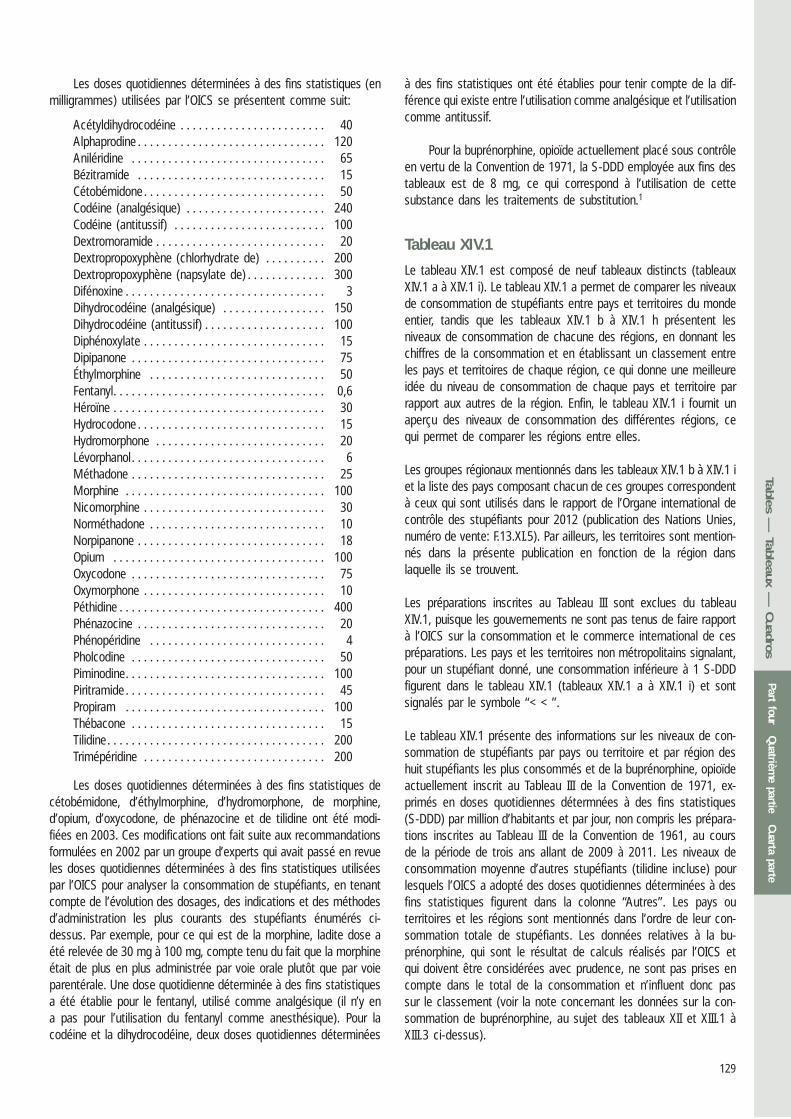
Les doses quotidiennes déterminées à des fins statistiques (en milligrammes) utilisées par l’OICS se présentent comme suit:
Acétyldihydrocodéine . . . . . . . . . . . . . . . . . . . . . . . . 40Alphaprodine . . . . . . . . . . . . . . . . . . . . . . . . . . . . . . . 120Aniléridine . . . . . . . . . . . . . . . . . . . . . . . . . . . . . . . . 65Bézitramide . . . . . . . . . . . . . . . . . . . . . . . . . . . . . . . 15Cétobémidone . . . . . . . . . . . . . . . . . . . . . . . . . . . . . . 50Codéine (analgésique) . . . . . . . . . . . . . . . . . . . . . . . 240Codéine (antitussif) . . . . . . . . . . . . . . . . . . . . . . . . . 100Dextromoramide . . . . . . . . . . . . . . . . . . . . . . . . . . . . 20Dextropropoxyphène (chlorhydrate de) . . . . . . . . . . 200Dextropropoxyphène (napsylate de) . . . . . . . . . . . . . 300Difénoxine . . . . . . . . . . . . . . . . . . . . . . . . . . . . . . . . . 3Dihydrocodéine (analgésique) . . . . . . . . . . . . . . . . . 150Dihydrocodéine (antitussif) . . . . . . . . . . . . . . . . . . . . 100Diphénoxylate . . . . . . . . . . . . . . . . . . . . . . . . . . . . . . 15Dipipanone . . . . . . . . . . . . . . . . . . . . . . . . . . . . . . . . 75Éthylmorphine . . . . . . . . . . . . . . . . . . . . . . . . . . . . . 50Fentanyl. . . . . . . . . . . . . . . . . . . . . . . . . . . . . . . . . . . 0,6Héroïne . . . . . . . . . . . . . . . . . . . . . . . . . . . . . . . . . . . 30Hydrocodone . . . . . . . . . . . . . . . . . . . . . . . . . . . . . . . 15Hydromorphone . . . . . . . . . . . . . . . . . . . . . . . . . . . . 20Lévorphanol . . . . . . . . . . . . . . . . . . . . . . . . . . . . . . . . 6Méthadone . . . . . . . . . . . . . . . . . . . . . . . . . . . . . . . . 25Morphine . . . . . . . . . . . . . . . . . . . . . . . . . . . . . . . . . 100Nicomorphine . . . . . . . . . . . . . . . . . . . . . . . . . . . . . . 30Norméthadone . . . . . . . . . . . . . . . . . . . . . . . . . . . . . 10Norpipanone . . . . . . . . . . . . . . . . . . . . . . . . . . . . . . . 18Opium . . . . . . . . . . . . . . . . . . . . . . . . . . . . . . . . . . . 100Oxycodone . . . . . . . . . . . . . . . . . . . . . . . . . . . . . . . . 75Oxymorphone . . . . . . . . . . . . . . . . . . . . . . . . . . . . . . 10Péthidine . . . . . . . . . . . . . . . . . . . . . . . . . . . . . . . . . . 400Phénazocine . . . . . . . . . . . . . . . . . . . . . . . . . . . . . . . 20Phénopéridine . . . . . . . . . . . . . . . . . . . . . . . . . . . . . 4Pholcodine . . . . . . . . . . . . . . . . . . . . . . . . . . . . . . . . 50Piminodine. . . . . . . . . . . . . . . . . . . . . . . . . . . . . . . . . 100Piritramide . . . . . . . . . . . . . . . . . . . . . . . . . . . . . . . . . 45Propiram . . . . . . . . . . . . . . . . . . . . . . . . . . . . . . . . . 100Thébacone . . . . . . . . . . . . . . . . . . . . . . . . . . . . . . . . 15Tilidine. . . . . . . . . . . . . . . . . . . . . . . . . . . . . . . . . . . . 200Trimépéridine . . . . . . . . . . . . . . . . . . . . . . . . . . . . . . 200
Les doses quotidiennes déterminées à des fins statistiques de cétobémidone, d’éthylmorphine, d’hydromorphone, de morphine, d’opium, d’oxycodone, de phénazocine et de tilidine ont été modi-fiées en 2003. Ces modifications ont fait suite aux recommandations formulées en 2002 par un groupe d’experts qui avait passé en revue les doses quotidiennes déterminées à des fins statistiques utilisées par l’OICS pour analyser la consommation de stupéfiants, en tenant compte de l’évolution des dosages, des indications et des méthodes d’administration les plus courants des stupéfiants énumérés ci-dessus. Par exemple, pour ce qui est de la morphine, ladite dose a été relevée de 30 mg à 100 mg, compte tenu du fait que la morphine était de plus en plus administrée par voie orale plutôt que par voie parentérale. Une dose quotidienne déterminée à des fins statistiques a été établie pour le fentanyl, utilisé comme analgésique (il n’y en a pas pour l’utilisation du fentanyl comme anesthésique). Pour la codéine et la dihydrocodéine, deux doses quotidiennes déterminées
à des fins statistiques ont été établies pour tenir compte de la dif-férence qui existe entre l’utilisation comme analgésique et l’utilisation comme antitussif.
Pour la buprénorphine, opioïde actuellement placé sous contrôle en vertu de la Convention de 1971, la S-DDD employée aux fins des tableaux est de 8 mg, ce qui correspond à l’utilisation de cette substance dans les traitements de substitution.1
Tableau XIV.1
Le tableau XIV.1 est composé de neuf tableaux distincts (tableaux XIV.1 a à XIV.1 i). Le tableau XIV.1 a permet de comparer les niveaux de consommation de stupéfiants entre pays et territoires du monde entier, tandis que les tableaux XIV.1 b à XIV.1 h présentent les niveaux de consommation de chacune des régions, en donnant les chiffres de la consommation et en établissant un classement entre les pays et territoires de chaque région, ce qui donne une meilleure idée du niveau de consommation de chaque pays et territoire par rapport aux autres de la région. Enfin, le tableau XIV.1 i fournit un aperçu des niveaux de consommation des différentes régions, ce qui permet de comparer les régions entre elles.
Les groupes régionaux mentionnés dans les tableaux XIV.1 b à XIV.1 iet la liste des pays composant chacun de ces groupes correspondent à ceux qui sont utilisés dans le rapport de l’Organe international de contrôle des stupéfiants pour 2012 (publication des Nations Unies, numéro de vente: F.13.XI.5). Par ailleurs, les territoires sont mention-nés dans la présente publication en fonction de la région dans laquelle ils se trouvent.
Les préparations inscrites au Tableau III sont exclues du tableau XIV.1, puisque les gouvernements ne sont pas tenus de faire rapport à l’OICS sur la consommation et le commerce international de ces préparations. Les pays et les territoires non métropolitains signalant, pour un stupéfiant donné, une consommation inférieure à 1 S-DDD figurent dans le tableau XIV.1 (tableaux XIV.1 a à XIV.1 i) et sont signalés par le symbole “<<”.
Le tableau XIV.1 présente des informations sur les niveaux de con-sommation de stupéfiants par pays ou territoire et par région des huit stupéfiants les plus consommés et de la buprénorphine, opioïde actuellement inscrit au Tableau III de la Convention de 1971, ex-primés en doses quotidiennes détermnées à des fins statistiques (S-DDD) par million d’habitants et par jour, non compris les prépara-tions inscrites au Tableau III de la Convention de 1961, au cours de la période de trois ans allant de 2009 à 2011. Les niveaux de consommation moyenne d’autres stupéfiants (tilidine incluse) pour lesquels l’OICS a adopté des doses quotidiennes déterminées à des fins statistiques figurent dans la colonne “Autres”. Les pays ou territoires et les régions sont mentionnés dans l’ordre de leur con-sommation totale de stupéfiants. Les données relatives à la bu-prénorphine, qui sont le résultat de calculs réalisés par l’OICS et qui doivent être considérées avec prudence, ne sont pas prises en compte dans le total de la consommation et n’influent donc pas sur le classement (voir la note concernant les données sur la con-sommation de buprénorphine, au sujet des tableaux XII et XIII.1 à XIII.3 ci-dessus).
Part fourQuatrièm
e partieCuarta parte
Tables — Tableau
x —
Cuadro
s
130
Tableau XIV.2
Le tableau XIV.2 donne des informations sur les niveaux moyens, dans le monde, d’utilisation de stupéfiants pour la fabrication des préparations inscrites au Tableau III, exprimés en doses quotidiennes déterminées à des fins statistiques par million d’habitants et par jour. Les informations portent sur la période de dix ans allant de 2002 à 2011. Le tableau fournit des données sur l’évolution générale de l’utilisation de stupéfiants spécifiques pour la fabrication des prépara-tions du Tableau III. On peut supposer que cette tendance reflète à peu de chose près l’évolution, au niveau mondial, de la consomma-tion de stupéfiants sous forme de préparations du Tableau III.
Tableau XIV.3
Le tableau XIV.3 présente les niveaux de la consommation mondiale d’opioïdes exprimée en millions de doses quotidiennes déterminées à des fins statistiques (S-DDD) pour la période de 20 ans allant de 1992 à 2011. Il comprend, présentées séparément, des informa-tions sur les analgésiques opiacés, les analgésiques synthétiques et les autres opiacés placés sous contrôle en vertu de la Convention de 1961, de même que des informations relatives à la buprénor-phine, opioïde actuellement placé sous contrôle en vertu de la Convention sur les substances psychotropes de 1971, et à la méthadone, opioïde placé sous contrôle en vertu de la Convention de 1961. Certains opioïdes sont employés pour différentes indica-tions. Ainsi, les opiacés que sont la codéine, la dihydrocodéine, l’éthylmorphine et l’hydrocodone peuvent être utilisés comme
analgésiques, mais ils sont principalement utilisés à d’autres fins que le traitement de la douleur. La buprénorphine, l’héroïne, la méthadone et la morphine sont des analgésiques, mais dans cer-tains pays ils sont aussi, voire exclusivement, employés dans le traitement de substitution des toxicomanes. Les informations statis-tiques communiquées à l’OICS par les gouvernements ne per-mettent pas de déterminer les quantités utilisées pour les différents usages. Pour cette raison, le tableau regroupe les opiacés et les opioïdes synthétiques en fonction de leur utilisation principale, telle qu’elle a été signalée à l’OICS. La répartition dans les différents groupes des opioïdes et des préparations en contenant est expli-quée dans les notes de bas de page accompagnant le tableau. Les niveaux de la consommation mondiale de buprénorphine et de méthadone, pour lesquels l’indication principale n’a pas pu être déterminée, apparaissent séparément. L’héroïne entre dans la catégorie des autres opiacés.
Tableau XV
Le tableau XV donne des informations sur les stocks mondiaux de stupéfiants. Les stocks de concentré de la paille de pavot sont présentés comme ayant une teneur totale en alcaloïde anhydre [codéine anhydre (ACA), morphine anhydre (AMA), oripavine anhydre (AOA) ou thébaïne anhydre (ATA)] équivalente à 100 %, respective-ment. Ces données ne sont donc pas directement comparables à celles figurant dans les éditions du rapport technique publiées avant 2005, dans lesquelles le concentré de paille de pavot était supposé avoir une teneur de 50 % pour le principal alcaloïde.
1Substances psychotropes: Statistiques pour 2011; Prévisions des besoins annuels médicaux et scientifiques concernant les substances des Tableaux II, III et IV de la Convention de 1971 sur les substances psychotropes (publication des Nations Unies, numéro de vente: T.13.XI.3), tableau IV, “Niveaux de consommation de substances psychotropes exprimés en doses quotidiennes déterminées à des fins statistiques (S-DDD) par millier d’habitants et par jour”.
131
Notas:
Las observaciones de carácter general sobre los cuadros de las estadísticas comunicadas que figuran a continuación y la explicación de los símbolos utilizados en ellos figuran en la sección titulada “Observaciones sobre los cuadros estadísticos”, en la primera parte de la presente publicación.
Cuadro I
El cuadro I contiene información sobre el cultivo de Papaver somni-ferum para la producción de opio. Las estadísticas de la producción efectiva corresponden al quinquenio 2007-2011, y las previsiones de la producción futura, al bienio 2012-2013. Las estadísticas y las previsiones de la producción de opio se expresan en función del opio de una consistencia del 90% (10% de contenido de humedad).
Cuadro II
El cuadro II contiene información sobre el cultivo de Papaver som-niferum para fines distintos de la producción de opio. Entre esos fines figura la producción de paja de adormidera para la extracción de alcaloides y para decoración, así como la producción de semillas de adormidera. Las estadísticas del cultivo efectivo corresponden al quinquenio 2007-2011, y las previsiones, al bienio 2012-2013. En el cuadro no se incluyen las áreas de cultivo de menos de una hectá-rea; las fracciones de hectárea se redondean a la unidad más próxi-ma. Los datos relativos a la producción de paja de adormidera que figuran en el cuadro II se refieren únicamente a la producción para la extracción de alcaloides. No siempre se conocen esos datos, pues se presentan a título voluntario.
Cuadro III
El cuadro III contiene información sobre la extracción de alcaloides a partir del opio e incluye las correspondientes tasas de rendimiento; las estadísticas presentadas se refieren a la codeína, la morfina y la tebaína.
Cuadro IV
El cuadro IV contiene información sobre la extracción de morfina a partir de la paja de adormidera rica en morfina y del concentrado de paja de adormidera cuyo principal alcaloide es la morfina, e incluye las correspondientes tasas de rendimiento. Los datos sobre el concentrado de paja de adormidera se presentan en función de su contenido de alcaloide morfina anhidra (AMA), ex-presado al 100%. Por consiguiente, los datos que figuran en este cuadro sobre el concentrado de paja de adormidera y sobre las tasas de rendimiento respectivas no son directamente compara-bles con los datos de ediciones anteriores a 2005 del presente informe técnico, en las que se tomaba un contenido expresado al 50% de AMA.
Cuadros de las estadísticas comunicadas
Cuadro V
El cuadro V contiene información sobre la extracción de tebaína a partir de la paja de adormidera y del concentrado de paja de ador-midera, incluidas las tasas de rendimiento correspondientes, respec-to del quinquenio 2007-2011. El cuadro incluye la fabricación de tebaína a partir de todos los tipos de paja de adormidera y de concentrado de paja de adormidera que se utilizan comercialmente con esa finalidad. El concentrado de paja de adormidera se presenta en función de su contenido de alcaloide tebaína anhidra (ATA) y alcaloide oripavina anhidra (AOA), expresado al 100% del alcaloide considerado.
Cuadro VI
El cuadro VI contiene información sobre la transformación de la mor-fina. La mayor parte de la morfina que se fabrica se transforma en codeína, etilmorfina o folcodina. El cuadro presenta información sobre dicha transformación, incluidas las tasas de rendimiento correspon-dientes. En otras dos columnas se indican las cantidades de morfina transformadas en otros estupefacientes y en sustancias no fiscali-zadas en virtud de la Convención Única de 1961 sobre Estupefacien-tes. Los nombres de esos estupefacientes o sustancias se indican en las notas del cuadro.
Cuadro VII
El cuadro VII contiene información sobre la transformación de la te-baína. La mayor parte de la tebaína que se fabrica se transforma en hidrocodona y oxicodona. El cuadro contiene información sobre dicha transformación, incluidas las tasas de rendimiento correspondientes. En otras tres columnas se indican las cantidades de tebaína trans-formadas en otros estupefacientes, en buprenorfina, sustancia fisca-lizada en virtud del Convenio sobre Sustancias Sicotrópicas de 1971, y en sustancias distintas de la buprenorfina a las que no se aplica la Convención de 1961. Cuando corresponde, los nombres de esos estupefacientes y sustancias se indican en las notas del cuadro.
Cuadro VIII
El cuadro VIII contiene información correspondiente al quinquenio 2007-2011 sobre la fabricación de los alcaloides presentes en el con-centrado de paja de adormidera. Las cifras sobre el concentrado de paja de adormidera se presentan en función de su contenido total de alcaloide anhidro (alcaloide codeína anhidra (ACA), alcaloide morfina anhidra (AMA), alcaloide oripavina anhidra (AOA) y alcaloide tebaína anhidra (ATA)), expresado al 100% del alcaloide de que se trate.
Cuadros IX y X
Los cuadros IX y X contienen información sobre la fabricación de estupefacientes. El cuadro IX, que se refiere a los principales estu-pefacientes, está desglosado por países, en tanto que el cuadro X, que se refiere a otros estupefacientes más comunes, presenta las
Part fourQuatrièm
e partieCuarta parte
Tables — Tableau
x —
Cuadro
s
132
cifras generales únicamente. Al decidir la inclusión de un estupefa-ciente en el cuadro IX o en el cuadro X se aplican dos criterios que son a menudo, aunque no siempre, coincidentes, a saber, la cantidad fabricada y el número de países fabricantes. En consecuencia, los estupefacientes fabricados en grandes cantidades por varios países figuran en el cuadro IX.
En el cuadro IX también se incluye información sobre la fabrica-ción de buprenorfina, opiáceo en la actualidad incluido en la Lista III del Convenio de 1971. De conformidad con las disposiciones del artículo 16 de ese Convenio, las Partes tienen la obligación de infor-mar a la Junta Internacional de Fiscalización de Estupefacientes sobre las cantidades de buprenorfina fabricadas y sobre las cantidades to-tales exportadas e importadas. Las estadísticas relativas a la expor-tación e importación de buprenorfina podrán consultarse en el informe técnico de la Junta relativo a las sustancias sicotrópicas: Sustancias sicotrópicas: Estadísticas de 2011; Previsiones de las necesidades anuales para fines médicos y científicos de sustancias de las Listas II, III y IV del Convenio sobre Sustancias Sicotrópicas de 1971 (publicación de las Naciones Unidas, núm. de venta T.13.XI.3).
Cuadro XI
El cuadro XI contiene información relativa a la producción, utilización, importación y exportación de hoja de coca y a la fabricación de cocaína. En el cuadro también se incluye información sobre las can-tidades de cocaína obtenidas mediante la purificación de material incautado.
Cuadros XII y XIII.1 a XIII.3
Los cuadros XII y XIII.1 a XIII.3 contienen información sobre el con-sumo de estupefacientes en cantidades de un 1 kilogramo o más en cada uno de los años considerados. El cuadro XII, en que se refleja el consumo de los principales estupefacientes, está desglo-sado por países. Se presentan en él datos sobre el consumo de buprenorfina. La buprenorfina es un opiáceo incluido actualmente en la Lista III del Convenio de 1971, que abarca las sustancias respecto de cuyo consumo los gobiernos no están obligados a presentar es-tadísticas a la JIFE. Los datos publicados en el cuadro XII son cal-culados por la JIFE a partir de información estadística proporcionada por los gobiernos sobre la fabricación, la importación, la exportación y, si se dispone de información al respecto, las existencias de bu-prenorfina. Por consiguiente, hay que actuar con prudencia para extraer conclusiones acerca del consumo real de buprenorfina. De resultas del proceso de seguimiento continuo iniciado por la JIFE con objeto de aclarar discrepancias de la información con los go-biernos, las cifras publicadas con respecto al consumo de buprenor-fina en determinado año pueden variar de una edición a otra del presente informe técnico, a medida que la información se vaya revisando.
El cuadro XIII.1, en que figuran los opioides sintéticos que se consumen en cantidades mensurables en miligramos, tales como el fentanilo y sus análogos, y que se administran en dosis muy peque-ñas (por ejemplo, 0,005 a 0,1 miligramos en forma inyectable) de-bido a su gran potencia, también está desglosado por países, en
tanto que los cuadros XIII.2 y XIII.3, que se refieren a otros derivados del opio y a los opioides sintéticos, respectivamente, muestran los totales mundiales únicamente.
Los datos relativos al consumo que se presentan en los cuadros XII, XIII.2 y XIII.3 incluyen las cantidades de estupefacientes que, según los informes suministrados por los gobiernos, se han utilizado en el país o territorio respectivo para la fabricación de preparados de la Lista III de la Convención de 1961. Cabe observar, sin embargo, que algunos preparados de la Lista III pueden haber sido exportados del país o territorio en que fueron fabricados, y haber sido consu-midos en otro país o territorio. La Junta no dispone de información sobre el consumo real de esos preparados en los distintos países o territorios, ya que los gobiernos no tienen la obligación de informar sobre la exportación ni la importación de preparados de la Lista III, y no deben incluir datos sobre el consumo de preparados de la Lista III en sus estadísticas y previsiones relativas al consumo. Las esta-dísticas y previsiones que se refieren a los preparados de la Lista III deben limitarse a las cantidades utilizadas para su fabricación. Por consiguiente, los datos presentados en los cuadros XII, XIII.2 y XIII.3, que se refieren a los estupefacientes que se utilizan para la fabricación de preparados de la Lista III, se deben manejar con es-pecial cuidado al comparar los niveles de consumo de estupefacien-tes. Para efectuar ese tipo de comparaciones, tal vez sea más apropiada la información que figura en el cuadro XIV.
Los estupefacientes para los que existen preparados de la Lista III son:
Acetildihidrocodeína Difenoxina NicocodinaCocaína Dihidrocodeína NicodicodinaCodeína Etilmorfina NorcodeínaDextropropoxifeno Folcodina OpioDifenoxilato Morfina Propiramo
Véase la definición exacta de esos preparados en la “Lista de estupefacientes sometidos a fiscalización internacional” (“Lista Amarilla”), que la Junta publica anualmente.
Cuadros XIV.1 a-i , XIV.2 y XIV.3
Los cuadros XIV.1 y XIV.2 cambiaron considerablemente en la edición de 2003 del presente informe técnico. En consecuencia, no es posible hacer comparaciones directas con los datos publicados en las edi-ciones anteriores a ese año. El cuadro XIV.3 se presentó por primera vez en la edición de 2007. En los cuadros XIV.1, XIV.2 y XIV.3 se presenta información sobre los niveles de consumo de estupefacien-tes utilizando el concepto de dosis diarias definidas con fines esta-dísticos. La expresión “dosis diarias definidas con fines estadísticos” (S-DDD) sustituyó a la expresión “dosis diarias definidas” (DDD) que la Junta había utilizado anteriormente en sus publicaciones. Las dosis diarias definidas con fines estadísticos constituyen unidades técnicas de medida a efectos del análisis estadístico, y no dosis de prescrip-ción recomendadas. Su definición no está exenta de cierto grado de arbitrariedad. Ciertos estupefacientes pueden utilizarse en determina-dos países para tratamientos diferentes o de conformidad con prác-ticas médicas diferentes y, por consiguiente, una dosis diaria diferente podría resultar más apropiada. Las dosis diarias definidas con fines
133
estadísticos que se indican en el presente informe técnico deben considerarse aproximadas y sujetas a modificación en caso de que se reciba información más precisa (véase infra).
Las dosis diarias definidas con fines estadísticos (expresadas en miligramos) que utiliza la Junta para los estupefacientes son las siguientes:
Acetildihidrocodeína . . . . . . . . . . . . . . . . . . . . . . . . . 40Alfaprodina . . . . . . . . . . . . . . . . . . . . . . . . . . . . . . . . 120Anileridina . . . . . . . . . . . . . . . . . . . . . . . . . . . . . . . . 65Becitramida . . . . . . . . . . . . . . . . . . . . . . . . . . . . . . . 15Cetobemidona . . . . . . . . . . . . . . . . . . . . . . . . . . . . . . 50Clorhidrato de dextropropoxifeno . . . . . . . . . . . . . . . 200Codeína (analgésico) . . . . . . . . . . . . . . . . . . . . . . . . 240Codeína (antitusígeno) . . . . . . . . . . . . . . . . . . . . . . . 100Dextromoramida . . . . . . . . . . . . . . . . . . . . . . . . . . . 20Difenoxilato . . . . . . . . . . . . . . . . . . . . . . . . . . . . . . . 15Difenoxina . . . . . . . . . . . . . . . . . . . . . . . . . . . . . . . . 3Dihidrocodeína (analgésico) . . . . . . . . . . . . . . . . . . . 150Dihidrocodeína (antitusígeno) . . . . . . . . . . . . . . . . . . 100Dipipanona . . . . . . . . . . . . . . . . . . . . . . . . . . . . . . . . 75Etilmorfina . . . . . . . . . . . . . . . . . . . . . . . . . . . . . . . . 50Fenazocina . . . . . . . . . . . . . . . . . . . . . . . . . . . . . . . . 20Fenoperidina . . . . . . . . . . . . . . . . . . . . . . . . . . . . . . 4Fentanilo . . . . . . . . . . . . . . . . . . . . . . . . . . . . . . . . . . 0,6Folcodina . . . . . . . . . . . . . . . . . . . . . . . . . . . . . . . . . . 50Heroína . . . . . . . . . . . . . . . . . . . . . . . . . . . . . . . . . . . 30Hidrocodona . . . . . . . . . . . . . . . . . . . . . . . . . . . . . . . 15Hidromorfona . . . . . . . . . . . . . . . . . . . . . . . . . . . . . . 20Levorfanol . . . . . . . . . . . . . . . . . . . . . . . . . . . . . . . . . 6Metadona . . . . . . . . . . . . . . . . . . . . . . . . . . . . . . . . . 25Morfina . . . . . . . . . . . . . . . . . . . . . . . . . . . . . . . . . . 100Napsilato de dextropropoxifeno . . . . . . . . . . . . . . . . 300Nicomorfina. . . . . . . . . . . . . . . . . . . . . . . . . . . . . . . . 30Normetadona . . . . . . . . . . . . . . . . . . . . . . . . . . . . . . 10Norpipanona . . . . . . . . . . . . . . . . . . . . . . . . . . . . . . . 18Opio. . . . . . . . . . . . . . . . . . . . . . . . . . . . . . . . . . . . . . 100Oxicodona . . . . . . . . . . . . . . . . . . . . . . . . . . . . . . . . 75Oximorfona . . . . . . . . . . . . . . . . . . . . . . . . . . . . . . . . 10Petidina . . . . . . . . . . . . . . . . . . . . . . . . . . . . . . . . . . . 400Piminodina. . . . . . . . . . . . . . . . . . . . . . . . . . . . . . . . . 100Piritramida . . . . . . . . . . . . . . . . . . . . . . . . . . . . . . . . . 45Propiramo . . . . . . . . . . . . . . . . . . . . . . . . . . . . . . . . . 100Tebacón. . . . . . . . . . . . . . . . . . . . . . . . . . . . . . . . . . . 15Tilidina . . . . . . . . . . . . . . . . . . . . . . . . . . . . . . . . . . . . 200Trimeperidina . . . . . . . . . . . . . . . . . . . . . . . . . . . . . . 200
En 2003 se modificaron las dosis diarias definidas con fines estadísticos de la cetobemidona, la etilmorfina, la fenazocina, la hi-dromorfona, la morfina, el opio, la oxicodona y la tilidina. Esas modi-ficaciones se introdujeron a raíz de las recomendaciones formuladas en 2002 por un grupo de expertos que examinó las dosis diarias definidas con fines estadísticos que utilizaba la Junta para el análisis del consumo de estupefacientes, a fin de tener en cuenta las nove-dades registradas en cuanto a las dosis, indicaciones y métodos de administración más comunes de los estupefacientes enumerados. En el caso de la morfina, por ejemplo, la dosis diaria definida con fines estadísticos se cambió de 30 miligramos a 100 miligramos para
reflejar el aumento del consumo de esa sustancia por vía oral, en contraposición a la administración por vía parenteral. Se estableció una dosis diaria definida con fines estadísticos para el fentanilo cuan-do es utilizado como analgésico (no hay una dosis diaria definida con fines estadísticos para el utilizado como anestésico). Se establecieron dos dosis diarias definidas con fines estadísticos para la codeína y la dihidrocodeína, a fin de reflejar la diferencia en la utilización de esas sustancias como analgésicos y como antitusígenos.
En el caso de la buprenorfina, opioide actualmente sujeto a fiscalización en virtud del Convenio de 1971, la S-DDD utilizada en estos cuadros es de 8 miligramos, valor que refleja su uso para el tratamiento de sustitución.1
Cuadro XIV.1
El cuadro XIV.1 se ha subdividido en nueve cuadros (cuadros XIV.1 a-i). En el cuadro XIV.1.a se pueden comparar los niveles de consumo de estupefacientes entre los países y territorios de todo el mundo, en tanto que en los cuadros XIV.1.b-h se indican los niveles de consumo en cada una de las regiones, consignando, para cada país o territorio de una región determinada, datos sobre el consumo y el lugar que ocupa en los planos regional y mundial, a fin de dar una idea más clara del nivel de consumo de cada país o territorio en relación con su región. Por último, en el cuadro XIV.1.i se ofrece una visión general de los niveles de consumo de todas las regiones a efectos de la comparación entre una y otra región en su conjunto.
Las agrupaciones regionales usadas en los cuadros XIV.1.b-i, así como la lista de países de cada una de esas agrupaciones, son las empleadas en el Informe de la Junta Internacional de Fiscalización de Estupefacientes correspondiente a 2012 (publicación de las Naciones Unidas, núm. de venta S.13.XI.5). Sin embargo, en la pre-sente publicación los territorios se han incluido en las respectivas regiones.
En el cuadro XIV.1 no se han incluido los preparados de la Lista III, ya que los gobiernos no están obligados a informar a la Junta acerca del consumo ni el comercio internacional de esos pre-parados. Se incluyen los países y los territorios no metropolitanos que han comunicado el consumo de un estupefaciente en cantidades de menos de 1 S-DDD, marcados con el símbolo “<<”.
En el cuadro XIV.1. se presenta información sobre el consumo medio por países o territorios y por regiones de los ocho estupefa-cientes más consumidos y de buprenorfina, opioide actualmente clasificado en la Lista III del Convenio de 1971, expresada en dosis diarias definidas con fines estadísticos (S-DDD) por millón de habi-tantes por día (excluidos los preparados de la Lista III de la Conven-ción de 1961), en el trienio comprendido entre 2009 y 2011. Los niveles medios de consumo de otros estupefacientes (incluida la tilidina), para los que la Junta ha establecido dosis diarias definidas con fines estadísticos, figuran en la columna titulada “Otros.” Los países o territorios y regiones están ordenados según su consumo total de estupefacientes. Los datos correspondientes a la buprenor-fina, que están basados en cálculos de la JIFE y, por consiguiente, deben ser manejados con prudencia, no se incluyen en el consumo
Part fourQuatrièm
e partieCuarta parte
Tables — Tableau
x —
Cuadro
s
134
total y, por lo tanto, no influyen en el lugar que ocupan los países (véase la explicación relativa a la información sobre el consumo de buprenorfina en la nota correspondiente a los cuadros XII y XIII.1-XIII.3 supra).
Cuadro XIV.2
En el cuadro XIV.2 se presenta información sobre los niveles medios de utilización de estupefacientes a nivel mundial para la fabricación de preparados de la Lista III, expresados en dosis diarias definidas con fines estadísticos por millón de habitantes por día. La informa-ción presentada corresponde al decenio 2002-2011. Se presentainformación sobre la tendencia mundial de la utilización de los dis-tintos estupefacientes para la fabricación de preparados de la Lista III. Cabe suponer que esta tendencia es muy similar a la tendencia mundial del consumo de estupefacientes en forma de preparados de la Lista III.
Cuadro XIV.3
En el cuadro XIV.3 se presentan los datos sobre los niveles de con-sumo mundial de opioides, expresados en millones de dosis diarias definidas con fines estadísticos (S-DDD), correspondientes al período veinteñal 1992-2011. Se ofrece información por separado con res-pecto a los analgésicos a base de opiáceos, los analgésicos sinté-ticos y otros opiáceos sujetos a fiscalización con arreglo a la Convención de 1961. También se incluye información aparte sobre la buprenorfina, opioide en la actualidad fiscalizado con arreglo al Convenio sobre Sustancias Sicotrópicas de 1971, y sobre la meta-dona, opioide fiscalizado con arreglo a la Convención de 1961.
Algunos opioides tienen indicaciones de uso diversas. Por ejemplo, los opiáceos codeína, dihidrocodeína, etilmorfina e hidrocodona se pueden usar como analgésicos, pero se utilizan principalmente con fines que no son el de aliviar el dolor. La buprenorfina, la heroína, la metadona y la morfina son analgésicos, pero en algunos países se usan también, o exclusivamente, para el tratamiento de la drogo-dependencia por sustitución. La información estadística presentada a la Junta por los gobiernos no permite distinguir entre cantidades destinadas a fines diferentes. Por esa razón, se muestran los opiá-ceos y los opioides sintéticos agrupados según su uso principal comunicado a la Junta. En las notas del cuadro se explica la distri-bución de los opioides y los preparados que los contienen entre los diferentes grupos. Los niveles mundiales de consumo de buprenor-fina y metadona se presentan por separado cuando no se ha podido determinar la principal indicación de uso. La heroína se incluye en el grupo de otros opiáceos.
Cuadro XV
El cuadro XV contiene información sobre las existencias mundiales de estupefacientes. Las existencias de concentrado de paja de ador-midera se presentan en función del contenido total del alcaloide anhidro (alcaloide codeína anhidra (ACA), alcaloide morfina anhidra (AMA), alcaloide oripavina anhidra (AOA) y alcaloide tebaína anhidra (ATA)) del concentrado, expresado al 100% del alcaloide respectivo. En consecuencia, los datos sobre las existencias de concentrado de paja de adormidera no son directamente comparables con los reco-gidos en las ediciones anteriores a 2005 de la presente publicación, en que el concentrado de paja de adormidera se expresaba al 50% del principal alcaloide que contenía.
1Sustancias Sicotrópicas: Estadísticas de 2011; Previsiones de las necesidades anuales para fines médicos y científicos de las sustancias de las Listas II, III y IV del Convenio sobre Sustancias Sicotrópicas de 1971 (publicación de las Naciones Unidas, núm. de venta: T.13.XI.3), cuadro IV, “Niveles de consumo de sustancias sicotrópicas por grupos en dosis diarias definidas con fines estadísticos (S-DDD) por millar de habitantes por día”.
135
Opium
Opio
Year
Année
Año
Country
Pays
País
Area
Superficie
Yieldper hectare
Rendementpar hectare
Rendimientopor hectárea
Exports
Exportations
Exportaciones
(ha) (kg) (kg) (kg)
Table I. Cultivation of Papaver somniferum for the production of opium, 2007-2013(Statistics are shown for the years 2007-2011; estimates are indicated, in italics,
for the years 2012 and 2013)
Tableau I. Culture du Papaver somniferum pour la production d’opium, 2007-2013(Les statistiques sont indiquées pour les années 2007 à 2011;
les évaluations sont indiquées, en italique, pour les années 2012 et 2013)
Cuadro I. Cultivo de Papaver somniferum para la producción de opio, 2007-2013(Se indican las estadísticas de los años 2007 a 2011; se indican, en bastardilla,
las previsiones para los años 2012 y 2013)(For the explanatory notes to this table, see page 123 — Pour les notes explicatives à ce tableau, voir page 127 — Para las notas explicativas sobre este cuadro, véase página 131)
aStatistical report submitted but data for item in respect of opium cultivation area and production were not furnished by 1 November 2012. — Des statistiques ont été fournies, mais aucune donnée concernant la superficie des cultures de pavot à opium et la production d’opium n’a encore été communiquée au 1er novembre 2012. — Se presentó el informe estadístico, pero aún no se han facilitado los datos relativos a la superficie de cultivo y la producción de opio al 1o de noviembre de 2012.
bTotal estimated area and production for 2013 are incomplete (see footnote a). — Les données concernant la superficie des cultures et la production estimées pour 2013 sont incomplètes (voir note a). — La información relativa a la superficie y la producción totales estimadas correspondientes a 2013 está incompleta (véase la nota a).
China . . . . . . . . . . . . . . . . . . . . . . . . . . . . . . . . . . . 2007 140 12 780 91.3 —Chine 2008 100 8 695 87.0 —
2009 120 10 731 89.4 —2010 60 5 178 86.32011 — — — —
2012 80 7 200 90.02013 80 7 200 90.0
Democratic People’s Republic of Korea . . . . . . . 2007 130 455 3.5 —
République populaire démocratique de Corée 2008 130 450 3.5 —República Popular Democrática de Corea 2009 130 449 3.5 —
2010 120 480 4.0 —2011 . . 450 . . — 2012 120 600 5.02013 117 600 5.1
India . . . . . . . . . . . . . . . . . . . . . . . . . . . . . . . . . . . . 2007 5 913 269 111 45.5 488 851
Inde 2008 2 653 134 555 50.7 478 0322009 8 853 395 889 44.7 328 1442010 12 237 574 777 47.0 395 5282011 16 518 788 667 47.7 361 902 2012 21 220 990 000 46.72013 . . a . . a
Japan . . . . . . . . . . . . . . . . . . . . . . . . . . . . . . . . . . . . 2007 << 2 10.0 —
Japon 2008 << 2 8.9 —Japón 2009 << 2 10.0 —
2010 << 1 7.0 —2011 << 1 5.9 — 2012 << 1 6.22013 << 1 5.9
Total . . . . . . . . . . . . . . . . . . . . . . . . . . . . . . . . . . . . . 2007 6 183 282 348 488 851
2008 2 883 143 702 478 0322009 9 103 407 071 328 1442010 12 417 580 436 395 5282011 16 518 789 155 361 969 2012 21 420 997 8012013 197 b 7 801 b
Part fourQuatrièm
e partieCuarta parte
Tables — Tableaux —
Cuadros
136
Yieldper hectare
Rendementpar hectare
Rendimientopor hectárea
Year
Année
Año
Quantityharvestedc
Quantitérécoltéec
Cantidadcosechadac
Area
Superficie
Superficie
Country
Pays
País
Exports
Exportations
Exporta-ciones
(ha) (kg) (kg) (kg)
Yieldper hectare
Rendementpar hectare
Rendimientopor hectárea
Quantityharvestedc
Quantitérécoltéec
Cantidadcosechadac
Area
Superficie
Superficie
Exports
Exportations
Exporta-ciones
(ha) (kg) (kg) (kg)
Poppy straw (M)a
Paille de pavot (M)a
Paja de adormidera (M)a
Poppy straw (T)b
Paille de pavot (T)b
Paja de adormidera (T)b
Table II. Cultivation of Papaver somniferum for purposesother than the production of opium, 2007-2013
(Statistics are shown for the years 2007-2011;estimates are indicated, in italics, for the years 2012 and 2013)
Tableau II. Culture du Papaver somniferum pour d’autres finsque la production d’opium, 2007-2013
(Les statistiques sont indiquées pour les années 2007 à 2011;les évaluations sont indiquées, en italique, pour les années 2012 et 2013)
Cuadro II. Cultivo de Papaver somniferum para fines distintosde la producción de opio, 2007-2013
(Se indican las estadísticas de los años 2007 a 2011;se indican, en bastardilla, las previsiones para los años 2012 y 2013)
(For the explanatory notes to this table, see page 123 — Pour les notes explicatives à ce tableau, voir page 127 — Para las notas explicativas sobre este cuadro, véase página 131)
Australia . . . . . . . . . . . . . . . . . . . . . 2007 4 661 3 827 266 821 — 3 837 3 431 260 894 —Australie 2008 4 108 2 303 975 561 — 7 807 6 130 099 785 —
2009 4 299 3 250 778 756 — 9 594 8 669 941 904 —2010 8 547 7 091 102 830 — 10 921 10 135 860 928 —
580 d 415 300 716 — 2011 9 046 6 323 029 e 699 — 13 165 13 112 447 996 —
1 927 d 1 390 000 721 —
2012 17 120 12 390 490 d
2013 9 000 12 000 2 100 d
Austria . . . . . . . . . . . . . . . . . . . . . . . 2007 2 644 f 22 875
Autriche 2008 2 011 f 18 205 2009 2 186 f 17 125 2010 2 536 f 13 605 2011 1 740 f 15 650
2012 2 536 f 2013 1 740 f
China . . . . . . . . . . . . . . . . . . . . . . . . 2007 1 180 1 332 000 1 129 — — — — —
Chine 2008 1 480 1 800 000 1 216 — — — — —2009 1 600 1 800 000 1 125 — — — — —2010 1 570 1 767 375 1 126 — — — — —2011 1 684 1 894 500 1 125 — 16 7 330 458 —
2012 1 600 70 2013 1 600 30
Czech Republic . . . . . . . . . . . . . . . . 2007 53 710 2 947 090 g 55 2 208 250
République tchèque 2008 66 560 1 985 340 g 30 1 985 340 República Checa 2009 50 432 2 800 000 g 56 2 851 330
2010 46 461 2 555 355 g 55 3 388 740 2011 33 111 1 821 105 g 55 1 849 240
2012 45 000 2013 18 000
137
Table II. Cultivation of Papaver somniferum for purposesother than the production of opium, 2007-2013 (continued)
Tableau II. Culture du Papaver somniferum pour d’autres finsque la production d’opium, 2007-2013 (suite)
Cuadro II. Cultivo de Papaver somniferum para fines distintosde la producción de opio, 2007-2013 (continuación)
Yieldper hectare
Rendementpar hectare
Rendimientopor hectárea
Year
Année
Año
Quantityharvestedc
Quantitérécoltéec
Cantidadcosechadac
Area
Superficie
Superficie
Country
Pays
País
Exports
Exportations
Exporta-ciones
(ha) (kg) (kg) (kg)
Yieldper hectare
Rendementpar hectare
Rendimientopor hectárea
Quantityharvestedc
Quantitérécoltéec
Cantidadcosechadac
Area
Superficie
Superficie
Exports
Exportations
Exporta-ciones
(ha) (kg) (kg) (kg)
Poppy straw (M)a
Paille de pavot (M)a
Paja de adormidera (M)a
Poppy straw (T)b
Paille de pavot (T)b
Paja de adormidera (T)b
France . . . . . . . . . . . . . . . . . . . . . . . 2007 3 198 1 544 500 483 — 2 707 1 462 800 540 —Francia 2008 4 640 2 701 320 582 — 2 534 1 954 560 771 —
2009 6 718 4 717 320 702 83 000 2 993 3 172 340 1 060 —2010 9 400 5 800 000 617 120 560 700 300 000 429 —2011 8 592 4 744 290 552 — 110 40 580 369 — 2012 11 000 2 000 2013 11 000 2 000
Germany. . . . . . . . . . . . . . . . . . . . . . 2007 51 f 870 Allemagne 2008 54 f 1 152 Alemania 2009 108 f 1 833
2010 108 f 535 2011 61 f 953 2012 368 f 2013 300 f
Hungary . . . . . . . . . . . . . . . . . . . . . . 2007 3 269 1 914 593 586 40 577 5 790 158 790 Hongrie 2008 3 524 1 311 375 372 14 434 — — — — Hungría 2009 1 910 1 126 122 590 700 — — — —
2010 7 308 3 930 617 538 49 621 — — — —2011 6 025 3 009 310 499 61 270 1 532 525 310 343 — 2012 10 810 3 000 2013 12 810 5 100
Netherlands . . . . . . . . . . . . . . . . . . . 2007 . . f Pays-Bas 2008 . . f Países Bajos 2009 . . f
2010 . . f 2011 . . f 2012 800 f 2013 800 f
New Zealand . . . . . . . . . . . . . . . . . . 2007 — — — — —Nouvelle-Zélande 2008 — — — — —Nueva Zelandia 2009 — << h 39 h 1 303 —
2010 — << h 66 h 207 —2011 — 1.8 h . . h . . — 2012 << h
2013 6 i
Poland . . . . . . . . . . . . . . . . . . . . . . . 2007 969 f Pologne 2008 580 f Polonia 2009 652 f
2010 281 f 2011 . . f 2012 2 300 f 2013 1 500 f
Part fourQuatrièm
e partieCuarta parte
Tables — Tableaux —
Cuadros
138
Table II. Cultivation of Papaver somniferum for purposesother than the production of opium, 2007-2013 (continued)
Tableau II. Culture du Papaver somniferum pour d’autres finsque la production d’opium, 2007-2013 (suite)
Cuadro II. Cultivo de Papaver somniferum para fines distintosde la producción de opio, 2007-2013 (continuación)
Yieldper hectare
Rendementpar hectare
Rendimientopor hectárea
Year
Année
Año
Quantityharvestedc
Quantitérécoltéec
Cantidadcosechadac
Area
Superficie
Superficie
Country
Pays
País
Exports
Exportations
Exporta-ciones
(ha) (kg) (kg) (kg)
Yieldper hectare
Rendementpar hectare
Rendimientopor hectárea
Quantityharvestedc
Quantitérécoltéec
Cantidadcosechadac
Area
Superficie
Superficie
Exports
Exportations
Exporta-ciones
(ha) (kg) (kg) (kg)
Poppy straw (M)a
Paille de pavot (M)a
Paja de adormidera (M)a
Poppy straw (T)b
Paille de pavot (T)b
Paja de adormidera (T)b
Slovakia . . . . . . . . . . . . . . . . . . . . . . 2007 1 200 106 990 g 89 — Slovaquie 2008 1 000 36 210 g 36 — Eslovaquia 2009 1 200 163 780 g 136 41 123
2010 1 500 359 030 g 239 36 258 2011 900 265 879 g 295 181 962
2012 1 700 2013 1 200
Spain . . . . . . . . . . . . . . . . . . . . . . . . 2007 5 606 3 660 000 653 546 1 482 1 570 000 1 059 —
Espagne 2008 5 507 3 687 150 670 — 2 537 2 851 000 1 124 —España 2009 6 875 3 702 049 538 1 625 4 925 4 448 612 903 —
2010 6 439 4 257 000 661 10 3 528 2 808 000 796 —2011 9 488 6 353 900 670 731 967 186 135 664 729 —
2012 10 000 2 000 2013 10 100 3 800
The former Yugoslav Rep. . . . . . . 2007 328 98 302 300 —
of Macedonia — L’ex-Rép. 2008 397 118 985 300 — yougoslave de Macédoine 2009 487 146 190 300 —
La ex Rep. Yugoslava 2010 355 106 644 300 — de Macedonia 2011 108 32 345 299 —
2012 850 2013 750
Turkey. . . . . . . . . . . . . . . . . . . . . . . . 2007 24 603 8 164 000 332 —
Turquie 2008 20 042 9 849 000 491 — Turquía 2009 48 893 31 094 000 636 —
2010 51 987 33 555 000 645 — 2011 54 911 40 979 000 746 —
2012 70 000 2013 70 000
Ukraine . . . . . . . . . . . . . . . . . . . . . . 2007 . . f — Ucrania 2008 . . f —
2009 . . f — 2010 3 200 f — 2011 679 f —
2012 5 072 f 2013 1 365 f
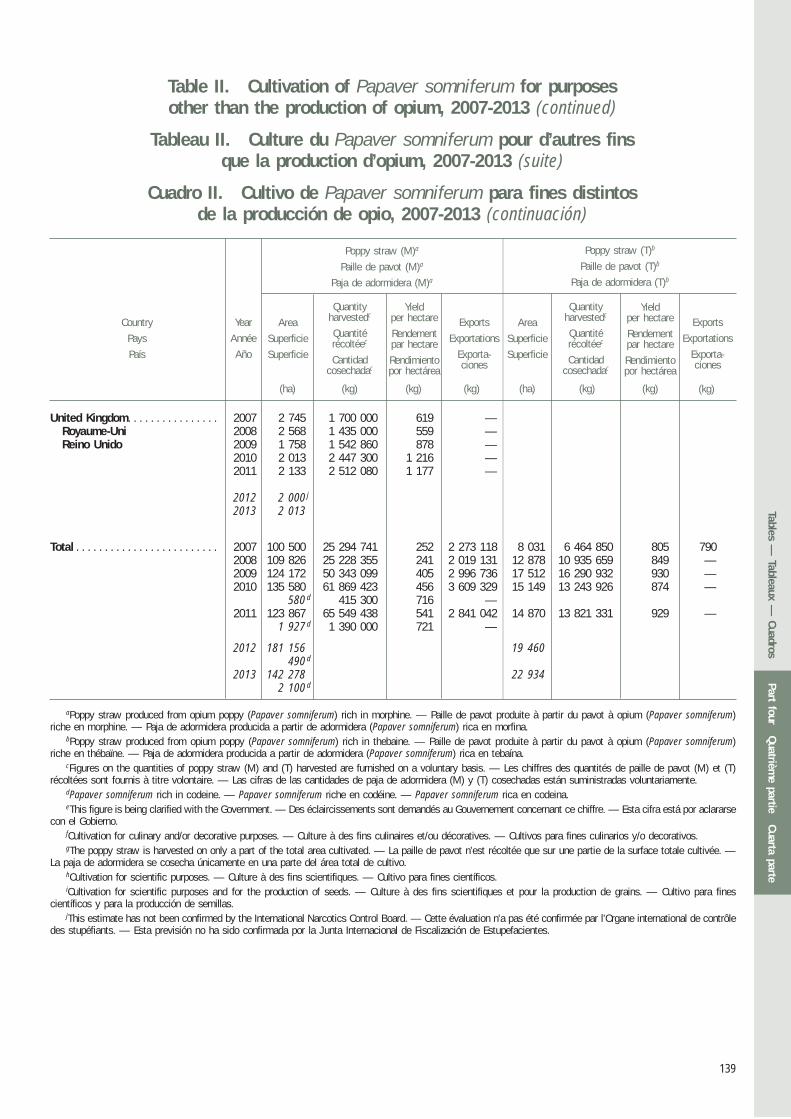
139
Table II. Cultivation of Papaver somniferum for purposesother than the production of opium, 2007-2013 (continued)
Tableau II. Culture du Papaver somniferum pour d’autres finsque la production d’opium, 2007-2013 (suite)
Cuadro II. Cultivo de Papaver somniferum para fines distintosde la producción de opio, 2007-2013 (continuación)
Yieldper hectare
Rendementpar hectare
Rendimientopor hectárea
Year
Année
Año
Quantityharvestedc
Quantitérécoltéec
Cantidadcosechadac
Area
Superficie
Superficie
Country
Pays
País
Exports
Exportations
Exporta-ciones
(ha) (kg) (kg) (kg)
Yieldper hectare
Rendementpar hectare
Rendimientopor hectárea
Quantityharvestedc
Quantitérécoltéec
Cantidadcosechadac
Area
Superficie
Superficie
Exports
Exportations
Exporta-ciones
(ha) (kg) (kg) (kg)
Poppy straw (M)a
Paille de pavot (M)a
Paja de adormidera (M)a
Poppy straw (T)b
Paille de pavot (T)b
Paja de adormidera (T)b
United Kingdom. . . . . . . . . . . . . . . . 2007 2 745 1 700 000 619 — Royaume-Uni 2008 2 568 1 435 000 559 — Reino Unido 2009 1 758 1 542 860 878 —
2010 2 013 2 447 300 1 216 — 2011 2 133 2 512 080 1 177 —
2012 2 000 j 2013 2 013
Total . . . . . . . . . . . . . . . . . . . . . . . . . 2007 100 500 25 294 741 252 2 273 118 8 031 6 464 850 805 790
2008 109 826 25 228 355 241 2 019 131 12 878 10 935 659 849 —2009 124 172 50 343 099 405 2 996 736 17 512 16 290 932 930 —2010 135 580 61 869 423 456 3 609 329 15 149 13 243 926 874 —
580 d 415 300 716 — 2011 123 867 65 549 438 541 2 841 042 14 870 13 821 331 929 —
1 927 d 1 390 000 721 —
2012 181 156 19 460 490 d
2013 142 278 22 934 2 100 d
aPoppy straw produced from opium poppy (Papaver somniferum) rich in morphine. — Paille de pavot produite à partir du pavot à opium (Papaver somniferum)riche en morphine. — Paja de adormidera producida a partir de adormidera (Papaver somniferum) rica en morfina.
bPoppy straw produced from opium poppy (Papaver somniferum) rich in thebaine. — Paille de pavot produite à partir du pavot à opium (Papaver somniferum)riche en thébaïne. — Paja de adormidera producida a partir de adormidera (Papaver somniferum) rica en tebaína.
cFigures on the quantities of poppy straw (M) and (T) harvested are furnished on a voluntary basis. — Les chiffres des quantités de paille de pavot (M) et (T) récoltées sont fournis à titre volontaire. — Las cifras de las cantidades de paja de adormidera (M) y (T) cosechadas están suministradas voluntariamente.
dPapaver somniferum rich in codeine. — Papaver somniferum riche en codéine. — Papaver somniferum rica en codeina.eThis figure is being clarified with the Government. — Des éclaircissements sont demandés au Gouvernement concernant ce chiffre. — Esta cifra está por aclararse
con el Gobierno.fCultivation for culinary and/or decorative purposes. — Culture à des fins culinaires et/ou décoratives. — Cultivos para fines culinarios y/o decorativos.gThe poppy straw is harvested on only a part of the total area cultivated. — La paille de pavot n’est récoltée que sur une partie de la surface totale cultivée. —
La paja de adormidera se cosecha únicamente en una parte del área total de cultivo.hCultivation for scientific purposes. — Culture à des fins scientifiques. — Cultivo para fines científicos.iCultivation for scientific purposes and for the production of seeds. — Culture à des fins scientifiques et pour la production de grains. — Cultivo para fines
científicos y para la producción de semillas.jThis estimate has not been confirmed by the International Narcotics Control Board. — Cette évaluation n’a pas été confirmée par l’Organe international de contrôle
des stupéfiants. — Esta previsión no ha sido confirmada por la Junta Internacional de Fiscalización de Estupefacientes.
Part fourQuatrièm
e partieCuarta parte
Tables — Tableaux —
Cuadros
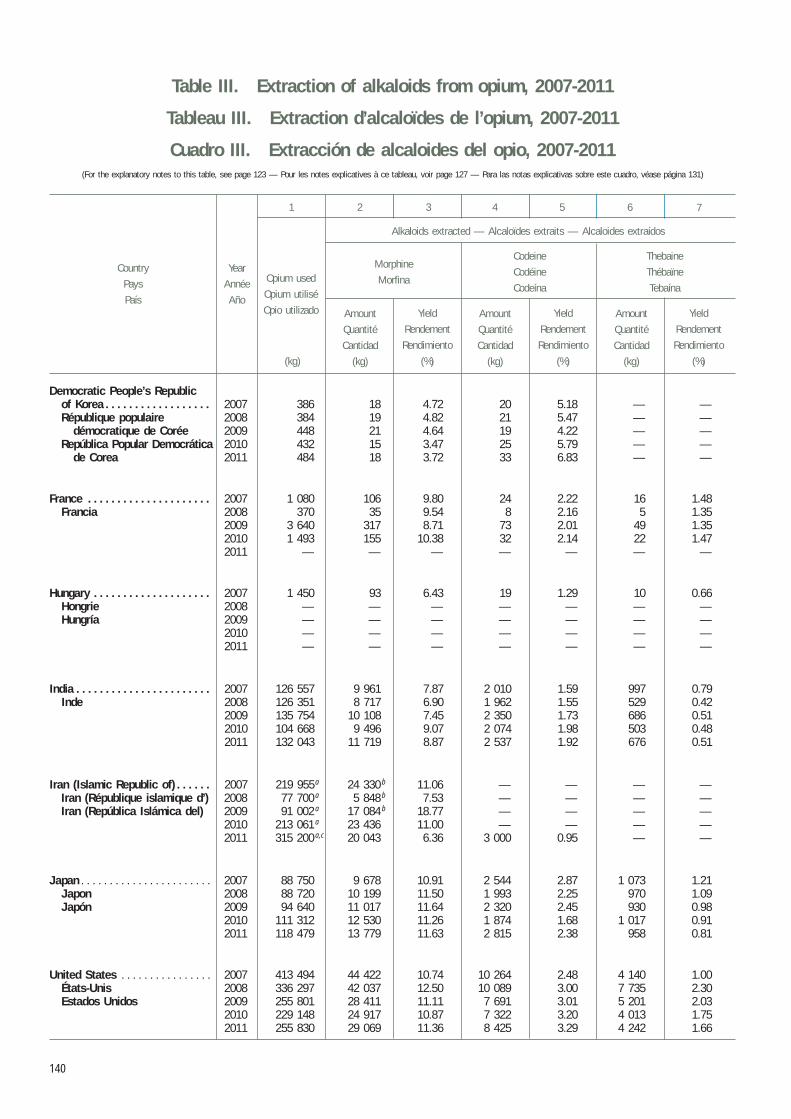
140
Year
Année
Año
Country
Pays
País
Opium used
Opium utilisé
Opio utilizado
1 2 3 4 5 6 7
Alkaloids extracted — Alcaloïdes extraits — Alcaloides extraídos
Codeine
Codéine
Codeína
Morphine
Morfina
Thebaine
Thébaïne
Tebaína
Yield
Rendement
Rendimiento
(%)
Yield
Rendement
Rendimiento
(%)
Yield
Rendement
Rendimiento
(%)(kg)
Amount
Quantité
Cantidad
(kg)
Amount
Quantité
Cantidad
(kg)
Amount
Quantité
Cantidad
(kg)
Table III. Extraction of alkaloids from opium, 2007-2011
Tableau III. Extraction d’alcaloïdes de l’opium, 2007-2011
Cuadro III. Extracción de alcaloides del opio, 2007-2011(For the explanatory notes to this table, see page 123 — Pour les notes explicatives à ce tableau, voir page 127 — Para las notas explicativas sobre este cuadro, véase página 131)
Democratic People’s Republicof Korea . . . . . . . . . . . . . . . . . . 2007 386 18 4.72 20 5.18 — —République populaire 2008 384 19 4.82 21 5.47 — —
démocratique de Corée 2009 448 21 4.64 19 4.22 — —República Popular Democrática 2010 432 15 3.47 25 5.79 — —
de Corea 2011 484 18 3.72 33 6.83 — —
France . . . . . . . . . . . . . . . . . . . . . 2007 1 080 106 9.80 24 2.22 16 1.48
Francia 2008 370 35 9.54 8 2.16 5 1.352009 3 640 317 8.71 73 2.01 49 1.352010 1 493 155 10.38 32 2.14 22 1.472011 — — — — — — —
Hungary . . . . . . . . . . . . . . . . . . . . 2007 1 450 93 6.43 19 1.29 10 0.66
Hongrie 2008 — — — — — — —Hungría 2009 — — — — — — —
2010 — — — — — — —2011 — — — — — — —
India . . . . . . . . . . . . . . . . . . . . . . . 2007 126 557 9 961 7.87 2 010 1.59 997 0.79
Inde 2008 126 351 8 717 6.90 1 962 1.55 529 0.422009 135 754 10 108 7.45 2 350 1.73 686 0.512010 104 668 9 496 9.07 2 074 1.98 503 0.482011 132 043 11 719 8.87 2 537 1.92 676 0.51
Iran (Islamic Republic of) . . . . . . 2007 219 955a 24 330 b 11.06 — — — —
Iran (République islamique d’) 2008 77 700 a 5 848 b 7.53 — — — —Iran (República Islámica del) 2009 91 002 a 17 084 b 18.77 — — — —
2010 213 061 a 23 436 11.00 — — — —2011 315 200 a,c 20 043 6.36 3 000 0.95 — —
Japan . . . . . . . . . . . . . . . . . . . . . . . 2007 88 750 9 678 10.91 2 544 2.87 1 073 1.21
Japon 2008 88 720 10 199 11.50 1 993 2.25 970 1.09Japón 2009 94 640 11 017 11.64 2 320 2.45 930 0.98
2010 111 312 12 530 11.26 1 874 1.68 1 017 0.912011 118 479 13 779 11.63 2 815 2.38 958 0.81
United States . . . . . . . . . . . . . . . . 2007 413 494 44 422 10.74 10 264 2.48 4 140 1.00 États-Unis 2008 336 297 42 037 12.50 10 089 3.00 7 735 2.30
Estados Unidos 2009 255 801 28 411 11.11 7 691 3.01 5 201 2.032010 229 148 24 917 10.87 7 322 3.20 4 013 1.752011 255 830 29 069 11.36 8 425 3.29 4 242 1.66
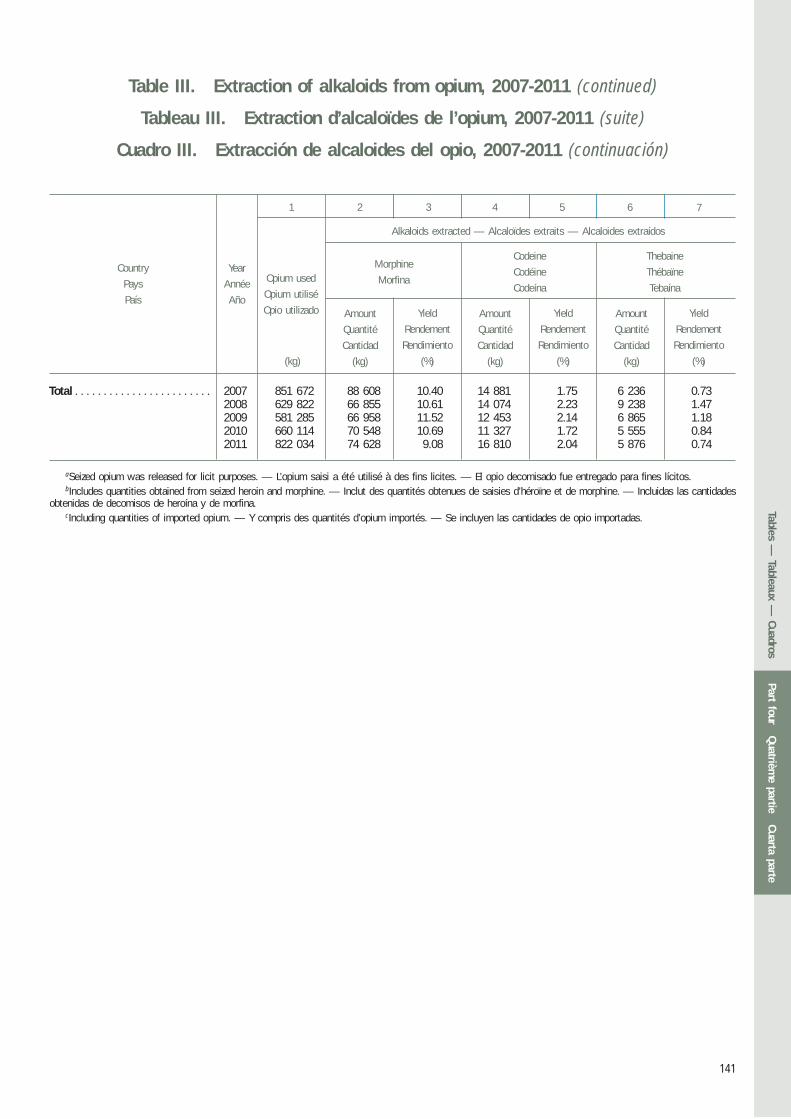
141
Table III. Extraction of alkaloids from opium, 2007-2011 (continued)
Tableau III. Extraction d’alcaloïdes de l’opium, 2007-2011 (suite)
Cuadro III. Extracción de alcaloides del opio, 2007-2011 (continuación)
Year
Année
Año
Country
Pays
País
Opium used
Opium utilisé
Opio utilizado
1 2 3 4 5 6 7
Alkaloids extracted — Alcaloïdes extraits — Alcaloides extraídos
Thebaine
Thébaïne
Tebaína
Yield
Rendement
Rendimiento
(%)
Yield
Rendement
Rendimiento
(%)
Yield
Rendement
Rendimiento
(%)(kg)
Amount
Quantité
Cantidad
(kg)
Amount
Quantité
Cantidad
(kg)
Amount
Quantité
Cantidad
(kg)
Codeine
Codéine
Codeína
Morphine
Morfina
aSeized opium was released for licit purposes. — L’opium saisi a été utilisé à des fins licites. — El opio decomisado fue entregado para fines lícitos.bIncludes quantities obtained from seized heroin and morphine. — Inclut des quantités obtenues de saisies d’héroïne et de morphine. — Incluidas las cantidades
obtenidas de decomisos de heroína y de morfina.cIncluding quantities of imported opium. — Y compris des quantités d’opium importés. — Se incluyen las cantidades de opio importadas.
Total . . . . . . . . . . . . . . . . . . . . . . . . 2007 851 672 88 608 10.40 14 881 1.75 6 236 0.732008 629 822 66 855 10.61 14 074 2.23 9 238 1.472009 581 285 66 958 11.52 12 453 2.14 6 865 1.182010 660 114 70 548 10.69 11 327 1.72 5 555 0.842011 822 034 74 628 9.08 16 810 2.04 5 876 0.74
Part fourQuatrièm
e partieCuarta parte
Tables — Tableaux —
Cuadros
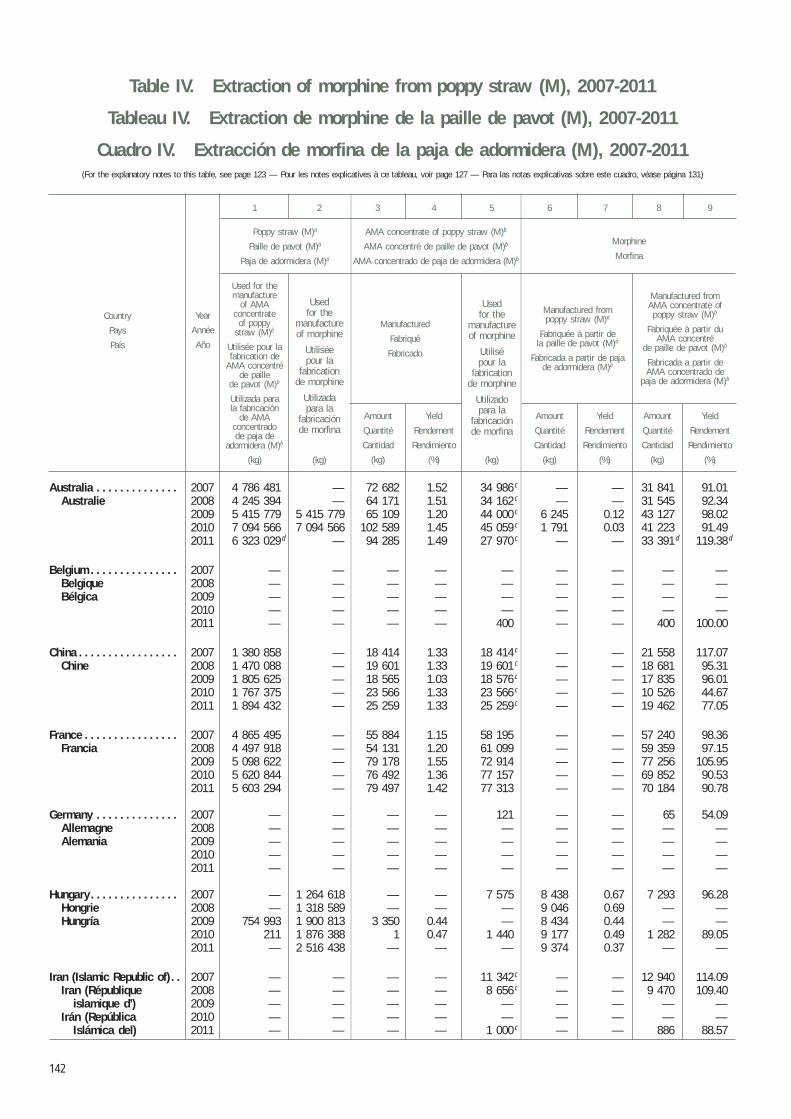
142
Year
Année
Año
Country
Pays
País
Poppy straw (M)a
Paille de pavot (M)a
Paja de adormidera (M)a
1 2 3 4 5 6 7
AMA concentrate of poppy straw (M)b
AMA concentré de paille de pavot (M)b
AMA concentrado de paja de adormidera (M)b
Yield
Rendement
Rendimiento
(%)
Yield
Rendement
Rendimiento
(%)(kg) (kg)
8 9
Yield
Rendement
Rendimiento
(%)
Used for themanufacture
of AMA concentrate
of poppy straw (M)b
Utilisée pour la fabrication de
AMA concentréde paille
de pavot (M)b
Utilizada parala fabricación
de AMA concentradode paja de
adormidera (M)b
Usedfor the
manufactureof morphine
Utiliséepour la
fabricationde morphine
Utilizadapara la
fabricaciónde morfina
Manufactured
Fabriqué
Fabricado
Usedfor the
manufactureof morphine
Utilisépour la
fabricationde morphine
Utilizadopara la
fabricaciónde morfina
Manufactured from poppy straw (M)a
Fabriquée à partir de la paille de pavot (M)a
Fabricada a partir de paja de adormidera (M)a
Manufactured fromAMA concentrate of
poppy straw (M)b
Fabriquée à partir du AMA concentré
de paille de pavot (M)b
Fabricada a partir deAMA concentrado de
paja de adormidera (M)b
Morphine
Morfina
(kg)
Amount
Quantité
Cantidad
(kg)
Amount
Quantité
Cantidad
(kg)
Amount
Quantité
Cantidad
(kg)
Table IV. Extraction of morphine from poppy straw (M), 2007-2011
Tableau IV. Extraction de morphine de la paille de pavot (M), 2007-2011
Cuadro IV. Extracción de morfina de la paja de adormidera (M), 2007-2011(For the explanatory notes to this table, see page 123 — Pour les notes explicatives à ce tableau, voir page 127 — Para las notas explicativas sobre este cuadro, véase página 131)
Australia . . . . . . . . . . . . . . 2007 4 786 481 — 72 682 1.52 34 986 c — — 31 841 91.01Australie 2008 4 245 394 — 64 171 1.51 34 162 c — — 31 545 92.34
2009 5 415 779 5 415 779 65 109 1.20 44 000 c 6 245 0.12 43 127 98.022010 7 094 566 7 094 566 102 589 1.45 45 059 c 1 791 0.03 41 223 91.492011 6 323 029 d — 94 285 1.49 27 970 c — — 33 391 d 119.38 d
Belgium . . . . . . . . . . . . . . . 2007 — — — — — — — — —Belgique 2008 — — — — — — — — —Bélgica 2009 — — — — — — — — —
2010 — — — — — — — — —2011 — — — — 400 — — 400 100.00
China . . . . . . . . . . . . . . . . . 2007 1 380 858 — 18 414 1.33 18 414 c — — 21 558 117.07Chine 2008 1 470 088 — 19 601 1.33 19 601 c — — 18 681 95.31
2009 1 805 625 — 18 565 1.03 18 576 c — — 17 835 96.012010 1 767 375 — 23 566 1.33 23 566 c — — 10 526 44.672011 1 894 432 — 25 259 1.33 25 259 c — — 19 462 77.05
France . . . . . . . . . . . . . . . . 2007 4 865 495 — 55 884 1.15 58 195 — — 57 240 98.36Francia 2008 4 497 918 — 54 131 1.20 61 099 — — 59 359 97.15
2009 5 098 622 — 79 178 1.55 72 914 — — 77 256 105.952010 5 620 844 — 76 492 1.36 77 157 — — 69 852 90.532011 5 603 294 — 79 497 1.42 77 313 — — 70 184 90.78
Germany . . . . . . . . . . . . . . 2007 — — — — 121 — — 65 54.09Allemagne 2008 — — — — — — — — —Alemania 2009 — — — — — — — — —
2010 — — — — — — — — —2011 — — — — — — — — —
Hungary . . . . . . . . . . . . . . . 2007 — 1 264 618 — — 7 575 8 438 0.67 7 293 96.28Hongrie 2008 — 1 318 589 — — — 9 046 0.69 — —Hungría 2009 754 993 1 900 813 3 350 0.44 — 8 434 0.44 — —
2010 211 1 876 388 1 0.47 1 440 9 177 0.49 1 282 89.052011 — 2 516 438 — — — 9 374 0.37 — —
Iran (Islamic Republic of) . . 2007 — — — — 11 342 c — — 12 940 114.09Iran (République 2008 — — — — 8 656 c — — 9 470 109.40
islamique d’) 2009 — — — — — — — — —Irán (República 2010 — — — — — — — — —
Islámica del) 2011 — — — — 1 000 c — — 886 88.57

143
Table IV. Extraction of morphine from poppy straw (M), 2007-2011 (continued)
Tableau IV. Extraction de morphine de la paille de pavot (M), 2007-2011 (suite)
Cuadro IV. Extracción de morfina de la paja de adormidera (M), 2007-2011 (continuación)
Year
Année
Año
Country
Pays
País
Poppy straw (M)a
Paille de pavot (M)a
Paja de adormidera (M)a
1 2 3 4 5 6 7
AMA concentrate of poppy straw (M)b
AMA concentré de paille de pavot (M)b
AMA concentrado de paja de adormidera (M)b
Yield
Rendement
Rendimiento
(%)
Yield
Rendement
Rendimiento
(%)(kg) (kg)
8 9
Yield
Rendement
Rendimiento
(%)
Used for themanufacture
of AMA concentrate
of poppy straw (M)b
Utilisée pour la fabrication de
AMA concentréde paille
de pavot (M)b
Utilizada parala fabricación
de AMA concentradode paja de
adormidera (M)b
Usedfor the
manufactureof morphine
Utiliséepour la
fabricationde morphine
Utilizadapara la
fabricaciónde morfina
Manufactured
Fabriqué
Fabricado
Usedfor the
manufactureof morphine
Utilisépour la
fabricationde morphine
Utilizadopara la
fabricaciónde morfina
Manufactured from poppy straw (M)a
Fabriquée à partir de la paille de pavot (M)a
Fabricada a partir de paja de adormidera (M)a
Manufactured fromAMA concentrate of
poppy straw (M)b
Fabriquée à partir du AMA concentré
de paille de pavot (M)b
Fabricada a partir deAMA concentrado de
paja de adormidera (M)b
Morphine
Morfina
(kg)
Amount
Quantité
Cantidad
(kg)
Amount
Quantité
Cantidad
(kg)
Amount
Quantité
Cantidad
(kg)
Italy . . . . . . . . . . . . . . . . . . 2007 — — — — 2 144 — — 2 101 98.00Italie 2008 — — — — 2 375 — — 2 328 98.01Italia 2009 — — — — 908 c — — 755 83.16
2010 — — — — 2 225 — — 2 008 90.252011 — — — — 1 590 — — 1 305 82.06
Norway . . . . . . . . . . . . . . . 2007 — — — — 12 320 c — — 12 846 104.27Norvège 2008 — — — — 9 677 c — — 9 999 103.33Noruega 2009 — — — — 11 863 c — — 12 243 103.21
2010 — — — — 17 799 c — — 18 285 101.592011 — — — — 16 948 c — — 17 212 101.56
Portugal . . . . . . . . . . . . . . . 2007 — — — — 3 675 c — — 4 020 109.382008 — — — — 1 305 c — — 1 109 84.992009 — — — — — — — — —2010 — — — — — — — — —2011 — — — — — — — — —
Slovakia . . . . . . . . . . . . . . . 2007 — 3 071 403 — — — 7 502 0.24 — —Slovaquie 2008 — 1 436 183 — — — 4 491 0.31 — —Eslovaquia 2009 — 3 898 000 — — — 11 371 0.29 — —
2010 — 4 069 430 — — — 11 462 0.28 — —2011 — 1 853 338 — — 7 273 3 025 0.16 7 022 96.54
South Africa . . . . . . . . . . . 2007 — — — — 7 783 — — 7 663 98.46Afrique du Sud 2008 — — — — 7 807 — — 7 714 98.81Sudáfrica 2009 — — — — 8 950 — — 8 565 95.70
2010 — — — — 10 273 — — 9 767 95.082011 — — — — 10 214 — — 8 398 82.22
Spain . . . . . . . . . . . . . . . . . 2007 3 994 955 — 47 608 1.19 129 — — 116 89.92Espagne 2008 3 809 150 — 53 407 1.40 1 120 — — 1 036 92.49España 2009 4 067 820 — 52 901 1.30 3 030 — — 2 790 92.07
2010 4 026 930 — 45 058 1.12 5 995 — — 5 518 92.042011 6 350 780 — 73 656 1.16 15 658 — — 14 461 92.36
Switzerland . . . . . . . . . . . . 2007 — — — — 75 — — — —Suisse 2008 — — — — 319 — — 298 93.30Suiza 2009 — — — — 120 — — 107 88.97
2010 — — — — 2 517 — — 2 485 98.752011 — — — — 1 073 — — 1 101 102.58
Part fourQuatrièm
e partieCuarta parte
Tables — Tableaux —
Cuadros
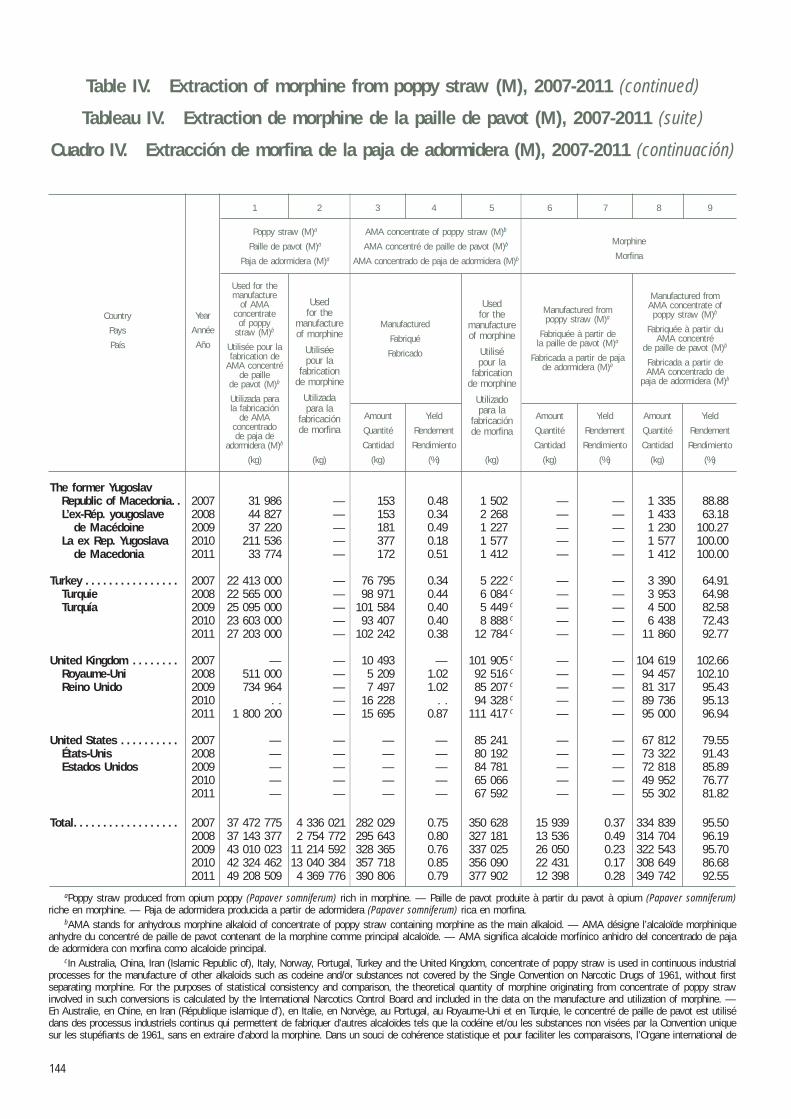
144
Table IV. Extraction of morphine from poppy straw (M), 2007-2011 (continued)
Tableau IV. Extraction de morphine de la paille de pavot (M), 2007-2011 (suite)
Cuadro IV. Extracción de morfina de la paja de adormidera (M), 2007-2011 (continuación)
Year
Année
Año
Country
Pays
País
Poppy straw (M)a
Paille de pavot (M)a
Paja de adormidera (M)a
1 2 3 4 5 6 7
AMA concentrate of poppy straw (M)b
AMA concentré de paille de pavot (M)b
AMA concentrado de paja de adormidera (M)b
Yield
Rendement
Rendimiento
(%)
Yield
Rendement
Rendimiento
(%)(kg) (kg)
8 9
Yield
Rendement
Rendimiento
(%)
Used for themanufacture
of AMA concentrate
of poppy straw (M)b
Utilisée pour la fabrication de
AMA concentréde paille
de pavot (M)b
Utilizada parala fabricación
de AMA concentradode paja de
adormidera (M)b
Usedfor the
manufactureof morphine
Utiliséepour la
fabricationde morphine
Utilizadapara la
fabricaciónde morfina
Manufactured
Fabriqué
Fabricado
Usedfor the
manufactureof morphine
Utilisépour la
fabricationde morphine
Utilizadopara la
fabricaciónde morfina
Manufactured from poppy straw (M)a
Fabriquée à partir de la paille de pavot (M)a
Fabricada a partir de paja de adormidera (M)a
Manufactured fromAMA concentrate of
poppy straw (M)b
Fabriquée à partir du AMA concentré
de paille de pavot (M)b
Fabricada a partir deAMA concentrado de
paja de adormidera (M)b
Morphine
Morfina
(kg)
Amount
Quantité
Cantidad
(kg)
Amount
Quantité
Cantidad
(kg)
Amount
Quantité
Cantidad
(kg)
aPoppy straw produced from opium poppy (Papaver somniferum) rich in morphine. — Paille de pavot produite à partir du pavot à opium (Papaver somniferum) riche en morphine. — Paja de adormidera producida a partir de adormidera (Papaver somniferum) rica en morfina.
bAMA stands for anhydrous morphine alkaloid of concentrate of poppy straw containing morphine as the main alkaloid. — AMA désigne l’alcaloïde morphinique anhydre du concentré de paille de pavot contenant de la morphine comme principal alcaloïde. — AMA significa alcaloide morfínico anhidro del concentrado de paja de adormidera con morfina como alcaloide principal.
cIn Australia, China, Iran (Islamic Republic of), Italy, Norway, Portugal, Turkey and the United Kingdom, concentrate of poppy straw is used in continuous industrial processes for the manufacture of other alkaloids such as codeine and/or substances not covered by the Single Convention on Narcotic Drugs of 1961, without first separating morphine. For the purposes of statistical consistency and comparison, the theoretical quantity of morphine originating from concentrate of poppy straw involved in such conversions is calculated by the International Narcotics Control Board and included in the data on the manufacture and utilization of morphine. — En Australie, en Chine, en Iran (République islamique d’), en Italie, en Norvège, au Portugal, au Royaume-Uni et en Turquie, le concentré de paille de pavot est utilisé dans des processus industriels continus qui permettent de fabriquer d’autres alcaloïdes tels que la codéine et/ou les substances non visées par la Convention unique sur les stupéfiants de 1961, sans en extraire d’abord la morphine. Dans un souci de cohérence statistique et pour faciliter les comparaisons, l’Organe international de
The former YugoslavRepublic of Macedonia . . 2007 31 986 — 153 0.48 1 502 — — 1 335 88.88L’ex-Rép. yougoslave 2008 44 827 — 153 0.34 2 268 — — 1 433 63.18
de Macédoine 2009 37 220 — 181 0.49 1 227 — — 1 230 100.27La ex Rep. Yugoslava 2010 211 536 — 377 0.18 1 577 — — 1 577 100.00
de Macedonia 2011 33 774 — 172 0.51 1 412 — — 1 412 100.00
Turkey . . . . . . . . . . . . . . . . 2007 22 413 000 — 76 795 0.34 5 222 c — — 3 390 64.91Turquie 2008 22 565 000 — 98 971 0.44 6 084 c — — 3 953 64.98Turquía 2009 25 095 000 — 101 584 0.40 5 449 c — — 4 500 82.58
2010 23 603 000 — 93 407 0.40 8 888 c — — 6 438 72.432011 27 203 000 — 102 242 0.38 12 784 c — — 11 860 92.77
United Kingdom . . . . . . . . 2007 — — 10 493 — 101 905 c — — 104 619 102.66Royaume-Uni 2008 511 000 — 5 209 1.02 92 516 c — — 94 457 102.10Reino Unido 2009 734 964 — 7 497 1.02 85 207 c — — 81 317 95.43
2010 . . — 16 228 . . 94 328 c — — 89 736 95.132011 1 800 200 — 15 695 0.87 111 417 c — — 95 000 96.94
United States . . . . . . . . . . 2007 — — — — 85 241 — — 67 812 79.55États-Unis 2008 — — — — 80 192 — — 73 322 91.43Estados Unidos 2009 — — — — 84 781 — — 72 818 85.89
2010 — — — — 65 066 — — 49 952 76.772011 — — — — 67 592 — — 55 302 81.82
Total . . . . . . . . . . . . . . . . . . 2007 37 472 775 4 336 021 282 029 0.75 350 628 15 939 0.37 334 839 95.502008 37 143 377 2 754 772 295 643 0.80 327 181 13 536 0.49 314 704 96.192009 43 010 023 11 214 592 328 365 0.76 337 025 26 050 0.23 322 543 95.702010 42 324 462 13 040 384 357 718 0.85 356 090 22 431 0.17 308 649 86.682011 49 208 509 4 369 776 390 806 0.79 377 902 12 398 0.28 349 742 92.55
145
contrôle des stupéfiants a calculé la quantité théorique de morphine fabriquée à partir du concentré de paille de pavot ainsi transformé et l’a incluse dans les statis-tiques relatives à la fabrication et à l’utilisation de morphine. — En Australia, China, Irán (República Islámica del), Italia, Noruega, Portugal, el Reino Unido y Turquía se utiliza concentrado de paja de adormidera en procesos industriales continuos para la fabricación de otros alcaloides, como la codeína, y/o sustancias a las que no se aplica la Convención Única sobre Estupefacientes de 1961, sin separar antes la morfina. A los efectos de la compatibilidad estadística y la comparación, la Junta Internacional de Fiscalización de Estupefacientes calcula la cantidad teórica de morfina originada en el concentrado de paja de adormidera que se utiliza en esas transformaciones y la incluye en los datos de fabricación y utilización de morfina.
dThis figure is being clarified with the Government. — Des éclaircissements sont demandés au Gouvernement concernant ce chiffre. — Esta cifra está por aclararse con el Gobierno.
Part fourQuatrièm
e partieCuarta parte
Tables — Tableaux —
Cuadros
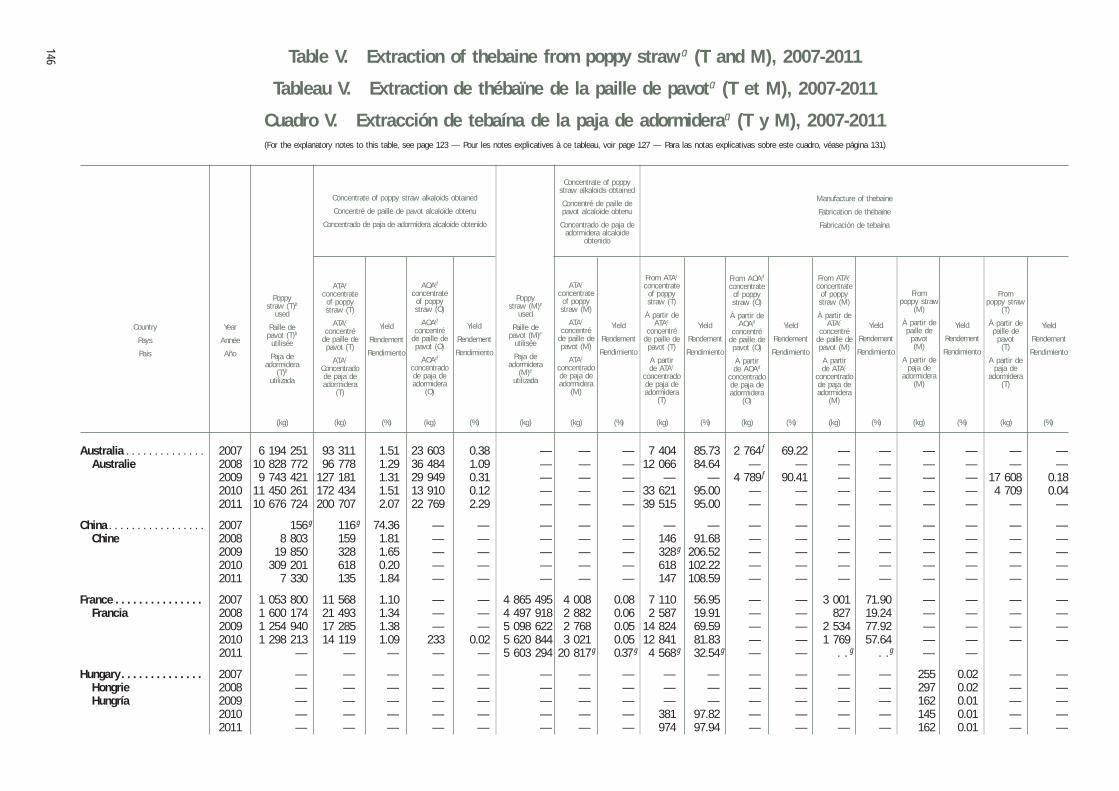
146
Poppystraw (T)b
used
Paille de pavot (T)b
utilisée
Paja de adormidera
(T)b
utilizada
Concentrate of poppy straw alkaloids obtained
Concentré de paille de pavot alcaloïde obtenu
Concentrado de paja de adormidera alcaloide obtenido
Manufacture of thebaine
Fabrication de thébaïne
Fabricación de tebaína
From ATAc
concentrateof poppy
straw (M)
À partir de ATAc
concentréde paille de pavot (M)
A partir de ATAc
concentradode paja de adormidera
(M)
Yield
Rendement
Rendimiento
Yield
Rendement
Rendimiento
From ATAc
concentrateof poppy straw (T)
À partir de ATAc
concentréde paille de
pavot (T)
A partir de ATAc
concentradode paja de adormidera
(T)
From poppy straw
(M)
À partir de paille de
pavot(M)
A partir de paja de
adormidera(M)
ATAc
concentrateof poppy
straw (M)
ATAc
concentréde paille de pavot (M)
ATAc
concentradode paja de adormidera
(M)
Yield
Rendement
Rendimiento
Yield
Rendement
Rendimiento
Yield
Rendement
Rendimiento
(kg) (kg) (%) (kg) (kg) (kg) (%) (kg) (%) (kg) (%) (kg) (%) (kg) (%)(%)
Country
Pays
País
Year
Année
Año
ATAc
concentrateof poppy straw (T)
ATAc
concentréde paille de
pavot (T)
ATAc
Concentradode paja de adormidera
(T)
Yield
Rendement
Rendimiento
AOAd
concentrateof poppy straw (O)
AOAd
concentréde paille de pavot (O)
AOAd
concentradode paja de adormidera
(O)
Yield
Rendement
Rendimiento
Poppystraw (M)e
used
Paille de pavot (M)e
utilisée
Paja de adormidera
(M)e
utilizada
From AOAd
concentrateof poppy straw (O)
À partir de AOAd
concentréde paille de pavot (O)
A partir de AOAd
concentradode paja de adormidera
(O)
Concentrate of poppy straw alkaloids obtained
Concentré de paille de pavot alcaloïde obtenu
Concentrado de paja de adormidera alcaloide
obtenido
From poppy straw
(T)
À partir de paille de
pavot(T)
A partir de paja de
adormidera(T)
Yield
Rendement
Rendimiento
(kg) (%)
Table V. Extraction of thebaine from poppy strawa (T and M), 2007-2011
Tableau V. Extraction de thébaïne de la paille de pavota (T et M), 2007-2011
Cuadro V. Extracción de tebaína de la paja de adormideraa (T y M), 2007-2011(For the explanatory notes to this table, see page 123 — Pour les notes explicatives à ce tableau, voir page 127 — Para las notas explicativas sobre este cuadro, véase página 131)
Australia . . . . . . . . . . . . . . 2007 6 194 251 93 311 1.51 23 603 0.38 — — — 7 404 85.73 2 764 f 69.22 — — — — — —Australie 2008 10 828 772 96 778 1.29 36 484 1.09 — — — 12 066 84.64 — — — — — — — —
2009 9 743 421 127 181 1.31 29 949 0.31 — — — — — 4 789 f 90.41 — — — — 17 608 0.182010 11 450 261 172 434 1.51 13 910 0.12 — — — 33 621 95.00 — — — — — — 4 709 0.042011 10 676 724 200 707 2.07 22 769 2.29 — — — 39 515 95.00 — — — — — — — —
China . . . . . . . . . . . . . . . . . 2007 156 g 116 g 74.36 — — — — — — — — — — — — — — —Chine 2008 8 803 159 1.81 — — — — — 146 91.68 — — — — — — — —
2009 19 850 328 1.65 — — — — — 328 g 206.52 — — — — — — — —2010 309 201 618 0.20 — — — — — 618 102.22 — — — — — — — —2011 7 330 135 1.84 — — — — — 147 108.59 — — — — — — — —
France . . . . . . . . . . . . . . . 2007 1 053 800 11 568 1.10 — — 4 865 495 4 008 0.08 7 110 56.95 — — 3 001 71.90 — — — —Francia 2008 1 600 174 21 493 1.34 — — 4 497 918 2 882 0.06 2 587 19.91 — — 827 19.24 — — — —
2009 1 254 940 17 285 1.38 — — 5 098 622 2 768 0.05 14 824 69.59 — — 2 534 77.92 — — — —2010 1 298 213 14 119 1.09 233 0.02 5 620 844 3 021 0.05 12 841 81.83 — — 1 769 57.64 — — — —2011 — — — — — 5 603 294 20 817 g 0.37 g 4 568 g 32.54 g — — . . g . . g — —
Hungary . . . . . . . . . . . . . . 2007 — — — — — — — — — — — — — — 255 0.02 — —Hongrie 2008 — — — — — — — — — — — — — — 297 0.02 — —Hungría 2009 — — — — — — — — — — — — — — 162 0.01 — —
2010 — — — — — — — — 381 97.82 — — — — 145 0.01 — —2011 — — — — — — — — 974 97.94 — — — — 162 0.01 — —
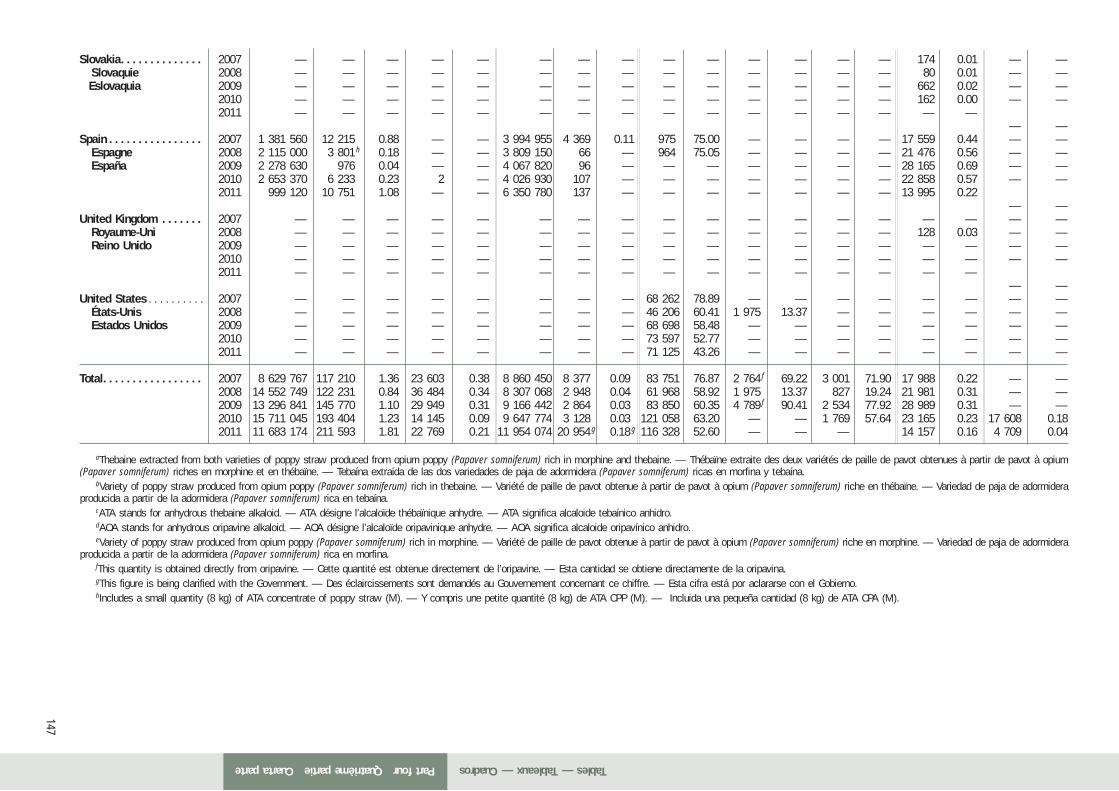
147
aThebaine extracted from both varieties of poppy straw produced from opium poppy (Papaver somniferum) rich in morphine and thebaine. — Thébaïne extraite des deux variétés de paille de pavot obtenues à partir de pavot à opium (Papaver somniferum) riches en morphine et en thébaïne. — Tebaína extraída de las dos variedades de paja de adormidera (Papaver somniferum) ricas en morfina y tebaína.
bVariety of poppy straw produced from opium poppy (Papaver somniferum) rich in thebaine. — Variété de paille de pavot obtenue à partir de pavot à opium (Papaver somniferum) riche en thébaïne. — Variedad de paja de adormidera producida a partir de la adormidera (Papaver somniferum) rica en tebaína.
cATA stands for anhydrous thebaine alkaloid. — ATA désigne l’alcaloïde thébaïnique anhydre. — ATA significa alcaloide tebaínico anhidro.dAOA stands for anhydrous oripavine alkaloid. — AOA désigne l’alcaloïde oripavinique anhydre. — AOA significa alcaloide oripavínico anhidro.eVariety of poppy straw produced from opium poppy (Papaver somniferum) rich in morphine. — Variété de paille de pavot obtenue à partir de pavot à opium (Papaver somniferum) riche en morphine. — Variedad de paja de adormidera
producida a partir de la adormidera (Papaver somniferum) rica en morfina.fThis quantity is obtained directly from oripavine. — Cette quantité est obtenue directement de l’oripavine. — Esta cantidad se obtiene directamente de la oripavina.gThis figure is being clarified with the Government. — Des éclaircissements sont demandés au Gouvernement concernant ce chiffre. — Esta cifra está por aclararse con el Gobierno.hIncludes a small quantity (8 kg) of ATA concentrate of poppy straw (M). — Y compris une petite quantité (8 kg) de ATA CPP (M). — Incluida una pequeña cantidad (8 kg) de ATA CPA (M).
Slovakia . . . . . . . . . . . . . . 2007 — — — — — — — — — — — — — — 174 0.01 — —Slovaquie 2008 — — — — — — — — — — — — — — 80 0.01 — —Eslovaquia 2009 — — — — — — — — — — — — — — 662 0.02 — —
2010 — — — — — — — — — — — — — — 162 0.00 — —2011 — — — — — — — — — — — — — — — —
— —Spain . . . . . . . . . . . . . . . . 2007 1 381 560 12 215 0.88 — — 3 994 955 4 369 0.11 975 75.00 — — — — 17 559 0.44 — —
Espagne 2008 2 115 000 3 801 h 0.18 — — 3 809 150 66 — 964 75.05 — — — — 21 476 0.56 — —España 2009 2 278 630 976 0.04 — — 4 067 820 96 — — — — — — — 28 165 0.69 — —
2010 2 653 370 6 233 0.23 2 — 4 026 930 107 — — — — — — — 22 858 0.57 — —2011 999 120 10 751 1.08 — — 6 350 780 137 — — — — — — — 13 995 0.22
— —United Kingdom . . . . . . . 2007 — — — — — — — — — — — — — — — — — —
Royaume-Uni 2008 — — — — — — — — — — — — — — 128 0.03 — —Reino Unido 2009 — — — — — — — — — — — — — — — — — —
2010 — — — — — — — — — — — — — — — — — —2011 — — — — — — — — — — — — — — — —
— —United States . . . . . . . . . . 2007 — — — — — — — — 68 262 78.89 — — — — — — — —
États-Unis 2008 — — — — — — — — 46 206 60.41 1 975 13.37 — — — — — —Estados Unidos 2009 — — — — — — — — 68 698 58.48 — — — — — — — —
2010 — — — — — — — — 73 597 52.77 — — — — — — — —2011 — — — — — — — — 71 125 43.26 — — — — — — — —
Total . . . . . . . . . . . . . . . . . 2007 8 629 767 117 210 1.36 23 603 0.38 8 860 450 8 377 0.09 83 751 76.87 2 764 f 69.22 3 001 71.90 17 988 0.22 — —2008 14 552 749 122 231 0.84 36 484 0.34 8 307 068 2 948 0.04 61 968 58.92 1 975 13.37 827 19.24 21 981 0.31 — —2009 13 296 841 145 770 1.10 29 949 0.31 9 166 442 2 864 0.03 83 850 60.35 4 789 f 90.41 2 534 77.92 28 989 0.31 — —2010 15 711 045 193 404 1.23 14 145 0.09 9 647 774 3 128 0.03 121 058 63.20 — — 1 769 57.64 23 165 0.23 17 608 0.182011 11 683 174 211 593 1.81 22 769 0.21 11 954 074 20 954 g 0.18 g 116 328 52.60 — — — 14 157 0.16 4 709 0.04
Part fourQuatrième partieCuarta parte Tables — Tableaux — Cuadros
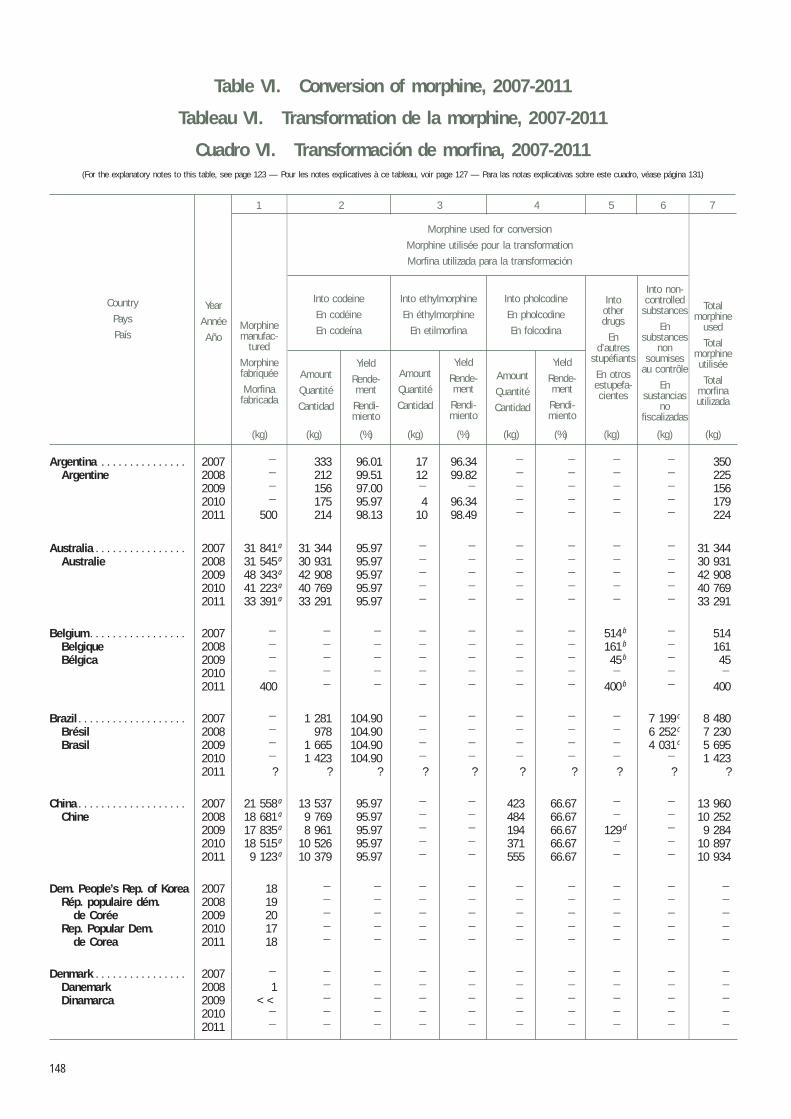
148
1 2 3 4 5 6 7
Morphine used for conversion
Morphine utilisée pour la transformation
Morfina utilizada para la transformación
Totalmorphine
used
Totalmorphineutilisée
Totalmorfinautilizada
Into non-controlled
substances
Ensubstances
nonsoumises
au contrôle
Ensustancias
nofiscalizadas
Intootherdrugs
End’autres
stupéfiants
En otrosestupefa-cientes
Into pholcodine
En pholcodine
En folcodina
Into codeine
En codéine
En codeína
Into ethylmorphine
En éthylmorphine
En etilmorfinaMorphinemanufac-
tured
Morphinefabriquée
Morfinafabricada
Yield
Rende-ment
Rendi-miento
Yield
Rende-ment
Rendi-miento
(kg)(kg) (kg) (kg) (kg)(kg)(kg)
Year
Année
Año
Country
Pays
País
Yield
Rende-ment
Rendi-miento
Amount
Quantité
Cantidad
Amount
Quantité
Cantidad
Amount
Quantité
Cantidad
(%) (%) (%)
Table VI. Conversion of morphine, 2007-2011
Tableau VI. Transformation de la morphine, 2007-2011
Cuadro VI. Transformación de morfina, 2007-2011(For the explanatory notes to this table, see page 123 — Pour les notes explicatives à ce tableau, voir page 127 — Para las notas explicativas sobre este cuadro, véase página 131)
Argentina . . . . . . . . . . . . . . . 2007 — 333 96.01 17 96.34 — — — — 350Argentine 2008 — 212 99.51 12 99.82 — — — — 225
2009 — 156 97.00 — — — — — — 1562010 — 175 95.97 4 96.34 — — — — 1792011 500 214 98.13 10 98.49 — — — — 224
Australia . . . . . . . . . . . . . . . . 2007 31 841 a 31 344 95.97 — — — — — — 31 344Australie 2008 31 545 a 30 931 95.97 — — — — — — 30 931
2009 48 343 a 42 908 95.97 — — — — — — 42 9082010 41 223 a 40 769 95.97 — — — — — — 40 7692011 33 391 a 33 291 95.97 — — — — — — 33 291
Belgium . . . . . . . . . . . . . . . . . 2007 — — — — — — — 514 b — 514Belgique 2008 — — — — — — — 161 b — 161Bélgica 2009 — — — — — — — 45 b — 45
2010 — — — — — — — — — —
2011 400 — — — — — — 400 b — 400
Brazil . . . . . . . . . . . . . . . . . . . 2007 — 1 281 104.90 — — — — — 7 199 c 8 480Brésil 2008 — 978 104.90 — — — — — 6 252 c 7 230Brasil 2009 — 1 665 104.90 — — — — — 4 031 c 5 695
2010 — 1 423 104.90 — — — — — — 1 4232011 ? ? ? ? ? ? ? ? ? ?
China . . . . . . . . . . . . . . . . . . . 2007 21 558 a 13 537 95.97 — — 423 66.67 — — 13 960Chine 2008 18 681 a 9 769 95.97 — — 484 66.67 — — 10 252
2009 17 835 a 8 961 95.97 — — 194 66.67 129 d — 9 2842010 18 515 a 10 526 95.97 — — 371 66.67 — — 10 8972011 9 123 a 10 379 95.97 — — 555 66.67 — — 10 934
Dem. People’s Rep. of Korea 2007 18 — — — — — — — — —
Rép. populaire dém. 2008 19 — — — — — — — — —
de Corée 2009 20 — — — — — — — — —
Rep. Popular Dem. 2010 17 — — — — — — — — —
de Corea 2011 18 — — — — — — — — —
Denmark . . . . . . . . . . . . . . . . 2007 — — — — — — — — — —
Danemark 2008 1 — — — — — — — — —
Dinamarca 2009 << — — — — — — — — —
2010 — — — — — — — — — —
2011 — — — — — — — — — —
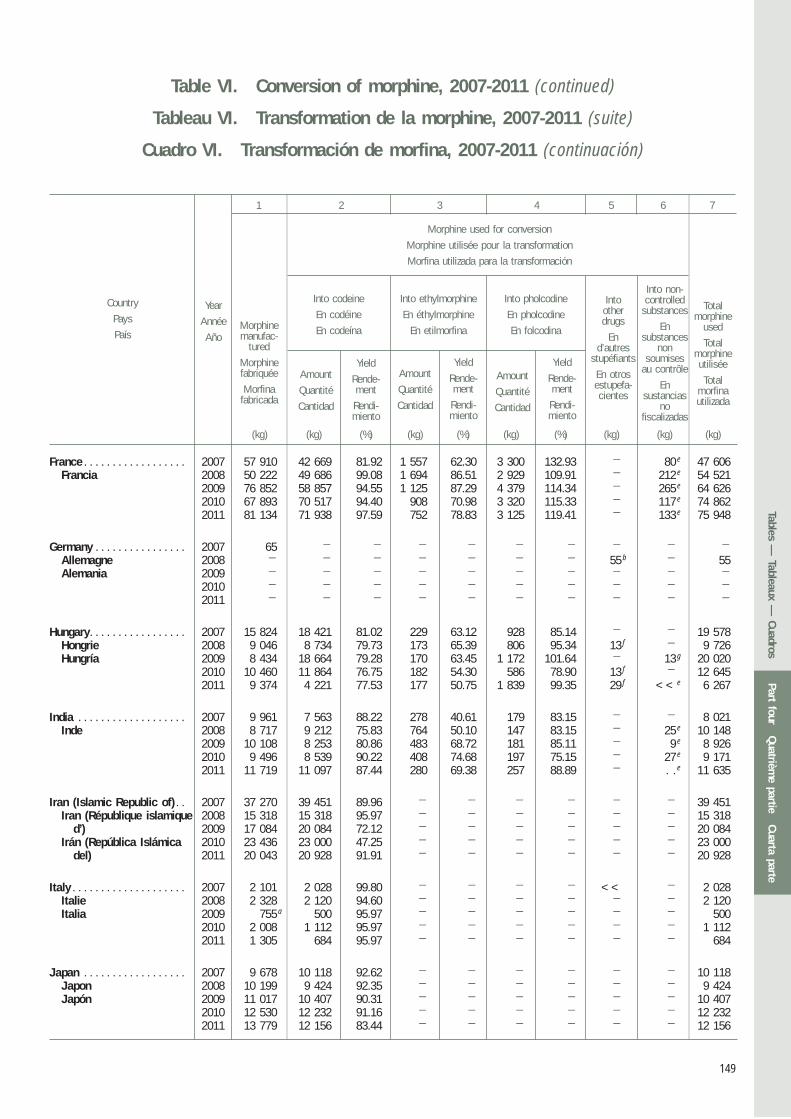
149
Table VI. Conversion of morphine, 2007-2011 (continued)
Tableau VI. Transformation de la morphine, 2007-2011 (suite)
Cuadro VI. Transformación de morfina, 2007-2011 (continuación)
Morphine used for conversion
Morphine utilisée pour la transformation
Morfina utilizada para la transformación
1 2 3 4 5 6 7
Totalmorphine
used
Totalmorphineutilisée
Totalmorfinautilizada
Into non-controlled
substances
Ensubstances
nonsoumises
au contrôle
Ensustancias
nofiscalizadas
Intootherdrugs
End’autres
stupéfiants
En otrosestupefa-cientes
Into pholcodine
En pholcodine
En folcodina
Into codeine
En codéine
En codeína
Into ethylmorphine
En éthylmorphine
En etilmorfinaMorphinemanufac-
tured
Morphinefabriquée
Morfinafabricada
Yield
Rende-ment
Rendi-miento
Yield
Rende-ment
Rendi-miento
(kg)(kg) (kg) (kg) (kg)(kg)(kg)
Year
Année
Año
Country
Pays
País
Yield
Rende-ment
Rendi-miento
Amount
Quantité
Cantidad
Amount
Quantité
Cantidad
Amount
Quantité
Cantidad
(%) (%) (%)
France . . . . . . . . . . . . . . . . . . 2007 57 910 42 669 81.92 1 557 62.30 3 300 132.93 — 80 e 47 606Francia 2008 50 222 49 686 99.08 1 694 86.51 2 929 109.91 — 212 e 54 521
2009 76 852 58 857 94.55 1 125 87.29 4 379 114.34 — 265 e 64 6262010 67 893 70 517 94.40 908 70.98 3 320 115.33 — 117 e 74 8622011 81 134 71 938 97.59 752 78.83 3 125 119.41 — 133 e 75 948
Germany . . . . . . . . . . . . . . . . 2007 65 — — — — — — — — —
Allemagne 2008 — — — — — — — 55 b — 55Alemania 2009 — — — — — — — — — —
2010 — — — — — — — — — —
2011 — — — — — — — — — —
Hungary . . . . . . . . . . . . . . . . . 2007 15 824 18 421 81.02 229 63.12 928 85.14 — — 19 578 Hongrie 2008 9 046 8 734 79.73 173 65.39 806 95.34 13 f — 9 726 Hungría 2009 8 434 18 664 79.28 170 63.45 1 172 101.64 — 13 g 20 020
2010 10 460 11 864 76.75 182 54.30 586 78.90 13 f — 12 6452011 9 374 4 221 77.53 177 50.75 1 839 99.35 29 f << e 6 267
India . . . . . . . . . . . . . . . . . . . 2007 9 961 7 563 88.22 278 40.61 179 83.15 — — 8 021Inde 2008 8 717 9 212 75.83 764 50.10 147 83.15 — 25 e 10 148
2009 10 108 8 253 80.86 483 68.72 181 85.11 — 9 e 8 9262010 9 496 8 539 90.22 408 74.68 197 75.15 — 27 e 9 1712011 11 719 11 097 87.44 280 69.38 257 88.89 — . . e 11 635
Iran (Islamic Republic of) . . 2007 37 270 39 451 89.96 — — — — — — 39 451Iran (République islamique 2008 15 318 15 318 95.97 — — — — — — 15 318
d’) 2009 17 084 20 084 72.12 — — — — — — 20 084Irán (República Islámica 2010 23 436 23 000 47.25 — — — — — — 23 000
del) 2011 20 043 20 928 91.91 — — — — — — 20 928
Italy . . . . . . . . . . . . . . . . . . . . 2007 2 101 2 028 99.80 — — — — << — 2 028Italie 2008 2 328 2 120 94.60 — — — — — — 2 120Italia 2009 755 a 500 95.97 — — — — — — 500
2010 2 008 1 112 95.97 — — — — — — 1 1122011 1 305 684 95.97 — — — — — — 684
Japan . . . . . . . . . . . . . . . . . . 2007 9 678 10 118 92.62 — — — — — — 10 118Japon 2008 10 199 9 424 92.35 — — — — — — 9 424Japón 2009 11 017 10 407 90.31 — — — — — — 10 407
2010 12 530 12 232 91.16 — — — — — — 12 2322011 13 779 12 156 83.44 — — — — — — 12 156
Part fourQuatrièm
e partieCuarta parte
Tables — Tableaux —
Cuadros
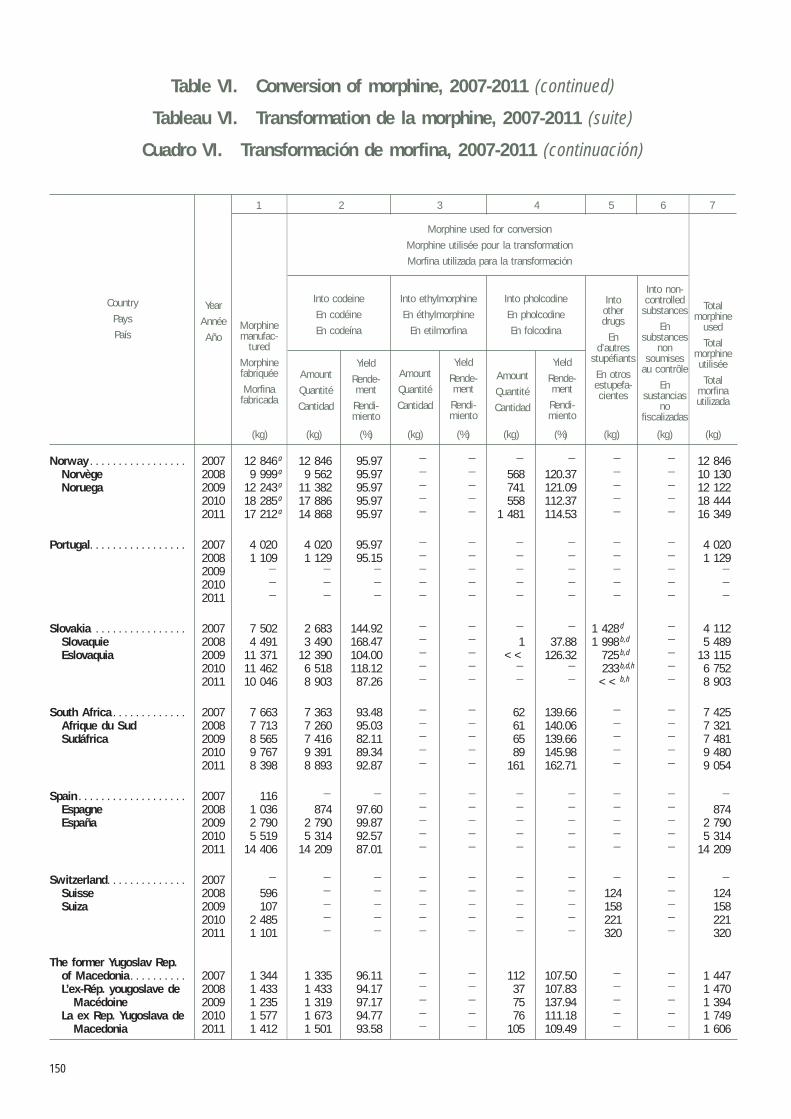
150
Table VI. Conversion of morphine, 2007-2011 (continued)
Tableau VI. Transformation de la morphine, 2007-2011 (suite)
Cuadro VI. Transformación de morfina, 2007-2011 (continuación)
Morphine used for conversion
Morphine utilisée pour la transformation
Morfina utilizada para la transformación
1 2 3 4 5 6 7
Totalmorphine
used
Totalmorphineutilisée
Totalmorfinautilizada
Into non-controlled
substances
Ensubstances
nonsoumises
au contrôle
Ensustancias
nofiscalizadas
Intootherdrugs
End’autres
stupéfiants
En otrosestupefa-cientes
Into pholcodine
En pholcodine
En folcodina
Into codeine
En codéine
En codeína
Into ethylmorphine
En éthylmorphine
En etilmorfinaMorphinemanufac-
tured
Morphinefabriquée
Morfinafabricada
Yield
Rende-ment
Rendi-miento
Yield
Rende-ment
Rendi-miento
(kg)(kg) (kg) (kg) (kg)(kg)(kg)
Year
Année
Año
Country
Pays
País
Yield
Rende-ment
Rendi-miento
Amount
Quantité
Cantidad
Amount
Quantité
Cantidad
Amount
Quantité
Cantidad
(%) (%) (%)
Norway . . . . . . . . . . . . . . . . . 2007 12 846 a 12 846 95.97 — — — — — — 12 846Norvège 2008 9 999 a 9 562 95.97 — — 568 120.37 — — 10 130Noruega 2009 12 243 a 11 382 95.97 — — 741 121.09 — — 12 122
2010 18 285 a 17 886 95.97 — — 558 112.37 — — 18 4442011 17 212 a 14 868 95.97 — — 1 481 114.53 — — 16 349
Portugal. . . . . . . . . . . . . . . . . 2007 4 020 4 020 95.97 — — — — — — 4 0202008 1 109 1 129 95.15 — — — — — — 1 1292009 — — — — — — — — — —
2010 — — — — — — — — — —
2011 — — — — — — — — — —
Slovakia . . . . . . . . . . . . . . . . 2007 7 502 2 683 144.92 — — — — 1 428 d — 4 112Slovaquie 2008 4 491 3 490 168.47 — — 1 37.88 1 998 b,d — 5 489Eslovaquia 2009 11 371 12 390 104.00 — — << 126.32 725 b,d — 13 115
2010 11 462 6 518 118.12 — — — — 233 b,d,h — 6 7522011 10 046 8 903 87.26 — — — — << b,h — 8 903
South Africa . . . . . . . . . . . . . 2007 7 663 7 363 93.48 — — 62 139.66 — — 7 425Afrique du Sud 2008 7 713 7 260 95.03 — — 61 140.06 — — 7 321Sudáfrica 2009 8 565 7 416 82.11 — — 65 139.66 — — 7 481
2010 9 767 9 391 89.34 — — 89 145.98 — — 9 4802011 8 398 8 893 92.87 — — 161 162.71 — — 9 054
Spain . . . . . . . . . . . . . . . . . . . 2007 116 — — — — — — — — —
Espagne 2008 1 036 874 97.60 — — — — — — 874España 2009 2 790 2 790 99.87 — — — — — — 2 790
2010 5 519 5 314 92.57 — — — — — — 5 3142011 14 406 14 209 87.01 — — — — — — 14 209
Switzerland . . . . . . . . . . . . . . 2007 — — — — — — — — — —
Suisse 2008 596 — — — — — — 124 — 124Suiza 2009 107 — — — — — — 158 — 158
2010 2 485 — — — — — — 221 — 2212011 1 101 — — — — — — 320 — 320
The former Yugoslav Rep. of Macedonia . . . . . . . . . . 2007 1 344 1 335 96.11 — — 112 107.50 — — 1 447L’ex-Rép. yougoslave de 2008 1 433 1 433 94.17 — — 37 107.83 — — 1 470
Macédoine 2009 1 235 1 319 97.17 — — 75 137.94 — — 1 394La ex Rep. Yugoslava de 2010 1 577 1 673 94.77 — — 76 111.18 — — 1 749
Macedonia 2011 1 412 1 501 93.58 — — 105 109.49 — — 1 606
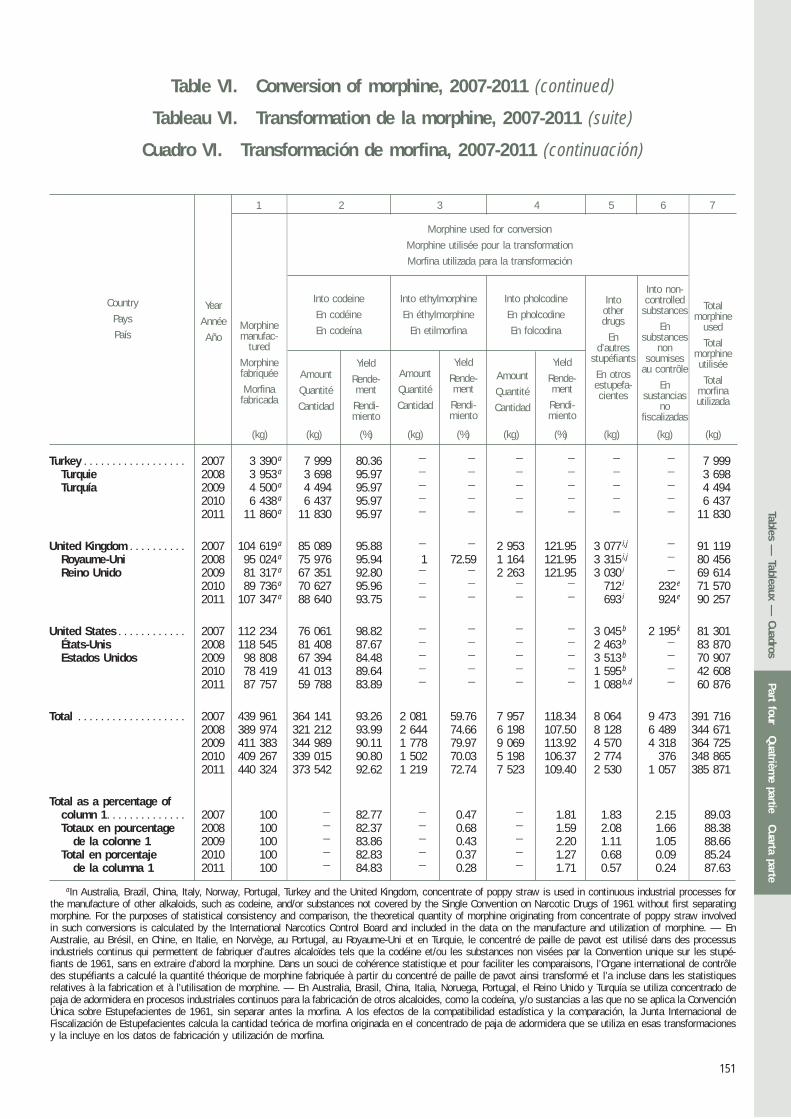
151
Table VI. Conversion of morphine, 2007-2011 (continued)
Tableau VI. Transformation de la morphine, 2007-2011 (suite)
Cuadro VI. Transformación de morfina, 2007-2011 (continuación)
Morphine used for conversion
Morphine utilisée pour la transformation
Morfina utilizada para la transformación
1 2 3 4 5 6 7
Totalmorphine
used
Totalmorphineutilisée
Totalmorfinautilizada
Into non-controlled
substances
Ensubstances
nonsoumises
au contrôle
Ensustancias
nofiscalizadas
Intootherdrugs
End’autres
stupéfiants
En otrosestupefa-cientes
Into pholcodine
En pholcodine
En folcodina
Into codeine
En codéine
En codeína
Into ethylmorphine
En éthylmorphine
En etilmorfinaMorphinemanufac-
tured
Morphinefabriquée
Morfinafabricada
Yield
Rende-ment
Rendi-miento
Yield
Rende-ment
Rendi-miento
(kg)(kg) (kg) (kg) (kg)(kg)(kg)
Year
Année
Año
Country
Pays
País
Yield
Rende-ment
Rendi-miento
Amount
Quantité
Cantidad
Amount
Quantité
Cantidad
Amount
Quantité
Cantidad
(%) (%) (%)
Turkey . . . . . . . . . . . . . . . . . . 2007 3 390 a 7 999 80.36 — — — — — — 7 999Turquie 2008 3 953 a 3 698 95.97 — — — — — — 3 698Turquía 2009 4 500 a 4 494 95.97 — — — — — — 4 494
2010 6 438 a 6 437 95.97 — — — — — — 6 4372011 11 860 a 11 830 95.97 — — — — — — 11 830
United Kingdom . . . . . . . . . . 2007 104 619 a 85 089 95.88 — — 2 953 121.95 3 077 i,j — 91 119Royaume-Uni 2008 95 024 a 75 976 95.94 1 72.59 1 164 121.95 3 315 i,j — 80 456Reino Unido 2009 81 317 a 67 351 92.80 — — 2 263 121.95 3 030 i — 69 614
2010 89 736 a 70 627 95.96 — — — — 712 i 232 e 71 5702011 107 347 a 88 640 93.75 — — — — 693 i 924 e 90 257
United States . . . . . . . . . . . . 2007 112 234 76 061 98.82 — — — — 3 045 b 2 195 k 81 301 États-Unis 2008 118 545 81 408 87.67 — — — — 2 463 b — 83 870
Estados Unidos 2009 98 808 67 394 84.48 — — — — 3 513 b — 70 9072010 78 419 41 013 89.64 — — — — 1 595 b — 42 6082011 87 757 59 788 83.89 — — — — 1 088 b,d — 60 876
Total . . . . . . . . . . . . . . . . . . . 2007 439 961 364 141 93.26 2 081 59.76 7 957 118.34 8 064 9 473 391 7162008 389 974 321 212 93.99 2 644 74.66 6 198 107.50 8 128 6 489 344 6712009 411 383 344 989 90.11 1 778 79.97 9 069 113.92 4 570 4 318 364 7252010 409 267 339 015 90.80 1 502 70.03 5 198 106.37 2 774 376 348 8652011 440 324 373 542 92.62 1 219 72.74 7 523 109.40 2 530 1 057 385 871
Total as a percentage of column 1 . . . . . . . . . . . . . . 2007 100 — 82.77 — 0.47 — 1.81 1.83 2.15 89.03Totaux en pourcentage 2008 100 — 82.37 — 0.68 — 1.59 2.08 1.66 88.38
de la colonne 1 2009 100 — 83.86 — 0.43 — 2.20 1.11 1.05 88.66Total en porcentaje 2010 100 — 82.83 — 0.37 — 1.27 0.68 0.09 85.24
de la columna 1 2011 100 — 84.83 — 0.28 — 1.71 0.57 0.24 87.63
aIn Australia, Brazil, China, Italy, Norway, Portugal, Turkey and the United Kingdom, concentrate of poppy straw is used in continuous industrial processes for the manufacture of other alkaloids, such as codeine, and/or substances not covered by the Single Convention on Narcotic Drugs of 1961 without first separating morphine. For the purposes of statistical consistency and comparison, the theoretical quantity of morphine originating from concentrate of poppy straw involved in such conversions is calculated by the International Narcotics Control Board and included in the data on the manufacture and utilization of morphine. — En Australie, au Brésil, en Chine, en Italie, en Norvège, au Portugal, au Royaume-Uni et en Turquie, le concentré de paille de pavot est utilisé dans des processus industriels continus qui permettent de fabriquer d’autres alcaloïdes tels que la codéine et/ou les substances non visées par la Convention unique sur les stupé-fiants de 1961, sans en extraire d’abord la morphine. Dans un souci de cohérence statistique et pour faciliter les comparaisons, l’Organe international de contrôle des stupéfiants a calculé la quantité théorique de morphine fabriquée à partir du concentré de paille de pavot ainsi transformé et l’a incluse dans les statistiques relatives à la fabrication et à l’utilisation de morphine. — En Australia, Brasil, China, Italia, Noruega, Portugal, el Reino Unido y Turquía se utiliza concentrado de paja de adormidera en procesos industriales continuos para la fabricación de otros alcaloides, como la codeína, y/o sustancias a las que no se aplica la Convención Única sobre Estupefacientes de 1961, sin separar antes la morfina. A los efectos de la compatibilidad estadística y la comparación, la Junta Internacional de Fiscalización de Estupefacientes calcula la cantidad teórica de morfina originada en el concentrado de paja de adormidera que se utiliza en esas transformaciones y la incluye en los datos de fabricación y utilización de morfina.
Part fourQuatrièm
e partieCuarta parte
Tables — Tableaux —
Cuadros
152
bHydromorphone. — Hidromorfona.cNoroxymorphone. — Noroximorfona.dDihydrocodeine. — Dihydrocodéine. — Dihidrocodeína.eApomorphine. — Apomorfina.fNicomorphine. — Nicomorfina.gNalorphine. — Nalorfina.hThis figure is being clarified with the Government. — Des éclaircissements sont demandés au Gouvernement concernant ce chiffre. — Esta cifra está por aclararse
con el Gobierno.iHeroin. — Héroïne. — Heroína.jDihydromorphine. — Dihidromorfina.kNalbuphine. — Nalbufina.
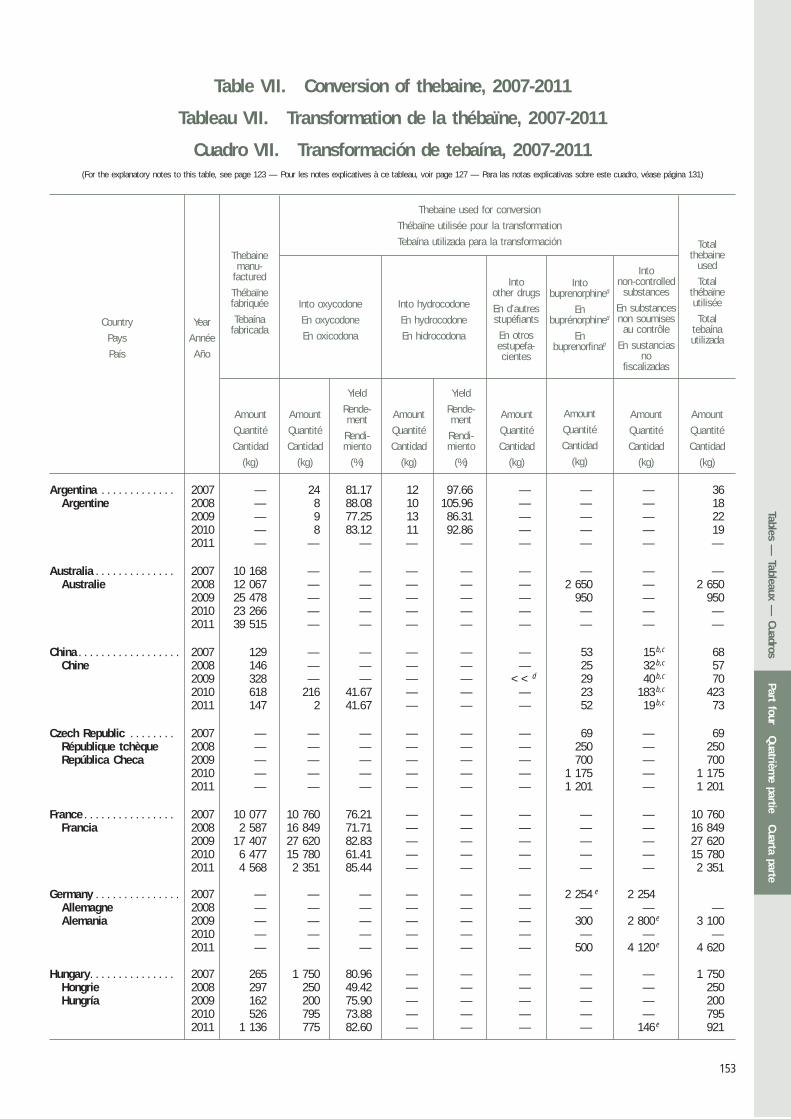
153
Year
Année
Año
Country
Pays
País
Thebaine used for conversion
Thébaïne utilisée pour la transformation
Tebaína utilizada para la transformación Totalthebaine
used
Totalthébaïneutilisée
Totaltebaínautilizada
Intonon-controlled
substances
En substancesnon soumises
au contrôle
En sustanciasno
fiscalizadas
Intobuprenorphinea
Enbuprénorphinea
Enbuprenorfinaa
Intoother drugs
En d’autresstupéfiants
En otros estupefa-cientes
Into oxycodone
En oxycodone
En oxicodona
Into hydrocodone
En hydrocodone
En hidrocodona
Thebainemanu-
factured
Thébaïnefabriquée
Tebaínafabricada
Yield
Rende-ment
Rendi-miento
(%)
Yield
Rende-ment
Rendi-miento
(%)
Amount
Quantité
Cantidad
(kg)
Amount
Quantité
Cantidad
(kg)
Amount
Quantité
Cantidad
(kg)
Amount
Quantité
Cantidad
(kg)
Amount
Quantité
Cantidad
(kg)
Amount
Quantité
Cantidad
(kg)
Amount
Quantité
Cantidad
(kg)
Table VII. Conversion of thebaine, 2007-2011
Tableau VII. Transformation de la thébaïne, 2007-2011
Cuadro VII. Transformación de tebaína, 2007-2011(For the explanatory notes to this table, see page 123 — Pour les notes explicatives à ce tableau, voir page 127 — Para las notas explicativas sobre este cuadro, véase página 131)
Argentina . . . . . . . . . . . . . 2007 — 24 81.17 12 97.66 — — — 36Argentine 2008 — 8 88.08 10 105.96 — — — 18
2009 — 9 77.25 13 86.31 — — — 222010 — 8 83.12 11 92.86 — — — 192011 — — — — — — — — —
Australia . . . . . . . . . . . . . . 2007 10 168 — — — — — — — —Australie 2008 12 067 — — — — — 2 650 — 2 650
2009 25 478 — — — — — 950 — 9502010 23 266 — — — — — — — —2011 39 515 — — — — — — — —
China . . . . . . . . . . . . . . . . . . 2007 129 — — — — — 53 15 b,c 68Chine 2008 146 — — — — — 25 32 b,c 57
2009 328 — — — — << d 29 40 b,c 702010 618 216 41.67 — — — 23 183 b,c 4232011 147 2 41.67 — — — 52 19 b,c 73
Czech Republic . . . . . . . . 2007 — — — — — — 69 — 69République tchèque 2008 — — — — — — 250 — 250República Checa 2009 — — — — — — 700 — 700
2010 — — — — — — 1 175 — 1 1752011 — — — — — — 1 201 — 1 201
France . . . . . . . . . . . . . . . . 2007 10 077 10 760 76.21 — — — — — 10 760Francia 2008 2 587 16 849 71.71 — — — — — 16 849
2009 17 407 27 620 82.83 — — — — — 27 6202010 6 477 15 780 61.41 — — — — — 15 7802011 4 568 2 351 85.44 — — — — — 2 351
Germany . . . . . . . . . . . . . . . 2007 — — — — — — 2 254 e 2 254Allemagne 2008 — — — — — — — — —Alemania 2009 — — — — — — 300 2 800 e 3 100
2010 — — — — — — — — —2011 — — — — — — 500 4 120 e 4 620
Hungary . . . . . . . . . . . . . . . 2007 265 1 750 80.96 — — — — — 1 750 Hongrie 2008 297 250 49.42 — — — — — 250 Hungría 2009 162 200 75.90 — — — — — 200
2010 526 795 73.88 — — — — — 7952011 1 136 775 82.60 — — — — 146 e 921
Part fourQuatrièm
e partieCuarta parte
Tables — Tableaux —
Cuadros
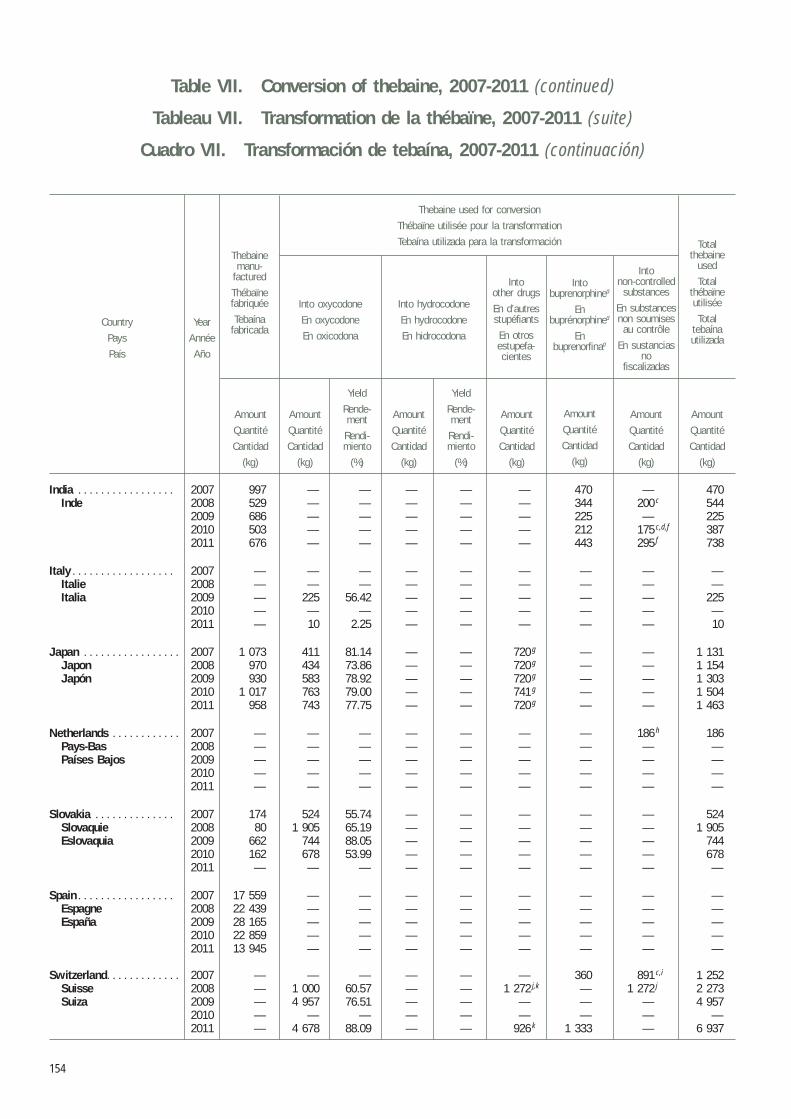
154
Table VII. Conversion of thebaine, 2007-2011 (continued)
Tableau VII. Transformation de la thébaïne, 2007-2011 (suite)
Cuadro VII. Transformación de tebaína, 2007-2011 (continuación)
Year
Année
Año
Country
Pays
País
Thebaine used for conversion
Thébaïne utilisée pour la transformation
Tebaína utilizada para la transformación Totalthebaine
used
Totalthébaïneutilisée
Totaltebaínautilizada
Intonon-controlled
substances
En substancesnon soumises
au contrôle
En sustanciasno
fiscalizadas
Intobuprenorphinea
Enbuprénorphinea
Enbuprenorfinaa
Intoother drugs
En d’autresstupéfiants
En otros estupefa-cientes
Into oxycodone
En oxycodone
En oxicodona
Into hydrocodone
En hydrocodone
En hidrocodona
Thebainemanu-
factured
Thébaïnefabriquée
Tebaínafabricada
Yield
Rende-ment
Rendi-miento
(%)
Yield
Rende-ment
Rendi-miento
(%)
Amount
Quantité
Cantidad
(kg)
Amount
Quantité
Cantidad
(kg)
Amount
Quantité
Cantidad
(kg)
Amount
Quantité
Cantidad
(kg)
Amount
Quantité
Cantidad
(kg)
Amount
Quantité
Cantidad
(kg)
Amount
Quantité
Cantidad
(kg)
India . . . . . . . . . . . . . . . . . 2007 997 — — — — — 470 — 470Inde 2008 529 — — — — — 344 200 c 544
2009 686 — — — — — 225 — 2252010 503 — — — — — 212 175 c,d,f 3872011 676 — — — — — 443 295 f 738
Italy . . . . . . . . . . . . . . . . . . 2007 — — — — — — — — —Italie 2008 — — — — — — — — —Italia 2009 — 225 56.42 — — — — — 225
2010 — — — — — — — — —2011 — 10 2.25 — — — — — 10
Japan . . . . . . . . . . . . . . . . . 2007 1 073 411 81.14 — — 720 g — — 1 131Japon 2008 970 434 73.86 — — 720 g — — 1 154Japón 2009 930 583 78.92 — — 720 g — — 1 303
2010 1 017 763 79.00 — — 741 g — — 1 5042011 958 743 77.75 — — 720 g — — 1 463
Netherlands . . . . . . . . . . . . 2007 — — — — — — — 186 h 186Pays-Bas 2008 — — — — — — — — —Países Bajos 2009 — — — — — — — — —
2010 — — — — — — — — —2011 — — — — — — — — —
Slovakia . . . . . . . . . . . . . . 2007 174 524 55.74 — — — — — 524Slovaquie 2008 80 1 905 65.19 — — — — — 1 905Eslovaquia 2009 662 744 88.05 — — — — — 744
2010 162 678 53.99 — — — — — 6782011 — — — — — — — — —
Spain . . . . . . . . . . . . . . . . . 2007 17 559 — — — — — — — —Espagne 2008 22 439 — — — — — — — —España 2009 28 165 — — — — — — — —
2010 22 859 — — — — — — — —2011 13 945 — — — — — — — —
Switzerland . . . . . . . . . . . . . 2007 — — — — — — 360 891 c,i 1 252Suisse 2008 — 1 000 60.57 — — 1 272 j,k — 1 272 j 2 273Suiza 2009 — 4 957 76.51 — — — — — 4 957
2010 — — — — — — — — —2011 — 4 678 88.09 — — 926 k 1 333 — 6 937
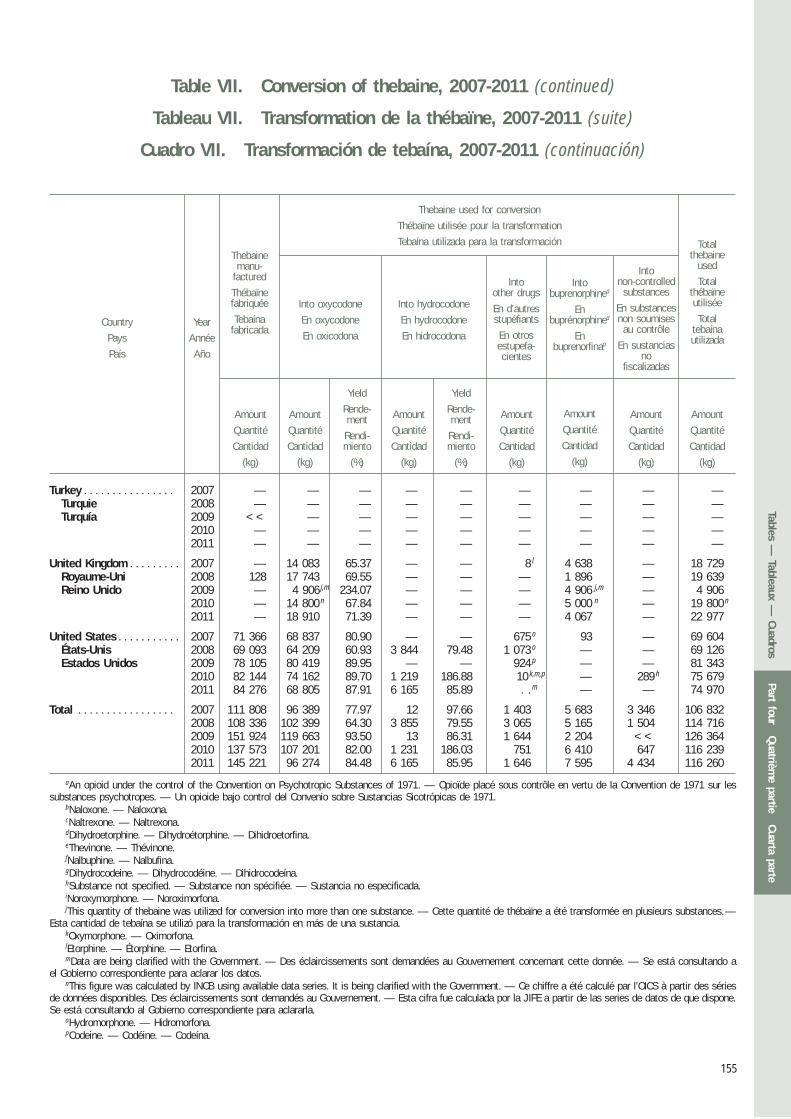
155
Table VII. Conversion of thebaine, 2007-2011 (continued)
Tableau VII. Transformation de la thébaïne, 2007-2011 (suite)
Cuadro VII. Transformación de tebaína, 2007-2011 (continuación)
Year
Année
Año
Country
Pays
País
Thebaine used for conversion
Thébaïne utilisée pour la transformation
Tebaína utilizada para la transformación Totalthebaine
used
Totalthébaïneutilisée
Totaltebaínautilizada
Intonon-controlled
substances
En substancesnon soumises
au contrôle
En sustanciasno
fiscalizadas
Intobuprenorphinea
Enbuprénorphinea
Enbuprenorfinaa
Intoother drugs
En d’autresstupéfiants
En otros estupefa-cientes
Into oxycodone
En oxycodone
En oxicodona
Into hydrocodone
En hydrocodone
En hidrocodona
Thebainemanu-
factured
Thébaïnefabriquée
Tebaínafabricada
Yield
Rende-ment
Rendi-miento
(%)
Yield
Rende-ment
Rendi-miento
(%)
Amount
Quantité
Cantidad
(kg)
Amount
Quantité
Cantidad
(kg)
Amount
Quantité
Cantidad
(kg)
Amount
Quantité
Cantidad
(kg)
Amount
Quantité
Cantidad
(kg)
Amount
Quantité
Cantidad
(kg)
Amount
Quantité
Cantidad
(kg)
Turkey . . . . . . . . . . . . . . . . 2007 — — — — — — — — —Turquie 2008 — — — — — — — — —Turquía 2009 << — — — — — — — —
2010 — — — — — — — — —2011 — — — — — — — — —
United Kingdom . . . . . . . . . 2007 — 14 083 65.37 — — 8 l 4 638 — 18 729Royaume-Uni 2008 128 17 743 69.55 — — — 1 896 — 19 639Reino Unido 2009 — 4 906 j,m 234.07 — — — 4 906 j,m — 4 906
2010 — 14 800 n 67.84 — — — 5 000 n — 19 800 n
2011 — 18 910 71.39 — — — 4 067 — 22 977
United States . . . . . . . . . . . 2007 71 366 68 837 80.90 — — 675 o 93 — 69 604 États-Unis 2008 69 093 64 209 60.93 3 844 79.48 1 073 o — — 69 126
Estados Unidos 2009 78 105 80 419 89.95 — — 924 p — — 81 3432010 82 144 74 162 89.70 1 219 186.88 10 k,m,p — 289 h 75 6792011 84 276 68 805 87.91 6 165 85.89 . . m — — 74 970
Total . . . . . . . . . . . . . . . . . 2007 111 808 96 389 77.97 12 97.66 1 403 5 683 3 346 106 8322008 108 336 102 399 64.30 3 855 79.55 3 065 5 165 1 504 114 7162009 151 924 119 663 93.50 13 86.31 1 644 2 204 << 126 3642010 137 573 107 201 82.00 1 231 186.03 751 6 410 647 116 2392011 145 221 96 274 84.48 6 165 85.95 1 646 7 595 4 434 116 260
aAn opioid under the control of the Convention on Psychotropic Substances of 1971. — Opioïde placé sous contrôle en vertu de la Convention de 1971 sur les substances psychotropes. — Un opioide bajo control del Convenio sobre Sustancias Sicotrópicas de 1971.
bNaloxone. — Naloxona.cNaltrexone. — Naltrexona.dDihydroetorphine. — Dihydroétorphine. — Dihidroetorfina.eThevinone. — Thévinone.fNalbuphine. — Nalbufina.gDihydrocodeine. — Dihydrocodéine. — Dihidrocodeína.hSubstance not specified. — Substance non spécifiée. — Sustancia no especificada.iNoroxymorphone. — Noroximorfona.jThis quantity of thebaine was utilized for conversion into more than one substance. — Cette quantité de thébaïne a été transformée en plusieurs substances. —
Esta cantidad de tebaína se utilizó para la transformación en más de una sustancia.kOxymorphone. — Oximorfona.lEtorphine. — Étorphine. — Etorfina.mData are being clarified with the Government. — Des éclaircissements sont demandées au Gouvernement concernant cette donnée. — Se está consultando a
el Gobierno correspondiente para aclarar los datos.nThis figure was calculated by INCB using available data series. It is being clarified with the Government. — Ce chiffre a été calculé par l’OICS à partir des séries
de données disponibles. Des éclaircissements sont demandés au Gouvernement. — Esta cifra fue calculada por la JIFE a partir de las series de datos de que dispone. Se está consultando al Gobierno correspondiente para aclararla.
oHydromorphone. — Hidromorfona.pCodeine. — Codéine. — Codeína.
Part fourQuatrièm
e partieCuarta parte
Tables — Tableaux —
Cuadros
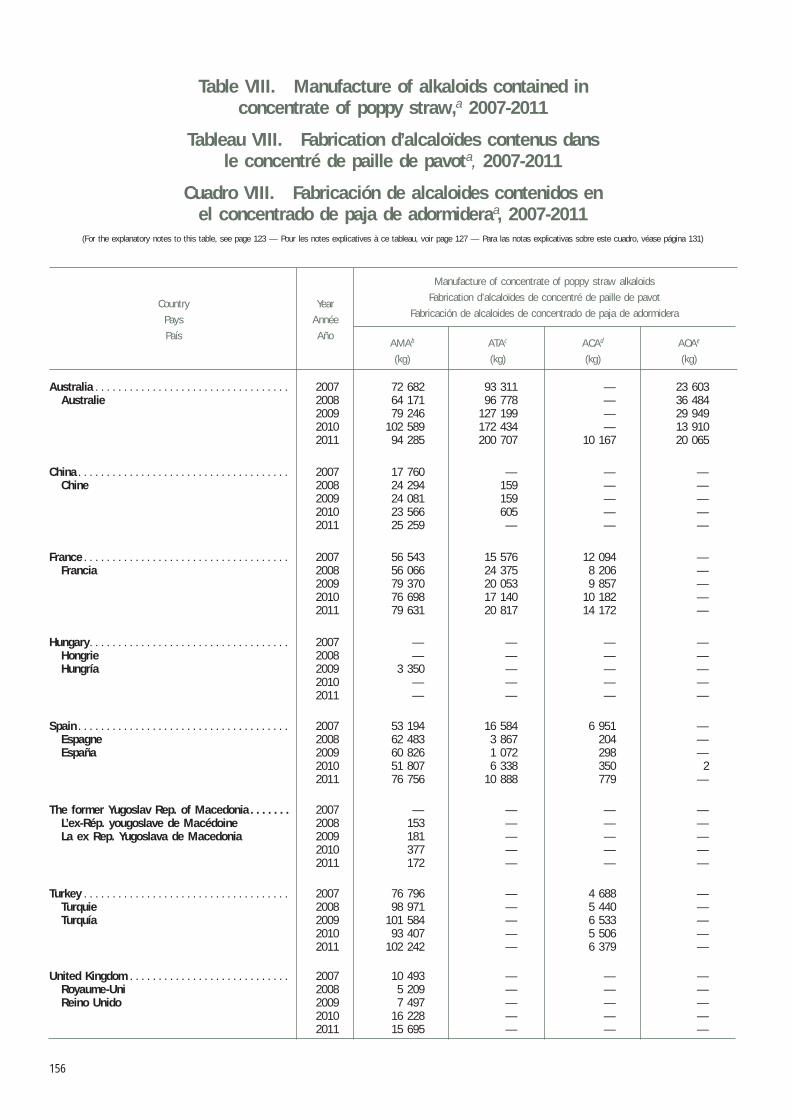
156
Table VIII. Manufacture of alkaloids contained in concentrate of poppy straw,a 2007-2011
Tableau VIII. Fabrication d’alcaloïdes contenus dans le concentré de paille de pavota, 2007-2011
Cuadro VIII. Fabricación de alcaloides contenidos en el concentrado de paja de adormideraa, 2007-2011
(For the explanatory notes to this table, see page 123 — Pour les notes explicatives à ce tableau, voir page 127 — Para las notas explicativas sobre este cuadro, véase página 131)
ATAc
(kg)
Year
Année
Año
Country
Pays
PaísAMAb
(kg)
ACAd
(kg)
AOAe
(kg)
Manufacture of concentrate of poppy straw alkaloids
Fabrication d’alcaloïdes de concentré de paille de pavot
Fabricación de alcaloides de concentrado de paja de adormidera
Australia . . . . . . . . . . . . . . . . . . . . . . . . . . . . . . . . . . 2007 72 682 93 311 — 23 603Australie 2008 64 171 96 778 — 36 484
2009 79 246 127 199 — 29 9492010 102 589 172 434 — 13 9102011 94 285 200 707 10 167 20 065
China . . . . . . . . . . . . . . . . . . . . . . . . . . . . . . . . . . . . . 2007 17 760 — — —
Chine 2008 24 294 159 — —2009 24 081 159 — —2010 23 566 605 — —2011 25 259 — — —
France . . . . . . . . . . . . . . . . . . . . . . . . . . . . . . . . . . . . 2007 56 543 15 576 12 094 —
Francia 2008 56 066 24 375 8 206 —2009 79 370 20 053 9 857 —2010 76 698 17 140 10 182 —2011 79 631 20 817 14 172 —
Hungary . . . . . . . . . . . . . . . . . . . . . . . . . . . . . . . . . . . 2007 — — — —
Hongrie 2008 — — — —Hungría 2009 3 350 — — —
2010 — — — —2011 — — — —
Spain . . . . . . . . . . . . . . . . . . . . . . . . . . . . . . . . . . . . . 2007 53 194 16 584 6 951 —
Espagne 2008 62 483 3 867 204 —España 2009 60 826 1 072 298 —
2010 51 807 6 338 350 22011 76 756 10 888 779 —
The former Yugoslav Rep. of Macedonia . . . . . . . 2007 — — — —
L’ex-Rép. yougoslave de Macédoine 2008 153 — — —La ex Rep. Yugoslava de Macedonia 2009 181 — — —
2010 377 — — —2011 172 — — —
Turkey . . . . . . . . . . . . . . . . . . . . . . . . . . . . . . . . . . . . 2007 76 796 — 4 688 —
Turquie 2008 98 971 — 5 440 —Turquía 2009 101 584 — 6 533 —
2010 93 407 — 5 506 —2011 102 242 — 6 379 —
United Kingdom . . . . . . . . . . . . . . . . . . . . . . . . . . . . 2007 10 493 — — —
Royaume-Uni 2008 5 209 — — —Reino Unido 2009 7 497 — — —
2010 16 228 — — —2011 15 695 — — —
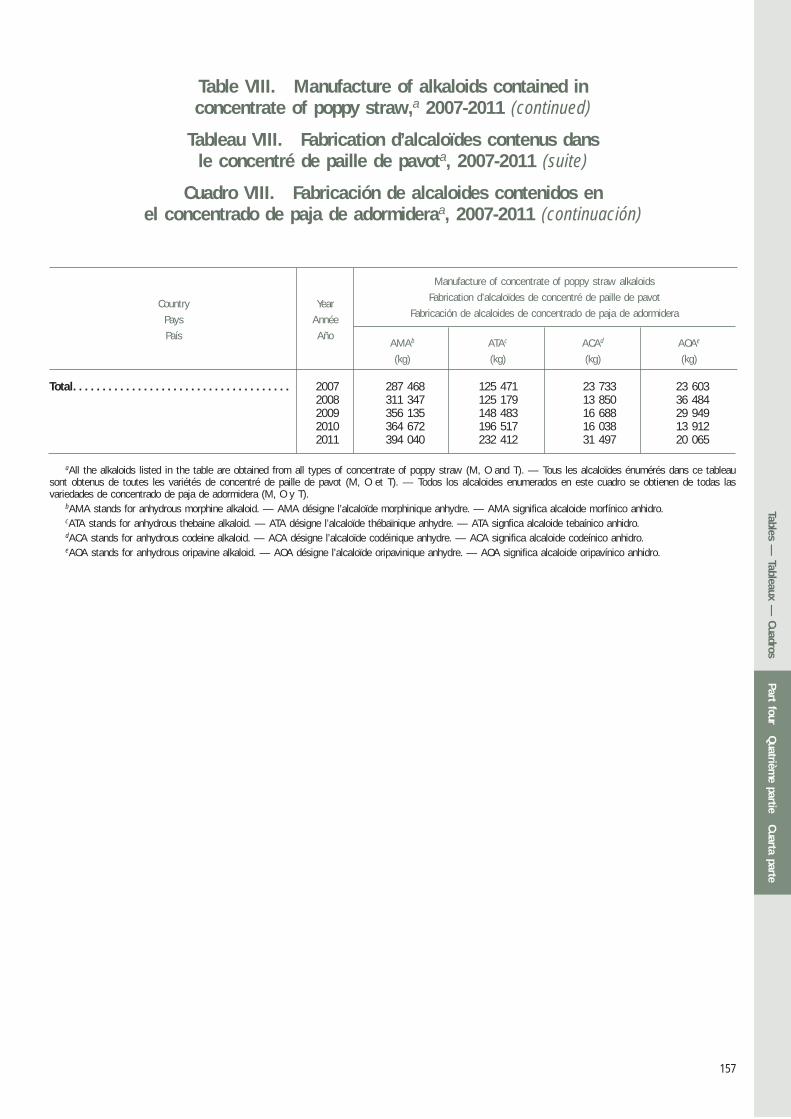
157
Table VIII. Manufacture of alkaloids contained in concentrate of poppy straw,a 2007-2011 (continued)
Tableau VIII. Fabrication d’alcaloïdes contenus dans le concentré de paille de pavota, 2007-2011 (suite)
Cuadro VIII. Fabricación de alcaloides contenidos en el concentrado de paja de adormideraa, 2007-2011 (continuación)
ATAc
(kg)
Year
Année
Año
Country
Pays
PaísAMAb
(kg)
ACAd
(kg)
AOAe
(kg)
Manufacture of concentrate of poppy straw alkaloids
Fabrication d’alcaloïdes de concentré de paille de pavot
Fabricación de alcaloides de concentrado de paja de adormidera
aAll the alkaloids listed in the table are obtained from all types of concentrate of poppy straw (M, O and T). — Tous les alcaloïdes énumérés dans ce tableau sont obtenus de toutes les variétés de concentré de paille de pavot (M, O et T). — Todos los alcaloides enumerados en este cuadro se obtienen de todas las variedades de concentrado de paja de adormidera (M, O y T).
bAMA stands for anhydrous morphine alkaloid. — AMA désigne l’alcaloïde morphinique anhydre. — AMA significa alcaloide morfínico anhidro.cATA stands for anhydrous thebaine alkaloid. — ATA désigne l’alcaloïde thébaïnique anhydre. — ATA signfica alcaloide tebaínico anhidro.dACA stands for anhydrous codeine alkaloid. — ACA désigne l’alcaloïde codéinique anhydre. — ACA significa alcaloide codeínico anhidro.eAOA stands for anhydrous oripavine alkaloid. — AOA désigne l’alcaloïde oripavinique anhydre. — AOA significa alcaloide oripavínico anhidro.
Total . . . . . . . . . . . . . . . . . . . . . . . . . . . . . . . . . . . . . 2007 287 468 125 471 23 733 23 6032008 311 347 125 179 13 850 36 4842009 356 135 148 483 16 688 29 9492010 364 672 196 517 16 038 13 9122011 394 040 232 412 31 497 20 065
Part fourQuatrièm
e partieCuarta parte
Tables — Tableaux —
Cuadros
158 Table IX. Manufacture of the principal narcotic drugs, 2007-2011
Tableau IX. Fabrication des principaux stupéfiants, 2007-2011
Cuadro IX. Fabricación de los principales estupefacientes, 2007-2011(For the explanatory notes to this table, see page 123 — Pour les notes explicatives à ce tableau, voir page 127 — Para las notas explicativas sobre este cuadro, véase página 131)
Country
Pays
País
Year
Année
AñoMorphine
Morfina
Codeine
Codéine
Codeína
Dihydro-codeine
Dihydro-codéine
Dihidro-codeína
Pholcodine
Folcodina
Ethyl-morphine
Éthyl-morphine
Etilmorfina
Thebaine
Thébaïne
Tebaína
Oxycodone
Oxicodona
Hydrocodone
Hidrocodona
Dextropro-poxyphene
Dextropro-poxyphène
Dextropro-poxifeno
Diphenoxylate
Diphénoxylate
Difenoxilato
Methadone
Méthadone
Metadona
Pethidine
Péthidine
Petidina
Opium alkaloids and their derivatives
Alcaloïdes de l’opium et leurs dérivés
Alcaloides del opio y sus derivados
Synthetic opioids
Opioïdes synthétiques
Opioides sintéticos
(kg) (kg) (kg) (kg) (kg) (kg) (kg) (kg) (kg) (kg) (kg) (kg) (kg)
Buprenorphinea
Buprénorphinea
Buprenorfinaa
Argentina . . . . . . . . . . . . . . . . . . 2007 — 320 — — — 16 11 20 — — — 12 —Argentine 2008 — 211 — — — 12 11 7 — — — 3 —
2009 — 151 — — — — 11 7 — — — 16 —2010 — 168 — — — 4 10 6 — — — 9 —2011 500 — — — — — — — — — — 72 —
Australia . . . . . . . . . . . . . . . . . . . 2007 31 841 b 32 227 10 168 361 — — — 10 — — — 515 28Australie 2008 31 545 b 29 684 12 067 645 — — — — — — — — —
2009 48 343 b 41 178 25 478 379 — — — — — — — — —2010 41 223 b 39 126 23 266 — — — — — — — — — —2011 33 391 b 31 949 39 515 — — — — — — — — — —
Belgium . . . . . . . . . . . . . . . . . . . 2007 — — — 258 1 526 — 138 — — — — — —Belgique 2008 — — — — 872 — — — — — — — —Bélgica 2009 — — — 620 1 311 — — — — — — — —
2010 — — — 1 098 1 391 — — — — — — — —2011 400 — — 1 250 1 642 — — — — — — — —
Brazil . . . . . . . . . . . . . . . . . . . . . 2007 — 1 344 — — — — — — — — — — 659Brésil 2008 — 1 028 — — — — — — — — — — 371Brasil 2009 — 1 746 — — — — — — — — — — 240
2010 — 1 472 — — — — — — — — — — 3202011 ? ? ? ? ? ? ? ? ? ? ? ? ?
Canada . . . . . . . . . . . . . . . . . . . 2007 — — — — — — — — — — — — —Canadá 2008 — — — — — — — — — — — — —
2009 — — — — — — — — — — — — —2010 — — — — — — — — — — — — —2011 — — — 2 — — — — — — — — —

159
China . . . . . . . . . . . . . . . . . . . . . 2007 21 558 b 9 224 129 5 — — — — 282 709 2 576 46 807Chine 2008 18 681 b 9 375 146 3 77 — — — 322 901 2 117 76 2 666
2009 17 835 b 8 600 328 3 79 — — — 119 — 2 451 1 109 1 8422010 18 515 b 10 102 618 4 320 — — — 228 — 1 549 1 811 1 0412011 9 123 b 9 961 147 7 166 — — 1 341 — 2 032 2 090 1 597
Croatia . . . . . . . . . . . . . . . . . . . . 2007 — 381 — — — — — — — — — 113 —Croatie 2008 — — — — — — — — — — — 64 —Croacia 2009 — 262 — — — — — — — — — — —
2010 — 183 — — — — — — — — — 61 —2011 — — — — — — — — — — — 61 —
Czech Republic . . . . . . . . . . . . . 2007 — — — 22 — — — — — — — — —République tchèque 2008 — — — 36 — — — — — — — — —República Checa 2009 — — — 234 — — — — — — — — —
2010 — — — 397 — — — — — — — — —2011 — — — 232 — — — — — — — — —
Dem. People’s Rep. of Korea . . 2007 18 20 — — — — — — — — — — —Rép. populaire dém. de Corée 2008 19 21 — — — — — — — — — — —Rep. Popular Dem. de Corea 2009 20 21 — — — — — — — — — — —
2010 17 25 — — — — — — — — — — —2011 18 33 — ? — — — — — — — — —
Denmark . . . . . . . . . . . . . . . . . . 2007 — — — — — — — — — — — — —Danemark 2008 1 — — — — — — — — — — — —Dinamarca 2009 << << — — << << << — — — — — —
2010 — — — — — — — — — — — — —2011 — — — — — — — — — — — — —
France . . . . . . . . . . . . . . . . . . . . 2007 57 910 37 569 10 077 — — 970 — 8 201 4 387 40 665 — — —Francia 2008 50 222 49 227 2 587 — — 1 465 — 13 083 3 220 33 422 — — —
2009 76 852 55 646 17 407 — — 982 — 22 878 5 007 11 002 — — —2010 67 893 66 568 6 477 — — 644 — 9 690 3 829 3 376 — — —2011 81 134 78 330 4 568 — — 593 — 2 008 3 731 — — — —
Germany . . . . . . . . . . . . . . . . . . 2007 65 — — — — — — — — << — 1 556 1 200Allemagne 2008 — — — 130 — — — — — — — 552 —Alemania 2009 — — — — — — — — — — — 1 428 1 269
2010 — — — 127 — — — — — — — 929 —2011 — — — — — — — — — — — 1 234 —
Hungary . . . . . . . . . . . . . . . . . . . 2007 15 824 15 621 265 — 176 144 — 1 417 790 — — — —Hongrie 2008 9 046 7 615 297 — — 113 — 124 768 — — — —Hungría 2009 8 434 15 380 162 — — 108 — 152 1 191 — — — —
2010 10 460 9 284 526 — — 99 — 587 462 — — 53 —2011 9 374 4 329 1 136 — 1 162 90 — 640 1 827 — — — —
India. . . . . . . . . . . . . . . . . . . . . . 2007 9 961 8 683 997 4 — 113 — — 149 127 545 12 345 560 —Inde 2008 8 717 8 948 529 39 — 383 — — 122 136 374 15 703 649 —
2009 10 108 9 023 686 27 — 332 — — 154 147 680 15 551 1 839 1332010 9 496 8 747 503 42 — 304 — — 148 146 951 16 592 1 061 662011 11 719 11 533 676 72 c — 195 — — 229 142 422 21 471 861 462
Part fourQuatrième partieCuarta parte Tables — Tableaux — Cuadros
160 Table IX. Manufacture of the principal narcotic drugs, 2007-2011 (continued)
Tableau IX. Fabrication des principaux stupéfiants, 2007-2011 (suite)
Cuadro IX. Fabricación de los principales estupefacientes, 2007-2011 (continuación)
Country
Pays
País
Year
Année
AñoMorphine
Morfina
Codeine
Codéine
Codeína
Dihydro-codeine
Dihydro-codéine
Dihidro-codeína
Pholcodine
Folcodina
Ethyl-morphine
Éthyl-morphine
Etilmorfina
Thebaine
Thébaïne
Tebaína
Oxycodone
Oxicodona
Hydrocodone
Hidrocodona
Dextropro-poxyphene
Dextropro-poxyphène
Dextropro-poxifeno
Diphenoxylate
Diphénoxylate
Difenoxilato
Methadone
Méthadone
Metadona
Pethidine
Péthidine
Petidina
Opium alkaloids and their derivatives
Alcaloïdes de l’opium et leurs dérivés
Alcaloides del opio y sus derivados
Synthetic opioids
Opioïdes synthétiques
Opioides sintéticos
(kg) (kg) (kg) (kg) (kg) (kg) (kg) (kg) (kg) (kg) (kg) (kg) (kg)
Buprenorphinea
Buprénorphinea
Buprenorfinaa
Iran (Islamic Republic of) . . . . 2007 37 270 b 34 457 — — — — — — — — — — —Iran (République islamique d’) 2008 15 318 b 15 545 — — — — — — — — — — —Irán (República Islámica del) 2009 17 084 14 485 — — — — — — — — — — —
2010 23 436 10 865 — — — — — — — — — — —2011 20 043 19 235 — — — — — — — — — — —
Italy . . . . . . . . . . . . . . . . . . . . . . 2007 2 101 2 024 — — 5 992 — — — — 25 586 — 452 —Italie 2008 2 328 2 006 — — 3 735 — — — — 15 274 — 437 —Italia 2009 755 b 479 — — 4 715 — — 127 — 18 318 — — —
2010 2 008 1 068 — — 4 038 — — — — — — — —2011 1 305 656 — — 3 196 — — — — — — — —
Japan . . . . . . . . . . . . . . . . . . . . . 2007 9 678 11 915 1 073 — 10 459 — — 335 — — — — —Japon 2008 10 199 10 696 970 — 11 579 — — 321 — — — — —Japón 2009 11 017 11 719 930 — 10 654 — — 460 — — — — —
2010 12 530 13 024 1 017 — 11 621 — — 603 — — — — —2011 13 779 12 958 958 — 12 329 — — 578 — — — — —
Norway . . . . . . . . . . . . . . . . . . . 2007 12 846 b 12 328 — — — — — — — — — — —Norvège 2008 9 999 b 9 177 — — — — — — 683 — — — —Noruega 2009 12 243 b 10 923 — — — — — — 897 — — — —
2010 18 285 b 17 165 — — — — — — 627 — — — —2011 17 212 b 14 269 — — — << — — 1 696 — — — —
Portugal . . . . . . . . . . . . . . . . . . . 2007 4 020 3 858 — — — — — — — — — — —2008 1 109 1 089 — — — — — — — — — — —2009 — — — — — — — — — — — — —2010 — — — — — — — — — — — — —2011 — — — — — — — — — — — — —
161
Slovakia . . . . . . . . . . . . . . . . . . . 2007 7 502 3 888 174 — 1 927 — — 292 — — — 780 919Slovaquie 2008 4 491 5 956 80 — 1 542 — << 1 242 << — — — 980Eslovaquia 2009 11 371 13 380 662 — 894 — 2 655 << — — 357 994
2010 11 462 8 095 162 — 1 747 — — 366 — — — 391 1092011 10 046 7 837 — — 1 702 — — — — — — 789 690
South Africa . . . . . . . . . . . . . . . 2007 7 663 6 882 — — — — — — 86 — — — —Afrique du Sud 2008 7 713 6 899 — — — — — — 86 — — — —Sudáfrica 2009 8 565 6 702 — — — — — — 90 — — — —
2010 9 767 8 390 — — — — — — 130 — — — —2011 8 398 8 259 — — — — — — 262 — — — —
Spain . . . . . . . . . . . . . . . . . . . . . 2007 116 6 952 17 559 — — — — — — — — 1 122 1 778Espagne 2008 1 036 6 138 22 439 — — — — — — — — 1 660 2 229España 2009 2 790 7 272 28 165 — — — — — — — — 1 406 2 230
2010 5 519 9 211 22 859 — — — — — — — — 1 177 2 0142011 14 406 18 810 13 945 — — — — — — — — 1 495 2 896
Switzerland . . . . . . . . . . . . . . . . 2007 — 98 — 40 — — — — — — — 9 727 —Suisse 2008 596 << — — — — — 606 — — — 9 351 —Suiza 2009 107 — — — — — — 4 175 — — — 15 316 —
2010 2 485 — — 49 — — — — — — — 11 457 —2011 1 101 — — 406 — — — 4 218 — — — 12 411 —
The former Yugoslav Rep. of Macedonia . . . . . . . . . . . . 2007 1 344 1 290 — — — — — — 121 — — 100 —L’ex-Rép. yougoslave 2008 1 433 1 352 — — — — — — 40 — — 88 —
de Macédoine 2009 1 235 1 287 — — — — — — 103 — — — —La ex Rep. Yugoslava 2010 1 577 1 590 — — — — — — 85 — — 234 —
de Macedonia 2011 1 412 1 411 — — — — — — 115 — — 270 —
Turkey . . . . . . . . . . . . . . . . . . . . 2007 3 390 b 3 214 — — — — — — — — — — —Turquie 2008 3 953 b 3 549 — — 276 314 — — — — — — —Turquía 2009 4 500 b 4 313 << — — — — — — — — — —
2010 6 438 b 6 178 — — 81 36 — — — — — — —2011 11 860 b 11 353 — — 566 156 — — — — — — —
United Kingdom . . . . . . . . . . . . 2007 104 619 b 80 057 — 3 095 11 410 — 83 9 206 3 713 — — 6 400 601Royaume-Uni 2008 95 024 b 72 896 128 3 769 12 014 — 49 12 339 1 420 — — 4 624 790Reino Unido 2009 81 317 b 62 509 — 5 218 9 277 — 43 11 484 2 760 — — 3 061 593
2010 89 736 b 67 773 — — 10 623 — 50 9 792 2 304 — — 1 650 d . .2011 107 347 b 85 070 — 739 11 399 — 74 12 965 2 249 8 — 2 568 282
United States . . . . . . . . . . . . . . 2007 112 234 76 954 71 366 7 382 — 37 936 55 688 — 91 359 643 16 392 6 358 États-Unis 2008 118 545 81 456 69 093 10 << << 42 549 68 207 — 84 931 680 17 690 5 594
Estados Unidos 2009 98 808 74 543 78 105 6 196 — 48 364 95 946 — 80 848 757 19 154 4 2532010 78 419 51 875 82 144 147 117 — 44 241 101 229 — 53 703 716 15 171 3 5142011 87 757 64 629 84 276 1 546 << — 56 017 106 117 — << 666 17 427 3 166
Part fourQuatrième partieCuarta parte Tables — Tableaux — Cuadros
162 Table IX. Manufacture of the principal narcotic drugs, 2007-2011 (continued)
Tableau IX. Fabrication des principaux stupéfiants, 2007-2011 (suite)
Cuadro IX. Fabricación de los principales estupefacientes, 2007-2011 (continuación)
Country
Pays
País
Year
Année
AñoMorphine
Morfina
Codeine
Codéine
Codeína
Dihydro-codeine
Dihydro-codéine
Dihidro-codeína
Pholcodine
Folcodina
Ethyl-morphine
Éthyl-morphine
Etilmorfina
Thebaine
Thébaïne
Tebaína
Oxycodone
Oxicodona
Hydrocodone
Hidrocodona
Dextropro-poxyphene
Dextropro-poxyphène
Dextropro-poxifeno
Diphenoxylate
Diphénoxylate
Difenoxilato
Methadone
Méthadone
Metadona
Pethidine
Péthidine
Petidina
Opium alkaloids and their derivatives
Alcaloïdes de l’opium et leurs dérivés
Alcaloides del opio y sus derivados
Synthetic opioids
Opioïdes synthétiques
Opioides sintéticos
Buprenorphinea
Buprénorphinea
Buprenorfinaa
(kg) (kg) (kg) (kg) (kg) (kg) (kg) (kg) (kg) (kg) (kg) (kg) (kg)
aAn opioid under the control of the Convention on Psychotropic Substances of 1971. — Opioïde placé sous contrôle en vertu de la Convention de 1971 sur les substances psychotropes. — Un opioide bajo control del Convenio sobre Sustancias Sicotrópicas de 1971.
bIn Australia, China, Iran (Islamic Republic of), Italy, Norway, Portugal, Turkey and the United Kingdom, concentrate of poppy straw is used in continuous industrial processes for the manufacture of other alkaloids such as codeine, without first separating morphine. For the purposes of statistical consistency and comparison, the theoretical quantity of morphine originating from concentrate of poppy straw involved in such conversions is calculated by the International Narcotics Control Board and included in the data on the manufacture and utilization of morphine. — En Australie, en Chine, en Iran (République islamique d’), en Italie, en Norvège, au Portugal, au Royaume-Uni et en Turquie, le concentré de paille de pavot est utilisé dans des processus industriels continus qui permettent de fabriquer d’autres alcaloïdes tels que la codéine et/ou les substances non visées par la Convention unique sur les stupéfiants de 1961, sans en extraire d’abord la morphine. Dans un souci de cohérence statistique et pour faciliter les comparaisons, l’Organe international de contrôle des stupéfiants a calculé la quantité théorique de morphine fabriquée à partir du concentré de paille de pavot ainsi transformé et l’a incluse dans les statistiques relatives à la fabrication et à l’utilisation de morphine. — En Australia, China, Irán (República Islámica del), Italia, Noruega, Portugal, el Reino Unido y Turquía se utiliza concentrado de paja de adormidera en procesos industriales continuos para la fabricación de otros alcaloides, como la codeína, sin separar antes la morfina. A los efectos de la compatibilidad estadística y la comparación, la Junta Internacional de Fiscalización de Estupefacientes calcula la cantidad teórica de morfina originada en el concentrado de paja de adormidera que se utiliza en esas transformaciones y la incluye en los datos de fabricación y utilización de morfina.
cThe statistical report on psychotropic substances was submitted, but data on the manufacture of buprenorphine were furnished on Form C. — Le rapport statistique sur les substances psychotropes a été soumis, mais les données sur la fabrication de buprénorphine ont été fournies dans le formulaire C. — Se presentó el informe estadístico sobre las sustancias sicotrópicas, pero los datos sobre la fabricación de buprenorfina se facilitaron en el Formulario C.
dThis figure was calculated by INCB using available data series. It is being clarified with the Government. — Ce chiffre a été calculé par l’OICS à partir des séries de données disponibles. Des éclaircissements sont demandés au Gouvernement. — Esta cifra fue calculada por la JIFE a partir de las series de datos de que dispone. Se está consultando al Gobierno correspondiente para aclararla.
Total . . . . . . . . . . . . . . . . . . . . . . 2007 439 961 349 307 111 808 3 792 31 872 1 244 38 168 75 167 9 528 285 865 15 564 37 775 12 3502008 389 974 322 868 108 336 4 632 30 095 2 288 42 609 95 929 6 662 270 902 18 500 35 194 12 6302009 411 383 339 622 151 924 6 487 27 127 1 422 48 421 135 883 10 322 257 848 18 759 43 685 11 5552010 409 267 330 910 137 573 1 864 29 939 1 088 44 302 122 273 7 813 204 030 18 857 34 003 7 0642011 440 324 380 623 145 221 4 253 32 160 1 033 56 091 126 547 10 449 142 430 24 169 39 277 9 093
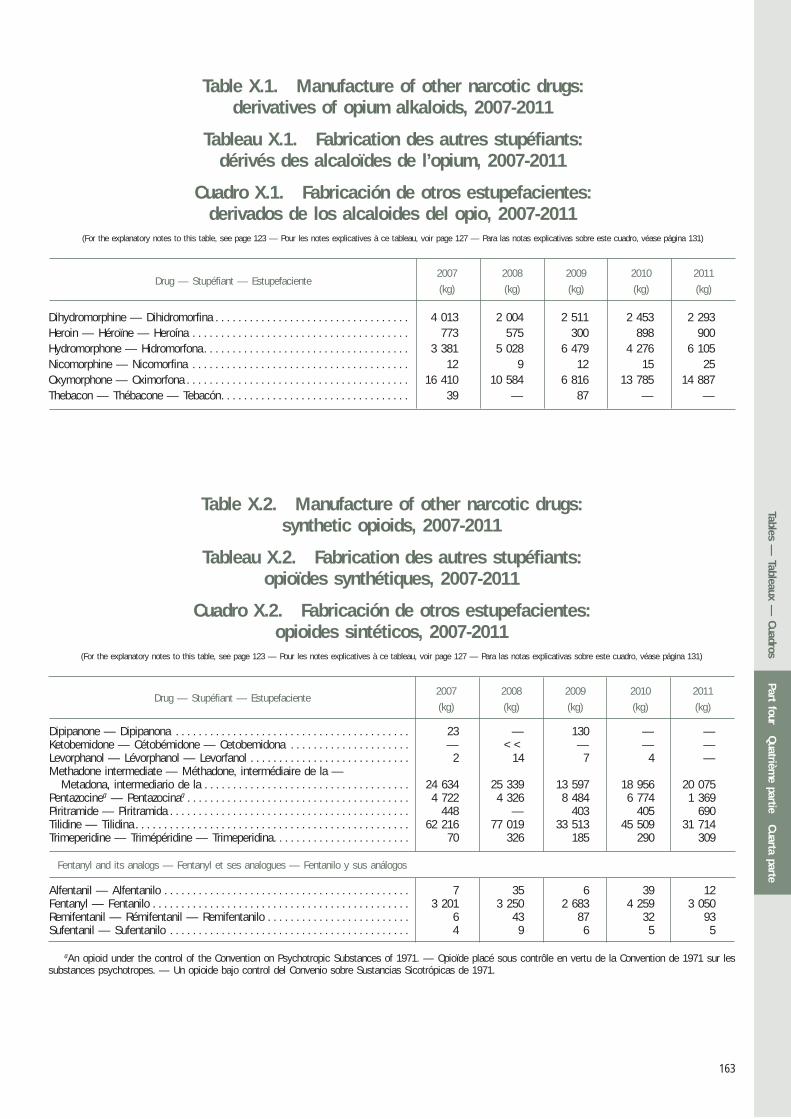
163
2007 2008 2009 2010 2011
(kg) (kg) (kg) (kg) (kg)Drug — Stupéfiant — Estupefaciente
Table X.1. Manufacture of other narcotic drugs: derivatives of opium alkaloids, 2007-2011
Tableau X.1. Fabrication des autres stupéfiants: dérivés des alcaloïdes de l’opium, 2007-2011
Cuadro X.1. Fabricación de otros estupefacientes:derivados de los alcaloides del opio, 2007-2011
(For the explanatory notes to this table, see page 123 — Pour les notes explicatives à ce tableau, voir page 127 — Para las notas explicativas sobre este cuadro, véase página 131)
Dihydromorphine — Dihidromorfina . . . . . . . . . . . . . . . . . . . . . . . . . . . . . . . . . . 4 013 2 004 2 511 2 453 2 293Heroin — Héroïne — Heroína . . . . . . . . . . . . . . . . . . . . . . . . . . . . . . . . . . . . . . 773 575 300 898 900Hydromorphone — Hidromorfona . . . . . . . . . . . . . . . . . . . . . . . . . . . . . . . . . . . . 3 381 5 028 6 479 4 276 6 105Nicomorphine — Nicomorfina . . . . . . . . . . . . . . . . . . . . . . . . . . . . . . . . . . . . . . 12 9 12 15 25Oxymorphone — Oximorfona . . . . . . . . . . . . . . . . . . . . . . . . . . . . . . . . . . . . . . . 16 410 10 584 6 816 13 785 14 887Thebacon — Thébacone — Tebacón . . . . . . . . . . . . . . . . . . . . . . . . . . . . . . . . . 39 — 87 — —
Drug — Stupéfiant — Estupefaciente2007 2008 2009 2010 2011
(kg) (kg) (kg) (kg) (kg)
Table X.2. Manufacture of other narcotic drugs: synthetic opioids, 2007-2011
Tableau X.2. Fabrication des autres stupéfiants:opioïdes synthétiques, 2007-2011
Cuadro X.2. Fabricación de otros estupefacientes:opioides sintéticos, 2007-2011
(For the explanatory notes to this table, see page 123 — Pour les notes explicatives à ce tableau, voir page 127 — Para las notas explicativas sobre este cuadro, véase página 131)
aAn opioid under the control of the Convention on Psychotropic Substances of 1971. — Opioïde placé sous contrôle en vertu de la Convention de 1971 sur les substances psychotropes. — Un opioide bajo control del Convenio sobre Sustancias Sicotrópicas de 1971.
Dipipanone — Dipipanona . . . . . . . . . . . . . . . . . . . . . . . . . . . . . . . . . . . . . . . . . 23 — 130 — —Ketobemidone — Cétobémidone — Cetobemidona . . . . . . . . . . . . . . . . . . . . . — << — — —Levorphanol — Lévorphanol — Levorfanol . . . . . . . . . . . . . . . . . . . . . . . . . . . . 2 14 7 4 —Methadone intermediate — Méthadone, intermédiaire de la —
Metadona, intermediario de la . . . . . . . . . . . . . . . . . . . . . . . . . . . . . . . . . . . . 24 634 25 339 13 597 18 956 20 075Pentazocinea — Pentazocinaa . . . . . . . . . . . . . . . . . . . . . . . . . . . . . . . . . . . . . . . 4 722 4 326 8 484 6 774 1 369Piritramide — Piritramida . . . . . . . . . . . . . . . . . . . . . . . . . . . . . . . . . . . . . . . . . . 448 — 403 405 690Tilidine — Tilidina . . . . . . . . . . . . . . . . . . . . . . . . . . . . . . . . . . . . . . . . . . . . . . . . 62 216 77 019 33 513 45 509 31 714Trimeperidine — Trimépéridine — Trimeperidina . . . . . . . . . . . . . . . . . . . . . . . . 70 326 185 290 309
Fentanyl and its analogs — Fentanyl et ses analogues — Fentanilo y sus análogos
Alfentanil — Alfentanilo . . . . . . . . . . . . . . . . . . . . . . . . . . . . . . . . . . . . . . . . . . . 7 35 6 39 12Fentanyl — Fentanilo . . . . . . . . . . . . . . . . . . . . . . . . . . . . . . . . . . . . . . . . . . . . . 3 201 3 250 2 683 4 259 3 050Remifentanil — Rémifentanil — Remifentanilo . . . . . . . . . . . . . . . . . . . . . . . . . 6 43 87 32 93Sufentanil — Sufentanilo . . . . . . . . . . . . . . . . . . . . . . . . . . . . . . . . . . . . . . . . . . 4 9 6 5 5
Part fourQuatrièm
e partieCuarta parte
Tables — Tableaux —
Cuadros
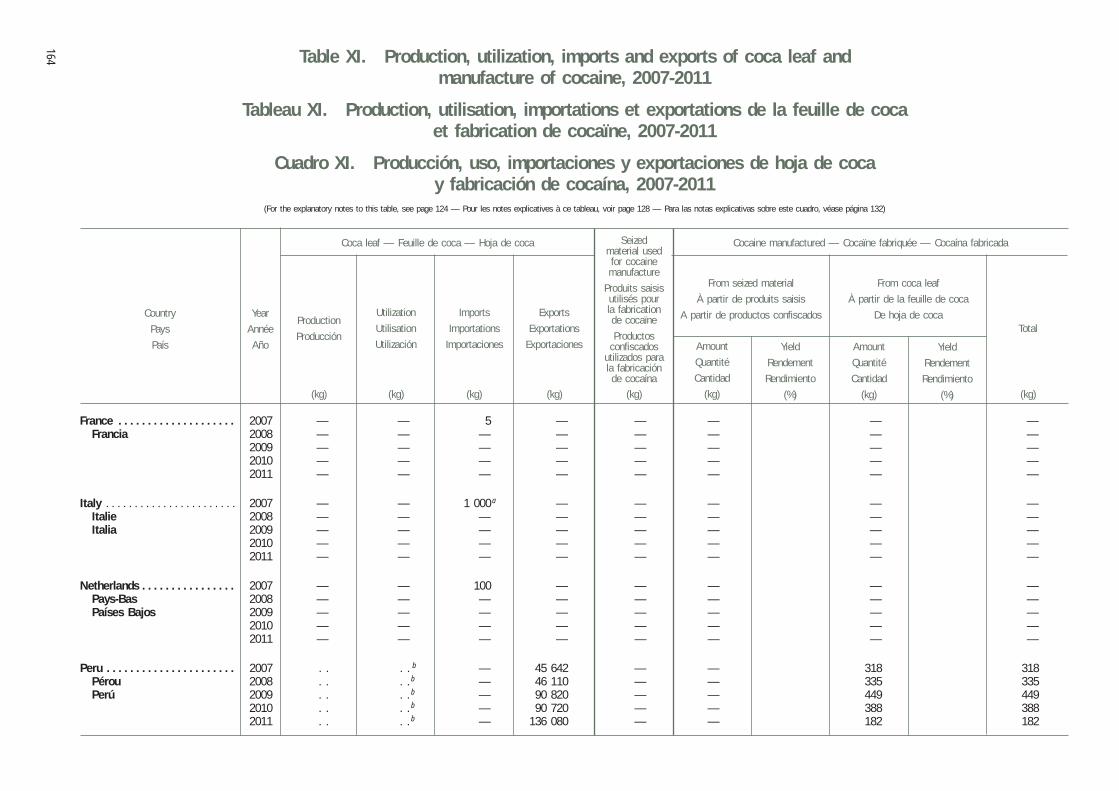
164 Table XI. Production, utilization, imports and exports of coca leaf and manufacture of cocaine, 2007-2011
Tableau XI. Production, utilisation, importations et exportations de la feuille de cocaet fabrication de cocaïne, 2007-2011
Cuadro XI. Producción, uso, importaciones y exportaciones de hoja de coca y fabricación de cocaína, 2007-2011
(For the explanatory notes to this table, see page 124 — Pour les notes explicatives à ce tableau, voir page 128 — Para las notas explicativas sobre este cuadro, véase página 132)
Country
Pays
País
Year
Année
Año
Coca leaf — Feuille de coca — Hoja de coca Cocaine manufactured — Cocaïne fabriquée — Cocaína fabricada
Production
Producción
Utilization
Utilisation
Utilización
Imports
Importations
Importaciones
Exports
Exportations
Exportaciones
Seizedmaterial usedfor cocaine manufacture
Produits saisis utilisés pourla fabricationde cocaïne
Productos confiscados
utilizados para la fabricaciónde cocaína
From coca leaf
À partir de la feuille de coca
De hoja de coca
From seized material
À partir de produits saisis
A partir de productos confiscadosTotal
Yield
Rendement
Rendimiento
(%)
Yield
Rendement
Rendimiento
(%)(kg) (kg) (kg) (kg) (kg) (kg)
Amount
Quantité
Cantidad
(kg)
Amount
Quantité
Cantidad
(kg)
France . . . . . . . . . . . . . . . . . . . . 2007 — — 5 — — — — —Francia 2008 — — — — — — — —
2009 — — — — — — — —2010 — — — — — — — —2011 — — — — — — — —
Italy . . . . . . . . . . . . . . . . . . . . . . . 2007 — — 1 000 a — — — — —Italie 2008 — — — — — — — —Italia 2009 — — — — — — — —
2010 — — — — — — — —2011 — — — — — — — —
Netherlands . . . . . . . . . . . . . . . . 2007 — — 100 — — — — —
Pays-Bas 2008 — — — — — — — —Países Bajos 2009 — — — — — — — —
2010 — — — — — — — —2011 — — — — — — — —
Peru . . . . . . . . . . . . . . . . . . . . . . 2007 . . . . b — 45 642 — — 318 318
Pérou 2008 . . . . b — 46 110 — — 335 335Perú 2009 . . . . b — 90 820 — — 449 449
2010 . . . . b — 90 720 — — 388 3882011 . . . . b — 136 080 — — 182 182
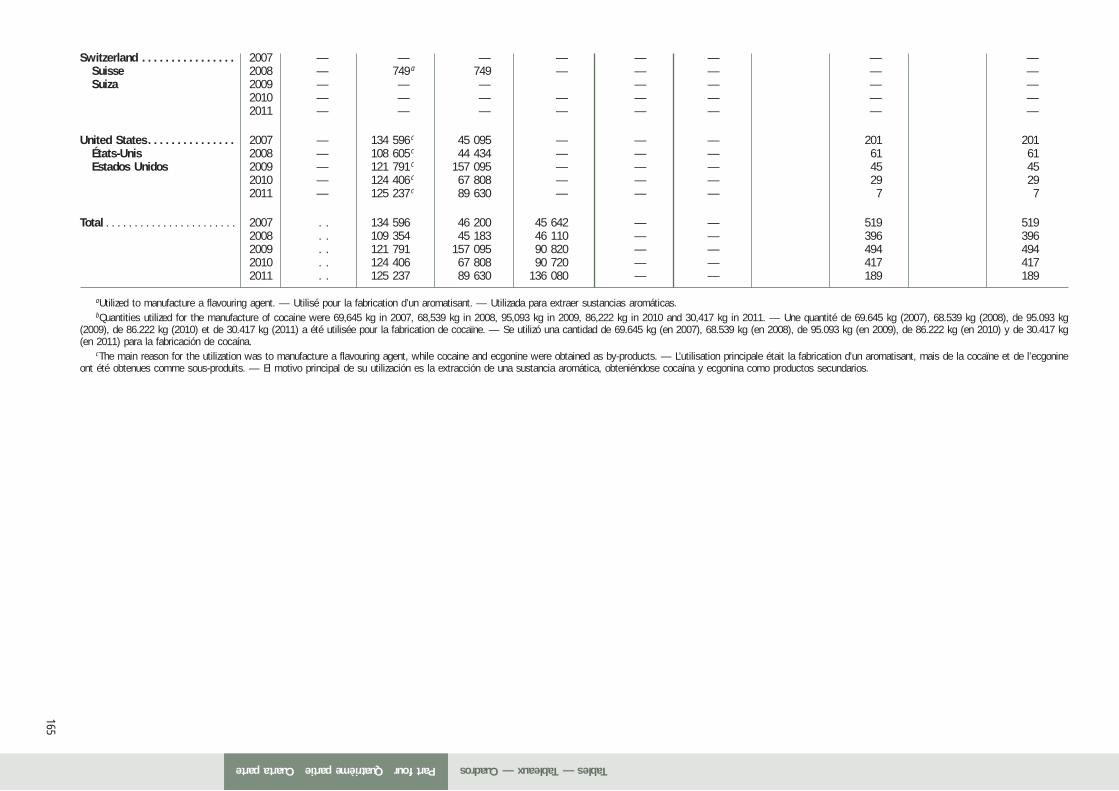
165
aUtilized to manufacture a flavouring agent. — Utilisé pour la fabrication d’un aromatisant. — Utilizada para extraer sustancias aromáticas.bQuantities utilized for the manufacture of cocaine were 69,645 kg in 2007, 68,539 kg in 2008, 95,093 kg in 2009, 86,222 kg in 2010 and 30,417 kg in 2011. — Une quantité de 69.645 kg (2007), 68.539 kg (2008), de 95.093 kg
(2009), de 86.222 kg (2010) et de 30.417 kg (2011) a été utilisée pour la fabrication de cocaïne. — Se utilizó una cantidad de 69.645 kg (en 2007), 68.539 kg (en 2008), de 95.093 kg (en 2009), de 86.222 kg (en 2010) y de 30.417 kg (en 2011) para la fabricación de cocaína.
cThe main reason for the utilization was to manufacture a flavouring agent, while cocaine and ecgonine were obtained as by-products. — L’utilisation principale était la fabrication d’un aromatisant, mais de la cocaïne et de l’ecgonine ont été obtenues comme sous-produits. — El motivo principal de su utilización es la extracción de una sustancia aromática, obteniéndose cocaína y ecgonina como productos secundarios.
Switzerland . . . . . . . . . . . . . . . . 2007 — — — — — — — —Suisse 2008 — 749 a 749 — — — — —Suiza 2009 — — — — — — —
2010 — — — — — — — —2011 — — — — — — — —
United States . . . . . . . . . . . . . . . 2007 — 134 596 c 45 095 — — — 201 201
États-Unis 2008 — 108 605 c 44 434 — — — 61 61Estados Unidos 2009 — 121 791 c 157 095 — — — 45 45
2010 — 124 406 c 67 808 — — — 29 292011 — 125 237 c 89 630 — — — 7 7
Total . . . . . . . . . . . . . . . . . . . . . . . 2007 . . 134 596 46 200 45 642 — — 519 519
2008 . . 109 354 45 183 46 110 — — 396 3962009 . . 121 791 157 095 90 820 — — 494 4942010 . . 124 406 67 808 90 720 — — 417 4172011 . . 125 237 89 630 136 080 — — 189 189
Part fourQuatrième partieCuarta parte Tables — Tableaux — Cuadros
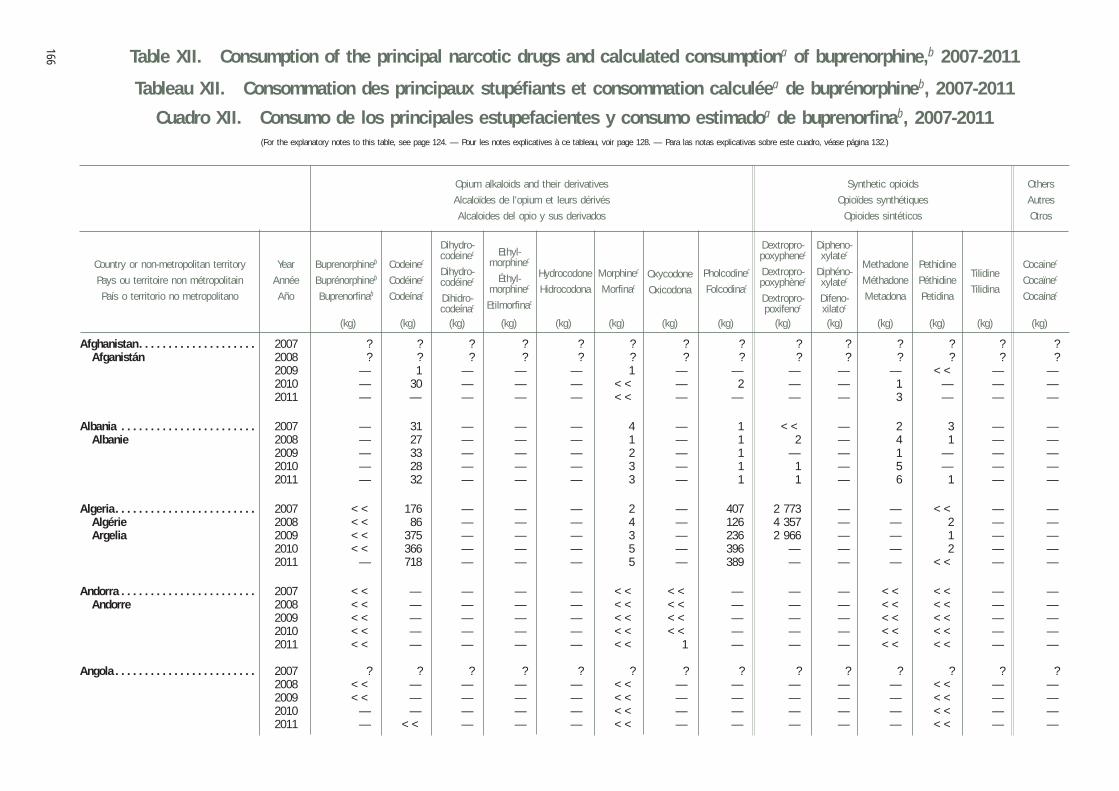
166
Year
Année
Año
Country or non-metropolitan territory
Pays ou territoire non métropolitain
País o territorio no metropolitano
Cocainec
Cocaïnec
Cocaínac
Codeinec
Codéinec
Codeínac
Buprenorphineb
Buprénorphineb
Buprenorfinab
Dextropro-poxyphenec
Dextropro-poxyphènec
Dextropro-poxifenoc
Dipheno-xylatec
Diphéno-xylatec
Difeno-xilatoc
Dihydro-codeinec
Dihydro-codéinec
Dihidro-codeínac
Ethyl-morphinec
Éthyl-morphinec
Etilmorfinac
Methadone
Méthadone
Metadona
Morphinec
Morfinac
Pethidine
Péthidine
Petidina
Pholcodinec
Folcodinac
(kg) (kg) (kg) (kg) (kg) (kg) (kg) (kg) (kg) (kg) (kg) (kg) (kg) (kg)
Oxycodone
Oxicodona
Hydrocodone
Hidrocodona
Tilidine
Tilidina
Opium alkaloids and their derivatives
Alcaloïdes de l’opium et leurs dérivés
Alcaloides del opio y sus derivados
Synthetic opioids
Opioïdes synthétiques
Opioides sintéticos
Others
Autres
Otros
Table XII. Consumption of the principal narcotic drugs and calculated consumptiona of buprenorphine,b 2007-2011
Tableau XII. Consommation des principaux stupéfiants et consommation calculéea de buprénorphineb, 2007-2011
Cuadro XII. Consumo de los principales estupefacientes y consumo estimadoa de buprenorfinab, 2007-2011(For the explanatory notes to this table, see page 124. — Pour les notes explicatives à ce tableau, voir page 128. — Para las notas explicativas sobre este cuadro, véase página 132.)
Afghanistan . . . . . . . . . . . . . . . . . . . . 2007 ? ? ? ? ? ? ? ? ? ? ? ? ? ?Afganistán 2008 ? ? ? ? ? ? ? ? ? ? ? ? ? ?
2009 — 1 — — — 1 — — — — — << — —2010 — 30 — — — << — 2 — — 1 — — —2011 — — — — — << — — — — 3 — — —
Albania . . . . . . . . . . . . . . . . . . . . . . . 2007 — 31 — — — 4 — 1 << — 2 3 — —Albanie 2008 — 27 — — — 1 — 1 2 — 4 1 — —
2009 — 33 — — — 2 — 1 — — 1 — — —2010 — 28 — — — 3 — 1 1 — 5 — — —2011 — 32 — — — 3 — 1 1 — 6 1 — —
Algeria . . . . . . . . . . . . . . . . . . . . . . . . 2007 << 176 — — — 2 — 407 2 773 — — << — —Algérie 2008 << 86 — — — 4 — 126 4 357 — — 2 — —Argelia 2009 << 375 — — — 3 — 236 2 966 — — 1 — —
2010 << 366 — — — 5 — 396 — — — 2 — —2011 — 718 — — — 5 — 389 — — — << — —
Andorra . . . . . . . . . . . . . . . . . . . . . . . 2007 << — — — — << << — — — << << — —Andorre 2008 << — — — — << << — — — << << — —
2009 << — — — — << << — — — << << — —2010 << — — — — << << — — — << << — —2011 << — — — — << 1 — — — << << — —
Angola . . . . . . . . . . . . . . . . . . . . . . . . 2007 ? ? ? ? ? ? ? ? ? ? ? ? ? ?2008 << — — — — << — — — — — << — —2009 << — — — — << — — — — — << — —2010 — — — — — << — — — — — << — —2011 — << — — — << — — — — — << — —
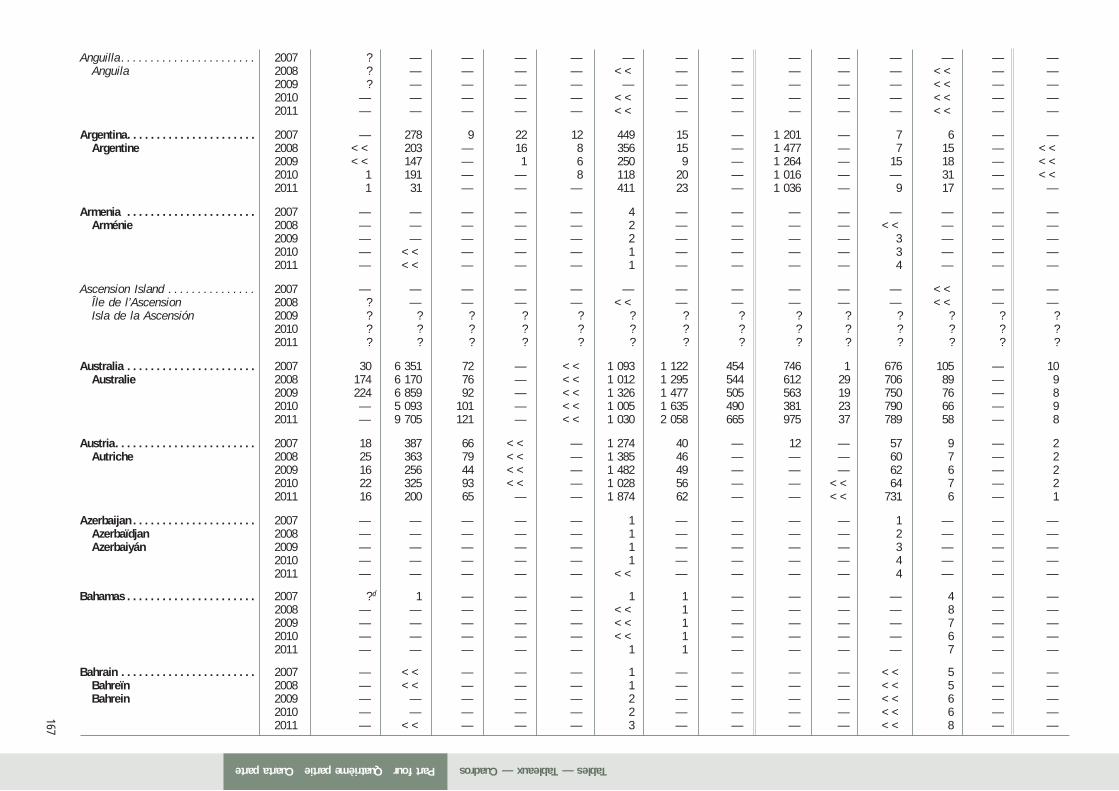
167
Anguilla . . . . . . . . . . . . . . . . . . . . . . . 2007 ? — — — — — — — — — — — — —Anguila 2008 ? — — — — << — — — — — << — —
2009 ? — — — — — — — — — — << — —2010 — — — — — << — — — — — << — —2011 — — — — — << — — — — — << — —
Argentina . . . . . . . . . . . . . . . . . . . . . . 2007 — 278 9 22 12 449 15 — 1 201 — 7 6 — —Argentine 2008 << 203 — 16 8 356 15 — 1 477 — 7 15 — <<
2009 << 147 — 1 6 250 9 — 1 264 — 15 18 — <<2010 1 191 — — 8 118 20 — 1 016 — — 31 — <<2011 1 31 — — — 411 23 — 1 036 — 9 17 — —
Armenia . . . . . . . . . . . . . . . . . . . . . . 2007 — — — — — 4 — — — — — — — —Arménie 2008 — — — — — 2 — — — — << — — —
2009 — — — — — 2 — — — — 3 — — —2010 — << — — — 1 — — — — 3 — — —2011 — << — — — 1 — — — — 4 — — —
Ascension Island . . . . . . . . . . . . . . . 2007 — — — — — — — — — — — << — —Île de l’Ascension 2008 ? — — — — << — — — — — << — —Isla de la Ascensión 2009 ? ? ? ? ? ? ? ? ? ? ? ? ? ?
2010 ? ? ? ? ? ? ? ? ? ? ? ? ? ?2011 ? ? ? ? ? ? ? ? ? ? ? ? ? ?
Australia . . . . . . . . . . . . . . . . . . . . . . 2007 30 6 351 72 — << 1 093 1 122 454 746 1 676 105 — 10Australie 2008 174 6 170 76 — << 1 012 1 295 544 612 29 706 89 — 9
2009 224 6 859 92 — << 1 326 1 477 505 563 19 750 76 — 82010 — 5 093 101 — << 1 005 1 635 490 381 23 790 66 — 92011 — 9 705 121 — << 1 030 2 058 665 975 37 789 58 — 8
Austria . . . . . . . . . . . . . . . . . . . . . . . . 2007 18 387 66 << — 1 274 40 — 12 — 57 9 — 2Autriche 2008 25 363 79 << — 1 385 46 — — — 60 7 — 2
2009 16 256 44 << — 1 482 49 — — — 62 6 — 22010 22 325 93 << — 1 028 56 — — << 64 7 — 22011 16 200 65 — — 1 874 62 — — << 731 6 — 1
Azerbaijan . . . . . . . . . . . . . . . . . . . . . 2007 — — — — — 1 — — — — 1 — — —Azerbaïdjan 2008 — — — — — 1 — — — — 2 — — —Azerbaiyán 2009 — — — — — 1 — — — — 3 — — —
2010 — — — — — 1 — — — — 4 — — —2011 — — — — — << — — — — 4 — — —
Bahamas . . . . . . . . . . . . . . . . . . . . . . 2007 ? d 1 — — — 1 1 — — — — 4 — —2008 — — — — — << 1 — — — — 8 — —2009 — — — — — << 1 — — — — 7 — —2010 — — — — — << 1 — — — — 6 — —2011 — — — — — 1 1 — — — — 7 — —
Bahrain . . . . . . . . . . . . . . . . . . . . . . . 2007 — << — — — 1 — — — — << 5 — —Bahreïn 2008 — << — — — 1 — — — — << 5 — —Bahrein 2009 — — — — — 2 — — — — << 6 — —
2010 — — — — — 2 — — — — << 6 — —2011 — << — — — 3 — — — — << 8 — —
Part fourQuatrième partieCuarta parte Tables — Tableaux — Cuadros
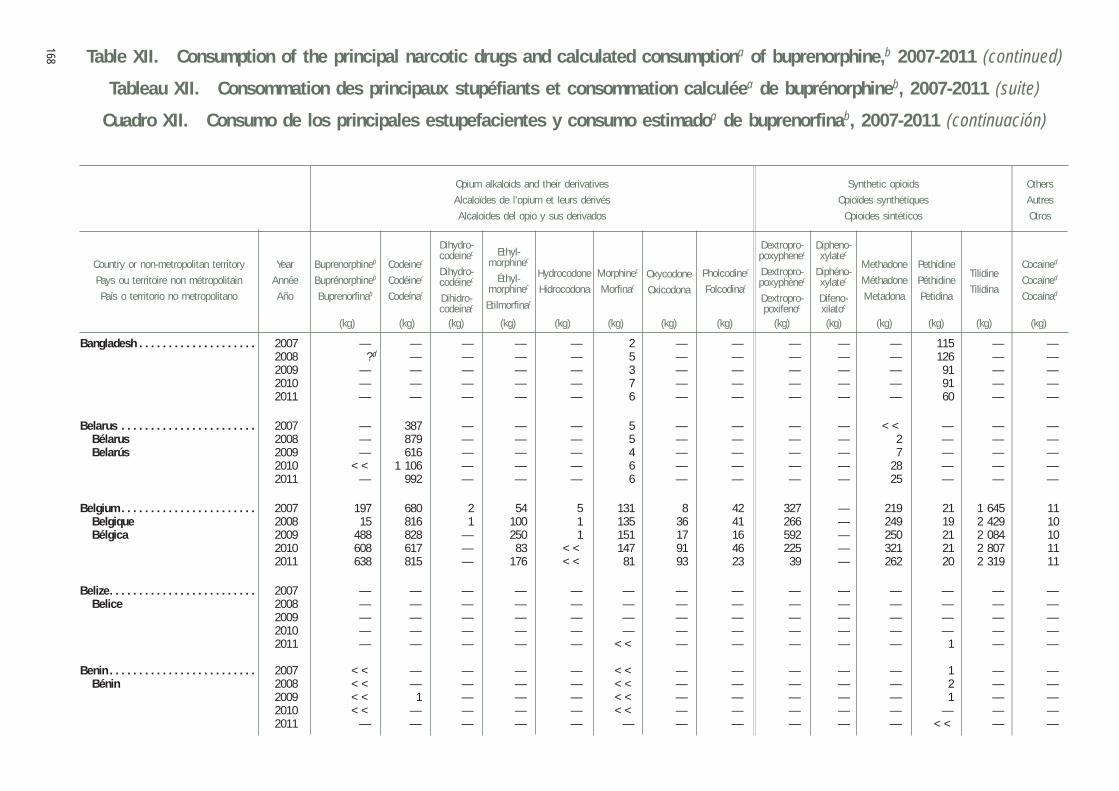
Table XII. Consumption of the principal narcotic drugs and calculated consumptiona of buprenorphine,b 2007-2011 (continued)
Tableau XII. Consommation des principaux stupéfiants et consommation calculéea de buprénorphineb, 2007-2011 (suite)
Cuadro XII. Consumo de los principales estupefacientes y consumo estimadoa de buprenorfinab, 2007-2011 (continuación)
168
Year
Année
Año
Country or non-metropolitan territory
Pays ou territoire non métropolitain
País o territorio no metropolitano
Cocained
Cocaïned
Cocaínad
Codeinec
Codéinec
Codeínac
Buprenorphineb
Buprénorphineb
Buprenorfinab
Dextropro-poxyphenec
Dextropro-poxyphènec
Dextropro-poxifenoc
Dipheno-xylatec
Diphéno-xylatec
Difeno-xilatoc
Dihydro-codeinec
Dihydro-codéinec
Dihidro-codeínac
Ethyl-morphinec
Éthyl-morphinec
Etilmorfinac
Methadone
Méthadone
Metadona
Morphinec
Morfinac
Pethidine
Péthidine
Petidina
Pholcodinec
Folcodinac
(kg) (kg) (kg) (kg) (kg) (kg) (kg) (kg) (kg) (kg) (kg) (kg) (kg) (kg)
Oxycodone
Oxicodona
Hydrocodone
Hidrocodona
Tilidine
Tilidina
Opium alkaloids and their derivatives
Alcaloïdes de l’opium et leurs dérivés
Alcaloides del opio y sus derivados
Synthetic opioids
Opioïdes synthétiques
Opioides sintéticos
Others
Autres
Otros
Bangladesh . . . . . . . . . . . . . . . . . . . . 2007 — — — — — 2 — — — — — 115 — —2008 ? d — — — — 5 — — — — — 126 — —2009 — — — — — 3 — — — — — 91 — —2010 — — — — — 7 — — — — — 91 — —2011 — — — — — 6 — — — — — 60 — —
Belarus . . . . . . . . . . . . . . . . . . . . . . . 2007 — 387 — — — 5 — — — — << — — —Bélarus 2008 — 879 — — — 5 — — — — 2 — — —Belarús 2009 — 616 — — — 4 — — — — 7 — — —
2010 << 1 106 — — — 6 — — — — 28 — — —2011 — 992 — — — 6 — — — — 25 — — —
Belgium . . . . . . . . . . . . . . . . . . . . . . . 2007 197 680 2 54 5 131 8 42 327 — 219 21 1 645 11Belgique 2008 15 816 1 100 1 135 36 41 266 — 249 19 2 429 10Bélgica 2009 488 828 — 250 1 151 17 16 592 — 250 21 2 084 10
2010 608 617 — 83 << 147 91 46 225 — 321 21 2 807 112011 638 815 — 176 << 81 93 23 39 — 262 20 2 319 11
Belize . . . . . . . . . . . . . . . . . . . . . . . . . 2007 — — — — — — — — — — — — — —Belice 2008 — — — — — — — — — — — — — —
2009 — — — — — — — — — — — — — —2010 — — — — — — — — — — — — — —2011 — — — — — << — — — — — 1 — —
Benin . . . . . . . . . . . . . . . . . . . . . . . . . 2007 << — — — — << — — — — — 1 — —Bénin 2008 << — — — — << — — — — — 2 — —
2009 << 1 — — — << — — — — — 1 — —2010 << — — — — << — — — — — — — —2011 — — — — — — — — — — — << — —
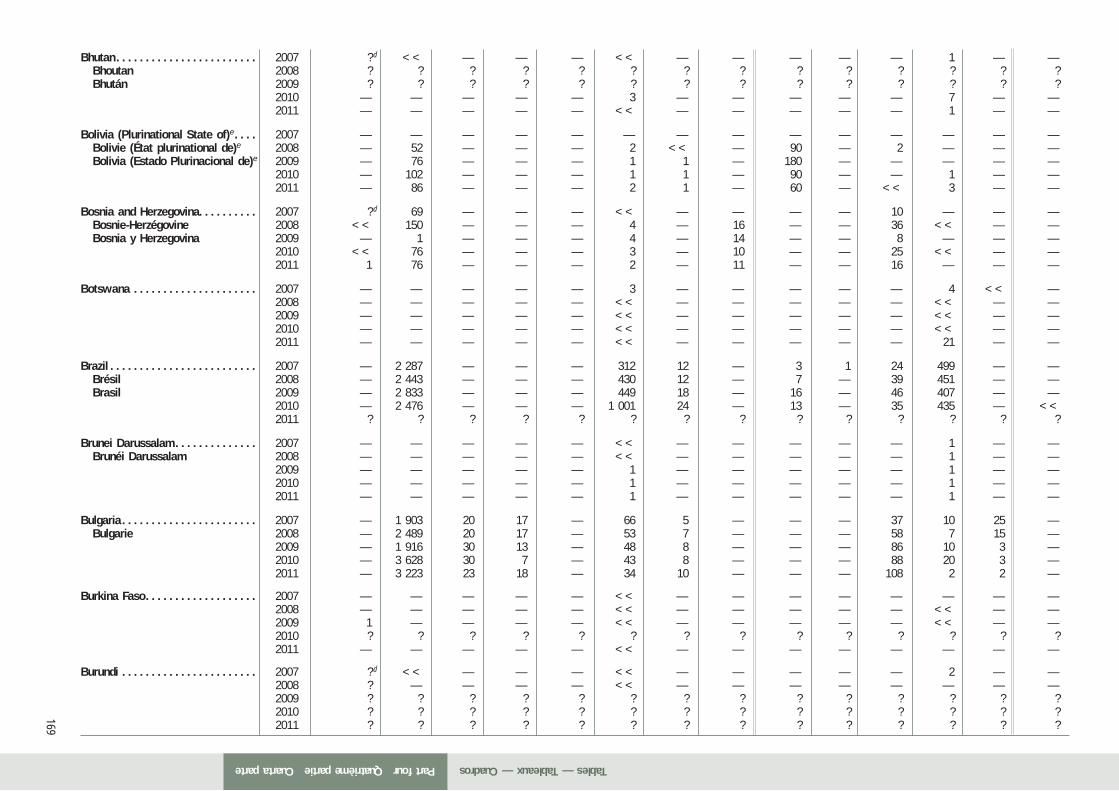
169
Bhutan . . . . . . . . . . . . . . . . . . . . . . . . 2007 ? d << — — — << — — — — — 1 — —Bhoutan 2008 ? ? ? ? ? ? ? ? ? ? ? ? ? ?Bhután 2009 ? ? ? ? ? ? ? ? ? ? ? ? ? ?
2010 — — — — — 3 — — — — — 7 — —2011 — — — — — << — — — — — 1 — —
Bolivia (Plurinational State of)e . . . . 2007 — — — — — — — — — — — — — —Bolivie (État plurinational de)e 2008 — 52 — — — 2 << — 90 — 2 — — —Bolivia (Estado Plurinacional de)e 2009 — 76 — — — 1 1 — 180 — — — — —
2010 — 102 — — — 1 1 — 90 — — 1 — —2011 — 86 — — — 2 1 — 60 — << 3 — —
Bosnia and Herzegovina. . . . . . . . . . 2007 ? d 69 — — — << — — — — 10 — — —Bosnie-Herzégovine 2008 << 150 — — — 4 — 16 — — 36 << — —Bosnia y Herzegovina 2009 — 1 — — — 4 — 14 — — 8 — — —
2010 << 76 — — — 3 — 10 — — 25 << — —2011 1 76 — — — 2 — 11 — — 16 — — —
Botswana . . . . . . . . . . . . . . . . . . . . . 2007 — — — — — 3 — — — — — 4 << —2008 — — — — — << — — — — — << — —2009 — — — — — << — — — — — << — —2010 — — — — — << — — — — — << — —2011 — — — — — << — — — — — 21 — —
Brazil . . . . . . . . . . . . . . . . . . . . . . . . . 2007 — 2 287 — — — 312 12 — 3 1 24 499 — —Brésil 2008 — 2 443 — — — 430 12 — 7 — 39 451 — —Brasil 2009 — 2 833 — — — 449 18 — 16 — 46 407 — —
2010 — 2 476 — — — 1 001 24 — 13 — 35 435 — <<2011 ? ? ? ? ? ? ? ? ? ? ? ? ? ?
Brunei Darussalam . . . . . . . . . . . . . . 2007 — — — — — << — — — — — 1 — —Brunéi Darussalam 2008 — — — — — << — — — — — 1 — —
2009 — — — — — 1 — — — — — 1 — —2010 — — — — — 1 — — — — — 1 — —2011 — — — — — 1 — — — — — 1 — —
Bulgaria . . . . . . . . . . . . . . . . . . . . . . . 2007 — 1 903 20 17 — 66 5 — — — 37 10 25 —Bulgarie 2008 — 2 489 20 17 — 53 7 — — — 58 7 15 —
2009 — 1 916 30 13 — 48 8 — — — 86 10 3 —2010 — 3 628 30 7 — 43 8 — — — 88 20 3 —2011 — 3 223 23 18 — 34 10 — — — 108 2 2 —
Burkina Faso . . . . . . . . . . . . . . . . . . . 2007 — — — — — << — — — — — — — —2008 — — — — — << — — — — — << — —2009 1 — — — — << — — — — — << — —2010 ? ? ? ? ? ? ? ? ? ? ? ? ? ?2011 — — — — — << — — — — — — — —
Burundi . . . . . . . . . . . . . . . . . . . . . . . 2007 ? d << — — — << — — — — — 2 — —2008 ? — — — — << — — — — — — — —2009 ? ? ? ? ? ? ? ? ? ? ? ? ? ?2010 ? ? ? ? ? ? ? ? ? ? ? ? ? ?2011 ? ? ? ? ? ? ? ? ? ? ? ? ? ?
Part fourQuatrième partieCuarta parte Tables — Tableaux — Cuadros
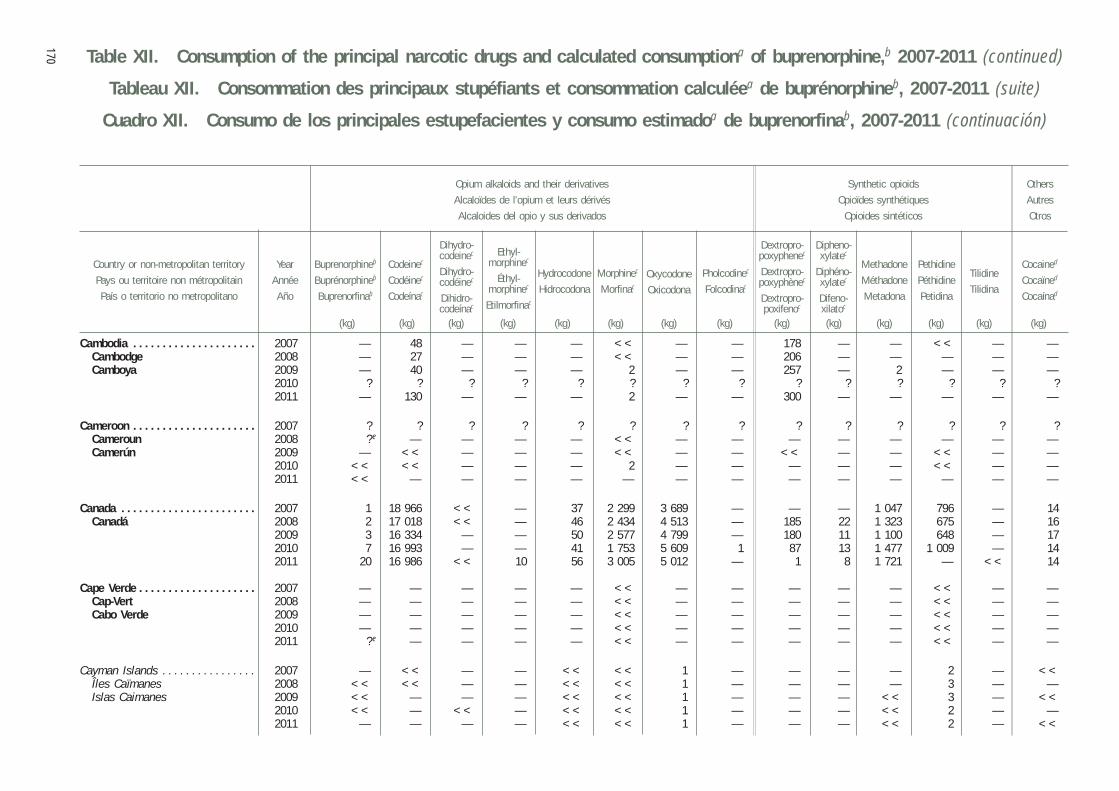
Table XII. Consumption of the principal narcotic drugs and calculated consumptiona of buprenorphine,b 2007-2011 (continued)
Tableau XII. Consommation des principaux stupéfiants et consommation calculéea de buprénorphineb, 2007-2011 (suite)
Cuadro XII. Consumo de los principales estupefacientes y consumo estimadoa de buprenorfinab, 2007-2011 (continuación)
170
Year
Année
Año
Country or non-metropolitan territory
Pays ou territoire non métropolitain
País o territorio no metropolitano
Cocained
Cocaïned
Cocaínad
Codeinec
Codéinec
Codeínac
Buprenorphineb
Buprénorphineb
Buprenorfinab
Dextropro-poxyphenec
Dextropro-poxyphènec
Dextropro-poxifenoc
Dipheno-xylatec
Diphéno-xylatec
Difeno-xilatoc
Dihydro-codeinec
Dihydro-codéinec
Dihidro-codeínac
Ethyl-morphinec
Éthyl-morphinec
Etilmorfinac
Methadone
Méthadone
Metadona
Morphinec
Morfinac
Pethidine
Péthidine
Petidina
Pholcodinec
Folcodinac
(kg) (kg) (kg) (kg) (kg) (kg) (kg) (kg) (kg) (kg) (kg) (kg) (kg) (kg)
Oxycodone
Oxicodona
Hydrocodone
Hidrocodona
Tilidine
Tilidina
Opium alkaloids and their derivatives
Alcaloïdes de l’opium et leurs dérivés
Alcaloides del opio y sus derivados
Synthetic opioids
Opioïdes synthétiques
Opioides sintéticos
Others
Autres
Otros
Cambodia . . . . . . . . . . . . . . . . . . . . . 2007 — 48 — — — << — — 178 — — << — —Cambodge 2008 — 27 — — — << — — 206 — — — — —Camboya 2009 — 40 — — — 2 — — 257 — 2 — — —
2010 ? ? ? ? ? ? ? ? ? ? ? ? ? ?2011 — 130 — — — 2 — — 300 — — — — —
Cameroon . . . . . . . . . . . . . . . . . . . . . 2007 ? ? ? ? ? ? ? ? ? ? ? ? ? ?Cameroun 2008 ? e — — — — << — — — — — — — —Camerún 2009 — << — — — << — — << — — << — —
2010 << << — — — 2 — — — — — << — —2011 << — — — — — — — — — — — — —
Canada . . . . . . . . . . . . . . . . . . . . . . . 2007 1 18 966 << — 37 2 299 3 689 — — — 1 047 796 — 14Canadá 2008 2 17 018 << — 46 2 434 4 513 — 185 22 1 323 675 — 16
2009 3 16 334 — — 50 2 577 4 799 — 180 11 1 100 648 — 172010 7 16 993 — — 41 1 753 5 609 1 87 13 1 477 1 009 — 142011 20 16 986 << 10 56 3 005 5 012 — 1 8 1 721 — << 14
Cape Verde . . . . . . . . . . . . . . . . . . . . 2007 — — — — — << — — — — — << — —Cap-Vert 2008 — — — — — << — — — — — << — —Cabo Verde 2009 — — — — — << — — — — — << — —
2010 — — — — — << — — — — — << — —2011 ? e — — — — << — — — — — << — —
Cayman Islands . . . . . . . . . . . . . . . . 2007 — << — — << << 1 — — — — 2 — <<Îles Caïmanes 2008 << << — — << << 1 — — — — 3 — —Islas Caimanes 2009 << — — — << << 1 — — — << 3 — <<
2010 << — << — << << 1 — — — << 2 — —2011 — — — — << << 1 — — — << 2 — <<
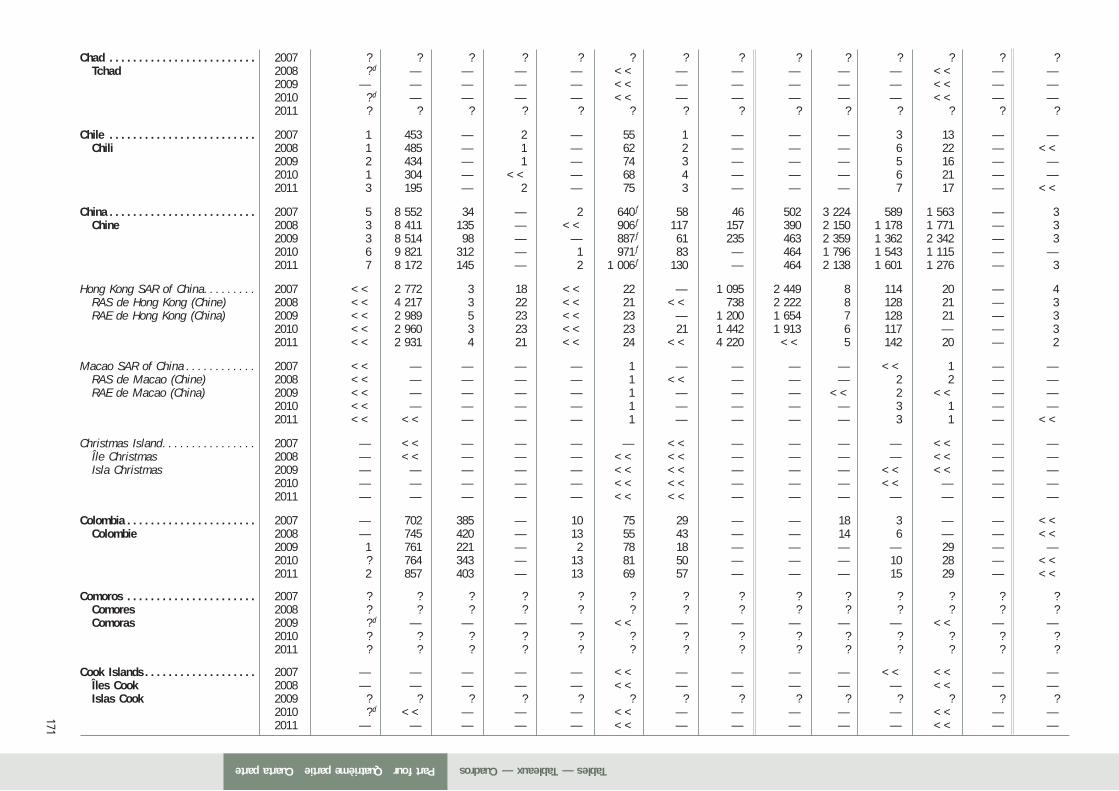
171
Chad . . . . . . . . . . . . . . . . . . . . . . . . . 2007 ? ? ? ? ? ? ? ? ? ? ? ? ? ?Tchad 2008 ? d — — — — << — — — — — << — —
2009 — — — — — << — — — — — << — —2010 ? d — — — — << — — — — — << — —2011 ? ? ? ? ? ? ? ? ? ? ? ? ? ?
Chile . . . . . . . . . . . . . . . . . . . . . . . . . 2007 1 453 — 2 — 55 1 — — — 3 13 — —Chili 2008 1 485 — 1 — 62 2 — — — 6 22 — <<
2009 2 434 — 1 — 74 3 — — — 5 16 — —2010 1 304 — << — 68 4 — — — 6 21 — —2011 3 195 — 2 — 75 3 — — — 7 17 — <<
China . . . . . . . . . . . . . . . . . . . . . . . . . 2007 5 8 552 34 — 2 640 f 58 46 502 3 224 589 1 563 — 3Chine 2008 3 8 411 135 — << 906 f 117 157 390 2 150 1 178 1 771 — 3
2009 3 8 514 98 — — 887 f 61 235 463 2 359 1 362 2 342 — 32010 6 9 821 312 — 1 971 f 83 — 464 1 796 1 543 1 115 — —2011 7 8 172 145 — 2 1 006 f 130 — 464 2 138 1 601 1 276 — 3
Hong Kong SAR of China. . . . . . . . . 2007 << 2 772 3 18 << 22 — 1 095 2 449 8 114 20 — 4RAS de Hong Kong (Chine) 2008 << 4 217 3 22 << 21 << 738 2 222 8 128 21 — 3RAE de Hong Kong (China) 2009 << 2 989 5 23 << 23 — 1 200 1 654 7 128 21 — 3
2010 << 2 960 3 23 << 23 21 1 442 1 913 6 117 — — 32011 << 2 931 4 21 << 24 << 4 220 << 5 142 20 — 2
Macao SAR of China . . . . . . . . . . . . 2007 << — — — — 1 — — — — << 1 — —RAS de Macao (Chine) 2008 << — — — — 1 << — — — 2 2 — —RAE de Macao (China) 2009 << — — — — 1 — — — << 2 << — —
2010 << — — — — 1 — — — — 3 1 — —2011 << << — — — 1 — — — — 3 1 — <<
Christmas Island . . . . . . . . . . . . . . . . 2007 — << — — — — << — — — — << — —Île Christmas 2008 — << — — — << << — — — — << — —Isla Christmas 2009 — — — — — << << — — — << << — —
2010 — — — — — << << — — — << — — —2011 — — — — — << << — — — — — — —
Colombia . . . . . . . . . . . . . . . . . . . . . . 2007 — 702 385 — 10 75 29 — — 18 3 — — <<Colombie 2008 — 745 420 — 13 55 43 — — 14 6 — — <<
2009 1 761 221 — 2 78 18 — — — — 29 — —2010 ? 764 343 — 13 81 50 — — — 10 28 — <<2011 2 857 403 — 13 69 57 — — — 15 29 — <<
Comoros . . . . . . . . . . . . . . . . . . . . . . 2007 ? ? ? ? ? ? ? ? ? ? ? ? ? ?Comores 2008 ? ? ? ? ? ? ? ? ? ? ? ? ? ?Comoras 2009 ? d — — — — << — — — — — << — —
2010 ? ? ? ? ? ? ? ? ? ? ? ? ? ?2011 ? ? ? ? ? ? ? ? ? ? ? ? ? ?
Cook Islands . . . . . . . . . . . . . . . . . . . 2007 — — — — — << — — — — << << — —Îles Cook 2008 — — — — — << — — — — — << — —Islas Cook 2009 ? ? ? ? ? ? ? ? ? ? ? ? ? ?
2010 ? d << — — — << — — — — — << — —2011 — — — — — << — — — — — << — —
Part fourQuatrième partieCuarta parte Tables — Tableaux — Cuadros
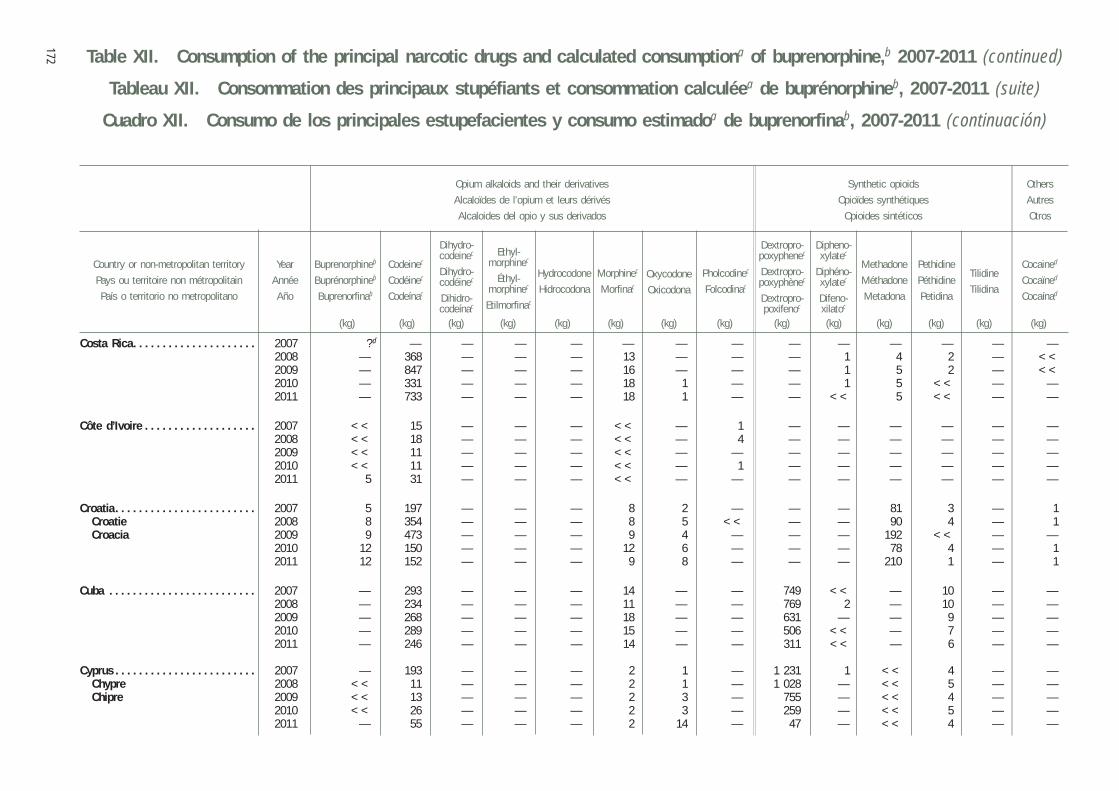
Table XII. Consumption of the principal narcotic drugs and calculated consumptiona of buprenorphine,b 2007-2011 (continued)
Tableau XII. Consommation des principaux stupéfiants et consommation calculéea de buprénorphineb, 2007-2011 (suite)
Cuadro XII. Consumo de los principales estupefacientes y consumo estimadoa de buprenorfinab, 2007-2011 (continuación)
172
Year
Année
Año
Country or non-metropolitan territory
Pays ou territoire non métropolitain
País o territorio no metropolitano
Cocained
Cocaïned
Cocaínad
Codeinec
Codéinec
Codeínac
Buprenorphineb
Buprénorphineb
Buprenorfinab
Dextropro-poxyphenec
Dextropro-poxyphènec
Dextropro-poxifenoc
Dipheno-xylatec
Diphéno-xylatec
Difeno-xilatoc
Dihydro-codeinec
Dihydro-codéinec
Dihidro-codeínac
Ethyl-morphinec
Éthyl-morphinec
Etilmorfinac
Methadone
Méthadone
Metadona
Morphinec
Morfinac
Pethidine
Péthidine
Petidina
Pholcodinec
Folcodinac
(kg) (kg) (kg) (kg) (kg) (kg) (kg) (kg) (kg) (kg) (kg) (kg) (kg) (kg)
Oxycodone
Oxicodona
Hydrocodone
Hidrocodona
Tilidine
Tilidina
Opium alkaloids and their derivatives
Alcaloïdes de l’opium et leurs dérivés
Alcaloides del opio y sus derivados
Synthetic opioids
Opioïdes synthétiques
Opioides sintéticos
Others
Autres
Otros
Costa Rica . . . . . . . . . . . . . . . . . . . . . 2007 ? d — — — — — — — — — — — — —2008 — 368 — — — 13 — — — 1 4 2 — <<2009 — 847 — — — 16 — — — 1 5 2 — <<2010 — 331 — — — 18 1 — — 1 5 << — —2011 — 733 — — — 18 1 — — << 5 << — —
Côte d’Ivoire . . . . . . . . . . . . . . . . . . . 2007 << 15 — — — << — 1 — — — — — —2008 << 18 — — — << — 4 — — — — — —2009 << 11 — — — << — — — — — — — —2010 << 11 — — — << — 1 — — — — — —2011 5 31 — — — << — — — — — — — —
Croatia . . . . . . . . . . . . . . . . . . . . . . . . 2007 5 197 — — — 8 2 — — — 81 3 — 1Croatie 2008 8 354 — — — 8 5 << — — 90 4 — 1Croacia 2009 9 473 — — — 9 4 — — — 192 << — —
2010 12 150 — — — 12 6 — — — 78 4 — 12011 12 152 — — — 9 8 — — — 210 1 — 1
Cuba . . . . . . . . . . . . . . . . . . . . . . . . . 2007 — 293 — — — 14 — — 749 << — 10 — —2008 — 234 — — — 11 — — 769 2 — 10 — —2009 — 268 — — — 18 — — 631 — — 9 — —2010 — 289 — — — 15 — — 506 << — 7 — —2011 — 246 — — — 14 — — 311 << — 6 — —
Cyprus . . . . . . . . . . . . . . . . . . . . . . . . 2007 — 193 — — — 2 1 — 1 231 1 << 4 — —Chypre 2008 << 11 — — — 2 1 — 1 028 — << 5 — —Chipre 2009 << 13 — — — 2 3 — 755 — << 4 — —
2010 << 26 — — — 2 3 — 259 — << 5 — —2011 — 55 — — — 2 14 — 47 — << 4 — —
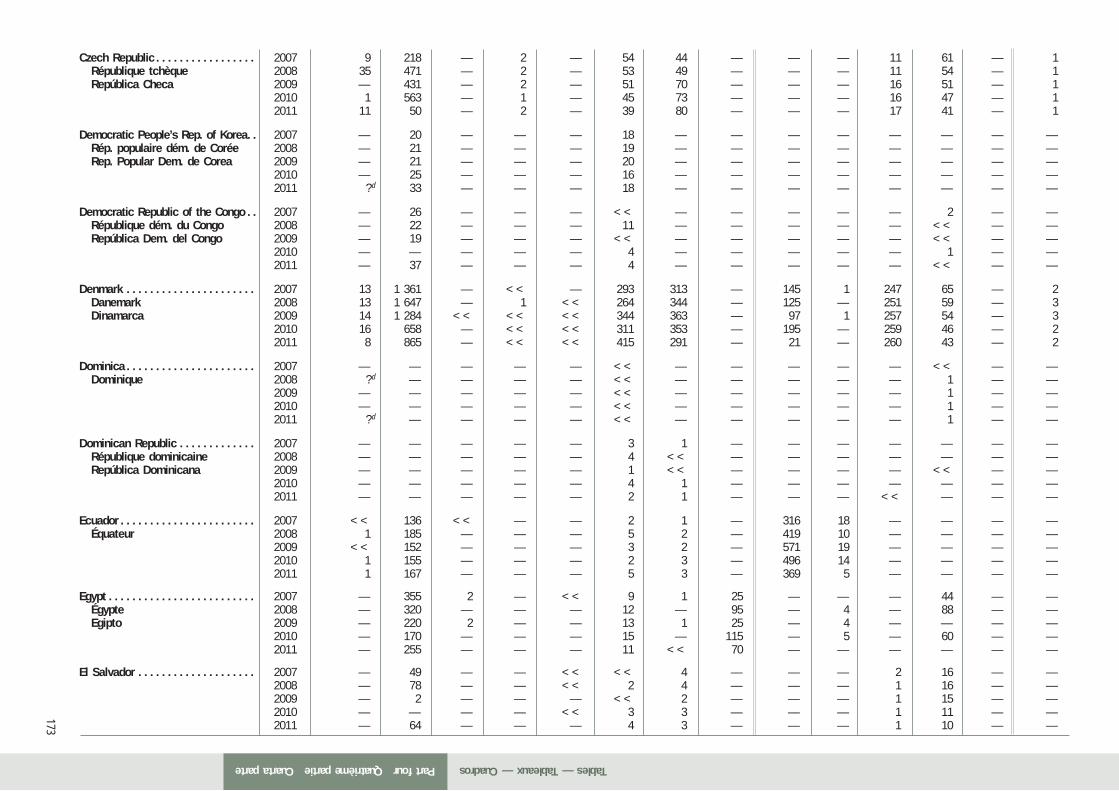
173
Czech Republic . . . . . . . . . . . . . . . . . 2007 9 218 — 2 — 54 44 — — — 11 61 — 1République tchèque 2008 35 471 — 2 — 53 49 — — — 11 54 — 1República Checa 2009 — 431 — 2 — 51 70 — — — 16 51 — 1
2010 1 563 — 1 — 45 73 — — — 16 47 — 12011 11 50 — 2 — 39 80 — — — 17 41 — 1
Democratic People’s Rep. of Korea . . 2007 — 20 — — — 18 — — — — — — — —Rép. populaire dém. de Corée 2008 — 21 — — — 19 — — — — — — — —Rep. Popular Dem. de Corea 2009 — 21 — — — 20 — — — — — — — —
2010 — 25 — — — 16 — — — — — — — —2011 ? d 33 — — — 18 — — — — — — — —
Democratic Republic of the Congo . . 2007 — 26 — — — << — — — — — 2 — —République dém. du Congo 2008 — 22 — — — 11 — — — — — << — —República Dem. del Congo 2009 — 19 — — — << — — — — — << — —
2010 — — — — — 4 — — — — — 1 — —2011 — 37 — — — 4 — — — — — << — —
Denmark . . . . . . . . . . . . . . . . . . . . . . 2007 13 1 361 — << — 293 313 — 145 1 247 65 — 2Danemark 2008 13 1 647 — 1 << 264 344 — 125 — 251 59 — 3Dinamarca 2009 14 1 284 << << << 344 363 — 97 1 257 54 — 3
2010 16 658 — << << 311 353 — 195 — 259 46 — 22011 8 865 — << << 415 291 — 21 — 260 43 — 2
Dominica . . . . . . . . . . . . . . . . . . . . . . 2007 — — — — — << — — — — — << — —Dominique 2008 ? d — — — — << — — — — — 1 — —
2009 — — — — — << — — — — — 1 — —2010 — — — — — << — — — — — 1 — —2011 ? d — — — — << — — — — — 1 — —
Dominican Republic . . . . . . . . . . . . . 2007 — — — — — 3 1 — — — — — — —République dominicaine 2008 — — — — — 4 << — — — — — — —República Dominicana 2009 — — — — — 1 << — — — — << — —
2010 — — — — — 4 1 — — — — — — —2011 — — — — — 2 1 — — — << — — —
Ecuador . . . . . . . . . . . . . . . . . . . . . . . 2007 << 136 << — — 2 1 — 316 18 — — — — Équateur 2008 1 185 — — — 5 2 — 419 10 — — — —
2009 << 152 — — — 3 2 — 571 19 — — — —2010 1 155 — — — 2 3 — 496 14 — — — —2011 1 167 — — — 5 3 — 369 5 — — — —
Egypt . . . . . . . . . . . . . . . . . . . . . . . . . 2007 — 355 2 — << 9 1 25 — — — 44 — — Égypte 2008 — 320 — — — 12 — 95 — 4 — 88 — —
Egipto 2009 — 220 2 — — 13 1 25 — 4 — — — —2010 — 170 — — — 15 — 115 — 5 — 60 — —2011 — 255 — — — 11 << 70 — — — — — —
El Salvador . . . . . . . . . . . . . . . . . . . . 2007 — 49 — — << << 4 — — — 2 16 — —2008 — 78 — — << 2 4 — — — 1 16 — —2009 — 2 — — — << 2 — — — 1 15 — —2010 — — — — << 3 3 — — — 1 11 — —2011 — 64 — — — 4 3 — — — 1 10 — —
Part fourQuatrième partieCuarta parte Tables — Tableaux — Cuadros
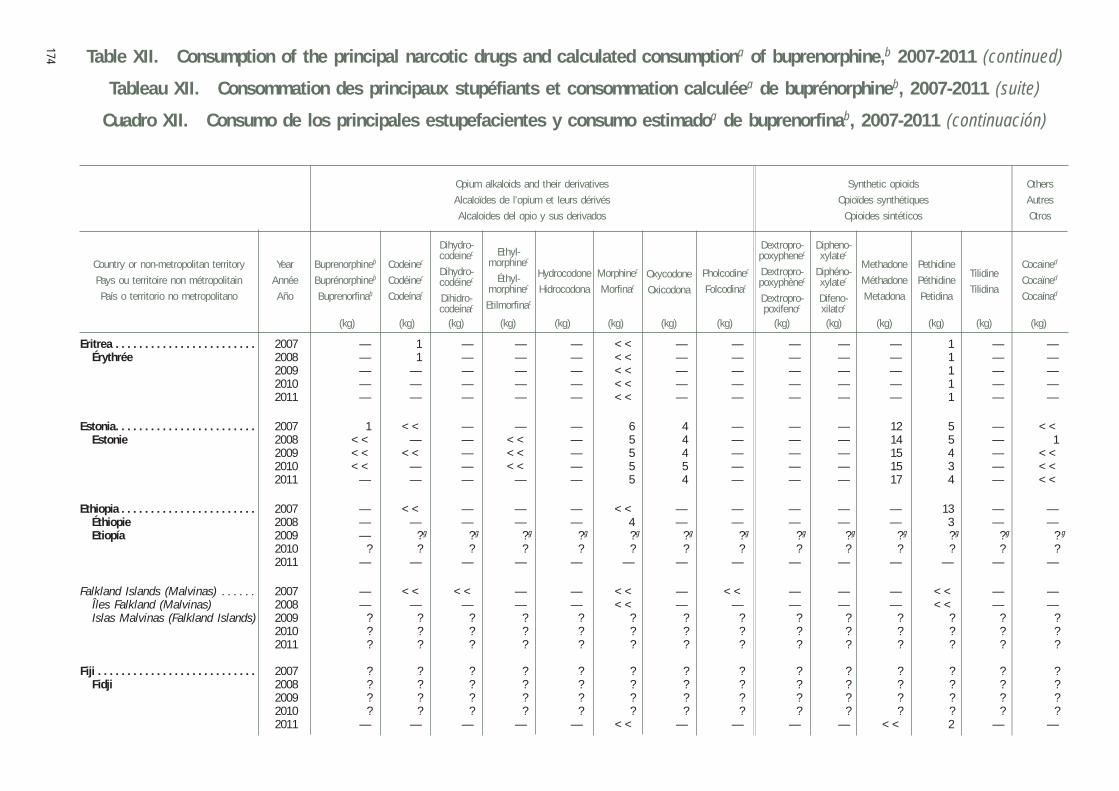
Table XII. Consumption of the principal narcotic drugs and calculated consumptiona of buprenorphine,b 2007-2011 (continued)
Tableau XII. Consommation des principaux stupéfiants et consommation calculéea de buprénorphineb, 2007-2011 (suite)
Cuadro XII. Consumo de los principales estupefacientes y consumo estimadoa de buprenorfinab, 2007-2011 (continuación)
174
Year
Année
Año
Country or non-metropolitan territory
Pays ou territoire non métropolitain
País o territorio no metropolitano
Cocained
Cocaïned
Cocaínad
Codeinec
Codéinec
Codeínac
Buprenorphineb
Buprénorphineb
Buprenorfinab
Dextropro-poxyphenec
Dextropro-poxyphènec
Dextropro-poxifenoc
Dipheno-xylatec
Diphéno-xylatec
Difeno-xilatoc
Dihydro-codeinec
Dihydro-codéinec
Dihidro-codeínac
Ethyl-morphinec
Éthyl-morphinec
Etilmorfinac
Methadone
Méthadone
Metadona
Morphinec
Morfinac
Pethidine
Péthidine
Petidina
Pholcodinec
Folcodinac
(kg) (kg) (kg) (kg) (kg) (kg) (kg) (kg) (kg) (kg) (kg) (kg) (kg) (kg)
Oxycodone
Oxicodona
Hydrocodone
Hidrocodona
Tilidine
Tilidina
Opium alkaloids and their derivatives
Alcaloïdes de l’opium et leurs dérivés
Alcaloides del opio y sus derivados
Synthetic opioids
Opioïdes synthétiques
Opioides sintéticos
Others
Autres
Otros
Eritrea . . . . . . . . . . . . . . . . . . . . . . . . 2007 — 1 — — — << — — — — — 1 — — Érythrée 2008 — 1 — — — << — — — — — 1 — —
2009 — — — — — << — — — — — 1 — —2010 — — — — — << — — — — — 1 — —2011 — — — — — << — — — — — 1 — —
Estonia . . . . . . . . . . . . . . . . . . . . . . . . 2007 1 << — — — 6 4 — — — 12 5 — <<Estonie 2008 << — — << — 5 4 — — — 14 5 — 1
2009 << << — << — 5 4 — — — 15 4 — <<2010 << — — << — 5 5 — — — 15 3 — <<2011 — — — — — 5 4 — — — 17 4 — <<
Ethiopia . . . . . . . . . . . . . . . . . . . . . . . 2007 — << — — — << — — — — — 13 — — Éthiopie 2008 — — — — — 4 — — — — — 3 — —
Etiopía 2009 — ? g ? g ? g ? g ? g ? g ? g ? g ? g ? g ? g ? g ? g
2010 ? ? ? ? ? ? ? ? ? ? ? ? ? ?2011 — — — — — — — — — — — — — —
Falkland Islands (Malvinas) . . . . . . 2007 — << << — — << — << — — — << — —Îles Falkland (Malvinas) 2008 — — — — — << — — — — — << — —Islas Malvinas (Falkland Islands) 2009 ? ? ? ? ? ? ? ? ? ? ? ? ? ?
2010 ? ? ? ? ? ? ? ? ? ? ? ? ? ?2011 ? ? ? ? ? ? ? ? ? ? ? ? ? ?
Fiji . . . . . . . . . . . . . . . . . . . . . . . . . . . 2007 ? ? ? ? ? ? ? ? ? ? ? ? ? ?Fidji 2008 ? ? ? ? ? ? ? ? ? ? ? ? ? ?
2009 ? ? ? ? ? ? ? ? ? ? ? ? ? ?2010 ? ? ? ? ? ? ? ? ? ? ? ? ? ?2011 — — — — — << — — — — << 2 — —
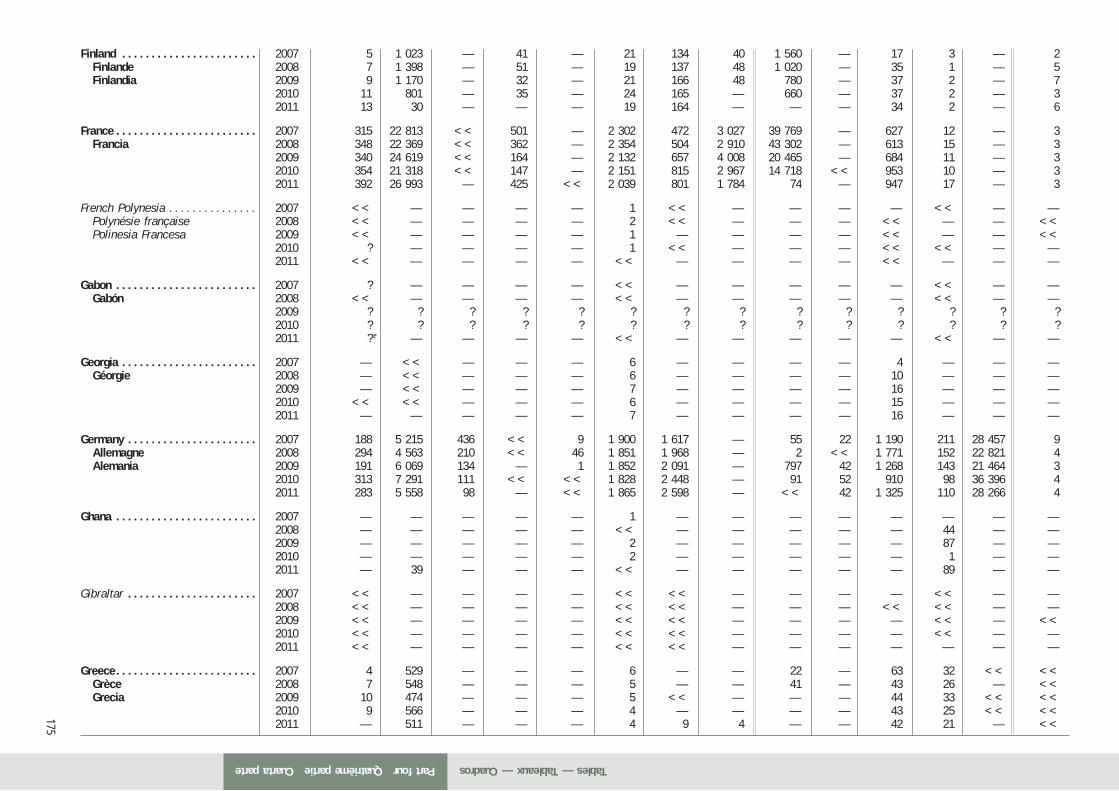
175
Finland . . . . . . . . . . . . . . . . . . . . . . . 2007 5 1 023 — 41 — 21 134 40 1 560 — 17 3 — 2Finlande 2008 7 1 398 — 51 — 19 137 48 1 020 — 35 1 — 5Finlandia 2009 9 1 170 — 32 — 21 166 48 780 — 37 2 — 7
2010 11 801 — 35 — 24 165 — 660 — 37 2 — 32011 13 30 — — — 19 164 — — — 34 2 — 6
France . . . . . . . . . . . . . . . . . . . . . . . . 2007 315 22 813 << 501 — 2 302 472 3 027 39 769 — 627 12 — 3Francia 2008 348 22 369 << 362 — 2 354 504 2 910 43 302 — 613 15 — 3
2009 340 24 619 << 164 — 2 132 657 4 008 20 465 — 684 11 — 32010 354 21 318 << 147 — 2 151 815 2 967 14 718 << 953 10 — 32011 392 26 993 — 425 << 2 039 801 1 784 74 — 947 17 — 3
French Polynesia . . . . . . . . . . . . . . . 2007 << — — — — 1 << — — — — << — —Polynésie française 2008 << — — — — 2 << — — — << — — <<Polinesia Francesa 2009 << — — — — 1 — — — — << — — <<
2010 ? — — — — 1 << — — — << << — —2011 << — — — — << — — — — << — — —
Gabon . . . . . . . . . . . . . . . . . . . . . . . . 2007 ? — — — — << — — — — — << — —Gabón 2008 << — — — — << — — — — — << — —
2009 ? ? ? ? ? ? ? ? ? ? ? ? ? ?2010 ? ? ? ? ? ? ? ? ? ? ? ? ? ?2011 ? e — — — — << — — — — — << — —
Georgia . . . . . . . . . . . . . . . . . . . . . . . 2007 — << — — — 6 — — — — 4 — — —Géorgie 2008 — << — — — 6 — — — — 10 — — —
2009 — << — — — 7 — — — — 16 — — —2010 << << — — — 6 — — — — 15 — — —2011 — — — — — 7 — — — — 16 — — —
Germany . . . . . . . . . . . . . . . . . . . . . . 2007 188 5 215 436 << 9 1 900 1 617 — 55 22 1 190 211 28 457 9Allemagne 2008 294 4 563 210 << 46 1 851 1 968 — 2 << 1 771 152 22 821 4Alemania 2009 191 6 069 134 — 1 1 852 2 091 — 797 42 1 268 143 21 464 3
2010 313 7 291 111 << << 1 828 2 448 — 91 52 910 98 36 396 42011 283 5 558 98 — << 1 865 2 598 — << 42 1 325 110 28 266 4
Ghana . . . . . . . . . . . . . . . . . . . . . . . . 2007 — — — — — 1 — — — — — — — —2008 — — — — — << — — — — — 44 — —2009 — — — — — 2 — — — — — 87 — —2010 — — — — — 2 — — — — — 1 — —2011 — 39 — — — << — — — — — 89 — —
Gibraltar . . . . . . . . . . . . . . . . . . . . . . 2007 << — — — — << << — — — — << — —2008 << — — — — << << — — — << << — —2009 << — — — — << << — — — — << — <<2010 << — — — — << << — — — — << — —2011 << — — — — << << — — — — — — —
Greece . . . . . . . . . . . . . . . . . . . . . . . . 2007 4 529 — — — 6 — — 22 — 63 32 << <<Grèce 2008 7 548 — — — 5 — — 41 — 43 26 — <<Grecia 2009 10 474 — — — 5 << — — — 44 33 << <<
2010 9 566 — — — 4 — — — — 43 25 << <<2011 — 511 — — — 4 9 4 — — 42 21 — <<
Part fourQuatrième partieCuarta parte Tables — Tableaux — Cuadros
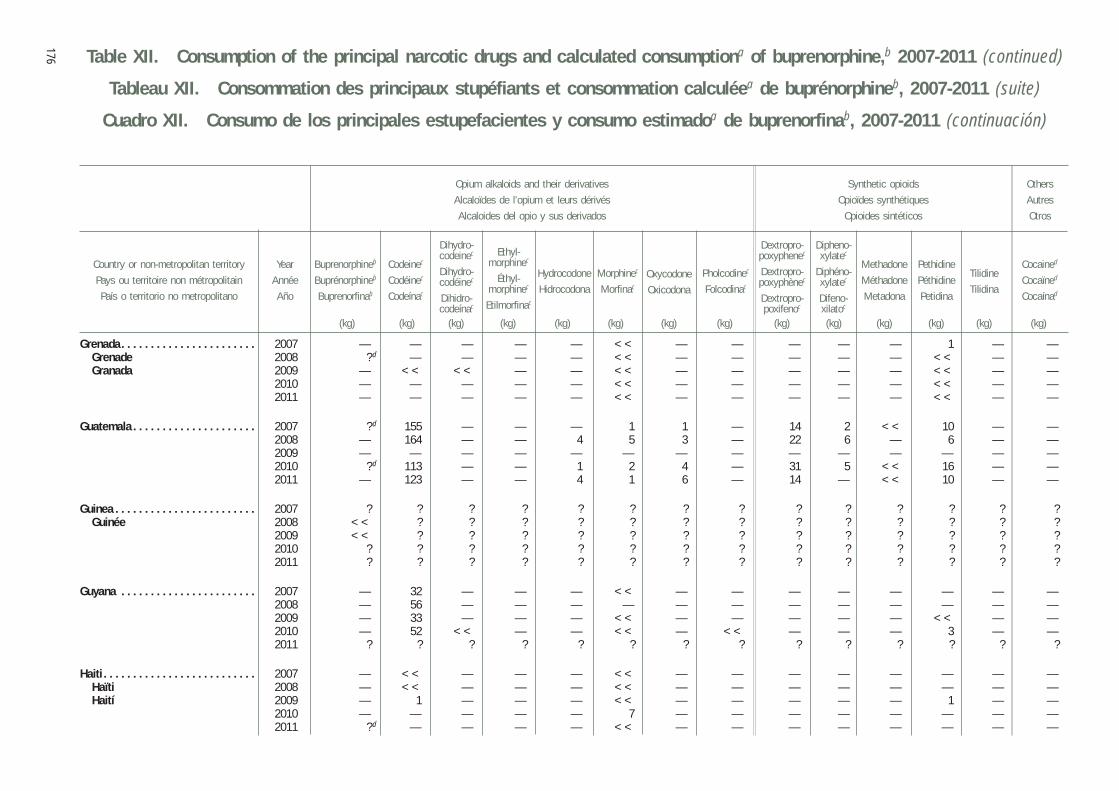
Table XII. Consumption of the principal narcotic drugs and calculated consumptiona of buprenorphine,b 2007-2011 (continued)
Tableau XII. Consommation des principaux stupéfiants et consommation calculéea de buprénorphineb, 2007-2011 (suite)
Cuadro XII. Consumo de los principales estupefacientes y consumo estimadoa de buprenorfinab, 2007-2011 (continuación)
176
Year
Année
Año
Country or non-metropolitan territory
Pays ou territoire non métropolitain
País o territorio no metropolitano
Cocained
Cocaïned
Cocaínad
Codeinec
Codéinec
Codeínac
Buprenorphineb
Buprénorphineb
Buprenorfinab
Dextropro-poxyphenec
Dextropro-poxyphènec
Dextropro-poxifenoc
Dipheno-xylatec
Diphéno-xylatec
Difeno-xilatoc
Dihydro-codeinec
Dihydro-codéinec
Dihidro-codeínac
Ethyl-morphinec
Éthyl-morphinec
Etilmorfinac
Methadone
Méthadone
Metadona
Morphinec
Morfinac
Pethidine
Péthidine
Petidina
Pholcodinec
Folcodinac
(kg) (kg) (kg) (kg) (kg) (kg) (kg) (kg) (kg) (kg) (kg) (kg) (kg) (kg)
Oxycodone
Oxicodona
Hydrocodone
Hidrocodona
Tilidine
Tilidina
Opium alkaloids and their derivatives
Alcaloïdes de l’opium et leurs dérivés
Alcaloides del opio y sus derivados
Synthetic opioids
Opioïdes synthétiques
Opioides sintéticos
Others
Autres
Otros
Grenada . . . . . . . . . . . . . . . . . . . . . . . 2007 — — — — — << — — — — — 1 — —Grenade 2008 ? d — — — — << — — — — — << — —Granada 2009 — << << — — << — — — — — << — —
2010 — — — — — << — — — — — << — —2011 — — — — — << — — — — — << — —
Guatemala . . . . . . . . . . . . . . . . . . . . . 2007 ? d 155 — — — 1 1 — 14 2 << 10 — —2008 — 164 — — 4 5 3 — 22 6 — 6 — —2009 — — — — — — — — — — — — — —2010 ? d 113 — — 1 2 4 — 31 5 << 16 — —2011 — 123 — — 4 1 6 — 14 — << 10 — —
Guinea . . . . . . . . . . . . . . . . . . . . . . . . 2007 ? ? ? ? ? ? ? ? ? ? ? ? ? ?Guinée 2008 << ? ? ? ? ? ? ? ? ? ? ? ? ?
2009 << ? ? ? ? ? ? ? ? ? ? ? ? ?2010 ? ? ? ? ? ? ? ? ? ? ? ? ? ?2011 ? ? ? ? ? ? ? ? ? ? ? ? ? ?
Guyana . . . . . . . . . . . . . . . . . . . . . . . 2007 — 32 — — — << — — — — — — — —2008 — 56 — — — — — — — — — — — —2009 — 33 — — — << — — — — — << — —2010 — 52 << — — << — << — — — 3 — —2011 ? ? ? ? ? ? ? ? ? ? ? ? ? ?
Haiti . . . . . . . . . . . . . . . . . . . . . . . . . . 2007 — << — — — << — — — — — — — — Haïti 2008 — << — — — << — — — — — — — — Haití 2009 — 1 — — — << — — — — — 1 — —
2010 — — — — — 7 — — — — — — — —2011 ? d — — — — << — — — — — — — —
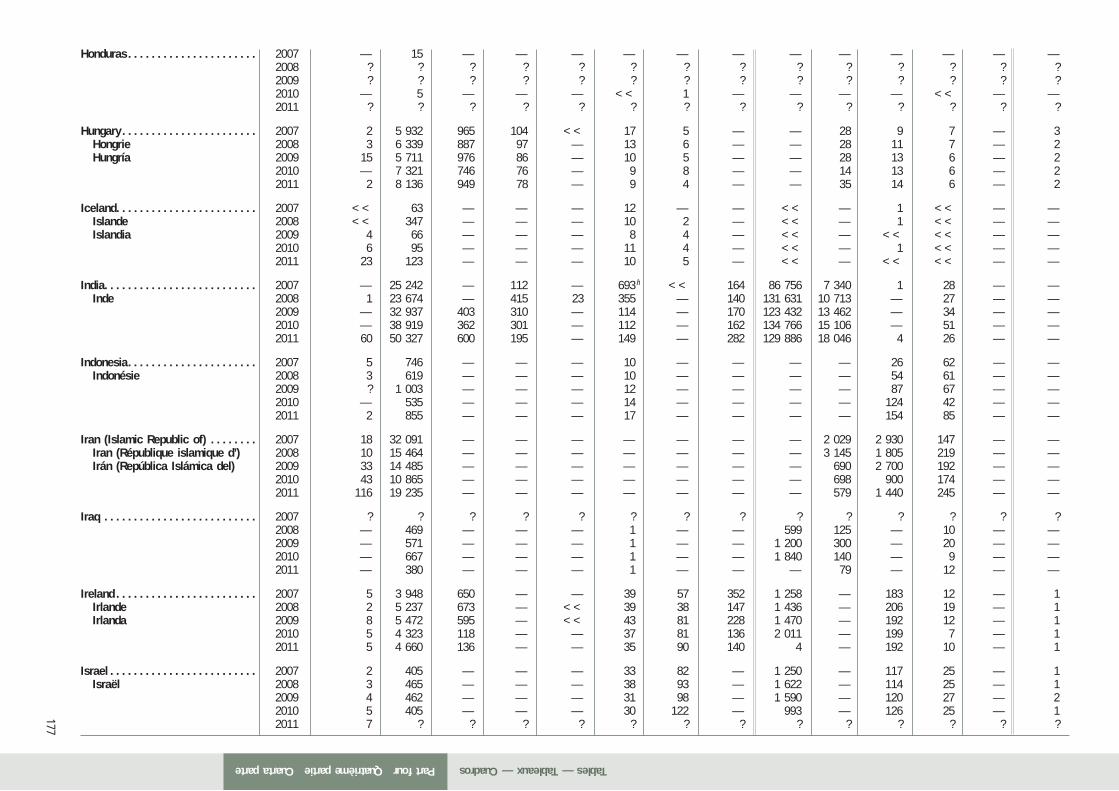
177
Honduras . . . . . . . . . . . . . . . . . . . . . . 2007 — 15 — — — — — — — — — — — —2008 ? ? ? ? ? ? ? ? ? ? ? ? ? ?2009 ? ? ? ? ? ? ? ? ? ? ? ? ? ?2010 — 5 — — — << 1 — — — — << — —2011 ? ? ? ? ? ? ? ? ? ? ? ? ? ?
Hungary . . . . . . . . . . . . . . . . . . . . . . . 2007 2 5 932 965 104 << 17 5 — — 28 9 7 — 3 Hongrie 2008 3 6 339 887 97 — 13 6 — — 28 11 7 — 2 Hungría 2009 15 5 711 976 86 — 10 5 — — 28 13 6 — 2
2010 — 7 321 746 76 — 9 8 — — 14 13 6 — 22011 2 8 136 949 78 — 9 4 — — 35 14 6 — 2
Iceland . . . . . . . . . . . . . . . . . . . . . . . . 2007 << 63 — — — 12 — — << — 1 << — —Islande 2008 << 347 — — — 10 2 — << — 1 << — —Islandia 2009 4 66 — — — 8 4 — << — << << — —
2010 6 95 — — — 11 4 — << — 1 << — —2011 23 123 — — — 10 5 — << — << << — —
India. . . . . . . . . . . . . . . . . . . . . . . . . . 2007 — 25 242 — 112 — 693 h << 164 86 756 7 340 1 28 — —Inde 2008 1 23 674 — 415 23 355 — 140 131 631 10 713 — 27 — —
2009 — 32 937 403 310 — 114 — 170 123 432 13 462 — 34 — —2010 — 38 919 362 301 — 112 — 162 134 766 15 106 — 51 — —2011 60 50 327 600 195 — 149 — 282 129 886 18 046 4 26 — —
Indonesia . . . . . . . . . . . . . . . . . . . . . . 2007 5 746 — — — 10 — — — — 26 62 — —Indonésie 2008 3 619 — — — 10 — — — — 54 61 — —
2009 ? 1 003 — — — 12 — — — — 87 67 — —2010 — 535 — — — 14 — — — — 124 42 — —2011 2 855 — — — 17 — — — — 154 85 — —
Iran (Islamic Republic of) . . . . . . . . 2007 18 32 091 — — — — — — — 2 029 2 930 147 — —Iran (République islamique d’) 2008 10 15 464 — — — — — — — 3 145 1 805 219 — —Irán (República Islámica del) 2009 33 14 485 — — — — — — — 690 2 700 192 — —
2010 43 10 865 — — — — — — — 698 900 174 — —2011 116 19 235 — — — — — — — 579 1 440 245 — —
Iraq . . . . . . . . . . . . . . . . . . . . . . . . . . 2007 ? ? ? ? ? ? ? ? ? ? ? ? ? ?2008 — 469 — — — 1 — — 599 125 — 10 — —2009 — 571 — — — 1 — — 1 200 300 — 20 — —2010 — 667 — — — 1 — — 1 840 140 — 9 — —2011 — 380 — — — 1 — — — 79 — 12 — —
Ireland . . . . . . . . . . . . . . . . . . . . . . . . 2007 5 3 948 650 — — 39 57 352 1 258 — 183 12 — 1Irlande 2008 2 5 237 673 — << 39 38 147 1 436 — 206 19 — 1Irlanda 2009 8 5 472 595 — << 43 81 228 1 470 — 192 12 — 1
2010 5 4 323 118 — — 37 81 136 2 011 — 199 7 — 12011 5 4 660 136 — — 35 90 140 4 — 192 10 — 1
Israel . . . . . . . . . . . . . . . . . . . . . . . . . 2007 2 405 — — — 33 82 — 1 250 — 117 25 — 1Israël 2008 3 465 — — — 38 93 — 1 622 — 114 25 — 1
2009 4 462 — — — 31 98 — 1 590 — 120 27 — 22010 5 405 — — — 30 122 — 993 — 126 25 — 12011 7 ? ? ? ? ? ? ? ? ? ? ? ? ?
Part fourQuatrième partieCuarta parte Tables — Tableaux — Cuadros
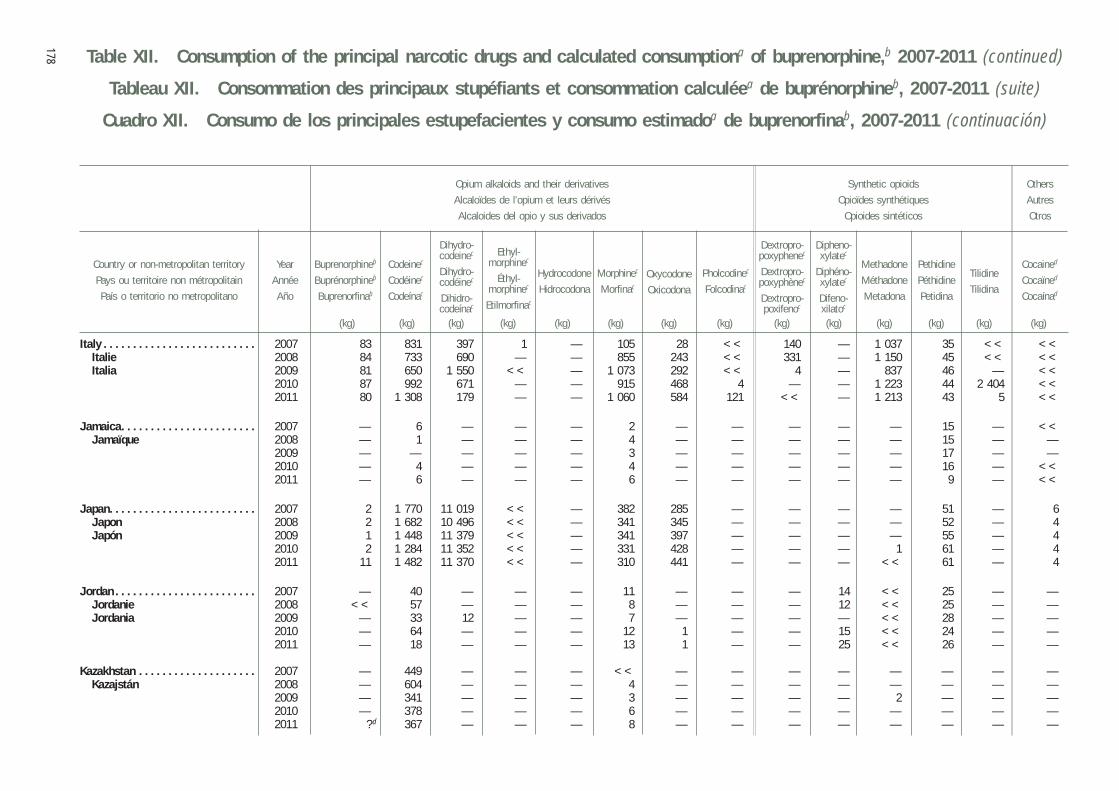
Table XII. Consumption of the principal narcotic drugs and calculated consumptiona of buprenorphine,b 2007-2011 (continued)
Tableau XII. Consommation des principaux stupéfiants et consommation calculéea de buprénorphineb, 2007-2011 (suite)
Cuadro XII. Consumo de los principales estupefacientes y consumo estimadoa de buprenorfinab, 2007-2011 (continuación)
178
Year
Année
Año
Country or non-metropolitan territory
Pays ou territoire non métropolitain
País o territorio no metropolitano
Cocained
Cocaïned
Cocaínad
Codeinec
Codéinec
Codeínac
Buprenorphineb
Buprénorphineb
Buprenorfinab
Dextropro-poxyphenec
Dextropro-poxyphènec
Dextropro-poxifenoc
Dipheno-xylatec
Diphéno-xylatec
Difeno-xilatoc
Dihydro-codeinec
Dihydro-codéinec
Dihidro-codeínac
Ethyl-morphinec
Éthyl-morphinec
Etilmorfinac
Methadone
Méthadone
Metadona
Morphinec
Morfinac
Pethidine
Péthidine
Petidina
Pholcodinec
Folcodinac
(kg) (kg) (kg) (kg) (kg) (kg) (kg) (kg) (kg) (kg) (kg) (kg) (kg) (kg)
Oxycodone
Oxicodona
Hydrocodone
Hidrocodona
Tilidine
Tilidina
Opium alkaloids and their derivatives
Alcaloïdes de l’opium et leurs dérivés
Alcaloides del opio y sus derivados
Synthetic opioids
Opioïdes synthétiques
Opioides sintéticos
Others
Autres
Otros
Italy . . . . . . . . . . . . . . . . . . . . . . . . . . 2007 83 831 397 1 — 105 28 << 140 — 1 037 35 << <<Italie 2008 84 733 690 — — 855 243 << 331 — 1 150 45 << <<Italia 2009 81 650 1 550 << — 1 073 292 << 4 — 837 46 — <<
2010 87 992 671 — — 915 468 4 — — 1 223 44 2 404 <<2011 80 1 308 179 — — 1 060 584 121 << — 1 213 43 5 <<
Jamaica . . . . . . . . . . . . . . . . . . . . . . . 2007 — 6 — — — 2 — — — — — 15 — <<Jamaïque 2008 — 1 — — — 4 — — — — — 15 — —
2009 — — — — — 3 — — — — — 17 — —2010 — 4 — — — 4 — — — — — 16 — <<2011 — 6 — — — 6 — — — — — 9 — <<
Japan . . . . . . . . . . . . . . . . . . . . . . . . . 2007 2 1 770 11 019 << — 382 285 — — — — 51 — 6Japon 2008 2 1 682 10 496 << — 341 345 — — — — 52 — 4Japón 2009 1 1 448 11 379 << — 341 397 — — — — 55 — 4
2010 2 1 284 11 352 << — 331 428 — — — 1 61 — 42011 11 1 482 11 370 << — 310 441 — — — << 61 — 4
Jordan . . . . . . . . . . . . . . . . . . . . . . . . 2007 — 40 — — — 11 — — — 14 << 25 — —Jordanie 2008 << 57 — — — 8 — — — 12 << 25 — —Jordania 2009 — 33 12 — — 7 — — — — << 28 — —
2010 — 64 — — — 12 1 — — 15 << 24 — —2011 — 18 — — — 13 1 — — 25 << 26 — —
Kazakhstan . . . . . . . . . . . . . . . . . . . . 2007 — 449 — — — << — — — — — — — —Kazajstán 2008 — 604 — — — 4 — — — — — — — —
2009 — 341 — — — 3 — — — — 2 — — —2010 — 378 — — — 6 — — — — — — — —2011 ? d 367 — — — 8 — — — — — — — —
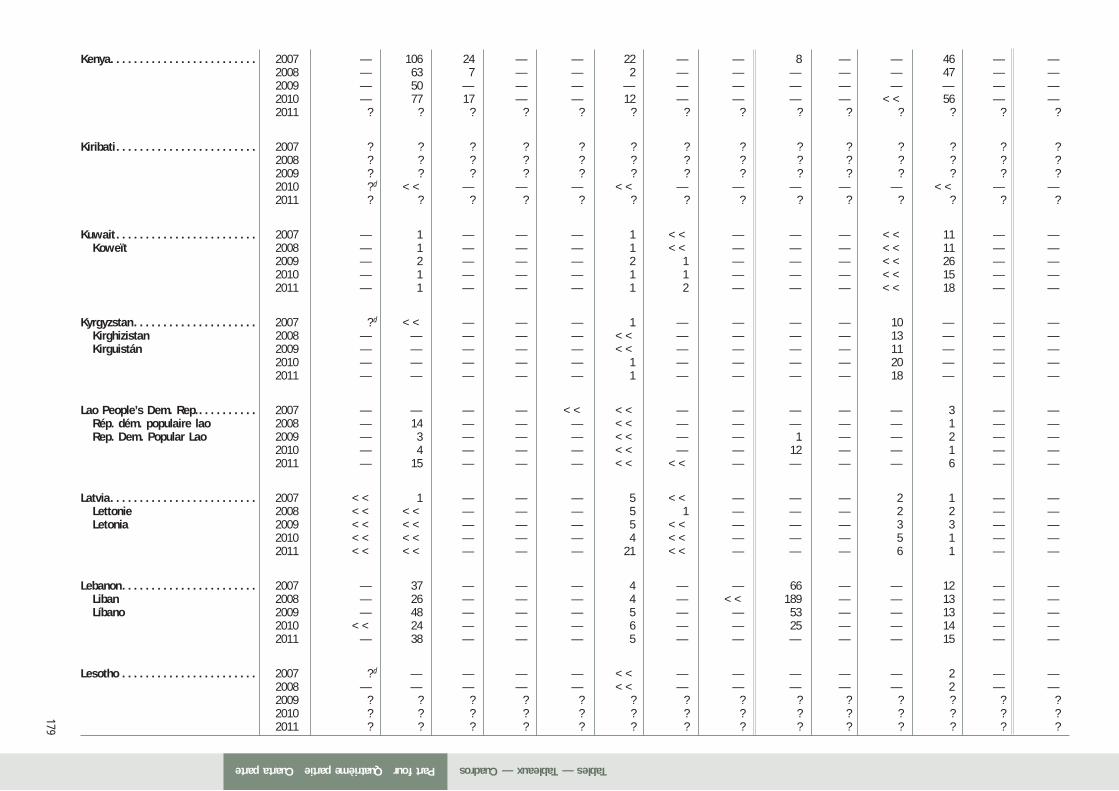
179
Kenya . . . . . . . . . . . . . . . . . . . . . . . . . 2007 — 106 24 — — 22 — — 8 — — 46 — —2008 — 63 7 — — 2 — — — — — 47 — —2009 — 50 — — — — — — — — — — — —2010 — 77 17 — — 12 — — — — << 56 — —2011 ? ? ? ? ? ? ? ? ? ? ? ? ? ?
Kiribati . . . . . . . . . . . . . . . . . . . . . . . . 2007 ? ? ? ? ? ? ? ? ? ? ? ? ? ?2008 ? ? ? ? ? ? ? ? ? ? ? ? ? ?2009 ? ? ? ? ? ? ? ? ? ? ? ? ? ?2010 ? d << — — — << — — — — — << — —2011 ? ? ? ? ? ? ? ? ? ? ? ? ? ?
Kuwait . . . . . . . . . . . . . . . . . . . . . . . . 2007 — 1 — — — 1 << — — — << 11 — —Koweït 2008 — 1 — — — 1 << — — — << 11 — —
2009 — 2 — — — 2 1 — — — << 26 — —2010 — 1 — — — 1 1 — — — << 15 — —2011 — 1 — — — 1 2 — — — << 18 — —
Kyrgyzstan . . . . . . . . . . . . . . . . . . . . . 2007 ? d << — — — 1 — — — — 10 — — —Kirghizistan 2008 — — — — — << — — — — 13 — — —Kirguistán 2009 — — — — — << — — — — 11 — — —
2010 — — — — — 1 — — — — 20 — — —2011 — — — — — 1 — — — — 18 — — —
Lao People’s Dem. Rep. . . . . . . . . . . 2007 — — — — << << — — — — — 3 — —Rép. dém. populaire lao 2008 — 14 — — — << — — — — — 1 — —Rep. Dem. Popular Lao 2009 — 3 — — — << — — 1 — — 2 — —
2010 — 4 — — — << — — 12 — — 1 — —2011 — 15 — — — << << — — — — 6 — —
Latvia . . . . . . . . . . . . . . . . . . . . . . . . . 2007 << 1 — — — 5 << — — — 2 1 — —Lettonie 2008 << << — — — 5 1 — — — 2 2 — —Letonia 2009 << << — — — 5 << — — — 3 3 — —
2010 << << — — — 4 << — — — 5 1 — —2011 << << — — — 21 << — — — 6 1 — —
Lebanon . . . . . . . . . . . . . . . . . . . . . . . 2007 — 37 — — — 4 — — 66 — — 12 — —Liban 2008 — 26 — — — 4 — << 189 — — 13 — —Líbano 2009 — 48 — — — 5 — — 53 — — 13 — —
2010 << 24 — — — 6 — — 25 — — 14 — —2011 — 38 — — — 5 — — — — — 15 — —
Lesotho . . . . . . . . . . . . . . . . . . . . . . . 2007 ? d — — — — << — — — — — 2 — —2008 — — — — — << — — — — — 2 — —2009 ? ? ? ? ? ? ? ? ? ? ? ? ? ?2010 ? ? ? ? ? ? ? ? ? ? ? ? ? ?2011 ? ? ? ? ? ? ? ? ? ? ? ? ? ?
Part fourQuatrième partieCuarta parte Tables — Tableaux — Cuadros
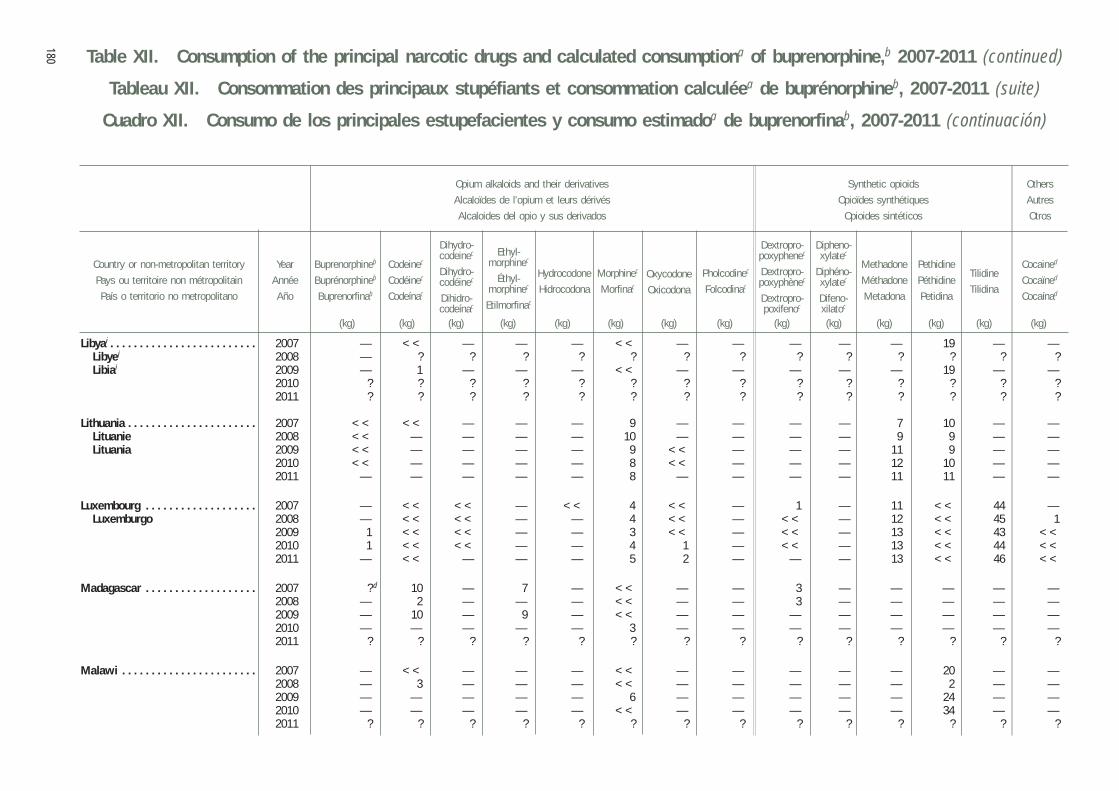
Table XII. Consumption of the principal narcotic drugs and calculated consumptiona of buprenorphine,b 2007-2011 (continued)
Tableau XII. Consommation des principaux stupéfiants et consommation calculéea de buprénorphineb, 2007-2011 (suite)
Cuadro XII. Consumo de los principales estupefacientes y consumo estimadoa de buprenorfinab, 2007-2011 (continuación)
180
Year
Année
Año
Country or non-metropolitan territory
Pays ou territoire non métropolitain
País o territorio no metropolitano
Cocained
Cocaïned
Cocaínad
Codeinec
Codéinec
Codeínac
Buprenorphineb
Buprénorphineb
Buprenorfinab
Dextropro-poxyphenec
Dextropro-poxyphènec
Dextropro-poxifenoc
Dipheno-xylatec
Diphéno-xylatec
Difeno-xilatoc
Dihydro-codeinec
Dihydro-codéinec
Dihidro-codeínac
Ethyl-morphinec
Éthyl-morphinec
Etilmorfinac
Methadone
Méthadone
Metadona
Morphinec
Morfinac
Pethidine
Péthidine
Petidina
Pholcodinec
Folcodinac
(kg) (kg) (kg) (kg) (kg) (kg) (kg) (kg) (kg) (kg) (kg) (kg) (kg) (kg)
Oxycodone
Oxicodona
Hydrocodone
Hidrocodona
Tilidine
Tilidina
Opium alkaloids and their derivatives
Alcaloïdes de l’opium et leurs dérivés
Alcaloides del opio y sus derivados
Synthetic opioids
Opioïdes synthétiques
Opioides sintéticos
Others
Autres
Otros
Libyai . . . . . . . . . . . . . . . . . . . . . . . . . 2007 — << — — — << — — — — — 19 — —Libyei 2008 — ? ? ? ? ? ? ? ? ? ? ? ? ?Libiai 2009 — 1 — — — << — — — — — 19 — —
2010 ? ? ? ? ? ? ? ? ? ? ? ? ? ?2011 ? ? ? ? ? ? ? ? ? ? ? ? ? ?
Lithuania . . . . . . . . . . . . . . . . . . . . . . 2007 << << — — — 9 — — — — 7 10 — —Lituanie 2008 << — — — — 10 — — — — 9 9 — —Lituania 2009 << — — — — 9 << — — — 11 9 — —
2010 << — — — — 8 << — — — 12 10 — —2011 — — — — — 8 — — — — 11 11 — —
Luxembourg . . . . . . . . . . . . . . . . . . . 2007 — << << — << 4 << — 1 — 11 << 44 —Luxemburgo 2008 — << << — — 4 << — << — 12 << 45 1
2009 1 << << — — 3 << — << — 13 << 43 <<2010 1 << << — — 4 1 — << — 13 << 44 <<2011 — << — — — 5 2 — — — 13 << 46 <<
Madagascar . . . . . . . . . . . . . . . . . . . 2007 ? d 10 — 7 — << — — 3 — — — — —2008 — 2 — — — << — — 3 — — — — —2009 — 10 — 9 — << — — — — — — — —2010 — — — — — 3 — — — — — — — —2011 ? ? ? ? ? ? ? ? ? ? ? ? ? ?
Malawi . . . . . . . . . . . . . . . . . . . . . . . 2007 — << — — — << — — — — — 20 — —2008 — 3 — — — << — — — — — 2 — —2009 — — — — — 6 — — — — — 24 — —2010 — — — — — << — — — — — 34 — —2011 ? ? ? ? ? ? ? ? ? ? ? ? ? ?
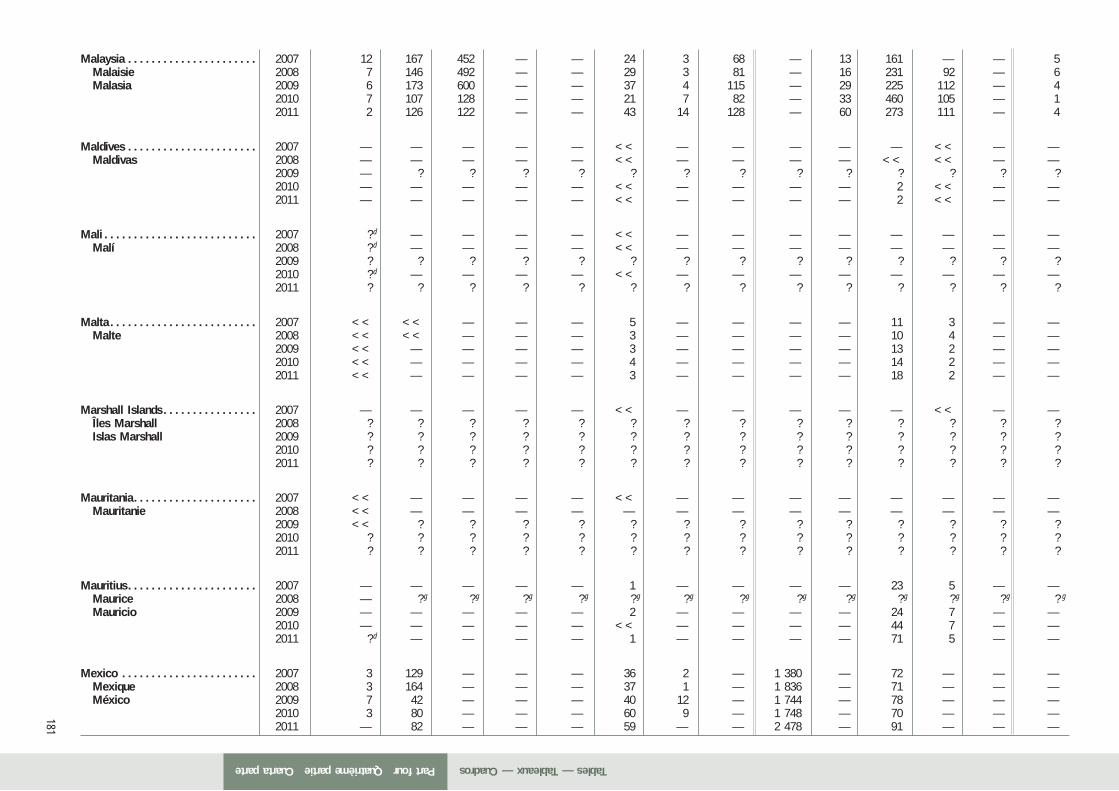
181
Malaysia . . . . . . . . . . . . . . . . . . . . . . 2007 12 167 452 — — 24 3 68 — 13 161 — — 5Malaisie 2008 7 146 492 — — 29 3 81 — 16 231 92 — 6Malasia 2009 6 173 600 — — 37 4 115 — 29 225 112 — 4
2010 7 107 128 — — 21 7 82 — 33 460 105 — 12011 2 126 122 — — 43 14 128 — 60 273 111 — 4
Maldives . . . . . . . . . . . . . . . . . . . . . . 2007 — — — — — << — — — — — << — —Maldivas 2008 — — — — — << — — — — << << — —
2009 — ? ? ? ? ? ? ? ? ? ? ? ? ?2010 — — — — — << — — — — 2 << — —2011 — — — — — << — — — — 2 << — —
Mali . . . . . . . . . . . . . . . . . . . . . . . . . . 2007 ? d — — — — << — — — — — — — —Malí 2008 ? d — — — — << — — — — — — — —
2009 ? ? ? ? ? ? ? ? ? ? ? ? ? ?2010 ? d — — — — << — — — — — — — —2011 ? ? ? ? ? ? ? ? ? ? ? ? ? ?
Malta . . . . . . . . . . . . . . . . . . . . . . . . . 2007 << << — — — 5 — — — — 11 3 — —Malte 2008 << << — — — 3 — — — — 10 4 — —
2009 << — — — — 3 — — — — 13 2 — —2010 << — — — — 4 — — — — 14 2 — —2011 << — — — — 3 — — — — 18 2 — —
Marshall Islands . . . . . . . . . . . . . . . . 2007 — — — — — << — — — — — << — —Îles Marshall 2008 ? ? ? ? ? ? ? ? ? ? ? ? ? ?Islas Marshall 2009 ? ? ? ? ? ? ? ? ? ? ? ? ? ?
2010 ? ? ? ? ? ? ? ? ? ? ? ? ? ?2011 ? ? ? ? ? ? ? ? ? ? ? ? ? ?
Mauritania . . . . . . . . . . . . . . . . . . . . . 2007 << — — — — << — — — — — — — —Mauritanie 2008 << — — — — — — — — — — — — —
2009 << ? ? ? ? ? ? ? ? ? ? ? ? ?2010 ? ? ? ? ? ? ? ? ? ? ? ? ? ?2011 ? ? ? ? ? ? ? ? ? ? ? ? ? ?
Mauritius . . . . . . . . . . . . . . . . . . . . . . 2007 — — — — — 1 — — — — 23 5 — —Maurice 2008 — ? g ? g ? g ? g ? g ? g ? g ? g ? g ? g ? g ? g ? g
Mauricio 2009 — — — — — 2 — — — — 24 7 — —2010 — — — — — << — — — — 44 7 — —2011 ? d — — — — 1 — — — — 71 5 — —
Mexico . . . . . . . . . . . . . . . . . . . . . . . 2007 3 129 — — — 36 2 — 1 380 — 72 — — —Mexique 2008 3 164 — — — 37 1 — 1 836 — 71 — — —México 2009 7 42 — — — 40 12 — 1 744 — 78 — — —
2010 3 80 — — — 60 9 — 1 748 — 70 — — —2011 — 82 — — — 59 — — 2 478 — 91 — — —
Part fourQuatrième partieCuarta parte Tables — Tableaux — Cuadros
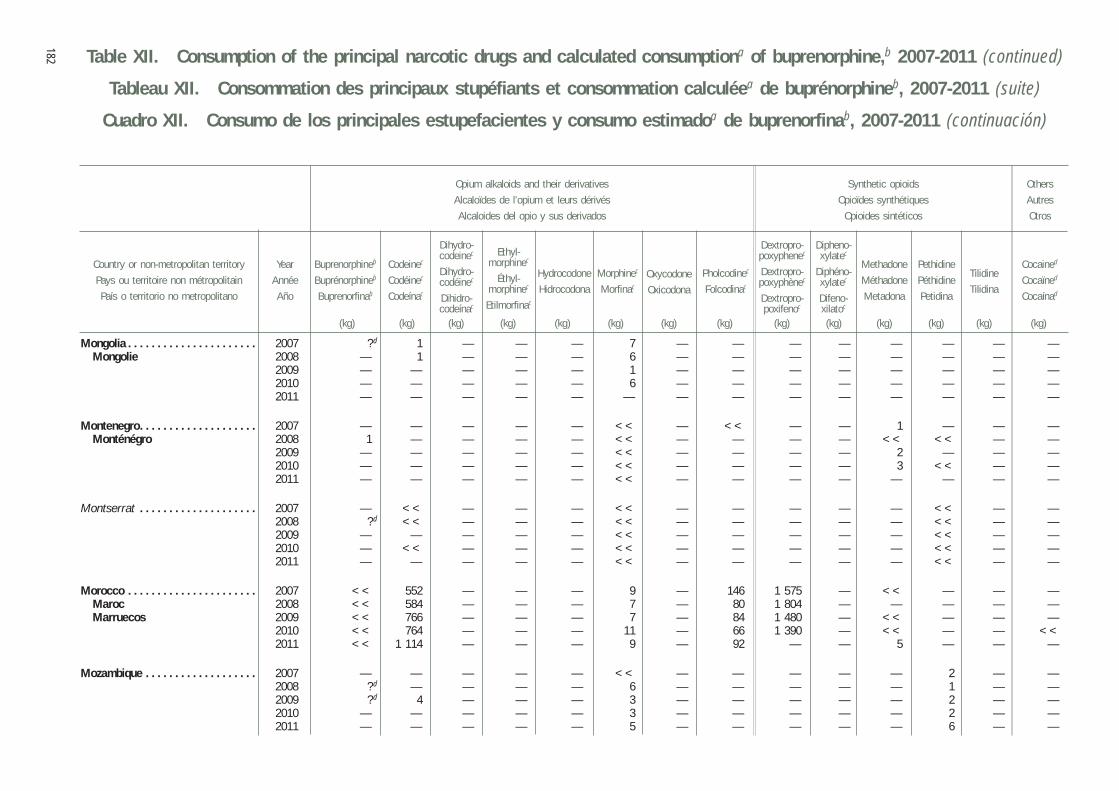
Table XII. Consumption of the principal narcotic drugs and calculated consumptiona of buprenorphine,b 2007-2011 (continued)
Tableau XII. Consommation des principaux stupéfiants et consommation calculéea de buprénorphineb, 2007-2011 (suite)
Cuadro XII. Consumo de los principales estupefacientes y consumo estimadoa de buprenorfinab, 2007-2011 (continuación)
182
Year
Année
Año
Country or non-metropolitan territory
Pays ou territoire non métropolitain
País o territorio no metropolitano
Cocained
Cocaïned
Cocaínad
Codeinec
Codéinec
Codeínac
Buprenorphineb
Buprénorphineb
Buprenorfinab
Dextropro-poxyphenec
Dextropro-poxyphènec
Dextropro-poxifenoc
Dipheno-xylatec
Diphéno-xylatec
Difeno-xilatoc
Dihydro-codeinec
Dihydro-codéinec
Dihidro-codeínac
Ethyl-morphinec
Éthyl-morphinec
Etilmorfinac
Methadone
Méthadone
Metadona
Morphinec
Morfinac
Pethidine
Péthidine
Petidina
Pholcodinec
Folcodinac
(kg) (kg) (kg) (kg) (kg) (kg) (kg) (kg) (kg) (kg) (kg) (kg) (kg) (kg)
Oxycodone
Oxicodona
Hydrocodone
Hidrocodona
Tilidine
Tilidina
Opium alkaloids and their derivatives
Alcaloïdes de l’opium et leurs dérivés
Alcaloides del opio y sus derivados
Synthetic opioids
Opioïdes synthétiques
Opioides sintéticos
Others
Autres
Otros
Mongolia . . . . . . . . . . . . . . . . . . . . . . 2007 ? d 1 — — — 7 — — — — — — — —Mongolie 2008 — 1 — — — 6 — — — — — — — —
2009 — — — — — 1 — — — — — — — —2010 — — — — — 6 — — — — — — — —2011 — — — — — — — — — — — — — —
Montenegro . . . . . . . . . . . . . . . . . . . . 2007 — — — — — << — << — — 1 — — —Monténégro 2008 1 — — — — << — — — — << << — —
2009 — — — — — << — — — — 2 — — —2010 — — — — — << — — — — 3 << — —2011 — — — — — << — — — — — — — —
Montserrat . . . . . . . . . . . . . . . . . . . . 2007 — << — — — << — — — — — << — —2008 ? d << — — — << — — — — — << — —2009 — — — — — << — — — — — << — —2010 — << — — — << — — — — — << — —2011 — — — — — << — — — — — << — —
Morocco . . . . . . . . . . . . . . . . . . . . . . 2007 << 552 — — — 9 — 146 1 575 — << — — —Maroc 2008 << 584 — — — 7 — 80 1 804 — — — — —Marruecos 2009 << 766 — — — 7 — 84 1 480 — << — — —
2010 << 764 — — — 11 — 66 1 390 — << — — <<2011 << 1 114 — — — 9 — 92 — — 5 — — —
Mozambique . . . . . . . . . . . . . . . . . . . 2007 — — — — — << — — — — — 2 — —2008 ? d — — — — 6 — — — — — 1 — —2009 ? d 4 — — — 3 — — — — — 2 — —2010 — — — — — 3 — — — — — 2 — —2011 — — — — — 5 — — — — — 6 — —
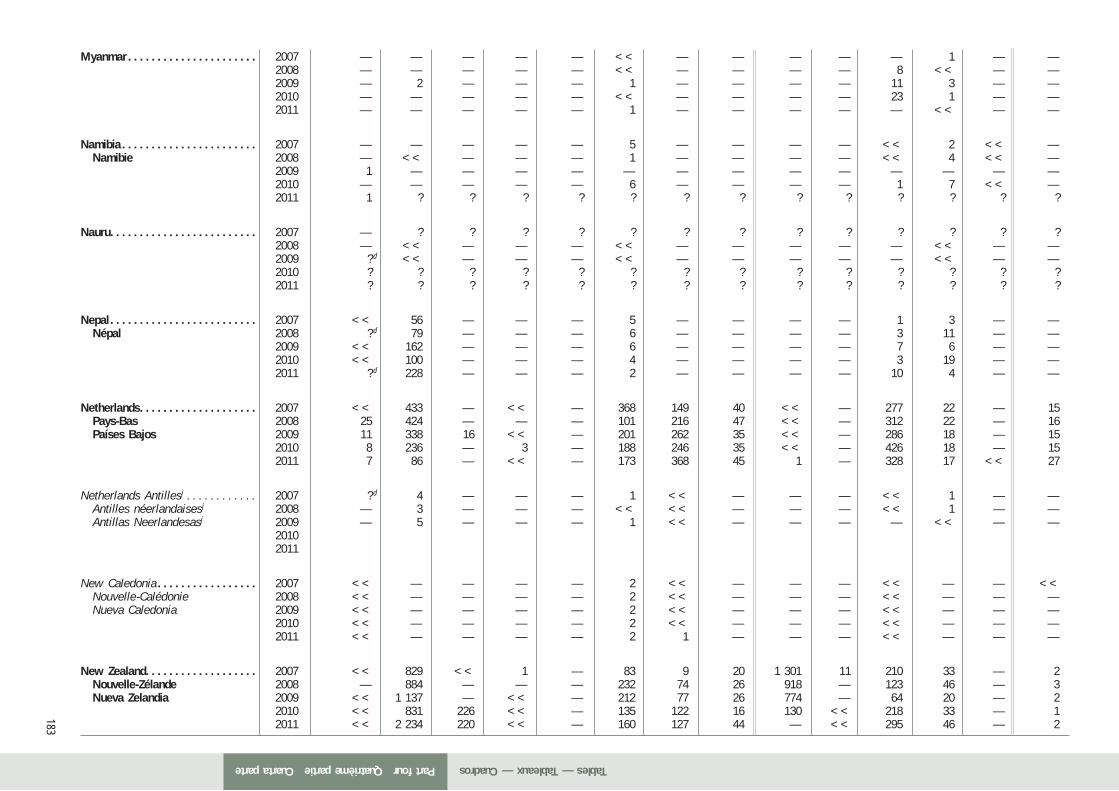
183
Myanmar . . . . . . . . . . . . . . . . . . . . . . 2007 — — — — — << — — — — — 1 — —2008 — — — — — << — — — — 8 << — —2009 — 2 — — — 1 — — — — 11 3 — —2010 — — — — — << — — — — 23 1 — —2011 — — — — — 1 — — — — — << — —
Namibia . . . . . . . . . . . . . . . . . . . . . . . 2007 — — — — — 5 — — — — << 2 << —Namibie 2008 — << — — — 1 — — — — << 4 << —
2009 1 — — — — — — — — — — — — —2010 — — — — — 6 — — — — 1 7 << —2011 1 ? ? ? ? ? ? ? ? ? ? ? ? ?
Nauru . . . . . . . . . . . . . . . . . . . . . . . . . 2007 — ? ? ? ? ? ? ? ? ? ? ? ? ?2008 — << — — — << — — — — — << — —2009 ? d << — — — << — — — — — << — —2010 ? ? ? ? ? ? ? ? ? ? ? ? ? ?2011 ? ? ? ? ? ? ? ? ? ? ? ? ? ?
Nepal . . . . . . . . . . . . . . . . . . . . . . . . . 2007 << 56 — — — 5 — — — — 1 3 — —Népal 2008 ? d 79 — — — 6 — — — — 3 11 — —
2009 << 162 — — — 6 — — — — 7 6 — —2010 << 100 — — — 4 — — — — 3 19 — —2011 ? d 228 — — — 2 — — — — 10 4 — —
Netherlands . . . . . . . . . . . . . . . . . . . . 2007 << 433 — << — 368 149 40 << — 277 22 — 15Pays-Bas 2008 25 424 — — — 101 216 47 << — 312 22 — 16Países Bajos 2009 11 338 16 << — 201 262 35 << — 286 18 — 15
2010 8 236 — 3 — 188 246 35 << — 426 18 — 152011 7 86 — << — 173 368 45 1 — 328 17 << 27
Netherlands Antillesj . . . . . . . . . . . . 2007 ? d 4 — — — 1 << — — — << 1 — —Antilles néerlandaisesj 2008 — 3 — — — << << — — — << 1 — —Antillas Neerlandesasj 2009 — 5 — — — 1 << — — — — << — —
20102011
New Caledonia . . . . . . . . . . . . . . . . . 2007 << — — — — 2 << — — — << — — <<Nouvelle-Calédonie 2008 << — — — — 2 << — — — << — — —Nueva Caledonia 2009 << — — — — 2 << — — — << — — —
2010 << — — — — 2 << — — — << — — —2011 << — — — — 2 1 — — — << — — —
New Zealand. . . . . . . . . . . . . . . . . . . 2007 << 829 << 1 — 83 9 20 1 301 11 210 33 — 2Nouvelle-Zélande 2008 — 884 — — — 232 74 26 918 — 123 46 — 3Nueva Zelandia 2009 << 1 137 — << — 212 77 26 774 — 64 20 — 2
2010 << 831 226 << — 135 122 16 130 << 218 33 — 12011 << 2 234 220 << — 160 127 44 — << 295 46 — 2
Part fourQuatrième partieCuarta parte Tables — Tableaux — Cuadros
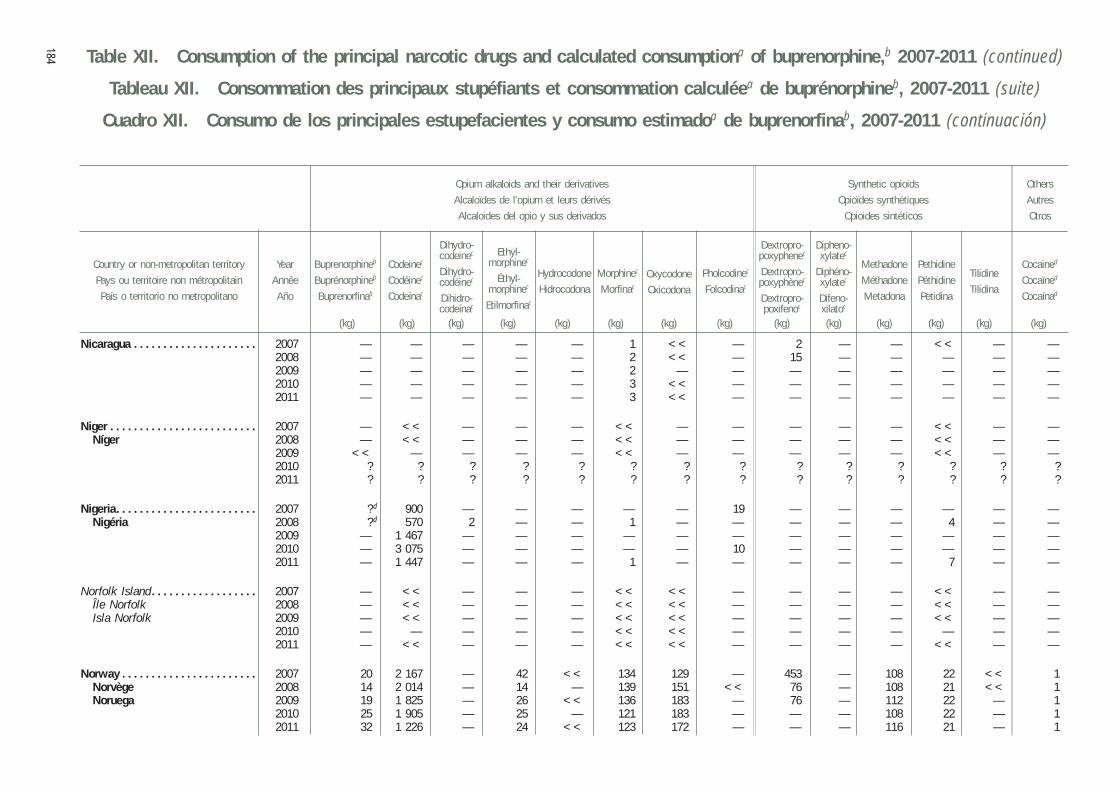
Table XII. Consumption of the principal narcotic drugs and calculated consumptiona of buprenorphine,b 2007-2011 (continued)
Tableau XII. Consommation des principaux stupéfiants et consommation calculéea de buprénorphineb, 2007-2011 (suite)
Cuadro XII. Consumo de los principales estupefacientes y consumo estimadoa de buprenorfinab, 2007-2011 (continuación)
184
Year
Année
Año
Country or non-metropolitan territory
Pays ou territoire non métropolitain
País o territorio no metropolitano
Cocained
Cocaïned
Cocaínad
Codeinec
Codéinec
Codeínac
Buprenorphineb
Buprénorphineb
Buprenorfinab
Dextropro-poxyphenec
Dextropro-poxyphènec
Dextropro-poxifenoc
Dipheno-xylatec
Diphéno-xylatec
Difeno-xilatoc
Dihydro-codeinec
Dihydro-codéinec
Dihidro-codeínac
Ethyl-morphinec
Éthyl-morphinec
Etilmorfinac
Methadone
Méthadone
Metadona
Morphinec
Morfinac
Pethidine
Péthidine
Petidina
Pholcodinec
Folcodinac
(kg) (kg) (kg) (kg) (kg) (kg) (kg) (kg) (kg) (kg) (kg) (kg) (kg) (kg)
Oxycodone
Oxicodona
Hydrocodone
Hidrocodona
Tilidine
Tilidina
Opium alkaloids and their derivatives
Alcaloïdes de l’opium et leurs dérivés
Alcaloides del opio y sus derivados
Synthetic opioids
Opioïdes synthétiques
Opioides sintéticos
Others
Autres
Otros
Nicaragua . . . . . . . . . . . . . . . . . . . . . 2007 — — — — — 1 << — 2 — — << — —2008 — — — — — 2 << — 15 — — — — —2009 — — — — — 2 — — — — — — — —2010 — — — — — 3 << — — — — — — —2011 — — — — — 3 << — — — — — — —
Niger . . . . . . . . . . . . . . . . . . . . . . . . . 2007 — << — — — << — — — — — << — —Níger 2008 — << — — — << — — — — — << — —
2009 << — — — — << — — — — — << — —2010 ? ? ? ? ? ? ? ? ? ? ? ? ? ?2011 ? ? ? ? ? ? ? ? ? ? ? ? ? ?
Nigeria . . . . . . . . . . . . . . . . . . . . . . . . 2007 ? d 900 — — — — — 19 — — — — — —Nigéria 2008 ? d 570 2 — — 1 — — — — — 4 — —
2009 — 1 467 — — — — — — — — — — — —2010 — 3 075 — — — — — 10 — — — — — —2011 — 1 447 — — — 1 — — — — — 7 — —
Norfolk Island . . . . . . . . . . . . . . . . . . 2007 — << — — — << << — — — — << — —Île Norfolk 2008 — << — — — << << — — — — << — —Isla Norfolk 2009 — << — — — << << — — — — << — —
2010 — — — — — << << — — — — — — —2011 — << — — — << << — — — — << — —
Norway . . . . . . . . . . . . . . . . . . . . . . . 2007 20 2 167 — 42 << 134 129 — 453 — 108 22 << 1Norvège 2008 14 2 014 — 14 — 139 151 << 76 — 108 21 << 1Noruega 2009 19 1 825 — 26 << 136 183 — 76 — 112 22 — 1
2010 25 1 905 — 25 — 121 183 — — — 108 22 — 12011 32 1 226 — 24 << 123 172 — — — 116 21 — 1
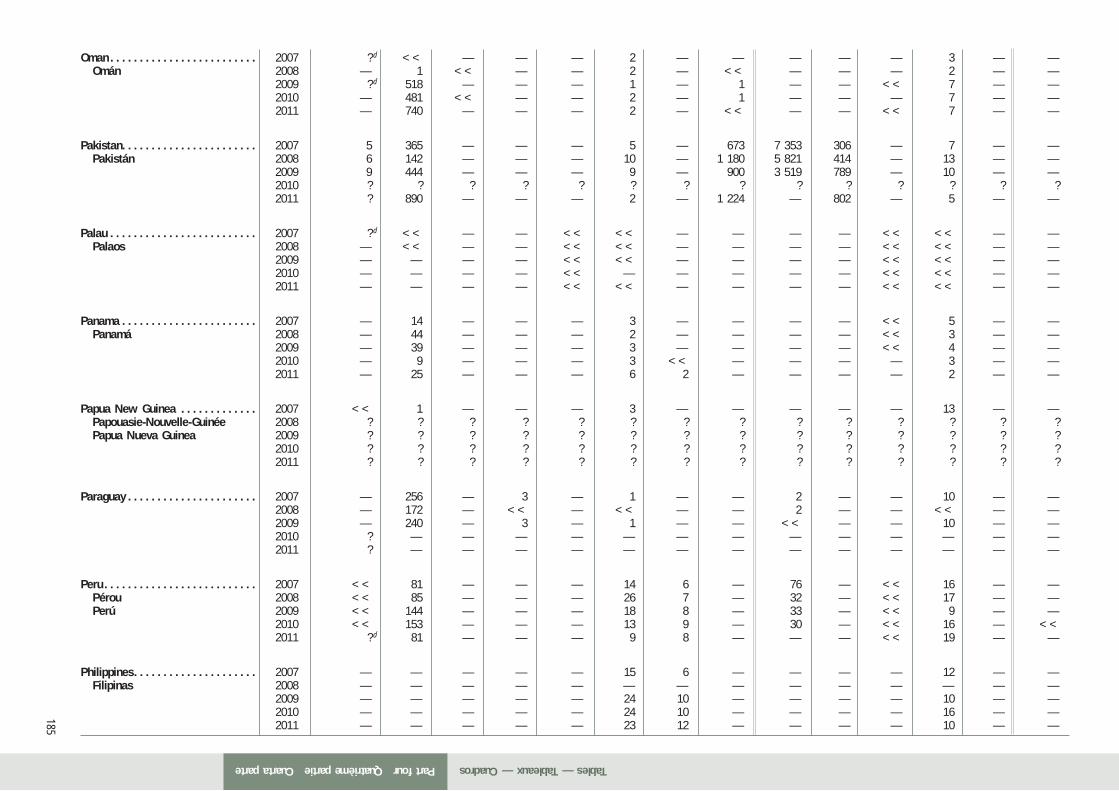
185
Oman . . . . . . . . . . . . . . . . . . . . . . . . . 2007 ? d << — — — 2 — — — — — 3 — —Omán 2008 — 1 << — — 2 — << — — — 2 — —
2009 ? d 518 — — — 1 — 1 — — << 7 — —2010 — 481 << — — 2 — 1 — — — 7 — —2011 — 740 — — — 2 — << — — << 7 — —
Pakistan. . . . . . . . . . . . . . . . . . . . . . . 2007 5 365 — — — 5 — 673 7 353 306 — 7 — —Pakistán 2008 6 142 — — — 10 — 1 180 5 821 414 — 13 — —
2009 9 444 — — — 9 — 900 3 519 789 — 10 — —2010 ? ? ? ? ? ? ? ? ? ? ? ? ? ?2011 ? 890 — — — 2 — 1 224 — 802 — 5 — —
Palau . . . . . . . . . . . . . . . . . . . . . . . . . 2007 ? d << — — << << — — — — << << — —Palaos 2008 — << — — << << — — — — << << — —
2009 — — — — << << — — — — << << — —2010 — — — — << — — — — — << << — —2011 — — — — << << — — — — << << — —
Panama . . . . . . . . . . . . . . . . . . . . . . . 2007 — 14 — — — 3 — — — — << 5 — —Panamá 2008 — 44 — — — 2 — — — — << 3 — —
2009 — 39 — — — 3 — — — — << 4 — —2010 — 9 — — — 3 << — — — — 3 — —2011 — 25 — — — 6 2 — — — — 2 — —
Papua New Guinea . . . . . . . . . . . . . 2007 << 1 — — — 3 — — — — — 13 — —Papouasie-Nouvelle-Guinée 2008 ? ? ? ? ? ? ? ? ? ? ? ? ? ?Papua Nueva Guinea 2009 ? ? ? ? ? ? ? ? ? ? ? ? ? ?
2010 ? ? ? ? ? ? ? ? ? ? ? ? ? ?2011 ? ? ? ? ? ? ? ? ? ? ? ? ? ?
Paraguay . . . . . . . . . . . . . . . . . . . . . . 2007 — 256 — 3 — 1 — — 2 — — 10 — —2008 — 172 — << — << — — 2 — — << — —2009 — 240 — 3 — 1 — — << — — 10 — —2010 ? — — — — — — — — — — — — —2011 ? — — — — — — — — — — — — —
Peru . . . . . . . . . . . . . . . . . . . . . . . . . . 2007 << 81 — — — 14 6 — 76 — << 16 — —Pérou 2008 << 85 — — — 26 7 — 32 — << 17 — —Perú 2009 << 144 — — — 18 8 — 33 — << 9 — —
2010 << 153 — — — 13 9 — 30 — << 16 — <<2011 ? d 81 — — — 9 8 — — — << 19 — —
Philippines . . . . . . . . . . . . . . . . . . . . . 2007 — — — — — 15 6 — — — — 12 — —Filipinas 2008 — — — — — — — — — — — — — —
2009 — — — — — 24 10 — — — — 10 — —2010 — — — — — 24 10 — — — — 16 — —2011 — — — — — 23 12 — — — — 10 — —
Part fourQuatrième partieCuarta parte Tables — Tableaux — Cuadros
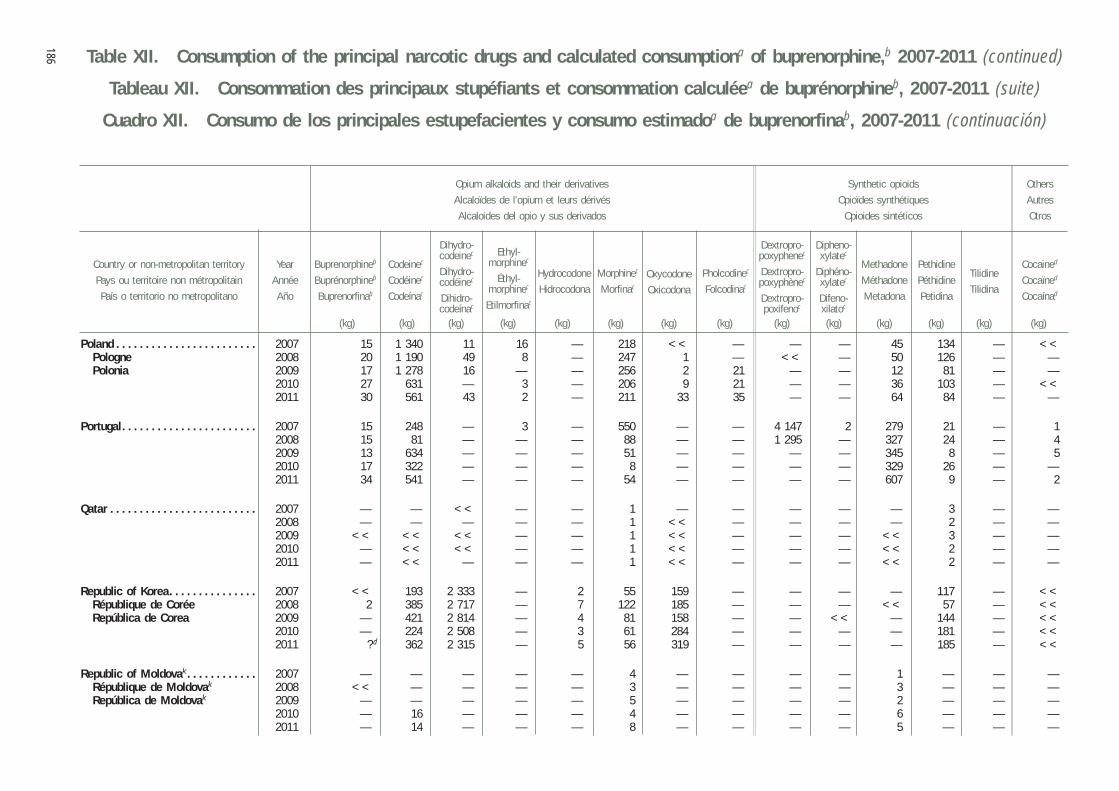
Table XII. Consumption of the principal narcotic drugs and calculated consumptiona of buprenorphine,b 2007-2011 (continued)
Tableau XII. Consommation des principaux stupéfiants et consommation calculéea de buprénorphineb, 2007-2011 (suite)
Cuadro XII. Consumo de los principales estupefacientes y consumo estimadoa de buprenorfinab, 2007-2011 (continuación)
186
Year
Année
Año
Country or non-metropolitan territory
Pays ou territoire non métropolitain
País o territorio no metropolitano
Cocained
Cocaïned
Cocaínad
Codeinec
Codéinec
Codeínac
Buprenorphineb
Buprénorphineb
Buprenorfinab
Dextropro-poxyphenec
Dextropro-poxyphènec
Dextropro-poxifenoc
Dipheno-xylatec
Diphéno-xylatec
Difeno-xilatoc
Dihydro-codeinec
Dihydro-codéinec
Dihidro-codeínac
Ethyl-morphinec
Éthyl-morphinec
Etilmorfinac
Methadone
Méthadone
Metadona
Morphinec
Morfinac
Pethidine
Péthidine
Petidina
Pholcodinec
Folcodinac
(kg) (kg) (kg) (kg) (kg) (kg) (kg) (kg) (kg) (kg) (kg) (kg) (kg) (kg)
Oxycodone
Oxicodona
Hydrocodone
Hidrocodona
Tilidine
Tilidina
Opium alkaloids and their derivatives
Alcaloïdes de l’opium et leurs dérivés
Alcaloides del opio y sus derivados
Synthetic opioids
Opioïdes synthétiques
Opioides sintéticos
Others
Autres
Otros
Poland . . . . . . . . . . . . . . . . . . . . . . . . 2007 15 1 340 11 16 — 218 << — — — 45 134 — <<Pologne 2008 20 1 190 49 8 — 247 1 — << — 50 126 — —Polonia 2009 17 1 278 16 — — 256 2 21 — — 12 81 — —
2010 27 631 — 3 — 206 9 21 — — 36 103 — <<2011 30 561 43 2 — 211 33 35 — — 64 84 — —
Portugal . . . . . . . . . . . . . . . . . . . . . . . 2007 15 248 — 3 — 550 — — 4 147 2 279 21 — 12008 15 81 — — — 88 — — 1 295 — 327 24 — 42009 13 634 — — — 51 — — — — 345 8 — 52010 17 322 — — — 8 — — — — 329 26 — —2011 34 541 — — — 54 — — — — 607 9 — 2
Qatar . . . . . . . . . . . . . . . . . . . . . . . . . 2007 — — << — — 1 — — — — — 3 — —2008 — — — — — 1 << — — — — 2 — —2009 << << << — — 1 << — — — << 3 — —2010 — << << — — 1 << — — — << 2 — —2011 — << — — — 1 << — — — << 2 — —
Republic of Korea . . . . . . . . . . . . . . . 2007 << 193 2 333 — 2 55 159 — — — — 117 — <<République de Corée 2008 2 385 2 717 — 7 122 185 — — — << 57 — <<República de Corea 2009 — 421 2 814 — 4 81 158 — — << — 144 — <<
2010 — 224 2 508 — 3 61 284 — — — — 181 — <<2011 ? d 362 2 315 — 5 56 319 — — — — 185 — <<
Republic of Moldovak . . . . . . . . . . . . 2007 — — — — — 4 — — — — 1 — — —République de Moldovak 2008 << — — — — 3 — — — — 3 — — —República de Moldovak 2009 — — — — — 5 — — — — 2 — — —
2010 — 16 — — — 4 — — — — 6 — — —2011 — 14 — — — 8 — — — — 5 — — —

187
Romania . . . . . . . . . . . . . . . . . . . . . . 2007 << 389 — — — 10 — — — — 13 22 — —Roumanie 2008 1 219 54 — — 32 14 — — — 32 — — —Rumania 2009 1 433 114 — — 39 58 — — — 7 24 — —
2010 — — — — — — — — — — — — — <<2011 ? d — — — — — — — — — — — — —
Russian Federation . . . . . . . . . . . . . . 2007 — 4 322 — — — 66 — — — — — — — <<Fédération de Russie 2008 << 4 866 — — — 62 — — — — — — — <<Federación de Rusia 2009 — 3 909 — — — 61 — — — — — — — —
2010 << 4 149 — — — 68 — — — — — — — <<2011 — 4 094 — — — 54 — — — — — — — <<
Rwanda . . . . . . . . . . . . . . . . . . . . . . . 2007 — — — — — — — — — — — — — —2008 ? d — — — — << — — — — — 1 — —2009 — — — — — — — — — — — — — —2010 << — — — — — — — — — — — — —2011 ? d — — — — — — — — — — — — —
Saint Helena . . . . . . . . . . . . . . . . . . . 2007 — << — — — << — — — — — << — —Sainte-Hélène 2008 — << — — — << — — — — — << — —Santa Elena 2009 — << — — — << — — — — — << — —
2010 — ? ? ? ? ? ? ? ? ? ? ? ? ?2011 — << — — — << — — — — — << — —
Saint Lucia . . . . . . . . . . . . . . . . . . . . 2007 — 1 — — — << — — — — << 1 — —Sainte-Lucie 2008 — 1 — — << << — — — — << 1 — —Santa Lucía 2009 — 2 — — << << — — — — << 1 — —
2010 — — — — << << — — — — << 2 — —2011 ? d — — — — — — — — — — — — —
Saint Vincent and the Grenadines . . 2007 — << — — — << — — — — — << — —Saint-Vincent-et-les Grenadines 2008 — — — — — << — — — — — 1 — —San Vicente y las Granadinas 2009 ? d — — — — << — — — — — 1 — —
2010 — — — — — << — — — — — 2 — —2011 ? d — — — — << — — — — — 1 — —
Samoa . . . . . . . . . . . . . . . . . . . . . . . . 2007 ? d — — — — << — — — — — << — —2008 — — — — — << — — — — — << — —2009 — — — — — — — — — — — — — —2010 ? ? ? ? ? ? ? ? ? ? ? ? ? ?2011 ? << — — — << — — — — — 1 — —
Sao Tome and Principe . . . . . . . . . . 2007 — — — — — — — — — — — — — —Sao Tomé-et-Principe 2008 — — — — — — — — — — — — — —Santo Tomé y Príncipe 2009 — — — — — << — — — — — — — —
2010 ? ? ? ? ? ? ? ? ? ? ? ? ? ?2011 — — — — — — — — — — — 1 — —
Part fourQuatrième partieCuarta parte Tables — Tableaux — Cuadros
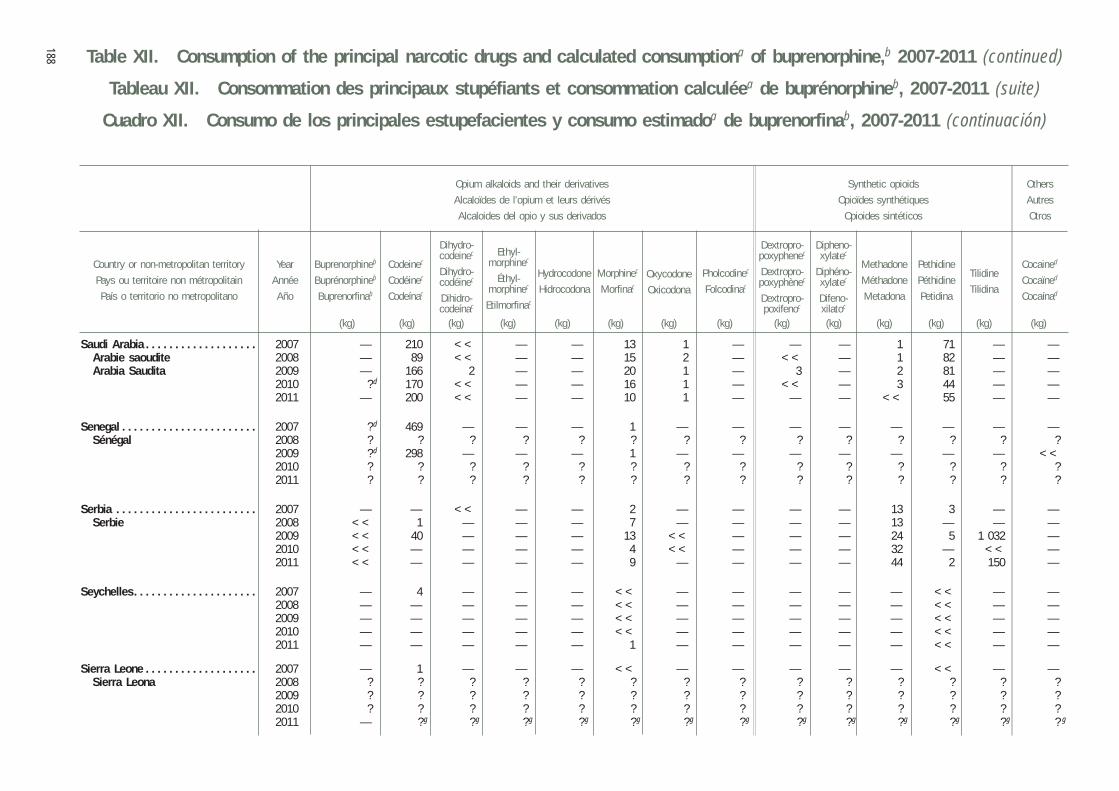
Table XII. Consumption of the principal narcotic drugs and calculated consumptiona of buprenorphine,b 2007-2011 (continued)
Tableau XII. Consommation des principaux stupéfiants et consommation calculéea de buprénorphineb, 2007-2011 (suite)
Cuadro XII. Consumo de los principales estupefacientes y consumo estimadoa de buprenorfinab, 2007-2011 (continuación)
188
Year
Année
Año
Country or non-metropolitan territory
Pays ou territoire non métropolitain
País o territorio no metropolitano
Cocained
Cocaïned
Cocaínad
Codeinec
Codéinec
Codeínac
Buprenorphineb
Buprénorphineb
Buprenorfinab
Dextropro-poxyphenec
Dextropro-poxyphènec
Dextropro-poxifenoc
Dipheno-xylatec
Diphéno-xylatec
Difeno-xilatoc
Dihydro-codeinec
Dihydro-codéinec
Dihidro-codeínac
Ethyl-morphinec
Éthyl-morphinec
Etilmorfinac
Methadone
Méthadone
Metadona
Morphinec
Morfinac
Pethidine
Péthidine
Petidina
Pholcodinec
Folcodinac
(kg) (kg) (kg) (kg) (kg) (kg) (kg) (kg) (kg) (kg) (kg) (kg) (kg) (kg)
Oxycodone
Oxicodona
Hydrocodone
Hidrocodona
Tilidine
Tilidina
Opium alkaloids and their derivatives
Alcaloïdes de l’opium et leurs dérivés
Alcaloides del opio y sus derivados
Synthetic opioids
Opioïdes synthétiques
Opioides sintéticos
Others
Autres
Otros
Saudi Arabia . . . . . . . . . . . . . . . . . . . 2007 — 210 << — — 13 1 — — — 1 71 — —Arabie saoudite 2008 — 89 << — — 15 2 — << — 1 82 — —Arabia Saudita 2009 — 166 2 — — 20 1 — 3 — 2 81 — —
2010 ? d 170 << — — 16 1 — << — 3 44 — —2011 — 200 << — — 10 1 — — — << 55 — —
Senegal . . . . . . . . . . . . . . . . . . . . . . . 2007 ? d 469 — — — 1 — — — — — — — —Sénégal 2008 ? ? ? ? ? ? ? ? ? ? ? ? ? ?
2009 ? d 298 — — — 1 — — — — — — — <<2010 ? ? ? ? ? ? ? ? ? ? ? ? ? ?2011 ? ? ? ? ? ? ? ? ? ? ? ? ? ?
Serbia . . . . . . . . . . . . . . . . . . . . . . . . 2007 — — << — — 2 — — — — 13 3 — —Serbie 2008 << 1 — — — 7 — — — — 13 — — —
2009 << 40 — — — 13 << — — — 24 5 1 032 —2010 << — — — — 4 << — — — 32 — << —2011 << — — — — 9 — — — — 44 2 150 —
Seychelles . . . . . . . . . . . . . . . . . . . . . 2007 — 4 — — — << — — — — — << — —2008 — — — — — << — — — — — << — —2009 — — — — — << — — — — — << — —2010 — — — — — << — — — — — << — —2011 — — — — — 1 — — — — — << — —
Sierra Leone . . . . . . . . . . . . . . . . . . . 2007 — 1 — — — << — — — — — << — —Sierra Leona 2008 ? ? ? ? ? ? ? ? ? ? ? ? ? ?
2009 ? ? ? ? ? ? ? ? ? ? ? ? ? ?2010 ? ? ? ? ? ? ? ? ? ? ? ? ? ?2011 — ? g ? g ? g ? g ? g ? g ? g ? g ? g ? g ? g ? g ? g
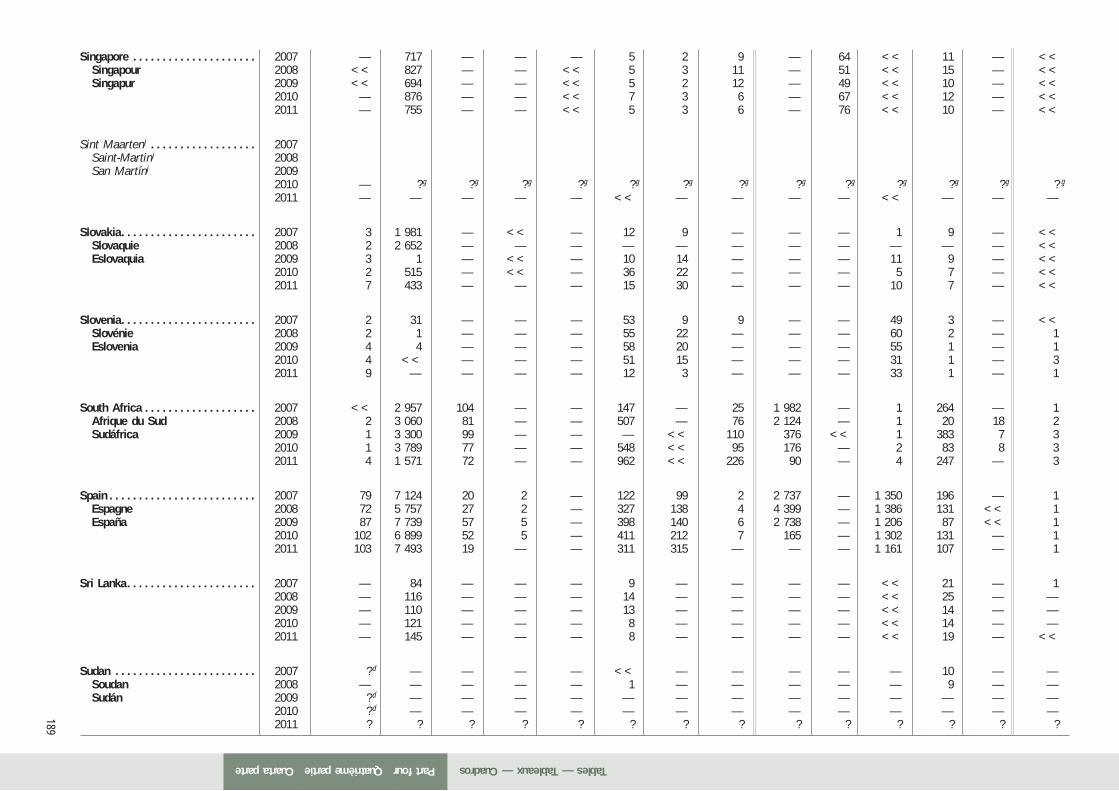
189
Singapore . . . . . . . . . . . . . . . . . . . . . 2007 — 717 — — — 5 2 9 — 64 << 11 — <<Singapour 2008 << 827 — — << 5 3 11 — 51 << 15 — <<Singapur 2009 << 694 — — << 5 2 12 — 49 << 10 — <<
2010 — 876 — — << 7 3 6 — 67 << 12 — <<2011 — 755 — — << 5 3 6 — 76 << 10 — <<
Sint Maartenj . . . . . . . . . . . . . . . . . . 2007 Saint-Martinj 2008San Martínj 2009
2010 — ? g ? g ? g ? g ? g ? g ? g ? g ? g ? g ? g ? g ? g
2011 — — — — — << — — — — << — — —
Slovakia . . . . . . . . . . . . . . . . . . . . . . . 2007 3 1 981 — << — 12 9 — — — 1 9 — <<Slovaquie 2008 2 2 652 — — — — — — — — — — — <<Eslovaquia 2009 3 1 — << — 10 14 — — — 11 9 — <<
2010 2 515 — << — 36 22 — — — 5 7 — <<2011 7 433 — — — 15 30 — — — 10 7 — <<
Slovenia . . . . . . . . . . . . . . . . . . . . . . . 2007 2 31 — — — 53 9 9 — — 49 3 — <<Slovénie 2008 2 1 — — — 55 22 — — — 60 2 — 1Eslovenia 2009 4 4 — — — 58 20 — — — 55 1 — 1
2010 4 << — — — 51 15 — — — 31 1 — 32011 9 — — — — 12 3 — — — 33 1 — 1
South Africa . . . . . . . . . . . . . . . . . . . 2007 << 2 957 104 — — 147 — 25 1 982 — 1 264 — 1Afrique du Sud 2008 2 3 060 81 — — 507 — 76 2 124 — 1 20 18 2Sudáfrica 2009 1 3 300 99 — — — << 110 376 << 1 383 7 3
2010 1 3 789 77 — — 548 << 95 176 — 2 83 8 32011 4 1 571 72 — — 962 << 226 90 — 4 247 — 3
Spain . . . . . . . . . . . . . . . . . . . . . . . . . 2007 79 7 124 20 2 — 122 99 2 2 737 — 1 350 196 — 1Espagne 2008 72 5 757 27 2 — 327 138 4 4 399 — 1 386 131 << 1España 2009 87 7 739 57 5 — 398 140 6 2 738 — 1 206 87 << 1
2010 102 6 899 52 5 — 411 212 7 165 — 1 302 131 — 12011 103 7 493 19 — — 311 315 — — — 1 161 107 — 1
Sri Lanka . . . . . . . . . . . . . . . . . . . . . . 2007 — 84 — — — 9 — — — — << 21 — 12008 — 116 — — — 14 — — — — << 25 — —2009 — 110 — — — 13 — — — — << 14 — —2010 — 121 — — — 8 — — — — << 14 — —2011 — 145 — — — 8 — — — — << 19 — <<
Sudan . . . . . . . . . . . . . . . . . . . . . . . . 2007 ? d — — — — << — — — — — 10 — —Soudan 2008 — — — — — 1 — — — — — 9 — —Sudán 2009 ? d — — — — — — — — — — — — —
2010 ? d — — — — — — — — — — — — —2011 ? ? ? ? ? ? ? ? ? ? ? ? ? ?
Part fourQuatrième partieCuarta parte Tables — Tableaux — Cuadros
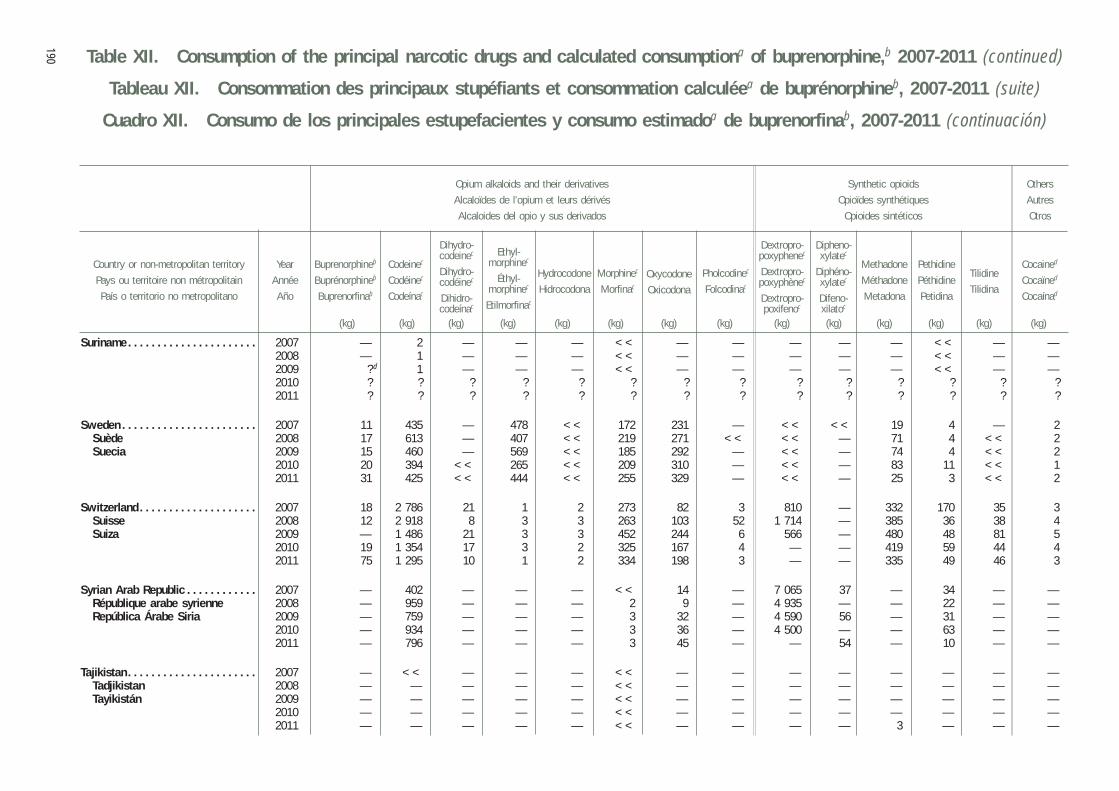
Table XII. Consumption of the principal narcotic drugs and calculated consumptiona of buprenorphine,b 2007-2011 (continued)
Tableau XII. Consommation des principaux stupéfiants et consommation calculéea de buprénorphineb, 2007-2011 (suite)
Cuadro XII. Consumo de los principales estupefacientes y consumo estimadoa de buprenorfinab, 2007-2011 (continuación)
190
Year
Année
Año
Country or non-metropolitan territory
Pays ou territoire non métropolitain
País o territorio no metropolitano
Cocained
Cocaïned
Cocaínad
Codeinec
Codéinec
Codeínac
Buprenorphineb
Buprénorphineb
Buprenorfinab
Dextropro-poxyphenec
Dextropro-poxyphènec
Dextropro-poxifenoc
Dipheno-xylatec
Diphéno-xylatec
Difeno-xilatoc
Dihydro-codeinec
Dihydro-codéinec
Dihidro-codeínac
Ethyl-morphinec
Éthyl-morphinec
Etilmorfinac
Methadone
Méthadone
Metadona
Morphinec
Morfinac
Pethidine
Péthidine
Petidina
Pholcodinec
Folcodinac
(kg) (kg) (kg) (kg) (kg) (kg) (kg) (kg) (kg) (kg) (kg) (kg) (kg) (kg)
Oxycodone
Oxicodona
Hydrocodone
Hidrocodona
Tilidine
Tilidina
Opium alkaloids and their derivatives
Alcaloïdes de l’opium et leurs dérivés
Alcaloides del opio y sus derivados
Synthetic opioids
Opioïdes synthétiques
Opioides sintéticos
Others
Autres
Otros
Suriname . . . . . . . . . . . . . . . . . . . . . . 2007 — 2 — — — << — — — — — << — —2008 — 1 — — — << — — — — — << — —2009 ? d 1 — — — << — — — — — << — —2010 ? ? ? ? ? ? ? ? ? ? ? ? ? ?2011 ? ? ? ? ? ? ? ? ? ? ? ? ? ?
Sweden . . . . . . . . . . . . . . . . . . . . . . . 2007 11 435 — 478 << 172 231 — << << 19 4 — 2Suède 2008 17 613 — 407 << 219 271 << << — 71 4 << 2Suecia 2009 15 460 — 569 << 185 292 — << — 74 4 << 2
2010 20 394 << 265 << 209 310 — << — 83 11 << 12011 31 425 << 444 << 255 329 — << — 25 3 << 2
Switzerland . . . . . . . . . . . . . . . . . . . . 2007 18 2 786 21 1 2 273 82 3 810 — 332 170 35 3Suisse 2008 12 2 918 8 3 3 263 103 52 1 714 — 385 36 38 4Suiza 2009 — 1 486 21 3 3 452 244 6 566 — 480 48 81 5
2010 19 1 354 17 3 2 325 167 4 — — 419 59 44 42011 75 1 295 10 1 2 334 198 3 — — 335 49 46 3
Syrian Arab Republic . . . . . . . . . . . . 2007 — 402 — — — << 14 — 7 065 37 — 34 — —République arabe syrienne 2008 — 959 — — — 2 9 — 4 935 — — 22 — —República Árabe Siria 2009 — 759 — — — 3 32 — 4 590 56 — 31 — —
2010 — 934 — — — 3 36 — 4 500 — — 63 — —2011 — 796 — — — 3 45 — — 54 — 10 — —
Tajikistan . . . . . . . . . . . . . . . . . . . . . . 2007 — << — — — << — — — — — — — —Tadjikistan 2008 — — — — — << — — — — — — — —Tayikistán 2009 — — — — — << — — — — — — — —
2010 — — — — — << — — — — — — — —2011 — — — — — << — — — — 3 — — —
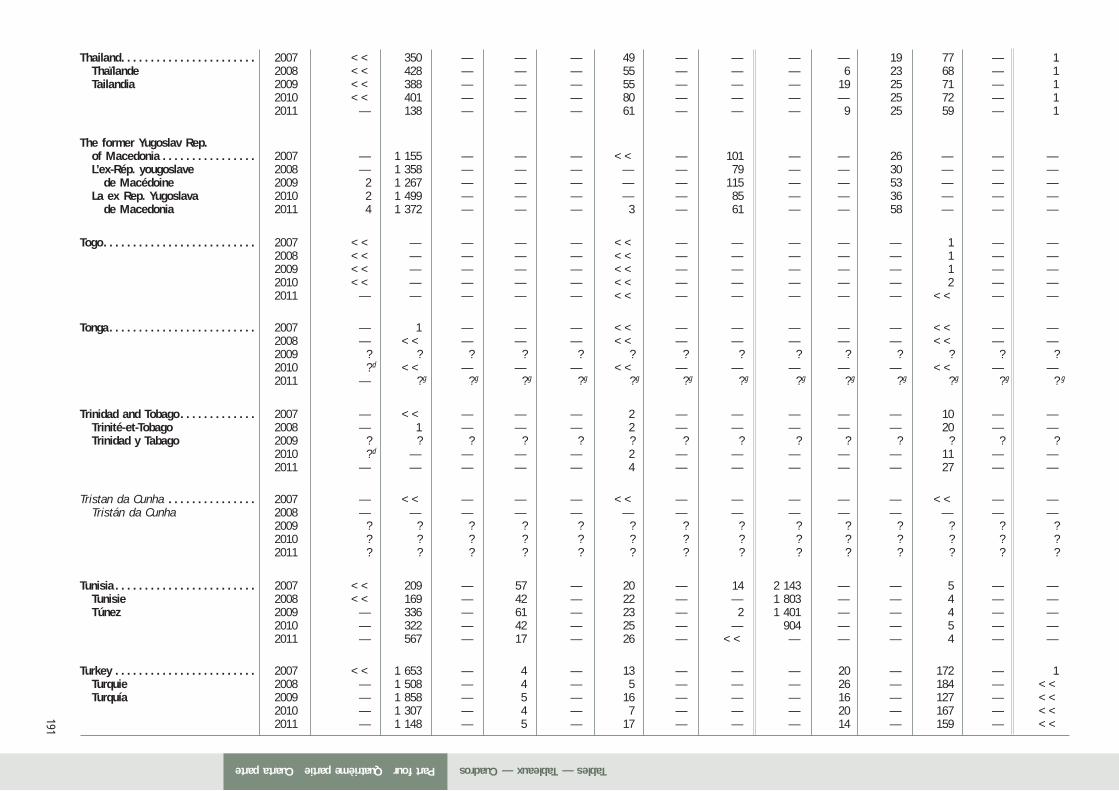
191
Thailand . . . . . . . . . . . . . . . . . . . . . . . 2007 << 350 — — — 49 — — — — 19 77 — 1Thaïlande 2008 << 428 — — — 55 — — — 6 23 68 — 1Tailandia 2009 << 388 — — — 55 — — — 19 25 71 — 1
2010 << 401 — — — 80 — — — — 25 72 — 12011 — 138 — — — 61 — — — 9 25 59 — 1
The former Yugoslav Rep. of Macedonia . . . . . . . . . . . . . . . . 2007 — 1 155 — — — << — 101 — — 26 — — —L’ex-Rép. yougoslave 2008 — 1 358 — — — — — 79 — — 30 — — —
de Macédoine 2009 2 1 267 — — — — — 115 — — 53 — — —La ex Rep. Yugoslava 2010 2 1 499 — — — — — 85 — — 36 — — —
de Macedonia 2011 4 1 372 — — — 3 — 61 — — 58 — — —
Togo . . . . . . . . . . . . . . . . . . . . . . . . . . 2007 << — — — — << — — — — — 1 — —2008 << — — — — << — — — — — 1 — —2009 << — — — — << — — — — — 1 — —2010 << — — — — << — — — — — 2 — —2011 — — — — — << — — — — — << — —
Tonga . . . . . . . . . . . . . . . . . . . . . . . . . 2007 — 1 — — — << — — — — — << — —2008 — << — — — << — — — — — << — —2009 ? ? ? ? ? ? ? ? ? ? ? ? ? ?2010 ? d << — — — << — — — — — << — —2011 — ? g ? g ? g ? g ? g ? g ? g ? g ? g ? g ? g ? g ? g
Trinidad and Tobago . . . . . . . . . . . . . 2007 — << — — — 2 — — — — — 10 — —Trinité-et-Tobago 2008 — 1 — — — 2 — — — — — 20 — —Trinidad y Tabago 2009 ? ? ? ? ? ? ? ? ? ? ? ? ? ?
2010 ? d — — — — 2 — — — — — 11 — —2011 — — — — — 4 — — — — — 27 — —
Tristan da Cunha . . . . . . . . . . . . . . . 2007 — << — — — << — — — — — << — —Tristán da Cunha 2008 — — — — — — — — — — — — — —
2009 ? ? ? ? ? ? ? ? ? ? ? ? ? ?2010 ? ? ? ? ? ? ? ? ? ? ? ? ? ?2011 ? ? ? ? ? ? ? ? ? ? ? ? ? ?
Tunisia . . . . . . . . . . . . . . . . . . . . . . . . 2007 << 209 — 57 — 20 — 14 2 143 — — 5 — —Tunisie 2008 << 169 — 42 — 22 — — 1 803 — — 4 — —Túnez 2009 — 336 — 61 — 23 — 2 1 401 — — 4 — —
2010 — 322 — 42 — 25 — — 904 — — 5 — —2011 — 567 — 17 — 26 — << — — — 4 — —
Turkey . . . . . . . . . . . . . . . . . . . . . . . . 2007 << 1 653 — 4 — 13 — — — 20 — 172 — 1Turquie 2008 — 1 508 — 4 — 5 — — — 26 — 184 — <<Turquía 2009 — 1 858 — 5 — 16 — — — 16 — 127 — <<
2010 — 1 307 — 4 — 7 — — — 20 — 167 — <<2011 — 1 148 — 5 — 17 — — — 14 — 159 — <<
Part fourQuatrième partieCuarta parte Tables — Tableaux — Cuadros
Table XII. Consumption of the principal narcotic drugs and calculated consumptiona of buprenorphine,b 2007-2011 (continued)
Tableau XII. Consommation des principaux stupéfiants et consommation calculéea de buprénorphineb, 2007-2011 (suite)
Cuadro XII. Consumo de los principales estupefacientes y consumo estimadoa de buprenorfinab, 2007-2011 (continuación)
192
Year
Année
Año
Country or non-metropolitan territory
Pays ou territoire non métropolitain
País o territorio no metropolitano
Cocained
Cocaïned
Cocaínad
Codeinec
Codéinec
Codeínac
Buprenorphineb
Buprénorphineb
Buprenorfinab
Dextropro-poxyphenec
Dextropro-poxyphènec
Dextropro-poxifenoc
Dipheno-xylatec
Diphéno-xylatec
Difeno-xilatoc
Dihydro-codeinec
Dihydro-codéinec
Dihidro-codeínac
Ethyl-morphinec
Éthyl-morphinec
Etilmorfinac
Methadone
Méthadone
Metadona
Morphinec
Morfinac
Pethidine
Péthidine
Petidina
Pholcodinec
Folcodinac
(kg) (kg) (kg) (kg) (kg) (kg) (kg) (kg) (kg) (kg) (kg) (kg) (kg) (kg)
Oxycodone
Oxicodona
Hydrocodone
Hidrocodona
Tilidine
Tilidina
Opium alkaloids and their derivatives
Alcaloïdes de l’opium et leurs dérivés
Alcaloides del opio y sus derivados
Synthetic opioids
Opioïdes synthétiques
Opioides sintéticos
Others
Autres
Otros
Turkmenistan . . . . . . . . . . . . . . . . . . . 2007 — — — — — 1 — — — — — — — —Turkménistan 2008 — — — — — 1 — — — — — — — —Turkmenistán 2009 — << — — — 2 — — — — — — — —
2010 ? d << — — — << — — — — — — — —2011 ? d << — — — 1 — — — — — — — —
Turks and Caicos Islands . . . . . . . . 2007 — << << — — << << — — — — << — —Îles Turques et Caïques 2008 — << << — — << << — — — — << — —Islas Turcas y Caicos 2009 — — — — — << << — — — — << — —
2010 ? ? ? ? ? ? ? ? ? ? ? ? ? ?2011 ? ? ? ? ? ? ? ? ? ? ? ? ? ?
Tuvalu . . . . . . . . . . . . . . . . . . . . . . . . 2007 ? ? ? ? ? ? ? ? ? ? ? ? ? ?2008 ? << — — — — — — — — — << — —2009 ? << — — — << — — — — — << — —2010 ? d << — — — << — — — — — << — —2011 ? ? ? ? ? ? ? ? ? ? ? ? ? ?
Uganda . . . . . . . . . . . . . . . . . . . . . . . 2007 — ? ? ? ? ? ? ? ? ? ? ? ? ?Ouganda 2008 — 38 — — — 45 — — — — — 6 — —
2009 ? 15 — — — 9 — — — — — << — —2010 ? 4 — — — 22 — — — — — 12 — —2011 ? ? ? ? ? ? ? ? ? ? ? ? ? ?
Ukraine . . . . . . . . . . . . . . . . . . . . . . . 2007 2 — — — — — — — — — — — — — Ucrania 2008 3 — — — — — — — — — — — — —
2009 6 1 754 — — — 31 — — — — 108 — — —2010 2 1 955 — — — 29 — — — — 89 — — —2011 7 2 426 — — — 27 — — — — 120 — — —
193
United Arab Emirates . . . . . . . . . . . . 2007 << 93 — — — 2 1 — 17 1 << 5 — — Émirats arabes unis 2008 << 3 — — — 3 << — 5 1 << 7 — —
Emiratos Árabes Unidos 2009 << << — — — 1 — — — << << 7 — —2010 << 69 — — — 1 << — — << << 8 — —2011 << 77 — — — 6 << — — << << 4 — —
United Kingdom . . . . . . . . . . . . . . . . 2007 1 861 34 681 12 701 — — 1 437 217 796 1 935 — 740 170 — 28Royaume-Uni 2008 1 732 32 233 9 015 — — 2 861 1 823 388 2 242 1 2 422 293 — 18Reino Unido 2009 3 042 51 433 11 257 — << 3 946 2 442 839 1 140 19 3 043 402 — 39
2010 — 51 400 11 572 — — 3 915 993 194 1 732 38 3 000 213 — 392011 — 50 000 h,l 11 600 h,l — 5 3 400 h,l 830 93 216 — 2 452 406 — 40 h,l
United Republic of Tanzania . . . . . . 2007 — — — — — — — — — — — — — —République-Unie de Tanzanie 2008 — — — — — — — — 1 — — — — —República Unida de Tanzanía 2009 ? d — — — — 1 — — — — — — — —
2010 — 19 — — — 14 — — — — 5 6 — —2011 — 12 — — — 8 — — 23 — — 9 — —
United States . . . . . . . . . . . . . . . . . . 2007 700 24 478 241 << 30 147 23 005 42 445 — 90 125 552 15 080 3 911 — 81 États-Unis 2008 1 091 20 111 86 << 28 593 20 550 40 523 — 68 694 375 14 846 4 006 — 67
Estados Unidos 2009 1 629 21 255 57 — 39 101 23 403 62 380 — 76 033 654 15 324 3 566 — 712010 2 485 21 609 151 << 42 355 22 868 58 987 — 44 376 481 15 286 2 838 — 822011 3 397 18 202 19 — 42 899 23 099 66 199 — 5 227 547 15 289 2 325 — 82
Uruguay . . . . . . . . . . . . . . . . . . . . . . . 2007 — — — — — — — — — — — — — —2008 — 23 — 1 — 16 — — 83 — 2 7 — —2009 — 18 — 2 << 12 — — 31 — << 8 — —2010 — — — — — 12 — — — — << — — —2011 — 11 — 2 1 9 — — 2 — 1 — — —
Uzbekistan . . . . . . . . . . . . . . . . . . . . . 2007 1 << — — — 3 — — — — << — — —Ouzbékistan 2008 — << — — — 3 — — — — 1 — — —
Uzbekistán 2009 — << — — — 3 — — — — 1 — — —2010 — << — — — 4 — — — — 1 — — —2011 — << — — — 4 — — — — << — — —
Vanuatu . . . . . . . . . . . . . . . . . . . . . . . 2007 ? d << — — — << — — — — — — — —2008 ? ? ? ? ? ? ? ? ? ? ? ? ? ?2009 ? ? ? ? ? ? ? ? ? ? ? ? ? ?2010 ? ? ? ? ? ? ? ? ? ? ? ? ? ?2011 — << — — — << << — — — — — — —
Venezuela (Bolivarian Rep. of) . . . . 2007 — 386 — 23 — 6 3 — — 16 2 12 — — Venezuela (Rép. bolivarienne du) 2008 — 655 — 62 — 11 9 — — — — 4 — — Venezuela (Rep. Bolivariana de) 2009 — 462 — — — 9 18 — — — << — — —
2010 8 604 — — — 7 11 — — — 1 — — —2011 — 425 — — — 12 5 — — — 2 — — —
Part fourQuatrième partieCuarta parte Tables — Tableaux — Cuadros
Table XII. Consumption of the principal narcotic drugs and calculated consumptiona of buprenorphine,b 2007-2011 (continued)
Tableau XII. Consommation des principaux stupéfiants et consommation calculéea de buprénorphineb, 2007-2011 (suite)
Cuadro XII. Consumo de los principales estupefacientes y consumo estimadoa de buprenorfinab, 2007-2011 (continuación)
194
Year
Année
Año
Country or non-metropolitan territory
Pays ou territoire non métropolitain
País o territorio no metropolitano
Cocained
Cocaïned
Cocaínad
Codeinec
Codéinec
Codeínac
Buprenorphineb
Buprénorphineb
Buprenorfinab
Dextropro-poxyphenec
Dextropro-poxyphènec
Dextropro-poxifenoc
Dipheno-xylatec
Diphéno-xylatec
Difeno-xilatoc
Dihydro-codeinec
Dihydro-codéinec
Dihidro-codeínac
Ethyl-morphinec
Éthyl-morphinec
Etilmorfinac
Methadone
Méthadone
Metadona
Morphinec
Morfinac
Pethidine
Péthidine
Petidina
Pholcodinec
Folcodinac
(kg) (kg) (kg) (kg) (kg) (kg) (kg) (kg) (kg) (kg) (kg) (kg) (kg) (kg)
Oxycodone
Oxicodona
Hydrocodone
Hidrocodona
Tilidine
Tilidina
Opium alkaloids and their derivatives
Alcaloïdes de l’opium et leurs dérivés
Alcaloides del opio y sus derivados
Synthetic opioids
Opioïdes synthétiques
Opioides sintéticos
Others
Autres
Otros
Viet Nam . . . . . . . . . . . . . . . . . . . . . . 2007 — 4 321 4 — — 16 — — 5 540 — — 79 — —2008 — 4 844 13 — — 19 — — 7 290 — 43 31 — —2009 — 5 704 20 — — 38 — — 7 740 — 65 31 — —2010 — 6 613 — << — 40 — — — — 12 41 — —2011 — ? ? ? ? ? ? ? ? ? ? ? ? ?
Wallis and Futuna Islands . . . . . . . . 2007 — — — — — << — — 4 — — — — —Îles Wallis-et-Futuna 2008 — — — — — << — — — — — — — —Islas Wallis y Futuna 2009 — — — — — << — — — — — — — —
2010 — — — — — << — — — — — — — —2011 — — — — — << — — — — — — — —
Yemen . . . . . . . . . . . . . . . . . . . . . . . . 2007 — 5 — — — << — — — — — 3 — — Yémen 2008 — 5 — — — << — — — — — 4 — —
2009 — 5 — — — 1 — — — — — 4 — —2010 — 3 — — — << — — — — — 3 — —2011 — 9 — — — << — — — — — 4 — —
Zambia . . . . . . . . . . . . . . . . . . . . . . . . 2007 ? d << << — — << — — 23 — — 1 — —Zambie 2008 — — — — — 1 — — — — — 30 — —
2009 — — — — — 4 — — — — — 17 — —2010 ? — — — — 6 — — — — — 2 — —2011 — — — — — 13 — — — — — 34 — —
Zimbabwe . . . . . . . . . . . . . . . . . . . . . 2007 ? d 137 — — — 5 — — — — — 13 — —2008 ? ? ? ? ? ? ? ? ? ? ? ? ? ?2009 — 55 — — — 1 — — — — — 18 — —2010 — 196 — — — 1 — — — — — 19 << —2011 ? ? ? ? ? ? ? ? ? ? ? ? ? ?
195
aStatistical data for buprenorphine submitted by Governments are used by the International Narcotics Control Board to calculate the approximate consumption in a given year, which is not reported as such by Governments. — Les statistiques communiquées par les gouvernements pour la buprénorphine sont utilisées par l’Organe international de contrôle des stupéfiants pour calculer, pour une année donnée, la consommation appropriée qui n’est pas fournie comme telle par les gouvernements. — La Junta Internacional de Fiscalización de Estupefacientes utiliza los datos estadísticos sobre la buprenorfina presentados por los gobiernos para calcular el consumo correspondiente a determinado año cuando estos no se lo han comunicado.
bAn opiate currently controlled under the 1971 Convention on Psychotropic Substances. — Opiacé actuellement placé sous contrôle en vertu de la Convention de 1971 sur les substances psychotropes. — Opiáceo actualmente sujeto a fiscalización en virtud del Convenio sobre Sustancias Sicotrópicas de 1971.
cThe consumption figures also include quantities used in the manufacture of preparations listed in Schedule III of the 1961 Convention. — Les chiffres de la consommation comprennent également les quantités utilisées pour la fabrica-tion des préparations du Tableau III de la Convention de 1961. — En las cifras de consumo están incluidas también las cantidades utilizadas en la fabricación de preparados de la Lista III de la Convención de 1961.
dThe statistical report on psychotropic substances had not been received by 1 November 2012. — Le rapport statistique sur les substances psychotropes n’avait pas encore été reçu au 1er novembre 2012. — El informe estadístico sobre las sustancias sicotrópicas no se había recibida aún el 1 de noviembre 2012.
eSince 31 March 2009, “Plurinational State of Bolivia” has replaced “Bolivia” as the short name used in the United Nations. — Depuis le 31 mars 2009, “État plurinational de Bolivie” est la forme qui remplace “Bolivie” à l’Organisation des Nations Unies. — Desde el 31 marzo de 2009, “el Estado Plurinacional de Bolivia” reemplaza a “Bolivia” como forma abreviada del nombre de ese país en las Naciones Unidas.
fIn addition, preparations in Schedule III of the 1961 Convention were manufactured from concentrate of poppy straw containing morphine as the main alkaloid to replace preparations of opium consumed in the past. Expressed in terms of the anhydrous morphine alkaloid, the quantities of concentrate of poppy straw utilized were 6,826 kg in 2007, 7,306 kg in 2008, 7,115 kg in 2009, 7,324 kg in 2010 and 7,449 kg in 2011. — En outre, des préparations du Tableau III de la Convention de 1961 destinées à remplacer les préparations d’opium consommées dans le passé ont été fabriquées à partir de concentré de paille de pavot dont la morphine était le principal alcaloïde. Exprimées en équivalent morphine anhydre, les quantités de concentré de paille de pavot utilisées ont été de 6.826 kg en 2007, 7.306 kg en 2008, 7.115 kg en 2009, 7.324 kg en 2010 et de 7.449 kg en 2011. — Además, para sustituir a los preparados de opio que seconsumían anteriormente, se fabricaron preparados de la Lista III de la Convención de 1961 a partir de concentrado de paja de adormidera que contiene morfina como alcaloide principal. Los volúmenes de concentrado de paja de ador-midera, expresados en términos de alcaloide morfínico anhidro, fueron los siguientes: 6.826 kg en 2007, 7.306 kg en 2008, 7.115 kg en 2009, 7.324 kg en 2010 y 7.449 kg en 2011.
gThe statistical report on narcotic drugs had not been received by 1 November 2012. — Le rapport statistique sur les stupéfiants n’avait pas encore été reçu au 1er novembre 2012. — El informe estadístico sobre los estupefacientes no se había recibida aún el 1 de noviembre 2012.
hThis figure is being clarified with the Government. — Des éclaircissements sont demandés au Gouvernement concernant ce chiffre. — Esta cifra está por aclararse con el Gobierno.iSince 16 September 2011, “Libya” has replaced “Libyan Arab Jamahiriya” as the short name used in the United Nations. — Depuis le 16 septembre 2011, “Libye” est la forme courte utilisée à l’Organisation des Nations Unies à la
place de “Jamahiriya arabe libyenne”. — A partir del 16 de septiembre de 2011, “Libia” reemplaza a “Jamahiriya Árabe Libia” como forma abreviada del nombre del país utilizada en las Naciones Unidas.jThe Netherlands Antilles was dissolved on 10 October 2010, resulting in two new constituent entities, Curaçao and Sint Maarten. No data for the Netherlands Antilles were submitted after that date. — Le 10 octobre 2010, les Antilles
néerlandaises ont cessé d’exister et Curaçao et Saint-Martin sont devenus deux pays constitutifs autonomes. Aucune donnée concernant les Antilles néerlandaises n’a été communiquée après cette date. — Las Antillas Neerlandesas se disolvieron el 10 de octubre de 2010 y pasaron a ser dos nuevas entidades constitutivas: Curaçao y Sint Maarten. No se presentaron datos relativos a las Antillas Neerlandesas después de esa fecha.
kSince 9 September 2008, “Republic of Moldova” has replaced “Moldova” as the short name used in the United Nations. — Depuis le 9 septembre 2008, “République de Moldova” est la forme courte utilisée à l’Organisation des Nations Unies à la place de “Moldova”. — A partir del 9 de septiembre de 2008, “República de Moldova” reemplaza a “Moldova” como forma abreviada del nombre del país utilizada en las Naciones Unidas.
lThis figure was calculated by the International Narcotics Control Board. — Ce chiffre a été calculé par l’Organe international de contrôle des stupéfiants. — Cifra calculada por la Junta Internacional de Fiscalización de Estupefacientes.
Total . . . . . . . . . . . . . . . . . . . . . . . . . . 2007 3 658 245 486 29 973 1 512 30 226 39 440 51 609 7 580 270 206 13 732 28 210 9 918 30 208 2172008 4 072 223 636 26 242 1 629 28 745 39 411 53 389 6 991 297 438 17 159 30 589 9 776 25 366 1962009 6 334 256 006 30 617 1 564 39 169 43 470 77 061 8 957 262 226 18 573 32 012 10 156 24 715 2192010 4 248 257 499 28 991 1 023 42 425 41 881 74 235 6 394 215 945 18 527 31 565 8 203 41 708 2162011 5 463 269 394 28 516 1 422 42 988 43 411 81 576 9 668 141 639 22 563 32 833 6 576 30 834 234
Part fourQuatrième partieCuarta parte Tables — Tableaux — Cuadros
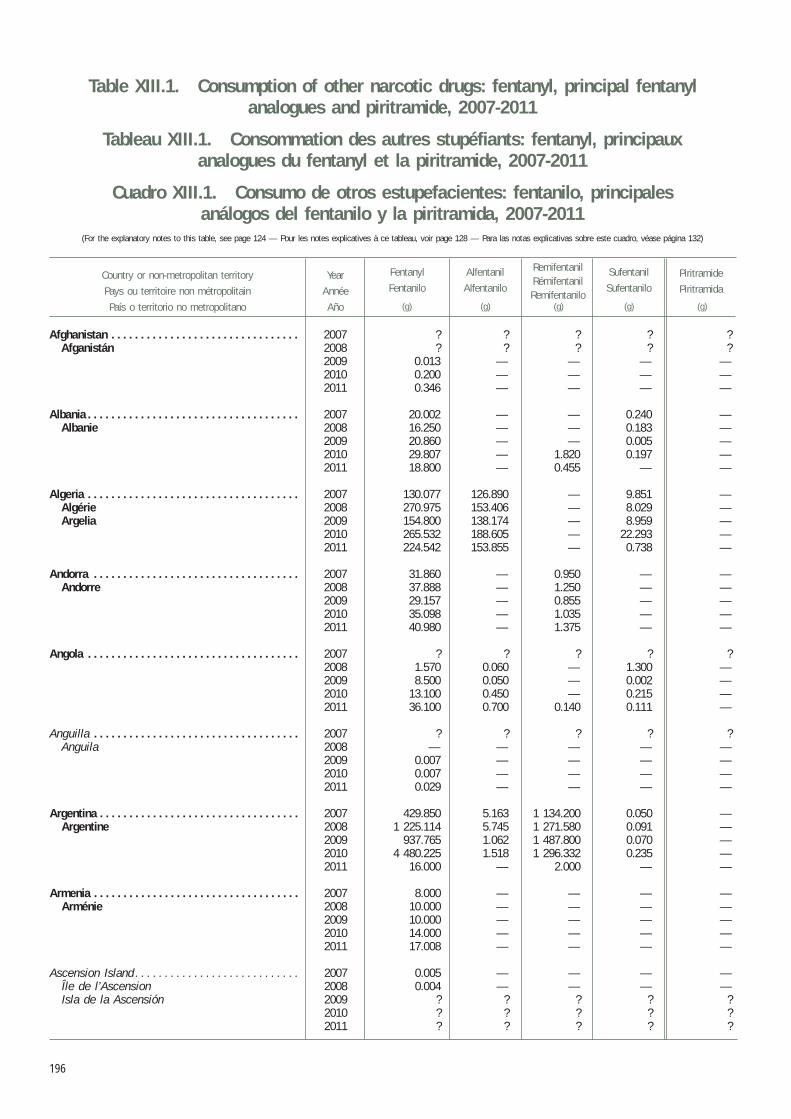
196
Table XIII.1. Consumption of other narcotic drugs: fentanyl, principal fentanyl analogues and piritramide, 2007-2011
Tableau XIII.1. Consommation des autres stupéfiants: fentanyl, principaux analogues du fentanyl et la piritramide, 2007-2011
Cuadro XIII.1. Consumo de otros estupefacientes: fentanilo, principales análogos del fentanilo y la piritramida, 2007-2011
(For the explanatory notes to this table, see page 124 — Pour les notes explicatives à ce tableau, voir page 128 — Para las notas explicativas sobre este cuadro, véase página 132)
Country or non-metropolitan territory
Pays ou territoire non métropolitain
País o territorio no metropolitano
Year
Année
Año
Alfentanil
Alfentanilo
Fentanyl
FentaniloPiritramide
Piritramida
RemifentanilRémifentanilRemifentanilo
Sufentanil
Sufentanilo
(g) (g) (g) (g) (g)
Afghanistan . . . . . . . . . . . . . . . . . . . . . . . . . . . . . . . . 2007 ? ? ? ? ?Afganistán 2008 ? ? ? ? ?
2009 0.013 — — — —2010 0.200 — — — —2011 0.346 — — — —
Albania . . . . . . . . . . . . . . . . . . . . . . . . . . . . . . . . . . . . 2007 20.002 — — 0.240 —Albanie 2008 16.250 — — 0.183 —
2009 20.860 — — 0.005 —2010 29.807 — 1.820 0.197 —2011 18.800 — 0.455 — —
Algeria . . . . . . . . . . . . . . . . . . . . . . . . . . . . . . . . . . . . 2007 130.077 126.890 — 9.851 —Algérie 2008 270.975 153.406 — 8.029 —Argelia 2009 154.800 138.174 — 8.959 —
2010 265.532 188.605 — 22.293 —2011 224.542 153.855 — 0.738 —
Andorra . . . . . . . . . . . . . . . . . . . . . . . . . . . . . . . . . . . 2007 31.860 — 0.950 — —Andorre 2008 37.888 — 1.250 — —
2009 29.157 — 0.855 — —2010 35.098 — 1.035 — —2011 40.980 — 1.375 — —
Angola . . . . . . . . . . . . . . . . . . . . . . . . . . . . . . . . . . . . 2007 ? ? ? ? ?2008 1.570 0.060 — 1.300 —2009 8.500 0.050 — 0.002 —2010 13.100 0.450 — 0.215 —2011 36.100 0.700 0.140 0.111 —
Anguilla . . . . . . . . . . . . . . . . . . . . . . . . . . . . . . . . . . . 2007 ? ? ? ? ?Anguila 2008 — — — — —
2009 0.007 — — — —2010 0.007 — — — —2011 0.029 — — — —
Argentina . . . . . . . . . . . . . . . . . . . . . . . . . . . . . . . . . . 2007 429.850 5.163 1 134.200 0.050 —Argentine 2008 1 225.114 5.745 1 271.580 0.091 —
2009 937.765 1.062 1 487.800 0.070 —2010 4 480.225 1.518 1 296.332 0.235 —2011 16.000 — 2.000 — —
Armenia . . . . . . . . . . . . . . . . . . . . . . . . . . . . . . . . . . . 2007 8.000 — — — —Arménie 2008 10.000 — — — —
2009 10.000 — — — —2010 14.000 — — — —2011 17.008 — — — —
Ascension Island . . . . . . . . . . . . . . . . . . . . . . . . . . . . 2007 0.005 — — — —Île de l’Ascension 2008 0.004 — — — —Isla de la Ascensión 2009 ? ? ? ? ?
2010 ? ? ? ? ?2011 ? ? ? ? ?
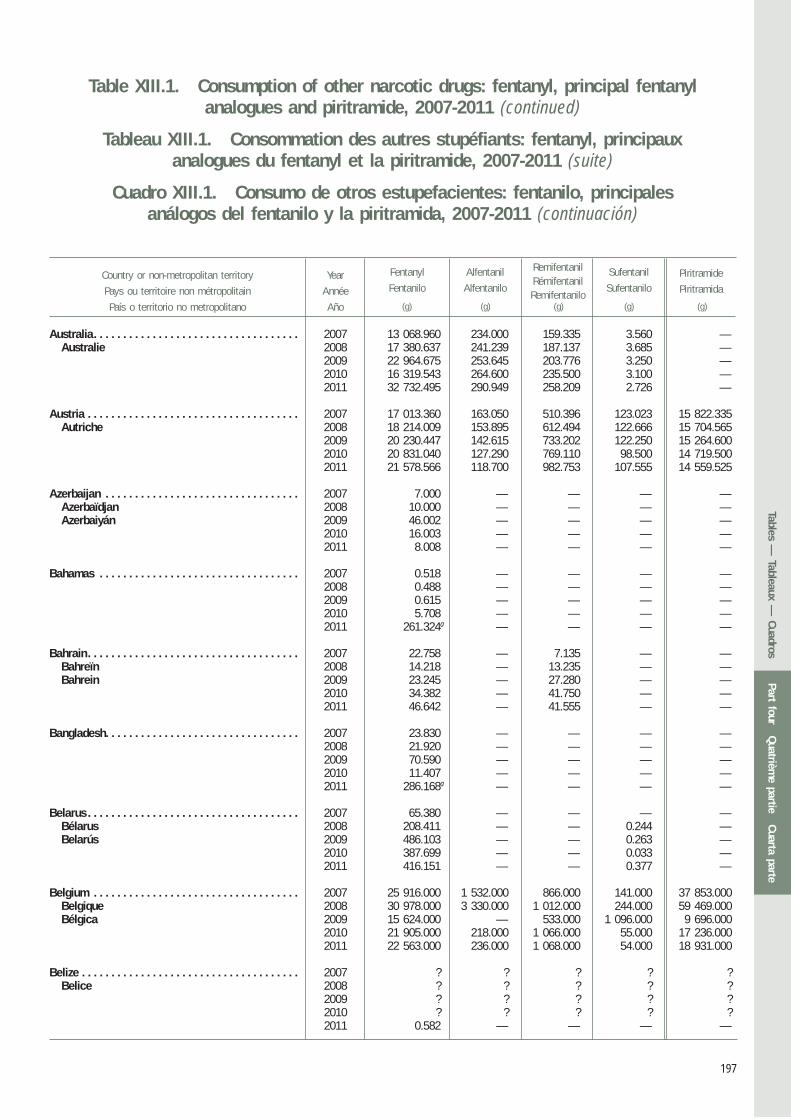
197
Table XIII.1. Consumption of other narcotic drugs: fentanyl, principal fentanyl analogues and piritramide, 2007-2011 (continued)
Tableau XIII.1. Consommation des autres stupéfiants: fentanyl, principaux analogues du fentanyl et la piritramide, 2007-2011 (suite)
Cuadro XIII.1. Consumo de otros estupefacientes: fentanilo, principales análogos del fentanilo y la piritramida, 2007-2011 (continuación)
Country or non-metropolitan territory
Pays ou territoire non métropolitain
País o territorio no metropolitano
Year
Année
Año
Alfentanil
Alfentanilo
Fentanyl
FentaniloPiritramide
Piritramida
RemifentanilRémifentanilRemifentanilo
Sufentanil
Sufentanilo
(g) (g) (g) (g) (g)
Australia. . . . . . . . . . . . . . . . . . . . . . . . . . . . . . . . . . . 2007 13 068.960 234.000 159.335 3.560 —Australie 2008 17 380.637 241.239 187.137 3.685 —
2009 22 964.675 253.645 203.776 3.250 —2010 16 319.543 264.600 235.500 3.100 —2011 32 732.495 290.949 258.209 2.726 —
Austria . . . . . . . . . . . . . . . . . . . . . . . . . . . . . . . . . . . . 2007 17 013.360 163.050 510.396 123.023 15 822.335Autriche 2008 18 214.009 153.895 612.494 122.666 15 704.565
2009 20 230.447 142.615 733.202 122.250 15 264.6002010 20 831.040 127.290 769.110 98.500 14 719.5002011 21 578.566 118.700 982.753 107.555 14 559.525
Azerbaijan . . . . . . . . . . . . . . . . . . . . . . . . . . . . . . . . . 2007 7.000 — — — —Azerbaïdjan 2008 10.000 — — — —Azerbaiyán 2009 46.002 — — — —
2010 16.003 — — — —2011 8.008 — — — —
Bahamas . . . . . . . . . . . . . . . . . . . . . . . . . . . . . . . . . . 2007 0.518 — — — —2008 0.488 — — — —2009 0.615 — — — —2010 5.708 — — — —2011 261.324a — — — —
Bahrain. . . . . . . . . . . . . . . . . . . . . . . . . . . . . . . . . . . . 2007 22.758 — 7.135 — —Bahreïn 2008 14.218 — 13.235 — —Bahrein 2009 23.245 — 27.280 — —
2010 34.382 — 41.750 — —2011 46.642 — 41.555 — —
Bangladesh. . . . . . . . . . . . . . . . . . . . . . . . . . . . . . . . . 2007 23.830 — — — —2008 21.920 — — — —2009 70.590 — — — —2010 11.407 — — — —2011 286.168a — — — —
Belarus . . . . . . . . . . . . . . . . . . . . . . . . . . . . . . . . . . . . 2007 65.380 — — — —Bélarus 2008 208.411 — — 0.244 —Belarús 2009 486.103 — — 0.263 —
2010 387.699 — — 0.033 —2011 416.151 — — 0.377 —
Belgium . . . . . . . . . . . . . . . . . . . . . . . . . . . . . . . . . . . 2007 25 916.000 1 532.000 866.000 141.000 37 853.000Belgique 2008 30 978.000 3 330.000 1 012.000 244.000 59 469.000Bélgica 2009 15 624.000 — 533.000 1 096.000 9 696.000
2010 21 905.000 218.000 1 066.000 55.000 17 236.0002011 22 563.000 236.000 1 068.000 54.000 18 931.000
Belize . . . . . . . . . . . . . . . . . . . . . . . . . . . . . . . . . . . . . 2007 ? ? ? ? ?Belice 2008 ? ? ? ? ?
2009 ? ? ? ? ?2010 ? ? ? ? ?2011 0.582 — — — —
Part fourQuatrièm
e partieCuarta parte
Tables — Tableaux —
Cuadros
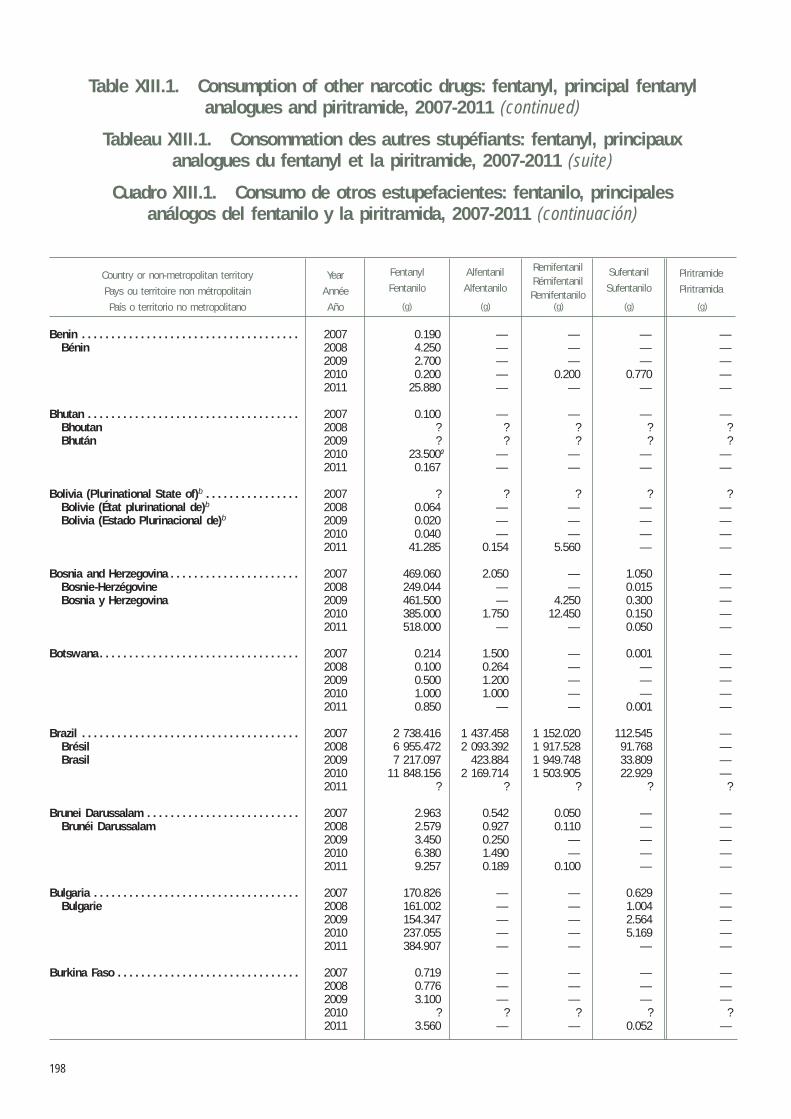
198
Table XIII.1. Consumption of other narcotic drugs: fentanyl, principal fentanyl analogues and piritramide, 2007-2011 (continued)
Tableau XIII.1. Consommation des autres stupéfiants: fentanyl, principaux analogues du fentanyl et la piritramide, 2007-2011 (suite)
Cuadro XIII.1. Consumo de otros estupefacientes: fentanilo, principales análogos del fentanilo y la piritramida, 2007-2011 (continuación)
Country or non-metropolitan territory
Pays ou territoire non métropolitain
País o territorio no metropolitano
Year
Année
Año
Alfentanil
Alfentanilo
Fentanyl
FentaniloPiritramide
Piritramida
RemifentanilRémifentanilRemifentanilo
Sufentanil
Sufentanilo
(g) (g) (g) (g) (g)
Benin . . . . . . . . . . . . . . . . . . . . . . . . . . . . . . . . . . . . . 2007 0.190 — — — —Bénin 2008 4.250 — — — —
2009 2.700 — — — —2010 0.200 — 0.200 0.770 —2011 25.880 — — — —
Bhutan . . . . . . . . . . . . . . . . . . . . . . . . . . . . . . . . . . . . 2007 0.100 — — — —Bhoutan 2008 ? ? ? ? ?Bhután 2009 ? ? ? ? ?
2010 23.500a — — — —2011 0.167 — — — —
Bolivia (Plurinational State of)b . . . . . . . . . . . . . . . . 2007 ? ? ? ? ?Bolivie (État plurinational de)b 2008 0.064 — — — —Bolivia (Estado Plurinacional de)b 2009 0.020 — — — —
2010 0.040 — — — —2011 41.285 0.154 5.560 — —
Bosnia and Herzegovina . . . . . . . . . . . . . . . . . . . . . . 2007 469.060 2.050 — 1.050 —Bosnie-Herzégovine 2008 249.044 — — 0.015 —Bosnia y Herzegovina 2009 461.500 — 4.250 0.300 —
2010 385.000 1.750 12.450 0.150 —2011 518.000 — — 0.050 —
Botswana . . . . . . . . . . . . . . . . . . . . . . . . . . . . . . . . . . 2007 0.214 1.500 — 0.001 —2008 0.100 0.264 — — —2009 0.500 1.200 — — —2010 1.000 1.000 — — —2011 0.850 — — 0.001 —
Brazil . . . . . . . . . . . . . . . . . . . . . . . . . . . . . . . . . . . . . 2007 2 738.416 1 437.458 1 152.020 112.545 —Brésil 2008 6 955.472 2 093.392 1 917.528 91.768 —Brasil 2009 7 217.097 423.884 1 949.748 33.809 —
2010 11 848.156 2 169.714 1 503.905 22.929 —2011 ? ? ? ? ?
Brunei Darussalam . . . . . . . . . . . . . . . . . . . . . . . . . . 2007 2.963 0.542 0.050 — —Brunéi Darussalam 2008 2.579 0.927 0.110 — —
2009 3.450 0.250 — — —2010 6.380 1.490 — — —2011 9.257 0.189 0.100 — —
Bulgaria . . . . . . . . . . . . . . . . . . . . . . . . . . . . . . . . . . . 2007 170.826 — — 0.629 —Bulgarie 2008 161.002 — — 1.004 —
2009 154.347 — — 2.564 —2010 237.055 — — 5.169 —2011 384.907 — — — —
Burkina Faso . . . . . . . . . . . . . . . . . . . . . . . . . . . . . . . 2007 0.719 — — — —2008 0.776 — — — —2009 3.100 — — — —2010 ? ? ? ? ?2011 3.560 — — 0.052 —
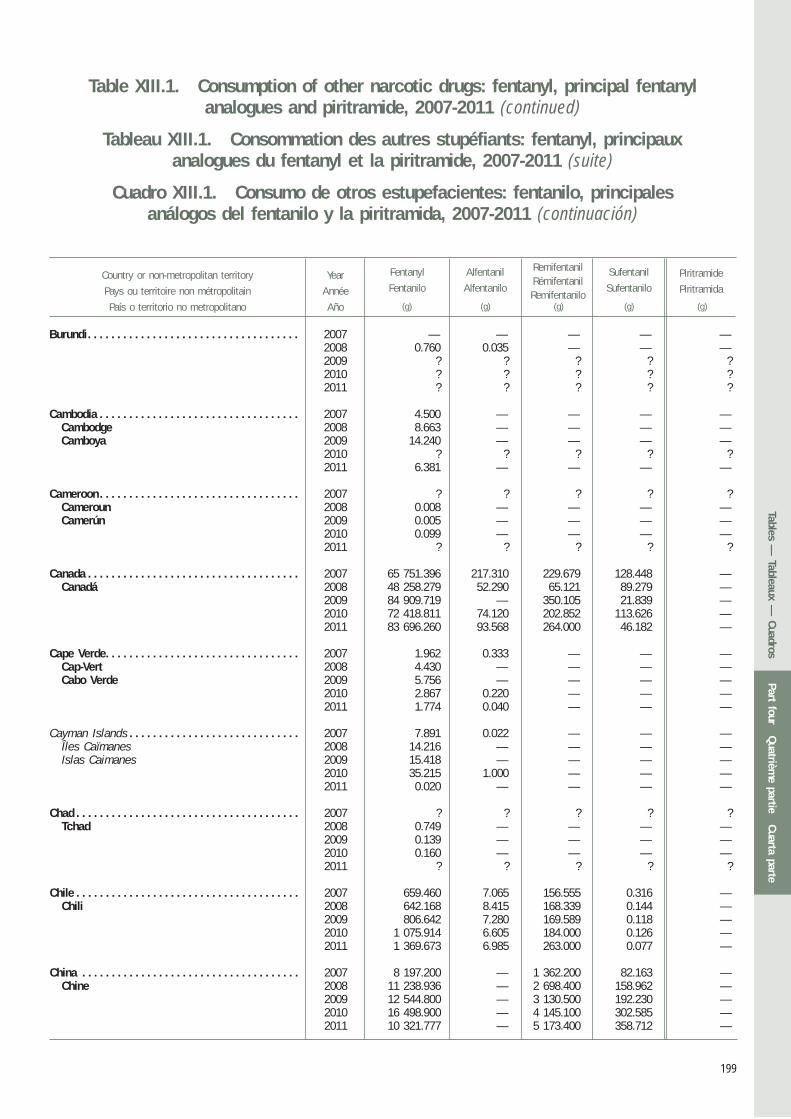
199
Table XIII.1. Consumption of other narcotic drugs: fentanyl, principal fentanyl analogues and piritramide, 2007-2011 (continued)
Tableau XIII.1. Consommation des autres stupéfiants: fentanyl, principaux analogues du fentanyl et la piritramide, 2007-2011 (suite)
Cuadro XIII.1. Consumo de otros estupefacientes: fentanilo, principales análogos del fentanilo y la piritramida, 2007-2011 (continuación)
Country or non-metropolitan territory
Pays ou territoire non métropolitain
País o territorio no metropolitano
Year
Année
Año
Alfentanil
Alfentanilo
Fentanyl
FentaniloPiritramide
Piritramida
RemifentanilRémifentanilRemifentanilo
Sufentanil
Sufentanilo
(g) (g) (g) (g) (g)
Burundi. . . . . . . . . . . . . . . . . . . . . . . . . . . . . . . . . . . . 2007 — — — — —2008 0.760 0.035 — — —2009 ? ? ? ? ?2010 ? ? ? ? ?2011 ? ? ? ? ?
Cambodia . . . . . . . . . . . . . . . . . . . . . . . . . . . . . . . . . . 2007 4.500 — — — —Cambodge 2008 8.663 — — — —Camboya 2009 14.240 — — — —
2010 ? ? ? ? ?2011 6.381 — — — —
Cameroon . . . . . . . . . . . . . . . . . . . . . . . . . . . . . . . . . . 2007 ? ? ? ? ?Cameroun 2008 0.008 — — — —Camerún 2009 0.005 — — — —
2010 0.099 — — — —2011 ? ? ? ? ?
Canada . . . . . . . . . . . . . . . . . . . . . . . . . . . . . . . . . . . . 2007 65 751.396 217.310 229.679 128.448 —Canadá 2008 48 258.279 52.290 65.121 89.279 —
2009 84 909.719 — 350.105 21.839 —2010 72 418.811 74.120 202.852 113.626 —2011 83 696.260 93.568 264.000 46.182 —
Cape Verde. . . . . . . . . . . . . . . . . . . . . . . . . . . . . . . . . 2007 1.962 0.333 — — —Cap-Vert 2008 4.430 — — — —Cabo Verde 2009 5.756 — — — —
2010 2.867 0.220 — — —2011 1.774 0.040 — — —
Cayman Islands . . . . . . . . . . . . . . . . . . . . . . . . . . . . . 2007 7.891 0.022 — — —Îles Caïmanes 2008 14.216 — — — —Islas Caimanes 2009 15.418 — — — —
2010 35.215 1.000 — — —2011 0.020 — — — —
Chad . . . . . . . . . . . . . . . . . . . . . . . . . . . . . . . . . . . . . . 2007 ? ? ? ? ?Tchad 2008 0.749 — — — —
2009 0.139 — — — —2010 0.160 — — — —2011 ? ? ? ? ?
Chile . . . . . . . . . . . . . . . . . . . . . . . . . . . . . . . . . . . . . . 2007 659.460 7.065 156.555 0.316 —Chili 2008 642.168 8.415 168.339 0.144 —
2009 806.642 7.280 169.589 0.118 —2010 1 075.914 6.605 184.000 0.126 —2011 1 369.673 6.985 263.000 0.077 —
China . . . . . . . . . . . . . . . . . . . . . . . . . . . . . . . . . . . . . 2007 8 197.200 — 1 362.200 82.163 —Chine 2008 11 238.936 — 2 698.400 158.962 —
2009 12 544.800 — 3 130.500 192.230 —2010 16 498.900 — 4 145.100 302.585 —2011 10 321.777 — 5 173.400 358.712 —
Part fourQuatrièm
e partieCuarta parte
Tables — Tableaux —
Cuadros
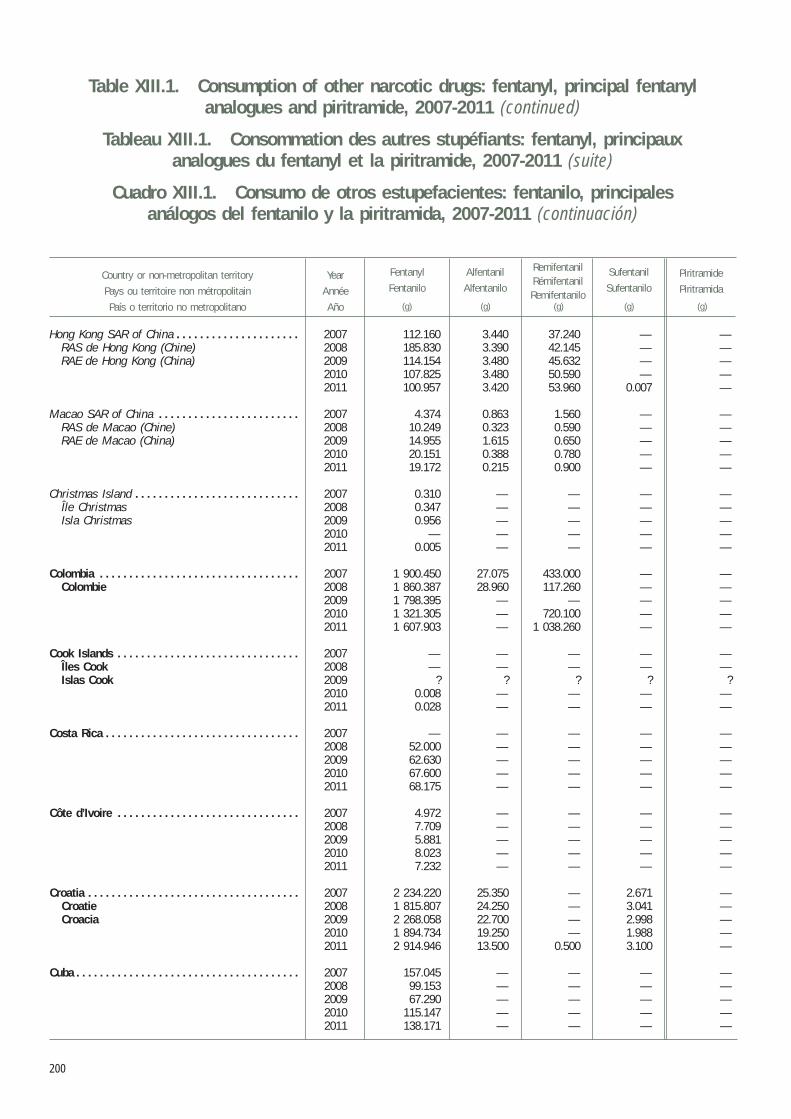
200
Table XIII.1. Consumption of other narcotic drugs: fentanyl, principal fentanyl analogues and piritramide, 2007-2011 (continued)
Tableau XIII.1. Consommation des autres stupéfiants: fentanyl, principaux analogues du fentanyl et la piritramide, 2007-2011 (suite)
Cuadro XIII.1. Consumo de otros estupefacientes: fentanilo, principales análogos del fentanilo y la piritramida, 2007-2011 (continuación)
Country or non-metropolitan territory
Pays ou territoire non métropolitain
País o territorio no metropolitano
Year
Année
Año
Alfentanil
Alfentanilo
Fentanyl
FentaniloPiritramide
Piritramida
RemifentanilRémifentanilRemifentanilo
Sufentanil
Sufentanilo
(g) (g) (g) (g) (g)
Hong Kong SAR of China . . . . . . . . . . . . . . . . . . . . . 2007 112.160 3.440 37.240 — —RAS de Hong Kong (Chine) 2008 185.830 3.390 42.145 — —RAE de Hong Kong (China) 2009 114.154 3.480 45.632 — —
2010 107.825 3.480 50.590 — —2011 100.957 3.420 53.960 0.007 —
Macao SAR of China . . . . . . . . . . . . . . . . . . . . . . . . 2007 4.374 0.863 1.560 — —RAS de Macao (Chine) 2008 10.249 0.323 0.590 — —RAE de Macao (China) 2009 14.955 1.615 0.650 — —
2010 20.151 0.388 0.780 — —2011 19.172 0.215 0.900 — —
Christmas Island . . . . . . . . . . . . . . . . . . . . . . . . . . . . 2007 0.310 — — — —Île Christmas 2008 0.347 — — — —Isla Christmas 2009 0.956 — — — —
2010 — — — — —2011 0.005 — — — —
Colombia . . . . . . . . . . . . . . . . . . . . . . . . . . . . . . . . . . 2007 1 900.450 27.075 433.000 — —Colombie 2008 1 860.387 28.960 117.260 — —
2009 1 798.395 — — — —2010 1 321.305 — 720.100 — —2011 1 607.903 — 1 038.260 — —
Cook Islands . . . . . . . . . . . . . . . . . . . . . . . . . . . . . . . 2007 — — — — —Îles Cook 2008 — — — — —Islas Cook 2009 ? ? ? ? ?
2010 0.008 — — — —2011 0.028 — — — —
Costa Rica . . . . . . . . . . . . . . . . . . . . . . . . . . . . . . . . . 2007 — — — — —2008 52.000 — — — —2009 62.630 — — — —2010 67.600 — — — —2011 68.175 — — — —
Côte d’Ivoire . . . . . . . . . . . . . . . . . . . . . . . . . . . . . . . 2007 4.972 — — — —2008 7.709 — — — —2009 5.881 — — — —2010 8.023 — — — —2011 7.232 — — — —
Croatia . . . . . . . . . . . . . . . . . . . . . . . . . . . . . . . . . . . . 2007 2 234.220 25.350 — 2.671 —Croatie 2008 1 815.807 24.250 — 3.041 —Croacia 2009 2 268.058 22.700 — 2.998 —
2010 1 894.734 19.250 — 1.988 —2011 2 914.946 13.500 0.500 3.100 —
Cuba . . . . . . . . . . . . . . . . . . . . . . . . . . . . . . . . . . . . . . 2007 157.045 — — — —2008 99.153 — — — —2009 67.290 — — — —2010 115.147 — — — —2011 138.171 — — — —
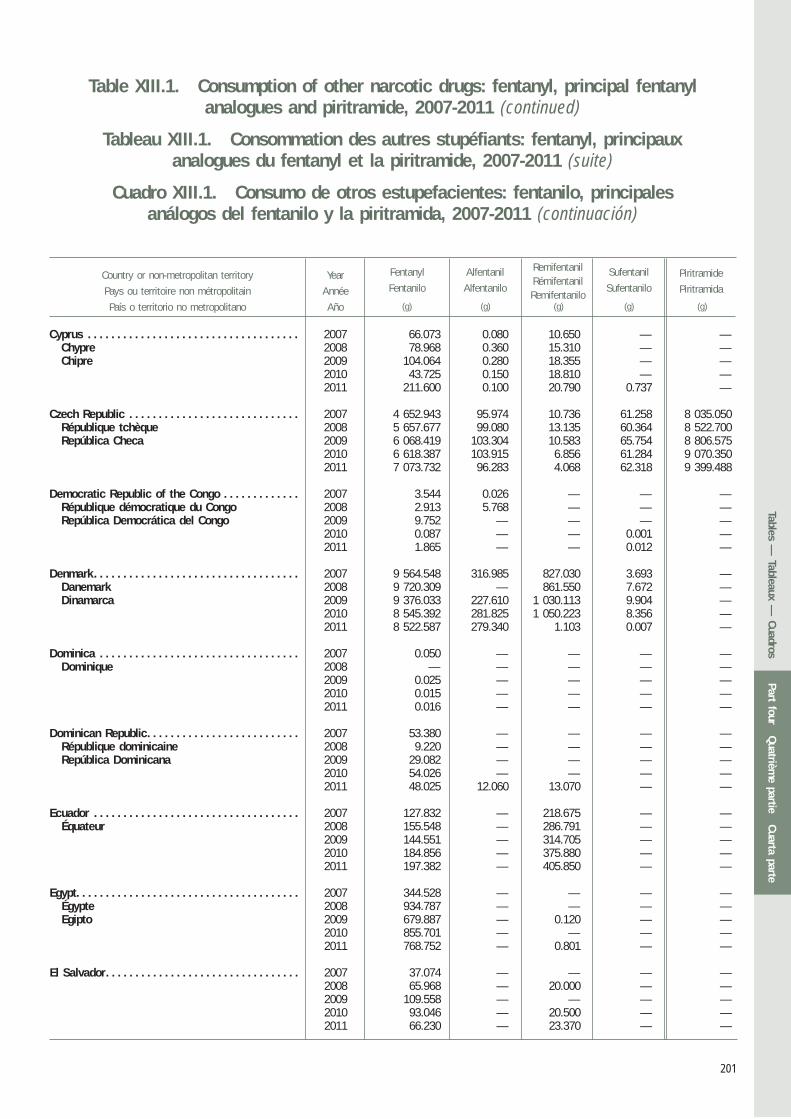
201
Table XIII.1. Consumption of other narcotic drugs: fentanyl, principal fentanyl analogues and piritramide, 2007-2011 (continued)
Tableau XIII.1. Consommation des autres stupéfiants: fentanyl, principaux analogues du fentanyl et la piritramide, 2007-2011 (suite)
Cuadro XIII.1. Consumo de otros estupefacientes: fentanilo, principales análogos del fentanilo y la piritramida, 2007-2011 (continuación)
Country or non-metropolitan territory
Pays ou territoire non métropolitain
País o territorio no metropolitano
Year
Année
Año
Alfentanil
Alfentanilo
Fentanyl
FentaniloPiritramide
Piritramida
RemifentanilRémifentanilRemifentanilo
Sufentanil
Sufentanilo
(g) (g) (g) (g) (g)
Cyprus . . . . . . . . . . . . . . . . . . . . . . . . . . . . . . . . . . . . 2007 66.073 0.080 10.650 — —Chypre 2008 78.968 0.360 15.310 — —Chipre 2009 104.064 0.280 18.355 — —
2010 43.725 0.150 18.810 — —2011 211.600 0.100 20.790 0.737 —
Czech Republic . . . . . . . . . . . . . . . . . . . . . . . . . . . . . 2007 4 652.943 95.974 10.736 61.258 8 035.050République tchèque 2008 5 657.677 99.080 13.135 60.364 8 522.700República Checa 2009 6 068.419 103.304 10.583 65.754 8 806.575
2010 6 618.387 103.915 6.856 61.284 9 070.3502011 7 073.732 96.283 4.068 62.318 9 399.488
Democratic Republic of the Congo . . . . . . . . . . . . . 2007 3.544 0.026 — — —République démocratique du Congo 2008 2.913 5.768 — — —República Democrática del Congo 2009 9.752 — — — —
2010 0.087 — — 0.001 —2011 1.865 — — 0.012 —
Denmark. . . . . . . . . . . . . . . . . . . . . . . . . . . . . . . . . . . 2007 9 564.548 316.985 827.030 3.693 —Danemark 2008 9 720.309 — 861.550 7.672 —Dinamarca 2009 9 376.033 227.610 1 030.113 9.904 —
2010 8 545.392 281.825 1 050.223 8.356 —2011 8 522.587 279.340 1.103 0.007 —
Dominica . . . . . . . . . . . . . . . . . . . . . . . . . . . . . . . . . . 2007 0.050 — — — —Dominique 2008 — — — — —
2009 0.025 — — — —2010 0.015 — — — —2011 0.016 — — — —
Dominican Republic. . . . . . . . . . . . . . . . . . . . . . . . . . 2007 53.380 — — — —République dominicaine 2008 9.220 — — — —República Dominicana 2009 29.082 — — — —
2010 54.026 — — — —2011 48.025 12.060 13.070 — —
Ecuador . . . . . . . . . . . . . . . . . . . . . . . . . . . . . . . . . . . 2007 127.832 — 218.675 — —Équateur 2008 155.548 — 286.791 — —
2009 144.551 — 314.705 — —2010 184.856 — 375.880 — —2011 197.382 — 405.850 — —
Egypt. . . . . . . . . . . . . . . . . . . . . . . . . . . . . . . . . . . . . . 2007 344.528 — — — —Égypte 2008 934.787 — — — —Egipto 2009 679.887 — 0.120 — —
2010 855.701 — — — —2011 768.752 — 0.801 — —
El Salvador. . . . . . . . . . . . . . . . . . . . . . . . . . . . . . . . . 2007 37.074 — — — —2008 65.968 — 20.000 — —2009 109.558 — — — —2010 93.046 — 20.500 — —2011 66.230 — 23.370 — —
Part fourQuatrièm
e partieCuarta parte
Tables — Tableaux —
Cuadros
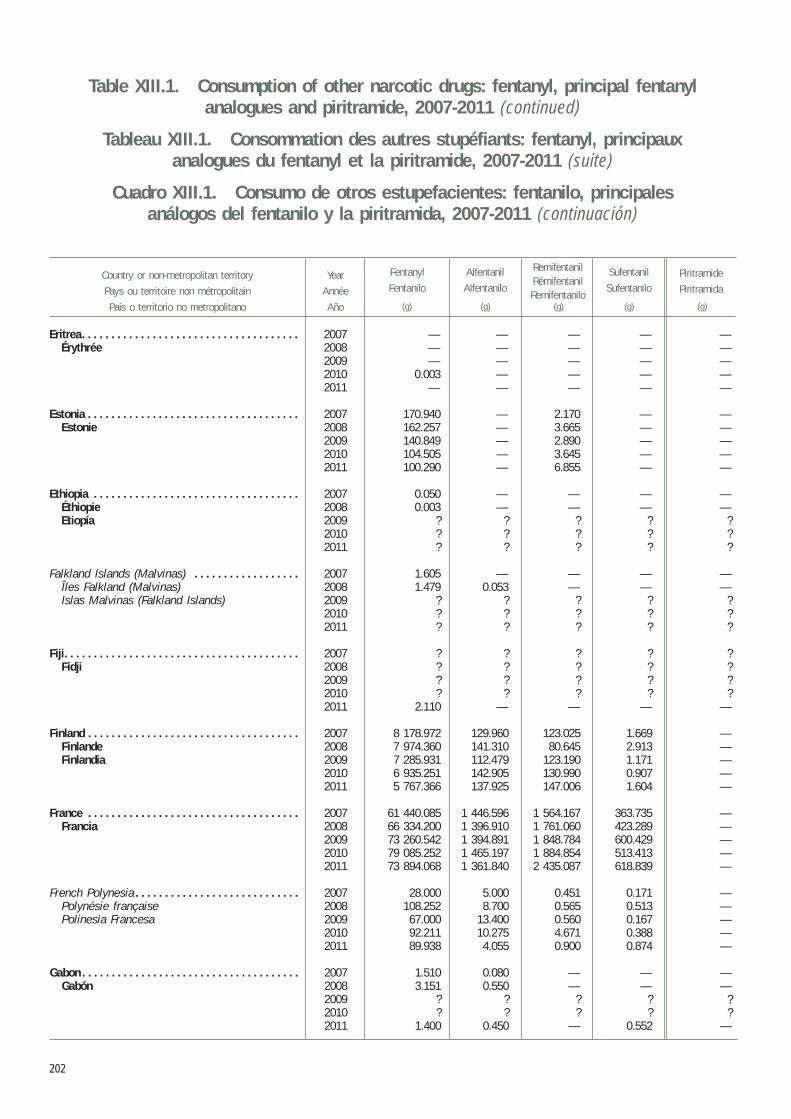
202
Table XIII.1. Consumption of other narcotic drugs: fentanyl, principal fentanyl analogues and piritramide, 2007-2011 (continued)
Tableau XIII.1. Consommation des autres stupéfiants: fentanyl, principaux analogues du fentanyl et la piritramide, 2007-2011 (suite)
Cuadro XIII.1. Consumo de otros estupefacientes: fentanilo, principales análogos del fentanilo y la piritramida, 2007-2011 (continuación)
Country or non-metropolitan territory
Pays ou territoire non métropolitain
País o territorio no metropolitano
Year
Année
Año
Alfentanil
Alfentanilo
Fentanyl
FentaniloPiritramide
Piritramida
RemifentanilRémifentanilRemifentanilo
Sufentanil
Sufentanilo
(g) (g) (g) (g) (g)
Eritrea. . . . . . . . . . . . . . . . . . . . . . . . . . . . . . . . . . . . . 2007 — — — — —Érythrée 2008 — — — — —
2009 — — — — —2010 0.003 — — — —2011 — — — — —
Estonia . . . . . . . . . . . . . . . . . . . . . . . . . . . . . . . . . . . . 2007 170.940 — 2.170 — —Estonie 2008 162.257 — 3.665 — —
2009 140.849 — 2.890 — —2010 104.505 — 3.645 — —2011 100.290 — 6.855 — —
Ethiopia . . . . . . . . . . . . . . . . . . . . . . . . . . . . . . . . . . . 2007 0.050 — — — —Éthiopie 2008 0.003 — — — —Etiopía 2009 ? ? ? ? ?
2010 ? ? ? ? ?2011 ? ? ? ? ?
Falkland Islands (Malvinas) . . . . . . . . . . . . . . . . . . 2007 1.605 — — — —Îles Falkland (Malvinas) 2008 1.479 0.053 — — —Islas Malvinas (Falkland Islands) 2009 ? ? ? ? ?
2010 ? ? ? ? ?2011 ? ? ? ? ?
Fiji. . . . . . . . . . . . . . . . . . . . . . . . . . . . . . . . . . . . . . . . 2007 ? ? ? ? ?Fidji 2008 ? ? ? ? ?
2009 ? ? ? ? ?2010 ? ? ? ? ?2011 2.110 — — — —
Finland . . . . . . . . . . . . . . . . . . . . . . . . . . . . . . . . . . . . 2007 8 178.972 129.960 123.025 1.669 —Finlande 2008 7 974.360 141.310 80.645 2.913 —Finlandia 2009 7 285.931 112.479 123.190 1.171 —
2010 6 935.251 142.905 130.990 0.907 —2011 5 767.366 137.925 147.006 1.604 —
France . . . . . . . . . . . . . . . . . . . . . . . . . . . . . . . . . . . . 2007 61 440.085 1 446.596 1 564.167 363.735 —Francia 2008 66 334.200 1 396.910 1 761.060 423.289 —
2009 73 260.542 1 394.891 1 848.784 600.429 —2010 79 085.252 1 465.197 1 884.854 513.413 —2011 73 894.068 1 361.840 2 435.087 618.839 —
French Polynesia . . . . . . . . . . . . . . . . . . . . . . . . . . . . 2007 28.000 5.000 0.451 0.171 —Polynésie française 2008 108.252 8.700 0.565 0.513 —Polinesia Francesa 2009 67.000 13.400 0.560 0.167 —
2010 92.211 10.275 4.671 0.388 —2011 89.938 4.055 0.900 0.874 —
Gabon . . . . . . . . . . . . . . . . . . . . . . . . . . . . . . . . . . . . . 2007 1.510 0.080 — — —Gabón 2008 3.151 0.550 — — —
2009 ? ? ? ? ?2010 ? ? ? ? ?2011 1.400 0.450 — 0.552 —
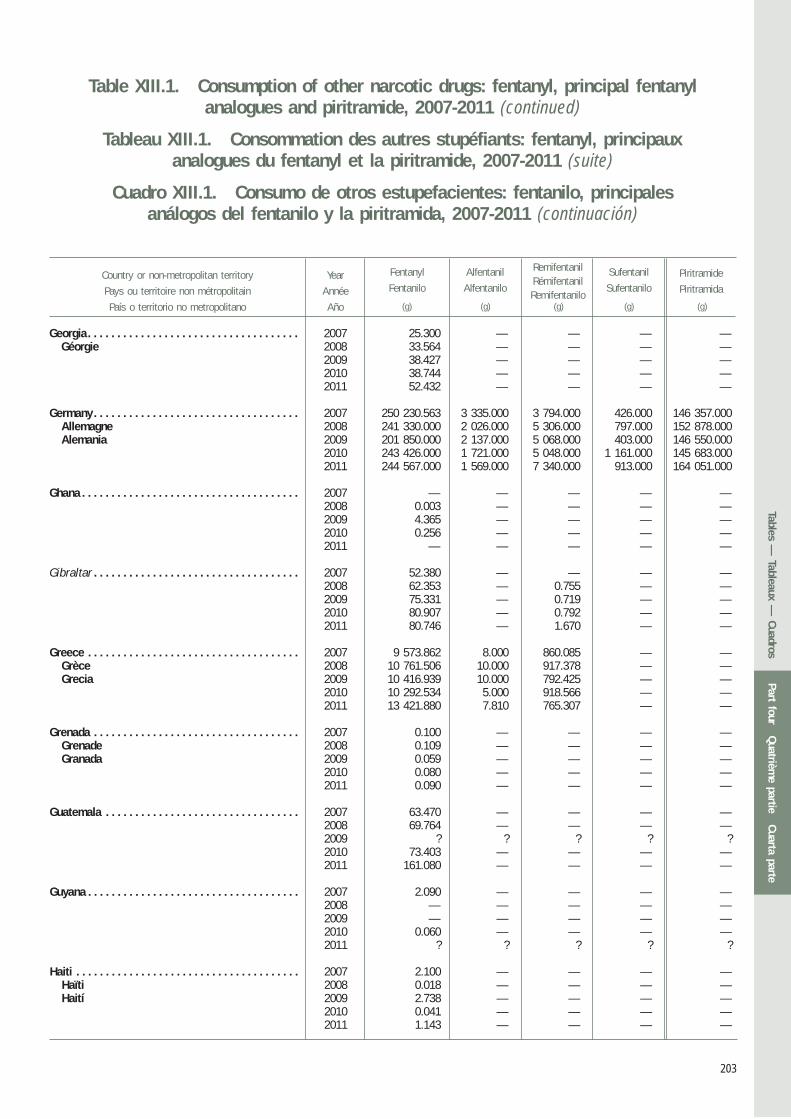
203
Table XIII.1. Consumption of other narcotic drugs: fentanyl, principal fentanyl analogues and piritramide, 2007-2011 (continued)
Tableau XIII.1. Consommation des autres stupéfiants: fentanyl, principaux analogues du fentanyl et la piritramide, 2007-2011 (suite)
Cuadro XIII.1. Consumo de otros estupefacientes: fentanilo, principales análogos del fentanilo y la piritramida, 2007-2011 (continuación)
Country or non-metropolitan territory
Pays ou territoire non métropolitain
País o territorio no metropolitano
Year
Année
Año
Alfentanil
Alfentanilo
Fentanyl
FentaniloPiritramide
Piritramida
RemifentanilRémifentanilRemifentanilo
Sufentanil
Sufentanilo
(g) (g) (g) (g) (g)
Georgia . . . . . . . . . . . . . . . . . . . . . . . . . . . . . . . . . . . . 2007 25.300 — — — —Géorgie 2008 33.564 — — — —
2009 38.427 — — — —2010 38.744 — — — —2011 52.432 — — — —
Germany . . . . . . . . . . . . . . . . . . . . . . . . . . . . . . . . . . . 2007 250 230.563 3 335.000 3 794.000 426.000 146 357.000Allemagne 2008 241 330.000 2 026.000 5 306.000 797.000 152 878.000Alemania 2009 201 850.000 2 137.000 5 068.000 403.000 146 550.000
2010 243 426.000 1 721.000 5 048.000 1 161.000 145 683.0002011 244 567.000 1 569.000 7 340.000 913.000 164 051.000
Ghana . . . . . . . . . . . . . . . . . . . . . . . . . . . . . . . . . . . . . 2007 — — — — —2008 0.003 — — — —2009 4.365 — — — —2010 0.256 — — — —2011 — — — — —
Gibraltar . . . . . . . . . . . . . . . . . . . . . . . . . . . . . . . . . . . 2007 52.380 — — — —2008 62.353 — 0.755 — —2009 75.331 — 0.719 — —2010 80.907 — 0.792 — —2011 80.746 — 1.670 — —
Greece . . . . . . . . . . . . . . . . . . . . . . . . . . . . . . . . . . . . 2007 9 573.862 8.000 860.085 — —Grèce 2008 10 761.506 10.000 917.378 — —Grecia 2009 10 416.939 10.000 792.425 — —
2010 10 292.534 5.000 918.566 — —2011 13 421.880 7.810 765.307 — —
Grenada . . . . . . . . . . . . . . . . . . . . . . . . . . . . . . . . . . . 2007 0.100 — — — —Grenade 2008 0.109 — — — —Granada 2009 0.059 — — — —
2010 0.080 — — — —2011 0.090 — — — —
Guatemala . . . . . . . . . . . . . . . . . . . . . . . . . . . . . . . . . 2007 63.470 — — — —2008 69.764 — — — —2009 ? ? ? ? ?2010 73.403 — — — —2011 161.080 — — — —
Guyana . . . . . . . . . . . . . . . . . . . . . . . . . . . . . . . . . . . . 2007 2.090 — — — —2008 — — — — —2009 — — — — —2010 0.060 — — — —2011 ? ? ? ? ?
Haiti . . . . . . . . . . . . . . . . . . . . . . . . . . . . . . . . . . . . . . 2007 2.100 — — — —Haïti 2008 0.018 — — — —Haití 2009 2.738 — — — —
2010 0.041 — — — —2011 1.143 — — — —
Part fourQuatrièm
e partieCuarta parte
Tables — Tableaux —
Cuadros
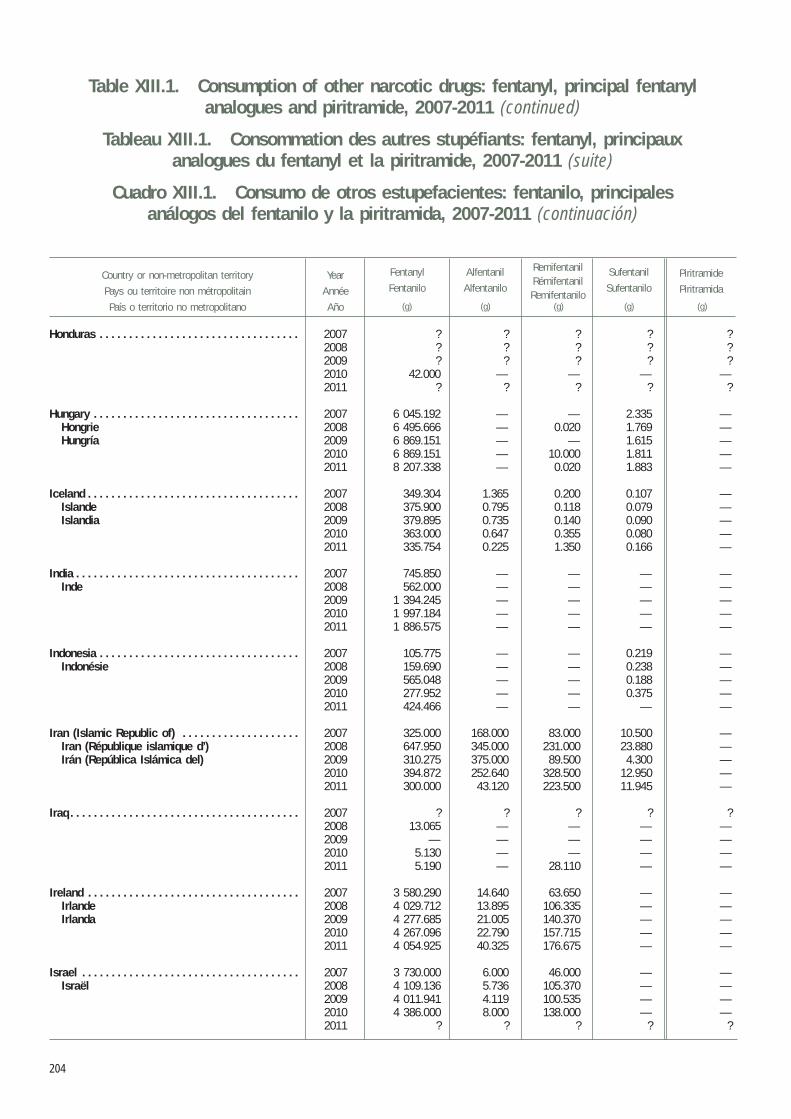
204
Table XIII.1. Consumption of other narcotic drugs: fentanyl, principal fentanyl analogues and piritramide, 2007-2011 (continued)
Tableau XIII.1. Consommation des autres stupéfiants: fentanyl, principaux analogues du fentanyl et la piritramide, 2007-2011 (suite)
Cuadro XIII.1. Consumo de otros estupefacientes: fentanilo, principales análogos del fentanilo y la piritramida, 2007-2011 (continuación)
Country or non-metropolitan territory
Pays ou territoire non métropolitain
País o territorio no metropolitano
Year
Année
Año
Alfentanil
Alfentanilo
Fentanyl
FentaniloPiritramide
Piritramida
RemifentanilRémifentanilRemifentanilo
Sufentanil
Sufentanilo
(g) (g) (g) (g) (g)
Honduras . . . . . . . . . . . . . . . . . . . . . . . . . . . . . . . . . . 2007 ? ? ? ? ?2008 ? ? ? ? ?2009 ? ? ? ? ?2010 42.000 — — — —2011 ? ? ? ? ?
Hungary . . . . . . . . . . . . . . . . . . . . . . . . . . . . . . . . . . . 2007 6 045.192 — — 2.335 —Hongrie 2008 6 495.666 — 0.020 1.769 —Hungría 2009 6 869.151 — — 1.615 —
2010 6 869.151 — 10.000 1.811 —2011 8 207.338 — 0.020 1.883 —
Iceland . . . . . . . . . . . . . . . . . . . . . . . . . . . . . . . . . . . . 2007 349.304 1.365 0.200 0.107 —Islande 2008 375.900 0.795 0.118 0.079 —Islandia 2009 379.895 0.735 0.140 0.090 —
2010 363.000 0.647 0.355 0.080 —2011 335.754 0.225 1.350 0.166 —
India . . . . . . . . . . . . . . . . . . . . . . . . . . . . . . . . . . . . . . 2007 745.850 — — — —Inde 2008 562.000 — — — —
2009 1 394.245 — — — —2010 1 997.184 — — — —2011 1 886.575 — — — —
Indonesia . . . . . . . . . . . . . . . . . . . . . . . . . . . . . . . . . . 2007 105.775 — — 0.219 —Indonésie 2008 159.690 — — 0.238 —
2009 565.048 — — 0.188 —2010 277.952 — — 0.375 —2011 424.466 — — — —
Iran (Islamic Republic of) . . . . . . . . . . . . . . . . . . . . 2007 325.000 168.000 83.000 10.500 —Iran (République islamique d’) 2008 647.950 345.000 231.000 23.880 —Irán (República Islámica del) 2009 310.275 375.000 89.500 4.300 —
2010 394.872 252.640 328.500 12.950 —2011 300.000 43.120 223.500 11.945 —
Iraq . . . . . . . . . . . . . . . . . . . . . . . . . . . . . . . . . . . . . . . 2007 ? ? ? ? ?2008 13.065 — — — —2009 — — — — —2010 5.130 — — — —2011 5.190 — 28.110 — —
Ireland . . . . . . . . . . . . . . . . . . . . . . . . . . . . . . . . . . . . 2007 3 580.290 14.640 63.650 — —Irlande 2008 4 029.712 13.895 106.335 — —Irlanda 2009 4 277.685 21.005 140.370 — —
2010 4 267.096 22.790 157.715 — —2011 4 054.925 40.325 176.675 — —
Israel . . . . . . . . . . . . . . . . . . . . . . . . . . . . . . . . . . . . . 2007 3 730.000 6.000 46.000 — —Israël 2008 4 109.136 5.736 105.370 — —
2009 4 011.941 4.119 100.535 — —2010 4 386.000 8.000 138.000 — —2011 ? ? ? ? ?
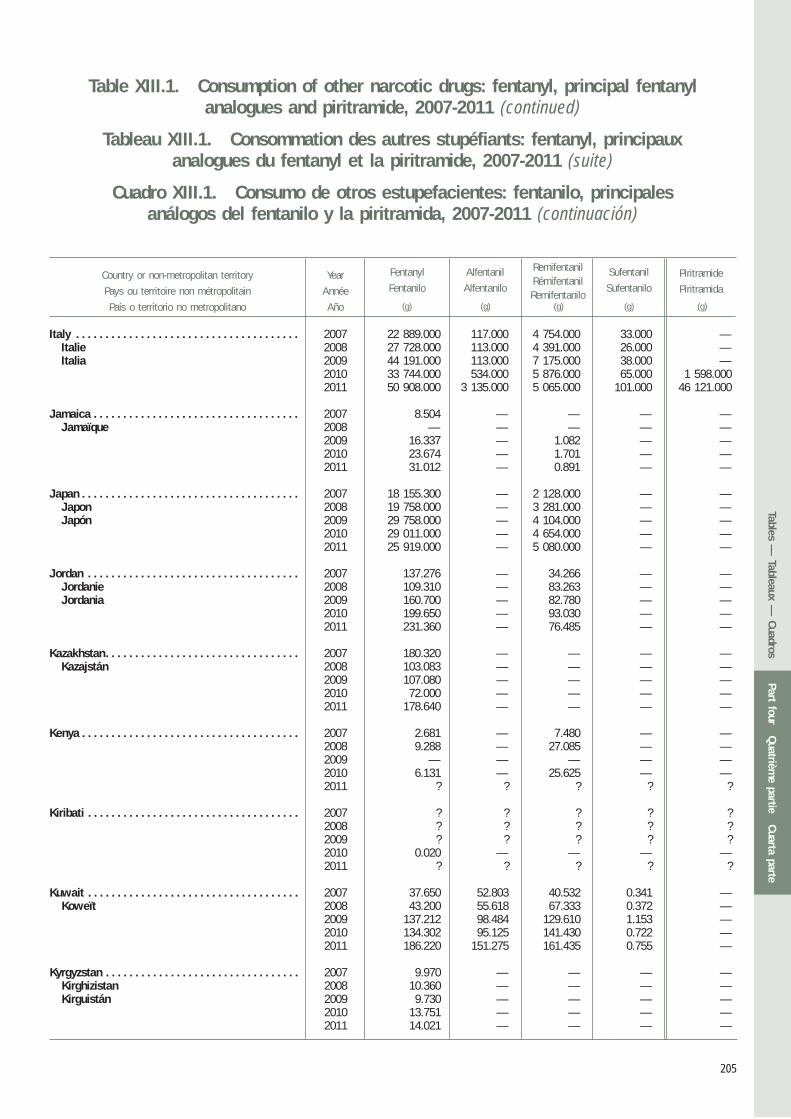
205
Table XIII.1. Consumption of other narcotic drugs: fentanyl, principal fentanyl analogues and piritramide, 2007-2011 (continued)
Tableau XIII.1. Consommation des autres stupéfiants: fentanyl, principaux analogues du fentanyl et la piritramide, 2007-2011 (suite)
Cuadro XIII.1. Consumo de otros estupefacientes: fentanilo, principales análogos del fentanilo y la piritramida, 2007-2011 (continuación)
Country or non-metropolitan territory
Pays ou territoire non métropolitain
País o territorio no metropolitano
Year
Année
Año
Alfentanil
Alfentanilo
Fentanyl
FentaniloPiritramide
Piritramida
RemifentanilRémifentanilRemifentanilo
Sufentanil
Sufentanilo
(g) (g) (g) (g) (g)
Italy . . . . . . . . . . . . . . . . . . . . . . . . . . . . . . . . . . . . . . 2007 22 889.000 117.000 4 754.000 33.000 —Italie 2008 27 728.000 113.000 4 391.000 26.000 —Italia 2009 44 191.000 113.000 7 175.000 38.000 —
2010 33 744.000 534.000 5 876.000 65.000 1 598.0002011 50 908.000 3 135.000 5 065.000 101.000 46 121.000
Jamaica . . . . . . . . . . . . . . . . . . . . . . . . . . . . . . . . . . . 2007 8.504 — — — —Jamaïque 2008 — — — — —
2009 16.337 — 1.082 — —2010 23.674 — 1.701 — —2011 31.012 — 0.891 — —
Japan . . . . . . . . . . . . . . . . . . . . . . . . . . . . . . . . . . . . . 2007 18 155.300 — 2 128.000 — —Japon 2008 19 758.000 — 3 281.000 — —Japón 2009 29 758.000 — 4 104.000 — —
2010 29 011.000 — 4 654.000 — —2011 25 919.000 — 5 080.000 — —
Jordan . . . . . . . . . . . . . . . . . . . . . . . . . . . . . . . . . . . . 2007 137.276 — 34.266 — —Jordanie 2008 109.310 — 83.263 — —Jordania 2009 160.700 — 82.780 — —
2010 199.650 — 93.030 — —2011 231.360 — 76.485 — —
Kazakhstan. . . . . . . . . . . . . . . . . . . . . . . . . . . . . . . . . 2007 180.320 — — — —Kazajstán 2008 103.083 — — — —
2009 107.080 — — — —2010 72.000 — — — —2011 178.640 — — — —
Kenya . . . . . . . . . . . . . . . . . . . . . . . . . . . . . . . . . . . . . 2007 2.681 — 7.480 — —2008 9.288 — 27.085 — —2009 — — — — —2010 6.131 — 25.625 — —2011 ? ? ? ? ?
Kiribati . . . . . . . . . . . . . . . . . . . . . . . . . . . . . . . . . . . . 2007 ? ? ? ? ?2008 ? ? ? ? ?2009 ? ? ? ? ?2010 0.020 — — — —2011 ? ? ? ? ?
Kuwait . . . . . . . . . . . . . . . . . . . . . . . . . . . . . . . . . . . . 2007 37.650 52.803 40.532 0.341 —Koweït 2008 43.200 55.618 67.333 0.372 —
2009 137.212 98.484 129.610 1.153 —2010 134.302 95.125 141.430 0.722 —2011 186.220 151.275 161.435 0.755 —
Kyrgyzstan . . . . . . . . . . . . . . . . . . . . . . . . . . . . . . . . . 2007 9.970 — — — —Kirghizistan 2008 10.360 — — — —Kirguistán 2009 9.730 — — — —
2010 13.751 — — — —2011 14.021 — — — —
Part fourQuatrièm
e partieCuarta parte
Tables — Tableaux —
Cuadros
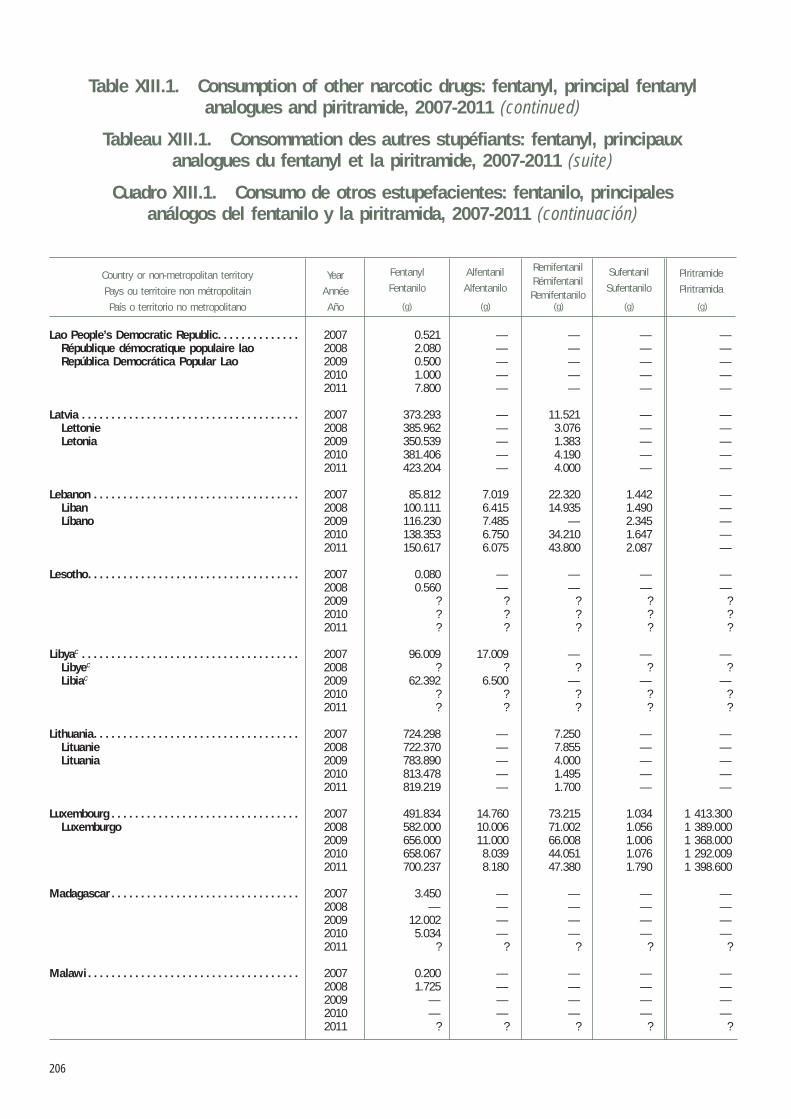
206
Table XIII.1. Consumption of other narcotic drugs: fentanyl, principal fentanyl analogues and piritramide, 2007-2011 (continued)
Tableau XIII.1. Consommation des autres stupéfiants: fentanyl, principaux analogues du fentanyl et la piritramide, 2007-2011 (suite)
Cuadro XIII.1. Consumo de otros estupefacientes: fentanilo, principales análogos del fentanilo y la piritramida, 2007-2011 (continuación)
Country or non-metropolitan territory
Pays ou territoire non métropolitain
País o territorio no metropolitano
Year
Année
Año
Alfentanil
Alfentanilo
Fentanyl
FentaniloPiritramide
Piritramida
RemifentanilRémifentanilRemifentanilo
Sufentanil
Sufentanilo
(g) (g) (g) (g) (g)
Lao People’s Democratic Republic. . . . . . . . . . . . . . 2007 0.521 — — — —République démocratique populaire lao 2008 2.080 — — — —República Democrática Popular Lao 2009 0.500 — — — —
2010 1.000 — — — —2011 7.800 — — — —
Latvia . . . . . . . . . . . . . . . . . . . . . . . . . . . . . . . . . . . . . 2007 373.293 — 11.521 — —Lettonie 2008 385.962 — 3.076 — —Letonia 2009 350.539 — 1.383 — —
2010 381.406 — 4.190 — —2011 423.204 — 4.000 — —
Lebanon . . . . . . . . . . . . . . . . . . . . . . . . . . . . . . . . . . . 2007 85.812 7.019 22.320 1.442 —Liban 2008 100.111 6.415 14.935 1.490 —Líbano 2009 116.230 7.485 — 2.345 —
2010 138.353 6.750 34.210 1.647 —2011 150.617 6.075 43.800 2.087 —
Lesotho. . . . . . . . . . . . . . . . . . . . . . . . . . . . . . . . . . . . 2007 0.080 — — — —2008 0.560 — — — —2009 ? ? ? ? ?2010 ? ? ? ? ?2011 ? ? ? ? ?
Libyac . . . . . . . . . . . . . . . . . . . . . . . . . . . . . . . . . . . . . 2007 96.009 17.009 — — —Libyec 2008 ? ? ? ? ?Libiac 2009 62.392 6.500 — — —
2010 ? ? ? ? ?2011 ? ? ? ? ?
Lithuania. . . . . . . . . . . . . . . . . . . . . . . . . . . . . . . . . . . 2007 724.298 — 7.250 — —Lituanie 2008 722.370 — 7.855 — —Lituania 2009 783.890 — 4.000 — —
2010 813.478 — 1.495 — —2011 819.219 — 1.700 — —
Luxembourg . . . . . . . . . . . . . . . . . . . . . . . . . . . . . . . . 2007 491.834 14.760 73.215 1.034 1 413.300Luxemburgo 2008 582.000 10.006 71.002 1.056 1 389.000
2009 656.000 11.000 66.008 1.006 1 368.0002010 658.067 8.039 44.051 1.076 1 292.0092011 700.237 8.180 47.380 1.790 1 398.600
Madagascar . . . . . . . . . . . . . . . . . . . . . . . . . . . . . . . . 2007 3.450 — — — —2008 — — — — —2009 12.002 — — — —2010 5.034 — — — —2011 ? ? ? ? ?
Malawi . . . . . . . . . . . . . . . . . . . . . . . . . . . . . . . . . . . . 2007 0.200 — — — —2008 1.725 — — — —2009 — — — — —2010 — — — — —2011 ? ? ? ? ?
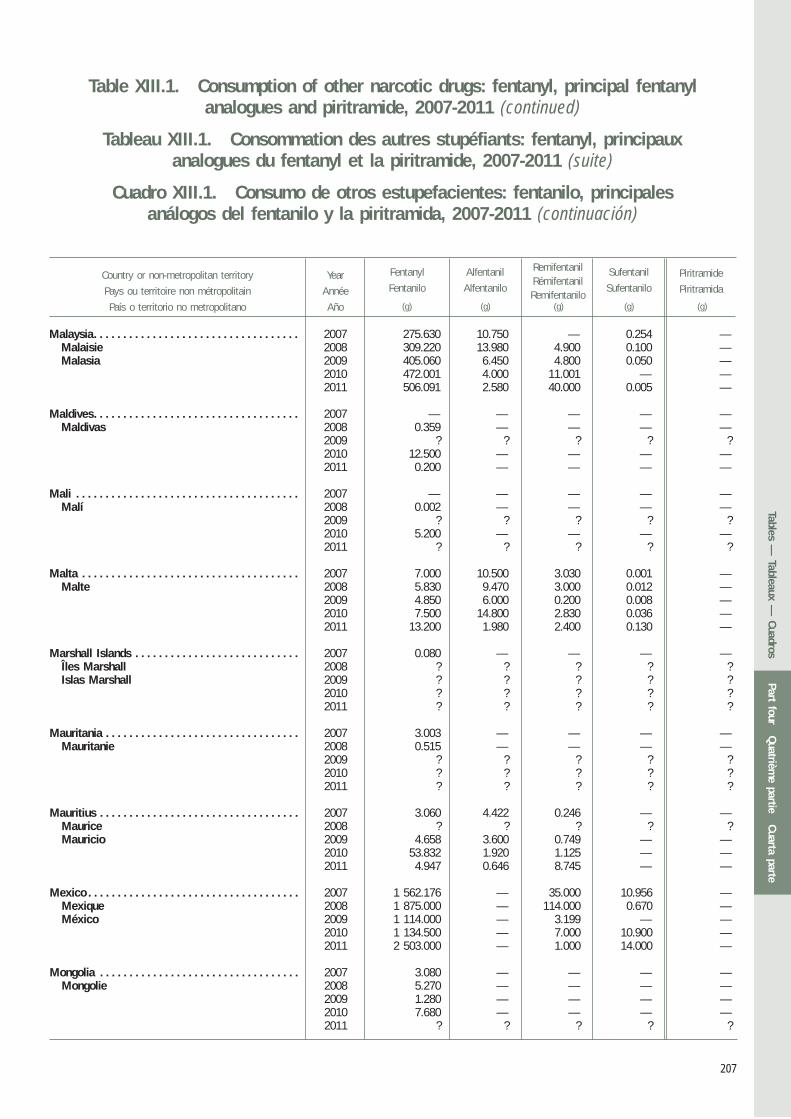
207
Table XIII.1. Consumption of other narcotic drugs: fentanyl, principal fentanyl analogues and piritramide, 2007-2011 (continued)
Tableau XIII.1. Consommation des autres stupéfiants: fentanyl, principaux analogues du fentanyl et la piritramide, 2007-2011 (suite)
Cuadro XIII.1. Consumo de otros estupefacientes: fentanilo, principales análogos del fentanilo y la piritramida, 2007-2011 (continuación)
Country or non-metropolitan territory
Pays ou territoire non métropolitain
País o territorio no metropolitano
Year
Année
Año
Alfentanil
Alfentanilo
Fentanyl
FentaniloPiritramide
Piritramida
RemifentanilRémifentanilRemifentanilo
Sufentanil
Sufentanilo
(g) (g) (g) (g) (g)
Malaysia. . . . . . . . . . . . . . . . . . . . . . . . . . . . . . . . . . . 2007 275.630 10.750 — 0.254 —Malaisie 2008 309.220 13.980 4.900 0.100 —Malasia 2009 405.060 6.450 4.800 0.050 —
2010 472.001 4.000 11.001 — —2011 506.091 2.580 40.000 0.005 —
Maldives. . . . . . . . . . . . . . . . . . . . . . . . . . . . . . . . . . . 2007 — — — — —Maldivas 2008 0.359 — — — —
2009 ? ? ? ? ?2010 12.500 — — — —2011 0.200 — — — —
Mali . . . . . . . . . . . . . . . . . . . . . . . . . . . . . . . . . . . . . . 2007 — — — — —Malí 2008 0.002 — — — —
2009 ? ? ? ? ?2010 5.200 — — — —2011 ? ? ? ? ?
Malta . . . . . . . . . . . . . . . . . . . . . . . . . . . . . . . . . . . . . 2007 7.000 10.500 3.030 0.001 —Malte 2008 5.830 9.470 3.000 0.012 —
2009 4.850 6.000 0.200 0.008 —2010 7.500 14.800 2.830 0.036 —2011 13.200 1.980 2.400 0.130 —
Marshall Islands . . . . . . . . . . . . . . . . . . . . . . . . . . . . 2007 0.080 — — — —Îles Marshall 2008 ? ? ? ? ?Islas Marshall 2009 ? ? ? ? ?
2010 ? ? ? ? ?2011 ? ? ? ? ?
Mauritania . . . . . . . . . . . . . . . . . . . . . . . . . . . . . . . . . 2007 3.003 — — — —Mauritanie 2008 0.515 — — — —
2009 ? ? ? ? ?2010 ? ? ? ? ?2011 ? ? ? ? ?
Mauritius . . . . . . . . . . . . . . . . . . . . . . . . . . . . . . . . . . 2007 3.060 4.422 0.246 — —Maurice 2008 ? ? ? ? ?Mauricio 2009 4.658 3.600 0.749 — —
2010 53.832 1.920 1.125 — —2011 4.947 0.646 8.745 — —
Mexico . . . . . . . . . . . . . . . . . . . . . . . . . . . . . . . . . . . . 2007 1 562.176 — 35.000 10.956 —Mexique 2008 1 875.000 — 114.000 0.670 —México 2009 1 114.000 — 3.199 — —
2010 1 134.500 — 7.000 10.900 —2011 2 503.000 — 1.000 14.000 —
Mongolia . . . . . . . . . . . . . . . . . . . . . . . . . . . . . . . . . . 2007 3.080 — — — —Mongolie 2008 5.270 — — — —
2009 1.280 — — — —2010 7.680 — — — —2011 ? ? ? ? ?
Part fourQuatrièm
e partieCuarta parte
Tables — Tableaux —
Cuadros
208
Table XIII.1. Consumption of other narcotic drugs: fentanyl, principal fentanyl analogues and piritramide, 2007-2011 (continued)
Tableau XIII.1. Consommation des autres stupéfiants: fentanyl, principaux analogues du fentanyl et la piritramide, 2007-2011 (suite)
Cuadro XIII.1. Consumo de otros estupefacientes: fentanilo, principales análogos del fentanilo y la piritramida, 2007-2011 (continuación)
Country or non-metropolitan territory
Pays ou territoire non métropolitain
País o territorio no metropolitano
Year
Année
Año
Alfentanil
Alfentanilo
Fentanyl
FentaniloPiritramide
Piritramida
RemifentanilRémifentanilRemifentanilo
Sufentanil
Sufentanilo
(g) (g) (g) (g) (g)
Montenegro . . . . . . . . . . . . . . . . . . . . . . . . . . . . . . . . 2007 50.178 8.712 — — —Monténégro 2008 174.354 6.000 2.055 — —
2009 151.600 5.800 10.125 — —2010 167.116 3.750 — — —2011 215.075 11.250 12.150 — —
Montserrat . . . . . . . . . . . . . . . . . . . . . . . . . . . . . . . . . 2007 — — — — —2008 — — — — —2009 0.001 — — — —2010 — — — — —2011 — — — — —
Morocco. . . . . . . . . . . . . . . . . . . . . . . . . . . . . . . . . . . 2007 121.839 33.725 — 3.700 —Maroc 2008 200.000 39.000 — 1.463 —Marruecos 2009 204.324 16.425 6.000 3.661 —
2010 262.517 18.055 18.300 4.814 —2011 112.639 9.945 16.060 1.241 —
Mozambique. . . . . . . . . . . . . . . . . . . . . . . . . . . . . . . . 2007 26.500 — — — —2008 — — — — —2009 — — — — —2010 26.005 — — — —2011 6.396 — — — —
Myanmar . . . . . . . . . . . . . . . . . . . . . . . . . . . . . . . . . . 2007 — — — — —2008 1.000 — — — —2009 1.000 — — — —2010 1.000 — — — —2011 . . — — — —
Namibia . . . . . . . . . . . . . . . . . . . . . . . . . . . . . . . . . . . 2007 8.040 3.005 1.000 0.048 —Namibie 2008 20.905 5.325 1.004 0.233 —
2009 — — — — —2010 31.908 2.225 6.529 0.207 —2011 ? ? ? ? ?
Nauru . . . . . . . . . . . . . . . . . . . . . . . . . . . . . . . . . . . . . 2007 ? ? ? ? ?2008 0.029 — — — —2009 — — — — —2010 ? ? ? ? ?2011 ? ? ? ? ?
Nepal . . . . . . . . . . . . . . . . . . . . . . . . . . . . . . . . . . . . . 2007 0.001 — — — —Népal 2008 0.500 — — — —
2009 9.200 — — — —2010 9.600 — — — —2011 17.320 — — — —
209
Table XIII.1. Consumption of other narcotic drugs: fentanyl, principal fentanyl analogues and piritramide, 2007-2011 (continued)
Tableau XIII.1. Consommation des autres stupéfiants: fentanyl, principaux analogues du fentanyl et la piritramide, 2007-2011 (suite)
Cuadro XIII.1. Consumo de otros estupefacientes: fentanilo, principales análogos del fentanilo y la piritramida, 2007-2011 (continuación)
Country or non-metropolitan territory
Pays ou territoire non métropolitain
País o territorio no metropolitano
Year
Année
Año
Alfentanil
Alfentanilo
Fentanyl
FentaniloPiritramide
Piritramida
RemifentanilRémifentanilRemifentanilo
Sufentanil
Sufentanilo
(g) (g) (g) (g) (g)
Netherlands . . . . . . . . . . . . . . . . . . . . . . . . . . . . . . . . 2007 24 846.520 227.112 338.915 46.036 11 061.000Pays-Bas 2008 13 270.757 212.750 368.227 55.860 11 788.000Países Bajos 2009 30 778.439 207.212 408.564 74.379 12 325.000
2010 14 118.443 185.558 476.599 63.397 14 827.0002011 28 873.679 180.889 573.531 66.379 12 238.600
Netherlands Antillesd . . . . . . . . . . . . . . . . . . . . . . . . 2007 45.207 0.044 0.850 0.150 90.000Antilles néerlandaisesd 2008 53.695 0.039 1.350 0.275 180.000Antillas Neerlandesasd 2009 25.231 — 1.200 0.190 120.400
2010 2011
New Caledonia . . . . . . . . . . . . . . . . . . . . . . . . . . . . . 2007 94.291 0.954 5.444 1.550 —Nouvelle-Calédonie 2008 120.478 0.597 5.945 1.604 —Nueva Caledonia 2009 100.319 0.420 7.019 1.807 —
2010 108.263 0.402 7.519 1.386 —2011 118.543 0.339 8.859 1.622 —
New Zealand . . . . . . . . . . . . . . . . . . . . . . . . . . . . . . . 2007 901.938 52.159 26.195 — —Nouvelle-Zélande 2008 — 58.000 20.000 — —Nueva Zelandia 2009 785.000 53.000 — — —
2010 1 725.070 42.450 50.000 — —2011 983.013 43.600 48.200 — —
Nicaragua. . . . . . . . . . . . . . . . . . . . . . . . . . . . . . . . . . 2007 25.810 — — — —2008 65.650 — — — —2009 16.366 — — — —2010 48.694 — — — —2011 28.435 — — — —
Niger. . . . . . . . . . . . . . . . . . . . . . . . . . . . . . . . . . . . . . 2007 2.160 — — — —Níger 2008 1.105 — — — —
2009 9.986 — — — —2010 ? ? ? ? ?2011 ? ? ? ? ?
Nigeria . . . . . . . . . . . . . . . . . . . . . . . . . . . . . . . . . . . . 2007 ? ? ? ? ?Nigéria 2008 8.000 — — — —
2009 ? ? ? ? ?2010 ? ? ? ? ?2011 — — — — —
Norfolk Island . . . . . . . . . . . . . . . . . . . . . . . . . . . . . . 2007 — — — — —Île Norfolk 2008 1.228 — — — —Isla Norfolk 2009 2.373 — — — —
2010 2.134 — — — —2011 2.301 — — — —
Part fourQuatrièm
e partieCuarta parte
Tables — Tableaux —
Cuadros
210
Table XIII.1. Consumption of other narcotic drugs: fentanyl, principal fentanyl analogues and piritramide, 2007-2011 (continued)
Tableau XIII.1. Consommation des autres stupéfiants: fentanyl, principaux analogues du fentanyl et la piritramide, 2007-2011 (suite)
Cuadro XIII.1. Consumo de otros estupefacientes: fentanilo, principales análogos del fentanilo y la piritramida, 2007-2011 (continuación)
Country or non-metropolitan territory
Pays ou territoire non métropolitain
País o territorio no metropolitano
Year
Année
Año
Alfentanil
Alfentanilo
Fentanyl
FentaniloPiritramide
Piritramida
RemifentanilRémifentanilRemifentanilo
Sufentanil
Sufentanilo
(g) (g) (g) (g) (g)
Norway. . . . . . . . . . . . . . . . . . . . . . . . . . . . . . . . . . . . 2007 5 029.180 173.475 250.645 1.147 6.750Norvège 2008 5 558.534 173.225 289.380 0.968 5.250Noruega 2009 5 380.950 177.340 322.375 0.987 6.750
2010 5 910.607 180.105 332.160 0.865 9.7502011 6 330.682 181.115 371.200 1.015 —
Oman . . . . . . . . . . . . . . . . . . . . . . . . . . . . . . . . . . . . . 2007 5.757 — — 3.654 —Omán 2008 7.868 — 1.164 — —
2009 40.001 — 8.001 — —2010 36.225 0.106 9.200 — —2011 84.451 — 14.600 — —
Pakistan . . . . . . . . . . . . . . . . . . . . . . . . . . . . . . . . . . . 2007 42.497 — — — —Pakistán 2008 53.000 — — — —
2009 70.540 — — — —2010 ? ? ? ? ?2011 . . — — — —
Palau. . . . . . . . . . . . . . . . . . . . . . . . . . . . . . . . . . . . . . 2007 — 0.004 — — —Palaos 2008 0.019 — — — —
2009 0.002 — — — —2010 2.600 — — — —2011 2.000 — — — —
Panama. . . . . . . . . . . . . . . . . . . . . . . . . . . . . . . . . . . . 2007 69.880 — — — —Panamá 2008 70.668 — — — —
2009 78.843 — — — —2010 119.336 — 2.060 — —2011 210.036 — — — —
Papua New Guinea . . . . . . . . . . . . . . . . . . . . . . . . . . 2007 0.072 — — — —Papouasie-Nouvelle-Guinée 2008 ? ? ? ? ?Papua Nueva Guinea 2009 ? ? ? ? ?
2010 ? ? ? ? ?2011 ? ? ? ? ?
Paraguay . . . . . . . . . . . . . . . . . . . . . . . . . . . . . . . . . . 2007 35.000 — — — —2008 40.000 — — — —2009 35.000 5.000 5.000 — —2010 ? ? ? ? ?2011 ? ? ? ? ?
Peru . . . . . . . . . . . . . . . . . . . . . . . . . . . . . . . . . . . . . . 2007 149.121 — 46.390 — —Pérou 2008 157.009 — 75.008 — —Perú 2009 172.185 — 102.002 — —
2010 273.735 — 119.593 — —2011 199.873 — 117.640 — —
211
Table XIII.1. Consumption of other narcotic drugs: fentanyl, principal fentanyl analogues and piritramide, 2007-2011 (continued)
Tableau XIII.1. Consommation des autres stupéfiants: fentanyl, principaux analogues du fentanyl et la piritramide, 2007-2011 (suite)
Cuadro XIII.1. Consumo de otros estupefacientes: fentanilo, principales análogos del fentanilo y la piritramida, 2007-2011 (continuación)
Country or non-metropolitan territory
Pays ou territoire non métropolitain
País o territorio no metropolitano
Year
Année
Año
Alfentanil
Alfentanilo
Fentanyl
FentaniloPiritramide
Piritramida
RemifentanilRémifentanilRemifentanilo
Sufentanil
Sufentanilo
(g) (g) (g) (g) (g)
Philippines . . . . . . . . . . . . . . . . . . . . . . . . . . . . . . . . . 2007 77.675 — — — —Filipinas 2008 — — — — —
2009 140.620 — — — —2010 169.682 — — — —2011 201.671 — — — —
Poland. . . . . . . . . . . . . . . . . . . . . . . . . . . . . . . . . . . . . 2007 15 617.358 0.721 56.124 1.896 —Pologne 2008 14 959.828 0.906 81.991 7.973 —Polonia 2009 21 360.804 0.801 92.456 3.036 —
2010 10 555.970 — 93.612 7.677 —2011 10 049.319 0.977 106.925 11.360 —
Portugal . . . . . . . . . . . . . . . . . . . . . . . . . . . . . . . . . . . 2007 3 284.424 316.727 137.980 48.438 —2008 4 750.634 268.701 144.370 6.225 —2009 1 966.559 305.401 175.790 31.744 —2010 3 705.857 277.093 189.087 21.349 —2011 2 936.736 388.140 255.654 13.146 —
Qatar. . . . . . . . . . . . . . . . . . . . . . . . . . . . . . . . . . . . . . 2007 15.393 — 73.140 — —2008 16.852 — 123.022 — —2009 20.547 — 90.016 — —2010 29.027 — 104.000 — —2011 33.262 — 63.510 — —
Republic of Korea . . . . . . . . . . . . . . . . . . . . . . . . . . . 2007 5 973.300 360.550 273.090 2.010 —République de Corée 2008 11 310.055 134.364 544.913 13.417 —República de Corea 2009 16 524.021 263.120 448.222 6.210 —
2010 19 617.246 217.040 899.480 7.050 —2011 16 264.375 412.320 1 255.111 1.660 —
Republic of Moldovae . . . . . . . . . . . . . . . . . . . . . . . . 2007 34.523 — — — —République de Moldovae 2008 16.276 — — — —República de Moldovae 2009 29.578 — — — —
2010 24.500 — — — —2011 32.061 — — — —
Romania . . . . . . . . . . . . . . . . . . . . . . . . . . . . . . . . . . . 2007 — — — — —Roumanie 2008 485.377 — 27.900 1.505 —Rumania 2009 843.727 — 19.480 0.724 —
2010 — — — — —2011 — — — — —
Russian Federation . . . . . . . . . . . . . . . . . . . . . . . . . . 2007 2 102.714 — — — —Fédération de Russie 2008 1 980.520 — — — —Federación de Rusia 2009 3 036.983 — — — —
2010 1 933.323 — — — —2011 2 854.365 — — — —
Part fourQuatrièm
e partieCuarta parte
Tables — Tableaux —
Cuadros
212
Table XIII.1. Consumption of other narcotic drugs: fentanyl, principal fentanyl analogues and piritramide, 2007-2011 (continued)
Tableau XIII.1. Consommation des autres stupéfiants: fentanyl, principaux analogues du fentanyl et la piritramide, 2007-2011 (suite)
Cuadro XIII.1. Consumo de otros estupefacientes: fentanilo, principales análogos del fentanilo y la piritramida, 2007-2011 (continuación)
Country or non-metropolitan territory
Pays ou territoire non métropolitain
País o territorio no metropolitano
Year
Année
Año
Alfentanil
Alfentanilo
Fentanyl
FentaniloPiritramide
Piritramida
RemifentanilRémifentanilRemifentanilo
Sufentanil
Sufentanilo
(g) (g) (g) (g) (g)
Rwanda . . . . . . . . . . . . . . . . . . . . . . . . . . . . . . . . . . . 2007 ? ? ? ? ?2008 0.001 — — — —2009 ? ? ? ? ?2010 ? ? ? ? ?2011 ? ? ? ? ?
Saint Helena . . . . . . . . . . . . . . . . . . . . . . . . . . . . . . . 2007 0.032 0.040 — — —Sainte-Hélène 2008 0.029 0.020 — — —Santa Elena 2009 0.026 0.010 — — —
2010 ? ? ? ? ?2011 0.012 0.030 — — —
Saint Lucia . . . . . . . . . . . . . . . . . . . . . . . . . . . . . . . . . 2007 0.021 — — — —Sainte-Lucie 2008 0.015 — — — —Santa Lucía 2009 0.044 — — — —
2010 0.019 — — — —2011 ? ? ? ? ?
Saint Vincent and the Grenadines . . . . . . . . . . . . . . 2007 0.069 — — — —Saint-Vincent-et-les Grenadines 2008 0.080 — — — —San Vicente y las Granadinas 2009 0.174 — — — —
2010 0.211 — — — —2011 0.540 — — — —
Samoa . . . . . . . . . . . . . . . . . . . . . . . . . . . . . . . . . . . . 2007 0.076 — — — —2008 0.076 — — — —2009 ? ? ? ? ?2010 ? ? ? ? ?2011 0.124 — — — —
Sao Tome and Principe. . . . . . . . . . . . . . . . . . . . . . . 2007 0.210 — — — —Sao Tomé-et-Principe 2008 0.252 — — — —Santo Tomé y Príncipe 2009 0.398 — — — —
2010 ? ? ? ? ?2011 — — — — —
Saudi Arabia . . . . . . . . . . . . . . . . . . . . . . . . . . . . . . . 2007 690.952 9.228 16.152 0.420 —Arabie saoudite 2008 697.067 10.491 11.215 0.642 —Arabia Saudita 2009 819.920 8.902 3.464 1.885 —
2010 1 174.768 1.002 10.914 0.158 —2011 1 119.786 1.002 35.845 0.909 —
Senegal . . . . . . . . . . . . . . . . . . . . . . . . . . . . . . . . . . . 2007 1.000 — — 0.003 —Sénégal 2008 ? ? ? ? ?
2009 2.000 — — 0.003 —2010 ? ? ? ? ?2011 ? ? ? ? ?
213
Table XIII.1. Consumption of other narcotic drugs: fentanyl, principal fentanyl analogues and piritramide, 2007-2011 (continued)
Tableau XIII.1. Consommation des autres stupéfiants: fentanyl, principaux analogues du fentanyl et la piritramide, 2007-2011 (suite)
Cuadro XIII.1. Consumo de otros estupefacientes: fentanilo, principales análogos del fentanilo y la piritramida, 2007-2011 (continuación)
Country or non-metropolitan territory
Pays ou territoire non métropolitain
País o territorio no metropolitano
Year
Année
Año
Alfentanil
Alfentanilo
Fentanyl
FentaniloPiritramide
Piritramida
RemifentanilRémifentanilRemifentanilo
Sufentanil
Sufentanilo
(g) (g) (g) (g) (g)
Serbia . . . . . . . . . . . . . . . . . . . . . . . . . . . . . . . . . . . . . 2007 3 102.258 134.000 15.307 1.750 —Serbie 2008 2 557.000 82.500 29.550 8.965 —
2009 2 401.946 52.500 69.950 0.015 —2010 2 609.400 95.000 15.270 0.632 —2011 2 577.878 12.500 1 140.270 2.246 —
Seychelles . . . . . . . . . . . . . . . . . . . . . . . . . . . . . . . . . 2007 0.409 — — — —2008 0.300 — — — —2009 0.348 — — — —2010 0.655 — — — —2011 0.540 — — — —
Sierra Leone . . . . . . . . . . . . . . . . . . . . . . . . . . . . . . . 2007 0.008 — — — —Sierra Leona 2008 ? ? ? ? ?
2009 ? ? ? ? ?2010 ? ? ? ? ?2011 ? ? ? ? ?
Singapore . . . . . . . . . . . . . . . . . . . . . . . . . . . . . . . . . . 2007 88.987 4.876 2.120 0.534 —Singapour 2008 144.727 3.999 3.667 — —Singapur 2009 126.425 5.666 6.205 — —
2010 314.241 8.400 7.140 — —2011 316.283 7.065 9.410 0.100 —
Sint Maartend . . . . . . . . . . . . . . . . . . . . . . . . . . . . . . 2007 Saint-Martind 2008 San Martínd 2009
2010 ? ? ? ? ?2011 5.477 — 0.070 0.010 17.000
Slovakia . . . . . . . . . . . . . . . . . . . . . . . . . . . . . . . . . . . 2007 3 924.080 0.250 6.290 10.710 —Slovaquie 2008 2 988.000 0.250 7.073 10.383 76.005Eslovaquia 2009 3 320.071 — 8.600 12.785 3.000
2010 3 102.714 — 18.760 15.763 —2011 4 511.560 — 12.930 11.810 47.500
Slovenia . . . . . . . . . . . . . . . . . . . . . . . . . . . . . . . . . . . 2007 2 019.940 16.700 139.360 0.110 2 522.560Slovénie 2008 1 360.720 16.900 488.250 0.020 3 214.130Eslovenia 2009 2 829.760 20.400 1 456.180 0.480 3 015.000
2010 1 452.940 16.000 115.460 0.060 2 415.0002011 1 378.950 — 53.600 0.460 —
South Africa. . . . . . . . . . . . . . . . . . . . . . . . . . . . . . . . 2007 970.945 290.350 0.372 2.573 —Afrique du Sud 2008 1 257.202 278.260 463.950 1.171 —Sudáfrica 2009 6 302.261 337.032 387.812 6.410 —
2010 15 104.271 245.425 627.464 7.507 —2011 6 003.000 295.320 934.433 6.838 —
Part fourQuatrièm
e partieCuarta parte
Tables — Tableaux —
Cuadros
214
Table XIII.1. Consumption of other narcotic drugs: fentanyl, principal fentanyl analogues and piritramide, 2007-2011 (continued)
Tableau XIII.1. Consommation des autres stupéfiants: fentanyl, principaux analogues du fentanyl et la piritramide, 2007-2011 (suite)
Cuadro XIII.1. Consumo de otros estupefacientes: fentanilo, principales análogos del fentanilo y la piritramida, 2007-2011 (continuación)
Country or non-metropolitan territory
Pays ou territoire non métropolitain
País o territorio no metropolitano
Year
Année
Año
Alfentanil
Alfentanilo
Fentanyl
FentaniloPiritramide
Piritramida
RemifentanilRémifentanilRemifentanilo
Sufentanil
Sufentanilo
(g) (g) (g) (g) (g)
Spain . . . . . . . . . . . . . . . . . . . . . . . . . . . . . . . . . . . . . 2007 63 993.000 156.085 1 997.275 — —Espagne 2008 81 170.000 218.125 2 156.000 — —España 2009 71 758.000 155.000 1 759.000 — —
2010 92 144.000 235.000 1 983.000 — —2011 85 128.000 140.000 1 673.000 0.034 —
Sri Lanka . . . . . . . . . . . . . . . . . . . . . . . . . . . . . . . . . . 2007 15.516 — — — —2008 5.590 — — — —2009 17.908 — — — —2010 16.984 — — — —2011 18.114 — 0.164 — —
Sudan . . . . . . . . . . . . . . . . . . . . . . . . . . . . . . . . . . . . . 2007 — — — — —Soudan 2008 0.312 — — — —Sudán 2009 ? ? ? ? ?
2010 ? ? ? ? ?2011 ? ? ? ? ?
Suriname . . . . . . . . . . . . . . . . . . . . . . . . . . . . . . . . . . 2007 0.987 — — — —2008 1.835 — — — —2009 0.690 — — — —2010 ? ? ? ? ?2011 ? ? ? ? ?
Sweden . . . . . . . . . . . . . . . . . . . . . . . . . . . . . . . . . . . 2007 8 877.000 276.000 170.000 7.000 —Suède 2008 10 956.000 277.000 226.000 9.000 —Suecia 2009 8 332.000 281.000 278.000 6.000 —
2010 10 927.000 314.000 350.000 11.690 0.0012011 11 564.000 265.000 416.000 8.800 —
Switzerland . . . . . . . . . . . . . . . . . . . . . . . . . . . . . . . . 2007 11 766.373 141.318 340.154 6.937 —Suisse 2008 11 693.626 143.663 377.688 8.558 3.000Suiza 2009 13 056.109 37.996 422.082 0.366 —
2010 15 001.889 133.473 441.491 8.884 —2011 14 781.448 125.871 470.863 9.887 100.000
Syrian Arab Republic . . . . . . . . . . . . . . . . . . . . . . . . 2007 35.312 — 40.800 — —République arabe syrienne 2008 138.299 — 84.650 — —República Árabe Siria 2009 104.209 — 69.890 — —
2010 83.862 — 180.040 — —2011 169.314 — 141.030 — —
Tajikistan . . . . . . . . . . . . . . . . . . . . . . . . . . . . . . . . . . 2007 3.620 — — — —Tadjikistan 2008 2.939 — — — —Tayikistán 2009 2.142 — — — —
2010 2.409 — — — —2011 2.030 — — — —
215
Table XIII.1. Consumption of other narcotic drugs: fentanyl, principal fentanyl analogues and piritramide, 2007-2011 (continued)
Tableau XIII.1. Consommation des autres stupéfiants: fentanyl, principaux analogues du fentanyl et la piritramide, 2007-2011 (suite)
Cuadro XIII.1. Consumo de otros estupefacientes: fentanilo, principales análogos del fentanilo y la piritramida, 2007-2011 (continuación)
Country or non-metropolitan territory
Pays ou territoire non métropolitain
País o territorio no metropolitano
Year
Année
Año
Alfentanil
Alfentanilo
Fentanyl
FentaniloPiritramide
Piritramida
RemifentanilRémifentanilRemifentanilo
Sufentanil
Sufentanilo
(g) (g) (g) (g) (g)
Thailand . . . . . . . . . . . . . . . . . . . . . . . . . . . . . . . . . . . 2007 416.018 — — — —Thaïlande 2008 577.342 — — — —Tailandia 2009 497.138 — — — —
2010 899.013 — — — —2011 627.337 — — — —
The former Yugoslav Rep. of Macedonia . . . . . . . . 2007 11.076 3.500 2.150 0.026 —L’ex-Rép. yougoslave de Macédoine 2008 10.784 1.690 0.976 0.120 —La ex Rep. Yugoslava de Macedonia 2009 11.409 0.180 0.884 0.310 —
2010 17.487 1.000 7.078 0.385 —2011 18.728 3.500 4.018 — —
Togo . . . . . . . . . . . . . . . . . . . . . . . . . . . . . . . . . . . . . . 2007 0.740 — — — —2008 1.433 — — — —2009 0.706 — — — —2010 1.700 — — — —2011 2.272 — — — —
Tonga . . . . . . . . . . . . . . . . . . . . . . . . . . . . . . . . . . . . . 2007 0.079 — — — —2008 0.071 — — — —2009 ? ? ? ? ?2010 0.085 — — — —2011 ? ? ? ? ?
Trinidad and Tobago . . . . . . . . . . . . . . . . . . . . . . . . . 2007 5.035 1.012 — — —Trinité-et-Tobago 2008 4.479 0.600 — — —Trinidad y Tabago 2009 ? ? ? ? ?
2010 4.149 0.031 0.010 — —2011 3.689 — — — —
Tristan da Cunha . . . . . . . . . . . . . . . . . . . . . . . . . . . . 2007 — — — — —Tristán da Cunha 2008 ? ? ? ? ?
2009 ? ? ? ? ?2010 ? ? ? ? ?2011 ? ? ? ? ?
Tunisia . . . . . . . . . . . . . . . . . . . . . . . . . . . . . . . . . . . . 2007 119.657 13.890 56.880 1.314 —Tunisie 2008 126.998 12.675 93.770 2.019 —Túnez 2009 153.489 12.850 100.265 1.229 —
2010 165.116 15.170 143.045 1.365 —2011 231.683 11.290 184.600 3.233 —
Turkey. . . . . . . . . . . . . . . . . . . . . . . . . . . . . . . . . . . . . 2007 6 362.196 118.005 508.315 0.289 —Turquie 2008 8 942.381 159.017 635.025 0.314 —Turquía 2009 9 115.312 3.096 525.135 0.183 —
2010 9 450.943 90.075 782.910 0.325 —2011 10 118.896 172.290 1 060.720 0.336 —
Part fourQuatrièm
e partieCuarta parte
Tables — Tableaux —
Cuadros
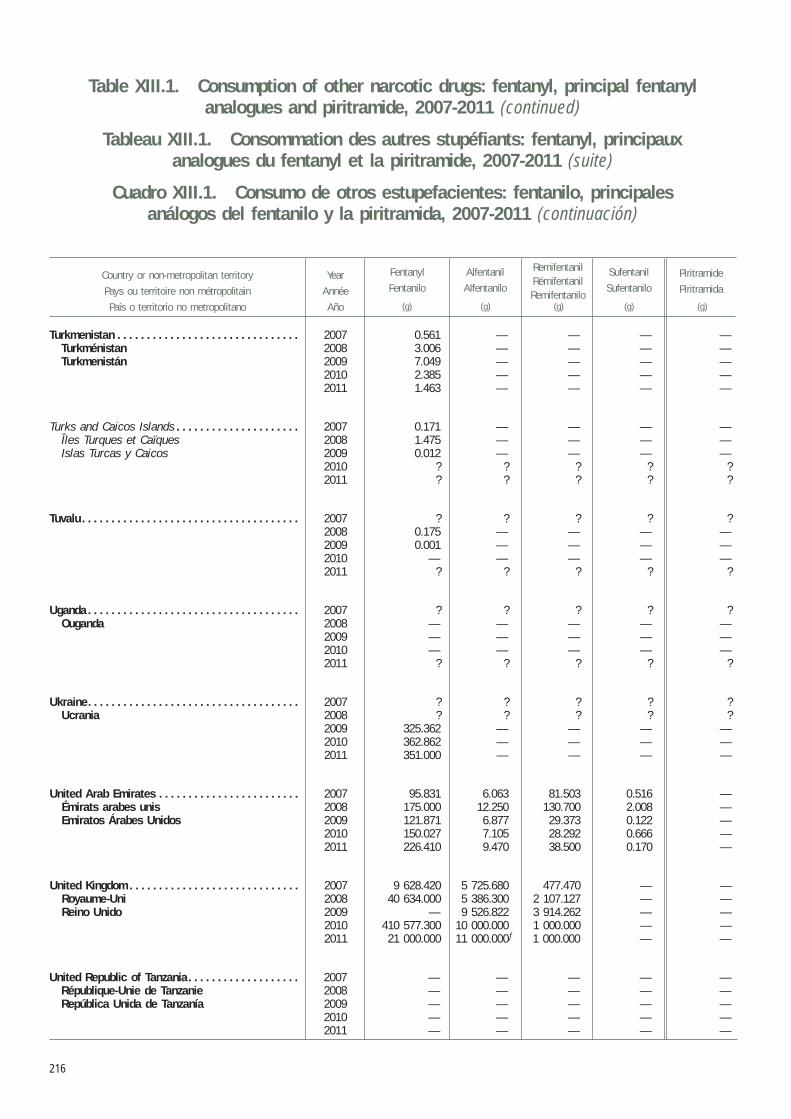
216
Table XIII.1. Consumption of other narcotic drugs: fentanyl, principal fentanyl analogues and piritramide, 2007-2011 (continued)
Tableau XIII.1. Consommation des autres stupéfiants: fentanyl, principaux analogues du fentanyl et la piritramide, 2007-2011 (suite)
Cuadro XIII.1. Consumo de otros estupefacientes: fentanilo, principales análogos del fentanilo y la piritramida, 2007-2011 (continuación)
Country or non-metropolitan territory
Pays ou territoire non métropolitain
País o territorio no metropolitano
Year
Année
Año
Alfentanil
Alfentanilo
Fentanyl
FentaniloPiritramide
Piritramida
RemifentanilRémifentanilRemifentanilo
Sufentanil
Sufentanilo
(g) (g) (g) (g) (g)
Turkmenistan . . . . . . . . . . . . . . . . . . . . . . . . . . . . . . . 2007 0.561 — — — —Turkménistan 2008 3.006 — — — —Turkmenistán 2009 7.049 — — — —
2010 2.385 — — — —2011 1.463 — — — —
Turks and Caicos Islands . . . . . . . . . . . . . . . . . . . . . 2007 0.171 — — — —Îles Turques et Caïques 2008 1.475 — — — —Islas Turcas y Caicos 2009 0.012 — — — —
2010 ? ? ? ? ?2011 ? ? ? ? ?
Tuvalu . . . . . . . . . . . . . . . . . . . . . . . . . . . . . . . . . . . . . 2007 ? ? ? ? ?2008 0.175 — — — —2009 0.001 — — — —2010 — — — — —2011 ? ? ? ? ?
Uganda . . . . . . . . . . . . . . . . . . . . . . . . . . . . . . . . . . . . 2007 ? ? ? ? ?Ouganda 2008 — — — — —
2009 — — — — —2010 — — — — —2011 ? ? ? ? ?
Ukraine. . . . . . . . . . . . . . . . . . . . . . . . . . . . . . . . . . . . 2007 ? ? ? ? ?Ucrania 2008 ? ? ? ? ?
2009 325.362 — — — —2010 362.862 — — — —2011 351.000 — — — —
United Arab Emirates . . . . . . . . . . . . . . . . . . . . . . . . 2007 95.831 6.063 81.503 0.516 —Émirats arabes unis 2008 175.000 12.250 130.700 2.008 —Emiratos Árabes Unidos 2009 121.871 6.877 29.373 0.122 —
2010 150.027 7.105 28.292 0.666 —2011 226.410 9.470 38.500 0.170 —
United Kingdom . . . . . . . . . . . . . . . . . . . . . . . . . . . . . 2007 9 628.420 5 725.680 477.470 — —Royaume-Uni 2008 40 634.000 5 386.300 2 107.127 — —Reino Unido 2009 — 9 526.822 3 914.262 — —
2010 410 577.300 10 000.000 1 000.000 — —2011 21 000.000 11 000.000 f 1 000.000 — —
United Republic of Tanzania . . . . . . . . . . . . . . . . . . . 2007 — — — — —République-Unie de Tanzanie 2008 — — — — —República Unida de Tanzanía 2009 — — — — —
2010 — — — — —2011 — — — — —
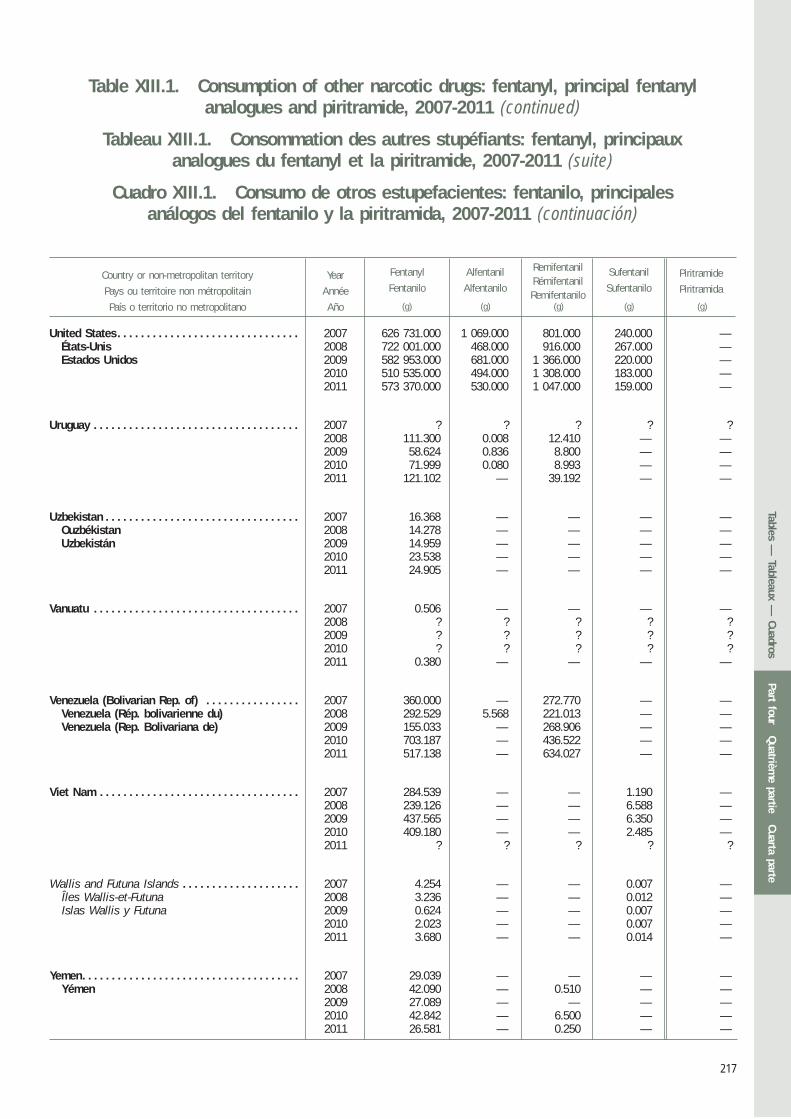
217
Table XIII.1. Consumption of other narcotic drugs: fentanyl, principal fentanyl analogues and piritramide, 2007-2011 (continued)
Tableau XIII.1. Consommation des autres stupéfiants: fentanyl, principaux analogues du fentanyl et la piritramide, 2007-2011 (suite)
Cuadro XIII.1. Consumo de otros estupefacientes: fentanilo, principales análogos del fentanilo y la piritramida, 2007-2011 (continuación)
Country or non-metropolitan territory
Pays ou territoire non métropolitain
País o territorio no metropolitano
Year
Année
Año
Alfentanil
Alfentanilo
Fentanyl
FentaniloPiritramide
Piritramida
RemifentanilRémifentanilRemifentanilo
Sufentanil
Sufentanilo
(g) (g) (g) (g) (g)
United States . . . . . . . . . . . . . . . . . . . . . . . . . . . . . . . 2007 626 731.000 1 069.000 801.000 240.000 —États-Unis 2008 722 001.000 468.000 916.000 267.000 —Estados Unidos 2009 582 953.000 681.000 1 366.000 220.000 —
2010 510 535.000 494.000 1 308.000 183.000 —2011 573 370.000 530.000 1 047.000 159.000 —
Uruguay . . . . . . . . . . . . . . . . . . . . . . . . . . . . . . . . . . . 2007 ? ? ? ? ?2008 111.300 0.008 12.410 — —2009 58.624 0.836 8.800 — —2010 71.999 0.080 8.993 — —2011 121.102 — 39.192 — —
Uzbekistan . . . . . . . . . . . . . . . . . . . . . . . . . . . . . . . . . 2007 16.368 — — — —Ouzbékistan 2008 14.278 — — — —Uzbekistán 2009 14.959 — — — —
2010 23.538 — — — —2011 24.905 — — — —
Vanuatu . . . . . . . . . . . . . . . . . . . . . . . . . . . . . . . . . . . 2007 0.506 — — — —2008 ? ? ? ? ?2009 ? ? ? ? ?2010 ? ? ? ? ?2011 0.380 — — — —
Venezuela (Bolivarian Rep. of) . . . . . . . . . . . . . . . . 2007 360.000 — 272.770 — —Venezuela (Rép. bolivarienne du) 2008 292.529 5.568 221.013 — —Venezuela (Rep. Bolivariana de) 2009 155.033 — 268.906 — —
2010 703.187 — 436.522 — —2011 517.138 — 634.027 — —
Viet Nam . . . . . . . . . . . . . . . . . . . . . . . . . . . . . . . . . . 2007 284.539 — — 1.190 —2008 239.126 — — 6.588 —2009 437.565 — — 6.350 —2010 409.180 — — 2.485 —2011 ? ? ? ? ?
Wallis and Futuna Islands . . . . . . . . . . . . . . . . . . . . 2007 4.254 — — 0.007 —Îles Wallis-et-Futuna 2008 3.236 — — 0.012 —Islas Wallis y Futuna 2009 0.624 — — 0.007 —
2010 2.023 — — 0.007 —2011 3.680 — — 0.014 —
Yemen. . . . . . . . . . . . . . . . . . . . . . . . . . . . . . . . . . . . . 2007 29.039 — — — —Yémen 2008 42.090 — 0.510 — —
2009 27.089 — — — —2010 42.842 — 6.500 — —2011 26.581 — 0.250 — —
Part fourQuatrièm
e partieCuarta parte
Tables — Tableaux —
Cuadros
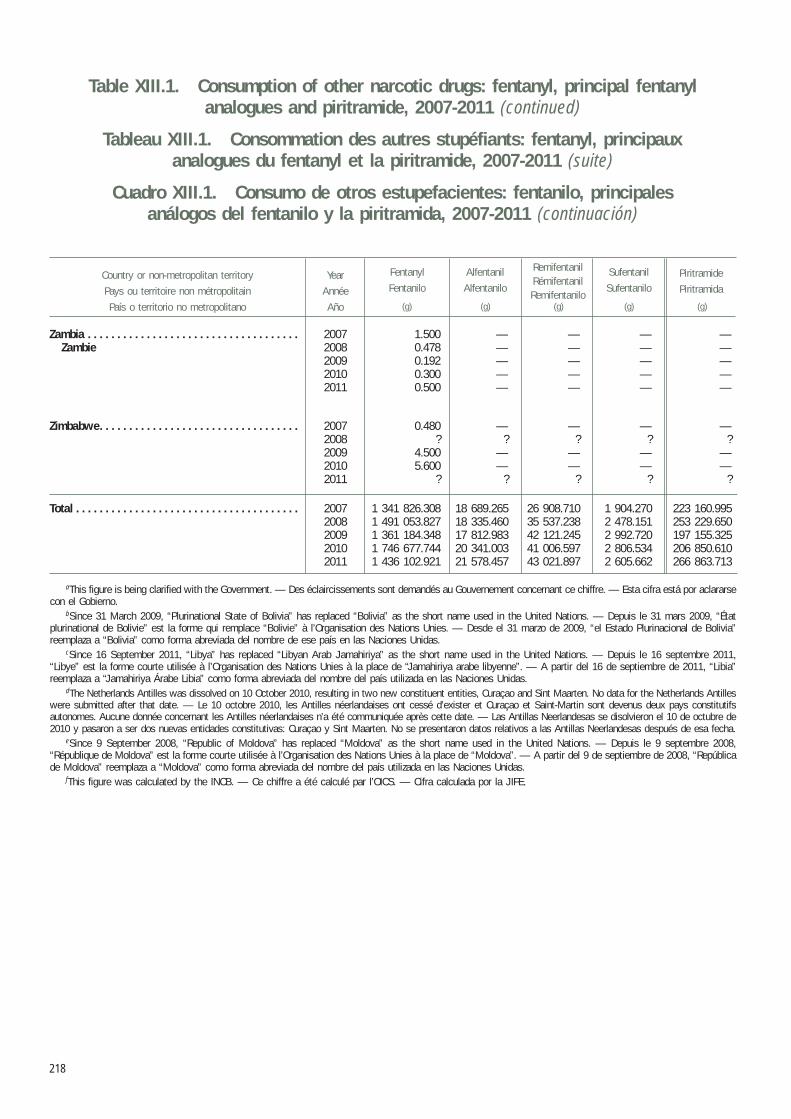
218
Table XIII.1. Consumption of other narcotic drugs: fentanyl, principal fentanyl analogues and piritramide, 2007-2011 (continued)
Tableau XIII.1. Consommation des autres stupéfiants: fentanyl, principaux analogues du fentanyl et la piritramide, 2007-2011 (suite)
Cuadro XIII.1. Consumo de otros estupefacientes: fentanilo, principales análogos del fentanilo y la piritramida, 2007-2011 (continuación)
Country or non-metropolitan territory
Pays ou territoire non métropolitain
País o territorio no metropolitano
Year
Année
Año
Alfentanil
Alfentanilo
Fentanyl
FentaniloPiritramide
Piritramida
RemifentanilRémifentanilRemifentanilo
Sufentanil
Sufentanilo
(g) (g) (g) (g) (g)
Zambia . . . . . . . . . . . . . . . . . . . . . . . . . . . . . . . . . . . . 2007 1.500 — — — —Zambie 2008 0.478 — — — —
2009 0.192 — — — —2010 0.300 — — — —2011 0.500 — — — —
Zimbabwe. . . . . . . . . . . . . . . . . . . . . . . . . . . . . . . . . . 2007 0.480 — — — —2008 ? ? ? ? ?2009 4.500 — — — —2010 5.600 — — — —2011 ? ? ? ? ?
Total . . . . . . . . . . . . . . . . . . . . . . . . . . . . . . . . . . . . . . 2007 1 341 826.308 18 689.265 26 908.710 1 904.270 223 160.9952008 1 491 053.827 18 335.460 35 537.238 2 478.151 253 229.6502009 1 361 184.348 17 812.983 42 121.245 2 992.720 197 155.3252010 1 746 677.744 20 341.003 41 006.597 2 806.534 206 850.6102011 1 436 102.921 21 578.457 43 021.897 2 605.662 266 863.713
aThis figure is being clarified with the Government. — Des éclaircissements sont demandés au Gouvernement concernant ce chiffre. — Esta cifra está por aclararse con el Gobierno.
bSince 31 March 2009, “Plurinational State of Bolivia” has replaced “Bolivia” as the short name used in the United Nations. — Depuis le 31 mars 2009, “État plurinational de Bolivie” est la forme qui remplace “Bolivie” à l’Organisation des Nations Unies. — Desde el 31 marzo de 2009, “el Estado Plurinacional de Bolivia” reemplaza a “Bolivia” como forma abreviada del nombre de ese país en las Naciones Unidas.
cSince 16 September 2011, “Libya” has replaced “Libyan Arab Jamahiriya” as the short name used in the United Nations. — Depuis le 16 septembre 2011, “Libye” est la forme courte utilisée à l’Organisation des Nations Unies à la place de “Jamahiriya arabe libyenne”. — A partir del 16 de septiembre de 2011, “Libia” reemplaza a “Jamahiriya Árabe Libia” como forma abreviada del nombre del país utilizada en las Naciones Unidas.
dThe Netherlands Antilles was dissolved on 10 October 2010, resulting in two new constituent entities, Curaçao and Sint Maarten. No data for the Netherlands Antilles were submitted after that date. — Le 10 octobre 2010, les Antilles néerlandaises ont cessé d’exister et Curaçao et Saint-Martin sont devenus deux pays constitutifs autonomes. Aucune donnée concernant les Antilles néerlandaises n’a été communiquée après cette date. — Las Antillas Neerlandesas se disolvieron el 10 de octubre de 2010 y pasaron a ser dos nuevas entidades constitutivas: Curaçao y Sint Maarten. No se presentaron datos relativos a las Antillas Neerlandesas después de esa fecha.
eSince 9 September 2008, “Republic of Moldova” has replaced “Moldova” as the short name used in the United Nations. — Depuis le 9 septembre 2008, “République de Moldova” est la forme courte utilisée à l’Organisation des Nations Unies à la place de “Moldova”. — A partir del 9 de septiembre de 2008, “República de Moldova” reemplaza a “Moldova” como forma abreviada del nombre del país utilizada en las Naciones Unidas.
fThis figure was calculated by the INCB. — Ce chiffre a été calculé par l’OICS. — Cifra calculada por la JIFE.
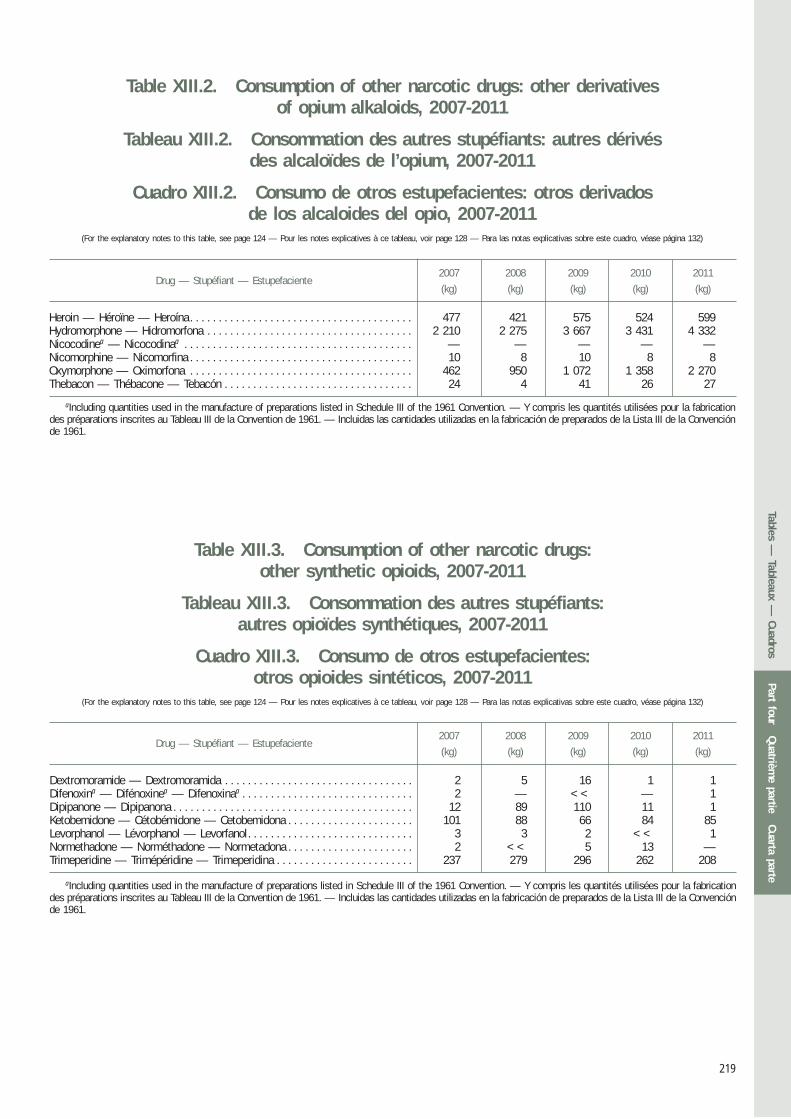
219
Drug — Stupéfiant — Estupefaciente
2007 2008 2009 2010 2011
(kg) (kg) (kg) (kg) (kg)Drug — Stupéfiant — Estupefaciente
Table XIII.3. Consumption of other narcotic drugs:other synthetic opioids, 2007-2011
Tableau XIII.3. Consommation des autres stupéfiants:autres opioïdes synthétiques, 2007-2011
Cuadro XIII.3. Consumo de otros estupefacientes:otros opioides sintéticos, 2007-2011
(For the explanatory notes to this table, see page 124 — Pour les notes explicatives à ce tableau, voir page 128 — Para las notas explicativas sobre este cuadro, véase página 132)
Table XIII.2. Consumption of other narcotic drugs: other derivatives of opium alkaloids, 2007-2011
Tableau XIII.2. Consommation des autres stupéfiants: autres dérivés des alcaloïdes de l’opium, 2007-2011
Cuadro XIII.2. Consumo de otros estupefacientes: otros derivados de los alcaloides del opio, 2007-2011
(For the explanatory notes to this table, see page 124 — Pour les notes explicatives à ce tableau, voir page 128 — Para las notas explicativas sobre este cuadro, véase página 132)
2007 2008 2009 2010 2011
(kg) (kg) (kg) (kg) (kg)
aIncluding quantities used in the manufacture of preparations listed in Schedule III of the 1961 Convention. — Y compris les quantités utilisées pour la fabrication des préparations inscrites au Tableau III de la Convention de 1961. — Incluidas las cantidades utilizadas en la fabricación de preparados de la Lista III de la Convención de 1961.
aIncluding quantities used in the manufacture of preparations listed in Schedule III of the 1961 Convention. — Y compris les quantités utilisées pour la fabrication des préparations inscrites au Tableau III de la Convention de 1961. — Incluidas las cantidades utilizadas en la fabricación de preparados de la Lista III de la Convención de 1961.
Heroin — Héroïne — Heroína. . . . . . . . . . . . . . . . . . . . . . . . . . . . . . . . . . . . . . . 477 421 575 524 599Hydromorphone — Hidromorfona . . . . . . . . . . . . . . . . . . . . . . . . . . . . . . . . . . . . 2 210 2 275 3 667 3 431 4 332Nicocodinea — Nicocodinaa . . . . . . . . . . . . . . . . . . . . . . . . . . . . . . . . . . . . . . . . — — — — —Nicomorphine — Nicomorfina . . . . . . . . . . . . . . . . . . . . . . . . . . . . . . . . . . . . . . . 10 8 10 8 8Oxymorphone — Oximorfona . . . . . . . . . . . . . . . . . . . . . . . . . . . . . . . . . . . . . . . 462 950 1 072 1 358 2 270Thebacon — Thébacone — Tebacón . . . . . . . . . . . . . . . . . . . . . . . . . . . . . . . . . 24 4 41 26 27
Dextromoramide — Dextromoramida . . . . . . . . . . . . . . . . . . . . . . . . . . . . . . . . . 2 5 16 1 1Difenoxina — Difénoxinea — Difenoxinaa . . . . . . . . . . . . . . . . . . . . . . . . . . . . . . 2 — << — 1Dipipanone — Dipipanona . . . . . . . . . . . . . . . . . . . . . . . . . . . . . . . . . . . . . . . . . . 12 89 110 11 1Ketobemidone — Cétobémidone — Cetobemidona . . . . . . . . . . . . . . . . . . . . . . 101 88 66 84 85Levorphanol — Lévorphanol — Levorfanol . . . . . . . . . . . . . . . . . . . . . . . . . . . . . 3 3 2 << 1Normethadone — Norméthadone — Normetadona . . . . . . . . . . . . . . . . . . . . . . 2 << 5 13 —Trimeperidine — Trimépéridine — Trimeperidina . . . . . . . . . . . . . . . . . . . . . . . . 237 279 296 262 208
Part fourQuatrièm
e partieCuarta parte
Tables — Tableaux —
Cuadros
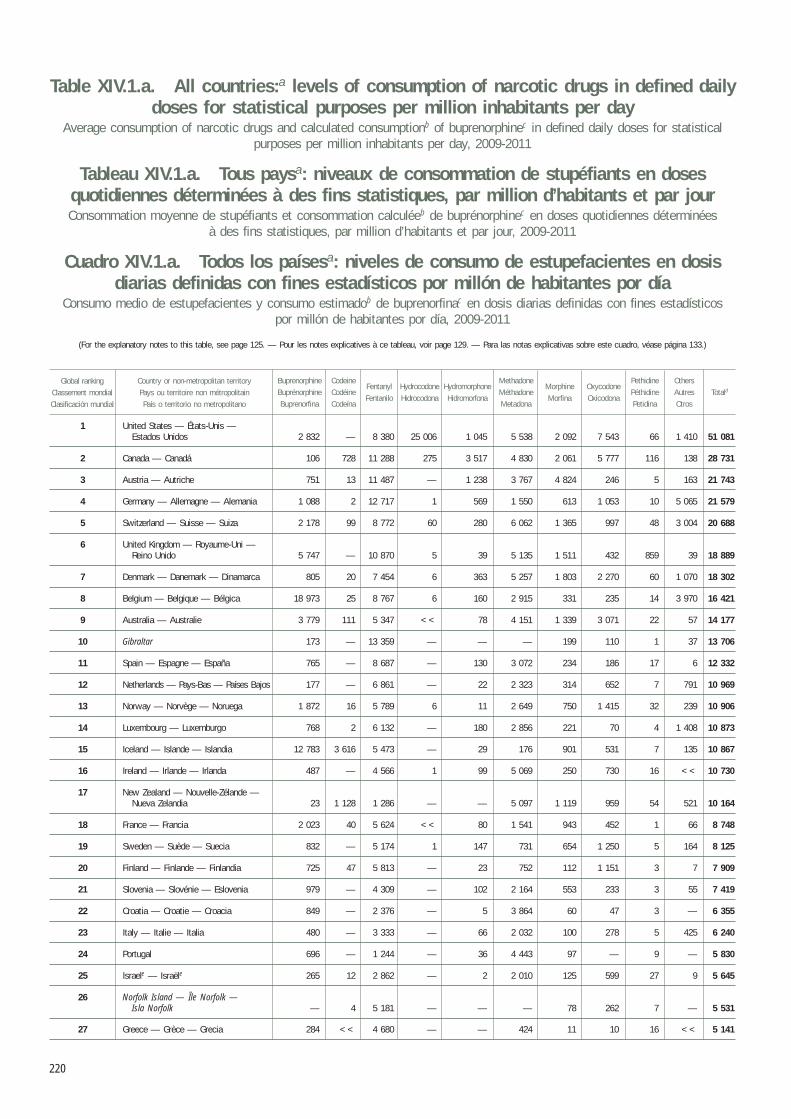
220
MorphineMorfina
CodeineCodéineCodeína
MethadoneMéthadoneMetadona
PethidinePéthidinePetidina
Country or non-metropolitan territoryPays ou territoire non métropolitainPaís o territorio no metropolitano
OthersAutresOtros
TotaldFentanylFentanilo
HydrocodoneHidrocodona
HydromorphoneHidromorfona
OxycodoneOxicodona
BuprenorphineBuprénorphineBuprenorfina
Global rankingClassement mondialClasificación mundial
Table XIV.1.a. All countries:a levels of consumption of narcotic drugs in defined daily doses for statistical purposes per million inhabitants per day
Average consumption of narcotic drugs and calculated consumptionb of buprenorphinec in defined daily doses for statistical purposes per million inhabitants per day, 2009-2011
Tableau XIV.1.a. Tous paysa: niveaux de consommation de stupéfiants en doses quotidiennes déterminées à des fins statistiques, par million d’habitants et par jourConsommation moyenne de stupéfiants et consommation calculéeb de buprénorphinec en doses quotidiennes déterminées
à des fins statistiques, par million d’habitants et par jour, 2009-2011
Cuadro XIV.1.a. Todos los paísesa: niveles de consumo de estupefacientes en dosis diarias definidas con fines estadísticos por millón de habitantes por día
Consumo medio de estupefacientes y consumo estimadob de buprenorfinac en dosis diarias definidas con fines estadísticos por millón de habitantes por día, 2009-2011
(For the explanatory notes to this table, see page 125. — Pour les notes explicatives à ce tableau, voir page 129. — Para las notas explicativas sobre este cuadro, véase página 133.)
1 United States — États-Unis — Estados Unidos 2 832 — 8 380 25 006 1 045 5 538 2 092 7 543 66 1 410 51 081
2 Canada — Canadá 106 728 11 288 275 3 517 4 830 2 061 5 777 116 138 28 731
3 Austria — Autriche 751 13 11 487 — 1 238 3 767 4 824 246 5 163 21 743
4 Germany — Allemagne — Alemania 1 088 2 12 717 1 569 1 550 613 1 053 10 5 065 21 579
5 Switzerland — Suisse — Suiza 2 178 99 8 772 60 280 6 062 1 365 997 48 3 004 20 688
6 United Kingdom — Royaume-Uni — Reino Unido 5 747 — 10 870 5 39 5 135 1 511 432 859 39 18 889
7 Denmark — Danemark — Dinamarca 805 20 7 454 6 363 5 257 1 803 2 270 60 1 070 18 302
8 Belgium — Belgique — Bélgica 18 973 25 8 767 6 160 2 915 331 235 14 3 970 16 421
9 Australia — Australie 3 779 111 5 347 << 78 4 151 1 339 3 071 22 57 14 177
10 Gibraltar 173 — 13 359 — — — 199 110 1 37 13 706
11 Spain — Espagne — España 765 — 8 687 — 130 3 072 234 186 17 6 12 332
12 Netherlands — Pays-Bas — Países Bajos 177 — 6 861 — 22 2 323 314 652 7 791 10 969
13 Norway — Norvège — Noruega 1 872 16 5 789 6 11 2 649 750 1 415 32 239 10 906
14 Luxembourg — Luxemburgo 768 2 6 132 — 180 2 856 221 70 4 1 408 10 873
15 Iceland — Islande — Islandia 12 783 3 616 5 473 — 29 176 901 531 7 135 10 867
16 Ireland — Irlande — Irlanda 487 — 4 566 1 99 5 069 250 730 16 << 10 730
17 New Zealand — Nouvelle-Zélande — Nueva Zelandia 23 1 128 1 286 — — 5 097 1 119 959 54 521 10 164
18 France — Francia 2 023 40 5 624 << 80 1 541 943 452 1 66 8 748
19 Sweden — Suède — Suecia 832 — 5 174 1 147 731 654 1 250 5 164 8 125
20 Finland — Finlande — Finlandia 725 47 5 813 — 23 752 112 1 151 3 7 7 909
21 Slovenia — Slovénie — Eslovenia 979 — 4 309 — 102 2 164 553 233 3 55 7 419
22 Croatia — Croatie — Croacia 849 — 2 376 — 5 3 864 60 47 3 — 6 355
23 Italy — Italie — Italia 480 — 3 333 — 66 2 032 100 278 5 425 6 240
24 Portugal 696 — 1 244 — 36 4 443 97 — 9 — 5 830
25 Israele — Israële 265 12 2 862 — 2 2 010 125 599 27 9 5 645
26 Norfolk Island — Île Norfolk — Isla Norfolk — 4 5 181 — — — 78 262 7 — 5 531
27 Greece — Grèce — Grecia 284 << 4 680 — — 424 11 10 16 << 5 141
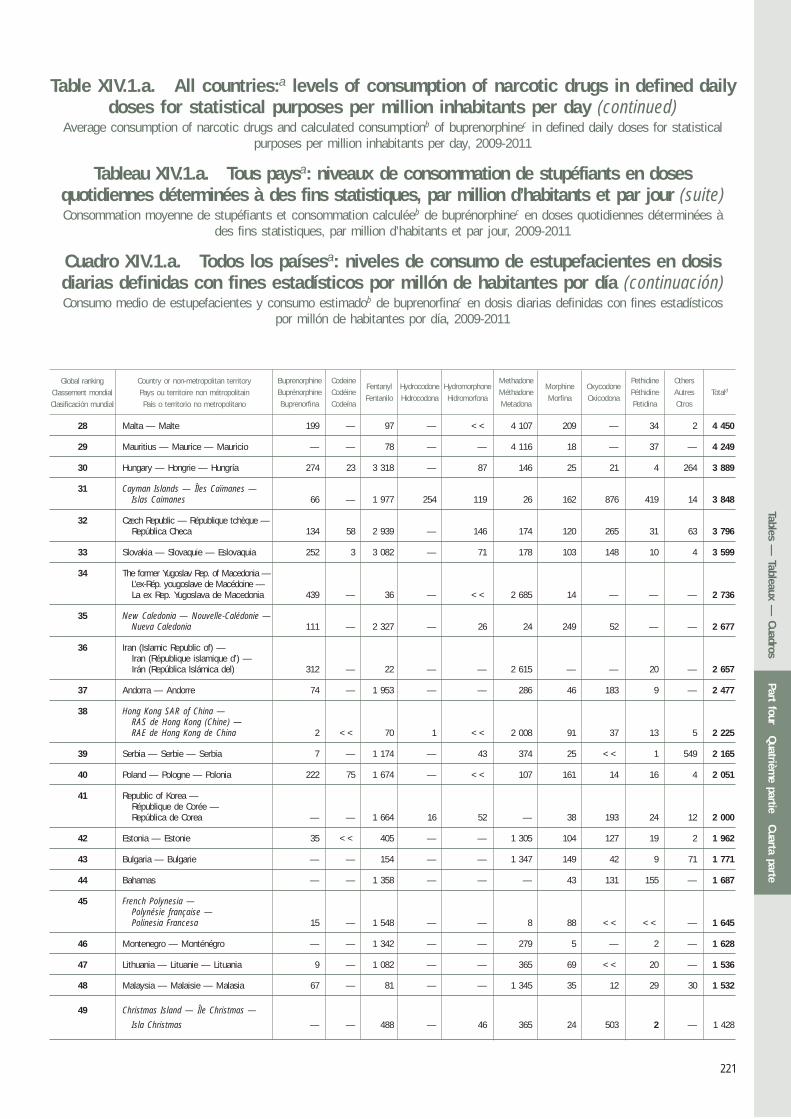
221
MorphineMorfina
CodeineCodéineCodeína
MethadoneMéthadoneMetadona
PethidinePéthidinePetidina
Country or non-metropolitan territoryPays ou territoire non métropolitainPaís o territorio no metropolitano
OthersAutresOtros
TotaldFentanylFentanilo
HydrocodoneHidrocodona
HydromorphoneHidromorfona
OxycodoneOxicodona
BuprenorphineBuprénorphineBuprenorfina
Global rankingClassement mondialClasificación mundial
Table XIV.1.a. All countries:a levels of consumption of narcotic drugs in defined daily doses for statistical purposes per million inhabitants per day (continued)
Average consumption of narcotic drugs and calculated consumptionb of buprenorphinec in defined daily doses for statistical purposes per million inhabitants per day, 2009-2011
Tableau XIV.1.a. Tous paysa: niveaux de consommation de stupéfiants en doses quotidiennes déterminées à des fins statistiques, par million d’habitants et par jour (suite)Consommation moyenne de stupéfiants et consommation calculéeb de buprénorphinec en doses quotidiennes déterminées à
des fins statistiques, par million d’habitants et par jour, 2009-2011
Cuadro XIV.1.a. Todos los paísesa: niveles de consumo de estupefacientes en dosis diarias definidas con fines estadísticos por millón de habitantes por día (continuación)Consumo medio de estupefacientes y consumo estimadob de buprenorfinac en dosis diarias definidas con fines estadísticos
por millón de habitantes por día, 2009-2011
28 Malta — Malte 199 — 97 — << 4 107 209 — 34 2 4 450
29 Mauritius — Maurice — Mauricio — — 78 — — 4 116 18 — 37 — 4 249
30 Hungary — Hongrie — Hungría 274 23 3 318 — 87 146 25 21 4 264 3 889
31 Cayman Islands — Îles Caïmanes — Islas Caimanes 66 — 1 977 254 119 26 162 876 419 14 3 848
32 Czech Republic — République tchèque — República Checa 134 58 2 939 — 146 174 120 265 31 63 3 796
33 Slovakia — Slovaquie — Eslovaquia 252 3 3 082 — 71 178 103 148 10 4 3 599
34 The former Yugoslav Rep. of Macedonia — L’ex-Rép. yougoslave de Macédoine — La ex Rep. Yugoslava de Macedonia 439 — 36 — << 2 685 14 — — — 2 736
35 New Caledonia — Nouvelle-Calédonie — Nueva Caledonia 111 — 2 327 — 26 24 249 52 — — 2 677
36 Iran (Islamic Republic of) — Iran (République islamique d’) — Irán (República Islámica del) 312 — 22 — — 2 615 — — 20 — 2 657
37 Andorra — Andorre 74 — 1 953 — — 286 46 183 9 — 2 477
38 Hong Kong SAR of China — RAS de Hong Kong (Chine) — RAE de Hong Kong de China 2 << 70 1 << 2 008 91 37 13 5 2 225
39 Serbia — Serbie — Serbia 7 — 1 174 — 43 374 25 << 1 549 2 165
40 Poland — Pologne — Polonia 222 75 1 674 — << 107 161 14 16 4 2 051
41 Republic of Korea — République de Corée — República de Corea — — 1 664 16 52 — 38 193 24 12 2 000
42 Estonia — Estonie 35 << 405 — — 1 305 104 127 19 2 1 962
43 Bulgaria — Bulgarie — — 154 — — 1 347 149 42 9 71 1 771
44 Bahamas — — 1 358 — — — 43 131 155 — 1 687
45 French Polynesia — Polynésie française — Polinesia Francesa 15 — 1 548 — — 8 88 << << — 1 645
46 Montenegro — Monténégro — — 1 342 — — 279 5 — 2 — 1 628
47 Lithuania — Lituanie — Lituania 9 — 1 082 — — 365 69 << 20 — 1 536
48 Malaysia — Malaisie — Malasia 67 — 81 — — 1 345 35 12 29 30 1 532
49 Christmas Island — Île Christmas —
Isla Christmas — — 488 — 46 365 24 503 2 — 1 428
Part fourQuatrièm
e partieCuarta parte
Tables — Tableaux —
Cuadros
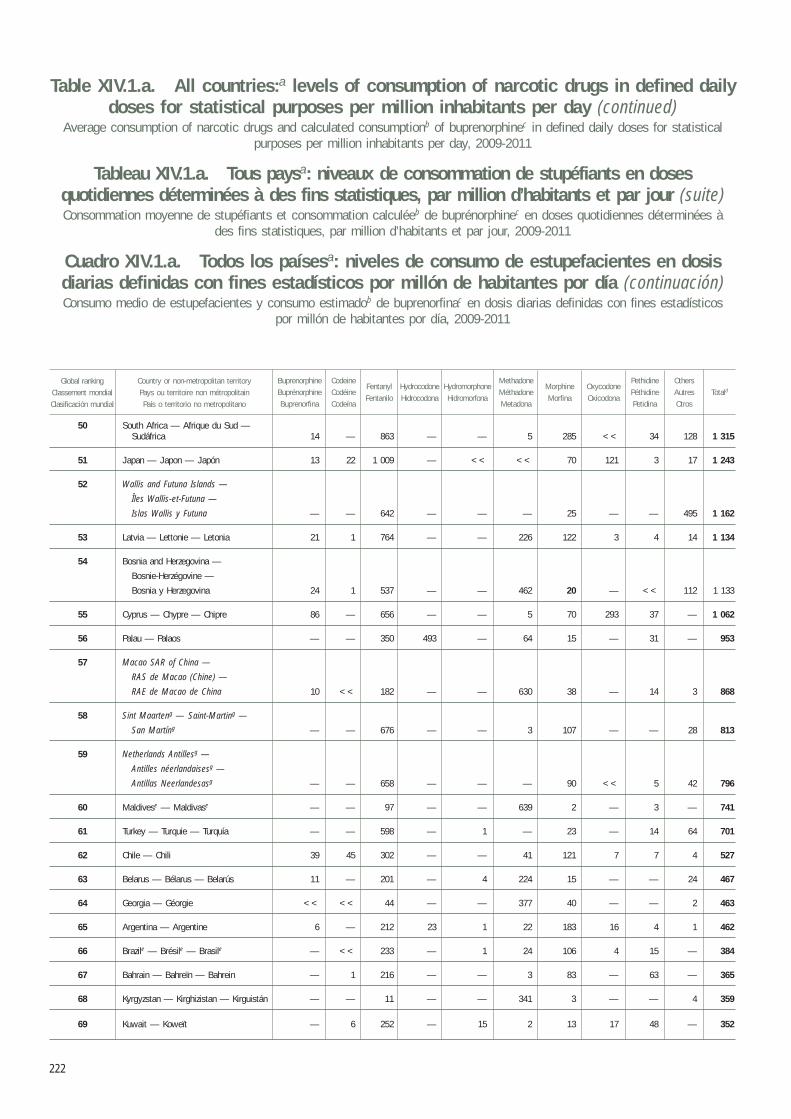
222
MorphineMorfina
CodeineCodéineCodeína
MethadoneMéthadoneMetadona
PethidinePéthidinePetidina
Country or non-metropolitan territoryPays ou territoire non métropolitainPaís o territorio no metropolitano
OthersAutresOtros
TotaldFentanylFentanilo
HydrocodoneHidrocodona
HydromorphoneHidromorfona
OxycodoneOxicodona
BuprenorphineBuprénorphineBuprenorfina
Global rankingClassement mondialClasificación mundial
Table XIV.1.a. All countries:a levels of consumption of narcotic drugs in defined daily doses for statistical purposes per million inhabitants per day (continued)
Average consumption of narcotic drugs and calculated consumptionb of buprenorphinec in defined daily doses for statistical purposes per million inhabitants per day, 2009-2011
Tableau XIV.1.a. Tous paysa: niveaux de consommation de stupéfiants en doses quotidiennes déterminées à des fins statistiques, par million d’habitants et par jour (suite)Consommation moyenne de stupéfiants et consommation calculéeb de buprénorphinec en doses quotidiennes déterminées à
des fins statistiques, par million d’habitants et par jour, 2009-2011
Cuadro XIV.1.a. Todos los paísesa: niveles de consumo de estupefacientes en dosis diarias definidas con fines estadísticos por millón de habitantes por día (continuación)Consumo medio de estupefacientes y consumo estimadob de buprenorfinac en dosis diarias definidas con fines estadísticos
por millón de habitantes por día, 2009-2011
50 South Africa — Afrique du Sud — Sudáfrica 14 — 863 — — 5 285 << 34 128 1 315
51 Japan — Japon — Japón 13 22 1 009 — << << 70 121 3 17 1 243
52 Wallis and Futuna Islands —
Îles Wallis-et-Futuna —
Islas Wallis y Futuna — — 642 — — — 25 — — 495 1 162
53 Latvia — Lettonie — Letonia 21 1 764 — — 226 122 3 4 14 1 134
54 Bosnia and Herzegovina —
Bosnie-Herzégovine —
Bosnia y Herzegovina 24 1 537 — — 462 20 — << 112 1 133
55 Cyprus — Chypre — Chipre 86 — 656 — — 5 70 293 37 — 1 062
56 Palau — Palaos — — 350 493 — 64 15 — 31 — 953
57 Macao SAR of China —
RAS de Macao (Chine) —
RAE de Macao de China 10 << 182 — — 630 38 — 14 3 868
58 Sint Maarteng — Saint-Marting —
San Martíng — — 676 — — 3 107 — — 28 813
59 Netherlands Antillesg —
Antilles néerlandaisesg —
Antillas Neerlandesasg — — 658 — — — 90 << 5 42 796
60 Maldivese — Maldivase — — 97 — — 639 2 — 3 — 741
61 Turkey — Turquie — Turquía — — 598 — 1 — 23 — 14 64 701
62 Chile — Chili 39 45 302 — — 41 121 7 7 4 527
63 Belarus — Bélarus — Belarús 11 — 201 — 4 224 15 — — 24 467
64 Georgia — Géorgie << << 44 — — 377 40 — — 2 463
65 Argentina — Argentine 6 — 212 23 1 22 183 16 4 1 462
66 Brazile — Brésile — Brasile — << 233 — 1 24 106 4 15 — 384
67 Bahrain — Bahreïn — Bahrein — 1 216 — — 3 83 — 63 — 365
68 Kyrgyzstan — Kirghizistan — Kirguistán — — 11 — — 341 3 — — 4 359
69 Kuwait — Koweït — 6 252 — 15 2 13 17 48 — 352

223
MorphineMorfina
CodeineCodéineCodeína
MethadoneMéthadoneMetadona
PethidinePéthidinePetidina
Country or non-metropolitan territoryPays ou territoire non métropolitainPaís o territorio no metropolitano
OthersAutresOtros
TotaldFentanylFentanilo
HydrocodoneHidrocodona
HydromorphoneHidromorfona
OxycodoneOxicodona
BuprenorphineBuprénorphineBuprenorfina
Global rankingClassement mondialClasificación mundial
Table XIV.1.a. All countries:a levels of consumption of narcotic drugs in defined daily doses for statistical purposes per million inhabitants per day (continued)
Average consumption of narcotic drugs and calculated consumptionb of buprenorphinec in defined daily doses for statistical purposes per million inhabitants per day, 2009-2011
Tableau XIV.1.a. Tous paysa: niveaux de consommation de stupéfiants en doses quotidiennes déterminées à des fins statistiques, par million d’habitants et par jour (suite)Consommation moyenne de stupéfiants et consommation calculéeb de buprénorphinec en doses quotidiennes déterminées à
des fins statistiques, par million d’habitants et par jour, 2009-2011
Cuadro XIV.1.a. Todos los paísesa: niveles de consumo de estupefacientes en dosis diarias definidas con fines estadísticos por millón de habitantes por día (continuación)Consumo medio de estupefacientes y consumo estimadob de buprenorfinac en dosis diarias definidas con fines estadísticos
por millón de habitantes por día, 2009-2011
70 Singapore — Singapour — Singapur 5 << 264 << 5 5 36 23 17 << 350
71 Ukraine — Ucrania 36 13 34 — — 248 17 — — 6 318
72 Colombia — Colombie 9 — 161 38 6 20 47 34 4 — 310
73 Costa Rica — — 69 — — 125 108 5 1 — 308
74 Uruguay — 13 116 18 — 15 94 — 6 11 273
75 Jordan — Jordanie — Jordania — — 160 — 4 3 52 2 32 — 252
76 Saudi Arabia — Arabie saoudite —
Arabia Saudita — 3 198 — 4 8 17 1 17 1 250
77 Turks and Caicos Islandsf —
Îles Turques et Caïquesf —
Islas Turcas y Caicosf — — 3 — — — 7 150 83 — 243
78 Republic of Moldova —
République de Moldova —
República de Moldova — 30 34 — — 120 40 — — 12 236
79 Mexico — Mexique — México 11 — 69 — 2 83 60 2 — — 217
80 Panama — Panamá — — 192 — — 5 7 7 6 — 216
81 United Arab Emirates —
Émirats arabes unis —
Emiratos Árabes Unidos 5 << 181 — 5 << 18 << 11 — 215
82 Albania — Albanie — — 33 — — 137 22 — 1 20 213
83 Lebanon — Liban — Líbano 36 — 152 — — — 36 — 24 — 212
84 China — Chine 1 2 45 << << 125 20 3 8 << 203
85 Qatar << 1 140 — — 9 27 1 19 2 198
86 Bhutane — Bhoutane — Bhutáne — — 83 — — — 61 — 42 — 187
87 Nauruf — 16 — — — — 142 — 24 — 182
88 Saint Helenae — Sainte-Hélènee —
Santa Elenae — 66 17 — — — 71 — 19 — 174
88 Trinidad and Tobago —
Trinité-et-Tobago — Trinidad y Tabago — — 18 — — — 62 — 95 — 174
88
Part fourQuatrièm
e partieCuarta parte
Tables — Tableaux —
Cuadros

224
MorphineMorfina
CodeineCodéineCodeína
MethadoneMéthadoneMetadona
PethidinePéthidinePetidina
Country or non-metropolitan territoryPays ou territoire non métropolitainPaís o territorio no metropolitano
OthersAutresOtros
TotaldFentanylFentanilo
HydrocodoneHidrocodona
HydromorphoneHidromorfona
OxycodoneOxicodona
BuprenorphineBuprénorphineBuprenorfina
Global rankingClassement mondialClasificación mundial
Table XIV.1.a. All countries:a levels of consumption of narcotic drugs in defined daily doses for statistical purposes per million inhabitants per day (continued)
Average consumption of narcotic drugs and calculated consumptionb of buprenorphinec in defined daily doses for statistical purposes per million inhabitants per day, 2009-2011
Tableau XIV.1.a. Tous paysa: niveaux de consommation de stupéfiants en doses quotidiennes déterminées à des fins statistiques, par million d’habitants et par jour (suite)Consommation moyenne de stupéfiants et consommation calculéeb de buprénorphinec en doses quotidiennes déterminées à
des fins statistiques, par million d’habitants et par jour, 2009-2011
Cuadro XIV.1.a. Todos los paísesa: niveles de consumo de estupefacientes en dosis diarias definidas con fines estadísticos por millón de habitantes por día (continuación)Consumo medio de estupefacientes y consumo estimadob de buprenorfinac en dosis diarias definidas con fines estadísticos
por millón de habitantes por día, 2009-2011
90 Algeria — Algérie — Argelia 3 — 30 — — — 4 — << 130 163
91 Sri Lanka — — 4 — — << 13 — 6 138 162
92 Tunisia — Tunisie — Túnez — — 83 — — — 67 — 3 — 153
93 Armenia — Arménie — << 21 — — 111 14 — — 1 147
94 Seychelles — — 23 — — — 111 — 12 — 146
95 Brunei Darussalam — Brunéi Darussalam — — 73 — — — 42 — 19 << 134
96 Oman — Omán — << 95 — — 1 18 — 18 << 133
97 Jamaica — Jamaïque — 5 40 — — — 46 — 35 — 126
Thailand — Thaïlande — Tailandia << << 48 — — 43 28 — 7 — 126
99 Saint Vincent and the Grenadines —
Saint-Vincent-et-les Grenadines —
San Vicente y las Granadinas — — 14 — — — 21 — 89 — 125
100 Romaniaf — Roumanief — Rumaniaf 12 — 60 — — 13 16 33 3 — 124
101 El Salvador — — 63 1 — 14 10 15 13 — 116
102 Syrian Arab Republic —
République arabe syrienne —
República Árabe Siria — — 28 — — — 4 70 12 — 114
103 Russian Federation —
Fédération de Russie —
Federación de Rusia 1 << 83 — — — 12 — — 17 112
104 Namibiae — Namibiee 61 — 36 — — 18 42 — 12 1 109
105 Venezuela (Bolivarian Rep. of) —
Venezuela (Rép. bolivarienne du) —
Venezuela (Rep. Bolivariana de) 103 — 77 — 1 5 10 15 — — 108
106 Montserrat — 61 << — — — 9 — 30 — 101
107 Viet Name — — 23 — — 49 13 — 3 — 88
108 Cuba — — 43 — — — 38 — 4 1 87
109 Saint Luciae — Sainte-Luciee —
Santa Lucíae — — 1 7 — 9 23 — 45 — 84
97
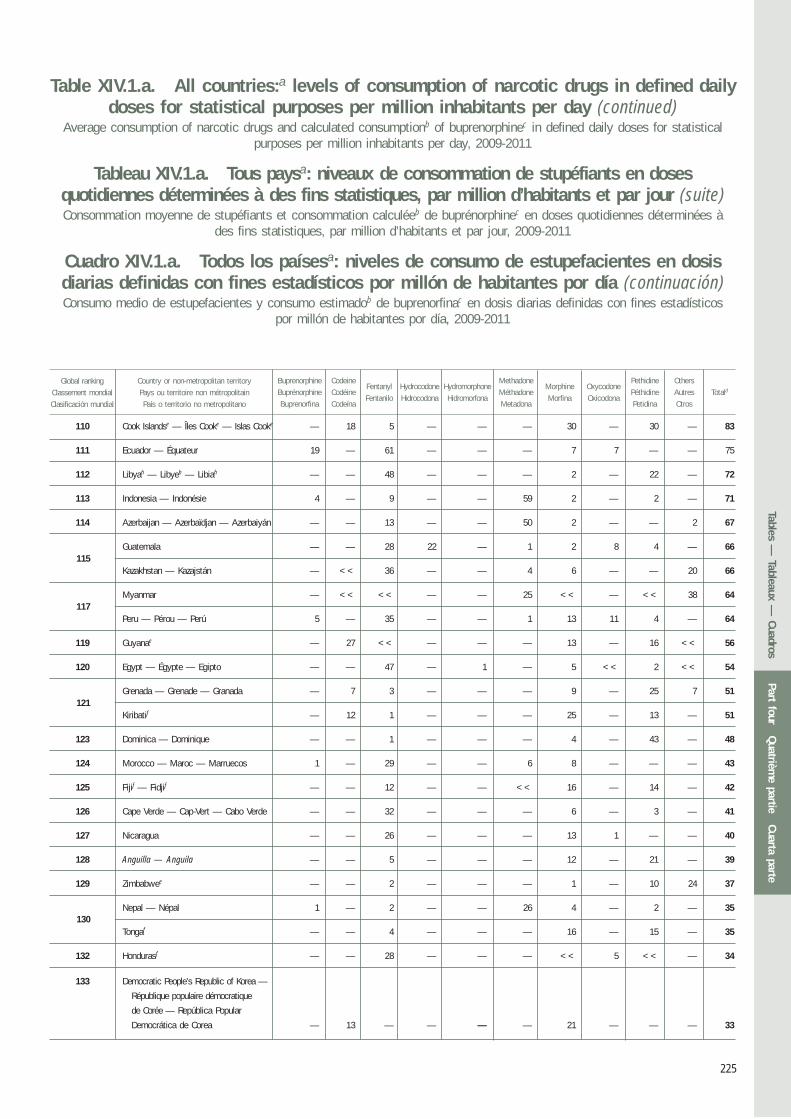
225
MorphineMorfina
CodeineCodéineCodeína
MethadoneMéthadoneMetadona
PethidinePéthidinePetidina
Country or non-metropolitan territoryPays ou territoire non métropolitainPaís o territorio no metropolitano
OthersAutresOtros
TotaldFentanylFentanilo
HydrocodoneHidrocodona
HydromorphoneHidromorfona
OxycodoneOxicodona
BuprenorphineBuprénorphineBuprenorfina
Global rankingClassement mondialClasificación mundial
Table XIV.1.a. All countries:a levels of consumption of narcotic drugs in defined daily doses for statistical purposes per million inhabitants per day (continued)
Average consumption of narcotic drugs and calculated consumptionb of buprenorphinec in defined daily doses for statistical purposes per million inhabitants per day, 2009-2011
Tableau XIV.1.a. Tous paysa: niveaux de consommation de stupéfiants en doses quotidiennes déterminées à des fins statistiques, par million d’habitants et par jour (suite)Consommation moyenne de stupéfiants et consommation calculéeb de buprénorphinec en doses quotidiennes déterminées à
des fins statistiques, par million d’habitants et par jour, 2009-2011
Cuadro XIV.1.a. Todos los paísesa: niveles de consumo de estupefacientes en dosis diarias definidas con fines estadísticos por millón de habitantes por día (continuación)Consumo medio de estupefacientes y consumo estimadob de buprenorfinac en dosis diarias definidas con fines estadísticos
por millón de habitantes por día, 2009-2011
110 Cook Islandse — Îles Cooke — Islas Cooke — 18 5 — — — 30 — 30 — 83
111 Ecuador — Équateur 19 — 61 — — — 7 7 — — 75
112 Libyah — Libyeh — Libiah — — 48 — — — 2 — 22 — 72
113 Indonesia — Indonésie 4 — 9 — — 59 2 — 2 — 71
114 Azerbaijan — Azerbaïdjan — Azerbaiyán — — 13 — — 50 2 — — 2 67
115 Guatemala — — 28 22 — 1 2 8 4 — 66
Kazakhstan — Kazajstán — << 36 — — 4 6 — — 20 66
117 Myanmar — << << — — 25 << — << 38 64
Peru — Pérou — Perú 5 — 35 — — 1 13 11 4 — 64
119 Guyanae — 27 << — — — 13 — 16 << 56
120 Egypt — Égypte — Egipto — — 47 — 1 — 5 << 2 << 54
121 Grenada — Grenade — Granada — 7 3 — — — 9 — 25 7 51
Kiribatif — 12 1 — — — 25 — 13 — 51
123 Dominica — Dominique — — 1 — — — 4 — 43 — 48
124 Morocco — Maroc — Marruecos 1 — 29 — — 6 8 — — — 43
125 Fijif — Fidjif — — 12 — — << 16 — 14 — 42
126 Cape Verde — Cap-Vert — Cabo Verde — — 32 — — — 6 — 3 — 41
127 Nicaragua — — 26 — — — 13 1 — — 40
128 Anguilla — Anguila — — 5 — — — 12 — 21 — 39
129 Zimbabwee — — 2 — — — 1 — 10 24 37
130 Nepal — Népal 1 — 2 — — 26 4 — 2 — 35
Tongaf — — 4 — — — 16 — 15 — 35
132 Hondurasf — — 28 — — — << 5 << — 34
133 Democratic People’s Republic of Korea —
République populaire démocratique
de Corée — República Popular
Democrática de Corea — 13 — — — — 21 — — — 33
115
117
121
130
Part fourQuatrièm
e partieCuarta parte
Tables — Tableaux —
Cuadros
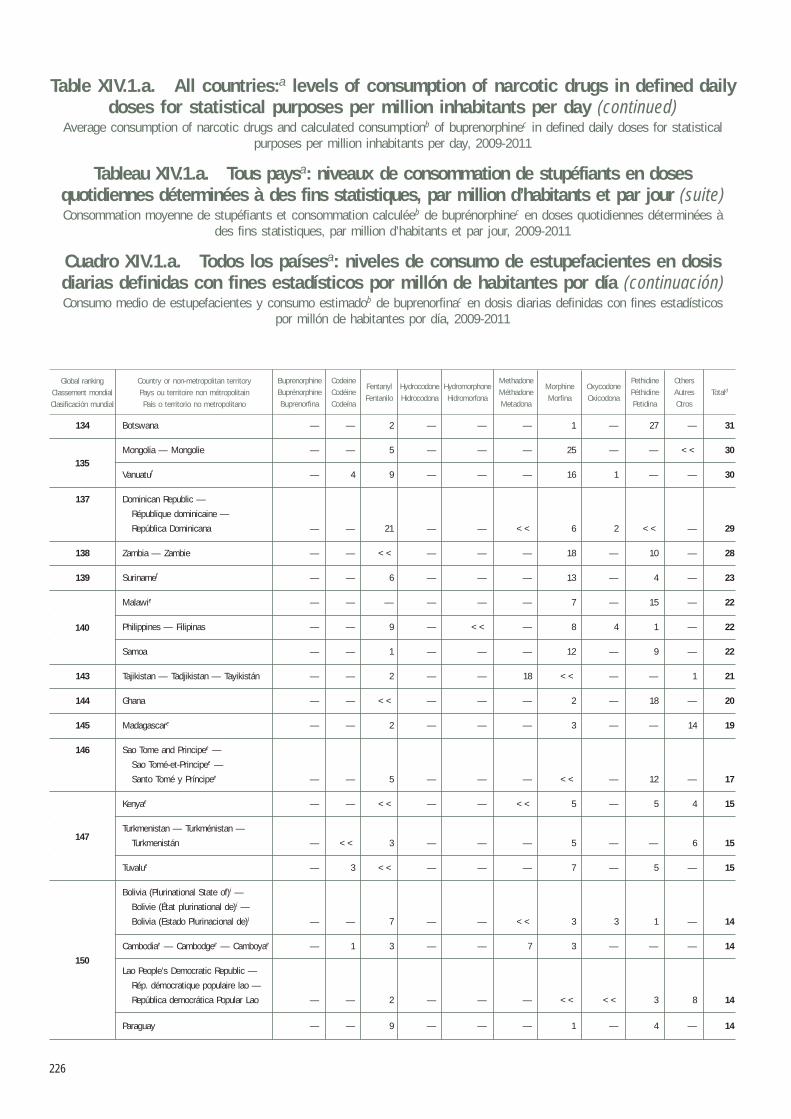
226
MorphineMorfina
CodeineCodéineCodeína
MethadoneMéthadoneMetadona
PethidinePéthidinePetidina
Country or non-metropolitan territoryPays ou territoire non métropolitainPaís o territorio no metropolitano
OthersAutresOtros
TotaldFentanylFentanilo
HydrocodoneHidrocodona
HydromorphoneHidromorfona
OxycodoneOxicodona
BuprenorphineBuprénorphineBuprenorfina
Global rankingClassement mondialClasificación mundial
Table XIV.1.a. All countries:a levels of consumption of narcotic drugs in defined daily doses for statistical purposes per million inhabitants per day (continued)
Average consumption of narcotic drugs and calculated consumptionb of buprenorphinec in defined daily doses for statistical purposes per million inhabitants per day, 2009-2011
Tableau XIV.1.a. Tous paysa: niveaux de consommation de stupéfiants en doses quotidiennes déterminées à des fins statistiques, par million d’habitants et par jour (suite)Consommation moyenne de stupéfiants et consommation calculéeb de buprénorphinec en doses quotidiennes déterminées à
des fins statistiques, par million d’habitants et par jour, 2009-2011
Cuadro XIV.1.a. Todos los paísesa: niveles de consumo de estupefacientes en dosis diarias definidas con fines estadísticos por millón de habitantes por día (continuación)Consumo medio de estupefacientes y consumo estimadob de buprenorfinac en dosis diarias definidas con fines estadísticos
por millón de habitantes por día, 2009-2011
134 Botswana — — 2 — — — 1 — 27 — 31
135 Mongolia — Mongolie — — 5 — — — 25 — — << 30
135 Vanuatuf — 4 9 — — — 16 1 — — 30
137 Dominican Republic —
République dominicaine —
República Dominicana — — 21 — — << 6 2 << — 29
138 Zambia — Zambie — — << — — — 18 — 10 — 28
139 Surinamef — — 6 — — — 13 — 4 — 23
140 Malawie — — — — — — 7 — 15 — 22
Philippines — Filipinas — — 9 — << — 8 4 1 — 22
Samoa — — 1 — — — 12 — 9 — 22
143 Tajikistan — Tadjikistan — Tayikistán — — 2 — — 18 << — — 1 21
144 Ghana — — << — — — 2 — 18 — 20
145 Madagascare — — 2 — — — 3 — — 14 19
146 Sao Tome and Principee —
Sao Tomé-et-Principee —
Santo Tomé y Príncipee — — 5 — — — << — 12 — 17
Kenyae — — << — — << 5 — 5 4 15
147 Turkmenistan — Turkménistan —
Turkmenistán — << 3 — — — 5 — — 6 15
Tuvalue — 3 << — — — 7 — 5 — 15
Bolivia (Plurinational State of)i —
Bolivie (État plurinational de)i —
Bolivia (Estado Plurinacional de)i — — 7 — — << 3 3 1 — 14
Cambodiae — Cambodgee — Camboyae — 1 3 — — 7 3 — — — 14
150 Lao People’s Democratic Republic —
Rép. démocratique populaire lao —
República democrática Popular Lao — — 2 — — — << << 3 8 14
Paraguay — — 9 — — — 1 — 4 — 14
135
150
147
140
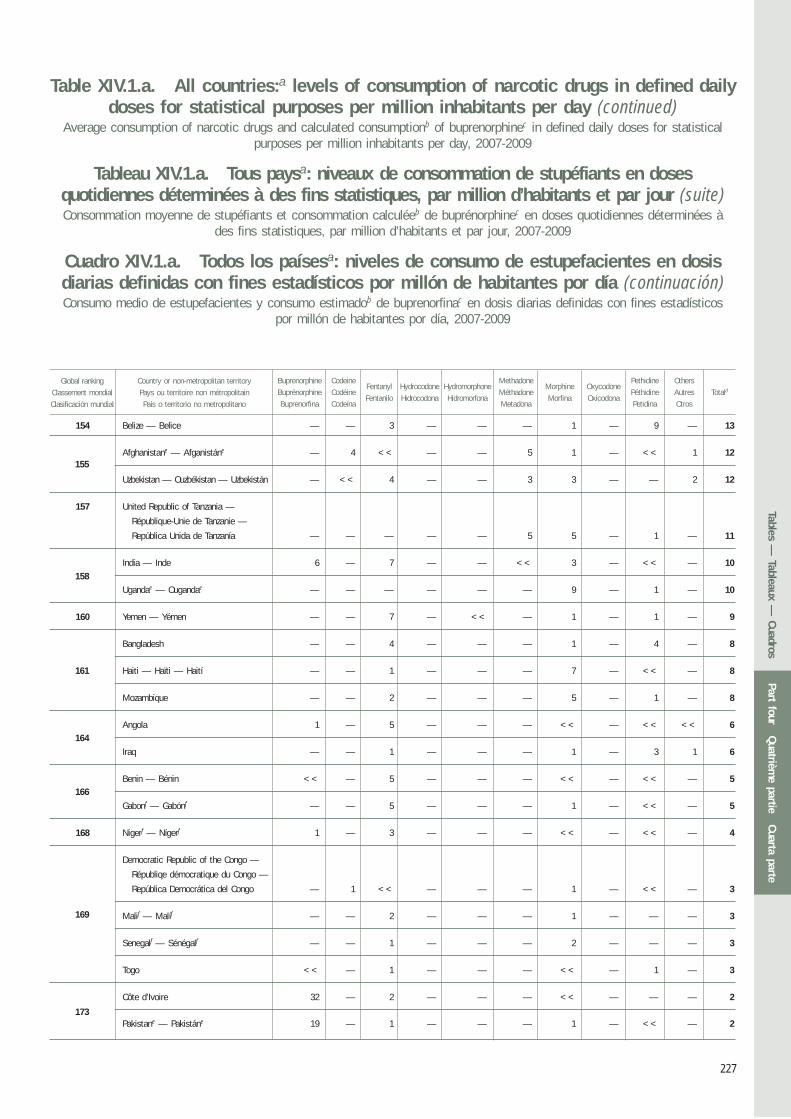
227
MorphineMorfina
CodeineCodéineCodeína
MethadoneMéthadoneMetadona
PethidinePéthidinePetidina
Country or non-metropolitan territoryPays ou territoire non métropolitainPaís o territorio no metropolitano
TotaldFentanylFentanilo
HydrocodoneHidrocodona
HydromorphoneHidromorfona
OxycodoneOxicodona
BuprenorphineBuprénorphineBuprenorfina
Global rankingClassement mondialClasificación mundial
Table XIV.1.a. All countries:a levels of consumption of narcotic drugs in defined daily doses for statistical purposes per million inhabitants per day (continued)
Average consumption of narcotic drugs and calculated consumptionb of buprenorphinec in defined daily doses for statistical purposes per million inhabitants per day, 2007-2009
Tableau XIV.1.a. Tous paysa: niveaux de consommation de stupéfiants en doses quotidiennes déterminées à des fins statistiques, par million d’habitants et par jour (suite)Consommation moyenne de stupéfiants et consommation calculéeb de buprénorphinec en doses quotidiennes déterminées à
des fins statistiques, par million d’habitants et par jour, 2007-2009
Cuadro XIV.1.a. Todos los paísesa: niveles de consumo de estupefacientes en dosis diarias definidas con fines estadísticos por millón de habitantes por día (continuación)Consumo medio de estupefacientes y consumo estimadob de buprenorfinac en dosis diarias definidas con fines estadísticos
por millón de habitantes por día, 2007-2009
OthersAutresOtros
154 Belize — Belice — — 3 — — — 1 — 9 — 13
155 Afghanistane — Afganistáne — 4 << — — 5 1 — << 1 12
Uzbekistan — Ouzbékistan — Uzbekistán — << 4 — — 3 3 — — 2 12
157 United Republic of Tanzania —
République-Unie de Tanzanie —
República Unida de Tanzanía — — — — — 5 5 — 1 — 11
158 India — Inde 6 — 7 — — << 3 — << — 10
Ugandae — Ougandae — — — — — — 9 — 1 — 10
160 Yemen — Yémen — — 7 — << — 1 — 1 — 9
161 Bangladesh — — 4 — — — 1 — 4 — 8
Haiti — Haïti — Haití — — 1 — — — 7 — << — 8
Mozambique — — 2 — — — 5 — 1 — 8
164 Angola 1 — 5 — — — << — << << 6
Iraq — — 1 — — — 1 — 3 1 6
166 Benin — Bénin << — 5 — — — << — << — 5
Gabonf — Gabónf — — 5 — — — 1 — << — 5
168 Nigerf — Nígerf 1 — 3 — — — << — << — 4
169 Democratic Republic of the Congo —
Républiqe démocratique du Congo —
República Democrática del Congo — 1 << — — — 1 — << — 3
Malif — Malíf — — 2 — — — 1 — — — 3
Senegalf — Sénégalf — — 1 — — — 2 — — — 3
Togo << — 1 — — — << — 1 — 3
173 Côte d’Ivoire 32 — 2 — — — << — — — 2
Pakistane — Pakistáne 19 — 1 — — — 1 — << — 2
155
158
161
164
166
173
169
Part fourQuatrièm
e partieCuarta parte
Tables — Tableaux —
Cuadros
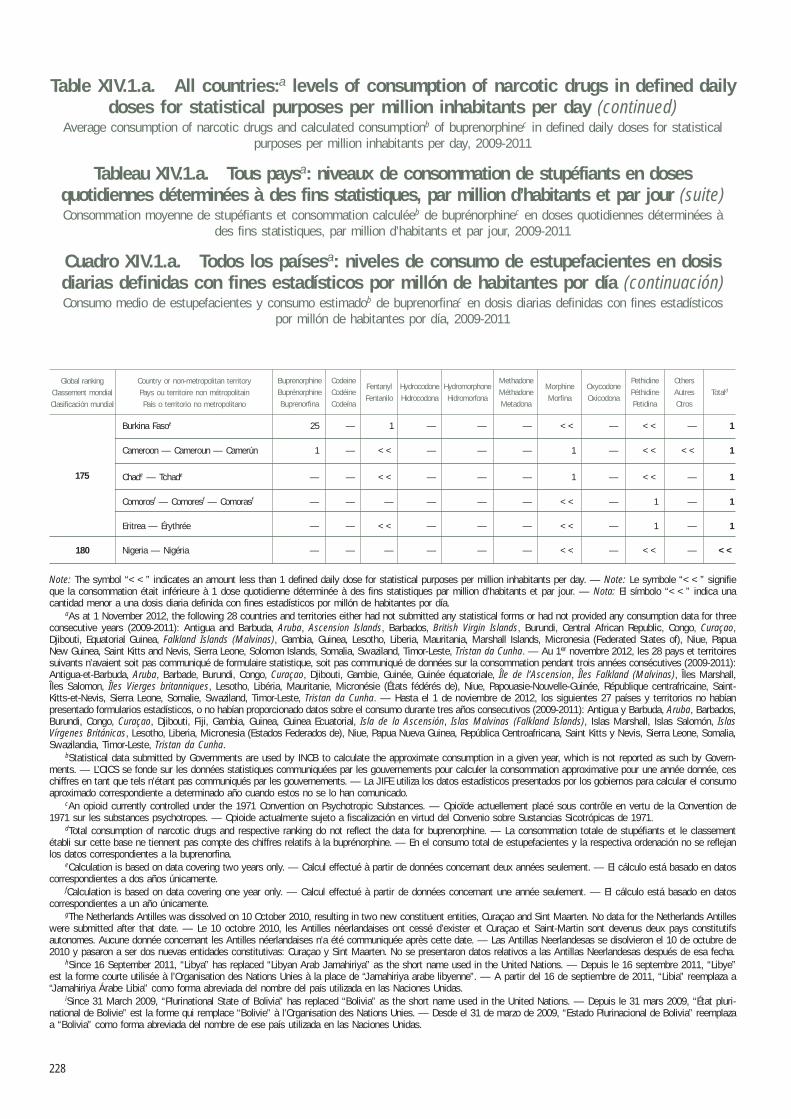
228
MorphineMorfina
CodeineCodéineCodeína
MethadoneMéthadoneMetadona
PethidinePéthidinePetidina
Country or non-metropolitan territoryPays ou territoire non métropolitainPaís o territorio no metropolitano
OthersAutresOtros
TotaldFentanylFentanilo
HydrocodoneHidrocodona
HydromorphoneHidromorfona
OxycodoneOxicodona
BuprenorphineBuprénorphineBuprenorfina
Global rankingClassement mondialClasificación mundial
Table XIV.1.a. All countries:a levels of consumption of narcotic drugs in defined daily doses for statistical purposes per million inhabitants per day (continued)
Average consumption of narcotic drugs and calculated consumptionb of buprenorphinec in defined daily doses for statistical purposes per million inhabitants per day, 2009-2011
Tableau XIV.1.a. Tous paysa: niveaux de consommation de stupéfiants en doses quotidiennes déterminées à des fins statistiques, par million d’habitants et par jour (suite)Consommation moyenne de stupéfiants et consommation calculéeb de buprénorphinec en doses quotidiennes déterminées à
des fins statistiques, par million d’habitants et par jour, 2009-2011
Cuadro XIV.1.a. Todos los paísesa: niveles de consumo de estupefacientes en dosis diarias definidas con fines estadísticos por millón de habitantes por día (continuación)Consumo medio de estupefacientes y consumo estimadob de buprenorfinac en dosis diarias definidas con fines estadísticos
por millón de habitantes por día, 2009-2011
175 Burkina Fasoe 25 — 1 — — — << — << — 1
Cameroon — Cameroun — Camerún 1 — << — — — 1 — << << 1
Chade — Tchade — — << — — — 1 — << — 1
Comorosf — Comoresf — Comorasf — — — — — — << — 1 — 1
Eritrea — Érythrée — — << — — — << — 1 — 1
180 Nigeria — Nigéria — — — — — — << — << — <<
Note: The symbol “<<” indicates an amount less than 1 defined daily dose for statistical purposes per million inhabitants per day. — Note: Le symbole “<<” signifie que la consommation était inférieure à 1 dose quotidienne déterminée à des fins statistiques par million d’habitants et par jour. — Nota: El símbolo “<<” indica una cantidad menor a una dosis diaria definida con fines estadísticos por millón de habitantes por día.
aAs at 1 November 2012, the following 28 countries and territories either had not submitted any statistical forms or had not provided any consumption data for three consecutive years (2009-2011): Antigua and Barbuda, Aruba, Ascension Islands, Barbados, British Virgin Islands, Burundi, Central African Republic, Congo, Curaçao,Djibouti, Equatorial Guinea, Falkland Islands (Malvinas), Gambia, Guinea, Lesotho, Liberia, Mauritania, Marshall Islands, Micronesia (Federated States of), Niue, Papua New Guinea, Saint Kitts and Nevis, Sierra Leone, Solomon Islands, Somalia, Swaziland, Timor-Leste, Tristan da Cunha. — Au 1er novembre 2012, les 28 pays et territoires suivants n’avaient soit pas communiqué de formulaire statistique, soit pas communiqué de données sur la consommation pendant trois années consécutives (2009-2011): Antigua-et-Barbuda, Aruba, Barbade, Burundi, Congo, Curaçao, Djibouti, Gambie, Guinée, Guinée équatoriale, Île de l’Ascension, Îles Falkland (Malvinas), Îles Marshall, Îles Salomon, Îles Vierges britanniques, Lesotho, Libéria, Mauritanie, Micronésie (États fédérés de), Niue, Papouasie-Nouvelle-Guinée, République centrafricaine, Saint-Kitts-et-Nevis, Sierra Leone, Somalie, Swaziland, Timor-Leste, Tristan da Cunha. — Hasta el 1 de noviembre de 2012, los siguientes 27 países y territorios no habían presentado formularios estadísticos, o no habían proporcionado datos sobre el consumo durante tres años consecutivos (2009-2011): Antigua y Barbuda, Aruba, Barbados, Burundi, Congo, Curaçao, Djibouti, Fiji, Gambia, Guinea, Guinea Ecuatorial, Isla de la Ascensión, Islas Malvinas (Falkland Islands), Islas Marshall, Islas Salomón, Islas Vírgenes Británicas, Lesotho, Liberia, Micronesia (Estados Federados de), Niue, Papua Nueva Guinea, República Centroafricana, Saint Kitts y Nevis, Sierra Leone, Somalia, Swazilandia, Timor-Leste, Tristan da Cunha.
bStatistical data submitted by Governments are used by INCB to calculate the approximate consumption in a given year, which is not reported as such by Govern-ments. — L’OICS se fonde sur les données statistiques communiquées par les gouvernements pour calculer la consommation approximative pour une année donnée, ces chiffres en tant que tels n’étant pas communiqués par les gouvernements. — La JIFE utiliza los datos estadísticos presentados por los gobiernos para calcular el consumo aproximado correspondiente a determinado año cuando estos no se lo han comunicado.
cAn opioid currently controlled under the 1971 Convention on Psychotropic Substances. — Opioïde actuellement placé sous contrôle en vertu de la Convention de 1971 sur les substances psychotropes. — Opioide actualmente sujeto a fiscalización en virtud del Convenio sobre Sustancias Sicotrópicas de 1971.
dTotal consumption of narcotic drugs and respective ranking do not reflect the data for buprenorphine. — La consommation totale de stupéfiants et le classement établi sur cette base ne tiennent pas compte des chiffres relatifs à la buprénorphine. — En el consumo total de estupefacientes y la respectiva ordenación no se reflejan los datos correspondientes a la buprenorfina.
eCalculation is based on data covering two years only. — Calcul effectué à partir de données concernant deux années seulement. — El cálculo está basado en datos correspondientes a dos años únicamente.
fCalculation is based on data covering one year only. — Calcul effectué à partir de données concernant une année seulement. — El cálculo está basado en datos correspondientes a un año únicamente.
gThe Netherlands Antilles was dissolved on 10 October 2010, resulting in two new constituent entities, Curaçao and Sint Maarten. No data for the Netherlands Antilles were submitted after that date. — Le 10 octobre 2010, les Antilles néerlandaises ont cessé d’exister et Curaçao et Saint-Martin sont devenus deux pays constitutifs autonomes. Aucune donnée concernant les Antilles néerlandaises n’a été communiquée après cette date. — Las Antillas Neerlandesas se disolvieron el 10 de octubre de 2010 y pasaron a ser dos nuevas entidades constitutivas: Curaçao y Sint Maarten. No se presentaron datos relativos a las Antillas Neerlandesas después de esa fecha.
hSince 16 September 2011, “Libya” has replaced “Libyan Arab Jamahiriya” as the short name used in the United Nations. — Depuis le 16 septembre 2011, “Libye” est la forme courte utilisée à l’Organisation des Nations Unies à la place de “Jamahiriya arabe libyenne”. — A partir del 16 de septiembre de 2011, “Libia” reemplaza a “Jamahiriya Árabe Libia” como forma abreviada del nombre del país utilizada en las Naciones Unidas.
iSince 31 March 2009, “Plurinational State of Bolivia” has replaced “Bolivia” as the short name used in the United Nations. — Depuis le 31 mars 2009, “État pluri-national de Bolivie” est la forme qui remplace “Bolivie” à l’Organisation des Nations Unies. — Desde el 31 de marzo de 2009, “Estado Plurinacional de Bolivia” reemplaza a “Bolivia” como forma abreviada del nombre de ese país utilizada en las Naciones Unidas.
175
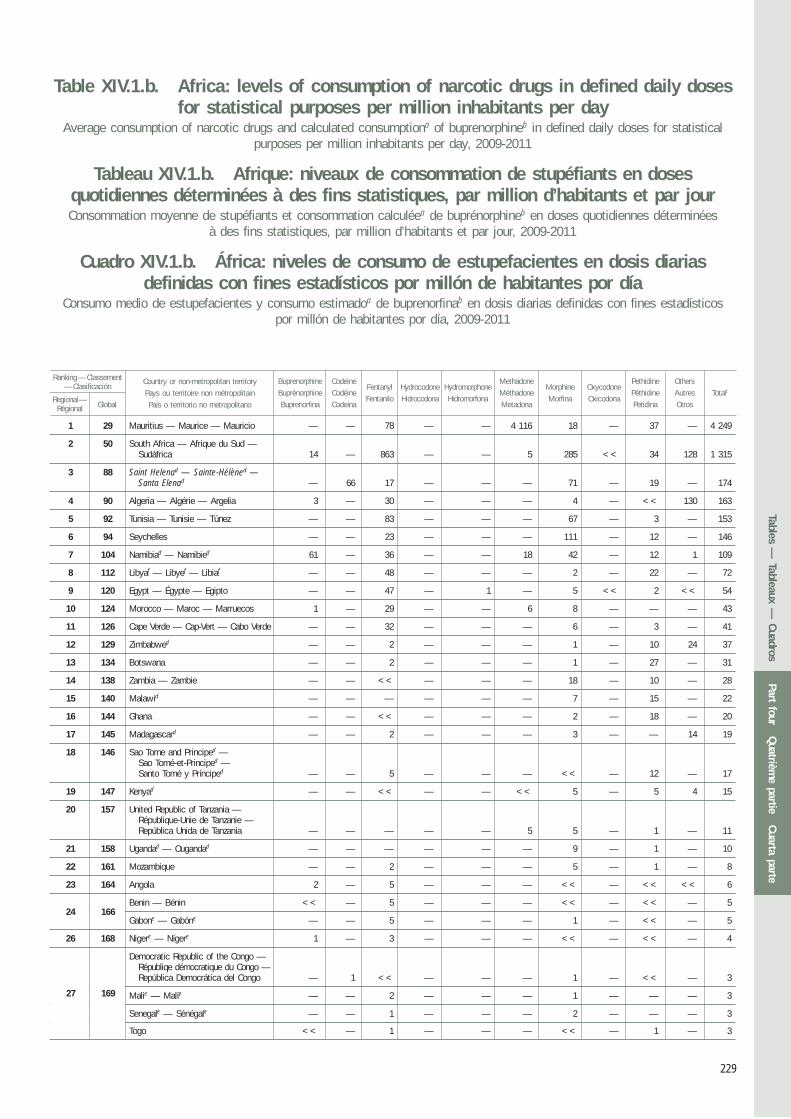
Country or non-metropolitan territoryPays ou territoire non métropolitainPaís o territorio no metropolitano
Ranking — Classement— Clasificación
GlobalRegional—
Régional
MorphineMorfina
CodeineCodéineCodeína
MethadoneMéthadoneMetadona
PethidinePéthidinePetidina
OthersAutresOtros
TotalcFentanylFentanilo
HydrocodoneHidrocodona
HydromorphoneHidromorfona
OxycodoneOxicodona
BuprenorphineBuprénorphineBuprenorfina
Table XIV.1.b. Africa: levels of consumption of narcotic drugs in defined daily doses for statistical purposes per million inhabitants per day
Average consumption of narcotic drugs and calculated consumptiona of buprenorphineb in defined daily doses for statistical purposes per million inhabitants per day, 2009-2011
Tableau XIV.1.b. Afrique: niveaux de consommation de stupéfiants en doses quotidiennes déterminées à des fins statistiques, par million d’habitants et par jourConsommation moyenne de stupéfiants et consommation calculéea de buprénorphineb en doses quotidiennes déterminées
à des fins statistiques, par million d’habitants et par jour, 2009-2011
Cuadro XIV.1.b. África: niveles de consumo de estupefacientes en dosis diarias definidas con fines estadísticos por millón de habitantes por día
Consumo medio de estupefacientes y consumo estimadoa de buprenorfinab en dosis diarias definidas con fines estadísticos por millón de habitantes por día, 2009-2011
229
1 29 Mauritius — Maurice — Mauricio — — 78 — — 4 116 18 — 37 — 4 249
2 50 South Africa — Afrique du Sud — Sudáfrica 14 — 863 — — 5 285 << 34 128 1 315
3 88 Saint Helenad — Sainte-Hélèned — Santa Elenad — 66 17 — — — 71 — 19 — 174
4 90 Algeria — Algérie — Argelia 3 — 30 — — — 4 — << 130 163
5 92 Tunisia — Tunisie — Túnez — — 83 — — — 67 — 3 — 153
6 94 Seychelles — — 23 — — — 111 — 12 — 146
7 104 Namibiad — Namibied 61 — 36 — — 18 42 — 12 1 109
8 112 Libyaf — Libyef — Libiaf — — 48 — — — 2 — 22 — 72
9 120 Egypt — Égypte — Egipto — — 47 — 1 — 5 << 2 << 54
10 124 Morocco — Maroc — Marruecos 1 — 29 — — 6 8 — — — 43
11 126 Cape Verde — Cap-Vert — Cabo Verde — — 32 — — — 6 — 3 — 41
12 129 Zimbabwed — — 2 — — — 1 — 10 24 37
13 134 Botswana — — 2 — — — 1 — 27 — 31
14 138 Zambia — Zambie — — << — — — 18 — 10 — 28
15 140 Malawid — — — — — — 7 — 15 — 22
16 144 Ghana — — << — — — 2 — 18 — 20
17 145 Madagascard — — 2 — — — 3 — — 14 19
18 146 Sao Tome and Principed — Sao Tomé-et-Principed — Santo Tomé y Prínciped — — 5 — — — << — 12 — 17
19 147 Kenyad — — << — — << 5 — 5 4 15
20 157 United Republic of Tanzania — République-Unie de Tanzanie — República Unida de Tanzanía — — — — — 5 5 — 1 — 11
21 158 Ugandad — Ougandad — — — — — — 9 — 1 — 10
22 161 Mozambique — — 2 — — — 5 — 1 — 8
23 164 Angola 2 — 5 — — — << — << << 6
24 165 Benin — Bénin << — 5 — — — << — << — 5
Gabone — Gabóne — — 5 — — — 1 — << — 5
26 168 Nigere — Nígere 1 — 3 — — — << — << — 4
27 169 Democratic Republic of the Congo — Républiqe démocratique du Congo — República Democrática del Congo — 1 << — — — 1 — << — 3
Malie — Malíe — — 2 — — — 1 — — — 3
Senegale — Sénégale — — 1 — — — 2 — — — 3
Togo << — 1 — — — << — 1 — 3
24 166
27 169
Part fourQuatrièm
e partieCuarta parte
Tables — Tableaux —
CuadrosPart four
Quatrième partie
Cuarta parteTables —
Tableaux — Cuadros
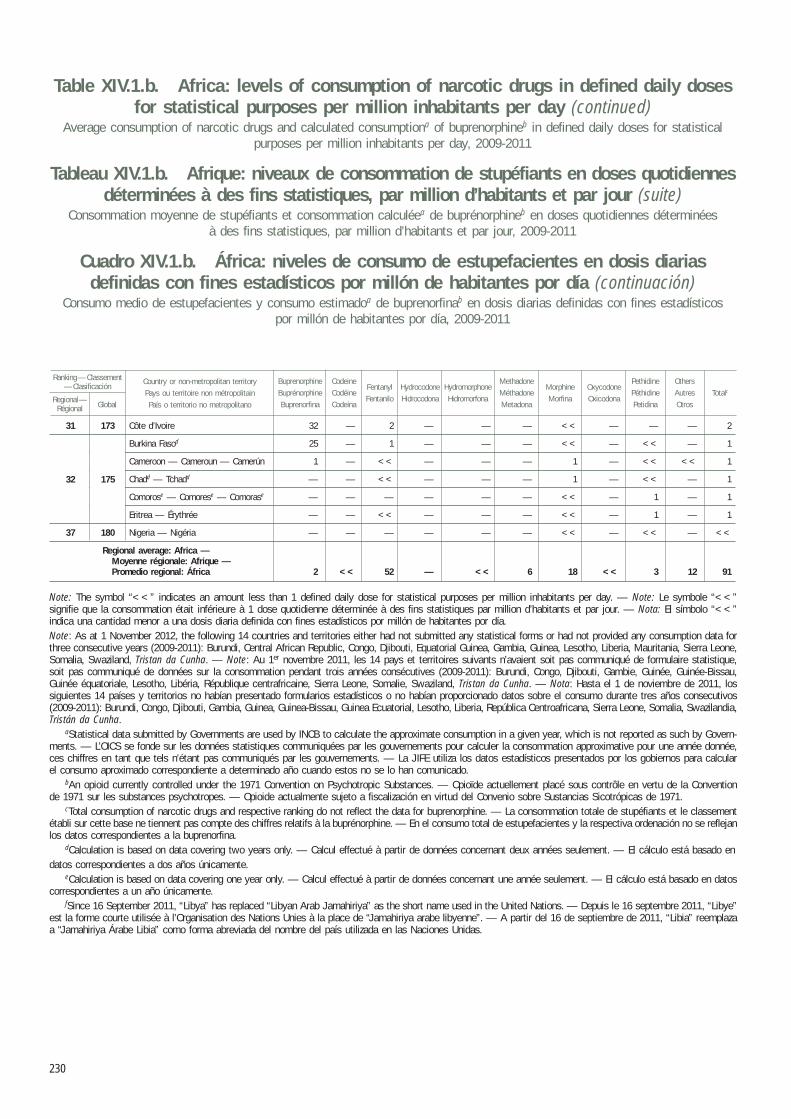
Table XIV.1.b. Africa: levels of consumption of narcotic drugs in defined daily doses for statistical purposes per million inhabitants per day (continued)
Average consumption of narcotic drugs and calculated consumptiona of buprenorphineb in defined daily doses for statistical purposes per million inhabitants per day, 2009-2011
Tableau XIV.1.b. Afrique: niveaux de consommation de stupéfiants en doses quotidiennes déterminées à des fins statistiques, par million d’habitants et par jour (suite)
Consommation moyenne de stupéfiants et consommation calculéea de buprénorphineb en doses quotidiennes déterminées à des fins statistiques, par million d’habitants et par jour, 2009-2011
Cuadro XIV.1.b. África: niveles de consumo de estupefacientes en dosis diarias definidas con fines estadísticos por millón de habitantes por día (continuación)
Consumo medio de estupefacientes y consumo estimadoa de buprenorfinab en dosis diarias definidas con fines estadísticos por millón de habitantes por día, 2009-2011
Country or non-metropolitan territoryPays ou territoire non métropolitainPaís o territorio no metropolitano
Ranking — Classement— Clasificación
Global
MorphineMorfina
CodeineCodéineCodeína
MethadoneMéthadoneMetadona
PethidinePéthidinePetidina
OthersAutresOtros
TotalcFentanylFentanilo
HydrocodoneHidrocodona
HydromorphoneHidromorfona
OxycodoneOxicodona
BuprenorphineBuprénorphineBuprenorfina
Regional—Régional
230
31 173 Côte d’Ivoire 32 — 2 — — — << — — — 2
32 174 Burkina Fasod 25 — 1 — — — << — << — 1
Cameroon — Cameroun — Camerún 1 — << — — — 1 — << << 1
Chadd — Tchadd — — << — — — 1 — << — 1
Comorose — Comorese — Comorase — — — — — — << — 1 — 1
Eritrea — Érythrée — — << — — — << — 1 — 1
37 180 Nigeria — Nigéria — — — — — — << — << — <<
Regional average: Africa — Moyenne régionale: Afrique — Promedio regional: África 2 << 52 — << 6 18 << 3 12 91
32 175
Note: The symbol “<<” indicates an amount less than 1 defined daily dose for statistical purposes per million inhabitants per day. — Note: Le symbole “<<” signifie que la consommation était inférieure à 1 dose quotidienne déterminée à des fins statistiques par million d’habitants et par jour. — Nota: El símbolo “<<” indica una cantidad menor a una dosis diaria definida con fines estadísticos por millón de habitantes por día.Note: As at 1 November 2012, the following 14 countries and territories either had not submitted any statistical forms or had not provided any consumption data for three consecutive years (2009-2011): Burundi, Central African Republic, Congo, Djibouti, Equatorial Guinea, Gambia, Guinea, Lesotho, Liberia, Mauritania, Sierra Leone, Somalia, Swaziland, Tristan da Cunha. — Note: Au 1er novembre 2011, les 14 pays et territoires suivants n’avaient soit pas communiqué de formulaire statistique, soit pas communiqué de données sur la consommation pendant trois années consécutives (2009-2011): Burundi, Congo, Djibouti, Gambie, Guinée, Guinée-Bissau, Guinée équatoriale, Lesotho, Libéria, République centrafricaine, Sierra Leone, Somalie, Swaziland, Tristan da Cunha. — Nota: Hasta el 1 de noviembre de 2011, los siguientes 14 países y territorios no habían presentado formularios estadísticos o no habían proporcionado datos sobre el consumo durante tres años consecutivos (2009-2011): Burundi, Congo, Djibouti, Gambia, Guinea, Guinea-Bissau, Guinea Ecuatorial, Lesotho, Liberia, República Centroafricana, Sierra Leone, Somalia, Swazilandia, Tristán da Cunha.
aStatistical data submitted by Governments are used by INCB to calculate the approximate consumption in a given year, which is not reported as such by Govern-ments. — L’OICS se fonde sur les données statistiques communiquées par les gouvernements pour calculer la consommation approximative pour une année donnée, ces chiffres en tant que tels n’étant pas communiqués par les gouvernements. — La JIFE utiliza los datos estadísticos presentados por los gobiernos para calcular el consumo aproximado correspondiente a determinado año cuando estos no se lo han comunicado.
bAn opioid currently controlled under the 1971 Convention on Psychotropic Substances. — Opioïde actuellement placé sous contrôle en vertu de la Convention de 1971 sur les substances psychotropes. — Opioide actualmente sujeto a fiscalización en virtud del Convenio sobre Sustancias Sicotrópicas de 1971.
cTotal consumption of narcotic drugs and respective ranking do not reflect the data for buprenorphine. — La consommation totale de stupéfiants et le classement établi sur cette base ne tiennent pas compte des chiffres relatifs à la buprénorphine. — En el consumo total de estupefacientes y la respectiva ordenación no se reflejan los datos correspondientes a la buprenorfina.
dCalculation is based on data covering two years only. — Calcul effectué à partir de données concernant deux années seulement. — El cálculo está basado endatos correspondientes a dos años únicamente.
eCalculation is based on data covering one year only. — Calcul effectué à partir de données concernant une année seulement. — El cálculo está basado en datos correspondientes a un año únicamente.
fSince 16 September 2011, “Libya” has replaced “Libyan Arab Jamahiriya” as the short name used in the United Nations. — Depuis le 16 septembre 2011, “Libye” est la forme courte utilisée à l’Organisation des Nations Unies à la place de “Jamahiriya arabe libyenne”. — A partir del 16 de septiembre de 2011, “Libia” reemplaza a “Jamahiriya Árabe Libia” como forma abreviada del nombre del país utilizada en las Naciones Unidas.
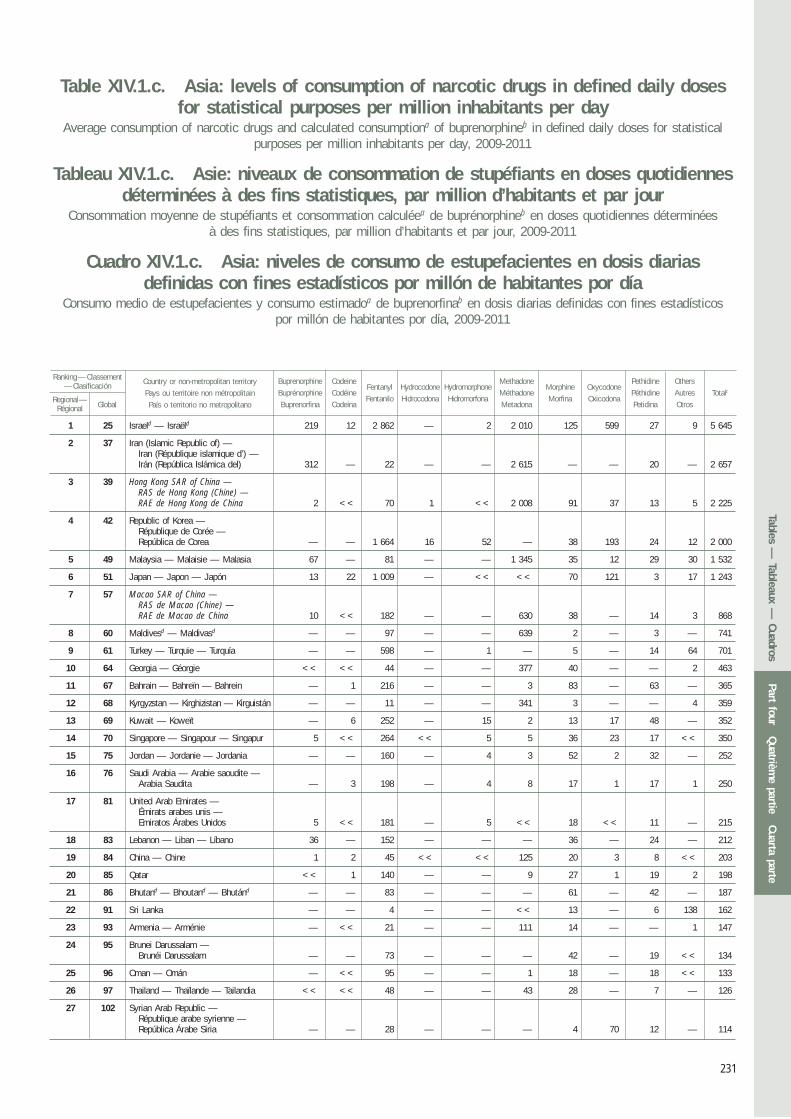
Country or non-metropolitan territoryPays ou territoire non métropolitainPaís o territorio no metropolitanoGlobal
MorphineMorfina
CodeineCodéineCodeína
MethadoneMéthadoneMetadona
PethidinePéthidinePetidina
OthersAutresOtros
TotalcFentanylFentanilo
HydrocodoneHidrocodona
HydromorphoneHidromorfona
OxycodoneOxicodona
BuprenorphineBuprénorphineBuprenorfina
Table XIV.1.c. Asia: levels of consumption of narcotic drugs in defined daily doses for statistical purposes per million inhabitants per day
Average consumption of narcotic drugs and calculated consumptiona of buprenorphineb in defined daily doses for statistical purposes per million inhabitants per day, 2009-2011
Tableau XIV.1.c. Asie: niveaux de consommation de stupéfiants en doses quotidiennes déterminées à des fins statistiques, par million d’habitants et par jour
Consommation moyenne de stupéfiants et consommation calculéea de buprénorphineb en doses quotidiennes déterminées à des fins statistiques, par million d’habitants et par jour, 2009-2011
Cuadro XIV.1.c. Asia: niveles de consumo de estupefacientes en dosis diarias definidas con fines estadísticos por millón de habitantes por día
Consumo medio de estupefacientes y consumo estimadoa de buprenorfinab en dosis diarias definidas con fines estadísticos por millón de habitantes por día, 2009-2011
Regional—Régional
Ranking — Classement— Clasificación
231
1 25 Israeld — Israëld 219 12 2 862 — 2 2 010 125 599 27 9 5 645
2 37 Iran (Islamic Republic of) — Iran (République islamique d’) — Irán (República Islámica del) 312 — 22 — — 2 615 — — 20 — 2 657
3 39 Hong Kong SAR of China — RAS de Hong Kong (Chine) — RAE de Hong Kong de China 2 << 70 1 << 2 008 91 37 13 5 2 225
4 42 Republic of Korea — République de Corée — República de Corea — — 1 664 16 52 — 38 193 24 12 2 000
5 49 Malaysia — Malaisie — Malasia 67 — 81 — — 1 345 35 12 29 30 1 532
6 51 Japan — Japon — Japón 13 22 1 009 — << << 70 121 3 17 1 243
7 57 Macao SAR of China — RAS de Macao (Chine) — RAE de Macao de China 10 << 182 — — 630 38 — 14 3 868
8 60 Maldivesd — Maldivasd — — 97 — — 639 2 — 3 — 741
9 61 Turkey — Turquie — Turquía — — 598 — 1 — 5 — 14 64 701
10 64 Georgia — Géorgie << << 44 — — 377 40 — — 2 463
11 67 Bahrain — Bahreïn — Bahrein — 1 216 — — 3 83 — 63 — 365
12 68 Kyrgyzstan — Kirghizistan — Kirguistán — — 11 — — 341 3 — — 4 359
13 69 Kuwait — Koweït — 6 252 — 15 2 13 17 48 — 352
14 70 Singapore — Singapour — Singapur 5 << 264 << 5 5 36 23 17 << 350
15 75 Jordan — Jordanie — Jordania — — 160 — 4 3 52 2 32 — 252
16 76 Saudi Arabia — Arabie saoudite — Arabia Saudita — 3 198 — 4 8 17 1 17 1 250
17 81 United Arab Emirates — Émirats arabes unis — Emiratos Árabes Unidos 5 << 181 — 5 << 18 << 11 — 215
18 83 Lebanon — Liban — Líbano 36 — 152 — — — 36 — 24 — 212
19 84 China — Chine 1 2 45 << << 125 20 3 8 << 203
20 85 Qatar << 1 140 — — 9 27 1 19 2 198
21 86 Bhutand — Bhoutand — Bhutánd — — 83 — — — 61 — 42 — 187
22 91 Sri Lanka — — 4 — — << 13 — 6 138 162
23 93 Armenia — Arménie — << 21 — — 111 14 — — 1 147
24 95 Brunei Darussalam — Brunéi Darussalam — — 73 — — — 42 — 19 << 134
25 96 Oman — Omán — << 95 — — 1 18 — 18 << 133
26 97 Thailand — Thaïlande — Tailandia << << 48 — — 43 28 — 7 — 126
27 102 Syrian Arab Republic — République arabe syrienne — República Árabe Siria — — 28 — — — 4 70 12 — 114
Part fourQuatrièm
e partieCuarta parte
Tables — Tableaux —
CuadrosPart four
Quatrième partie
Cuarta parteTables —
Tableaux — Cuadros
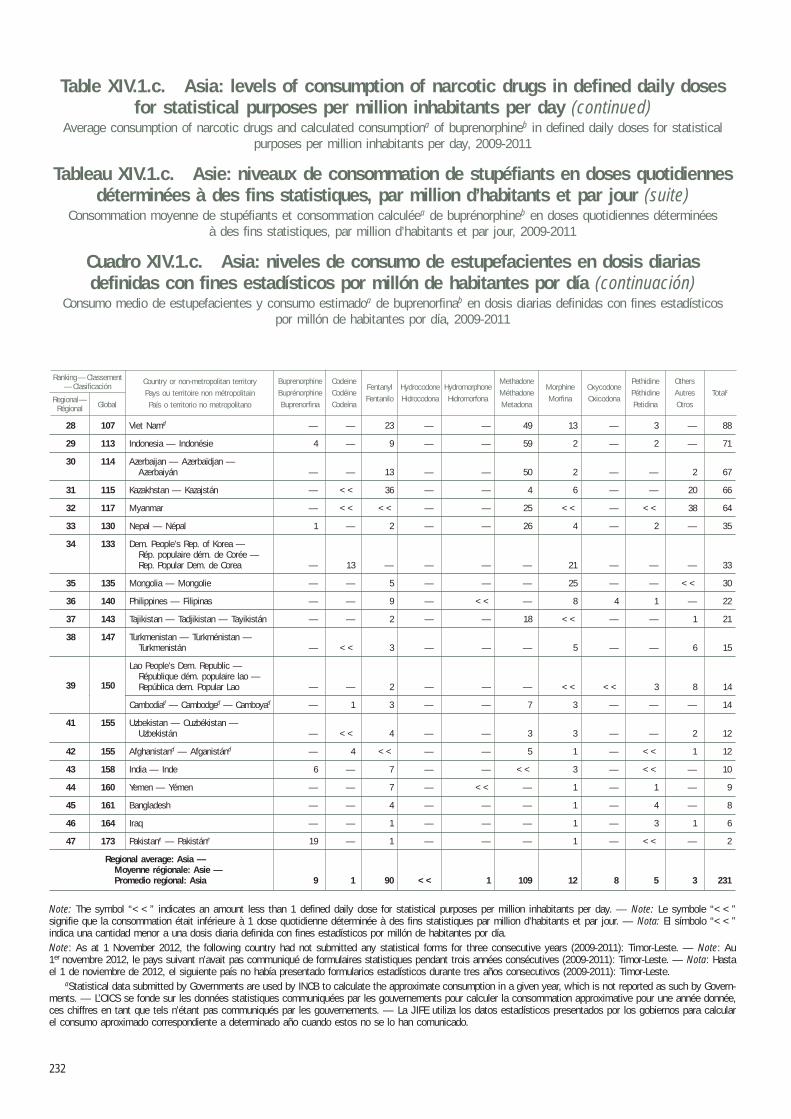
Country or non-metropolitan territoryPays ou territoire non métropolitainPaís o territorio no metropolitanoGlobal
MorphineMorfina
CodeineCodéineCodeína
MethadoneMéthadoneMetadona
PethidinePéthidinePetidina
OthersAutresOtros
TotalcFentanylFentanilo
HydrocodoneHidrocodona
HydromorphoneHidromorfona
OxycodoneOxicodona
BuprenorphineBuprénorphineBuprenorfina
Table XIV.1.c. Asia: levels of consumption of narcotic drugs in defined daily doses for statistical purposes per million inhabitants per day (continued)
Average consumption of narcotic drugs and calculated consumptiona of buprenorphineb in defined daily doses for statistical purposes per million inhabitants per day, 2009-2011
Tableau XIV.1.c. Asie: niveaux de consommation de stupéfiants en doses quotidiennes déterminées à des fins statistiques, par million d’habitants et par jour (suite)
Consommation moyenne de stupéfiants et consommation calculéea de buprénorphineb en doses quotidiennes déterminées à des fins statistiques, par million d’habitants et par jour, 2009-2011
Cuadro XIV.1.c. Asia: niveles de consumo de estupefacientes en dosis diarias definidas con fines estadísticos por millón de habitantes por día (continuación)
Consumo medio de estupefacientes y consumo estimadoa de buprenorfinab en dosis diarias definidas con fines estadísticos por millón de habitantes por día, 2009-2011
Regional—Régional
Ranking — Classement— Clasificación
232
Note: The symbol “<<” indicates an amount less than 1 defined daily dose for statistical purposes per million inhabitants per day. — Note: Le symbole “<<” signifie que la consommation était inférieure à 1 dose quotidienne déterminée à des fins statistiques par million d’habitants et par jour. — Nota: El símbolo “<<” indica una cantidad menor a una dosis diaria definida con fines estadísticos por millón de habitantes por día.Note: As at 1 November 2012, the following country had not submitted any statistical forms for three consecutive years (2009-2011): Timor-Leste. — Note: Au 1er novembre 2012, le pays suivant n’avait pas communiqué de formulaires statistiques pendant trois années consécutives (2009-2011): Timor-Leste. — Nota: Hasta el 1 de noviembre de 2012, el siguiente país no había presentado formularios estadísticos durante tres años consecutivos (2009-2011): Timor-Leste.
aStatistical data submitted by Governments are used by INCB to calculate the approximate consumption in a given year, which is not reported as such by Govern-ments. — L’OICS se fonde sur les données statistiques communiquées par les gouvernements pour calculer la consommation approximative pour une année donnée, ces chiffres en tant que tels n’étant pas communiqués par les gouvernements. — La JIFE utiliza los datos estadísticos presentados por los gobiernos para calcular el consumo aproximado correspondiente a determinado año cuando estos no se lo han comunicado.
28 107 Viet Namd — — 23 — — 49 13 — 3 — 88
29 113 Indonesia — Indonésie 4 — 9 — — 59 2 — 2 — 71
30 114 Azerbaijan — Azerbaïdjan — Azerbaiyán — — 13 — — 50 2 — — 2 67
31 115 Kazakhstan — Kazajstán — << 36 — — 4 6 — — 20 66
32 117 Myanmar — << << — — 25 << — << 38 64
33 130 Nepal — Népal 1 — 2 — — 26 4 — 2 — 35
34 133 Dem. People’s Rep. of Korea — Rép. populaire dém. de Corée — Rep. Popular Dem. de Corea — 13 — — — — 21 — — — 33
35 135 Mongolia — Mongolie — — 5 — — — 25 — — << 30
36 140 Philippines — Filipinas — — 9 — << — 8 4 1 — 22
37 143 Tajikistan — Tadjikistan — Tayikistán — — 2 — — 18 << — — 1 21
38 147 Turkmenistan — Turkménistan — Turkmenistán — << 3 — — — 5 — — 6 15
39 149 Lao People’s Dem. Republic — République dém. populaire lao — República dem. Popular Lao — — 2 — — — << << 3 8 14
Cambodiad — Cambodged — Camboyad — 1 3 — — 7 3 — — — 14
41 155 Uzbekistan — Ouzbékistan — Uzbekistán — << 4 — — 3 3 — — 2 12
42 155 Afghanistand — Afganistánd — 4 << — — 5 1 — << 1 12
43 158 India — Inde 6 — 7 — — << 3 — << — 10
44 160 Yemen — Yémen — — 7 — << — 1 — 1 — 9
45 161 Bangladesh — — 4 — — — 1 — 4 — 8
46 164 Iraq — — 1 — — — 1 — 3 1 6
47 173 Pakistane — Pakistáne 19 — 1 — — — 1 — << — 2
Regional average: Asia — Moyenne régionale: Asie — Promedio regional: Asia 9 1 90 << 1 109 12 8 5 3 231
39 150
Table XIV.1.c. Asia: levels of consumption of narcotic drugs in defined daily doses for statistical purposes per million inhabitants per day (continued)
Average consumption of narcotic drugs and calculated consumptiona of buprenorphineb in defined daily doses for statistical purposes per million inhabitants per day, 2009-2011
Tableau XIV.1.c. Asie: niveaux de consommation de stupéfiants en doses quotidiennes déterminées à des fins statistiques, par million d’habitants et par jour (suite)
Consommation moyenne de stupéfiants et consommation calculéea de buprénorphineb en doses quotidiennes déterminées à des fins statistiques, par million d’habitants et par jour, 2009-2011
Cuadro XIV.1.c. Asia: niveles de consumo de estupefacientes en dosis diarias definidas con fines estadísticos por millón de habitantes por día (continuación)
Consumo medio de estupefacientes y consumo estimadoa de buprenorfinab en dosis diarias definidas con fines estadísticos por millón de habitantes por día, 2009-2011
233
aStatistical data submitted by Governments are used by INCB to calculate the approximate consumption in a given year, which is not reported as such by Gov-ernments. — L’OICS se fonde sur les données statistiques communiquées par les gouvernements pour calculer la consommation approximative pour une année donnée, ces chiffres en tant que tels n’étant pas communiqués par les gouvernements. — La JIFE utiliza los datos estadísticos presentados por los gobiernos para calcular el consumo aproximado correspondiente a determinado año cuando estos no se lo han comunicado.
bAn opioid currently controlled under the 1971 Convention on Psychotropic Substances. — Opioïde actuellement placé sous contrôle en vertu de la Convention de 1971 sur les substances psychotropes. — Opioide actualmente sujeto a fiscalización en virtud del Convenio sobre Sustancias Sicotrópicas de 1971.
cTotal consumption of narcotic drugs and respective ranking do not reflect the data for buprenorphine. — La consommation totale de stupéfiants et le classement établi sur cette base ne tiennent pas compte des chiffres relatifs à la buprénorphine. — En el consumo total de estupefacientes y la respectiva ordenación no se reflejan los datos correspondientes a la buprenorfina.
dThe Netherlands Antilles was dissolved on 10 October 2010, resulting in two new constituent entities, Curaçao and Sint Maarten. No data for the Netherlands Antilles were submitted after that date. — Le 10 octobre 2010, les Antilles néerlandaises ont cessé d’exister et Curaçao et Saint-Martin sont devenus deux pays constitutifs autonomes. Aucune donnée concernant les Antilles néerlandaises n’a été communiquée après cette date. — Las Antillas Neerlandesas se disolvieron el 10 de octubre de 2010 y pasaron a ser dos nuevas entidades constitutivas: Curaçao y Sint Maarten. No se presentaron datos relativos a las Antillas Neerlandesas después de esa fecha.
eCalculation is based on data covering two years only. — Calcul effectué à partir de données concernant deux années seulement. — El cálculo está basado endatos correspondientes a dos años únicamente.
fCalculation is based on data covering one year only. — Calcul effectué à partir de données concernant une année seulement. — El cálculo está basado en datos correspondientes a un año únicamente.
Part fourQuatrièm
e partieCuarta parte
Tables — Tableaux —
Cuadros
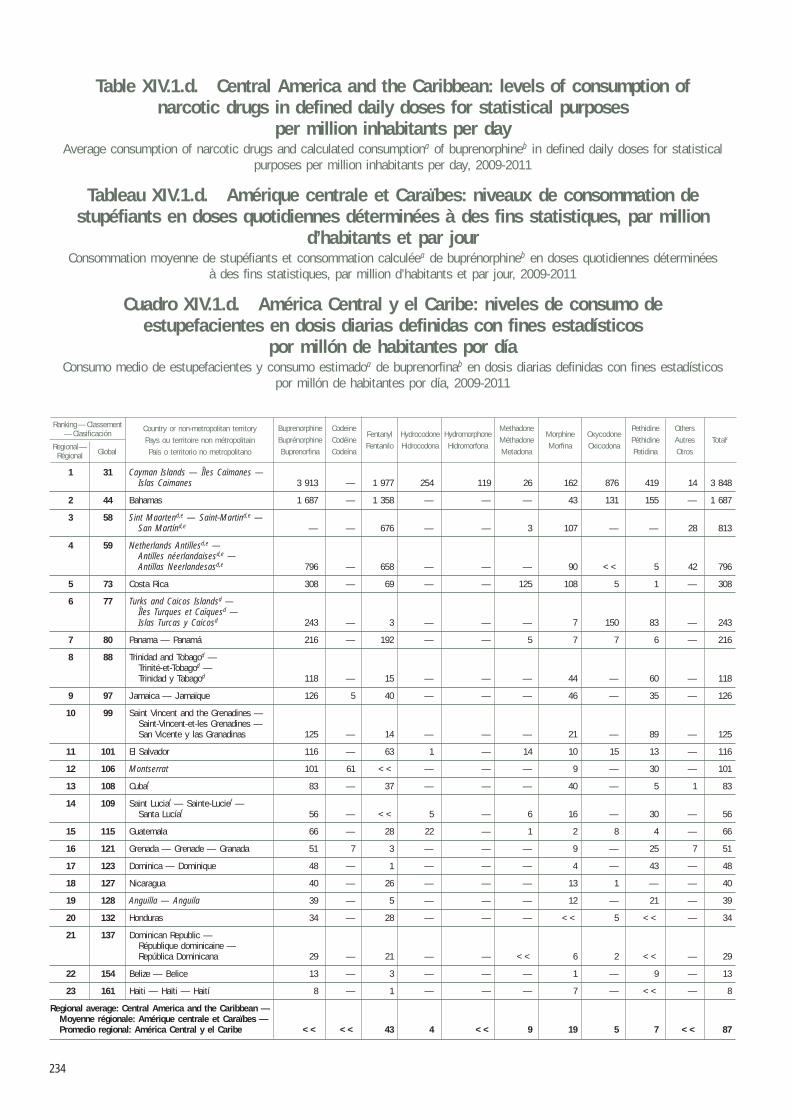
Country or non-metropolitan territoryPays ou territoire non métropolitainPaís o territorio no metropolitano
Ranking — Classement— Clasificación
GlobalRegional—
Régional
MorphineMorfina
CodeineCodéineCodeína
MethadoneMéthadoneMetadona
PethidinePéthidinePetidina
OthersAutresOtros
TotalcFentanylFentanilo
HydrocodoneHidrocodona
HydromorphoneHidromorfona
OxycodoneOxicodona
BuprenorphineBuprénorphineBuprenorfina
Table XIV.1.d. Central America and the Caribbean: levels of consumption of narcotic drugs in defined daily doses for statistical purposes
per million inhabitants per dayAverage consumption of narcotic drugs and calculated consumptiona of buprenorphineb in defined daily doses for statistical
purposes per million inhabitants per day, 2009-2011
Tableau XIV.1.d. Amérique centrale et Caraïbes: niveaux de consommation de stupéfiants en doses quotidiennes déterminées à des fins statistiques, par million
d’habitants et par jourConsommation moyenne de stupéfiants et consommation calculéea de buprénorphineb en doses quotidiennes déterminées
à des fins statistiques, par million d’habitants et par jour, 2009-2011
Cuadro XIV.1.d. América Central y el Caribe: niveles de consumo de estupefacientes en dosis diarias definidas con fines estadísticos
por millón de habitantes por díaConsumo medio de estupefacientes y consumo estimadoa de buprenorfinab en dosis diarias definidas con fines estadísticos
por millón de habitantes por día, 2009-2011
234
1 31 Cayman Islands — Îles Caïmanes — Islas Caimanes 3 913 — 1 977 254 119 26 162 876 419 14 3 848
2 44 Bahamas 1 687 — 1 358 — — — 43 131 155 — 1 687
3 58 Sint Maartend,e — Saint-Martind,e — San Martínd,e — — 676 — — 3 107 — — 28 813
4 59 Netherlands Antillesd,e — Antilles néerlandaisesd,e — Antillas Neerlandesasd,e 796 — 658 — — — 90 << 5 42 796
5 73 Costa Rica 308 — 69 — — 125 108 5 1 — 308
6 77 Turks and Caicos Islandsd — Îles Turques et Caïquesd — Islas Turcas y Caicosd 243 — 3 — — — 7 150 83 — 243
7 80 Panama — Panamá 216 — 192 — — 5 7 7 6 — 216
8 88 Trinidad and Tobagod — Trinité-et-Tobagod — Trinidad y Tabagod 118 — 15 — — — 44 — 60 — 118
9 97 Jamaica — Jamaïque 126 5 40 — — — 46 — 35 — 126
10 99 Saint Vincent and the Grenadines — Saint-Vincent-et-les Grenadines — San Vicente y las Granadinas 125 — 14 — — — 21 — 89 — 125
11 101 El Salvador 116 — 63 1 — 14 10 15 13 — 116
12 106 Montserrat 101 61 << — — — 9 — 30 — 101
13 108 Cubaf 83 — 37 — — — 40 — 5 1 83
14 109 Saint Luciaf — Sainte-Lucief — Santa Lucíaf 56 — << 5 — 6 16 — 30 — 56
15 115 Guatemala 66 — 28 22 — 1 2 8 4 — 66
16 121 Grenada — Grenade — Granada 51 7 3 — — — 9 — 25 7 51
17 123 Dominica — Dominique 48 — 1 — — — 4 — 43 — 48
18 127 Nicaragua 40 — 26 — — — 13 1 — — 40
19 128 Anguilla — Anguila 39 — 5 — — — 12 — 21 — 39
20 132 Honduras 34 — 28 — — — << 5 << — 34
21 137 Dominican Republic — République dominicaine — República Dominicana 29 — 21 — — << 6 2 << — 29
22 154 Belize — Belice 13 — 3 — — — 1 — 9 — 13
23 161 Haiti — Haïti — Haití 8 — 1 — — — 7 — << — 8
Regional average: Central America and the Caribbean — Moyenne régionale: Amérique centrale et Caraïbes — Promedio regional: América Central y el Caribe << << 43 4 << 9 19 5 7 << 87
Table XIV.1.d. Central America and the Caribbean: levels of consumption of narcotic drugs in defined daily doses for statistical purposes
per million inhabitants per day (continued)Average consumption of narcotic drugs and calculated consumptiona of buprenorphineb in defined daily doses for statistical
purposes per million inhabitants per day, 2009-2011
Tableau XIV.1.d. Amérique centrale et Caraïbes: niveaux de consommation de stupéfiants en doses quotidiennes déterminées à des fins statistiques, par million
d’habitants et par jour (suite)Consommation moyenne de stupéfiants et consommation calculéea de buprénorphineb en doses quotidiennes déterminées
à des fins statistiques, par million d’habitants et par jour, 2009-2011
Cuadro XIV.1.d. América Central y el Caribe: niveles de consumo de estupefacientes en dosis diarias definidas con fines estadísticos
por millón de habitantes por día (continuación)Consumo medio de estupefacientes y consumo estimadoa de buprenorfinab en dosis diarias definidas con fines estadísticos
por millón de habitantes por día, 2009-2011
235
Note: The symbol “<<” indicates an amount less than 1 defined daily dose for statistical purposes per million inhabitants per day. — Note: Le symbole “<<” signifie que la consommation était inférieure à 1 dose quotidienne déterminée à des fins statistiques par million d’habitants et par jour. — Nota: El símbolo “<<” indica una cantidad menor a una dosis diaria definida con fines estadísticos por millón de habitantes por día.Note: As at 1 November 2012, the following eight countries and territories either had not submitted any statistical forms or had not provided any consumption data for three consecutive years (2009-2011): Antigua and Barbuda, Aruba, Ascension Island, Barbados, British Virgin Islands, Curaçao, Falkland Islands (Malvinas), SaintKitts and Nevis. — Note: Au 1er novembre 2012, les huit pays et territoires suivants n’avaient soit pas communiqué de formulaires statistiques, soit pas communiqué de données sur la consommation pendant trois années consécutives (2009-2011): Antigua-et-Barbuda, Aruba, Barbade, Curaçao, Saint-Kitts-et-Nevis, Îles de l’Ascencion,Îles Falkland (Malvinas), Îles Vierges britanniques. — Nota: Hasta el 1 de noviembre de 2012, los siguientes ocho países y territorios no habían presentado formularios estadísticos o no habían proporcionado datos sobre el consumo durante tres años consecutivos (2009-2011): Antigua y Barbuda, Aruba, Barbados, Curaçao, Isla de la Ascensión, Islas Malvinas (Falkland Islands), Islas Vírgenes Británicas, Saint Kitts y Nevis.
aStatistical data submitted by Governments are used by INCB to calculate the approximate consumption in a given year, which is not reported as such by Govern-ments. — L’OICS se fonde sur les données statistiques communiquées par les gouvernements pour calculer la consommation approximative pour une année donnée, ces chiffres en tant que tels n’étant pas communiqués par les gouvernements. — La JIFE utiliza los datos estadísticos presentados por los gobiernos para calcular el consumo aproximado correspondiente a determinado año cuando estos no se lo han comunicado.
bAn opioid currently controlled under the 1971 Convention on Psychotropic Substances. — Opioïde actuellement placé sous contrôle en vertu de la Convention de 1971 sur les substances psychotropes. — Opioide actualmente sujeto a fiscalización en virtud del Convenio sobre Sustancias Sicotrópicas de 1971.
cTotal consumption of narcotic drugs and respective ranking do not reflect the data for buprenorphine. — La consommation totale de stupéfiants et le classement établi sur cette base ne tiennent pas compte des chiffres relatifs à la buprénorphine. — En el consumo total de estupefacientes y la respectiva ordenación no se reflejan los datos correspondientes a la buprenorfina.
dCalculation is based on data covering one year only. — Calcul effectué à partir de données concernant une année seulement. — El cálculo está basado en datos correspondientes a un año únicamente.
eThe Netherlands Antilles was dissolved on 10 October 2010, resulting in two new constituent entities, Curaçao and Sint Maarten. No data for the Netherlands Antilles were submitted after that date. — Le 10 octobre 2010, les Antilles néerlandaises ont cessé d’exister et Curaçao et Saint-Martin sont devenus deux pays constitutifs autonomes. Aucune donnée concernant les Antilles néerlandaises n’a été communiquée après cette date. — Las Antillas Neerlandesas se disolvieron el 10 de octubre de 2010 y pasaron a ser dos nuevas entidades constitutivas: Curaçao y Sint Maarten. No se presentaron datos relativos a las Antillas Neerlandesas después de esa fecha.
fCalculation is based on data covering two years only. — Calcul effectué à partir de données concernant deux années seulement. — El cálculo está basado en datos correspondientes a dos años únicamente.
Part fourQuatrièm
e partieCuarta parte
Tables — Tableaux —
Cuadros
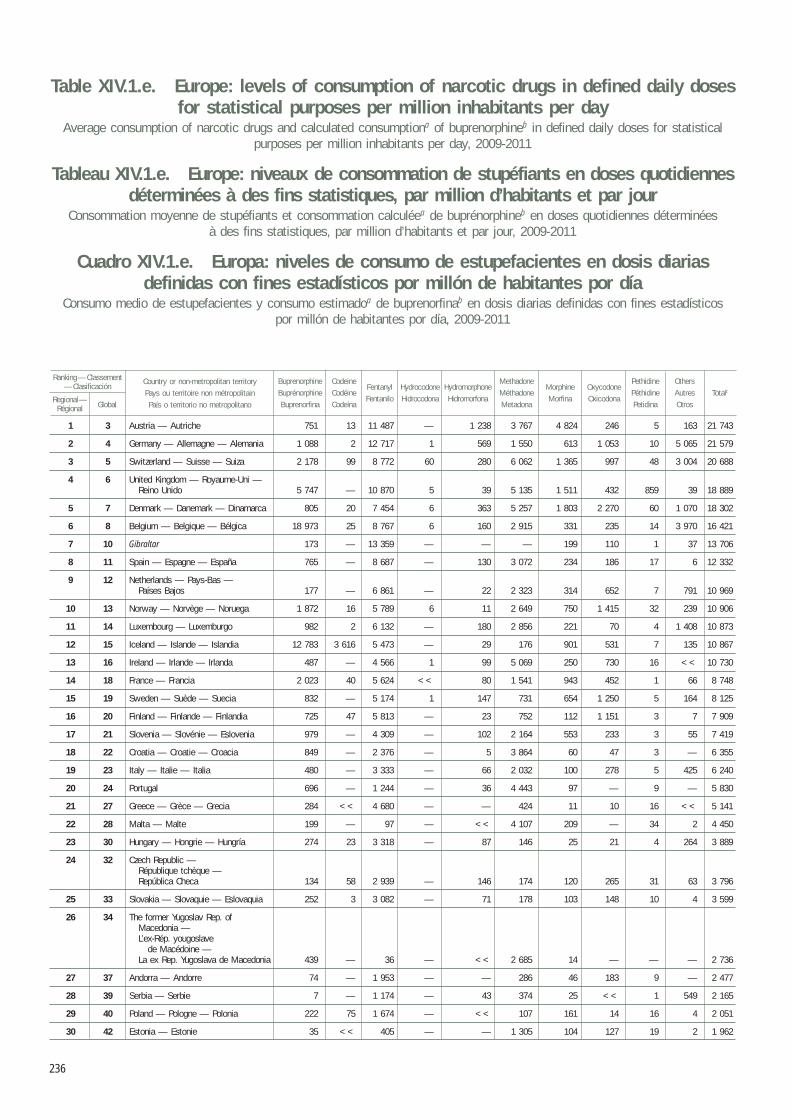
Country or non-metropolitan territoryPays ou territoire non métropolitainPaís o territorio no metropolitano
Ranking — Classement— Clasificación
GlobalRegional—
Régional
MorphineMorfina
CodeineCodéineCodeína
MethadoneMéthadoneMetadona
PethidinePéthidinePetidina
OthersAutresOtros
TotalcFentanylFentanilo
HydrocodoneHidrocodona
HydromorphoneHidromorfona
OxycodoneOxicodona
BuprenorphineBuprénorphineBuprenorfina
Table XIV.1.e. Europe: levels of consumption of narcotic drugs in defined daily doses for statistical purposes per million inhabitants per day
Average consumption of narcotic drugs and calculated consumptiona of buprenorphineb in defined daily doses for statistical purposes per million inhabitants per day, 2009-2011
Tableau XIV.1.e. Europe: niveaux de consommation de stupéfiants en doses quotidiennes déterminées à des fins statistiques, par million d’habitants et par jour
Consommation moyenne de stupéfiants et consommation calculéea de buprénorphineb en doses quotidiennes déterminées à des fins statistiques, par million d’habitants et par jour, 2009-2011
Cuadro XIV.1.e. Europa: niveles de consumo de estupefacientes en dosis diarias definidas con fines estadísticos por millón de habitantes por día
Consumo medio de estupefacientes y consumo estimadoa de buprenorfinab en dosis diarias definidas con fines estadísticos por millón de habitantes por día, 2009-2011
236
1 3 Austria — Autriche 751 13 11 487 — 1 238 3 767 4 824 246 5 163 21 743
2 4 Germany — Allemagne — Alemania 1 088 2 12 717 1 569 1 550 613 1 053 10 5 065 21 579
3 5 Switzerland — Suisse — Suiza 2 178 99 8 772 60 280 6 062 1 365 997 48 3 004 20 688
4 6 United Kingdom — Royaume-Uni — Reino Unido 5 747 — 10 870 5 39 5 135 1 511 432 859 39 18 889
5 7 Denmark — Danemark — Dinamarca 805 20 7 454 6 363 5 257 1 803 2 270 60 1 070 18 302
6 8 Belgium — Belgique — Bélgica 18 973 25 8 767 6 160 2 915 331 235 14 3 970 16 421
7 10 Gibraltar 173 — 13 359 — — — 199 110 1 37 13 706
8 11 Spain — Espagne — España 765 — 8 687 — 130 3 072 234 186 17 6 12 332
9 12 Netherlands — Pays-Bas — Países Bajos 177 — 6 861 — 22 2 323 314 652 7 791 10 969
10 13 Norway — Norvège — Noruega 1 872 16 5 789 6 11 2 649 750 1 415 32 239 10 906
11 14 Luxembourg — Luxemburgo 982 2 6 132 — 180 2 856 221 70 4 1 408 10 873
12 15 Iceland — Islande — Islandia 12 783 3 616 5 473 — 29 176 901 531 7 135 10 867
13 16 Ireland — Irlande — Irlanda 487 — 4 566 1 99 5 069 250 730 16 << 10 730
14 18 France — Francia 2 023 40 5 624 << 80 1 541 943 452 1 66 8 748
15 19 Sweden — Suède — Suecia 832 — 5 174 1 147 731 654 1 250 5 164 8 125
16 20 Finland — Finlande — Finlandia 725 47 5 813 — 23 752 112 1 151 3 7 7 909
17 21 Slovenia — Slovénie — Eslovenia 979 — 4 309 — 102 2 164 553 233 3 55 7 419
18 22 Croatia — Croatie — Croacia 849 — 2 376 — 5 3 864 60 47 3 — 6 355
19 23 Italy — Italie — Italia 480 — 3 333 — 66 2 032 100 278 5 425 6 240
20 24 Portugal 696 — 1 244 — 36 4 443 97 — 9 — 5 830
21 27 Greece — Grèce — Grecia 284 << 4 680 — — 424 11 10 16 << 5 141
22 28 Malta — Malte 199 — 97 — << 4 107 209 — 34 2 4 450
23 30 Hungary — Hongrie — Hungría 274 23 3 318 — 87 146 25 21 4 264 3 889
24 32 Czech Republic — République tchèque — República Checa 134 58 2 939 — 146 174 120 265 31 63 3 796
25 33 Slovakia — Slovaquie — Eslovaquia 252 3 3 082 — 71 178 103 148 10 4 3 599
26 34 The former Yugoslav Rep. of Macedonia — L’ex-Rép. yougoslave de Macédoine — La ex Rep. Yugoslava de Macedonia 439 — 36 — << 2 685 14 — — — 2 736
27 37 Andorra — Andorre 74 — 1 953 — — 286 46 183 9 — 2 477
28 39 Serbia — Serbie 7 — 1 174 — 43 374 25 << 1 549 2 165
29 40 Poland — Pologne — Polonia 222 75 1 674 — << 107 161 14 16 4 2 051
30 42 Estonia — Estonie 35 << 405 — — 1 305 104 127 19 2 1 962
Country or non-metropolitan territoryPays ou territoire non métropolitainPaís o territorio no metropolitano
Ranking — Classement— Clasificación
GlobalRegional—
Régional
MorphineMorfina
CodeineCodéineCodeína
MethadoneMéthadoneMetadona
PethidinePéthidinePetidina
OthersAutresOtros
TotalcFentanylFentanilo
HydrocodoneHidrocodona
HydromorphoneHidromorfona
OxycodoneOxicodona
BuprenorphineBuprénorphineBuprenorfina
Table XIV.1.e. Europe: levels of consumption of narcotic drugs in defined daily doses for statistical purposes per million inhabitants per day (continued)
Average consumption of narcotic drugs and calculated consumptiona of buprenorphineb in defined daily doses for statistical purposes per million inhabitants per day, 2009-2011
Tableau XIV.1.e. Europe: niveaux de consommation de stupéfiants en doses quotidiennes déterminées à des fins statistiques, par million d’habitants et par jour (suite)
Consommation moyenne de stupéfiants et consommation calculéea de buprénorphineb en doses quotidiennes déterminées à des fins statistiques, par million d’habitants et par jour, 2009-2011
Cuadro XIV.1.e. Europa: niveles de consumo de estupefacientes en dosis diarias definidas con fines estadísticos por millón de habitantes por día (continuación)
Consumo medio de estupefacientes y consumo estimadoa de buprenorfinab en dosis diarias definidas con fines estadísticos por millón de habitantes por día, 2009-2011
237
31 43 Bulgaria — Bulgarie — — 154 — — 1 347 149 42 9 71 1 771
32 46 Montenegro — Monténégro — — 1 342 — — 279 5 — 2 — 1 628
33 47 Lithuania — Lituanie — Lituania 9 — 1 082 — — 365 69 << 20 — 1 536
34 53 Latvia — Lettonie — Letonia 21 1 764 — — 226 122 3 4 14 1 134
35 54 Bosnia and Herzegovina — Bosnie-Herzégovine — Bosnia y Herzegovina 24 1 537 — — 462 20 — << 112 1 133
36 55 Cyprus — Chypre — Chipre 86 — 656 — — 5 70 293 37 — 1 062
37 63 Belarus — Bélarus — Belarús 11 — 201 — 4 224 15 — — 24 467
38 71 Ukraine — Ucrania 36 13 34 — — 248 17 — — 6 318
39 78 Republic of Moldova — République de Moldova — República de Moldova — 30 34 — — 120 40 — — 12 236
40 82 Albania — Albanie — — 33 — — 137 22 — 1 20 213
41 100 Romaniad — Roumanied — Rumaniad 12 — 60 — — 13 16 33 3 — 124
42 103 Russian Federation — Fédération de Russie — Federación de Rusia 1 << 83 — — — 12 — — 17 112
Regional average: Europe —Moyenne régionale: Europe —Promedio regional: Europa 1 234 13 4 687 1 118 1 543 427 355 10 785 7 937
Note: The symbol “<<” indicates an amount less than 1 defined daily dose for statistical purposes per million inhabitants per day. — Note: Le symbole “<<” signifie que la consommation était inférieure à 1 dose quotidienne déterminée à des fins statistiques par million d’habitants et par jour. — Nota: El símbolo “<<” indica una cantidad menor a una dosis diaria definida con fines estadísticos por millón de habitantes por día. Note: As at 1 November 2012, the following country had not provided any consumption data for two consecutive years (2010-2011): Romania. — Note: Au 1er
novembre 2012, le pays suivant n’avait communiqué aucune donnée sur la consommation pendant deux années consécutives (2010-2011): Roumanie. Nota: Hasta el 1 de noviembre de 2012, el siguiente país no había proporcionado ninguno dato sobre el consumo durante dos años consecutivos (2010-2011): Rumania.
aStatistical data submitted by Governments are used by INCB to calculate the approximate consumption in a given year, which is not reported as such by Governments. — L’OICS se fonde sur les données statistiques communiquées par les gouvernements pour calculer la consommation approximative pour une année donnée, ces chiffres en tant que tels n’étant pas communiqués par les gouvernements. — La JIFE utiliza los datos estadísticos presentados por los gobiernos para calcular el consumo aproximado correspondiente a determinado año cuando estos no se lo han comunicado.
bAn opioid currently controlled under the 1971 Convention on Psychotropic Substances. — Opioïde actuellement placé sous contrôle en vertu de la Convention de 1971 sur les substances psychotropes. — Opioide actualmente sujeto a fiscalización en virtud del Convenio sobre Sustancias Sicotrópicas de 1971.
cTotal consumption of narcotic drugs and respective ranking do not reflect the data for buprenorphine. — La consommation totale de stupéfiants et le classement établi sur cette base ne tiennent pas compte des chiffres relatifs à la buprénorphine. — En el consumo total de estupefacientes y la respectiva ordenación no se reflejan los datos correspondientes a la buprenorfina.
dCalculation is based on data covering one year only. — Calcul effectué à partir de données concernant une année seulement. — El cálculo está basado en datos correspondientes a un año únicamente.
Part fourQuatrièm
e partieCuarta parte
Tables — Tableaux —
CuadrosPart four
Quatrième partie
Cuarta parteTables —
Tableaux — Cuadros
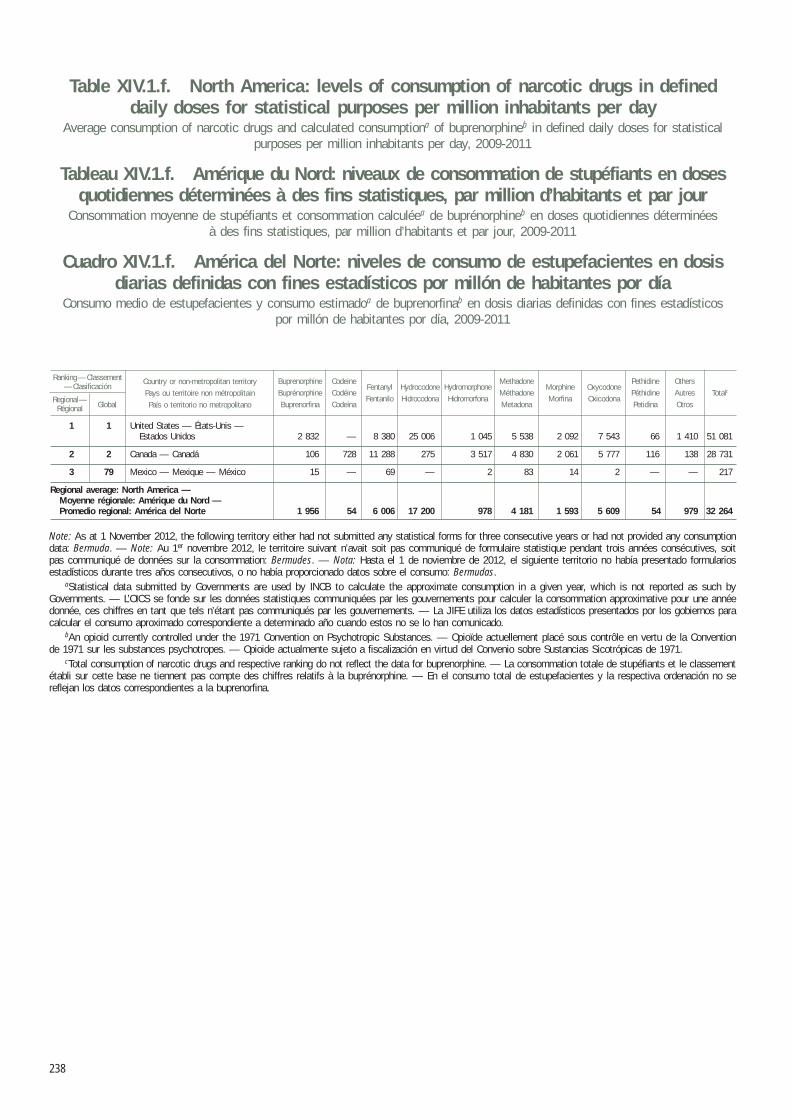
Country or non-metropolitan territoryPays ou territoire non métropolitainPaís o territorio no metropolitano
Ranking — Classement— Clasificación
GlobalRegional—
Régional
MorphineMorfina
CodeineCodéineCodeína
MethadoneMéthadoneMetadona
PethidinePéthidinePetidina
OthersAutresOtros
TotalcFentanylFentanilo
HydrocodoneHidrocodona
HydromorphoneHidromorfona
OxycodoneOxicodona
BuprenorphineBuprénorphineBuprenorfina
Table XIV.1.f. North America: levels of consumption of narcotic drugs in defined daily doses for statistical purposes per million inhabitants per day
Average consumption of narcotic drugs and calculated consumptiona of buprenorphineb in defined daily doses for statistical purposes per million inhabitants per day, 2009-2011
Tableau XIV.1.f. Amérique du Nord: niveaux de consommation de stupéfiants en doses quotidiennes déterminées à des fins statistiques, par million d’habitants et par jour
Consommation moyenne de stupéfiants et consommation calculéea de buprénorphineb en doses quotidiennes déterminées à des fins statistiques, par million d’habitants et par jour, 2009-2011
Cuadro XIV.1.f. América del Norte: niveles de consumo de estupefacientes en dosis diarias definidas con fines estadísticos por millón de habitantes por día
Consumo medio de estupefacientes y consumo estimadoa de buprenorfinab en dosis diarias definidas con fines estadísticos por millón de habitantes por día, 2009-2011
238
1 1 United States — États-Unis — Estados Unidos 2 832 — 8 380 25 006 1 045 5 538 2 092 7 543 66 1 410 51 081
2 2 Canada — Canadá 106 728 11 288 275 3 517 4 830 2 061 5 777 116 138 28 731
3 79 Mexico — Mexique — México 15 — 69 — 2 83 14 2 — — 217
Regional average: North America —Moyenne régionale: Amérique du Nord —Promedio regional: América del Norte 1 956 54 6 006 17 200 978 4 181 1 593 5 609 54 979 32 264
Note: As at 1 November 2012, the following territory either had not submitted any statistical forms for three consecutive years or had not provided any consumptiondata: Bermuda. — Note: Au 1er novembre 2012, le territoire suivant n’avait soit pas communiqué de formulaire statistique pendant trois années consécutives, soit pas communiqué de données sur la consommation: Bermudes. — Nota: Hasta el 1 de noviembre de 2012, el siguiente territorio no había presentado formularios estadísticos durante tres años consecutivos, o no había proporcionado datos sobre el consumo: Bermudas.
aStatistical data submitted by Governments are used by INCB to calculate the approximate consumption in a given year, which is not reported as such by Governments. — L’OICS se fonde sur les données statistiques communiquées par les gouvernements pour calculer la consommation approximative pour une année donnée, ces chiffres en tant que tels n’étant pas communiqués par les gouvernements. — La JIFE utiliza los datos estadísticos presentados por los gobiernos para calcular el consumo aproximado correspondiente a determinado año cuando estos no se lo han comunicado.
bAn opioid currently controlled under the 1971 Convention on Psychotropic Substances. — Opioïde actuellement placé sous contrôle en vertu de la Convention de 1971 sur les substances psychotropes. — Opioide actualmente sujeto a fiscalización en virtud del Convenio sobre Sustancias Sicotrópicas de 1971.
cTotal consumption of narcotic drugs and respective ranking do not reflect the data for buprenorphine. — La consommation totale de stupéfiants et le classement établi sur cette base ne tiennent pas compte des chiffres relatifs à la buprénorphine. — En el consumo total de estupefacientes y la respectiva ordenación no se reflejan los datos correspondientes a la buprenorfina.
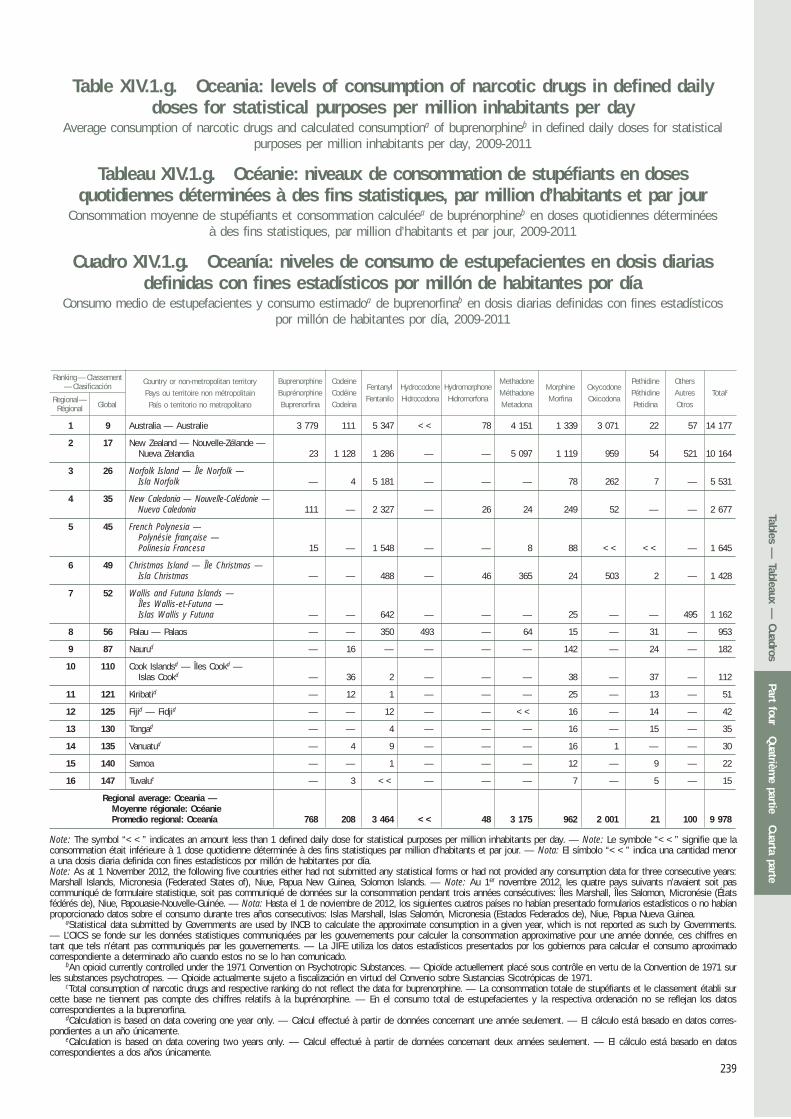
Country or non-metropolitan territoryPays ou territoire non métropolitainPaís o territorio no metropolitano
Ranking — Classement— Clasificación
GlobalRegional—
Régional
MorphineMorfina
CodeineCodéineCodeína
MethadoneMéthadoneMetadona
PethidinePéthidinePetidina
OthersAutresOtros
TotalcFentanylFentanilo
HydrocodoneHidrocodona
HydromorphoneHidromorfona
OxycodoneOxicodona
BuprenorphineBuprénorphineBuprenorfina
Table XIV.1.g. Oceania: levels of consumption of narcotic drugs in defined daily doses for statistical purposes per million inhabitants per day
Average consumption of narcotic drugs and calculated consumptiona of buprenorphineb in defined daily doses for statistical purposes per million inhabitants per day, 2009-2011
Tableau XIV.1.g. Océanie: niveaux de consommation de stupéfiants en doses quotidiennes déterminées à des fins statistiques, par million d’habitants et par jour
Consommation moyenne de stupéfiants et consommation calculéea de buprénorphineb en doses quotidiennes déterminées à des fins statistiques, par million d’habitants et par jour, 2009-2011
Cuadro XIV.1.g. Oceanía: niveles de consumo de estupefacientes en dosis diarias definidas con fines estadísticos por millón de habitantes por día
Consumo medio de estupefacientes y consumo estimadoa de buprenorfinab en dosis diarias definidas con fines estadísticos por millón de habitantes por día, 2009-2011
239
1 9 Australia — Australie 3 779 111 5 347 << 78 4 151 1 339 3 071 22 57 14 177
2 17 New Zealand — Nouvelle-Zélande — Nueva Zelandia 23 1 128 1 286 — — 5 097 1 119 959 54 521 10 164
3 26 Norfolk Island — Île Norfolk — Isla Norfolk — 4 5 181 — — — 78 262 7 — 5 531
4 35 New Caledonia — Nouvelle-Calédonie — Nueva Caledonia 111 — 2 327 — 26 24 249 52 — — 2 677
5 45 French Polynesia — Polynésie française — Polinesia Francesa 15 — 1 548 — — 8 88 << << — 1 645
6 49 Christmas Island — Île Christmas — Isla Christmas — — 488 — 46 365 24 503 2 — 1 428
7 52 Wallis and Futuna Islands — Îles Wallis-et-Futuna — Islas Wallis y Futuna — — 642 — — — 25 — — 495 1 162
8 56 Palau — Palaos — — 350 493 — 64 15 — 31 — 953
9 87 Naurud — 16 — — — — 142 — 24 — 182
10 110 Cook Islandsd — Îles Cookd — Islas Cookd — 36 2 — — — 38 — 37 — 112
11 121 Kiribatid — 12 1 — — — 25 — 13 — 51
12 125 Fijid — Fidjid — — 12 — — << 16 — 14 — 42
13 130 Tongad — — 4 — — — 16 — 15 — 35
14 135 Vanuatud — 4 9 — — — 16 1 — — 30
15 140 Samoa — — 1 — — — 12 — 9 — 22
16 147 Tuvalue — 3 << — — — 7 — 5 — 15
Regional average: Oceania —Moyenne régionale: Océanie Promedio regional: Oceanía 768 208 3 464 << 48 3 175 962 2 001 21 100 9 978
Note: The symbol “<<” indicates an amount less than 1 defined daily dose for statistical purposes per million inhabitants per day. — Note: Le symbole “<<” signifie que la consommation était inférieure à 1 dose quotidienne déterminée à des fins statistiques par million d’habitants et par jour. — Nota: El símbolo “<<” indica una cantidad menor a una dosis diaria definida con fines estadísticos por millón de habitantes por día.Note: As at 1 November 2012, the following five countries either had not submitted any statistical forms or had not provided any consumption data for three consecutive years: Marshall Islands, Micronesia (Federated States of), Niue, Papua New Guinea, Solomon Islands. — Note: Au 1er novembre 2012, les quatre pays suivants n’avaient soit pas communiqué de formulaire statistique, soit pas communiqué de données sur la consommation pendant trois années consécutives: Îles Marshall, Îles Salomon, Micronésie (États fédérés de), Niue, Papouasie-Nouvelle-Guinée. — Nota: Hasta el 1 de noviembre de 2012, los siguientes cuatros países no habían presentado formularios estadísticos o no habían proporcionado datos sobre el consumo durante tres años consecutivos: Islas Marshall, Islas Salomón, Micronesia (Estados Federados de), Niue, Papua Nueva Guinea.
aStatistical data submitted by Governments are used by INCB to calculate the approximate consumption in a given year, which is not reported as such by Governments.— L’OICS se fonde sur les données statistiques communiquées par les gouvernements pour calculer la consommation approximative pour une année donnée, ces chiffres en tant que tels n’étant pas communiqués par les gouvernements. — La JIFE utiliza los datos estadísticos presentados por los gobiernos para calcular el consumo aproximado correspondiente a determinado año cuando estos no se lo han comunicado.
bAn opioid currently controlled under the 1971 Convention on Psychotropic Substances. — Opioïde actuellement placé sous contrôle en vertu de la Convention de 1971 sur les substances psychotropes. — Opioide actualmente sujeto a fiscalización en virtud del Convenio sobre Sustancias Sicotrópicas de 1971.
cTotal consumption of narcotic drugs and respective ranking do not reflect the data for buprenorphine. — La consommation totale de stupéfiants et le classement établi sur cette base ne tiennent pas compte des chiffres relatifs à la buprénorphine. — En el consumo total de estupefacientes y la respectiva ordenación no se reflejan los datos correspondientes a la buprenorfina.
dCalculation is based on data covering one year only. — Calcul effectué à partir de données concernant une année seulement. — El cálculo está basado en datos corres-pondientes a un año únicamente.
eCalculation is based on data covering two years only. — Calcul effectué à partir de données concernant deux années seulement. — El cálculo está basado en datos correspondientes a dos años únicamente.
Part fourQuatrièm
e partieCuarta parte
Tables — Tableaux —
CuadrosPart four
Quatrième partie
Cuarta parteTables —
Tableaux — Cuadros
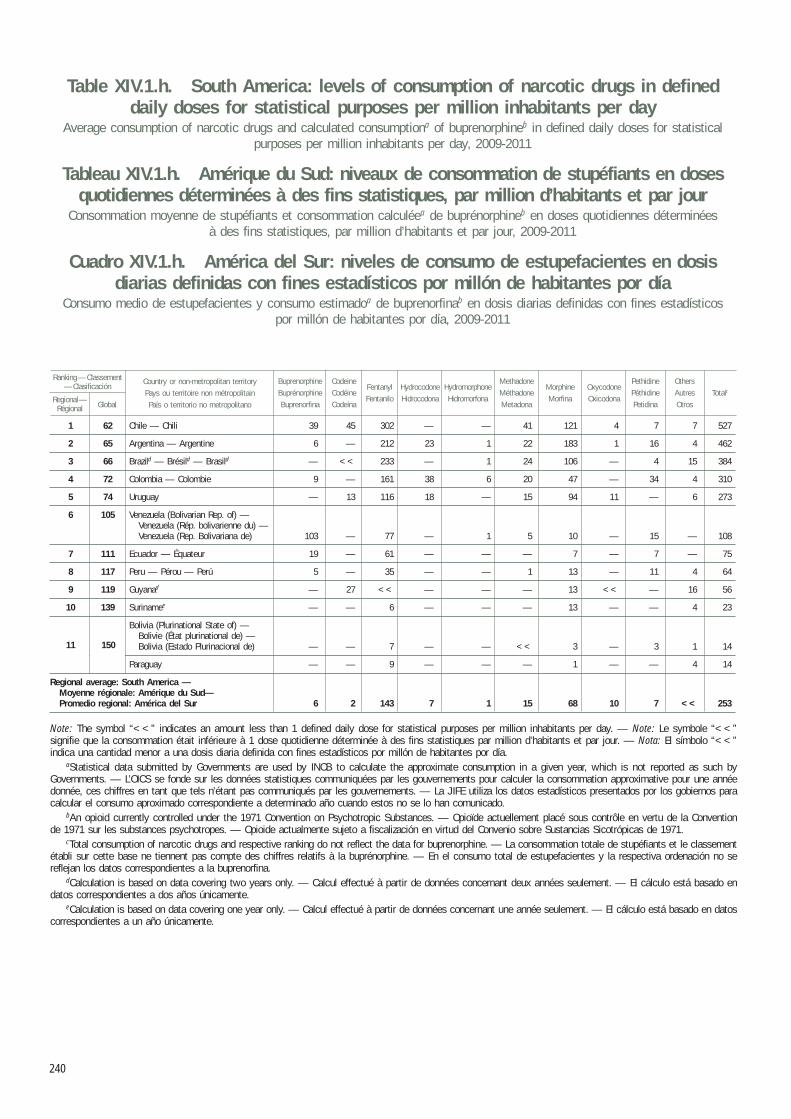
Country or non-metropolitan territoryPays ou territoire non métropolitainPaís o territorio no metropolitano
Ranking — Classement— Clasificación
GlobalRegional—
Régional
MorphineMorfina
CodeineCodéineCodeína
MethadoneMéthadoneMetadona
PethidinePéthidinePetidina
OthersAutresOtros
TotalcFentanylFentanilo
HydrocodoneHidrocodona
HydromorphoneHidromorfona
OxycodoneOxicodona
BuprenorphineBuprénorphineBuprenorfina
Table XIV.1.h. South America: levels of consumption of narcotic drugs in defined daily doses for statistical purposes per million inhabitants per day
Average consumption of narcotic drugs and calculated consumptiona of buprenorphineb in defined daily doses for statistical purposes per million inhabitants per day, 2009-2011
Tableau XIV.1.h. Amérique du Sud: niveaux de consommation de stupéfiants en doses quotidiennes déterminées à des fins statistiques, par million d’habitants et par jour
Consommation moyenne de stupéfiants et consommation calculéea de buprénorphineb en doses quotidiennes déterminées à des fins statistiques, par million d’habitants et par jour, 2009-2011
Cuadro XIV.1.h. América del Sur: niveles de consumo de estupefacientes en dosis diarias definidas con fines estadísticos por millón de habitantes por día
Consumo medio de estupefacientes y consumo estimadoa de buprenorfinab en dosis diarias definidas con fines estadísticos por millón de habitantes por día, 2009-2011
240
Note: The symbol “<<” indicates an amount less than 1 defined daily dose for statistical purposes per million inhabitants per day. — Note: Le symbole “<<” signifie que la consommation était inférieure à 1 dose quotidienne déterminée à des fins statistiques par million d’habitants et par jour. — Nota: El símbolo “<<” indica una cantidad menor a una dosis diaria definida con fines estadísticos por millón de habitantes por día. aStatistical data submitted by Governments are used by INCB to calculate the approximate consumption in a given year, which is not reported as such by Governments. — L’OICS se fonde sur les données statistiques communiquées par les gouvernements pour calculer la consommation approximative pour une année donnée, ces chiffres en tant que tels n’étant pas communiqués par les gouvernements. — La JIFE utiliza los datos estadísticos presentados por los gobiernos para calcular el consumo aproximado correspondiente a determinado año cuando estos no se lo han comunicado. bAn opioid currently controlled under the 1971 Convention on Psychotropic Substances. — Opioïde actuellement placé sous contrôle en vertu de la Convention de 1971 sur les substances psychotropes. — Opioide actualmente sujeto a fiscalización en virtud del Convenio sobre Sustancias Sicotrópicas de 1971. cTotal consumption of narcotic drugs and respective ranking do not reflect the data for buprenorphine. — La consommation totale de stupéfiants et le classement établi sur cette base ne tiennent pas compte des chiffres relatifs à la buprénorphine. — En el consumo total de estupefacientes y la respectiva ordenación no se reflejan los datos correspondientes a la buprenorfina. dCalculation is based on data covering two years only. — Calcul effectué à partir de données concernant deux années seulement. — El cálculo está basado en datos correspondientes a dos años únicamente. eCalculation is based on data covering one year only. — Calcul effectué à partir de données concernant une année seulement. — El cálculo está basado en datos correspondientes a un año únicamente.
1 62 Chile — Chili 39 45 302 — — 41 121 4 7 7 527
2 65 Argentina — Argentine 6 — 212 23 1 22 183 1 16 4 462
3 66 Brazild — Brésild — Brasild — << 233 — 1 24 106 — 4 15 384
4 72 Colombia — Colombie 9 — 161 38 6 20 47 — 34 4 310
5 74 Uruguay — 13 116 18 — 15 94 11 — 6 273
6 105 Venezuela (Bolivarian Rep. of) — Venezuela (Rép. bolivarienne du) — Venezuela (Rep. Bolivariana de) 103 — 77 — 1 5 10 — 15 — 108
7 111 Ecuador — Équateur 19 — 61 — — — 7 — 7 — 75
8 117 Peru — Pérou — Perú 5 — 35 — — 1 13 — 11 4 64
9 119 Guyanad — 27 << — — — 13 << — 16 56
10 139 Surinamee — — 6 — — — 13 — — 4 23
11 149 Bolivia (Plurinational State of) — Bolivie (État plurinational de) — Bolivia (Estado Plurinacional de) — — 7 — — << 3 — 3 1 14
Paraguay — — 9 — — — 1 — — 4 14
Regional average: South America — Moyenne régionale: Amérique du Sud— Promedio regional: América del Sur 6 2 143 7 1 15 68 10 7 << 253
11 150
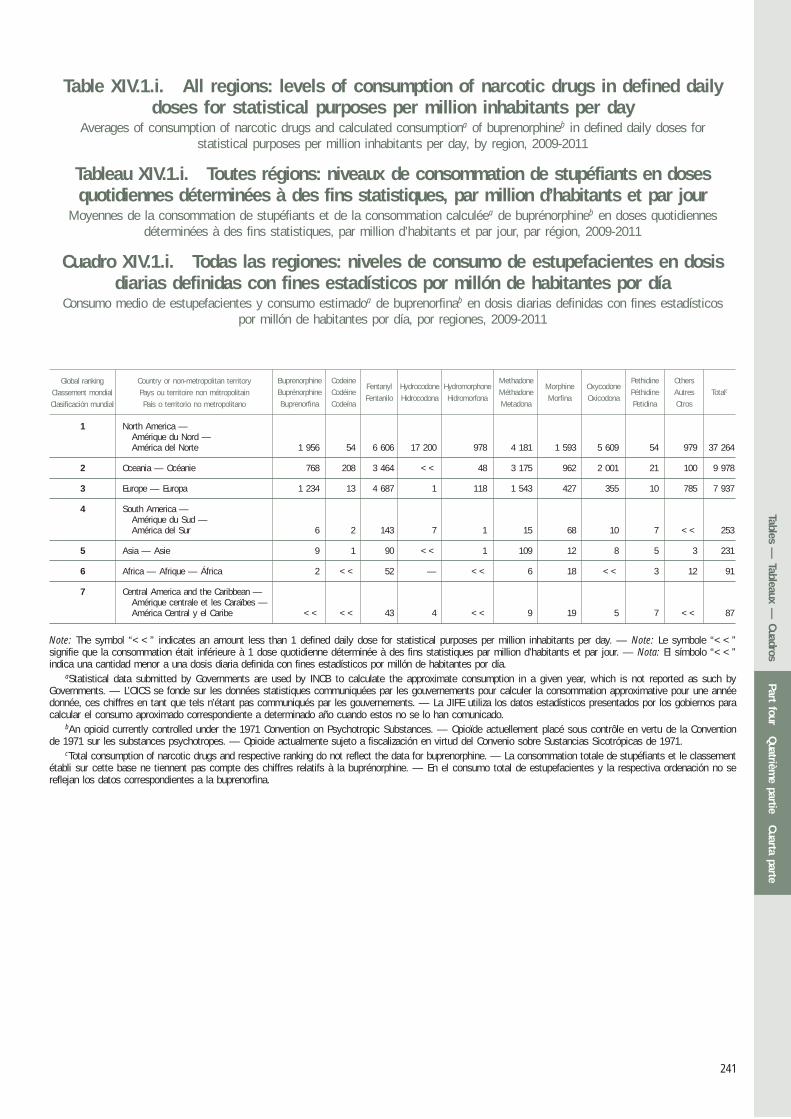
Table XIV.1.i. All regions: levels of consumption of narcotic drugs in defined daily doses for statistical purposes per million inhabitants per day
Averages of consumption of narcotic drugs and calculated consumptiona of buprenorphineb in defined daily doses for statistical purposes per million inhabitants per day, by region, 2009-2011
Tableau XIV.1.i. Toutes régions: niveaux de consommation de stupéfiants en doses quotidiennes déterminées à des fins statistiques, par million d’habitants et par jour
Moyennes de la consommation de stupéfiants et de la consommation calculéea de buprénorphineb en doses quotidiennes déterminées à des fins statistiques, par million d’habitants et par jour, par région, 2009-2011
Cuadro XIV.1.i. Todas las regiones: niveles de consumo de estupefacientes en dosis diarias definidas con fines estadísticos por millón de habitantes por día
Consumo medio de estupefacientes y consumo estimadoa de buprenorfinab en dosis diarias definidas con fines estadísticos por millón de habitantes por día, por regiones, 2009-2011
MorphineMorfina
CodeineCodéineCodeína
MethadoneMéthadoneMetadona
PethidinePéthidinePetidina
Country or non-metropolitan territoryPays ou territoire non métropolitainPaís o territorio no metropolitano
OthersAutresOtros
TotalcFentanylFentanilo
HydrocodoneHidrocodona
HydromorphoneHidromorfona
OxycodoneOxicodona
BuprenorphineBuprénorphineBuprenorfina
Global rankingClassement mondialClasificación mundial
241
1 North America — Amérique du Nord — América del Norte 1 956 54 6 606 17 200 978 4 181 1 593 5 609 54 979 37 264
2 Oceania — Océanie 768 208 3 464 << 48 3 175 962 2 001 21 100 9 978
3 Europe — Europa 1 234 13 4 687 1 118 1 543 427 355 10 785 7 937
4 South America — Amérique du Sud — América del Sur 6 2 143 7 1 15 68 10 7 << 253
5 Asia — Asie 9 1 90 << 1 109 12 8 5 3 231
6 Africa — Afrique — África 2 << 52 — << 6 18 << 3 12 91
7 Central America and the Caribbean — Amérique centrale et les Caraïbes — América Central y el Caribe << << 43 4 << 9 19 5 7 << 87
Note: The symbol “<<” indicates an amount less than 1 defined daily dose for statistical purposes per million inhabitants per day. — Note: Le symbole “<<” signifie que la consommation était inférieure à 1 dose quotidienne déterminée à des fins statistiques par million d’habitants et par jour. — Nota: El símbolo “<<” indica una cantidad menor a una dosis diaria definida con fines estadísticos por millón de habitantes por día.
aStatistical data submitted by Governments are used by INCB to calculate the approximate consumption in a given year, which is not reported as such by Governments. — L’OICS se fonde sur les données statistiques communiquées par les gouvernements pour calculer la consommation approximative pour une année donnée, ces chiffres en tant que tels n’étant pas communiqués par les gouvernements. — La JIFE utiliza los datos estadísticos presentados por los gobiernos para calcular el consumo aproximado correspondiente a determinado año cuando estos no se lo han comunicado.
bAn opioid currently controlled under the 1971 Convention on Psychotropic Substances. — Opioïde actuellement placé sous contrôle en vertu de la Convention de 1971 sur les substances psychotropes. — Opioide actualmente sujeto a fiscalización en virtud del Convenio sobre Sustancias Sicotrópicas de 1971.
cTotal consumption of narcotic drugs and respective ranking do not reflect the data for buprenorphine. — La consommation totale de stupéfiants et le classement établi sur cette base ne tiennent pas compte des chiffres relatifs à la buprénorphine. — En el consumo total de estupefacientes y la respectiva ordenación no se reflejan los datos correspondientes a la buprenorfina.
Part fourQuatrièm
e partieCuarta parte
Tables — Tableaux —
CuadrosPart four
Quatrième partie
Cuarta parteTables —
Tableaux — Cuadros
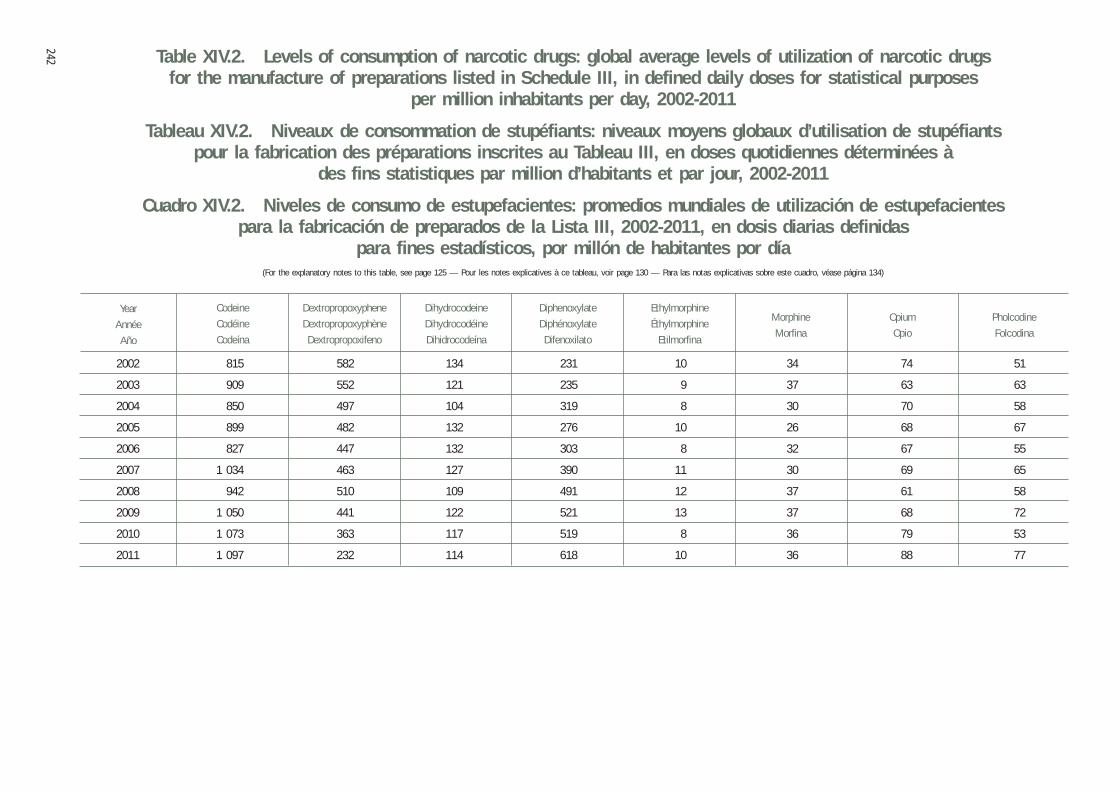
242
Year
Année
Año
Codeine
Codéine
Codeína
Dextropropoxyphene
Dextropropoxyphène
Dextropropoxifeno
Dihydrocodeine
Dihydrocodéine
Dihidrocodeína
Diphenoxylate
Diphénoxylate
Difenoxilato
Ethylmorphine
Éthylmorphine
Etilmorfina
Morphine
Morfina
Opium
Opio
Pholcodine
Folcodina
Table XIV.2. Levels of consumption of narcotic drugs: global average levels of utilization of narcotic drugs for the manufacture of preparations listed in Schedule III, in defined daily doses for statistical purposes
per million inhabitants per day, 2002-2011
Tableau XIV.2. Niveaux de consommation de stupéfiants: niveaux moyens globaux d’utilisation de stupéfiants pour la fabrication des préparations inscrites au Tableau III, en doses quotidiennes déterminées à
des fins statistiques par million d’habitants et par jour, 2002-2011
Cuadro XIV.2. Niveles de consumo de estupefacientes: promedios mundiales de utilización de estupefacientes para la fabricación de preparados de la Lista III, 2002-2011, en dosis diarias definidas
para fines estadísticos, por millón de habitantes por día(For the explanatory notes to this table, see page 125 — Pour les notes explicatives à ce tableau, voir page 130 — Para las notas explicativas sobre este cuadro, véase página 134)
2002 815 582 134 231 10 34 74 51
2003 909 552 121 235 9 37 63 63
2004 850 497 104 319 8 30 70 58
2005 899 482 132 276 10 26 68 67
2006 827 447 132 303 8 32 67 55
2007 1 034 463 127 390 11 30 69 65
2008 942 510 109 491 12 37 61 58
2009 1 050 441 122 521 13 37 68 72
2010 1 073 363 117 519 8 36 79 53
2011 1 097 232 114 618 10 36 88 77
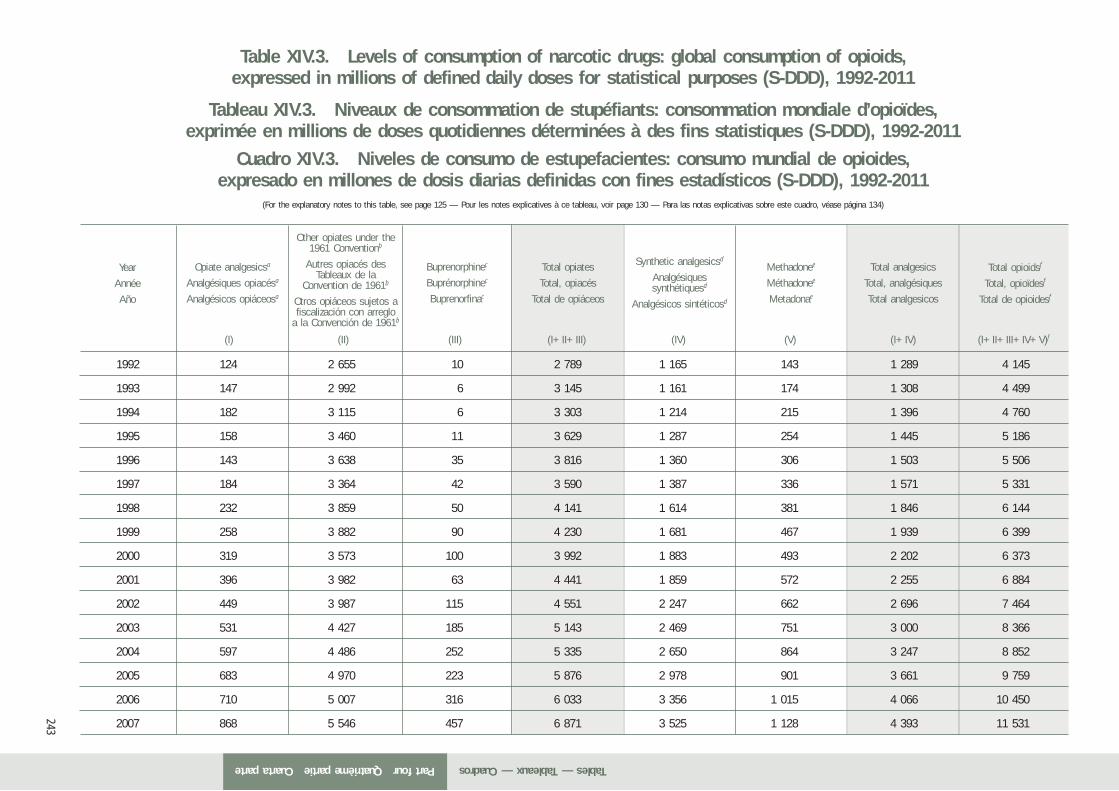
Year
Année
Año
Opiate analgesicsa
Analgésiques opiacésa
Analgésicos opiáceosa
Other opiates under the1961 Conventionb
Autres opiacés des Tableaux de la
Convention de 1961b
Otros opiáceos sujetos a fiscalización con arreglo
a la Convención de 1961b
Methadonee
Méthadonee
Metadonae
243
Buprenorphinec
Buprénorphinec
Buprenorfinac
(I) (II) (III) (I+II+III) (IV) (V) (I+IV) (I+II+III+IV+V)f
1992 124 2 655 10 2 789 1 165 143 1 289 4 145
1993 147 2 992 6 3 145 1 161 174 1 308 4 499
1994 182 3 115 6 3 303 1 214 215 1 396 4 760
1995 158 3 460 11 3 629 1 287 254 1 445 5 186
1996 143 3 638 35 3 816 1 360 306 1 503 5 506
1997 184 3 364 42 3 590 1 387 336 1 571 5 331
1998 232 3 859 50 4 141 1 614 381 1 846 6 144
1999 258 3 882 90 4 230 1 681 467 1 939 6 399
2000 319 3 573 100 3 992 1 883 493 2 202 6 373
2001 396 3 982 63 4 441 1 859 572 2 255 6 884
2002 449 3 987 115 4 551 2 247 662 2 696 7 464
2003 531 4 427 185 5 143 2 469 751 3 000 8 366
2004 597 4 486 252 5 335 2 650 864 3 247 8 852
2005 683 4 970 223 5 876 2 978 901 3 661 9 759
2006 710 5 007 316 6 033 3 356 1 015 4 066 10 450
2007 868 5 546 457 6 871 3 525 1 128 4 393 11 531
Table XIV.3. Levels of consumption of narcotic drugs: global consumption of opioids,expressed in millions of defined daily doses for statistical purposes (S-DDD), 1992-2011
Tableau XIV.3. Niveaux de consommation de stupéfiants: consommation mondiale d’opioïdes,exprimée en millions de doses quotidiennes déterminées à des fins statistiques (S-DDD), 1992-2011
Cuadro XIV.3. Niveles de consumo de estupefacientes: consumo mundial de opioides,expresado en millones de dosis diarias definidas con fines estadísticos (S-DDD), 1992-2011
(For the explanatory notes to this table, see page 125 — Pour les notes explicatives à ce tableau, voir page 130 — Para las notas explicativas sobre este cuadro, véase página 134)
Synthetic analgesicsd
Analgésiquessynthétiquesd
Analgésicos sintéticosd
Total opioidsf
Total, opioïdesf
Total de opioidesf
Total analgesics
Total, analgésiques
Total analgesicos
Total opiates
Total, opiacés
Total de opiáceos
Part fourQuatrième partieCuarta parte Tables — Tableaux — Cuadros
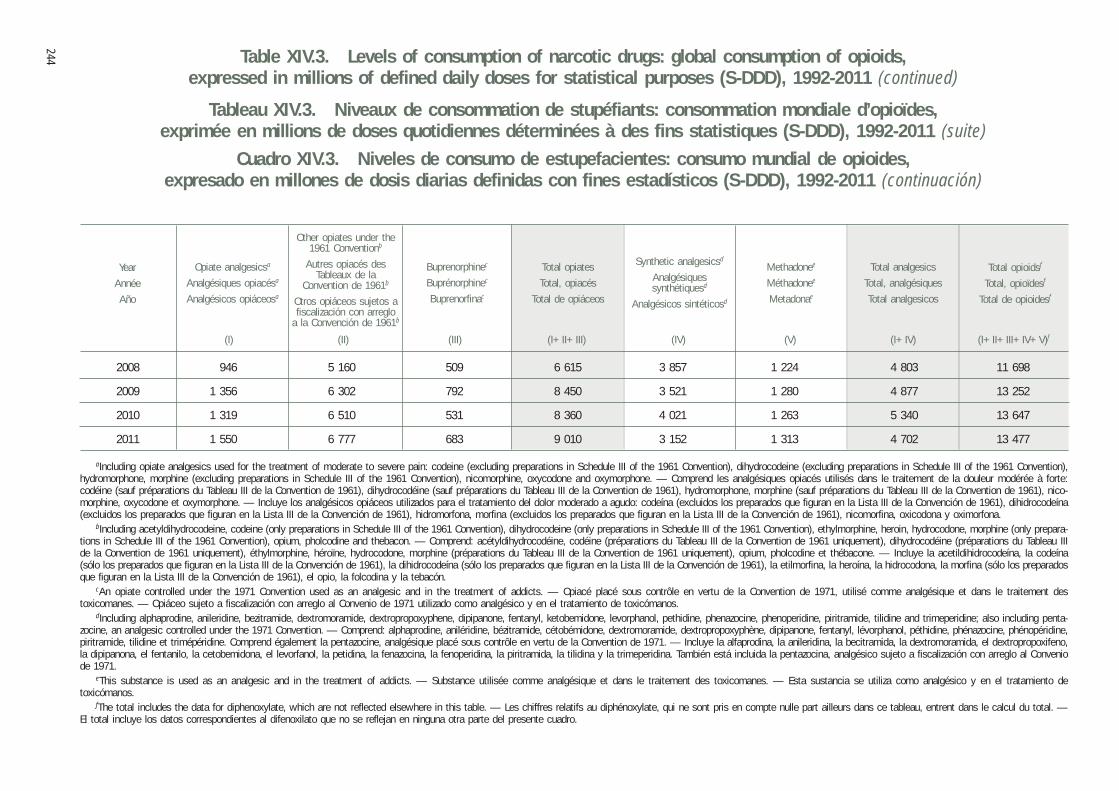
244 Table XIV.3. Levels of consumption of narcotic drugs: global consumption of opioids,expressed in millions of defined daily doses for statistical purposes (S-DDD), 1992-2011 (continued)
Tableau XIV.3. Niveaux de consommation de stupéfiants: consommation mondiale d’opioïdes,exprimée en millions de doses quotidiennes déterminées à des fins statistiques (S-DDD), 1992-2011 (suite)
Cuadro XIV.3. Niveles de consumo de estupefacientes: consumo mundial de opioides,expresado en millones de dosis diarias definidas con fines estadísticos (S-DDD), 1992-2011 (continuación)
Year
Année
Año
Opiate analgesicsa
Analgésiques opiacésa
Analgésicos opiáceosa
Other opiates under the1961 Conventionb
Autres opiacés des Tableaux de la
Convention de 1961b
Otros opiáceos sujetos a fiscalización con arreglo
a la Convención de 1961b
Buprenorphinec
Buprénorphinec
Buprenorfinac
aIncluding opiate analgesics used for the treatment of moderate to severe pain: codeine (excluding preparations in Schedule III of the 1961 Convention), dihydrocodeine (excluding preparations in Schedule III of the 1961 Convention), hydromorphone, morphine (excluding preparations in Schedule III of the 1961 Convention), nicomorphine, oxycodone and oxymorphone. — Comprend les analgésiques opiacés utilisés dans le traitement de la douleur modérée à forte: codéine (sauf préparations du Tableau III de la Convention de 1961), dihydrocodéine (sauf préparations du Tableau III de la Convention de 1961), hydromorphone, morphine (sauf préparations du Tableau III de la Convention de 1961), nico-morphine, oxycodone et oxymorphone. — Incluye los analgésicos opiáceos utilizados para el tratamiento del dolor moderado a agudo: codeína (excluidos los preparados que figuran en la Lista III de la Convención de 1961), dihidrocodeína (excluidos los preparados que figuran en la Lista III de la Convención de 1961), hidromorfona, morfina (excluidos los preparados que figuran en la Lista III de la Convención de 1961), nicomorfina, oxicodona y oximorfona.
bIncluding acetyldihydrocodeine, codeine (only preparations in Schedule III of the 1961 Convention), dihydrocodeine (only preparations in Schedule III of the 1961 Convention), ethylmorphine, heroin, hydrocodone, morphine (only prepara-tions in Schedule III of the 1961 Convention), opium, pholcodine and thebacon. — Comprend: acétyldihydrocodéine, codéine (préparations du Tableau III de la Convention de 1961 uniquement), dihydrocodéine (préparations du Tableau III de la Convention de 1961 uniquement), éthylmorphine, héroïne, hydrocodone, morphine (préparations du Tableau III de la Convention de 1961 uniquement), opium, pholcodine et thébacone. — Incluye la acetildihidrocodeína, la codeína (sólo los preparados que figuran en la Lista III de la Convención de 1961), la dihidrocodeína (sólo los preparados que figuran en la Lista III de la Convención de 1961), la etilmorfina, la heroína, la hidrocodona, la morfina (sólo los preparados que figuran en la Lista III de la Convención de 1961), el opio, la folcodina y la tebacón.
cAn opiate controlled under the 1971 Convention used as an analgesic and in the treatment of addicts. — Opiacé placé sous contrôle en vertu de la Convention de 1971, utilisé comme analgésique et dans le traitement des toxicomanes. — Opiáceo sujeto a fiscalización con arreglo al Convenio de 1971 utilizado como analgésico y en el tratamiento de toxicómanos.
dIncluding alphaprodine, anileridine, bezitramide, dextromoramide, dextropropoxyphene, dipipanone, fentanyl, ketobemidone, levorphanol, pethidine, phenazocine, phenoperidine, piritramide, tilidine and trimeperidine; also including penta-zocine, an analgesic controlled under the 1971 Convention. — Comprend: alphaprodine, aniléridine, bézitramide, cétobémidone, dextromoramide, dextropropoxyphène, dipipanone, fentanyl, lévorphanol, péthidine, phénazocine, phénopéridine, piritramide, tilidine et trimépéridine. Comprend également la pentazocine, analgésique placé sous contrôle en vertu de la Convention de 1971. — Incluye la alfaprodina, la anileridina, la becitramida, la dextromoramida, el dextropropoxifeno, la dipipanona, el fentanilo, la cetobemidona, el levorfanol, la petidina, la fenazocina, la fenoperidina, la piritramida, la tilidina y la trimeperidina. También está incluida la pentazocina, analgésico sujeto a fiscalización con arreglo al Convenio de 1971.
eThis substance is used as an analgesic and in the treatment of addicts. — Substance utilisée comme analgésique et dans le traitement des toxicomanes. — Esta sustancia se utiliza como analgésico y en el tratamiento de toxicómanos.
fThe total includes the data for diphenoxylate, which are not reflected elsewhere in this table. — Les chiffres relatifs au diphénoxylate, qui ne sont pris en compte nulle part ailleurs dans ce tableau, entrent dans le calcul du total. — El total incluye los datos correspondientes al difenoxilato que no se reflejan en ninguna otra parte del presente cuadro.
2008 946 5 160 509 6 615 3 857 1 224 4 803 11 698
2009 1 356 6 302 792 8 450 3 521 1 280 4 877 13 252
2010 1 319 6 510 531 8 360 4 021 1 263 5 340 13 647
2011 1 550 6 777 683 9 010 3 152 1 313 4 702 13 477
(I) (II) (III) (I+II+III) (IV) (V) (I+IV) (I+II+III+IV+V)f
Total opioidsf
Total, opioïdesf
Total de opioidesf
Total analgesics
Total, analgésiques
Total analgesicos
Methadonee
Méthadonee
Metadonae
Synthetic analgesicsd
Analgésiquessynthétiquesd
Analgésicos sintéticosd
Total opiates
Total, opiacés
Total de opiáceos
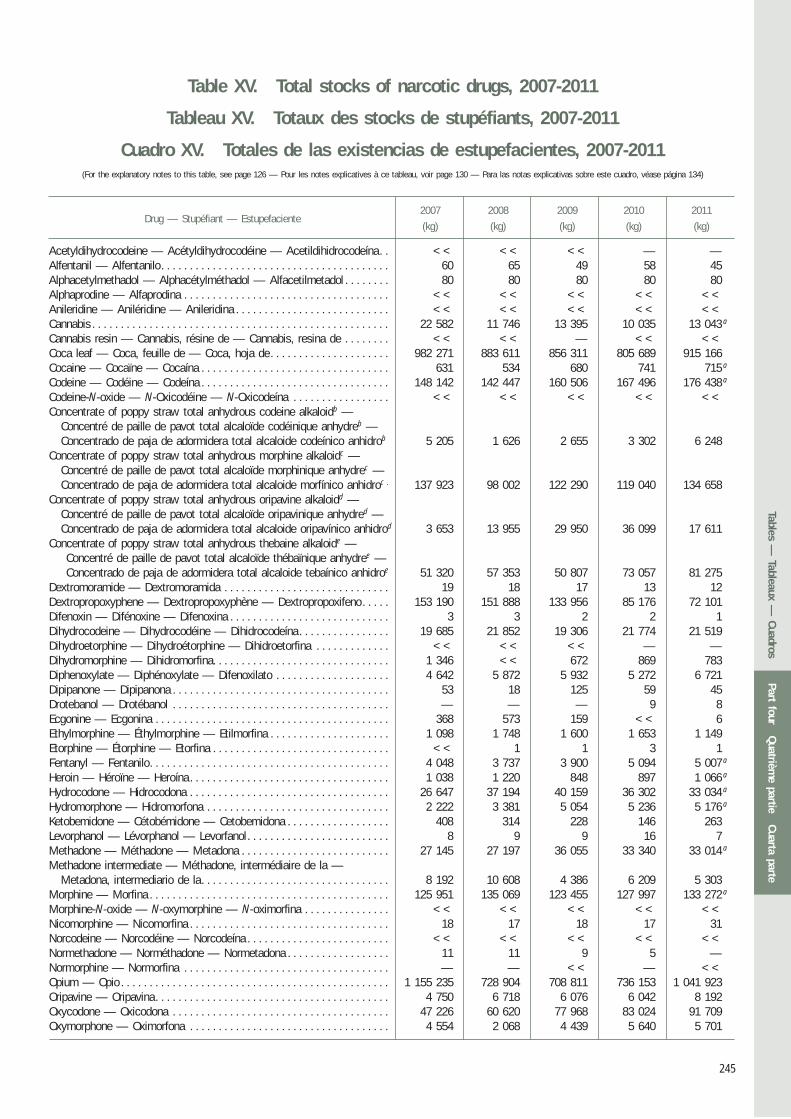
245
2007 2008 2009 2010 2011
(kg) (kg) (kg) (kg) (kg)
Table XV. Total stocks of narcotic drugs, 2007-2011
Tableau XV. Totaux des stocks de stupéfiants, 2007-2011
Cuadro XV. Totales de las existencias de estupefacientes, 2007-2011(For the explanatory notes to this table, see page 126 — Pour les notes explicatives à ce tableau, voir page 130 — Para las notas explicativas sobre este cuadro, véase página 134)
Drug — Stupéfiant — Estupefaciente
Acetyldihydrocodeine — Acétyldihydrocodéine — Acetildihidrocodeína. . << << << — —Alfentanil — Alfentanilo. . . . . . . . . . . . . . . . . . . . . . . . . . . . . . . . . . . . . . . . 60 65 49 58 45Alphacetylmethadol — Alphacétylméthadol — Alfacetilmetadol . . . . . . . . 80 80 80 80 80Alphaprodine — Alfaprodina . . . . . . . . . . . . . . . . . . . . . . . . . . . . . . . . . . . . << << << << <<Anileridine — Aniléridine — Anileridina . . . . . . . . . . . . . . . . . . . . . . . . . . . << << << << <<Cannabis . . . . . . . . . . . . . . . . . . . . . . . . . . . . . . . . . . . . . . . . . . . . . . . . . . . . 22 582 11 746 13 395 10 035 13 043 a
Cannabis resin — Cannabis, résine de — Cannabis, resina de . . . . . . . . << << — << <<Coca leaf — Coca, feuille de — Coca, hoja de. . . . . . . . . . . . . . . . . . . . . 982 271 883 611 856 311 805 689 915 166Cocaine — Cocaïne — Cocaína . . . . . . . . . . . . . . . . . . . . . . . . . . . . . . . . . 631 534 680 741 715 a
Codeine — Codéine — Codeína . . . . . . . . . . . . . . . . . . . . . . . . . . . . . . . . . 148 142 142 447 160 506 167 496 176 438 a
Codeine-N-oxide — N-Oxicodéine — N-Oxicodeína . . . . . . . . . . . . . . . . . << << << << <<Concentrate of poppy straw total anhydrous codeine alkaloidb —
Concentré de paille de pavot total alcaloïde codéinique anhydreb — Concentrado de paja de adormidera total alcaloide codeínico anhidrob 5 205 1 626 2 655 3 302 6 248
Concentrate of poppy straw total anhydrous morphine alkaloidc — Concentré de paille de pavot total alcaloïde morphinique anhydrec — Concentrado de paja de adormidera total alcaloide morfínico anhidroc . 137 923 98 002 122 290 119 040 134 658
Concentrate of poppy straw total anhydrous oripavine alkaloidd — Concentré de paille de pavot total alcaloïde oripavinique anhydred — Concentrado de paja de adormidera total alcaloide oripavínico anhidrod 3 653 13 955 29 950 36 099 17 611
Concentrate of poppy straw total anhydrous thebaine alkaloide — Concentré de paille de pavot total alcaloïde thébaïnique anhydree — Concentrado de paja de adormidera total alcaloide tebaínico anhidroe 51 320 57 353 50 807 73 057 81 275Dextromoramide — Dextromoramida . . . . . . . . . . . . . . . . . . . . . . . . . . . . . 19 18 17 13 12Dextropropoxyphene — Dextropropoxyphène — Dextropropoxifeno. . . . . 153 190 151 888 133 956 85 176 72 101Difenoxin — Difénoxine — Difenoxina . . . . . . . . . . . . . . . . . . . . . . . . . . . . 3 3 2 2 1Dihydrocodeine — Dihydrocodéine — Dihidrocodeína. . . . . . . . . . . . . . . . 19 685 21 852 19 306 21 774 21 519Dihydroetorphine — Dihydroétorphine — Dihidroetorfina . . . . . . . . . . . . . << << << — —Dihydromorphine — Dihidromorfina. . . . . . . . . . . . . . . . . . . . . . . . . . . . . . . 1 346 << 672 869 783Diphenoxylate — Diphénoxylate — Difenoxilato . . . . . . . . . . . . . . . . . . . . 4 642 5 872 5 932 5 272 6 721Dipipanone — Dipipanona . . . . . . . . . . . . . . . . . . . . . . . . . . . . . . . . . . . . . . 53 18 125 59 45Drotebanol — Drotébanol . . . . . . . . . . . . . . . . . . . . . . . . . . . . . . . . . . . . . . — — — 9 8Ecgonine — Ecgonina . . . . . . . . . . . . . . . . . . . . . . . . . . . . . . . . . . . . . . . . . 368 573 159 << 6Ethylmorphine — Éthylmorphine — Etilmorfina . . . . . . . . . . . . . . . . . . . . . 1 098 1 748 1 600 1 653 1 149Etorphine — Étorphine — Etorfina . . . . . . . . . . . . . . . . . . . . . . . . . . . . . . . << 1 1 3 1Fentanyl — Fentanilo. . . . . . . . . . . . . . . . . . . . . . . . . . . . . . . . . . . . . . . . . . 4 048 3 737 3 900 5 094 5 007 a
Heroin — Héroïne — Heroína. . . . . . . . . . . . . . . . . . . . . . . . . . . . . . . . . . . 1 038 1 220 848 897 1 066 a
Hydrocodone — Hidrocodona . . . . . . . . . . . . . . . . . . . . . . . . . . . . . . . . . . . 26 647 37 194 40 159 36 302 33 034 a
Hydromorphone — Hidromorfona . . . . . . . . . . . . . . . . . . . . . . . . . . . . . . . . 2 222 3 381 5 054 5 236 5 176 a
Ketobemidone — Cétobémidone — Cetobemidona . . . . . . . . . . . . . . . . . . 408 314 228 146 263Levorphanol — Lévorphanol — Levorfanol . . . . . . . . . . . . . . . . . . . . . . . . . 8 9 9 16 7Methadone — Méthadone — Metadona . . . . . . . . . . . . . . . . . . . . . . . . . . 27 145 27 197 36 055 33 340 33 014 a
Methadone intermediate — Méthadone, intermédiaire de la — Metadona, intermediario de la. . . . . . . . . . . . . . . . . . . . . . . . . . . . . . . . . 8 192 10 608 4 386 6 209 5 303
Morphine — Morfina . . . . . . . . . . . . . . . . . . . . . . . . . . . . . . . . . . . . . . . . . . 125 951 135 069 123 455 127 997 133 272 a
Morphine-N-oxide — N-oxymorphine — N-oximorfina . . . . . . . . . . . . . . . << << << << <<Nicomorphine — Nicomorfina . . . . . . . . . . . . . . . . . . . . . . . . . . . . . . . . . . . 18 17 18 17 31Norcodeine — Norcodéine — Norcodeína . . . . . . . . . . . . . . . . . . . . . . . . . << << << << <<Normethadone — Norméthadone — Normetadona . . . . . . . . . . . . . . . . . . 11 11 9 5 —Normorphine — Normorfina . . . . . . . . . . . . . . . . . . . . . . . . . . . . . . . . . . . . — — << — <<Opium — Opio . . . . . . . . . . . . . . . . . . . . . . . . . . . . . . . . . . . . . . . . . . . . . . . 1 155 235 728 904 708 811 736 153 1 041 923Oripavine — Oripavina. . . . . . . . . . . . . . . . . . . . . . . . . . . . . . . . . . . . . . . . . 4 750 6 718 6 076 6 042 8 192Oxycodone — Oxicodona . . . . . . . . . . . . . . . . . . . . . . . . . . . . . . . . . . . . . . 47 226 60 620 77 968 83 024 91 709Oxymorphone — Oximorfona . . . . . . . . . . . . . . . . . . . . . . . . . . . . . . . . . . . 4 554 2 068 4 439 5 640 5 701
Part fourQuatrièm
e partieCuarta parte
Tables — Tableaux —
Cuadros
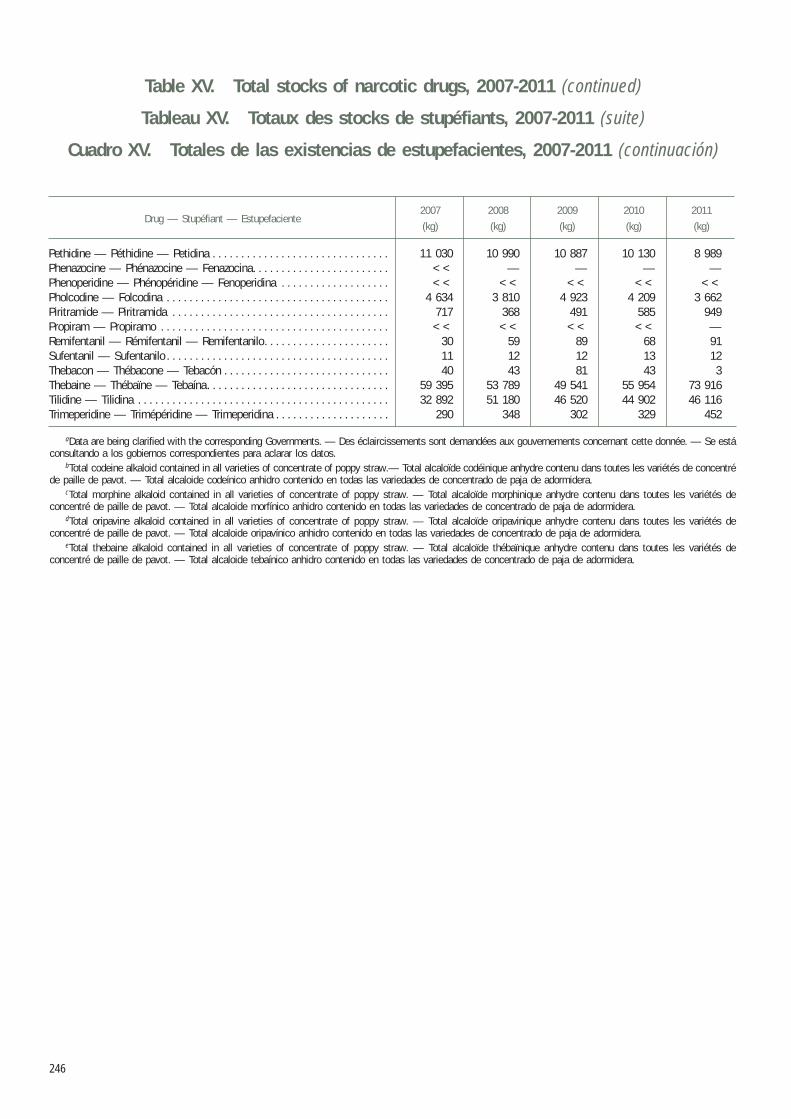
246
Drug — Stupéfiant — Estupefaciente2007 2008 2009 2010 2011
(kg) (kg) (kg) (kg) (kg)
Table XV. Total stocks of narcotic drugs, 2007-2011 (continued)
Tableau XV. Totaux des stocks de stupéfiants, 2007-2011 (suite)
Cuadro XV. Totales de las existencias de estupefacientes, 2007-2011 (continuación)
aData are being clarified with the corresponding Governments. — Des éclaircissements sont demandées aux gouvernements concernant cette donnée. — Se está consultando a los gobiernos correspondientes para aclarar los datos.
bTotal codeine alkaloid contained in all varieties of concentrate of poppy straw.— Total alcaloïde codéinique anhydre contenu dans toutes les variétés de concentré de paille de pavot. — Total alcaloide codeínico anhidro contenido en todas las variedades de concentrado de paja de adormidera.
cTotal morphine alkaloid contained in all varieties of concentrate of poppy straw. — Total alcaloïde morphinique anhydre contenu dans toutes les variétés de concentré de paille de pavot. — Total alcaloide morfínico anhidro contenido en todas las variedades de concentrado de paja de adormidera.
dTotal oripavine alkaloid contained in all varieties of concentrate of poppy straw. — Total alcaloïde oripavinique anhydre contenu dans toutes les variétés de concentré de paille de pavot. — Total alcaloide oripavínico anhidro contenido en todas las variedades de concentrado de paja de adormidera.
eTotal thebaine alkaloid contained in all varieties of concentrate of poppy straw. — Total alcaloïde thébaïnique anhydre contenu dans toutes les variétés de concentré de paille de pavot. — Total alcaloide tebaínico anhidro contenido en todas las variedades de concentrado de paja de adormidera.
Pethidine — Péthidine — Petidina . . . . . . . . . . . . . . . . . . . . . . . . . . . . . . . 11 030 10 990 10 887 10 130 8 989Phenazocine — Phénazocine — Fenazocina. . . . . . . . . . . . . . . . . . . . . . . . << — — — —Phenoperidine — Phénopéridine — Fenoperidina . . . . . . . . . . . . . . . . . . . << << << << <<Pholcodine — Folcodina . . . . . . . . . . . . . . . . . . . . . . . . . . . . . . . . . . . . . . . 4 634 3 810 4 923 4 209 3 662Piritramide — Piritramida . . . . . . . . . . . . . . . . . . . . . . . . . . . . . . . . . . . . . . 717 368 491 585 949Propiram — Propiramo . . . . . . . . . . . . . . . . . . . . . . . . . . . . . . . . . . . . . . . . << << << << —Remifentanil — Rémifentanil — Remifentanilo. . . . . . . . . . . . . . . . . . . . . . 30 59 89 68 91Sufentanil — Sufentanilo . . . . . . . . . . . . . . . . . . . . . . . . . . . . . . . . . . . . . . . 11 12 12 13 12Thebacon — Thébacone — Tebacón . . . . . . . . . . . . . . . . . . . . . . . . . . . . . 40 43 81 43 3Thebaine — Thébaïne — Tebaína. . . . . . . . . . . . . . . . . . . . . . . . . . . . . . . . 59 395 53 789 49 541 55 954 73 916Tilidine — Tilidina . . . . . . . . . . . . . . . . . . . . . . . . . . . . . . . . . . . . . . . . . . . . 32 892 51 180 46 520 44 902 46 116Trimeperidine — Trimépéridine — Trimeperidina . . . . . . . . . . . . . . . . . . . . 290 348 302 329 452