Embed Size (px)
Citation preview

N 8 4 - 2 0 695
NASA CR-168217
NASA CONTRACTOR REPORT
CHARACTERIZATION OF PMR POLYIMIDE RESIN AND PREPREG
Paul H. Lindenmeyer, C. H. Sheppard
BOEING AEROSPACE COMPANY
SEATTLE, WASHINGTON
CONTRACT NAS3-22523
NASA
National Aeronautics andSpace Administration
Lewis Research Center
Cleveland, Ohio 4,4135
https://ntrs.nasa.gov/search.jsp?R=19840012627 2020-03-20T13:35:07+00:00Z

NASA CR-168217
NASA CONTRACTOR REPORT
CHARACTERIZATION OF PMR POLYIMIDE RESIN AND PREPREG
Paul H. Lindenmeyer, C. H. Sheppard
BOEING AEROSPACE COMPANY
SEATTLE, WASHINGTON
CONTRACT NAS3-22523
NASA
National Aeronautics andSpace Administration
Lewis Research Center
Cleveland, Ohio 44135

FORWARD
This work was conducted under the technical direction of Dr. Richard W. Lauver,
Polymer Matrix Composite Section, Materials Division, NASA-Lewis Research Center,Cleveland, Ohio. The Materials and Processes Department of the Boeing Aerospace
Company was responsible for the work performed under this contract. Mr. C. H.
Sheppard was the program manager and Dr. M. E. Taylor served as the technical leader
for the first six months. The authors acknowledge the technical assistance provided
during the program by the following Boeing Aerospace Company personnel:
B. H. Hunter
J. Vry
Verla Monroe
Oscar Davis

CONTENTS
Summary 1
Introduction 2
Model Compounds, Precursors and Monomers 3
Selection of Baseline System 3
Quantification of HPLC Data 5
Definition and Characterization of Cure Cycle 6
Baseline Prepreg and Laminate Properties 9
Aging Studies of Baseline Resin Solutions 9
Influence of Various Possible Contaminants 10
Characterization of Commercial Monomers and Resins 11
Conclusions and Recommendations 11
Appendix A Chemical Characterization Procedures 45
Appendix B Composite Laminating Procedures 65
Appendix C Composite Mechanical and Physical Properties 67
Appendix D Prepreg Physical Properties ' 71
11
LET OF FIGURES
NUMBER - PAGE
1 Chemistry of PMR-Polyimide Resin System 13
2 Fourier Transform Infrared Spectra of Nadic Anhydride 14
3 Fourier Transform Infrared Spectra of Nadic Ester 15
4 Fourier Transform Infrared Spectra of MDA 16
5 Fourier Transform Infrared Spectra of BTDA 17
6 Fourier Transform Infrared Spectra of BTDE 18
7 Fourier Transform Infrared Spectra of Monoimide of NA 19
8 Fourier Transform Infrared Spectra of Bisimide of NA 20
9 Recommended Cure Cycle 21
10 DuPont DMA Characterization of Cure Cycle 22
11 Dielectric Dissipation Loss Factor 23
12 Comparison of DSC, Moisture Evolution and GasChromatography/Mass Spectroscopy 24
13 Comparison of DSC, Moisture Evolution and Gas Chromato-graphy/Mass Spectroscopy After 2 Hrs Aging at 150°F 25
14 Cure Analysis by Infrared 26
in

LIST OF TABLES
NUMBER PAGE
I Melting Points of Monomers, Precursors and Model Compounds 27
II Elution Time Ratios for Monomers, Precursors and Model
Compounds 28
III Typical HPLC Data from Boeing-U.S. Polymeric Data Base for
PMR-15 Resin Solutions 29
IV Typical HPLC Data from Boeing-U.S. Polymeric Data Base for
PMR-15 Prepregs 30
V Tentative Limits for HPLC Data Taken from Overall Averages of
Boeing-U.S. Polymeric Data Base 31
VI Quantization of HPLC Data for PMR-15 32
VII Quantization of Baseline Resin in Mole Percent 33
VIII Comparison of Mechanical Properties of Unidirectional Laminates
from Baseline Resin Solution with the Averages from the Boeing-
U.S. Polymeric Data Base 34
IX Aging Studies on PMR-15 Resin Solutions 35
X Calculated Weight Percent and (Mole Percent) for Contaminated
Resin Solution 36
XI Measured Concentration for Contaminated Resin Solution 37
XII Prepreg and Composite Properties for First Level Contamination 38
XIII Laminate Mechanical Properties for First Level Contamination 39
XIV Prepreg and Composite Properties for Second Level Contamination 40
XV Laminate Mechanical Properties for Second Level Contamination 41
XVI Measured Weight Percent Concentrations for Commercial Resins 42
XVII Prepreg and Composite Properties for Commercial Resins 43
XVIII Laminate Mechanical Properties for Commercial Resins 44
w

SUMMARY
This document is the final program report describing work performed by the Boeing
Aerospace Company (BAG) for the National Aeronautics and Space Administration
(NASA) Lewis Research Center under contract NAS3-22523. The objective of the
work was to develop a data base and procedures for the chemical characterization of
PMR-15 resin solutions and graphite prepreg. In addition it provided a basic
understanding of PMR-15 resin chemistry; this was translated into processing
procedures for the production of high quality graphite composites. The program was
divided as follows into four (4) technical tasks and one reporting task: 1) definition of
baseline system, 2) chemical characterization of commercial grade monomers and
solutions, 3) sensitivity of processing to specific chemical variables, 4)
characterization of commercial prepregs, and 5) reporting.
During this program, the PMR monomers and selected model compounds
representative of postulated PMR-15 solution chemistry were acquired and
characterized. Based on these data a baseline PMR-15 resin was formulated and its
processing characteristics and composite properties were evaluated. Commercially
available PMR-15 resins were then obtained and characterized. Composite panels
were fabricated and evaluated. Additionally, the effects of four chemical variations
were evaluated using the above techniques. The variations were: 1) the substitution
of 10% or 20% of theoretical amounts of nadic ester by the equivalent amount of nadic
anhydride, 2) the substitution of 10% or 20% of the BTDE by BTDA, 3) the substitution
of 10% and 20% of the nadic ester and MDA with equivalent amount of the
mononadimide and 4) the advancement of PMR-15 baseline resin at 150°F for 30 and
60 minutes.
This investigation has shown that PMR-15 resin solutions may be characterized by
HPLC methods, and that final composite properties depend primarily upon the amount
of unreacted NE present in the prepreg prior to cure. At relatively low temperatures
the NE and MDA appear to undergo a reaction that adversely effects the physical
properties (especially the high temperature aging characteristics) of the resulting
composites. Unfortunately, the most likely reaction products of such a combination,
the mono and bisimide, could not be confirmed as existing in the aged resins.
Furthermore, deliberate addition of these materials did not produce the same adverse
effects upon properties that aging produced.

In addition to the aging problem, this investigation has shown that one (or more) as yet
unidentified reactions caused by mild heating can occur during the commercial
preparation of PMR-15 resins. The isocratic HPLC method has been shown to be the
most sensitive method known at present for detecting the existence of such reactions
and determining the minimum amount of unreacted NE ( 10% by weight) necessary to
produce parts with acceptable high temperature performance.
INTRODUCTION
The purpose of this study was to characterize the monomers, resin and processing
variables of PMR-15 polyimide so that the most critical variables (impurities,
composition, process temperatures/times, degree of advancement, etc.) could be
defined in terms of their effect on prepreg processibility and composite properties.
The polymer employed in this study was the high temperature resistant, addition-type
polyimide resin system (designated PMR, for polymerization of monomer reactants)
developed at NASA-Lewis Research Center. The resin uses three monomers (Figure
1): the monomethylester of 5-norbornene-2, 3-dicarboxylic acid (NE), the dimethyl
ester of 3,3',4,4'-benzophenone tetracarboxylic acid (BTDE), and 4,4'-methylene-
dianiline (MDA). In the system as originally developed, both of the esters wereprepared by esterification of the 'corresponding anhydrides by refluxing at a 50 percent
concentration in methyl alcohoL The resin solution was then obtained by mixing the
monomer solutions in the mole ratio required to obtain a nominal molecular weight of
1,500 (NE:MDA:BTDE as 2: 3.084: 2.084) at a concentration of 50% by weight in
methanoL This solution was then used to impregnate graphite fibers or cloth, and
most of the solvent driven off. Although it is generally assumed that essentially no
reaction occurs during the preparation of prepreg in this manner, this is clearly only an
approximation and prepreg is routinely kept frozen prior to use in order to minimize
premature reaction.
As this resin system was further developed for commercialization it became desirable
to reduce the amount of solvent involved in the preparation of prepreg cloth and tapes.
This resulted in the development of the so-called "hot melt" process in which the
esterifications are carried out in a highly concentrated ( 90%) solution in methanol,
and the prepregging carried out with similarly highly concentrated solutions. The high
viscosity of such solutions requires powerful stirring and handling equipment not easily
duplicated in the laboratory. The "hot melt" process also increases the possibility of
local high temperature or high concentrations which can further complicate the

chemistry of the curing reactions. Thus the commercially attractive "hot melt"
process requires even more careful quality control in order to assure that resins and
prepregs prepared by this process can be cured into composite laminates having the
high temperature properties and the high temperature aging characteristics potentialto the PMR-15 resin system. This study was designed to identify the critical variables
and to develop characterization techniques which could be used to control the qualityof the resulting composite laminates, and, to the extent possible, increase our
understanding of the basic chemical reactions involved.
MODEL COMPOUNDS, PRECURSORS AND MONOMERS
In order to identify and characterize the impurities that might reasonably be expected
to exist in the PMR-15 resin system, preparations were made or obtained of the
following precursors and model compounds:1. 5-norbornene-2, 3-dicarboxylic acid anhydride (NA)
2. 3,3', 4,4'-benzophenone tetracarboxylic dianhydride (BTDA)
3. The monoimide formed from NA and MDA
4. The bisimide formed from 2NA and MDA
5. The tri- and tetra-methyl esters of BTDA
In addition the three monomers, NE, MDA and BTDE were obtained from a number of
sources in order to select the highest purity possible for the baseline system. All these
materials were characterized by (1) melting points via differential scanning
calorimetry (DSC), (2) Fourier transform infrared spectroscopy (FTIR), and (3) high
performance liquid chromatography (HPLC). The melting points of the purest
specimens obtained are listed in Table I, the infrared spectra in Figures 2 through 8,
and the qualitative HPLC results are summarized in Table II. In most cases these
latter data are given as the observed ratio of the elution time of the characteristic
peak to the tetrahydrofuran (THF) marker peak characteristic of the isocratic HPLC
method used (Appendix A.I). The exception to this occurs in the determination of
ratios of the three isomers of BTDE; the ratios in Table II are relative to the first
isomer to emerge from the column. The quantification of these data will be discussedin a subsequent section.

SELECTION OF BASELINE SYSTEM
Our objective in this selection was to obtain the purest available monomers and to
develop methods to quantitatively characterize the resulting baseline resin system.
After investigation of monomers supplied by several commercial resin manufacturers,
as well as several specimens prepared by esterifying the two anhydrides in our
laboratory, it was decided that NE and BTDE obtained from U.S. Polymeric offered
the best available choice for the baseline system. The NE showed essentially a single
HPLC peak and the BTDE exhibited an average of only 3.56% of the total area in the
HPLC spectrum which could be attributed to the triester. This selection of U.S.
Polymeric-prepared monomers allowed the use of a substantial data base of HPLC
results obtained over several years of a cooperative quality control program between
Boeing and U.S. Polymeric. The HPLC data in Table III are typical examples from this
data base. Unfortunately these data are all expressed in terms of the percent area
under the curve with no attempt to account for the difference in absorptivity
coefficients. Thus even if one assumes that the absorptivity of all the BTDE isomers
as well as the triester have similar absorptivity, this data base tells us only that the
relative amounts occur in the ratios of 1: 2.47: 1.80: 0.19 where the first three
represent the diester isomer and the last the triester. Please note the distinction
between the elution time ratios of Table II which serve to qualitatively identify the
peaks in the HPLC spectrum and these relative ratios of the areas under the curves.
These monomers were prepared by the commercially desirable "hot melt" method with
a minimum amount of methanol (approximately 10%) and thus are characteristic of
present commercial practice.
In the preparation of our baseline resin solution these two monomers were again
diluted and combined with MDA to obtain a resin solution that was 50% solids by
weight. Although the ratio of monomers was always held at the nominal
(NE:MDA:BTDE as 2: 3.084: 2.084) the uncertainty as to the amount of methanol in
the BTDE created some uncertainty in the quantitative stoichiometry. The amount ofmethanol in the BTDE was estimated by heating at 316K (110°F) to constant weight or
16 hours.
The Boeing-U.S. Polymeric data base contains HPLC data on resin solution and
prepreg. Typical results are given in Tables III and IV and the overall average values
are summarized in Table V. Here again the elution time ratios serve only to

qualitatively identify the various peaks and the only quantitative aspects of these data
are the relative peak area ratios.
QUANTIFICATION OF HPLC DATA
In order to make use of this data base and to obtain the quantification in terms of
weight percent or mole percent it becomes necessary to carry out a number of
calibrations as well as to make certain assumptions that may have questionable
validity.
First, since the isocratic HPLC method upon which the existing HPLC data is based
does not detect a peak for the MDA, it was necessary to develop a method that could
detect MDA in a reasonable time. This method uses a reverse phase column and a
gradient mobile phase. This gradient method detects all three major monomer
components of the resin solution; however, it does not resolve the BTDE isomers(Appendix A.2).
Now if one assumes that the absorptivity of all components are the same in both HPLC
methods, we can obtain three independent ratios of the amounts of the four principle
components: NE, BTDE, MDA and the triester. We thus require only a single
independent calibration of one of these components in order to quantitatively
determine the weight percent of each of the three monomers and the principle
impurity, the triester. In view of the uncertainty of the amount of methanol in BTDE
we carried out calibration runs for all three major components, NE, BTDE and MDA.
Although the existing isocratic HPLC data base consisted essentially of only the
BTDE:NE:Triester ratios, this method of calibration permits the conversion of the
existing data base to weight percent along with the baseline system. Thus we have
included in Table VI the average weight percent of BTDE and triester as well as the
proposed lower limit of NE from Table V. However, since data for MDA was not
included in the data base, only the baseline system provides measured weight percent
for all major components. Note that even for the baseline system where all four
identified and quantified components are known there still exists an unidentified
quantity of material obtained by subtraction of the known quantities from 100 percent.
This presumably represents some reaction product.
In view of the uncertainties involved and the assumptions necessary to arrive at this
weight percent, it must really be considered as no more quantitative than the

percentage area of the HPLC measurements from which it is derived. The only
advantage in expressing the results in weight percent rather than percent of total area
under the HPLC curve is that weight percent can be compared with the theoretical
values. Thus the proposed lower limit of 2.8% area for the NE peak works out to be
about 10 weight percent of the resin. Comparing this to the 21.69 weight percent of
NE theoretically initially present, we can see that composites made with resins in
which more than about half of the NE has already reacted would not have sufficient
out life in a manufacturing environment. However, if composites were fabricated
under ideal laboratory conditions the composite properties would be well within
accepted tolerances.
In order to further reduce the data from weight percent to mole percent it becomes
necessary to make an additional assumption concerning the molecular weight of this
unknown reaction product. Table VII contains this mole percent for the baseline
system assuming that the reaction product is (1) the monoimide of NE and MDA, (2)
the bisimide of 2NE and MDA, and (3) a reaction product of two MDA molecules with a
single NE molecule. This latter product is not precluded by steric considerations but it
is considered most unlikely to occur except in the case of locally very high
concentrations of MDA with respect to NE. Although the formation of the mono or
bisimide are considered to be the most probable reaction products, no direct evidence
for their formation is found in the HPLC data. There was also no evidence for the
formation of the third possibility, but since the MDA molecule is not observed in this
HPLC method and presumably is held up in the column, it is not unreasonable to
assume that this reaction product might also be held up in the column.
DEFINITION AND CHARACTERIZATION OF CURE CYCLE
The cure cycle selected for this work was adopted from the cycle developed on
contract NASl-15009 "Quality Control of PMR-15" and detailed in Document No.
D180-20545-5A in NASA CR-159182 (see Appendix B.I). The allowable limits for this
cure cycle illustrated in Figure 9 had been selected to allow the operation of certain
commercial autoclaves. For most of the work described in this report the temperaturewas increased to 522 K (480°F) at 1.7K (3°F) per minute and held at this temperature
for 30 minutes. At this point 650 mm of Hg (24 inches) vacuum and 1379 Pa (200 psi)positive pressure was applied and the temperature increased to 602K (625°F) at (1.7K
(3°F) per minute and held for two hours. The temperature was then lowered at 1.1K
(2°F) per minute to 322K (120<>F) and the pressure released. Laminates cured in this

manner were then subjected to a six hour post cure in an air circulating oven at 602 K
(625°F). Heat up rate for the post cure did not exceed 3K (6°F) and a cool down rate
of 1.1 K (2°F) per minute.
A number of methods were investigated to characterize the chemical and physical
changes which occur during this cure cycle. The physical changes were found to bebest characterized by dynamic mechanical analysis (DMA) using the DuPont compound
pendulum method (see Appendix A.2). Typical results are shown in Figure 10. The
first three damping peaks occur at 373K (212°F), 423K (302°F) and 503K (446°F), and
correspond very nicely with (1) the melting of the monomers, (2) the imidization
reaction, and (3) the glass transition or softening and flow of the polyimide. The
frequency curve, which is a measure of modulus, clearly shows that the first damping
peak corresponds to a decrease in modulus (melting) while the second corresponds to
the increase in modulus due to the imidization reaction. The third peak shows a
frequency and damping relationship typical of the glass transition in a thermoplastic
polymer. During the 30 minute holding period at 522K (480°F) both the damping and
the frequency increase slightly which would be consistent with the completion of the
ring closing imidization reaction and the continued flow of the thermoplastic
polyimide. With the resumption of heating at the end of the 30 minute hold period,
both the damping and the frequency decrease to a minimum at about 563K (554°F) and
then increase as the crosslinking reaction begins to influence the flow properties of
thermoplastic polyimide. The 30 minute hold period at 522K (480°F) is a reasonable
point to apply pressure to effect the best possible consolidation of a composite
material since it is just above the glass transition of the essentially complete
polyimide and below the activation temperature for the crosslinking reaction.
Other methods of physically characterizing the cure cycle including dielectric
dissipation loss factor (see Figure 11 and Appendix A.3), differential scanning
calorimetry (DSC) (Appendix A.4), and direct measurement of the flow by trimmingaway and measuring the "flash" from laminates were evaluated during the program. In
general these methods produced results in agreement with those of the above
described DMA. However, these results were not considered to be as reproducible or
significant as those produced by DMA, since measurement of resin flash did not yield
continuous results, and the sensitivity of the other two methods depends upon thescanning rate.

Chemical characterization of the cure cycle was studied (Appendix A.5) using Fourier
transform infrared spectroscopy (FTIR), moisture evolution (Appendix A.6 and Figure
12) and gas chromatography-mass spectroscopy (GC/MS) (Appendix A.7). Some
uncertainty in interpretation was encountered with all of these methods in that it wasnot possible to exactly duplicate the cure conditions. However, sufficient detail was
obtained to allow the development of excellent cure cycles. It was observed that the
maximum in moisture evolution occurred at 423K (302°F); this coincides with the
observed damping peak previously identified with the formation of amide esters. The
corresponding maximum in methanol evolution was observed somewhat later at about
463K (375°F). Thus it is reasonable to conclude that most of the imidization reaction
occurs in the region from 393 K (248OF) to 503 K (446°F). Boeing therefore concluded
that the first reaction step involved the formation of the amide-ester with the
liberation of water, as indicated in Figure 1. The formation of amide-acids, which
would liberate moisture, is possible, but not supported by experimental data. While
both reactions probably occur, the formation of amide-acids is not considered to be
particularly significant.
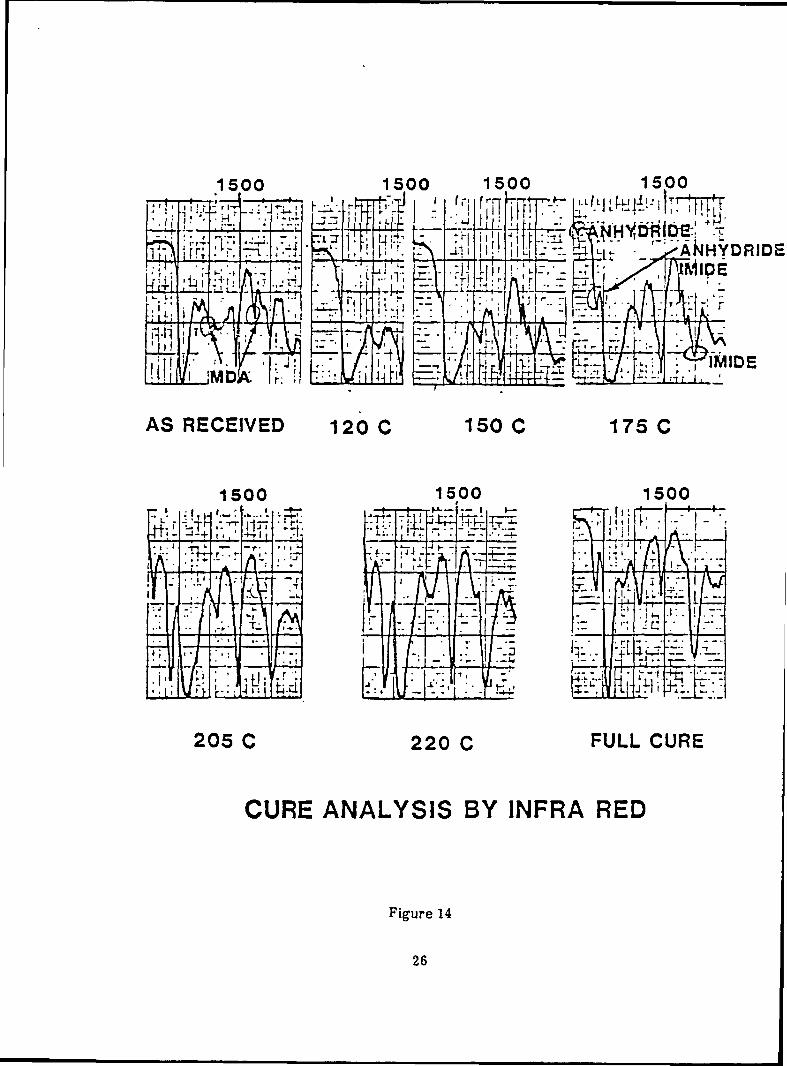
In heated FTIR studies, the PMR resin was scanned through the proposed cure cyclewith the following results. An FTIR absorption band was observed at 1860 cm~l. This
band first appears at 435K (325°F), increases to a maximum by the temperature of the
30 minute hold at 522K (480°F) and then disappears during this period (see Figure 13).
This band and a companion band at 1775 cm~l are known to be characteristic of an
anhydride; the formation of anhydrides has been previously suggested in the literature.
One possibility is that any diacid present in the original resin or formed by the
hydrolysis of a BTDE isomer would first form an anhydride by the elimination of water
before it could undergo the imidization reaction. It may be that this mechanism is the
slowest part of the imidization reaction that requires the holding time at 522K (480°F)
for its completion. Since we lack any quantitative estimate of the amount of reaction
that occurs by this mechanism it is not possible to estimate its importance in the
overall cure of PMR-15.
Another key observation made during the cure cycle studies was that, in the volatile
evolution test (Appendix A.6), the evolution of cyclopentadiene begins well in advance
of the thermally activated crosslinking reaction. Significant amounts of cyclo-
pentadiene are evolved by 463 K (374°F) while the increase in damping and modulus due
to crosslinking, as measured by the DMA, did not begin until 563K (554°F). The
observation of significant amounts of cyclopentadiene evolution at temperatures below

473K (392°F) does not agree with previous assumption concerning the decomposition of
the nadic ring, but can be explained by the presence of two isomeric forms of the
nadic material. This observation becomes even more significant since it was observed
that increased aging tended to increase the cyclopentadiene, converting the shoulder
at 463K (374°F) into a small maximum.
BASELINE PREPREG AND LAMINATE PROPERTIES
Celion 3000 graphite tow was impregnated with the 50% by weight solution of the
baseline system. The resulting prepreg was laid up in a unidirectional laminate and
cured as described in the previous section. The physical and mechanical properties of
these laminates are given in Table VIII along with the average values from the data
base of several hundred specimens. The solution-coated prepregs made on this
program yielded laminates with mechanical properties only very slightly lower than
the average values from the data base. Note that monomers used in our baseline
solutions were esterified as a 90% solution but the prepregs were made by coating
from a 50% solution. The laminates in the data base were made with both the
monomers and the prepregs prepared from the more concentrated (i.e., 90%) solution.
(See Appendix B, C and D for Composite Fabrication, Prepreg Properties and
Composite Properties.)
AGING STUDIES ON BASELINE RESIN SOLUTIONS
Solutions of the baseline resin in two concentrations 50% and 67% were aged at threedifferent temperatures, 295K (72°F), 316K (11QOF) and 339K (150°F), for a variety of
times up to 165 hours. The resulting solutions were analyzed using the HPLC methods
(Appendix A). The results of this analysis, tabulated in Table IX, show that the
concentration of BTDE and the triester did not change by more than the experimental
error during any of the aging time and temperatures measured. On the other handboth the NE and the MDA concentrations decreased with aging, indicating the
probability of some kind of a reaction product between these two monomers. Although
a very weak "reaction peak" that increased with aging was observed in the HPLC
gradient method, this peak could not be identified with either the mono or the bisimide
of NE and MDA, the most logical reaction products to be expected. The weight
percent of "reaction product" given in Table IX was obtained by difference since the
observed peak could not be positively identified and calibrated.

Although the model compound work had established the elution time ratios for thesetwo materials (see Table n) no systematic increase at these locations was observed.However, both of these compounds are known to have limited solubility in methanol.The possibility exists that these compounds were formed, but precipitated from thesolution and were not observed or included in the HPLC sample due to the highviscosity of the resin solution. Subsequent observations, during substitution of themonoimide for part of the formulation, supported this possibility.
A number of additional measurements (e.g., FTIR (Appendix A.6), dielectric loss(Appendix A.4), DMA (Appendix A.9), etc.) were made on these aged solutions as the
resin was carried through the cure cycle. Unfortunately none of these measurementsshowed any systematic change with aging. This was especially disappointing in the
case of the torsional braid data which did show some differences in apparent viscosity.This method is not quantitative however, so no significance could be attributed tothese differences.
INFLUENCE OF VARIOUS POSSIBLE CONTAMINANTS
In order to assess the influence of various extraneous materials likely to occur inPMR-15 resins, three of the most likely such materials, BTDA, NA, and the monoimideof NA and MDA, were selected for investigation. These materials were substituted forequivalent amounts of the monomers at the 10% and 20% levels. The calculatedweight percent and mole percent compositions of these six formulations are given inTable X along with the composition of the baseline resin, for comparison. Resinsolutions having these nominal concentrations were made up and analyzed by theHPLC methods described in Appendix A. The results are given in Table XI. Celion3000 graphite tow was impregnated with these 10% substituted solutions, and theprepregs were used to lay up and cure unidirectional panels. A baseline solution thathad been aged for 1/2 hour at 150°F was included. The prepreg and compositeproperties are summarized in Table XII and the mechanical properties of the resultinglaminates are in Table Xn (see Appendix B, C and D for procedures). Note that at thislevel of contamination laminates with mechanical properties not significantlydifferent from the baseline or the data base averages were produced.
Upon proceeding to the second level of contamination it was observed that the mixturein which BTDA was substituted for 20% of the BTDE could not be processed due to theinsolubility of BTDA in alcohol. Consequently data on this formulation was not
10

obtained. The prepreg and composite properties of this level are given in Table XIV
and the mechanical properties of the laminates in Table XV. Note that the flexural
strength and interlaminar shear were reduced by this level whereas the flexural
modulus was essentially unchanged. Since it was not reasonable to expect a level of
contamination in excess of 20%, no third level was attempted.
CHARACTERIZATION OF COMMERCIAL MONOMERS AND RESINS
Commercially prepared monomers and polymer solutions were obtained from four
manufacturers, Ferro, Fiberite, Hexcel and U.S. Polymeric. The Fiberite specimens
were eliminated from further testing after it was discovered that this manufacturer
apparently used a different chemistry based upon ethanol rather than methanol as the
solvent. The HPLC results for these commercial resin prepregs are summarized in
Table XVI, the prepreg and composite properties in Table XVII and the mechanical
properties of the composites in Table XVIII. Analytical techniques, composite
fabrication and composite evaluation are given in the Appendices.
CONCLUSIONS AND RECOMMENDATIONS
The primary objective of this program was to develop a data base and procedures for
the chemical characterization of PMR 15 resin solutions and graphite prepreg. In
addition, the program was to provide a basic understanding of the PMR-15 resin
chemistry for translation into quality control techniques for the manufacture of
quality prepreg and high performance graphite reinforced structure. The objectives of
the program were met. The procedures developed have been subsequently utilized to
develop material and process specifications at Boeing. More detailed conclusions, and
recommendations for further studies are presented below.
Conclusions
o Chemical characterization techniques using HPLC, infrared, and thermal
analysis techniques were developed with sufficient reproducibility to be viable
for use as a quality control tool.
o Sufficient chemical and/or physical property data was obtained on the PMR-15
resin to enable the development of a processing cycle for both graphite
broadgoods and graphite composite structure.
11

o The PMR-15 resin was shown to be very tolerant with respect to some compositeproperties when contaminated with the more obvious potential model compounds.
o The PMR-15 resin was shown to be sensitive to its thermal history during resin,
prepreg, and composite manufacture.
o Excellent analytical methods (i.e., DSC, infrared, volatile evolution, etc.) weredeveloped for the study of the chemistry and physical transformations (i.e.,DMA) of PMR resins.
Recommendations
o Sufficient data and/or techniques are available for the development of a Mil
Specification on PMR resins and broadgoods. This work should be pursued.
o The relationships between the processing conditions and the isothermal stabilityof PMR resins should be determined.
o The degradation kinetics and chemistry of PMR resins should be evaluated todetermine graphite reinforced structure's life at high temperatures.
12

cc0 -i1 1
C-OH
C -OCMj
0
• Cn » II
r
II|f M -tf̂ %- C -<E^~ NMj
H.
» n
NC MOAA | H?0
0 0
BIDE
MONOMtRRtAUANIS
<KC— N
C-CH
II-C-II
CHj-(
0 J.
I -CHjOH
H y v H II
"3 .';u
I'OIYAMIIIE ESIIH
H
H
0u0u
A I PRESSURE
1HCRMAUYCRUSSUNKEO
POIYIMIDl
Figure 1. Proposed reaction sequence for PMR-polyimide resin
13

._ _io 10 j,oo naa jooo IOM
. __ i _ i ' _ LI _ LJ __ I _ . I ___ Li i _ l _ l I 'itbj <>oo noo torn <v>a leoo i>E5 T«uo 1500 KM TJOO Tibo nlia 1000" va »!io E — 'JGo - ^Bu - Tc
Figure 2. FTIR Spectrum of 5-norbornene - 2, 3 - dicarboxylic acid andydride (NA) - Eastman
14

Figure 3. FTIR Spectrum of Monomethylester of 5 - norbornene - 2, 3 - dicarboxylicacid (NE) - U.S. Polymeric
15

Figure 4. FTIR Spectrum of 4.4' - Methylenedianlline (MDA) aldrich
16

ofio i T E o l e b o isoo r*oo 1100 i too i ibo ic
i
c : **»'ii jsuo j>\)o ytoo 3000I LJ-JJQUO *%oo iibo *^l
Figure 5. FTIR Spectrum of 3, 3', 4' - benzophenonetetra - carboxylic - aciddianleydride (BTDA) - Eastman
17

BTDE_7496.[CMtrlr^D riM ^Al ~[
Figure 6. FTIR Spectrum Dimethylester of 3, 3', 4, 4' benzophenonetetracarboxylic acid (BTDE)
18

f i
1iiU> JUUU Jl
Figure 7. FTIR Spectrum of the monoimide of NA and MDA
19

U lutii) JMIU JsOU 3.100 30(10 2BI1O 2t>OO ,̂ bu 6ba _ sua
Figure 8. FTIR Spectrum of the bisimide of 2 NA and MDA
20

589 (625) I
533 (500}L
477 (400)
TEMPERATURE,< (°F)
423 (300)U
366 (200)k
311 (100)
60JL
120 130 240
TIME (MINUTES)
300 360 240
Figure 9. Recommended Cure Cycle
21

Samples PMR-15Size: 10.7 X 6.35 X . 33 ,—. K A A
Rate: 1.7 DMA Date: 28-Oot-82
1 1 1 1 1 1 1
1.2
1.0
0.8
0.6 O
a.0.4 2
0.2
0.0
•0.2
20 40 60 80 100 120 140 160 180 200 220
TIME (MIN)
Figure 10
22

PMR-15 DIELECTRIC AT 1 KHz5 DOLC/HIN HEAT RATE
1E2DISSIPATION FACTOR
ft
1E1
lEfl
1E-1
1E-2
8 20 48 1« 120 140 160
TEW (DEG.D
228 240 260 280 308 320
Figure 11
23

SOS Unaged
OSC and H20, CHjOH, C5Hg evolution of a
fresh 50? solution of PMR-15 resin
200•Degrees Centigrade
400 °C
24

SOS Aged 2 hrs 9 150°F
Figure 13 DSC and H20, CHjOH and C-Hg
evolution of a 50? PMR-15 resin solution
ino 200 300Ccgrees Centigrade
400
25
1500 1500
AS RECEIVED
1500
120 C 150 C 175 C
1500 1500
205 C 220 C FULL CURE
CURE ANALYSIS BY INFRA RED
Figure 14
26

TABLE I MELTING POINT MAXIMA OF MONOMERS AND MODEL COMPOUNDS
MATERIAL MP,K(OF) IMPURITY M.P. K(op)
Eastman - NA 369 (205)
Eastman - BTDA 497 (435) 477 (399)
Eastman - BTDA (Rxd) 500 (441)
Aldrich - MDA 365 (198)
NASA Lewis - MDANI 464 (376)
Boeing - MDANI 451 (352)
NASA Lewis - MDAdiNI 537 (511) 527 (489)
Boeing - MDAdiNI 534 (502)
NASA Lewis - BTTE 389 (244)
27

TABLE n
ELUTION TIME RATIO FOR MONOMERS AND MODEL COMPOUNDS
MaterialHPLC Elution TimeRatio to THF Marker
BTDA
BTDE
Monoimide of NE and MDA
Triester of BTDA
Nadic Ester
Nadic Anhydride
Tetra Ester of BTDA
Bisimide of NE and MDA
Methylene Diamine(MDA)
* BTDE isomers and triester relative to 1st BTDE peak
MDA is not observed in the isocratic HPLC method
0.48 - 0.52
0.52-0.75 (1.00, 1.13, 1.30)*
1.05 -1.07
1.09 - l.ll (1.70)*
1.12 -1.14
1.35 -1.36
1.78 - 1.80
2.16 -2.17
28

TABLE III
TYPICAL HPLC DATA FROM BOEING-U.S. POLYMERIC DATA BASE FOR PMR-15 RESIN SOLUTIONS
NE 1st BTDE 2nd BTDE 3rd BTDE BT Tri E
Sample No.
WR 5889
WR 5417
WR 5608
WR 5866
WR 5909
WR 6040
Average
This Project
Ratio
1.101.08
1.151.13
1.12
1.12
1.12
1.11
% Area
3.61
3.66
3.60
3.84
3.58
4.19
3.75
4.87
Ratio
0.582
0.567
0.670
0.649
0.694
0.514
0.612
0.635
% Area
17.27
17.18
16.49
16.08
15.86
18.71
16.9316.81
Ratio*
1.11
1.11
1.13
1.13
1.10
1.11
1.12
1.14
% Area
42.67
42.17
42.15
43.61
41.15
46.41
43.02
41.23
Ratio*
1.251.29
1.32
1.35
1.29
1.29
1.30
1.35
% Area
27.27
27.91
33.11
32.56
36.94
30.67
31.41
31.94
Ratio*
1.68
1.69
1.23
1.78
1.65
1.68
1.62
1.71
% Area
8.75
8.62
2.57
3.90
2.47
3.86
5.26
5.23
* Ratio Relative to 1st BTDE Isomer Peak
29

Average
TABLE IV
TYPICAL HPLC DATA FROM BOEING-U.S. POLYMERIC DATA BASE FOR PMR-15 PREPREGS
Sample No.
2W4582
2W4604
2W4632
2W4643
2W4651
3W2020
Ratio
1.13
1.14
1.12
1.15
1.11
1.13
NE
% Area
3. .60
3.65
3.94
3.02
3.03
4.31
1st
Ratio
0.565
0.594
0.603
.0.591
0.573
0.60
BTDE
% Area
16.44
19.43
15.83
15.25
16.21
18.32
2nd
Ratio*
1.11
1.12
1.13
1.13
1.15
1.12
BTDE
% Area
40.45
44.74
45.45
42.26
40.55
44.37
3rd
Ratio*
1.27
1.29
1.36
1.33
1.42
1.30
BTDE
% Area
26.57
31.51
29.33
31.55
37.13
30.98
BTTri
Ratio*
1.69-
1.80
1.79 .
1.96
1.70
E
% Area
12.93-
4.77
5.43
2.91
1.64
1.13 3.59 0.587 17.0
* Ratio Relative to 1st BTDE Isomer Peak
1.13 42.97 1.31 31.29 1.78 3.69
30

TABLE V
TENTATIVE LIMITS FOR HPLC DATA TAKEN FROM OVERALL AVERAGES OFBOEING-U.S. POLYMERIC DATA BASE
Material NE 1st BTDE 2nd BTDE 3rd BTDE BT TRIE
%Ratio Area Ratio* % Area Ratio* % Area Ratio* % Area Ratio* % Area
NE 1.12 + .03 ___ _ _ _ _ _ _
BTDE — - 1.00 18.0 + 1.0 1.13 + .02 45.0 + 1.8 1.30 + .04 33.0 + 1.4 1.71 + .03 3.8 + 1.6
Resin iSolution 1.12 + .03 2.8** 1.00 17.0 + 1.5 1.13 + .02 43.0 + 2.0 1.30 + .03 31.0 + 1.5 1.70 + .04 5.0 + 1.6
GraphitePrepreg 1.12 + .03 2.8** 1.00 17.0 + 1.5 1.13 + .02 43.0 + 2.0 1.30 + .03 31.0 + 1.5 1.70 + .04 5.0 + 1.6
* Ratio Relative to 1st BTDE Isomer Peak.
** Represents the lower limit rather than the average.
31

TABLE VI
QUANTIZATION OF HPLC DATA FOR PMR-15
Concentration in Weight Percent
PMR-15Theoretical
NE BTDE
21.69 44.51
MDA BT TRI E
33.80 -
Difference
Baseline SolutionThis Project
Boeing-U.S. PolymericData Base
Average
SSD Deviation
16.20 40.45 28.20 8.3 6.85
10.00* 40.45
0.63
6.54
2.09
* This represents the lower limit rather than the average from the data base.
32

TABLE VII
Quantization of Baseline Resin in Mole Percent
Assumed Compositionof Difference
NE
Concentration in Mole Percent
BTDE MDA BT TRIE Difference
Monoimide ofNA and MDA 22.37
Bisimide ofNA and MDA 22.73
NA + 2 MDA 22.82
TheoreticalPMR-15 27.90
28.35
28.81
28.92
29.07
38.50
39.13
39.27
42.03
5.39
5.48
5.50
5.39
3.84
3.48
33

TABLE VIII
Comparison of Mechanical Properties of Laminate made fromBaseline Resin Solutions (this project) with Averages from Data Base
Baseline Data Base Avera&e
Ultimate Flexural Stress MPa (ksi) MPa (ksi)
at X O
295K(720F) 1446 (210) 1569 (228) 151 (22)
585K(600°F) 296 (130) 293 (134) 96 (14)
Flexural Modulus GPa(Msi)
at
295K (72°F) 113.7 (16.7) 123.9 (18.2) 9.5 (1.4)
289K (6000F) 117.1 (17.0) 121.2 (17.2) 8.9 (1.3)
Ultimate InterlaminarShear MPa (ksi)
295K(72°F) 93.0(13.5) 96.4(14.0) 5.5(0.8)
589K (60QOF) 48.9 (7.1) 55.8 (8.1) 7.6 (1.1)
X overall average
O standard deviation
34

TABLE IX
Aging Studies on PMR-15 Resin Solutions
Concentration in Weight Percent
Run Solution# Concentration
41
48
49
50
51
52
53
54
55
56
57
58
59
60
61
62
63
50%
50%
50%
50%
50%
50%
50%
50%
50%
67%
67%
67%
67%
67%
67%
67%
67%
Time(hours)
0
0.5
2.0
4.0
24.0
0.25
1.00
2.0
165.0
0
0.5
2.0
4.0
24.0
0.25
1.00
2.00
Temperature
316K (110QF)
316K (110°F)
316K (HOOF)
316K (110°F)
316K (110°F)
339K (150°F)
339K (15QOF)
339K (1500F)
295K (72°F)
316K (HOOF)
316K(110°F)
316K (HOOF)
316K (HOOF)
316K (HOOF)
339K (150°F)
339K (150°F)
339K (1500F)
NE
17.53
14.15
8.35
7.42
4.18
7.20
5.15
3.28
8.71
10.58
8.39
6.30
5.69
5.58
8.10
4.68
3.10
BTDE
41.67
39.63
42.29
41.06
40.04
40.45
41.27
43.31
41.07
42.50
43.11
41.88
41.07
42.13
43.01
42.08
41.57
MDA
27.32
24.12
23.72
22.32
15.84
20.02
19.39
18.85
17.29
23.65
23.49
23.05
22.21
17.32
21.17
19.72
17.73
BT Tri E
5.23
3.85
4.00
3.44
2.54
3.39
3.28
2.48
3.97
3.45
3.81
3.35
2.70
3.72
3.19
3.60
3.43
ReactionProduct
8.25
8.25
21.64
25.76
37.40
28.94
30.91
32.08
28.96
19.82
21.20
25.42
28.33
31.35
24.53
27.92
34.23
35

TABLE X
Calculated Weight Percent and (Mole Percent)for Contaminated Resin Solutions
NE
PME-15 BASELINE 21.69 (27.90)
10% N-IMIDE20% N-IMIDE
10% NA20% NA
10% BTDA20% BTDA
19.63 (25.83)17.55 (23.64)
19.59 (25.11)17.48 (22.32)
21.85 (27.90)22.02 (27.90)
BTDE
44.51 (29.07)
44.75 (29.91)45.00 (30.79)
44.66 (29.07)44.82 (29.07)
40.35 (26.17)36.14 (23.25)
MDA
33.80 (43.02)
31.79 (41.39)29.74 (39.65)
33.92 (43.02)34.06 (43.02
34.05 (43.02)34.31 (43.02)
N-IMIDE
3.83 (2.87)7.70 (5.91)
NA
1.98 (2.79)3.65 (5.58)
BTDA
3.73 (2.91)7.53 (5.82)
36

TABLE XI
Measured Concentration
Run#
7T
8T
10T
9T
11T
12T
52
54
Description
Baseline
10% NA (substituted)
20% NA (substituted)
10% BTDA (substituted)
20% BTDA (substituted)t
10% N-MDA (substituted)
20% N-MDA (substituted)
Aged 1/4 hour
Aged 1 hour
NE
16.20
13.50
12.40
17.50
14.3
13.2
7.20
5.15
(21.69)
(19.56)
(17.48)
(21.85)
(22.02)
(19.63)
(17.55)
-
-
40.45
38.72
41.70
39.00
41.6
42.05
40.45
41.27
BTDE
(44.51)
(44.66)
(44.82)
(40.35)
(36.14)
(44.75)
(45.00)
-
-
MDA
28.20
27.80
23.53
24.70
25.16
22.20
20.02
19.39
(33.80)
(33.92)
(34.06)
(34.05)
(34.31)
(31.79)
(29.74)
-
-
BTTr E
8
8
6
4
5
5
3
3
.3 (-)
.85 (-)
.90 (-)
.50 -
.82 -
.75 -
.39 -
.28 -
Difference
6.85
11.13
15.41
14.30
13.12
16.80
28.94
30.91
(-)
(1.98)
(3.65)
(3.73)
(7.53)
(3.83)
(7.70)
-
-
( ) Theoretical expected weight percent
BTDE/NE and BTDE/BT Tri E measured by isocratic - absorption HPLC
BTDE/MDA and BTDE/NE measured by gradient - reverse phase HPLC
37

TABLE XH
Prepreg Properties
Volatiles (%)
Gel Time (sec.)
Resin Content
PMR-15+10% NA
10.2
40
38.3
PMR-15 PMR-15 PMR-15+10% BTDA +10% N-IMIDE 1/2 hr at 15QOF
9.2
40
38.4
8.1
35
39.0
8.2
35
37.5
Resin Content%
SpecificGravity (gm/cc)
Void Volume (%)
Fiber Volume
28.6
1.62
Composite Properties
28.2
1.63
29.3
1.60
27.0
1.61
65.7 67.2 64.2 67.3
38

TABLE XHI
Laminate Mechanical Properties for First Level Contamination
FlexuralStrength (KSI)
RT6000F
FlexuralModulus (MSI)
PMR-15+10% NA
261.7 (239.0)170.7 (155.9)
PMR-15+10% BTDA
266.2 (237.7)120.1 (107.2)
PMR-15+10 N-IMIDE
219.2 (204.9)130.9 (122.3)
PMR-151/2 hr at15QOF
234.1 (208.7)126.5 (112.8)
PMR-15Baseline
X 5-
228134
2214
RT600°F
InterlaminarShear
RT600°F
17.117.4
13.77.6
(15.6)(16.0)
16.219.7
13.76.3
(14(17
.5)
.6)16.320.7
15.16.9
(15.2)(19.3)
15.820.3
13.06.9
(14.1)(18.1)
18.217.6
14.08.1
1.41.3
0.81.1
( ) normalized to 60% fiber volume
39

TABLE XIV
Prepreg Properties
Volatiles (%)
Gel Time (sec.)
Resin Content (%)
Resin Content (%)
Specific Gravity (gm/cc)
Void Volume (%)
Fiber Volume (%)
PMR-15+ 20% NA
8.7
40
36.7
PMR-15+ 20% N-IMIDE
9.5
35
37.7
PMR1 hr.
9.2
45
36.7
Composite Properties
35.4 29.7
1.57 1.61
58.1 64.7
30.6
1.61
<1
63.6
40

TABLE XV
Laminate Mechanical Properties for Second Level of Contamination
PMR-15 PMR-15 PMR-15 PMR-15+20% NA +20% N-IMIDE 1 hr. ISQOF BASELINE
FlexuralStrength (ksi) X o
RT 173.4(179.1) 175.7(162.9) 174.5(164.6) 228 22600QF 117.5(121.3) 113.1(108.5) 123.8(116.8) 134 14
FlexuralModulus (m si)
RT 17.0(17.6) 18.4(17.1) 18.7(17.6) 18.2 1.46000F 17.6(18.2) 18.2(16.9) 19.5(18.4) 17.6 1.3
InterlaminarShear
RT 13.5 12.8 14.2 14.0 0.8600°F 6.1 6.1 6.4 8.1 1.1
( ) Normalized to 60 percent fiber volume.
41

TABLE XVI
Measured Weight Percent Concentrationfor Commercial Resins
NE BTDE MDA BT Tri E Difference
PMR-15Theoretical
Baseline
Hexcel
U.S. Polymeric
21.69
16.20
11.00
13.03
44.51
40.45
43.54
45.30
33.8
28.20
19.15
22.68
-
8.3
7.5
2.44
-
6.85
18.81
13.55
42

TABLE XVII
Prepreg and Composite Properties for Commercial Resins
Volatiles (%)
Gel Time (sec.)
Resin Content (%)
Resin Content (%)
Specific Gravity
Void Volume (%)
Fiber Volume
Prepreg Properties
Hexcel
7.6
40.0
35.9
Composite Properties
Hexcel
47.2
1.57
0
56.2
U.S. Polymeric
9.5
45
38.2
U.S. Polymeric
48.1
1.57
0
57.1
43

TABLE XVni
Laminate Mechanical Properties for Commercial Resins
Hexcel U.S. Polymeric
Flexural Strength (KSI)
RT 196.9 (210.2) 192.6 (202.4)6000F 97.6 (104.2) 97.8 (102.8)
Flexural Modulus (MSI)
RT 14.8 (15.8) 16.58 (17.42)6000F 13.3 (14.2) 15.55 (16.33)
Interlaminar Shear (KSI)
RT 14.7 (15.6) 13.24 (13.91)600°F 6.1 (6.5) 5.83 (6.13)
( ) normalized to 60% fiber volume.
44

APPENDIX A
CHEMICAL CHARACTERIZATION PROCEDURES
A.I High Pressure Liquid Chromatography (Isocratic Method)
Test shall be performed with a duPont Model 850 or equivalent.
a. Sample Preparation
(1) Neat resin
From a sample of each material make a 0.1 g/5 ml solution using
tetrahydrofuran (THF) as the solvent. Filter the solution through a 0.2
micron filter.
(2) Prepreg
Obtain a 0.3 gram sample of prepreg. (This should provide approximately
0.1 gram of resin. The quantity may have to be adjusted depending on resin
content.) Discard any backing or carrier. Make a solution using 5 ml of
THF solvent. Mechanically shake the solution for ten minutes minimum.
Filter the solution through a 0.2 micron filter.
b. Instrument Parameters
Column:
Mobile Phase:
Elution Rate:
Sample Size:
Chart Speed:
UV DetectorWavelength:
UV DetectorAttenuation:
Two calibrated Type 1 duPont SE 60 size exclusion columns,
nonsilanized.
2:1 water: THF plus 0.01% acetic acid. Note: Water must be
ultra-pure and THF must be uninhibited and distilled in glass.
1.0 ml/minute3 microliter
2.0 - 3.0 cm/minute
210 nm 2 A.U.F.S.(absorption units full scale)
X8 Note: Depending on the instrument the attenuation may
have to be adjusted to give full page width chromatograms.
45

c. Analysis
(1) The required area of ^integration shall be 100,000 + 20,000 total area counts
of the chromatogram.
(2) The minimum area of integration shall be 0.625% of the total
chromatogram area.
d. Column Calibration
This method describes a procedure for calibration of the Type 1 duPont SE 60
size exclusion, nonsilanized columns used for the high performance liquid
chromatography described above.
(1) Sample preparation
Make up three solutions using benzanilide, I/, 4-bromoacetanilide, 2/ and
acenaphthene 3/ by combining 0.020 grams of each material in 5 ml ofTHF.
Blend 2.8 parts of the benzanilide solution with 4.0 parts of the 4-
bromoacetanilide solution with 0.75 parts acenaphthene solution. This
solution will then be used in the calibration procedure.
Notes
I/ Benzanilide, C6H5CONHC6H5, melting point 162-164°C, from Tridon
Chemical, Inc., 255 Oser Avenue, Hauppauge, NY 11787.
2/ 4-bromacetanilide, CHsCONHCgt^Br, melting point 165-166°C,
from Tridon Chemical, Inc., 255 Oser Avenue, Hauppauge, NY 11787.
3/ Acenaphthene, CioHg(CH2)2, melting point 90-95°C, from Aldrich
Chemical Co., P.O. Box 355, Milwaukee, Wisconsin 53201.
(2) Instrument parameters
Mobile phase: See B.1.2.1.b (previous page)
Elution rate: 1.0 ml/minute
Sample size: 1 microliter
Chart speed: 2-3 cm/minute
UV Detector Wavelength: 254 nm 2 A.U.F.S.
UV Detector Attenuation: X64
46

(3) Analysis
This evaluation is made by determination of:
N = theoretical plate number
01 = column selectivity
K' - capacity factor
Rs = resolution
The determination is made from the chromatogram.
Calculate N as follows for 4-bromoacetanilide:
2N = 16 I TZ
where Vo = elution volume in seconds
tw = baseline of extrapolated triangle in seconds
Calculate K' for both benzanilide and acenaphthene as follows:
t r-t0K' =
where tr = elution volume in seconds for each compound, respectively
t0 = elution volume in seconds for 4-bromoacetanilide.
NOTE; to is not calculated from the tetrahydrofuran elution volume but
because of difficulty at times in detecting this marker; use 4-
bromoacetanilide as the marker.
Calculate a as follows:
where Kj1 = K' for benzanilide
K2* = K1 for acenaphthene
47

Calculate Rs as follows:
_+ 1
(4) Requirements
For each column set N = 7000 (minimum) Rs = 4 (minimum).
(5) Column handling instructions
Store the column in methanol when not in use.
Flush the column with mobile phase to a stable baseline before injecting
samples or standards.
If the column deteriorates below specification requirements it may be
cleaned by pumping two to five column volumes of the following solvents
through the column in the following order.
methanol
tetrahydrofuran
cyclohexane
methylene chloride
methanol
NOTE; The above solvents must be high purity solvents.
48

A.2 High Pressure Liquid Chromatography (Gradient Method)
Test shall be performed with a duPont Model 850 or equivalent.
a. Sample preparation
From a sample of the resin make a 0.1 g/5 ml solution using methanol as the
solvent. Filter the solution through a 0.2 micron filter. Inject 3 microliters
using the instrumental parameters given below.
Instrument parameters
Column
Mobile Phase
Program
Varian R. P. MCH10
Methanol: Water
M.P. Flow Time
40:60 1.5 0.0
80:20 2.0 15.0
100:00 2.0 18.0
Detector UV at 210 and 254 nm
c. Typical chromatogram
49
fi O
- I-

A.3 Dynamic Mechanical Analysis (DMA) (duPont Method)
The equipment used shall be a duPont 981 Dynamic Mechanical Analyzer or its
equivalent
Test Method for Prepreg
a. The sample is run under the following conditions:
Sample Size Length Approximately 25 mm. The length must
be sufficient to fit in the instrument
jaws without buckling.
Sample Size Width 7.50 to 8.00 mm
Sample Size Thickness The thickness of two ply which should be
approximately 0.3 to 0.5 mm.
Working Length Actual measurement of sample between
clamps, with the gap between sample
arms in position 2
Sample Mode Horizontal Position
Number of Plies 2
Heat Rate 5°C/min
Temperature Range 0°C to 350°C
Oscillation Amplitude 0.20 mm
Environment Nitrogen
Insert the sample in the sample clamps making sure that the sample is centeredwithin the clamps and perpendicular to the arms. The test accuracy is dependent
upon placing the same length of sample in each arm clamp. Also the sample
dimensions must be measured accurately to the nearest 0.01 mm. The sample
thermocouple must be centered between the arms and located as close to the
sample as possible without interfering with the vibrating arms. Enclose the test
chamber and start the nitrogen flow at 51/minute. Record the damping and
frequency versus temperature. A typical DMA curve is shown in Figure 10.
50

A.4 Dielectrometer Analysis of Resins
This method describes the procedure for monitoring the gelling and advancement of
resinous materials.
The instrument shall be capable of measuring the dissipation factor of materials as a
function of temperature. Typical equipment is as follows:
duPont 900 Thermal Analysis Console with Dielectrometer Cell
General Radio Automatic Capacitance Bridge, type 1673
The following variables must be controlled.
a. Temperature range
b. Heating rate
c. Capacitance bridge frequency
d. Sample size
e. Inner and outer diameter of teflon template
ambient to 400°C
5°C/min.
1000 Hz
Sufficient to fill the teflon
ring
1.5"
The sample is placed between the plates of the capacitance bridge. This done by
placing a teflon template around the sample, and sandwiching it between aluminum
foil, and inserting the total package between the electrodes of the dielectrometer.
Place the sample sandwich in the dielectrometer cell between the boron nitride
insulators and assemble cell. Allow the system to equilibrate with the automatic
capacitance bridge turned on. Begin the run by turning the thermal analyzer to "Heat"
position. Record time, temperature,-conductance, and capacitance reading.
51
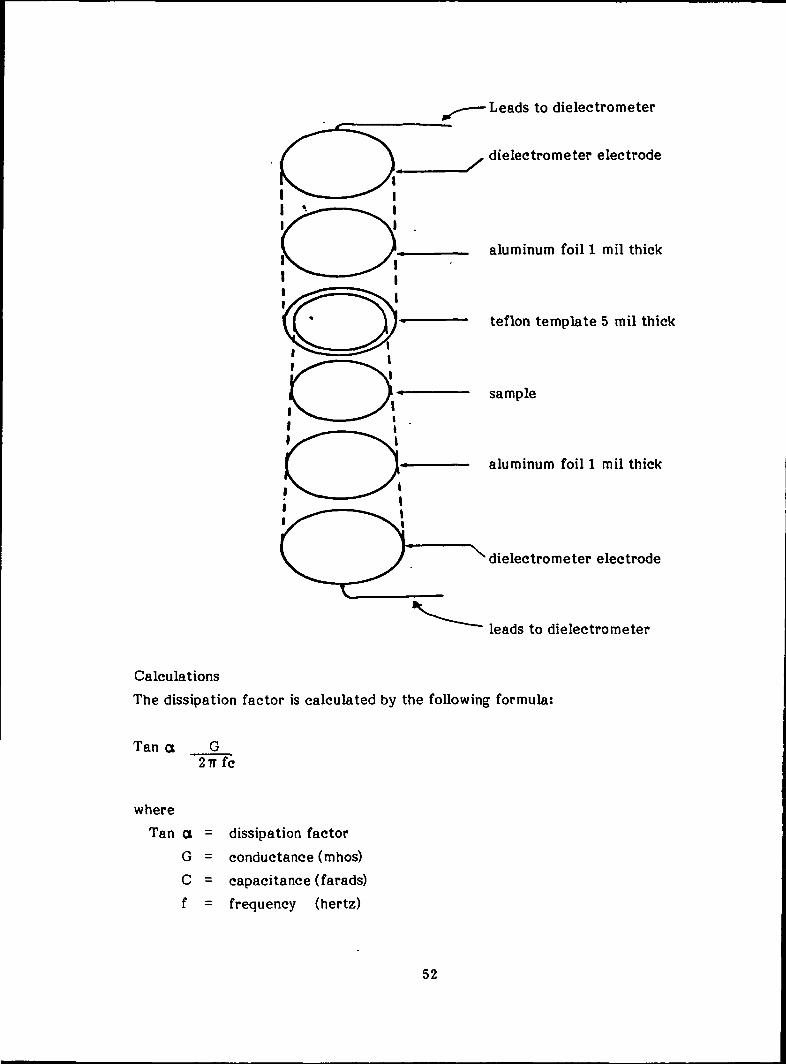
Leads to dielectrometer
dielectrometer electrode
aluminum foil 1 mil thick
teflon template 5 mil thick
sample
aluminum foil 1 mil thick
dielectrometer electrode
leads to dielectrometer
Calculations
The dissipation factor is calculated by the following formula:
Tan o G27Tfc
where
Tan a =G =
C =f =
dissipation factor
conductance (mhos)
capacitance (farads)
frequency (hertz)
52

The above formula can be reduced to Tan a = G when f - 1000 Hz
6.28C
where
Tan a =G =C =
dissipation factor
conductance in micromhos
capacitance in nanofarads
Plot the dissipation factor versus temperature.
A.5 Differential Scanning Calorimetry
Use a duPont 990 instrument, or equivalent, using the following control variables.
Sample size:
Temperature:
Rate of heating:
X-axis:
Y-axis:
Reference:
Atmosphere:
7.0 mg
ambient to 150<>F
5.0°C/minute maximum
10.0°C/minute
1 mcal/sec/inch
empty pan
air, no flow
53

A. 6 Infrared Analysis of PMR-15
A Fourier transform spectrophotometer or equivalent using the following IR scan
parameters:
a. resolution - 8.0 cm~l
b. number of scans in sample beam - 16c. number of scans in reference beam - 16
d. wave numbers per in. - 200e. spectral range 500-4 cm~l (standard plot) 204
Place a portion of the resin/solvent solution on a NaCl salt block. (If using
prepreg extract resin from tape using acetone.) The sample shall be of sufficientthickness to produce a spectrum whose strongest bond indicates 15 +i> %-p.
Allow solvent to evaporate and scan the sample.
54

A.7 Procedure for Determining Volatiles Using GC/MS
1. Experiment layout
Pressure chamber
Heater
•Sample chamber
Temperaturecontrollerand recorder
TSample withdraw.
=**Pressureapplied her
Gas sampling loop J
Massspectrometer
Gas chromatograph
2. Procedure descriptionA duPont Differential Scanning Calorimeter Pressure Cell was modified
slightly to hold a large amount of the resin. The cell was then interfaced
directly to a gas sampling loop of a Varian Gas Chromatograph which was
interfaced with a duPont Mass Spectrometer. The use of a thermal
analyzer cell gave temperature program capability as well as
environmental and pressure control to the sample. Interfacing with the gas
sampling loop gave the option of sampling under constant flow conditions
or maintaining a closed cell with periodic sampling. The gaschromatograph enabled the separation of any compounds evolving and the
mass spectrometer was used to qualitatively identify the compounds. In
the case of determining water content the Mass Spectrometer was replaced
and the thermal analyzer system was interfaced directly to a duPont
Moisture Monitor for moisture evolution analysis.
55

A.8 Gas Chromatography/Mass Spectroscopy
Use a Hewlett Packard FM Scientific 5750 gas chromatograph or equivalent.
a. Sample preparationExtract a sample of prepreg with reagent grade methanol at room temperature.
Make sure all the resin is extracted from the fibers. Filter the solution to
remove the fibers. Use resin solution as made.
b. Instrument parameters
Column:
Alltech Catalog no. C-5000
Alltech Reference No. 97783L
Length: 6 feet
O.D.: 0.125 inch
I.D.: 0.085 inch
Loading: 10%Stationary phase: UCW-98
Support: Chrom \V-Hp
Mesh: 80/100
Upper limit: 300 + C
Sample size: 1 microliter
Oven temperature: Room Temperature to 392°F
Program rate: 27F/minute
Detector: Flame lonization
Detector port temperature: 482°F
Injector port temperature: 437°F
Carrier gas: Helium (ultra-pure)
Range: 10-11
Attenuation: 256
Chart speed: 0.25 inch/minute
56

c. Procedure
Before injecting the sample, stabilize the baseline. When the baseline is
stabilized, inject the sample and mark the injection event as time zero. Hold for
one minute at room temperature before programming to upper limits. Allow
time for all of the sample to clear the column and the baseline to stabilize again.
Once the analysis is complete, program the column to its upper temperature
limits to flush the column.
A.9 Dynamic Mechanical Analysis (Rheometrics Method)
Prepreg PMR-15 resin solution on 181 Style A1100 finished glass fabric.
Mounting Rectangular Sample Torsion Fixture - To mount a Rectangular Torsion
fixture, proceed as follows:
a. Install 3" Oven, (EC-3020).
b. Verify that air gauge on pressure regulator (at rear of Test Station) indicates 35
PSI (60 PSI for TX-10,000 XYZT transducer and RMS-605 models with motor air
bearing), MAIN POWER switch is ON, MOTOR switch is OFF, Transducer
SELECT switch is set to type of Transducer in use, and equipment has been
warmed for 30 minutes minimum.
c. Clean the locating surfaces on the upper and lower fixtures to ensure that no
foreign particles are present.
d. Set THERMOCOUPLE select switch to EXTERNAL.
e. Align the locating hole on th eupper (long) S-2-A Rectangular Torsion Fixture
with the locating pin on the upper spindle. Install the fixture and secure hand
tight. The fixture should snap cleanly into place. If it does not, loosen the
knurled ring halfway (to prevent the fixture from falling), pull down until the
fixture comes loose, and repeat.
f. Align the locating hole on the lower (short) fixture with the locating pin on the
lower spindle. Install lower fixture on the spindle. While holding the knurled
57

ring so that it catches the threads on the fixture, spin the ring clockwise until
tight. If the fixture does not snap cleanly into place, loosen the ring completely,
pull up on the fixture while rocking it carefully, and repeat.
CAUTION
Do not over-tighten knurled ring or damage to Transducer may result.
g. At Signal Conditioner set OFFSET ON/OFF switch to ON. Rotate OFFSET
RADIANS control until the jaws of both fixtures are parallel. Adjust the
COARSE and FINE OFFSET ADJUST until TORQUE and NORMAL meters
indicate zero.
Mounting Rod Fixture - The Rod Fixtures consist of two cylindrical rod holders with
three sets of collets for 1/8, 3/16, and 1/4 inch diameter. Mounting is accomplished in
the same manner as with the Rectangular Sample Torsion Fixture with the exception
that the OFFSET RADIANS dial is not used.
When running a test with the rod fixtures, the TEST switch is set to PARALLEL
PLATE, and the sample height is entered as the gap.
Sample Insertion - The sample should be approximately 2.5 inches (63.5 mm) long or
slightly less, and .5 inches wide (12.7 mm).
NOTE
Standard inserts measure .030" (.762 mm), .060" (1.52 mm),
.125" (3.17 mm) thick samples. Samples should be tailored to
these sizes. Small decreases in thickness can be compensated
for by the addition of precision shim stock.
a. Slip the appropriate size aluminum insert onto each end of the
sample.
b. Raise the upper spindle as far as possible with the Spindle Adjust.
58

c. Measure the width and thickness of the sample and record for program entry.
Place one end of sample (with insert) into the lower fixture.
d. Slide both rectangular collars over the free end of the sample bar. Orient them
so that the setscrews are facing forward. Slide one collar over the jaws of the
lower fixture and tighten the setscrew firmly. The top of the insert should be
flush with the top of the jaws of the lower fixture.
e. Lower the upper fixture with the Fine Spindle Position Adjust so that the upper
end of the sample (with insert) slides into the jaws of the upper fixture. The
insert should be flush with the jaws of the fixture. Slide the rectangular collar
up as far as it will go and tighten the setscrew firmly. If the sample is to be
cooled, retighten both setscrews after cooling.
f. Check that the external thermocouple in the environmental chamber is close to
the sample but not touching.
g. Adjust the slide stop so the tools do not touch the oven when the oven door is
closed. Tighten the Slide Lock.
Making Measurements (Temperature Sweep)
NOTE
The numbers and entires used in the following sample
procedures are for PMMA at 1 Hz. Individual tests are designed
by the user.
59

Figure A.9-1 Sample Height Measurement
a. Raise the upper fixture with the Fine Spindle Adjust until the NORMAL meter
deflects to the left. This indicates tension on the sample to ensure that the
sample has not buckled. If temperature sweep mode is to be used, and the spring
loaded upper fixture is installed, set the tension to one-half of full scale
deflection. When set, lock the upper spindle.
b. Measure the height from insert to insert with dividers as shown in Figure A.9-1,
then use calipers to measure length of divider spacing.
c. Set TEMP °C to desired starting point and press OVEN ON switch. Follow the
nitrogen set-up procedure described in Section 4.2.2 if low temperature
measurements are desired. Monitor the NORMAL meter; allow the sample to
equilibrate until NORMAL meter reading does not change for five minutes.
d. Set the Signal Conditioner DYNAMIC/STEADY selector to DYNAMIC and adjust
the OFFSET RADIANS control until TORQUE meter reads zero. Set the
Computer switches as follows:
60

1. Set MODE switch to TEMP SWEEP.
2. Set TEST switch to TORSION RECT.
3. Set RATE to 6.3 (Rads/Sec).
4. Set STRAIN to 0.1 percent.
NOTE
Strain = 0 x sample thickness ,
sample length
where angle 0 equals motor rotation
in radians. Angle 0 can never exceed
0.5 radians or an input overload will occur.
5. Press TEST GEOMETRY and enter, via Data Terminal, sample dimensions
in milimeters.
6. Press SWEEP PARAMETERS and enter via Data Terminal: final
temperature, degrees per step, and thermal soak time.
7. Press PRINTER and enter, via Data Terminal, data to be printed.
8. Press PLOTTER, and enter via Data Terminal the data to be plotted, the
materials range, and the temperature range covered. (If modulus range is
not known, it will be necessary to run several single points without plotting
at various temperatures. If modulus range is known, proceed to step (i).
NOTE
PMMA runs between 106 and 1011 Dynes/cm2 @
-150°C to +300°C. Figure A.9-2 shows a sample
plot of PMMA at 1 Hz.
e. Make sure that the NORMAL meter is to the left of the zero setting (i.e. is
indicating tension on the sample). If not, raise the Fine Spindle Positioner. Also
make sure that the TORQUE panel meter is set to zero using the OFFSET
RADIANS controL If the sample is soft, it may not support a large tension but
the important thing is that there is not a deflection to the right, indicating
compressive force on sample.
61

TAN S°0
(M
b
2!°
N
X
<<
u_oenUJ
or<u u-
3 °cn QT'£ CL
<o
XuUJ
o
>-Q
Ul
COUl
CO
Oo
8
(VJ
CVJ
oCJ
o- o
o
o:LJa.
OO
ato
03O
(O io
G' DYNES/CM

f. Set MODE selector to SINGLE and press START. Set PRINTER ENABLE and
PLOTTER ENABLE switches OFF (light out). Turn chart recorder to 6 in/min.
Check that the sine wave response of the red (torque) pen is smooth and
symmetrical.
g. Tap the oven while observing the TORQUE trace and ensure that no deflection
(indicating rubbing of the fixture against the oven) occurs.
h. Set the chart to 6 in/hr. and observe the envelope formed by the Torque trace.
When the sides of the envelope are parallel to the baseline, the sample is at
thermal equilibrium. If the envelope has parallel sides skewed from the baseline,
this indicates thermal drift in the Transducer. This may be unavoidable at the
highest sensitivites.
i. When the sample is at starting temperature and at thermal equilibrium set
MODE selector switch to TEMP SWEEP and press PRINTER ENABLE and
PLOTTER ENABLE switches On (light lit). Press RESET then START. The test
will proceed as programmed. When the test is complete, oscillation will stop.
Sample and Fixture Removal
a. Procure a pair of work gloves for sample and fixture removaL Environmental
chamber will retain heat for some time.
b. Open environmental chamber and slide to the right. Loosen the setscrews on the
rectangular clamps.
c. Loosen the Spindle Lock and raise spindle to the uppermost position. Re-lock
spindle. _.„.
d. Slide out the rectangular sample and remove the aluminum inserts.
e. Loosen the knurled ring on upper fixture halfway. (It may be necessary to use
the tools provided).
63

f. Pull down on the knurled ring so that the upper fixture snaps free of the spindle.
Loosen the ring completely and remove the fixture.
g. Loosen the knurled ring on the lower fixture completely.
h. Pull up on the lower fixture while gently rocking back and forth until the fixture
is removed.
64

APPENDIX B
COMPOSITE LAMINATING PROCEDURES
B.I Composite Fabrication
a. Cut the prepreg plies and stack them on a nonporous Teflon "release fabric that
has been previously placed on a metal caul plate.
b. Place on the top of the layup a layer of porous Teflon (Taconic #7015 or
equivalent), followed by three plies of Style 120 glass fabric, three plies of Style
181 glass fabric, a pressure plate, and two additional plies of Style 181 glass
fabric as a vent layer on top of the layup. Place metal bars (equivalent to
laminate thickness) on all sides of stacked prepreg to prevent fiber washing.
c. Seal the above assembly in a vacuum bag shown below in such a manner that no
leaks occur and the vacuum source is in contact with the bleeder. Apply a
vacuum of 5 inches Hg.
Vacuum Bag
Side View
rtn Mir*"" "**
— root
65

d. Cure in an autoclave in accordance with the temperature, pressure, and vacuum
profile shown below.
Cure Cycle
130 2ttTWH (MIMUTUI
420
e. Remove vacuum bagging and bleeder materials from cured part, and post-cure in
an air-circulating oven for six hours at 625°F. Restraint of the laminate is
required during post-cure.
66

APPENDIX C
COMPOSITE MECHANICAL AND PHYSICAL PROPERTIES
C.I Composite Mechanical Properties
C.I.I Flexural Properties
Determine ultimate flexural strength and modulus of elasticity (see Figure in C.I.2)
for specimen) in accordance with ASTM D790 as modified below. The flexural test
specimen consists of a straight-sided rectangular cross section having the specified
thickness. Span thickness ratio is maintained constant at 32 to 1. Nominal specimen
length is 102 mm (4 inches) but varies with thickness. The specimen width remains
constant at 12.7 mm (0.5 in). The flexural specimens are loaded at quarter span
points. Ultimate flexural strength is calculated with the following equation:
F _ 3PSb " 4bt 2
FD = Stress in the outer fiber at failure
P = Maximum load carried by specimen Newtons (Ibs)
S = Major span meters (inches)
b = Width of specimen meters (inches)
t = Thickness of specimen meters (inches)
The modulus of elasticity is calculated as follows:
F - II sl_fcb ~ 64 bt3
m
£5 = Modulus of elasticity in flexure
S = Span (meters) inches
b = Width of specimen (meters) (inches)
t = Thickness of specimen meters (inches)
m = Slope of the initial straight-line portion of the loading deflection curve.N/m (Ib/in.)
67

C.I.2 Interlaminar Shear Properties
Determine ultimate interlaminar strength in accordance with ASTM D2344 as modified
below. The interlaminar shear test specimens shown below are short, rectangular
cross-section bars.
The testing is accomplished on a flexure testing fixture using three-point loading with
the span being equal to four times the specimen thickness. Interlaminar shear stress
at failure is computed from the following equation:
T _ 3P11 " 4A
Tj = Interlaminar shear stress kPa (ksi)
P = Total load at failure, Newton (Ibs)
A = Cross-sectional area m2 (in2)
I/ Parallel to within + 0.005 inch with a 125 edge flatness requirement inaccordance with MIL-^TD-10.
2/ Min imum thickness 0.070 inch + 0.010, -0
3/ = 1.00 inch for short beam shear specimen= 4.00 inch for flexure specimen
4/ W = 0.250 inch for short beam shear specimenW = 0.500 inch for flexure specimen
Schematic of Flexure and Short Beam Shear Specimen
68

C.2 Composite Physical Properties
C.2.1 Density
Determine the density of the composite in accordance with ASTM D792.
C.2.2 Resin Content
Determine the resin content of the composite as follows.
a. Transfer specimens, accurately weighed to the nearest milligram, to an 80-ml
glass beaker.
b. Carefully measure 50 ml of concentrated sulfuric acid and pour into the beaker
containing the sample. Cover the beaker with a watch glass, place on a hot plate
in a fume hood, and heat at 400° + 10°F until white fumes are visible above the
acid solution.
c. Maintain this condition for a minimum of 20 minutes or until the solution turns
black. At this point, carefully add dropwise a 30 percent solution of hydrogen
peroxide until the solution turns clear. Continue heating beaker for a minimum
of one hour. During this period, add dropwise the hydrogen peroxide solution to
clear the acid whenever the acid turns black. Cool the acid solution to room
temperature, add 2 ml of hydrogen perioxide, and heat until white fumes appear.
Continue heating for 10 minutes, then cool to room temperature. If acid turns
black, repeat the procedure until acid remains clear. (Note: This process shall
be accomplished in a fume hood with air exchange.)
d. Filter the acid solution using a fritted glass crucible (coarse) and wash a
minimum of three times separately with either distilled or deionized water and
then with acetone. Dry the glass crucibles at 150°F in an air-circulating oven a
minimum of 30 minutes, cool to room temperature in a desiccator, and weigh.
Remove the graphite yarn and obtain the crucible weight.
e. Calculate: Percent Resin Content = -—2 x 10°
69

where W^ = weight of sample
W2 = weight of graphite yarn after acid digestion of the resin matrix
f. Requirements are listed in Appendix E.2.
C.3.3 Fiber Volume and Void Volume
a. Fiber volume and void volume are determined from the results of the density
determination and the resin content determination using the following:
Calculate fiber volume (Vf) from the formula
V = Wf ' c x 100r f ' Wc
Calculate resin volume (Vr) from the formula
v, = Wr ' e x 100Wc
Calculate void content (Vv) from the formula 100 - (Vf + Vr)
where Wc = weight of original sample
Wf = weight of fiberwr = VVC - Wf = weight of resin
f = density of graphite (from supplier)
r = density of resin (from supplier)
c = density of composite in accordance with ASTM D792.
70

APPENDIX D
PREPREG PHYSICAL PROPERTIES
D.I Resin Content/Graphite Areal Weight
a. Cut three samples, each 3 grams minimum, equally spaced across the width of
the prepreg at least 1 inch from the edge of the prepreg. Weigh to the nearest
milligram (W^). Measure area (A) of each sample to the nearest 0.1 square inch.
b. Extract the three samples in separate soxhlet extractors containing 40 to 50 ml
acetone.
Option: Resin may be extracted in methylethylketone.
c. After extraction, dry the fibers at elevated temperature to constant weight.
Allow to cool at room temperature in a desiccator.
d. Obtain the weight of the fibers to the nearest milligram (W2>.
e. Calculate:
Percent Resin Content = -~—2 x 10°
f. Calculate:
Graphite Areal Weight = -r- ^?A m2
D.2 Prepreg Volatile Content
a. Obtain three specimens (2.0 to 4.0 g) in a pattern that will be representative of
the entire sample. The specimens must be taken at least 1 inch from the edge.
71
b. Remove the carrier from each specimen, place in a tared aluminum dish, and
weigh to the nearest milligram. Place the aluminum dish with specimen in an
air-circulating oven regulated to 600 + 10°F.
c. Close the oven door and start a clock. After 30 minutes, remove the aluminum
dishes and place in a desiccator to cooL Weigh the specimens to the nearest
milligram.
Percent Volatiles = A ^ B x 100
where A = weight of specimen before test
B = weight of specimen after test
D.3 Gel Time
a. Preset the temperature on a Fisher-Johns melting point apparatus to 477 K(400°F).
b. Insert a 6.35m x 6.35mm, (0.25 x 0.25 in) sample of prepreg between two cover
glasses and place on th heated platform of the Fisher-Johns apparatus.
c. Start a stopwatch or timer and begin to probe on the top of the coverglass with a
wooden pick.
d. Record the time when the resin gels. The gel point is reached when no resin
movement is observed through the coverglass when moderate pressure is applied.
e. Report the gel time as the average of three or more determinations.
72

1 ReooM No 2 Government Acression No
NASA CR- 1682 174 Title and Subtitle
Characterization of PMR-Polyimide Resin andPrepreg
7 Authorlsl
C.H. Sheppard, P.H. Lindenmeyer, A.B. Hunter
9 Pertorminq Qrqani/alion Name and Address
Boeing Aerospace CompanyEngineering TechnologyP.O. Box 3999SMt.tlp, Washington QR1?4
12 Sponsoring Aqenrv Name and Address
3 Heooient sC.itaioq No
5 Report Date
March, 19846 Pprforminq Orqjm/ation Code
2-36213 Pertormmg Organisation Report No
D 180- 2603 1-2
10 Work Unit No
1 1 Contract or Grant No
NAS3-2252313 Type of Report and Period Covered
Contractor14 Sponsoring Agency Code
15 Supplementary Notes
Technical Representative: Dr. Richard Lauvier NASA/LRC Cleveland, Ohio
10 Abstract
Procedures for the chemical characterization of PMR-15 resin solutions andgraphite-reinforced prepregs were developed, and a chemical data base wasestablished. In addition, a basic understanding of PMR-15 resin chemistrywas gained; this was translated into effective processing procedures forthe production of high quality graphite composites. During the programthe PMR monomers and selected model compounds representative of postulatedPMR-15 solution chemistry were acquired and characterized. Based on thesedata, a baseline PMR-15 resin was formulated and evaluated for processingcharacteristics and composite properties. Commercially available PMR-15resins were then obtained and chemically characterized. Composite panelswere fabricated and evaluated.
1 1 Kyy Words iSuqqpstPd hy Auihonsl 1
Polyimide, PMR resin, nadic esters,chemical characterization, modelcompounds, high pressure liquidchromatograph (HPLC), dynamic mechanics
18 Distrihuiion Statemr-nt
Unclassified, Unlimited
1
19 bpcunty Classit lot this rnpor t> 20 Security Classif lot this paqel 21 No of Paqes 22 Pnre"
Unclassified Unclassified'For sale bv the National Technical Information Service Springfield Virqmia 22151