Embed Size (px)
Citation preview
(NASA-CR-180602) PBOTBZN CEPS'PAL GBOWTH 11 N 8 7-2 20 59 LCY G B A B l I L Y Annual Technical Eeport, 1 Jan, - 3 1 Dec. 1986 (Etanford Uxiiv.) 28 p A v a i l : M'IIS I3C A03/pIP A01 CSCL 20B Unclas
G 3 / 2 9 007 1333
https://ntrs.nasa.gov/search.jsp?R=19870012626 2018-06-02T13:22:21+00:00Z
The Board of Trustees of t h e Leland Stanford Junior Un ive r s i ty
Center f o r Mater ia l s Research S tan fo rd , CA 94305
Santa Clara, 12th Congressional Dis t r ic t
Annual Technical Report
PROTEIN CRYSTAL GROWTH I N LOW GRAVITY NAG 8-489
January 1, 1986 through December 31, 1986
Submitted t o
Nat iona l Aeronaut ics and Space Adminis t ra t ion Marsha l l Space F l i g h t Center
H u n t s v i l l e , Alabama 35812
CMR-87-5
P r i n c i p a l I n v e s t i g a t o r
P ro fes so r (Research),’
May 22, 1987
TABLE OF CONTEN'E
I. SOLWILITY . . . . . . . e . . . . . . . . . . . . . . . . . . 3
A. Introduction............ . . . . . . . . . . . . 3 B. Experimental Procedures. . . . . . . . . . . . . . . . . . . 3 C. Results.. . . . . . . . . . . . . . . . . . . . . . . . . . 4 D. Discussion...... . . . . . . . . . . . . . . . . . . . 7 E. Conclusions............. . . . . . . . . . . . . 9
11. GRomRATE . . . . . . . . . . . . . . . . 0 0 . . 0 . . 0 0 . 10
A. Introduction . . . . . . . . . . . . . . . . . . . . . . 10 B. Experimental Procedures. . . . . . . . . . . . . . . . . . . 10 C. Results.. . . . . . . . . . . . . . . . . . . . . . . . . . 11 D. Discussion . . . . . . . . . . . . . . . . . . . . . . . . . 14 E. Conclusions. 0 19
111. SCHLIEREN . . . 19
A. Introduction . . . . . . . . . . . . . . . . . . . . . . . . 19 B. Experimental Procedures. . . . . . . . . . . . . . . . . . . 20 C. Results.. . . . . . . . . . . . . . . . . . . . . . . . 21 D. Discussion . . . . . . . . . . . . . . . . . . . . . . . . . 21
IV- REFEXENCES . e e . 25
ABSTRACT
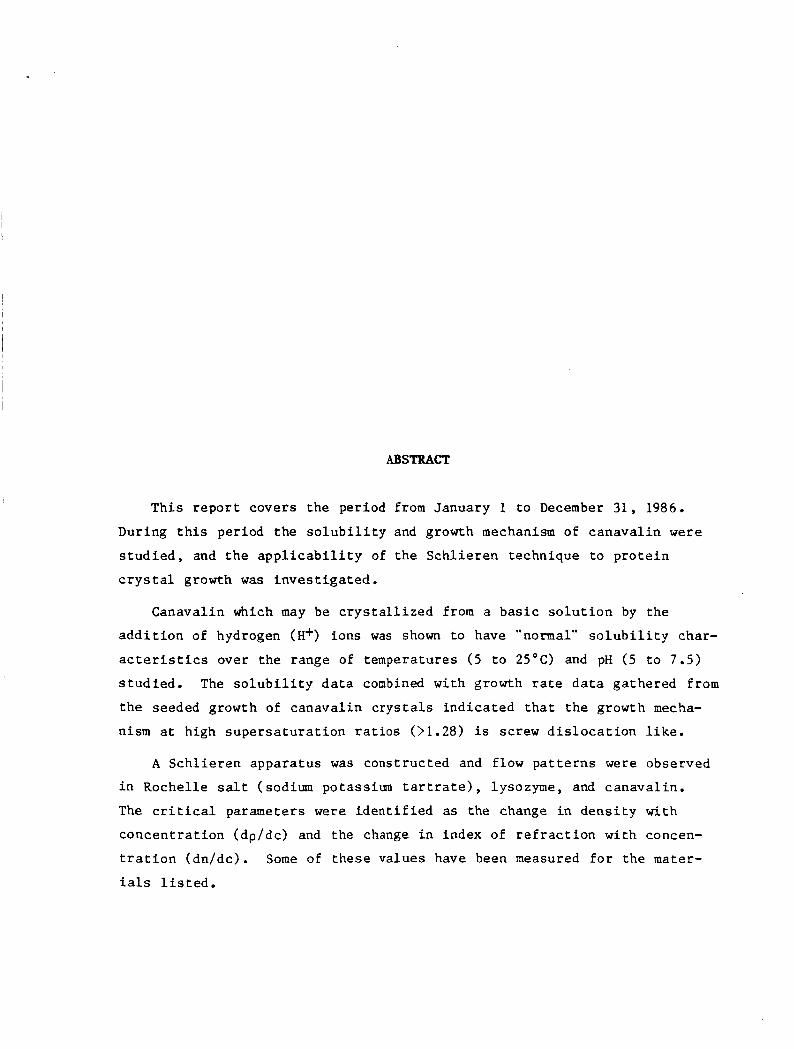
This r e p o r t covers t h e per iod from January 1 t o December 31, 1986.
During t h i s per iod t h e s o l u b i l i t y and growth mechanism of canava l in were
s t u d i e d , and t h e a p p l i c a b i l i t y of t h e Sch l i e ren technique t o p r o t e i n
c r y s t a l growth w a s i n v e s t i g a t e d .
Canaval in which may be c r y s t a l l i z e d from a b a s i c s o l u t i o n by t h e
a d d i t i o n of hydrogen (H+) ions was shown t o have "normal" s o l u b i l i t y char-
a c t e r i s t i c s over t h e range of temperatures ( 5 t o 25°C) and pH ( 5 t o 7.5)
s t u d i e d . The s o l u b i l i t y d a t a combined with growth rate d a t a ga thered from
t h e seeded growth of canaval in c r y s t a l s i n d i c a t e d t h a t t h e growth mecha-
nism a t high s u p e r s a t u r a t i o n ra t ios (>1.28) i s screw d i s l o c a t i o n l i k e .
A S c h l i e r e n appara tus was constructed and flow p a t t e r n s were observed
i n Rochel le sa l t (sodium potassium t a r t r a t e ) , lysozyme, and canava l in .
The c r i t i c a l parameters were i d e n t i f i e d as the change in d e n s i t y wi th
concen t r a t ion (dp/dc) and the change i n index of r e f r a c t i o n wi th concen-
t r a t i o n (dn/dc) . Some of t hese va lues have been measured f o r t he mater-
i a l s l i s t e d .
The ult imate goa l of t h i s three-year program is the c a r e f u l des ign of
an experiment f o r t h e growth of p ro te in c r y s t a l s i n a long-durat ion space
f l i g h t . me gound-based experiments are being performed t o opt imize the
c o n d i t i o n s f o r growth i n space and t o provide a d a t a base t o compare
a g a i n s t t he r e s u l t s ob ta ined i n space i n a f u t u r e program. The d a t a
ga thered w i l l a l s o provide i n s i g h t i n t o t h e mechanisms of p r o t e i n c r y s t a l
growth.
The g o a l s of t he f i r s t two years of t h i s program were t o deve lop
equipment and techniques t o s tudy t h e growth of c r y s t a l s i n a model
p r o t e i n system. The d a t a gathered dur ing t h e s e experiments w i l l be used
t o model and understand t h e mechanisms of p r o t e i n c r y s t a l growth. It w i l l
a l s o form t h e basis f o r comparison wi th d a t a c o l l e c t e d dur ing long-term
space f l i g h t s .
During the year covered by t h i s r e p o r t ( January 1 t o December 31,
1986) t h r e e s e p a r a t e s t u d i e s were conducted us ing t h e p r o t e i n canava l in as
a model system. S o l u b i l i t y and growth ra te s t u d i e s were undertaken i n an
e f f o r t t o understand the mechanisms involved i n the nuc lea t ion and c r y s t a l
growth of p ro te ins . Sch l i e ren experiments were used t o s tudy f l u i d flow
d u r i n g growth. Each area w i l l be d i scussed s e p a r a t e l y .
2
I. SOLWILITY
A. Introduction
It i s necessary t o understand t h e s o l u b i l i t y r e l a t i o n s h i p s i n a
c r y s t a l l i z i n g system i n o rde r t o e f f e c t i v e l y c o n t r o l t he growth pro-
cess. Mul l in l l i s t s s o l u b i l i t y as t h e f i r s t in format ion needed f o r
des igning a c r y s t a l l i z i n g system. Coupled t o t h e s o l u b i l i t y is t h e
concept of s u p e r s a t u r a t i o n as the d r i v i n g f o r c e f o r i so the rma l c r y s t a l -
l i z t i o n . Supe r sa tu ra t ion i s expressed i n terms of t h e s o l u t i o n concen-
t r a t i o n ( c ) and t h e concen t r a t ion a t s a t u r a t i o n ( s ) and i s u s u a l l y
g iven as e i t h e r a d i f f e r e n c e (c-s) o r a r a t i o (c /s) . P l o t s of growth
ra te versus s u p e r s a t u r a t i o n can be used t o determine the growth mecha-
nism (see f o r example F i d d l i s , et.a12). S u p e r s a t u r a t i o n d a t a can also be used t o determine n u c l e a t i o n r a t e l .
cu rves a l s o assists i n planning growth experiments .
Knowledge of t he s o l u b i l i t y
In most ino rgan ic systems the s o l u b i l i t y curves are r e l a t i v e l y
s imple r e l a t i o n s h i p s between temperature and concen t r a t ion of t h e c rys-
t a l l i z i n g spec ie s . The s i t u a t i o n in a p r o t e i n system i s somewhat more
complex. In a d d i t i o n t o t h e c r y s t a l l i z i n g s p e c i e s ( t h e p r o t e i n ) , t h e
c o n c e n t r a t i o n of hydrogen ion , p r e c i p i t a t i n g agen t s , and salts added
f o r s t a b i l i z a t i o n must be considered as w e l l as the e f f e c t of tempera-
t u r e . The system we chose t o study i s a r a t h e r s i m p l e one c o n s i s t i n g
of t h e p r o t e i n canava l in , water , sodium c h l o r i d e (NaC1-1% by weight)
added as a s t a b i l i z e r 3 , and hydrogen ion (H+).
included temperature and H+ concent ra t ion as measured by pH.
The v a r i a b l e s s t u d i e d
B. Ihpe r imen ta l Procedures
Canaval in (ob ta ined from Alexander McPherson, Un ive r s i ty of
C a l i f o r n i a , R ive r s ide ) was d isso lved i n a water s o l u t i o n ad jus t ed t o pH
9.2 t o 9.5 wi th ammonium hydroxide ( N H ~ O H ) and conta in ing 1% N a C 1 . The
s o l u t i o n was f i l t e r e d using a 1 . 0 ~ f i l t e r followed by a 0 . 2 2 ~ f i l t e r .
A l iquo t s of t h i s s t a r t i n g s o l u t i o n were removed and t h e i r pH ad jus t ed
to t h e des i r ed i n i t i a l pH us ing a c e t i c ac id (HAC). These s o l u t i o n s
were placed i n c u l t u r e d i s h e s and each i n d i v i d u a l compartment s e a l e d
3
t o t h e d e s i r e d i n i t i a l pH us ing a c e t i c ac id (HAC). These s o l u t i o n s
were placed i n c u l t u r e d i s h e s and each i n d i v i d u a l compartment s e a l e d
us ing s i l i c o n vacuum grease . The c u l t u r e p l a t e s were placed i n
c o n t r o l l e d temperature incuba to r s and allowed t o e q u i l i b r a t e f o r 2
weeks. At t he end of t h i s per iod , t h e pH of t h e s o l u t i o n w a s measured
and, a f t e r f i l t r a t i o n , t he concent ra t ion of canava l in i n t h e
supe rna tan t l i q u i d w a s measured using a spectrophotometer . These
experiments covered a temperature range of 5 t o 25OC i n 5°C increments
and a pH range of 5 t o 7 . 5 i n steps of 0.5.
C. Results
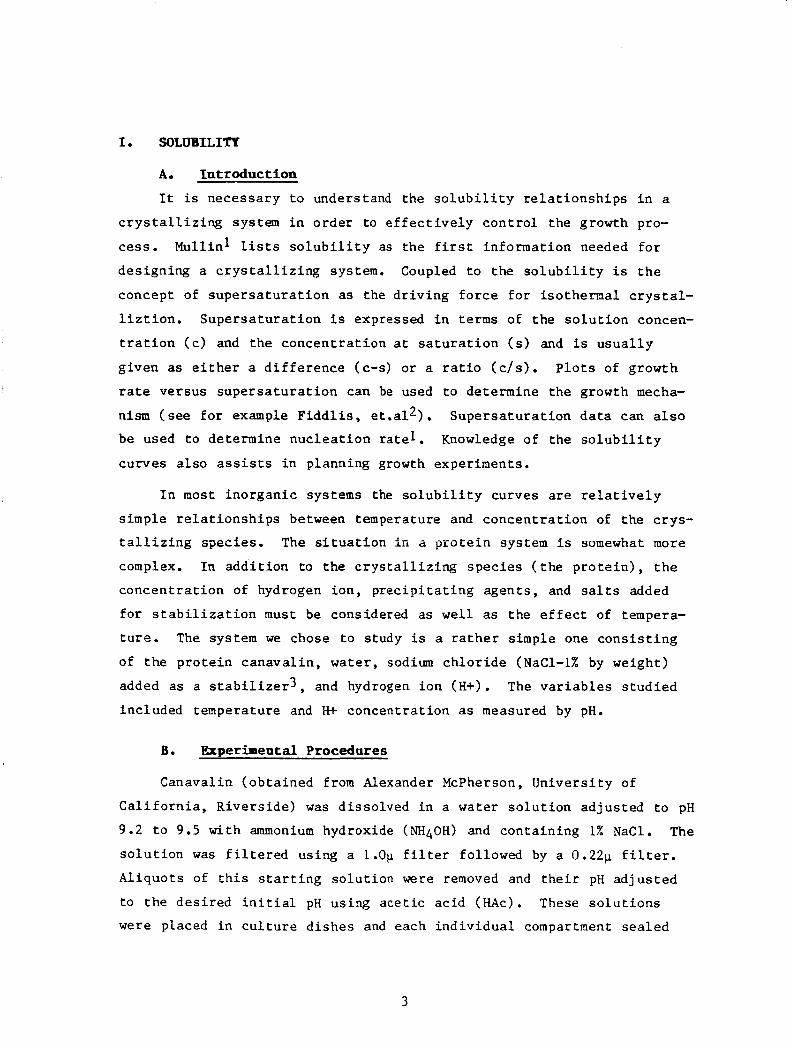
The r e s u l t s of t h e s e experiments are shown i n Figure 1. F igu re l a
shows the temperature dependence of s o l u b i l i t y . The s o l u b i l i t y curves
show a f a i r l y f l a t s o l u b i l i t y VS. t empera ture dependence a t h igher
tempera tures followed by a break which s h i f t s t o h igher temperatures as
t h e pH is lowered. It w a s also noted t h a t massive spontaneous p rec ip i -
t a t i o n occurs a t pH's lower than - 6 . 5 i f t h e canaval in c o n c e n t r a t i o n
i s s i g n i f i c a n t l y above the s o l u b i l i t y curve.
F igure l b shows the s o l u b i l i t y p l o t t e d a g a i n s t pH. The s o l u b i l i t y
d e c r e a s e s with dec reas ing pH.
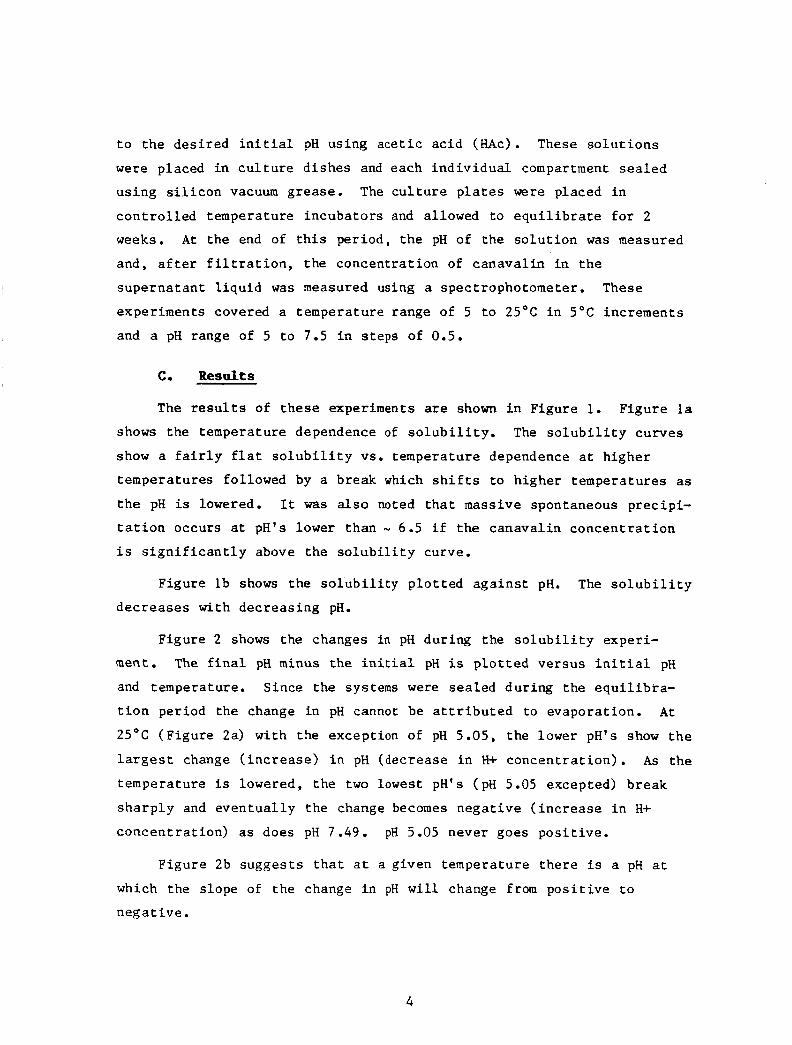
Figure 2 shows the changes i n pH during the s o l u b i l i t y experi-
ment. The f i n a l pH minus t h e i n i t i a l pH i s p l o t t e d ve r sus i n i t i a l pH
and temperature . Since t h e systems were sea l ed du r ing the e q u i l i b r a -
t i o n per iod the change i n pH cannot be a t t r i b u t e d t o evaporat ion. A t
25OC (F igure 2a) with the except ion of pH 5.05, t h e lower pH's show t h e
l a r g e s t change ( i n c r e a s e ) i n pH (decrease i n H+ concen t r a t ion ) . As t h e
tempera ture i s lowered, t h e t w o l o w e s t pH's (pH 5.05 excepted) break
s h a r p l y and e v e n t u a l l y t h e change becomes nega t ive ( i n c r e a s e i n H+ concen t r a t ion ) as does pH 7 . 4 9 . pH 5.05 never goes p o s i t i v e .
F igu re 2b sugges t s t h a t a t a given temperature t h e r e i s a pH a t
which the s lope of t he change i n pH w i l l change from p o s i t i v e t o
nega t ive .
4
I I I 1 1
----- 6.95
30
25- E
- 20-
h
- E >
15- 3 z 10-
- -- 6.07 5.60 5.05 INITIAL pH
--- - . .-
5
20- v r > h 15 4 m
10 3 z 5 -
a
-
-
0-
I I I 1 I I I I 0 5 10 15 20 25
TEMPERATURE ("C) -- -. .
25 "C 19.9 "C 15 "C 9 "C 5 %
- -.-. -- ---
25 "C 19.9 "C 15 "C 9 "C 5 %
- -.-. -- ---
5.0 5.5 6.0 6.5 7.0 7.5 INITIAL pH
b
F i g u r e 1: S o l u b i l i t y of canaval in p l o t t e d a> v e r s u s temperature a t f i x e d i n i t i a l pH, and b) ve r sus i n i t i a l pH a t f ixed temperature .
5
I I I I 1 - 7.49
2.0
1.5 = kL z 1.0 z W a z 0.5 4. I 0
0.0
-0.5
/ - -- 5.60 / -- 5.05 r-p--- /' /
INITIAL pH / / /
= L
-
-
-
-
-
-
5 1.0 z W
4 0.5 U I 0
0.0
I I I I 1 I
25 "C -
L I I I I I I
5.0 5.5 6.0 6.5 7.0 7.5 INITIAL pH
a
b
F i g u r e 2: a ) Change in pH ( f i n a l (F) minus i n i t i a l (I)) d u r i n g p r e c i p i t a t i o n p l o t t e d a) versus temperature a t f i x e d i n i t i a l pH, and b) ver sus i n i t i a l pH a t f ixed temperature .
6
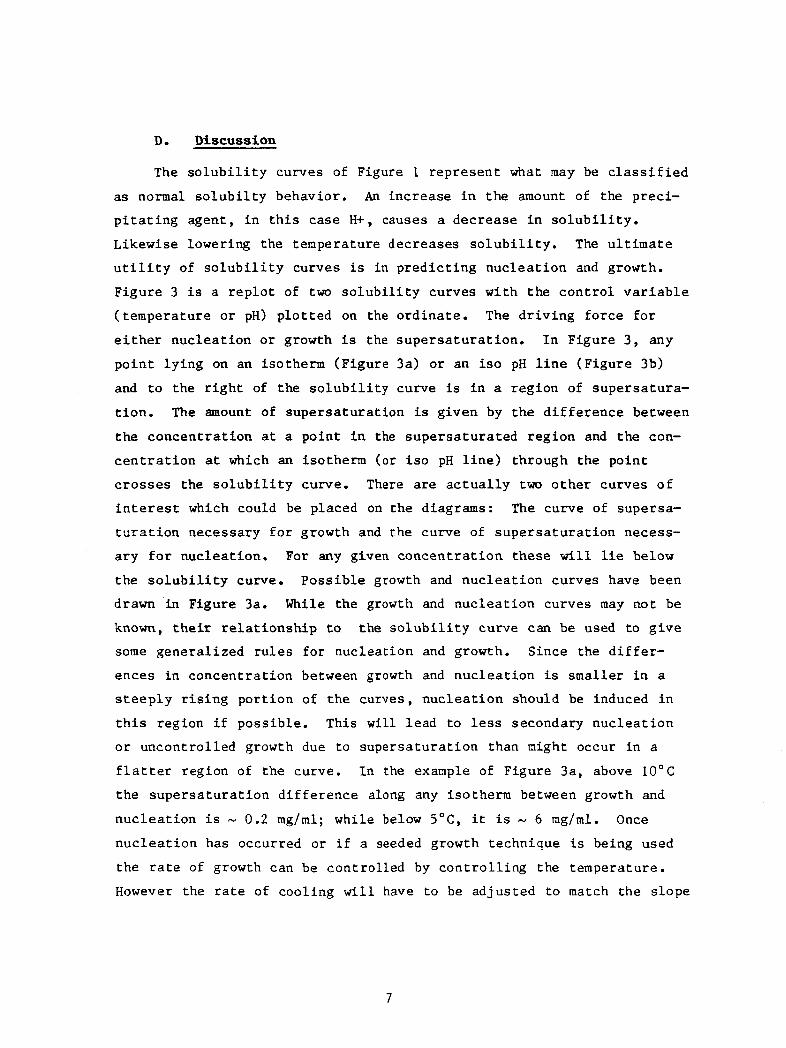
D. Discussion
The s o l u b i l i t y curves of Figure 1 r e p r e s e n t what may be c l a s s i f i e d
as normal s o l u b i l t y behavior . An i nc rease i n t h e amount of the p r e c i -
p i t a t i n g agent , i n t h i s case H+, causes a dec rease i n s o l u b i l i t y .
Likewise lowering the temperature decreases s o l u b i l i t y . The u l t i m a t e
u t i l i t y of s o l u b i l i t y curves is i n p r e d i c t i n g n u c l e a t i o n and growth.
F igure 3 i s a r e p l o t of two s o l u b i l i t y curves wi th t h e c o n t r o l v a r i a b l e
( t empera tu re o r pH) p l o t t e d on the o r d i n a t e . The d r i v i n g f o r c e f o r
e i t h e r nuc lea t ion o r growth is the s u p e r s a t u r a t i o n . In Figure 3 , any
p o i n t l y i n g on an isotherm (Figure 3a) o r an is0 pH l i n e (F igu re 3b)
and t o the r i g h t of t h e s o l u b i l i t y curve is i n a r eg ion of supe r sa tu ra -
t i o n . The amount of s u p e r s a t u r a t i o n is g iven by t h e d i f f e r e n c e between
t h e concen t r a t ion a t a po in t i n the s u p e r s a t u r a t e d r eg ion and t h e con-
c e n t r a t i o n a t which an i so therm (or is0 pH l i n e ) through t h e po in t
c r o s s e s the s o l u b i l i t y curve. There are a c t u a l l y two o t h e r curves o f
i n t e r e s t which could be placed on t h e diagrams: The curve of supersa-
tu rar ior r necessary f o r growth and t h e curve of s u p e r s a t u r a t i o n necess-
a r y f o r nuc lea t ion . For any given c o n c e n t r a t i o n these will l i e below
t h e s o l u b i l i t y curve. P o s s i b l e growth and n u c l e a t i o n curves have been
drawn i n Figure 3a. While the growth and n u c l e a t i o n curves may not be
known, t h e i r r e l a t i o n s h i p t o t h e s o l u b i l i t y curve can be used t o g i v e
some gene ra l i zed r u l e s f o r nuc lea t ion and growth. S ince the d i f f e r -
ences i n concen t r a t ion between growth and n u c l e a t i o n is smaller i n a
s t e e p l y r i s i n g po r t ion of t h e curves, n u c l e a t i o n should be induced i n
t h i s region i f poss ib l e . This w i l l l e ad t o less secondary n u c l e a t i o n
o r uncont ro l led growth due t o supe r sa tu ra t ion than might occur i n a f l a t t e r region of t he curve. I n the example of F igure 3a, above 1 0 ° C
t h e s u p e r s a t u r a t i o n d i f f e r e n c e along any isotherm between growth and
n u c l e a t i o n i s - 0.2 mg/ml; while below 5"C, i t i s 6 mg/ml. Once
n u c l e a t i o n has occurred or i f a seeded growth technique is being used
t h e r a t e of growth can be con t ro l l ed by c o n t r o l l i n g the t e m p e r a t u r e .
However the ra te of cool ing will have t o be ad jus t ed t o match the s lope
7
30
20
10
0
I U n s a t u r a t e d c s a t u r a t e d
10
7.5
r. 0
8.5
h
6.0
5.5
F i g u r e 3:
20 30 40 Concentration (mg/ml)
----------------.- 0. t 4. 6. a ia 12. 14.
C W N l R A T I O N (ffi/K)
a) Temperature - concen t r a t ion diagram a t pH 7.49 w i t h p o s s i b l e growth ( 0 ) and n u c l e a t i o n (1 ) s u p e r s a t u r a t i o n curves p l o t t e d t o the r i g h t and below the s o l u b i l i t y c u r v e , b) pH - c o n c e n t r a t i o n diagram a t 4°C with s o l u b i l i t y cu rve p l o t t e d .
8
of the growth curve t o prevent rapid increases i n s u p e r s a t u r a t i o n and
t h e a t t e n d e n t p o s s i b i l i t y of uncontrol led growth i n t h e f l a t t e r r e g i o n s
of t he curve.
These curves may a l s o be used t o opt imize t h e p r o t e i n y i e l d .
Using the curve of F igures 3a and b, a p o s s i b l e scheme might be used as
fo l lows . A s o l u t i o n of 30 m g / d of canaval in a t 25OC and pH 7.49 i s
g r a d u a l l y cooled t o 4°C. This would remove s l i g h t l y more than h a l f of
t h e s t a r t i n g material. A slow increase of H+ concen t r a t ion from pH
7.49 t o pH 5.05 would remove v i r t u a l l y all of t h e remaining p ro te in .
I f t h e p r o t e i n from 1 m l of so lu t ion could be grown i n t o a s i n g l e
c r y s t a l by t h i s method, i t would measure - 3mm on an edge. In t h e case
of p r o t e i n s which are less abundant than canava l in , fo l lowing such a
scheme would conserve material.
The hydrogen ion w a s chosen as t h e p r e c i p i t a t i n g agent i n t h e s e
experiments because i ts concent ra t ion is e a s i l y monitored and could
l ead t o some i n s i g h t i n t o t h e i n t e r a c t i o n between the p r o t e i n and H+
dur ing n u c l e a t i o n and growth. The r e s u l t s presented i n F igure 2 con-
f i rm t h e f a c t t h a t H+ i ons do i n t e r a c t with p r o t e i n molecules and i n
most i n s t a n c e s are removed from t h e s o l u t i o n dur ing c r y s t a l l i z a t i o n
( p r e c i p i t a t i o n ) . The i n t e r a c t i o n is both pH and temperature depen-
den t . F igure 2a shows t h a t t he p ro te in - H+ ion i n t e r a c t i o n as indi -
c a t e d by the pH changes is s t ronges t a t lower pH's (except f o r pH
5 . 0 5 ) . This i n t e r a c t i o n i s temperature dependent and as temperature is
decreased these i s less i n t e r a c t i o n ; some combinations of i n i t i a l pH
and temperature a c t u a l l y show a decrease i n pH i n d i c a t i n g a release of
H+ ion from the p ro te in . An i n i t i a l PH of 5.05 shows t h i s l a t t e r
behavior throughout the temperature range s tud ied . The exac t cause of
t h i s behavior is not known, but McPherson3 has suggested t h a t a
d i f f e r e n t o l igomer ic conf igu ra t ion may be involved.
E. Conclusions
The fol lowing conclus ions can be drawn from these resu l t s :
1. Canavalin fo l lows a "normal" s o l u b i l i t y behavior over the range of
9
temperature and pH s tud ied ( i . e . s o l u b i l i t y dec reases with dec reas ing
tempera ture and wi th inc reas ing p r e c i p i t a t i n g agent concen t r a t ion ) .
2. The s o l u b i l i t y curves can be used t o p lan c r y s t a l l i z a t i o n exper i -
ments by s e l e c t i n g optimum condi t ions f o r n u c l e a t i o n and/or growth.
3. The s o l u b i l i t y curves can be used t o d e v i s e experiments which will
make e f f i c i e n t use of t he material a v a i l a b l e .
4 . An i n t e r a c t i o n between hydrogen i o n and canava l in has been shown,
but i t s exac t na tu re r e q u i r e s more s tudy .
11. G x o m RATE
A. Introduction
One of t he g o a l s of t h i s program i s t o s tudy t h e mechanisms
involved i n p r o t e i n c r y s t a l growth. A t one l e v e l t h i s can be t h e
de t e rmina t ion of how t h e asymetr ica l u n i t is incorpora ted i n t o t h e
growing c r y s t a l and what t h e c o n t r o l l i n g f a c t o r s are. I n t h e b r o a d e s t
terms t h e ra te of i n c o r p o r a t i o n i s c o n t r o l l e d by e i t h e r d i f f u s i o n o r
i n t e r f a c e k i n e t i c s . Which of these i s t h e rate determining s t e p can be
determined by i n v e s t i g a t i o n of the growth ra te of p r o t e i n c r y s t a l s
v e r s u s s u p e r s a t u r a t i o n 2 . I n these s t u d i e s canava l in was a l s o used.
I n i t i a l l y t h e parameters a f f e c t i n g growth rate were i d e n t i f i e d as
pH, tempera ture , p r o t e i n concent ra t ion and salt concent ra t ion . Based
on t h e s o l u b i l i t y experiments descr ibed p rev ious ly i t appeared t h a t
wh i l e s o l u b i l i y w a s a s t rong func t ion of pH, p a t i c u l a r l y a t t h e h ighe r
pH's (above 6 . 0 ) , t h e main e f f e c t of vary ing pH i s t o a l t e r t h e solu-
b i l i t y l i m i t and hence the supe r sa tu ra t ion . I n i t i a l l y the growth ra te
d a t a i s being eva lua ted using t h i s premise.
B. Experimental Procedures
It is poss ib l e t o do both seeded and unseeded growth ra te exper i -
ments. The unseeded growth experiments, however, r e q u i r e a s u b s t a n t i a l
amount of t i m e f o r f i r s t t he nuc lea t ion s t a g e and then the growth of
t h e nuc lea ted c rys t a l s t o a s i z e l a r g e enough to be observed. Th i s
l e a d s t o an ambiguity i n the time i t t akes f o r growth t o s t a r t and the
10
t h e a c t u a l s u p e r s a t u r a t i o n condi t ions p re sen t during which growth i s
t ak ing place. Therefore , a l l of the growth rate d a t a w a s c o l l e c t e d
from seeded growth.
The growth appa ra tus c o n s i s t s of a thermostated holder which
c o n t a i n s e i g h t ce l l s (.95 an diameter x .32 cm deep). The ho lde r i s
mounted on an x-y s t a g e of a microscope which al lows t h e growing
c r y s t a l s t o be observed and photographed. S o l u t i o n s are in t roduced
i n t o the cel ls us ing hypodermic syr inges and needles .
The experiments are c a r r i e d o u t i n two s t a g e s : F i r s t seeds are
grown in t h e cells us ing a canaval in c o n c e n t r a t i o n and pH which has
been shown t o g i v e a small number of good c r y s t a l s . The seeding
s o l u t i o n is withdrawn from t h e c e l l and r ep laced with the s o l u t i o n
whose growth rate c h a r a c t e r i s t i c s a r e being s tud ied . Se lec t ed c r y s t a l s
are photographed a f t e r t he new so lu t ion has been added and hour ly
t h e r e a f t e r f o r t h r e e t o fou r hours.
c. Results
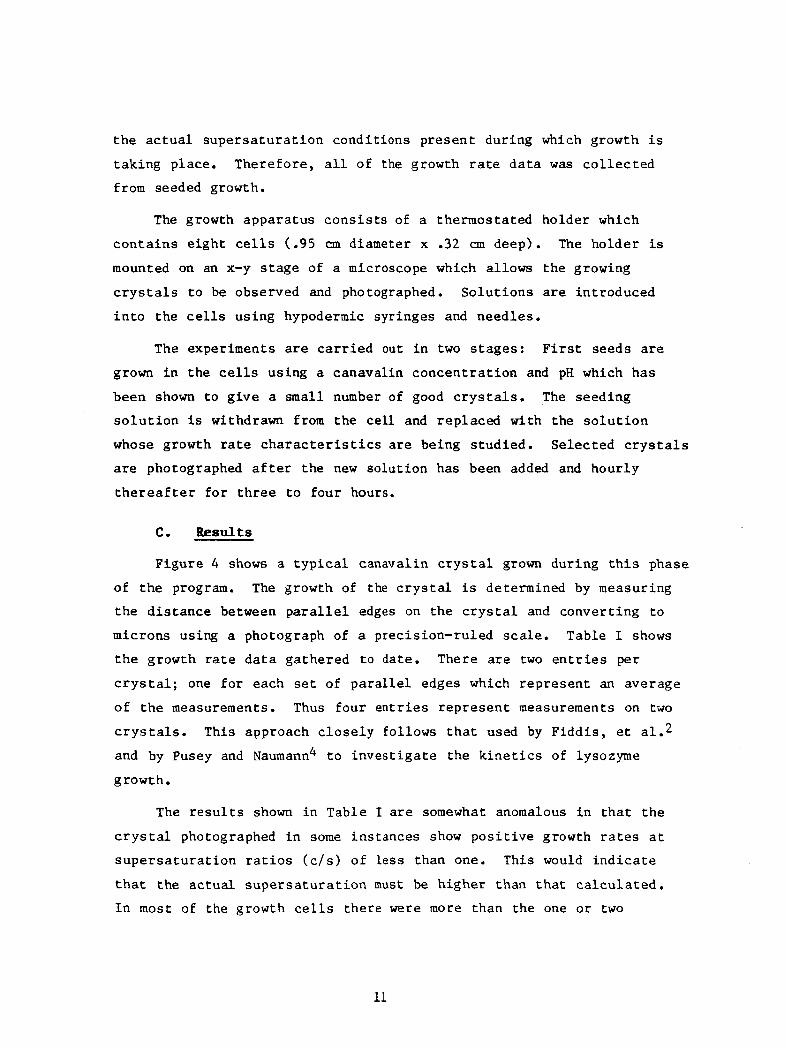
Figure 4 shows a t y p i c a l canaval in c r y s t a l grown during t h i s phase
of t h e program. The growth of the c r y s t a l is determined by measuring
t h e d i s t a n c e between p a r a l l e l edges on t h e c r y s t a l and conver t ing t o
microns using a photograph of a precis ion-ruled scale. Table I shows
t h e growth rate d a t a ga thered t o date. There a r e two e n t r i e s p e r
c r y s t a l ; one f o r each set of p a r a l l e l edges which r ep resen t an average
of t h e measurements. Thus f o u r e n t r i e s r e p r e s e n t measurements on two
c r y s t a l s . This approach c l o s e l y follows t h a t used by F i d d i s , et a1.2
and by Pusey and Naumann4 t o i n v e s t i g a t e the k i n e t i c s of lysozyme
growth.
The r e s u l t s shown i n Table I are somewhat anomalous i n t h a t t h e
c r y s t a l photographed i n some ins tances show p o s i t i v e growth rates a t
s u p e r s a t u r a t i o n r a t i o s ( c / s ) of l e s s than one. This would i n d i c a t e
t h a t t h e a c t u a l s u p e r s a t u r a t i o n must be h ighe r than t h a t c a l c u l a t e d .
I n most of the growth c e l l s there were more than the one o r two
11
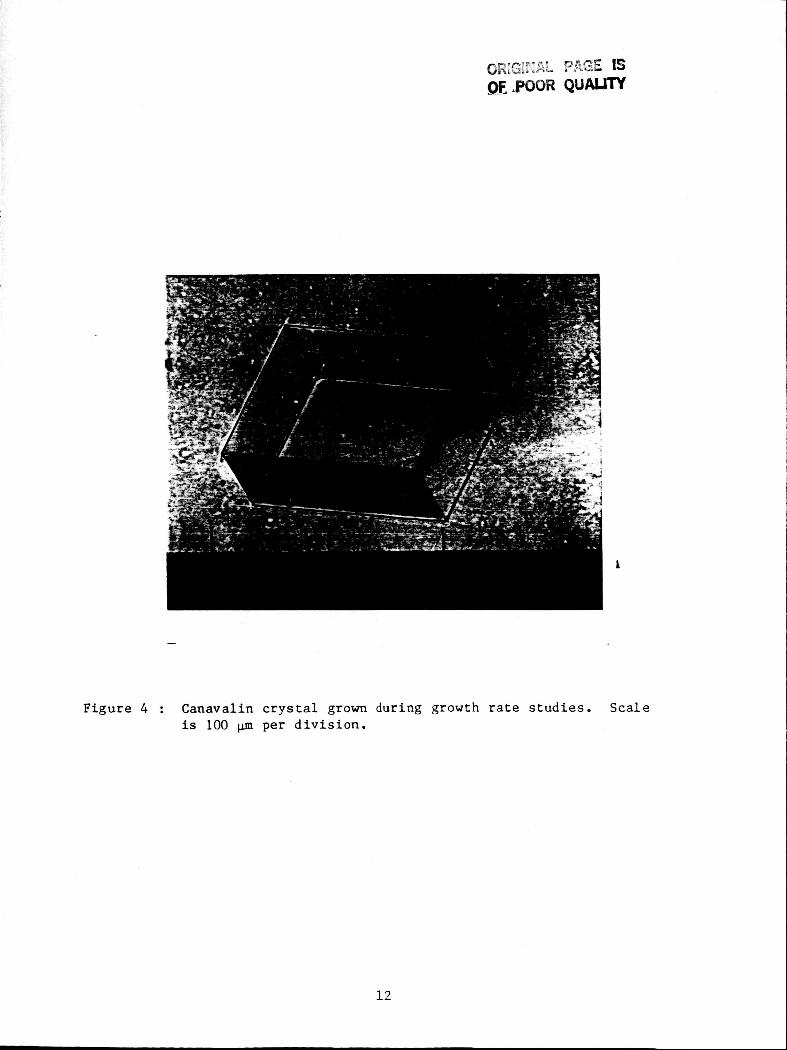
F i g u r e 4 : Canava l in c r y s t a l grown dur ing growth ra te s t u d i e s . S c a l e i s 100 pm per d i v i s i o n .
1 2
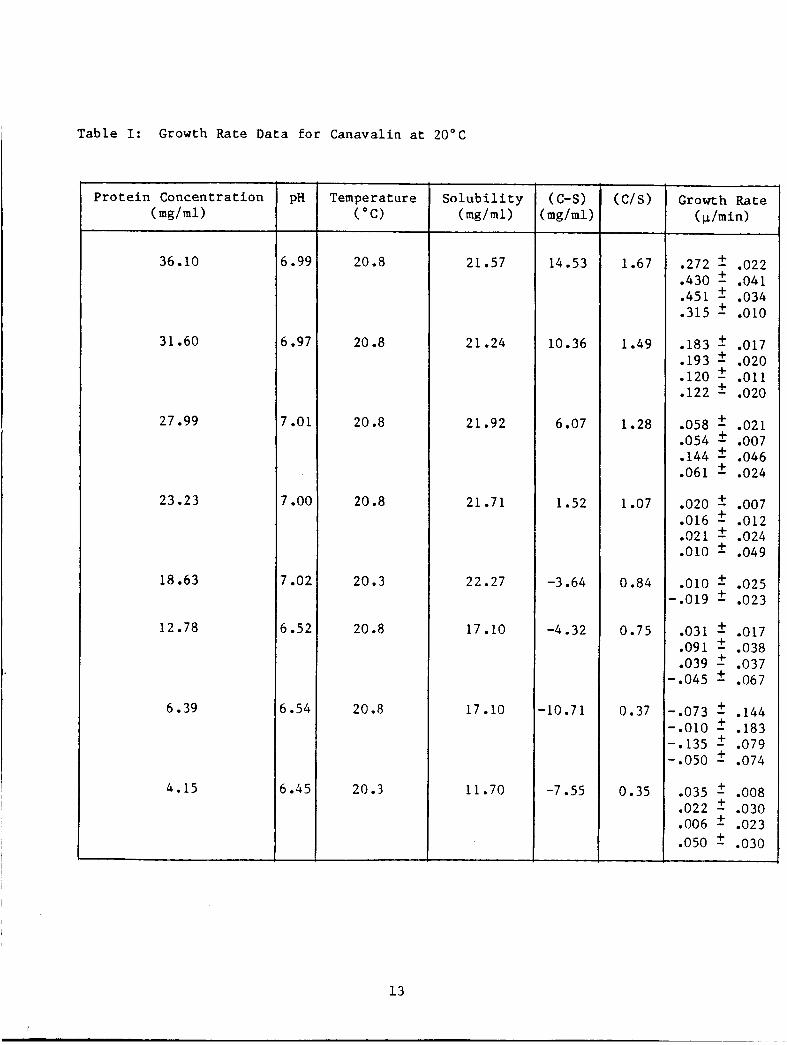
Table I: Growth Rate Data f o r Canavalin a t 20°C
36.10
31.60
27.99
23.23
18.63
12.78
6.39
4.15
6.99
6.97
7.01
7 -00
7.02
6.52
5.54
5.45
-
Temperature ("C)
20.8
20.8
20.8
20.8
20.3
20.8
20.8
20.3
S o l u b i l i t y (mg/ml)
21.57
2 1 -24
21.92
21 - 7 1
22.27
17.10
17.10
11.70
(c-SI C mg/ml)
14.53
10.36
6.07
1.52
-3.64
-4.32
-10.71
-7.55
( C / S )
1.67
1.49
1.28
1.07
0.84
0.75
0.37
0.35
Growth Rate (p/min)
.272 2 .022 -430 2 .041 -451 2 .034 .315 5 .010
-183 2 .017 .193 5 .020 0120 2 .011 0122 5 .020
-058 2 .021 .054 .007 -144 .046 -061 .024
.020 2 .007 -016 f -012 .02! f .024 .010 .049
.010 5 .025 -.019 -023
.031 f .017 ,091 2 ,038 -039 2 ,037
-.045 2 .067
-.073 - + -144
m . 0 5 0 - + -074
-.010 2 .183 -.135 2 -079
.035 5 + .008
.006 5 .023
.050 5 .030
a022 -. -030
1 3
I
c r y s t a l s t h a t were photographed. I n some cases t h e s e c r y s t a l s were
q u i t e small. Due t o s u r f a c e energy c o n s i d e r a t i o n s , t hese s m a l l c rys -
t a l s can d i s o l v e p r e f e r e n t i a l l y and some of t h e i r mass can c o n t r i b u t e
t o the growth of t he l a r g e r c r y s t a l s . I f a l l of t h e c r y s t a l s were
observed, t h e r e should be a ne t loss of c r y s t a l l i n e mass t o y i e l d a
f i n a l s o l u t i o n whose c o n c e n t r a t i o n is given by t h e s o l u b i l i t y c u r v e s .
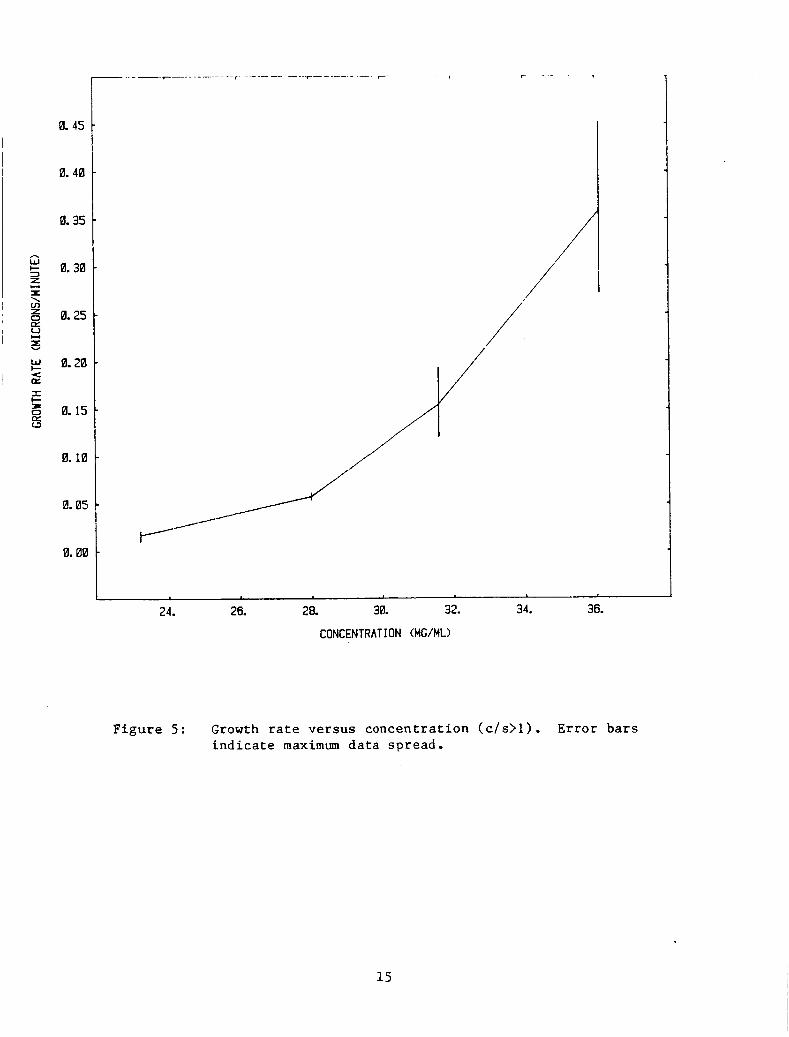
F igu re 5 i s a p l o t of growth r a t e s v e r s u s c o n c e n t r a t i o n f o r supe r sa tu r -
a t i o n r a t i o s (c /s) g r e a t e r than 1.0.
D. Discussion
F i d d i s e t a1.* has presented s e v e r a l forms of growth rate theo ry
based on the models d i scussed by Brice5 and Nielsen6.
c o n t r o l t h e growth ra te t akes t h e form
For d i f f u s i o n
t
where D i s t h e d i f f u s i o n c o e f f i c i e n t , v t he molecular volume and t t h e
s o l u t e boundary l a y e r ( e s t ima ted by Nielsen6 t o be 10-100pm).
c r y s t a l i s growing under i n t e r f a c e k i n e t i c c o n t r o l one of t h r e e modeis
can apply. If t h e whole s u r f a c e of t h e c r y s t a l i s a v a i l a b l e f o r growth
then
I f t h e
G = E vc I n ( 4 s ) d ( 2 )
where d is t h e molectuar diameter. For growth on a screw d i s l o c a t i o n
( 3 ) G = 0.05 D - d2 K T c [ l n ( c / s ) ] 2 Y
where y is the s u r f a c e free energy. F i n a l l y t h e growth rate f o r spon-
taneous two dimensional nuc lea t ion on t h e s u r f a c e is g i v e by .-i L
G = 1.7 Dd ( ~ - s ) ~ / ~ e x p ( 1 3K2T2,!ln( c / s )
( 4 )
I n o r d e r t o dec ide on which growth mechanism a p p l i e s t o canava l in i n
ou r experiment, t h e growth r a t e data w a s p l o t t e d according t o t h e s e
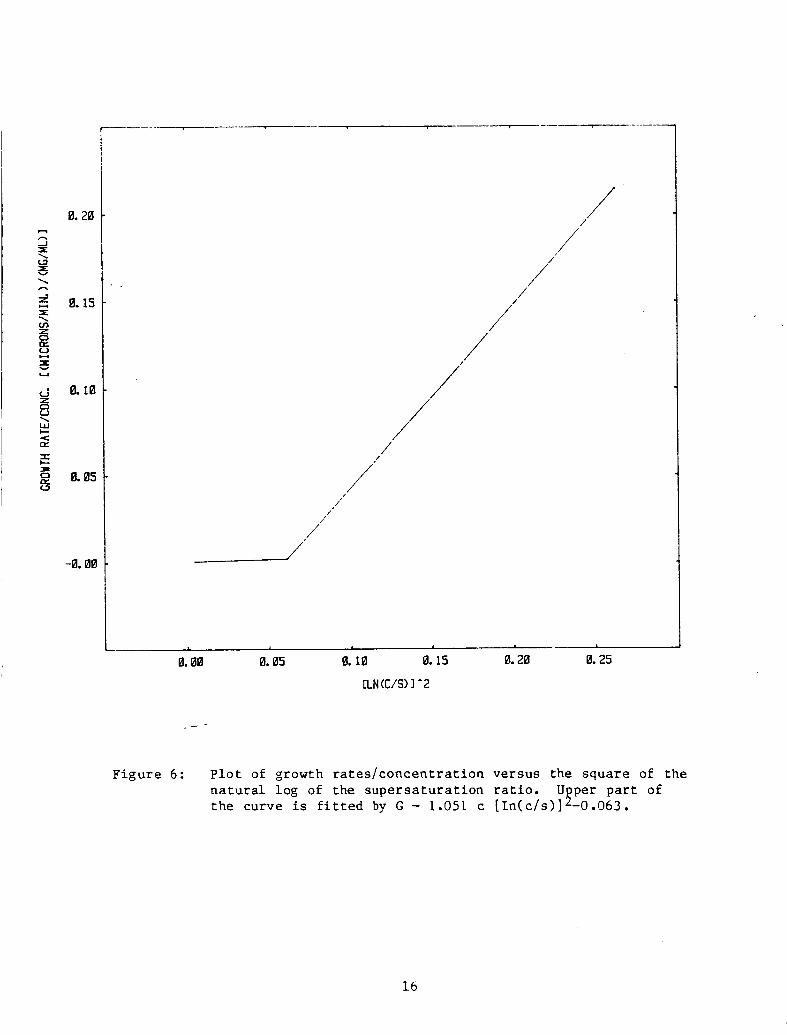
v a r i o u s models seeking the b e s t s t r a i g h t l i n e f i t . Figure 6 shows t h e
r e s u l t s of t h e b e s t f i t . I f only t h e p o i n t s w i th c/s r a t i o s of 1.28
and above are cons ide red , t he best f i t i s given by
G = 1.051 c [ 1 n ( c / s ) l 2 - .063
14
0. 45
0. 40
0.35
i3 I- 0.30 E 3
I \ m
E 0.25
3 E 0.20
B 0.15
< oz I + E (3
0. 10
0.05
0.00
-I 24. 26. 28. 30. 32. 34. 36.
CONCENTRAT ION (MG/ML)
Figure 5: Growth ra te ve r sus concen t r a t ion ( c / s > l ) . E r r o r b a r s i n d i c a t e maximum d a t a spread .
15
0.20 rl
s
5
I \ c3
\ m
z 0.1s
3 !4 b
J 0.10
E
E g 0.0s
r. \ v)
E
U
z 0 V \
< E
3
c3
-0.00
I
0.00 0.0s 0. 10 0. 1s 0.20 0.2s
CLN (C/S> 1 -2
- -
F i g u r e 6 : P l o t of growth r a t e s / c o n c e n t r a t i o n versus the square of t he n a t u r a l log of the s u p e r s a t u r a t i o n r a t i o . U per p a r t of t h e curve is f i t t e d by G - 1.051 c [ I n ( c / s ) ] 5 -0.063.
1 6
I n c l u s i o n of a l l d a t a p o i n t s g ives
G = 0 .874 c [ 1 n ( c / s ) l 2 - .026
T h i s f i t i s c o n s i s t e n t with Equation 3 and i n d i c a t i v e of growth on a
screw d i s l o c a t i o n . The d r a s t i c change i n s l o p e a t low s u p e r s a t u r a t i o n
r a t i o s may be i n d i c a t i v e of a region of d i f f u s i o n l i m i t e d growth. I f
t h i s i s the case , t he growth r a t e in t h i s r eg ion is given by
G 0.00895 (c-S) + .00320
Combining Equations 1 and 3 , i t is then p o s s i b l e t o make an estimate of
Y .
Using a molar volume based on t he work of HcPherson and Spenser7 and a
range f o r t of 10 t o loop g i v e s a range of v a l u e s f o r y from 0.9 KT t o
9.0 KT. These v a l u e s can be compared wi th t h e va lue r epor t ed by Durbin
and Feher8 f o r Lysozyme ( 5 % NaC1, T = 24"C, pH = 4.6) of y 101 = 1.9
KT and y 110 = 2 . 3 KT, and with those of F i d d i s , et a1.* (T = 2O"C,
pH = 4 ) of 3.1 KT and 3.9 KT.
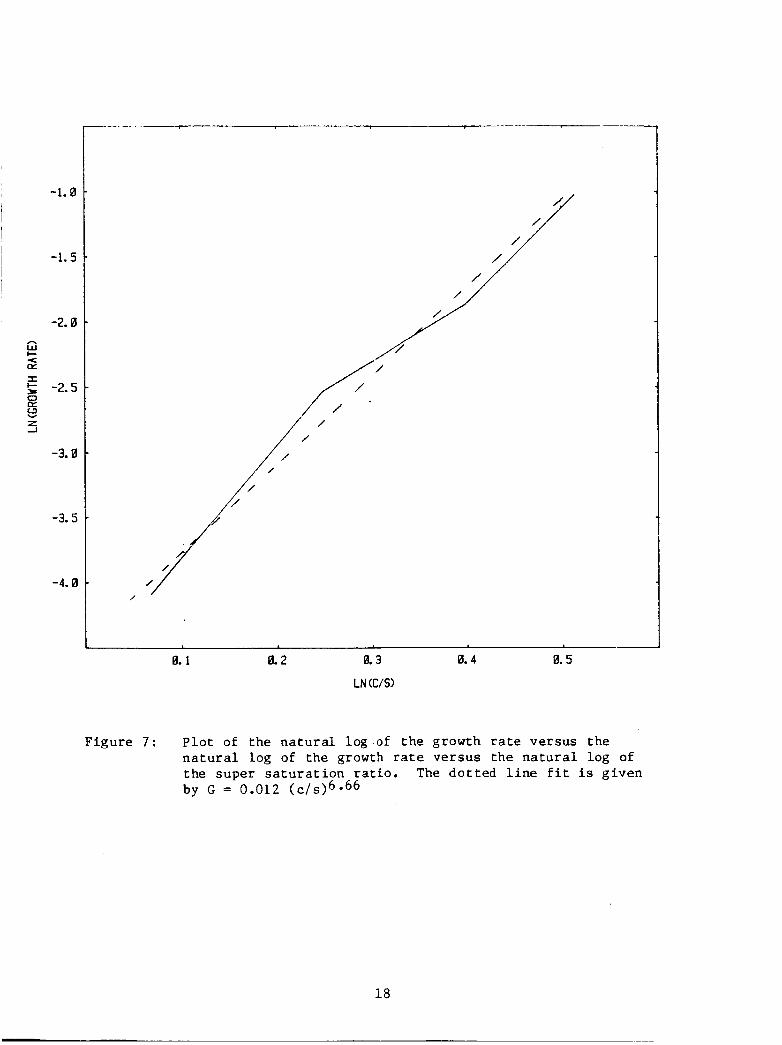
This d a t a can be handled i n another manner. Figure 7 is a Rn-Rn
p l o t of growth rates versus ( c / s ) . This p l o t w i l l y i e l d the c o e f f i -
c i e n t s of a equa t ion of the form
G =I b ( c / s I m (5 1
A b e s t f i t t o t h i s curve g i v e s
t h i s expres s ion does not correspond t o any of t he models used t o
e x p l a i n c r y s t a l growth. I t s u t i l i t y l i e s i n i t s use t o p r e d i c t growth
ra tes throughout t he s u p e r s a t u r a t i o n range and thus al low the growth
rate t o be c o n t r o l l e d a t d i f f e r e n t c o n d i t i o n s by combining t h i s curve
w i t h the s o l u b i l i t y curves.
1 7
-1.0
-1.5
-2.0
-2.5
-3.0
-3.5
-4.0
0. 1 0.2 0.3 0.4 0.5
LN (C/S)
Figure 7 : P l o t of the n a t u r a l log of t h e growth r a t e versus the n a t u r a l log of the growth ra te versus the n a t u r a l log of t he super s a t u r a t i o n r a t i o . The do t t ed l i n e f i t i s g iven by G = 0.012 ( c / s ) ~ * ~ ~
i8
E, Conclusions
The fol lowing conclus ions may be drawn from t h i s s tudy:
1. I n the s u p e r s a t u r a t i o n range s tudied t h e r e are appa ren t ly two
growth regimes. A t low supe r sa tu ra t ion the growth is d i f f u s i o n
c o n t r o l l e d ; a t h igher s u p e r s a t u r a t i o n growth i s c o n t r o l l e d by a screw
d i s l o c a t i o n mechanism.
2. The d i f f u s i o n c o n t r o l l e d region is desc r ibed by
and t h e k i n e t i c c o n t r o l l e d reg ion by
G = 1.051 c [ In ( c / s ) I 2 + .063
3. Combining t h e g e n e r a l equat ions f o r t h e s e two reg ions and t h e
c o e f f i c i e n t s found by g r a p h i c a l ana lys i s g i v e s an estimate of Y i n t he
range of 0.9 t o 9.0 ICT depending on t h e boundary l a y e r t h i ckness .
4 . A In-ln p l o t g i v e s a p r e d i c t i v e r e l a t i o n s h i p
G = 0.012 ( c / S ) ~ * ~ ~
which with the s o l u b i l i t y curves will al low t h e growth r a t e t o be
ad jus t ed under a v a r i e t y of condi t ions .
111. SCBLIEREN
A. Introduction
One of t he reasons f o r taking p r o t e i n c r y s t a l growth i n t o a low
g r a v i t y (g ) environment is to reduce or e l i m i n a t e convec t iona l flows.
I n o r d e r t o a s s e s s t h e magnitude of the flows a t one-g and t o confirm
t h e i r absences a t low g a technique i s needed t o v i s u a l i z e the flow.
The Sch l i e ren technique has been previous ly app l i ed t o ino rgan ic
c r y s t a l growth9.
p r o t e i n c r y s t a l growth.
It is a l o g i c a l ex tens ion t o a t tempt t o apply i t t o
If i so thermal c rys t a l growth i s cons ide red , t h e r e a r e two parame-
ters which a r e c r i t i c a l t o t he app l i ca t ion of t he Sch l i e ren technique.
There must be a change i n so lu t ion d e n s i t y wi th a change i n concentra-
19
t i o n (dp/dc) . This change i n dens i ty w i l l induce flow when a g rav i t a -
t i o n a l f o r c e i s p resen t . In order to image the flow, t h e r e must be a
change of index o r r e f r a c t i o n with a change i n concen t r a t ion (dn/dc) .
The purpose of t h i s s tudy i s t o demonstrate t h e S c h l i e r i n e f f e c t
i n d i f f e r e n t systems, and t o measure the dp/dc and dn/dc from these
sytems t o i n d i c a t e a range of a p p l i c a b i l i t y of t he S c h l i e r i n techni-
ques.
B. Experimental Procedures
The b a s i c S c h l i e r i n appara tus has been desc r ibed i n s e v e r a l publi-
The appara tus used i n these experiments uses a h igh p res su re ca t ions9 .
Xenon arc as a l i g h t source. The l i g h t i s focused onto a 3 f t . f o c a l
l e n g t h s p h e r i c a l mi r ro r which produces a para l le l l i g h t beam which
passes through t h e c r y s t a l l i z a t i o n c e l l . A second s p h e r i c a l mi r ro r
followed by a l e n s system focuses the l i g h t onto a k n i f e edge. The
S c h l i e r e n image is formed on a viewing screen and photographed us ing a
p r o f e s s i o n a l q u a l i t y 16 mm movie camera.
The d e n s i t y of s o l u t i o n s of var ious concen t r a t ions are measured by
weighing c a r e f u l l y measured volumes of t hese s o l u t i o n s on a balance
t h a t can weigh t o 0.1 mg T 0.1 mg. The index of r e f r a c t i o n i s
measured using a r e f r ac tomete r thermostated at 20°C. An incandescent
l i g h t source i s used.
The fo l lowing systems have been s tud ied ; Rochel le s a l t (potassium
sodium t a r t r a t e ) , lysozyme, and canaval in . I n t h e Rochelle s a l t , t h e
s o l u t i o n w a s s a t u r a t e d a t 2 0 ° C (380 mgjml). Growth w a s induced by
lowering t h e temperature t o 5°C. Lysozyme was d i s so lved i n a 0.1 molar
sodium a c e t a t e s o l u t i o n a t a pH of 4.1. The lysozyme concen t r a t ion w a s
30 mg/nl. Rais ing the sodium ch lo r ide concen t r a t ion t o 4% w/v caused
growth a t 19.2OC. I n canava l in , p r o t e i n was d i s so lved i n a s o l u t i o n a t
pH 9.2 t o g ive a s o l u t i o n concen t r a t ion of 30 mg/ml. The pH was
lowered t o 6 . 7 t o induce growth a t 19.2OC. All of the growths were
done on seed c r y s t a l s of t he r e spec t ive materials.
20
C, Results
S c h l i e r i n p a t t e r n s have been seen i n all t h r e e systems and photo-
graphed f o r t h e Rochel le sa l t and lysozyme. F igure 8 is a series of
frames from a movie made of the flow i n Rochel le sa l t . The t i m e in ter-
v a l between frames is 1/24 second s t a r t i n g from t h e top down; t h e t i m e
between each set of frames is 2 seconds. F igure 9 i s t h e same f o r
lysozyme wi th an i n t e r v a l of 0.8 seconds between frames. The S c h l i e r e n
work on lysozyme revea led a new f a c t o r which s i g n i f i c a n t l y i n f l u e n c e s
t h e k i n e t i c s of t h e p r o t e i n c r y s t a l growth process . This f a c t o r w a s
revea led dur ing t h e growth and d i s s o l u t i o n of seed c r y s t a l s of
lysozyme (as evidenced by t h e flow p a t t e r n s ) which w a s no t c o n s i s t a n t
w i th the degree of s u p e r s a t u r a t i o n of t h e growth s o l u t i o n . It was
found t h a t i f t h e s o l u t i o n was shaken be fo re the seed c r y s t a l s were
in t roduced , growth began almost ins tan taneous ly . Unshaken s o l u t i o n s
exh ib i t ed an " incubat ion" per iod before a growth plume w a s formed. I n
extreme cases, t h e r e appeared t o be some d i s o l u t i o n of the c r y s t a l , as
evidenced by a Gowinward going plxme before growth began. This e f f e c t
has been a l luded t o by F i d d l i s , et a1.2 and Kam and Feher . l l
The d a t a on dp/dc and dn/dc is shown i n Table 11.
D, Discussion
This s tudy has shown t h a t S c h l i e r i n is a p p l i c a b l e t o at l eas t some
p r o t e i n systems. The d a t a in Table T I , whi le not complete, i n d i c a t e s
t h a t 30 f o l d d i f f e r e n c e s i n dn/dc is no b a r r i e r t o the a p p l i c a t i o n of
Schl i e r i n .
While i t is expected t h a t there w i l l be no flows i n microgravi ty
environments , S c h l i e r i n may s t i l l have i t s use i n space. Since t h e
technique relies on dn/dc f o r i t s imaging a b i l i t y , i t can be used t o
image the s t a t i c boundary layers t h a t many develop during low-g growth.
The d iscovery of a new k i n e t i c f a c t o r may l ead to a new a r e a of
r e sea rch which may be pursued i n the f u t u r e .
2 1
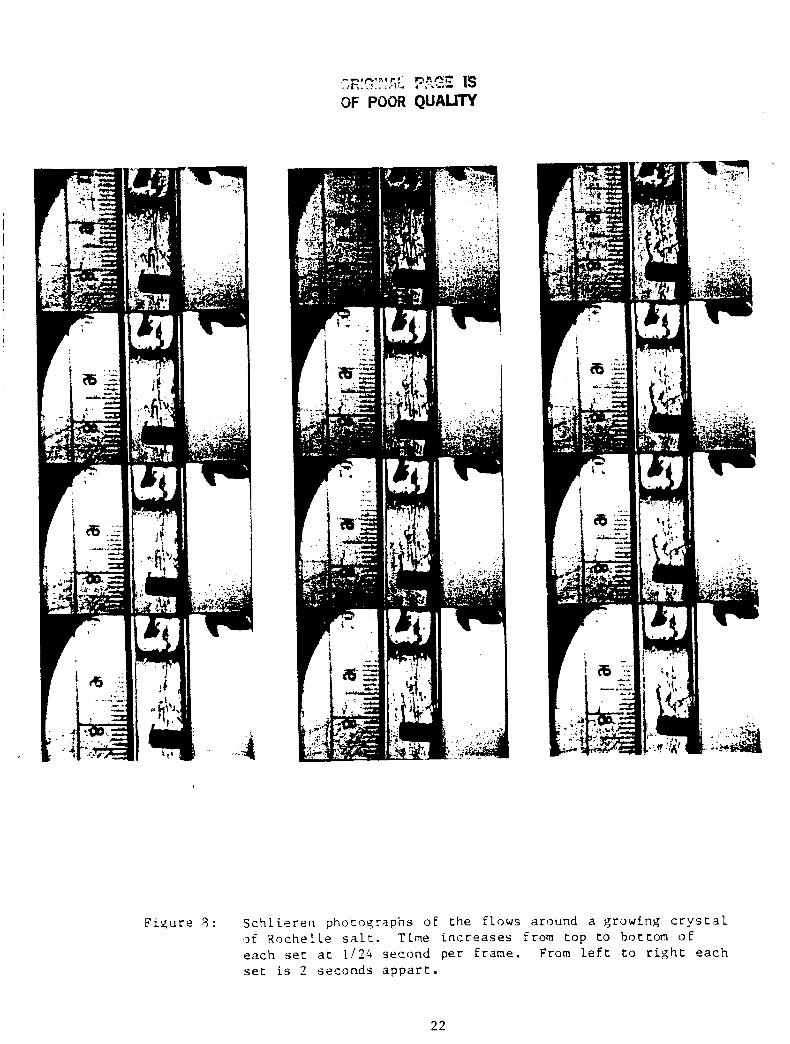
F i g u r e 9 : Sch l i e ren p h o t o q r a p h s o € t h e € L o w s a r o u n d a growing c r y s t a l . 'I€ KocheLLe s a l t . T i n e i n c r e a s e s from t o p t o b o t t o m of e a c h set a t I / ? & s e c o n d per E r a n e . From Left t o r i g h t e a c h set is 2 seconds a p p a r t .
22
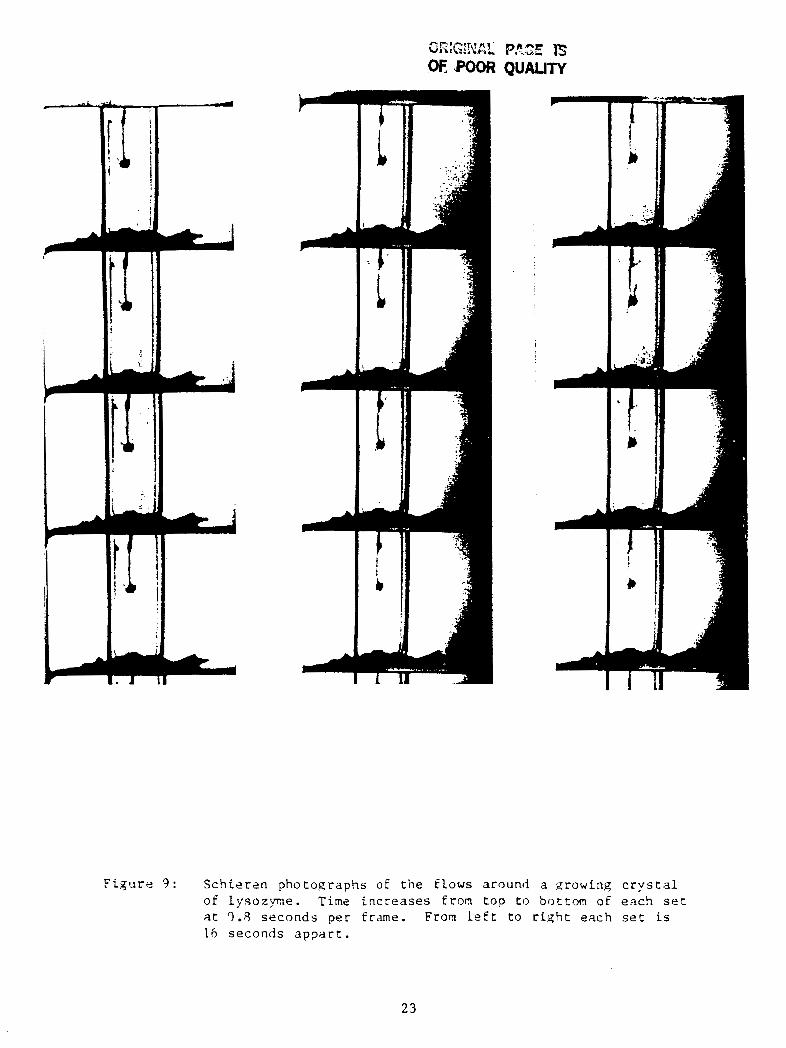
F i g u r e 9 : S c h i e r e n p h o t o g r a p h s O E t h e flows around a xrowing c r y s t a l of Lysozyme. Tine i n c r e a s e s from t o p t o b o t t o m of e a c h s e t a t q.8 s e c o n d s p e r f rame. From Left t o r i g h t e a c h s e t i s 16 seconds a p p a r t .
23
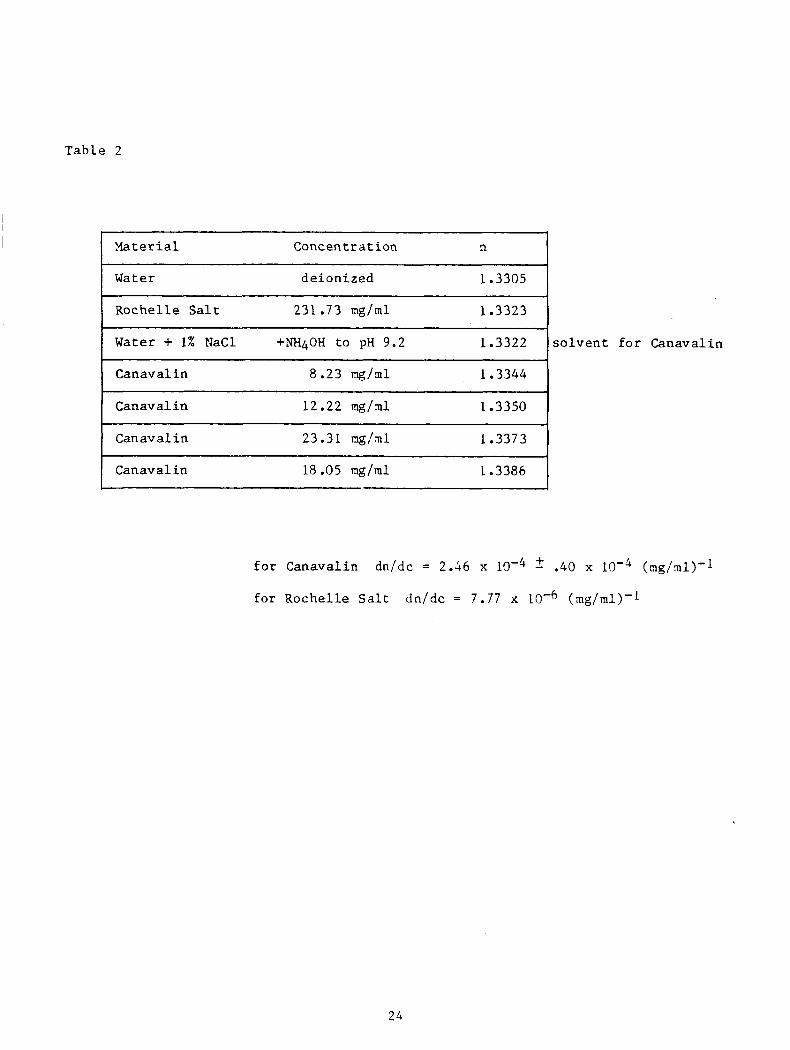
Tab le 2
Material Conc en t I: a t ion n
Water de ion ized 1.3305
1 Rochel le S a l t 231.73 mg/ml 1.3323
I Water + 1% Mac1 +NH4OH t o pH 9.2 1.3322
I Canaval in 8.23 m g / m l 1.3344
1 Canaval in
Can av a1 i n 23.31 ng/ml 1.3373
Canaval in 18.05 m g / m l 1.3386
s o l v e n t f o r Canaval in
f o r Canaval in dn/dc = 2.46 x 2 .40 x (mg/ml)'l
f o r Rochel le Salt dn/dc = 7.77 x (mg/ml)-l
24
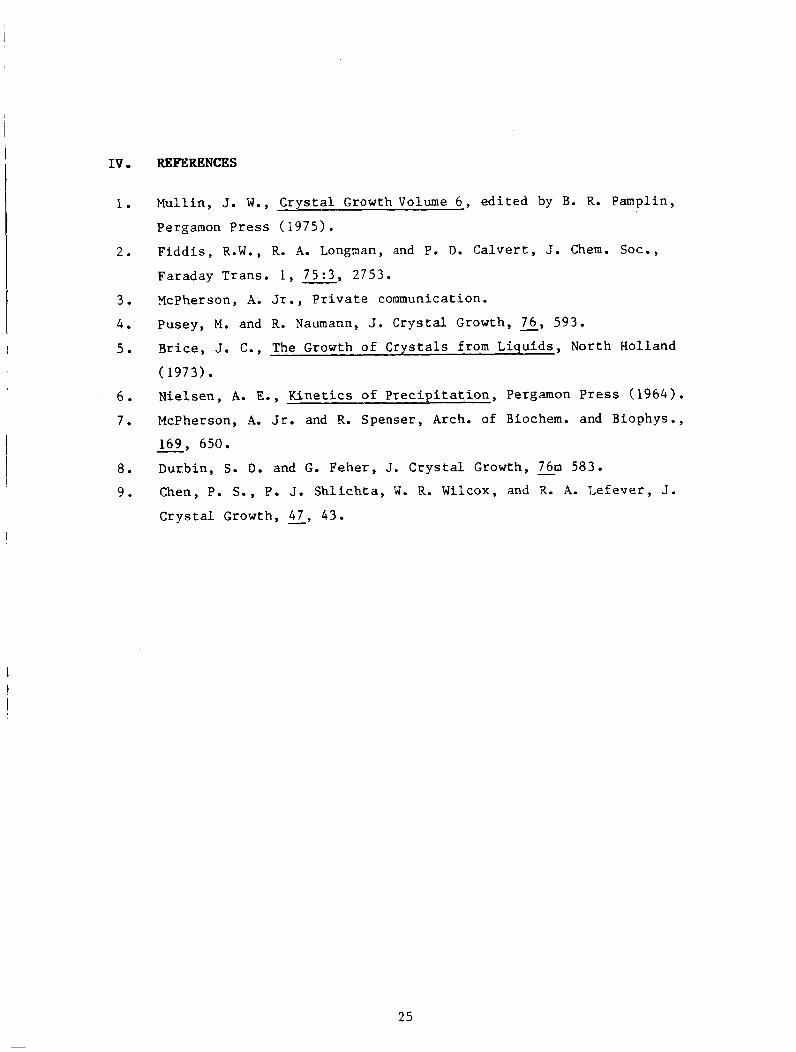
IV . REPERENCES
1.
2 .
3.
4 .
5.
6 .
7.
8.
9.
Mull in , J. W., C r y s t a l Growth Volume 6 , e d i t e d by 8. R. Pamplin,
Pergamon P r e s s (1975) .
F i d d i s , R.W., R. A. Longman, and P. D. C a l v e r t , J. Chem. S O C . ,
Faraday Trans. 1 , 75:3, 2753.
XcPherson, A. Jr., P r i v a t e communication.
Pusey, M. and R. Naumann, J. Crys t a l Growth, - 76, 593.
Brice, J. C., The Growth of C r y s t a l s from L iqu ids , North Holland
(1973) .
Nie lsen , A. E., K i n e t i c s of P r e c i p i t a t i o n , Pergamon P r e s s (1964) .
McPherson, A. Jr. and R. Spenser, Arch. of Biochem. and Biophys.,
c_ 169, 650.
Durbin, S. D. and G. Feher , J. C r y s t a l Growth, - 76m 583.
Chen, P. S., P. J. S h l i c h t a , M. R. Wilcox, and R. A. Lefeve r , J.
C r y s t a l Growth, - 47, 43.
25


![STRUCTURE AND SUPERSATURATION FOR INTERSECTING … · and Frankl [12] showed that this is the largest possible size of an intersecting family in Sn. In the corresponding supersaturation](https://img.pdfslide.net/doc/110x75/5f680d2126448e68ba5cbe1e/structure-and-supersaturation-for-intersecting-and-frankl-12-showed-that-this.jpg)