Embed Size (px)
Citation preview
NASA JCL: Process and Lessons
Steve Wilson and Mike Stelly
NASA: Lyndon B. Johnson Space Center
Office of Performance Management & Integration (PMI)
To ICEAA: June 12, 2014

NASA JCL: Process and Lessons Agenda
What/Why/How of NASA JCL
Lessons from Constellation
Lessons From Orion
Lessons from Commercial Crew
Poetic Epilogue 2
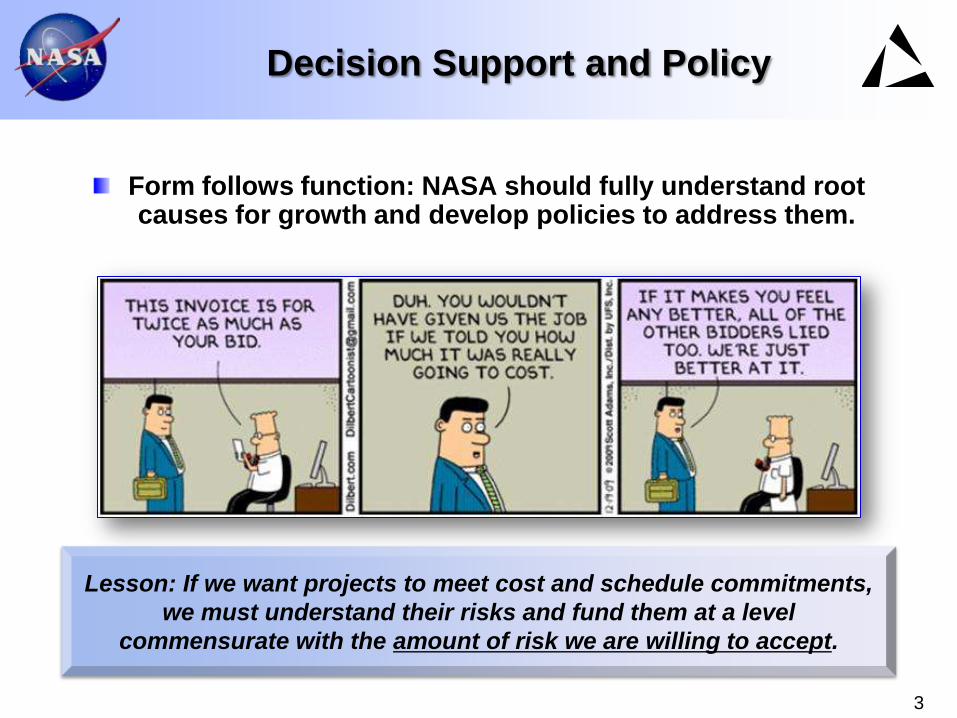
Decision Support and Policy
Form follows function: NASA should fully understand root causes for growth and develop policies to address them.
3
Lesson: If we want projects to meet cost and schedule commitments,
we must understand their risks and fund them at a level
commensurate with the amount of risk we are willing to accept.
What is JCL? Confidence Level Definition
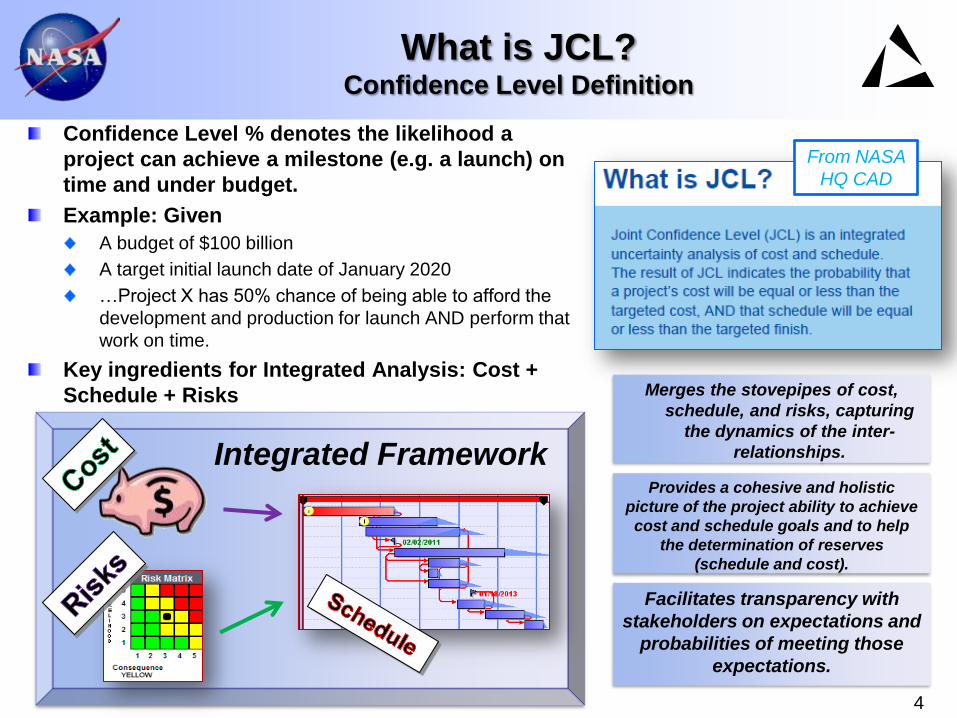
Confidence Level % denotes the likelihood a
project can achieve a milestone (e.g. a launch) on
time and under budget.
Example: Given
A budget of $100 billion
A target initial launch date of January 2020
…Project X has 50% chance of being able to afford the
development and production for launch AND perform that
work on time.
Key ingredients for Integrated Analysis: Cost +
Schedule + Risks
4
Integrated Framework
Merges the stovepipes of cost,
schedule, and risks, capturing
the dynamics of the inter-
relationships.
From NASA
HQ CAD
Provides a cohesive and holistic
picture of the project ability to achieve
cost and schedule goals and to help
the determination of reserves
(schedule and cost).
Facilitates transparency with
stakeholders on expectations and
probabilities of meeting those
expectations.
JCL Constituent Elements = Traditional
Program Assessment Paradigms
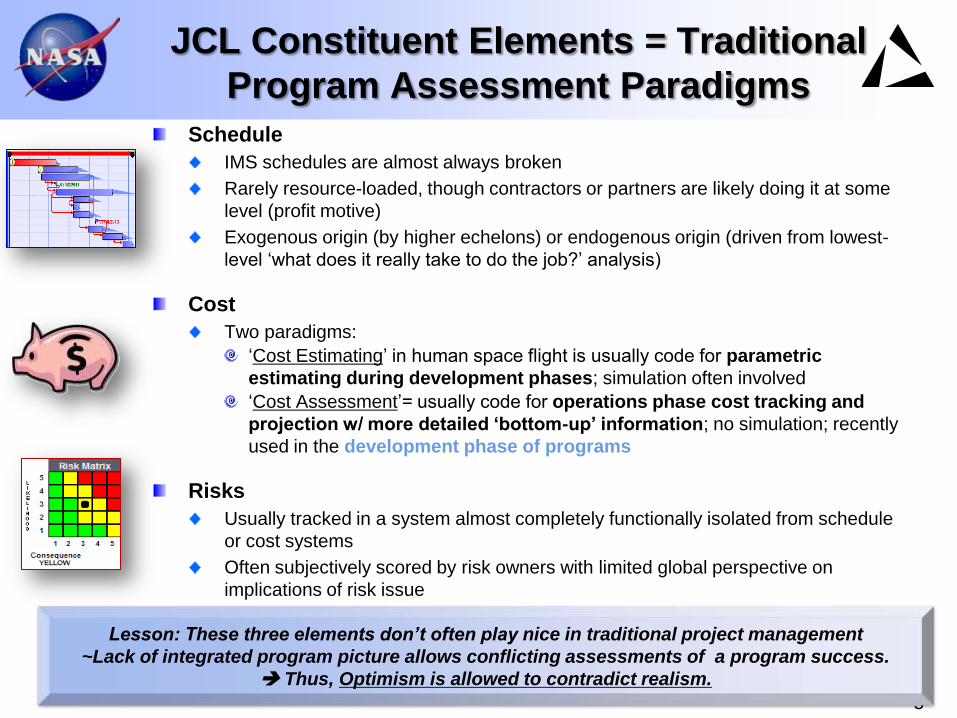
Schedule
IMS schedules are almost always broken
Rarely resource-loaded, though contractors or partners are likely doing it at some
level (profit motive)
Exogenous origin (by higher echelons) or endogenous origin (driven from lowest-
level ‘what does it really take to do the job?’ analysis)
Cost
Two paradigms:
‘Cost Estimating’ in human space flight is usually code for parametric
estimating during development phases; simulation often involved
‘Cost Assessment’= usually code for operations phase cost tracking and
projection w/ more detailed ‘bottom-up’ information; no simulation; recently
used in the development phase of programs
Risks
Usually tracked in a system almost completely functionally isolated from schedule
or cost systems
Often subjectively scored by risk owners with limited global perspective on
implications of risk issue
5
Lesson: These three elements don’t often play nice in traditional project management
~Lack of integrated program picture allows conflicting assessments of a program success.
Thus, Optimism is allowed to contradict realism.
What is JCL? Key Calculation Dynamic
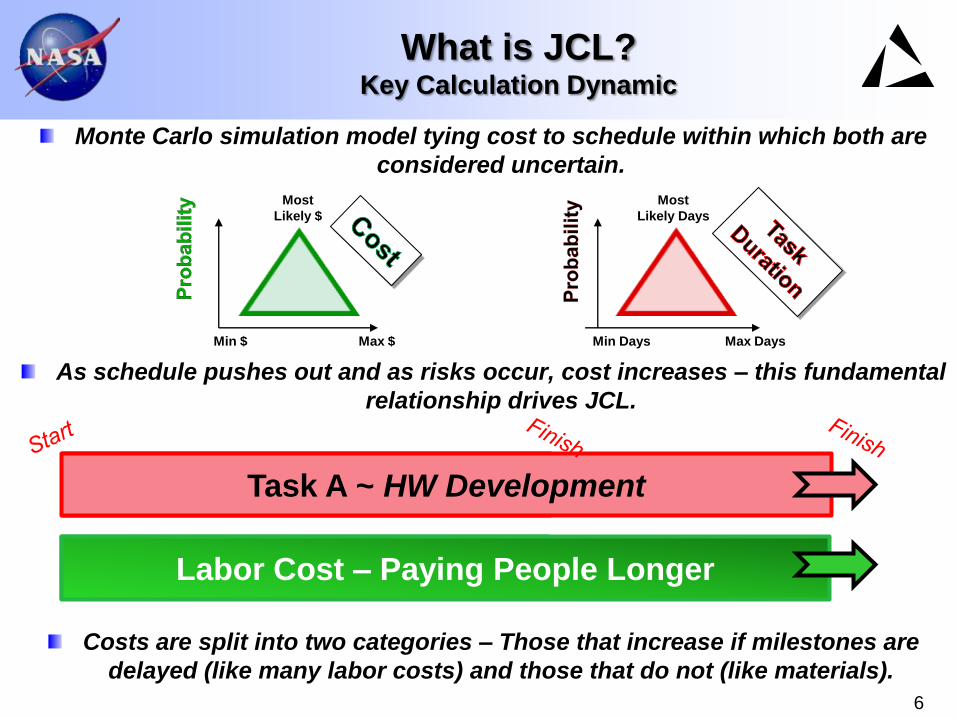
Monte Carlo simulation model tying cost to schedule within which both are
considered uncertain.
As schedule pushes out and as risks occur, cost increases – this fundamental
relationship drives JCL.
Costs are split into two categories – Those that increase if milestones are
delayed (like many labor costs) and those that do not (like materials).
6
Task A ~ HW Development Task A ~ HW Development
Labor Cost Labor Cost – Paying People Longer
Min $
Most
Likely $
Max $ Min Days
Most
Likely Days
Max Days
U/C
U/C
U/C
U/C
U/C
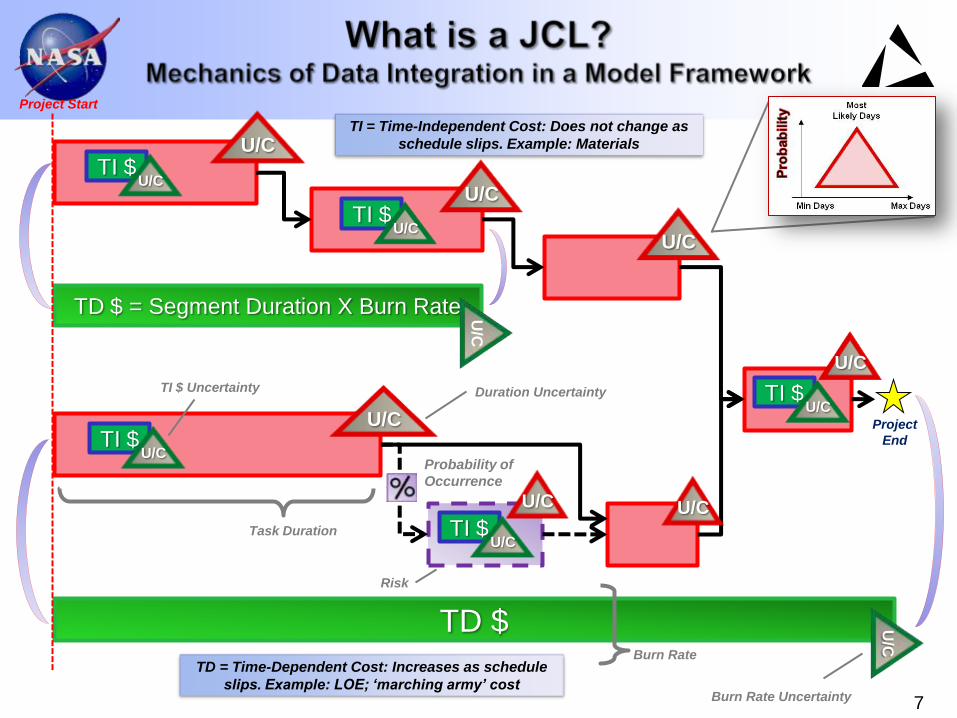
TD $
TD $ = Segment Duration X Burn Rate
U/C
U/C
U/C
U/C
TI $ U/C
TI $ U/C
TI $ U/C
TI $ U/C
TI $ U/C
Project Start
Project
End
Task Duration
Burn Rate
Burn Rate Uncertainty
Duration Uncertainty
Risk
Probability of
Occurrence
TI $ Uncertainty
7
TI = Time-Independent Cost: Does not change as
schedule slips. Example: Materials
TD = Time-Dependent Cost: Increases as schedule
slips. Example: LOE; ‘marching army’ cost
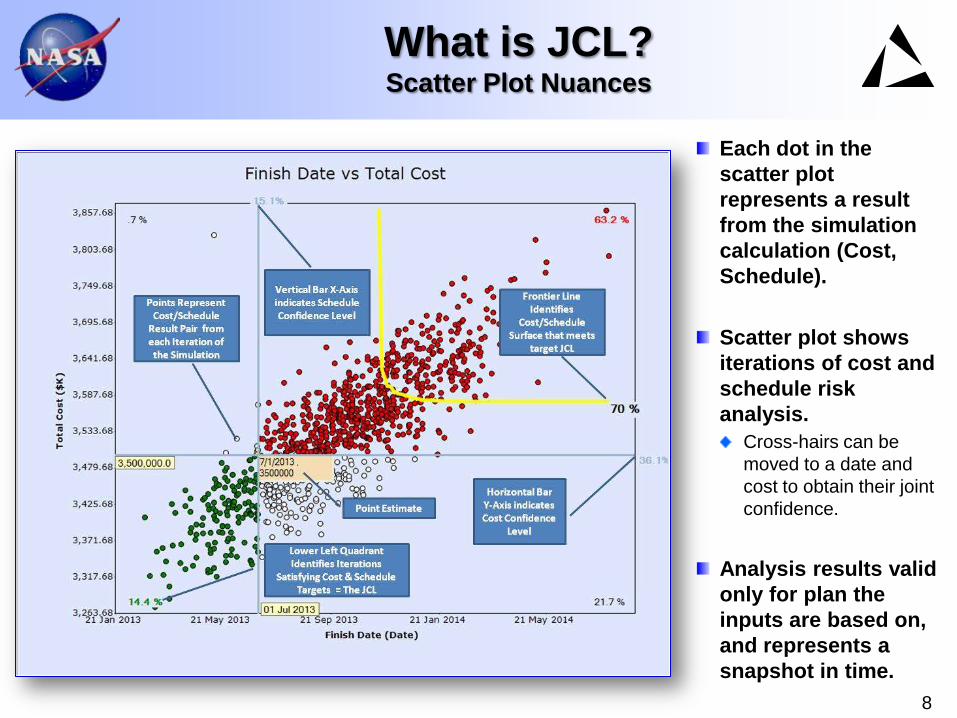
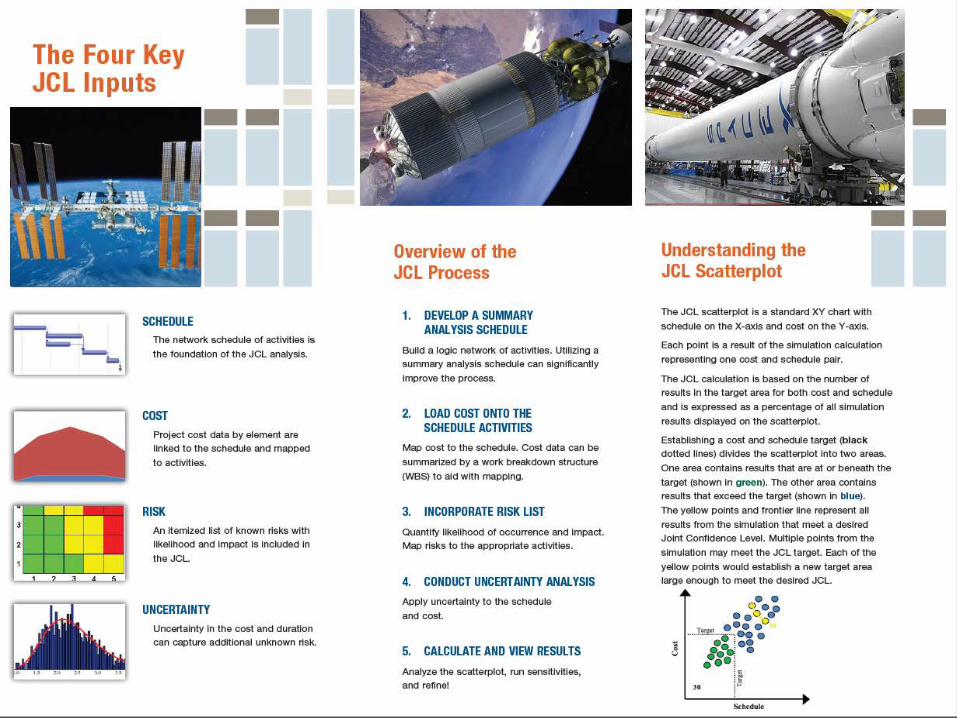
Each dot in the
scatter plot
represents a result
from the simulation
calculation (Cost,
Schedule).
Scatter plot shows
iterations of cost and
schedule risk
analysis.
Cross-hairs can be
moved to a date and
cost to obtain their joint
confidence.
Analysis results valid
only for plan the
inputs are based on,
and represents a
snapshot in time.
8
What is JCL? Scatter Plot Nuances
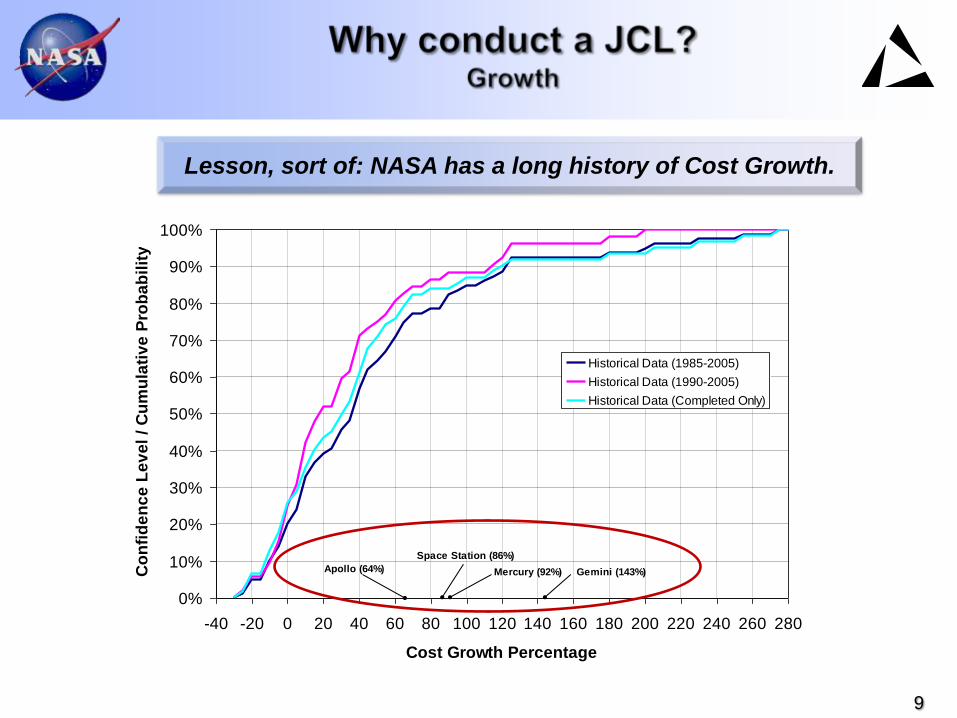
0%
10%
20%
30%
40%
50%
60%
70%
80%
90%
100%
-40 -20 0 20 40 60 80 100 120 140 160 180 200 220 240 260 280
Cost Growth Percentage
Co
nfi
de
nc
e L
ev
el
/ C
um
ula
tiv
e P
rob
ab
ilit
y
Historical Data (1985-2005)
Historical Data (1990-2005)
Historical Data (Completed Only)
Apollo (64%) Mercury (92%) Gemini (143%)
Space Station (86%)
9
Lesson, sort of: NASA has a long history of Cost Growth.
Why have 80% of major NASA projects an
programs overrun their budgets?* (Relentless) GAO reports support this statistic
Why have almost 100% of projects overrun initial
schedules?*
….And continue to do so? (JWST)
10
*Source Available
One major reason for many projects:
Lack of an integrated picture at the
beginning and throughout the life cycle
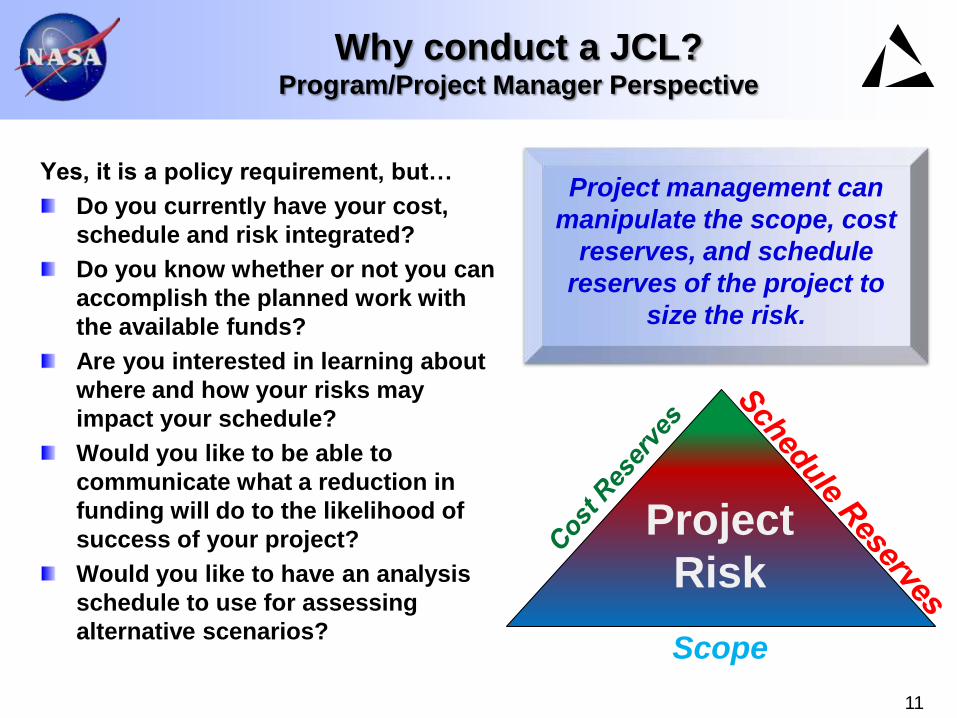
Why conduct a JCL? Program/Project Manager Perspective
Yes, it is a policy requirement, but…
Do you currently have your cost,
schedule and risk integrated?
Do you know whether or not you can
accomplish the planned work with
the available funds?
Are you interested in learning about
where and how your risks may
impact your schedule?
Would you like to be able to
communicate what a reduction in
funding will do to the likelihood of
success of your project?
Would you like to have an analysis
schedule to use for assessing
alternative scenarios?
11
Project management can
manipulate the scope, cost
reserves, and schedule
reserves of the project to
size the risk.
Scope
Project
Risk
Lessons from Around NASA
Agenda for Today
12
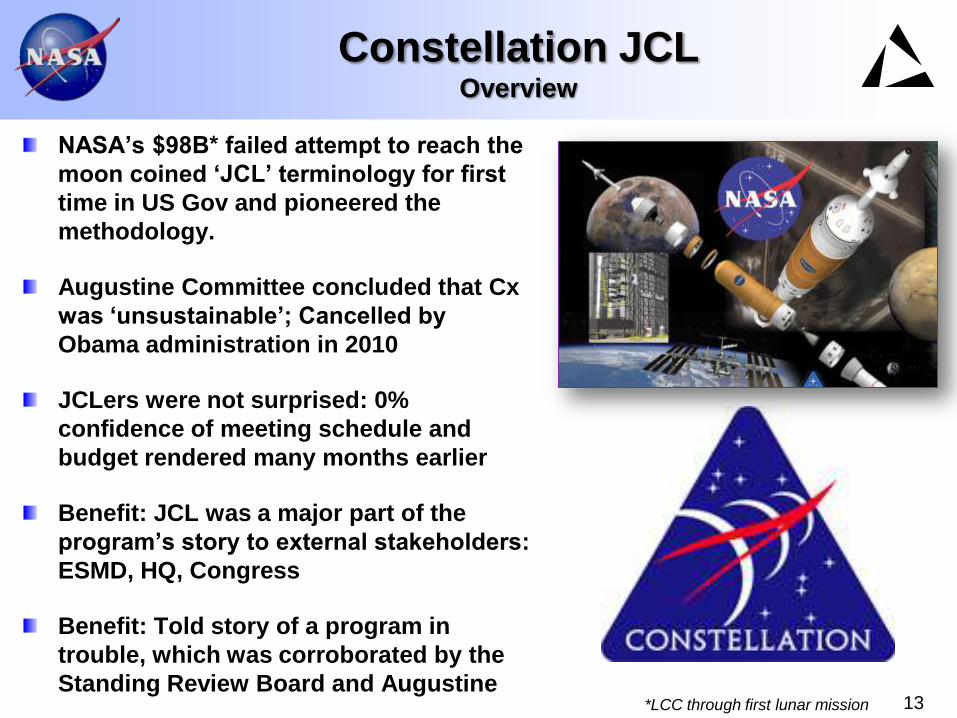
Constellation JCL Overview
NASA’s $98B* failed attempt to reach the
moon coined ‘JCL’ terminology for first
time in US Gov and pioneered the
methodology.
Augustine Committee concluded that Cx
was ‘unsustainable’; Cancelled by
Obama administration in 2010
JCLers were not surprised: 0%
confidence of meeting schedule and
budget rendered many months earlier
Benefit: JCL was a major part of the
program’s story to external stakeholders:
ESMD, HQ, Congress
Benefit: Told story of a program in
trouble, which was corroborated by the
Standing Review Board and Augustine
13 *LCC through first lunar mission
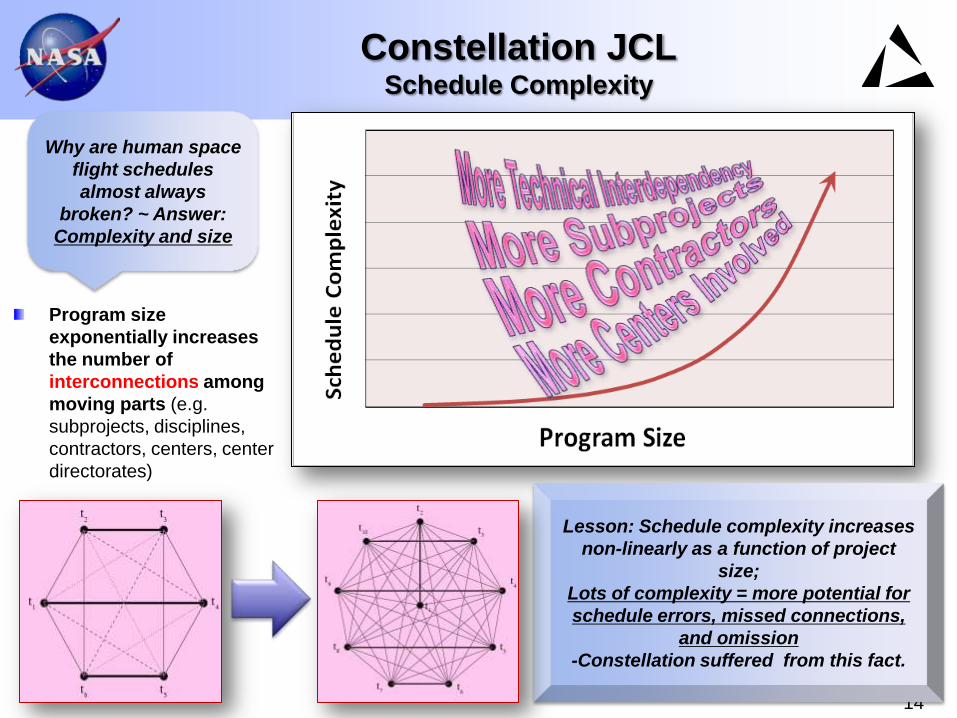
Constellation JCL Schedule Complexity
Program size
exponentially increases
the number of
interconnections among
moving parts (e.g.
subprojects, disciplines,
contractors, centers, center
directorates)
14
Lesson: Schedule complexity increases
non-linearly as a function of project
size;
Lots of complexity = more potential for
schedule errors, missed connections,
and omission
-Constellation suffered from this fact.
Why are human space
flight schedules
almost always
broken? ~ Answer:
Complexity and size
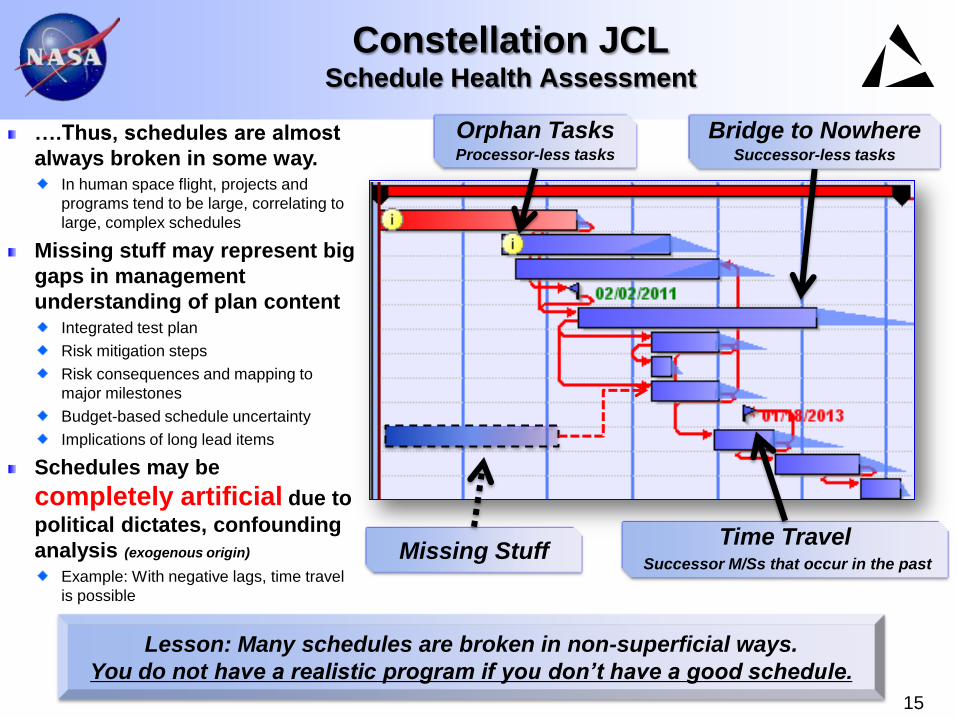
Constellation JCL Schedule Health Assessment
15
Lesson: Many schedules are broken in non-superficial ways.
You do not have a realistic program if you don’t have a good schedule.
….Thus, schedules are almost
always broken in some way. In human space flight, projects and
programs tend to be large, correlating to
large, complex schedules
Missing stuff may represent big
gaps in management
understanding of plan content Integrated test plan
Risk mitigation steps
Risk consequences and mapping to
major milestones
Budget-based schedule uncertainty
Implications of long lead items
Schedules may be
completely artificial due to
political dictates, confounding
analysis (exogenous origin)
Example: With negative lags, time travel
is possible
Bridge to Nowhere Successor-less tasks
Time Travel Successor M/Ss that occur in the past
Missing Stuff
Orphan Tasks Processor-less tasks
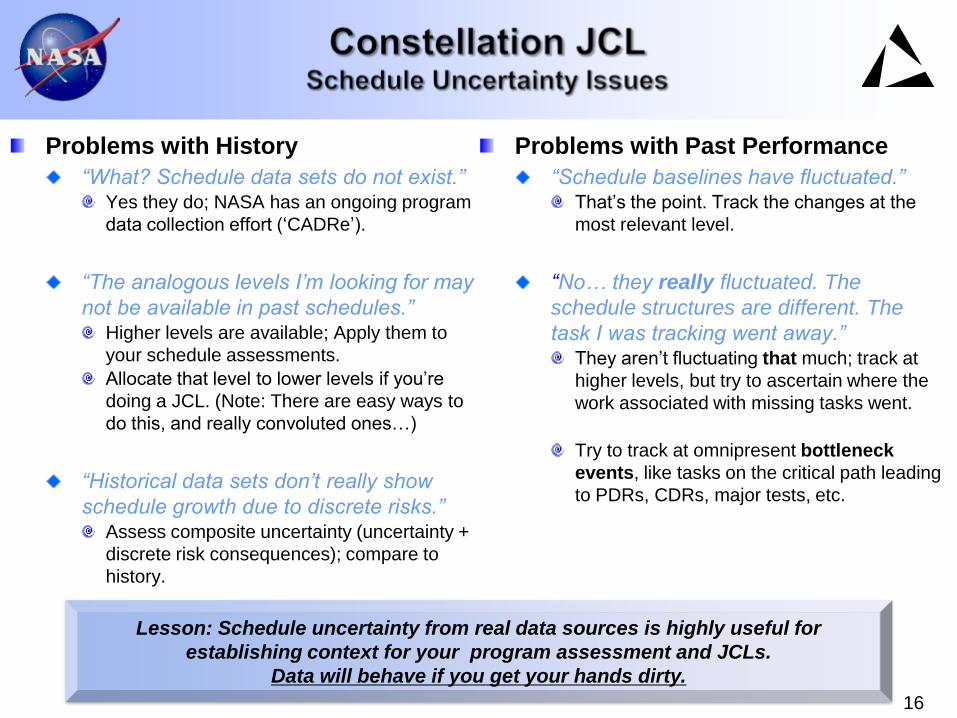
Problems with History
“What? Schedule data sets do not exist.” Yes they do; NASA has an ongoing program
data collection effort (‘CADRe’).
“The analogous levels I’m looking for may
not be available in past schedules.” Higher levels are available; Apply them to
your schedule assessments.
Allocate that level to lower levels if you’re
doing a JCL. (Note: There are easy ways to
do this, and really convoluted ones…)
“Historical data sets don’t really show
schedule growth due to discrete risks.” Assess composite uncertainty (uncertainty +
discrete risk consequences); compare to
history.
Problems with Past Performance
“Schedule baselines have fluctuated.” That’s the point. Track the changes at the
most relevant level.
“No… they really fluctuated. The
schedule structures are different. The
task I was tracking went away.” They aren’t fluctuating that much; track at
higher levels, but try to ascertain where the
work associated with missing tasks went.
Try to track at omnipresent bottleneck
events, like tasks on the critical path leading
to PDRs, CDRs, major tests, etc.
16
Lesson: Schedule uncertainty from real data sources is highly useful for
establishing context for your program assessment and JCLs.
Data will behave if you get your hands dirty.
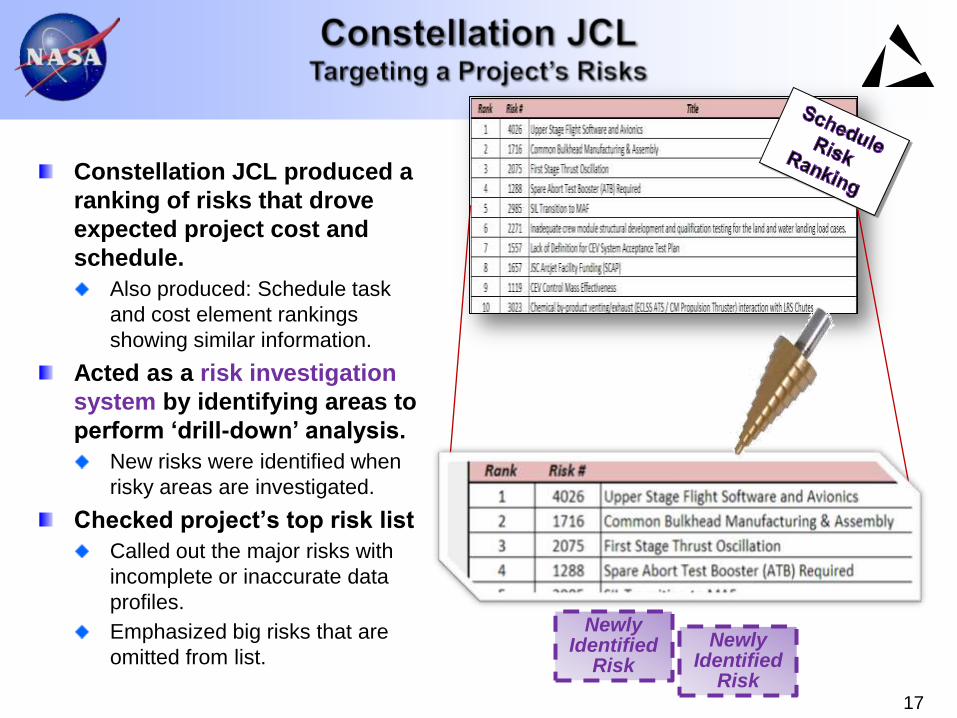
Constellation JCL produced a
ranking of risks that drove
expected project cost and
schedule.
Also produced: Schedule task
and cost element rankings
showing similar information.
Acted as a risk investigation
system by identifying areas to
perform ‘drill-down’ analysis.
New risks were identified when
risky areas are investigated.
Checked project’s top risk list
Called out the major risks with
incomplete or inaccurate data
profiles.
Emphasized big risks that are
omitted from list.
17
Newly Identified
Risk
Newly Identified
Risk
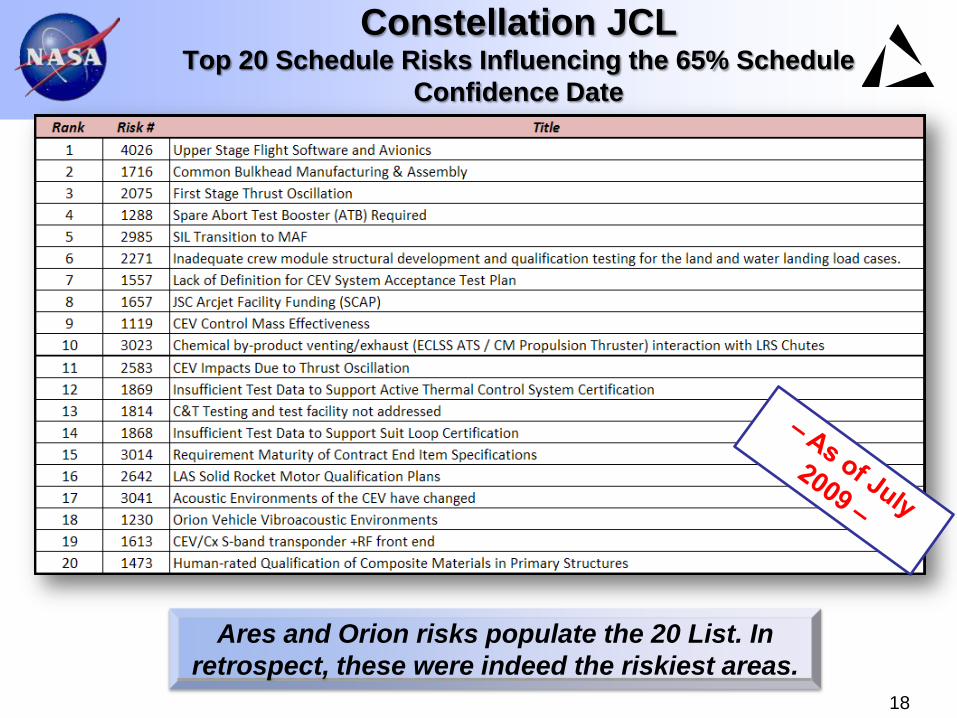
Constellation JCL Top 20 Schedule Risks Influencing the 65% Schedule
Confidence Date
18
Ares and Orion risks populate the 20 List. In
retrospect, these were indeed the riskiest areas.
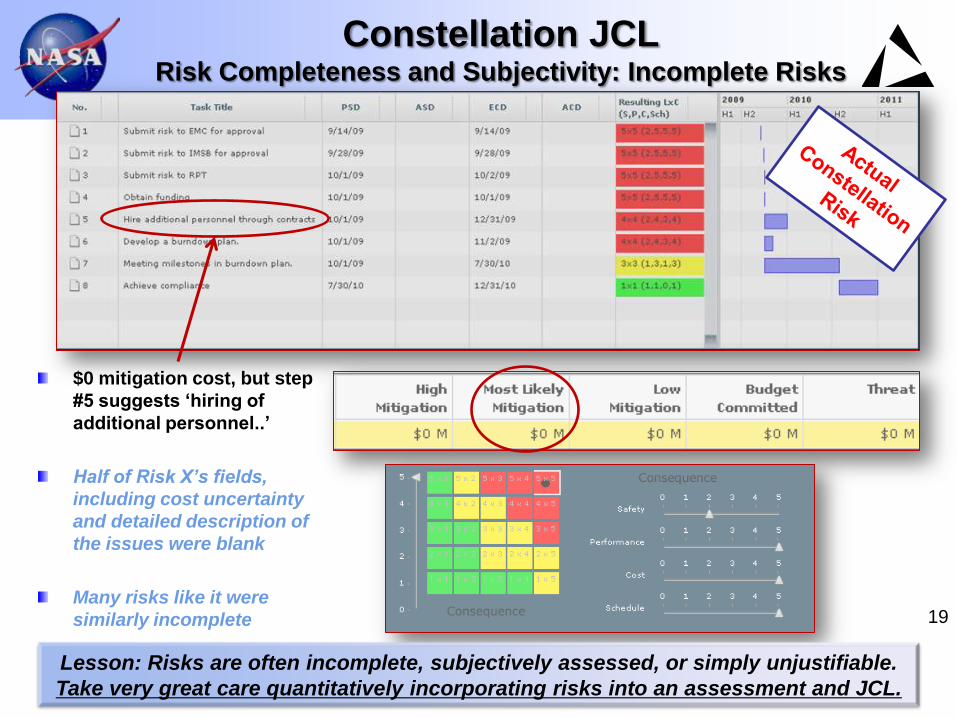
Constellation JCL Risk Completeness and Subjectivity: Incomplete Risks
$0 mitigation cost, but step
#5 suggests ‘hiring of
additional personnel..’
Half of Risk X’s fields,
including cost uncertainty
and detailed description of
the issues were blank
Many risks like it were
similarly incomplete 19
Lesson: Risks are often incomplete, subjectively assessed, or simply unjustifiable.
Take very great care quantitatively incorporating risks into an assessment and JCL.
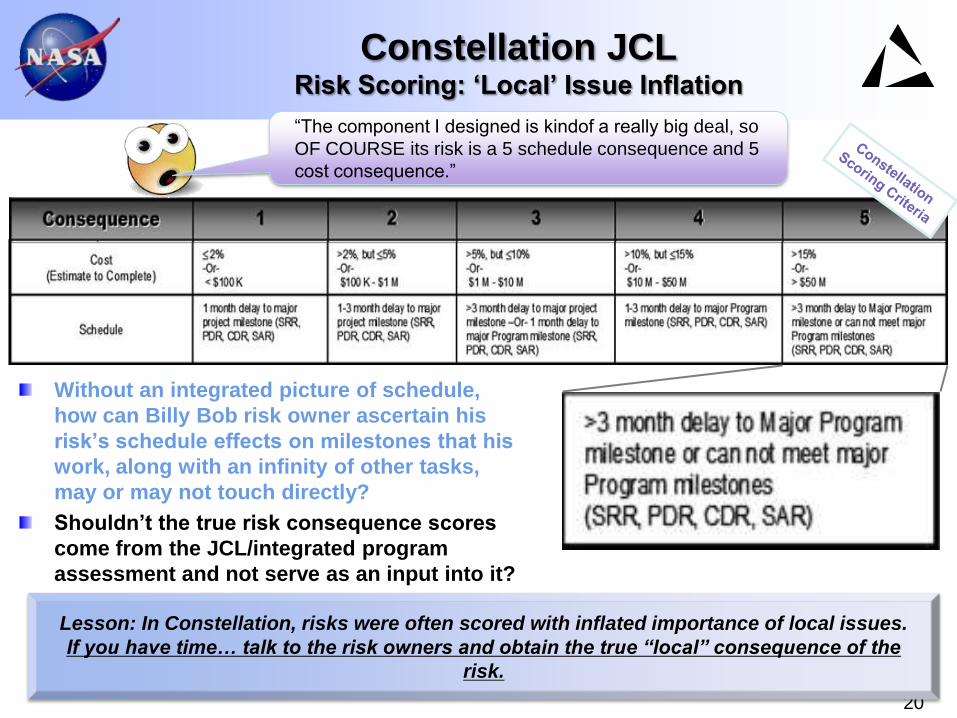
Constellation JCL Risk Scoring: ‘Local’ Issue Inflation
Without an integrated picture of schedule,
how can Billy Bob risk owner ascertain his
risk’s schedule effects on milestones that his
work, along with an infinity of other tasks,
may or may not touch directly?
Shouldn’t the true risk consequence scores
come from the JCL/integrated program
assessment and not serve as an input into it?
20
Lesson: In Constellation, risks were often scored with inflated importance of local issues.
If you have time… talk to the risk owners and obtain the true “local” consequence of the
risk.
“The component I designed is kindof a really big deal, so
OF COURSE its risk is a 5 schedule consequence and 5
cost consequence.”
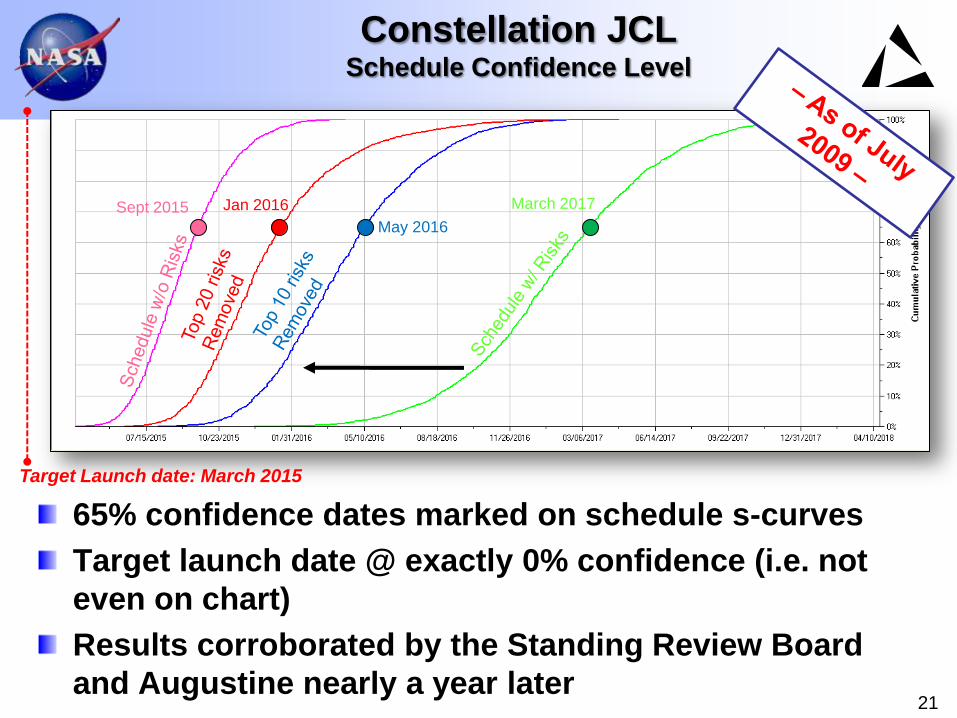
Constellation JCL Schedule Confidence Level
65% confidence dates marked on schedule s-curves
Target launch date @ exactly 0% confidence (i.e. not
even on chart)
Results corroborated by the Standing Review Board
and Augustine nearly a year later
21
Sept 2015
May 2016
March 2017 Jan 2016
Target Launch date: March 2015
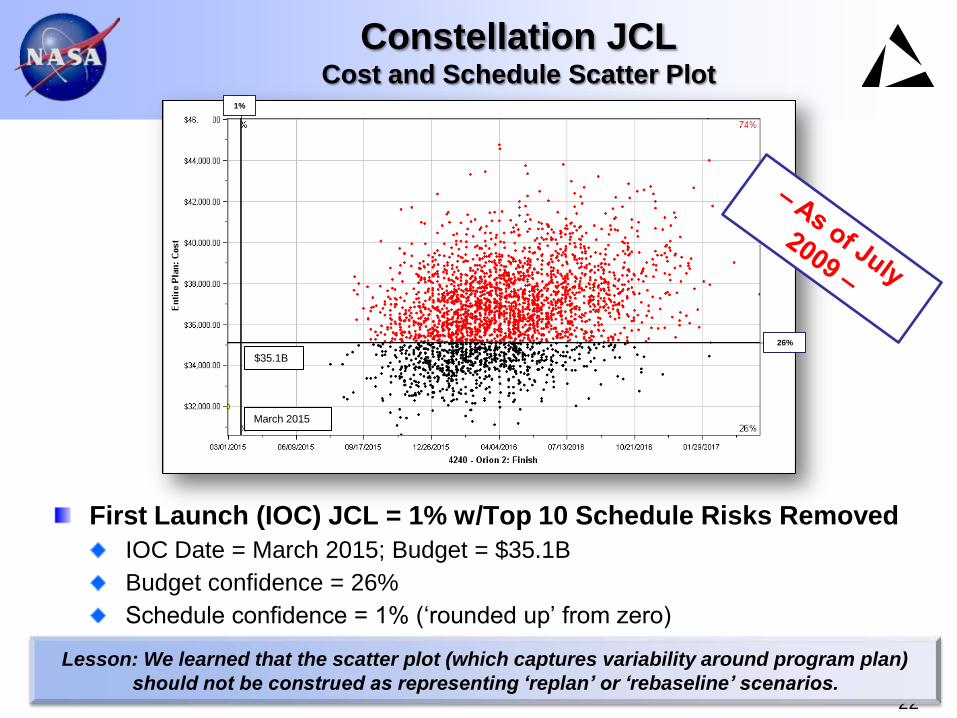
Constellation JCL Cost and Schedule Scatter Plot
First Launch (IOC) JCL = 1% w/Top 10 Schedule Risks Removed
IOC Date = March 2015; Budget = $35.1B
Budget confidence = 26%
Schedule confidence = 1% (‘rounded up’ from zero)
22
March 2015
$35.1B
1%
26%
Lesson: We learned that the scatter plot (which captures variability around program plan)
should not be construed as representing ‘replan’ or ‘rebaseline’ scenarios.
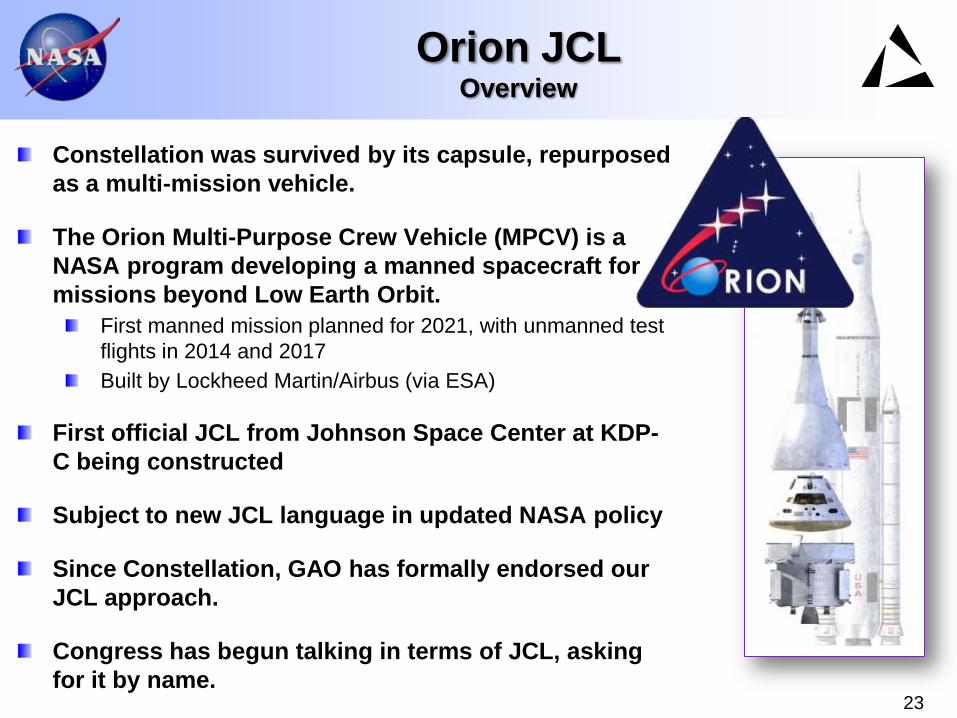
Orion JCL Overview
Constellation was survived by its capsule, repurposed
as a multi-mission vehicle.
The Orion Multi-Purpose Crew Vehicle (MPCV) is a
NASA program developing a manned spacecraft for
missions beyond Low Earth Orbit.
First manned mission planned for 2021, with unmanned test
flights in 2014 and 2017
Built by Lockheed Martin/Airbus (via ESA)
First official JCL from Johnson Space Center at KDP-
C being constructed
Subject to new JCL language in updated NASA policy
Since Constellation, GAO has formally endorsed our
JCL approach.
Congress has begun talking in terms of JCL, asking
for it by name. 23
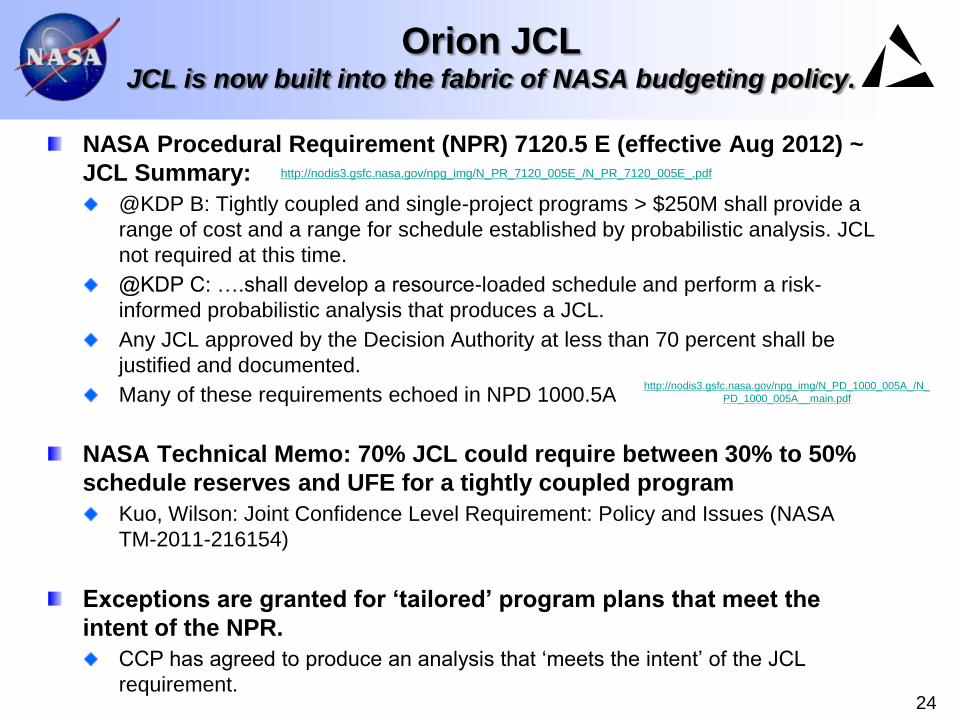
Orion JCL JCL is now built into the fabric of NASA budgeting policy.
NASA Procedural Requirement (NPR) 7120.5 E (effective Aug 2012) ~
JCL Summary:
@KDP B: Tightly coupled and single-project programs > $250M shall provide a
range of cost and a range for schedule established by probabilistic analysis. JCL
not required at this time.
@KDP C: ….shall develop a resource-loaded schedule and perform a risk-
informed probabilistic analysis that produces a JCL.
Any JCL approved by the Decision Authority at less than 70 percent shall be
justified and documented.
Many of these requirements echoed in NPD 1000.5A
NASA Technical Memo: 70% JCL could require between 30% to 50%
schedule reserves and UFE for a tightly coupled program
Kuo, Wilson: Joint Confidence Level Requirement: Policy and Issues (NASA
TM-2011-216154)
Exceptions are granted for ‘tailored’ program plans that meet the
intent of the NPR.
CCP has agreed to produce an analysis that ‘meets the intent’ of the JCL
requirement.
24
http://nodis3.gsfc.nasa.gov/npg_img/N_PR_7120_005E_/N_PR_7120_005E_.pdf
http://nodis3.gsfc.nasa.gov/npg_img/N_PD_1000_005A_/N_
PD_1000_005A__main.pdf
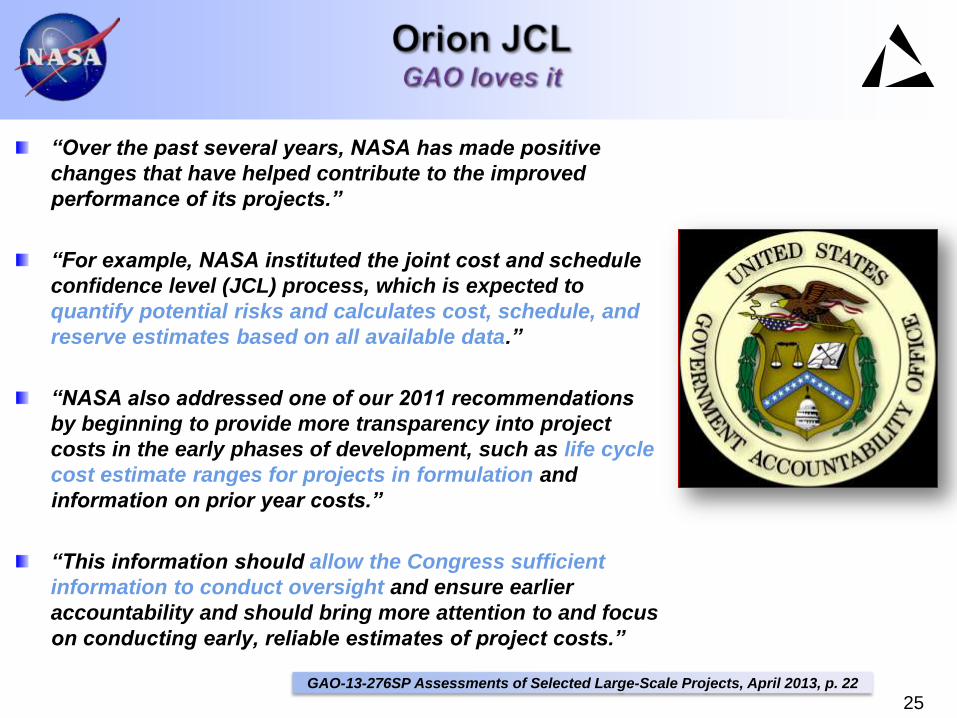
“Over the past several years, NASA has made positive
changes that have helped contribute to the improved
performance of its projects.”
“For example, NASA instituted the joint cost and schedule
confidence level (JCL) process, which is expected to
quantify potential risks and calculates cost, schedule, and
reserve estimates based on all available data.”
“NASA also addressed one of our 2011 recommendations
by beginning to provide more transparency into project
costs in the early phases of development, such as life cycle
cost estimate ranges for projects in formulation and
information on prior year costs.”
“This information should allow the Congress sufficient
information to conduct oversight and ensure earlier
accountability and should bring more attention to and focus
on conducting early, reliable estimates of project costs.”
25 GAO-13-276SP Assessments of Selected Large-Scale Projects, April 2013, p. 22
26
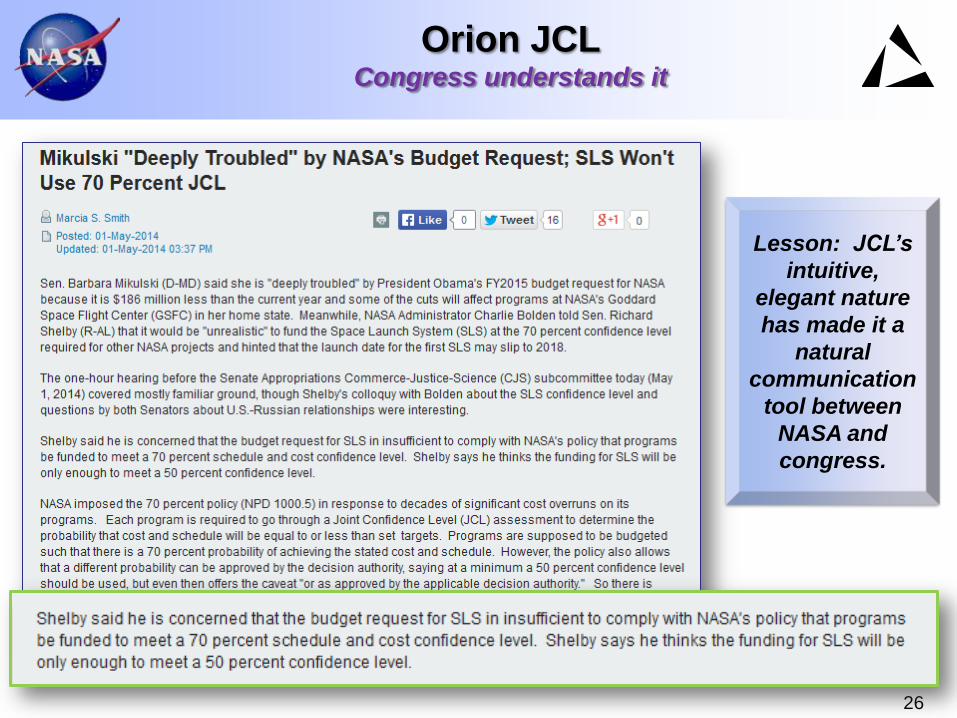
Orion JCL Congress understands it
Lesson: JCL’s
intuitive,
elegant nature
has made it a
natural
communication
tool between
NASA and
congress.
27
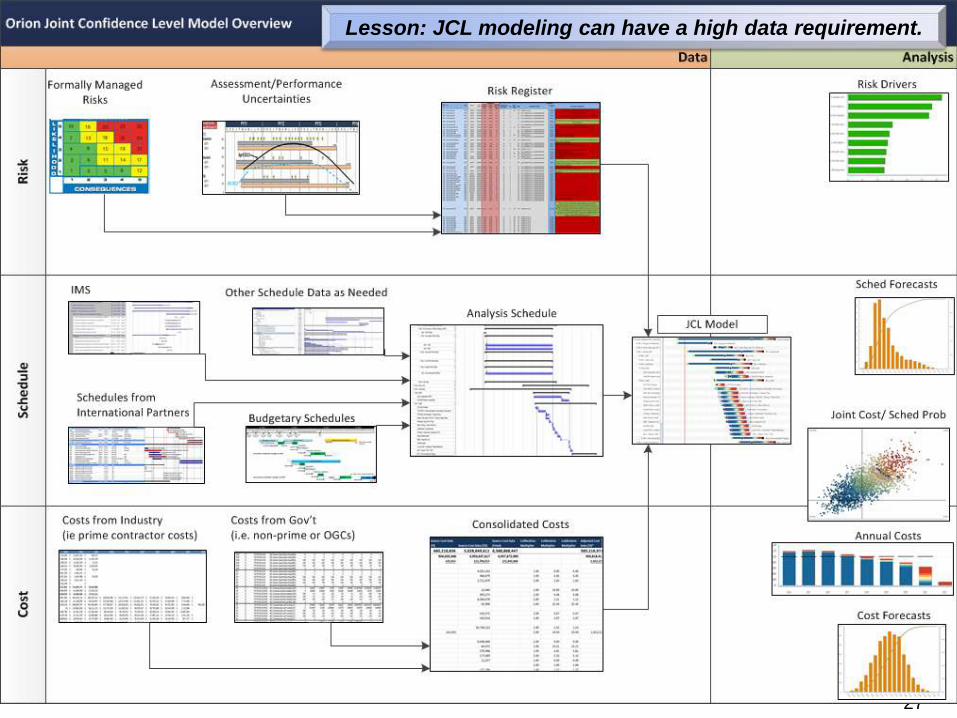
Lesson: JCL modeling can have a high data requirement.
28
Orion Use of JCL Products
Many JCL products are actionable and lend themselves well to
program management. These products include:
Impacts of discrete program risks
‘What-if’ scenarios
Recommended annual funding reserve
Management has found these other products more useful than the
traditional cost and schedule CDFs (‘ranges’)
The Orion Program Control team is constantly evolving with JCL
models to find new analyses for program insight
Lesson: JCL is acting as a forcing function to truly integrate cost,
schedule, and risk systems into useful reporting products.
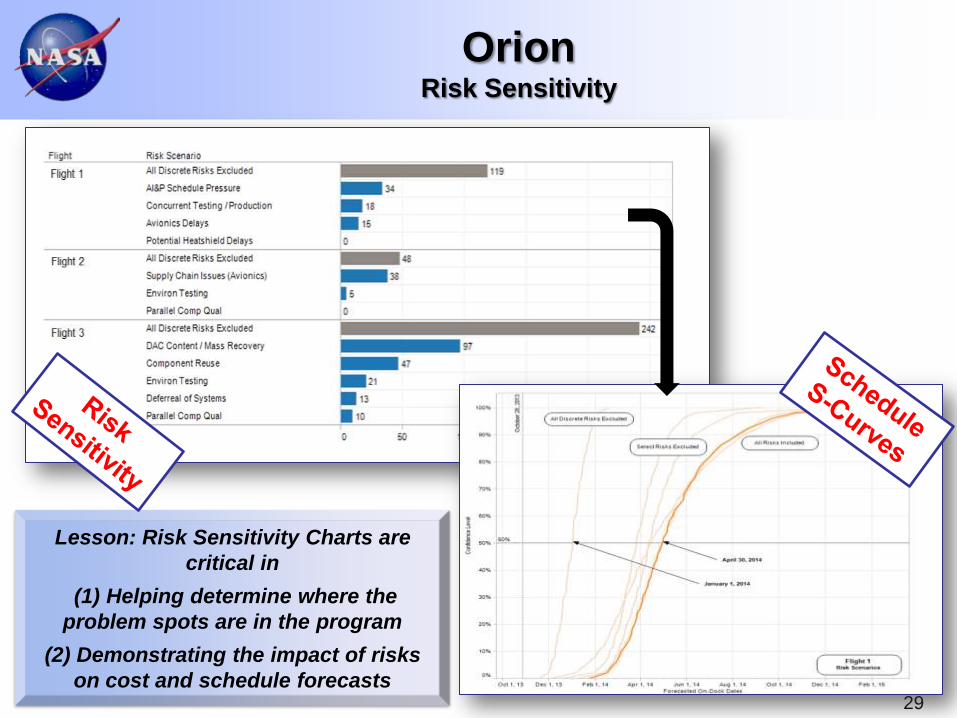
Orion Risk Sensitivity
29
Lesson: Risk Sensitivity Charts are
critical in
(1) Helping determine where the
problem spots are in the program
(2) Demonstrating the impact of risks
on cost and schedule forecasts
30
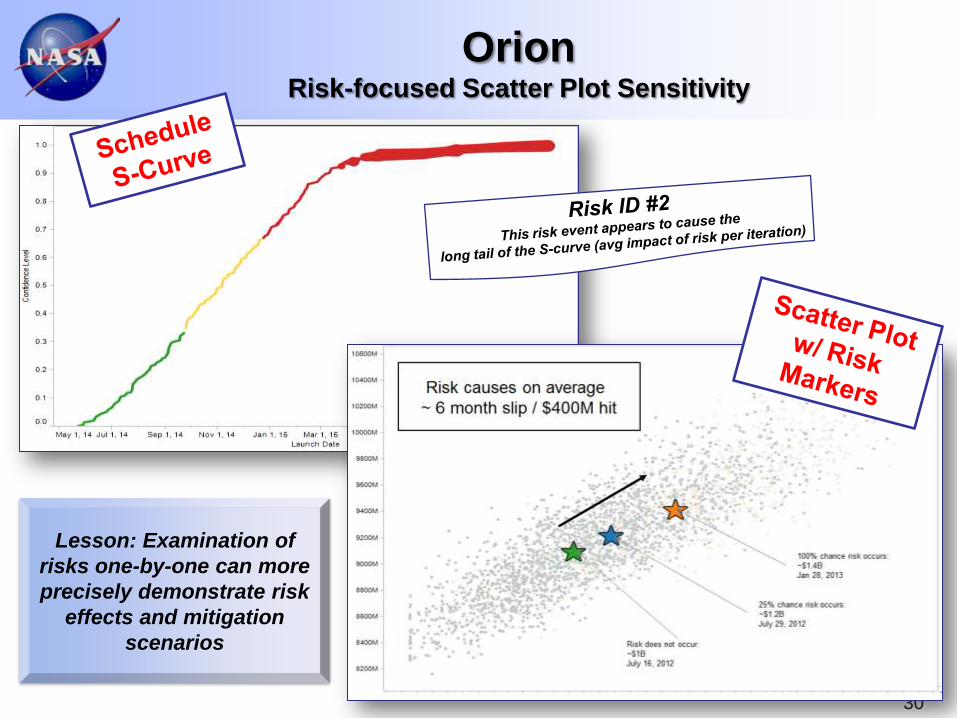
Orion Risk-focused Scatter Plot Sensitivity
Lesson: Examination of
risks one-by-one can more
precisely demonstrate risk
effects and mitigation
scenarios
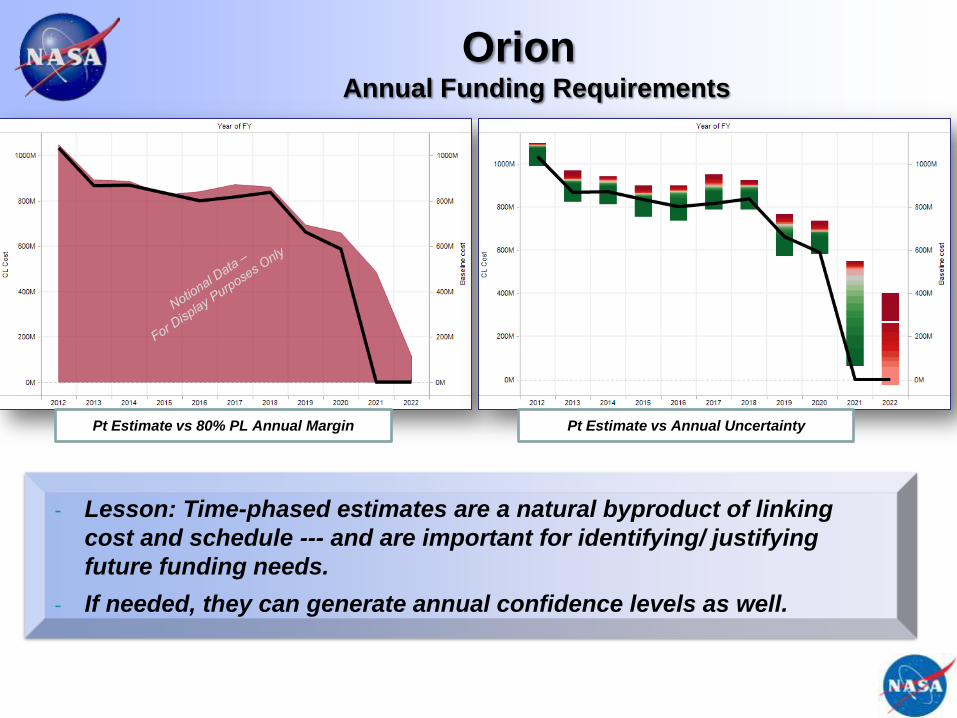
Orion Annual Funding Requirements
31
Pt Estimate vs 80% PL Annual Margin Pt Estimate vs Annual Uncertainty
- Lesson: Time-phased estimates are a natural byproduct of linking
cost and schedule --- and are important for identifying/ justifying
future funding needs.
- If needed, they can generate annual confidence levels as well.
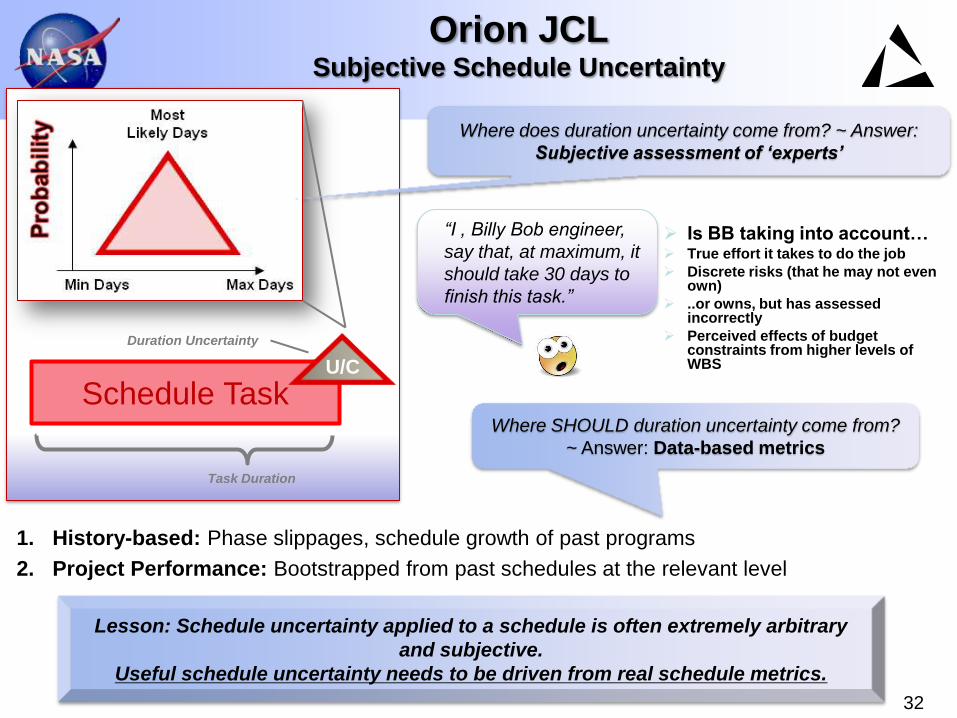
1. History-based: Phase slippages, schedule growth of past programs
2. Project Performance: Bootstrapped from past schedules at the relevant level
32
Lesson: Schedule uncertainty applied to a schedule is often extremely arbitrary
and subjective.
Useful schedule uncertainty needs to be driven from real schedule metrics.
Schedule Task U/C
Task Duration
Duration Uncertainty
Where does duration uncertainty come from? ~ Answer:
Subjective assessment of ‘experts’
Where SHOULD duration uncertainty come from?
~ Answer: Data-based metrics
Is BB taking into account… True effort it takes to do the job
Discrete risks (that he may not even own)
..or owns, but has assessed incorrectly
Perceived effects of budget constraints from higher levels of WBS
“I , Billy Bob engineer,
say that, at maximum, it
should take 30 days to
finish this task.”
Orion JCL Subjective Schedule Uncertainty
Orion JCL Quality Check of Project Data
Projects reexamine risk data
Integrated process incorporates risk data
With many NASA projects, upon initial inclusion of the risks within
the model, data quality has been immediately identified as an area
of interest
Helped projects to reevaluate risk data and improve database
quality.
Schedule health improves
Integrated analysis methodology requires a solid schedule
structure, a logically-linked network, and an evaluation of tasks
required to meet milestones – very ‘delicate’
Around NASA, teams implementing JCL have provided project
schedulers feedback and guidance on schedule health
Schedule health check criteria have been developed jointly by cost,
schedule, and risk personnel
Cost estimate methodologies are examined more closely
for realism in light of uncertain schedules and risks
33 Lesson: The JCL process at NASA is improving programs’ data quality.
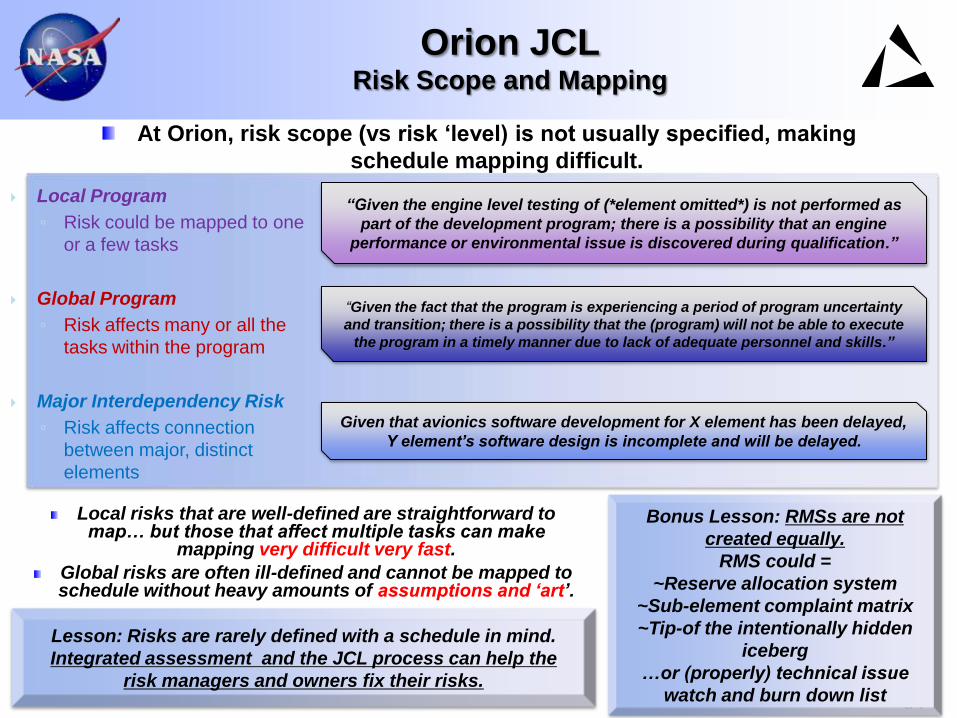
Orion JCL Risk Scope and Mapping
At Orion, risk scope (vs risk ‘level) is not usually specified, making
schedule mapping difficult.
34
Lesson: Risks are rarely defined with a schedule in mind.
Integrated assessment and the JCL process can help the
risk managers and owners fix their risks.
Local Program
◦ Risk could be mapped to one
or a few tasks
Global Program
◦ Risk affects many or all the
tasks within the program
Major Interdependency Risk
◦ Risk affects connection
between major, distinct
elements
“Given the fact that the program is experiencing a period of program uncertainty
and transition; there is a possibility that the (program) will not be able to execute
the program in a timely manner due to lack of adequate personnel and skills.”
“Given the engine level testing of (*element omitted*) is not performed as
part of the development program; there is a possibility that an engine
performance or environmental issue is discovered during qualification.”
Given that avionics software development for X element has been delayed,
Y element’s software design is incomplete and will be delayed.
Local risks that are well-defined are straightforward to map… but those that affect multiple tasks can make
mapping very difficult very fast.
Global risks are often ill-defined and cannot be mapped to schedule without heavy amounts of assumptions and ‘art’.
Bonus Lesson: RMSs are not
created equally.
RMS could =
~Reserve allocation system
~Sub-element complaint matrix
~Tip-of the intentionally hidden
iceberg
…or (properly) technical issue
watch and burn down list
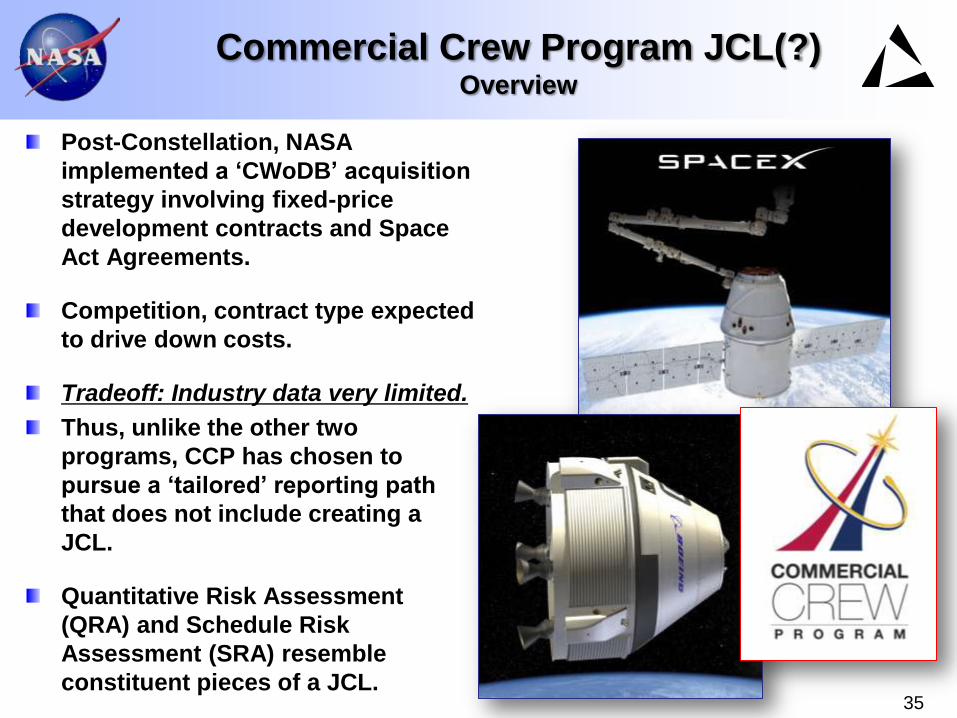
Commercial Crew Program JCL(?) Overview
Post-Constellation, NASA
implemented a ‘CWoDB’ acquisition
strategy involving fixed-price
development contracts and Space
Act Agreements.
Competition, contract type expected
to drive down costs.
Tradeoff: Industry data very limited.
Thus, unlike the other two
programs, CCP has chosen to
pursue a ‘tailored’ reporting path
that does not include creating a
JCL.
Quantitative Risk Assessment
(QRA) and Schedule Risk
Assessment (SRA) resemble
constituent pieces of a JCL. 35
Commercial Crew Program JCL(?) JCL Criticism
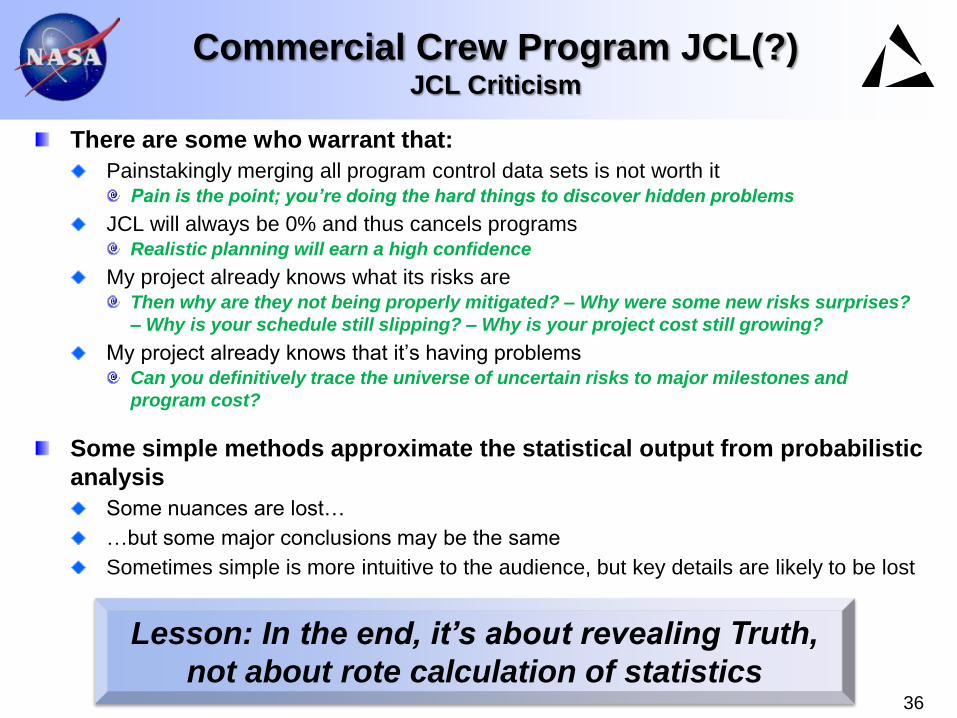
There are some who warrant that:
Painstakingly merging all program control data sets is not worth it Pain is the point; you’re doing the hard things to discover hidden problems
JCL will always be 0% and thus cancels programs Realistic planning will earn a high confidence
My project already knows what its risks are Then why are they not being properly mitigated? – Why were some new risks surprises?
– Why is your schedule still slipping? – Why is your project cost still growing?
My project already knows that it’s having problems Can you definitively trace the universe of uncertain risks to major milestones and
program cost?
Some simple methods approximate the statistical output from probabilistic
analysis
Some nuances are lost…
…but some major conclusions may be the same
Sometimes simple is more intuitive to the audience, but key details are likely to be lost
36
Lesson: In the end, it’s about revealing Truth,
not about rote calculation of statistics
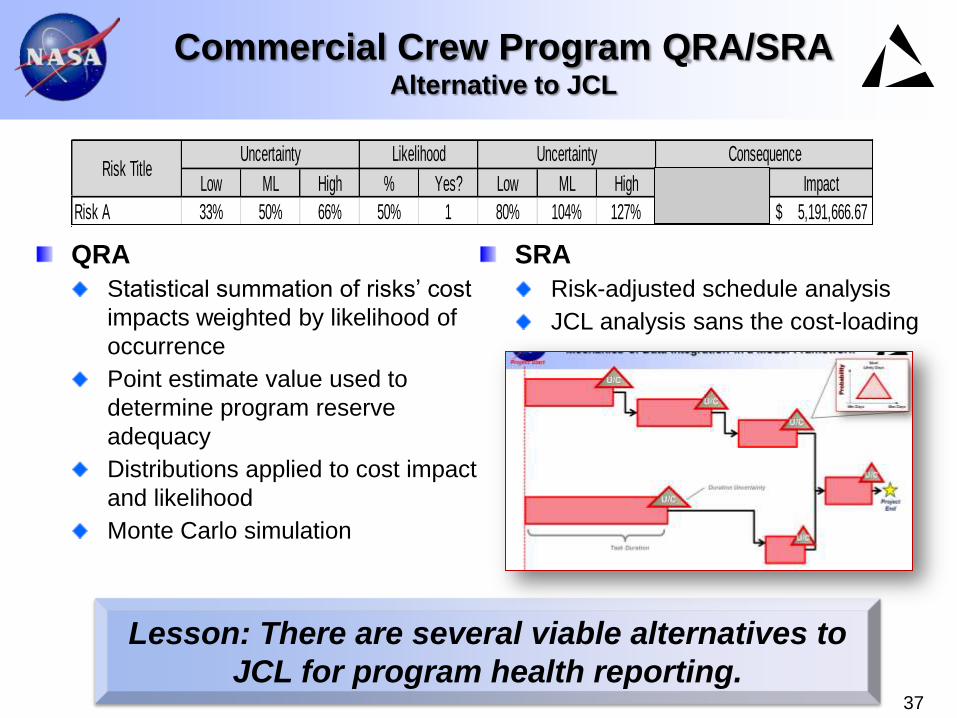
Commercial Crew Program QRA/SRA Alternative to JCL
QRA
Statistical summation of risks’ cost
impacts weighted by likelihood of
occurrence
Point estimate value used to
determine program reserve
adequacy
Distributions applied to cost impact
and likelihood
Monte Carlo simulation
SRA
Risk-adjusted schedule analysis
JCL analysis sans the cost-loading
37
Lesson: There are several viable alternatives to
JCL for program health reporting.
Low ML High % Yes? Low ML High Qualitative Analysis Impact
Risk A 33% 50% 66% 50% 1 80% 104% 127% 5,000,000.00$ 5,191,666.67$ 5,191,666.67$
Actual ImpactRisk TitleUncertainty UncertaintyLikelihood Consequence
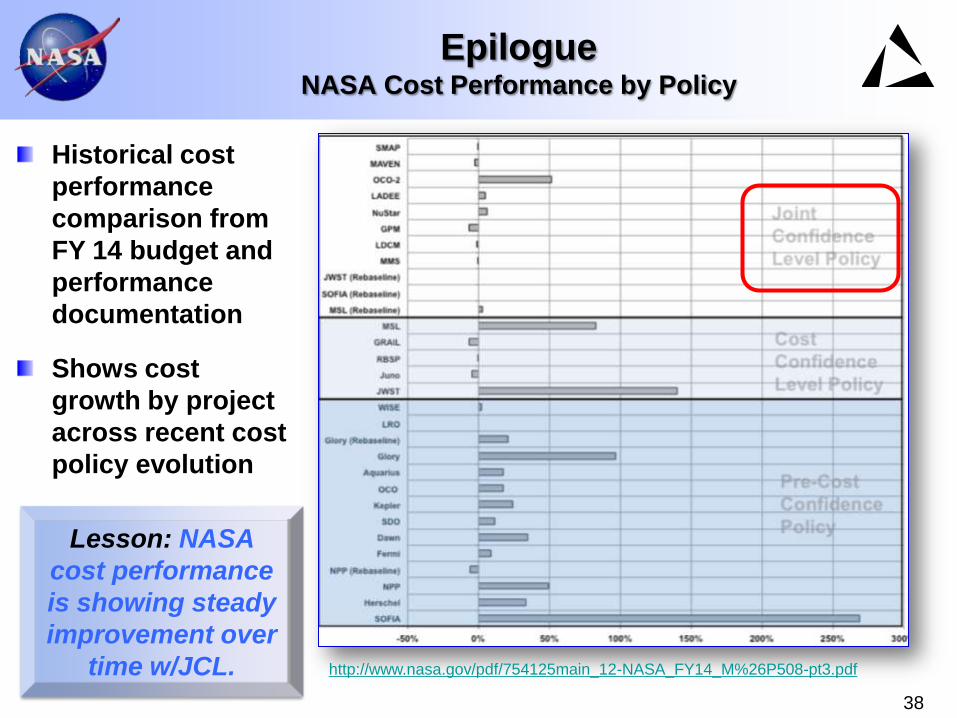
Epilogue NASA Cost Performance by Policy
38
Historical cost
performance
comparison from
FY 14 budget and
performance
documentation
Shows cost
growth by project
across recent cost
policy evolution
http://www.nasa.gov/pdf/754125main_12-NASA_FY14_M%26P508-pt3.pdf
Lesson: NASA
cost performance
is showing steady
improvement over
time w/JCL.

Backup and Resources
39
Backup
and
Resources
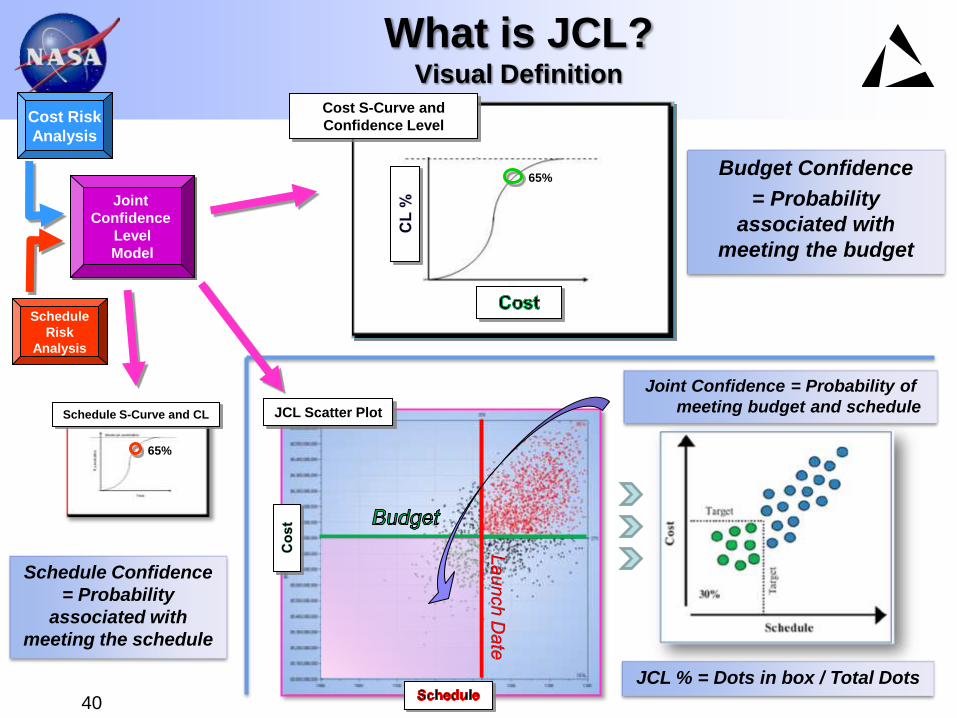
What is JCL? Visual Definition
Joint Confidence = Probability of
meeting budget and schedule
40
Joint
Confidence
Level
Model
65%
Schedule S-Curve and CL
65%
Cost Risk
Analysis
Schedule
Risk
Analysis
JCL Scatter Plot
Budget Confidence
= Probability
associated with
meeting the budget
Schedule Confidence
= Probability
associated with
meeting the schedule
JCL % = Dots in box / Total Dots
Cost S-Curve and
Confidence Level
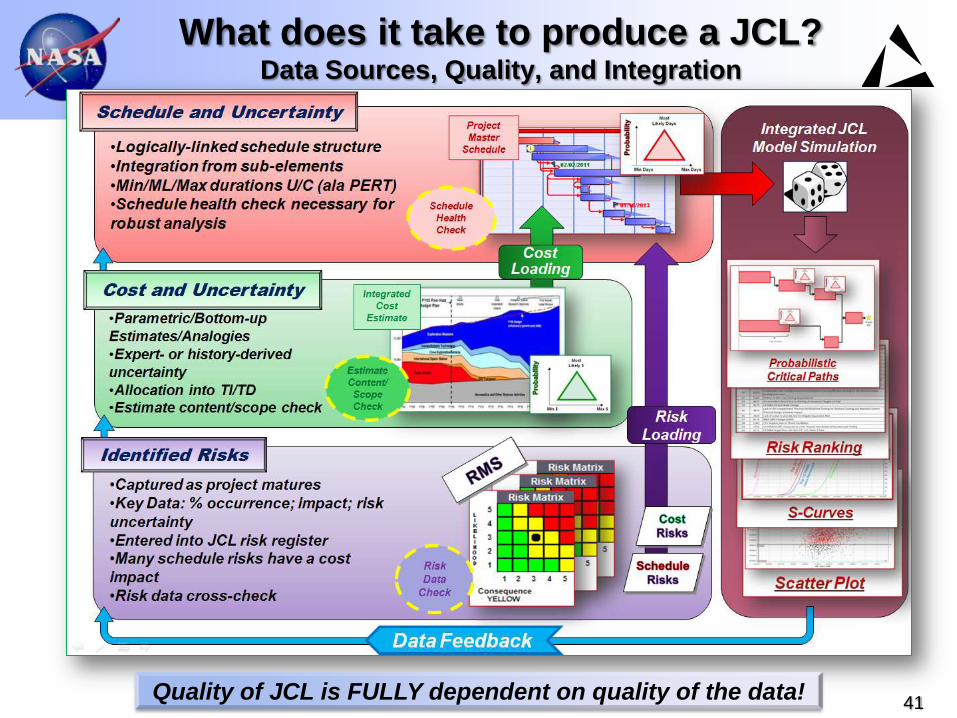
What does it take to produce a JCL? Data Sources, Quality, and Integration
41 Quality of JCL is FULLY dependent on quality of the data!
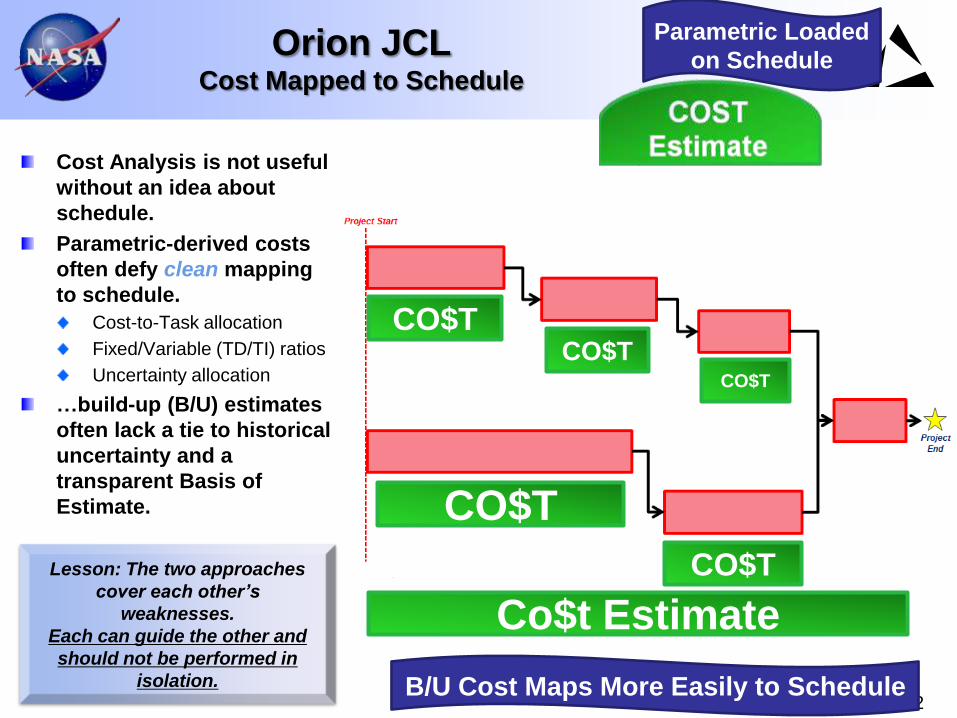
Orion JCL Cost Mapped to Schedule
Cost Analysis is not useful
without an idea about
schedule.
Parametric-derived costs
often defy clean mapping
to schedule.
Cost-to-Task allocation
Fixed/Variable (TD/TI) ratios
Uncertainty allocation
…build-up (B/U) estimates
often lack a tie to historical
uncertainty and a
transparent Basis of
Estimate.
42
Lesson: The two approaches
cover each other’s
weaknesses.
Each can guide the other and
should not be performed in
isolation.
CO$T
CO$T
CO$T
CO$T CO$T
Co$t Estimate
Parametric Loaded
on Schedule
B/U Cost Maps More Easily to Schedule

HQ JCL
Brochure
43

44
45

NASA JCL Policy
46
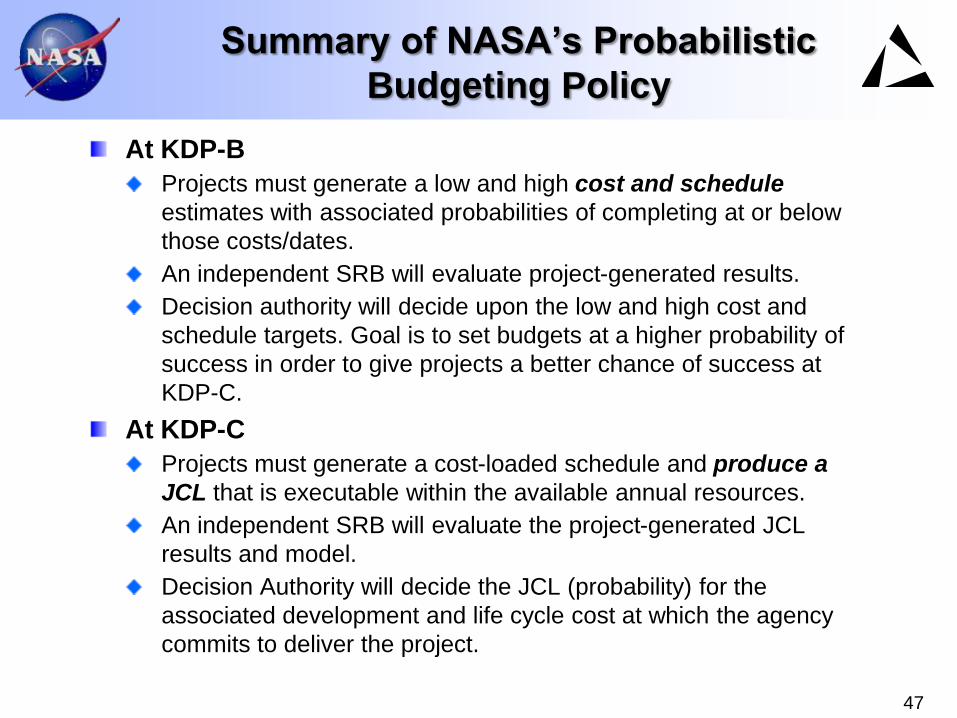
Summary of NASA’s Probabilistic
Budgeting Policy
At KDP-B
Projects must generate a low and high cost and schedule
estimates with associated probabilities of completing at or below
those costs/dates.
An independent SRB will evaluate project-generated results.
Decision authority will decide upon the low and high cost and
schedule targets. Goal is to set budgets at a higher probability of
success in order to give projects a better chance of success at
KDP-C.
At KDP-C
Projects must generate a cost-loaded schedule and produce a
JCL that is executable within the available annual resources.
An independent SRB will evaluate the project-generated JCL
results and model.
Decision Authority will decide the JCL (probability) for the
associated development and life cycle cost at which the agency
commits to deliver the project.
47