Embed Size (px)
Citation preview
NASA TECHNICAL NOTE
cr)
0 c-
-? n I I-
4 m 4 z
NASA TN D-6013
liom COPY A m
K I R ! I " D
THERMAL DECOMPOSITION A N D EXPLOSION OF AMMONIUM PERCHLORATE AND AMMONIUM PERCHLORATE PROPELLANT UP TO 5 0 KILOBARS (5.0X10' N/m2)
by Huns R. Voelkl
Lewis Research Center Cleueland, Ohio 44135
N A T I O N A L AERONAUTICS A N D SPACE A D M I N I S T R A T I O N W A S H I N G T O N , D. C. SEPTEMBER 1970
https://ntrs.nasa.gov/search.jsp?R=19700029187 2018-06-02T07:37:37+00:00Z
TECH LIBRARY KAFB, NM
~- - _ 19. Security Classif. (of this report)
Unclassified -~
- ... __ 1. Report No. 2. Government Accession No.
NASA TN D-6013 - -. .
4. Title and Subtitle THERMAL DECOMPOSITION AND EXPLOSION OF AMMONIUM PERCHLORATE AND AMMONIUM PERCHLORATE PROPELLANT UP TO 50 KILOBARS (5. O X l O 9 N/m2)
20. Security Classif. (of this page)
Unclassified
7. Author(s)
Hans R. Voelkl
9. Performing Organization Name- and Address
Lewis Research Center National Aeronautics and Space Administration Cleveland, Ohio 44135
National Aeronautics and Space Administration Washington, D. C. 20546
12. Sponsoring Agency Name and Address
- .
I 15. Supplementary Notes
- 0132bb4 3. Recipient's Catalog IVO.
5. Report Date
6. Performing Organization Code
September 1970
8. Performing Organization Report No.
E-4568 10. Work Unit No.
129-03 11. Contract or Grant No.
13. Type of Report and Period Covered
Technical Note - 14. Sponsoring Agency Code
L - - . . - - .
16. Abstract
The r a t e s of thermal decomposition of ammonium perchlorate and an ammonium perchlorate solid propellant at 15, 25, and 50 kilobars (1.5X10 , 2.5X10 , and 5 . 0 X l O N/m ) pres su re were studied in a cubic anvil p re s s . The data were cor re la ted by f i r s t o rde r ra te equations to obtain the tempera ture variation of the specific reaction r a t e s and the apparent activation energies. (3 . OXlO9 N/m2). E lec t r ica l res i s tance measurements of this salt at high p r e s s u r e were a l so made.
9 9 9 2
Explosion l imi t s of pu re ammonium perchlorate a r e included to 30 kilobars
Thermal decomposition Activation energy Ammonium perchlorate Explosion l imits Kilobar Rate equation
.- .~
18. Distribution Statement
Unclassified - unlimited
$3.00
'For sale by the Clearinghouse for Federal Scientific and Technical Information Springfield, Virginia 22151
THERMAL DECOMPOSITION AND EXPLOSION OF AMMONIUM PERCHLORATE AND
AMMONIUM PERCHLORATE PROPELLANT U P TO 50 KILOBARS (5. Ox109 N/m2)
by Hans R. Voelkl
Lewis Research Center
SUMMARY
Thermal decomposition of ammonium perchlorate (AP) and an AP based propellant was studied at high pressure in a cubic anvil press . Preexplosion kinetics of the ther- mal decomposition of AP and propellant were determined between 266' and 337' C at 15, 25, and 50 kilobars (1. 5x10⁹, 2. 5x10⁹, and 5.0XlO N/m ). Firs t -order kinetics were observed in all cases. Arrhenius plots of reaction-rate constants at different decomposi- tion temperatures allowed the calculation of activation energies. For AI? the energies ranged from 40.4 kilocalories per mole ( 1 . 6 9 ~ 1 0 J/mole) at 15 kilobars ( 1 . 5 ~ 1 0 N/m ) to 57.2 kilocalories per mole (2. 39x105 J/mole) at 50 kilobars ( 5 . 0 ~ 1 0 N/m ). Activa-
5 tion energies for propellant were calculated to be 30.3 kilocalories per mole (1.27X10 J/mole) at 15 kilobars (1.5~10' N/m2) and 48.5 kilocalories per mole ( 2 . 0 3 ~ 1 0 ~ J/mole) at 50 kilobars (5.0X10⁹ N/m2).
Decompositions of AP were explosive a t a heating rate of 10' C per minute. Explo- sion limit curves (T against P) showed explosion temperatures increasing with increas-
9 2 ing pressure up to 30 kilobars (3.0xlO N/m ). Addition of small amounts of aluminum and copper chromite powders to AP and propellant reduced explosion temperatures f rom 10' to 60' C depending upon the pressure.
Electrical resistance of AP pellets at high pressure with temperature variation showed no discontinuities. This suggested that no phase transformations occurred.
9 2
5 9 2 9 2
INTRODUCTION
There is a great technological interest in ammonium perchlorate (AP) because of its extensive use in solid propellant rockets. In this work AP is subjected to pressures and temperatures where many materials undergo phase transformations. Perhaps the best known case of a phase transformation is the formation of diamond from graphite
(ref. 1). A phase change in AI? would give a mater ia l with drastically different proper- ties, which, in turn, might change the flame characterist ics and burning rate.
and reduced pressure. Studies of this material show severa l unique features. Bircumshaw and Newman (ref. 2) found that below 300' C the decomposition does not go to completion, but stops after about 30 percent of the salt has decomposed, leaving a residue with the same chemical composition. The kinetics and mechanism of decompo- sition a r e temperature dependent (ref. 3). Galwey and Jacobs (ref. 4) suggested that below 300' C an electron transfer mechanism involving radical formation is responsible for the decomposition. Galwey and Jacobs (ref. 5) also found that temperatures above 350' C cause the decomposition to go to completion. At these higher temperatures the reaction can be explained by either a proton t ransfer mechanism o r rupture of chlorine- oxygen bonds. Above 440' C the decomposition is explosive (ref. 6). Deflagration char- acterist ics of pure AP have been studied by means of a closed-bomb strand burning tech- nique at pressures f rom 1000 to 23 000 psi (6.895XlO to 1. 586X108 N/m2) (ref. 7).
This investigation deals with the influence of pressure on the thermal decomposition of AP and an AP propellant in a multianvil high pressure apparatus. Preexplosion ki- netics of AP and propellant a r e determined between 266' and 337' C at 15, 25, and 50 kilobars (1. 5x1O9, 2.5xlO , and 5.0xlO N/m ). calculated from first-order equations. These data permit calculation of the energy of activation for the decompositions. compressed pellets of the salt at a slow, constant rate at fixed pressure. Data a r e given for the effect of finely divided aluminum powder and copper chromite additives on explosion limits. In addition, some data on the electrical resistance of AP at high pres- su re were obtained.
The thermal decomposition of AP has been studied in great detail at atmospheric
6
9 9 2 Specific reaction-rate constants a r e
Explosion limits of AP a r e determined by heating
EXPERIMENTAL MATERIALS AND PROCEDURE
Materia I s
Ordnance grade AP (99.5 percent minimum purity), twice recrystallized from water, finely ground was used in this study. calibration experiments, were high purity elements (>99.999 percent). Pyrophyllite (A1 0 . 4Si02. H20) is a naturally occurring substance and w a s used as received. The propellant used in this work contained 80 percent by weight polybutadiene-acrylic acid and 20 percent by weight AP. average particle diameter) and 80 percent coarse (88-y m average particle diameter).
Bismuth, barium, and thallium, in wire form for
2 3
The AP w a s a mixture of 20 percent fine material ( l l - y m
2
Apparatus
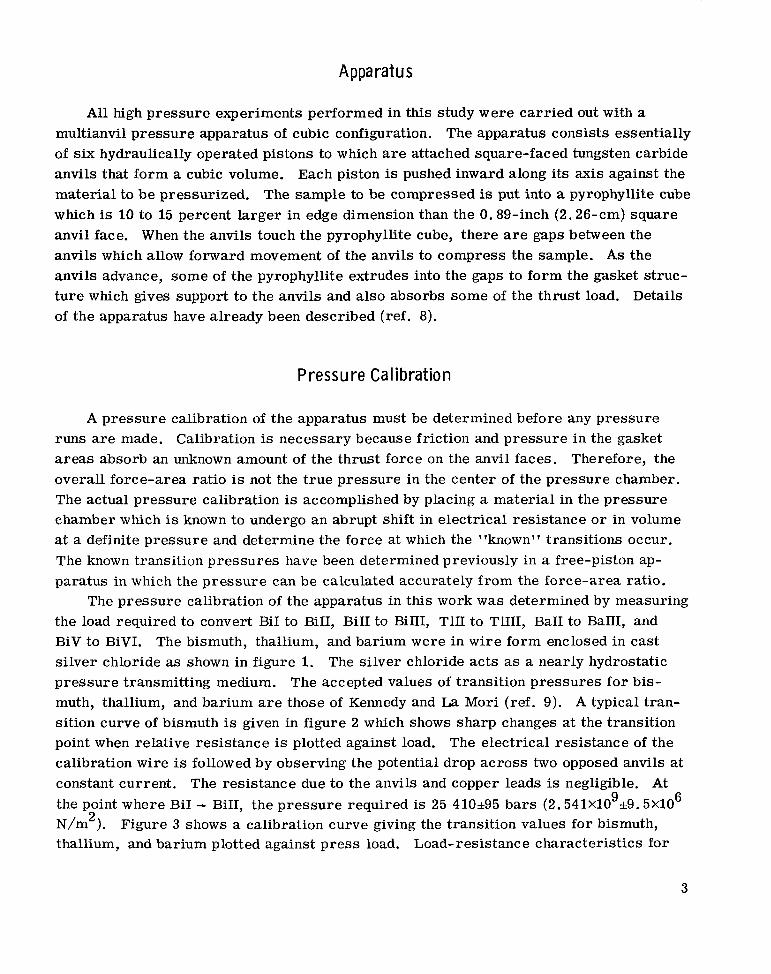
All high pressure experiments performed in this study were carr ied out with a multianvil pressure apparatus of cubic configuration. The apparatus consists essentially of six hydraulically operated pistons to which are attached square-faced tungsten carbide anvils that form a cubic volume. Each piston is pushed inward along its axis against the material to be pressurized. The sample to be compressed is put into a pyrophyllite cube which is 10 to 15 percent larger in edge dimension than the 0.89-inch (2.26-cm) square anvil face. When the anvils touch the pyrophyllite cube, there are gaps between the anvils which allow forward movement of the anvils to compress the sample. As the anvils advance, some of the pyrophyllite extrudes into the gaps to form the gasket struc- tu re which gives support to the anvils and also absorbs some of the thrust load. Details of the apparatus have already been described (ref. 8).
P ress u r e Ca I i b rat io n
A pressure calibration of the apparatus must be determined before any pressure runs are made. Calibration is necessary because friction and pressure in the gasket a r eas absorb an unknown amount of the thrust force on the anvil faces. Therefore, the overall force-area ratio is not the t rue pressure in the center of the pressure chamber. The actual pressure calibration is accomplished by placing a material in the pressure chamber which is known to undergo an abrupt shift in electrical resistance o r in volume at a definite pressure and determine the force at which the "known" transitions occur. The known transition pressures have been determined previously in a free-piston ap- paratus in which the pressure can be calculated accurately from the force-area ratio.
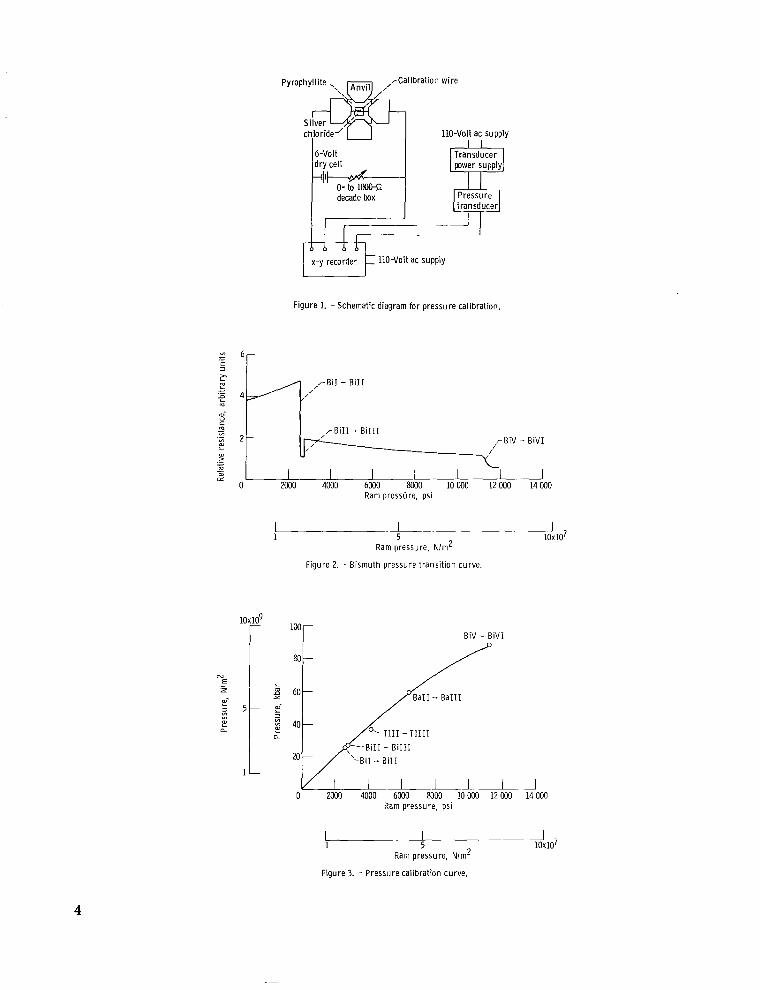
the load required to convert BiI to BiII, BiII to BiIII, TlII to TlIII, BaII to BaIII, and BiV to BiVI. The bismuth, thallium, and barium were in wire form enclosed in cast si lver chloride as shown in figure 1. pressure transmitting medium. The accepted values of transition pressures for bis- muth, thallium, and barium are those of Kennedy and La Mori (ref. 9). A typical tran- sition curve of bismuth is given in figure 2 which shows sharp changes at the transition point when relative resistance is plotted against load. The electrical resistance of the calibration wire is followed by observing the potential drop across two opposed anvils at constant current. The resistance due to the anvils and copper leads is negligible. At
9 6 the point where BiI - BiII, the pressure required is 25 410k95 ba r s (2.541XlO zt9.5X10 N/m ). thallium, and barium plotted against p ress load. Load-resistance characterist ics for
The pressure calibration of the apparatus in this work was determined by measuring
The silver chloride acts as a nearly hydrostatic
2 Figure 3 shows a calibration curve giving the transition values for bismuth,
3
rCalibration wi re
power supply
decade box
Figure 1. - Schematic diagram for pressure calibration.
r B i I - B i I I 4 ,/’
T B i I I - B i I I I 2 - r BiV
I I I 1 I 0 2000 4000 6000 8wO 10000 12000
- B iV I
I 14 000
Ram pressure, psi
I L - ’ 1 5 10x107
Ram pressure, N/m2
Figure 2. - Bismuth pressure transition curve.
loor BiV - BiVI
80-
60 -
l - - U U 0 2000 4000 6000 8000 10 OOO 12 000
I 1 14 000
Ram pressure, psi
I 10?107 1 5
Ram pressure, N/m2
Figure 3. - Pressure calibration curve.
4
the calibration w i r e s were observed on an X-Y recorder, the load signal being derived directly from a calibrated standard pressure cell and resistance from the potential drop across the wire at constant current.
P reexplosio n K i net ics
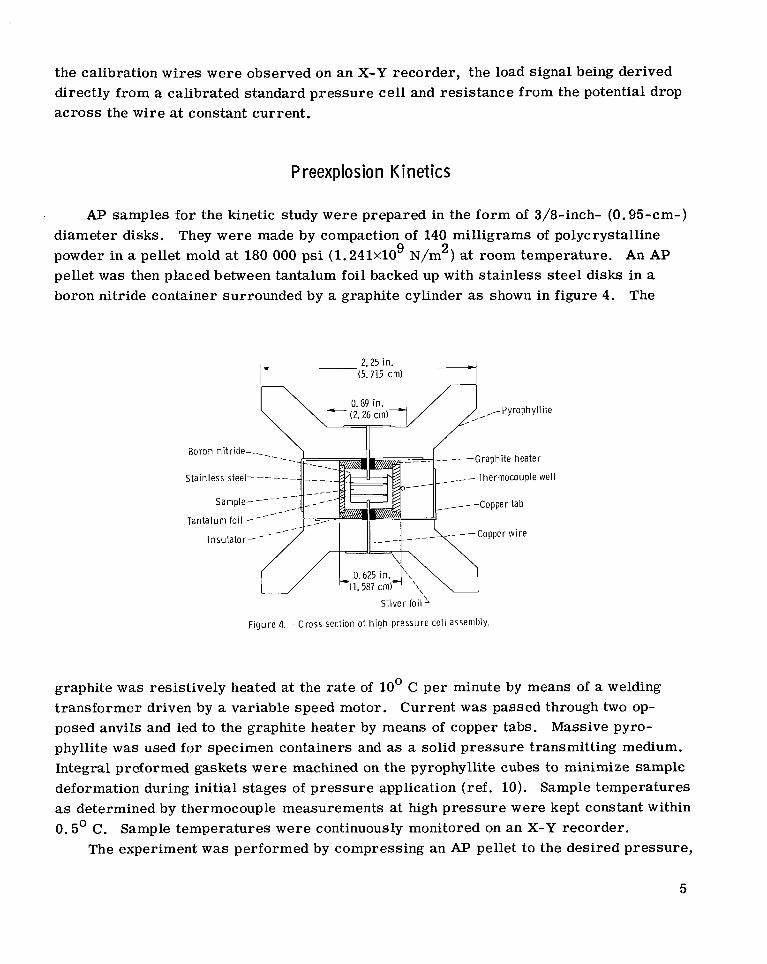
AP samples for the kinetic study were prepared in the form of 3/8-inch- (0.95-cm-) diameter disks. They were made by compaction of 140 milligrams of polycrystalline
9 2 powder in a pellet mold at 180 000 psi (1 .241~10 N/m ) at room temperature. An AP pellet was then placed between tantalum foil backed up with stainless s teel disks in a boron nitride container surrounded by a graphite cylinder as shown in figure 4. The
I_ 2.25 in.
(5.715 cm)
-- - Boron nitride-,
S ta in less steel------
/---
Tanta lum fo i l -- I n s u l a t o r - -
F i g u r e 4. - C r o s s sec
_ - _ - Graph i te heater
_ - _ - T h e r m o c o u p l e wel l
------Copper tab
0.625 in. (1.587 cm) ,
S i l v e r foil'
o n of h i g h pressure c e l l assenibly.
graphite w a s resistively heated at the ra te of 10' C per minute by means of a welding transformer driven by a variable speed motor. Current was passed through two op- posed anvils and led to the graphite heater by means of copper tabs. Massive pyro- phyllite was used for specimen containers and as a solid pressure transmitting medium. Integral preformed gaskets were machined on the pyrophyllite cubes to minimize sample deformation during initial stages of pressure application (ref. 10). Sample temperatures as determined by thermocouple measurements at high pressure w e r e kept constant within 0.5' C. Sample temperatures were continuously monitored on an X-Y recorder.
The experiment was performed by compressing an AP pellet to the desired pressure,
5
raising the temperature to the desired level, and holding these conditions for a pre- scribed time. Then temperature and pressure were reduced to ambient conditions and the sample weighed to determine weight loss. The resulting weight loss records were analyzed to determine the dependence of decomposed AP upon time.
Explosion Limits
In these experiments the weight of AP was reproduced in different runs to 140A milligrams. Samples were confined between 3-mil-thick tantalum foil. The AP pellets were brought to the desired pressure at room temperature and then heated at the rate of 10' C per minute. mined by recording the temperature at which a detonation was clearly heard during the heating of the sample. As a result of the explosions, pyrophyllite was ejected from the gasket areas of the container with considerable force. those at the higher pressures were of sufficient violence to damage or destroy the car- bide anvils. For this reason explosion limits were determined only to 30 kilobars (3. OXlO9 N/m2).
The temperature of explosion at the various pressures was deter-
Some explosions, particularly
Elect r ica I Re si sta nce
Resistance measurements were made with an electrometer equipped with power supply and shunt. Contact with the AP pellet was made with tantalum foil backed up with stainless s teel disks. The circuit to the exterior of the pyrophyllite cube was completed with copper wire and silver foil. Resistance was measured through two opposed anvils. The resistance of the electrical circuit excluding the AP pellet was negligible. Temper- a ture w a s measured with Chromel/Alumel thermocouples placed near the perchlorate sample as shown in figure 4. The output of the electrometer and thermocouple were fed into X-Y recorders to plot the changes in resistance with temperature.
RESULTS AND DISCUSSION
P reexplosion Kinetics (Ammonium Perch lorate)
Rate data in the temperature range 282' to 337' C were obtained for the thermal 9 decomposition of AP at 15, 25, and 50 kilobars (1. 5x10⁹, 2 . 5 ~ 1 0 ' ~ and 5.0XlO N/m2).
A first-order reaction for the disappearance of the salt was assumed since plots of the logarithm of the mole fraction of remaining AP against t ime produced approximately
6
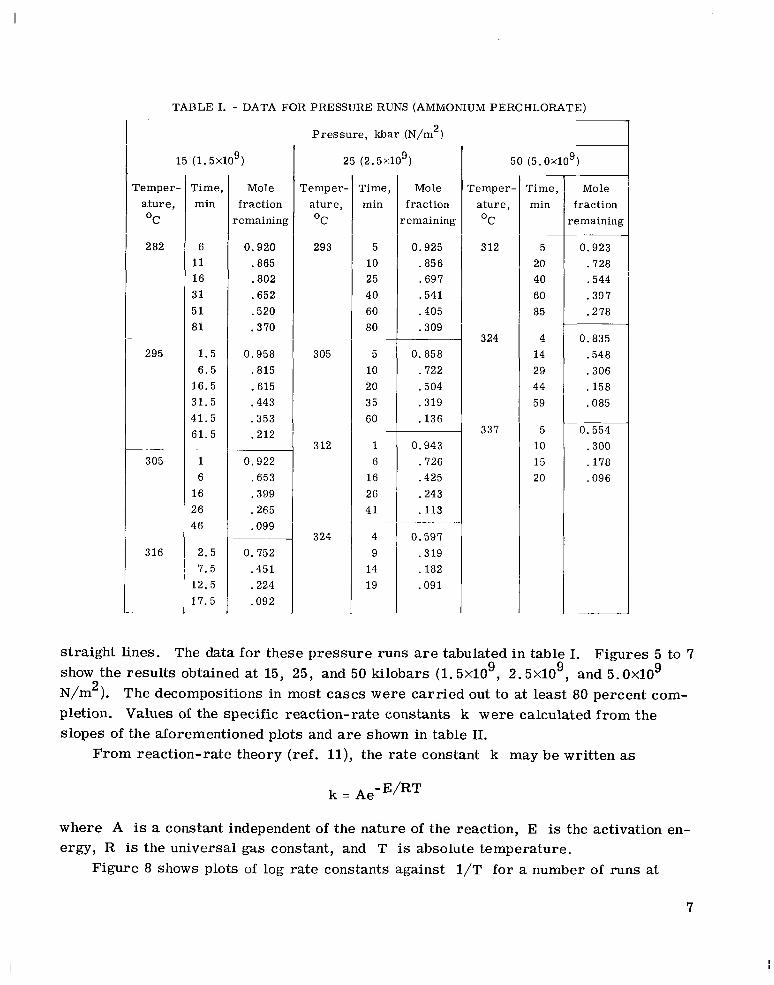
TABLE I. - DATA FOR PRESSURE RUNS (AMMONIUM PERCHLORATE)
15 ( 1 . 5 ~ 1 0 ~ )
smper- ature, O C
2 82
295
305
316
Time, min
6 11 16 3 1 5 1 a i
1.5 6.5
16.5 31.5 41.5 61.5
1 6
16 26 46
2.5 7.5
12.5 17.5
Mole fraction
remaining
0.920 .a65 .802 .652 .520 .370
0.958 .815 .615 .443 .353 .212
0.922 .653 .399 .265 .099
0.752 .451 .224 .092
2 Pressure, kbar (N/m )
25 (2.5~10' )
Temper- ature, O C
293
305
3 12
3 24
Time, min
5 10 25 40 60 80
5 10 20 35 60
1 6
16 26 4 1
4 9
14 19
~
~
-
Mole fraction emaining
0.925 .856 .697 .541 .405 .309
0.858 .722 .504 .319 . 136
0.943 .726 .425 .243 .113
0.597 .319 .182 .091
Temper- ature, OC
3 12
324
337
50 ( 5 . 0 ~ 1 0 ~ ) ~
Time, min
~
5 20 40 60 a5
4 14 29 44 59
5 10 15 20
~
Mole fraction -emaining
0.923 .728 ,544 .397 .278
0. a35 .548 .306 . 158 .085
0.554 .300 .178 .096
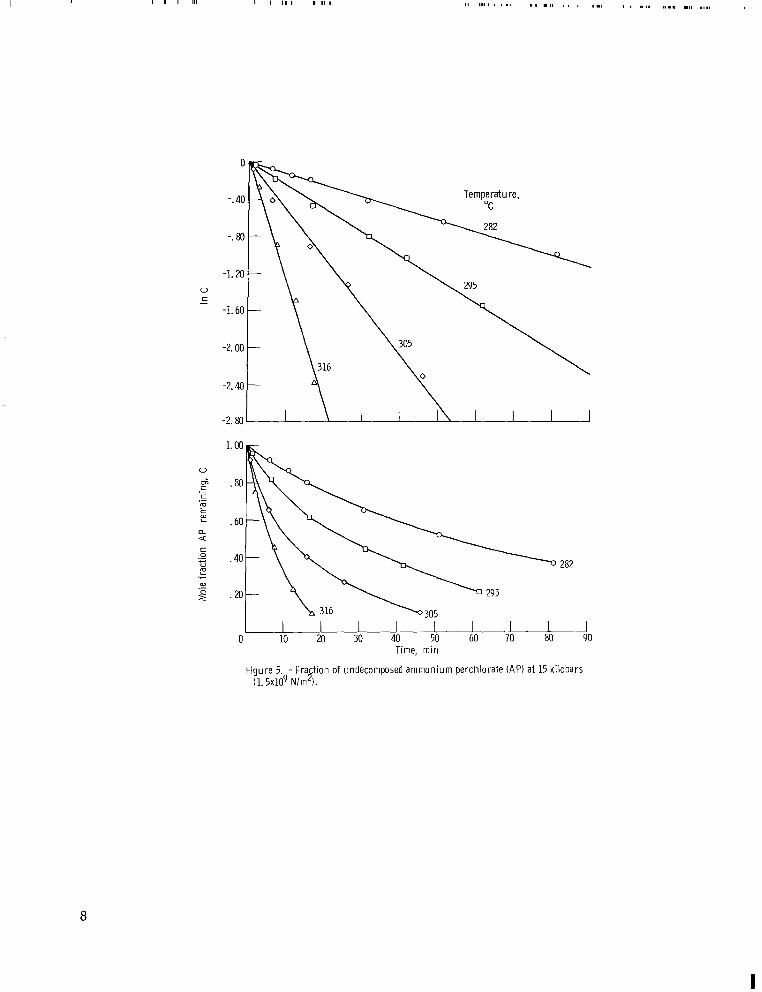
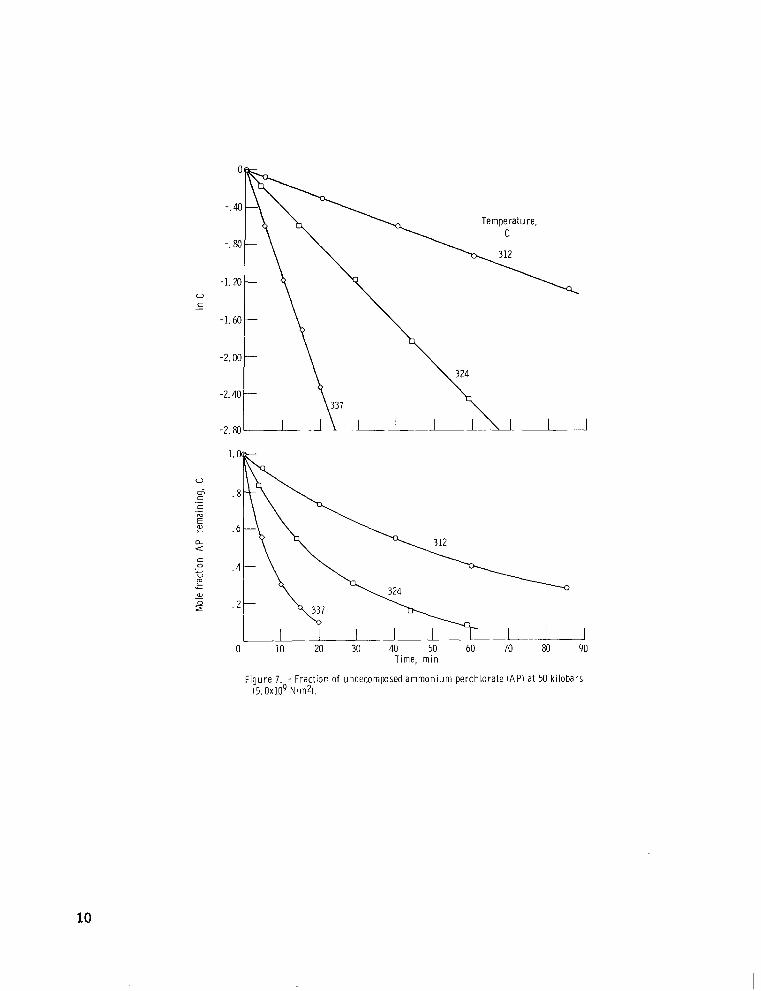
straight lines. The data for these pressure runs are tabulated in table I. Figures 5 to 7
N/m ). pletion. Values of the specific reaction-rate constants k were calculated from the slopes of the aforementioned plots and are shown in table 11.
show the results obtained at 15, 25, and 50 kilobars (1.5X10 9 , 2. 5x10⁹, and 5.0xlO 9 2 The decompositions in most cases were carr ied out to at least 80 percent com-
From reaction-rate theory (ref. ll), the ra te constant k may be written as
-E/RT k = Ae
where A is a constant independent of the nature of the reaction, E is the activation en- ergy, R is the universal gas constant, and T is absolute temperature.
Figure 8 shows plots of log rate constants against 1/T for a number of runs at
7
I
I I I I I 111
0 S -
0
-. 40
-. 80
-1.20 0 S -
-1.60
-2.00
-2.40
-2. 80
0
a 6
Time, mi r i
F igure 5. - Frac t ion of undecomposed a m m o n i u m perch lo ra te (AP) a t 15 k i lobars (1. 5x10⁹ N/m2).
a
I

-2. 80 I k4
a 6
F i g u r e 6. - Frac t ion of undecomposed a m m o n i u m perch lo ra te ( A P ) at 25 k i lobars (2 . 5x10⁹ Nlm2).
9
Temperature,
0 c -
-2.40-
0 10 20 30 40 50 60 70 80 90 Time, m i n
F igure 7. - Frac t ion of undecomposed a m m o n i u m perch lo ra te ( A P I a t 50 k i lobars ( 5 . 0 ~ 1 0 ~ N/mZl.
10

c
Temper- ature, OC
3 12
337 3 24
TABLE 11. - SPECIFIC REACTION RATES FOR DECOMPOSITION
OF AMMONIUM PERCHLORATE
Average reaction- ra te constant,
k, s ec
2 . 5 4 ~ 1 0 - ~
1 . 9 2 ~ 1 0 - ~
-1
7 . 0 1 ~ 1 0 - ~
Temper- ature, OC
282 295 305 3 16
Temper- ature, OC
293 305 312 3 24
15 (1.5~10')
Average reaction- rate constant,
k, sec-l
2 . 4 6 ~ 1 0 - ~ 5 . 5 0 ~ 1 0 - ~ 8 . 8 0 ~ 1 0 - ~ 2 . 1 0 ~ 1 0 - ~
I
-3.70 I I 1.62 1.64
kverage reaction- ra te constant,
k, sec-l
2 . 1 2 x 1 0 - ~
1. O O X ~ O - ~
4 . 5 3 ~ 1 0 - ~
1 . 7 7 ~ 1 0 - ~
I
I I
i -2.90
Y - 0 - -3.10
-3.30
-3.50
- A m m o n i u m perch lo ra te - Propel lant
Reciprocal decomposit ion temperature, UT, K
F igu re 8. - A r r h e n i u s plots o f t h e r m a l decomposit ions at h i g h pressures.
11
I
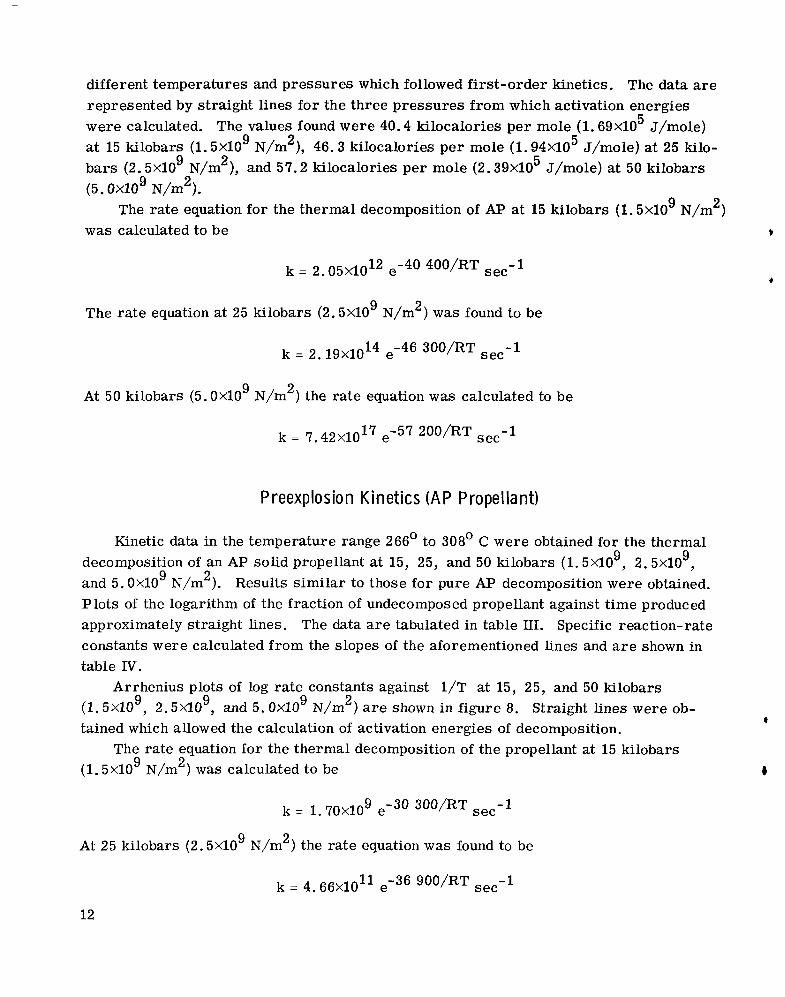
different temperatures and pressures which followed first-order kinetics. The data are represented by straight lines for the three pressures from which activation energies were calculated. The values found were 40.4 kilocalories per mole (1 .69~10 J/mole) at 15 kilobars ( 1 . 5 ~ 1 0 N/m2), 46.3 kilocalories pe r mole ( 1 . 9 4 ~ 1 0 ~ J/moIe) at 25 kilo-
9 2 5 bars ( 2 . 5 ~ 1 0 N/m ), and 57.2 kilocalories per mole (2.39XlO J/mole) at 50 kilobars
5 9
( 5 . 0 ~ 1 0 ~ ~ / m ~ ) . 9 The rate equation for the thermal decomposition of AI? at 15 kilobars ( 1 . 5 ~ 1 0 N/m2)
was calculated to be c
k = 2.05X10 12 ,-40 400/RT sec-l
9 2 The ra te equation at 25 kilobars (2.5X10 N/m ) was found to be
k = 2.19X10 14 ,-46 300/RT sec-l
9 2 At 50 kilobars (5.0XlO N/m ) the rate equation was calculated
k = 7.42X10 17 ,-57 200/RT sec-l
P reexplosio n Kinetics (A P P rope1 lant)
to be
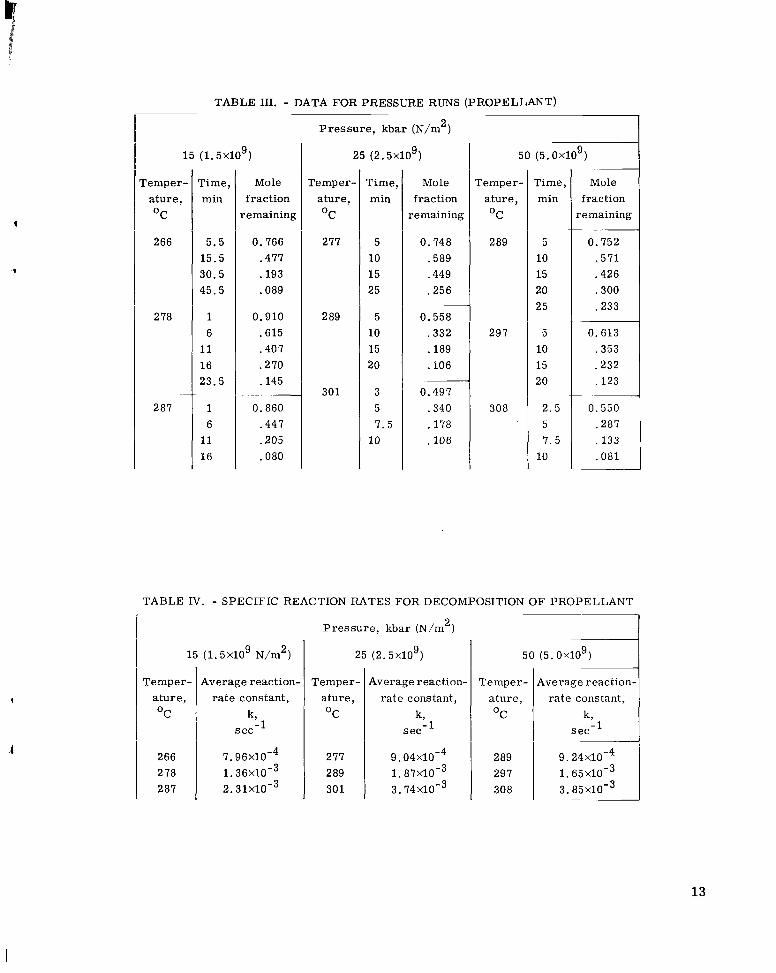
Kinetic data in the temperature range 266’ to 308’ C were obtained for the thermal decomposition of an AP solid propellant at 15, 25, and 50 kilobars (1.5X10 , 2 . 5 ~ 1 0 , and 5.0xlO N/m ). Results similar to those for pure AP decomposition were obtained. Plots of the logarithm of the fraction of undecomposed propellant against time produced approximately straight lines. The data a r e tabulated in table III. Specific reaction-rate constants were calculated f rom the slopes of the aforementioned lines and a r e shown in table IV.
( 1 . 5 ~ 1 0 , 2.5xlO , and 5.0XlO N/m ) are shown in figure 8. Straight lines were ob- tained which allowed the calculation of activation energies of decomposition.
( 1 . 5 ~ 1 0 N/m ) was calculated to be
9 9 9 2
Arrhenius plots of log rate constants against 1/T at 15, 25, and 50 kilobars 9 9 9 2
The rate equation for the thermal decomposition of the propellant at 15 kilobars 9 2
k = 1 . 7 0 ~ 1 0 9 e -30 300/RT sec-l
9 2 At 25 kilobars (2 .5~10 N/m ) the ra te equation was found to be
11 ,-xi ~ O O / R T sec-i k = 4.66X10
12
ature, OC
rate constant,
sec- l k,
TABLE 111. - DATA FOR PRESSURE RUNS (PROPELLANT)
2 Pressure, kbar (N/m )
25 (2.5~10’) 15 ( 1 . 5 ~ 1 0 ~ )
Temper- ature, O C
266
2 78
~~
287
remper- ature, O C
277
2 89
301
Time, min
5 10
20 25
5 10 15 20
15
2.5 5 7.5
i o
r ime, min
5.5 15.5 30.5 45.5
1 6
11 16 23.5
Time, min
5 10 15 25
5 10 15 20
3 5 7.5 10
remper- ature, OC
2 89
297
308
Mole fraction
remaining
0.748 .589 .449 .256
Mole fraction
:e maining
0.766 .477 .193 .089
0.910 .615 .407 .270 .145
0.860 .447 .205 .080
Mole fraction
remaining
0.752 . 5 7 1 .426 .300 .233
0.558 .332 ,189 . €06
0.613 .353 .232 .123
0.497 .340 .178 . 106
1 6
11 16
0.550 .287 , 1 3 3 . 0 8 1
TABLE IV. - SPECIFIC REACTION RATES FOR DECOMPOSITION OF PROPELLANT
2 Pressure, kbar (N/m )
25 (2.5~10’ )
Temper- I Average reaction-
1 15 ( 1 . 5 ~ 1 0 ~ N/m2) 50 ( 5 . 0 ~ 1 0 ~ )
Temper- ature, OC
266 2 78 287
Average reaction- ra te constant,
k, sec -1
7 . 9 6 ~ 1 0 - ~ 1 . 3 6 ~ 1 0 - ~ 2 . 3 1 ~ 1 0 - ~
ature, rate constant, OC
277 2 89 301
289 297 308
13
9 2 At 50 kilobars (5.0xlO N/m ) the ra te equation was calculated to be
15 ,-48 500/RT sec-l k = 8.05X10
Figure 8 shows that the effect of increasing pressure is to reduce the rate of ther- mal decomposition. F o r an increase in applied pressure it is necessary to use a higher temperature in order to obtain a decomposition rate comparable to one at a lower tem- perature. A decrease in reaction ra te with increasing pressure may be expected on the basis of Le Chatelier's principle. Since the decomposition of AP yields gaseous prod- ucts occupying a greater volume than the start ing material, the application of external pressure would favor retention of reactant, that is, retard the decomposition.
thermal decomposition of explosives. Increasing pressure altered the rate of decom- position; in most cases a decrease in rate was observed. Bridgman (ref. 14) studied the effect of high mechanical s t r e s s up to 100 000 atmospheres on solid explosives. He found that a combination of high temperature with high stress was needed to produce an explosion. In this work, pressures up to 80 kilobars (8.0X10 N/m ) failed to produce explosions o r any decomposition in AP at room temperature.
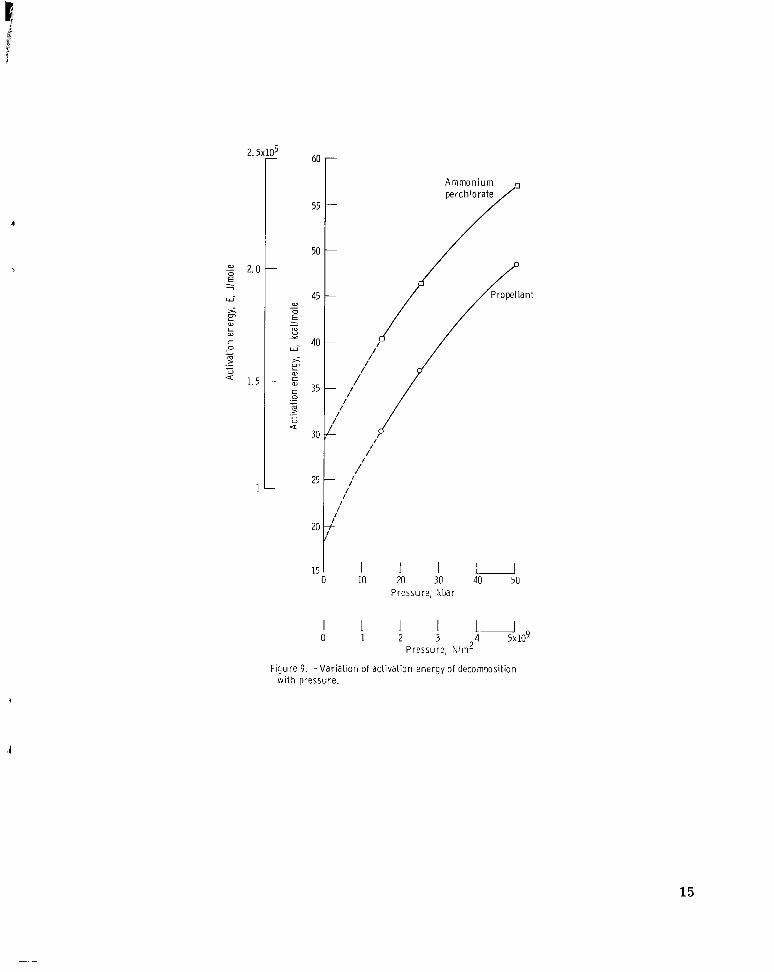
15, 25, and 50 kilobars (1.5X10 , 2. 5x1o9, and 5.0XlO N/m ) is shown in figure 9. The energy bar r ie r for decomposition increases with increasing pressure. Extrapola- tion of the A P curve back to atmospheric pressure gives an activation energy of 29 to 30 kilocalories per mole (1.21XlO to 1.255XlO J/mole). This value is in very good agreement with the results obtained by Galwey and Jacobs (ref. 3) for the decomposition of AI? pellets at 1 atmosphere (28 to 31 kcal/mole o r 1.17 to 1 .30 J/mole). Similar values were obtained by Bircumshaw and Newman (ref. 2). It should be pointed out that the activation energies calculated at atmospheric pressure were derived from different kinetic equations. Those workers used the Prout-Tompkins (ref. 15) and Avrami- Erofe'ev equations (refs. 16 and 17). The data for the decompositions of the present study were fitted to the Arrhenius equation. The data did not f i t either the Prout- Tompkins o r the Avrami-Erofe'ev equations.
8
d
Other workers (refs. 12 and 13) have studied the effect of high pressure on the
9 2
The variation of activation energy for the decomposition of AP and AP propellant at 9 9 2
5 5
Explosion Limits
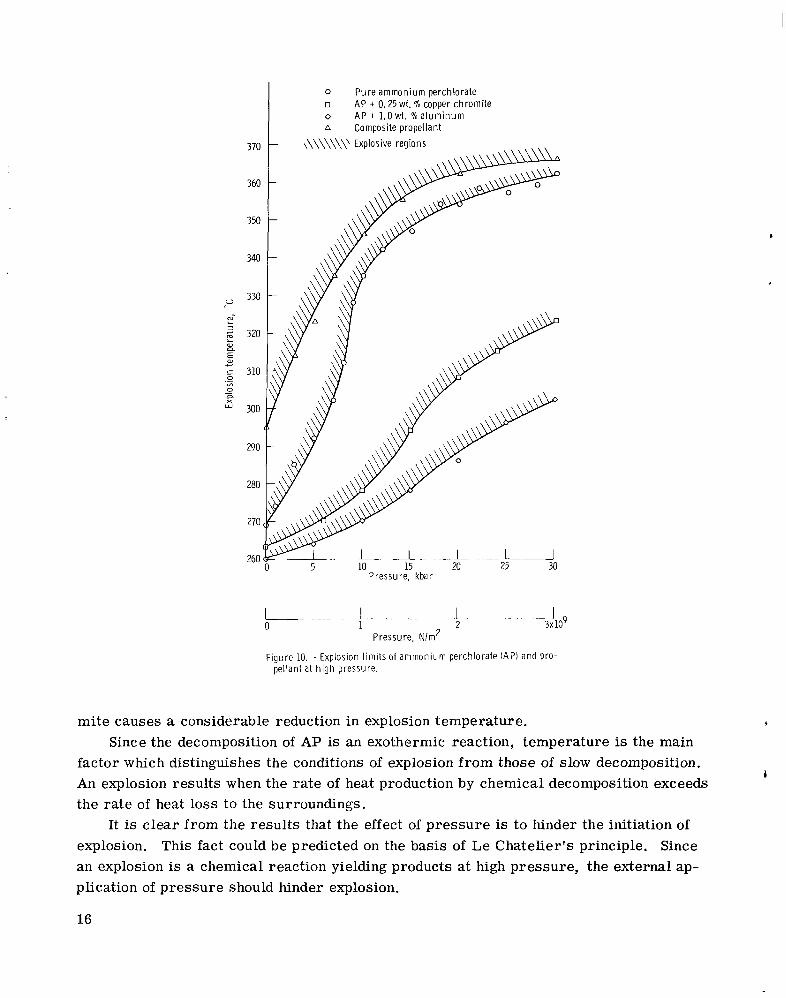
Explosion limits for pure AP and AP containing aluminum powder and copper chro- mite up to 30 kilobars (3.0XlO N/m ) pressure are shown in figure 10. The areas above the curves represent explosive regions. In all cases increasing pressure results in higher explosion temperatures. Addition of finely divided aluminum and copper chro-
9 2
14
2.5
2 2.0 E .... 7
w'
s P W c W
c 0
m > U
.- w
._ - 1.5
1
!? 60
55
50 -
45 W 0 - - - m U
* 4 0 w-
s P
- c W
: 35 0
m ._ c
._ c u a
30
25
20
; I
I I
Pressure , kbar
F igure 9. - V a r i a t i o n of act iva t ion energy of decomposi t ion w i t h p ressure .
15
0 P u r e a m m o n i u m perch lo ra te o o A Composite propel lant
AP + 0.25 wt. % copper c h r o m i t e A P + 1.0 wt. % a l u m i n u m
370
360
350
340
- 330
a; L
2 320 L a, CL
E c c 310 0 “l 0
a x
._ -
300
290
280
270
260
Pressure, kbar
I.-- . L - ~ 1 ~~ - -1 0 1 2 3x10⁹
Pressure, N/m2
F igu re 10. -Explos ion l i m i t s of a m m o n i u m perch lo ra te ( A P I and p ro - pel lant at high pressure.
mite causes a considerable reduction in explosion temperature.
factor which distinguishes the conditions of explosion from those of slow decomposition. An explosion results when the rate of heat production by chemical decomposition exceeds the rate of heat loss to the surroundings.
It is clear from the resul ts that the effect of pressure is to hinder the initiation of explosion. This fact could be predicted on the basis of Le Chatelier’s principle. Since an explosion is a chemical reaction yielding products at high pressure, the external ap- plication of pressure should hinder explosion.
I
Since the decomposition of AP is an exothermic reaction, temperature is the main
i
16

Since aluminum and copper chromite act as catalysts for the decomposition of am- monium perchlorate, it should b e expected that lower initiation temperatures would be required. The reason for the higher explosion temperatures of the propellant as com- pared to pure AP may be due to the binder (80 percent by weight of the propellant) acting as an inhibitor.
Elect r ica I Resistance . The temperature dependence of resistance of AP at high pressure is given in fig-
u re 11. Isobar I shows the resistance behavior for the first heating at 10 kilobars ( 1 . 0 ~ 1 0 N/m ); isobar I1 represents the cooling curve. Additional temperature cycling 9 2
I
io (1.0~1091
I I 375
I 325
I 75 125 175 225 275
I Temperature, "C
104 25
F igu re 11. - Electr ical res is tance of a m m o n i u m perch lo ra te at h i g h pressure.
17
I
9 2 at 10 kilobars (l.Oxl0 N/m ) is also represented by isobar II. Isobars I11 and IV show resistance at 20 and 30 kilobars (2.0XlO and 3.0XlO N/m ), respectively.
The type of resistance minimum in isobar I at approximately 125' C is usually as- sociated with a phase transformation. However, this probability was ruled out because the cooling curve and temperature cycling showed no minimum. Also, X-ray powder diagrams of recovered AP were identical with starting material. The density of AP samples prepared in the pellet mold was 1.92 grams pe r cubic centimeter. After com- pression to 10 kilobars (l.OXl0 N/m ) and heating to 300' C, the density increased to the single crystal value of 1.95 grams per cubic centimeter. Thus, the resistance minimum is attributed to voids in the sample which a r e removed during the first com- pression and heating.
9 9 2
9 2
r
2 4v I . J
3.2 3 . 6 ~ 1 0 - ~ 1
2. 0 2. 4 2. e 104 L6
Temperature, lIT, K
F i g u r e 12. - Electr ical resistance of a m m o n i u m perch lo ra te a s f u n c t i o n of temperature.
18
Tantalum foil was the best material for electrical contacts in resistance measure- This material was found to be inert to AP under the high temperatures and
Under the aforementioned conditions these metals were
ments. pressures used in this study. Platinum and molybdenum were unsuitable for making resistance measurements. attacked by AP and gave unreproducible resistance curves.
240' to 2'70' C at atmospheric pressure (refs. 18 and 19). the orthorhombic to the cubic form. Maycock, Verneker, and Gorzynski (ref. 20) studied the electrical conductivity of AP in the temperature range 60' to 280' C. plot of conductivity as a function of temperature showed a "knee" at 255' C which is attributed to the change in crystal structure. The plot of electrical resistance against
9 9 9 reciprocal temperature at 10, 20, and 30 kilobars (l.OXl0 , 2 . 0 ~ 1 0 , and 3 . 0 ~ 1 0 N/m ) in figure 12 shows none of the discontinuities usually associated with phase changes. It is possible the application of high pressure prevents the transformation, since there is a 9.7-percent increase in volume associated with the transition. The temperature shift of the transition as a function of pressure can be calculated by the Clap eyron- C laus ius equation (ref . 2 1) :
Ammonium perchlorate undergoes a phase transformation in the temperature range The crystal change is from
Their
2
L dp = AH dT T(Vc - Vo)
where AH is the enthalpy of transition, T is the absolute temperature, Vc is the
molar volume of cubic AP, equal to 5. 682X10-4 l i ter pe r gram (0.5682 cm /g), and Vo is the molar volume of orthorhombic AP, equal to 5. 128X10-4 liter pe r gram (0.5128 cm /g). transition (endothermic) as measured by Markowitz and Boryta (ref. 22) and the factor fo r converting calories to liter-atmospheres
3
3 3 Using 2 .3 kilocalories per mole ( 9 . 6 2 ~ 1 0 J/mole) for the enthalpy of
. or
I
1.9 87 (cal)(deg-')( mole- ')
82.05 (cm3-atm)(deg-l)(mole-')
8 . 3 1 4 ~ 1 0 ~ (J)(deg- ')(mole- ')
3 1 = 9.8694 (cm -atm)(J- )
l one obtains
19
- dP = dT
[2300 (cal)(mole-')] [O. 04129 (liter-atm)(cal-l)] . .
(513 deg) [5. 5 4 x W 5 (liter)(g-l)] [117.5 (g)(mole-'j]
or
[9.62x10⁶ (J)(mole-')] -~ ~ . [9.8694 .- - (cm3-atm)(J-l)] -. - d p = dT (513 deg) [5. 54X10-2 (cm3)(g-l)] [117.5 (g)(mole -1 )J 1
= 28.4 (atm)(deg-l)
The reciprocal, dT/dp = 0.035 degree per atmosphere, indicates that an increase in pressure of d atmosphere raises the transition point 0.035 degree. A pressure of 10 kilobars ( 1 . 0 ~ 1 0 N/m ) should ra i se the transition point approximately 350 degrees to about 590' C. This is obviously impossible, as shown by the explosion limit data at high pressure. High pressure X-ray measurements would be useful for determining the transition point of AP as a function of pressure. Such a method would clearly detect the orthorhombic to cubic transition.
9 2
SUMMARY OF RESULTS
The more significant results obtained from this study of solid ammonium perchlo- rate and an ammonium perchlorate based solid propellant at high pressures were as follows :
1. Thermal decompositions of AP and propellant at high pressure and elevated tem- peratures follow first-order kinetics and go to completion. Rate equations for the de-
9 composition of perchlorate between 282' and 337' C at 15, 25, and 50 kilobars ( 1 . 5 ~ 1 0 , 2.5X10 , and 5. O X l O N/m ) were calculated. Rate equations fo r decomposition of pro- pellant between 266' and 308' C at 15, 25, and 50 kilobars (1. 5x10⁹, 2. 5x10⁹, and 5.0X10⁹ N/m2) were calculated.
2. Explosion limits for ammonium perchlorate were determined to 30 kilobars (3.0X10⁹ N/m2). Increasing pressure raises explosion temperatures. Metallic addi- tives lower explosion temperatures.
3. A composite propellant containing ammonium perchlorate has higher explosion temperatures than pure AP alone.
9 9 2
.
20
4 . Electrical resistance measurements of compacted polycrystalline ammonium 9
perchlorate powder suggested no phase transformations up to 30 kilobars (3.0XlO N/m2) and 340' C.
Lewis Research Center, National Aeronautics and Space Administration,
Cleveland, Ohio, July 20, 1970, 129-03.
1.
2 .
3.
4 .
5.
6.
b
7.
I
8.
9.
REFERENCES
Bovenkerk, H. P . , et al. : Preparation of Diamond. Nature, vol. 184, no. 4693, Oct. 10, 1959, pp. 1094-1098.
Bircumshaw, L. L. ; and Newman, B. H. : The Thermal Decomposition of Ammonium Perchlorate. Thermal Decomposition Experiments. no. 1168, Dec. 21, 1954, pp. 115-132.
I. Introduction, Experimental, Analysis of Gaseous Products, and Proc. Roy. SOC. (London), Ser. A, vol. 227,
Bircumshaw, L. L. ; and Newman, B. H. : The Thermal Decomposition of Ammo- nium Perchlorate. Size, and Discussion of Results. Proc. Roy. SOC. (London), Ser. A, vol. 227, no. 1169, Jan. 7, 1955, pp. 228-241.
Galwey, A. K. ; and Jacobs, P. W. M. : The Thermal Decomposition of Ammonium Perchlorate at Low Temperatures. Proc. Roy. SOC. (London), Ser. A, vol. 254, no. 1279, Mar. 8, 1960, pp. 455-469.
Galwey, A. K. ; and Jacobs, P. W. M. : High-Temperature Thermal Decomposition
11. The Kinetics of the Decomposition, the Effect of Par t ic le
of Ammonium Perchlorate. J. Chem. SOC., pt. 1, 1959, pp. 837-844.
Galwey, A. K. ; and Jacobs, P. W. M. : The Thermal Explosion of Ammonium Perchlorate. J. Chem. SOC., pt. 4, 1960, pp. 5031-5033.
Irwin, 0. R. ; Salzman, P. K. ; and Andersen, W. H. : Deflagration Characteristics of Ammonium Perchlorate at High Pressures . Ninth Symposium (International) on Combustion. W. G. Berl, ed., Academic Press, 1963, pp. 358-365.
Zeitlin, Alexander: Equipment for Ultrahigh Pressures . Mech. Eng., vol. 83, no. 10, Oct. 1961, pp. 37-43.
Kennedy, G. C. ; and La Mori, P. N. : Some Fixed Points on the High P res su re Scale. Progress in Very High P res su re Research. F. P. Bundy, W. R. Hibbard, Jr., and H. M. Strong, eds., John Wiley & Sons, Inc., 1961, p. 304.
21
10. Samara, G. A. ; Henius, A. ; and Giardini, A. A. : A Study of P r e s s u r e Homogene- ity in the Hexahedral Anvil High-pressure Apparatus. J. Basic Eng., vol. 86, no. 4, Dec. 1964, pp. 729-735.
11. Glasstone, Samuel; Laidler, Keith J.; and Eyring, Henry: The Theory of Rate Processes. McGraw-Hill Book Co., Inc., 1941.
12. Bowden, F. P.; Evans, B. L.; Yoffe, A. D.; and Yuill, A. M.: The Influence of High Pressure on Thermal Explosion and the Decomposition and Detonation of Single Crystals. Disc. Faraday SOC., no. 22, 1956, pp. 182-187.
13. Ryabinin, Yu. N. : The Influence of Pressure on the Velocity of Thermal Decompo- + sition of Explosives. Doklady Akad Nauk SSSR, vol. 58, 1947, pp. 245-248.
14. Bridgman, P. W. : The Effect of High Mechanical Stress on Certain Solid Explo- sives. J. Chem. Phys., vol. 15, no. 5, May 1947, pp. 311-313.
15. Prout, E. G. ; and Tompkins, F. C. : The Thermal Decomposition of Silver Per- manganate. Trans. Faraday SOC., vol. 42, June-July 1946, pp. 468-472.
16. Avrami, Melvin: Kinetics of Phase Change. I. General Theory. J. Chem. Phys., vol. 7, no. 12, Dec. 1939, pp. 1103-1112.
17. Erofe'ev, B. V. : Generalized Equation of Chemical Kinetics and Its Application in Reactions Involving Solids. Compt. Rend. Acad. Sci. URSS, vol. 52, 1946, pp. 51 1-514.
18. Hueckel, Walter (L. H. Long, trans. ): Structural Chemistry of Inorganic Com- pounds. Vol. 2. Elsevier Publ. Co., 1951, pp. 667-670.
19. Vorlaender, D. ; and IQascht, Erich: New Forms of Perchlorates. Ber. deut. chem. Ges. , vol. 56B, 1923, pp. 1157-1162.
20. Maycock, J. N.; Verneker, V. R. Pai; and Gorzynski, C. S. , Jr.: Electrical Conductivity of Ammonium Perchlorate. Solid State Comm., vol. 5, no. 4, 1967, pp. 225-227.
21. Glasstone, Samuel: Textbook of Physical Chemistry. Second ed., D. Van Nostrand Co., Inc., 1946. 4
22, Markowitz, M. M. ; and Boryta, D. A. : Some Aspects of the Crystallographic Transition of Ammonium Perchlorate. ARS J. vol. 32, no. 12 , Dec. 1962, pp. I
1941-1942.
22 NASA-Langley, 1970 - 21 E-4568