Embed Size (px)
Citation preview
NASA Technical Paper 1877
Behavior of Aircraft Antiskid Braking Systems on Dry and Wet' -Runway Surfaces I
.Hydromechanically Controlled System ' .
John A. Tanner, Sandy M. Stubbs, and Eunice G . Smith
AUGUST 1981
NASA
\ '
https://ntrs.nasa.gov/search.jsp?R=19810021574 2018-05-15T21:13:17+00:00Z
TECH LIBRARY KAFB, NM
i # NASA Technical Paper 1877
Behavior of Aircraft Antiskid Braking Systems on Dry and Wet Runway Surfaces Hydromechanically Controlled System
John A. Tanner, Sandy M. Stubbs, and Eunice G. Smith Laugley Research Ceuter Hurnfitotr, Virgiilia
National Aeronautics and Space Administration
Scientific and Technical Information Branch
1981
Ill1 II 1111l IIIII I I

I 1 1 1 I I 1 1 1 I I I 1 I.
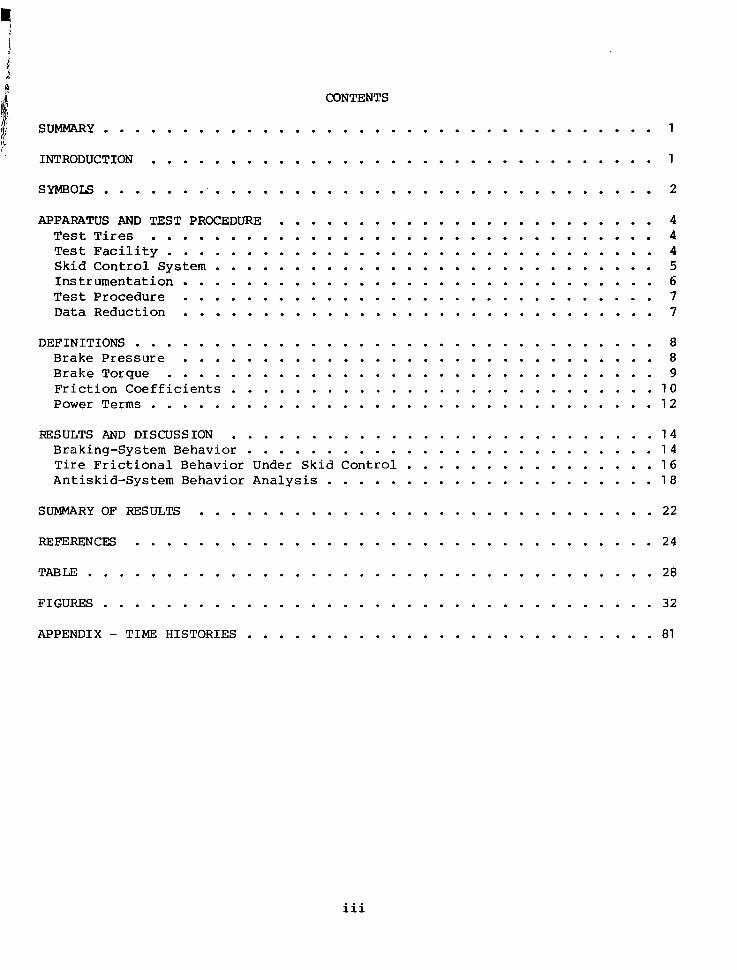
INTRODUCTION . . . . . . . . . . . . . . . . . . . . . . . . . . . . . . . . 1
SYMBOLS . . . . . . . . . . . . . . . . . . . . . . . . . . . . . . . . . . . . 2
APPARATUS AND TEST PROCEDURE . . . . . . . . . . . . . . . . . . . . . . . . 4 T e s t T i r e s . . . . . . . . . . . . . . . . . . . . . . . . . . . . . . . . 4 T e s t Fac i l i t y . . . . . . . . . . . . . . . . . . . . . . . . . . . . . . . 4 S k i d C o n t r o l S y s t e m . . . . . . . . . . . . . . . . . . . . . . . . . . . . 5 I n s t r u m e n t a t i o n . . . . . . . . . . . . . . . . . . . . . . . . . . . . . . 6 T e s t p r o c e d u r e . . . . . . . . . . . . . . . . . . . . . . . . . . . . . . 7 Data Reduction . . . . . . . . . . . . . . . . . . . . . . . . . . . . . . 7
DEFINITIONS . . . . . . . . . . . . . . . . . . . . . . . . . . . . . . . . . 8 B r a k e p r e s s u r e . . . . . . . . . . . . . . . . . . . . . . . . . . . . . . 8 Brake Torque . . . . . . . . . . . . . . . . . . . . . . . . . . . . . . . 9 F r i c t i o n C o e f f i c i e n t s . . . . . . . . . . . . . . . . . . . . . . . . . . . 1 0 Power Terms . . . . . . . . . . . . . . . . . . . . . . . . . . . . . . . . 1 2
RESULTS AND DISCUSSION . . . . . . . . . . . . . . . . . . . . . . . . . . . 1 4 Braking-System Behavior . . . . . . . . . . . . . . . . . . . . . . . . . . 1 4 T i r e F r i c t i o n a l B e h a v i o r Under S k i d C o n t r o l . . . . . . . . . . . . . . . . 1 6 Antiskid-System Behavior Analysis . . . . . . . . . . . . . . . . . . . . . 1 8
SUMMARY OF RESULTS . . . . . . . . . . . . . . . . . . . . . . . . . . . . . 22
mFERENcEs . . . . . . . . . . . . . . . . . . . . . . . . . . . . . . . . . 24
T A B m . . . . . . . . . . . . . . . . . . . . . . . . . . . . . . . . . . . . 28
FIGURES . . . . . . . . . . . . . . . . . . . . . . . . . . . . . . . . . . . 32
iii


i
SUMMARY
An e x p e r i m e n t a l i n v e s t i g a t i o n was conducted a t the Lang ley Aircraft Landing L o a d s a n d T r a c t i o n F a c i l i t y to s t u d y t h e b r a k i n g a n d c o r n e r i n g r e s p o n s e o f a hydromechan ica l ly con t ro l l ed a i rcraf t an t i sk id b rak ing sys t em. The i nves t iga - t ion , conducted on d ry and w e t runway s u r f a c e s , u t i l i z e d o n e m a i n g e a r w h e e l , brake, and t i r e assembly of a McDonnell Douglas DC-9 series 1 0 a i rp l ane . The l a n d i n g - g e a r s t r u t was r e p l a c e d by a dynamometer.
During maximum braking , average b rak ing behavior indexes based upon brake p r e s s u r e , brake t o r q u e , a n d d r a g - f o r c e f r i c t i o n c o e f f i c i e n t d e v e l o p e d by t h e a n t i s k i d s y s t e m were g e n e r a l l y h i g h e r o n t h e d r y runway s u r f a c e s t h a n o n t h e w e t s u r f a c e s . On t h e wet s u r f a c e s , t h e s e i n d e x e s were reduced a t h i g h e r c a r r i a g e speeds and when new t r e a d s were r e p l a c e d by worn t r e a d s . The t h r e e b r a k i n g behavior indexes gave similar r e s u l t s b u t the agreement was n o t s u f f i c i e n t to allow them to be used i n t e r c h a n g e a b l y a s a measure o f the b rak ing behavior for t h i s an t i sk id sys t em. Fu r the rmore , these braking behavior indexes are based upon maximum v a l u e s of p r e s s u r e , torque, a n d d r a g - f o r c e f r i c t i o n c o e f f i c i e n t , which may vary from system to sys tem, and any compar isons be tween d i f fe ren t a n t i s k i d s y s t e m s b a s e d s o l e l y upon these indexes may be t e c h n i c a l l y m i s l e a d i n g . The ave rage co rne r ing behav io r i ndex based upon the s i d e - f o r c e f r i c t i o n coef- f i c i e n t d e v e l o p e d by t h e t i r e u n d e r a n t i s k i d c o n t r o l was decreased on wet runway surfaces, wi th yaw a n g l e s g r e a t e r t h a n lo, and when t i r e s w i t h new t r e a d s were r e p l a c e d by those w i t h worn t r e a d s . The in t e rac t ion be tween b rak ing and co rne r - i n g f o r c e s i n d i c a t e d t h a t , d u r i n g a n t i s k i d c y c l i n g , t h e s i d e - f o r c e f r i c t i o n c o e f - f i c i e n t was s i g n i f i c a n t l y reduced d u r i n g p o r t i o n s of the b rak ing cyc le s . Dur ing t h e t r a n s i t i o n from a d r y to a f looded sur face under heavy brak ing , the wheel e n t e r e d i n t o a deep s k i d , b u t t h e a n t i s k i d s y s t e m reacted q u i c k l y by reducing brake pressure and performed normally during the remainder of the run on t h e f looded surface. The b rake -p res su re r ecove ry fo l lowing t r ans i t i on from a f looded to a d r y s u r f a c e was shown to be a f u n c t i o n of t h e a n t i s k i d m o d u l a t i n g o r i f i c e .
INTRODUCTION
Over t h e y e a r s , t h e number a n d v a r i e t y o f a i r p l a n e s u s i n g a n t i s k i d b r a k i n g s y s t e m s h a v e s t e a d i l y i n c r e a s e d u n t i l most c u r r e n t commercial a n d m i l i t a r y j e t a i r p l a n e s are now e q u i p p e d w i t h v a r i o u s s k i d c o n t r o l d e v i c e s . T h e earliest a n t i s k i d s y s t e m s were g e n e r a l l y d e s i g n e d to prevent wheel lockups and excess ive t i r e wear on dry pavements. Modern s k i d c o n t r o l d e v i c e s , h o w e v e r , are more s o p h i s t i c a t e d a n d are des igned to p r o v i d e maximum b r a k i n g e f f o r t w h i l e m a i n t a i n - i n g f u l l a n t i s k i d p r o t e c t i o n u n d e r a l l wea the r cond i t ions . Opera t ing statistics of modern j e t a i r p l a n e s i n d i c a t e t h a t t h e s e a n t i s k i d s y s t e m s are b o t h e f f e c t i v e a n d d e p e n d a b l e : t h e s e v e r a l m i l l i o n l a n d i n g s t h a t are made e a c h y e a r i n r o u t i n e f a s h i o n w i t h n o s e r i o u s o p e r a t i n g problems a t t e s t to t h i s fact .
However, it has been well established, both from flight tests and from field experience, that the performance of these systems is subject to degrada- tion on slippery runways; consequently, dangerously long roll-out distances and reduced steering capability can result during some airplane landing opera- tions (refs. 1 to 5). There is a need to study different types of antiskid braking systems in order to find reasons for the degraded braking performance that occurs under adverse runway conditions; there is also a need to obtain data for the developnent of more advanced systems that will insure safe ground handling operations under all weather conditions.
In an effort to meet these needs, an experimental research program has been undertaken to study the single-wheel behavior of several different airplane anti- skid braking systems under the controlled conditions afforded by the Langley Aircraft Landing Loads and Traction Facility (formerly called the Langley Land- ing Loads Track). The types of skid control devices undergoing study in this program include a velocity-rate-controlled system (ref. 6); a slip-ratio- controlled system with ground speed reference from an unbraked nose wheel (ref. 7) : a slipvelocity-controlled system (ref. 8 ) ; and described in this paper, a hydromechanically controlled system. The investigation of all these systems is being conducted with a single main wheel, brake, and tire assembly of a McDonnell Douglas X - 9 series 1 0 airplane.
The purpose of this paper is to present the results from a study of the behavior of a hydromechanically controlled aircraft antiskid braking system under maximum braking effort. The parameters varied in the study included carriage speed, tire loading, yaw angle, tire tread condition, and runway wetness condi- tions. A discussion of the effects of each of these parameters on the behavior of the skid control system is presented. In addition, comparisons are made between data obtained with the skid control system and data obtained from single- cycle braking tests without antiskid protection.
Dunlop Limited provided the antiskid-system hardware for this investigation, and the Federal Aviation Administration (FAA) provided the wheels, brakes, and tires.
SYMBOLS
Values are given in both SI and U.S. Customary Units. The measurements and calculations were made in U.S. Customary Units. Factors relating the two systems are given in reference 9.
d position of footprint center of pressure
FV tire vertical force
FX drag force parallel to plane of wheel
FY side force perpendicular to plane of wheel
h axle height
2

I moment of inertia
P power
P pres sur e
r tire rolling radius
S wheel slip ratio
T tor que
t time
V carriage speed
a angular acceleration
6 behavior index
U friction coefficient
9 yaw angle
w test wheel angular velocity
Subscripts:
b braking
C cornering
d drag
F friction
f final value
4 gross
max maximum va 1 ue
0 initial value
P pres sur e
r free rolling
S side
3

T
t
tor que
t i i e
A bar over a symbol denotes an average value.
APPARATUS AND TEST PROCEDURE
T e s t T i r e s
The t i r e s u s e d i n t h i s i n v e s t i g a t i o n were 40 x 1 4 , t y p e VII, bias-p ly a i r c r a f t t i res of 22 p l y r a t i n g w i t h a r a t e d maximum speed of 200 k n o t s (1 knot = 0.5144 m/sec). The t ires were stock r e t r e a d s w i t h a s ix-groove t r e a d p a t t e r n , a n d t h e s t u d y i n c l u d e d b o t h new and worn t r e a d c o n f i g u r a t i o n s . A photograph of the two test t i r e s having new and worn t r e a d s is p r e s e n t e d i n f i g u r e 1 . The new t r ead had a groove depth of 0.71 cm (0 28 i n . ) and was c o n s i d e r e d new u n t i l t h e g r o o v e d e p t h d e c r e a s e d to 0.36 c m (0 .14 i n . ) . To gen- erate worn t i r e s , a c o m m e r c i a l l y a v a i l a b l e t i r e gr inding machine was employed to remove t r ead rubbe r un i fo rmly f rom the r e t r eaded t i r e u n t i l a groove depth of 0.05 cm (0.02 in . ) rema. ined. This s imulated worn t i re was p r o b a b l y i n a worse wear c o n d i t i o n t h a n is n o r m a l l y e x p e r i e n c e d i n a i r p l a n e o p e r a t i o n s . T h r o u g h o u t t h i s i n v e s t i g a t i o n , t h e t i r e i n f l a t i o n pressure was m a i n t a i n e d a t t h e n o r m a l a i r l i n e o p e r a t i o n a l p r e s s u r e o f 0 . 9 7 MPa (140 p s i ) .
T e s t F a c i l i t y
The i n v e s t i g a t i o n was performed by u s i n g a 4800-kg (106 000-lbm) tes t car- r i a g e a t the Langley Aircraft Landing Loads a n d T r a c t i o n F a c i l i t y d e s c r i b e d i n r e f e r e n c e 10. F i g u r e 2 is a photograph of t h e c a r r i a g e w i t h t h e tes t wheel a s s e m b l y i n s t a l l e d ; f i g u r e 3 is a closeup view of the wheel and other components An instrumented dynamometer was used i n s t ead o f a landing-gear s t r u t to s u p p o r t the wheel and brake assembly because it provided an accura te measurement o f the t i r e -g round fo rces .
For the tests d e s c r i b e d i n t h i s p a p e r , a p p r o x i m a t e l y 274 m (900 f t ) o f t h e a v a i l a b l e 366 m (1200 f t ) of f l a t c o n c r e t e test runway was used to provide b rak- ing and corner ing da ta on a d r y s u r f a c e , o n a n a r t i f i c i a l l y damp su r face , on an a r t i f i c i a l l y f l o o d e d s u r f a c e , a n d o n a n a t u r a l r a i n wet s u r f a c e . W i t h t h e e x c e p t i o n of t r a n s i e n t runway f r i c t i o n tests, t h e e n t i r e runway had a uniform s u r f a c e wetness c o n d i t i o n , a n d a n t i s k i d c y c l i n g o c c u r r e d f o r t h e e n t i r e 274 m (900 f t ) . The 61 m (200 f t ) o f runway p reced ing t he t es t s e c t i o n was u s e d f o r t h e i n i t i a l w h e e l s p i n - u p a n d b r a k e a c t u a t i o n , a n d t h e 30.5 m (100 f t ) beyond the t es t s e c t i o n was r e t a i n e d f o r brake release. To o b t a i n a damp con- d i t i o n , t h e test s u r f a c e was l i g h t l y w e t t e d w i t h n o s t a n d i n g water. For the f looded runway c o n d i t i o n , t h e s u r f a c e was surrounded by a f l e x i b l e dam and f looded to a depth of approximate ly 1 .0 cm ( 0 . 4 i n . ) . For t h e n a t u r a l r a i n sur- face condi t ion no measurement of water depth was made.
4

M- I I
I
The c o n c r e t e s u r f a c e i n t h e t e s t area had a v e r s e d i r e c t i o n , a n d t h e s u r f a c e t e x t u r e was n o t
l i g h t broom f i n i s h i n a t r a n s - comple te ly un i form, as shown
by t h e t e x t u r e d e p t h m e a s u r e m e n t s i n t h e f o l l o w i n g s k e t c h :
366 m (1200 ft)
Test area
Tes t runway ( w i d t h n o t t o s c a l e ) 1
k. 6 1 m -A- 6 1 m dL 61 m J- 6 1 m - ! 6 1 rn J L - 6 1 rn
I
(200 f t) (200 f t ) (200 f t ) (200 f t) (200 f t) (200 f t )
Deta i l s o f t he t ex tu re dep th measu remen t t echn ique are p r e s e n t e d i n r e f e r e n c e 1 1 . The ave rage t ex tu re dep th of t h e tes t runway was 159 m (0.00626 in. ) , which is s l i g h t l y less than t h a t of a t y p i c a l o p e r a t i o n a l runway. (See ref . 12 , for example.) The tes t runway was q u i t e l e v e l compared w i t h a i r p o r t runways and had no crown. During the course of t e s t i n g o n t h e d r y s u r f a c e , p a r t i c u l a r l y w i t h a yawed t i r e , rubber was deposi ted on the runway and it was n e c e s s a r y to c l e a n t h e s u r f a c e p e r i o d i c a l l y .
S k i d Cont ro l Sys tem
A hydromechan ica l ly con t ro l l ed s k i d c o n t r o l u n i t was used i n t h i s i n v e s t i - ga t ion and adapted to an ex i s t ing b rak ing sys t em tha t had t h e correct h y d r a u l i c components for a s i n g l e wheel of a DC-9 s e r i e s 1 0 a i r p l a n e . S i n c e t h e c o n t r o l u n i t was no t des igned for t h i s p a r t i c u l a r a i r p l a n e , c e r t a i n i n s t a l l a t i o n modifi- c a t i o n s were necessary to make t h e two systems compatible. The c o n t r o l u n i t i t s e l f , r a t h e r t h a n b e i n g i n s t a l l e d i n a hollow a x l e as des igned , was mounted o n a n a u x i l i a r y a x l e as shown i n f i g u r e 3 . The a u x i l i a r y a x l e was d r i v e n by t h e tes t wheel through a s t ee l - r e in fo rced , cogged , rubbe r t iming b e l t o p e r a t i n g over one-to-one dr ive r a t io no tched pu l l eys . T h i s dr ive system had been used p r e v i o u s l y i n a number o f i n v e s t i g a t i o n s a n d was found to have no s l i p p a g e or o the r undes i r ab le dynamic effects ( r e f s . 6 to 8 ) . The tests were conducted w i t h t h e s k i d c o n t r o l u n i t i n t h e "as r e c e i v e d " c o n d i t i o n w i t h o u t o p t i m i z a t i o n ad jus tmen t s . F igu re 4 is a photograph of the major hydraul ic components o f the s imulated braking system, upstream from t h e a n t i s k i d hardware, i n s t a l l e d o n t h e test c a r r i a g e ; f i g u r e 5 is a schematic of t he system. The brake system is act i - v a t e d by opening the p i l o t m e t e r i n g v a l v e ( f i g . 5) , which allows b r a k e f l u i d to flow from a high-pressure accumula tor and brake selector valve throlzgh t h e h y d r a u l i c f u s e a n d a n t i s k i d c o n t r o l v a l v e to the brake. The sole f u n c t i o n o f t h e b r a k e selector v a l v e a n d h y d r a u l i c f u s e was to d u p l i c a t e t h e DC-9 h y d r a u l i c
5

system. A pneumatic piston shown i n figure 4 was used to open the pilot meter- i n g valve to its f u l l stroke; t h u s , maximum braking e f fo r t fo r a l l t e s t s was provided.
The antiskid control u n i t is a hydraulic valve mechanically connected to the braked wheel. The opening and closing of the valve is controlled by the energy stored i n a small flywheel. The flywheel and a i r c r a f t wheel spin up together through an overrunning c l u t c h mechanism. During a brake cycle, the flywheel is used as a spin-up speed reference. During braking without skidding, the torque given up by the flywheel is balanced by a spring. A t the onset of a s k i d , when the angular deceleration of the braked wheel exceeds a cer ta in pre- selected threshold value, the flywheel overruns and expands the spring. The relat ive motion t h u s produced operates the mechanism to release the brake pres- sure. When the wheel recovers from the s k i d and the angular deceleration again drops below the threshold value, the spring is recompressed; t h u s , brake reappli- cation is permitted. The r a t e a t which pressure is applied to the brake is con- trolled by an o r i f i ce which is sized for a specific airplane application. Brake release is restrained only by l ine s ize and component resistances.
Typical time h is tor ies of wheel speed, wheel acceleration, brake pressure, and the resulting drag-force friction coefficient lid are presented i n figure 6 to help describe the system operation. The points labeled @ t o @ are used to highlight events which occur during antiskid cycling. I n the figure, t h e brake pressure is ini t ia l ly appl ied (@ t o @) and resu l t s i n a slight decrease i n wheel speed (0) ; the early braking effort does not cause the t i re to enter a s k i d and the brake pressure is held constant a t the maximum system pressure (@ to y ) . Eventually the braking effort causes the tire to enter a deep s k i d (0 and, consequently, an increase i n the wheel deceleration (0) beyond the threshold value (dashed line i n f i g . 6 ) causes a pressure release (@ to 0). The h i g h spin-up acceleration of the wheel (0) and the subsequent spring- back response of t.he t i r e (@) causes a momentary fluctuation i n the brake pres- sure (@) before the brake pressure is reapplied (@ t o @) w i t h a corresponding increase i n the friction level (0 to 0) . Beyond 1 0 sec, the wheel decelera- tion again moves beyond the apparent threshold value, and the brake release cycle is repeated.
Instrumentation
The t i re f r ic t ion forces were measured w i t h the dynamometer shown i n f ig - ure 3 and illustrated schematically i n figure 7. Strain gages were mounted on the five dynamometer support beams; two of the beams were used for measuring vertical forces, two were used for measuring drag forces parallel to the wheel plane, and a single beam was used for measuring side force perpendicular to the wheel plane. Four accelerometers on the t e s t wheel axle provided information €or inertia corrections to the force data. The brake torque was measured w i t h torque l i n k s which were independent of the drag-force beams. Transducers were installed i n the hydraulic system ( f i g . 4 ) t o measure pressures at the pilot metering valve, a t the antiskid inlet, at the brake, and i n the return line between the brake and the hydraulic reservoir. A pressure relief valve i n the return l ine maintained a back pressure of 448 kPa (65 ps i ) i n the hydraulic l ines , and a l l the pressure transducers were calibrated to read zero a t t h i s
6
p r e s s u r e . A s tee l - re inforced , cogged , rubber t iming belt was d r i v e n by t h e test wheel to r u n a n a u x i l i a r y a x l e w h i c h d r o v e t h e p u l s e (ac) a l t e r n a t o r w h i c h was used t o o b t a i n a measure of t h e test whee l angu la r ve loc i ty and accelera- t i o n . As p r e v i o u s l y m e n t i o n e d , t h e a u x i l i a r y a x l e also d r o v e t h e a n t i s k i d c o n - t r o l u n i t . A l i g h t w e i g h t t r a i l i n g w h e e l was mounted on the side of t h e t e s t c a r r i a g e (as shown i n f i g . 81, a n d t h e o u t p u t from a ' d c genera tor mounted on its a x l e r e c o r d e d t h e c a r r i a g e speed and was combined wi th the ou tput f rom the tes t w h e e l p u l s e a l t e r n a t o r to c o m p u t e i n s t a n t a n e o u s s l i p v e l o c i t y a n d s l i p r a t i o . A l l d a t a o u t p u t s were f e d i n t o s i g n a l c o n d i t i o n i n g e q u i p m e n t a n d t h e n i n t o t w o frequency-modulated tape recorders. A time code was recorded on bo th recorders to p rov ide synchron iza t ion o f t he two sets o f da t a .
Test Procedure
The t echn ique fo r t he b rak ing tests wi th and wi thout a n t i s k i d p r o t e c t i o n c o n s i s t e d of r o t a t i n g a n d l o c k i n g t h e yoke holding the dynamometer and t i r e assembly t o the chosen yaw a n g l e , p r o p e l l i n g t h e t e s t c a r r i a g e t o t h e desired speed , app ly ing a p r e s e l e c t e d v e r t i c a l l o a d o n t h e t i r e , and r eco rd ing t he outputs f rom t h e onboa rd i n s t rumen ta t ion . Fo r an t i sk id tests, the brake was a c t u a t e d by a p n e u m a t i c p i s t o n a t t h e p i l o t m e t e r i n g v a l v e , which gave f u l l p e d a l d e f l e c t i o n or maximum braking, and t h e a n t i s k i d s y s t e m m o d u l a t e d t h e b rak ing e f fo r t . The runway su r face cond i t ion was e s s e n t i a l l y u n i f o r m o v e r t h e e n t i r e l e n g t h ; t h e brake was a p p l i e d t h e f d l d i s t a n c e a n d was r e l e a s e d p r i o r to c a r r i a g e a r r e s t m e n t .
I n a d d i t i o n t o a n t i s k i d b r a k i n g tests, s i n g l e - c y c l e b r a k i n g tests were made w i t h o u t a n t i s k i d p r o t e c t i o n . T h e s e s i n g l e b r a k e c y c l e s c o n s i s t e d of a p p l y i n g s u f f i c i e n t b r a k e pressure t o b r i n g t h e t i r e from a f r e e - r o l l i n g c o n d i t i o n t o a locked-wheel s k i d and t hen r e l eas ing t he b rake t o a l l o w f u l l t i r e spin-up prior t o t h e n e x t c y c l e . For s i n g l e - c y c l e b r a k i n g , t h e runway s u r f a c e was d i v i d e d i n t o t h r e e s e c t i o n s ( d r y , damp, and f looded) , and brake p r e s s u r e was a p p l i e d by t r i g g e r i n g d e v i c e s a t e a c h s e c t i o n a l o n g t h e t e s t t r a c k .
The nomina l ca r r i age speeds for b o t h t y p e s of tests ranged from 36 t o 1 02 knots and were measured approximately midway a long the runway where , a f te r i n i t i a l a c c e l e r a t i o n , t h e c a r r i a g e was c o a s t i n g t h r o u g h t h e t e s t s e c t i o n w i t h some s p e d decay due t o c a r r i a g e wheel f r i c t i o n , a i r d r a g , a n d t h e b r a k i n g of t h e test t i r e . Tire v e r t i c a l l o a d i n g was main ta ined hydraul ica l ly and ranged from approximately 58 kN (1 3 000 l b f ) to 11 1 kN (25 000 l b f ) , which represented a nominal landing weight and a r e fused t ake -o f f we igh t , r e spec t ive ly , fo r a s i n - g le main wheel o f the DC-9. Tests were run on t i r e yaw a n g l e s from Oo t o go. The nominal brake-system pressure was main ta ined near 1 4 MPa ( 2 0 0 0 p s i ) .
Data Reduction
A l l data were recorded on ana log magnet ic t ape f i l t e r ed to 1000 Hz. A l l analog data were t h e n f i l t e r ed through a low-pass f i l t e r ( c u t o f f f r e q u e n c i e s of 5 Hz f o r c a r r i a g e s p e e d a n d 60 Hz for a l l o t h e r d a t a ) a n d d i g i t i z e d a t 250 samples/sec. Time h i s t o r i e s u s e d i n t h e data a n a l y s i s a n d t h o s e i n t h e a p p e n d i x a r e p l o t t e d a t 50 s a m p l e s / s e c . F r m t h e s e d i g i t i z e d data, d i rec t mea-
surements were obtained of the carriage speed, the braked-wheel angular velocity and acceleration, the brake pressure and torque, the drag force F, (sum of two beams), the side force Fy, the vertical force applied to the tire Fv (sum of two beams), and the accelerations of the dynamometer. The instantaneous vertical-, drag-, and side-force data were corrected for inertia effects and were combined to compute both the instantaneous drag-force friction coefficient pd parallel to the direction of motion and the side-force friction coefficient p s perpendicular to the direction of motion. The load transfer between the two drag-force beams (fig. 7) provided a measure of the alining torque about the ver- tical or steering axis of the wheel. The braked-wheel angular velocity was com- bined with the carriage speed to yield wheel slip velocity and slip ratio. Pertinent data obtained from all the antiskid braking tests are presented in table I, together with parameters which describe each test condition.
Time histories of some of the measured parameters for a typical antiskid braking test are presented in figure 9 (a). These plots start just prior to wheel spin-up and end approximately 1 sec after the release of brake pressure. As previously mentioned, the vertical and drag forces are each the summation of two data channels with corrections made for acceleration effects. The time histories of figure 9(b) are the parameters calculated from the data of fig- ure 9(a). Although brake pressure is a measured parameter, it is included in figure 9(b) to serve as a reference.
DEFINITIONS
An assessment of the behavior of an antiskid braking system subjected to a wide variety of operational conditions requires careful consideration of many variables. Four methods are used in this paper to analyze the behavior of this antiskid braking system; these methods are based upon the following parameters: brake pressure, brake torque, tire friction coefficient, and the stopping and cornering power generated by the antiskid system. The development of the param- eters used to describe the antiskid-system behavior is discussed in the follow- ing paragraphs.
Brake Pressure
One method of determining antiskid-system behavior is to compare the average - brake pressure p to the maximum brake pressure %ax developed by the system. This method is defined in references 13, 1 4 , and 1 5 as a comparison of the area under the brake-pressure time history with the area beneath a pressure profile obtained from the envelope defined by the peaks in the brake-pressure time history. It is noted in reference 1 3 that an examinztion of the wheel-speed time history must show sufficient variations in both magnitude and frequency to demonstrate that the brake is not torque-limited. According to reference 14, this method of study may be open to objection, especially for rate threshold systems, because the threshold rate may be lower than the maximum attainable deceleration, or the pressure may continue to increase while the wheel is spin- ning down. Furthermore, mechanical lags in the brake may not allow the brake- pressure time history to coincide with the drag-force-friction-coefficient time history. However, in the absence of other data, this process can be applied
-
8

I
t e t o t h e a n a l y s i s of a i r p l a n e test da ta and may p r o v e h e l p f u l for comparison purposes (ref. 1 4 ) .
i T y p i c a l e x a m p l e s o f t h e r e l a t i v e l y s m o o t h b r a k e - p r e s s u r e trace are shown i n f i g u r e 1 0 . The a v e r a g e p r e s s u r e p deve loped by t he an t i sk id sys t em du r ing a g iven test is d e f i n e d by t h e e x p r e s s i o n
I
‘0
where to and t f , i d e n t i f i e d i n f i g u r e 1 0 , e n c l o s e d t h e time i n t e r v a l o v e r which jj is measured. The time to r e p r e s e n t s t h e p o i n t a t which the b rake p r e s s u r e i s f i r s t a p p l i e d . The time tf i s taken j u s t p r i o r to brake release a t t h e e n d of t h e t e s t s e c t i o n . The average pressure is computed for each b r a k i n g test by n u m e r i c a l i n t e g r a t i o n t e c h n i q u e s . The maximum p r e s s u r e hax is d e r i v e d i n much t h e same way as 6 , e x c e p t t h a t t h e d a s h e d c u r v e s i n f i g - ure 1 0 t h a t a r e f o r m e d by j o i n i n g t h e s t r a i g h t l i n e s e g m e n t s b e t w e e n t h e p r e s - sure p e a k s a r e u sed .
Brake Tor que
A s e c o n d i n d i c a t i o n of an t i sk id - sys t em behav io r is t h e r a t i o of the ave rage brake torque t o t h e maximum t o r q u e Tmax developed dur ing a t e s t ( r e f s . 1 3 and 1 5 ) . I n many tes t programs, it is d i f f i c u l t t o measure the b rake t o rque : hence, torque is n o t commonly used t o s tudy an t i sk id - sys t em behav io r . Fo r - t una te ly , t he i n s t rumen ted dynamomete r u sed i n t h i s i n v e s t i g a t i o n g i v e s a d i r e c t and independent measure of brake torque. According t o r e f e r e n c e 16, t h e rela- t i o n s h i p b e t w e e n b r a k e t o r q u e a n d f r i c t i o n f o r c e is more e a s i l y d e f i n e d t h a n t h e r e l a t i o n s h i p b e t w e e n b r a k e p r e s s u r e a n d f r i c t i o n f o r c e . T h i s r e l a t i o n s h i p , d e s c r i b e d f u l l y i n r e f e r e n c e 2, is
Torque = F,h + Fvd - Ia ( 2 )
a n d i n d i c a t e s t h a t b r a k e t o r q u e i s d e f i n e d by a l i n e a r c o m b i n a t i o n o f moments and t hus canno t be un ique ly de f ined by t h e p r o d u c t of d r a g force F, and i ts moment arm h. When t h e t i r e operates a t a f i x e d s l i p v e l o c i t y s u c h tha t a becomes n e g l i g i b l e a n d d is r e l a t i v e l y small, t h e n t h e t o r q u e may more c l o s e l y r e f l e c t t h e d r a g - f o r c e f r i c t i o n c o e f f i c i e n t . I n most cases, however , an t i sk id c y c l i n g r e s u l t s i n rapid w h e e l s p e e d c h a n g e s a n d s i g n i f i c a n t s h i f t s d i n t h e f o r e - a n d - a f t p o s i t i o n of t h e f o o t p r i n t c e n t e r o f p r e s s u r e . T h u s , peaks i n t h e
9

brake-torque time h i s t o r i e s may n o t c o i n c i d e w i t h t h e p e a k s i n t h e p d time his tor ies : however , the b rake- torque time h i s t o r i e s for t h i s a n t i s k i d s y s t e m are r e l a t i v e l y s m o o t h ( f i g . 1 0 ) , and t he t o rque ra t ios a r e p r e s e n t e d as an inde- pendent method to s t u d y a n t i s k i d b e h a v i o r .
The average brake t o r q u e ? deve loped by t he an t i sk id system d u r i n g a g i v e n test is d e f i n e d by an expres s ion similar t o t h a t for p. T h i s e x p r e s s i o n
was a l s o computed from measured torque time h i s t o r i e s by n u m e r i c a l i n t e g r a t i o n techniques . The maximum torque Tmax was d e r i v e d i n t h e same way as t h e a v e r a g e t o r q u e e x c e p t t h a t t h e d a s h e d c u r v e s i n f i g u r e 1 0 t h a t were formed by j o i n i n g s t r a i g h t l i n e s e g m e n t s b e t w e e n t h e t o r q u e p e a k s were used.
-
The slope o f t h e l e a s t - s q u a r e s l i n e t h r o u g h t h e o r i g i n , w h i c h f a i r s t h e d a t a when T is p l o t t e d as a f u n c t i o n of Tmax, is d e f i n e d a s t h e torque brak- ing behavior index Bb,T.
-
F r i c t i o n C o e f f i c i e n t s
D r a g - f o r c e f r i c t i o n c o e f f i c i e n t s . - Many r e f e r e n c e s a c k n o w l e d g e t h e e x i s t - ence of a peak or maximum v a l u e o f d r a g - f o r c e f r i c t i o n c o e f f i c i e n t . ( S e e r e f s . 1 6 t o 26 for examples . ) Most a n t i s k i d s y s t e m s a c t i v e l y seek t h i s p e a k f r i c t i o n c o e f f i c i e n t or are des igned t o o p e r a t e w i t h i n a r e l a t i v e l y n a r r o w r a n g e of s l i p v e l o c i t i e s o r s l i p ra t ios i n which t h i s p e a k is assumed to occur ; t hus , maximum a i r p l a n e d e c e l e r a t i o n is provided ( re f . 2 7 ) . A c c o r d i n g l y , r e f e r e n c e 1 3 d e f i n e s t h e b r a k e - p r e s s u r e a n d t o r q u e r a t i o s a s i n d i r e c t i n d i c a t o r s o f a n t i s k i d - sys t em behav io r and r ega rds t he r a t io of average developed t o maximum achieved g round r eac t ion fo rces due t o b r a k i n g e f f o r t a s a d i r e c t i n d i c a t i o n of t h e an t i sk id-sys tem brak ing behavior . However, f r i c t i o n d a t a c a n b e more d i f f i c u l t t o ana lyze .
D u r i n g t h i s i n v e s t i g a t i o n , t h e a n t i s k i d s y s t e m e x h i b i t e d two d i s t i n c t response modes. Response mode A is d e f i n e d as a n t i s k i d c y c l i n g w i t h w e l l - d e f i n e d i n c i p i e n t s k i d p o i n t s as shown i n f i g u r e 1 O(a) . Response mode B is d e f i n e d as a n t i s k i d c y c l i n g w i t h o u t w e l l - d e f i n e d i n c i p i e n t s k i d p o i n t s as shown i n f i g - u r e 1 O(b) . Mode A response has been reported f r e q u e n t l y i n t h e l i t e r a t u r e . (See r e f s . 1 , 2 , 6, and 8 f o r e x a m p l e s . ) I n t h i s s t u d y , r e s p o n s e mode A is gen- e r a l l y a s s o c i a t e d w i t h new t i r e s a t yaw ang les o f 0°, 1 O, and 3O a n d r e p r e s e n t more than t h ree -qua r t e r s o f t h e d a t a . When r e s p o n s e mode A was observed , va lues of pdlmaXl denoted by t h e circles i n f i g u r e 1 0 ( a ) , were measured n e a r t h e i n c i p - i e n t s k i d p o i n t s . U s i n g i n c i p i e n t s k i d p o i n t s f o r o b t a i n i n g Udlmax is a Well- e s t ab l i shed and accep ted me thod . (See r e f s . 1 , 1 3 , 1 5 , 22, and 25 for examples.)
1 0

Mode B response was reported p r e v i o u s l y i n r e f e r e n c e s 7 and 8. I n t h e p r e s e n t i n v e s t i g a t i o n , r e s p o n s e mode B is a s s o c i a t e d w i t h t h e worn t i r e and w i t h t h e h i g h e r yaw a n g l e s . T h i s t y p e r e s p o n s e i s p r o b a b l y t h e r e su l t of the i n t e r a c t i o n b e t w e e n t h e a n t i s k i d c y c l i n g f r e q u e n c y a n d t h e t i r e mechanical properties. The possible e f f e c t t h a t t h i s i n t e r a c t i o n may have on t he shape o f t h e c u r v e f o r Ll p l o t t e d a g a i n s t s l i p and hence t he pd ,Fax i nc ip i en t s k i d r e l a t i o n s h i p is shown i n r e f e r e n c e s 1 , 6, 7, and 8 and 1s d i s c u s s e d i n sane de t a i l i n r e f e r e n c e 28. S i n c e r e s p o n s e mode B g e n e r a l l y p r e c l u d e d d e t e r - mina t ions of Ud,max from i n c i p i e n t s k i d p o i n t s , a n a l t e r n a t e a p p r o a c h was employed based upon fixed time inc remen t s . Fo r t h i s me thod , t he pd time h i s t o r y was d i v i d e d i n t o u n i f o r m time inc remen t s and t he appa ren t pd,max v a l u e n e a r e s t e a c h time l i n e was m e a s u r e d ( c i r c l e d p o i n t s i n f i g . 1 O(b)) . These Pdlmax values were occas iona l ly supp lemen ted by d a t a from wel l -de f ined i nc ip i - e n t s k i d s w i t h i n t h e time h i s t o r y .
The d i s t i n c t i o n b e t w e e n r e s p o n s e modes A and B is o n l y made w i t h respect t o t h e f r i c t i o n - c o e f f i c i e n t d a t a . The p r e s s u r e a n d t o r q u e d a t a were always t r e a t e d as mode A data.
The a v e r a g e d r a g - f o r c e f r i c t i o n c o e f f i c i e n t i d developed by t h e a n t i s k i d sys tem dur ing a g iven t e s t is d e f i n e d by t h e e x p r e s s i o n
and was computed for each braking t e s t w i t h t h e u s e of n u m e r i c a l i n t e g r a t i o n techniques . (Ske refs. 13, 15, and 29.) The average maximum drag- force f r ic- t i o n c o e f f i c i e n t p d , max was d e r i v e d i n t h e same way a s Ed e x c e p t t h a t a f r i c t i o n - c o e f f i c i e n t prof i le formed by j o i n i n g t h e s t r a i g h t - l i n e s e g m e n t s b e t w e e n t h e f r i c t i o n c o e f f i c i e n t peaks was used. V a l u e s of pd,max are n o t a v a i l a b l e for to rque - l imi t ed b rak ing tests because t he maximum f r i c t i o n l e v e l could not be c o n f i r m e d . ( T o r q u e - l i m i t e d i n t h i s i n v e s t i g a t i o n r e f e r s t o t h e s i t u a t i o n w h e r e , for a g iven supp ly p re s su re , t he b rake t o rque is i n s u f f i c i e n t to cause a spin-down of t h e t i re . ) I t is a p p a r e n t t h a t no a n t i s k i d c y c l i n g o c c u r s when the b rake is torque- l imi ted .
-
-
The d r a g - f o r c e f r i c t i o n c o e f f i c i e n t t h a t is observed when t h e r e is no brak- i n g r e s u l t s f r o m t h e t i r e r o l l i n g r e s i s t a n c e a n d is assumed t o rema in cons t an t throughout a test r u n : t h i s a v e r a g e f r i c t i o n c o e f f i c i e n t i s l a b e l e d pr i n f i g - ure 10. For those tests on f l ooded su r f aces , u r also i n c l u d e s t h e r e s i s t a n c e a t t r i b u t e d to f l u i d drag (ref. 2 ) . When t h e r a t i o of t he ave rage deve loped 5d t o t h e maximum a c h i e v e d d r a g - f o r c e f r i c t i o n c o e f f i c i e n t Edrmax is computed, p r is subtracted from both the numerator and denominator t o isolate t h e f r i c - t i o n c o e f f i c i e n t a t t r i b u t e d t o t h e b r a k i n g e f f o r t .
-
L
11
The slope of t h e l e a s t - s q u a r e s l i n e t h r o u g h t h e o r i g i n , w h i c h f a i r s t h e - d a t a when pd - &- is p l o t t e d a s a f s n c t i o n of pd,max - Prr is d e f i n e d as t h e b r a k i n g - f r i c t i o n b e h a v i o r i n d e x Bb,F.
- -
S i d e - f o r c e f r i c t i o n c o e f f i c i e n t s . - T h e maximum s i d e - f o r c e f r i c t i o n c o e f - f i c i e n t llSImax f o r a yawed-wheel brak ing test was u s u a l l y o b t a i n e d when t h e yawed wheel was f r e e l y r o l l i n g p r i o r t o brake a p p l i c a t i o n b u t a f t e r s p i n - u p t r a n s i e n t s as snown i n f i g u r e l O ( a ) . (See refs. 23 and 30 for examples . ) O c c a s i o n a l l y , h o w e v e r , t h e v a r i a b i l i t y of Ps d u r i n g a run was so g r e a t t h a t a n a l t e r n a t e m e t h o d , i l l u s t r a t e d i n f i g u r e 1 0 ( b ) , was used. For t h i s method, a number of I-lsIrnax v a l g e s were ob ta ined du r ing t he b rak ing portion of t h e r u n near po in ts o f fu l l wheel -speed recovery , which ind ica ted a nomentary re lax- a t i o n of t h e b r a k i n g e f f o r t ( t h r e e c i r c l e d p o i n t s i n f i g u r e 1 O(b) ) . The lls,max p r o f i l e formed by j o i n i n g t h e s t r a i g h t - l i n e s e g m e n t s b e t w e e n t h e 1-1, peaks was n u m e r i c a l l y i n t e g r a t e d to e s t a b l i s h ps,max
-
-
1 f =f "s,max d t
The a v e r a g e s i d e - f o r c e f r i c t i o n c o e f f i c i e n t i is was d e r i v e d i n t h e same way €or each yawed-wheel brak ing t es t e x c e p t t h a t VS time h i s t o r i e s were used.
The slope o f t h e l e a s t - s q u a r e s l i n e t h r o u g h t h e o r i g i n , w h i c h f a i r s t h e d a t a when us is p lo t ted-as a f u n c t i o n of Us,max, is d e f i n e d as the co rne r ing - f r i c t i o n b e h a v i o r i n d e x B c , ~ .
- -
Power Terms
A s n o t e d i n r e f e r e n c e 6, t h e behavior of an an t i sk id sys t em can a l so be e x p r e s s e d i n terms o f t h e g r o s s s t o p p i n g power developed by the b rak ing sys tem < . ~ d by the s topp ing and co rne r ing power d i s s i p a t e d by t h e t i r e . These v a r i o u s power terms a r e d e f i n e d i n r e f e r e n c e 6 i n terms o f t h e c a r r i a g e s p e e d V, t h e t o t a l d r a g f o r c e F, p a r a l l e l t o t h e w h e e l p l a n e , t h e s i d e f o r c e Fy perpen- d i c u l a r to t h e w h e e l p l a n e , t h e yaw a n g l e $, a n d t h e s l i p r a t i o S. Time h i s - tories of some of these v a r i a b l e s d u r i n g a t y p i c a l a n t i s k i d b r a k i n g test a r e p r e s e n t e d i n f i g u r e 1 1 . S l i p r a t i o i s t h e i n s t a n t a n e o u s r a t i o o f t h e s l i p v e l o c i t y of the braked wheel V - r W to t h e c a r r i a g e s p e e d V and is g iven by t h e f o l l o w i n g e q u a t i o n :
V - rW s = - V
1 2
where r is t h e e f f e c t i v e r o l l i n g r a d i u s f o r t h e t e s t t i r e which was computed f rom the unbraked ro l l i ng d i s t ance and whee l - r evo lu t ion coun t fo r each run . The value of r var ied f rom 0.439 t o 0.474 m (1.44 t o 1.55 f t I r depending on the var ious combina t ions o f t i r e v e r t i c a l load and speed. The fo l lowing expres - s i o n s a r e d e f i n e d o v e r t h e i n t e r v a l b e t w e e n to and tf i n f i g u r e 1 1 .
Gross stopping power.- The g r o s s s t o p p i n g power Pd,g developed by the a n t i s k i d s y s t e m d u r i n g a braking test is de r ived f rom fo rces oppos ing t he d i r ec - t ion o f mot ion and is a measure o f t h e o v e r a l l b r a k i n g e f f o r t . The e x p r e s s i o n f o r t h a t power is
where F, cos $ + Fu s i n $ c o n v e r t s t h e m e a s u r e d d r a g a n d s i d e f o r c e s n o t e d i n f i g u r e 11 t o a s l n g l e d r a g force oppos ing ca r r i age mo t ion . The product of v e l o c i t y a n d time y i e l d s t h e d i s t a n c e t h r o u g h w h i c h t h e f o r c e acts and completes t h e work e q u a t i o n . D i v i d i n g t h e w o r k by t he du ra t ion p rov ides a measure of t h e power be ing genera ted .
Tire stopping power.- A measure of t h e s t o p p i n g power d i s s i p a t e d by t h e t i r e Pdr is g iven by
1 - P d , t - [ (F, cos $ + Fy s i n $)VS + Fy s i n $ ( l - S)V] d t ( 8 )
t f - t o
where t he ca r r i age speed is m u l t i p l i e d by t h e s l i p r a t i o t o o b t a i n t h e s l i p v e l o c i t y ( r e l a t i v e s p e e d b e t w e e n t i re and pavement). The l a s t term i n equa-
t i o n (8) , Fy s i n $ ( l - S)V d t r is an estimate of t h e w o r k d i s s i p a t e d by t h e
r o l l i n g r e s i s t a n c e r w h i c h is a t t r i b u t e d to a yawed r o l l i n g t i r e . The v a l u e of P d , t is thus an i n d i c a t o r of t h e t r e a d wear a s s o c i a t e d w i t h t h e b r a k i n g e f f o r t .
1 3
T i r e c o r n e r i n g power.- The c o r n e r i n g power d i s s i p a t e d by t h e t i r e pelt can be c lose ly approximated by t h e e x p r e s s i o n
where Fy cos $ - Fx s i n J, conver t s t he measu red s ide and d rag fo rces to a s i n - g l e s i d e force p e r p e n d i c u l a r to t h e d i r e c t i o n of motion and where (1 - S)V is the braked wheel speed which, when m u l t i p l i e d by s i n $, y i e l d s t h e t i r e l a t e r a l v e l o c i t y . The value of PC, t is a n i n d i c a t o r o f t h e t r e a d wear a s s o c i a t e d w i t h t h e c o r n e r i n g effor t .
RESULTS AND DISCUSSION
A s men t ioned p rev ious ly , pe r t inen t da t a ob ta ined f rom a l l t h e a n t i s k i d brak ing tests a r e p r e s e n t e d i n t a b l e I , toge the r w i th pa rame te r s wh ich desc r ibe each tes t c o n d i t i o n . I n a d d i t i o n , time h i s t o r i e s o f k e y p a r a m e t e r s f r o m a l l t h e tests are p r e s e n t e d i n the appendix . The tabular da ta and the time h i s t o r i e s i n t h e a p p e n d i x are g iven fo r t he conven ience o f t he user i n p l o t t i n g t h e d a t a i n ways o t h e r t h a n t h o s e p r e s e n t e d i n t h i s r e p o r t . The f o l l o w i n g s e c t i o n s descr ibe the b rak ing-sys tem behavior , the t i re f r i c t i o n a l b e h a v i o r u n d e r s k i d control, and the ant iskid-system behavior under a v a r i e t y o f o p e r a t i n g cond i t ions .
Braking-System Behavior
I n o r d e r to s t u d y t h e b e h a v i o r o f t h e a n t i s k i d s y s t e m , it is f i r s t n e c e s s a r y to e s t a b l i s h t h e r e s p o n s e c h a r a c t e r i s t i c s o f t h e b r a k i n g s y s t e m a n d its compo- nents . The fo l lowing paragraphs descr ibe the b rak ing-sys tem hydraul ic response , t he b rake p re s su re - to rque r e sponse , and t he an t i sk id - sys t em r e sponse to t r a n s i e n t f r i c t i o n c o n d i t i o n s .
Hydraul ic response.- Time h i s t o r i e s from run 32 are p r e s e n t e d i n f i g u r e 1 2 to i l l u s t r a t e t h e h y d r a u l i c r e s p o n s e c h a r a c t e r i s t i c s o f t h e a n t i s k i d b r a k i n g system. The h y d r a u l i c l a g s a s s o c i a t e d w i t h b r a k e a p p l i c a t i o n c a n b e d e t e r m i n e d by e x a m i n i n g t h e a n t i s k i d i n l e t p r e s s u r e a n d t h e b r a k e p r e s s u r e . A t b rake a p p l i c a t i o n , t h e a n t i s k i d i n l e t p r e s s u r e q u i c k l y r i s e s to the sys t em p re s su re of approximately 13 MPa (1 900 ps i ) and r ema ins s t eady for the remainder o f the tes t . There is a l a g o f 1 0 msec b e f o r e t h e p r e s s u r e i m p u l s e is s e e n a t t h e b r a k e , a n d t h i s l a g is a t t r i b u t e d to f l o w r e s t r i c t i o n s t h r o u g h a p p r o x i m a t e l y 4 m (13 f t ) o f h y d r a u l i c l i n e ( i n s i d e d i a m e t e r o f 0.81 cm (0.32 in . ) ) wh ich s e p a r a t e t h e two p r e s s u r e t r a n s d u c e r s . About 1 . 7 sec a r e r e q u i r e d f o r t h e b r a k e pressure to reach a maximum value , and the rate o f t h i s p r e s s u r e a p p l i c a t i o n a n d a l l subsequent pressure r e a p p l i c a t i o n s is c o n t r o l l e d by the an t i sk id - sys t em modu- l a t i o n or i f ice.
1 4

, 1: 1 The initial brake-pressure ramp may weigh more heavily in the determination
of the antiskid-system braking behavior during these track tests than during an actual airplane braking stop. During the track tests, several runs are d
I i necessary to cover a representative speed range and the initial brake-pressure
ramp is repeated for each run; however, during an airplane braking stop, this initial brake-pressure ramp might appear only once.
The hydraulic lags associated with brake release under antiskid control can be determined by examining the brake-system behavior following the deep skid approximately 7 sec into the run described by figure 12. The antiskid system senses the skid when the wheel deceleration increases beyond the threshold level identified by the dashed line. There is a lag of 20 msec following detection of the skid before the brake pressure begins to reduce and an additional 120 msec is required to complete the pressure dump. The brake torque release lags the pressure dump by another 60 msec. Thus, hydraulic lags totaling approximately 200 msec are associated with this antiskid brake release cycle. This duration is greater than the 80 msec required for the tire to lock up following a transi- tion from a dry to a damp section of the runway. A portion of these lags may be attributed to the hydraulic line lengths necessary to install the antiskid sys- tem on the test carriage.
Pressure-torque response.- The relationship between brake pressure and brake torque is shown in figure 13 where arrowheads are used to indicate increas- ing pressure for the initial braking cycle and decreasing pressure during the brake release at the end of the run. The figure clearly shows that the hys- teretic nature of the pressure-torque relationship for this friction condition results in substantial variations in the brake torque for a given brake pressure. This characteristic is most notable during the first brake cycle when the tem- perature of the brake is essentially the ambient temperature and would suggest that the temperature of the brake has a significant influence on its ability to develop torque. According to reference 31 , the pressure-torque response dur- ing the initial brake cycle may also be affected by gradual equilization of force through the stack of stators and rotors as keyway friction is overcome. For the test shown, most of the cycling occurred at brake pressures between 4 and 11 MPa (600 and 1500 psi) .
The large hysteresis loop associated with the initial brake cycle may weigh more heavily in the determination of the antiskid-system braking behavior during these track tests than during an actual airplane braking stop and for the same reason as noted previously for the initial brake-pressure ramp.
Response to runway friction transition.- The adaptive characteristics of the antiskid system are illustrated by time histories of the wheel speed, wheel angular acceleration, brake pressure, and drag-force friction coefficient as pre- sented in figure 14 for two transient runway friction conditions. The response of the braking system to a single transition from a dry to a flooded runway is presented in figures 1 4 (a) and 14 (b) for nominal carriage speeds of 41 knots and 97 knots, respectively. At both test speeds, the brake pressure reached a nominal system operating pressure of 13 MPa (1950 psi) and was not modulated by the antiskid system on the dry surface. Upon entering the flooded section, the wheel in both tests rapidly decelerated to a deep skid, as noted by the immedi- ate reduction in wheel speed. At a carriage speed of 41 knots, the antiskid
1 5
system reacted quickly to permit the wheel t o recover from the skid, and t h e remainder of the braking test was conducted w i t h proper antiskid protection. As shown i n figure 1 4 (b) , a t a carriage speed of 97 knots, the wheel did not recover immediately a f t e r a l l brake pressure was released. Instead, the wheel recovered from the skid when t h e carriage speed was reduced to 92 knots. The predicted spin-up hydroplaning speed for the t i re , based upon a t i r e i n f l a t ion pressure of 0.97 MPa (140 p s i ) , was 91 k n o t s ( re f . 5), which is equivalent to a wheel speed of approximately 15.6 rps; t h u s , once t h e t i r e had spun down, insufficient torque was being developed between the t i r e and the pavement t o spin up the t i r e u n t i l the carriage speed was reduced.
Time his tor ies of t e s t runs that were selected to i l lustrate the response of the braking system during the transition from a flooded to a dry runway sur- face are presented i n f igures 1 4 (c ) and 1 4 ( a ) , for nominal carriage speeds of 67 knots and 98 knots, respectively. I n both tes ts , the wheel was spun up t o carriage speed on a dry surface prior to entering the flooded test section, and the brakes were applied at or near the s t a r t of the flooded section. Fig- ure 1 4 (c ) shows t h a t , a t 67 knots, the antiskid system modulates the brake pres- sure on the flooded portion of the runway. Upon reaching the dry section, a t about 5 sec, the brake pressure increased a t a rate controlled by the modulat- ing or i f ice . N o further pressure modulation was observed for the remainder of the run.
For the test run a t a nominal carriage speed of 98 knots ( f i g . 14(d)), the wheel commenced to spin down on the flooded section before brakes were applied due to dynamic t i r e hydroplaning. The calculated spin-down hydroplaning speed was 106 knots, which is equivalent to a wheel speed of approximately 18.2 rps ( ref . 5 ) . The antiskid system acted as designed and prevented the application of pressure to the brake. Upon reaching the dry section, the wheel rapidly spun up to the carriage speed, and approximately 1.5 sec later, the brake pressure began to increase at a rate controlled again by the modulating or i f ice .
Tire Frictional Behavior Under S k i d Control
The runway/tire maximum drag- and side-force friction values are discussed here to provide a quantitative measure of the surface condition and for use i n updating t i r e f r i c t ion models w i t h data from realist ic antiskid operating conditions.
Effect of t e s t parameters on maximum drag-force friction coefficient.- The average maximum drag-force fr ic t ion coeff ic ient jid,max as developed by the unyawed t i r e under dry, damp, and flooded conditions is presented as a function of carriage speed i n f igure 15. The fair ings i n the f igure are l inear least- squares curve f i ts of the data. A s expected, values of pd,max for the wet runways are substantially lower than those for the dry runway, and the d i f fe r - ence is greater for the flooded surface than for the damp surface, particularly a t the higher speeds. An extrapolation of the linear curve f i t of Pd,max for the flooded condition would be seen to approach negligible values near the pre- d ic ted t i re spin-down hydroplaning speed of 106 knots (ref. 5) . Also noted i n the figure is the maximum value of the drag-force fr ic t ion coeff ic ient , 0.78, which was predicted from the empirical expression developed i n reference 32 for
-
.-
16
I! t h e test t i r e o p e r a t i n g a t v e r y low speeds. I t is a p p a r e n t t h a t t h e d r y d a t a I for Pd,max is i n good ag reemen t w i th t h i s p red ic t ion .
: p
The f r i c t i o n d a t a of f i g u r e 1 5 were o b t a i n e d a t a yaw ang le o f 00. The f a i r i n g s of t h e s e d a t a are r e c o n s t r u c t e d i n f i g u r e 1 6 , t o g e t h e r w i t h c o r r e s p o n d - i n g d a t a o b t a i n e d a t yaw a n g l e s of lo, 3 O , and 6O, to show t h e e f f e c t o f yaw ang le on pd ,max- The f i gu re shows t ha t t he e f f ec t o f yaw a n g l e is dependent upon t h e s u r f a c e c o n d i t i o n a n d c a r r i a g e s p e e d . W i t h t h e i n t r o d u c t i o n of yaw, Dd,max is reduced on t he damp s u r f a c e a n d is r e l a t i v e l y u n a f f e c t e d when t h e s u r f a c e is f looded . On t h e d r y s u r f a c e , iid ,max is shown to d e c r e a s e o n l y when t h e yaw a n g l e was i n c r e a s e d to 6O.
The effect o f t i r e tread wear on 'pd,max is p r e s e n t e d i n f i g u r e 1 7 , i n which values of fid,max for t i res having new and worn treads are p l o t t e d as a f u n c t i o n of c a r r i a g e s p e e d for t h r e e test s u r f a c e c o n d i t i o n s . The new t r e a d d a t a were a g a i n o b t a i n e d from t h e f a i r e d c u r v e s of f i g u r e 1 5 . T h e d a t a i n d i c a t e t h a t when t h e new tread is r e p l a c e d by a worn t r e a d , t h e r e is l i t t l e degrada- t i o n i n !id,max on the d r y s u r f a c e , b u t t h e r e is a pronounced reduct ion on t h e damp and f l ooded runway su r faces . These t r ends a r e i n good ag reemen t w i th simi- l a r t r e n d s n o t e d i n r e f e r e n c e s 2, 6 , 7, and 8 .
Effect of t e s t parameters on maximum s i d e - f o r c e f r i c t i o n c o e f f i c i e n t . - The maximum side-force f r i c t i o n c o e f f i c i e n t s d e v e l o p e d by t h e yawed r o l l i n g t i r e under dry, damp, and f l ooded cond i t ions are p l o t t e d as a f u n c t i o n of c a r r i a g e s p e e d i n f i g u r e 1 8 . The f a i r i n g s i n t h e f i g u r e are l i n e a r l e a s t - s q u a r e s c u r v e f i t s o f t h e d a t a . As d i s c u s s e d p r e v i o u s l y , t h e s e c o e f f i c i e n t s were g e n e r a l l y measured dur ing the unbraked por t ion of t h e run and, for t h e wet runway s u r f a c e , a r e g e n e r a l l y lower t h a n t h o s e for t h e dry runway, wi th the d i f fe rence becoming g r e a t e r w i t h i n c r e a s i n g yaw a n g l e , water depth, and speed. As e x p e c t e d , t h e v a l u e s of ps,max i n c r e a s e w i t h i n c r e a s i n g yaw a n g l e f o r t h e range of yaw a n g l e s t e s t e d . On the f l ooded su r f ace , p s ,max is shown to approach zero as the speed a p p r o a c h e s t h e p r e d i c t e d t i r e spin-down hydroplaning speed of 106 knots .
-
The effect o f t r e a d wear on Es,max is shown i n f i g u r e 1 9 w h e r e t h e v a l u e s of jis,max a t a yaw a n g l e of 6O on dry, damp, and flooded runway s u r f a c e s are p l o t t e d as a f u n c t i o n of c a r r i a g e s p e e d . The new tread d a t a were o b t a i n e d from t h e fa i red c u r v e s i n f i g u r e 1 8 f o r a yaw ang le o f 6O. On t h e d r y a n d damp sur - faces t h e v a l u e s of j?s,max were reduced when t h e new t r e a d was r e p l a c e d by a worn tread. On t h e f looded surface only one da tum poin t is a v a i l a b l e from t h e worn t i r e tests and it is i n close ag reemen t w i th t he da t a f rom the new t i r e tests.
In t e rac t ion be tween b rak ing .and corner ing . - The in te rac t ion be tween brak ing a n d c o r n e r i n g i s - i l l u s t r a t e d by t h e typical y a w e d - t i r e f r i c t i o n r e s p o n s e to an t i sk id b rak ing on d ry runway surface shown i n f i g u r e 20. The drag- and side- f o r c e f r i c t i o n c o e f f i c i e n t s p d and p s are p l o t t e d as a f u n c t i o n of s l i p r a t io f o r t h e t i re yawed to 6O and ope ra t ing a t a nomina l ca r r i age speed of 56 knots . The d a t a p r e s e n t e d i n t h e f i g u r e i l l u s t r a t e t h e i r r e g u l a r n a t u r e o f t h e f r i c t i o n c o e f f i c i e n t to which the an t i sk id b rak ing sys tem must respond. The apparent ly random p e r t u r b a t i o n s may r e s u l t f r o m a combinat ion of such factors as small f l u c - t u a t i o n s i n t h e t i r e v e r t i c a l l o a d d u e to r u n w a y u n e v e n n e s s , f l e x i b i l i t y i n t h e wheel suppor t which could be reflected i n t h e m e a s u r e d d r a g a n d s i d e forces,
17
v a r i a t i o n s i n t h e r u n w a y surface t e x t u r e , t i re and brake temperatures, a n d t h e sp r ing coup l ing p rov ided by t he t i r e between the wheel and the pavement . R e f - e r e n c e 28 d i s c u s s e s some o f t h e s e factors i n more d e t a i l . The f i g u r e also demon- strates t h e d e t e r i o r a t i o n i n t ire c o r n e r i n g c a p a b i l i t y w i t h i n c r e a s e d b r a k i n g e f f o r t ( h i g h e r s l i p r a t i o ) . The v a l u e of Us is reduced approximately 70 per- c e n t a t a s l i p ra t io o f 0.4. T h i s c o r n e r i n g r e d u c t i o n d u r i n g t h e b r a k i n g c y c l e s is c o n s i s t e n t w i t h s i m i l a r c o r n e r i n g r e d u c t i o n s n o t e d d u r i n g p r e v i o u s a n t i s k i d brak ing tests ( r e f s . 1 , 6, 7, and 8) a n d f u r t h e r i l l u s t r a t e s t h e c o r n e r i n g / braking dilemma faced by a n t i s k i d d e s i g n e r s .
E f f e c t o f c y c l i c b r a k i n g o n maximum d r a g - f o r c e f r i c t i o n c o e f f i c i e n t s . - So f a r , t h e f r i c t i o n d a t a p r e s e n t e d h e r e i n were d e r i v e d from c y c l i c b r a k e o p e r a - t i o n s . However, t h e r e is i n t h e l i t e r a t u r e a l a r g e body of t i r e f r i c t i o n d a t a a v a i l a b l e w h i c h were ob ta ined unde r s ing le -cyc le cond i t ions , and a d i s c u s s i o n of t h e two d a t a sets is a p p r o p r i a t e . A comparison of v a l u e s of udfmaX mea- s u r e d d u r i n g s i n g l e - c y c l e b r a k i n g tests made w i t h o u t a n t i s k i d p r o t e c t i o n a n d the ave rage of cor responding va lues measured under the same tes t c o n d i t i o n s w i t h t h e a n t i s k i d s y s t e m o p e r a t i o n a l is p r e s e n t e d i n f i g u r e 21. The s i n g l e - c y c l e d a t a were ob ta ined approx ima te ly 5 y r p r i o r to t h e p r e s e n t a n t i s k i d b r a k - ing tests a n d w e r e p r e v i o u s l y r e p o r t e d i n r e f e r e n c e s 6 t o 8 . I n f i g u r e 2 1 , d a t a are p r e s e n t e d s e p a r a t e l y for dry , damp, and f looded test c o n d i t i o n s a n d f o r a l l t h e t e s t cond i t ions combined . These da t a i nc lude coe f f i c i en t s for tests a t s i m - i l a r speeds , yaw a n g l e s , v e r t i c a l loads, and for worn as well a s new t read con- f i g u r a t i o n s . The d a t a f o r e a c h test c o n d i t i o n are f a i r e d by a l e a s t - s q u a r e s s t r a i g h t l i n e t h r o u g h t h e plot o r i g i n s . The d a t a i n d i c a t e t h a t t h e maximum drag- f o r c e f r i c t i o n c o e f f i c i e n t s o b t a i n e d from t h e s i n g l e - c y c l e b r a k i n g tests tend to be lower t h a n t h e a v e r a g e maximum c o e f f i c i e n t d e v e l o p e d b y a n t i s k i d s y s t e m o n t h e d r y a n d damp test s u r f a c e s . On t h e f l o o d e d s u r f a c e , t h e two sets of d a t a are i n close agreement. When t h e d a t a f r o m a l l t h r e e s u r f a c e w e t n e s s c o n d i t i o n s are c o m p a r e d s i m u l t a n e o u s l y , t h e l e a s t - s q u a r e s c u r v e f i t i n d i c a t e s t h a t t h e s i n g l e - c y c l e data are a p p r o x i m a t e l y 1 0 p e r c e n t lower t h a n t h e maximum drag- force f r i c t i o n c o e f f i c i e n t d e v e l o p e d by t h e a n t i s k i d s y s t e m . The agreement between t h e two sets o f d a t a is q u i t e good cons ide r ing t he time span be tween acqu i s i t i on o f t he UdImax va lues . However , the impl ica t ion is q u i t e clear t h a t c a u t i o n shou ld be exe rc i sed i n any e s t ima te o f an t i sk id - sys t em b rak ing behav io r t ha t is b a s e d s o l e l y upon Udlmax Values obtained f rom s ingle-cycle tests.
Antiskid-System Behavior Analysis
B r a k i n g b e h a v i o r . - I n t h i s s e c t i o n , f o u r terms are used t o d e s c r i b e t h e e x t e n t of t h e b r a k i n g e f f o r t a n d _to examine t h e a n t i s k i d b e h a v i o r : ( 1 ) t h e pressure braking behavior index 6b lp , which assesses t h e a b i l i t y o f t h e s y s t e m to c o n t r o l b r a k e p r e s s u r e : ( 2 ) t h e t o r q u e b r a k i n g b e h a v i o r i n d e x Bb,Tr which - a s s e s s e s t h e s y s t e m t o r q u e c o n t r o l : ( 3 ) t h e f r i c t i o n - b r a k i n g b e h a v i o r i n d e x Bb ,Ff wh ich measu res t he ab i l i t y of t h e a n t i s k i d s y s t e m t o u s e t h e apparent maxi- i m u m f r i c t i o n c o e f f i c i e n t a t t h e t i r e / r u n w a y i n t e r f a c e : a n d ( 4 ) t h e t o t a l s t o p - p ing power Pd, t h a t is developed by t h e a n t i s k i d s y s t e m .
-
P r e s e n t e d i n f i g u r e 2 2 are plots of as a f u n c t i o n o f pmax, ’? as a f u n c t i o n of T,,,, and I”d - p r as a f u n c t i o n of udlmaX - fir. Data are p l o t t e d f o r a l l brak ing tests excep t t hose wh ich were t o r q u e - l i m i t e d t h r o u g h o u t t h e
- - - -
1 8
e n t i r e r u n , t h o s e i n v o l v i n g t i r e hydroplaning, and those performed to examine t h e e f f e c t s o f a runway f r i c t i o n t r a n s i t i o n . I n e a c h case, t h e d r y data and t h e w e t d a t a are p l o t t e d s e p a r a t e l y . The d i f f e r e n t s u r f a c e w e t n e s s c o n d i t i o n s are denoted by d i f f e r e n t s y m b o l s , b u t n o d i s t i n c t i o n is made f o r t h e v a r i o u s t es t parameters such as c a r r i a g e s p e e d s , yaw ang les , and t i r e v e r t i c a l forces. The s o l i d l i n e i n e a c h plot r e p r e s e n t s t h e l i n e of per fec t agreement be tween the average deve loped and maximum achieved behavior parameter; it h a s a u n i t slope and is denoted as t h e l i n e o f i d e a l b e h a v i o r . T h e d a s h e d l i n e i n e a c h plot is t h e l e a s t - s q u a r e s f i t pas s ing t h rough t he plot o r i g i n . T h e slope of e a c h d a s h e d l i n e r e p r e s e n t s t h e a v e r a g e b r a k i n g b e h a v i o r i n d e x f o r e a c h d a t a set. (See f i g . 16 of re f . 26 . )
On t h e d r y r u n w a y s u r f a c e s , t h e a v e r a g e b r a k i n g b e h a v i o r i n d e x e s Bb determined from t h e p r e s s u r e , t o r q u e , a n d f r i c t i o n ra t ios vary between 0.74 and 0.81, a d i f f e r e n c e of approximate ly 9 p e r c e n t . On t h e w e t runway surfaces, t h e v a r i a t i o n i n $ b is between 0.69 and 0.78, a d i f f e r e n c e o f a p p r o x i m a t e l y 13 pezcent . A comparison of t h e v a l u e s f o r t he Wet runway s u r f a c e s w i t h t h e Bb v a l u e s f o r t h e d r y runway s u r f a c e s i n d i c a t e s a r e d u c t i o n o f 1 2 p e r c e n t and 7 p e r c e n t i n t h e p r e s s u r e a n d f r i c t i o n b r a k i n g b e h a v i o r i n d e x e s , respec- t i v e l y , a n d a n i n c r e a s e o f 3 p e r c e n t i n t h e torque braking behavior index. Thus , f i gu re 22 g e n e r a l l y shows t h a t t h e a n t i s k i d b r a k i n g s y s t e m s u f f e r s a degraded brak ing- index leve l on t h e w e t runway s u r f a c e s , i n a d d i t i o n to the obv i - o u s r e d u c t i o n i n f r i c t i o n c o e f f i c i e n t . A l t h o u g h t h e a n t i s k i d b r a k i n g b e h a v i o r i ndexes de r ived from t h e t h r e e p a r a m e t e r s g i v e s i m i l a r resu l t s , s u f f i c i e n t d i f - f e r e n c e s s t i l l e x i s t to s u g g e s t t h a t t h e t h r e e i n d e x e s s h o u l d n o t b e u s e d i n t e r - changeably as a measure o f the b rak ing behavior . I t s h o u l d a lso be emphasized t h a t t h e b r a k i n g b e h a v i o r i n d e x e s are based upon maximum ach ieved va lues of p r e s s u r e , torque, a n d f r i c t i o n w h i c h may va ry f rom one an t i sk id sys t em to ano the r , and any compar i sons be tween d i f f e ren t an t i sk id sys t ems based so l e ly upon these i ndexes may b e t e c h n i c a l l y m i s l e a d i n g s i n c e t h e r e is no common b a s e for compar i son .
-
-
To isolate t h e effect t h a t v a r i o u s t es t parameters have on the p ressure , torque, and f r i c t i o n i n d e x e s , d a t a from f i g u r e 22 are p l o t t e d i n f i g u r e s 23 to 27. Each f i g u r e is d i v i d e d i n t o three parts: ( a ) p r e s s u r e i n d e x e s , ( b ) tor- q u e indexes, and (c) f r i c t i o n i n d e x e s . E a c h p l o t i n c l u d e s t h e l i n e o f ideal b e h a v i o r a n d t h e l e a s t - s q u a r e s f i t p a s s i n g t h r o u g h t h e o r i g i n , from which t h e average braking behavior index Bb is de termined . The t rends observed for some tes t c o n d i t i o n s may be i n f luenced by a small sample s i ze .
The effect o f ca r r i age speed on b rak ing behav io r i ndexes is shown i n f i g - ure 23. The data i n d i c a t e t h a t i n g e n e r a l t h e effect of i n c r e a s i n g speed is to reduce t he pressure, t o r q u e , a n d f r i c t i o n i n d e x e s a n d t h i s t r e n d is o b s e r v e d f o r a l l t h r e e s u r f a c e w e t n e s s c o n d i t i o n s . N o d a t a are a v a i l a b l e a t 1 0 0 k n o t s o n t h e f looded runway s u r f a c e d u e to t i r e hydroplaning.
F i g u r e 24 p r e s e n t s t h e effect of yaw angle on the b rak ing behavior indexes . The d a t a i n d i c a t e t h a t t h e s e i n d e x e s are g e n e r a l l y h i g h e r for t h e yawed b r a k i n g tests t h a n f o r t h e unyawed braking tests under a l l s u r f a c e w e t n e s s c o n d i t i o n s .
The e f f e c t of v a r i a t i o n s i n t h e v e r t i c a l force on t he b rak ing behav io r indexes is shown i n f i g u r e 25. No data are a v a i l a b l e f o r v e r t i c a l forces
19

greater than 89 kN (20 000 l b f ) on t he dry runway s u r f a c e s a n d n o c o n s i s t e n t t r e n d s were observed for the r ema in ing test c o n d i t i o n s .
shown i n f i g u r e 26 is t h e e f f e c t of tread wear on the b rak ing behavior indexes . On t h e dry runway su r faces , t he i ndexes are i n s e n s i t i v e to t i r e t r e a d wear. under damp c o n d i t i o n s t h e i n d e x e s are lower when t h e new t r e a d is replaced w i t h a worn tread. On t h e flooded runway t h e opposite t r e n d is obse rved , bu t t h i s is probably due to t h e small sample s i z e .
P r e s e n t e d i n f i g u r e 27 is t h e e f f e c t of sys tem response mode o n t h e brak- i n g b e h a v i o r i n d e x e s . I n s u f f i c i e n t data a r e a v a i l a b l e to d i s c u s s t h e effect of response mode on t he d ry runway su r faces and t hese data are n o t plotted. On t h e wet runway su r faces , however , t he data i n d i c a t e t h a t mode B system response produces s i g n i f i c a n t i n c r e a s e s i n t h e b r a k i n g b e h a v i o r i n d e x e s o v e r t h o s e o b t a i n e d from mode A o p e r a t i o n ; t h i s was obse rved fo r a l l t h ree i ndexes .
I n summary, t h e data p r e s e n t e d i n f i g u r e s 23 to 27 i m p l y t h a t t h e b r a k i n g behavior of t h e a n t i s k i d s y s t e m would n o t be a d v e r s e l y a f f e c t e d by cross-wind o p e r a t i o n s ( y a w - a n g l e e f f e c t s ) or f l u c t u a t i o n s i n t h e t i r e v e r t i c a l l o a d i n g b u t might be degraded by e x c e s s i v e t r e a d wear on damp runway surfaces. These resul ts also i n d i c a t e t h a t t h e a n t i s k i d s y s t e m w i l l be more e f f e c t i v e as t h e a i r c r a f t speed is reduced du r ing t he l and ing rollout. F i n a l l y , t h e data i n d i c a t e t h a t h igher an t i sk id-sys tem brak ing behavior indexes are achieved when t h e a n t i s k i d s y s t e m o p e r a t e s i n r e s p o n s e mode B.
The g r o s s s t o p p i n g power Pd,g (eq. ( 7 ) ) d e v e l o p e d b y t h e a n t i s k i d s y s t e m , which is a measure of t h e o v e r a l l a n t i s k i d b r a k i n g e f f o r t , is l i s t e d i n table I f o r e a c h tes t c o n d i t i o n . F i g u r e 28 p r e s e n t s bar c h a r t s o f t h e s e data i n terms of Fd,gt a numerical average of a l l t h e data f o r a g i v e n test condi t ion . For example, the dry, 50-knot bar graph is t h e a v e r a g e of a l l d r y r u n s a t 50 k n o t s , i n c l u d i n g t h e v a r i o u s yaw a n g l e s , v e r t i c a l forces, a n d t r e a d c o n f i g u r a t i o n s . Data f rom torque- l imi ted tests and from tests i n v o l v i n g t i r e hydroplaning are i n c l u d e d i n t h e f igure, b u t no data are inc luded from tests performed under t r a n s i e n t runway f r i c t i o n c o n d i t i o n s . As expec ted , because o f h ighe r ava i l ab le f r i c t i o n c o e f f i c i e n t s , t h e g r o s s s t o p p i n g power on t h e d r y surface is much h i g h e r t h a n t h a t o n t h e wet runway s u r f a c e s . On t h e d r y s u r f a c e , i n c r e a s e s w i t h c a r r i a g e speed and to a lesser e x t e n t w i t h i n c r e a s i n g v e r t i c a l force and with a new tread c o n f i g u r a t i o n ; t h e w h e e l yaw a n g l e appears to have no cons is ten t e f fec t . On t h e wet s u r f a c e s , i n c r e a s e s w i t h c a r r i a g e speed and decreases wi th yaw a n g l e ; t h e v a l u e o f P d , g is h i g h e r f o r t h e h e a v y w e i g h t c o n d i t i o n ( v e r t i c a l f o r c e g r e a t e r t h a n 8 9 kN (20 000 l b f ) ) a n d f o r t h e new tread c o n f i g u r a t i o n .
The s topping power d i s s i p a t e d by t h e t i r e a l o n e P d , t (eq. (8) ) is o n l y a small f r a c t i o n o f t h e g r o s s s t o p p i n g power, b u t it does p r o v i d e a n i n d i c a t i o n of t h e t r e a d wear a s s o c i a t e d w i t h t h e b r a k i n g e f f o r t ; t h u s , t h e ideal a n t i s k i d sys- tem would maximize Pd,g and minimize P d , t . v a l u e s o f P d , t are l i s t ed i n table I fo r each tes t c o n d i t i o n ; t h e d a t a a r e a v e r a g e d a n d p l o t t e d as ba r g raphs i n f i g u r e 29 to show t h e effects a t t r i b u t e d to test parameter v a r i a t i o n s . Data from a l l tests except those per formed to s t u d y t h e e f f e c t o f a runway f r i c t i o n t r a n s i t i o n are i n c l u d e d i n t h e f i g u r e . The f i g u r e shows t h a t for cor responding c o n d i t i o n s , is h i g h e r o n t h e d r y s u r f a c e t h a n o n t h e wet s u r f a c e e x c e p t for t h e h e a v y v e r t i c a l force tests. On t h e d r y surface, P d , t g e n e r a l l y
-
i n c r e a s e s w i t h c a r r i a g e speed and yaw a n g l e ( f o r yaw a n g l e s g r e a t e r t h a n lo). The v a l u e of ?id,t is reduced for t h e h e a v y v e r t i c a l force ( g r e a t e r t h a n 8 9 kN (20 000 l b f ) ) and when t h e new t r e a d is r e p l a c e d w i t h .a worn t read . On t h e w e t runway s u r f a c e s , F d , t is higher a t a c a r r i a g e s p e e d of 1 0 0 k n o t s t h a n f o r t h e o t h e r test s p e e d s a n d i n c r e a s e s w i t h v e r t i c a l force. The v a l u e of ",t decreases when t h e yaw a n g l e is increased beyond l o and when t h e new t r e a d 1s r e p l a c e d w i t h a worn t r e a d . The d a t a p r e s e n t e d i n f i g u r e 29 i n d i c a t e t h a t t h e most s e v e r e tread wear occurs dur ing combined b rak ing and co rne r ing ope ra t ions on a d r y s u r f a c e .
The ra t io of t i r e s t o p p i n g power to g r o s s s t o p p i n g power for e a c h tes t is p l o t t e d as a f u n c t i o n of Bdrmax i n f i g u r e 30. Data are n o t i n c l u d e d f o r to rque- l imi ted tests, f o r tests pe r fo rmed unde r t r ans i en t runway f r i c t ion cond i - t i o n s , or f o r tests i n v o l v i n g t i r e hydrop lan ing . The l i nea r cu rve wh ich f a i r s t h e d a t a r e p r e s e n t s a l e a s t - s q u a r e s €it a n d i n d i c a t e s t h a t t h e r a t i o i n c r e a s e s s l i g h t l y w i t h t h e f r i c t i o n l e v e l . T h i s w o u l d s u g g e s t a n i n c r e a s e i n t r e a d wear ( a s is also suggested by the amount of rubber deposi ted on the runway) during b r a k i n g tests o n t h e d r y s u r f a c e ) . The r a t i o of Pd, to Pd,g appears to be i n s e n s i t i v e to v a r i a t i o n s i n t h e yaw a n g l e for t h i s a n t i s k i d b r a k i n g s y s t e m .
Corner ing behavior . - Ant i sk id sys tems are no t des igned t o maximize corner- ing per formance s ince good c o r n e r i n g is n o t compatible with heavy braking but c o r n e r i n g is i m p o r t a n t f o r d i r e c t i o n a l c o n t r o l , e s p e c i a l l y when cross winds a re p r e s e n t .
P r e s e n t e d i n f i g u r e s 31 t o 33 a re p l o t s of j is as a f u n c t i o n of -
" to show t h e e f f e c t s e v e r a l t es t parameters have on t h e co rne r ing behav io r i ndexes f3,,,. The tes t p a r a m e t e r l e v e l s a n d s u r f a c e w e t n e s s c o n d i t i o n s are p l o t t e d s e p - a r a t e l y . Each plot i n c l u d e s t h e l i n e o f i d e a l b e h a v i o r a n d t h e l e a s t - s q u a r e s f i t p a s s i n g t h r o u g h t h e plot o r i g i n from which t he ave rage co rne r ing behav io r i n d e x is o b t a i n e d . I t shou ld aga in be emphas ized t ha t t r ends obse rved for some tes t c o n d i t i o n s may be i n f l u e n c e d by a small sample s i z e .
The e f f e c t of yaw a n g l e o n t h e c o r n e r i n g b e h a v i o r i n d e x e s is shown i n f i g - u r e 31 . Data a r e p r e s e n t e d for a l l t h r e e w e t n e s s c o n d i t i o n s a t l o , 3O, and 6O. The tes t run a t go was on a damp runway surface. These indexes are somewhat higher on the dry runway surfaces than on t he w e t runway s u r f a c e s . The d a t a a l s o i n d i c a t e t h a t t h e s e i n d e x e s a r e g e n e r a l l y h i g h e r f o r t h e l o yaw a n g l e t h a n f o r t h e h i g h e r yaw a n g l e s .
F i g u r e 32 shows t h e e f f e c t o f c a r r i a g e s p e e d o n t h e c o r n e r i n g b e h a v i o r indexes. Only the 6O yaw a n g l e d a t a are p r e s e n t e d i n t h e f i g u r e . On t h e d r y s u r f a c e s , t h e c o r n e r i n g i n d e x e s d e c r e a s e w i t h s p e e d , w h e r e a s o n t h e damp run- way s u r f a c e s t h e s e i n d e x e s are r e l a t i v e l y i n s e n s i t i v e t o v a r i a t i o n s i n c a r r i a g e speed . A t 1 0 0 kno t s on t he f l ooded runway su r faces , hydrop lan ing e f f ec t s have c o m p l e t e l y e l i m i n a t e d t h e t i r e c o r n e r i n g c a p a b i l i t y .
P r e s e n t e d i n f i g u r e 3 3 is t h e effect of tread wear o n t h e c o r n e r i n g b e h a v i o r indexes . Again on ly the 6O yaw a n g l e data are p r e s e n t e d . A l l t h r e e s u r f a c e w e t - n e s s c o n d i t i o n s show a d e c r e a s e i n t h e i n d e x e s when a new t i r e is replaced by a worn t i r e , and t h i s d e c r e a s e is much more pronounced on the wet runway s u r f a c e s .
21
The c o r n e r i n g power d i s s i p a t e d by t h e t i r e PC, (eq. (9) ) n o t o n l y is i n d i c a t i v e of t h e o v e r a l l c o r n e r i n g c a p a b i l i t y of t h e t i r e d u r i n g t h e a n t i s k i d c o n t r o l l e d b r a k i n g b u t also p r o v i d e s a n i n d i c a t i o n o f t h e i n c r e a s e d t r e a d wear a s s o c i a t e d w i t h t h e s t e e r i n g e f f o r t . The e f f e c t s of test parameter v a r i a t i o n s on Pelt are p r e s e n t e d i n f i g u r e 34 as b a r g r a p h s . T h e d a t a i n d i c a t e t h a t PCl t va lues are, as e x p e c t e d , g e n e r a l l y h i g h e r o n t h e d r y s u r f a c e s t h a n o n t h e w e t surfaces f o r similar test parameter cond i t ions . The one excep t ion to t h i s t r e n d o c c u r s a t a ca r r i age speed o f 100 kno t s . The va lue o f Pc , t a l so i n c r e a s e s when t h e yaw a n g l e is i n c r e a s e d a n d , s u r p r i s i n g l y , when t h e new t r e a d is r e p l a c e d w i t h a worn t read . Al though B c , ~ is reduced fo r yaw a n g l e s g r e a t e r t h a n l o ( f i g . 3 1 ) t h e v a l u e s of P c , t i n c r e a s e d s u b s t a n t i a l l y when t h e yaw a n g l e was i n c r e a s e d ( f i g . 3 4 ) ; t h u s , b o t h power terms and behavior- index terms are needed when s t u d y i n g t h e c h a r a c t e r i s t i c s o f a n t i s k i d s y s t e m s .
- -
-
- -
SUMMARY OF RESULTS
An e x p e r i m e n t a l i n v e s t i g a t i o n was conducted a t t h e Langley Aircraft Landing L o a d s a n d T r a c t i o n F a c i l i t y to s tudy t he b rak ing and co rne r ing r e sponse o f a h y d r o m e c h a n i c a l l y c o n t r o l l e d a i r c r a f t a n t i s k i d b r a k i n g s y s t e m . The i n v e s t i g a - t ion, conducted on dry and wet runway s u r f a c e s , u t i l i z e d o n e main gear wheel, brake, and t i r e assembly of a McDonnell Douglas DC-9 ser ies 1 0 a i r p l a n e .
T h e e x p e r i m e n t a l i n v e s t i g a t i o n i n d i c a t e s t h e f o l l o w i n g results:
1 . During maximum brak ing , ave rage b rak ing behav io r i ndexes based upon b r a k e p r e s s u r e , torque, a n d d r a g - f o r c e f r i c t i o n c o e f f i c i e n t d e v e l o p e d by t h e a n t i s k i d s y s t e m were g e n e r a l l y h i g h e r on t h e d r y s u r f a c e s t h a n o n t h e wet s u r f a c e s .
2. On t h e w e t s u r f a c e s , t h e s e i n d e x e s were reduced a t h i g h e r c a r r i a g e speeds and when new t r e a d s were r e p l a c e d by worn t r e a d s .
3 . The th ree b rak ing behav io r i ndexes gave similar r e su l t s b u t t h e a g r e e - ment was n o t s u f f i c i e n t to allow them to be u sed i n t e rchangeab ly as a measure of the b rak ing behavior f o r t h i s a n t i s k i d s y s t e m .
4 . These b rak ing behavior indexes a re based upon maximum v a l u e s o f p r e s s u r e , torque, a n d d r a g - f o r c e f r i c t i o n c o e f f i c i e n t w h i c h may vary f rom system to sys- tem, and any compar i sons be tween d i f f e ren t an t i sk id sys t ems based so l e ly upon these i ndexes may b e t e c h n i c a l l y m i s l e a d i n g .
5. The a v e r a g e g r o s s s t o p p i n g power g e n e r a t e d by the b rake sys tem was c o n s i d e r a b l y h i g h e r o n t h e d r y s u r f a c e s t h a n o n t h e wet s u r f a c e s .
6. T h a t p o r t i o n o f t h e s t o p p i n g power which was d i s s i p a t e d by t h e t i r e and which provided an ind ica t ion of the t i r e wear was observed to b e g r e a t e s t d u r i n g combined braking and corner ing on a d r y s u r f a c e .
22

7. The average cornering behavior index based upon the side-force friction coefficient developed by the tire under antiskid control was decreased on wet surfaces, with yaw angles larger than 1 O , and when tires with treads were replaced by those with worn treads.
8. The interaction between braking and cornering forces indicated that during antiskid cycling, the side-force friction coefficient was significantly reduced during portions of the braking cycles.
9. During the transition from a dry to a flooded surface under heavy brak- ing, the wheel entered into a deep skid but the antiskid system reacted properly by quickly reducing brake pressure and performed normally during the remainder of the run on the flooded surface.
10. The brake-pressure recovery following transition from a flooded to a dry surface was shown to be a function of the antiskid modulating orifice.
Langley Research Center National Aeronautics and Space Administration Hampton, VA 23665 May 20, 1981
23

REFERENCES
1 . Tanner , John A.: Performance of a n A i r c r a f t T i r e Under Cyc l i c Brak ing and of a Cur ren t ly Opera t iona l An t i sk id Brak ing Sys t em. NASA TN D-6755, 1972.
2. Horne, Walter B.; and Le land , Traf ford J. W.: I n f l u e n c e of T i r e T r e a d P a t t e r n a n d Runway Sur face Cond i t ion on Brak ing F r i c t ion and Ro l l ing R e s i s t a n c e o f a Modern Aircraft T i r e . NASA TN D-1376, 1962.
3. Tracy, William v., Jr . : Wet Runway Aircraft C o n t r o l P r o j e c t (P-4 R a i n T i r e P r o j e c t ) . ASD-TR-74-37, U.S. A i r Force , O c t . 1974. (Avai lable f rom DTIC as AD A004 768.)
4 . Danhof, Richard H.; and Gent ry , Je rau ld R.: RF-IC Wet Runway Performance Evalua t ion . FTC-TR-66-6, U.S. A i r Force , May 1966. (Avai lable f rom DTIC as AD 486 049 .)
5. Horne, Walter B.; McCarty, John L. ; and Tanner, John A.: Some E f f e c t s o f Adverse Weather Condi t ions on Per formance of Ai rp lane Ant i sk id Braking Systems. NASA TN D-8202, 1976.
6 . Stubbs, Sandy M.; and Tanner, John A.: Behavior of Aircraf t Ant i sk id Brak- ing Systems on Dry and Wet Runway S u r f a c e s - A Veloci ty-Rate-Control led, Pressure-Bias-Modulated System. NASA TN D-8332, 1976.
7. Tanner, John A , ; and Stubbs, Sandy M.: Behavior of Aircraf t A n t i s k i d B r a k - ing Systems on Dry and Wet Runway S u r f a c e s - A Sl ip-Rat io-Cont ro l led SYS- tern With Ground Speed Reference From Unbraked Nose Wheel. NASA TN D-8455, 1977.
8 . Stubbs, Sandy M.; Tanner, John A . ; and Smi th , Eunice G.: Behavior o f Aircraft Ant i sk id Braking Sys tems on Dry and Wet Runway S u r f a c e s - A Sl ip-Veloci ty-Control led, Pressure-Bias-Modulated System. NASA TP-1051, 1979.
9 . S t anda rd fo r Metric P r a c t i c e . E 380-79, American SOC. T e s t i n g h Mater., c.1980.
10. Tanner , John A.: Fore-and-Aft Elastic R e s p o n s e C h a r a c t e r i s t i c s o f 34 X 9.9, Type V I I , 14 Ply-Rating Aircraft Tires of Bias-ply, Bias-Bel ted, and Radial-Bel ted Design. NASA TN D-7449, 1974.
11 . Le land , T ra f fo rd J. W.; Yager, Thomas J.; and Joyner , Upshur T.: E f f e c t s of Pavement Texture on Wet-Runway Braking Performance. NASA TN D-4323, 1968.
12. Yager, Thomas J.; P h i l l i p s , W. Pelham; Horne, Walter B.; and Sparks, Howard C. (appendix D by R. W. Sugg): A Compar ison of Ai rcraf t and Ground Vehic le Stopping Performance on Dry, Wet, Flooded, Slush-, Snow-, and Ice-Covered Runways. NASA TN D-6098, 1970.
25
13. Skid Control Performance Evaluation. ARP 862, S o c . Automot. Eng., Mar. 1 , 1968.
14. Lester, W. G. S.: Some Factors Influencing the Performance of Aircraft Anti-Skid Systems. Tech. Memo. EP 550, British R.A.E., July 1973.
15. Brake Control Systems, Antiskid, Aircraft wheels, General Specifications for. Mil. Specif. MIL-B-8075-D, Feb. 24, 1971.
16. Aircraft Stopping Systems. Aircr. Eng., vol. 47, no. 10, Oct. 1975, pp. 18-22.
17. Merritt, Leslie R.: Concorde Landing Requirement Evaluation Tests. Rep. No. FAA-FS-1 60-74-2, 1974.
18. Proceedings First International Skid Prevention Conference. Part I. Virginia Counc. Highway Invest. Res. (Charlottesville), Aug. 1959.
19. Flight Tests To Determine the Coefficient of Friction Between an Aircraft Tyre and Various Wet Runway Surfaces. Part 7: Trials on a Concrete Run- way at Filton. S & T MEMO 3/62, British Minist. Aviat., May 1962.
20. Batterson, Sidney A.: Investigation of the Maximum Spin-up Coefficients of Friction Obtained During Tests of a Landing Gear Having a Static-Load Rating of 20,000 Pounds. NASA MEMO 12-20-58L, 1959.
21. Theisen, Jerome G.; and Edge, Philip M., Jr.: An Evaluation of an Acceler- ometer Method for Obtaining Landing-Gear Drag Loads. NACA TN 3247, 1954.
22. Sawyer, Richard H.; Batterson, Sidney A,; and Harrin, Eziaslav N.: Tire-to Surface Friction Especially Under Wet Conditions. NASA MEMO 2-23-59L, 1959.
23. Dreher, Robert C.; and Yager, Thomas J.: Friction Characteristics of 20 x 4.4, Type VII, Aircraft Tires Constructed With Different Tread Rubber Compounds. NASA TN D-8252, 1976.
24. Batterson, Sidney A.: Braking and Landing Tests on Some New Types of Air- plane Landing Mats and Membranes. NASA TN D-154, 1959.
25. Zalovcik, John A.: Ground Deceleration and Stopping of Large Aircraft. Presented at Thirteenth Meeting of the Flight Test Panel of AGARD (Copenhagen, Denmark) , Oct. 20-29, 1958.
26. Frictional and Retarding Forces on Aircraft Tyres. Part 11: Estimation of Braking Force. Eng. Sci. Data Item No. 71026, R. Aeronaut. SOC., Oct. 1971.
27. Hirzel, E. A.: Antiskid and Modern Aircraft. [Preprint] 720868, SOC. Automot. Eng., OCt. 1972.
26

I II' 28. Bat te rson , S idney A.: A S tudy of t h e D y n a m i c s of Airp lane Braking Sys tems
as Affected b y T i r e E l a s t i c i t y and B r a k e Response. NASA TN D-3081, 1965.
29. F r i c t i o n a l a n d R e t a r d i n g F o r c e s o n A i r c r a f t T y r e s . P a r t I: I n t r o d u c t i o n . Eng. Sci. Data Item N o . 71 025 with Amendment A , R. Aeronaut. SOC., Aug. 1 972.
30. Yager, Thomas J.; and McCarty, John L.: F r i c t i o n C h a r a c t e r i s t i c s of Three 30 X 11.5-14.5, Type V I I I , Aircraft Tires With Various Tread Groove Pa t te rns and Rubber Compounds. NASA TP-1080, 1977.
31 . S t raub , H. H.; Yurczyk, R. F.; and A t t r i , N . S.: Development of a Pneumatic- F l u i d i c A n t i s k i d S y s t e m . AFFDL-TR-74-117, U.S. A i r Force, O c t . 1974. ( A v a i l a b l e from DTIC as AD A009 170.)
32. Smiley, Robert F.; and Horne, Walter B.: Mechan ica l P rope r t i e s of Pneumatic T i r e s Wi th Spec ia l Re fe rence t o Modern A i r c r a f t T i r e s . NASA TR R-64, 1960. (Supersedes NACA TN 41 1 0. )
27
e
TABLE I.- SUHMARY OF TEST
- Run
- 1 2 3 4 5
6 7 8 9
1 0
11 1 2 1 3 1 4 1 5
1 6 1 7 1 8 1 9 20
22 21
23 24 25
26 27 28 29 30
31 32 33 34 35
36 3 7 38 39 40
42 41
43 44 45 46
.__
Response mode
A A A A A
A
A A
A A A A A
A A A A A
A A A A A
A A A A A
A A A A A
A
A A
Tire- treac c o n d i t i o n
N en N e w
N en New
New
New
N e w New
N e w New
N en New
N e w New
New
N en New N e w
N e w New
N e w N e w
N en New
New
N e w New New New New
N e w New
N en N e w
New
N e w New N en
N e w N e w
N e w New
New New New N en
Brake SUPPlY
pressure - MP "
1 3 1 4
1 4 1 3
1 3
1 3
1 3 1 3
1 3 1 3
1 3 1 3
1 4 1 3 1 3
1 3 1 3 1 3 1 3 1 4
1 3 1 3 1 4 1 3 1 3
13 13 13 14 14
14 I 3 13 13 I 3
3 4 3 3 3
3 3 3 2 3 3 -
- p s i
1951 2001
1951 2001 1851
1901
1851 1901
1851 1 9 5 (
1 9 5 ( 1 8 5 ( 200( 1 9 5 ( 185C
190c
195c 195(
200c 195c
190c 1900
1850 200c
1900
1 9 0 0 1 9 0 0 1 9 0 0 2000 2000
2000 I 9 0 0 I 9 5 0 1950 1950
I 9 5 0 2000 1950 I 9 5 0 I 9 5 0
I 8 5 0 I 9 0 0 I 9 0 0 I 800 I 9 0 0 I 9 5 0 "
a n g l e Yaw
de9
"
0 0 0 0 0
0 0 0 0 0
0 0 0 0 0
0 0 0 0 0
0 0 0 0 0
0 0 0 0 0
0 0 0 0 0
0 0 0 0 0
0 1 1 1 1 1 "
A l t e r n a t l n g d r y and damp a t 30.5-m ( 1 0 0 - f t ) i n t e r v a l s .
- kN
5! 5!
5! 71 71
6 ! 71 9:
5; 5c
5; 7( 7c 7c 87
9c 90
111
115 116
56 56
74 57
72
71
8 5 89
113 I 1 4
I 1 2 68
69 68
70
69
69 69
69 68
68 68
69 70
69 69
-
V e r t i c a l l o a d
l b f x 1OOC
13 .3 13 .2 1 3 . 3 1 5 . 7 15 .9
-~ __
1 5 . 6 15.9
12 .7 20.9
12 .8
12 .9 1 5 . 7 15 .8 15 .7 19 .5
20.2 20.3 25.0
25 .9 26.0
12 .7 1 2 . 7
16.6 12 .8
16.1
1 5 . 9
1 9 . 0 20.1
2 5 . 7 25.3
25.2 15 .3
1 5 . 5 15 .2
15 .1
1 5 . 6
15 .4 15 .6
15.3 15 .4
15 .3 15 .3 15 .6 15 .8 15 .4 15 .6 "
Nanina: s p e e d , knots
"~
3 9 6 4 9 9 39 7 3
9 8 9 7 61 43 69
95 44 71
41 98
70
39 96
6 6 9 6
4 6 7 2 94 45 69
9 6 45 6 6 3 7 69
9 8 41 65 68 97
41 70 9 7 36 6 7
9 8 36 68 9 9 44 6 6 __
-
i d
-
0.5! .51
.5! .4'
.4,
.4:
.4.
.41 . 41
.3:
.21
.3(
. 2 t
.3;
.21
.26
.2!
.3<
.25 .2 f
.28
.19
.11
. 2 7
.23
.1 0
.30
.23 .35 .25
.07
.46
.38
.25
.28
.26
.65
.45
.54
.38
.34 -
ud,max
0.78
.74
.74
.77 .67
.64
.51
.47
.42
.41
.43
.40
.52
. 4 2
.36
.47
. 34 .39
.42
.24
.43
.32
.46
.33
.46
.33
.62
. 6 0 .49 .42
.76
.45
.47
- ur
-
1.0 .o .o .o .o
.o
.o
. O '
. O '
. 0.
.o ,
. O l
. O '
.os
. O J . 0:
. 01 .OJ
. ot
.11
. o<
.11
.Of
. O E
.Of
.11
.03
.06
.03
.05
.04
.04
.04
"
- ~- MPa
10.; 7.1 8.< 9.:
1O.E
11 .( 5.6 5.0
4.1
4.3 4.0
4.3 7.9
4.8
9.0 5.2
6.4 6.9
4.3 1 .8
5.3 3.0
7.3 4.3
t l . 2 6.2
8.5 6.8 4.3 5.4
2.1
6.5 5.8 -
P 1 - p s i
1481 11 41 1221 1351 1 5 6 (
1 5 9 (
8Ot 72!
585 57c 624 624
1 1 5c
689
1 31 0 760
927 999
260 61 8
772 442
I 0 6 0 625
1620 E96
I 2 3 0 990 625 783
750
940 835 -
- MPa
10: 12.1
13.1 12. ' 12. t
12.1
7.: ? . I
5.1 5.1 7.( 7.1
1 1 . i
7.; 8 . f
12.: 9.1 9.5
7.1 2.4
9 . 2 4.3
11 .4
12.6 6.7
8.9
11.9 11.6
9.2 8.8
12.8
8.9 7.6 -
Emax
-
- p s i
1 8 6 1 4 7 1 8 8 1 83 1 8 2
1 8 5
7 07, 1 0 4 '
731 841
1 01 I 113 ' I 6 9 1
1041 124: I 81 I I 3 2 ! 144:
I 0 3 1 34:
I 3 3 ( 62(
651 96E 83C 292
720 682 341 282
855
0 9 9 296
-
28
CONDITIONS AND RESULTS
T - T
-
- US
-
1.1 1 .10 .11 .08 .09 -
~
k , m a x
"
0.12
.10
.10
1 T TII -
iun
- 1 2 3 4 5
6 7 8 9 0
1 2 3 4 5
6 7 8 9
!O
1 12 3 4 15
6 7 8 9 10
31 32 33 34 35
36 37 38 39 40
11 12 13 14 15 16 -
- I 1
"
1
1 1 1 1 1
1 1 1 1
2 2
2
2 2 2 2 3
-
A v e r a g e s l i p
ve loc i ty stopping
G r o s s
p o w e r stopping
T i r e
p o w e r x n e r i n g power
T i r e :orque .h i t , E r c e n t
Lverage s l i p r a t i o
0.1 6 .15 .12 .21 .10
.08
.09
.09
.14
.10
.08
.1 4
.10
.14
.10
.08
.09
.15
.11
.08
.15
.59
.11
.12
.20
.69
.18
.12
.1 3
.12
.80
.10
.15
.10
.11
.16
.1 5
.55
.10
.1 3
.13
.35
..l 0 .08 .14 .10
__
l y d r o p l a n i n g
NO NO
NO NO NO
NO
NO NO
N o NO
N o N o N o NO NO
N o N o NO NO NO
NO No
Y e s NO NO
Y e s N o N o NO N o
Y e s NO
NO NO
NO
N o No
N o / Y e s No NO
Y e s / N o NO
NO NO
NO NO
~- E t / s e c
16.2 10.5
13 .7 1 9 . 3
12 .6
~ ~~
1 3 . 0 14.4
9.2 9.8
11 .1
10.9 12 .7
12.1 16.2
9 .5
1 0 . 7 12 .4 10.1
1 3 . 6 12.7
12.4 13.9
15.4 95.7
1 3 . 7
112.7 13.8 14 .0
14.2 8.3
134.3 1 0 . 0
1 2 . 6 11.4
15 .8
10.7 1 7 . 2 87.4
8 .2 1 1 . 2
60.1 8.0
14.1 11 .o
10.5 11 . o -
I - hp
972
190c 150C
157c
2020 2200 1620
900 708
1 0 9 0 657
1 1 2 0 887
922
107a
11 60 1 5 0 0 1 0 4 0 1 4 9 0 1900
508 531
6 3 2 420
809
478 856
I 0 5 0 9 0 8
I 3 9 0
551 89:
11 5( 83C
1 3 2 (
791 90:
90: 84:
1 2 5 (
112c 4 6 f
176C 21 4c
1 08C 81 6
-
- h p
1 5 3 240 237 204 169
I 6 8 204 I 4 4
9 6 91
90 99 99
113 119
115 I 21 I 4 8 I 7 5 I 6 4
79
245 61
I 2 2 9 6
333
09 51
75 33
1 2 6 432
1 2 4
1 2 7 96
1 0 6 1 0 5 21 2 1 1 2 1 28
1 2 2 1 4 7 1 6 5 1 9 0 1 1 4 111 -
I ~
E t - l b f ~~~
16 677 15 544 16 1 6 2 19 3 3 6 15 828
I 4 564
9 441 8 342
8 771 9 1 5 0 8 1 9 6 4 031
' 0 553
6 464 9 857
2 964 1 528
7 512 2 575
5 460 0 767
2 1 5 4 7 870 5 441 9 791
15 001 12 483 I 1 576
8 982
' 7 633
0 068 8 830
- "
kN-n
17.9 16 .8 14.6 18.3 15.3
15.4
11 .8 8.9
7.1 9.0 8.4 6.9
13.8
10.5
16.4 9.7
13.8 I 1 .e
7.2 2.9
9.1 5.9
1 .7
7.1 8.1
0.3
15.0 11.2
8.3 8.5
20.2
11.3 10.4 -
f t - l b f
1 3 200
1 0 800 1 2 400
1 3 500 11 300
~-
11 400
6 570 8 730
5 240 6 660 6 240
10 200 5 060
7 777
1 2 1 0 0 7 170
I O 200 8 710
5 290 2 1 4 0
6 720 4 370
8 650 5 990 2 600 7 600
11 100 8 270 6 1 4 0 6 250
14 900
8 330 7 710 -
kN-m ~
m / s e c
3.2 4.9 5.9 4.2 3.8
4.0 4.4 2.8 3.0 3.4
3.9 3.3 3.7 4.9 2.9
3.3 3.8 3.1 3.9 4.1
3.8
29.2 4.2
4.7 4.1
34.4
4.3 4.2
4.3 2.5
40.9 3.0
3.8 3.5
4.8
3.3
26.6 5.2
2.5 3.4
18 .3 2.4 3.4 4.3 3.2 3.4
-~
-
~~
kW
726 1 1 1 9 141 7
1171 798
1 5 0 6 1641 1208
671 528
81 3 490
835 661
688
1119 865
1111 776
I41 7
396 379
471 31 3
603
356 638 677 783
' 0 3 7
41 i 669
623 984
858
590
629 673
932 673
347 835
131 2 1 5 9 6
608 805 -
- <W
114 I 7 9 I 7 7 I 5 2 I 2 6
I 2 5 I 5 2 I 0 7
68 72
67 74
84 74
89
9 0 86
1 0
2 2 30
59 45 8 3 91 72
!48 1 3 81 99 30
322 94 92 72 95
79 78
I 5 8 8 4 9 5
91 110 I 2 3 I 4 2 8 5 8 3 -
- :W
2 4 6 2 4 -
"
I
I 1 I 1 I 1 I 1 I 1
I 1 I 1 I 1
,
1 1 1
1
1
1
I 1 1
1 ,
I I I I
l l I 1 I 1
I -
22.6
21 .9 21 . o
26.2 21 .4
19.7
12 .8 11.3
11 .9 12.4 11 .1 19.0
14.3 13.3 22.3 17.6 15.6
10.3 3.5
14.6 7.4
16.5 10.7 20.9 13.3
16 .9 20.3
1 2 . 2 15 .7
23.9
13.6 12 .0 -
38
47 54
98
1 0 0 98
1 0 0
34
35
86
40 42 41 58 37
9 5 1 0 0 1 0 0
29

TABLE 1.-
-
Ru
- 47 48 49
51 50
52
54 53
55 56
57 58 59 60 61
62 63 64 65 66
67 68 69 70 71
73 72
74
76 75
78 77
79 80 81
82 83 84 85 86
87 88 89 90
91
7
In
"
L
-
Respc mol
__ A A B
A
A A A A A
A A A B
A A B B B
B A
A A
A A A A
B A A A A
A A B B B
B
B B -
Tire - treac c o n d i t i o n
~-
New N e w
N e w N e w
New
New New N e w
N e w New
N e w New
New N e w
New
N e w
N e w New
N e w N e w
N e w New
New Worn worn
Worn worn Worn
Worn worn
Worn worn
worn Worn worn
Worn
Worn Worn
worn Worn
worn Worn
Worn worn
worn "
Brake supply
pressure - MPi -
1 3 1 3
1 3 1 3
1 3
1 3 1 4 1 4 1 3 1 3
1 3 1 3
1 3 1 3 1 3
1 3 1 3 1 3 1 3 1 3
1 3 1 3 1 3 1 3 1 3
1 3 13 1 3 13 13
13 1 3 13 13 14
13 I 3 I 3 13 13
13 13 13 I 3 13 "
- )si
850 900
950 950
850
1000 950
'000 850 850
850 950
900 950
850
900 950 850 850 950
950 950
950 950
950
900 900 900
900 950
950 850
950 900 000
950
900 950
950 950
-
950 9 50 950 950
I - a n g l e Yaw
deg
~
1 1 1 1 1
3 3 3 3 3
3 3 3 3 3
6 6 6 6 6
6 6 6 0 0
0 0 0 0 0
0 0 0 0 6
6 6 6 6 6
6 6 6 9 9 -
condi t io1 Surface
F l w d e d Damp
Flooded Flooded
Rain
Dry Dry Dry
Damp
D m P Flooded Flooded Flooded Flooded
Dry Dry
Damp Damp
Flooded Flooded
Flooded Dry Dry
Dry
Damp
Flooded
Flooded
Damp
Damp
(a1 (a1 (a1
Dry
Dry DKY
Damp
Damp DmP
Flooded Flooded Flooded Damp Damp
T V e r t i c a l
- h -
IC is E
i 7 ,S
'0 ,9 1 9 0
0 9 0 9 8
1 1 9 9 9
0 9 9 9 9
0 9
70 70 67
68 69 70 71 73
72 73 72
70 71
69 69 70 69 72 -.
lA l ternat ing dry and damp a t 30.5-111 (100- f t l i n t e r v a l s
l oad
Lbf x 1001
15.7 7 5 .5 15.3 15.1 15.5
1 5 . 7 1 5 . 5 15.9 15 .6 1 5 . 8
15 .7 1 5 . 6
15 .5 15 .7
1 5 . 3
1 5 . 9 15 .9 15 .5 15.6 15 .5
1 5 . 5 15 .7
15.4 1 5 . 6 15.5
15 .6 15 .7
1 5 . 7 15 .7 15 .0
15.2
15 .8 15 .6
16 .0 1 6 . 3
1 6 . 2
1 6 . 2 16.4
16.0 15 .8
1 5 . 5 15.6 15 .8 15 .6 16.1
T ___
Nanina speed knots
__
45 95
67 97 99
47
98 79
42 67
96
45 45
69 79
56 78 42 70 96
44 70
50 91
72
98 44 72
60 98
72
73 52
96 46
72 97 59 71
100
61
101 77
102 50
~
-
Fd
- 0.2;
.3;
. O E
.2?
. o i
.59
.55 .51 .39 .33
.22
.36
.33
.19
.14
.60
.53
.37
.25
.20
.1 8
.36
.50
.07
.48
.41
.27
.17
.20 .1 5
.26
.12
.19
.17
.51
.45
.40
.11
. l l
. O B
.10
.10
.03
.22
.13 -
-
Ud,rna
__ 0.35
. 4 3
.27
.13
.74
.76
.69
.46
.40
.32
.42
.46
.23
.71
.63
.41
.29
.27
.23
.40
.69
.70
.28
.38
.18
.32
.48
.13
.33
.64 .22
.59
.51
.1 6
.19
.1 4
.11
.28
.20 -
!JK
-
0.04 .O l .Ol
.01
. O ! . O !
.Of
.01 . O f
. O I
.01
. O f
.05
.1 c
. o s
. O f
.Of
. O f
.09
.09
.03
.04
.03
.04
.09
.05
.03
.09
.03
.02 .05
.05
.02
. 0 4
. 0 3
.04
.06
. 07
. O K -
- MPa
4.1 5.1 3.1
1 :
11.: 10. : 10.1
5.' 3.!
3.: 5.I 5.f 2.:
-
8.1 9. ;
2.5 4.1
2.f
4.5 1.5
10.; 9.5
5.c 2.f
1 . 7 2.9
1 .1
2.9 4.5
3.3 9.8
8.3 7.9 2.1 1 .6 1 . 7
1 .2
1 . 9 3.1
-
P
__ p s i __
571 8Ot 433
164
163C 1490 1560
781 563
459 795
330 a7 8
1250 1330
695 427 400
270 70 7
1380 1550
725 379
2 51 41 5
157
427 657
1420 485
1200 1140
308 239 244
177
4 4 4 273 -
L a x
- MPa -
4.1 9.1 3.5
1 . f
12.; 12.5 12.7
6.5 4.5
3.9 7.c 7.4 3.c
10.4 11 .3
5.8 3.5 3.3
6.0 2.3
12.9 12.1
4.5 7.5
4.0 2.2
1 . 4 9.8 5 .5
12.2 4.6
11.2 10.9 2.8 2.2 2.1
1 . 5
4.0 2.3 -
- p s i -
701 1321
561
231
183f 187( 183 ' 1001
70!
110( 564
108( 421
1 51 164;
841
48: 51 1
877 33E
1871 1758
1091 647
322 585
201 141 5
800
1763 674
I 61 9 I574 408
31 1 31 6
21 8
585 330 -
30
Concluded
"_ .
- T
kN-n
8.5 9.3 5 .3
2.6
19 .0 17.3 16 .8 12 .5 10 .0
10 .5 6.8
10.1 3.8
"
"
17.7 16.1 10.7
6.9 5.1
9.8 3.1
17 .2 15.7
8 .8 5.5 5.6 2.5
1.1 8.6 5.7
17 .6 6.0
15 .3 14 .2
3.8
2.6 3.4
1.8
6.4 3.5 -
T ~
f t - l b f -
6 900 6 260
3 910
1 910
1 4 000
1 2 400 12 800
9 250 7 410
5 03C 7 730 7 480 2 770
1 3 1 0 0 11 900
5 130 7 880
3 770
7 270 2 280
1 2 700 11 600
6 520 4 090
1 880 4 110
804 6 360 4 220 4 440
13 000
1 0 500 11 300
2 840
1 910 2 520
1 31 0
4 720 2 610
". . -
-
~- kN-n
12.2 9.6
5.8
24.2 24.1 19.9 14.1 11.1
12.5 7.9
11.6 4 . 4
20.7
11 .5 20.2
7.6 5.8
11 .0 3.5
24.1 21.5
11 .9 9.0 7.6 3 . 0
1 . 3 16.4
9.9
22.7 7.8
20.2 18.3
5.2 4.3 3.4
2.1
7.9 4.5 " .
- f t - l b f
8 996 7 128
4 284
1 7 871 1 7 833 1 4 708 1 0 427
8 234
5 811 9 215 8 585 3 217
1 4 917 1 5 283
5 636 8 475
4 317
8 125 2 611
1 5 871 1 7 821
8 803
5 596 6 638
2 202
12 129 930
7 340 5 729
16 795
1 3 487 1 4 939
3 860 3 1 5 7 2 490
1 569
5 815 3 354 " -
- - . -. -. - Torque l i m i t , percent
8 3 75 80
32 52
8 3 83
100
39
41
_.
- us
1.09 . O€ .04 .02 .o:
.2?
. 2 i
.21
.15
.1 i
.15
.14
.1>
.05
. oi
.25
. 3 4
.19
.21
.15
.1 7
-.01 .1 c
.2c
.2c
.1 a
.04
.Of
. 02
-.04 .Ol
-.os
.24
. 2 i
-.
- k , m a
0.1 0
.07
.09
.05
.23
.24
.24
.21
.21
.19
.20
.18
.12
.46
.40
.31
.28
.30
.26
.1 6
.20
.30
.32 .17
.14
.1 6
.20
.42
4veragl s l i p r a t i o
0.09 .18 .12
.08
.89
.14
.14
.10
.16
. l l
.09
.1 6
.1 7
.12
.41
.18
.15
.1 4
.20
.12
.1 8
.15
.91
. l l
.1 0
. 0 6
.11
.07
. O B
.09
.09 .11 .09
.15
.07
.14
.12
.08
.09
. 08
.12
.45
.91
.15
.10
"
Average
v e l o c i t y s l i p
m/sec
4.4 4.0 4.0
44.8 4.3
3.2 5 . 5 5.2 3.6 4.0
4.6 3.8 4.1
1 7 . 3 4.1
5.2 5.9 4.5 4.9 5.9
4.1
42.8 5.3
2.6 3.6
2.9
2.9 2.4
2.9 3.5
3.3 3.0
3 . 3 3.2
3.4
5.0 6.1 2.7
4.1 3 . 0
3.7 18.5 47.0
3.9 5.4 .. . .
E t/sec
14 .4 13.2
147.1 13.1
14.2
17.9 10.6
17.1 1 1 . 7 13.0
~ ~ ..
15.2 12.5 13 .5 13 .6 56.7
16 .9 19.4 14.6 16.1 1 9 . 2
1 3 . 5 1 7 . 4
140.3 8.6
11 .8
9.6 7 .9 9.6
11.4 9 .4
1 0 . 9
10.6 10.0
10.9 11.1
19.9 16 .3
8.9 9.9
1 3 . 3
12 .0 60.6
154.2
17 .6 12 .8
T i r e
power
kW -
~~
940 521 550 269 246
I544 999
1805 588 81 3
761 579
464 536
396
I245 151 4
640 565
692
563 459 233
I201 865
I432 432 435 690 309
294 483 509 600 880
1208 1462
247 276 304
21 3 262
93 403 51 0
~~
hp kW
1260 87 699 86 737 64 361 239 330 22
1340 136 2070 208 2420 195
789 98 1090 95
1020 74 776 97 719 92 622 56 531 151
~-
1670 228 2030 236
758 11 6 858 89 928 86
755 1 0 5 61 5 69
1160 87 31 2 21 0
1610 1 1 6
1920 91 579 48
925 51 584 37
414 29
394 27 648 51 683 4 4
1180 131 804 44
1620 171 1960 1 9 5
331 24 370 26 408 28
286 25 352 11 6 1 2 5 79 540 64 684 54 . ~ .~ .
- hp
116 115 86
320 29
I83 279 262 I 31 I 28
99 I 3 0 I24
203 75
~
306 31 7 I 55 I 2 0 115
I 41
282 92
117 I56
I22 65 50 68 39
36
59 68
I76 59
229 2 61
32 35 38
34 155 IO6
86 72 ..
corner in T i r e
power - kW -
4 1 1 0 1
1 9 30
1 0 37
20
1 0 25
9 1 0
3
54 90 25 48 62
24 22
0
34
51 65 l i 1c 1c
1 -5 - 2 65
125
- hp -
6 2 2 0 2
25 40 49 1 4 27
34 1 4 1 2 1 3
4
1 21 73
34 65 83
32 29
0
46
69
1 6 87
1 4 1 4
2 -7 -3 87 73
Aydroplaning
NO
N o NO
Yes N o
NO N o N o NO No
NO No N o N o
Yes
N o N o
NO N o
N o
NO NO
Y es
N o NO
N o NO
NO N o
N o
N o
No N o
NO N o
N o NO
N o No
NO
NO Yes Yes
NO NO
" - .. -
-
Run
- 47 48 49
51 50
52 53 54 55 56
57
59 58
60 61
62 6 3 64 65 66
67 68 69 70 71
72 7 3
75 74
76
77
79 78
80 81
82 83 84 8 5 86
87
89 88
90 91 -
31
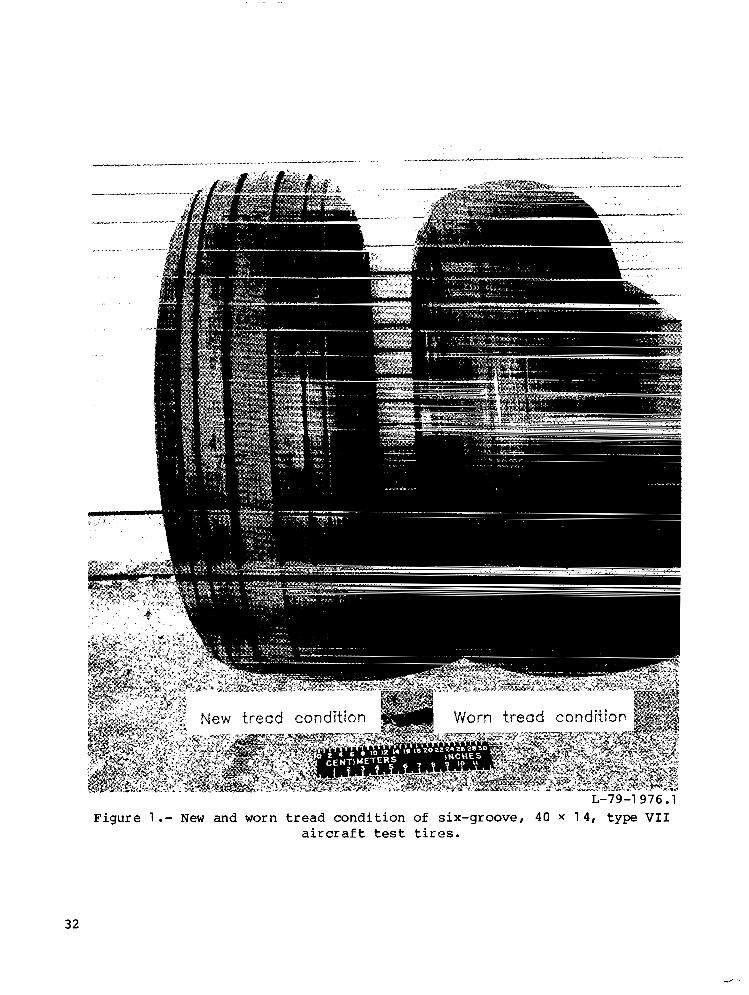
Figure 1 .- New and worn tread condition of six-groove, 40 x 1 4 , type V I 1 a i r c r a f t t e s t t i r e s .
32
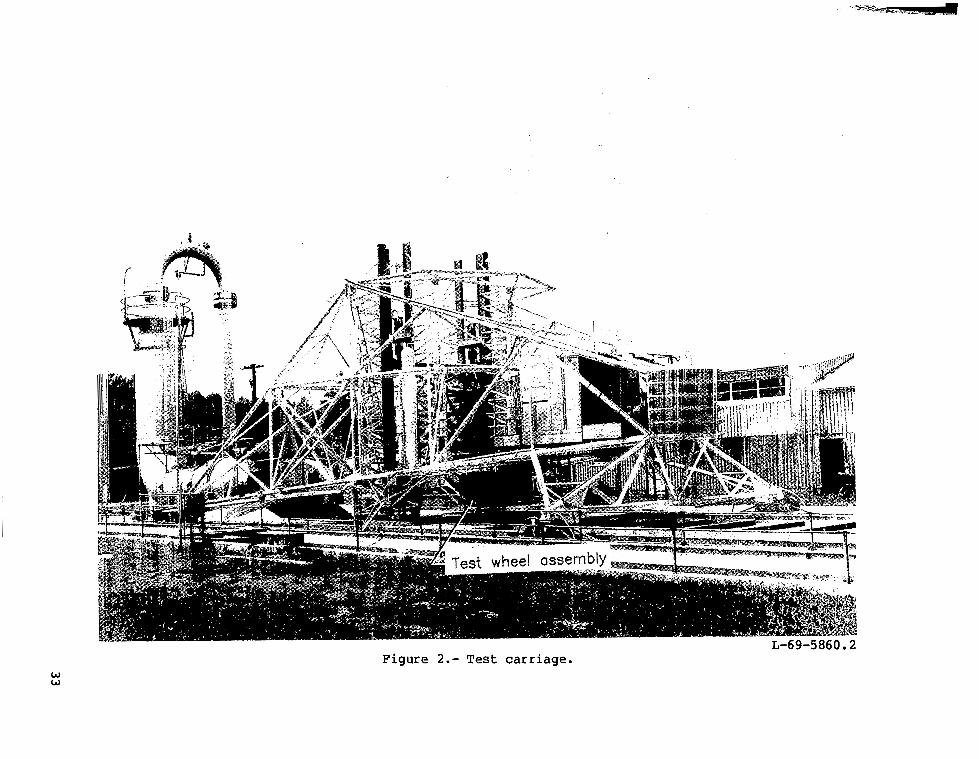
W W
Figure 2.- Test carriage. L-69-5860.2
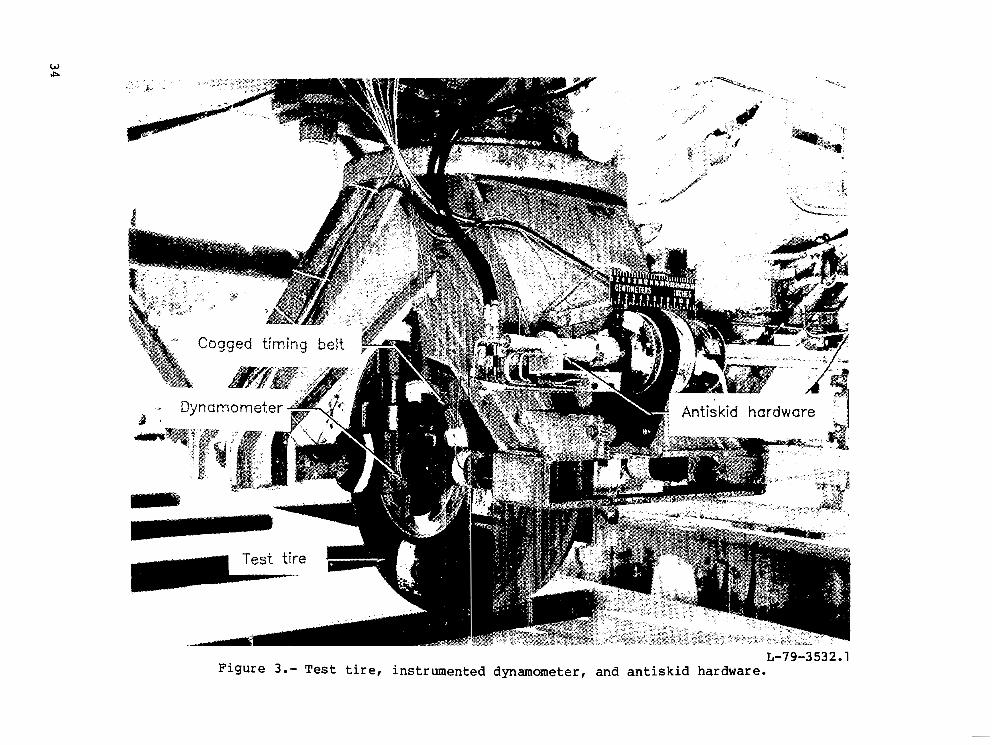
W IP
L-79-3532.1 F i g u r e 3 . - Test t i r e , instrumented dynamometer, and antiskid hardware.
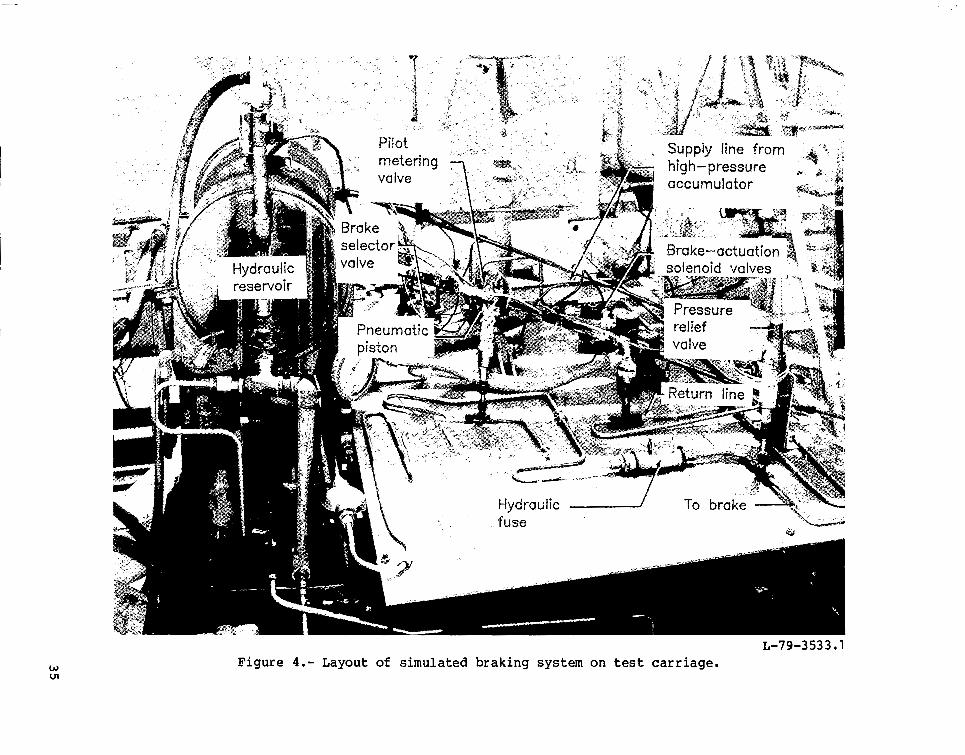
W cn
L-79-3533.1 Figure 4.- Layout of simulated braking system on test c a r r i a g e .
W QI
k v q High-pressure hydraulic line Low-pressure hydraulic line
Figure 5.- Schematic of skid control system.

Wheel speed, rPs
Wheel accel., rad/sec2
Brake pressure, M Pa
pd
Brake application Brake release -.
Approximate threshold
1.0 -
_I
0 2 4 6 8 10 12 14
Time, sec
1 3 x l o 3
L 16
Figure 6 . - Typical time histories of parameters to describe operation of antiskid system. ~m 4 (table I ) ; nominal carriage speed, 39 knots; vertical load, 70 kN (1 5 700 l b f ) ; yaw angle, 00; t i r e condition, new; surface condition, dry.
W 4
W 03
Antiskid hardware Wheel angular velocity and acceleration indicators
Cogged timing belt
Draa-force beam -..
Forward
Vertical-force beam -.
Drag-force beam-” w? Accelerometers 4
Brake torque links
-force beam
tire, and brake
Figure 7.- Dynamometer details .

L-76-3786 -1 Figure 8.- Lightweight t ra i l ing wheel used to obtain carriage speed.
W W
20 r 1 3 x l o 3 Broke pressure, MPa
Brake torque, kN-rn
Carriage
knots speed,
Wheel speed, rps
Wheel accel., rad/sec
Vertical force, kN
Drag force, kN
Side force, kN
10 - pressure, psi
0
30 - X l o 4
15
- 1 3 torque, Brake ft-lbf 0
100 - 56 knots
50 - I
1 - x loJ
0
-1 - h z x l o 4
] r i c a l force,
100
50
0
(a) Measured parameters.
Figure 9.- Typical time histories of measured and calculated param- eters. Run 62; nominal carriage speed, 56 knots; vertical load, 71 kN (15 900 lbf); yaw angle, 6O; tire condition, new; surface condition, dry.
40

Brake pressure, MPa
Alining torque, kN-rn
Slip velocity, m/sec
2o r 1 3 x 1 0 3
.5
0
r
4 1 4 X l o 4
Alining 0 0 torque,
ft-lbf -4 L J -4
Slip ratio
0 2 4 6 8 10 12
Time. sec
(b) Calculated parameters.
Figure 9 .- Concluded.
41
2o r t 0 I
t f I
.
Wheel speed, rPs
Wheel accel., rad/sec2
Brake pressure, MPa
Brake torque, kN-m
-1 L
20 r 1 3 x l o 3
20 - - """"""" Brake torque,
0 ft-lbf -
4 Time, sec
(a) Run 81 ; nominal carriage speed, 46 knots; vertical load, 7 3 kN (16 300 lbf); yaw angle, 6*; tire condition, worn; surface condition, dry.
Figure 10.- Definition of various friction terms.
Wheel speed, rPs
Wheel accel., rad/sec
Brake pressure, MPa
Brake torque, kN-rn
pd
P S
- 1 I ' I I I
0 I I ; I
!
20 r
10 - 2 Brake pressure, psi
0 -
40 r I I -, 3 X l o 4
20 c i I 1 Brake ~~ ~
torque, ""
0 I 1 ft-lbf
1 .o .5
0
1 .o
.5 "_"
0 1 2 3 4 5 6 7 a Time, sec
(b) Run 66; nominal carriage speed, 96 knots; vertical load, 69 kN (15 500 l b f ) ; yaw angle, 6O; t i r e condition, new; surface condition, damp.
Figure 1 0. - Concluded.

t 0 1
t f I
7 5 r I I Carriage speed, m/sec
Drag force, kN
Side force, kN
Slip ratio
0 1 1 - '0
100 - 2 X l o 4
50 - - - - . ] b Ibf
Drag force,
0
100 - 2 X l o 4
50 -
0 1 Ibf
Side force,
1 .o
.5
41
0 2 4 6 8
Time, sec
!
Figure 11.- Typical time histories of variables used to obtain power terms. Run 66; nominal carriage speed, 96 knots; vertical load, 69 kN (15 500 l b f ) ; yaw angle, 6O; t i r e condition, new; surface condition, damp.

Wheel speed, rPs
Wheel accel., rad/sec
Antiskid inlet pressure, MPa
Brake pressure, MPa
Brake torque, kN- m
20
10
0
- -
0
-1 -
2O r
1.7 sec
10
0
i 1 1- 1
40 r I
2o t
a20 msec
L J O
3 X 10³ Antiskid inlet pressure, psi
4 1 2 0 msec 103 Brake pressure, psi
60 msec 1 3 X l o 4 I - l o Brake
I I
torque, ft-lbf
0 2 4 6 a 10 12 14 16 Time, sec
Figure 12.- Typical brake-system hydraulic response. R u n 32; nominal carr iage speed, 41 knots; ver t i ca l l oad , 68 kN (15 300 l b f ) ; yaw angle, Oo; t i re condi t ion , new: surface condit ion, alternating dry and damp a t 30'5-m (1 O O - f t ) i n terva l s .
Brake pressure, psi
40
Brake torque, 20 kN- m
0
0 1000 2000 3000 I I I I
Brake release
Initial brake application
10
Brake pressure, MPa 20
3 x 1 0 4
2 Brake torque, ft-lbf
1
0
Figure 13.- Brake torque-pressure relationship. Run 62; nominal carriage speed, 56 knots; vertical load, 71 kN (1 5 900 lbf) ; yaw angle, 6O; tire condition, new; surface condition, dry.

Dry 1_1_ Flooded
Wheel speed, rPs
Wheel accel., rod/sec2
Brake pressure, MPa
2o r
1 . 5 r X 10 3 I l .0C I 1
.5 0
-.5 - "
V . h II
V I,
-1.0 t -1.5
20 - 10
0
- 2 Brake pressure, psi
.5
0
(a) Run 36;
2 4 6 8 10 12 14 16
Time, sec
nominal carr iage speed, 41 kno t s : ve r t i ca l l oad , 69 kN (1 5 600 l b f ) : yaw angle , Oo: t i r e condi t ion , new; su r face cond i t ion , d ry t o flooded.
F igure 14. - Ant i sk id - sys t em r e sponse t o t r ans i en t runway condi t ions .
Dry - Wheel 2or) speed, rPs
1.5 1 .o
Wheel .5 accel., 0 rad/sec2 - -5
-1 .o -1.5
Brake pressure, 10 M Pa
0
- Flooded /- 91 knots
, -
2 Brake 1 pressure,
psi
0 1 2 3 4 5 6 7 8
Time, sec
(b) Run 38; nominal carriage speed, 97 knots: vertical load, 69 kN (15 400 lbf): yaw angle, Oo; tire condition, new: surface condition, dry to flooded.
Figure 14.- Continued.

*O r Flooded -
+ - -"- ---- - - - i
-1.0 - -1.5 -
20 - Brake pressure, 10
2 Brake - MPa
0-
1.0 r
pressure, psi
pd .5 - I
0 2 4 6 8 10 12
Time, sec
(c) Run 40; nominal carriage speed, 67 knots; vertical load, 68 kN (15 300 l b f ) ; yaw angle, Oo; tire condition, new; surface condition, flooded to dry.
Figure 14. - Continued.
91 knots
Wheel speed, rP S
7 I
Wheel accel., rad/sec
-1 .o -1.5
Brake pressure, 10 MPa
2 Brake 1 pressure,
psi
0 1 2 3 4 5 6 7
Time, sec
(d ) R u n 41 ; nominal carr iage speed, 98 k n o t s ; v e r t i c a l l o a d , 68 kN (1 5 300 lbf) ; yaw angle , Oo; t i r e c o n d i t i o n , new; surface cond i t ion , f l ooded t o dry.
F igu re 1 4.- Concluded.
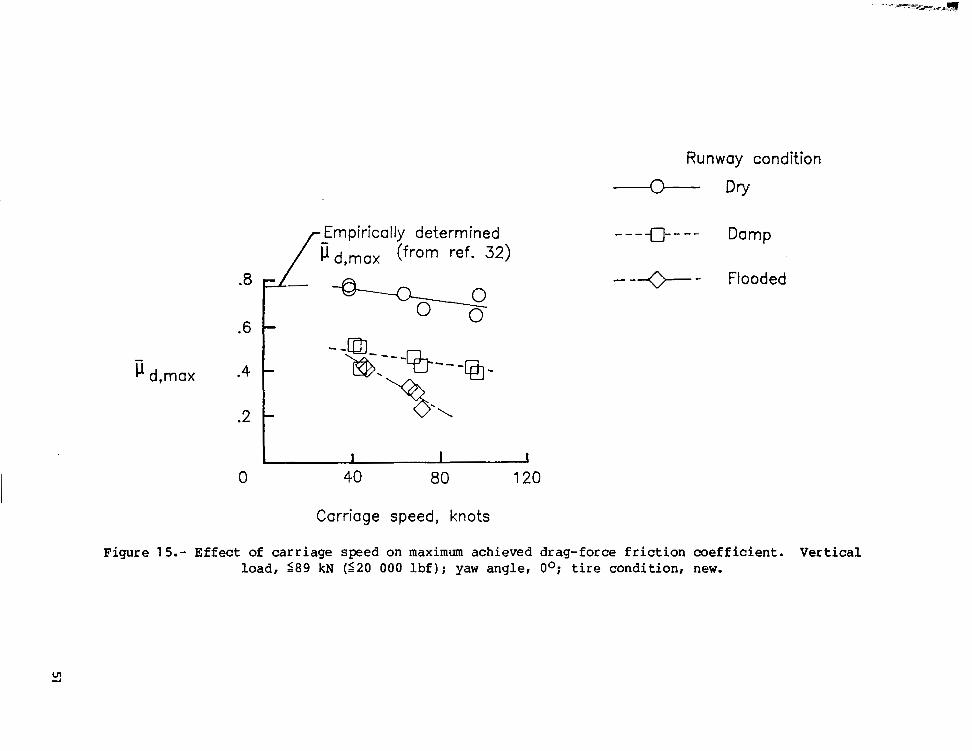
/ii d,max (from ref. 32) Empirically determined
0 40 80 120
Carriage speed, knots
Runway condition
Dry
"-13 -"- Damp
- -+ - Flooded
Figure 15.- Effect of carriage speed on maximum achieved drag-force friction coefficient. Vertical load, 289 kN (520 000 lbf); yaw angle, Oo; t i r e condition, new.
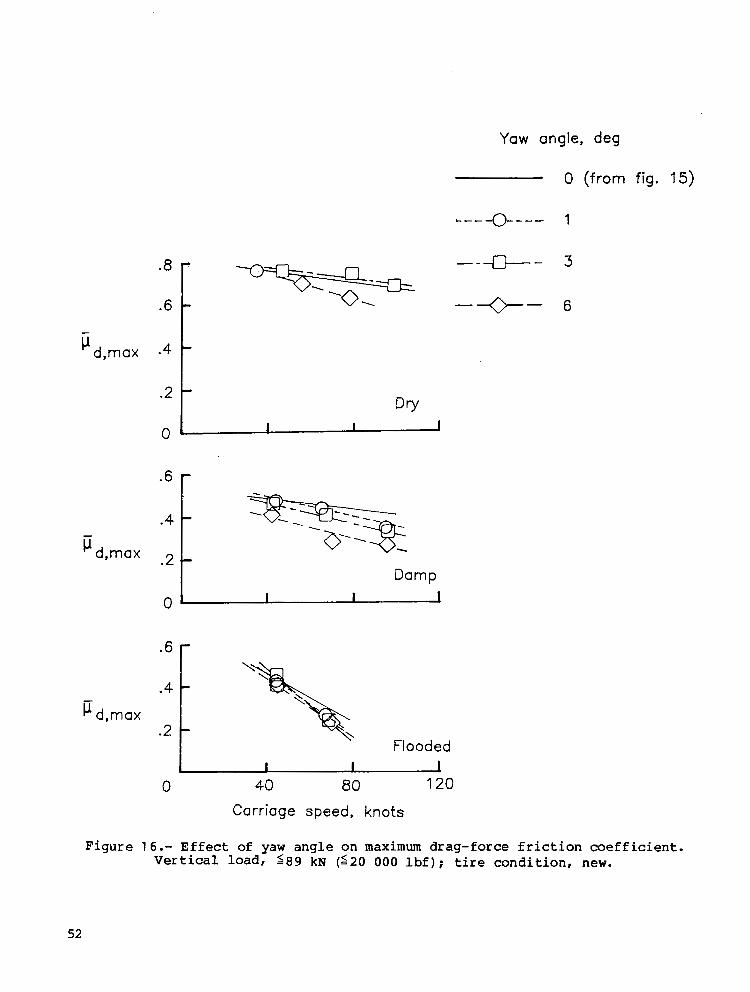
Yaw angle, deg
0 (from fig. 15)
.8 - ---"--- 3 \
.6 - .O. -e- 6 - c1 d,max -4
- .2
-
Dry
0 . I I I
r
d,max
.4
.2 " - Damp
A 0 40 80 120
Carriage speed, knots
F i g u r e 16.- Effect of yaw ang le on maximum d r a g - f o r c e f r i c t i o n c o e f f i c i e n t . Vertical load, 589 kN (620 000 l b f ) ; t i r e c o n d i t i o n , new.
52
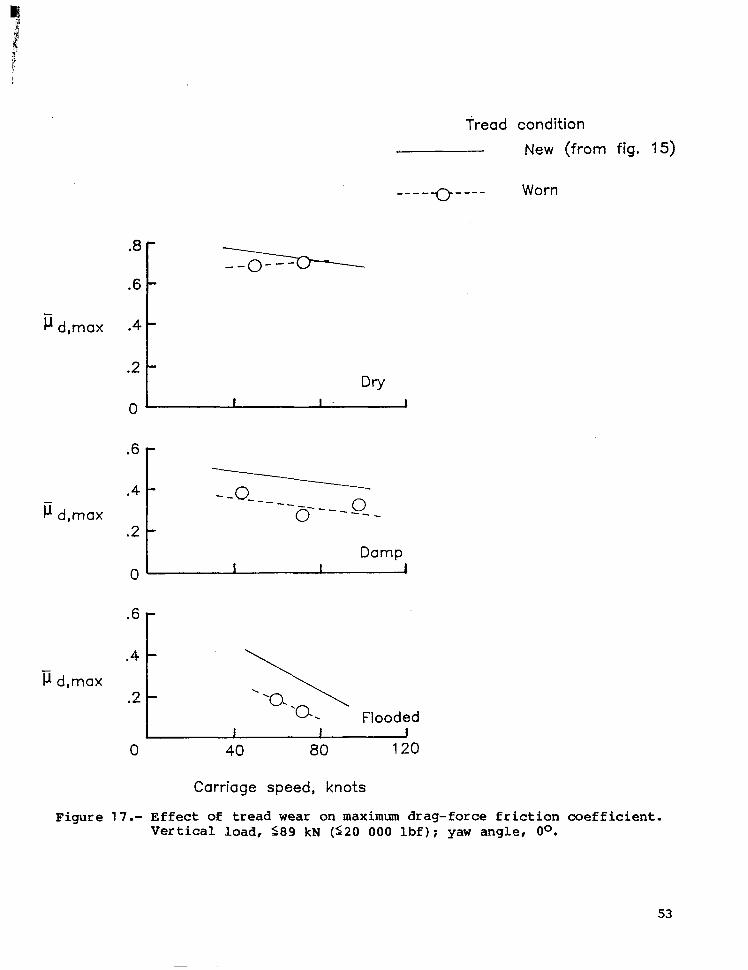
Tread condition
New (from fig. 15)
"" 0"" Worn
.4
.2 ::I r
.2 t Damp 0 ' I I 1
- p d,max
*4/ .2 ,b , Flooded
0 40 80 120
Carriage speed, knots
Figure 1 7 . - Effect of tread wear on maximum d r a g - f o r c e f r i c t i o n c o e f f i c i e n t . Ver t i ca l l oad , S89 kN (220 000 l b f ) ; yaw angle , Oo.
53
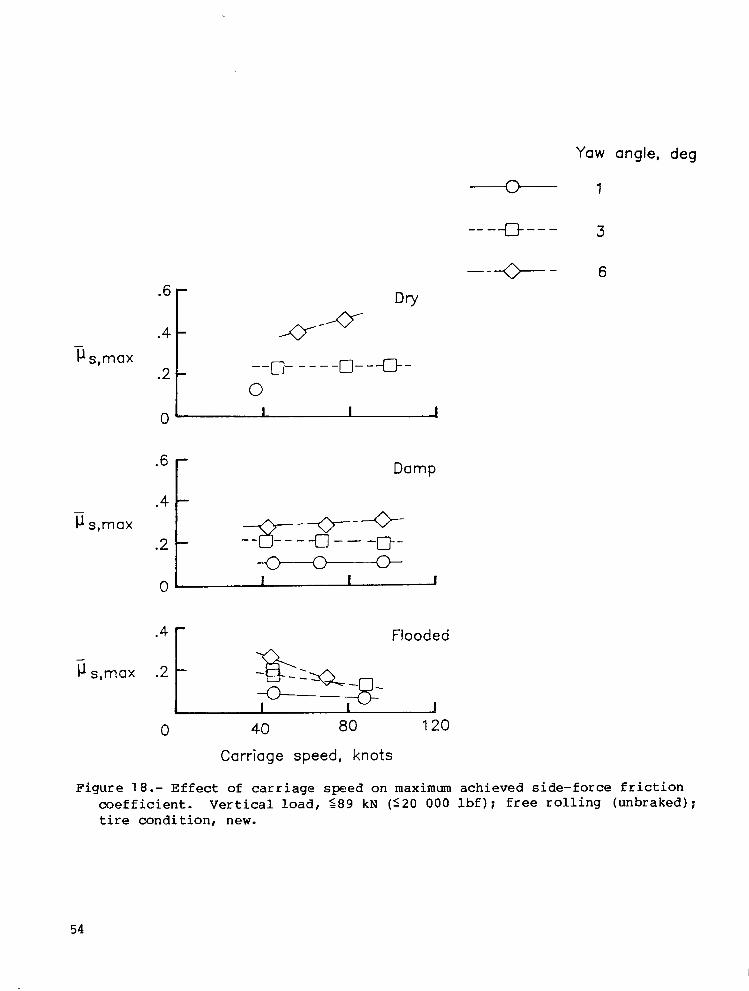
-
IJ.slmax .2 t a 6 r Damp
- "-e-+ IJ.slmax "F - .2 " ""0" -0"
-4 r Flooded
0 40 80 120
Carriage speed, knots
Yaw angle, deg
& 1
"+- 6
Figure 18.- Effect of carriage speed on maximum achieved side-force friction coefficient. Vertical load, $89 kN (520 000 l b f ) ; f r ee ro l l i ng (unbraked) ; tire condition, new.
54
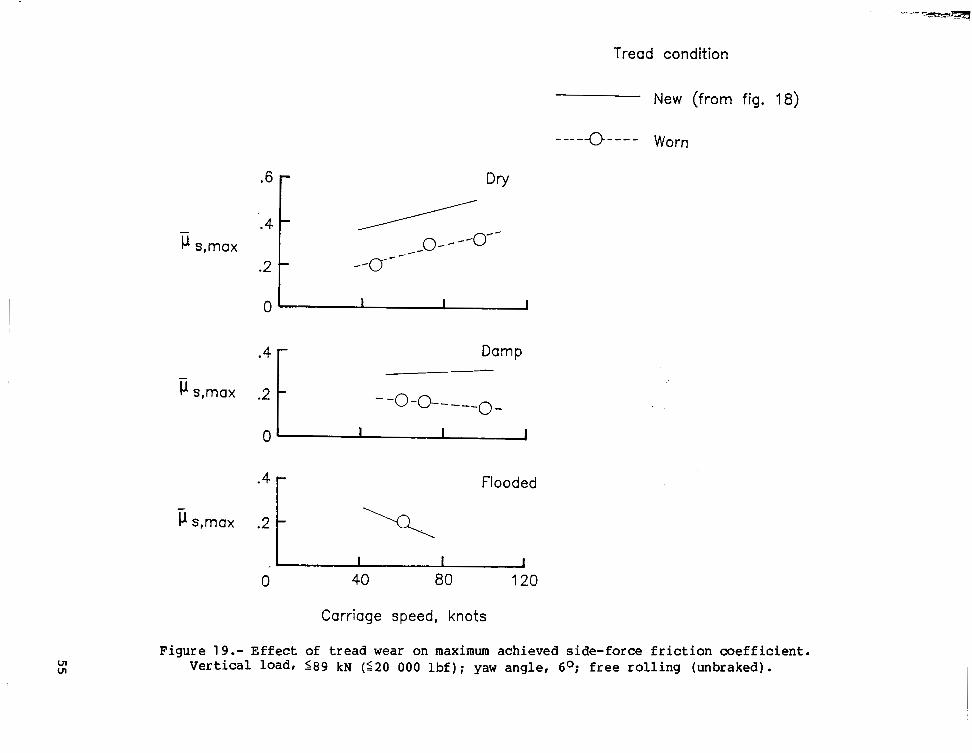
Tread condition
New (from fig. 18)
Worn "" 0 ""
.6 r
0 0
s4 r Damp
s4 r Flooded
0 40 80 120
Carriage speed, knots
Figure 19.- Effect of tread wear on maximum achieved side-force friction coefficient. Vertical load, 289 kN (120 000 l b f ) ; yaw angle, 6O; free rolling (unbraked).
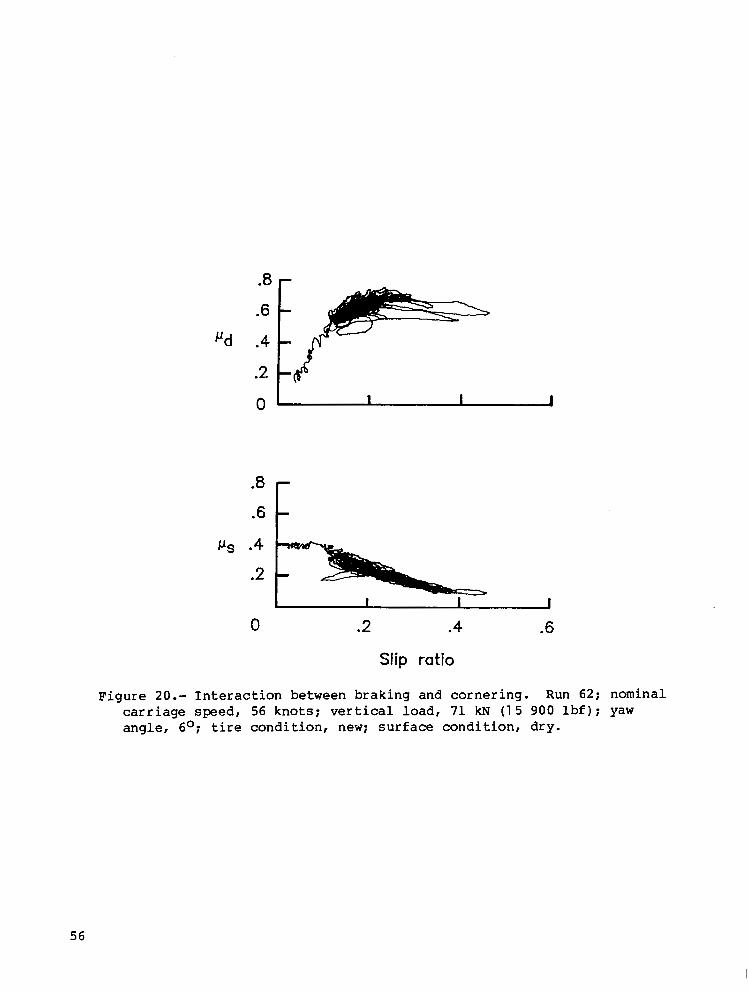
.a
0 ,
0 .2 .4 .6
Slip ratio
F i g u r e 20.- In te rac t ion be tween brak ing and corner ing . Run 62; nominal c a r r i a g e s p e e d , 56 k n o t s ; v e r t i c a l l o a d , 71 kN (1 5 900 lbf) ; yaw ang le , 6O; t i r e c o n d i t i o n , new: s u r f a c e c o n d i t i o n , d r y .
56

d,max (single cycle) -50
c1 d,max *75 t (single cycle)
I 1
agreement
.Least-squares curve fit
0 .25 .50 .75 1 .OO 0 .25 .50 .75 1 .OO - - c1 d,max (antiskid) I-1 d,max (antiskid)
Figure 21.- Effect of c y c l i c braking on maximum achieved drag-force fr ic t ion coef f ic ient .
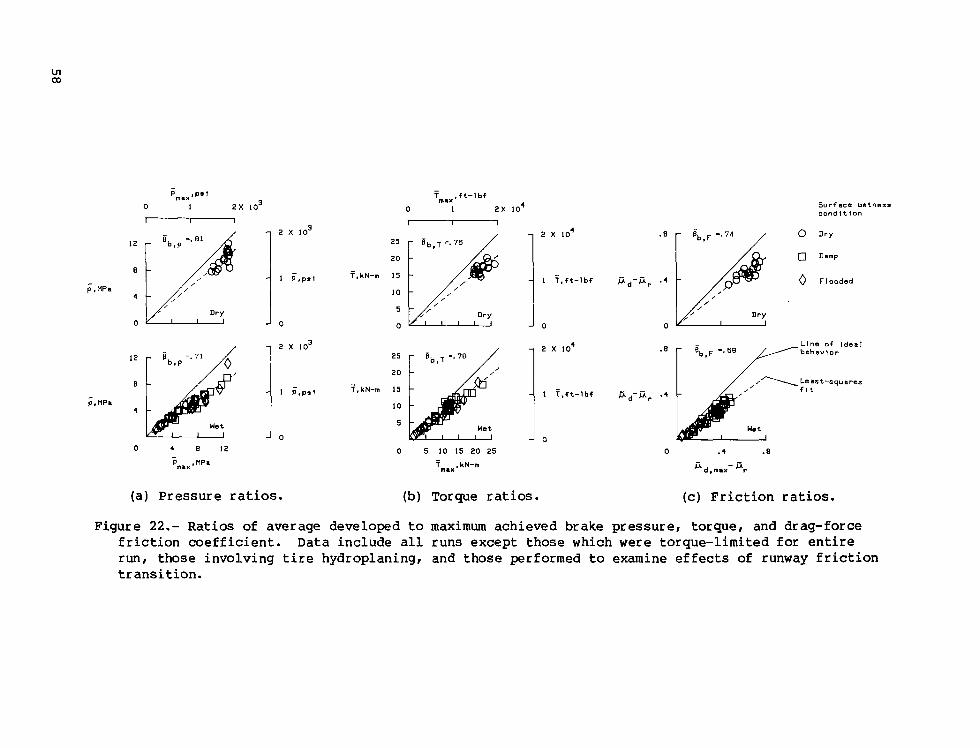
ymax,ft-lbf
0 I 2 x IO‘ S u r f a c e w e t n a s r cond I t Ion
- 2 X lo3
-
L i n e o f I d e a l bchavtor
, , \ ~ e a s t - s q u a r e s - I P . P t l 1 y.ft-lbf jLd-jXr . 4 f l t
;.UP.
0 5 10 15 20 25 - Tmnx. kN-m
(a) Pressure ratios. (b) Torque ratios. (c) Friction ratios.
Figure 22.- Ratios of average developed t o maximum achieved brake pressure, torque, and drag-force friction coefficient. Data include a l l runs except those which were torque-limited for entire run, those involving t i r e hydroplaning, and those performed t o examine effects of runway f r ic t ion transit ion.
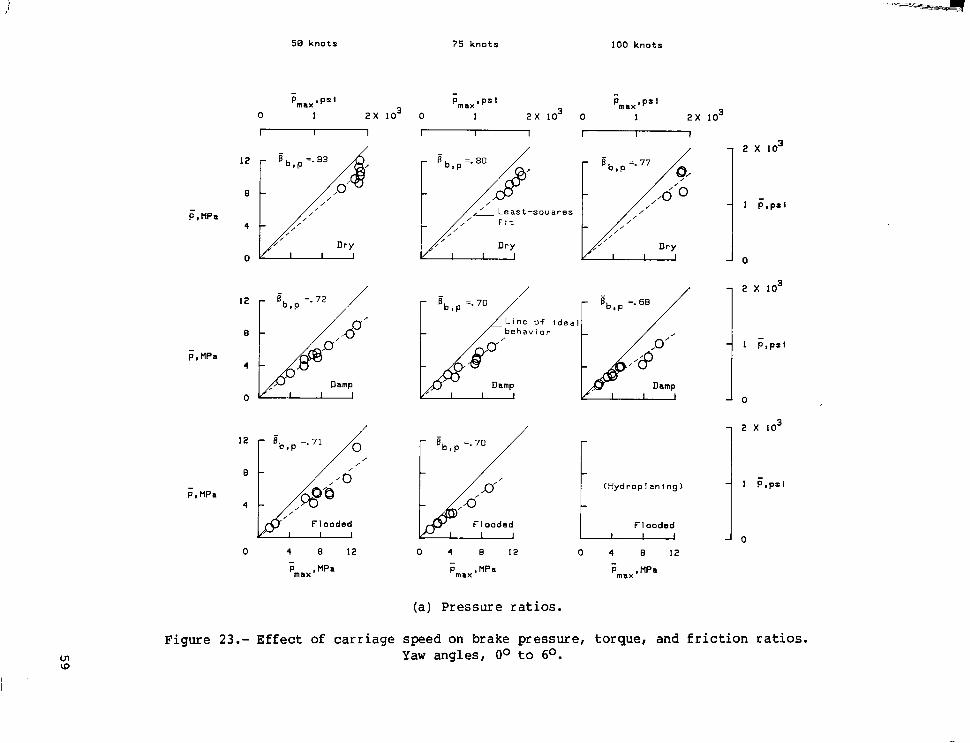
P, MPa
p. MPa
P. MPa
50 knots 75 knots 100 knots
- - - Pmax IPS 1 Pma, e P+ 1
0 1 2 x lo3 o 1 2 x lo3 o 1 Pmax I PS 1
=. 72
4
Damp 0
a
4
F 1 ooded
p! E,, =. 70 b e h a v i o r of i d e a
1 (Hydrop 1 an 1 ng 1
L FI oodsd
(a) Pressure ratios.
2 X lo3
1 P , P S l
0
2 X lo3
- 1 P,PSl
- 0
- 2 x lo3
- 1 P,ps l
- 0
Figure 23.- Effect of carriage speed on brake pressure, torque, and friction ratios. Yaw angles, Oo t o 6O.
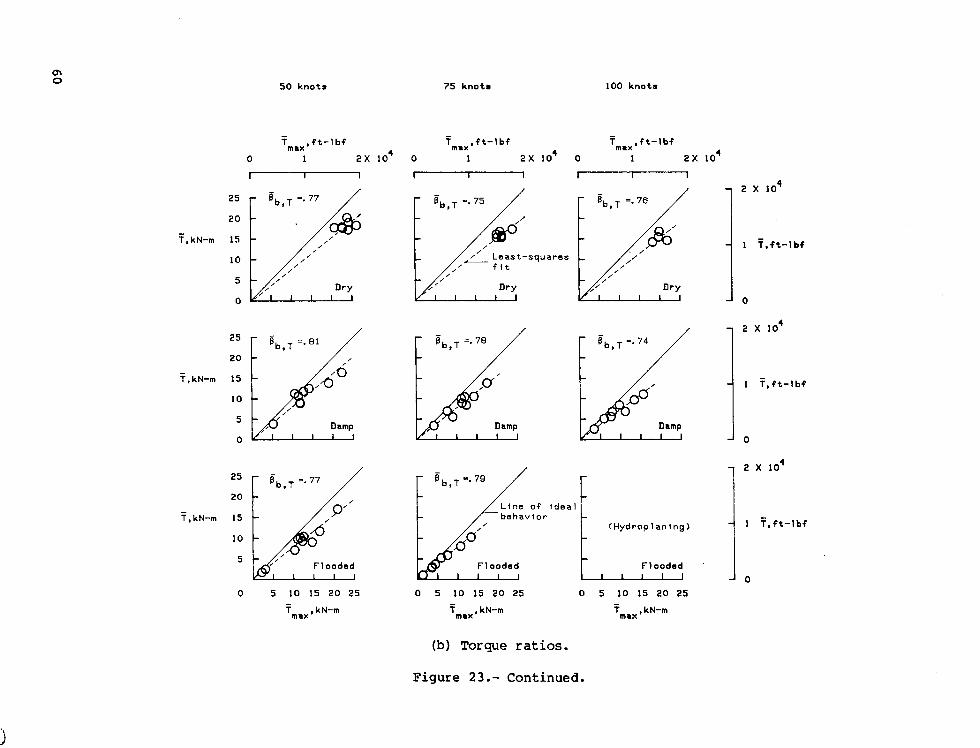
5 0 knots 75 knots 100 knots
- - - Tmax,ft-lbf Tmmx,ft-lbf Tmax,ft-lbf
0 1 2~ lo4 o 1 2~ lo4 o I 2 x IO'
7,kN-m 15 1 7.ft-lbf 10 + Least-squares
f i t
5
0 0
, /
/
0
c
y, kN-m
25
2 0
15
10
5
0 Damp
25
7,kN-m 15
10
5 Flooded
Damp
l?b,T 5 7 4
1 7.ft-lbf
2 X 10'
1 7,ft-lbf
0
1 2 X lo4
4 1 7,ft-lbf
1, (b) Torque ratios.
Figure 23.- Continued.

50 k n o t s 75 k n o t s 100 knots
. e B b , i' =. 76
fid-Er . 4
0
0 . 4 . e
' d , max- "r
eb, =. 72 /
E,, 5-66 / behavior L i n e of ideal
Damp, 1
B b , 5 . 6 4
Flooded
0 . 4 . e
E d, max-
// 8b,F =.69
, , , , Dry
I I
-/ Bb , =. 63
Damp I
1 (Hydroplaning)
FI oodsd
0 . 4 . e
'd,max-'r
(c) Friction ratios.
Figure 23.- Concluded.
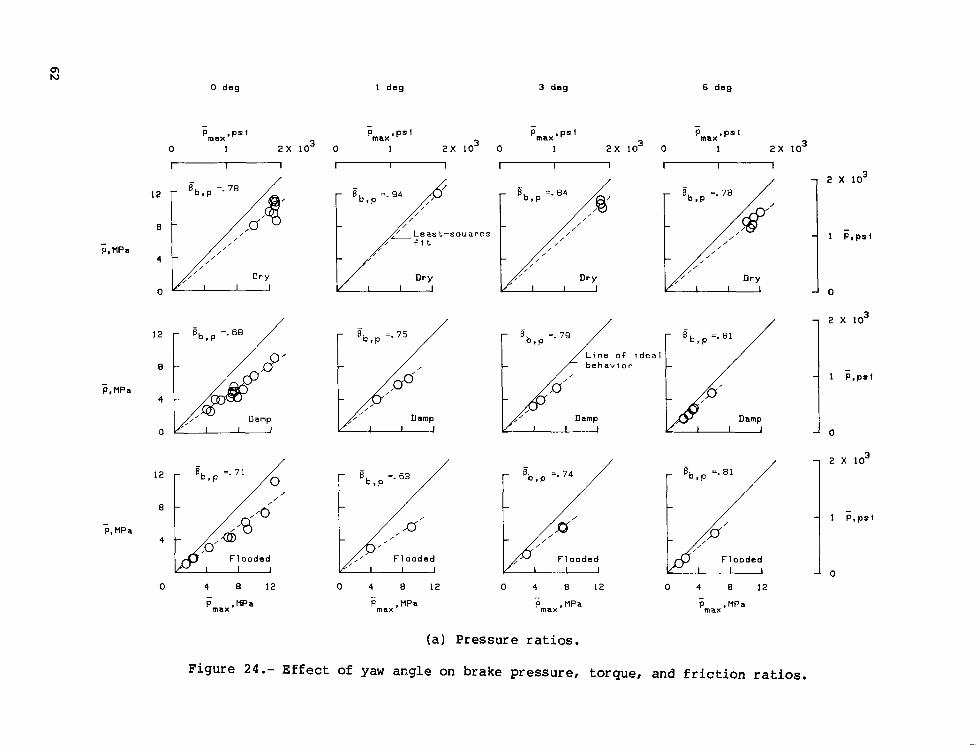
- p,MPa
- P. MPa
12
E
4
0
12
E
4
0
0 deg 1 dag 3 deg 6 dag
0 1 2 x
I I I
12
E
4
I I 1
,' Flooded
(a) Pressure ratios.
Figure 24.- Effect of yaw angle on brake pressure, torque, and fr ic t ion ra t ios .

0 deg 1 deg 3 deg 6 deg
- - - - Tmax,ft-lbf Tmax,ft-lbf Tmax,ft-lbf Tmax,ft-lbf
0 1 2 x lo4 o 1 2~ lo4 o 1 2~ lo4 o 1 2~ lo4
I I I I I I I I I I I I
25
20
7.kN-m 15
10
5
0
7 , kN-m
25
20
15
10
5 Flooded
ideal
0 5 10 15 20 25 0 5 10 15 20 25 0 5 10 15 20 25 0 5 10 15 20 25 - - - - Tmax I kN-m T ,kN-m T m a x I kN-m Tmax I kN-m max
- 2 X lo4
- 1 7,ft-lbf
- 0
- 2 X lo4
- 1 7,ft-lbf
- 0
2 X lo4
1 T,ft-lbf
0
(b) Torque ratios.
Figure 24.- Continued.
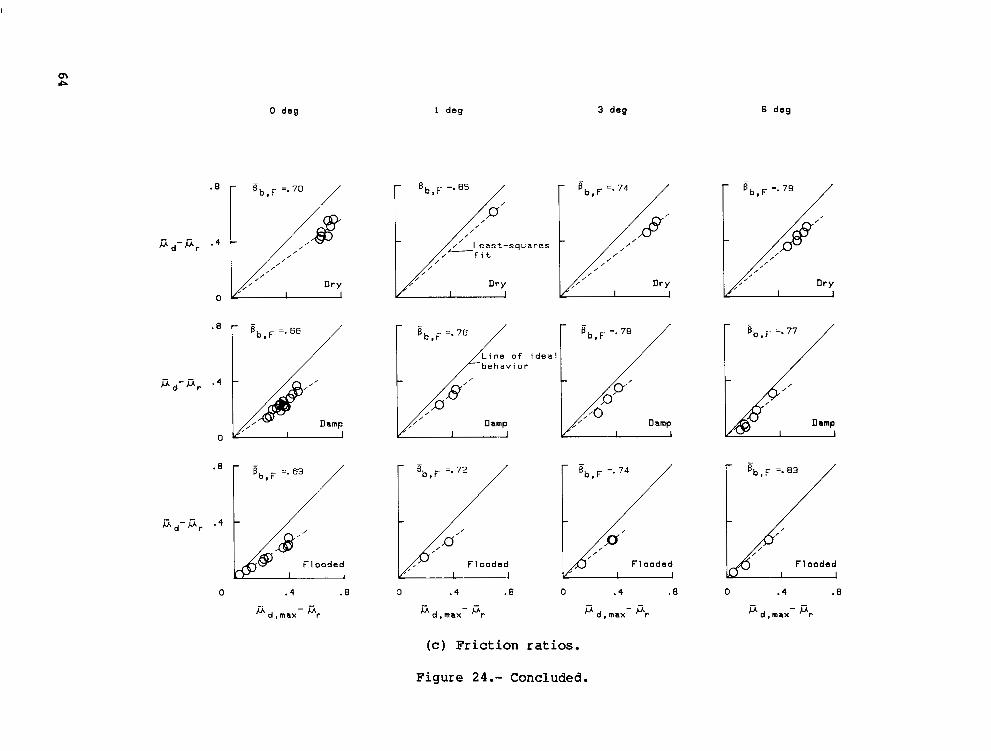
0 dag 1 dog 3 dog 6 dog
behavior
Damp
i d e a l
Damp
0 . 4 .B 0 . 4 . e 0 . 4 . e 0 . 4 . e
fid,max-'r ' d , max- 'r ' d , max- 'r ' d , max- 'r
( c ) F r i c t i o n ratios.
F i g u r e 24.- Concluded.

(67 kN 67 to 89 kN ((15 000 lbf)
>89 kN (15 000 to 20 000 lbf) (>20 000 lbf)
12
e
4
0
L e a s t - s q u a r e s ,- , f i t , , , D r y
p, MPa
12 , % , p =./ r e, =_ 64 / E
12
E
4
b e h a v i o L i n e o f
Flooded
i d e a l P
1 ;,psi
0
- 2 X lo3
- - 1 P.ps1
- 0
- 2 X lo3
- - 1 P . P + f
- 0
(a) Pressure ratios.
Figure 25.- Effect of vertical-force variations on brake pressure, torque, and f r ic t ion ra t ios . Yaw angle, Oo; t i r e condition, new.
65
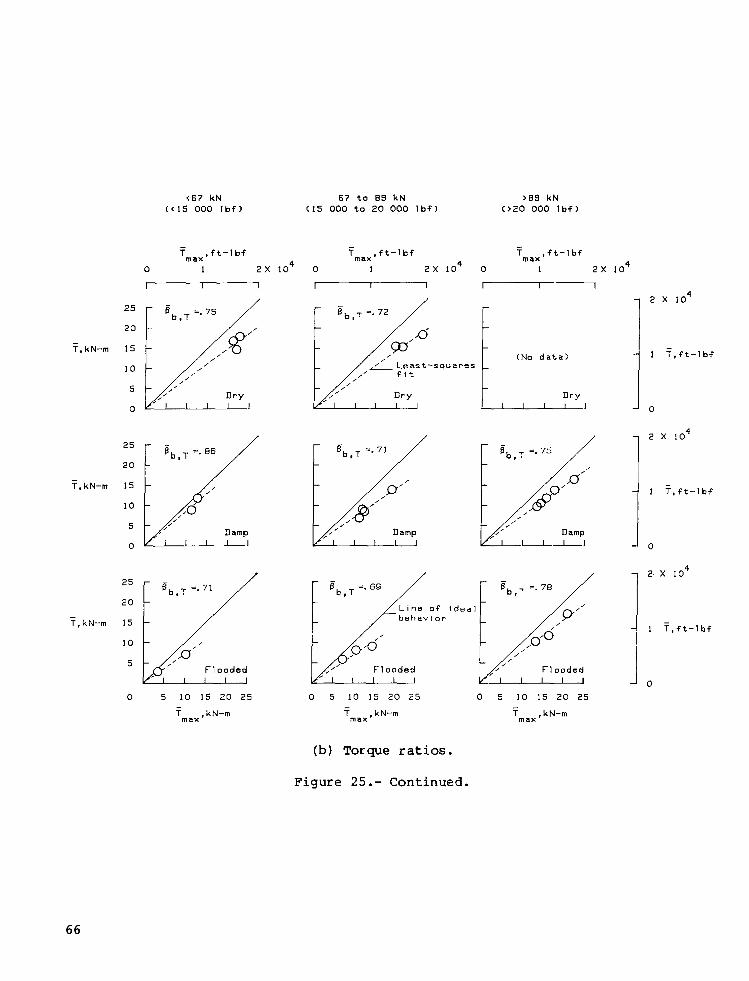
25
2 0
7,kN-m 15
10
5
0
7 , kN-m
25
2 0
15
10
5
0
25
2 0
T , kN-m 15
10
5
-
( 6 7 k N 67 t o 89 k N (<15 000 I b f ) (15 000 t o 2 0 000 I b f )
> 8 9 k N ( > 2 0 000 I b f )
- T m a x , f t - l b f
0 1 2 x
I I I
1 o4
- - T m a x , f t - l b f T m a x , f t - l b f
0 1 2~ lo4 o 1 2 x lo4 I I I I I I
L L e a s t - s q u a r e s (No d a t a )
f i t
Damp
[ 'b,T=.,/ L i n e o f i d e a l 1 'b ,T =./
b e h a v i o r
0 5 10 15 2 0 25 0 5 10 15 2 0 25 0 5 10 15 2 0 25 - - - Tmax, kN-m Tmax I kN-m Tmax, kN-m
2 X l o4
1 ' i , f t - l b f
0
(b) Torque ratios.
F i g u r e 25.- Continued.
66

. a
f i d - f i r - 4
0
. e
f i d " f i r - 4
0
. a
f i d - f i r
( ( 1 5 000 Ibf) ( 6 7 kN
(15 000 to 20 000 Ibf) 67 to 89 kN
Bb - =_ 70
Damp
- Bb ,F =. 63 /
L i n e o f i d e a l b e h a v i o r
bP' Dampl
e,, F' =. 59
/// ' Flooded, "'
LJ
I F I oodsd
(>20 000 Ibf) >a9 kN
Bb,;- =_ 66
Damp
N FI oodsd I I
0 . 4 . a 0 . 4 . a 0 . 4 . e -
fid.max- "r wd,rnax- fir Pd.max- f i t -
(c) F r i c t i o n r a t i o s .
Figure 25.- Concluded.
67
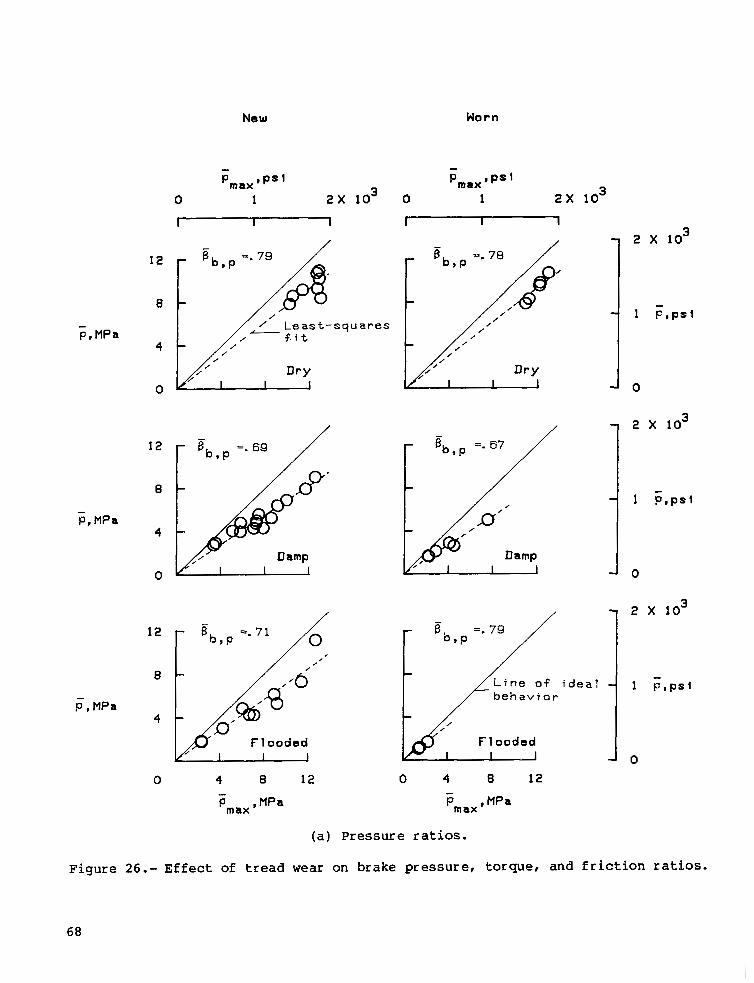
New No rn
12
0
4
0
p, MPa 4
b e h a v i o r
- 1 ooded - 0 0 4 8 12 0 4 8 12
(a) Pressure ratios.
68

New Worn
?, kN-m
7, kN-m
y , kN-rn
- Tmax,ft-lbf
0 1 2~ lo4 I I 1
2 0
15
10
5
0
25 r Bb, 7’ =. 76 - /
20
15
1 0
5
0
25
20
15
1 0
5
0
. - B b , =. 76 /
/’: F1 oodsd
5 10 15 20 25
T ,kN-m - max
q u a r e s
I I I
2 X lo4
1 7,ft-lbf
0
-
F1 ooded
0 5 10 15 20 25 - Tmax , kN-m
(b) Torque ratios.
Figure 26 .- Continued.
2 X lo4
1 7,ft-lbf
0

New Worn
. 8
. 8
nd-Pp - 4
B b , =. 68 -
/ L i n e of ideal b e h a v i o r
- Bb, =. 65 /
Flooded F1 ooded
0 . 4 . 8 0 . 4 . e
d, max- Pd,rnax - P ,
(c) Friction ra t ios .
Figure 26.- Concluded.
70
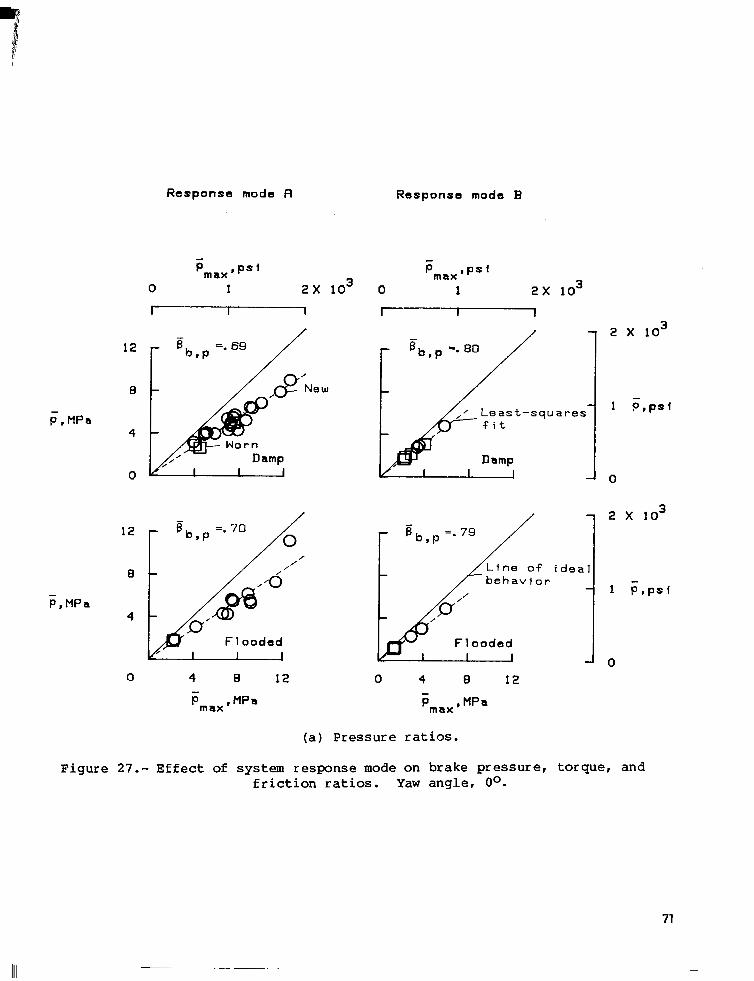
Response mode fl Response mode B
I I 1
p, MPa
l2 r %P =. 70 ,( - P , MPa
0 4 B 12
Pmax MPa
0
New
- s,,, =. 79 / t Line of idea behavior
0 4 B 12 - P ,MPa max
(a) Pressure ratios.
Figure 27.- Effect of system response mode on brake pressure, torque, and f r ic t ion ra t ios . Yaw angle, Oo.

Response mode fl Response mode B
f , kN-m
7, kN-rn
- T m a x , f t - l b f
- Tmax, f t - 1 b f
0 I 2 x lo4 o 1 2~ lo4
I I 1
25 r is,,, =. 77
20
15
1 0
5
0
25
20
15
10
5
New
F 1 ooded
I I I
2 X lo4
- -
L i n e of b e h a v i o -
L F1 ooded
0 5 1 0 15 20 25 0 5 IO 15 20 25 - T ,kN-m Tmax kN-m
- m ax
1 T , f t - l b f
0
2 X lo4
1 f , f t - l b f
0
(b) Torque ratios.
Figure 27.- Continued.
72
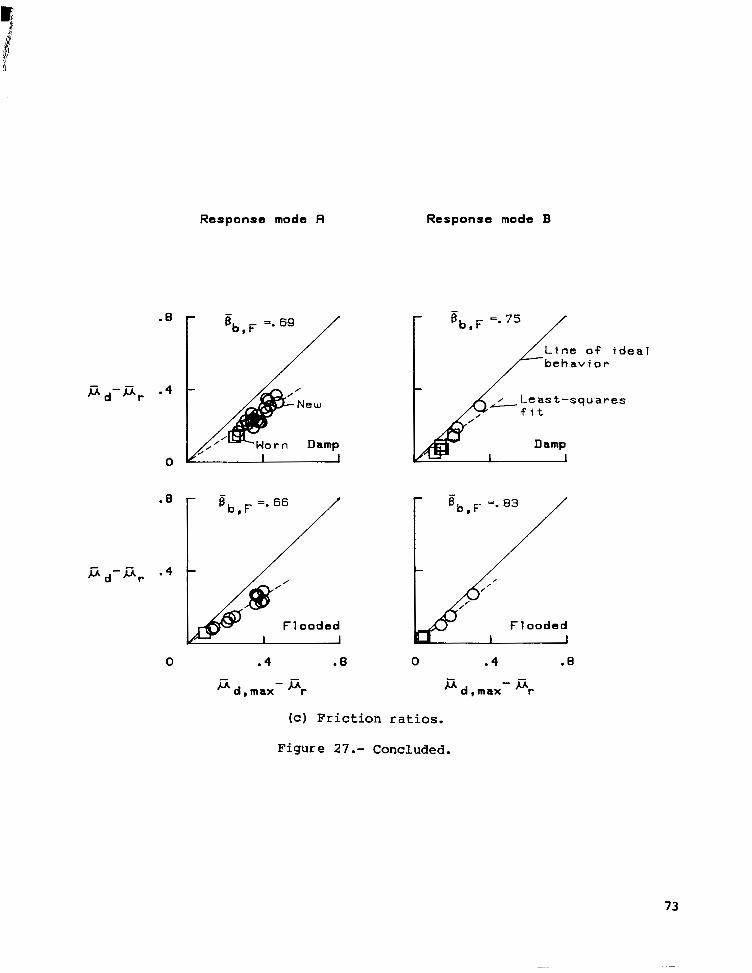
Response mode A Response mode B
.8
Line o f ideal
f i d - f i r - 4
0
0 . 4 . 8 0 . 4 . e
fid,max - fir fid.max - fir
(c) F r i c t i o n r a t i o s .
F igure 27.- Concluded.
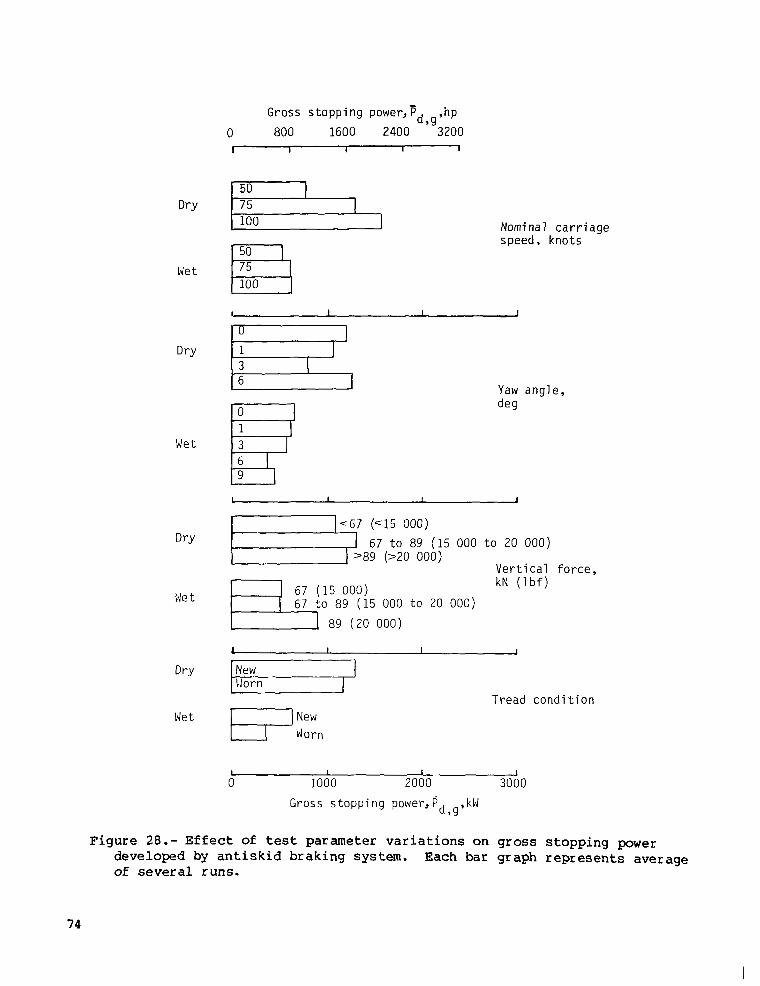
Gross s topping power,Pd ,hp
0 800 1600 2400 3200 I I I I 1
3g
50 1
100
Nominal carr iage speed, knots
1 I ’
Yaw ang le , deg
r 1 ~ 6 7 (e15 000) 67 t o 89 (15 000 t o 20 000)
V e r t i c a l f o r c e .
67 (15 000) kN ( l b f )
89 ( 1 5 000 t o 20 000)
I I 89 (20 000)
1 1 I J
I” T r e a d c o n d i t i o n
I I I 1 0 IO00 2000 3000
Gross stopping power, P, , kW Yg
Figure 28.- Effect of t e s t parameter variations on gross stopping power developed by antiskid braking system. Each bar graph represents average of several runs .
74

T i r e s t o p p i n g p o w e r , P d , t , h p 0 100 200 300 400 500
I I I I 1
y 100
p q , 100
Nominal c a r r i a g e s p e e d , knots
Yaw a n g l e , deg
I 1 I I I
67 t o 89 (15 000 t o 20 000)
V e r t i c a l f o r c e , kN ( l b f )
67 ( ~ 1 5 000) 89 ( 1 5 000 t o 20 000)
~ 8 9 (>20 000) I I I I I
N err 1 Worn
T r e a d c o n d i t i o n
0 100 200 300 400
Tire stopping power,Pd,t ,kW
Figure 29.- Effect of t e s t parameter variations on stopping power dissipated by t i r e .
75

Surface condition
F .8
Yaw angle,
1 e U e 3 9 E A 6 m + 9 A
.2 - 0 -2 .4 .6 .8
Figure 30.- Effect of maximum drag-force fr ic t ion coeff ic ient on r a t i o of t i r e stopping power to gross stopping power.
76
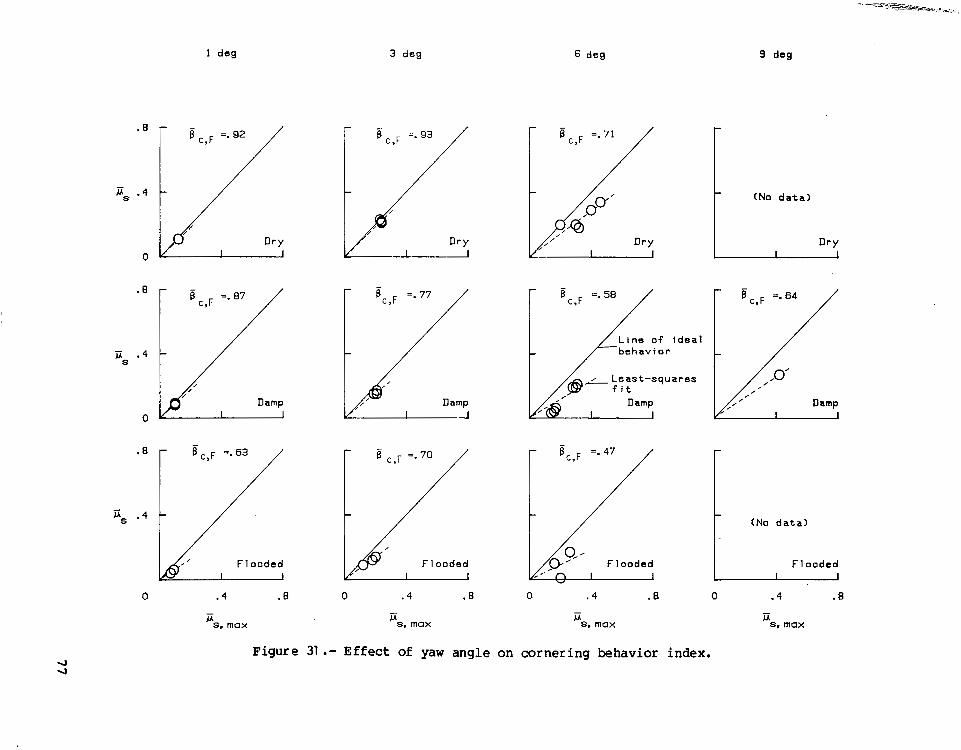
. e
- us . 4
0
1 deg
' B c , F =.87 / Damp
0
- =-63 /
/ / / , F1 ooded
. 4 . e - '"s, rnax
3 deg
d/ e c,F =. 93
D r y - =. 77
c,F =. 70 / /
F I ooded I
6 deg
I / ec ,F =.58
L i n e of i d e a l behav ior
ec,F =. 47
/ /
F1 ooded 1 v
9 dog
(No d a t a l
(No d a t a )
F1 ooded ' 0 . 4 . e 0 . 4 . 8 0 . 4 . e
'"s, max -
'"s, rnax -
'"s. max -
Figure 31.- Effect of yaw angle on cornering behavior index.

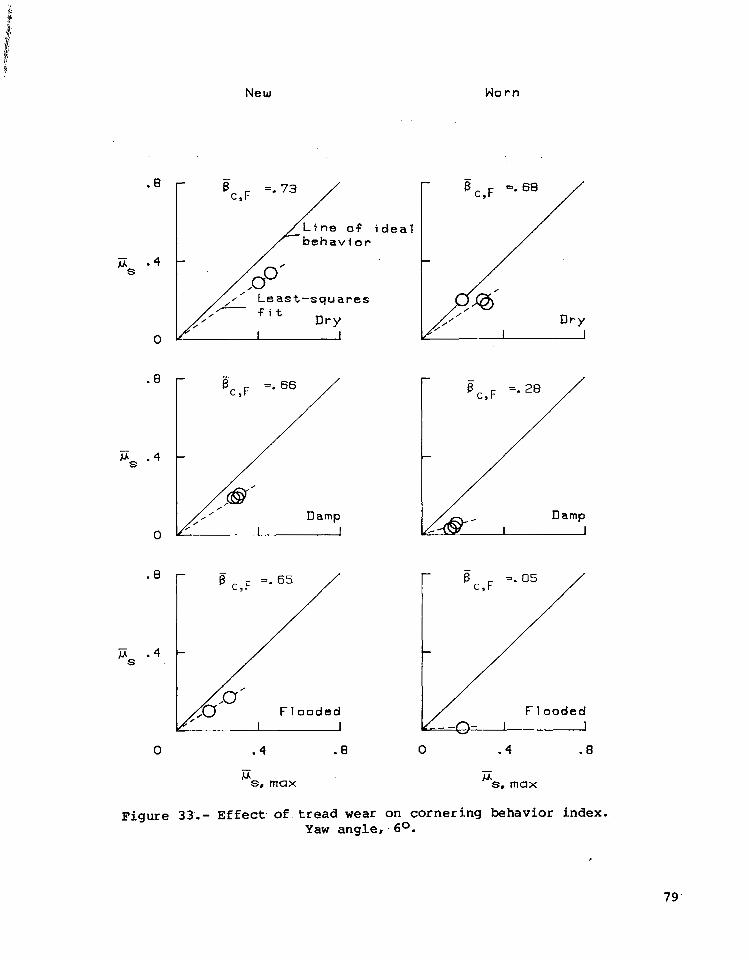
New No r n
. e
PS . 4
0
x' L e a s t - s q u a r e s
. e
% . 4
c,F =. 65
F 1 ooded I I
0 . 4 .8 - '"s. max
Figure 33 . - Effect. of. tread weaI
i d e a l
F 1 ooded
0 . 4 .8 - '"s, rnax
on cornering behavior index. Yaw a n g l e , . 6O.
79
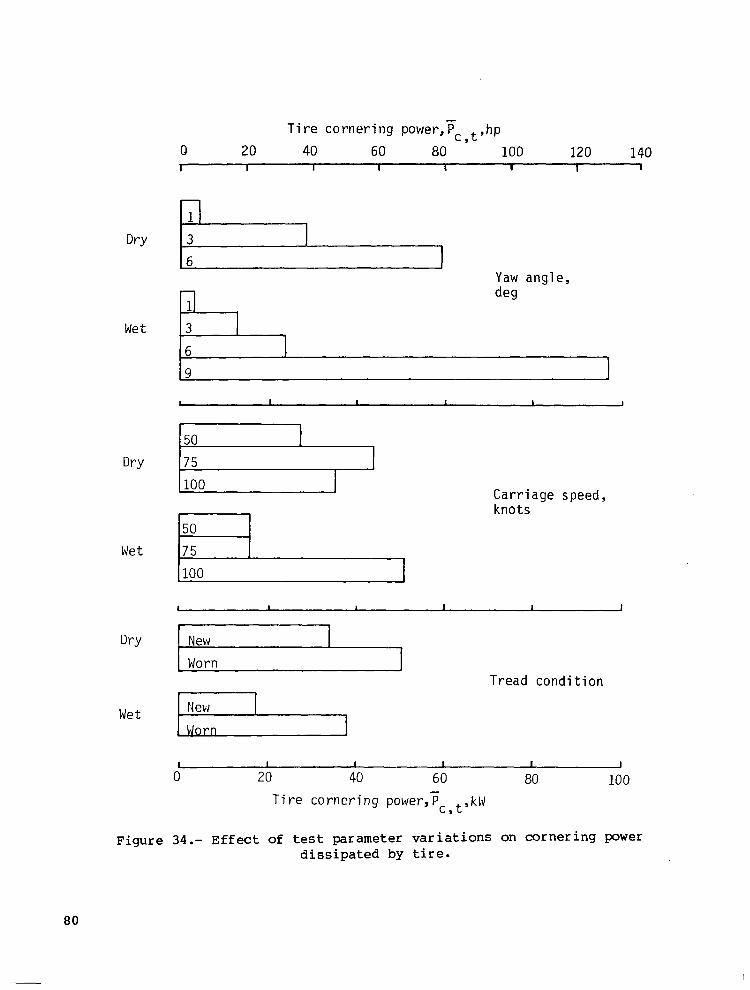
Dry
Wet
Dry
Wet
Dry
Wet
Tire cornering power,F ,hp c s t
0 20 40 60 80 100 120 140 1 I I I I I I I
16 I Yaw angle, deg
50 1 I
100 1 Carriage speed, knots
100 I
Tread condition
f I I I I I 0 20 40 60 80 100
Tire cornering power,P ,kLJ -
c , t
Figure 34.- Effect of t e s t parameter variations on cornering power dissipated by t i r e .
80

APPENDIX
TIME HISTORIES
This appendix presents time histories in figures A1 to A91 of nine parameters which describe the behavior of the antiskid system during each test condition. These nine parameters, which are wheel speed, slip velocity, wheel acceleration, brake pressure, brake torque, drag-force friction coefficient, side-force friction coefficient, alining torque, and slip ratio, are given for the convenience of the user in studying detail characteristics of the antiskid system.
81

APPEND1 X
Wheel
r p s speed,
slip
m/= velocity,
Wheel accel., rad/sec
Brake pressure, MPa
Brake torque, kN-m
p d
P1
Mining torque, kN-m
Slip ratio
2o r 10
0
20 - 3 x IO8 2 Brake
1 pei 10 - pressure,
0 ~ = A 0 ~~
40r 1 3 x 10' I - 2 Brake
20 "1 ft-lbf
torque,
n n
1.0 r-
1.0
1.0
.5
1 I ." - 0 2 4 6 8 10 12 14 16 18
Time. sec
.~ 1-J
Figure A1 .- Time histories for run 1 . Naninal carriage speed, 39 knots; vertical load, 59.2 kN (1 3 300 l b f ) ; yaw angle, Oo; brake pressure, 1 4 MPa (2000 ps i ) ; t i re condi t ion , new; surface condition, dry.
82
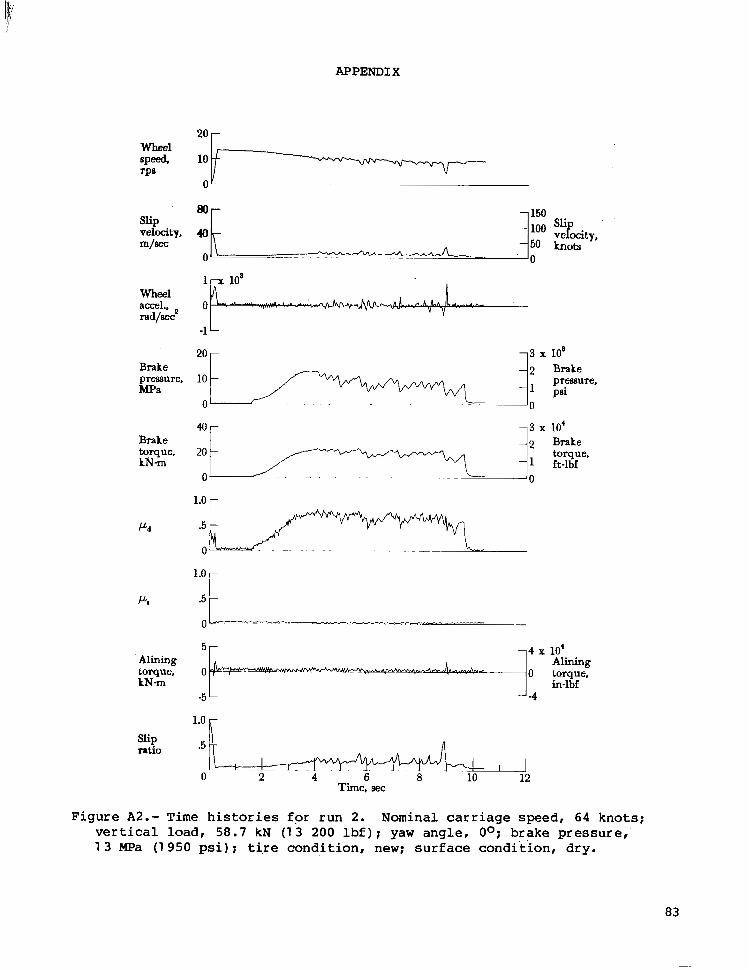
APPEND1 X
Wheel speed, rP8
Slip velocity, m/=
Wheel accel., rad/Bec2
Brake pressure, MPa
Brake torque, kNm
Pd
I 4
Alining torque, k N m
Slip reti0
2o t 19 Brake
1.0 r-
r .5 t O L -
5 4 x 10'
0
-5 -4
Alining 0 torque,
in-lbf
1.0
.5 I
0 2 - . ." I
12 Time; sec
Figure A2.- Time h i s t o r i e s for run 2 . Nominal carr iage speed, 64 knots; v e r t i c a l l o a d , 5 8 . 7 kN (1 3 200 l b f ) ; yaw ang le , Oo; brake pressure, 1 3 MPa (1 950 ps i ) ; t i . re condi t ion , new; surface condit ion, dry .
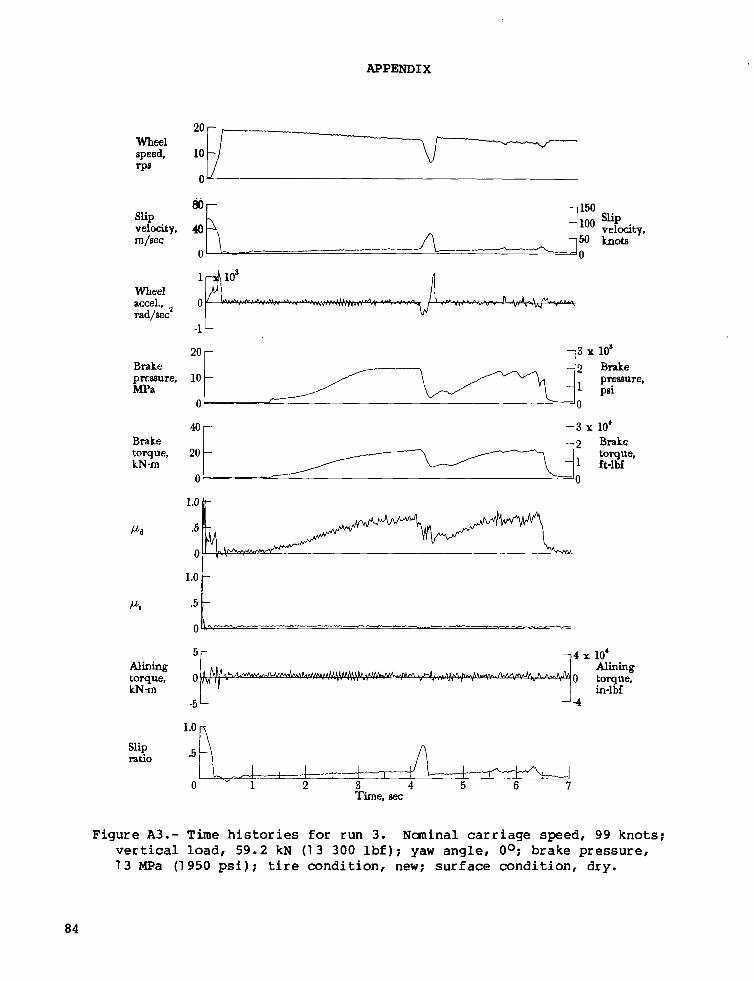
APPENDIX
Wheel
rP8 Speed.
slip velocity, m/sec
Wheel accel., radjse;
Brake presure, MPa
Brake torque, k N m
Pd
Pi
Alining torque, kNm
Slip mho
1 A 10' n 0
-1 L
20 r
lo?* 0 0 Brake
pressure, 1 psi
~ -"--------wt'Z torque,
0 0
1.0 It
l*OI .5
5r 1 4 x 10'
0 Alining
0 torque, in-lbf
-5 L J-4
1.0
.5 -
I I I I I 0 "~ 1 I
2 3 4 5 6 7 Time, LUX
Figure A3.- Time h i s t o r i e s f o r run 3 . Nuninal carriage speed, 99 knots; v e r t i c a l l o a d , 5 9 . 2 kN (13 300 l b f ) ; yaw a n g l e , Oo; brake pressure, 1 3 MPa (1 950 p s i ) ; t ire c o n d i t i o n , new; surface condit ion, dry .
84

APPENDIX
Wheel speed, rP'
slip velocity, m/aec
Wheel accel., rad/aecz
Brake preesure, MPa
Brake torque, kNm
p d
/",
Alining torque, kNm
Slip ratio
*Or
20 - 2 Brake
1 ft-lbf torque.
0 - . . - . ~-
1.0 r
lUo r .5 t 5 -
in-lbf -5 -
1.0
.5 --
I I
0 I I . I
2 I
4 6
I.
- . .
Time. aec
[r n n n .5
I I I.
0 - . . 2 I 4 I . I 6 I 4U.UL I a 10 12 14 16
Time. aec
Figure A4.- Time histories for run 4. Nominal carriage speed, 39 knots; vertical load, 69.8 kN (1 5 700 lbf) ; yaw angle, Oo; brake pressure, 14 MPa (2000 psi); tire condition, new; surface condition, dry.
85
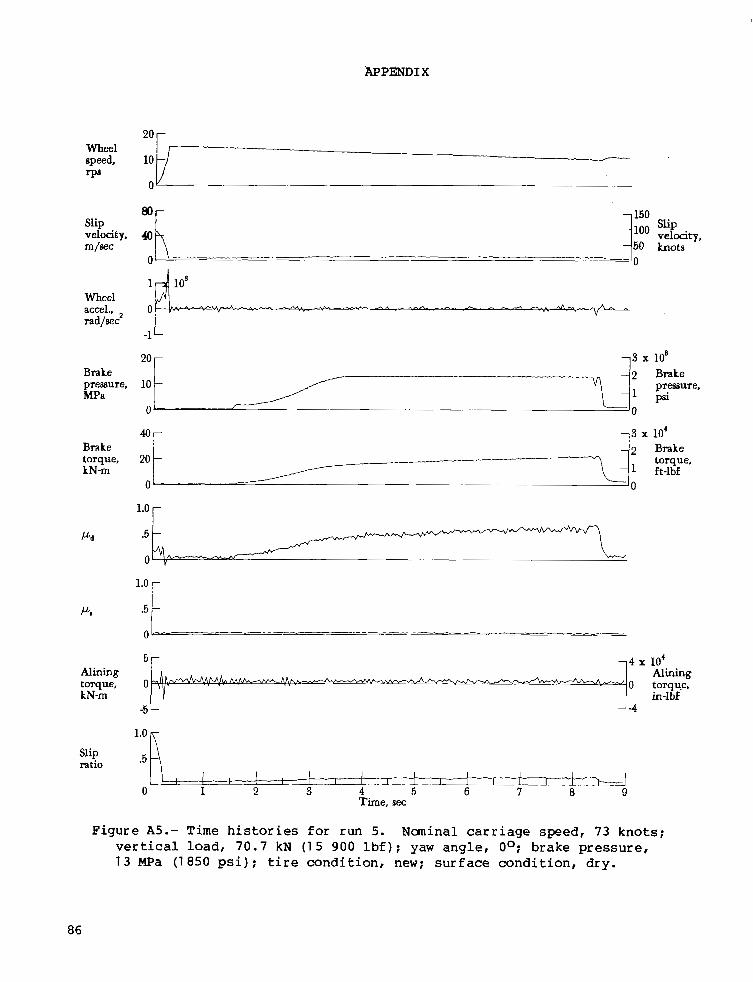
APPEND1 X
2O r Wheel speed, rP8
Slip velocity. m / t x
Wheel accel., rad/sec
Brake pressure. MPa
Brake torque, kN-m
Pd
P,
Alining torque, kNm
Slip rat10
Y
-1 L 20 r 3 x lo8
10
- .]: !?re, 0 - 0
40-
20 - torque, A. 3 x 10' 2 Brake
1 ft-lbf 0 ,
1.0
.5
-
-
0 qy
n - 5 r 1 4 x 10'
0 '%--A o torque, Alining in-lbf
.5 R Figure A5.- Time histories for run 5. Naninal carriage speed, 73 knots;
vertical load, 70.7 kN (1 5 900 l b f ) ; yaw angle, Oo; brake pressure, 13 MPa (1850 psi); t ire condition, new; surface condition, dry.
86
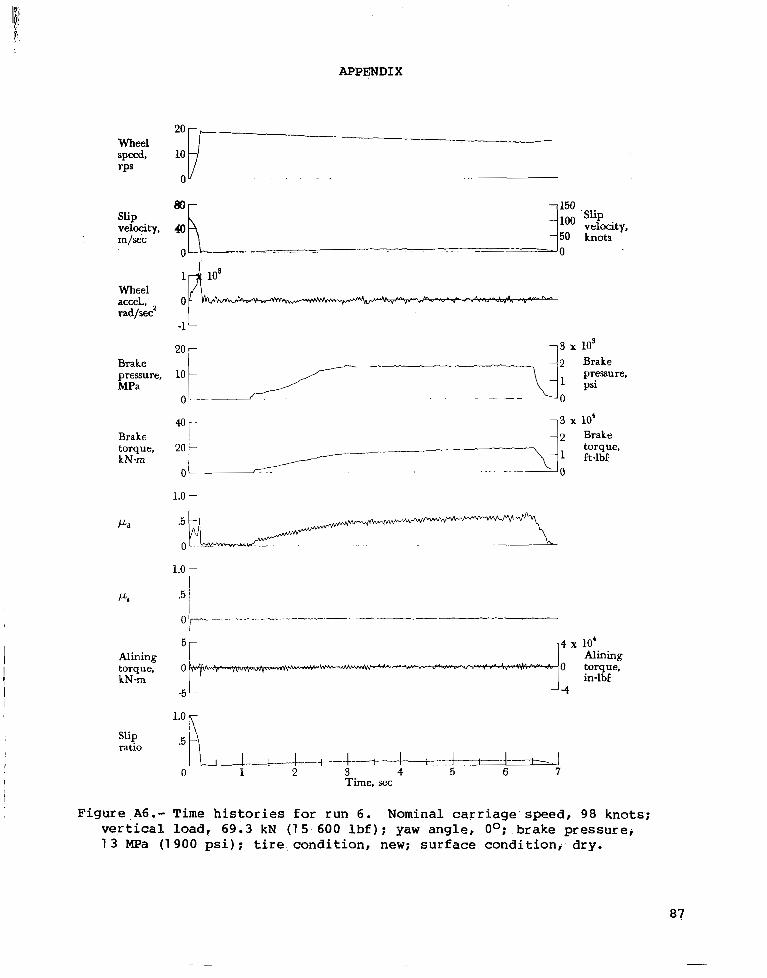
APPENDIX
Wheel speed, rPS
Slip velocity,
1 m/sec
Wheel
rad/sec2 accel.,
Brake pressure, MPa
Brake torque, kN-rn
P.
Alining torque, kN -m
SfiP ratlo
f
5 4 x 10' Alining
0 0 torque,
-5 -4 in-lbf
.5 R I i I I I I I
0 1 2 5 6 3 4 7 Time, sec
L L I .~ .. . t-"
Figure,A6.- Time histories for run 6. Nominal carriage speed, 98 knots; vertical load, 69.3 kN (15-600 lbf); yaw angle, Oo;. brake pressure; 13 MPa (1 900 psi); tire. condition, new; surface condition, dry.
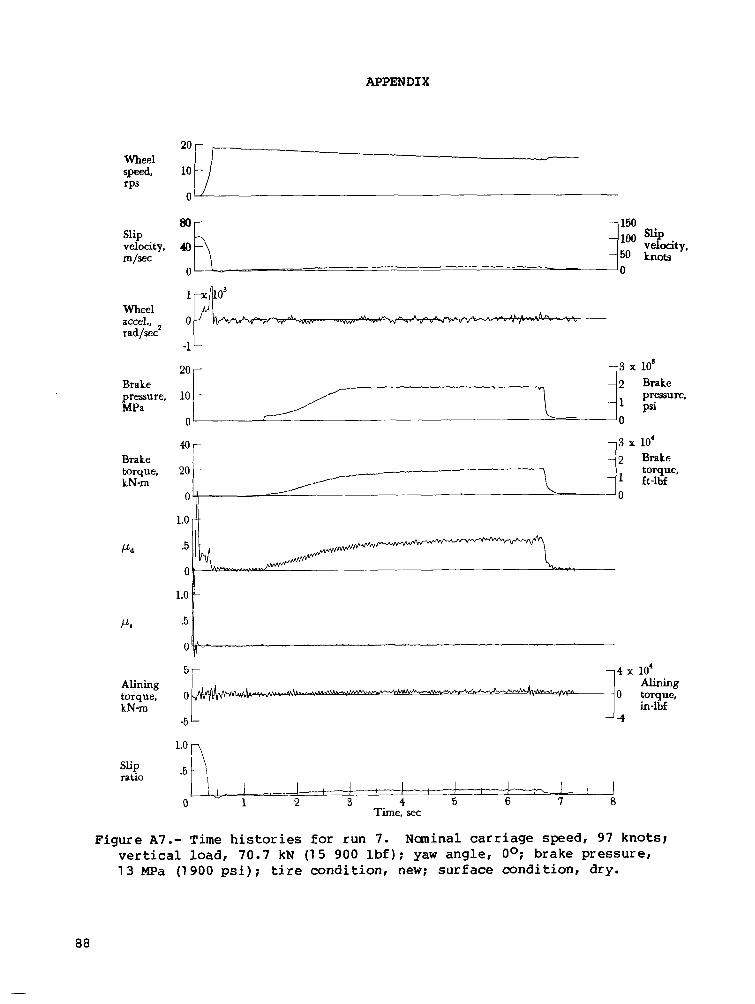
APPENDIX
speed, m e e l 2o 10 [I 11-
m/sec
Wheel accel., rad/sec2
Brake pressure, MPa
Bmke torque, kNm
p d
Pa
Alining torque, kNm
slip ratio
. '0
"12 Brakc
01"- z. - 1 0 - 40-
20 - torque, 2 Brake
ft-lbf 0 '
5 4 x lo4 ALining
0 0 torque,
-5 -4 in-lbf
.5 n 1 , I
0 - 1 2 3 4 5 6 I 8 I I
Time, sec
Figure A7.- Time h i s t o r i e s f o r run 7 . Naninal carriage speed, 97 knots; v e r t i c a l l o a d , 70.7 kN (1 5 900 l b f ) ; yaw angle, Oo; brake pressure, 1 3 MPa (1900 p s i ) ; t i r e c o n d i t i o n , new; surface condit ion, dry.
88
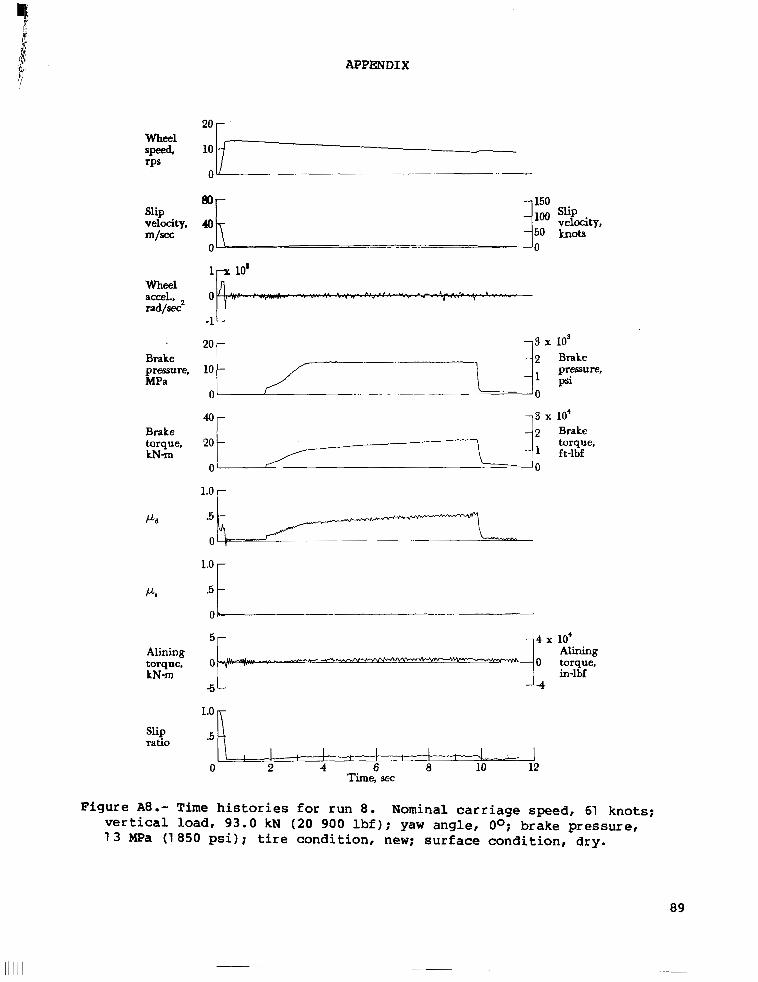
i
APPENDIX
wheel speed. rPS
Slip velocity, m/sec
Wheel accel., nd/sec2
Brake pressure, MPa
Brake torque, k N m
Pd
P.
Alining torque, kN -m
slip ratio
20& 10
0' '0
1 1 10'
0
-1
20 -
10 -
0
-
I.
l " l 0
s x 10' 2 Brake
1 psi pressure,
r
.5 L 0 i
.5 R I ! I I I I I
0 2 4 6 a 10 12 Time. sec
Figure A8.- Time histories for run 8. Nominal carriage speed, 61 knots; vertical load, 93.0 kN (20 900 lbf); yaw angle, Oo; brake pressure, 13 MPa (1 850 psi); tire condition, new; surface condition, dry.
89
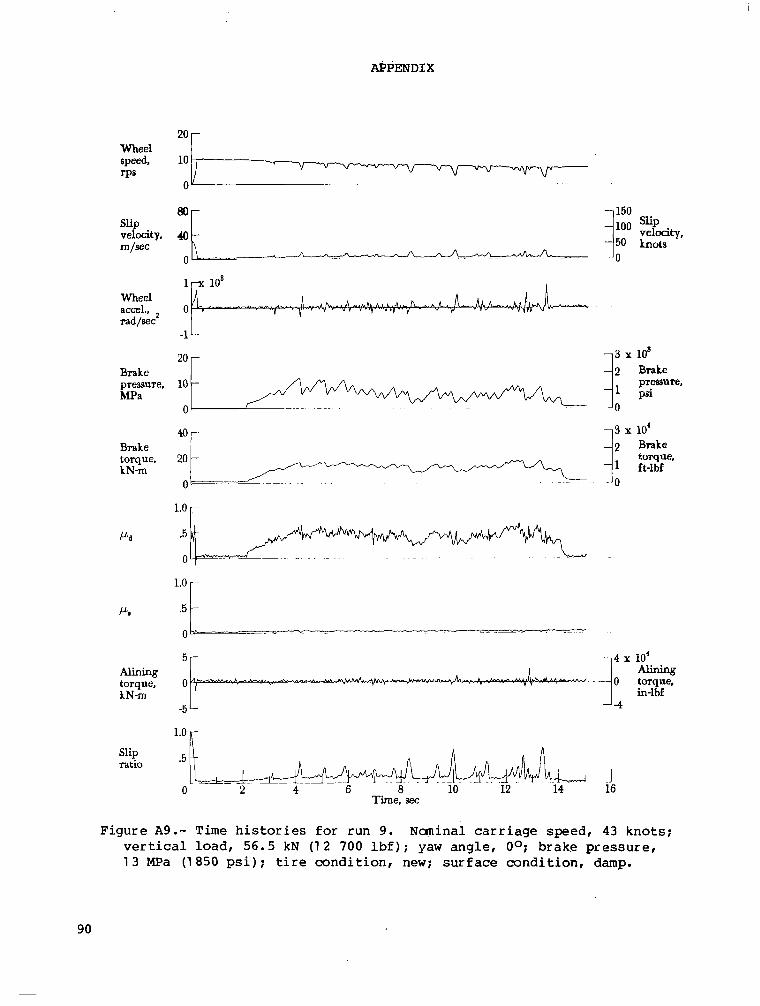
APPENDIX
Wheel speed. rPS
slip velocity, m/sec
Wheel accel., rad/sec
Brake pressure, MPa
Brake torque, kN-m
Pa
P,
Alining torque, kN-m
Slip ratio
20 - 10
20
10 - prmure,
0
- 2 Brake
1 psi ~~~
40- 3 x 10' 2 Brake
20
1.0 7
01
-
2 lo torque, 1 ft-lbf
~ -. . . . . . ~"
.
1.0 -
.5
0'
-
~- " -~ . . ""
5 4 x 10' Alining
0 0 torque. in-lbf
-5 -4
J 0 2 4 6 8 10 12 14 16
Time, EC
Figure A9.- Time histories for run 9. Nominal carriage speed, 43 knots; vertical load, 56.5 kN (1 2 700 l b f ) ; yaw angle, Oo; brake pressure, 1 3 MPa (1850 psi); t i r e condition, new; surface condition, damp.
90

APPENDIX
Wheel speed. rP8
slip
m/= velocity,
Wheel accel., rad/-
Brake prmure, MPa
Brake torque, kN-m
P d
K
Alining torque, mm
slip ratio
20& 10
0 v "_
*O r 10
0
- 1 psi
pressure,
-~
40r 1 3 x 10' I 42
1.0 r .5
0
l a o r *5 t O*
- 4
* O
-5 L 1.0 r
J-4
.5 I I
0 2 4 6 8 10 Time, sec
Brake torque, A-lbf
x 10' Alining torque, in-lbf
Figure A1 0.- Time histories for run 10. Nominal carriage speed, 69 knots; vertical load, 56.9 kN (12 800 lbf); yaw angle, Oo; brake pressure, 13 MPa (1950 psi); tire condition, new; surface condition, damp.
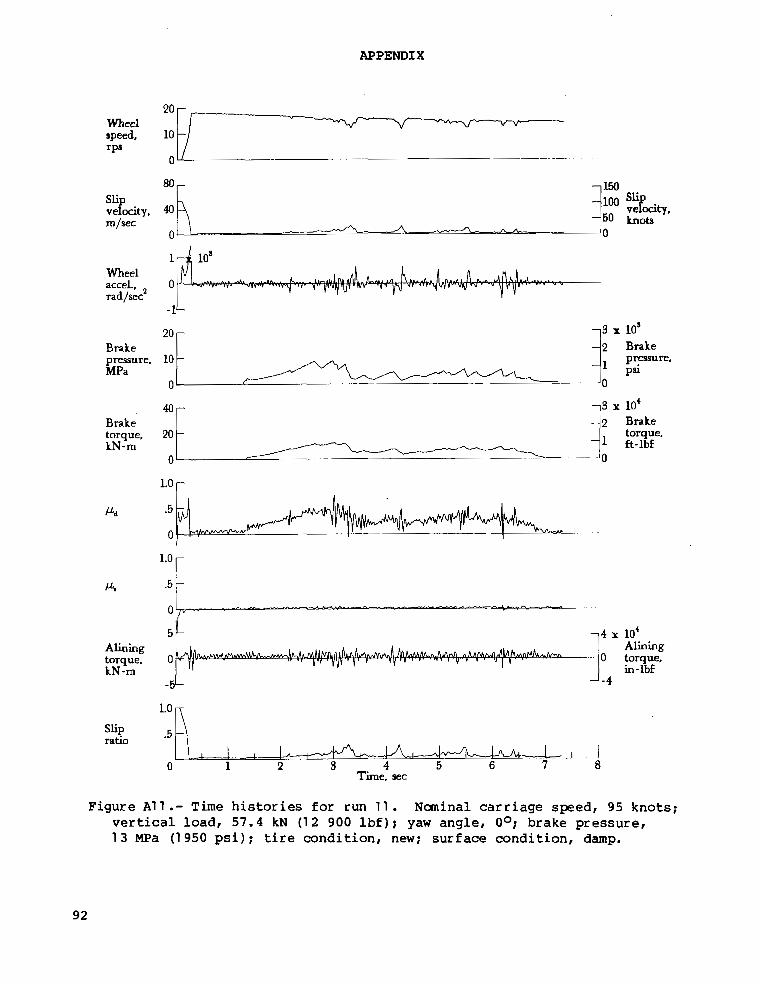
APPENDIX
v v speed, 10 rPs
0
5 4 x 10' Alining Alining torque, 0 0 torque, kN-rn in-lbf
-5 -4
slip ratio
0 1 2 4 5 6 7 8 Time, sec
Figure All.- Time histories for run 11 . Naninal carriage speed, 95 knots; vertical load, 57.4 kN (1 2 900 l b f ) ; yaw angle, Oo; brake pressure, 1 3 MPa (1950 psi) ; t i re condi t ion, new; surface condition, damp.
92
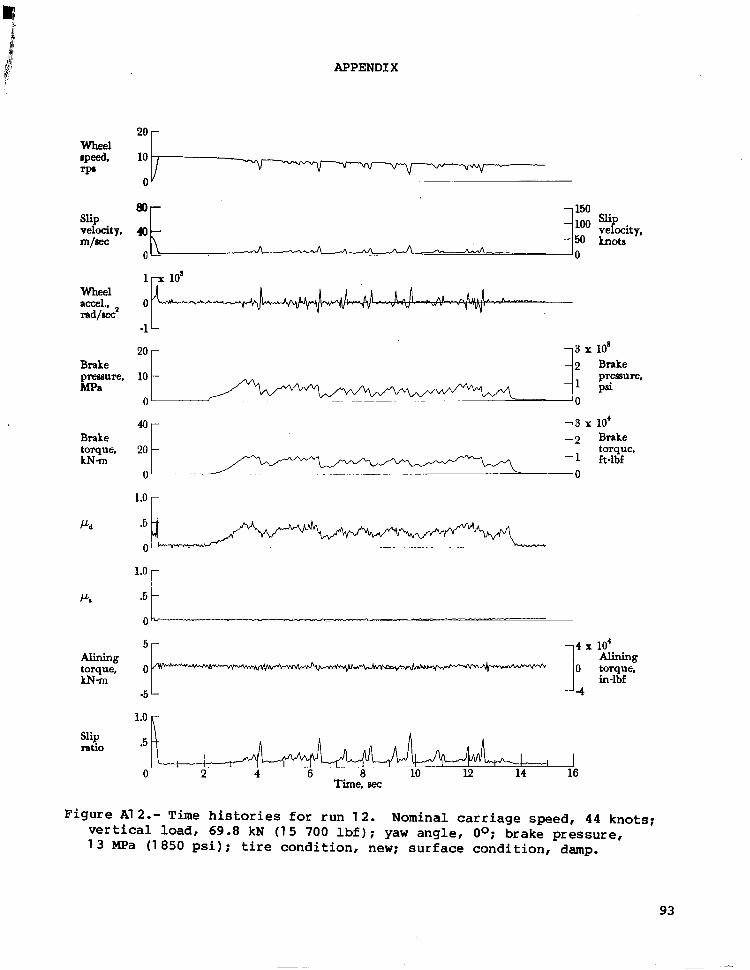
APPEND1 X
20 - Wheel
rP' speed, 10
0'
lrr 10' Wheel accel.. rad/8ecz
Brake preesure, MPa
Brake torque, LNm
k
0
-1 L
20 -
10
0
-
"3 x 10' - 2 Brake
-1 ft-lbf torque,
0
r
laO F .5
5 4 x 10' Alining Alining
-5 -4
torque, 0 0 torque, kNm in-lbf
1.0
Slip ratio .5
I . 0 2 4 6 8 10 12 14 16
1 I . I
Time, 8ec
Figure Al2.- Time h i s t o r i e s f o r run 12 . Nominal carriage speed, 44 knots; ver t i ca l l oad , 69 .8 kN (15 700 l b f ) ; yaw angle, Oo; brake pressure, 1 3 MPa ( 1 850 psi); t i re condi t ion , new; surface condit ion, damp.
93
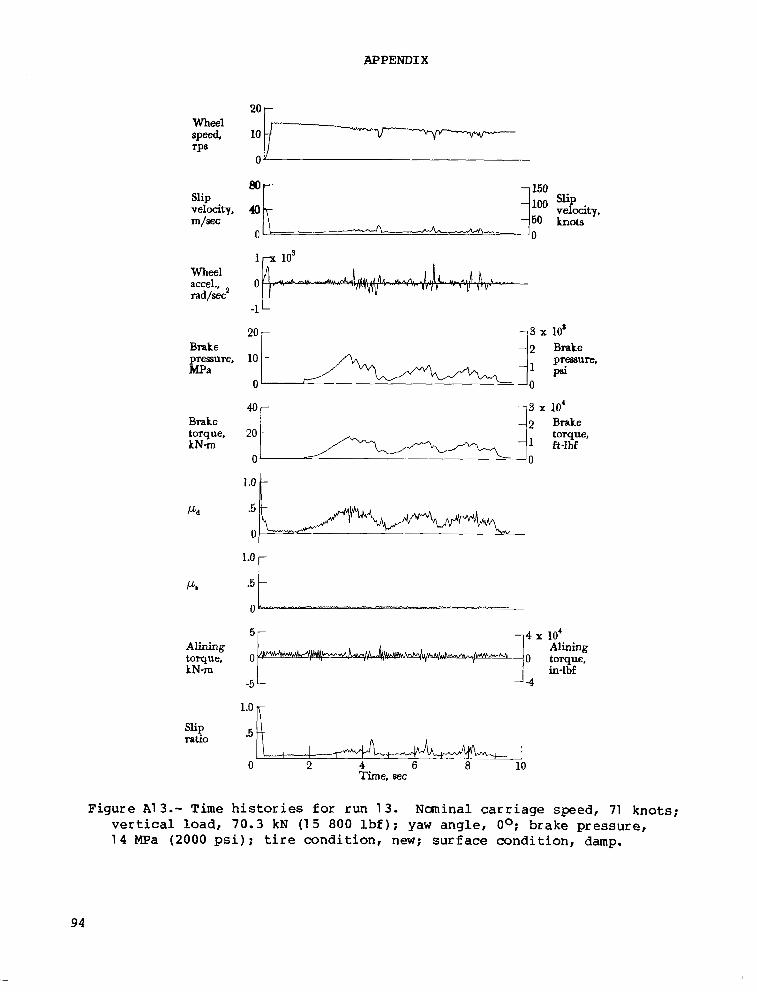
APPEND1 X
Wheel
TPS speed,
Slip velocity, m/sec
Wheel accel., radjsec'
Brake Dresure, t P a
Brake torque, kNm
Pd
P.
Alining
LN-m torque,
Slip ratio
20 - 10
0 3
1.0 1 .5
0
r *5 t 0- . - - -
5 r l4 x 10'
[r .5
! I
0 2 4 6 8 10 Time, aec
Figure A1 3.- Time his tor ies for run 1 3 . Naninal carriage speed, 71 knots; vertical load, 70.3 kN (1 5 800 lbf) ; yaw angle, Oo; brake pressure, 1 4 MPa (2000 ps i ) : t i re condi t ion , new; surface condition, damp.
94
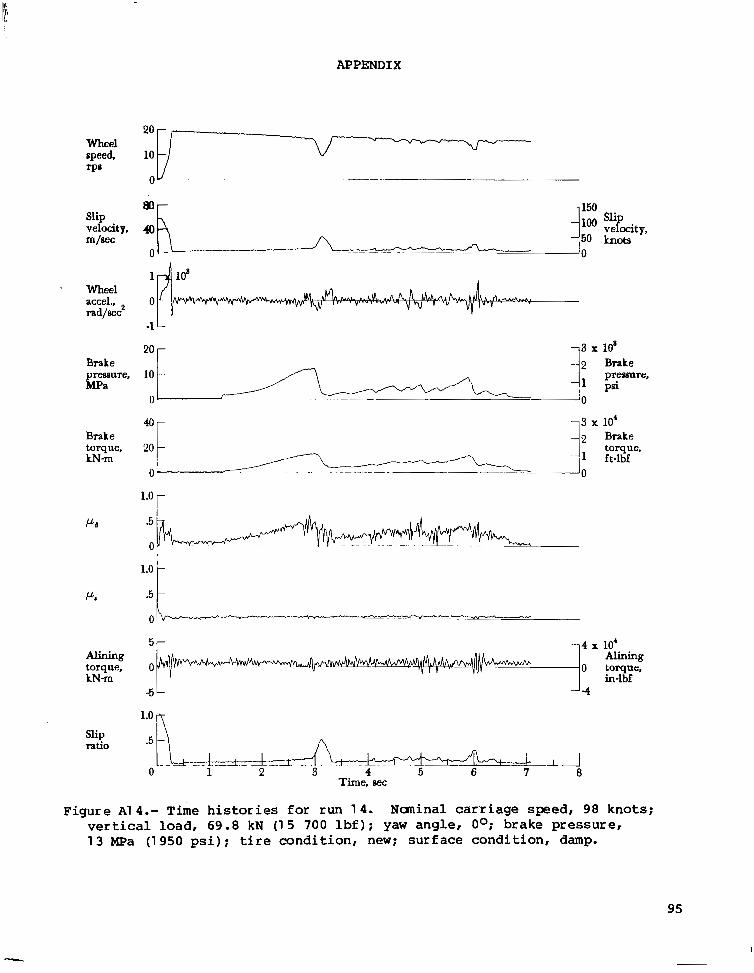
APPENDIX
Wheel speed, rpa
Slip
m/sec velocity,
Wheel accel., raCl/BeCZ
Brake pressure, MPa
Brake torque, kN-m
K
Alining torque, kN-m
Slip rat10
20 - 2 Brake
1 ft-lbf torque,
0 - ~ - ~ ~-
.5
0
lS0 1 .5
Alining 0 0 torque,
in-lbf -5 14
.5 R n
Figure A1 4.- Time h i s t o r i e s f o r run 1 4 . Nominal carriage speed, 98 knots; v e r t i c a l l o a d , 69.8 kN (1 5 700 l b f ) ; yaw angle, Oo; brake pressure, 1 3 MPa (1950 p s i ) ; t i r e c o n d i t i o n , new; surface condit ion, damp.
95
I
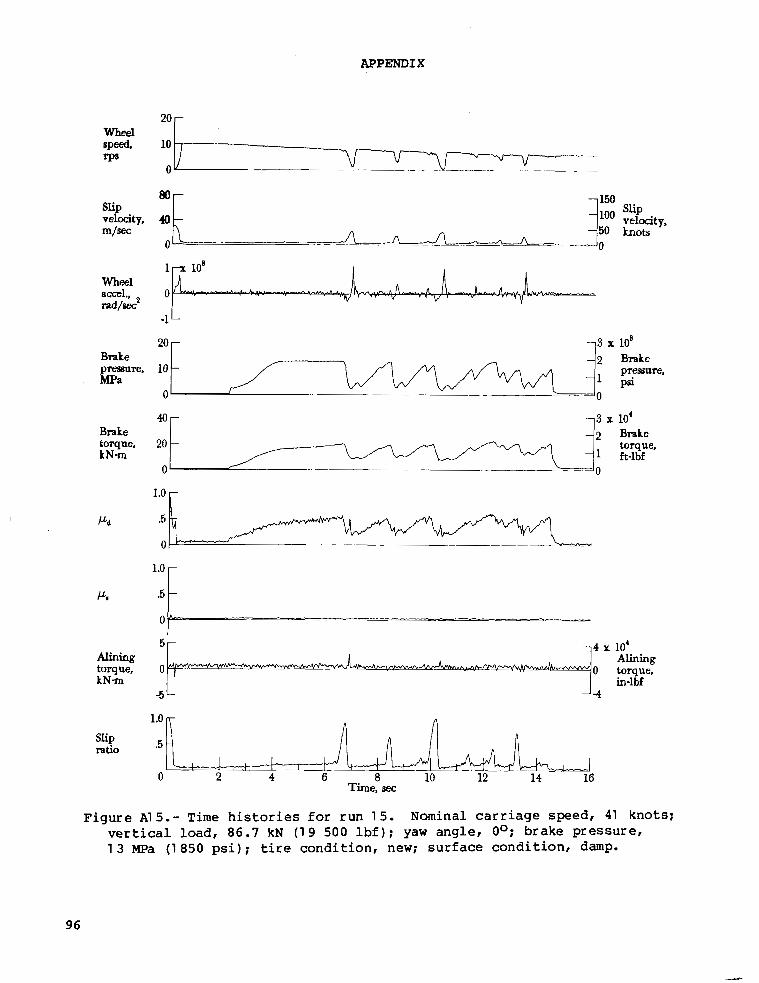
APPENDIX
I
Wheel speed, we
slip
m/= velocity,
Wheel accel., rad/='
Brake presaure, MPa
Brake
k N m torque,
Pd
I4
Alining torque, kNm
slip ratio
*Or
10 - pressure,
0 ~-
l e o r .5 t 0
5 4 x 10'
0 0 torque,
-5 -4
Alining
in-lbf
1.0 n
Figure Al5.- Time his tor ies for run 15. Nominal carriage speed, 41 knots: vertical load, 86.7 kN ( 1 9 500 l b f ) ; yaw angle, Oo; brake pressure, 1 3 MPa (1 850 psi) ; t i re condi t ion, new; surface condition, damp.
96

APPENDIX
Wheel speed, rPS
Slip velocity, m/sec
Wheel accel.. rad/sec2
Brake pressure, MPa
Brake torque, kN-m
P d
II,
Alining torque, kN-m
Slip ratio
203 10 0 V -~
2o r
2o 1 4; ft-lbf torque,
.5 F 5 4 x 10'
Alining 0 0 torque,
-5 4 in-lbf
.5 I
0 2 4 6 8 10 Time, sec
Figure A1 6.- Time h i s t o r i e s f o r run 1 6 . Nominal carriage speed, 70 knots; v e r t i c a l l o a d , 8 9 . 8 kN (20 200 l b f ) ; yaw angle, Oo; brake pressure, 1 3 MPa (1900 p s i ) ; t i r e c o n d i t i o n , new; surface condit ion, damp.
97
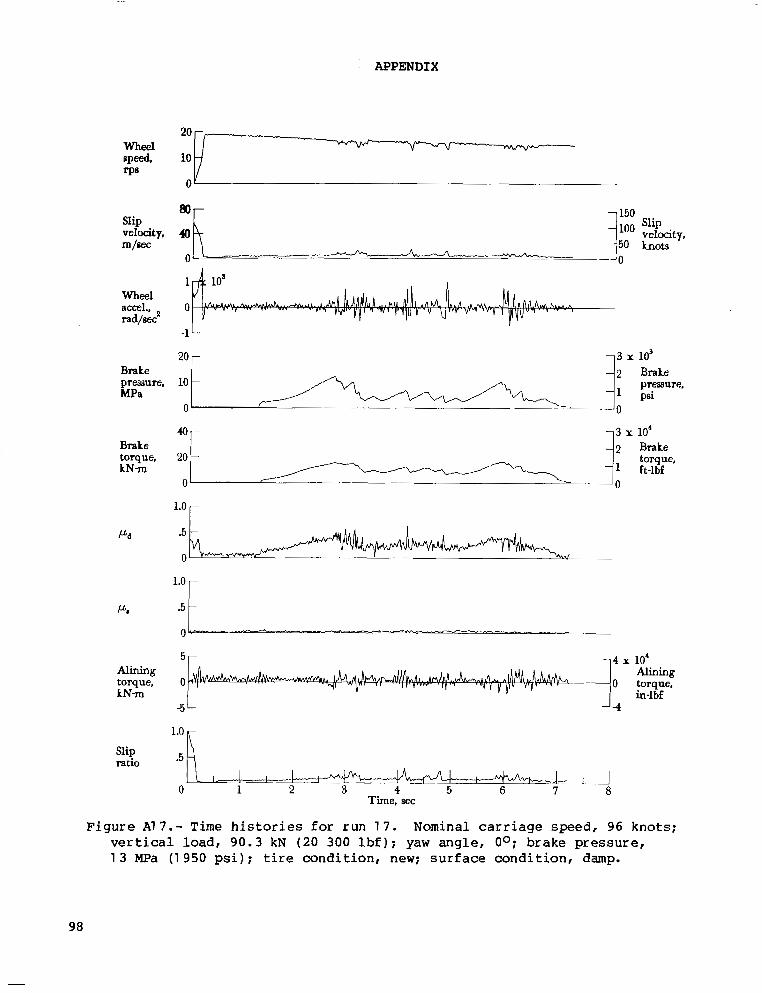
APPENDIX
Wheel accel., rad/=
-1
20 - 3 x lo3 2 Brake
1 psi
Brake pressure, 10 MPa
- lo pressure,
0-
40- Brake
1 ft-lbf kN-m - torque, torque, 20 2 Brake
0
1.0 r P& .5 -
0
5 4 x 10‘ Mining Mining
-5 -4
torque, 0 0 torque, kN-m in-Ibf
r
F i g u r e A l 7 . - Time h i s t o r i e s for r u n 1 7 . Nominal c a r r i a g e s p e e d , 96 knots ; v e r t i c a l l o a d , 9 0 . 3 kN (20 300 l b f ) ; yaw a n g l e , 00; brake p r e s s u r e , 1 3 MPa (1 950 p s i ) ; t i r e c o n d i t i o n , new; s u r f a c e c o n d i t i o n , damp.
98
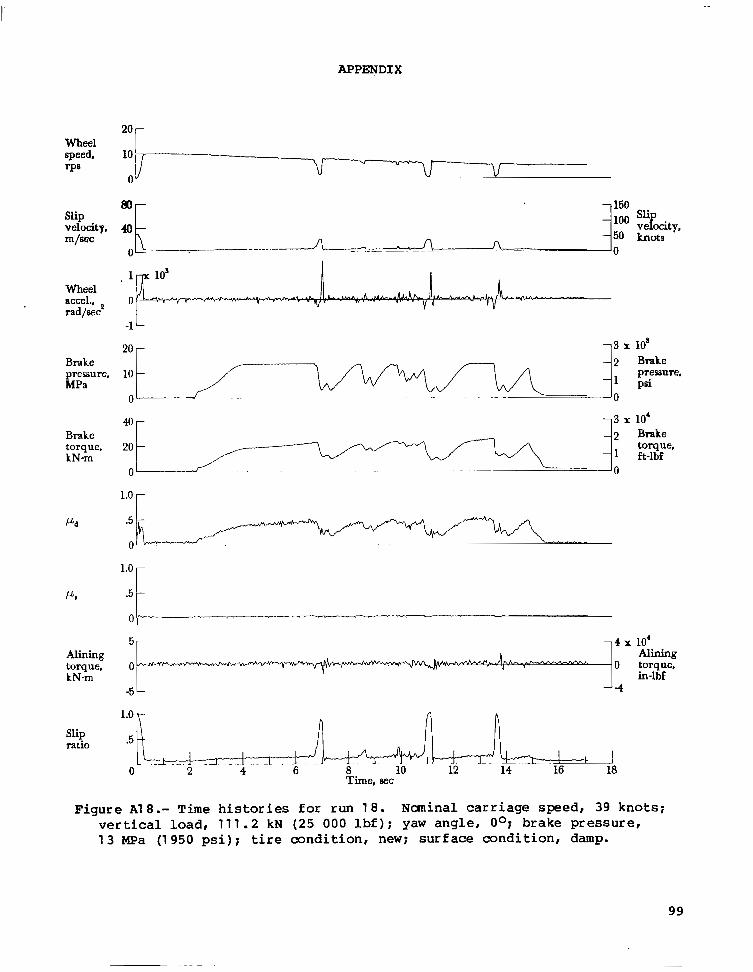
APPENDIX
Wheel speed, rPs
slip velocity, m/wc
Wheel accel., rad/sec2
Brake pressure, MPa
Brake torque, kN-m
p d
Alining torque, kN-m
Slip ratio
20 -
10
0
v v V
20
0
- 2 Brake
1 ft-lbf torque,
r .5
0
I
- 4 x 10‘ Alining
0 torque,
-5 in-lbf
“4
Figure A1 8.- Time h i s t o r i e s f o r run 18. Naninal carriage speed, 39 knots; v e r t i c a l l o a d , 111.2 kN (25 000 l b f 1: yaw angle, Oo; brake pressure, 1 3 MPa (1 950 p s i ) ; t i r e c o n d i t i o n , new; surface condit ion, damp.
99
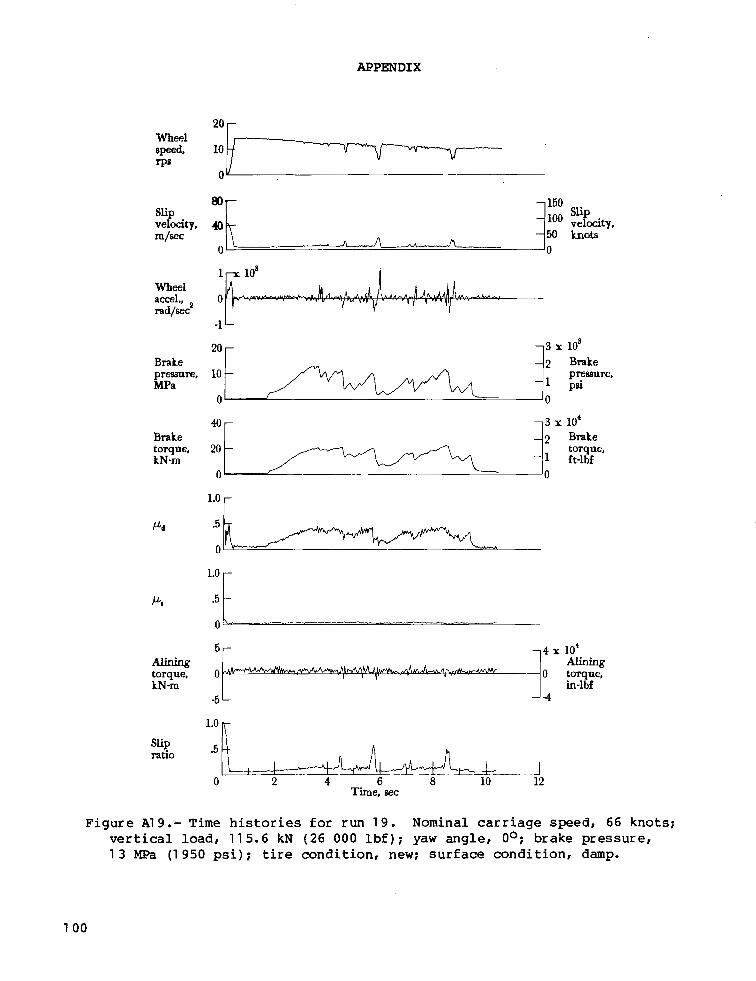
APPENDIX
slip
m/= veIocity,
Brake pressure, MPa
"
10
0
-
2 Brake torque, kNm 1 ft-lbf
torque,
'ao r
P. I:$ , - I
0
5
torque, 0 kNm in-lbf
Alining 4 x 10'
Alining 0 torque,
-5 -4
1.0
slip ratio .5 "
I _
0 2 4 6 8 10 12 1
Time, sec
Figure A1 9.- Time his tor ies for run 1 9 . Nominal carriage speed, 66 knots; ver t ical load, 115.6 kN (26 000 l b f ) ; yaw angle, Oo; brake pressure, 13 MPa (1 950 psi) ; t i re condi t ion, new; surface condition, damp.
1 00
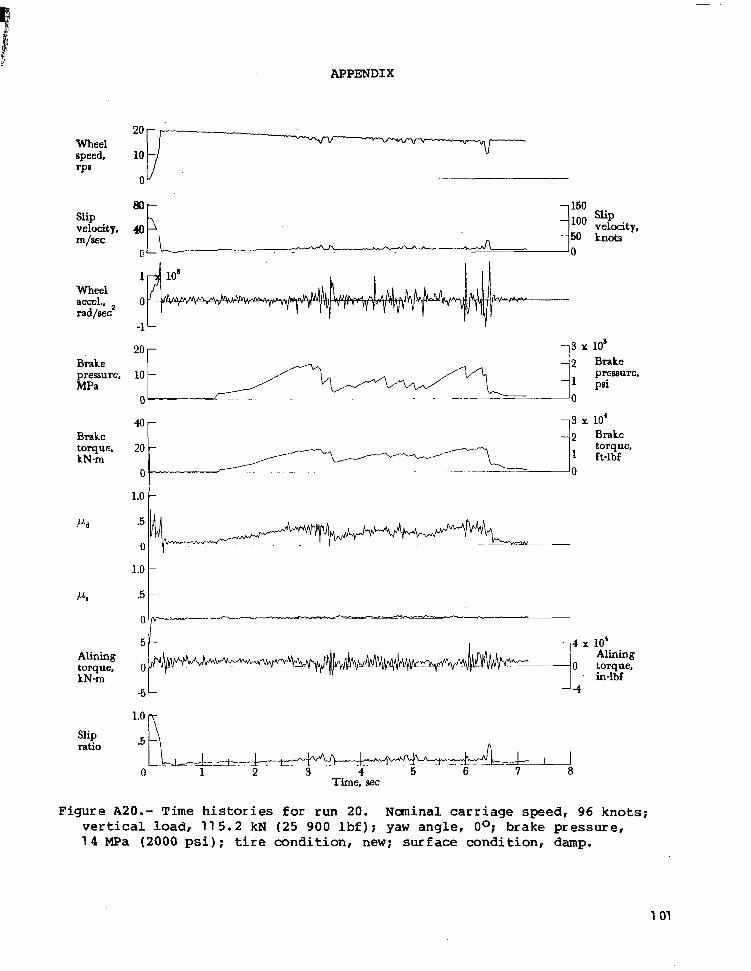
APPENDIX
Wheel speed, rP8
Slip velocity, lTl/WC
Wheel accel., rad/WC2
Brake pressure, MPa
Brake torque, kN -m
Pd
P.
Mining torque, kN-m
Slip ratio
20 r- 1 3 X 10'
40-
20
0
2 Brake
1 ft-lbf torque,
-. . "
1.0 1 *5 t 0"- -- " 5 4 x 10'
Alining 0 0 torque,
in-lbf -5 -4
.5 R L . L ! I
0 1 2 3 4 5 6 7 8 I
~~
Time, sec
Figure A20.- Time h i s t o r i e s f o r run 20. Naninal carriage speed, 96 knots; v e r t i c a l l o a d , 1 1 5 . 2 kN (25 900 l b f ) ; yaw angle, Oo; brake pressure, 1 4 MPa (2000 p s i ) ; t i r e c o n d i t i o n , new; surface condit ion, damp.
1 01
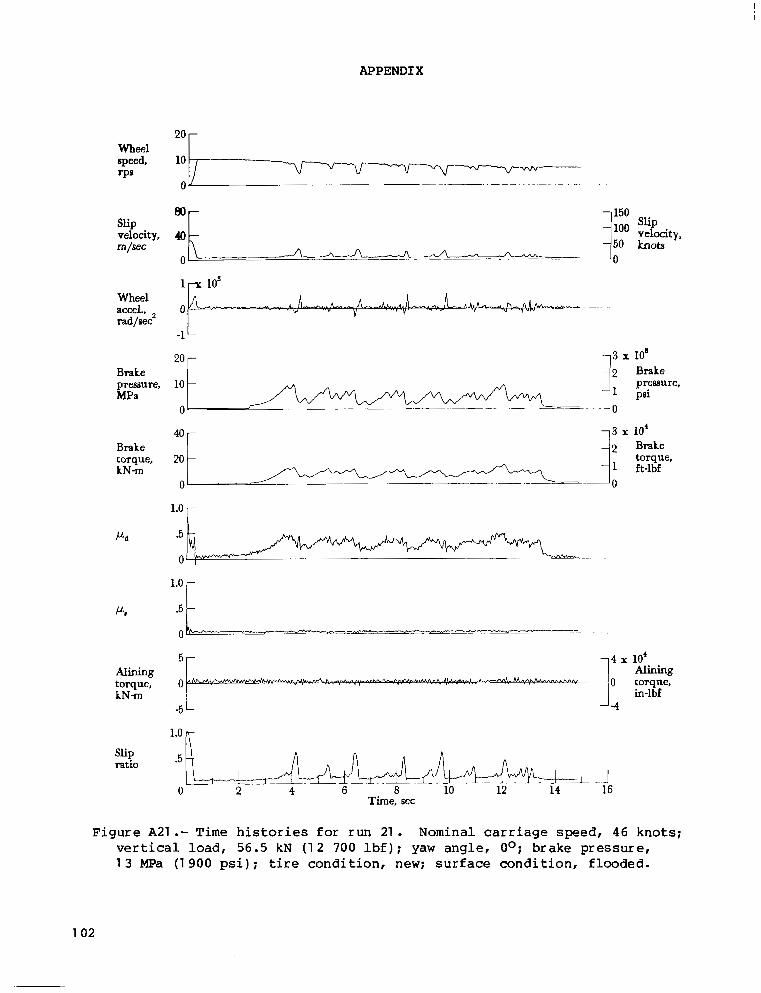
APPEND1 X
speed, 10 rP6
slip
rn/sec F velocity,
80-
velocity, 4 - rn/sec
slip
0 A
Wheel accel., 0 rad/aec
20 - 3 x lo8 Brake pressure, 10
1 psi MPa - lo 2 Brake
pressure,
0 .
40-
___ .~
Brake
kN-m - torque, torque, 20
2 Brake
0
1.0 r
-
5 4 x 10' Alining Alining
-5 -4
torque, 0 0 torque, kNm in-lbf
1.0
Slip rat10 .5
0 2 4 6 8 10 12 14 16 Time, aec
Figure A21 .- Time his tor ies for run 21. Nominal carriage speed, 46 knots; vertical load, 56.5 kN (1 2 700 l b f ) ; yaw angle, Oo; brake pressure, 1 3 Mpa (1 900 psi) ; t i re condi t ion, new; surface condition, flooded.
1 02

APPENDIX
Slip velocity, m/=
Wheel accel., rad/aec2
Brake
MPa pressure,
Brake torque, kNrn
PUa
Alining torque, kN-m
Slip ratio
Figure A22.- Time v e r t i c a l l o a d ,
1150
5 4 x 10' Alining
0 0 torque, in-lbf
-5 -4
.5 A 1;1
0 2 4 6 8 10 Time, sec
"
h i s t o r i e s f o r run 22. Naninal carriage speed, 72 knots; 5 6 . 5 kN ( 1 2 700 l b f 1; yaw angle, Oo; brake pressure, -
1 3 MPa (1900 p s i ) ; t i re condi t ion , new; surface condition, f looded.
1 03
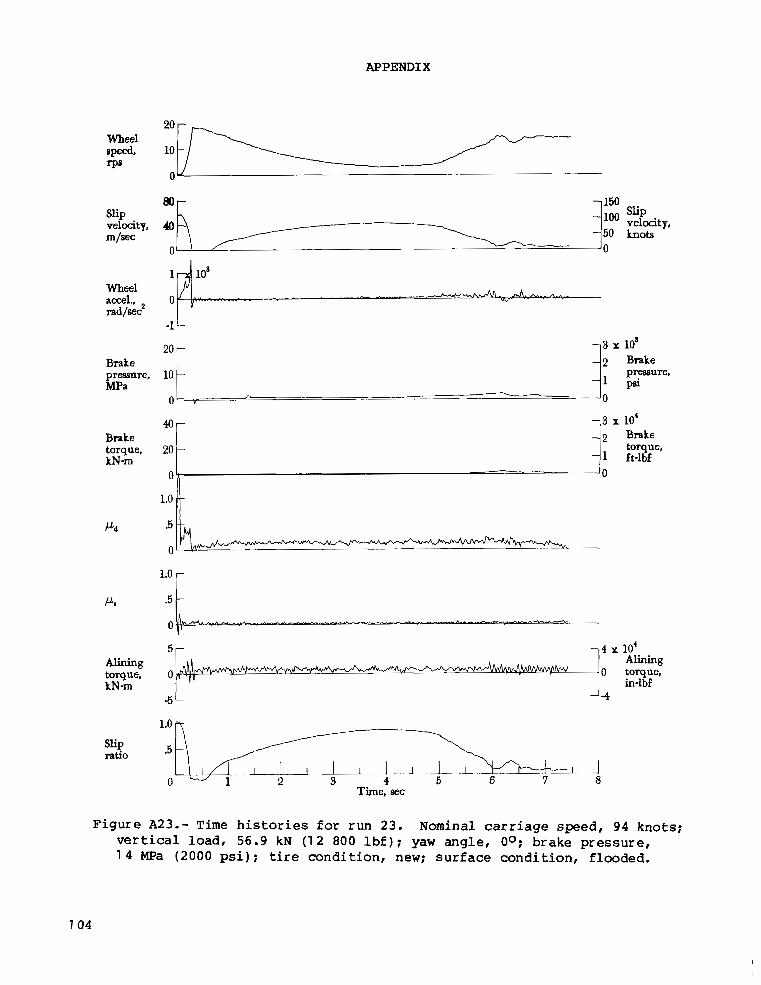
APPEND1 X
WhMl
r p e speed.
Slip velocity, m/=
Wheel accel., rad/sec2
Brake prmure, MPa
Brake torque, kNm
l l d
ll.
Alining torque, kNm
slip ratio
"
-1 L
::["pn ~ j 3 x 10'
1 psi
2 Brake preaure,
0 0
2 Brake
1 ft-lbf torque,
1.0 1
r *5 t 0 c "
5- "-4 x 10'
0
5- "4
Alining - 0 torque,
in-lbf
1.0 rT
Figure A23.- Time h i s t o r i e s for run 23 . Nominal carriage speed, 94 knots; v e r t i c a l load, 5 6 . 9 kN ( 7 2 800 l b f ) ; yaw angle, Oo; brake pressure, 1 4 MPa (2000 p s i ) ; t i r e c o n d i t i o n , new; surface condition, f looded.
7 04
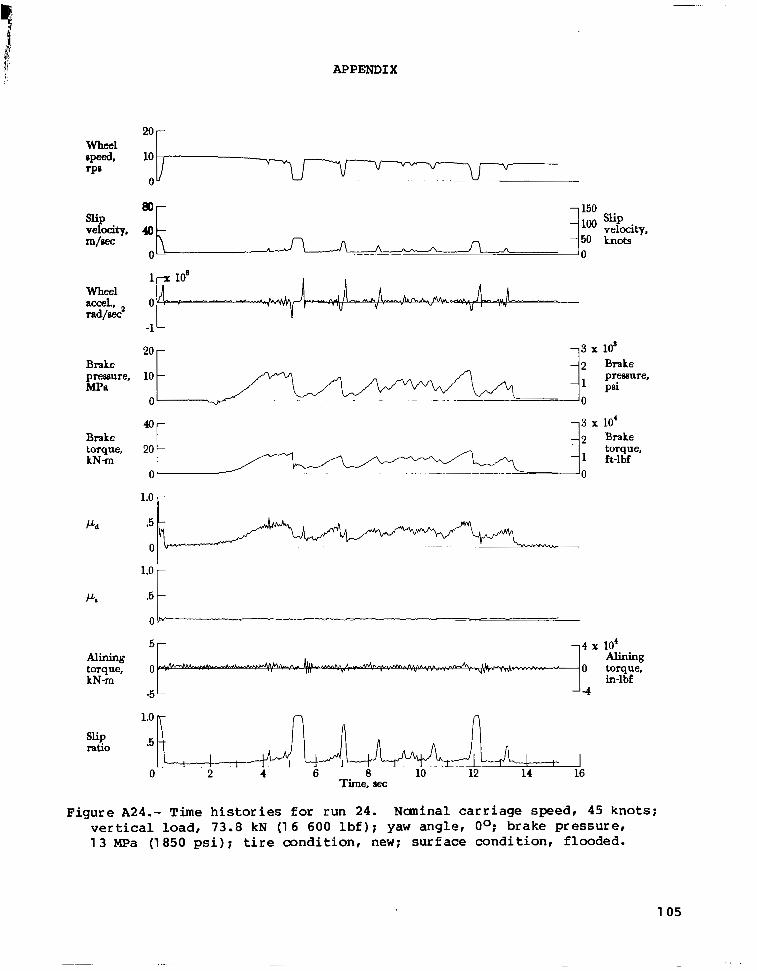
APPENDIX
Wheel Speed, rp'
Slip velocity, m/=
Wheel accel., rad/aec2
Brake pressure, MPa
Brake torque, k N m
Pd
P.
Alining torque, k N m
slip ratio
2o r 10
0 v V V
" .
M r 1 3 x 10'
1.0 r
r .5 t 5 4 x 10'
0
-5 -4
Alining 0 torque,
in-lbf
1.0 I7 n n
*5b 0 2 4 6 8 10 . ~~ 1 12 L 14 16
Time, sec
Figure A24.- Time histories for run 24. Naninal carriage speed, 45 knots; vertical load, 73.8 kN (1 6 600 lbf); yaw angle, Oo; brake pressure, 1 3 MPa (1 850 ps i ) ; t i re condi t ion , new; surface condition, flooded.
1 05

APPEND1 X
Wheel accel., 0 rad/sec2
-1
20 - -3 x lo8 Brake
kN-m
Brake torque, :----^??;: x Z k e
pei 1 1
MPa - pressure, 10
- 2 Brake pressure,
0 0
torque, 1 ft-lbf
0 0
1.0 r
5 - - 4 x 10' Alining
in-lbf kNm o torque, J- torque, o Alining
5- "4
1.0
slip ratio .5 --
l I I / - J 0 2 4 6 a 10
Time, e-ec
slip .L ratio
0 2 4 6 a 10 Time, e-ec
F i g u r e A25.- Time h i s t o r i e s f o r r u n 2 5 . Nominal c a r r i a g e speed, 69 knots ; ver t ical l o a d , 71 .6 kN (16 100 l b f ) ; yaw a n g l e , Oo; brake pressure, 1 3 MPa (1 900 ps i ) ; t i r e c o n d i t i o n , new; s u r f a c e c o n d i t i o n , f l o o d e d .
1 06

APPENDIX
Wheel opeed. rPa
Slip velocity, m/=
Wheel accel., rad/sec2
Brake preseure, MPa
Brake torque, kN-m
P d
PCL,
Alining torque, kN-m
Slip ati0
0
I
-1 L
20
?, 3 x lo8 2 Brake
1 psi preasure.
- .
3 x 10‘ 2 Brake
1 ft-lbf torque,
0 4 - -0
1.0 f .5
0
1.0
*51 OL--”” “
5 r 7 4 x 10‘
0 Alining
0 torque. in-lbf
-5 L J-4
I 4 5 6 7 8
Time, aec
Figure A26.- Time h i s t o r i e s for run 26. Naninal carriage speed, 96 knots; v e r t i c a l l o a d , 70.7 kN (15 900 l b f ) ; yaw angle, Oo; brake pressure, 1 3 MPa ( 1 900 p s i ) ; t i r e c o n d i t i o n , new; surface condit ion, f looded.
107
- ”

APPENDIX
Wheel accel., rad/sec'
20 I" Brake pressure, 10 MPa
0
-
Brake "r torque, 20 - kNm ]i A-lbf
torque,
0- .
Pa .5 -
0 ' ..
P. .5 i 5- 4 x 10'
Alining 11 torque, torque, 0
Alining
in-lbf kNm -5 -
1.0
.5 Slip ratio
I I
0 2 4 6 a 10 12 14 16 Time, 8ec
1 08
F igure A27.- Time h i s t o r i e s f o r r u n 27 . Nominal carriage speed, 45 knots; v e r t i c a l l o a d , 8 9 . 4 kN (20 100 l b f ) ; yaw a n g l e , Oo; brake pressure, 1 3 MPa (1 900 p s i ) ; t i r e c o n d i t i o n , new; s u r f a c e c o n d i t i o n , f l o o d e d .

APPENDIX
WhHl
rp' ppeed,
slip ml= velocity,
Wheel accel., rad/=*
Bmke preseure. MPa
Brake torque, kNm
Pd
P.
Mining torque, kNm
slip ratio
* O F _ _ _ _ - " - 10
1.0 -
r .5 t 5 4 x 10'
Alining 0 0 torque.
5 4 in-lbf
.5 A 0 1: I
2 4 6 8 10 12 " . .
Time, eec
Figure A28.- Time h i s t o r i e s f o r run 28. Naninal carriage speed, 66 knots; v e r t i c a l l o a d , 84.5 kN (1 9 000 l b f ) ; yaw angle, Oo; brake pressure, 1 3 MPa (1900 p s i ) ; t i r e condit ion, new; surface condit ion, f looded.
1 09
9 ~
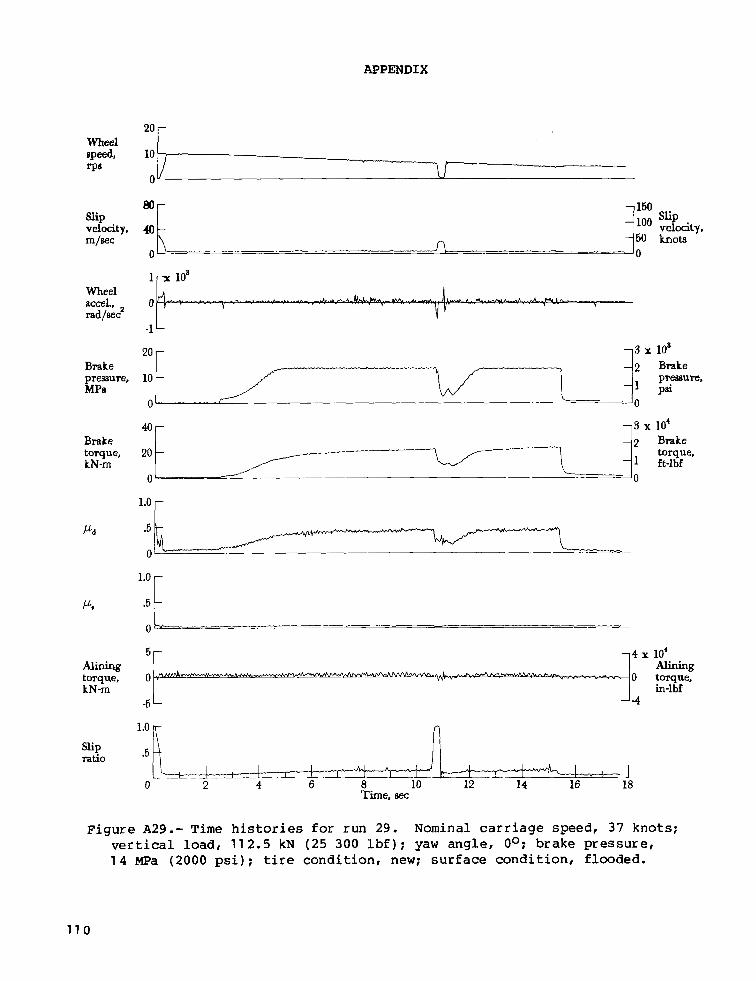
APPENDIX
Wheel
rP8 speed
Slip velocity, m/sec
Wheel accel., rad/Bec2
Brake pressure, MPa
Brake torque, kN-rn
P d
K
Alining torque, kN-m
Slip rat10
*O r
Slip
h o t s velocity.
20 - 3 x lo8 2 Brake
1 psi 1 do 10
0
- prwure,
4Qr 1 3 x 10'
20
0 '
- 2 Brake
1 ft-lbf torque, 2o t 2 Brake
1 ft-lbf torque,
lm0 r
l a o r
5 4 x 10' Alining
0 0 torque,
-5 -4 in-lbf
1.0 r
.5 I I I 1 -
O 2 4 6 8 10 12 14 16 18 Time, sec
Figure A29.- Time h i s t o r i e s for run 29. Nominal carriage speed, 3 7 k n o t s ; v e r t i c a l l o a d , 1 1 2.5 kN (25 300 l b f ) ; yaw angle, Oo: brake pressure, 1 4 m a (2000 p s i ) ; t i re condi t ion , new: surface condit ion, f looded.
110
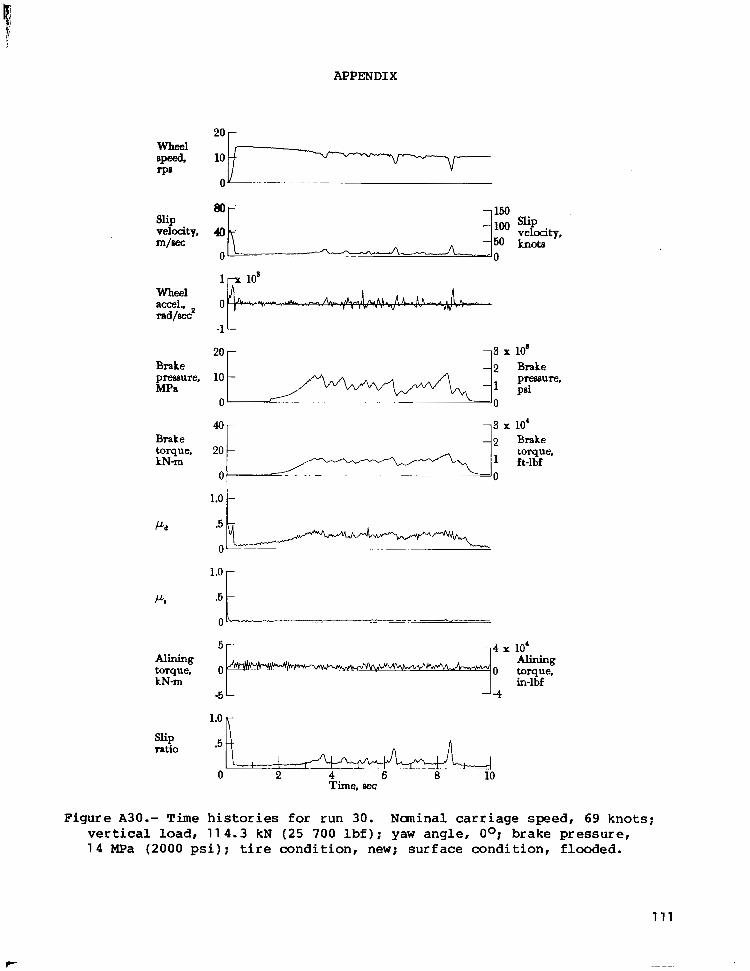
APPENDIX
2o r
Slip
m/= velocity,
Wheel accel., rad/eec2
Brake pressure, MPa
10
2 Brake preesure,
Brake torque, k N m ft-lbf
1.0
P,
Mining torque, k N m
slip ratio
.5 L 5 r -4 x 10'
ALining 0 o torque, 1
in-lbf -5 - "4
.5 I
0 2 4 6 8 10 Time, ~ e c
Figure A30.- Time h i s t o r i e s f o r run 30. Naninal carriage speed, 69 knots; v e r t i c a l l o a d , 1 1 4 .3 kN (25 700 l b f ) ; yaw angle, Oo; brake pressure, 1 4 MPa ( 2 0 0 0 p s i ) ; t i r e c o n d i t i o n , new; surface condit ion, f looded.
1 1 1

APPENDIX
slip velocity, m/aec
Wheel accel., rad/sec2
-1 -
0-
2 Brake torque, k N m
torque, 1 ft-lbf
5 r 1-1 X 10' Alining Alining torque, 0 0 torque, k N m in-lbf
Time, aec
Figure A31.- Time h i s t o r i e s f o r run 31. Nominal carriage speed, 98 knots; ver t i ca l l oad , 11 2.1 kN ( 2 5 200 l b f ) ; yaw angle, Oo; brake pressure, 1 4 Mpa (2000 p s i ) ; t i r e c o n d i t i o n , new; surface condition, f looded.
1 1 2
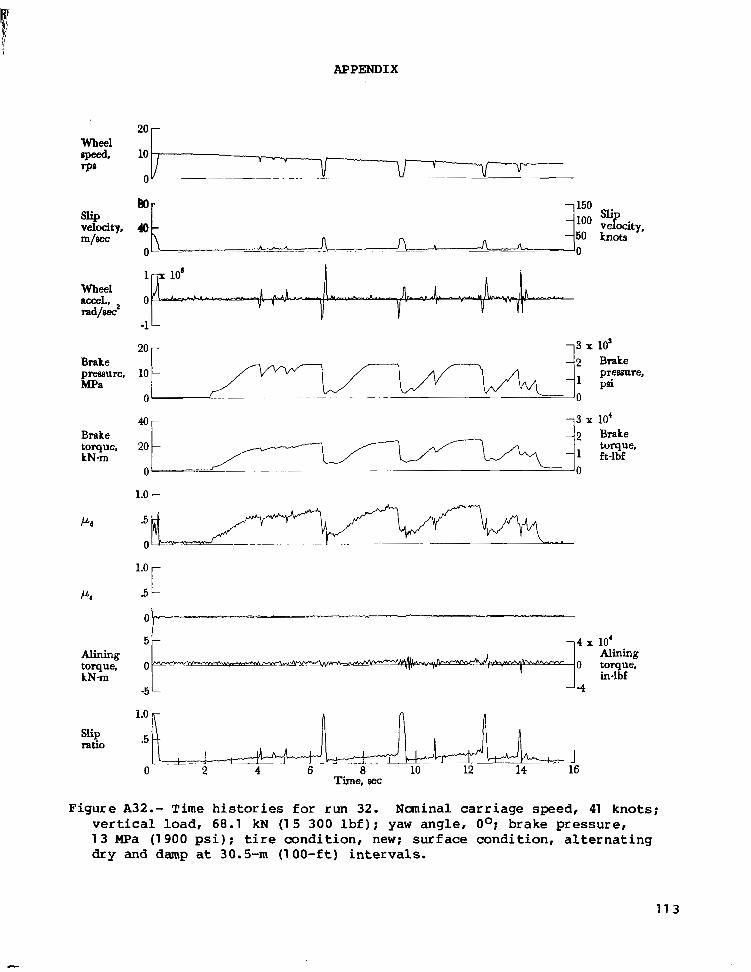
APPENDIX
Wheel speed. rps
Slip velocity, m/=
Wheel accel., r a d / e 2
Brake preseure, MPa
Brake torque, LN-m
Pd
w
ALining torque, kN-m
Slip ratio
20 -
10
0
-
:o
3 x lo8 2 Brake
1 psi preseure,
~ " -~ ~
20 -
0
2 Brake
1 ft-lbf torque,
~ .
1.0 r
1.0
-5 F 4 x 10'
Alining 0 torque,
-4 in-lbf
Figure A32.- Time h i s t o r i e s f o r run 32. Naninal carriage speed, 41 knots; v e r t i c a l l o a d , 68.1 kN (1 5 300 l b f ) : yaw angle, Oo; brake pressure, 1 3 MPa (1 900 p s i ) ; t i r e c o n d i t i o n , new: surface condit ion, a l ternat ing dry and damp a t 30.5-m (1 00 - f t ) in terva l s .
113

,. . ..... . . - .... , . - . . . .
Wheel speed, rPS
Slip velocity, rn/sec
Wheel accel., rad/sec
Brake pressure, MPa
...... .. . . . . .. ._ " ..
APPENDIX
-1
20 r
10 c pressure,
Brake "r torque, 20 kN-rn
- torque, ft-lbf -
0 0
1.0
P. .5 -
0- -
5 r
-5 ' 1-4
1.0
Figure A 3 3 . - Time his tor ies for run 33. Ncminal carriage speed, 65 knots; vertical load, 67.6 kN (1 5 200 l b f ) ; yaw angle, Oo; brake pressure, 1 3 MJ?a (1 950 p s i ) ; t i r e condition, new; surface condition, alternating dry and damp a t 30.5-m ( 1 0 0 - f t ) intervals.
1 1 4
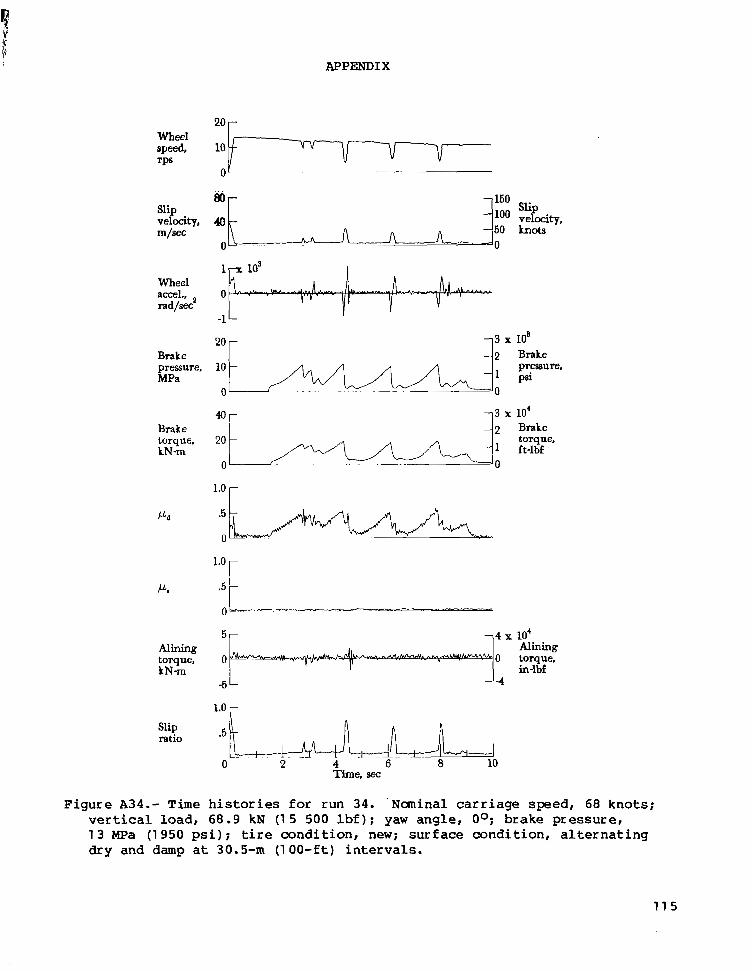
APPEND1 X
Wheel speed, rPS
*O r 10 v
Slip velocity, rn/sec
Wheel accel., rad/sec
Brake pressure, MPa
Brake torque. kN-n
P.
Alining torque, LN -rn
Slip ratio
Figure A34.- Time v e r t i c a l l o a d ,
20 -
0 -
-2
r
.5 t
slip velocity, knots
lon Brake pr.wure, PSI
10' Brake torque, ft-lbf
Alining 0 0 torque,
in-lbf J-4
1.0 r
.5
0 2 4 6 8 10 Time, sec
I "
h i s t o r i e s for run 34. Naninal carriage speed, 68 knots; 68.9 kN (1 5 500 l b f ) : yaw angle, Oo; brake pressure,
1 3 MPa (1 950 p s i ) : t i r e c o n d i t i o n , new; surface condit ion, a l ternat ing dry and damp at 30.5-m (100- f t ) in terva l s .
1 1 5

APPEND1 X
Wheel speed. rPS
Slip velocity, m/sec
Wheel
rad/= accel.,
Brake pressure, MPa
Brake torque, kNm
Pd
K
Alining torque, kNm
slip ratio
"
I,+ 10'
0
-1
20 -
<o
i,
3 x los 2 Brake
1 psi 10 - pressure,
0-
40- s x 10' 2 Brake e ft-lbf
20 " torque,
0
r
l.o .5 r - 5 4 x 10'
0 0 torque,
-5 -4
Alining
in-lbf
1.0 r
Time, sec
Figure A35.- Time h i s t o r i e s f o r run 35. Nanina l carr iage sped , 97 knots; v e r t i c a l l o a d , 6 9 . 8 kN ( 1 5 700 l b f ) ; yaw angle, Oo; brake pressure, 13 MPa (1 950 p s i ) ; t i r e c o n d i t i o n , new; surface condit ion, alternating dry and damp a t 30.5-m (100- f t ) in terva l s .
116

APPENDIX
Wheel
rPs SPced.
Slip velocity, m/sec
wheel accel.. rad/sec2
Brake pressure, MPa
Brake torque, kN-m
P d
P.
Alining torque, kN-m
Slip ratio
- 150 slip - '00 velocity, -50 knots A A c 0
-1
20 -3 x lo8
. . .
-3 x 10' - 2
0 2 . . . " - 0 ft-lbf torque, - 20 Brake
1.0 r I
1.0
.5
0
5
0
-5
r
L
- 4 x 10'
5??--+-??" Alirling +"- o torque, in-lbf
"4
Figure A36.- Time histories for run 36. Naninal carriage speed, 41 knots; v e r t i c a l l o a d , 6 9 . 3 kN ( 1 5 6 0 0 l b f ) ; yaw ang le , Oo; brake pressure, 1 3 MPa ( 1 9 5 0 p s i ) ; t i r e c o n d i t i o n , new; sur face condi t ion , dry / f looded .
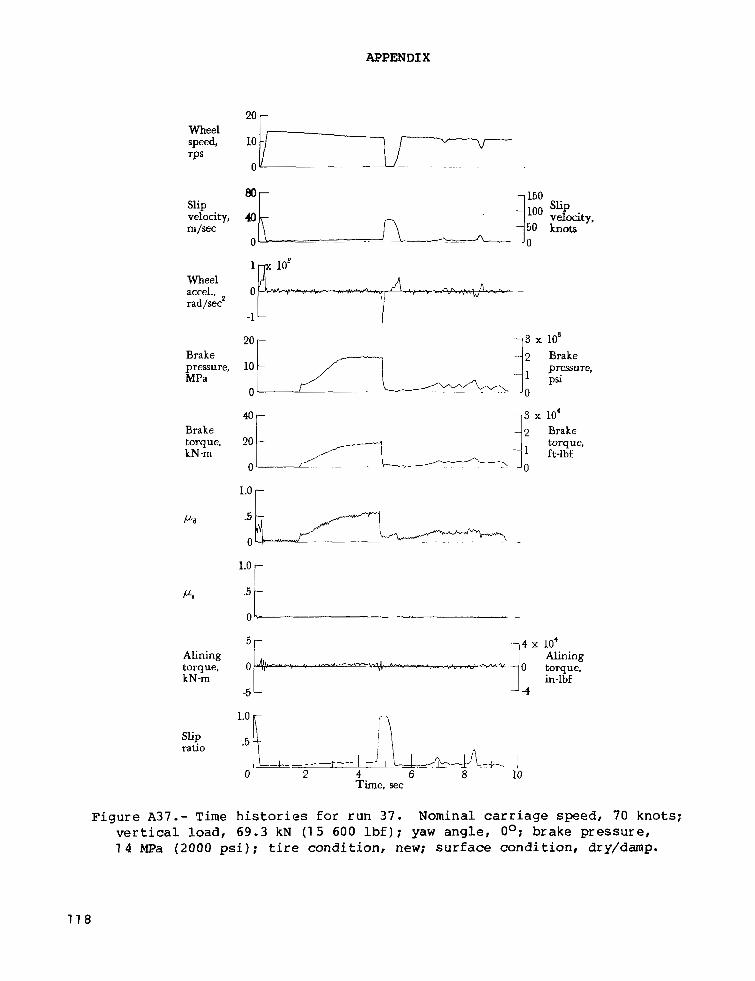
APPENDIX
2o r Wheel speed, rPS
slip velocity, m/sec
Wheel
rad/secz accel.,
Brake pressure, MPa
slip ratio
0 2 4 ti a 10 Time, sec
Figure A37.- Time his tor ies for run 37. Nominal carriage speed, 70 knots; vertical load, 69.3 kN (1 5 600 l b f ) ; yaw angle, Oo; brake pressure, 1 4 MPa (2000 ps i ) ; t ire condition, new; surface condition, dry/damp.
1 1 8

APPENDIX
Slip velocity, rn/sec
Wheel accel., rad/scc2
Brake pressure, MPa
Brake torque, kN -rn
Alining torque, kN-rn
Slip ratio
-1 L 20 - -3 x 10'
- 2
-1 psi
Brake 10 - pressure,
0 0
@r 1 3 x 10'
i, 2 Brake
ft-lbf torque,
._.________
1.0
.5 I' 5 4 x 10'
0 0 torque,
-5 4
Alining
in-lbf
1.0 r "
Figure A38.- Time h i s t o r i e s f o r run 38. Nominal carriage speed, 97 knots; ver t i ca l l oad , 68 .5 kN (1 5 400 l b f ) ; yaw angle, Oo; brake pressure, 1 3 MPa (1 950 p s i ) ; t i r e c o n d i t i o n , new; surface condition, dry/flooded.
1 1 9
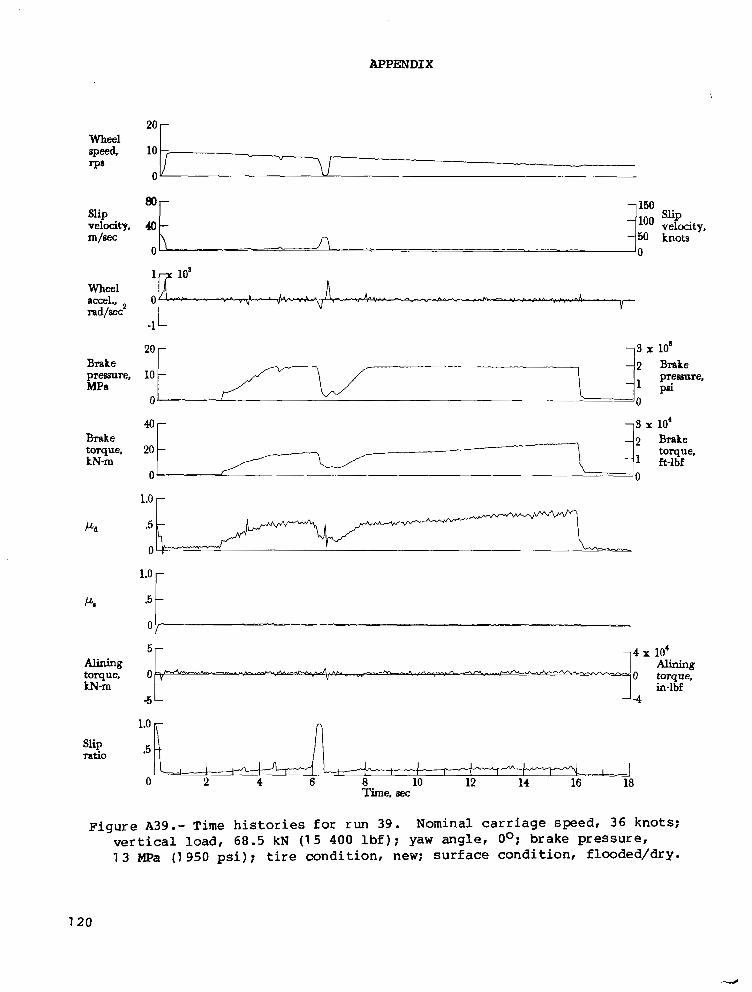
APPENDIX
Slip velocity, m/=
Brake pressure, MPa
Brake torque, kN-m
Alining
k N m torque,
Slip ratio
lrx lo8
0
20 - -3 x lo8
Y "
-1 L
10
0
- V 1% y preeeure.
1.0 -
.5 -
o/----"
5 4 x 10'
0
-5 4
Alining 0 torque,
in-lbf
*5 tt I \ I ! I I I, - . - 0 2 4 6 8 10 12 14 16 18
Time, EC
Figure A39.- Time histories for run 39. Nominal carriage speed, 36 knots; vertical load, 68.5 kN (1 5 400 l b f ) ; yaw angle, Oo; brake pressure, 13 ME% (1 950 psi); t ire condition, new; surface condition, flooded/dry.
7 20

APPEND1 X
Wheel speed, r p n
slip velocity, m/=
Wheel rccel., fad/='
Brake preseum. MPa
Brake torque, k N m
P d
K
Alining torque, k N m
Slip fati0
20
10 -
20 -
10 -
0
40-
20 -
0
1.0 r
dLo s x loB 2 Brake
1 psi prwure,
-
2 Brake
1 ft-lbf torque,
1.0 -
5 -
O k -'-~--"
5 4 x 10' Alining
0 0 torque,
-5 -4
_. .. .
in-lbf
1.0
Time, ~ e c
Figure A40.- Time h i s t o r i e s f o r run 40. Naninal carriage speed, 67 knots; v e r t i c a l l o a d , 68.1 kN (15 300 l b f ) ; yaw angle, Oo; brake pressure, 1 3 MPa (1 950 p s i ) : t i re condi t ion , new; surface condition, f looded/dry.

APPEND1 X
- 150
-50 knots I -- 0
Wheel accel., rad/sec
pressure, Brake ;:L 4j,x> MPa
pressure,
0
Aji x z k c torque,
kN-m ft-lbf 0 0
r
0
5 4 x 10' Alining Alining torque, 0 0 torque, kN m in-lbf
-5 -4
1.0 r i
0 -- 1
Figure A41 .- Time histories for run 41 . Nominal carriage speed, 98 knots; vertical load, 68.1 kN ( 1 5 300 l b f ) ; yaw angle, Oo; brake pressure, 1 3 MPa (1 850 psi) ; tire condition, new; surface condition, flooded/dry.
1 22

APPENDIX
Slip velocity, m/=
wheel accel., nd/eec*
Brake pressure, MPa
Brake torque, kN -m
*O r OF "
r
Alining
kN-m torque,
slip ratio
5- Alining
in-lbf 5- -4
.5 Fk
Time, aec
Figure A42.- Time h i s t o r i e s f o r run 42. Naninal carriage speed, 36 knots; v e r t i c a l l o a d , 68.1 kN (1 5 300 l b f ) ; yaw angle, l o ; brake pressure, 1 3 MPa (1900 p s i ) ; t i r e c o n d i t i o n , new; surface condition, dry.
1 23

APPENDIX
Figure A
Wheel speed, rP8
slip velocity, rn/eec
Wheel accel., rad/aec2
Brake pressure, MPa
Brake torque, LN-rn
Pd
PI
Alining torque, kN-rn
Slip ratio
43.- Time vertical load,
2od 10
20 - -3 x lo8
-1
3 x 10'
psi 10 -
- 2 Brake presaure,
,,,-,-"d 0 0
2 Brake
1 ft-lbf torque,
0 0
5- -4 x 10' Alining
0 o torque, -~w in-lbf
.5 A I ! ! I I I I
0 2 4 6 8 10 Time, sec
" ~
histories for run 43. Nominal carriage speed, 68 knots; 69.3 kN ( 1 5 600 l b f ) ; yaw angle, lo; brake pressure,
1 24

APPENDIX
Slip velocity, m/=
Wheel accel., nd/sec2
Brake pressure, MPa
0- - ”_ 10
20 r 1 3 x lo8
40- Brake torque, 20 -
2 Brake
kN-m Et-lbf torque,
0
1.0 r -
H
5 - - 4 x 10‘ Alining
0 torque, in-lbf kN-m
-5 - -4
1.0
slip ratio .5 -
a ! I I L i I I I + ” - I 0 1 2 3 4 5 6 7
Time, sec
~ -
Figure A44.- Time h i s t o r i e s f o r run 44. Naninal carriage speed, 99 knots; v e r t i c a l l o a d , 7 0 . 3 kN (1 5 800 l b f ) : yaw angle, 1 O: brake pressure, 1 2 MPa (1 800 p s i ) : t i r e a n d i t i o n , new: surface condit ion, dry.
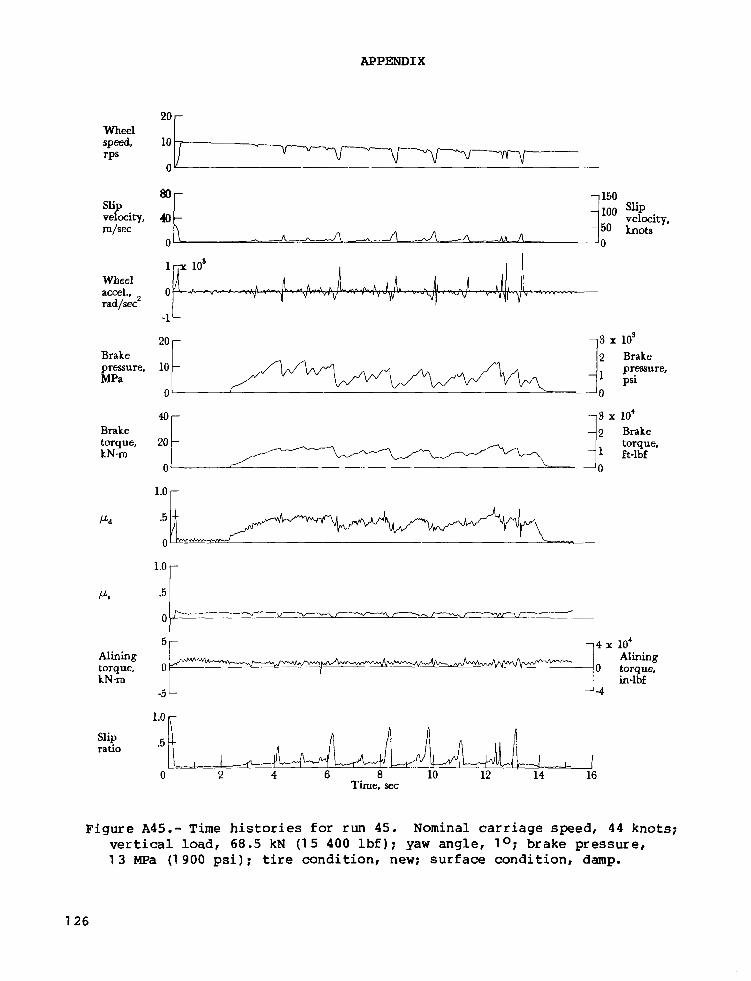
APPEND1 X
Wheel r speed, 10 - rPs V ” 1 / V”
0
Wheel accel., rad/sec2
-1
20 r Brake
MPa - pressure, 10
Brake - 2 pressure, -1 psi
0 0
4Or -+ x 10’ Brake torque, kN-m
Alining
kN-m torque,
Slip ra ti0
1.0 -
.5
0 J L -
5- -4 x 10‘
O w , - ” Alining
0 torque, - in-lbf
-5 - -4
1.0 rT
.5
0 2 4 6 8 10 12 14 16 Time, sec
Figure A45.- Time h i s t o r i e s f o r run 45. Nominal carriage speed, 44 knots; ver t i ca l l oad , 68 .5 kN (1 5 400 lbf 1 ; yaw angle, l o ; brake pressure, 1 3 MPa (1 900 p s i ) ; t i re condi t ion , new; surface condit ion, damp.
126

' I
APPENDIX
Wheel
=Ps speed,
Slip velocity, m/sec
Wheel
+ad/sec2 accel.,
Brake pressure, MPa
Brake torque, kNm
P d
P.
Alining torque, kNm
Slip -ti0
20 - -9 x 10' - 2
- 1
Brake
psi 10 pressure. -
0 0
2o t i1 ft-lbf torque,
1.0 r
0
Alining
.5 --
0 2 4 6 8 10 12 I
T h e , sec
127
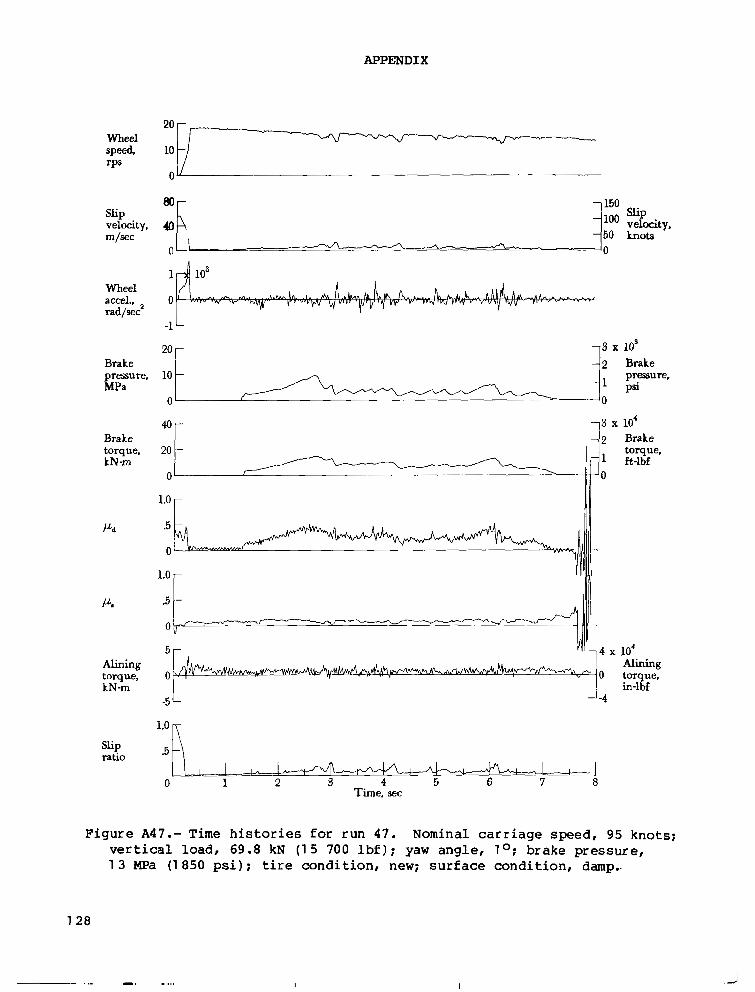
APPENDIX
Wheel speed. rPs
Slip velocity, m/sec
Wheel accel., rad/sec2
Brake pressure, MPa
Brake torque, kN-m
Pd
P.
Alining torque, kN-m
Slip ratio
zoLl "
10
~ 1; x :lke pressure,
0
40-
20 -
1 psi 0
-3 x 10' - 2 Brake
r1 ft-lbf torque,
0 0
1.0 -
4 x 10' Alining
0 torque,
-4 in-lbf
.5 R I * I I
0 1 2 3 4 5 6 7 8 Time. sec
Figure A47.- Time h i s t o r i e s for run 47. Nominal c a r r i a g e speed, 95 knots; v e r t i c a l load, 69.8 kN (1 5 700 l b f ) ; yaw angle , lo; brake pressure, 13 MPa (1 850 psi) : t i r e condi t ion , new; su r face cond i t ion , damp..
1 28
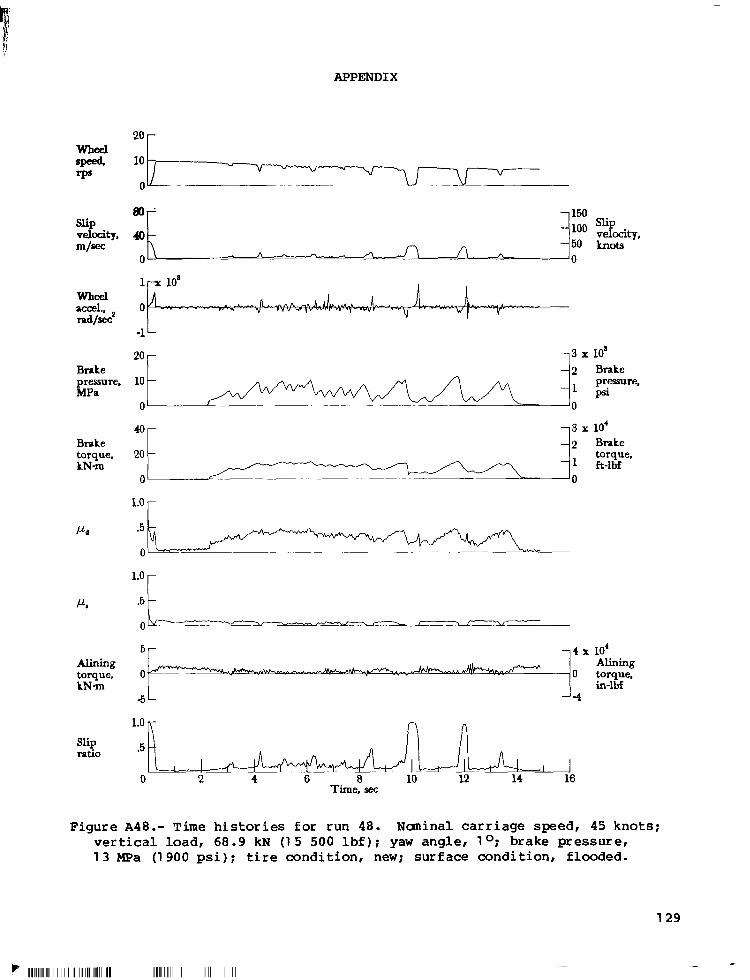
APPENDIX
wheel
rps speed,
slip velocity, m/=
wheel accel., md/sec2
Brake pressure, MPa
Brake torque, LN-m
Pa
P.
Alining torque, kN-m
Slip ratio
*O r
lr los
0
-1
1
-
-3 x 10'
1 psi
40- -3 x 10'
2 Brake pressure,
0 ~ _ _ _ _ ~ ~" ~~ 0
- 2 Brake 20 - - 1 ft-lbf
torque,
0 0
1.0 r
1.0 -
.5 -
5 4 x 10'
0 Alining
0 torque, in-lbf
-5 -4
Time. sec
Figure A48.- Time h i s tor ie s €or run 48. Naninal carriage speed, 45 knots; v e r t i c a l l o a d , 68.9 kN (1 5 500 l b f ) ; yaw angle, 1 O; brake pressure, 1 3 MPa (1 900 p s i ) ; t i r e c o n d i t i o n , new; surface condit ion, f looded.
lIlIlllll1l11l1lllIlll I I1 I lIll1lllllIIIll1ll111llllIIIl lIIIllllll11l11ll I I I I I I I I I 1
1 29
3 -
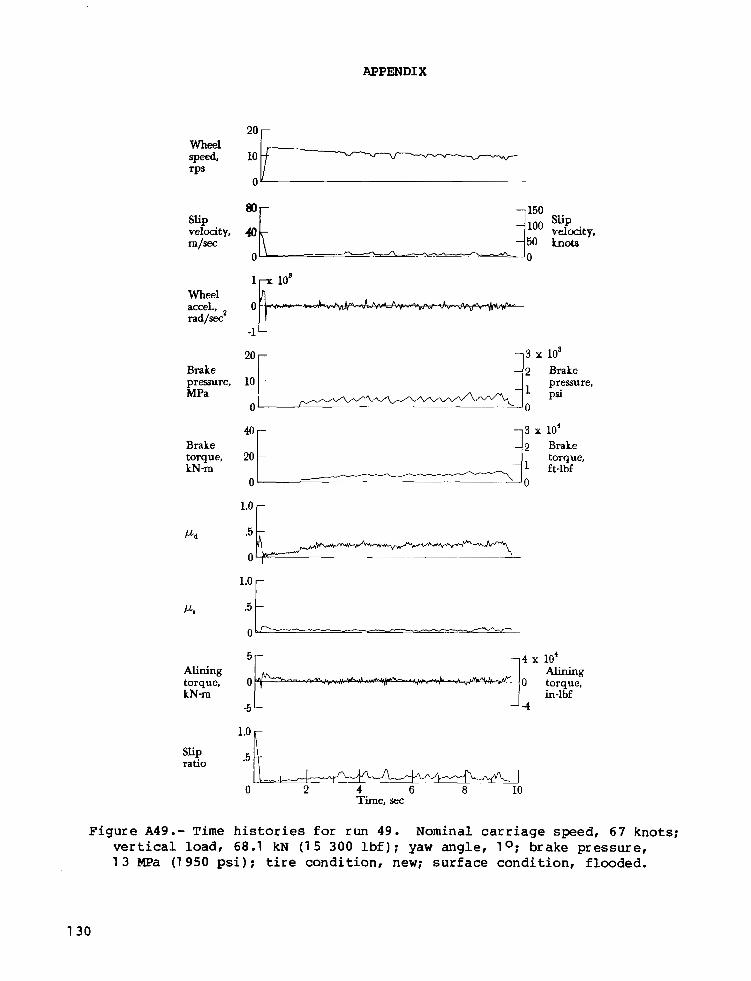
APPENDIX
Wheel
=PS speed,
slip
m/= velocity,
Wheel accel.. rad/='
Brake pressure, MPa
Brake
kN-m torque,
Pd
P.
Alining torque, kN-m
"
i 5 0 knots .
l::;
l::L - "~
0 ~ _ _ _ _ _
0
5 4 x 10'
0 Alining
0 torque, in-lbf
-5 -4
1.0
Figure A49.- Time h i s t o r i e s f o r run 49 . Nominal carriage speed, 67 knots; ver t i ca l l oad , 68 .1 kN ( 1 5 300 l b f ) ; yaw angle, lo; brake pressure , 1 3 MPa ( 1 950 p s i ) ; t i r e c o n d i t i o n , new; s u r f a c e c o n d i t i o n , f l o o d e d .
130

APPENDIX
slip velocity,
knots '0
accel., rad/sec2
-1
-8 x lo8 Brake - 2
psi MPa - 1 pressure, pressure, Brake
0
Brake torque, kN-m ft-lbf
__- , -
r
5 4 x 10' Alining Alining torque, 0 0 torque, kN-rn in-lbf
-5 -4
Figure A50.- Time h i s t o r i e s f o r run 50. Naninal carriage speed, 97 knots; ver t i ca l l oad , 6 6 . 2 kN (1 5 1 0 0 l b f ) ; yaw angle, 1 O; brake pressure, 1 3 MPa (1 950 p s i ) ; t i r e c o n d i t i o n , new; surface condit ion, f looded.
I b - - -
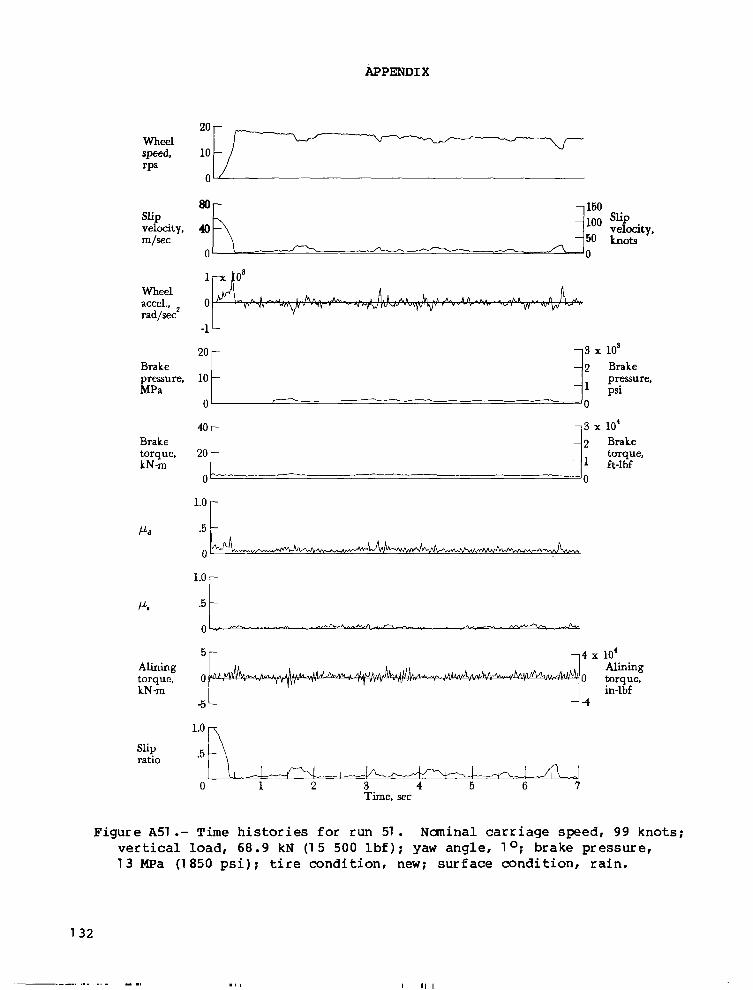
APPEND1 X
Wheel speed, rPs
Slip velocity, m/sec
Wheel accel., rad/sec2
Brake pressure, MPa
Brake torque, kN-m
P d
P.
Alining torque, kN -m
Slip ratio
Figure A51 .-
2 o l l 10 - - 20 4 0 ' -
20 T 14
x lo3 Brake pressure, psi
x 10' Brake torque, ft-lbf
5 r 1 4 x 10'
0 Alining
0 torque, in-lbf
l e o n .5t- \ 0 1 2 3 4 5 6 7
Time, sec
Time h i s t o r i e s f o r run 51. Ncminal carriage speed, 99 knots; ver t i ca l l oad , 68.9 kN (1 5 500 l b f ) ; yaw angle, lo; brake pressure, 1 3 MPa (1850 p s i ) ; t i r e c o n d i t i o n , new; surface condit ion, rain.
1 32
". .. . .. - ... I, I I I I

APPENDIX
WhEf?l *O r 0" u
Brake torque, 20 k N m
0
- 2 Brake
torque, 1 ft-lbf
" ~ ".
1.0 r-
.5 - .~ . " \f--"-
5- - 4 x 10' Alining
W I"" 0 torque, kN-rn in-lbf
"4
1.0 A Slip ratio .5 "
I I I .
0 = . 5- ' 4 ' 6 8 10 12 14 Time. ~ e c
Figure A52.- Time h i s t o r i e s f o r run 52. Nominal carriage speed, 47 knots; v e r t i c a l l o a d , 69.8 kN (1 5 700 l b f ) ; yaw angle, 3O; brake pressure, 1 3 MPa (1 950 p s i ) ; t i r e c o n d i t i o n , new: surface condit ion, dry.
1 33
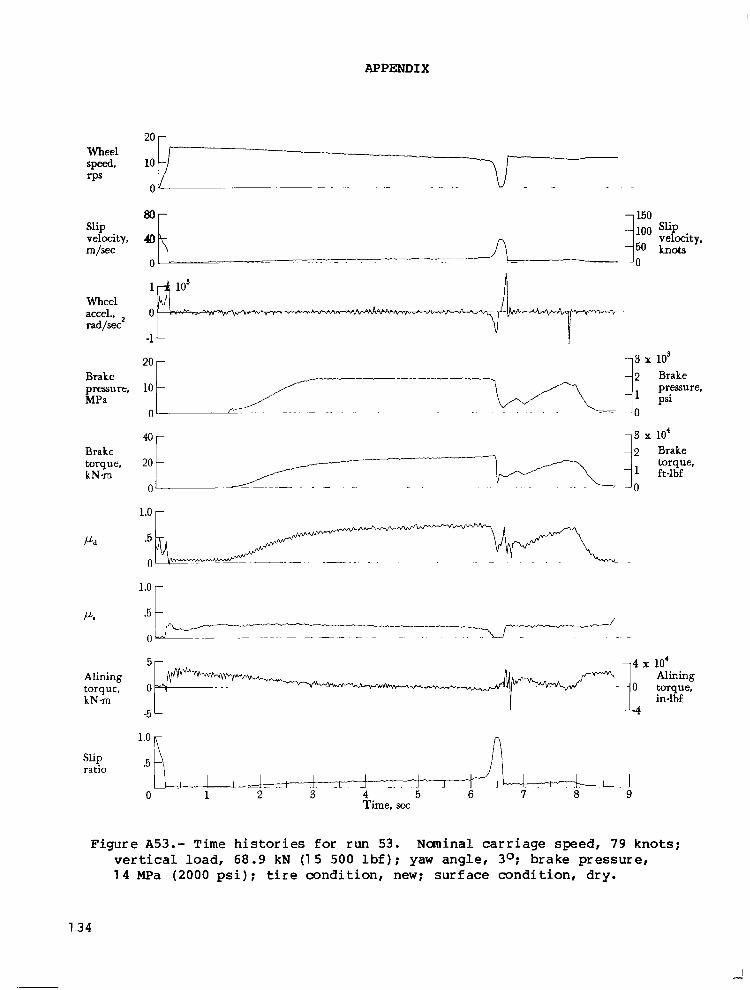
I
APPENDIX
80- Slip velocity, 41) m/sec
velocity,
0-
Wheel accel., rad/sec
20 Brake pressure, 10 MPa 1 psi
0
-
- 2 Brake
pressure,
. " " "
Brake torque, kN-m
Alining torque, kN-m
slip ratio
40-
20
0
-
Alining
in-lbf
Figure A53.- Time h i s t o r i e s f o r run 53. Nanina l ca r r i age speed, 79 knots; v e r t i c a l l o a d , 68.9 kN (1 5 500 l b f ) ; yaw angle , 3O; brake pressure, 1 4 MPa (2000 p s i ) ; t i r e condi t ion , new; sur face condi t ion , d ry .
134
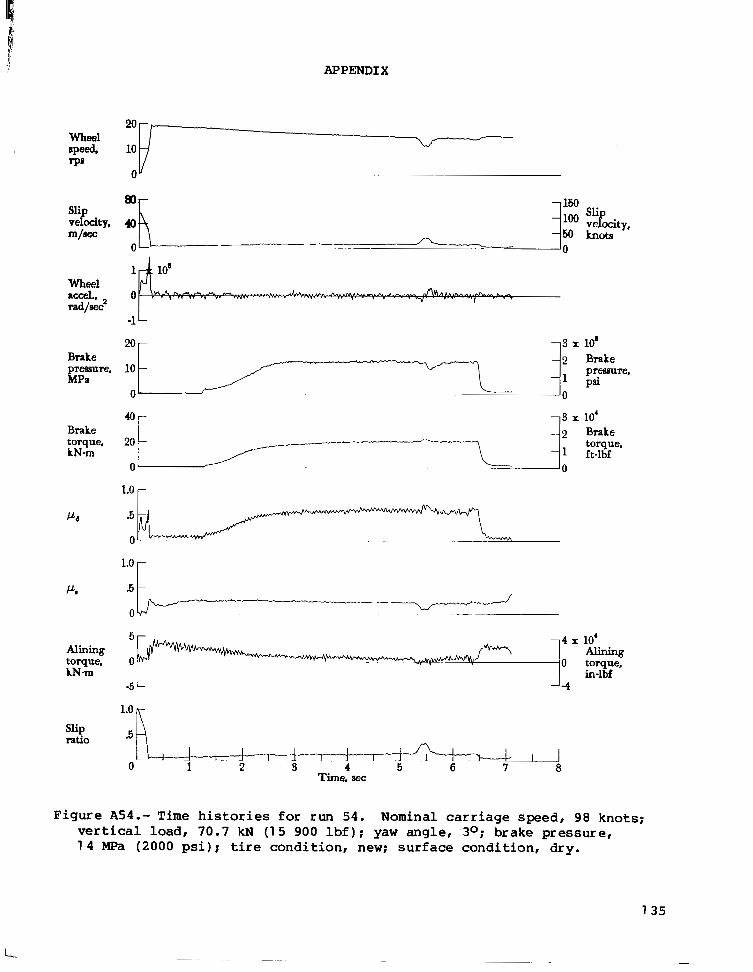
APPEND1 X
Wheel EPpeed, r p n
Slip velocity, m/=
Wheel accel., rad/='
Brake prmure, MPa
Brake torque, LNm
p d
P,
Mining torque, LN-rn
Slip ratio
-1 L 20 - 3 x lo8
10 -
0 j: 0 !?re,
40- 2 Brake
1 ft-lbf 20 - torque,
0
1.0 r . ~~~~
1.0 r I
-4 x 10' Alining
-0 torque, in-lbf
.5 R
Figure AS4.- Time h i s t o r i e s f o r run 54. Nominal carriage speed, 98 knots; v e r t i c a l l o a d , 70 .7 kN (15 900 l b f ) ; yaw angle, 3O; brake pressure, 1 4 MPa (2000 p s i ) ; t i r e c o n d i t i o n , new; surface condit ion, dry.
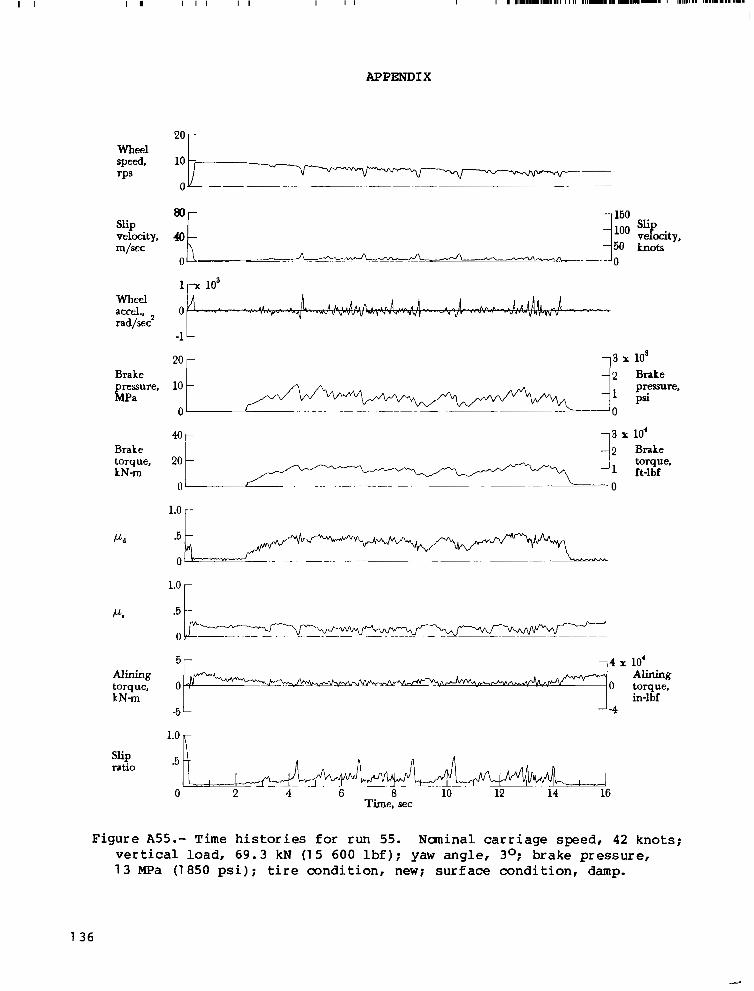
I 1 I I I I I I I I
APPENDIX
wheel accel., rad/sec2
20 - -3 x 10' Brake
- pressure. 10 Brake - 2
MPa 0
M r 1 3 x 10' Brake torque, 20 kNm
- - 2
-1 ft-lbf
Brake torque,
0 -0
r
1.0 -
H .5 -
5- -4 x 10' Alining Alining torque, 0 kN-m
0 torque, in-lbf
-5 L J-4
1.0
Slip ratio .5 --
I - 0 2 4 6 a 10 12 14 16
Time. sec
Figure A55.- Time h i s t o r i e s for run 55. Naninal carriage speed, 42 knots; v e r t i c a l l o a d , 6 9 . 3 kN (1 5 600 lbf); yaw ang le , 3O; brake pressure, 1 3 MPa (1850 psi); t i r e c o n d i t i o n , new; s u r f a c e c o n d i t i o n , damp.
1 36
APPEND1 X
slip velocity, m/sec
Wheel accel.. rad/sec2
Brake pressure, MPa
Brake torque, kN-m
P.
Alining torque, kNm
Slip ratio
Figure A56.- Time v e r t i c a l l o a d ,
' O I 10 0 v "
20 r -3 x 10' - 2 Brake
10 pressure. - psi
0 . ~~ ___ .O
"r 1; x ?rake
2o t 4 1 ft-lbf torque,
r
.5 c 5 - - 4 x 10'
Alining 0 7 - - ." 0 torque,
in-lbf -5- "4
.5 A I! !I
0 2 4 6 8 10 ~~-
Time, sec
h i s t o r i e s f o r r u n 56 . Nominal carriage speed, 67 knots: 70 .3 kN (1 5 800 lbf); yaw angle, 3O; brake pressure,
1 3 MPa (1 850 ps i ) : t i r e c o n d i t i o n , new; s u r f a c e c o n d i t i o n , damp.
APPENDIX
Wheel speed, rPs
Slip velocity, m/sec
Wheel accel., rad@
Brake pressure, MPa
Brake torque, kN-m
Pd
P.
Alining torque, kNm
Slip ratio
20 -
10 -
0
40-
20 -
0 . . ". .
1.0 1
.5 [I
Slip 100 velocity. 50 knots
'0
2 Brake
1 ft-lbf torque,
J 8
Figure A57.- Time h i s t o r i e s f o r run 57. Naninal carr iage sped, 96 knots; vert ica l load, 69.8 kN (1 5 700 l b f ) ; yaw angle, 3O; brake pressure, 1 3 MPa (1 850 p s i ) ; t i r e c o n d i t i o n , new; surface condit ion, damp.
1 38
APPENDIX
Wheel speed, rP8
Slip velocity, m / m
Wheel accel., rad/sec2
Brake presaure, MPs
Brake torque, k N m
p d
K
Alining torque, kN-m
Slip ratio
40- - 50 - 100
0". . . A A -0
1.0 r
1.0 - .5 -
- 4 x
0
slip velocity, h O t 8
lo8 Brake presaure, Psi
10' Brake torque, 8- lbf
10' Alining torque, in-lbf
Figure A58.- Time h i s t o r i e s f o r run 5 8 . Nominal carriage speed, 4 5 knots; ver t i ca l l oad , 69 .3 kN ( 1 5 600 l b f ) ; yaw angle, 3O; brake pressure, 1 3 Mpa (1 950 p s i ) ; t i r e c o n d i t i o n , new; surface condit ion, f looded.
1 39
APPEND1 X
Wheel speed, rPB
Slip velocity, m/sec
Wheel accel., rad/sec2
Brake preesure, MPa
Brake torque, k N m
Pd
K
Alining torque, kN-m
Slip rat10
2o r 10 "-.
:LF j; b o t s
10
- 1 ]: ! p r e ,
150 slip loo velocity,
0 m
20 - 3 x los
0 0
"r I: x !lke 4; ft-lbf torque,
1.0 - .5
0 1% 1.0 r
I
.5 I- O
.5 I -
0 2 4 6 8 10 12 14 16 Time, sec
Figure A59.- Time h i s t o r i e s for run 59. Nan ina l ca r r i age speed, 45 knots; v e r t i c a l l o a d , 69.8 kN (1 5 700 l b f ) ; yaw angle , 3O: brake pressure, 1 3 MPa (1 950 ps i ) : t i r e cond i t ion , new; sur face condi t ion , f looded .
1 40
. I
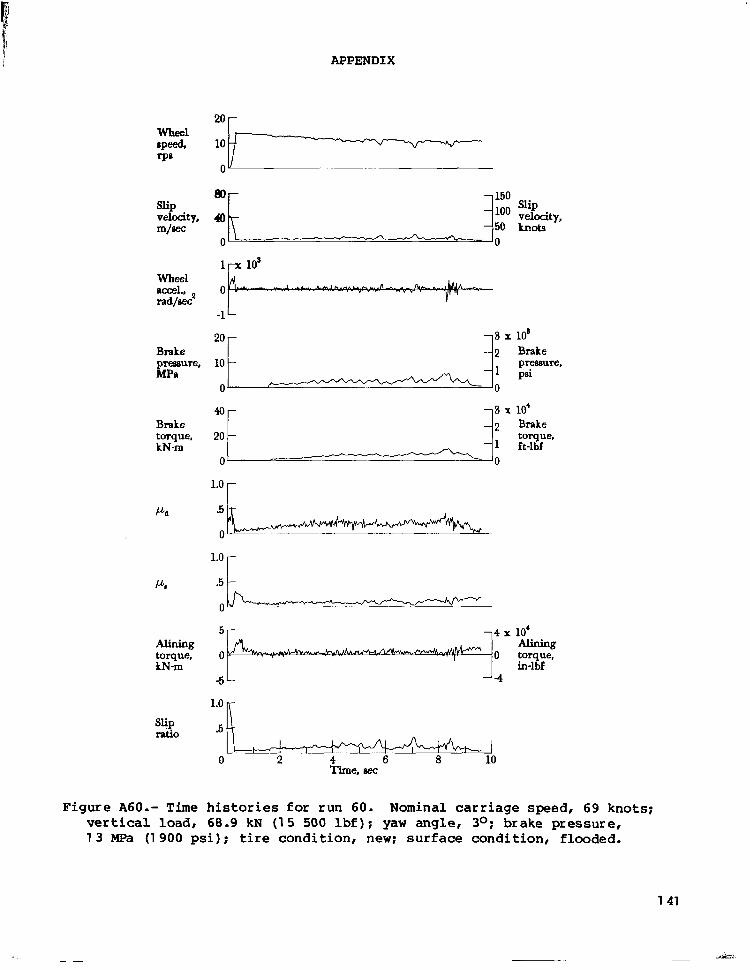
APPENDIX
Wheel
rps speed.
slip m/= velocity,
Wheel accel., radjaec'
Brake preeeure, MPa
Brake torque, LN-m
Pd
P.
Alining torque, kN-m
Slip ratio
20 -
10
"
.5 c 5 4 x 10'
Alining 0 0 torque,
-5 -4 in-lbf
6 R I ' i l
0 2 4 6 a 10 -
Time, aec
Figure A60.- Time h i s t o r i e s f o r run 60. Nominal carriage speed, 69 knots; vert ica l load, 68 .9 kN (1 5 500 l b f ) ; yaw angle, 3O; brake pressure, 1 3 MPa (1 900 p s i ) ; t i r e c o n d i t i o n , new; surface condition, f looded.

APPENDIX
Wheel
TP'PB speed,
Slip velocity, m/=
Wheel
rad/sec2 accel.,
Brake pressure, MPa
Brake torque, kNm
Pa
P.
Alining torque, kNm
Slip ratio
2 Brake
1 ft-lbf torque,
4 x 10' 1: g: J 9
Figure A61 .- Time h i s t o r i e s f o r run 61. Naninal carriage speed, 79 knots; vert ica l load, 68.1 kN (1 5 300 l b f ) ; yaw angle, 3O; brake pressure, 1 3 MPa (1 850 p s i ) ; t i r e c o n d i t i o n , new; surface condit ion, f looded.
1 42

APPENDIX
Slip velocity, m/=
Wheel accel., rad/sec2
Brake pressure, MPa
Brake torque, kN-rn
20
10
- "s x lo3 - 2 Brake -
0-
- 2 20
1.0 r
0
-
Alining torque, kNm
slip ratio
.5
0
5 4 X
0 0
-4 -5
1.0
.5
I J 0 2 4 6 8 10 12
Time. sec
Brake torque, ft-lbf
10' Alining torque, in-lbf
Figure A62.- Time h i s t o r i e s f o r run 62. Nominal carriage speed, 56 knots; ver t i ca l l oad , 70.7 kN (1 5 900 l b f ) ; yaw angle, 6O; brake pressurer 1 3 (1 900 ' p s i ) ; t i re condi t ion , new; surface condition, dry.
1 43
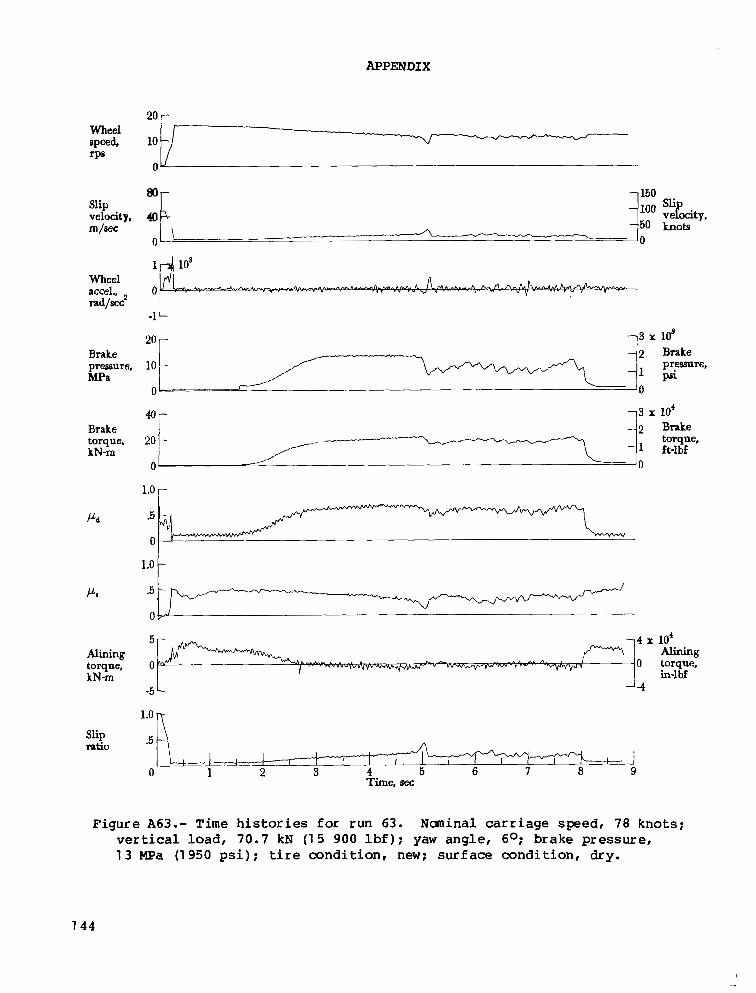
APPENDIX
Wheel accel., rad/aec2
20 r- Brake pressure, 10 L MPa
0
NL"/o 9 10'
Brake 2 Brake torque, 20 kN-m 1 A-lbf
0
1.0 r
torque,
- 4 x 10' Alining
0 torque, kN-m in-lbf
-5 L 1.0
Slip ratio
I I I
0 1 2 4 5 6 7 8 9 ,
Time, sec
Figure A63.- Time h i s t o r i e s for run 63. Nuninal carriage speed, 78 knots; ver t i ca l l oad , 7 0 . 7 kN (1 5 900 l b f ) ; yaw angle, 6O; brake pressure, 1 3 m a (1950 p s i ) ; t i r e c o n d i t i o n , new; surface condition, dry.
7 4 4

APPENDIX
Wheel
'PS speed.
Slip velocity, m/=
Wheel accel., rad/='
Brake pressure. MPa
Brake
kN m torque,
l L d
P.
Alining torque, k N m
slip ratio
20 -
10
0
-
40 "F 7 150
"r *O t 1
0 0
l.o r
-4
0
-5 L 1.0
.5
n 2 4 6 8 10 12 14 16
Brake pressure, psi
x lo4 Brake torque, Et-lbf
x 10' Alining
in-lbf torque,
Figure A64.- Time h i s t o r i e s f o r run 64. Nominal carriage speed, 42 knots; v e r t i c a l l o a d , 68 .9 kN (15 500 l b f ) ; yaw angle, 6O; brake pressure, 1 3 MPa (1 850 p s i ) ; t i r e c o n d i t i o n , new; surface mndit ion, damp.
1 4 5
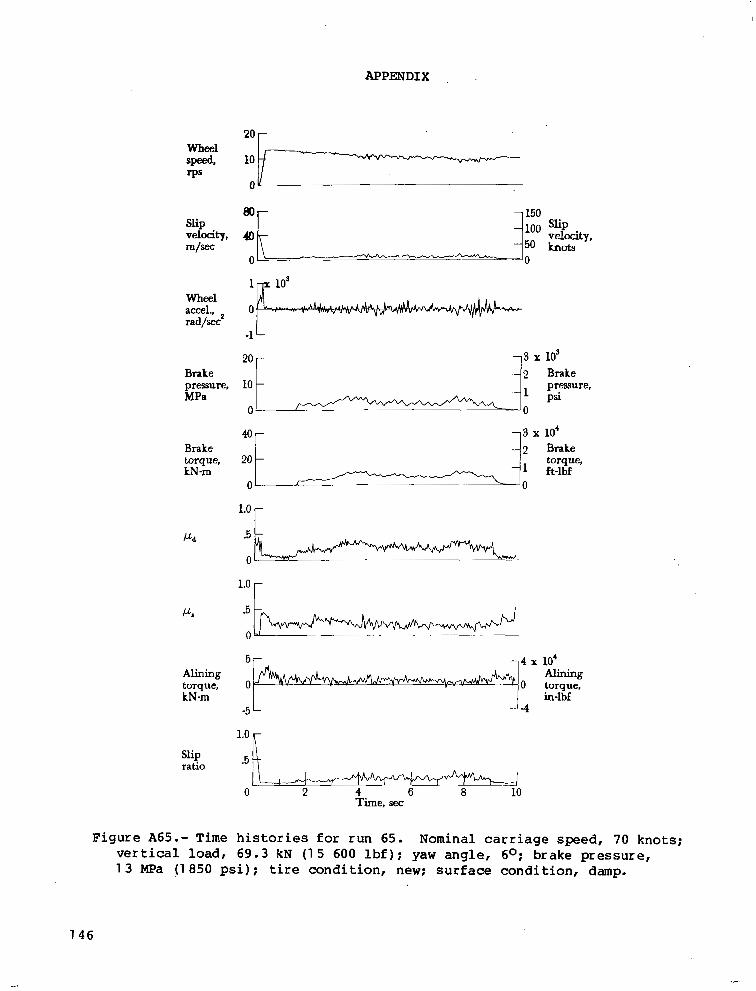
APPENDIX
Slip velocity, m/=
Wheel accel., rad/sec
Brake pressure, MPa
Brake
kNm torque,
Alining
k N m torque,
Slip ratio
Figure A65.- Time v e r t i c a l l o a d ,
20 -
10
0' ' - - '0
40- -3 x 10'
20 - - 2 Brake - ft-lbf
torque,
0 0
1.0 - .5 -
0 4 1.0 -
5 7 - 4 x 10'
0 Alining
E o torque, in-lbf
-5 - "4
.5 R ;
0 2 4 6 8 10 Time, sec
h i s t o r i e s f o r run 65. Nominal carriage speed, 70 knots: 69.3 kN ( 1 5 600 l b f ) : yaw angle, 6O; brake pressure, -
1 3 MPa (1 850 psi) i t i re condi t ion , new; surface condit ion, damp.
1 4 6
.,-
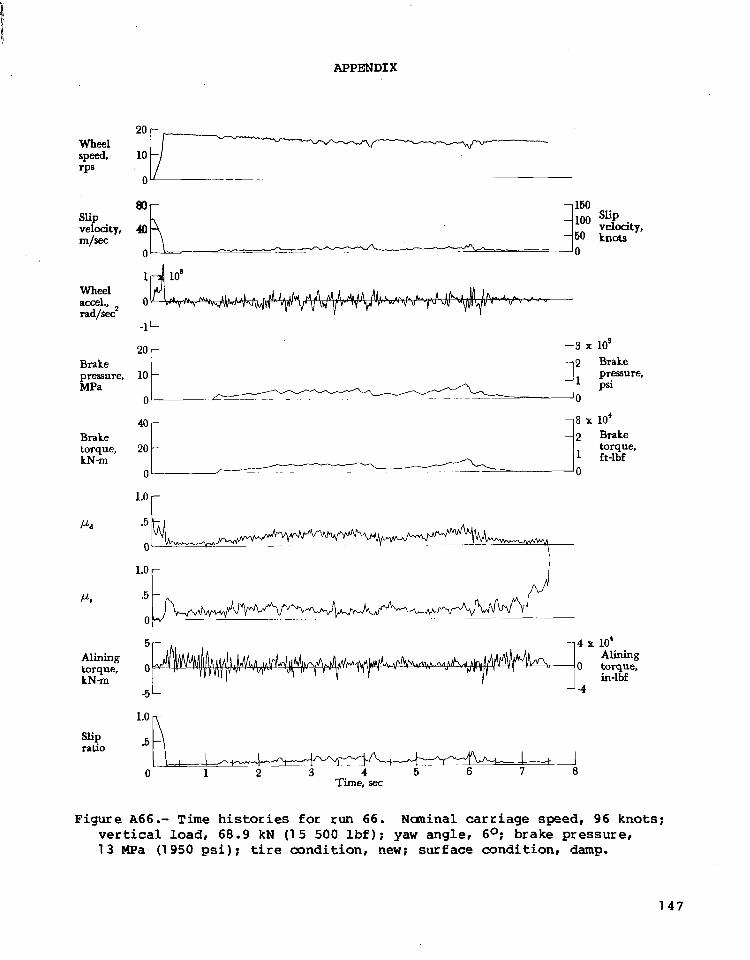
APPENDIX
slip velocity, m/sec
Wheel accel., rad/sec2
Brake pressure, MPa
Brake torque, kNm
Alining torque, kNm
slip ratio
F igur e
5 4 x 10' Alining
0 0 torque, in-lbf
-5 L
d R Time, sec
A66.- Time h i s t o r i e s f o r run 66. Naninal carriage speed, 96 knots; v e r t i c a l l o a d , 6 8 . 9 kN (1 5 500 l b f ) ; yaw angle, 6O; brake pressure, 1 3 MPa (1 950 ps i ) ; t i r e c o n d i t i o n , new; surface condit ion, damp.
1 4 7
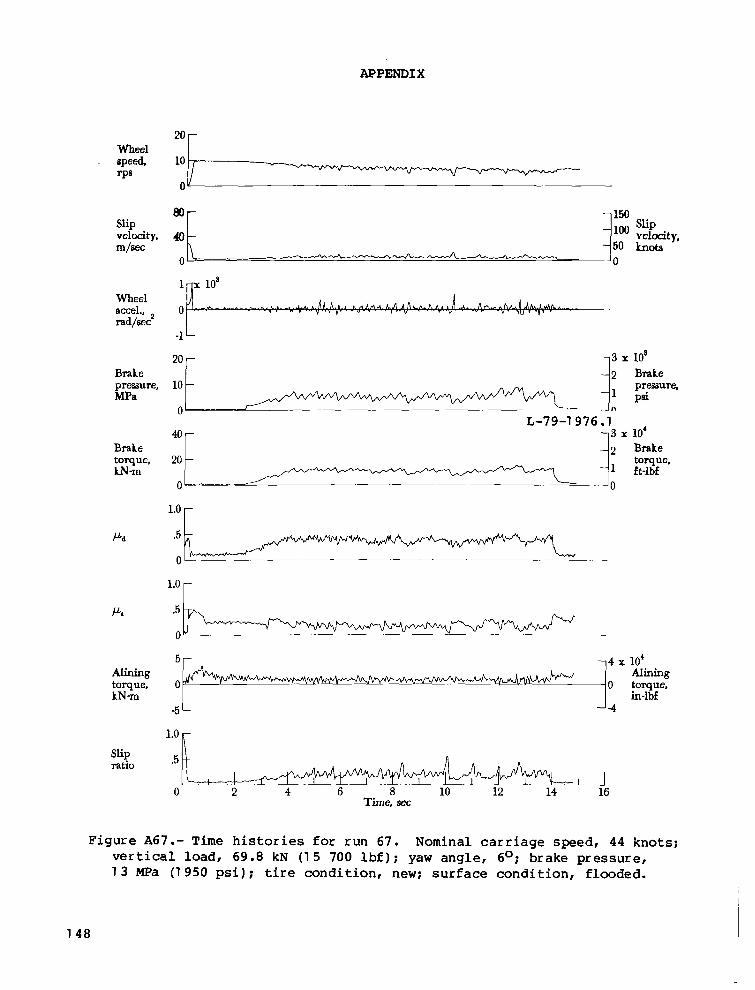
APPENDIX
20 - Wheel speed, 10 rPS
Y
Slip
m/sec velocity,
Wheel accel., rad/sec
Brake pressure, MPa
Brake torque, LN-m
- ~ ]150 loo ::Lity,
10
- 3 $: pr.essure,
50 hots 0 0
20 - 3 x IO*
0
40-
20 -
0 -
- n
L-79-1976.1
2 Brake
1 ft-lbf torque,
r P d
r P. .5
0
5- Alining
-4 x 10'
torque, o in-lbf k N m
J Alining
0 torque,
-5 - "4
slip ratio .5 1-
C I ! 0 2
Time, sec
Figure A67.- Time his tor ies f o r run 67. Nominal carriage speed, 4 4 knots; ver t ical load, 69.8 kN (1 5 700 l b f ) ; yaw angle, 6O; brake pressure, 13 MPa (1 950 psi): t ire condition, new; surface condition, flooded.
148
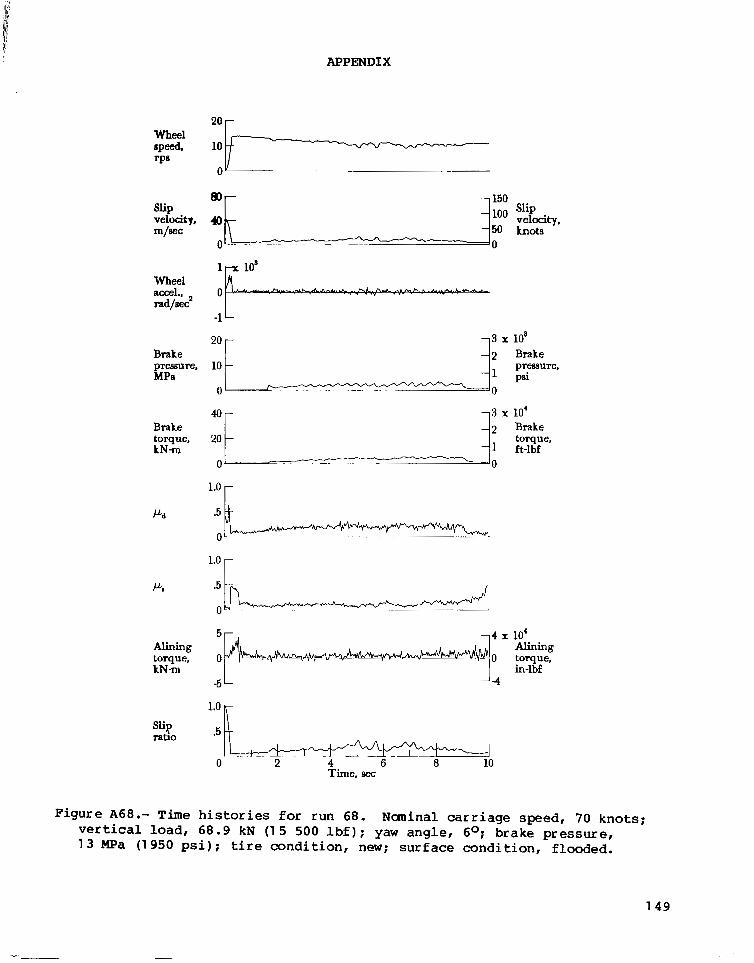
APPENDIX
Wheel speed, rP8
Slip velocity, m/sec
Wheel accel., rad/sec'
Brake pressure, MPa
Brake torque, kN-m
ll.d
El,
Alining torque, kNm
slip ratio
"k"-------- 10 0 v
20 -
10
0
-
!o
3 x lo8 2 Brake
1 psi
40- - 3 x 10'
pressure,
~~ .. "~
20
0
- -2 Brake
-1 ft-lbf torque,
-0 " .. -
%
r
5 r I 1 4 X 10'
.5 A
Figure A68.- Time h i s t o r i e s f o r run 68. Naninal carriage speed, 70 knots; v e r t i c a l l o a d , 68.9 kN (1 5 500 l b f ) ; yaw angle, 6O; brake pressure, 1 3 MPa (1950 psi); t i r e c o n d i t i o n , new; surface condition, f looded.
149

APPENDIX
Wheel speed. r p s
slip velocity, m/wc
Wheel
radjsec' accel.,
Brake pressure, MPa
Brake torque, kN-m
p d
P,
Alining torque, kNm
slip ratio
l.o r
l'OI* .5
5 4 x 10' Alining
0 0 torque, in-lbf
F i g u r e A69.- Time h i s t o r i e s for run 69. Nominal c a r r i a g e s p e e d , 91 knots ; v e r t i c a l l o a d , 68.5 kN (15 400 l b f ) ; yaw a n g l e , 6O; brake pressure, 1 3 m a (1 950 psi) ; t i re c o n d i t i o n , new; surface c o n d i t i o n , f l m d e d .
1 50

' APPENDIX
Slip velocity, m/wc
Wheel accel., Tad/ae?
Brake pressure, MPa
Brake torque, kNm
20 -
io 0 U "~ ~ .
n
2o t /
2 Brake torque,
1 ft-lbf
Alining torque, kNm
slip ratio
5 4 x 10'
0 Alining
0 torque, in-lbf
5 -4
1.0 n
.5 R
Figure A70.- Time h i s t o r i e s for run 70. Nominal carriage speed, 50 knots; v e r t i c a l load, 69.3 kN ( 1 5 600 lbf); yaw angle, Oo; brake pressure, 1 3 MPa (1950 p s i ) ; t i r e c o n d i t i o n , worn; surface condit ion, dry.
1 51
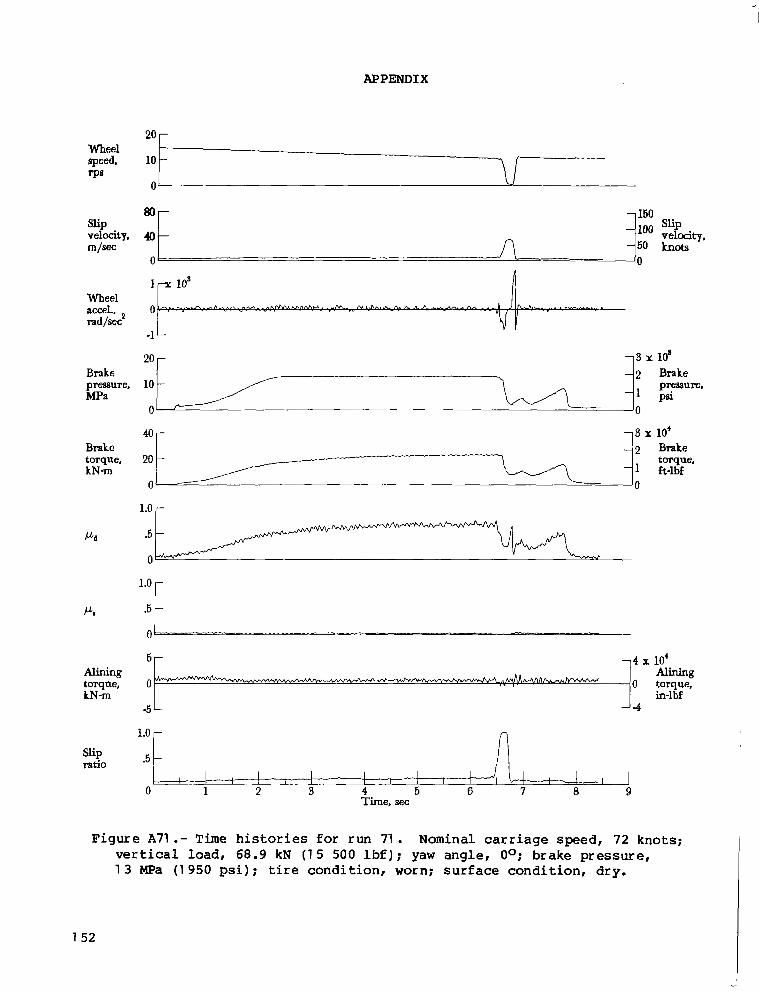
APPENDIX
2O r
slip velocity, m/sec
Wheel
rad/=; accel..
Brake
MPa pressure,
Brake torque, k N m
Pd
P,
Alining torque, kN-m
slip ratio
10
n
80- - 150
40- --O0 :LQ, -50 knots
0 - 0
-1
20
10 - preesure,
- -3 x lo8
-1
40- -9 x 10'
psi
- 2 Brake
0 - 0
- 2 Brake 20 - - 1 ft-lbf
torque,
0- 0
1.0 r
r *5 t 0-*
5- -4 10' Alining O""------..-----------"--.~ 0 torque. in-lbf
-5 - -4
loo .5 c A I I I I I I I I I I AI 1 I
0 1 2 3 4 6 7 8 9 5 - I
Time, aec
Figure A71 .- Time h i s t o r i e s f o r run 71. Nominal carriage speed, 72 knots; ver t i ca l l oad , 68 .9 kN (1 5 500 l b f ) : yaw angle, Oo; brake pressure, 1 3 MPa (1 950 p s i ) ; t i r e c o n d i t i o n , worn: surface condit ion, dry.
1 52
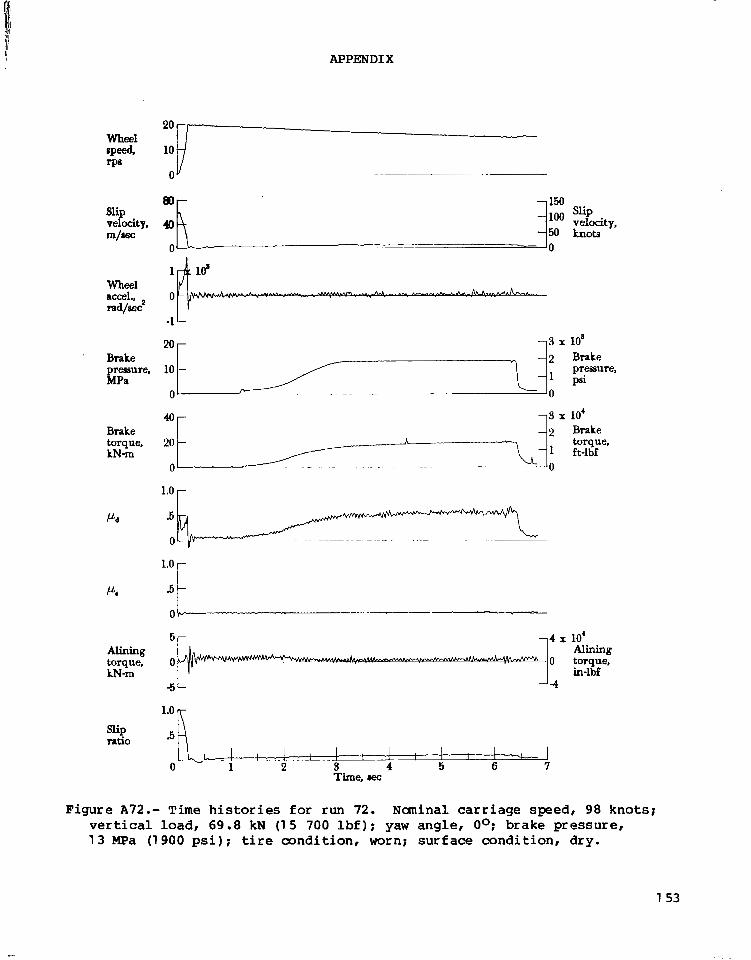
APPENDIX
Wheel speed, rps
slip velocity, m/aec
Wheel accel., rad/=*
Brake preasure, MPa
Brake torque, kN-m
I-La
I4
Alining torque, kN-m
Slip ratio
*5 t 5 4
0 0
-5 -4
.5 R I I I I I I
I I
0 1 2 s 4 5 6 7 . . .. ~-
Time, .set
x lo8 Brake
psi pressure.
x lo4 Brake torque, ft-lbf
x 10' Alining torque, in-lbf
Figure A72.- Time h i s t o r i e s f o r run 72. Naninal carriage speed, 98 knots; v e r t i c a l l o a d , 6 9 . 8 kN (1 5 700 l b f ) ; yaw angle, Oo; brake pressure, 1 3 MPa (1900 p s i ) ; t i r e c o n d i t i o n , worn; surface condition, dry.
1 53

APPEND1 X'
' 20- Wheel speed, 10 rPs
n 9 9 '
Slip velocity, m/sec
Wheel accel., rad/sec2
Brake pressure, MPa
Brake torque, kN-m
20 - -3 x lo8 - 2 -1
Brake
psi 10 - pressure,
0- j0
~
-3 x 10' - 2 -
Brake
ft-lbf torque,
0
1.0 r -~ ___ 0
I
5 4 x 10' Alining Alining torque, 0 0 torque, kN-m in-lbf
-5 -4
1.0
Slip ratio *5LLL ~- I
0 2 4 6 8 10 12 14 16 Time, sec
Figure A73.- Time h i s t o r i e s f o r run 73. Nominal carriage speed, 44 knots; v e r t i c a l l o a d , 69 .6 kN (1 5 600 l b f ) ; yaw angle, Oo; brake pressure, 1 3 MPa (1 900 p s i ) ; t i r e c o n d i t i o n , worn; sur face condi t ion , damp.
1 54

APPENDIX
Wheel
rP8 epee&
Slip velocity, m/wc
Wheel accel.. rad/sec2
Brake preeeure, MPa
Brake torque, kNm
Pd
Pa
Alining torque, kNm
Slip ratio
20
10
-
'mo r
5 4 x 10' Alining
0 0 torque,
a -4 in-lbf
.5
I ! 0 2 4 6 8 10
Time, sec
Figure A74.- Time h i s t o r i e s f o r run 74. Naninal carriage speed, 72 knots; vert ica l load, 69 .8 kN (15 700 l b f ) ; yaw angle, Oo; brake pressure, 1 3 MPa (1 900 p s i ) ; t i r e c o n d i t i o n , worn; surface condit ion, damp.
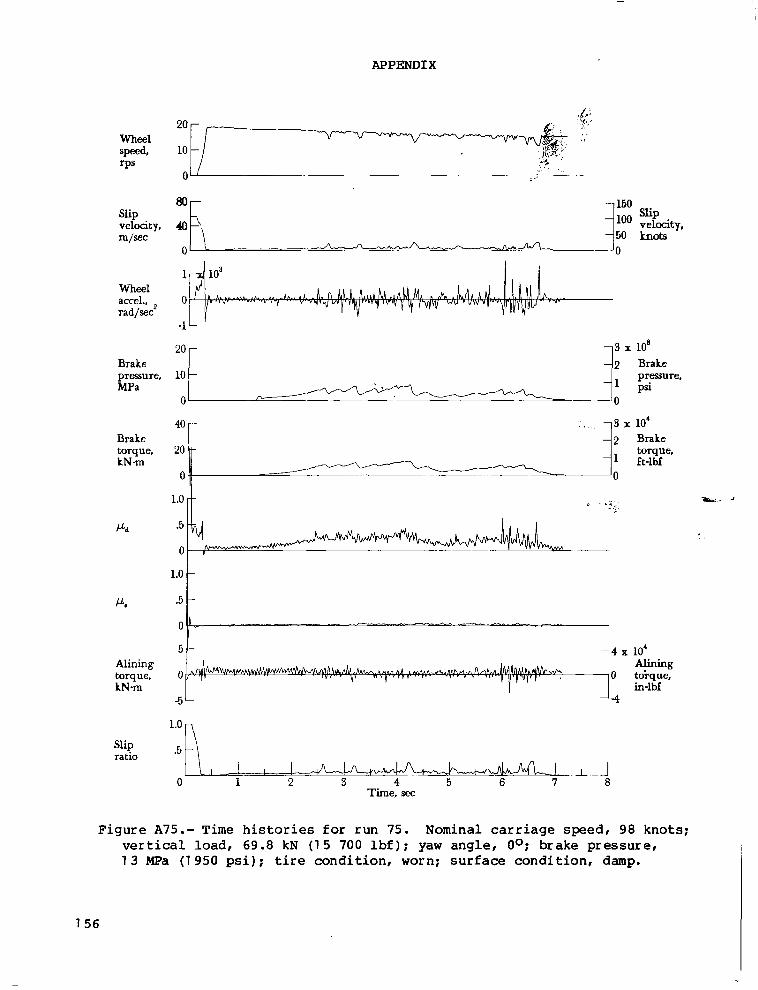
APPEND1 X
wheel
rPs speed,
Slip velocity, m/sec
wheel
rad/sec accel.,
Brake pressure. MPa
Brake torque, k N m
P d
P.
Alining torque, kN-m
" . .-
1.0
.5
0
1.0 I-
5/- 1 4 X 10'
0 Alining
0 toi-que, in-lbf
1.0
Time, scc
Figure A75.- Time h i s t o r i e s f o r run 75 . Nominal carriage speed, 98 knots: v e r t i c a l l o a d , 6 9 . 8 kN (1 5 700 l b f ) : yaw angle, Oo: brake pressure, 1 3 MPa (1 950 ps i ) : t i r e c o n d i t i o n , worn: s u r f a c e c o n d i t i o n , damp.
156

APPENDIX
Wheel speed, rpe
Slip velocity, m/ec
wheel accel., rad/eec2
Brake
MPa preeeure,
Brake torque, kNm
Pa
El,
mining torque, kN-m
Slip ratio
2o r 10 - pr.eeeure,
- I 0 0
P a
::3 x lo'
'";
2 Brake
1 ft-lbf torque,
0 0
0
1.0 r-
.5 t I
5- -4 x 10' Aliiing
0 3
-5- "4
0 torque, in"
A .5
0 2 4 6 8 10 12 Time, sec
Figure A76.- Time h i s t o r i e s f o r run 76. Nminal carriage speed, 60 knots; v e r t i c a l l o a d , 66.7 kN (1 5 000 l b f ) ; yaw angle, Oo; brake pressure, 1 3 MPa (1 900 p s i ) ; t i r e c o n d i t i o n , worn; surface condit ion, f looded.
1 57
I
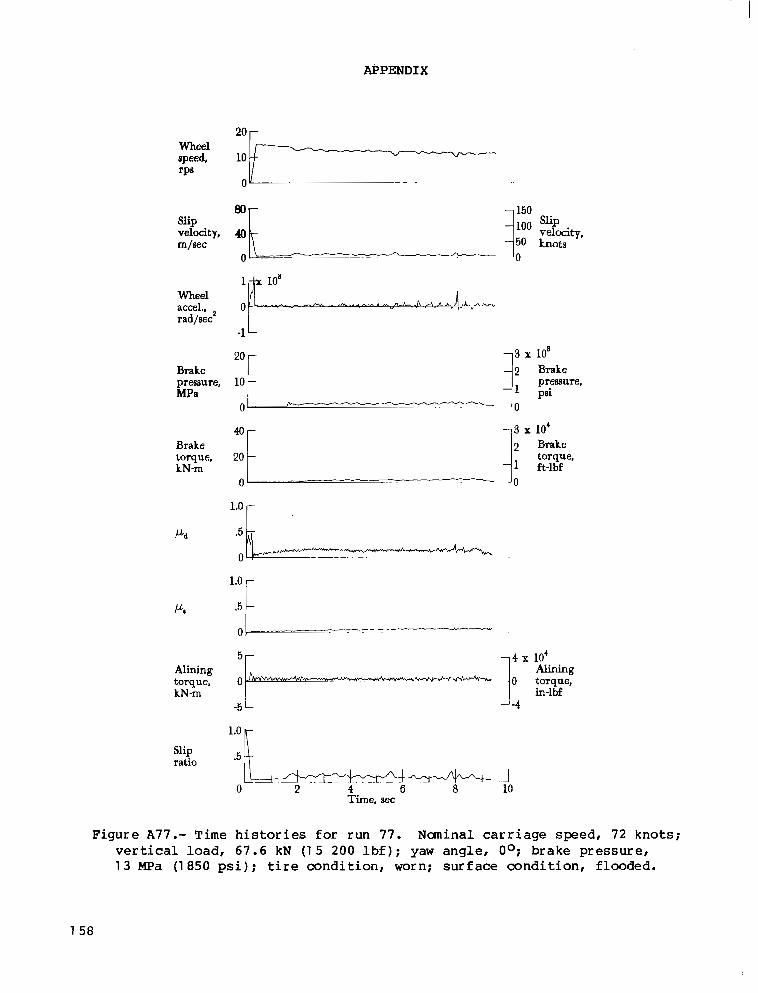
APPENDIX
Wheel speed, rPs
Slip velocity, m/aec
Wheel accel., rad/eec2
Brake pressure, MPa
Brake torque, kN-m
p d
PuI
Alining torque, kN-m
20 -
10
1.0 r
.5 c 0 w . ~ . . .
5 -
0-
-5 -
2 Brake torque,
1 ft-lbf
Slip ratio .5 "
- h J ~ .. ~~ - " - ~ .. 0 2 4 6 8 10
Time, sec
Figure A77.- Time h i s t o r i e s f o r run 77. Naninal carriage speed, 72 knots: vert ica l load, 67.6 kN (1 5 200 l b f ) : yaw angle, Oo; brake pressure, 1 3 MPa (1 850 p s i ) ; t i r e c o n d i t i o n , worn; surface condition, f looded.
1 58
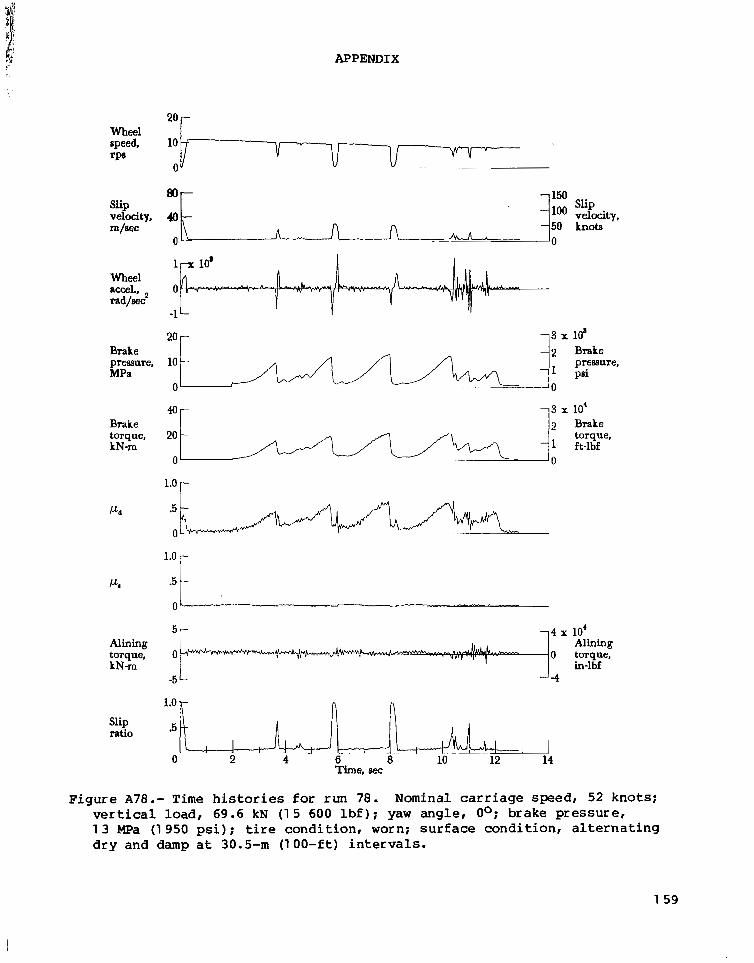
APPENDIX
Wheel speed, rPs
Slip velocity, m/sec
Wheel accel., rad/sec2
Brake pressure, MPa
Brake torque, kNm
P d
Pa
Alining torque, kN-m
Slip ratio
*Or
4Qr 1 3 x 10'
r
1.0
-5 F 5L/,+.&v4% O L
4 x 10' Alining
0 torque, in-lbf
-5 -4
Figure A78.- Time h i s t o r i e s f o r run 78. Nominal carriage speed, 52 knots; v e r t i c a l l o a d , 69 .6 kN ( 1 5 600 l b f ) ; yaw angle, Oo; brake pressure, 1 3 Mpa (1 950 p s i ) ; t i r e c o n d i t i o n , worn: surface condit ion, alternating dry and damp a t 30.5-m (100-f t ) intervals .
1 59
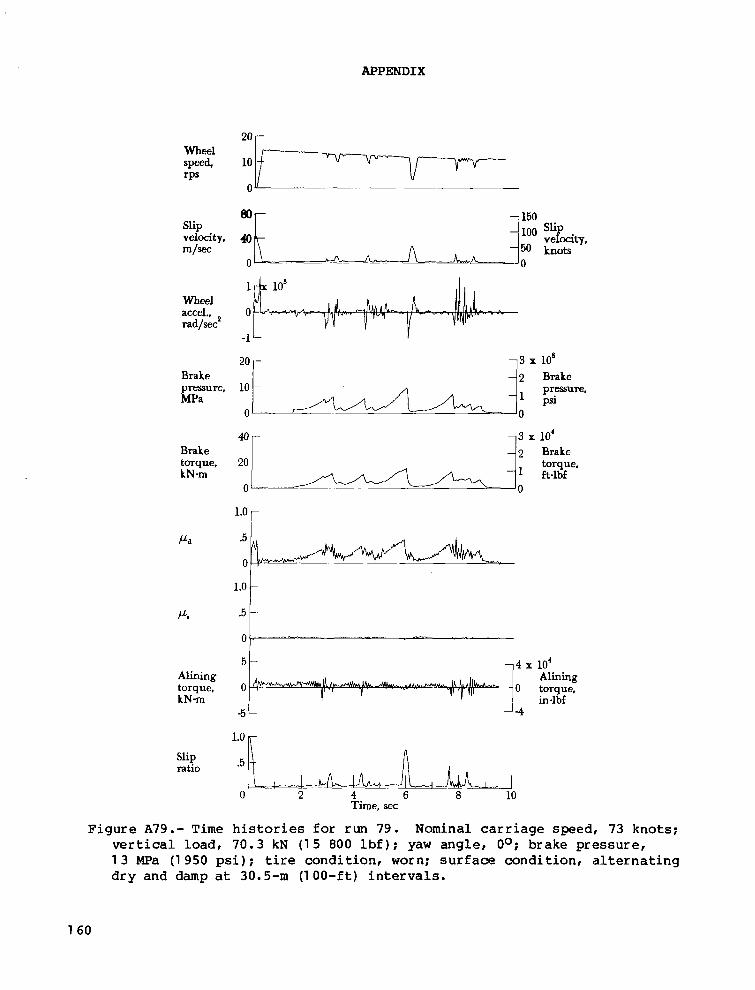
APPENDIX
Slip velocity, m/=
Wheel accel., rad/sec2
Brake pressurc, MPa
Brake torque, kN-m
P.
Alining torque, kN-m
Slip ratio
Figure A79.- Time vert ica l load,
80- - 150
40 -100 slip
L a - 5 0 knots velocity,
0. - 0
20 - -3 x 10'
- 1
torque, - 20
40- -3 x 10'
psi 10 -
- 2 Brake pressure.
0- 0
- 2 Brake
ft-lbf 0 0
1.0 r I
.5
5 4 x 10'
0 Alining
0 torque, in-lbf
1.0
.5
I I I -
O 2 4 6 8 10 Time, sec
h i s t o r i e s f o r run 79. Nominal carriage speed, 73 knots; 70.3 kN (1 5 800 lbf); yaw angle, Oo; brake pressure,
1 3 MPa (1 950 p s i ) ; t i r e c o n d i t i o n , worn; surface condit ion, alternating dry and damp a t 30.5-m (1 00- f t ) in terva l s .
1 60
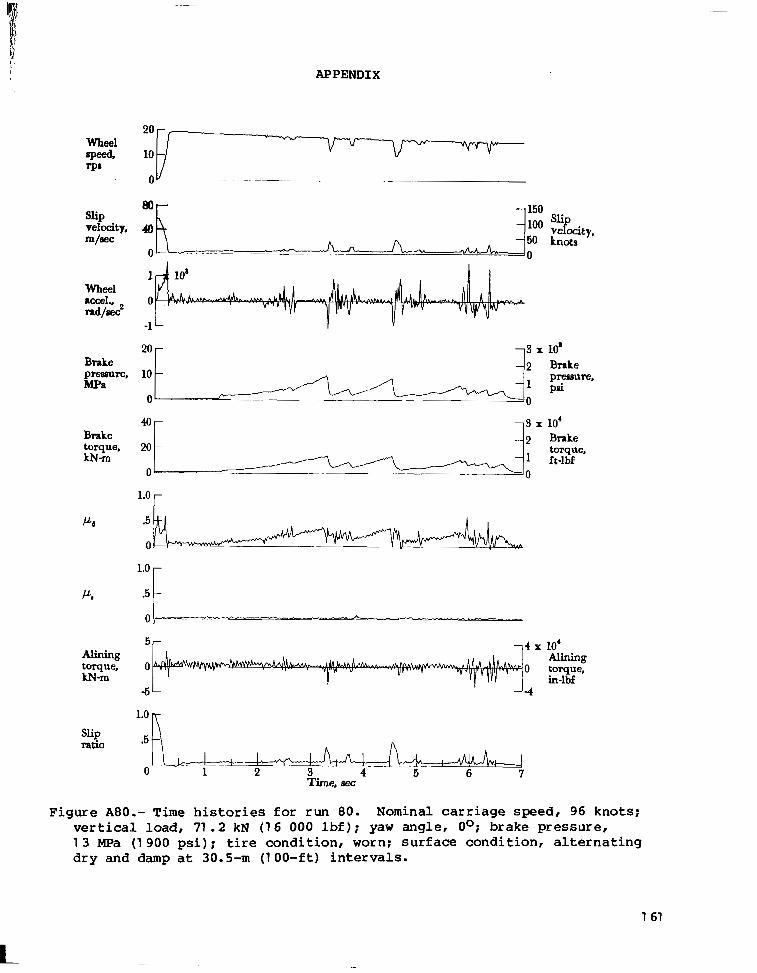
APPENDIX
Wheel #Peed, r p a
slip
m/wc velocity,
Wheel accel., rad/eec2
Brake preeeure, MPa
Brake torque, kN-m
P a
P,
Alining torque, kN-m
slip ratio
20
10
-
-
0- " . .
40-
20
0
1.0 r
2 Brake -
1 ft-lbf torque,
--
.5 1 5 4 x 10'
0
-5
Alining 0 torque,
-4 in-lbf
a .5
0 I L L ~~ ! 1 2 3 4 5 6 7
Time, aec
L
Figure A80.- Time h i s t o r i e s f o r run 80. Nominal carriage speed, 96 knots; ver t i ca l l oad , 71 .2 kN (1 6 000 l b f ) : yaw angle, Oo; brake pressure, 1 3 MPa (1 900 p s i ) ; t i re condi t ion , worn; surface condit ion, a l ternat ing dry and damp a t 30.5-m (100- f t ) in terva l s .
1 61
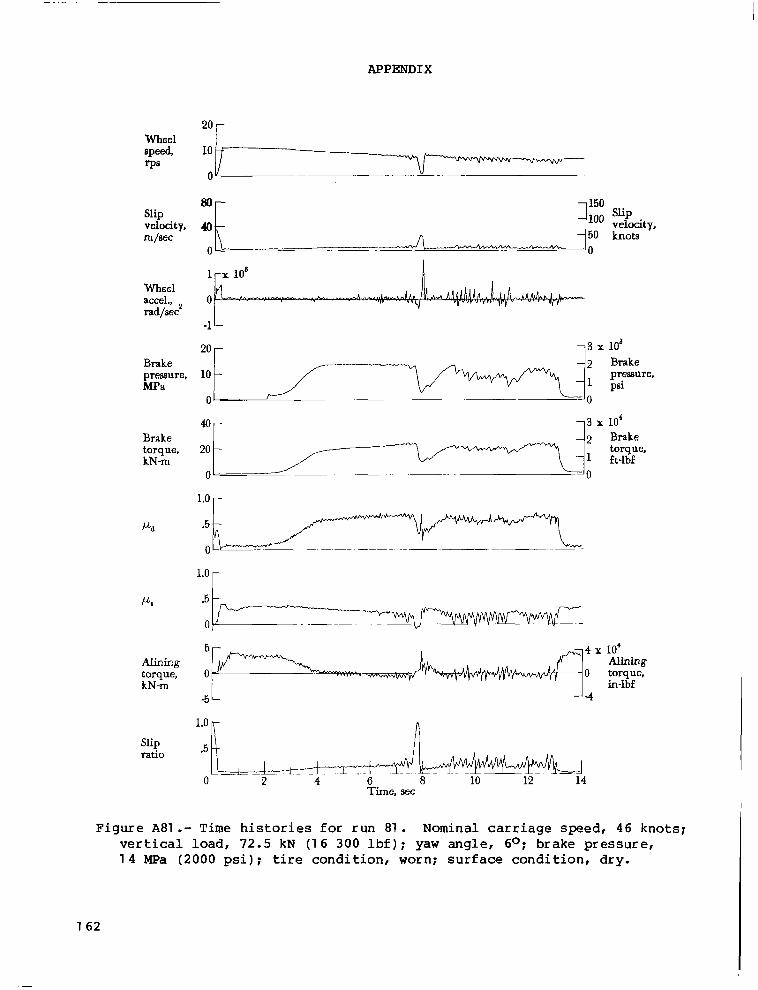
._ . . ... .
APPENDIX
Wheel speed. rPS
slip velocity, m/wc
Wheel accel.. rad/wc2
Brake presure, MPa
Brake torque, kN-m
Pd
Alining torque, kN-m
Slip ratio
*O r
n
-1 L
20 r-
40-
20 - torque,
0
1.0 r
2 Brake
1 ft-lbf
1.0 -
.5
0
-
5 4 x 10'
0 Al in ing
0 torque, in-lbf
1.0
*5LJ- 0 2 " 4 6 8 10 12 ~- 14 J Time, sec
Figure A81 .- Time h i s t o r i e s f o r run 81. Nominal carriage speed, 4 6 knots; v e r t i c a l l o a d , 72 .5 kN ( 1 6 300 l b f ) ; yaw angle, 6O; brake pressure, 1 4 MPa (2000 p s i ) ; t i r e c o n d i t i o n , worn; s u r f a c e c o n d i t i o n , d r y .
1 62
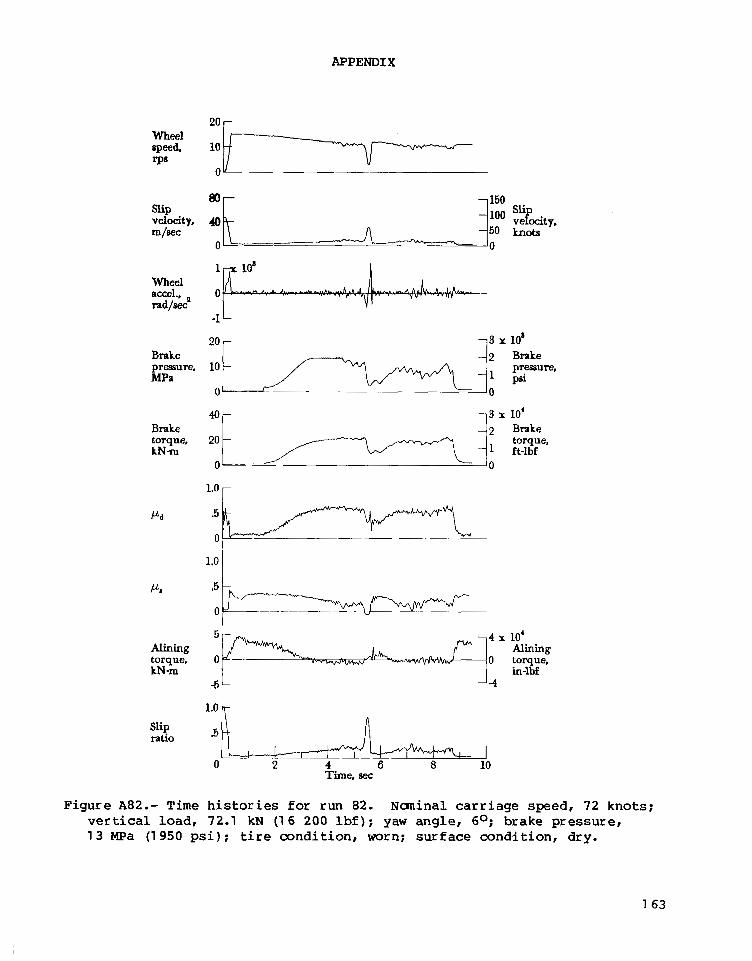
APPEND1 X
Slip velocity, m/wc
wheel accel., rad/aeca
Brake
MPa pressure,
Brake torque, t N m
Alining torque, kN-m
slip ratio
Figure A82.- Time v e r t i c a l l o a d ,
20 r
10
m r 7 150
A
20 r 1 3 x 10’
10 - pressure,
0-
1 7 4; ft-lbf torque,
in-lbf J-4
1.0
h i s t o r i e s f o r run 82. Naninal carriage speed, 72 knots; 72.1 kN (1 6 200 lbf); yaw angle, 6O; brake pressure,
1 3 MPa (1 950 p s i ) ; t i r e m n d i t i o n , worn; surface condition, dry.
1 63
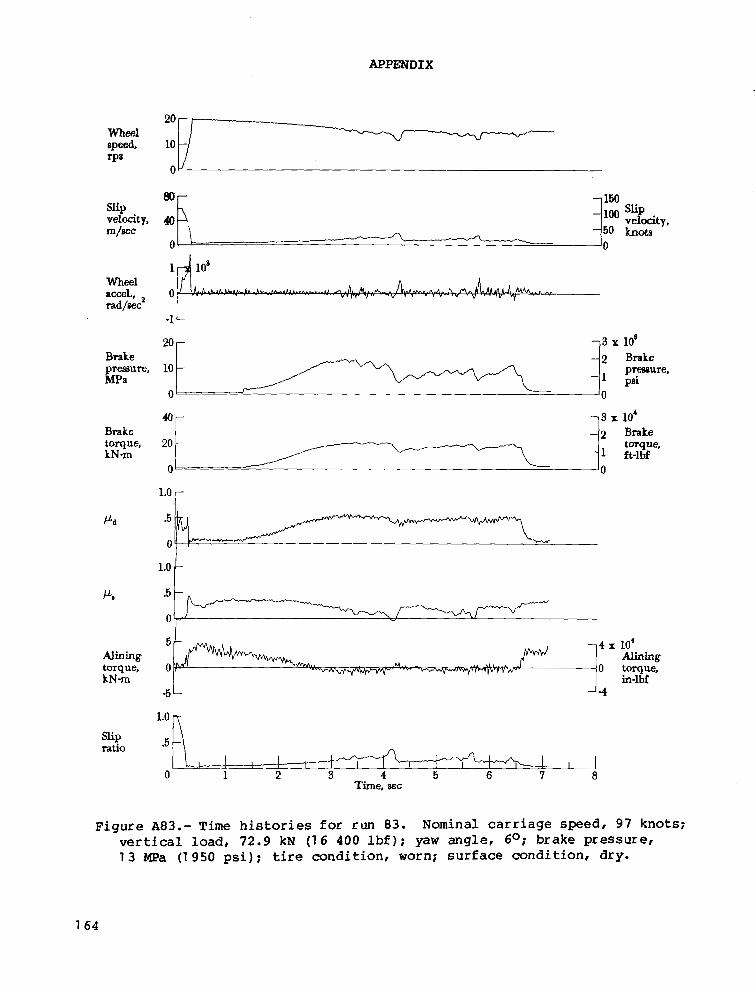
APPENDIX
WMl speed, rPS
Slip velocity. m/EC
Wheel accel., rad/azc2
Brake preasure, MPa
Brake torque, kN-m
P d
P.
mining torque, kNm
slip ratio
1.0 r-
I
1.0 1 .5
0 -
-
5 4 x 10'
0 mining
0 torque, in-lbf
-5L J-4
I I I I I J 0 1 2 s 4 5 6 7 8
Time. sec
Figure A83.- Time h i s t o r i e s f o r run 83. Nominal carriage speed, 97 knots; vert ica l load, 72 .9 kN (16 400 l b f ) ; yaw angle, 6O; brake pressure, 1 3 MPa (1 950 p s i ) ; t i r e c o n d i t i o n , worn; surface condition, dry.
1 64
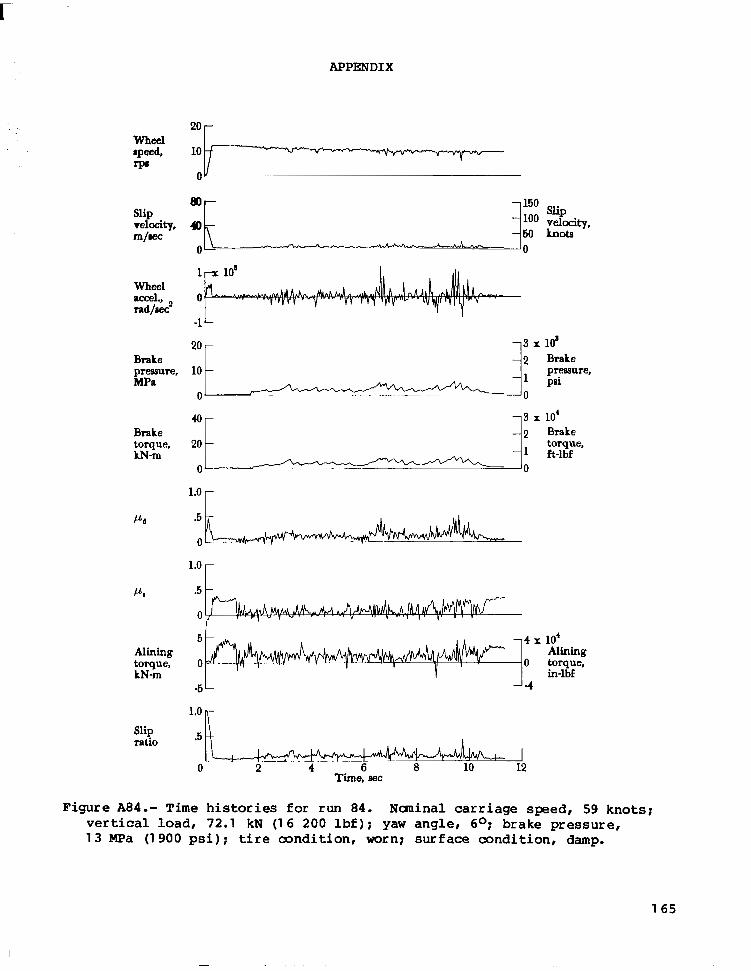
r
APPENDIX
Wheel apeed, rp,
Slip velocity, m/wc
wheel rccel., md/aec2
Brake pressure, MPa
Brake torque, kN-m
Pa
Po
Alining torque, kNm
Slip ratio
.A
2o r
40-
20 - torque,
0
1.0 -
2 Brake
1 ft-lbf ~~ "
.5 c 0
5 4 x 10'
0 Alining
0 torque, in-lbf
1.0
.5
0 2 4 6 8 10 12 Time, aec
Figure A84.- Time h i s t o r i e s for run 84. Naninal carriage speed, 59 knots; v e r t i c a l l o a d , 72.1 kN (1 6 200 l b f ) ; yaw angle, 6O; brake pressure, 1 3 MPa (1 900 p s i ) ; t i r e c o n d i t i o n , worn; surface condit ion, damp.
165
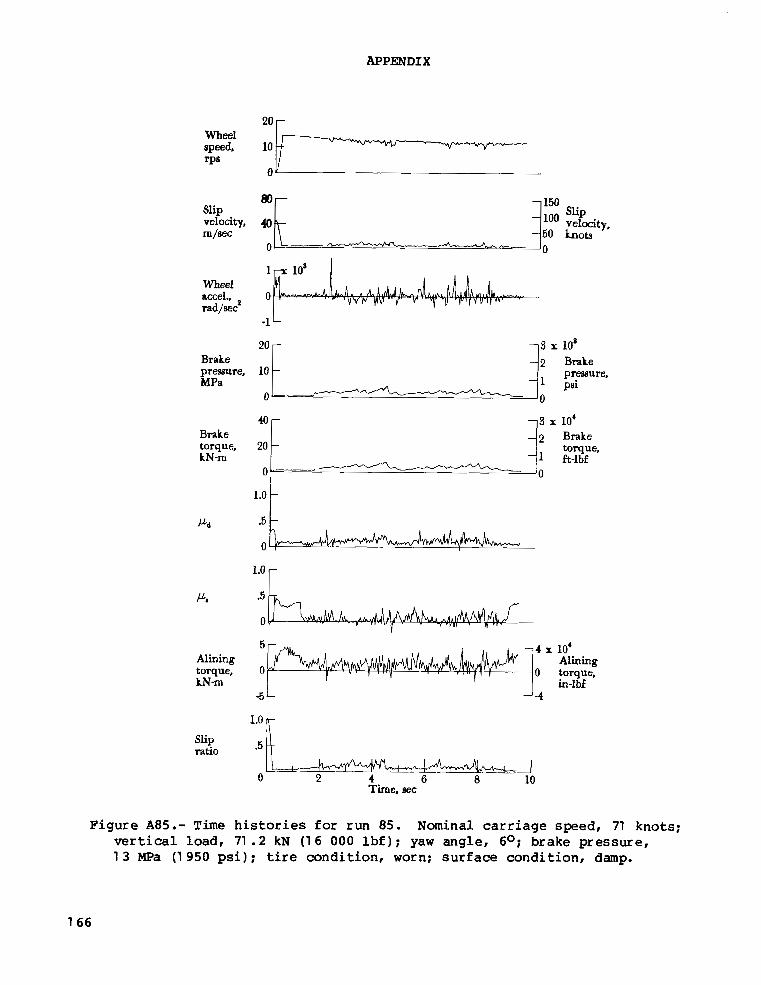
APPENDIX
wheel speed. rPS
slip velocity, I I l / R C
Wheel accel., rad/&
Brake pressure, MPa
Brake torque, kN-m
P d
K
Alining torque, LNm
Slip ratio
20 -
10
O L '0
:::2 Brake
-j s x loa
1 pa1
s x 10'
pressure.
0 0
2 Brake
1 ft-lbf 0
torque,
0 I
.5 t r
r L .il 0
5 4 x 10'
0 Alining
0 torque, in-ibf
6 A 0 1 2
4 6 8 10 Time. nec
Figure A85.- Time h i s t o r i e s f o r run 85. Nominal carr iage speed, 71 knots; v e r t i c a l l o a d , 71 . 2 kN (1 6 000 l b f ) ; yaw angle, 6O; brake pressure, 1 3 MPa (1 950 psi ) ; t i r e c o n d i t i o n , worn; s u r f a c e c o n d i t i o n , damp.
1 66
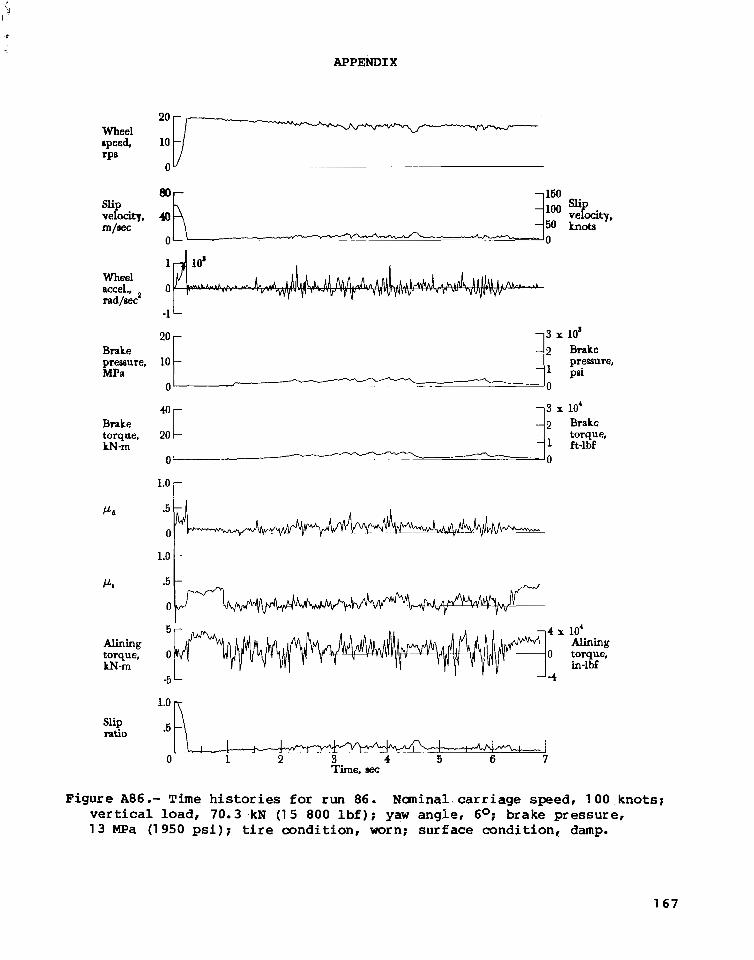
APPENDIX
m e e l 2o r/- rpeed, 10
Wheel accel., rad/sec2
20 - 3 x 10' Brake preesure, 10 MPa
-
0
40-
1 - .
i 3 x 10'
Brake
1 ft-lbf LN-m - torque, torque, 20
2 Brake
0 4 . ~"
1.0 -
P d
1.0 -
4 x lo4 ALining
0 torque,
-4 in-lbf
slip '"R ratio .5
I L
0 I ! '
1 > 2 4 5 6 7 3 1 .. .
3
Figure A86.- Time h i s t o r i e s for run 86. Naninal .carriage speed, 100 knots; v e r t i c a l l o a d , 70 .3 .kN (1 5 800 lbf); yaw angle, 6O; brake pressure, 1 3 MPa (1 950 p s i ) ; t i r e c o n d i t i o n , worn; surface condit ion, damp.
167
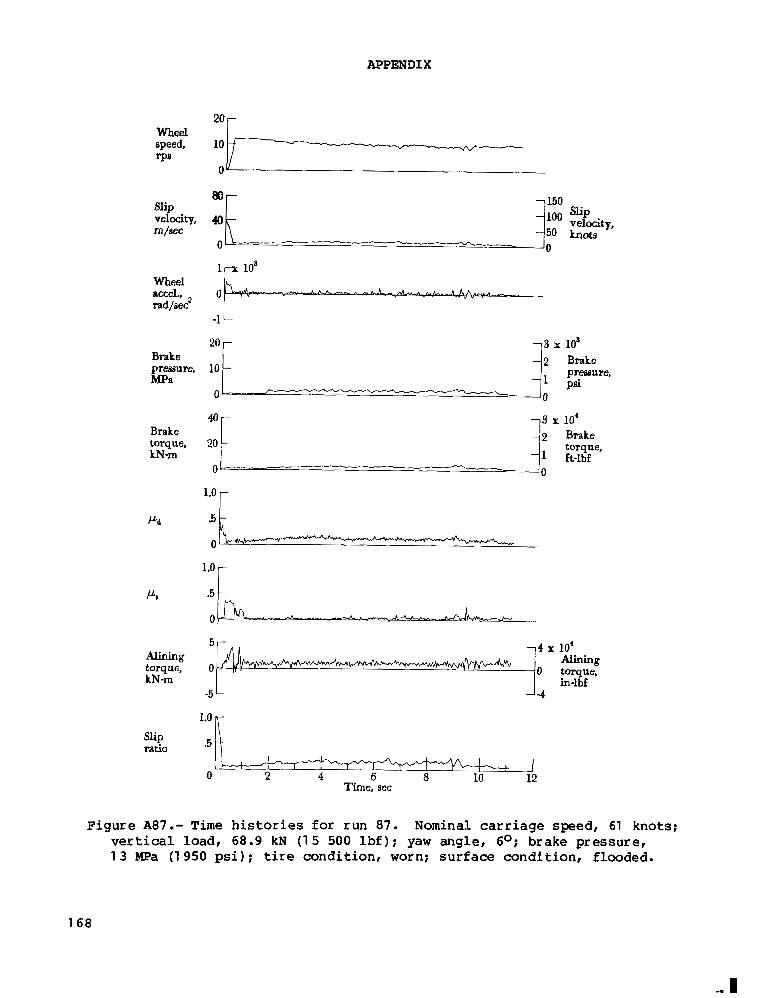
APPEND1 X
Wheel speed, rP6
slip velocity, m / m
Wheel
rad/aec2 accel..
Brake presciure, MPa
Brake torque, kNm
Pd
P,
Alining torque, kN-m
Slip ratio
OV
l o x 0 0 1 psi pressure,
::3 x lo'
l::;
l::;& -
2 Brake torque, ft-lbf
0 0
0
0
-4 x 10' Alining
0 torque, in-lbf
-5 - "4
.5 R 0 2 4 6 8 LO 12
Time, sec
F igure A87.- Time h i s t o r i e s for run 87. Nominal carriage speed, 61 knots; v e r t i c a l l o a d , 6 8 . 9 kN ( 1 5 500 l b f ) ; yaw angle, 6O; brake pressure, 1 3 MPa ( 1 950 p s i ) ; t i r e c o n d i t i o n , worn; sur face condi t ion , f l ooded .
168
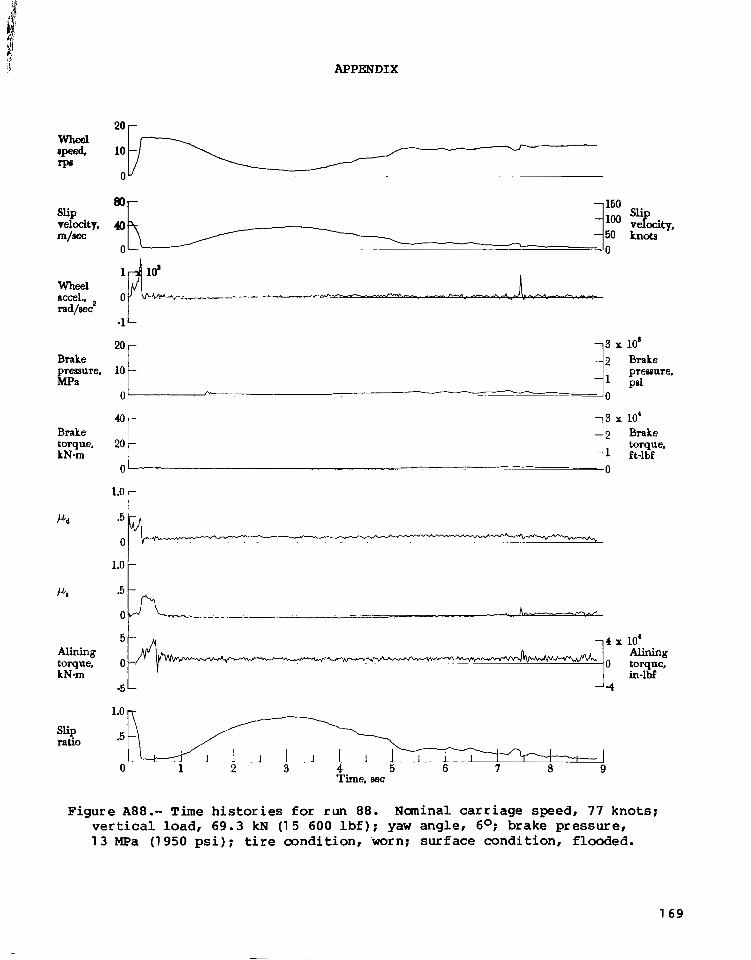
APPENDIX
Wheel
r p s speed.
slip
m/= velocity,
wheel accel., rad/aec2
Brake pressure, MPa
Brake torque, kN-m
Pd
Pa
ALining torque, kN m
slip ratio
I
-1 L
20 -
10 -
3 x 10'
0 - j: 0 !::re,
3 x 10' 2 Brake
torque, 1 ft-lbf
r
t *5t h.
C
0 1 2 3 4 5 6 7 8 9 . .
Time, aec
Figure A88.- Time h i s t o r i e s f o r run 88 . Ncminal carriage speed, 77 knots; v e r t i c a l l o a d , 6 9 . 3 kN (1 5 600 l b f ) ; yaw angle, 6O; brake pressure, 1 3 MPa (1950 p s i ) ; t i r e a n d i t i o n , 'worn; surface condition, f looded.
169
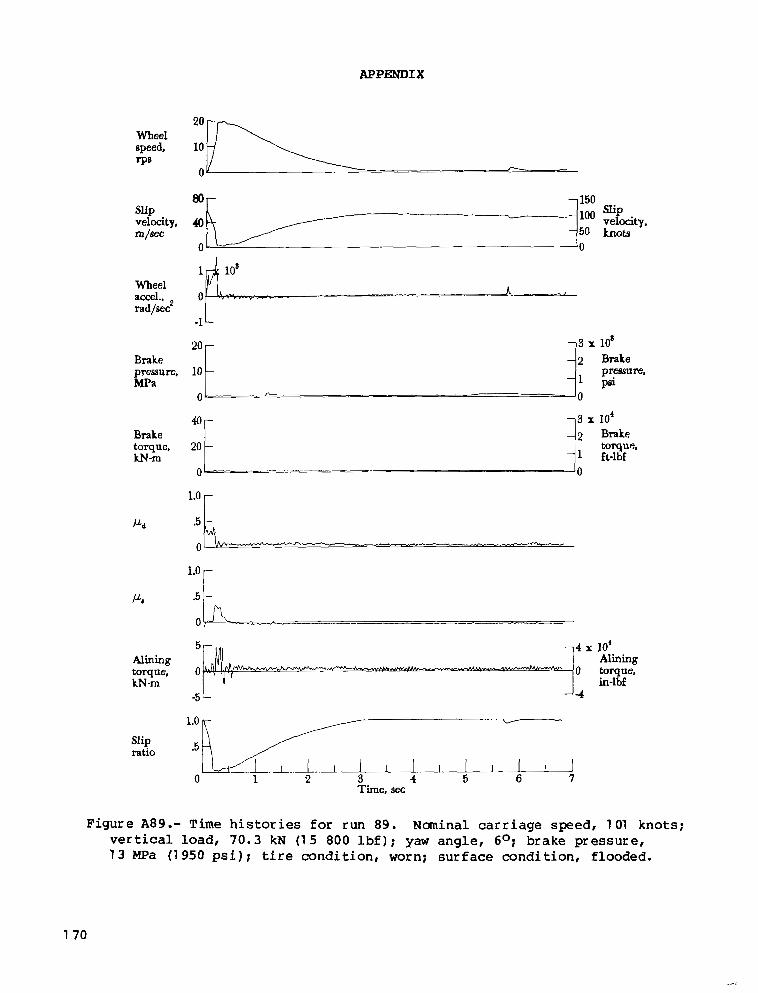
APPENDIX
WhHl speed, rP8
slip velocity, m/sec
Wheel
rad/eec2 accel..
Brake pressure, MPa
Brake torque, k N m
P d
K
Alining torque, k N m
Slip ratio
3 x 10' 2 Brake
1 ft-lbf torque,
OL '0
1.0 r
l:fk 0
5
0
4 X 10' Alining
0 torque, in-lbf
-5 -4
1.0 ri- v
I I I I I 0 1 2 3 4 5 6 7
Time, sec
Figure A89.- Time h i s t o r i e s f o r run 89 . Nominal carriage speed, 101 knots; vert ica l load, 7 0 . 3 kN (1 5 800 l b f ) ; yaw angle, 6O; brake pressure, 1 3 MPa (1 950 p s i ) ; t i r e c o n d i t i o n , worn; surface condition, f looded.
1 70
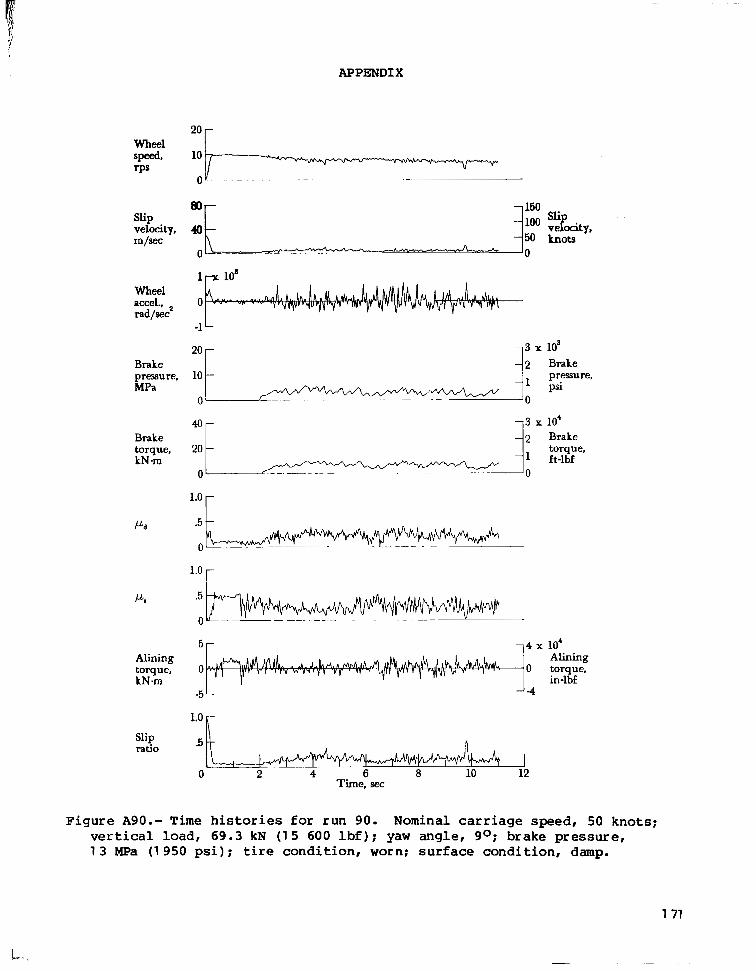
APPEND1 X
20 r I
slip
m/= velocity,
Wheel accel., rad/sec2
Brake pressure, MPa
10
0 lL "" " '0
20
10
0
-
-
40-
lo 3 x 10'
Brake
ft-lbf kN m - torque, torque, 20
2 Brake
0 ,
1.0 -
Pd .5 -
~ - -. " - . - - ~ "~
0 - q w ~- -~ .
r P.
5 r 14 x 10' Alining ALining torque, 0 0 torque, kN-m in-lbf
-5 -4
1.0
Slip ratio .5
0 2 4 6 8 10 12 Time, sec
Figure Ago.- Time h i s t o r i e s f o r run 90. Nominal carriage speed, 50 knots; v e r t i c a l l o a d , 6 9 . 3 kN ( 1 5 600 l b f ) : yaw angle, go; brake pressure, 1 3 MPa ( 1 950 p s i ) : t i r e c o n d i t i o n , worn: surface condit ion, damp.
1 71
"

APPENDIX
F
1 72
wheel speed, rPe
slip velocity, m/aec
Wheel
rad/eec accel.,
Brake preasure, MPa
Brake torque, kN-m
Pd
PI
Alining torque, kN-m
Slip ratio
OK-
2 Brake
1 ft-lbf torque.
P .5
0
1.0 r .5
0
.5 L J
0 1 2 ?I 4 5 6 I The. sec
'igure A91 .- Time h i s t o r i e s for run 91. Naninal carriage speed, 102 knots; v e r t i c a l l o a d , 71 .6 kN (1 6 100 l b f ) ; yaw angle , go; brake pressure, 1 3 MPa (1 950 p s i ) ; t i r e c o n d i t i o n , worn; surface condit ion, damp.

1. Report No. 3. Recipient's C a t a l o g No. 2. Government Accession No. NASA Tp-1877
4. Title and Subtitle 5. ReDort Date
BEHAVIOR OF AIRCRAET ANTISKID BRAKING SYSTEMS ON DRY
505-44-33-01 SYSTEM 6. Performing Organization Code AND WET RUNWAY SURFACES - HYDROMECHANICALLY CONTROLLED
August 1981
7. Author(r) 8. Performing Organization Report No.
John A. Tanner , Sandy M. Stubbs, 10. Work Unit No. and Eunice G. Smith
L-14549
9. Performing Organization Name and Address
NASA Langley Research Center Hampton, VA 23665 I 11, Contract or Grant No.
I 13. Type of Report and Period Covered
2. Sponsoring Agency Name and Address
14. Sponsoring Agency Code
Technical Paper National Aeronautics and Space Administration Washington, DC 20546
5. Supplementary Notes
6. Abstract
An experimental investigation was conducted a t t h e Langley Aircraf t Landing Loads and Trac t ion Fac i l i t y t o study the braking and cornering response of a hydromechan- i ca l ly con t ro l l ed a i r c ra f t an t i sk id b rak ing system. The investigation, conducted on dry and wet runway surfaces , u t i l ized one main gear wheel, brake, and t i r e assem- b ly of a McDonnell Douglas DC-9 series 10 a i rplane. The landing-gear s t r u t was replaced by a dynamometer. During maximum braking, average braking behavior indexes based upon brake pressure, brake torque, and drag-force friction coefficient devel- oped by the ant iskid system were generally higher on dry surfaces than on wet sur- faces. The three braking behavior indexes gave similar resu l t s bu t should no t be used interchangeably as a measure of the braking behavior of t h i s a n t i s k i d system. During t h e t r a n s i t i o n from a dry to a flooded surface under heavy braking, the wheel en tered in to a deep s k i d but the antiskid system reacted quickly by reducing brake pressure and performed normally during the remainder of the run on the Elooded surface. The brake-pressure recovery following transition from a flooded to a dry surface was shown to be a funct ion of the antiskid modulating orifice.
I. Key Words (Suggested by Author(s)) ~"
intiskid braking system i i r c ra f t t i r e s 2or ner ing
18. Distribution Statement
Unclassified - Unlimited
Subject Category 0 5 I I. Security Classif. (of this report) 22. Price 21. No. of Pages 20. Security Classif. (of this p a g e )
Unclassified A0 8 175 Unclassified "
For sale by the National Technical Information Service, Springfield. Vlrglnia 22161
NASA-Langley, 1981