Embed Size (px)
Citation preview
NASDAQ OMX 1
ROLE OF THE CAPITAL MARKETS IN CHANNELING FUNDS TO THE REAL ECONOMY
- NORDIC MARKETS
LAURI ROSENDAHL
PRESIDENT, NASDAQ OMX HELSINKI
SENIOR VICE PRESIDENT, EUROPEAN EQUITY & EQUITY DERIVATIVES,
GLOBAL TRADING & MARKET SERVICES
NASDAQ OMX
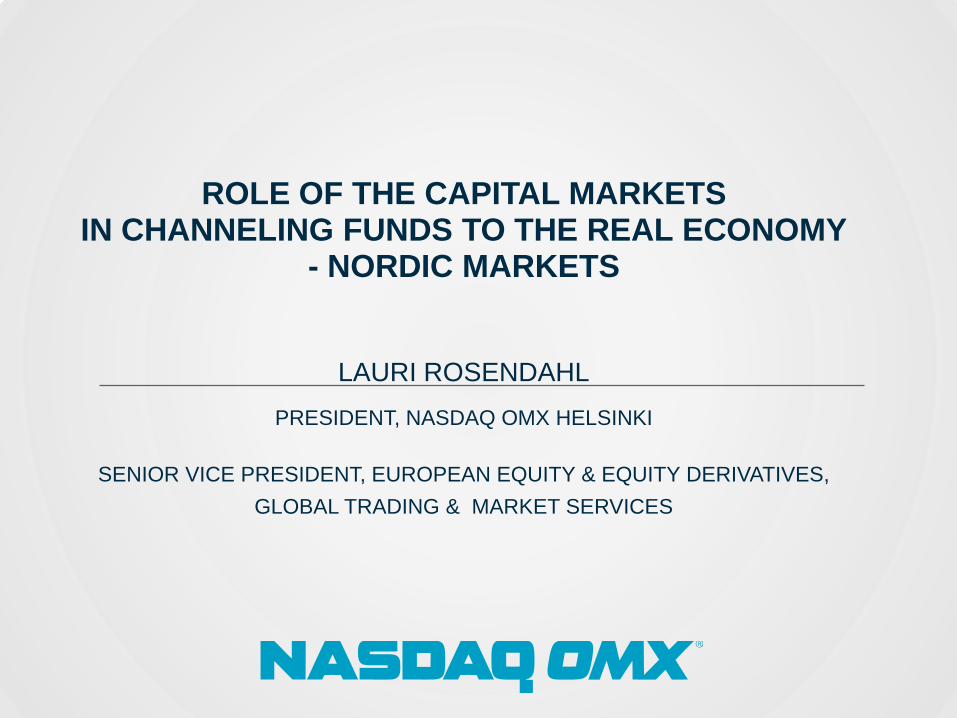
CONTENT
Role of the Exchanges in Financing the Economy
NASDAQ OMX in the Nordic and Baltic Region
Open Competition in Equity Trading
Back to Basics – it is all about Financing
First North – a Success Primarily in Sweden
IPO Task Force – Sweden, Finland and Denmark
Conclusions
3
NASDAQ OMX
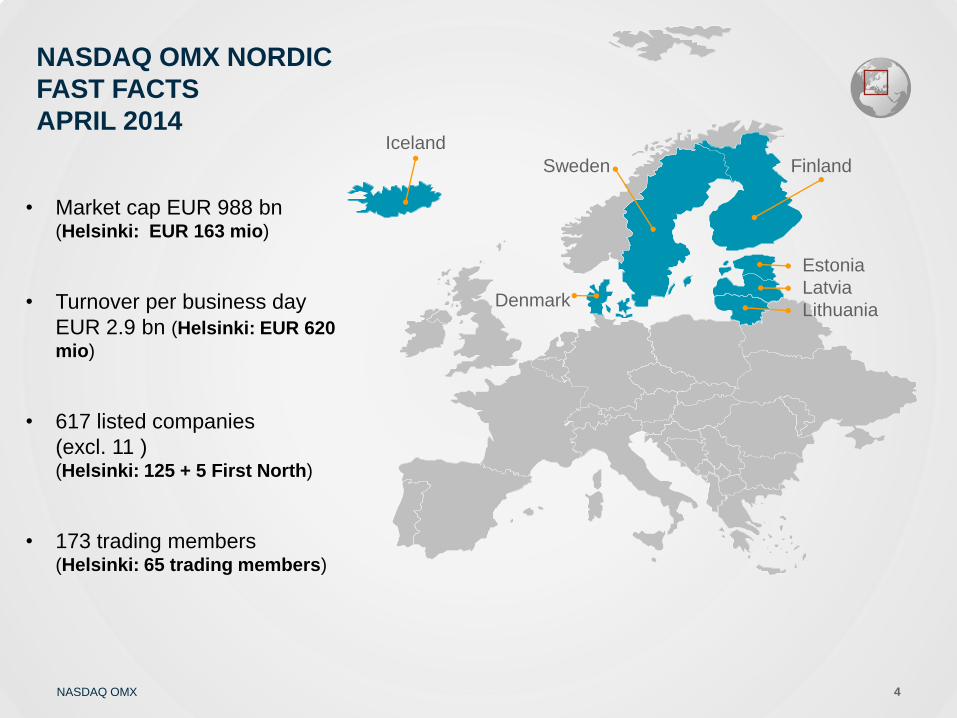
NASDAQ OMX NORDIC
FAST FACTS
APRIL 2014
• Market cap EUR 988 bn (Helsinki: EUR 163 mio)
• Turnover per business day
EUR 2.9 bn (Helsinki: EUR 620
mio)
• 617 listed companies
(excl. 11 ) (Helsinki: 125 + 5 First North)
• 173 trading members (Helsinki: 65 trading members)
Iceland
Sweden Finland
Denmark
Estonia
Latvia
Lithuania
4
NASDAQ OMX
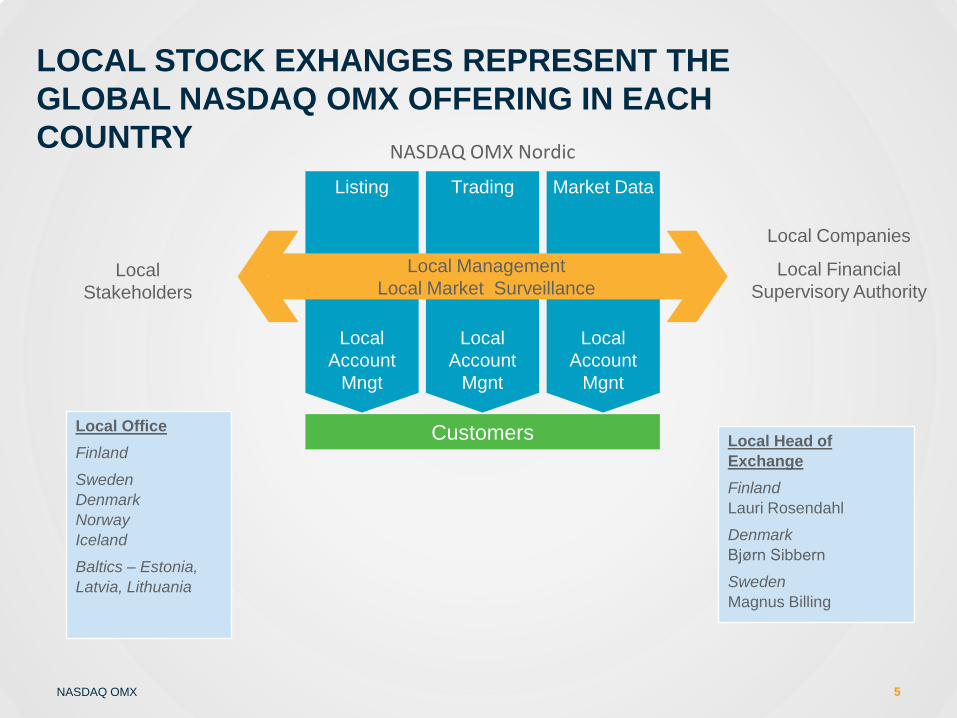
LOCAL STOCK EXHANGES REPRESENT THE
GLOBAL NASDAQ OMX OFFERING IN EACH
COUNTRY
5
Local
Stakeholders
Local Companies
Local Financial
Supervisory Authority
Local Head of
Exchange
Finland
Lauri Rosendahl
Denmark
Bjørn Sibbern
Sweden
Magnus Billing
Local Office
Finland
Sweden
Denmark
Norway
Iceland
Baltics – Estonia,
Latvia, Lithuania
NASDAQ OMX Nordic
Customers
Local
Account
Mngt
Local
Account
Mgnt
Local
Account
Mgnt
Local Management
Local Market Surveillance
Listing Trading Market Data
NASDAQ OMX
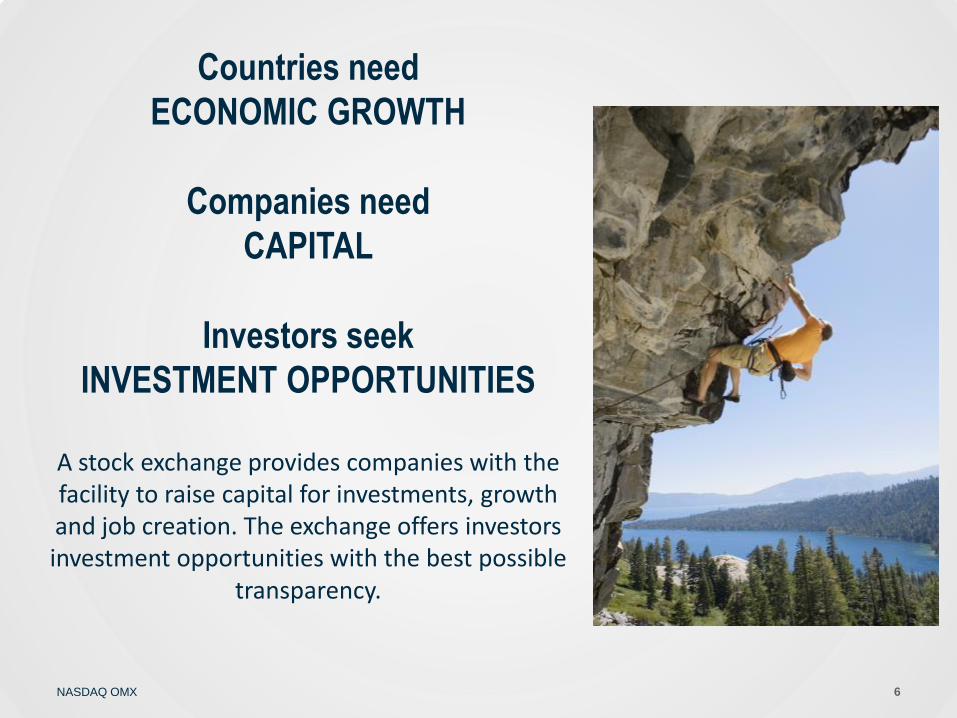
Countries need
ECONOMIC GROWTH
Companies need
CAPITAL
Investors seek
INVESTMENT OPPORTUNITIES
A stock exchange provides companies with the facility to raise capital for investments, growth and job creation. The exchange offers investors investment opportunities with the best possible
transparency.
6
NASDAQ OMX
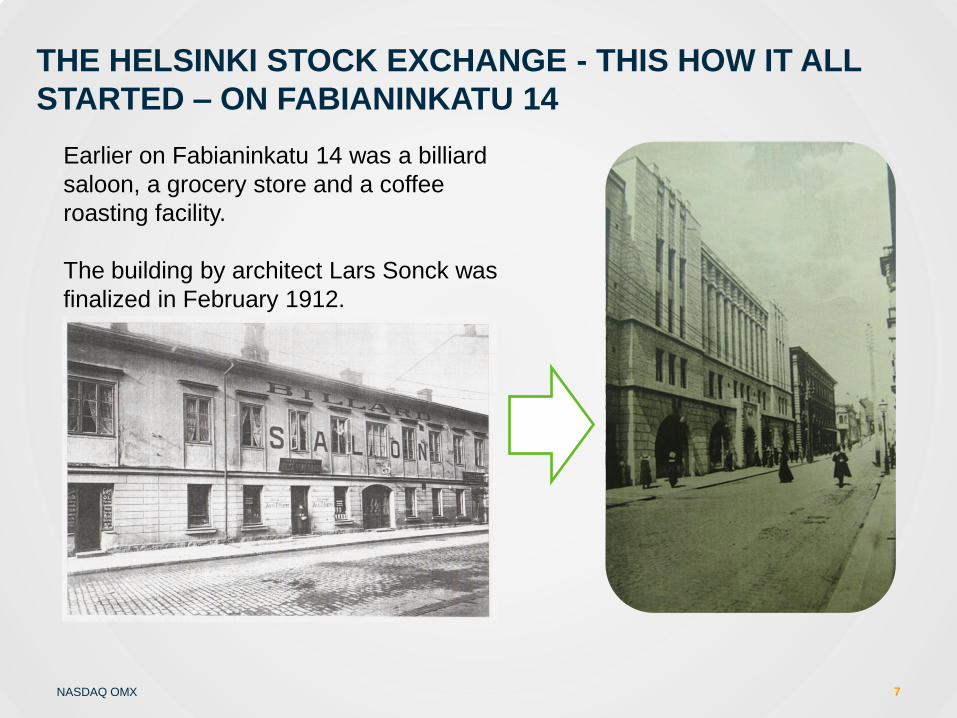
THE HELSINKI STOCK EXCHANGE - THIS HOW IT ALL
STARTED – ON FABIANINKATU 14
7
Earlier on Fabianinkatu 14 was a billiard
saloon, a grocery store and a coffee
roasting facility.
The building by architect Lars Sonck was
finalized in February 1912.

NASDAQ OMX 8
INAUGURATION OF THE BUILDING FEB 2, 1912
NASDAQ OMX 9
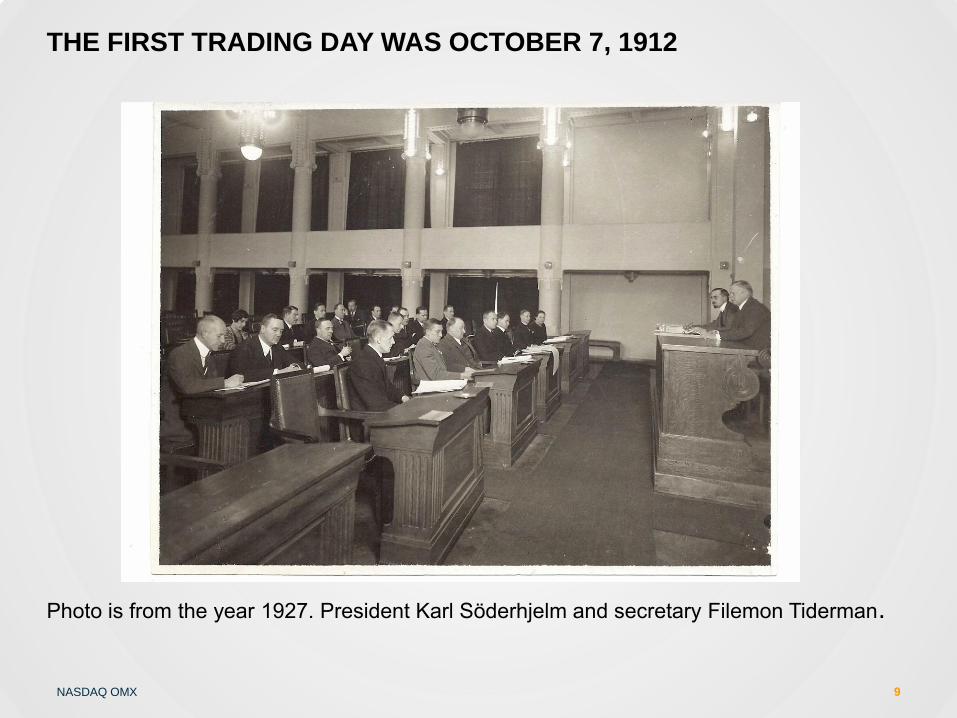
THE FIRST TRADING DAY WAS OCTOBER 7, 1912
Photo is from the year 1927. President Karl Söderhjelm and secretary Filemon Tiderman.
NASDAQ OMX
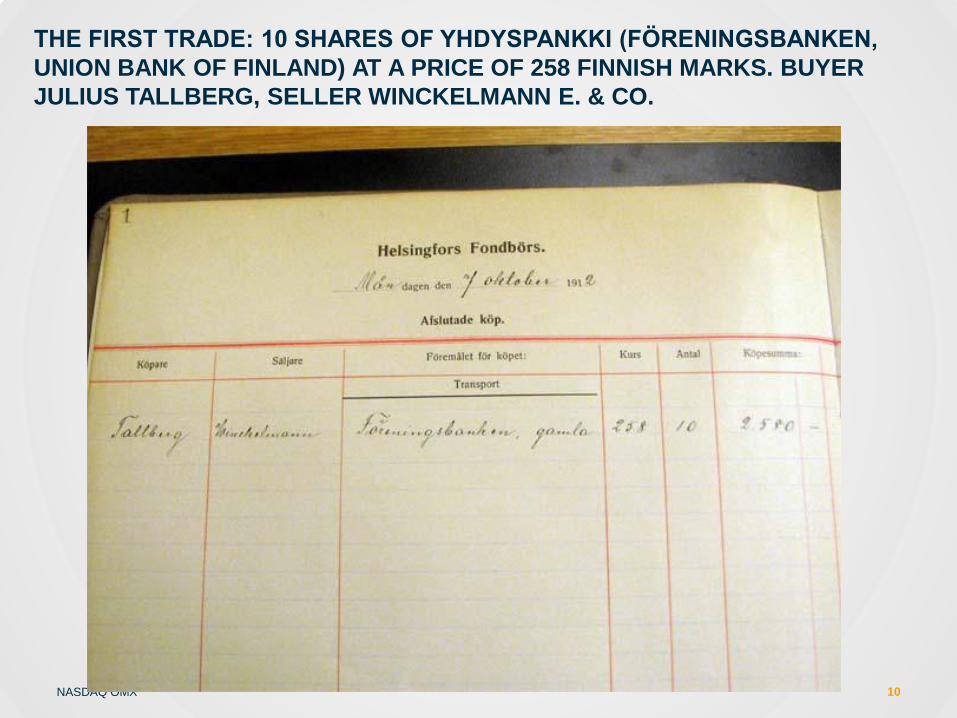
THE FIRST TRADE: 10 SHARES OF YHDYSPANKKI (FÖRENINGSBANKEN,
UNION BANK OF FINLAND) AT A PRICE OF 258 FINNISH MARKS. BUYER
JULIUS TALLBERG, SELLER WINCKELMANN E. & CO.
10

NASDAQ OMX
NASDAQ OMX
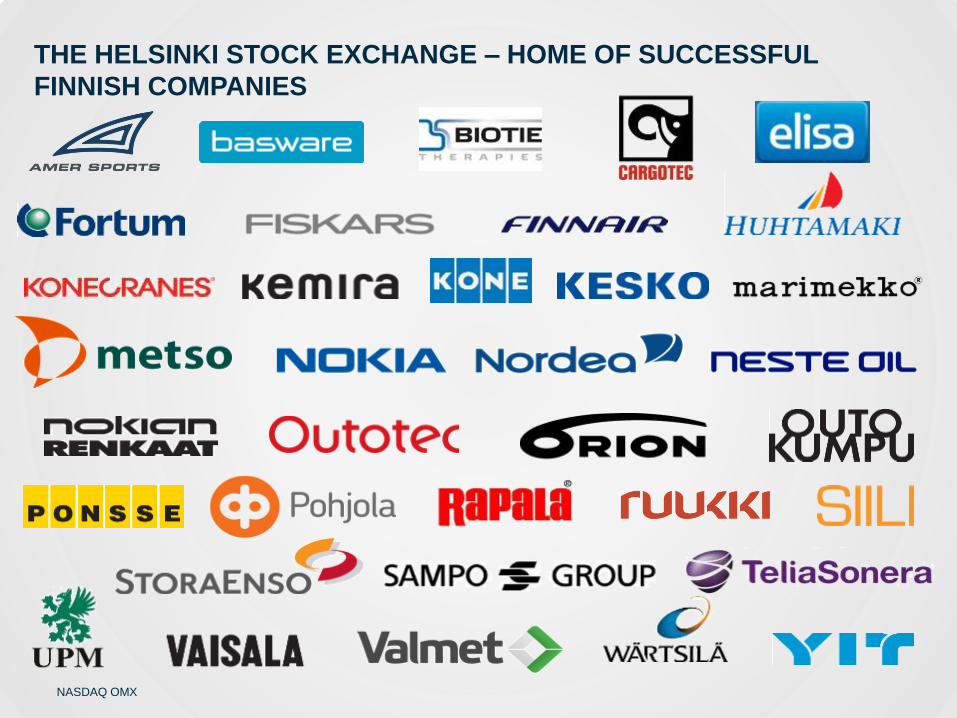
THE HELSINKI STOCK EXCHANGE – HOME OF SUCCESSFUL
FINNISH COMPANIES
NASDAQ OMX
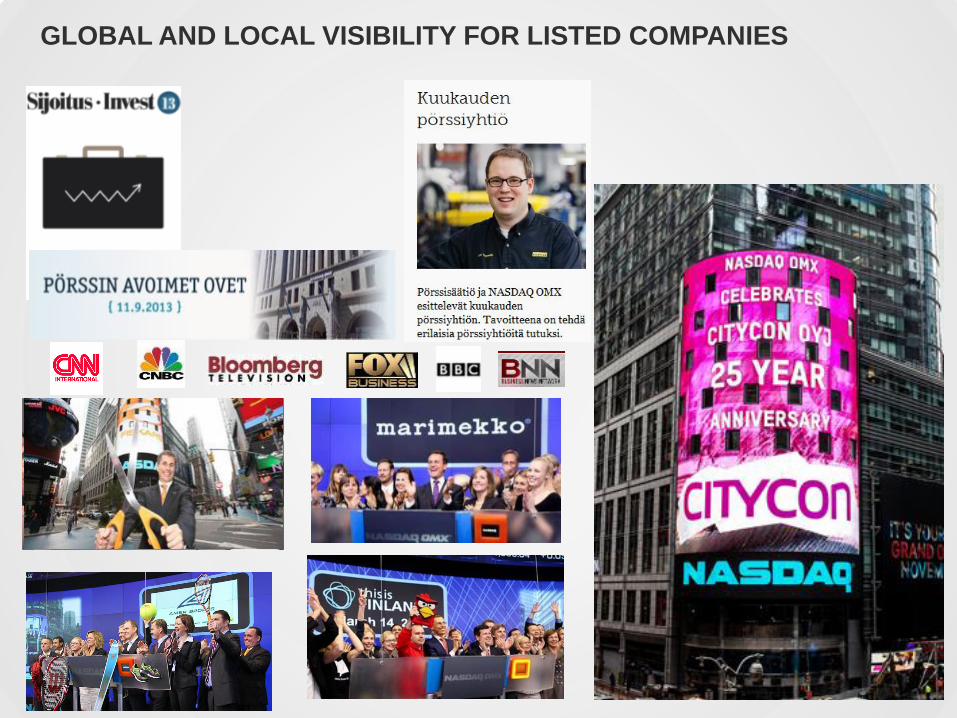
GLOBAL AND LOCAL VISIBILITY FOR LISTED COMPANIES
.
13
NASDAQ OMX
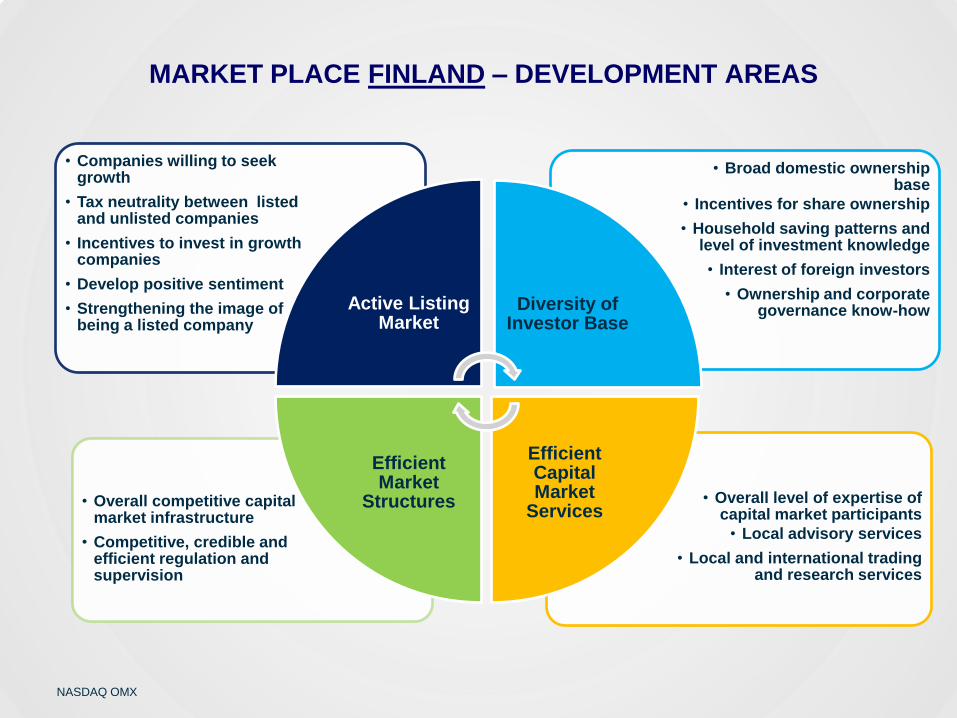
• Overall level of expertise of capital market participants
• Local advisory services
• Local and international trading and research services
• Overall competitive capital market infrastructure
• Competitive, credible and efficient regulation and supervision
• Broad domestic ownership base
• Incentives for share ownership
• Household saving patterns and level of investment knowledge
• Interest of foreign investors
• Ownership and corporate governance know-how
• Companies willing to seek growth
• Tax neutrality between listed and unlisted companies
• Incentives to invest in growth companies
• Develop positive sentiment
• Strengthening the image of being a listed company
Active Listing Market
Diversity of Investor Base
Efficient Capital Market
Services
Efficient Market
Structures
MARKET PLACE FINLAND – DEVELOPMENT AREAS
NASDAQ OMX
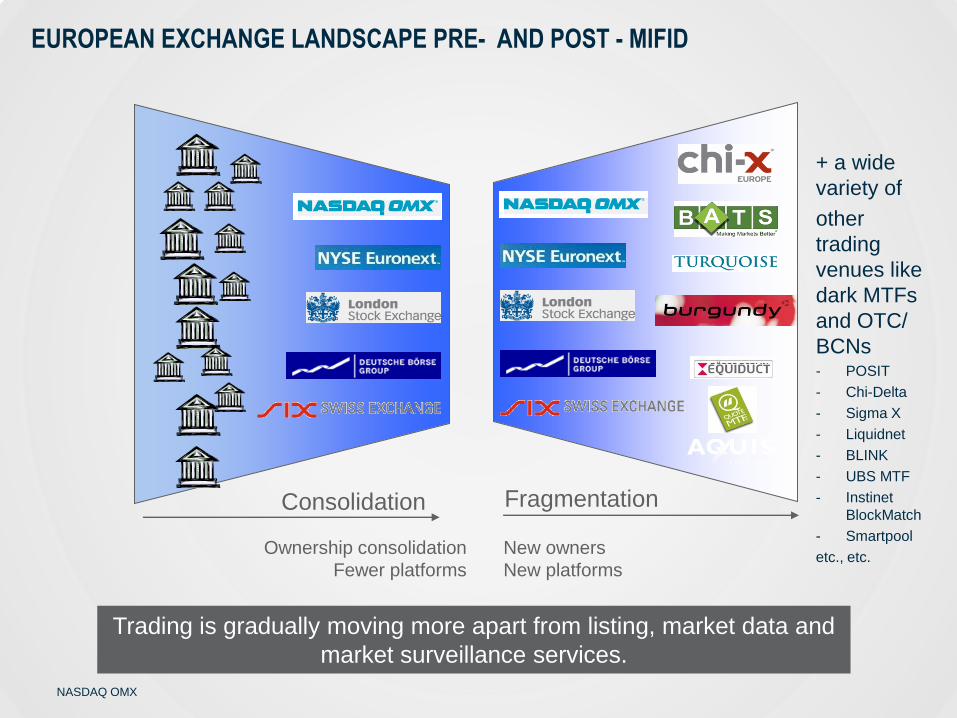
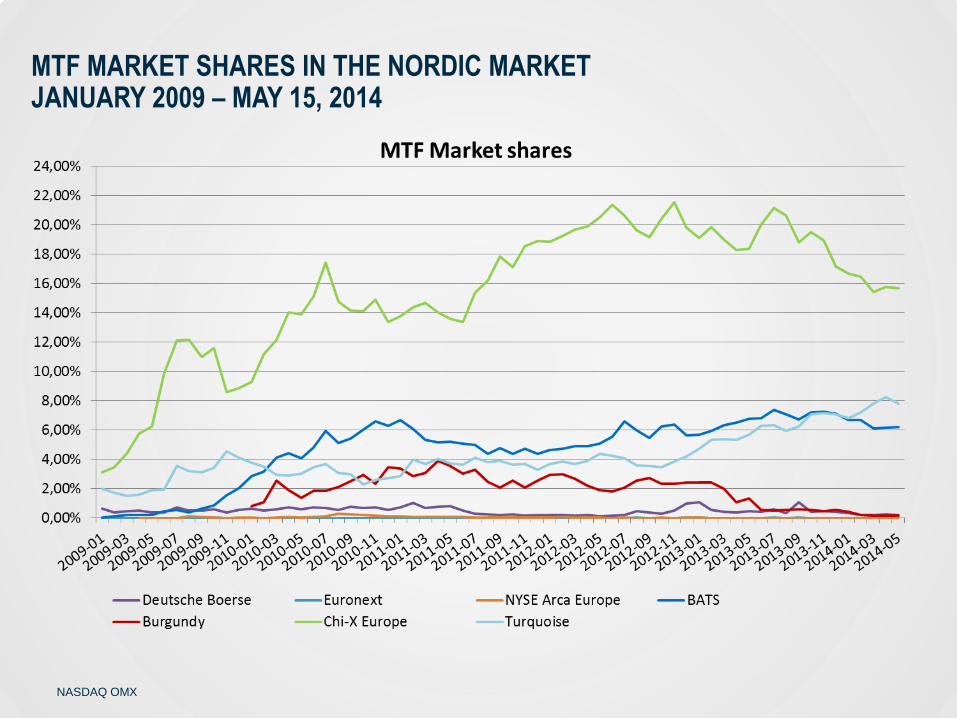
Trading is gradually moving more apart from listing, market data and
market surveillance services.
EUROPEAN EXCHANGE LANDSCAPE PRE- AND POST - MIFID
Consolidation
Ownership consolidation
Fewer platforms
New owners
New platforms
Fragmentation
+ a wide
variety of
other
trading
venues like
dark MTFs
and OTC/
BCNs - POSIT
- Chi-Delta
- Sigma X
- Liquidnet
- BLINK
- UBS MTF
- Instinet
BlockMatch
- Smartpool
etc., etc.
NASDAQ OMX
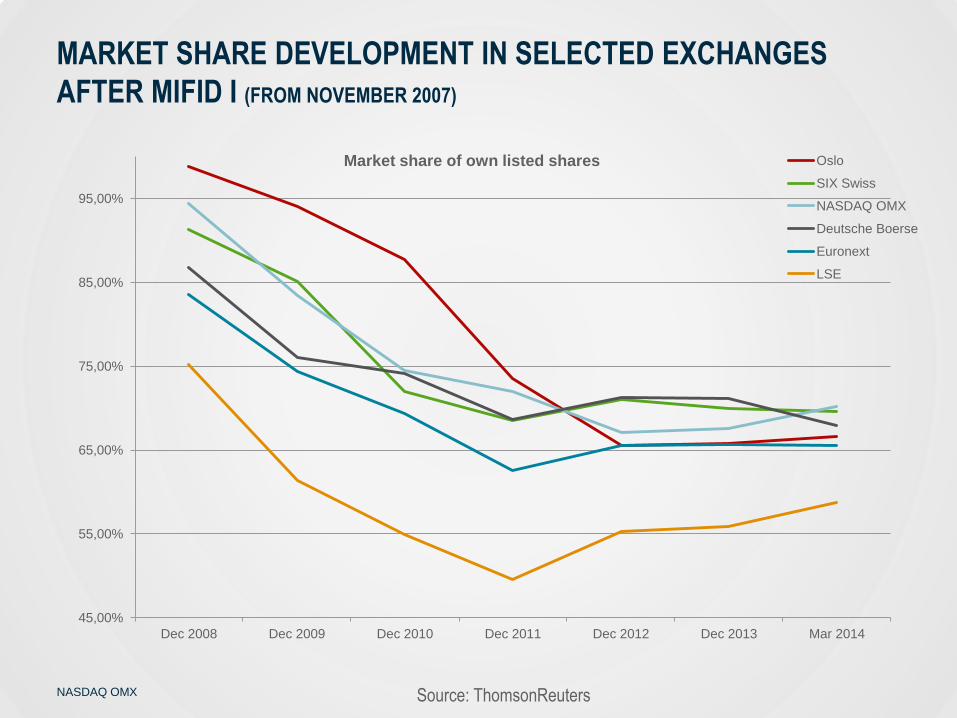
45,00%
55,00%
65,00%
75,00%
85,00%
95,00%
Dec 2008 Dec 2009 Dec 2010 Dec 2011 Dec 2012 Dec 2013 Mar 2014
Market share of own listed shares Oslo
SIX Swiss
NASDAQ OMX
Deutsche Boerse
Euronext
LSE
MARKET SHARE DEVELOPMENT IN SELECTED EXCHANGES
AFTER MIFID I (FROM NOVEMBER 2007)
Source: ThomsonReuters
NASDAQ OMX
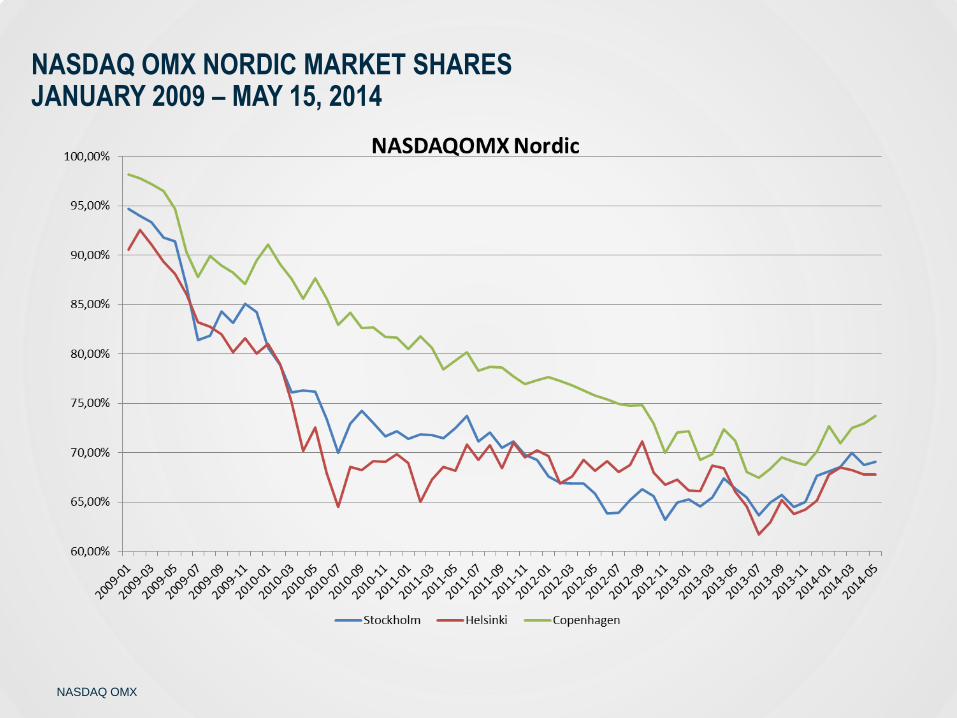
NASDAQ OMX NORDIC MARKET SHARES JANUARY 2009 – MAY 15, 2014
NASDAQ OMX
MTF MARKET SHARES IN THE NORDIC MARKET JANUARY 2009 – MAY 15, 2014
NASDAQ OMX
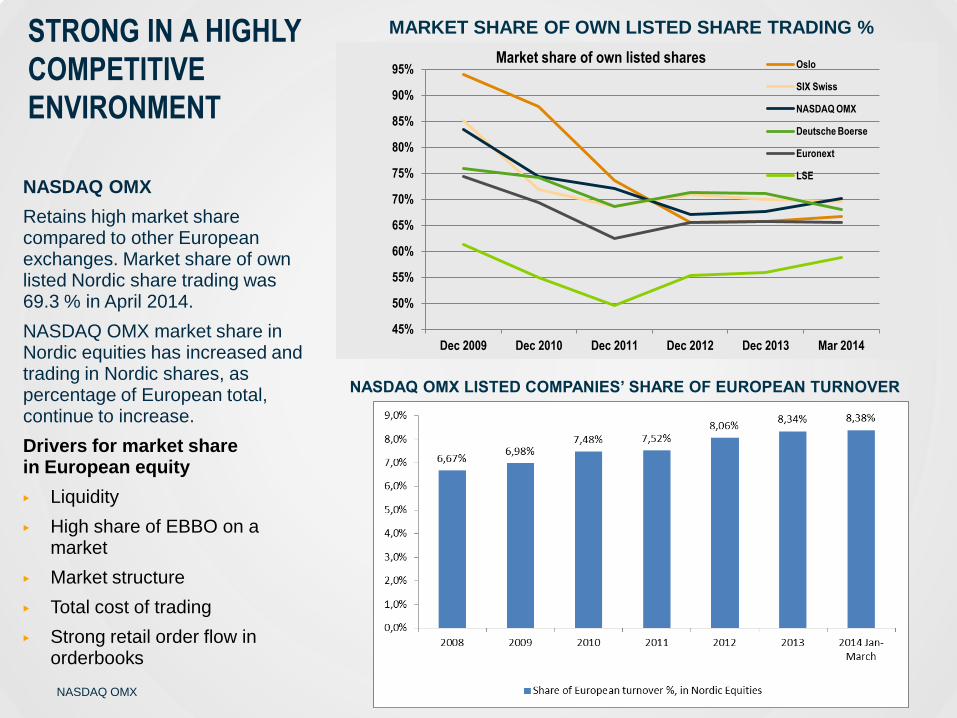
STRONG IN A HIGHLY
COMPETITIVE
ENVIRONMENT
NASDAQ OMX
Retains high market share compared to other European exchanges. Market share of own listed Nordic share trading was 69.3 % in April 2014.
NASDAQ OMX market share in Nordic equities has increased and trading in Nordic shares, as percentage of European total, continue to increase.
Drivers for market share in European equity
▶ Liquidity
▶ High share of EBBO on a market
▶ Market structure
▶ Total cost of trading
▶ Strong retail order flow in orderbooks
MARKET SHARE OF OWN LISTED SHARE TRADING %
NASDAQ OMX LISTED COMPANIES’ SHARE OF EUROPEAN TURNOVER
45%
50%
55%
60%
65%
70%
75%
80%
85%
90%
95%
Dec 2009 Dec 2010 Dec 2011 Dec 2012 Dec 2013 Mar 2014
Market share of own listed shares Oslo
SIX Swiss
NASDAQ OMX
Deutsche Boerse
Euronext
LSE
NASDAQ OMX
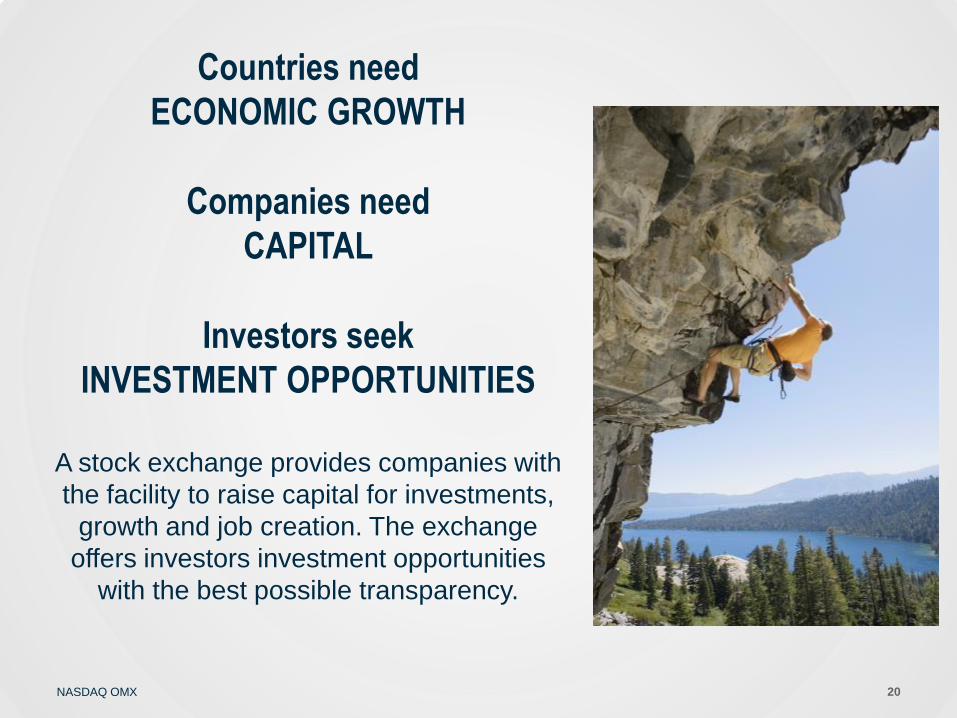
Countries need
ECONOMIC GROWTH
Companies need
CAPITAL
Investors seek
INVESTMENT OPPORTUNITIES
A stock exchange provides companies with
the facility to raise capital for investments,
growth and job creation. The exchange
offers investors investment opportunities
with the best possible transparency.
20
NASDAQ OMX
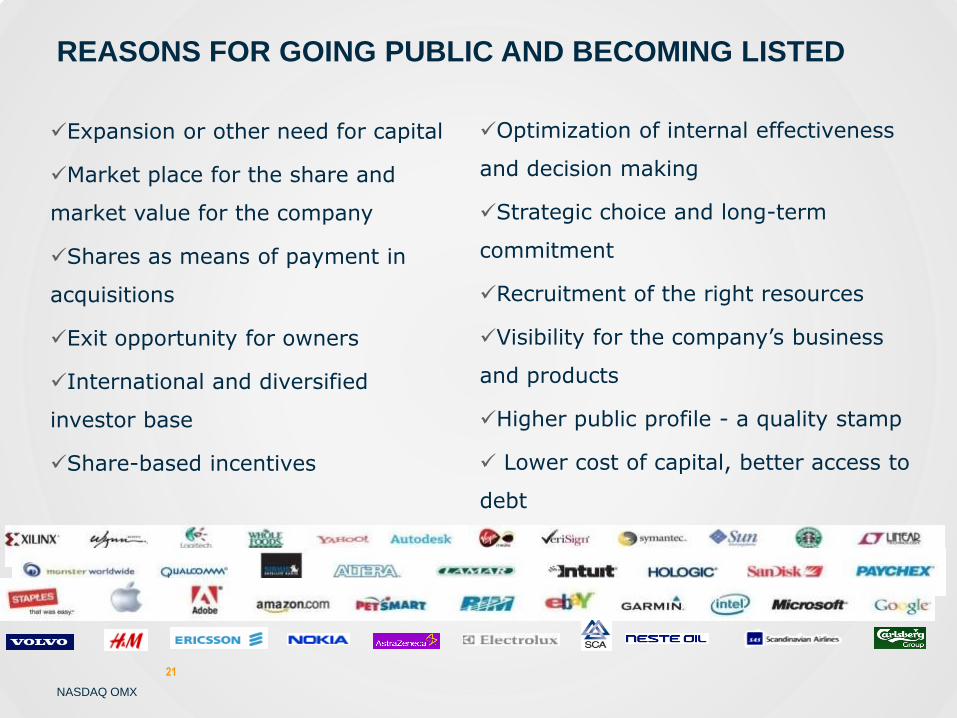
REASONS FOR GOING PUBLIC AND BECOMING LISTED
Expansion or other need for capital
Market place for the share and
market value for the company
Shares as means of payment in
acquisitions
Exit opportunity for owners
International and diversified
investor base
Share-based incentives
Optimization of internal effectiveness
and decision making
Strategic choice and long-term
commitment
Recruitment of the right resources
Visibility for the company’s business
and products
Higher public profile - a quality stamp
Lower cost of capital, better access to
debt
21
NASDAQ OMX
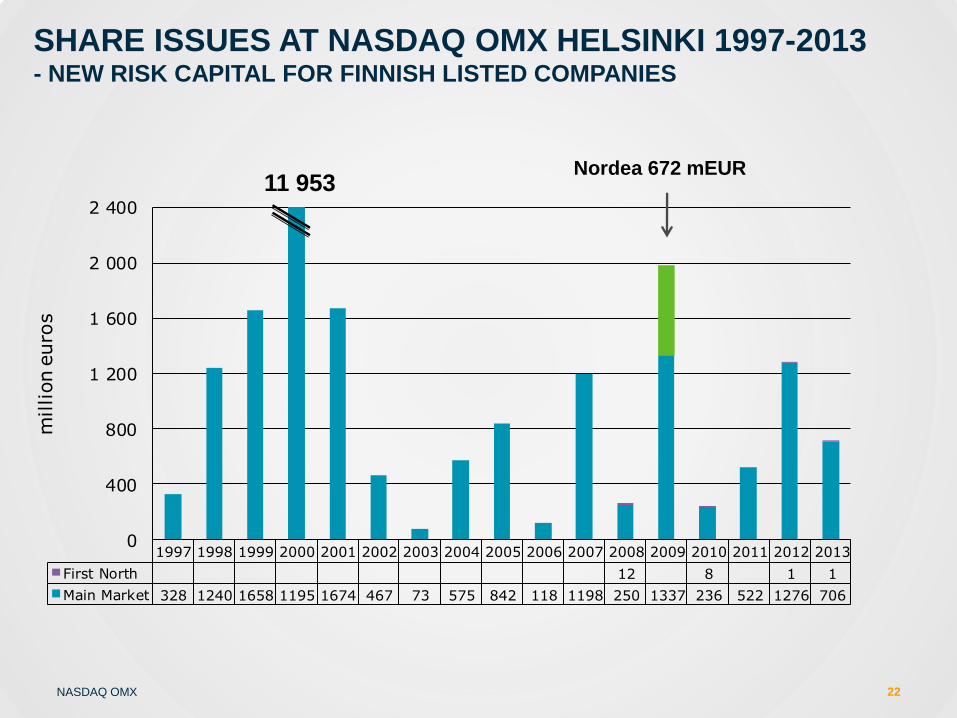
SHARE ISSUES AT NASDAQ OMX HELSINKI 1997-2013 - NEW RISK CAPITAL FOR FINNISH LISTED COMPANIES
1997 1998 1999 2000 2001 2002 2003 2004 2005 2006 2007 2008 2009 2010 2011 2012 2013
First North 12 8 1 1
Main Market 328 1240 1658 1195 1674 467 73 575 842 118 1198 250 1337 236 522 1276 706
0
400
800
1 200
1 600
2 000
2 400
million e
uro
s
11 953 Nordea 672 mEUR
22
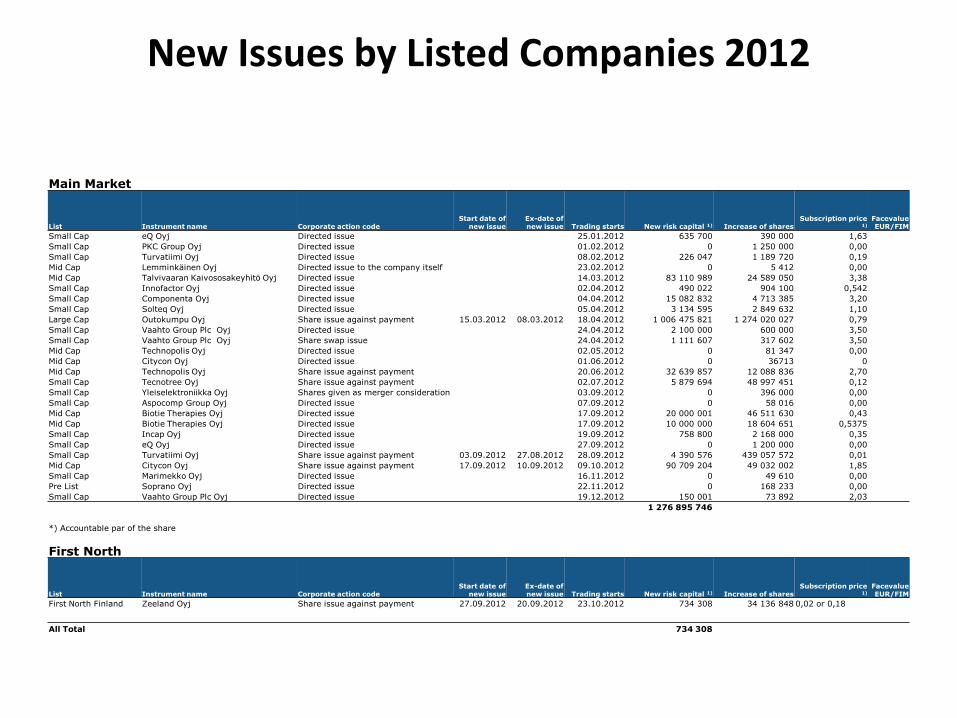
New Issues by Listed Companies 2012
Main Market
List Instrument name Corporate action code Start date of
new issue Ex-date of new issue Trading starts New risk capital 1) Increase of shares
Subscription price 1)
Facevalue EUR/FIM
Small Cap eQ Oyj Directed issue 25.01.2012 635 700 390 000 1,63
Small Cap PKC Group Oyj Directed issue 01.02.2012 0 1 250 000 0,00
Small Cap Turvatiimi Oyj Directed issue 08.02.2012 226 047 1 189 720 0,19
Mid Cap Lemminkäinen Oyj Directed issue to the company itself 23.02.2012 0 5 412 0,00
Mid Cap Talvivaaran Kaivososakeyhitö Oyj Directed issue 14.03.2012 83 110 989 24 589 050 3,38
Small Cap Innofactor Oyj Directed issue 02.04.2012 490 022 904 100 0,542
Small Cap Componenta Oyj Directed issue 04.04.2012 15 082 832 4 713 385 3,20
Small Cap Solteq Oyj Directed issue 05.04.2012 3 134 595 2 849 632 1,10
Large Cap Outokumpu Oyj Share issue against payment 15.03.2012 08.03.2012 18.04.2012 1 006 475 821 1 274 020 027 0,79
Small Cap Vaahto Group Plc Oyj Directed issue 24.04.2012 2 100 000 600 000 3,50
Small Cap Vaahto Group Plc Oyj Share swap issue 24.04.2012 1 111 607 317 602 3,50
Mid Cap Technopolis Oyj Directed issue 02.05.2012 0 81 347 0,00
Mid Cap Citycon Oyj Directed issue 01.06.2012 0 36713 0
Mid Cap Technopolis Oyj Share issue against payment 20.06.2012 32 639 857 12 088 836 2,70
Small Cap Tecnotree Oyj Share issue against payment 02.07.2012 5 879 694 48 997 451 0,12
Small Cap Yleiselektroniikka Oyj Shares given as merger consideration 03.09.2012 0 396 000 0,00
Small Cap Aspocomp Group Oyj Directed issue 07.09.2012 0 58 016 0,00
Mid Cap Biotie Therapies Oyj Directed issue 17.09.2012 20 000 001 46 511 630 0,43
Mid Cap Biotie Therapies Oyj Directed issue 17.09.2012 10 000 000 18 604 651 0,5375
Small Cap Incap Oyj Directed issue 19.09.2012 758 800 2 168 000 0,35
Small Cap eQ Oyj Directed issue 27.09.2012 0 1 200 000 0,00
Small Cap Turvatiimi Oyj Share issue against payment 03.09.2012 27.08.2012 28.09.2012 4 390 576 439 057 572 0,01
Mid Cap Citycon Oyj Share issue against payment 17.09.2012 10.09.2012 09.10.2012 90 709 204 49 032 002 1,85
Small Cap Marimekko Oyj Directed issue 16.11.2012 0 49 610 0,00
Pre List Soprano Oyj Directed issue 22.11.2012 0 168 233 0,00
Small Cap Vaahto Group Plc Oyj Directed issue 19.12.2012 150 001 73 892 2,03
1 276 895 746
*) Accountable par of the share
First North
List Instrument name Corporate action code Start date of
new issue Ex-date of new issue Trading starts New risk capital 1) Increase of shares
Subscription price 1)
Facevalue EUR/FIM
First North Finland Zeeland Oyj Share issue against payment 27.09.2012 20.09.2012 23.10.2012 734 308 34 136 848 0,02 or 0,18
All Total 734 308
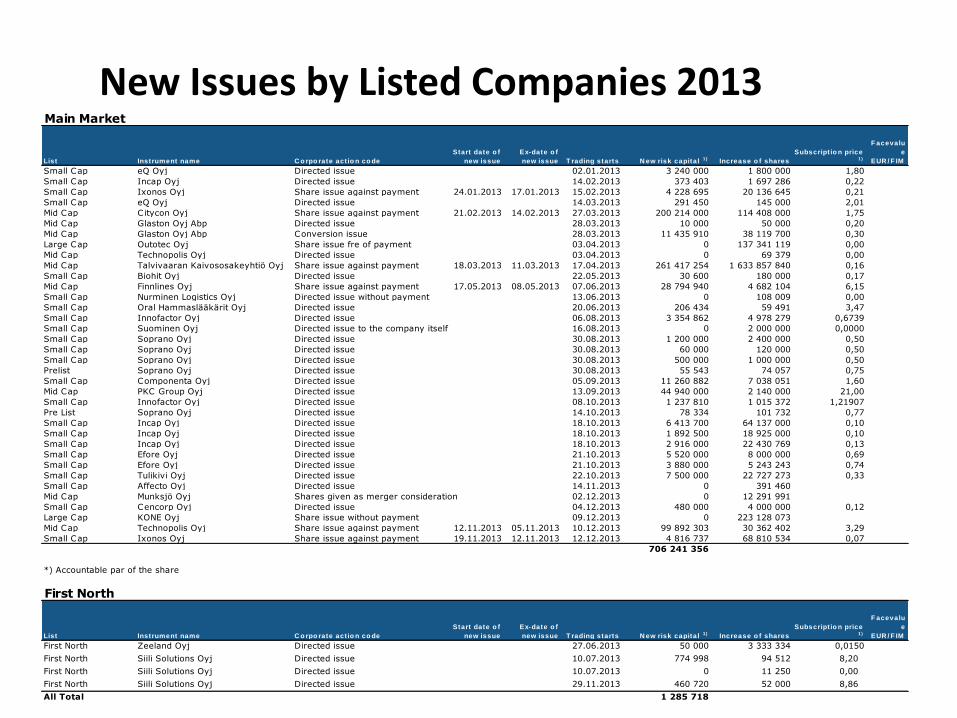
Main Market
List Instrument name C o rpo rate act io n co de
Start date o f
new issue
Ex-date o f
new issue T rading starts N ew risk capital 1) Increase o f shares
Subscript io n price 1)
F acevalu
e
EUR / F IM
Small Cap eQ Oyj Directed issue 02.01.2013 3 240 000 1 800 000 1,80
Small Cap Incap Oyj Directed issue 14.02.2013 373 403 1 697 286 0,22
Small Cap Ixonos Oyj Share issue against payment 24.01.2013 17.01.2013 15.02.2013 4 228 695 20 136 645 0,21
Small Cap eQ Oyj Directed issue 14.03.2013 291 450 145 000 2,01
Mid Cap Citycon Oyj Share issue against payment 21.02.2013 14.02.2013 27.03.2013 200 214 000 114 408 000 1,75
Mid Cap Glaston Oyj Abp Directed issue 28.03.2013 10 000 50 000 0,20
Mid Cap Glaston Oyj Abp Conversion issue 28.03.2013 11 435 910 38 119 700 0,30
Large Cap Outotec Oyj Share issue fre of payment 03.04.2013 0 137 341 119 0,00
Mid Cap Technopolis Oyj Directed issue 03.04.2013 0 69 379 0,00
Mid Cap Talvivaaran Kaivososakeyhtiö Oyj Share issue against payment 18.03.2013 11.03.2013 17.04.2013 261 417 254 1 633 857 840 0,16
Small Cap Biohit Oyj Directed issue 22.05.2013 30 600 180 000 0,17
Mid Cap Finnlines Oyj Share issue against payment 17.05.2013 08.05.2013 07.06.2013 28 794 940 4 682 104 6,15
Small Cap Nurminen Logistics Oyj Directed issue without payment 13.06.2013 0 108 009 0,00
Small Cap Oral Hammaslääkärit Oyj Directed issue 20.06.2013 206 434 59 491 3,47
Small Cap Innofactor Oyj Directed issue 06.08.2013 3 354 862 4 978 279 0,6739
Small Cap Suominen Oyj Directed issue to the company itself 16.08.2013 0 2 000 000 0,0000
Small Cap Soprano Oyj Directed issue 30.08.2013 1 200 000 2 400 000 0,50
Small Cap Soprano Oyj Directed issue 30.08.2013 60 000 120 000 0,50
Small Cap Soprano Oyj Directed issue 30.08.2013 500 000 1 000 000 0,50
Prelist Soprano Oyj Directed issue 30.08.2013 55 543 74 057 0,75
Small Cap Componenta Oyj Directed issue 05.09.2013 11 260 882 7 038 051 1,60
Mid Cap PKC Group Oyj Directed issue 13.09.2013 44 940 000 2 140 000 21,00
Small Cap Innofactor Oyj Directed issue 08.10.2013 1 237 810 1 015 372 1,21907
Pre List Soprano Oyj Directed issue 14.10.2013 78 334 101 732 0,77
Small Cap Incap Oyj Directed issue 18.10.2013 6 413 700 64 137 000 0,10
Small Cap Incap Oyj Directed issue 18.10.2013 1 892 500 18 925 000 0,10
Small Cap Incap Oyj Directed issue 18.10.2013 2 916 000 22 430 769 0,13
Small Cap Efore Oyj Directed issue 21.10.2013 5 520 000 8 000 000 0,69
Small Cap Efore Oyj Directed issue 21.10.2013 3 880 000 5 243 243 0,74
Small Cap Tulikivi Oyj Directed issue 22.10.2013 7 500 000 22 727 273 0,33
Small Cap Affecto Oyj Directed issue 14.11.2013 0 391 460
Mid Cap Munksjö Oyj Shares given as merger consideration 02.12.2013 0 12 291 991
Small Cap Cencorp Oyj Directed issue 04.12.2013 480 000 4 000 000 0,12
Large Cap KONE Oyj Share issue without payment 09.12.2013 0 223 128 073
Mid Cap Technopolis Oyj Share issue against payment 12.11.2013 05.11.2013 10.12.2013 99 892 303 30 362 402 3,29
Small Cap Ixonos Oyj Share issue against payment 19.11.2013 12.11.2013 12.12.2013 4 816 737 68 810 534 0,07
706 241 356
*) Accountable par of the share
First North
List Instrument name C o rpo rate act io n co de
Start date o f
new issue
Ex-date o f
new issue T rading starts N ew risk capital 1) Increase o f shares
Subscript io n price 1)
F acevalu
e
EUR / F IM
First North Zeeland Oyj Directed issue 27.06.2013 50 000 3 333 334 0,0150
First North Siili Solutions Oyj Directed issue 10.07.2013 774 998 94 512 8,20
First North Siili Solutions Oyj Directed issue 10.07.2013 0 11 250 0,00
First North Siili Solutions Oyj Directed issue 29.11.2013 460 720 52 000 8,86
All Total 1 285 718
New Issues by Listed Companies 2013
NASDAQ OMX
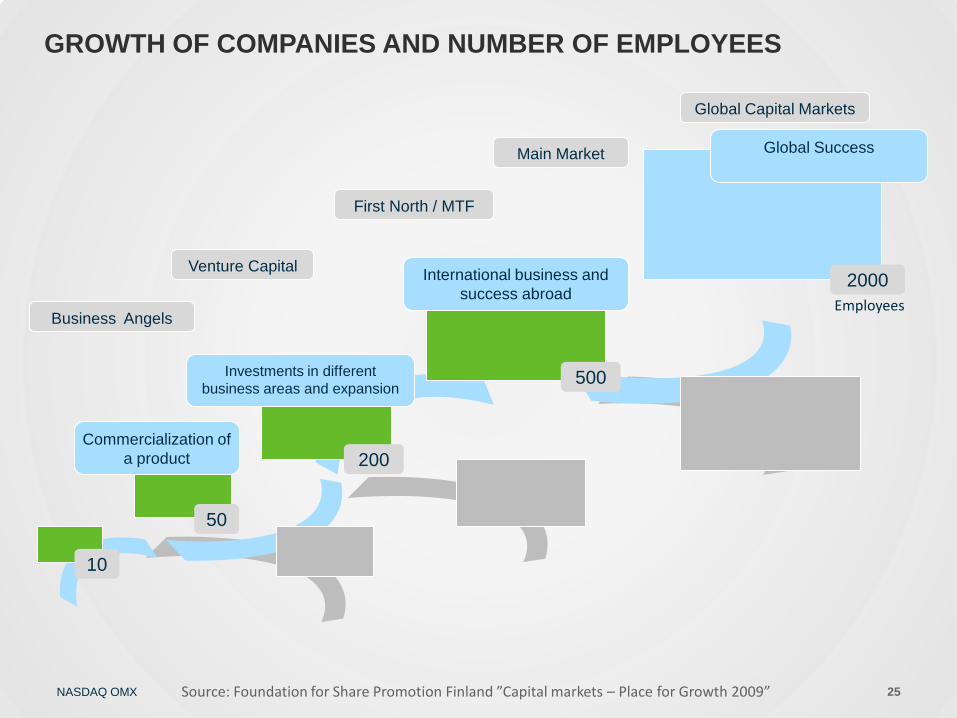
GROWTH OF COMPANIES AND NUMBER OF EMPLOYEES
Global Success
10
Employees
Commercialization of
a product
International business and
success abroad
Investments in different
business areas and expansion
Business Angels
Venture Capital
First North / MTF
Main Market
Global Capital Markets
50
200
500
2000
Source: Foundation for Share Promotion Finland ”Capital markets – Place for Growth 2009” 25
NASDAQ OMX
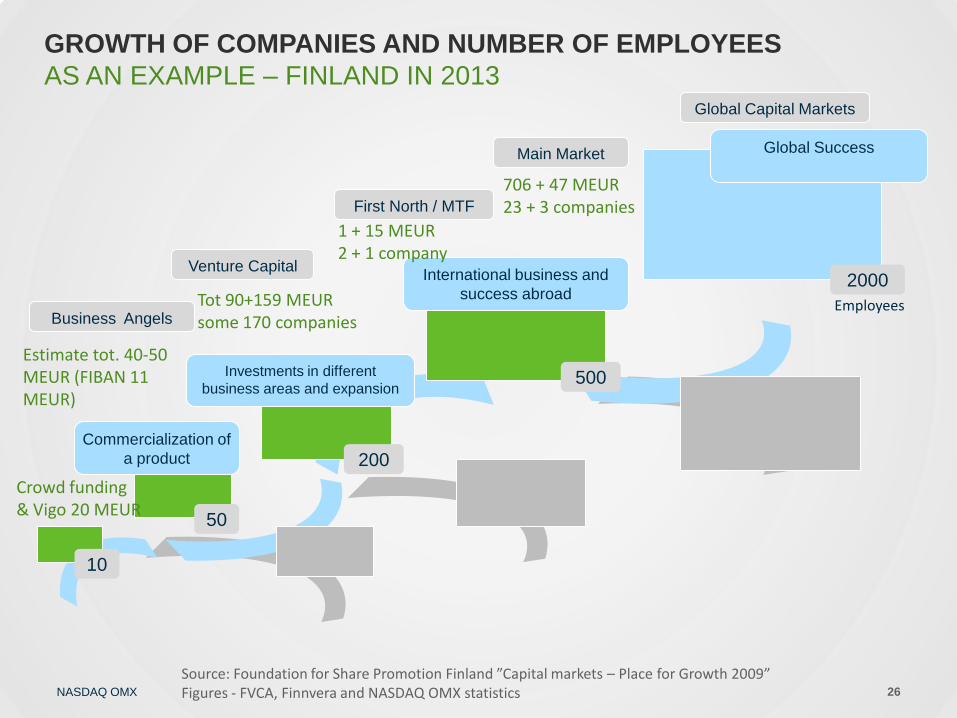
GROWTH OF COMPANIES AND NUMBER OF EMPLOYEES
AS AN EXAMPLE – FINLAND IN 2013
Global Success
10
Employees
Commercialization of
a product
International business and
success abroad
Investments in different
business areas and expansion
Business Angels
Venture Capital
First North / MTF
Main Market
Global Capital Markets
50
200
500
2000
Source: Foundation for Share Promotion Finland ”Capital markets – Place for Growth 2009” Figures - FVCA, Finnvera and NASDAQ OMX statistics 26
Tot 90+159 MEUR some 170 companies
1 + 15 MEUR 2 + 1 company
706 + 47 MEUR 23 + 3 companies
Crowd funding & Vigo 20 MEUR
Estimate tot. 40-50 MEUR (FIBAN 11 MEUR)
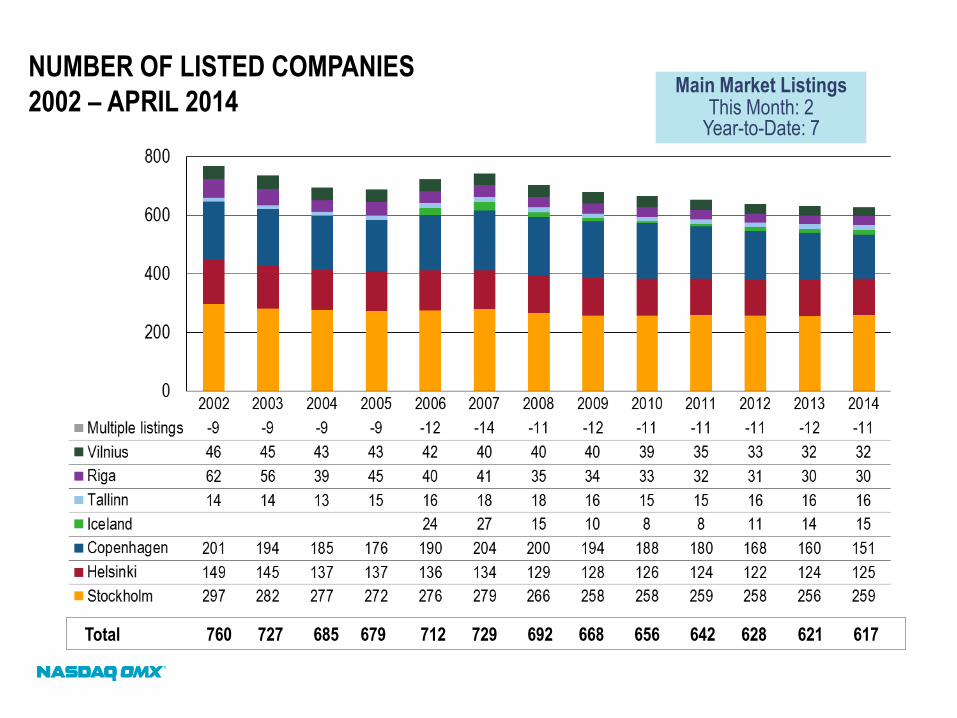
NUMBER OF LISTED COMPANIES
2002 – APRIL 2014
Total 760 727 685 679 712 729 692 668 656 642 628 621 617
Main Market Listings This Month: 2
Year-to-Date: 7
NASDAQ OMX
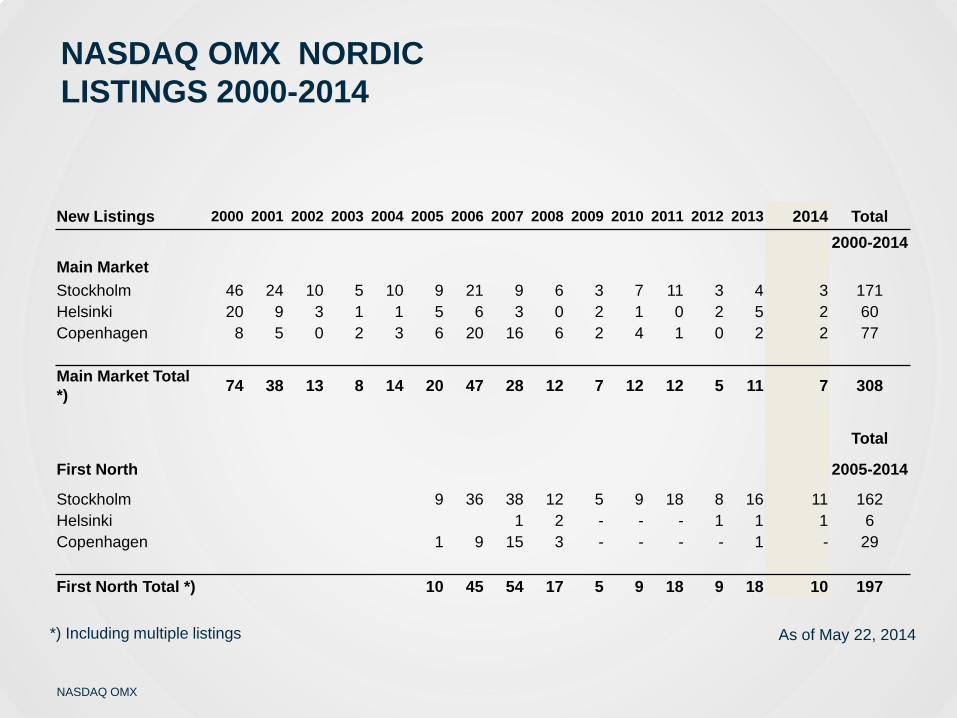
New Listings 2000 2001 2002 2003 2004 2005 2006 2007 2008 2009 2010 2011 2012 2013 2014 Total
2000-2014
Main Market
Stockholm 46 24 10 5 10 9 21 9 6 3 7 11 3 4 3 171
Helsinki 20 9 3 1 1 5 6 3 0 2 1 0 2 5 2 60
Copenhagen 8 5 0 2 3 6 20 16 6 2 4 1 0 2 2 77
Main Market Total
*) 74 38 13 8 14 20 47 28 12 7 12 12 5 11 7 308
Total
First North 2005-2014
Stockholm 9 36 38 12 5 9 18 8 16 11 162
Helsinki 1 2 - - - 1 1 1 6
Copenhagen 1 9 15 3 - - - - 1 - 29
First North Total *) 10 45 54 17 5 9 18 9 18 10 197
*) Including multiple listings As of May 22, 2014
NASDAQ OMX NORDIC
LISTINGS 2000-2014
NASDAQ OMX
FIRST NORTH COMPANIES SIGNIFICANTLY GROW ON OUR MARKET MORE THAN 30 COMPANIES HAVE ALREADY MOVED FROM FIRST NORTH TO MAIN MARKET
NASDAQ OMX
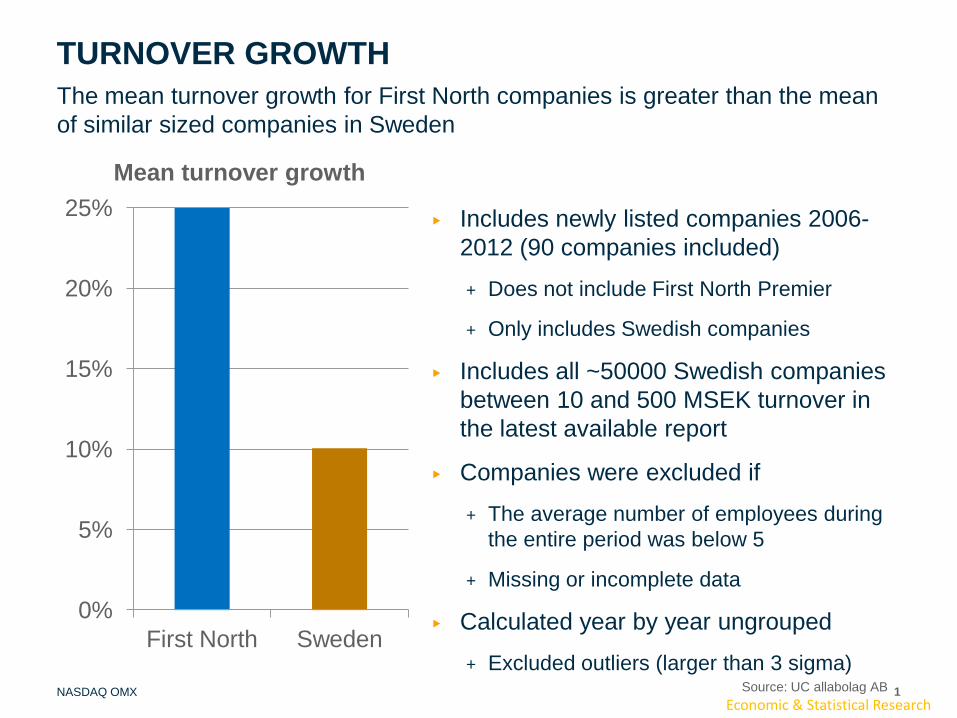
TURNOVER GROWTH
1
The mean turnover growth for First North companies is greater than the mean
of similar sized companies in Sweden
Economic & Statistical Research Source: UC allabolag AB
▶ Includes newly listed companies 2006-
2012 (90 companies included)
+ Does not include First North Premier
+ Only includes Swedish companies
▶ Includes all ~50000 Swedish companies
between 10 and 500 MSEK turnover in
the latest available report
▶ Companies were excluded if
+ The average number of employees during
the entire period was below 5
+ Missing or incomplete data
▶ Calculated year by year ungrouped
+ Excluded outliers (larger than 3 sigma)
0%
5%
10%
15%
20%
25%
First North Sweden
Mean turnover growth
NASDAQ OMX
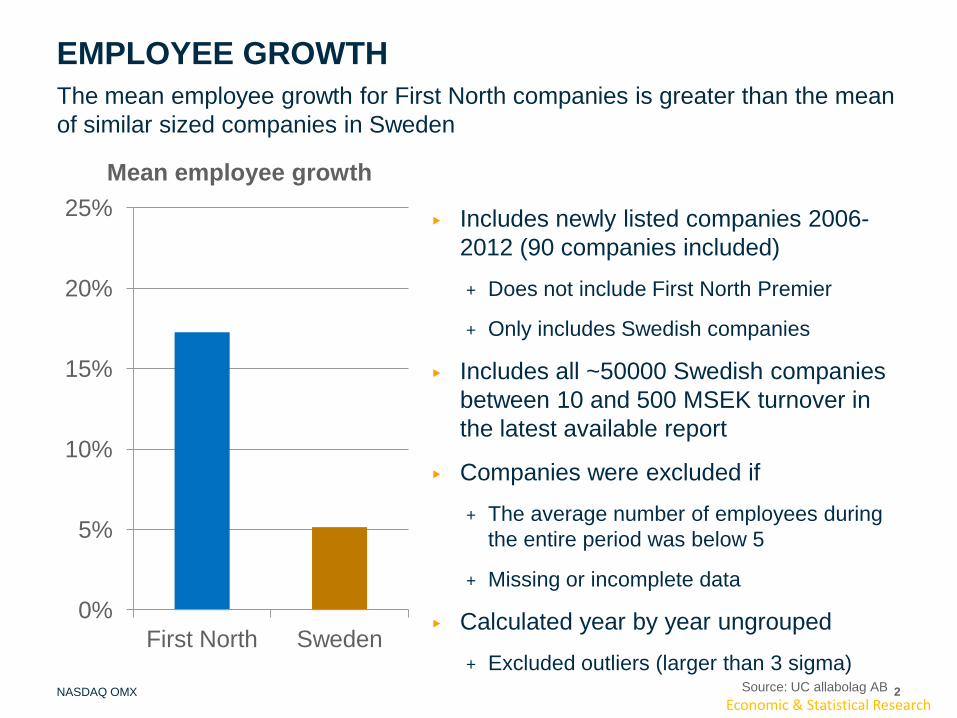
EMPLOYEE GROWTH
2
The mean employee growth for First North companies is greater than the mean
of similar sized companies in Sweden
Economic & Statistical Research Source: UC allabolag AB
▶ Includes newly listed companies 2006-
2012 (90 companies included)
+ Does not include First North Premier
+ Only includes Swedish companies
▶ Includes all ~50000 Swedish companies
between 10 and 500 MSEK turnover in
the latest available report
▶ Companies were excluded if
+ The average number of employees during
the entire period was below 5
+ Missing or incomplete data
▶ Calculated year by year ungrouped
+ Excluded outliers (larger than 3 sigma)
0%
5%
10%
15%
20%
25%
First North Sweden
Mean employee growth
NASDAQ OMX
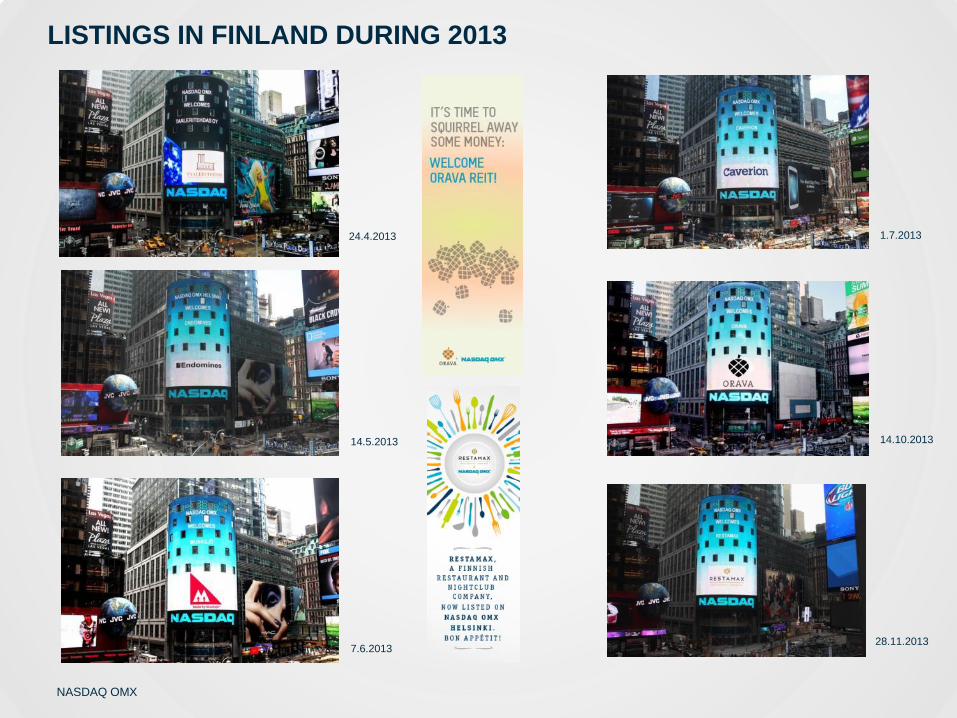
LISTINGS IN FINLAND DURING 2013
24.4.2013
14.5.2013
7.6.2013
1.7.2013
14.10.2013
28.11.2013
NASDAQ OMX
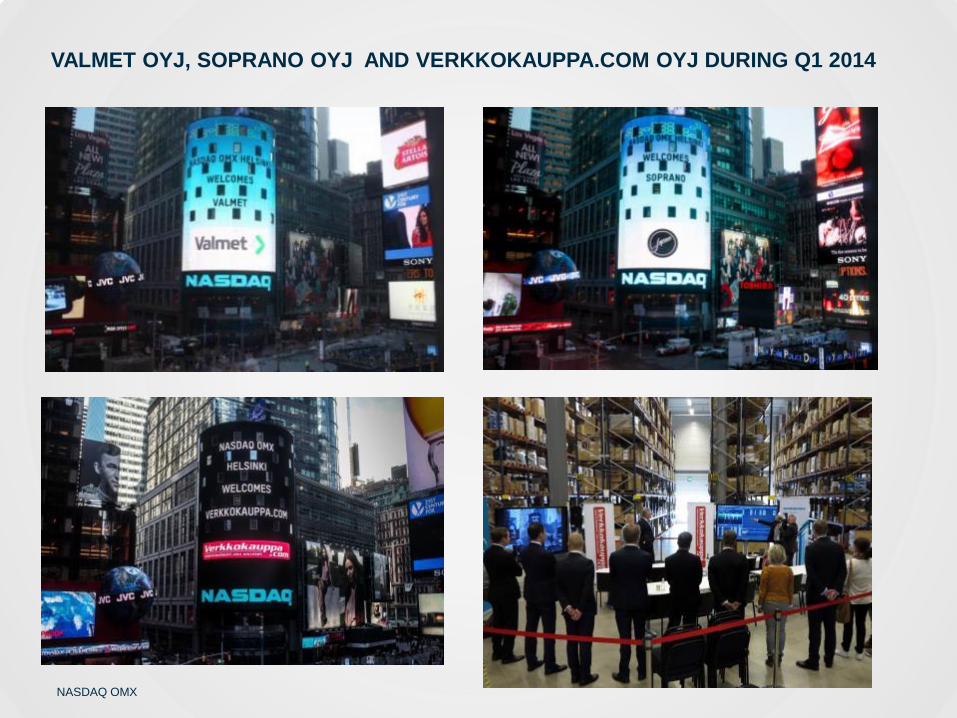
VALMET OYJ, SOPRANO OYJ AND VERKKOKAUPPA.COM OYJ DURING Q1 2014
NASDAQ OMX 34
Economic Growth with IPOs
- An Efficient Listing
Environment is Key to Growth
and Capital Market
Competitiveness in Finland
NASDAQ OMX
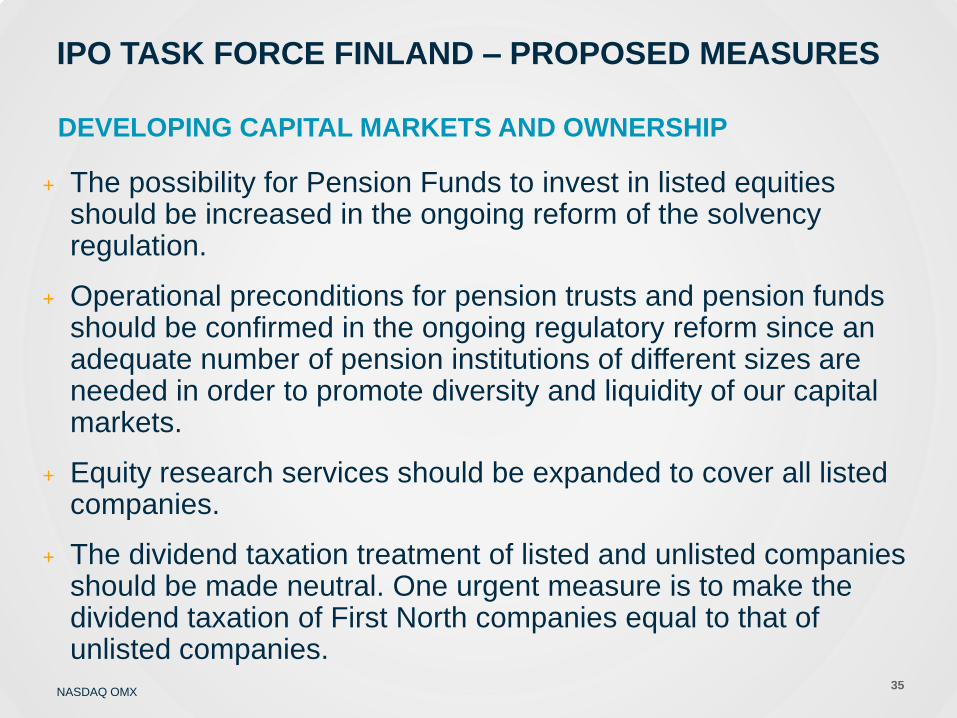
IPO TASK FORCE FINLAND – PROPOSED MEASURES
DEVELOPING CAPITAL MARKETS AND OWNERSHIP
+ The possibility for Pension Funds to invest in listed equities should be increased in the ongoing reform of the solvency regulation.
+ Operational preconditions for pension trusts and pension funds should be confirmed in the ongoing regulatory reform since an adequate number of pension institutions of different sizes are needed in order to promote diversity and liquidity of our capital markets.
+ Equity research services should be expanded to cover all listed companies.
+ The dividend taxation treatment of listed and unlisted companies should be made neutral. One urgent measure is to make the dividend taxation of First North companies equal to that of unlisted companies.
35
NASDAQ OMX
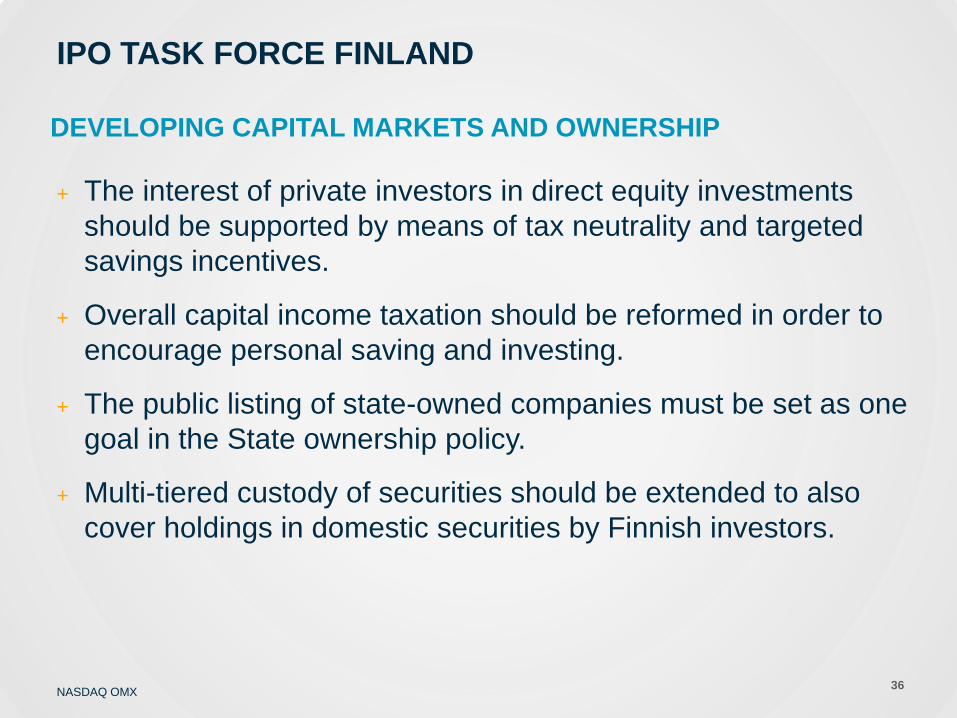
IPO TASK FORCE FINLAND
DEVELOPING CAPITAL MARKETS AND OWNERSHIP
+ The interest of private investors in direct equity investments
should be supported by means of tax neutrality and targeted
savings incentives.
+ Overall capital income taxation should be reformed in order to
encourage personal saving and investing.
+ The public listing of state-owned companies must be set as one
goal in the State ownership policy.
+ Multi-tiered custody of securities should be extended to also
cover holdings in domestic securities by Finnish investors.
36
NASDAQ OMX
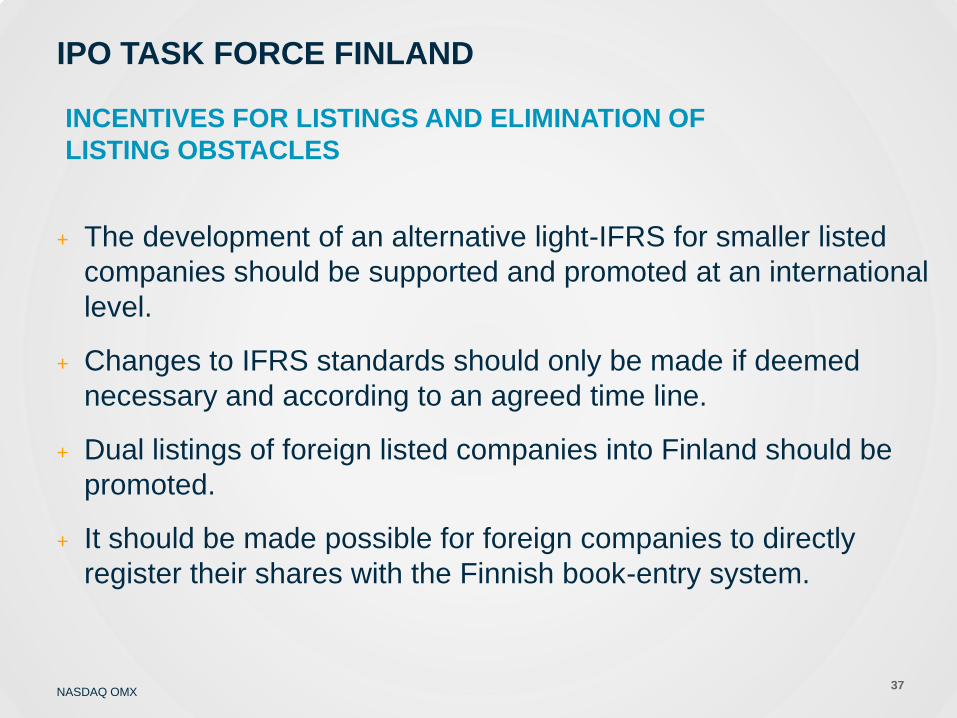
IPO TASK FORCE FINLAND
INCENTIVES FOR LISTINGS AND ELIMINATION OF
LISTING OBSTACLES
+ The development of an alternative light-IFRS for smaller listed
companies should be supported and promoted at an international
level.
+ Changes to IFRS standards should only be made if deemed
necessary and according to an agreed time line.
+ Dual listings of foreign listed companies into Finland should be
promoted.
+ It should be made possible for foreign companies to directly
register their shares with the Finnish book-entry system.
37
NASDAQ OMX
IPO TASK FORCE FINLAND
INCENTIVES FOR LISTINGS AND ELIMINATION OF
LISTING OBSTACLES
+ A handbook for listing candidates should be published also for the
Main Market.
+ The Listing Committee process should be assessed and improved.
+ The requirement for a lead manager statement should be removed
when a lead manager is used in the listing process.
+ The interpretation of Exchange Rules concerning the minimum
number of shareholders should be made more flexible.
+ Awareness of the importance of new listings for company growth
and job creation should be increased.
38
NASDAQ OMX
IPO TASK FORCE FINLAND
LIGHTENING THE REGULATORY BURDEN FOR LISTED COMPANIES
+ Templates containing minimum requirements for Corporate Governance reports should be published.
+ An advisory committee should be formed to specify key situations for regulatory interpretation and to determine whether the regulatory burden of listed companies could be lightened by means of new guidelines. If deemed appropriate, the committee would submit proposals on new guidelines.
+ Evaluate whether the disclosure procedure for stock exchange releases could be simplified by modifying technical requirements.
+ Information to be reported as non-financial information should not be included in the contents of the Financial Statement, so that it will not be subject to external audit.
39
NASDAQ OMX
IPO TASK FORCE FINLAND
LIGHTENING THE REGULATORY BURDEN FOR LISTED COMPANIES
+ It should be assessed if the requirement to audit the full Financial
Statement in Finland can be discontinued in accordance with general
European practices.
+ An effort should be made to reduce the impacts that increase the
regulatory burden brought by the EU-directive proposal on addressing
remuneration and related party transactions at Annual General Meetings
both at an EU level and, if necessary, in the national implementation.
+ The regular disclosure obligation, which is compliant with the
Transparency Directive, should be implemented in Finland without the
adoption of any additional national requirements. As a result, the
statutory requirement for submitting quarterly reports would be omitted
from the legislation.
+ Finland should advocate on an EU-level for broader provisions
concerning the publishing obligations for listed company prospectuses.
40
FIRST NORTH BOND MARKET
SCOPE: CORPORATE BONDS
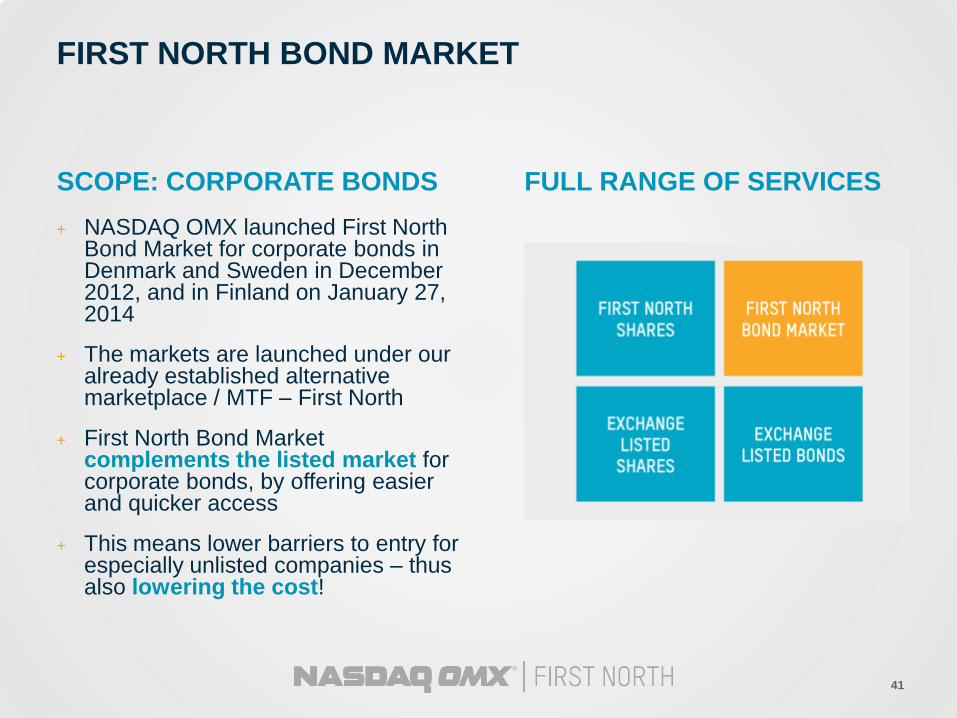
+ NASDAQ OMX launched First North Bond Market for corporate bonds in Denmark and Sweden in December 2012, and in Finland on January 27, 2014
+ The markets are launched under our already established alternative marketplace / MTF – First North
+ First North Bond Market complements the listed market for corporate bonds, by offering easier and quicker access
+ This means lower barriers to entry for especially unlisted companies – thus also lowering the cost!
FULL RANGE OF SERVICES
41
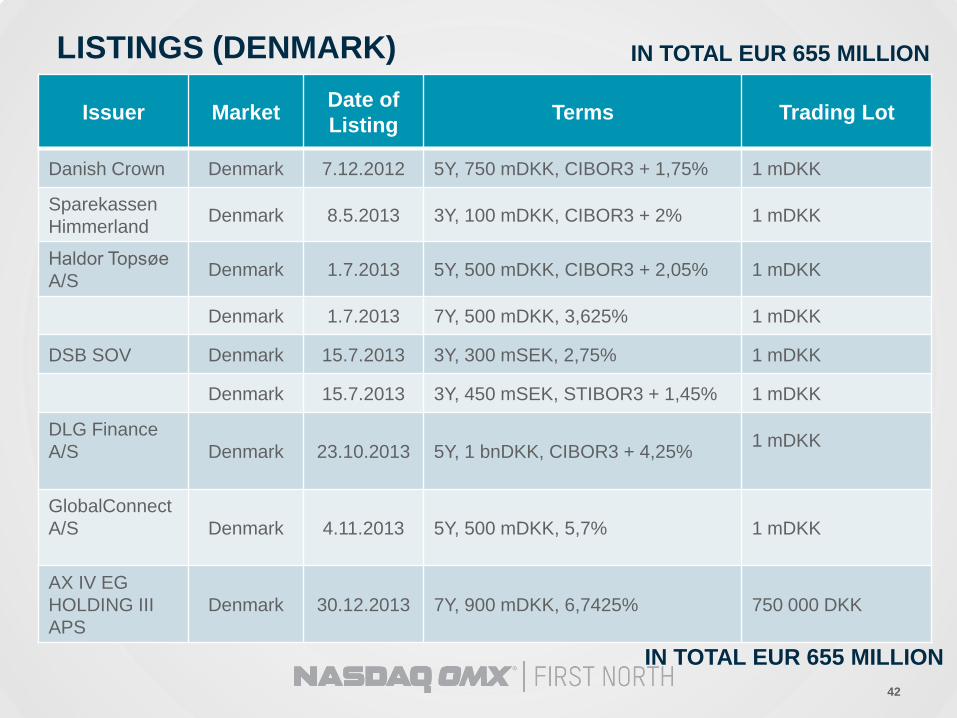
LISTINGS (DENMARK)
42
Issuer Market Date of
Listing Terms Trading Lot
Danish Crown Denmark 7.12.2012 5Y, 750 mDKK, CIBOR3 + 1,75% 1 mDKK
Sparekassen
Himmerland Denmark 8.5.2013 3Y, 100 mDKK, CIBOR3 + 2% 1 mDKK
Haldor Topsøe
A/S Denmark 1.7.2013 5Y, 500 mDKK, CIBOR3 + 2,05% 1 mDKK
Denmark 1.7.2013 7Y, 500 mDKK, 3,625% 1 mDKK
DSB SOV Denmark 15.7.2013 3Y, 300 mSEK, 2,75% 1 mDKK
Denmark 15.7.2013 3Y, 450 mSEK, STIBOR3 + 1,45% 1 mDKK
DLG Finance
A/S
Denmark
23.10.2013
5Y, 1 bnDKK, CIBOR3 + 4,25%
1 mDKK
GlobalConnect
A/S
Denmark 4.11.2013
5Y, 500 mDKK, 5,7%
1 mDKK
AX IV EG
HOLDING III
APS
Denmark 30.12.2013 7Y, 900 mDKK, 6,7425% 750 000 DKK
IN TOTAL EUR 655 MILLION
IN TOTAL EUR 655 MILLION
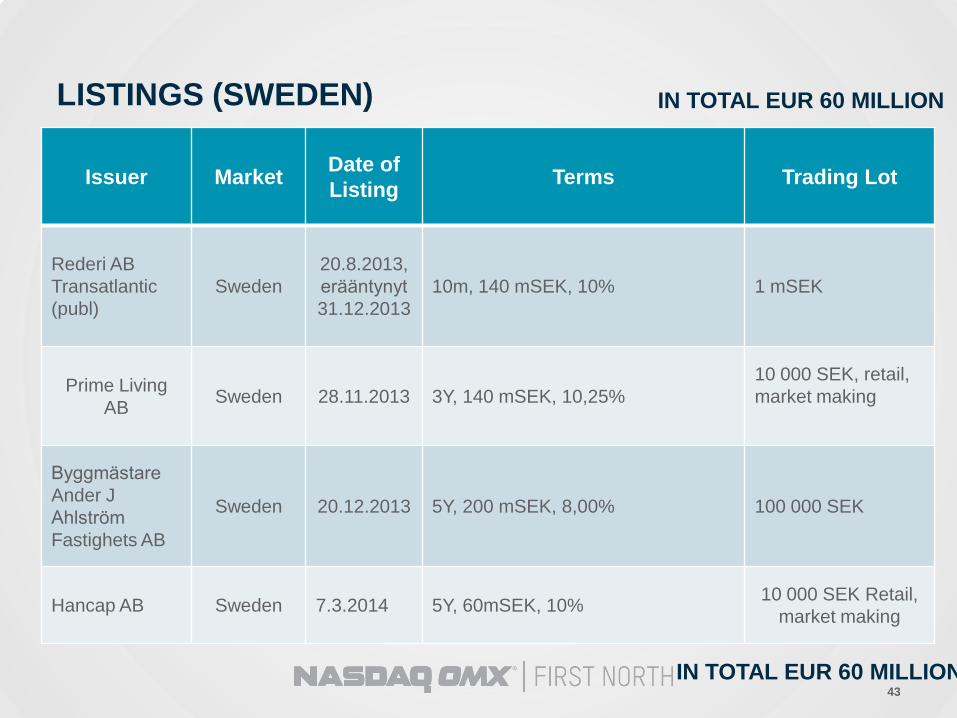
LISTINGS (SWEDEN)
43
Issuer Market Date of
Listing Terms Trading Lot
Rederi AB
Transatlantic
(publ)
Sweden
20.8.2013,
erääntynyt
31.12.2013
10m, 140 mSEK, 10% 1 mSEK
Prime Living
AB
Sweden 28.11.2013 3Y, 140 mSEK, 10,25%
10 000 SEK, retail,
market making
Byggmästare
Ander J
Ahlström
Fastighets AB
Sweden 20.12.2013 5Y, 200 mSEK, 8,00% 100 000 SEK
Hancap AB Sweden 7.3.2014 5Y, 60mSEK, 10% 10 000 SEK Retail,
market making
IN TOTAL EUR 60 MILLION
IN TOTAL EUR 60 MILLION
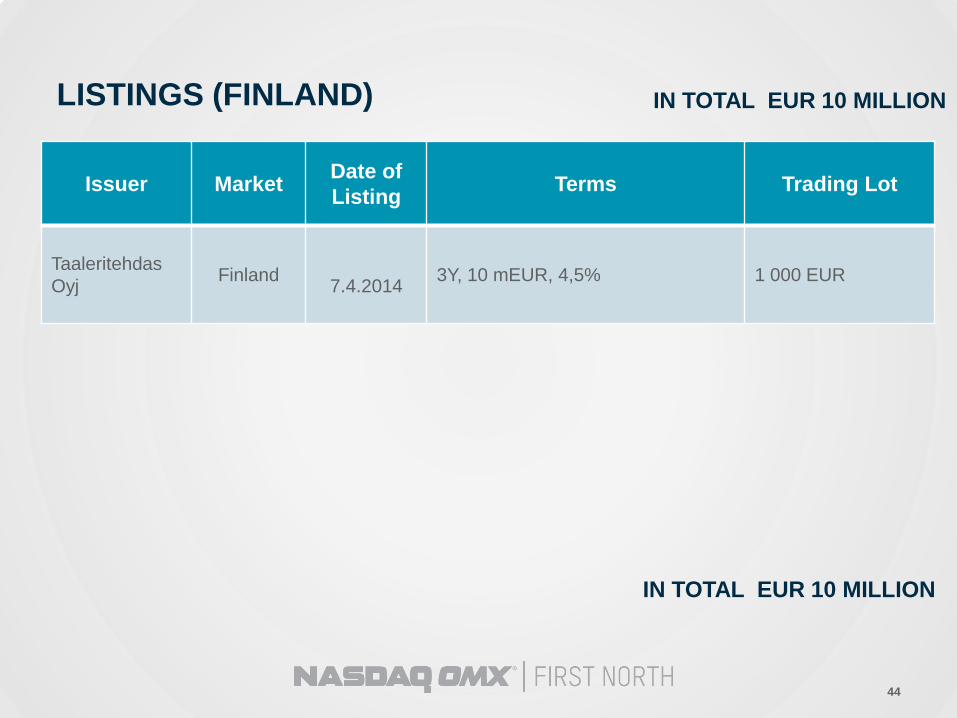
LISTINGS (FINLAND)
44
Issuer Market Date of
Listing Terms Trading Lot
Taaleritehdas
Oyj Finland
7.4.2014 3Y, 10 mEUR, 4,5% 1 000 EUR
IN TOTAL EUR 10 MILLION
IN TOTAL EUR 10 MILLION
© Copyright 2014, The NASDAQ OMX Group, Inc. All rights reserved.
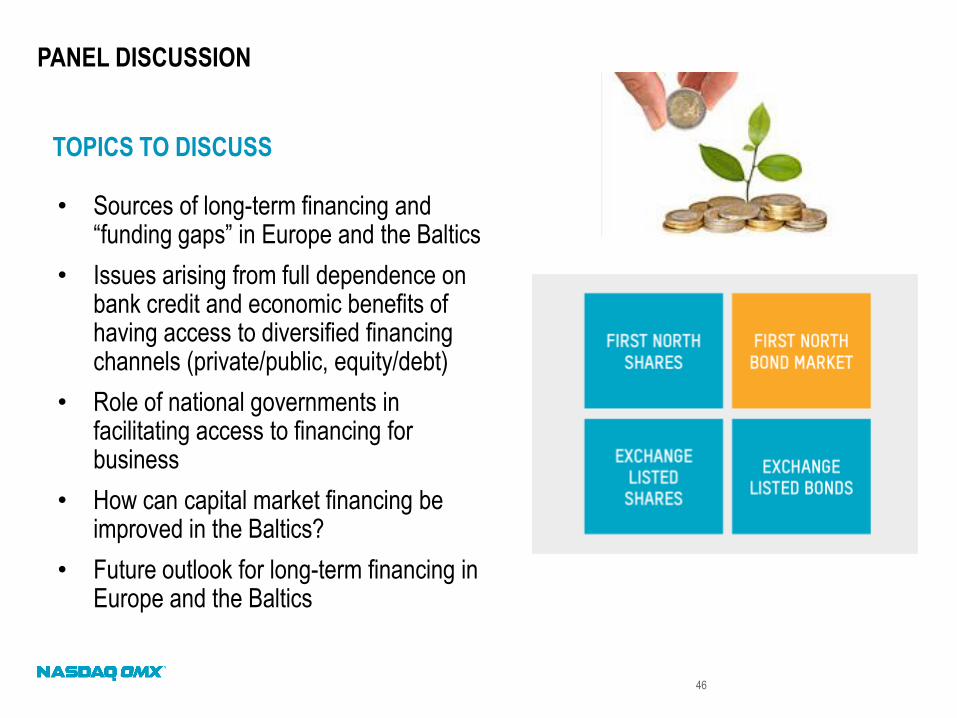
PANEL DISCUSSION
TOPICS TO DISCUSS
• Sources of long-term financing and “funding gaps” in Europe and the Baltics
• Issues arising from full dependence on bank credit and economic benefits of having access to diversified financing channels (private/public, equity/debt)
• Role of national governments in facilitating access to financing for business
• How can capital market financing be improved in the Baltics?
• Future outlook for long-term financing in Europe and the Baltics
46