Embed Size (px)
Citation preview
National Aeronautics and Space Administration
Aquarius/SAC-DSCIENCE WRITERS’ GUIDE
June 2011
Studying Earth’s Salty Seas from Space
Aquarius/SAC-D SCIENCE WRITERS’ GUIDE
CONTACT INFORMATION AND MEDIA RESOURCES
Please call the individuals listed below from the Communications Offices at NASA, CONAE or United Launch Alliance before contacting scientists or engineers at these organizations.
NASA Jet Propulsion Laboratory Alan Buis, 818-354-0474, [email protected]
NASA Headquarters Steve Cole, 202-358-0918, [email protected]
NASA Kennedy Space Center George Diller, 321-867-2468, [email protected]
Comisión Nacional de Actividades Espaciales (CONAE) Laura Sarrate, 011-54-03547-431-075, [email protected]
United Launch Alliance Jessica Rye, 321-730-5646, [email protected]
NASA Web sites http://www.nasa.gov/aquariushttp://www.aquarius.nasa.gov http://www.conae.gov.ar
WRITERS
Alan Buis Gretchen Cook-Anderson Patrick Lynch Rosemary Sullivant
DESIGN
Kevin Miller
Aquarius/SAC-D SCIENCE WRITERS’ GUIDE
TABLE OF CONTENTS
Science Overview .............................................................................. 4
Instruments ....................................................................................... 5
FEATURE STORIES
Aquarius to Illuminate Links Between Salt, Ocean and Climate ................................................ 6
For Aquarius, Sampling Earth’s Salty Seas from Space No “Grain of Salt” Task ...................................................... 8
Just Add Salt: Ocean Salinity Measurements from New NASA Satellite Instrument to Advance Climate Forecasts ...................... 10
NASA Goes Below the Surface to Understand Salinity ................ 12
Aquarius Spokespersons ................................................................... 14
Aquarius U.S. Science Team Members ............................................ 15
Cover image credit: NASA
Aquarius/SAC-D SCIENCE WRITERS’ GUIDE
4
SCIENCE OVERVIEW
The international Aquarius/Satélite de Aplicaciones Científicas (SAC)-D mission will make NASA’s first space-based measurements of salinity — the concentration of dissolved salt — at the ocean surface. Ocean surface salinity is one of the missing variables in satellite studies of Earth.
This information is critical to improving our understanding of two major components of Earth’s climate system: the water cycle and ocean circulation. Aquarius, the primary instrument on the SAC-D observatory, is expected to provide new insights into how the massive natural exchange of freshwater between the ocean, atmosphere and sea ice influences ocean circulation, weather and climate.
An experimental NASA Earth System Science Pathfinder Program mission, Aquarius will map the entire open ocean once a week at a resolution of 93 miles (150 kilometers) for at least three years. Its weekly and monthly average maps of global ocean surface salinity will show how salinity changes from month to month, season to season and year to year. Scientists will combine Aquarius data with in-water measurements of salinity to generate routine maps of ocean salinity distribution. Later in the mission, Aquarius data will be inter-calibrated and combined with complementary data from the European Soil Moisture and Ocean Salinity satellite. Aquarius will also serve as a pathfinder for possible future long-term satellite missions to measure ocean surface salinity.
Because ocean surface salinity varies from place to place and over time, scientists can use it to trace the ocean’s role in Earth’s water cycle. For example, approximately 86 percent of global evaporation and 78 percent of global precipitation occur over the ocean. By measuring changes in ocean surface salinity caused by these processes, as well as by ice melting and river runoff, Aquarius will provide important new information about how Earth’s freshwater moves between the ocean and atmosphere and around the globe.
Knowing more about ocean surface salinity can also help scientists track ocean currents and better understand ocean circulation. Salinity, together with temperature, determines how dense or buoyant seawater is. This, in turn, drives how ocean waters are layered and mixed. Salinity has a major effect on ocean circulation, including the flow of currents that move heat from the tropics to the poles.
Aquarius observations will contribute significantly to improving computer models used to forecast future climate conditions. With this new data stream, scientists can begin to understand the correlation of changes in salinity with changes in the water cycle, ocean circulation and climate.
The Aquarius instrument consists of three passive microwave instruments (radiometers) to detect the surface emission used to measure salinity, and an active microwave radar instrument
(scatterometer) to measure the ocean waves that affect the precision of the salinity measurement. Salinity levels in the open ocean generally vary over a narrow range between about 32 and 37 parts per thousand.
Following launch from California’s Vandenberg Air Force Base aboard a United Launch Alliance Delta II rocket, Aquarius/SAC-D will fly in a sun-synchronous orbit 408 miles (657 kilometers) above Earth’s surface.
Aquarius/SAC-D is a collaboration between NASA and Argentina’s space agency, Comisión Nacional de Actividades Espaciales (CONAE), with participation from Brazil, Canada, France and Italy. The Aquarius instrument was jointly built by NASA’s Jet Propulsion Laboratory, Pasadena, Calif., and NASA’s Goddard Space Flight Center, Greenbelt, Md. NASA’s Launch Services Program at the agency’s Kennedy Space Center in Florida provides launch management. JPL will manage Aquarius through the mission’s commissioning phase and will archive mission data. Goddard will manage the mission’s operations phase and process Aquarius science data. CONAE is providing the SAC-D observatory, an optical camera, a thermal camera in collaboration with Canada, a microwave radiometer, sensors developed by various Argentine institutions and the mission operations center in Argentina. France and Italy are also contributing instruments.
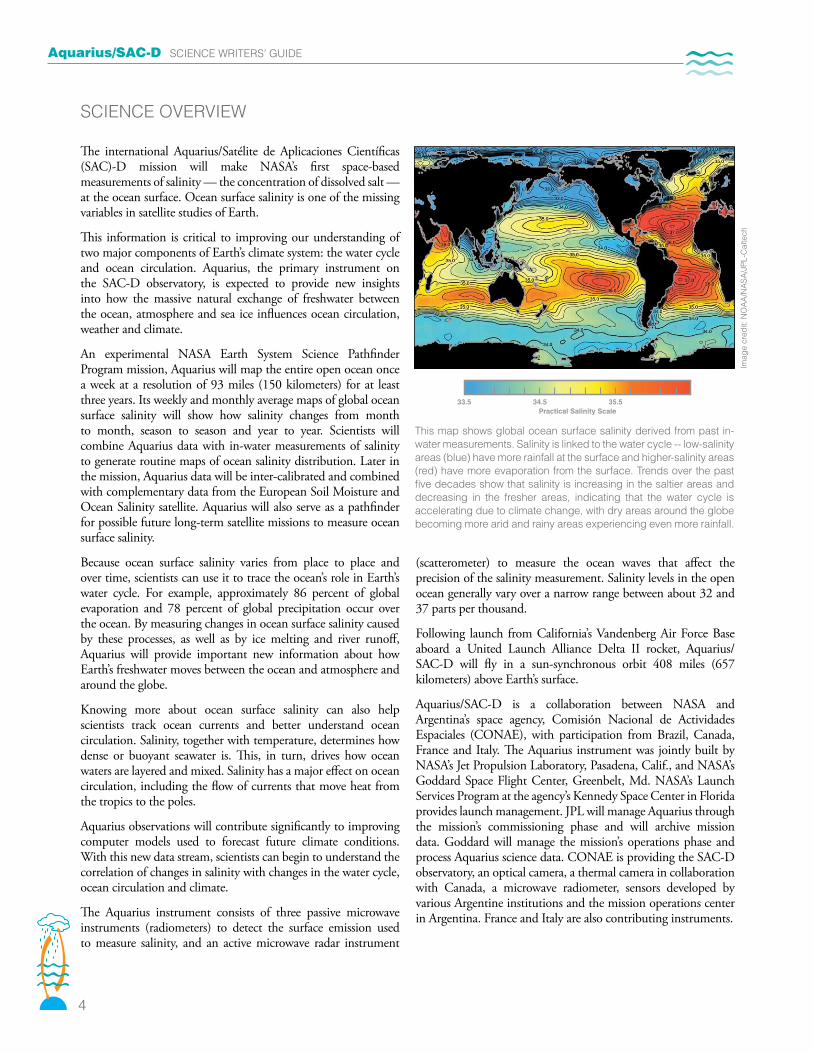
This map shows global ocean surface salinity derived from past in-water measurements. Salinity is linked to the water cycle -- low-salinity areas (blue) have more rainfall at the surface and higher-salinity areas (red) have more evaporation from the surface. Trends over the past five decades show that salinity is increasing in the saltier areas and decreasing in the fresher areas, indicating that the water cycle is accelerating due to climate change, with dry areas around the globe becoming more arid and rainy areas experiencing even more rainfall.
Imag
e cr
edit:
NO
AA
/NA
SA/J
PL-C
alte
ch
Aquarius/SAC-D SCIENCE WRITERS’ GUIDE
5
INSTRUMENTS
Aquarius, the NASA-built primary instrument on the Aquarius/SAC-D observatory, features a design based on more than 30 years of remote-sensing salinity research. It will measure ocean surface salinity by observing thermal emission from the surface at 1.413 gigahertz, using three passive microwave instruments called radiometers. These radiometers are the most accurate ever developed for Earth remote sensing at this frequency.
The strength of the thermal signal emitted in this microwave band from the ocean surface depends on both the salinity of the ocean water and its temperature. The thermal emission, measured as an equivalent “brightness” temperature in Kelvin, is directly correlated to ocean surface salinity. Other things being equal, salty water appears cooler to the radiometers than freshwater.
Over the open ocean, salinity varies globally within a relatively narrow range between about 32 to 37 parts per thousand. To meet Aquarius’ science goals, Aquarius must detect changes in salinity as small as about two parts in 10,000. That’s equivalent to about a “pinch” (one-eighth of a teaspoon) of salt in a gallon of water. This corresponds to a change in brightness temperature of about 0.1 Kelvin, making detecting changes in salinity a very challenging measurement for an Earth remote sensing instrument.
Aquarius must correct for interference with the salinity signal from other sources, such as ocean surface “roughness” caused by ocean waves. This roughness can modify the emissions and distort the salinity signal measured from space. To measure and correct for these effects, Aquarius includes an additional instrument called a radar scatterometer.
The three Aquarius radiometers are aligned with an 8.2-foot- (2.5-meter) diameter antenna reflector to generate three fixed beams at different angles relative to the ocean surface. The beams form three “footprints” on the ocean surface aligned across a 242-mile (390-kilometer)-wide swath. This provides for complete global coverage every seven days and produces enough samples in a month to achieve the mission’s salinity accuracy requirements.
In addition to Aquarius, the SAC-D observatory also includes seven other science instruments and technology packages built by CONAE, the French Space Agency (Centre National d’Etudes Spatiales, or CNES), Italian Space Agency (Agenzia Spaziale Italiana, or ASI) and Canadian Space Agency, or CSA. These are:
• A Microwave Radiometer (MWR), built by CONAE, that will make complementary measurements of rain, wind, sea ice and water vapor.
• A New InfraRed Scanner Technology (NIRST) camera, built by CONAE in collaboration with the Canadian Space Agency, that will detect forest fires on land and map sea surface temperature.
• A High Sensitivity Camera (HSC), built by CONAE, that will acquire nighttime images of urban lighting and fires and aurora events.
• A Data Collection System (DCS), built by CONAE, that will be used to relay environmental data from ground stations.
• The Radio Occultation Sounder for Atmosphere (ROSA), built by Agenzia Spaziale Italiana, that will measure atmospheric temperature and humidity using a technique known as GPS occultation.
• The CARacterisation et Modelisation de l’ENvironnement (CARMEN) 1, built by CNES, consists of the ICARE instrument and three SODAD detectors. ICARE will measure the effects of cosmic radiation on electronics, while SODAD will measure the distribution of microparticles and debris in space.
• A Technology Demonstration Package (TDP) rounds out the SAC-D observatory’s payloads.
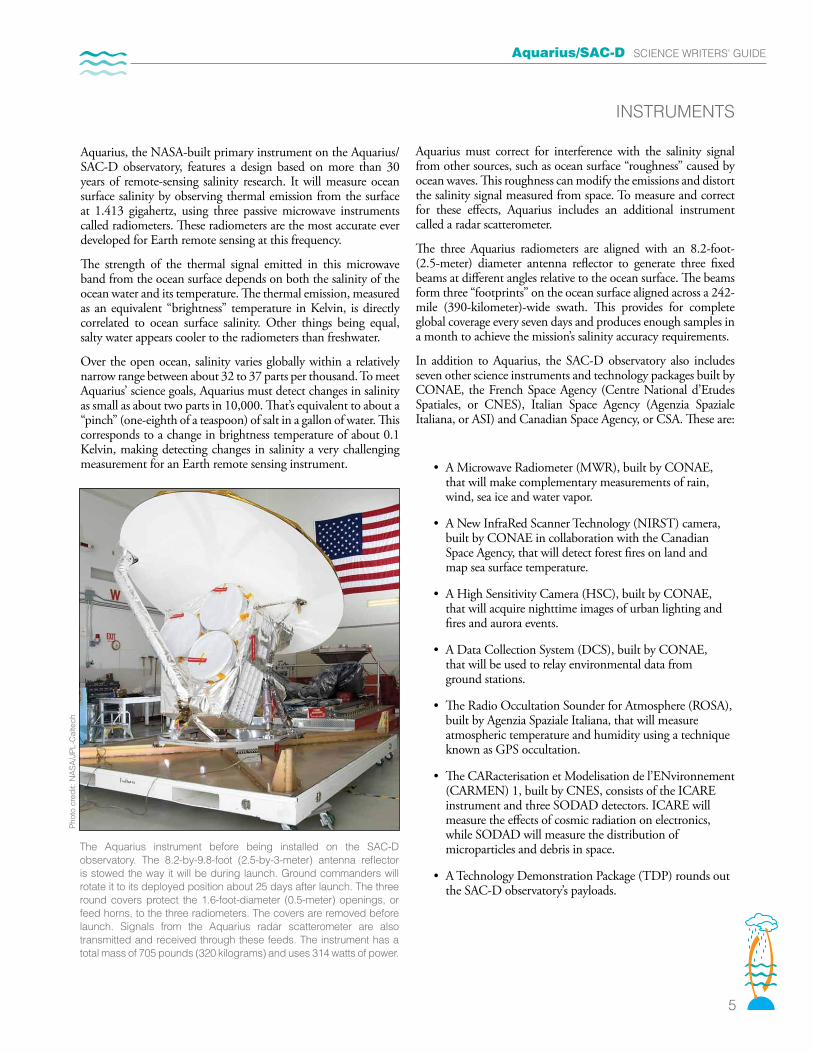
The Aquarius instrument before being installed on the SAC-D observatory. The 8.2-by-9.8-foot (2.5-by-3-meter) antenna reflector is stowed the way it will be during launch. Ground commanders will rotate it to its deployed position about 25 days after launch. The three round covers protect the 1.6-foot-diameter (0.5-meter) openings, or feed horns, to the three radiometers. The covers are removed before launch. Signals from the Aquarius radar scatterometer are also transmitted and received through these feeds. The instrument has a total mass of 705 pounds (320 kilograms) and uses 314 watts of power.
Phot
o cr
edit:
NA
SA/J
PL-C
alte
ch
Aquarius/SAC-D SCIENCE WRITERS’ GUIDE
6
FEATURE STORIES
AQUARIUS TO ILLUMINATE LINKS BETWEEN SALT, OCEAN AND CLIMATE
When NASA’s salt-seeking Aquarius instrument ascends to the heavens this June, the moon above its launch site at California’s Vandenberg Air Force Base won’t be in the seventh house, and Jupiter’s latest alignment with Mars will be weeks in the past, in contrast to the lyrics of the song from the popular Broadway musical “Hair.” Yet for the science team eagerly awaiting Aquarius’ ocean surface salinity data, the dawning of NASA’s “Age of Aquarius” promises revelations on how salinity is linked to Earth’s water cycle, ocean circulation and climate.
Salinity—the concentration of salt—on the ocean surface is a key missing puzzle piece in satellite studies of Earth that will improve our understanding of how the ocean and atmosphere are coupled and work in tandem to affect our climate. While satellites already measure sea surface temperature and winds, rainfall, water vapor, sea level, and ocean color, measurements of ocean surface salinity have, until quite recently, been limited to sparse data collected from ships, buoys and a small number of airborne science campaigns.
From those limited data, we know ocean surface salinity varies by only about five parts per thousand globally. Yet a change of just a fraction of one part per thousand can influence the circulation of the ocean. Knowing the salinity of the ocean surface can also help scientists trace Earth’s water cycle—the process that circulates freshwater from the ocean to the atmosphere to the land and back again to the ocean through rainfall, evaporation, ice melt and river runoff. Aquarius, the primary science instrument on the Aquarius/Satélite de Aplicaciones Científicas (SAC)-D spacecraft built by Argentina’s national space agency, Comisión Nacional de Actividades Espaciales, will help scientists study these complex, interrelated processes and their link to climate.
Recent studies have shown Earth’s water cycle is speeding up in response to climate change, which affects global precipitation patterns. Currently, scientists study the water cycle by making inferences from measurements of how much water is discharged from rivers and by measuring precipitation and evaporation rates using satellites like NASA’s Tropical Rainfall Measuring Mission.
“About 80 percent of Earth’s water cycle takes place over the ocean,” said Aquarius Principal Investigator Gary Lagerloef of Earth & Space Research, Seattle. “By measuring ocean surface salinity,
Aquarius will be able to track how the water cycle is changing in response to climate change.”
SALINITY AND THE DEEP BLUE SEA
While surface winds drive currents in the upper ocean, deep below the surface, it’s a different story.
There, ocean circulation is dominated by changes in the density of seawater. These
changes are determined by salinity and temperature. The saltier and colder
the water, the more dense it is. In parts of the world, cool, high-salinity surface waters become so dense that they sink to great depths, where they become part of deep ocean currents. Found in all ocean basins, these deep currents are interconnected and play an important role in regulating Earth’s climate by transporting heat globally.
By revealing changes in patterns of global precipitation and evaporation
and showing how these changes may affect ocean circulation, Aquarius will
help improve predictions of future climate trends and short-term climate events, such as
El Niño and La Niña.
‘A SPOON OF SALT IN A LAKE’
Gautama Siddhartha, the founder of Buddhism, once said, “A spoon of salt in a glass of water makes the water undrinkable. A spoon of salt in a lake is almost unnoticed.”
Such is the challenge faced by the scientists who designed Aquarius (for more on the technical challenge of the Aquarius mission, see “For Aquarius, Sampling Earth’s Salty Seas from Space No ‘Grain of Salt’ Task,” page 8). Since ocean surface salinity generally averages just 32 to 37 parts per thousand around the globe, it’s very hard for a satellite to detect its signal. The salinity differences between El Niño and La Niña are very small – only about one part per thousand.
Aquarius employs new technologies to be able to detect changes in ocean surface salinity as small as about two parts in 10,000, equivalent to about one-eighth of a teaspoon of salt in a gallon of water. Its unique, advanced design combines three radiometers,
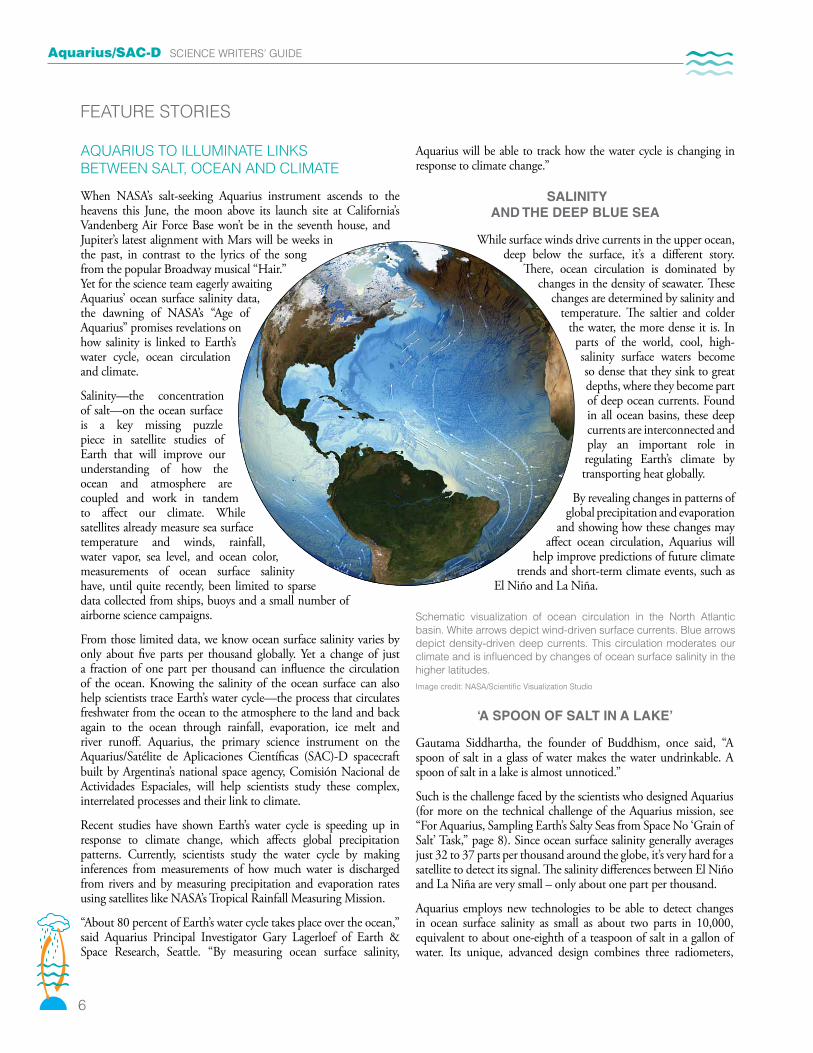
Schematic visualization of ocean circulation in the North Atlantic basin. White arrows depict wind-driven surface currents. Blue arrows depict density-driven deep currents. This circulation moderates our climate and is influenced by changes of ocean surface salinity in the higher latitudes.Image credit: NASA/Scientific Visualization Studio
Aquarius/SAC-D SCIENCE WRITERS’ GUIDE
7
which measure the salinity signal, with a scatterometer that compensates for the effects of ocean surface “roughness” (waves). The result is expected to be the most accurate salinity data ever measured from space.
Scientists will combine Aquarius’ maps of global ocean surface salinity with in-ocean salinity measurements to generate routine maps of ocean salinity distribution. Later in the mission, Aquarius data will be inter-calibrated and combined with complementary data from the European Soil Moisture and Ocean Salinity satellite.
PEERING INTO A CRYSTAL BALL (OF SALT)
Scientists believe Aquarius will lead to exciting and unexpected new discoveries—a “mind’s true liberation” of sorts. They will be able to accurately calculate the rate at which surface ocean circulation transports freshwater. They’ll see how salinity is affected by melting ice, freshwater flowing into the ocean, and fluxes of freshwater to and from the atmosphere from rainfall and evaporation. They’ll be able to better study how ocean waters mix vertically. And they’ll greatly reduce uncertainties in calculating the ocean’s freshwater budget (the net difference between freshwater lost in the ocean through evaporation and freshwater added to the ocean by precipitation and runoff).
Perhaps nowhere is the potential for discovery from Aquarius higher than in the Southern Ocean. “Today’s salinity maps don’t show many features in the Southern Ocean,” said Yi Chao, Aquarius project scientist at NASA’s Jet Propulsion Laboratory, Pasadena, Calif., which jointly built Aquarius with NASA’s Goddard Space Flight Center, Greenbelt, Md. “This is because data there are so sparse. Yet the Southern Ocean is one of the key deepwater formation areas in the world and is one of the key drivers of deep ocean circulation and heat transport.”
Other areas of particular interest to Aquarius researchers include:
• The Central North Atlantic, where salinity has been observed to be increasing, and the region has been getting more arid
• The Nordic and Labrador Seas, where dense water forms at the surface and sinks to deep layers in the ocean. Aquarius should be able to observe the year-to-year effects of ice melting on the circulation between Greenland and Iceland.
• The Indian Ocean and Bay of Bengal, which have a very large salinity signal but have been less frequently measured than the Atlantic and Pacific oceans
And then there’s the Arctic Ocean, which has seen significant changes in sea ice cover in recent years. Aquarius will provide some salinity measurements over the Arctic during its ice-free seasons, though the Aquarius signal is less sensitive over cold water.
Aquarius’ prime mission will last at least three years, long enough to map year-to-year variations in salinity that will allow researchers to develop the methodology for and demonstrate the usefulness of salinity as a climate data record.
Aquarius data will eventually be used to improve the accuracy of climate forecast models (see “Just Add Salt: Ocean Salinity Measurements from New NASA Satellite Instrument to Advance Climate Forecasts,” page 10). Ocean surface salinity is not currently well represented in models used by the United Nations’ Intergovernmental Panel on Climate Change in its assessment reports.
Lagerloef likened Aquarius to an explorer of an unexplored frontier. “We’ll see the ocean in a whole different light. When the first Earth science satellites launched in the 1970s, we saw ocean eddies for the first time and got our first glimpse of the tremendous turbulence of the ocean. With Aquarius, we’re going to see things we don’t currently see. It’s as though the blinders will be removed from our eyes.”
By Alan Buis NASA Jet Propulsion Laboratory
For more information on Aquarius, contact:
Gary Lagerloef, Aquarius Principal Investigator Earth & Space Research, [email protected]
Yi Chao, Aquarius Project Scientist NASA Jet Propulsion Laboratory, Pasadena, [email protected]
Related Links:
The Aquarius Mission http://www.nasa.gov/aquarius http://aquarius.nasa.gov/ http://www.conae.gov.ar
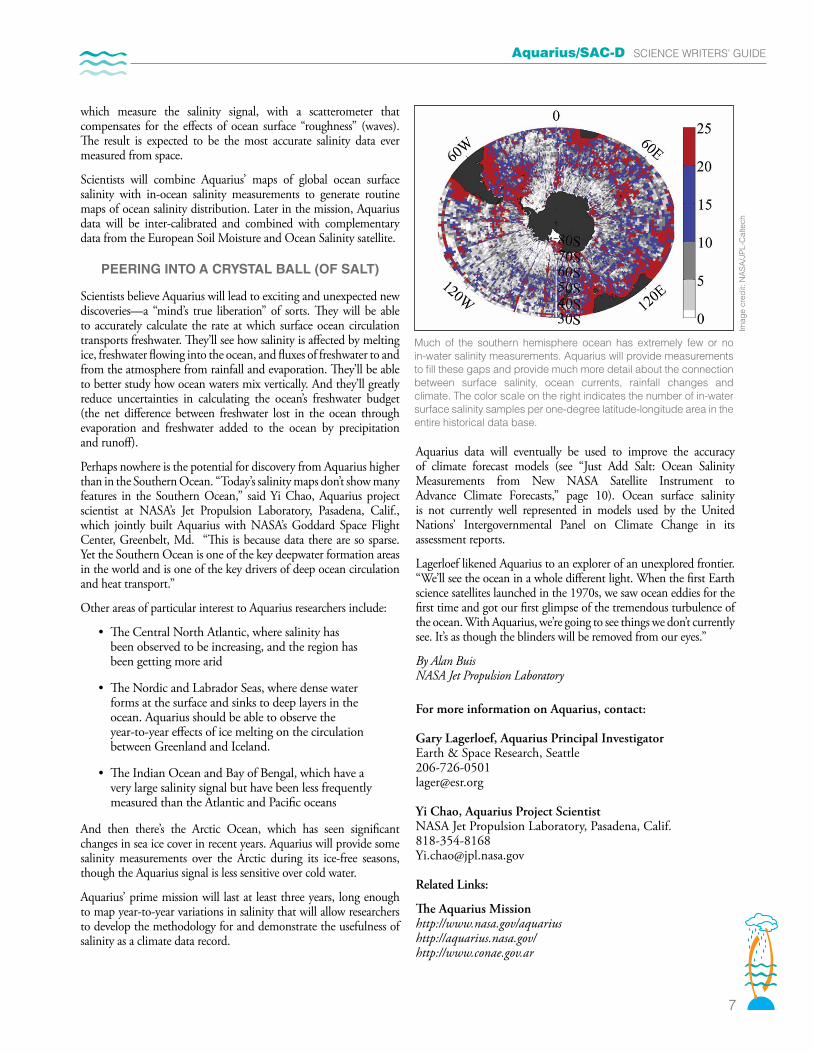
Much of the southern hemisphere ocean has extremely few or no in-water salinity measurements. Aquarius will provide measurements to fill these gaps and provide much more detail about the connection between surface salinity, ocean currents, rainfall changes and climate. The color scale on the right indicates the number of in-water surface salinity samples per one-degree latitude-longitude area in the entire historical data base.
Imag
e cr
edit:
NA
SA/J
PL-C
alte
ch
Aquarius/SAC-D SCIENCE WRITERS’ GUIDE
8
FEATURE STORIES
FOR AQUARIUS, SAMPLING EARTH’S SALTY SEAS FROM SPACE NO “GRAIN OF SALT” TASK
The breakthrough moment for oceanographer Gary Lagerloef, the principal investigator for NASA’s new Aquarius mission, came in 1991. That’s when he knew it would be possible to make precise measurements of ocean salinity from space. It has taken nearly two decades to turn that possibility into a reality.
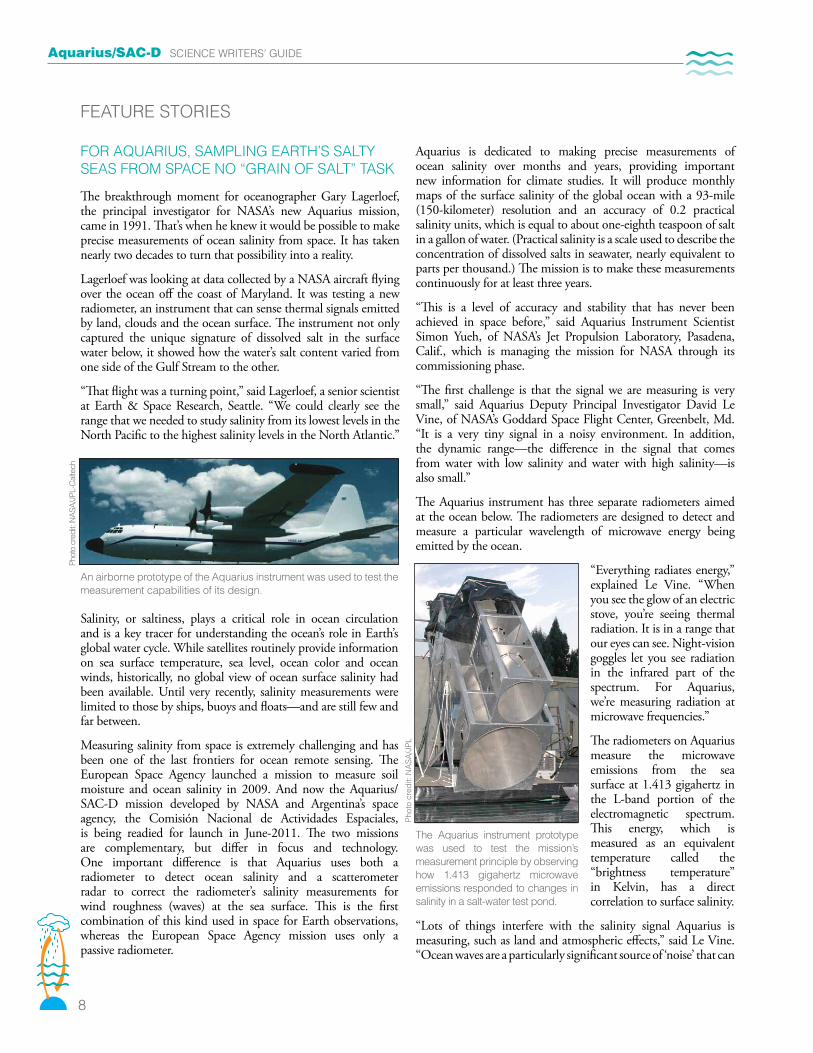
Lagerloef was looking at data collected by a NASA aircraft flying over the ocean off the coast of Maryland. It was testing a new radiometer, an instrument that can sense thermal signals emitted by land, clouds and the ocean surface. The instrument not only captured the unique signature of dissolved salt in the surface water below, it showed how the water’s salt content varied from one side of the Gulf Stream to the other.
“That flight was a turning point,” said Lagerloef, a senior scientist at Earth & Space Research, Seattle. “We could clearly see the range that we needed to study salinity from its lowest levels in the North Pacific to the highest salinity levels in the North Atlantic.”
Salinity, or saltiness, plays a critical role in ocean circulation and is a key tracer for understanding the ocean’s role in Earth’s global water cycle. While satellites routinely provide information on sea surface temperature, sea level, ocean color and ocean winds, historically, no global view of ocean surface salinity had been available. Until very recently, salinity measurements were limited to those by ships, buoys and floats—and are still few and far between.
Measuring salinity from space is extremely challenging and has been one of the last frontiers for ocean remote sensing. The European Space Agency launched a mission to measure soil moisture and ocean salinity in 2009. And now the Aquarius/SAC-D mission developed by NASA and Argentina’s space agency, the Comisión Nacional de Actividades Espaciales, is being readied for launch in June-2011. The two missions are complementary, but differ in focus and technology. One important difference is that Aquarius uses both a radiometer to detect ocean salinity and a scatterometer radar to correct the radiometer’s salinity measurements for wind roughness (waves) at the sea surface. This is the first combination of this kind used in space for Earth observations, whereas the European Space Agency mission uses only a passive radiometer.
Aquarius is dedicated to making precise measurements of ocean salinity over months and years, providing important new information for climate studies. It will produce monthly maps of the surface salinity of the global ocean with a 93-mile (150-kilometer) resolution and an accuracy of 0.2 practical salinity units, which is equal to about one-eighth teaspoon of salt in a gallon of water. (Practical salinity is a scale used to describe the concentration of dissolved salts in seawater, nearly equivalent to parts per thousand.) The mission is to make these measurements continuously for at least three years.
“This is a level of accuracy and stability that has never been achieved in space before,” said Aquarius Instrument Scientist Simon Yueh, of NASA’s Jet Propulsion Laboratory, Pasadena, Calif., which is managing the mission for NASA through its commissioning phase.
“The first challenge is that the signal we are measuring is very small,” said Aquarius Deputy Principal Investigator David Le Vine, of NASA’s Goddard Space Flight Center, Greenbelt, Md. “It is a very tiny signal in a noisy environment. In addition, the dynamic range—the difference in the signal that comes from water with low salinity and water with high salinity—is also small.”
The Aquarius instrument has three separate radiometers aimed at the ocean below. The radiometers are designed to detect and measure a particular wavelength of microwave energy being emitted by the ocean.
“Everything radiates energy,” explained Le Vine. “When you see the glow of an electric stove, you’re seeing thermal radiation. It is in a range that our eyes can see. Night-vision goggles let you see radiation in the infrared part of the spectrum. For Aquarius, we’re measuring radiation at microwave frequencies.”
The radiometers on Aquarius measure the microwave emissions from the sea surface at 1.413 gigahertz in the L-band portion of the electromagnetic spectrum. This energy, which is measured as an equivalent temperature called the “brightness temperature” in Kelvin, has a direct correlation to surface salinity.
“Lots of things interfere with the salinity signal Aquarius is measuring, such as land and atmospheric effects,” said Le Vine. “Ocean waves are a particularly significant source of ‘noise’ that can
An airborne prototype of the Aquarius instrument was used to test the measurement capabilities of its design.
Phot
o cr
edit:
NA
SA/J
PL-C
alte
ch
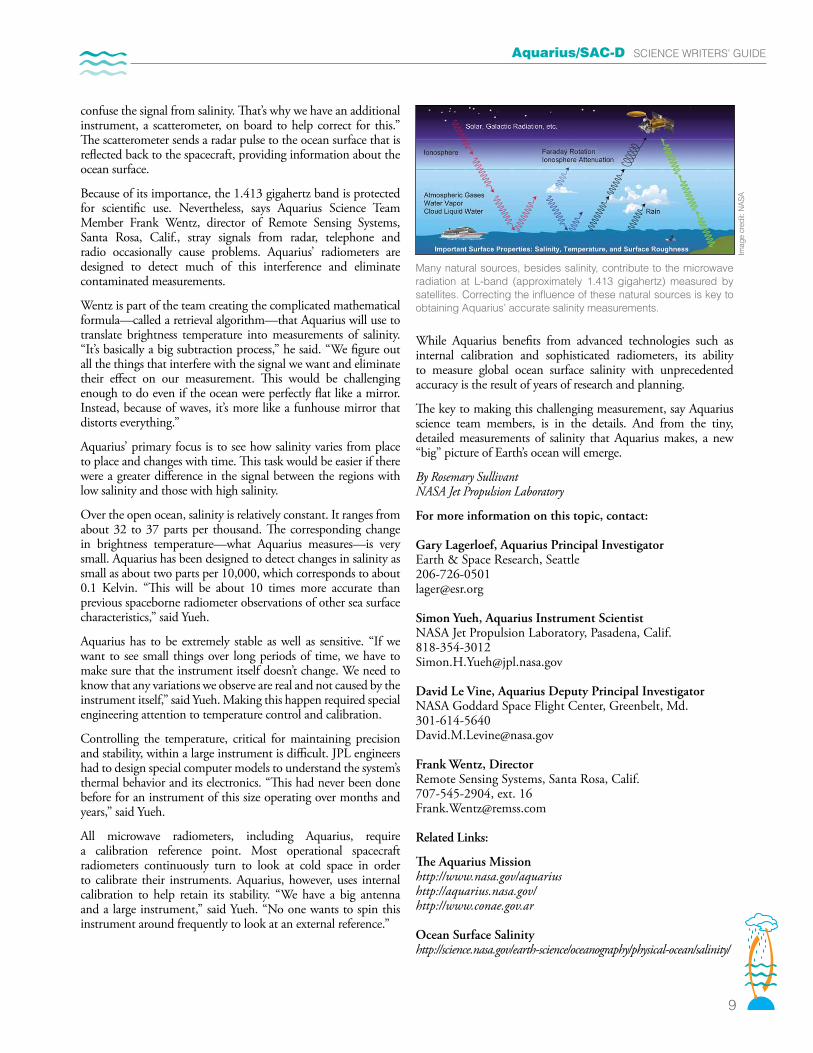
The Aquarius instrument prototype was used to test the mission’s measurement principle by observing how 1.413 gigahertz microwave emissions responded to changes in salinity in a salt-water test pond.
Phot
o cr
edit:
NA
SA/J
PL
Aquarius/SAC-D SCIENCE WRITERS’ GUIDE
9
confuse the signal from salinity. That’s why we have an additional instrument, a scatterometer, on board to help correct for this.” The scatterometer sends a radar pulse to the ocean surface that is reflected back to the spacecraft, providing information about the ocean surface.
Because of its importance, the 1.413 gigahertz band is protected for scientific use. Nevertheless, says Aquarius Science Team Member Frank Wentz, director of Remote Sensing Systems, Santa Rosa, Calif., stray signals from radar, telephone and radio occasionally cause problems. Aquarius’ radiometers are designed to detect much of this interference and eliminate contaminated measurements.
Wentz is part of the team creating the complicated mathematical formula—called a retrieval algorithm—that Aquarius will use to translate brightness temperature into measurements of salinity. “It’s basically a big subtraction process,” he said. “We figure out all the things that interfere with the signal we want and eliminate their effect on our measurement. This would be challenging enough to do even if the ocean were perfectly flat like a mirror. Instead, because of waves, it’s more like a funhouse mirror that distorts everything.”
Aquarius’ primary focus is to see how salinity varies from place to place and changes with time. This task would be easier if there were a greater difference in the signal between the regions with low salinity and those with high salinity.
Over the open ocean, salinity is relatively constant. It ranges from about 32 to 37 parts per thousand. The corresponding change in brightness temperature—what Aquarius measures—is very small. Aquarius has been designed to detect changes in salinity as small as about two parts per 10,000, which corresponds to about 0.1 Kelvin. “This will be about 10 times more accurate than previous spaceborne radiometer observations of other sea surface characteristics,” said Yueh.
Aquarius has to be extremely stable as well as sensitive. “If we want to see small things over long periods of time, we have to make sure that the instrument itself doesn’t change. We need to know that any variations we observe are real and not caused by the instrument itself,” said Yueh. Making this happen required special engineering attention to temperature control and calibration.
Controlling the temperature, critical for maintaining precision and stability, within a large instrument is difficult. JPL engineers had to design special computer models to understand the system’s thermal behavior and its electronics. “This had never been done before for an instrument of this size operating over months and years,” said Yueh.
All microwave radiometers, including Aquarius, require a calibration reference point. Most operational spacecraft radiometers continuously turn to look at cold space in order to calibrate their instruments. Aquarius, however, uses internal calibration to help retain its stability. “We have a big antenna and a large instrument,” said Yueh. “No one wants to spin this instrument around frequently to look at an external reference.”
While Aquarius benefits from advanced technologies such as internal calibration and sophisticated radiometers, its ability to measure global ocean surface salinity with unprecedented accuracy is the result of years of research and planning.
The key to making this challenging measurement, say Aquarius science team members, is in the details. And from the tiny, detailed measurements of salinity that Aquarius makes, a new “big” picture of Earth’s ocean will emerge.
By Rosemary Sullivant NASA Jet Propulsion Laboratory
For more information on this topic, contact:
Gary Lagerloef, Aquarius Principal Investigator Earth & Space Research, Seattle 206-726-0501 [email protected]
Simon Yueh, Aquarius Instrument Scientist NASA Jet Propulsion Laboratory, Pasadena, Calif. 818-354-3012 [email protected]
David Le Vine, Aquarius Deputy Principal Investigator NASA Goddard Space Flight Center, Greenbelt, Md. 301-614-5640 [email protected]
Frank Wentz, Director Remote Sensing Systems, Santa Rosa, Calif. 707-545-2904, ext. 16 [email protected]
Related Links:
The Aquarius Mission http://www.nasa.gov/aquarius http://aquarius.nasa.gov/ http://www.conae.gov.ar
Ocean Surface Salinity http://science.nasa.gov/earth-science/oceanography/physical-ocean/salinity/
Many natural sources, besides salinity, contribute to the microwave radiation at L-band (approximately 1.413 gigahertz) measured by satellites. Correcting the influence of these natural sources is key to obtaining Aquarius’ accurate salinity measurements.
Imag
e cr
edit:
NAS
A
Aquarius/SAC-D SCIENCE WRITERS’ GUIDE
10
FEATURE STORIES
JUST ADD SALT: OCEAN SALINITY MEASUREMENTS FROM NEW NASA SATELLITE INSTRUMENT TO ADVANCE CLIMATE FORECASTS
Salt is essential to human life. Most people don’t know, however, that salt—in a form nearly the same as the simple table variety—is just as essential to Earth’s ocean, serving as a critical driver of key ocean processes. While ancient Greek soothsayers believed they could foretell the future by reading the patterns in sprinkled salt, today’s scientists have learned that they can indeed harness this invaluable mineral to foresee the future—of Earth’s climate.
The oracles of modern climate science are the computer models used to forecast climate change. These models, which rely on a myriad of data from many sources, are effective in predicting many climate variables, such as global temperatures. Yet data for some pieces of the climate puzzle have been scarce, including the
concentration of dissolved sea salt at the surface of the world’s ocean, commonly called ocean surface salinity, subjecting the models to varying margins of error. This salinity is a key indicator of how Earth’s freshwater moves between the ocean, land and atmosphere.
Enter Aquarius, a new NASA salinity-measurement instrument slated for launch in June 2011 aboard the Satélite de Aplicaciones Científicas (SAC)-D spacecraft built by Argentina’s Comisión
Nacional de Actividades Espaciales (CONAE). Aquarius’ high-tech, salt-seeking sensors will make comprehensive space-based measurements of ocean surface salinity with the precision needed to help researchers better determine how Earth’s ocean interacts with the atmosphere to influence climate. It’s a mission that promises to be, to quote the old saying, “worth its salt.”
IMPROVING CLIMATE FORECASTS
“We ultimately want to predict climate change and have greater confidence in our predictions. Climate models are the only effective means we have to do so,” said Aquarius Principal Investigator Gary Lagerloef, a scientist at the Seattle-based independent laboratory Earth & Space Research. “But, a climate model’s forecast skill is only as good as its ability to accurately represent modern-day observations.”
Density-driven ocean circulation, according to Lagerloef, is controlled as much by salinity as by ocean temperature. Sea salt makes up only 3.5 percent of the world’s ocean, but its relatively small presence reaps huge consequences.
Salinity influences the very motion of the ocean and the temperature of sea water, because the concentration of sea salt in the ocean’s surface mixed layer—the portion of the ocean that is actively exchanging water and heat with Earth’s atmosphere—is a critical driver of these ocean processes. It’s the missing variable in understanding the link between the water cycle and ocean circulation. Specifically, it’s an essential metric to modeling precipitation and evaporation.
Accurate ocean surface salinity data are a necessary component to understanding what will happen in the future, but can also open a window to Earth’s climate past. When researchers want to create a climate record that spans previous decades—which helps them identify trends—it’s necessary to collect and integrate data from the last two to three decades to develop a consistent analysis.
“Aquarius, and successor missions based on it, will give us, over time, critical data that will be used by models that study how Earth’s ocean and atmosphere interact, to see trends in climate,” said Lagerloef. “The advances this mission will enable make this an exciting time in climate research.”
TAKING PAST MEASUREMENTS WITH A GRAIN OF SALT
Anyone who’s splashed at the beach knows that ocean water is salty. Yet measuring this simple compound in seawater has been a scientific challenge for well over a century.
Until now, researchers had taken ocean salinity measurements from aboard ships, buoys and aircraft – but they’d done so using a wide range of methods across assorted sampling areas and over inconsistent times from one season to another. Because of the sparse and intermittent nature of these salinity observations, researchers have not been able to fine-tune models to obtain a
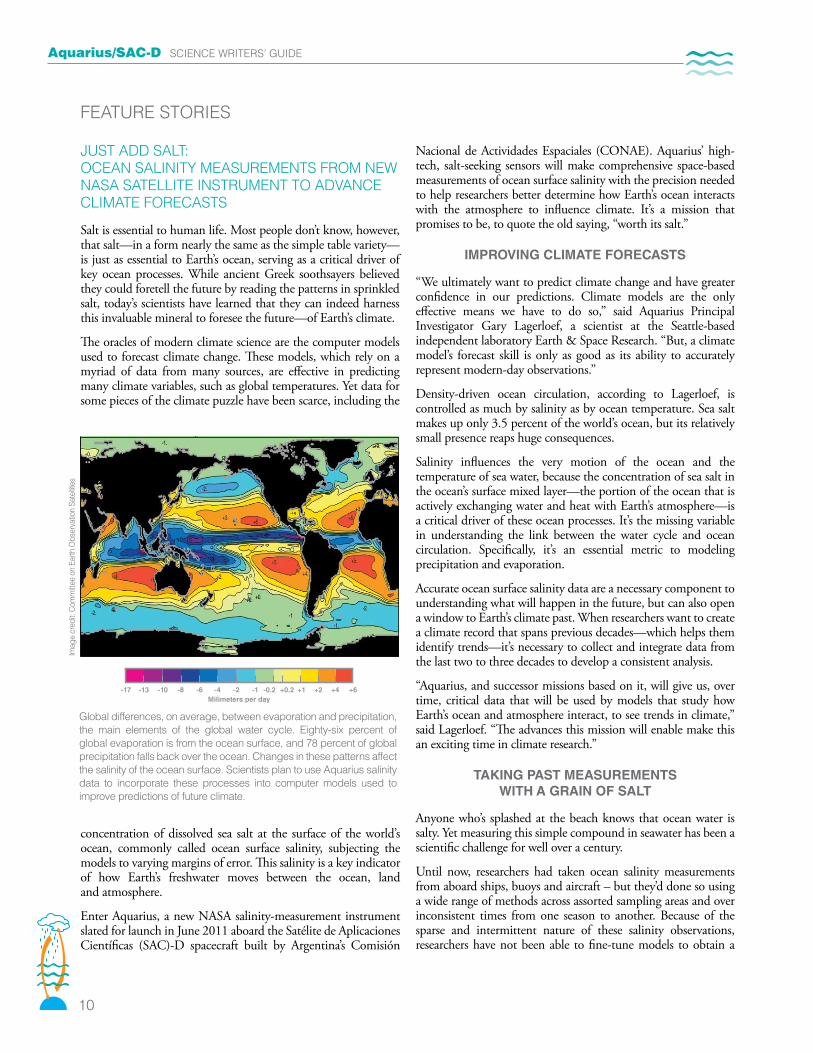
Global differences, on average, between evaporation and precipitation, the main elements of the global water cycle. Eighty-six percent of global evaporation is from the ocean surface, and 78 percent of global precipitation falls back over the ocean. Changes in these patterns affect the salinity of the ocean surface. Scientists plan to use Aquarius salinity data to incorporate these processes into computer models used to improve predictions of future climate.
Imag
e cr
edit:
Com
mitt
ee o
n Ea
rth O
bser
vatio
n Sa
tellit
es
Aquarius/SAC-D SCIENCE WRITERS’ GUIDE
11
true global picture of how ocean surface salinity is influencing the ocean. Aquarius promises to resolve these deficiencies, seeing changes in ocean surface salinity consistently across space and time and mapping the entire ice-free ocean every seven days for at least three years.
THE AGE OF AQUARIUS
Research modelers like William Large, an oceanographer at the National Center for Atmospheric Research in Boulder, Colo., will use Aquarius’ ocean surface salinity data, along with precipitation and temperature observations, to round out the data needed to refine the numerical climate models he and his colleagues have developed.
“This mission is sure to mark a new era for end users like us,” explained Large. “Aquarius puts us on the road to implementing a long-term, three-step plan that could improve our climate models. The first step will be to use Aquarius data to identify if there is a problem with our models—what deficiencies exist, for example, in parts of the world where observations are sparse.
“Second, the data will help us determine the source of these problems,” he continued. “Salinity helps us understand density—and density, after all, makes ocean waters sink and float, and circulate around Earth.
“Third, Aquarius will help us solve the puzzle of what’s going on in the ocean itself—the ocean processes,” he added. “We’ll pair an ocean observation experiment with the satellite mission to explore the mixing and convection—how things like salinity are stirred in the ocean—to better determine what processes might be actually changing climate. Measuring salinity at the ocean surface will deliver a pioneering baseline of observations for changes seen by the next generation of missions in the coming decades.”
“We’ve done all of the advance work leading up to the launch of Aquarius, so the proof will be in the actual data,” said Lagerloef. “Our intent is to put the data out immediately as soon as the satellite begins transmitting. Before the end of the first year, we’ll be interpreting exactly what the data are telling us and how they will benefit climate modeling.”
By Gretchen Cook-Anderson
For more information on this topic, contact:
Gary Lagerloef, Aquarius Principal Investigator Earth & Space Research, Seattle 206-726-0501 [email protected]
Yi Chao, Aquarius Project Scientist NASA Jet Propulsion Laboratory, Pasadena, Calif. 818-354-8168 [email protected]
William Large, Division Director, Climate & Global Dynamics National Center for Atmospheric Research, Boulder, Colo. 303-497-1364 [email protected]
Related Links:
The Aquarius Mission http://www.nasa.gov/aquarius http://aquarius.nasa.gov/ http://www.conae.gov.ar
Ocean Surface Salinity http://science.nasa.gov/earth-science/oceanography/physical-ocean/salinity/
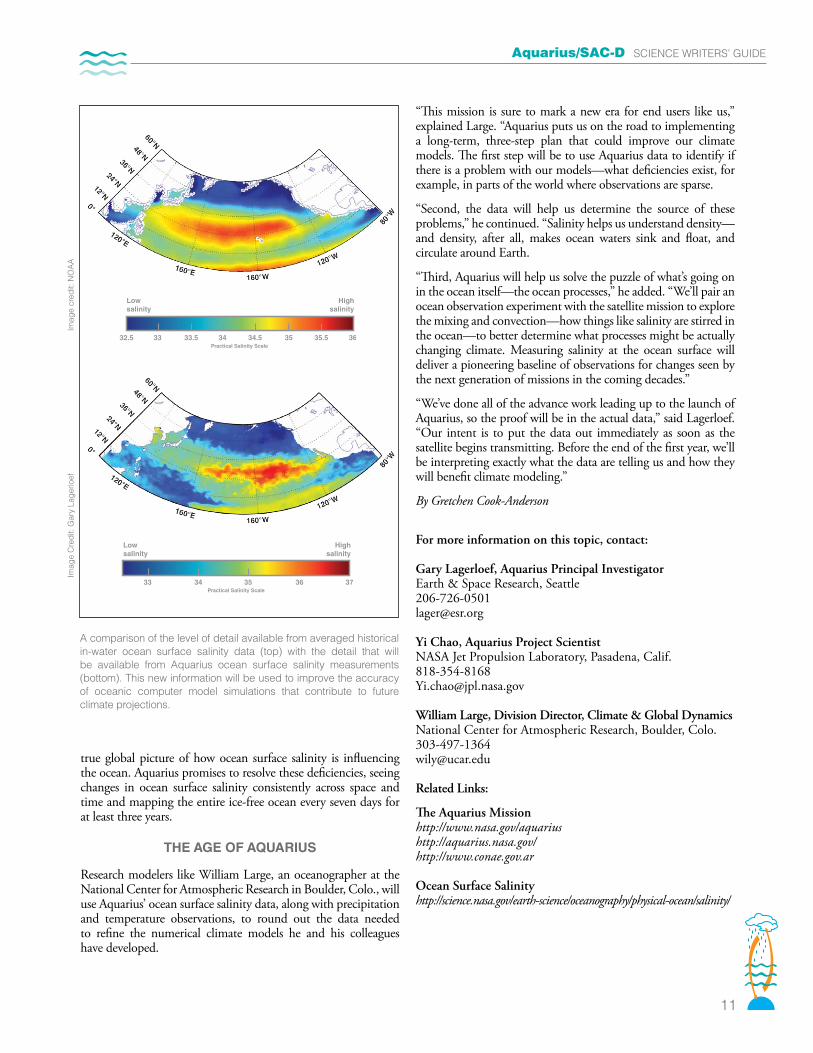
A comparison of the level of detail available from averaged historical in-water ocean surface salinity data (top) with the detail that will be available from Aquarius ocean surface salinity measurements (bottom). This new information will be used to improve the accuracy of oceanic computer model simulations that contribute to future climate projections.
Imag
e cr
edit:
NO
AA
Imag
e C
redi
t: G
ary
Lage
rloef
Aquarius/SAC-D SCIENCE WRITERS’ GUIDE
12
FEATURE STORIES
NASA GOES BELOW THE SURFACE TO UNDERSTAND SALINITY
When NASA’s Aquarius instrument launches this June, its radiometer instruments will take a “skin” reading of the oceans’ salt content at the surface. From these data of salinity in the top 0.4 inch (1 centimeter) of the ocean surface, Aquarius will create weekly and monthly maps of ocean surface salinity all over the globe for at least three years. But to better understand what’s driving changes and fluctuations in salinity—and how those changes relate to an acceleration of the global water cycle and climate change—scientists need to go deeper.
That’s why scientists working on the newest NASA Earth System Science Pathfinder mission aboard the Argentine-built Aquarius/Satelite de Aplicaciones Cientificas (SAC)-D observatory have devised a plan. They will deploy instruments on floats, research ships, commercial cargo ships, free-drifting platforms, buoys, underwater gliders and an autonomous underwater vehicle to build a 3-D view of what’s happening beneath the ocean surface that affects salinity distribution.
Along with temperature, ocean salinity is a key driver of ocean currents, a critical factor in climate processes, and an indicator of Earth’s changing water cycle. Measuring salinity from space has been one of the great technological challenges of satellite ocean studies. But once Aquarius starts delivering its salinity data, with accuracy equal to a pinch of salt in a gallon of water, a new challenge begins.
“The next question is: How do you understand what the satellite sees?” said Yi Chao of NASA’s Jet Propulsion Laboratory in Pasadena, Calif., and the Aquarius project scientist. “Without deploying instruments under the ocean’s surface, we do not know how to fully interpret the satellite observations of surface salinity.”
To help address that question, NASA has a new field experiment: SPURS—Salinity Processes in the Upper Ocean Regional Study. The experiment, which will sample salinity and other key factors, such as ocean temperature and velocity, will take place from spring 2012 to summer 2013 and will include five month-long research ship cruises to the center of the saltiest region in the Atlantic Ocean. In oceanography lingo, it’s known as the “Atlantic salinity maximum,” and it’s located about halfway between the southeast U.S. coast and the western coast of North Africa, at about 25 degrees north and 38 degrees west. Many of the methods used for years to take in-ocean measurements of salinity will be put to use, but in a far more concentrated and intensive manner, and, for the first time, they’ll be used in combination with Aquarius’ satellite salinity readings.
SPURS scientists hope to replicate the study in a contrasting, relatively low salinity region elsewhere in the ocean in the future.
The scope of the measurements taken during SPURS will give scientists deeper insights into the salinity observations from Aquarius and the physical processes—temperature changes, currents, turbulence, evaporation, precipitation—that affect salinity. These are all aspects of the global water cycle, the continuous movement of water through the Earth system by evaporation, condensation, precipitation and runoff. Water cycles from the ocean
to the atmosphere and then back to the ocean, either directly or via melting ice caps, rivers or underground aquifers. Scientists see evidence of an accelerating water cycle, driven by climate change. Salinity measurements can indicate how the patterns of freshwater mixing with saltwater are changing due to changes in precipitation, evaporation, and freshwater runoff from rivers and melting ice.
“One of the big questions is how much will the water cycle accelerate because of warming?” said Raymond Schmitt, project scientist for SPURS and an oceanographer at Woods Hole Oceanographic Institution in Woods Hole, Mass. In short, as Earth’s lowermost atmospheric layer, the troposphere, warms, its ability to hold water in the form of water vapor increases. This, in turn, increases evaporation over land and the ocean, and quickens the cycle as a whole. As precipitation and evaporation patterns change—thus changing how freshwater mixes with salty water—so do salinities.
“We’re seeing big changes in ocean salinities that can only be explained by an increase in the water cycle,” Schmitt said. “We see this changing salinity, and we want to relate it to the changing water cycle—but we have to understand what the ocean is doing.”
DESIGNING A MULTI-PLATFORM EXPERIMENT AT SEA
The ocean makes up 71 percent of Earth’s surface area and represents 97 percent of the world’s volume of water. Measuring what’s happening with salinity everywhere in the ocean at every depth is
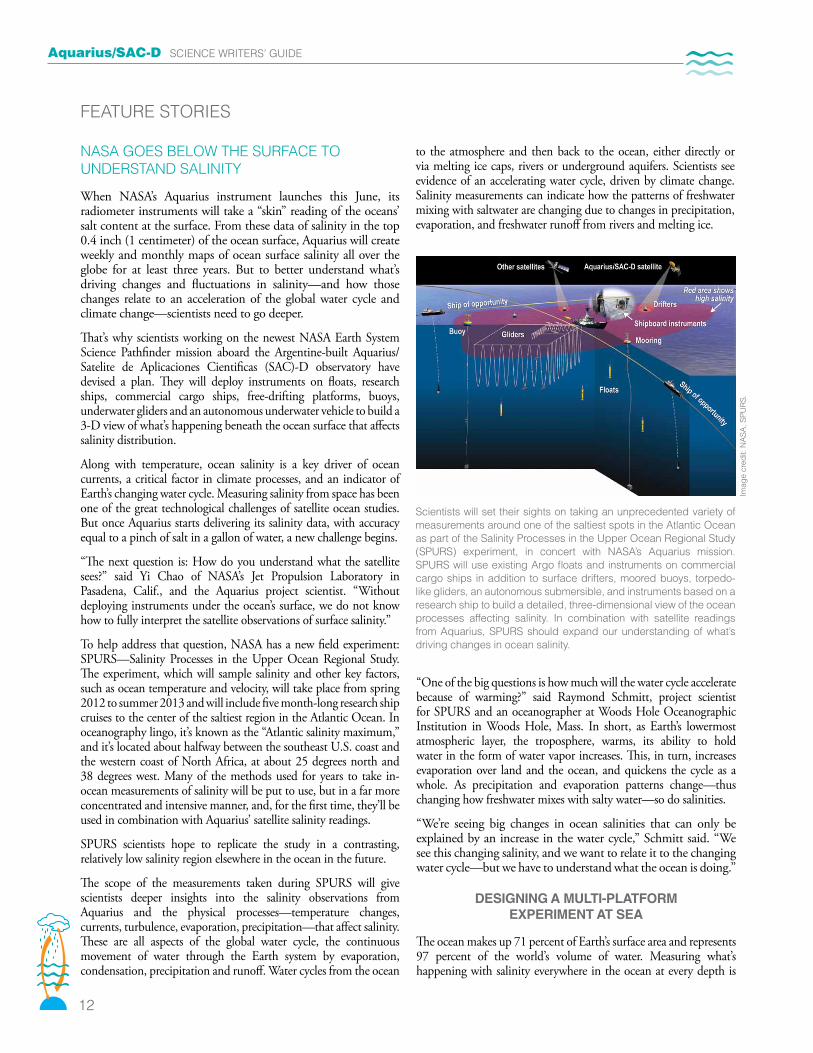
Scientists will set their sights on taking an unprecedented variety of measurements around one of the saltiest spots in the Atlantic Ocean as part of the Salinity Processes in the Upper Ocean Regional Study (SPURS) experiment, in concert with NASA’s Aquarius mission. SPURS will use existing Argo floats and instruments on commercial cargo ships in addition to surface drifters, moored buoys, torpedo-like gliders, an autonomous submersible, and instruments based on a research ship to build a detailed, three-dimensional view of the ocean processes affecting salinity. In combination with satellite readings from Aquarius, SPURS should expand our understanding of what’s driving changes in ocean salinity.
Imag
e cr
edit:
NA
SA, S
PUR
S.
Aquarius/SAC-D SCIENCE WRITERS’ GUIDE
13
an impossible task. So the SPURS scientists decided to focus on one representative region and measure that as a proxy. A network of different instruments creates a “bounded” volume of water to study in the SPURS experiment.
SPURS precisely identifies a specific 3-D portion of the Atlantic Ocean, and sets out to measure key ocean processes there as thoroughly as possible. Starting at the surface, commercial cargo ships carrying basic salinity gauges and deploying disposable thermometers will criss-cross the target region on their regular trade routes. Ocean scientists have partnered with commercial ships to do this for years. SPURS will also take advantage of the existing Argo network of profiling floats that measure temperature and salinity at the surface and below. The floats dive as deep as 1.2 miles (2 kilometers) while returning to the surface every 10 days to transmit their measurements via satellite. The international scientific collaboration began in the late 1990s and now maintains more than 3,000 floats worldwide.
It is the multiple additions beyond these existing measurements that will make SPURS more complex than a typical study of ocean processes. Multiple buoys will take basic meteorological measurements at the surface. But cables running to anchors on the ocean bottom will stretch down as deep as 2.5 miles (4 kilometers) below the surface, while instruments deployed on the cables at different depths will take salinity, temperature and velocity readings, Chao said. SPURS will also draw on data from NOAA’s existing PIRATA (Prediction and Research Array Moored in the Atlantic) network, which uses similar buoys moored to the ocean floor.
In addition, about 75 free-floating surface drifters, outfitted with GPS, temperature and salinity instruments, will be deployed in a radius of several hundred kilometers, Chao said. Beneath the surface, NASA will deploy teams of two kinds of “gliders”—torpedo-like autonomous devices that use slight changes in buoyancy and wings to dive up and down and propel themselves forward, collecting data with instruments onboard.
One class of smaller gliders, called “Slocum gliders,” which operate in shallower water, will be deployed for 20 to 30 days during each research cruise. Multiple “Seagliders” will also be deployed for six to nine months at a time. These gliders travel in a wider circumference and dive to greater depths.
Finally, from onboard during each of the five one-month ship cruises to the site, scientists will operate a CTD profiler (CTD stands for Conductivity, Temperature and Depth) and a battery-powered, propeller-driven autonomous underwater vehicle that they’ll be able to control remotely.
“Salinity has never been measured to the level of detail that SPURS is planning,” Chao said.
The questions Chao, Schmitt and others hope to begin to answer with SPURS range from the smallest to the largest scale. For one, what are the physical processes that determine the location and magnitude of the high-salinity region in the Atlantic being studied? What is the salinity balance on monthly and seasonal time scales, plus regional and larger spatial scales?
Larger questions include how the ocean will respond to temperature and freshwater changes likely to come with a warming climate. How will the meridional overturning circulation—the “global ocean conveyor belt,” which has such a dominant effect on the planet’s climate—change?
“We can see in the patterns of salinity change that something big is going on with the water cycle,” Schmitt said. “Eighty percent of the water cycle happens over the ocean. We need to document and understand how the ocean is responding.”
By Patrick Lynch NASA’s Earth Science News Team
For more information on this topic, contact:
Yi Chao, Aquarius Project Scientist NASA Jet Propulsion Laboratory, Pasadena, Calif. 818-354-8168 [email protected]
Raymond Schmitt, SPURS Project Scientist Woods Hole Oceanographic Institution, Woods Hole, Mass. 508-289-2426 [email protected]
Related Links:
The Aquarius Mission http://www.nasa.gov/aquarius http://aquarius.nasa.gov/ http://www.conae.gov.ar
Ocean Surface Salinity http://science.nasa.gov/earth-science/oceanography/physical-ocean/salinity/
SPURS http://spurs.jpl.nasa.gov/
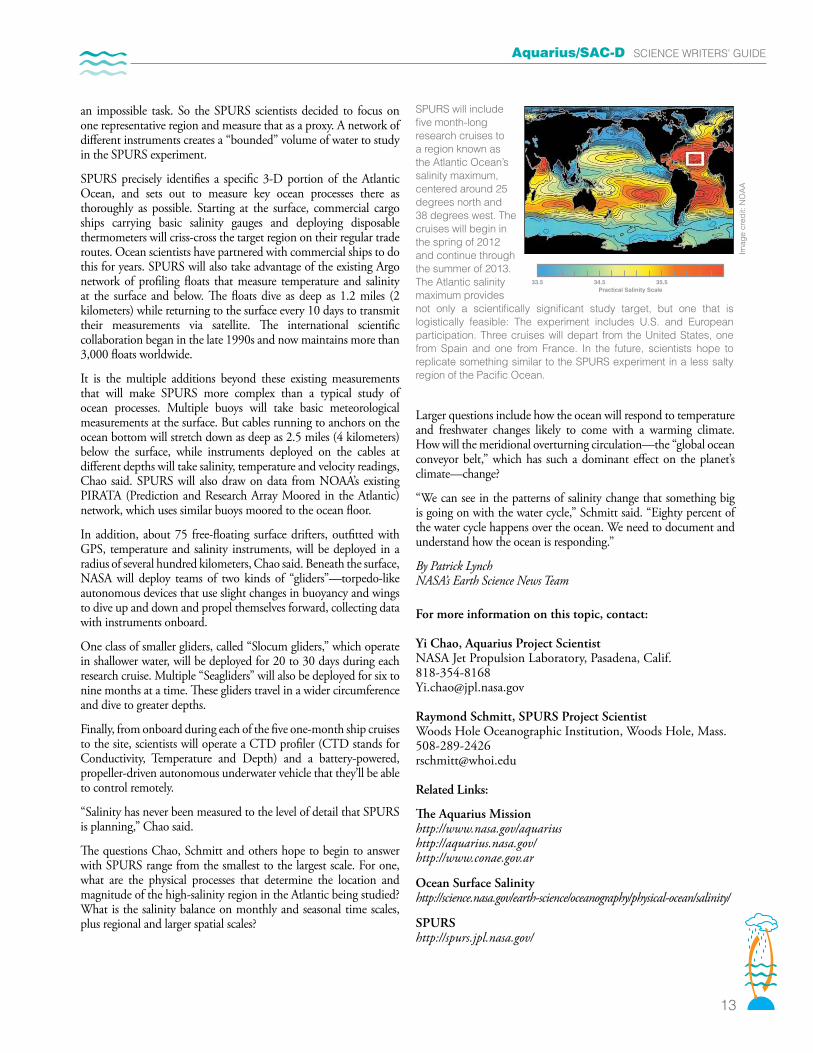
SPURS will include five month-long research cruises to a region known as the Atlantic Ocean’s salinity maximum, centered around 25 degrees north and 38 degrees west. The cruises will begin in the spring of 2012 and continue through the summer of 2013. The Atlantic salinity maximum providesnot only a scientifically significant study target, but one that is logistically feasible: The experiment includes U.S. and European participation. Three cruises will depart from the United States, one from Spain and one from France. In the future, scientists hope to replicate something similar to the SPURS experiment in a less salty region of the Pacific Ocean.
Imag
e cr
edit:
NO
AA
Aquarius/SAC-D SCIENCE WRITERS’ GUIDE
14
AQUARIUS SPOKESPERSONS
Yi Chao is project scientist for the Aquarius mission at NASA’s Jet Propulsion Laboratory in Pasadena, Calif., where he provides the interface between JPL’s Aquarius team and non-JPL members of the Aquarius science team. An oceanographer, his specialties are satellite oceanography, ocean satellite data analysis, and ocean and climate modeling.
Arnold Gordon is a member of the Aquarius science team and associate director of ocean and climate physics at the Lamont-Doherty Earth Observatory at Columbia University in New York. He will be investigating how the resolution and accuracy of Aquarius data will portray the detailed ocean surface salinity patterns as observed from ships and drifting sensors within the ocean. Gordon has expertise in ocean stratification, circulation and mixing, and its role in Earth’s climate system.
Eric Ianson is Aquarius program executive at NASA Headquarters in Washington, where he serves as NASA’s primary program point of contact for the mission, ensuring consistent program direction and execution. His area of specialty is mission development and programmatic implementation.
Gary Lagerloef is principal investigator of the Aquarius mission and founder of Seattle-based Earth & Space Research, a non-profit laboratory. He is responsible for the scientific and technical success of the project and compliance with the mission’s financial and regulatory requirements. He is an oceanographer who specializes in salinity remote sensing, ocean circulation and climate.
William Large is a research modeler and oceanographer at the National Center for Atmospheric Research in Boulder, Colo. He will use Aquarius’ ocean surface salinity data, along with precipitation and temperature observations, to round out the data needed to refine the numerical climate models he and his colleagues have developed.
David Le Vine is deputy principal investigator for the Aquarius mission at NASA’s Goddard Space Flight Center in Greenbelt, Md. Le Vine is a specialist in microwave remote sensing, and is responsible for the Aquarius mission’s science algorithm—the retrieval of salinity from the instrument measurements.
Eric Lindstrom is an oceanographer and Aquarius program scientist at NASA Headquarters in Washington where, among other responsibilities, he assures that mission science is effectively integrated with that of related research programs and that results of the mission are well known throughout NASA and among members of the public. His specialty is physical oceanography and climate.
Amit Sen serves as project manager for the Aquarius mission from NASA’s Jet Propulsion Laboratory in Pasadena, Calif., where he is responsible for coordinating and managing all Aquarius activities on a day-to-day basis within the United States and with international partners. He has extensive experience managing instruments and teams for large and complex international satellite projects like Aquarius.
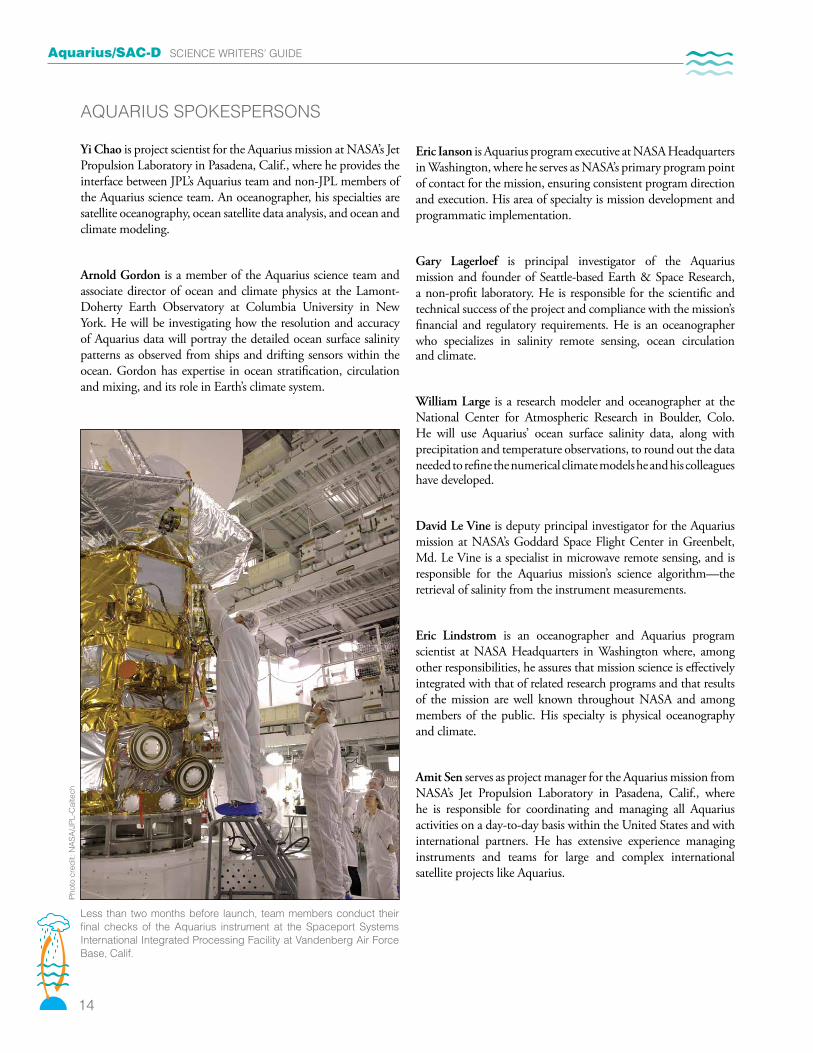
Less than two months before launch, team members conduct their final checks of the Aquarius instrument at the Spaceport Systems International Integrated Processing Facility at Vandenberg Air Force Base, Calif.
Phot
o cr
edit:
NA
SA/J
PL-C
alte
ch
Aquarius/SAC-D SCIENCE WRITERS’ GUIDE
15
AQUARIUS U.S. SCIENCE TEAM MEMBERS
Asher, Bill Applied Physics Laboratory, University of Washington, Seattle
Bingham, Frederick Department of Physics and Physical Oceanography, University of North Carolina Wilmington
Brown, Shannon NASA Jet Propulsion Laboratory, Pasadena, Calif.
Busalacchi, Antonio Earth System Science Interdisciplinary Center, University of Maryland, College Park
Chao, Yi NASA Jet Propulsion Laboratory, Pasadena, Calif.
Fukumori, Ichiro NASA Jet Propulsion Laboratory, Pasadena, Calif.
Gordon, Arnold Earth and Environmental Sciences, Lamont-Doherty Earth Observatory, The Earth Institute at Columbia University, Palisades, N.Y.
Jackson, Thomas United States Department of Agriculture Agricultural Research Service Hydrology and Remote Sensing Laboratory, Beltsville, Md.
Jones, W. Linwood School of Electrical Engineering and Computer Science, University of Central Florida, Orlando
Lagerloef, Gary Earth & Space Research, Seattle
Lang, Roger George Washington University, Washington, D.C.
Large, William Climate & Global Dynamics Division, Earth & Sun Systems Laboratory, National Center for Atmospheric Research, Boulder, Colo.
Le Vine, David NASA Goddard Space Flight Center, Greenbelt, Md.
Lindstrom, Eric NASA Headquarters, Washington, D.C.
Maximenko, Nikolai International Pacific Research Center, University of Hawaii, Honolulu
Ponte, Rui Atmospheric and Environmental Research, Inc., Cambridge, Mass.
Riser, Stephen University of Washington, Seattle
Ruf, Christopher University of Michigan, Ann Arbor
Vandemark, Douglas Institute for the Study of Earth, Oceans, and Space, University of New Hampshire, Durham
Wentz, Frank Remote Sensing Systems, Santa Rosa, Calif.
Yueh, Simon NASA Jet Propulsion Laboratory, Pasadena, Calif.
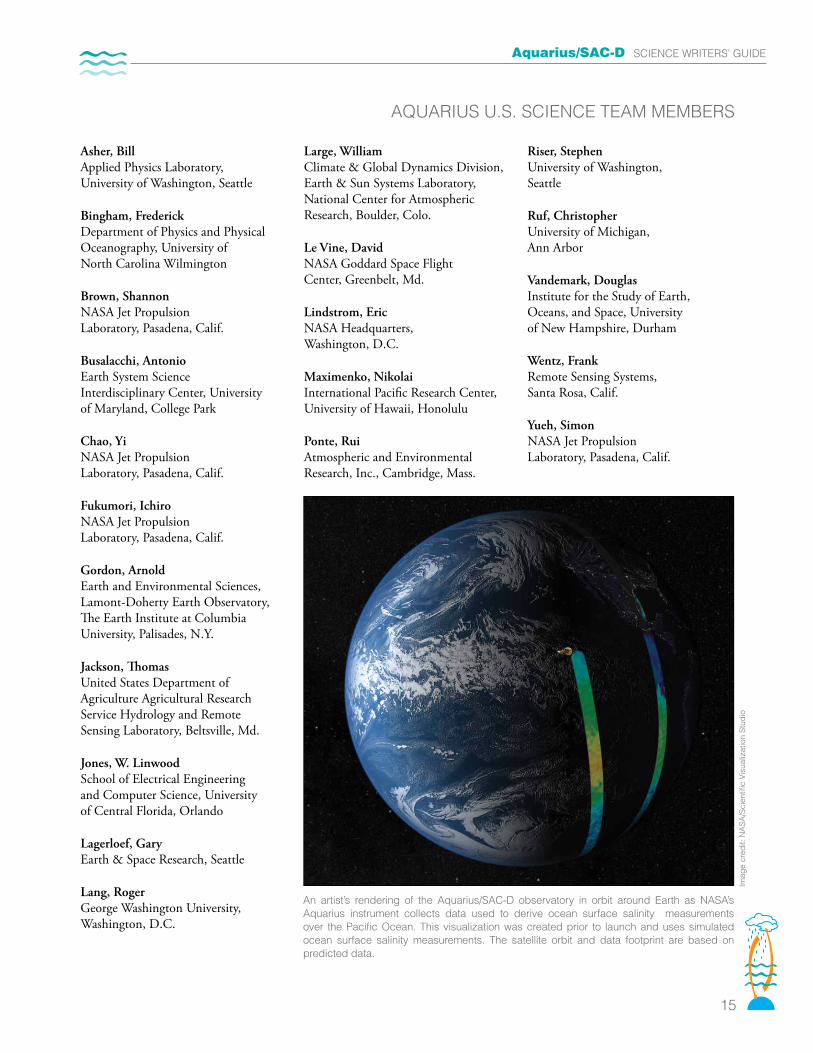
An artist’s rendering of the Aquarius/SAC-D observatory in orbit around Earth as NASA’s Aquarius instrument collects data used to derive ocean surface salinity measurements over the Pacific Ocean. This visualization was created prior to launch and uses simulated ocean surface salinity measurements. The satellite orbit and data footprint are based on predicted data.
Imag
e cr
edit:
NA
SA/S
cien
tific
Visu
aliz
atio
n St
udio

National Aeronautics and Space Administration
www.nasa.gov
NP-2010-12-183-GSFC