Embed Size (px)
Citation preview

National and New York State Highway Bridge Inspections
Sreenivas AlampalliNew York State DOT
MCEER/SUNY@ Buffalo
Buffalo, NY
November 23, 2009

OutlineOutline
National Bridge InspectionsNational Bridge Inspections–– HistoryHistory–– Current statusCurrent statusNew York State Bridge Inspection ProgramNew York State Bridge Inspection Program–– HistoryHistory–– Highlights and differences with National Highlights and differences with National
ProgramProgramLooking into the FutureLooking into the Future

Current National Bridge Inspection Program Current National Bridge Inspection Program What is a bridge?What is a bridge?
It must be over a It must be over a depression or an depression or an obstruction, such obstruction, such as water or a as water or a highway highway
• It must carry traffic and have an opening (span) of more than 20 feet

Highway Bridges - United States
0
10
20
30
40
50
60
1901
- 190
519
11 - 1
915
1921
- 192
519
31 - 1
935
1941
- 194
519
51 - 1
955
1961
- 196
519
71 - 1
975
1981
- 198
519
91 - 1
995
2001
- 200
6
X10000
Year of Construction
Num
ber o
f Brid
ges
~ 600,000Mean Age: 40 yrs PONTIS
NBI

NBIS HistoryNBIS History
1916 Act: Federal Aid to Highways1916 Act: Federal Aid to Highways–– Inspections of highway structures was part of Inspections of highway structures was part of
maintenance work by states and othersmaintenance work by states and others–– More detailed program under Public Roads More detailed program under Public Roads
Administration during 1930Administration during 1930--40s40s1967: Ohio River Bridge Collapse1967: Ohio River Bridge Collapse–– President Johnson formed a task force charged President Johnson formed a task force charged
to determine procedures available to preclude to determine procedures available to preclude future disasters and implement changes, if future disasters and implement changes, if neededneeded

Silver Bridge CollapseSilver Bridge Collapse

NBIS HistoryNBIS History
March 1968 FHWA MemoMarch 1968 FHWA Memo–– Initiated review and inventory of all existing structures, Initiated review and inventory of all existing structures,
to be completed by January 1970to be completed by January 1970–– All structures reviewed once in five yearsAll structures reviewed once in five years–– TwoTwo--year inspection interval for important structuresyear inspection interval for important structures–– Need qualified personnelNeed qualified personnel–– 1964 AASHTO 1964 AASHTO ““Information Guide for Maintenance Information Guide for Maintenance
PersonnelPersonnel””–– Resulted in complete inventoryResulted in complete inventory–– Identified and fixed serious deficienciesIdentified and fixed serious deficiencies

NBIS HistoryNBIS History
1968 Act: Required establishment of NBIS1968 Act: Required establishment of NBIS–– Limited to FederalLimited to Federal--aid Highway Systemaid Highway System–– Inspection FrequenciesInspection Frequencies–– Inspector QualificationsInspector Qualifications1970: Manual Development1970: Manual Development–– AASHTO Manual for Maintenance Inspection of AASHTO Manual for Maintenance Inspection of
BridgesBridges–– FHWA Bridge Inspectors Training ManualFHWA Bridge Inspectors Training Manual1970 Act: Establishment of NBIS in 19711970 Act: Establishment of NBIS in 1971

NBIS HistoryNBIS History
1971 NBIS: Uniform guidelines and criteria1971 NBIS: Uniform guidelines and criteria–– A licensed engineer in each organizationA licensed engineer in each organization–– 22--year inspection cycle (first cycle by July year inspection cycle (first cycle by July ’’73)73)–– Detailed reporting format, appraisal ratings Detailed reporting format, appraisal ratings
(present vs. current desirable), and sufficiency (present vs. current desirable), and sufficiency ratingsratings
–– Inspection types: inventory, routine, damage, inInspection types: inventory, routine, damage, in--depth, and interimdepth, and interim
–– Rating and measurementsRating and measurements

NBIS HistoryNBIS History
1978 Surface Transportation Act:1978 Surface Transportation Act:–– Establishment of HBRR ProgramEstablishment of HBRR Program–– Improve significantly important and unsafe Improve significantly important and unsafe
bridgesbridges–– R&R based on structural deficiencies, physical R&R based on structural deficiencies, physical
deterioration, and functional obsolescencedeterioration, and functional obsolescence–– Extension of inspection program to nonExtension of inspection program to non--federal federal
aid systemaid system–– Classification of bridges for prioritizationClassification of bridges for prioritization
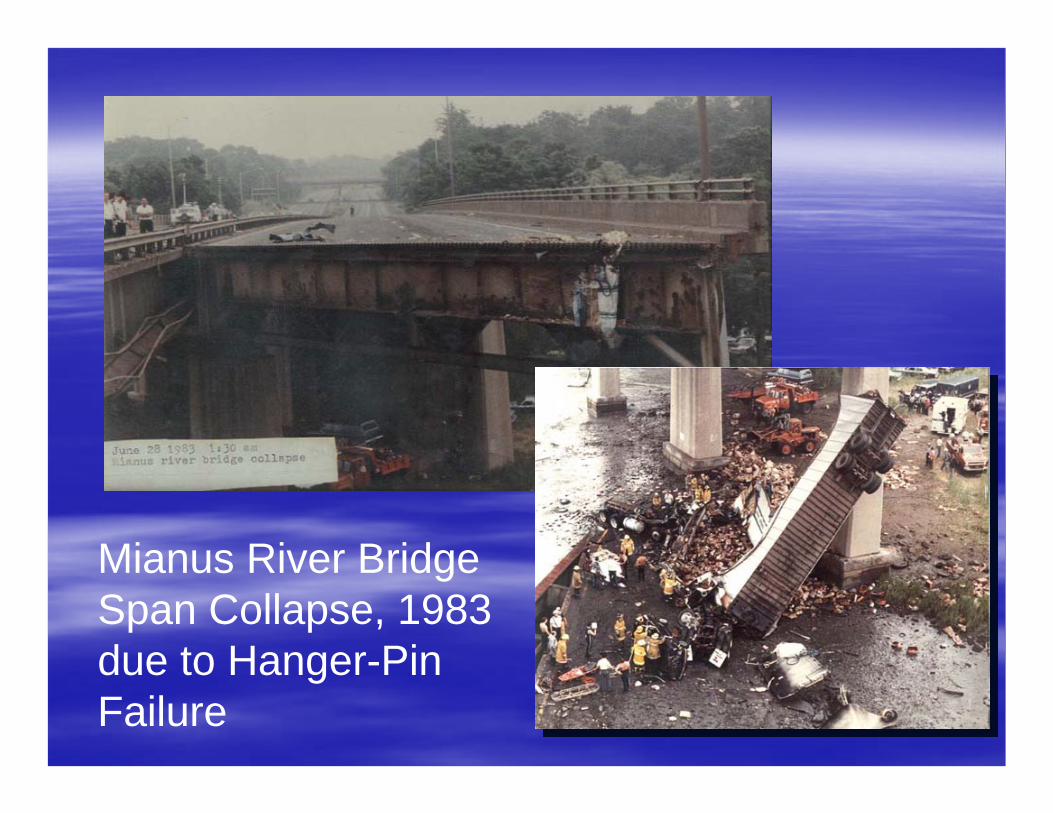
Mianus River Bridge Span Collapse, 1983 due to Hanger-Pin Failure

NBIS HistoryNBIS History1988: NBIS revised1988: NBIS revised–– States can vary frequency of routine bridge States can vary frequency of routine bridge
inspections when certain conditions are metinspections when certain conditions are met–– Establishment of fracture and scour critical Establishment of fracture and scour critical
bridges requiring 2bridges requiring 2--yr max inspection intervalyr max inspection interval–– Special requirements for fracture critical Special requirements for fracture critical
member inspections and appropriate NBI member inspections and appropriate NBI designationsdesignations
–– Underwater bridge inspection requirements Underwater bridge inspection requirements

Schoharie Bridge CollapseSchoharie Bridge Collapse

NBIS HistoryNBIS History
1988: NBIS revised1988: NBIS revised–– Alternative procedures for certifying bridge Alternative procedures for certifying bridge
inspection Team Leaders and required inspection Team Leaders and required competence levelscompetence levels
–– Change in reporting requirements: 180Change in reporting requirements: 180--days for days for local bridgeslocal bridges
1992 US Court of Appeals, D.C. Ruling1992 US Court of Appeals, D.C. Ruling–– 1993 NBIS Revision: Maximum inspection 1993 NBIS Revision: Maximum inspection
interval of 4 yearsinterval of 4 years

NBIS HistoryNBIS History2004 NBIS Revisions: Effective Jan. 20052004 NBIS Revisions: Effective Jan. 2005–– State DOT is responsible for making sure inspections State DOT is responsible for making sure inspections
are done within the stateare done within the state–– More ways to qualify to be a Team LeaderMore ways to qualify to be a Team Leader–– Two year interval defined as 24 monthsTwo year interval defined as 24 months–– Max inspection interval cannot exceed 48 monthsMax inspection interval cannot exceed 48 months–– Max interval for underwater inspection is 72 monthsMax interval for underwater inspection is 72 months–– FollowFollow--up on critical findingsup on critical findings–– Complex bridgesComplex bridges–– QC/QAQC/QA–– Training for DiversTraining for Divers–– Refresher trainingRefresher training

Current National Bridge Inspection Current National Bridge Inspection ProgramProgram
All publicly owned highway bridges are All publicly owned highway bridges are coveredcoveredMost bridges inspected at least once in twoMost bridges inspected at least once in two--yearsyearsDiving inspections at least once in five yearsDiving inspections at least once in five yearsTeam LeadersTeam Leaders’’ qualifications are definedqualifications are definedRefresher training requiredRefresher training required

Current National Bridge Inspection Current National Bridge Inspection ProgramProgram
Evaluate the entire structure to asEvaluate the entire structure to as--built conditionbuilt conditionRate few elements, indicative of entire structure, Rate few elements, indicative of entire structure, not for localized deteriorationnot for localized deterioration–– SuperstructureSuperstructure–– DeckDeck–– SubstructureSubstructure–– Channel and channel protectionChannel and channel protection–– CulvertsCulverts–– CapacityCapacity
Need a global understanding of structural behavior and failure mechanisms

Current National Bridge Inspection Current National Bridge Inspection ProgramProgram
Federal ratings (0 to 9 Scale)– 9 Excellent; 7 Good; 5 Fair; 3: Serious; 0 Failed
Structurally Deficient– Typically requires significant maintenance and repair to remain in
service– Need eventual rehabilitation or replacement to address deficiencies– In order to remain in service, are often posted with weight limits
Functionally obsolete– Refers to a bridge’s inability to meet current standards for
managing the volume of traffic it carries, not its structural integrity– For example, a bridge may be functionally obsolete if it has narrow
lanes, no shoulders, or low clearances
Current National Bridge Inspection Current National Bridge Inspection ProgramProgram
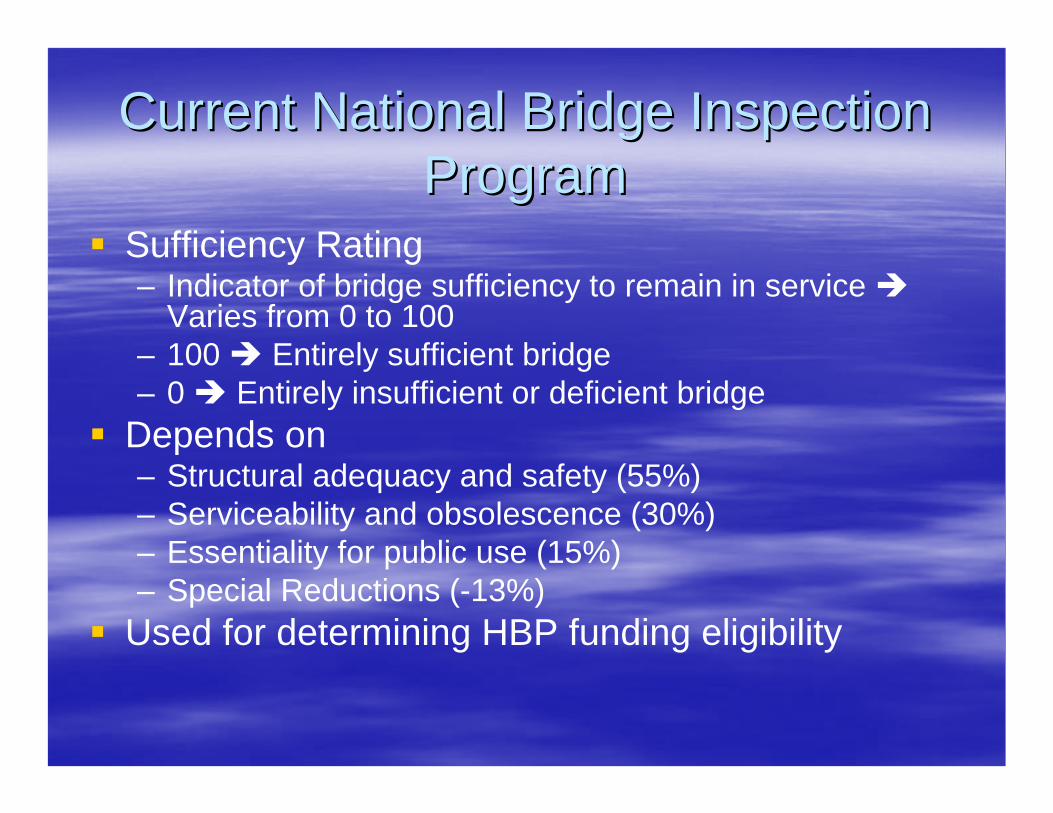
Sufficiency Rating– Indicator of bridge sufficiency to remain in service
Varies from 0 to 100– 100 Entirely sufficient bridge– 0 Entirely insufficient or deficient bridge
Depends on– Structural adequacy and safety (55%)– Serviceability and obsolescence (30%)– Essentiality for public use (15%)– Special Reductions (-13%)
Used for determining HBP funding eligibility

Current National Bridge Inspection Current National Bridge Inspection ProgramProgram
Several states go beyond FHWA Several states go beyond FHWA requirements and conduct element level requirements and conduct element level inspectionsinspections–– Varies from state to state significantlyVaries from state to state significantlyCondition RatingsCondition Ratings–– Generated directly through inspectionGenerated directly through inspection–– State data converted through translatorState data converted through translator

NYS Bridge Population
New York State is home to more than 17,000 highway bridges– About 44 percent of them owned by the State
Department of Transportation (NYSDOT) – Roughly 50 percent owned by municipalities – The rest are owned by state and local authorities (such
as the State Thruway Authority), commissions (such as the Capital District State Park Commission), and railroads (such as CSX Corporation, Inc.)
Total NYS highway bridge area: 136 million square feet (about 5 square miles or over 3,100 acres)
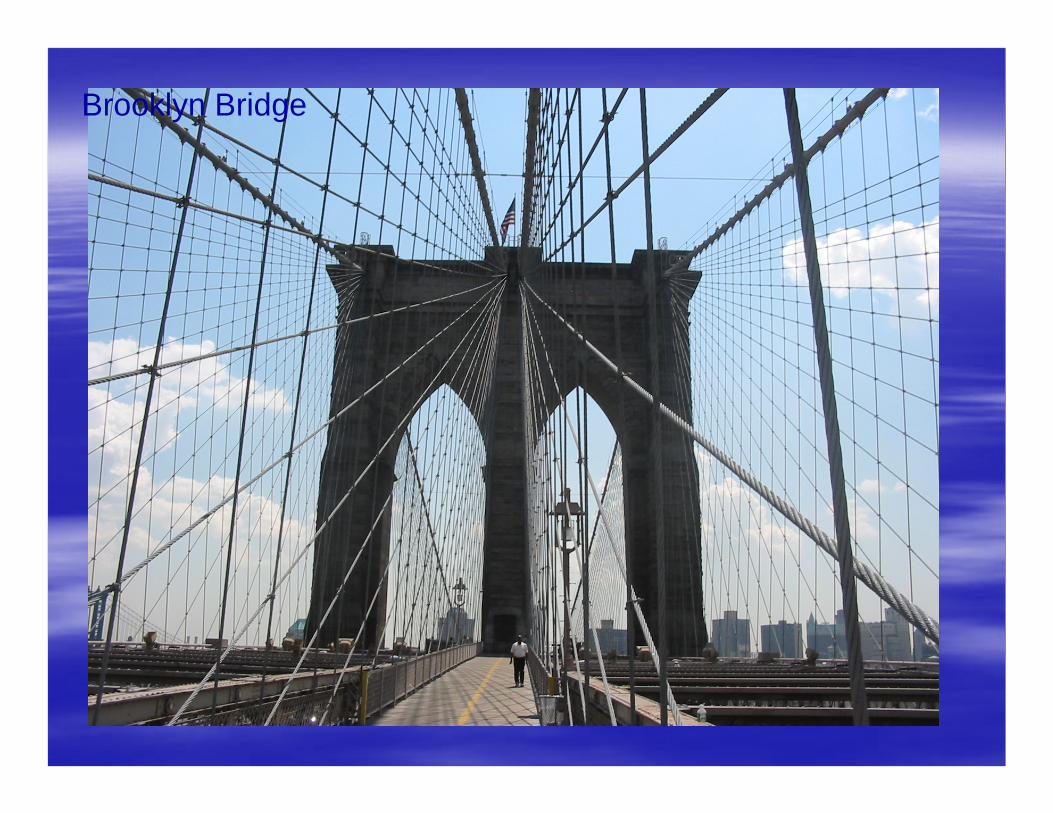
Brooklyn Bridge

Manhattan Bridge from Brooklyn Bridge

George Washington Bridge


Twin Arches, Latham, NY


NYS Bridge Ownership

NYS Highway Bridges by Material
63%
18%
14%
3%
2%
steel
reinforced concrete
prestressed concrete
timber
other (masonry,aluminum, iron, etc.)

NYS Bridge Population

NY Inspection History
1930s to 1970s– Touring route bridges inspected by the state regional
personnelInspectors did not always have structural backgroundLimited or no trainingNo standardized proceduresValue of inspection was not realized or appreciated
– Local bridge owners were responsible for their bridges– Limited bridge inventory and inspection corporate
databaseUsed to support planning functions

NY Inspection History
Early 1970s– Assigned to Structures Division– Ad hoc Inventory and Inspection units formed– Better inventory data collection (BIIS emerged!)– Element level inspections with ratings collected in every
inspection cycle– Computerized inventories started with paper print-outs– Reduction in staff, limited to one-man inspections– But no dedicated staff or equipment– Failed to meet federal standards in many cases

NY Inspection HistoryLate 1970s– State became responsible for inspection of local
bridges thru 1977 state legislation1978-79: Consultants hired for inspection, inventory, and load rating of local bridgesMostly compliant with federal standardsTwo-man inspection teams with reasonable work access
Schoharie Creek Collapse in 1987– Five vehicles fell into water with 10 fatalities

NY Inspection History
1988 Legislative Action (Graber Bill)– Resulted in Uniform Code of Bridge Inspection– The current program resulted due to this bill– Higher standards than those imposed by FHWA
Inspector QualificationsLoad RatingStructural Integrity EvaluationsDatabase EstablishmentBridge Safety Assurance Program
– Flagging Procedure

NY Inspection History
1993 Automation Efforts Initiated– Electronic Bridge Inspection (BIPPI) in 1999– By 2003 BIPPI in full use by all regions
2003 Automation– Moved old database to Oracle Database – Easy access to data with ad hoc querying
capabilities– Data update done on a daily basis– Annual Federal Data generated automatically

Inspection Basics“Statutory Requirements:– Federal Regulations: National Bridge
Inspection Standards (NBIS)– NYS Regulations: Uniform Code of
Bridge Inspection
Bottom line is to ensure the safety of the traveling public

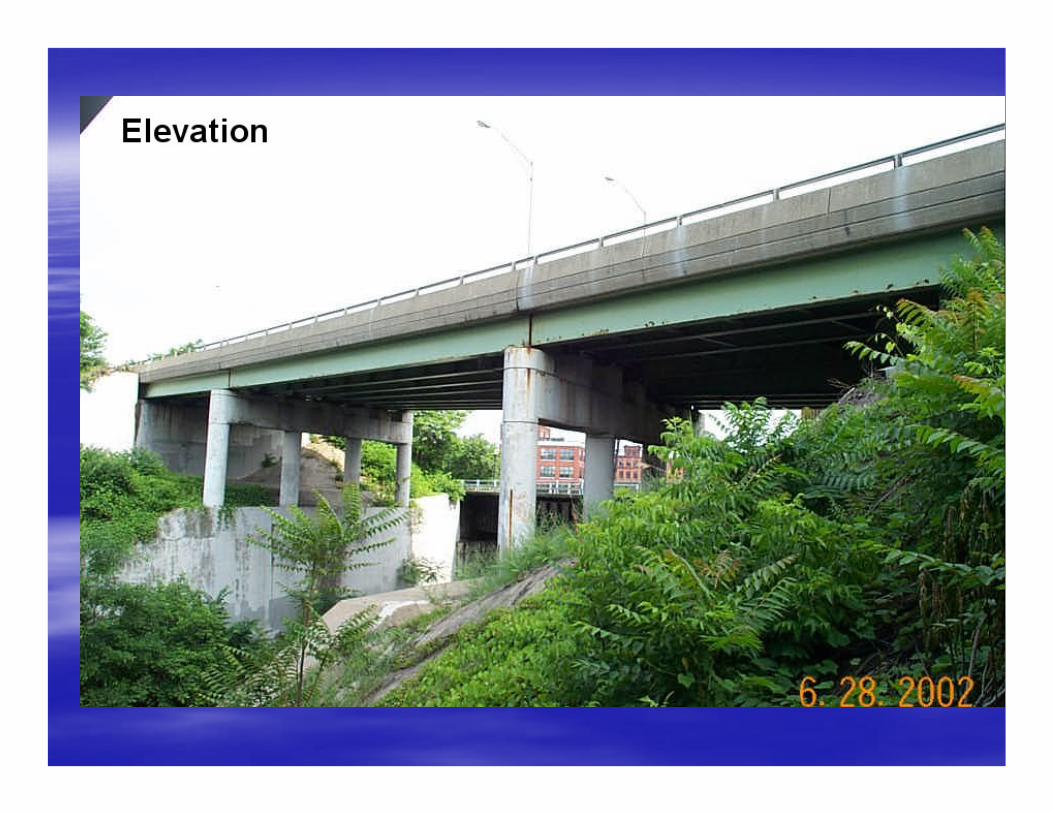
NY Inspection Standards
Reference Manuals– NYS Bridge Inspection Manual (BIM - 1997)
including addendums and appendices– NYS Bridge Inventory Manual (2004)– Bridge Diving Inspection Manual– Bridge Inspection Safety Manual– Federal Manuals

Sight
Sound
Touch

InspectionAll inspections completed by a Team Leader (PE) and an Assistant Team Leader– Both inspection types examine and evaluate all
elements of the bridge– Rate 47 elements, on a span basis– Measure and sketch deterioration and scour as
necessary– Update load rating and inventory data– Flag serious bridge deficiencies that require fast
attention, or to report conditions that are or may be a clear and present danger

NYS Bridge Inspection Rating Scale
7 -- New condition, no deterioration6 – shade between 7 and 5 5 -- Minor deterioration and
functioning as designed 4 -- shade between 5 and 33 --Serious deterioration or
not functioning as designed2 -- shade between 3 and 11 -- Totally deteriorated or failed
condition
Def
icie
ntN
on-D
efic
ient
Good
Fair
Poor

What do we inspect?•Some of the major bridge components that are inspected:
•Primary members•Pedestals•Columns•Wingwalls•Bearings•Paint•Wearing surface

Inspection
Condition Rating– It is a rating calculated based on weighted inspection
ratings of several components– Uses 13 different element ratings– When several elements exist, such as piers, the
calculation utilizes lowest rating of all piers– If less than 5.00, the bridge is considered deficient
according to NYSDOTGeneral Recommendation– A number between 1 to 7, based on inspector’s
judgment – very close to condition rating

Inspection
Inspection data gathered using NYSDOT proprietary software BIPPIInterfaces with Bridge Data Management System (BDMS)BDMS provides current inventory and inspection dataContinuous update of BDMS with daily extracts for routine use

NYS Inspection Ratings
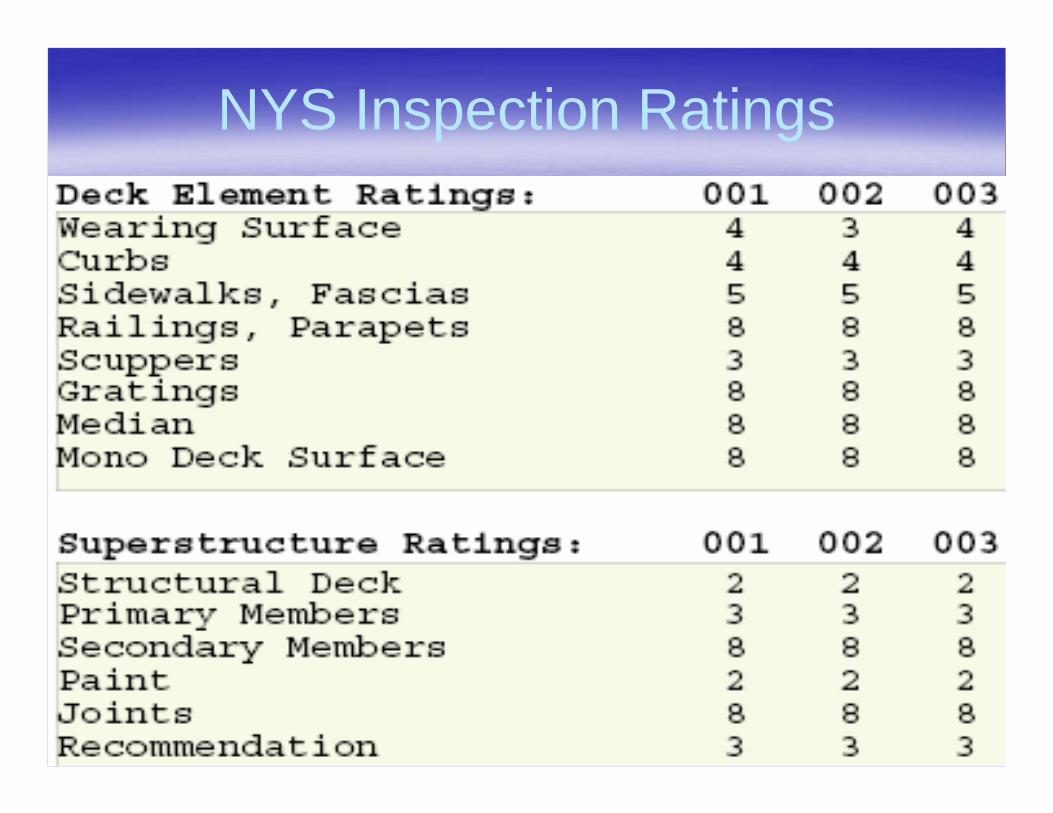
NYS Inspection Ratings

Inspection
Inspection Types and Intervals– General Inspections (every two years or
more)– Diving Inspections (every five years or more)– Special Inspections (as needed)
Reporting Critical Findings– Red Flag– Yellow Flag– Safety Flag

RED FLAG
Most severeRequires quick action (max. 42 days)

YELLOW FLAG

SAFETY FLAGSNon-Structural

Inspection Process
Submit TO QCE For:1) QC Review and
2) Submission to MO for QA Review
MO QA Review:1) No Comments, Finalize Report
2) Comments: Return report for Revisions
Inspection Team Completes Inspection
and Report
Inspector is the only person who can prepare the inspection report

NYS vs. NBIS: Rating Scale
NYS Ratings:– 1 “Total deterioration or failed” - 7 “New”– Base-lined to the original design capacity or original
functioning of the component– Component or element based– Span based - “local” focusFederal Ratings:– 0 “Failed” – 9 “Excellent”– Component condition is rated in comparison to its
original as-built condition– Bridge based – “global” focus

NYS vs. NBIS: Inspection Types
Fracture Critical Member (FCM) InspectionsA Member in Tension, or with a tension element, whose failure would probably cause a portion of the structure to collapse
– NBIS: Steel Member in Tension– NYS: Non- Redundant and FCM
3 Girder SystemCertain concrete deck haunchesDetails vulnerable to Out-of-Plane distortion
In-Depth Inspections

NYS vs. NBIS: Qualifications
Qualification of Inspection Personnel: Team Leader to have 3 years of bridge related experience and a NYS PE
Qualification of Inspection Personnel: Minimum requirements for QCE and ATL

NYS vs. NBIS: Inspection Findings
Critical Inspection Findings: – Robust Inspection Flagging Procedure
Inspection Findings: – Federal Coding requirements emphasize 5
major bridge components and their condition – NYS documents 8 groups of components
encompassing 47 elements

Uses of Inspection Data Maintaining Current Bridge Data– Element condition based queries– Inventory based queries– Element / Feature Combinations
Assuring Safety of Traveling Public and Structure– Critical Findings (Structural and Safety related)– Emergency Repairs– Closures (Post-Event)– Flood Watch – Postings and Closings

Load Rating
Load rating is the determination of the safe live load capacity of a bridgeUsed for determining what loads can go on a bridgeUpdated after every inspection and as neededLL Capacity = (Capacity – DL Effect)/SF


Load RatingDone using bridge structural element database and software such as AASHTOWare® VIRTIS – Deterioration data collected from inspections
Load testing is another option– Diagnostic tests– Proof load tests

Why Inspect Bridges?Why Inspect Bridges?
Bridge ManagementBridge Management–– Preventive maintenancePreventive maintenance–– Corrective maintenanceCorrective maintenance–– Replacement and rehabilitation assistanceReplacement and rehabilitation assistance–– Funding eligibility determinationFunding eligibility determination–– Permitting operationsPermitting operations–– PostPost--event assessmentevent assessment

Uses of Inspection Data
Scheduling Maintenance Activities– Emergency Repairs– Flag Repairs– Corrective Maintenance– Preventative Maintenance
Satisfying Federal and State Reporting Requirements– Annual “Federal Tape”– Annual NYS “Report of Bridge Management and
Inspection Programs” – Graber Report

Uses of Inspection Data
Providing Data for Capital Program Planning– Used for developing capital program by using data with
BMS software– Used to compute “Sufficiency Rating” (measure of the
bridge’s ability to remain in service) to determine federal funding eligibility
Supporting Design Functions– Inspection report used as a basis for structural integrity
evaluations, load rating, and other functions– Inspection report documentation as a reference

Uses of Inspection Data
PermitsPost-event assessment– Needed to make decision on opening or closing
a bridge– Prioritization of funding– Appropriate repair actions
Vulnerability Assessment


Uses of Inspection Data
PermitsPost-event assessment– Needed to make decision on opening or closing
a bridge– Prioritization of funding– Appropriate repair actions
Vulnerability Assessment


IMPACT HAZARD

IMPACT HAZARD

Uses of Inspection Data
PermitsPost-event assessment– Needed to make decision on opening or closing
a bridge– Prioritization of funding– Appropriate repair actions
Vulnerability Assessment

CORROSION
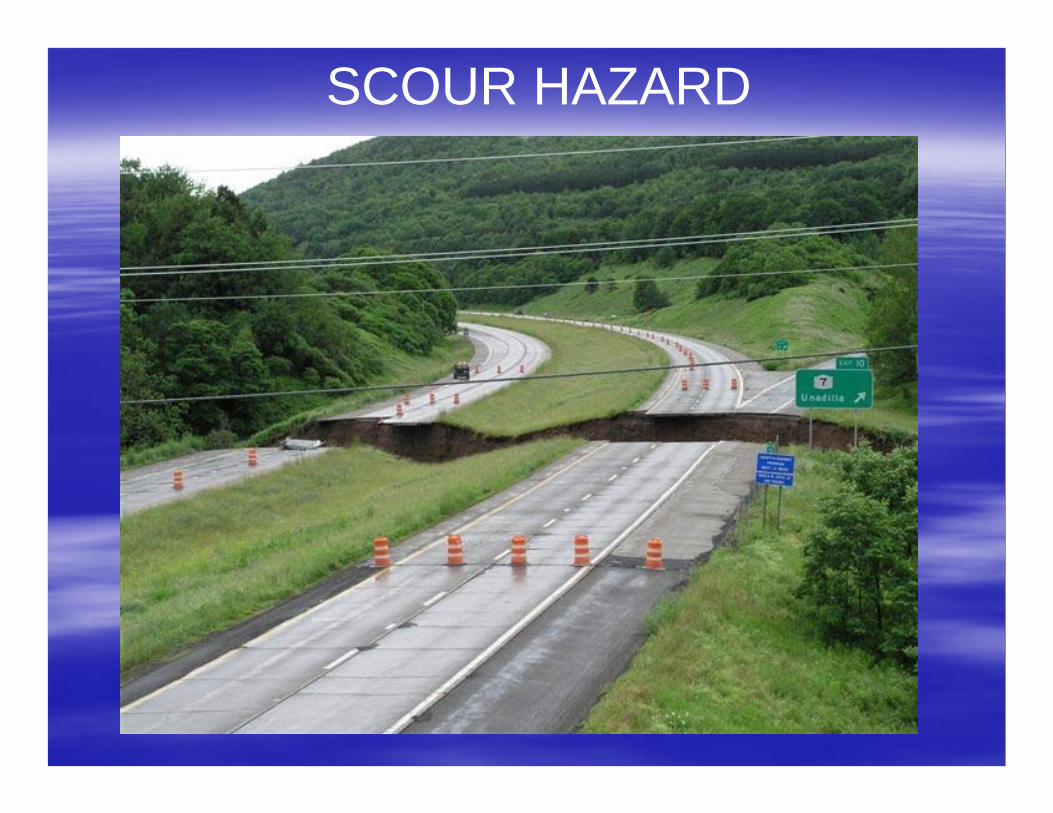
SCOUR HAZARD

SCOUR HAZARD

OVERLOADS

OVERLOADS

SEISMIC HAZARD

STEEL DETAIL


Bridge Vulnerability Program
Pro-active programBased on an expert task force’s recommendationsSystematic evaluations of bridges based on failure modesEvaluate statewide bridge population:
Screen Assess ClassifyClassifications consider risk– Failure likelihood– Consequence

Bridge Vulnerability Program
Bridge Vulnerabilities– Scour– Earthquakes– Collision– Overloads– Steel details– Concrete details– Security

IssuesIssues
FHWA Intended UseFHWA Intended Use–– Assuring safetyAssuring safety–– Inventory and statisticsInventory and statistics–– Planning at national levelPlanning at national level–– Works well for intended purposesWorks well for intended purposesSeveral StakeholdersSeveral Stakeholders–– Several players to satisfySeveral players to satisfy–– Change in formulae and definition can have Change in formulae and definition can have
significant impact on federal funding to statessignificant impact on federal funding to states

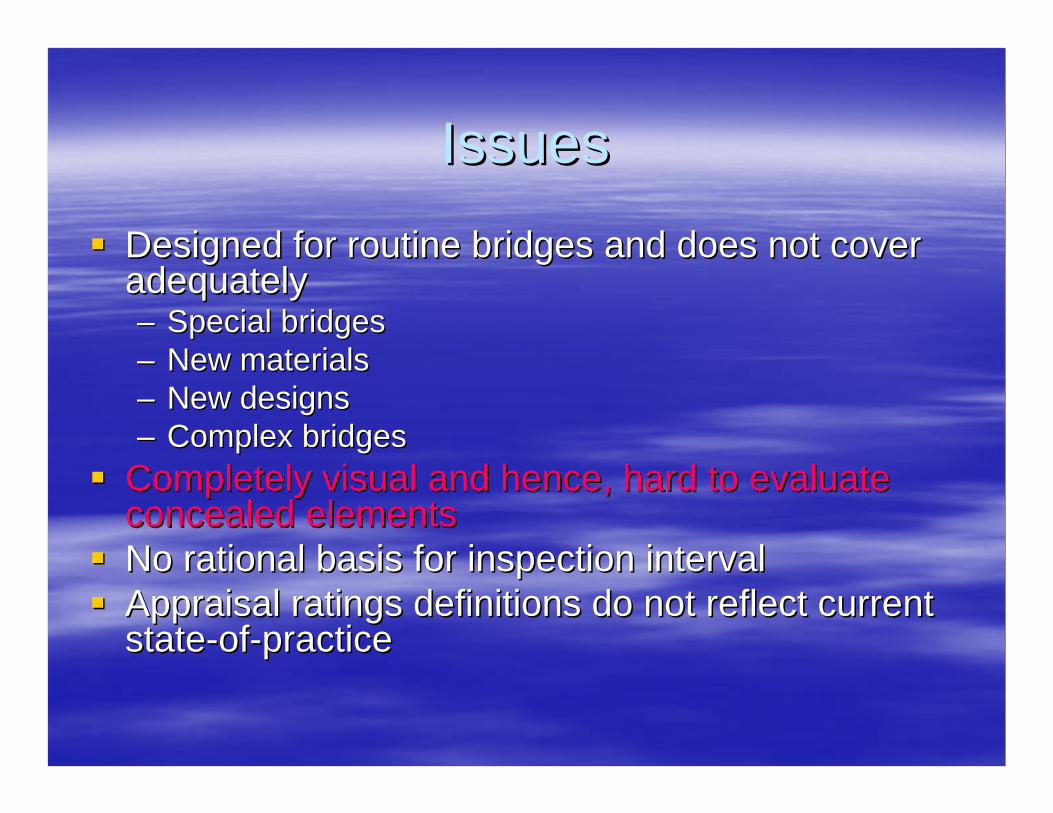
IssuesIssuesDesigned for routine bridges and does not cover Designed for routine bridges and does not cover adequately adequately –– Special bridgesSpecial bridges–– New materialsNew materials–– New designsNew designs–– Complex bridgesComplex bridges
Completely visual and hence, hard to evaluate Completely visual and hence, hard to evaluate concealed elementsconcealed elementsNo rational basis for inspection intervalNo rational basis for inspection intervalAppraisal ratingsAppraisal ratings’’ definitions do not reflect current definitions do not reflect current statestate--ofof--practicepractice


IssuesIssuesDesigned for routine bridges and does not cover Designed for routine bridges and does not cover adequately adequately –– Special bridgesSpecial bridges–– New materialsNew materials–– New designsNew designs–– Complex bridgesComplex bridges
Completely visual and hence, hard to evaluate Completely visual and hence, hard to evaluate concealed elementsconcealed elementsNo rational basis for inspection intervalNo rational basis for inspection intervalAppraisal ratings definitions do not reflect current Appraisal ratings definitions do not reflect current statestate--ofof--practicepractice

Inspecting a 20Inspecting a 20--foot length of cable with wedging at 8 foot length of cable with wedging at 8 points exposes less than 0.1% of the wire for a typical points exposes less than 0.1% of the wire for a typical suspension bridge (4,000 foot main cable with 15,000 suspension bridge (4,000 foot main cable with 15,000 wires).wires).
((Robert Nickerson (1998), Robert Nickerson (1998), ““Safety Appraisal of Suspension Bride Main CablesSafety Appraisal of Suspension Bride Main Cables””, National , National Cooperative Highway Research Program, Transportation Research BoCooperative Highway Research Program, Transportation Research Board, Contractorard, Contractor’’s Report s Report for a Workshop in Newark, NJfor a Workshop in Newark, NJ))
UnexposedExposed
How Much of the Cable is Inspected?
Courtesy of Mike Higgins

FRP Bridge DeckFRP Bridge Deck

IssuesIssues
Limited data: Not effective for bridge Limited data: Not effective for bridge management practicesmanagement practices–– Global ratings: do not extend to element levelGlobal ratings: do not extend to element level–– Qualitative and does not lend to deterioration Qualitative and does not lend to deterioration
rate estimations for significant elementsrate estimations for significant elements–– Need extent of damage for financial estimationsNeed extent of damage for financial estimations–– No link to bridge maintenance practices and No link to bridge maintenance practices and
inspection datainspection dataNot hazard specific (reactive not proNot hazard specific (reactive not pro--active)active)

Looking into FutureLooking into FutureIdentifying and recording data needed to evaluate Identifying and recording data needed to evaluate and improve performanceand improve performance–– Environmental dataEnvironmental data–– Operational data: deicing salts, etc.Operational data: deicing salts, etc.–– Load dataLoad data–– Material dataMaterial data–– Maintenance, R&R dataMaintenance, R&R data
Evaluate how data is used and how it can be used Evaluate how data is used and how it can be used more effectivelymore effectively–– Identify elements needing improvementIdentify elements needing improvement–– Focus on maximum benefit with associated cost Focus on maximum benefit with associated cost

Looking into FutureLooking into Future
Account for structure type and complexityAccount for structure type and complexity–– Inspection intervalInspection interval–– Inspector qualificationsInspector qualifications–– Inspection extent Inspection extent –– Data collectedData collected–– Supplement with NDT methods as neededSupplement with NDT methods as needed–– ResourcesResources–– Addressing critical findingsAddressing critical findings

Brooklyn Bridge


Looking into FutureLooking into Future
More uniformity and consistency in ratingsMore uniformity and consistency in ratings–– Reference bridgesReference bridges–– Uniform QC/QA proceduresUniform QC/QA procedures–– Uniform qualifications, training, and continuing Uniform qualifications, training, and continuing
educationeducation–– Better manualsBetter manuals–– Quantitative dataQuantitative data–– Deterioration extentDeterioration extent–– Recording maintenance dataRecording maintenance data–– Certification and calibration of inspectorsCertification and calibration of inspectors


Looking into FutureLooking into FutureProPro--active inspection and assessmentactive inspection and assessment–– Design and construct for inspection easeDesign and construct for inspection ease–– MultiMulti--hazard approachhazard approach–– Leveraging current sensor and computing Leveraging current sensor and computing
technologiestechnologiesPassive sensorsPassive sensorsNew test methodsNew test methodsSmart structuresSmart structures

Courtesy: K. Rehm, AASHTO

Thermographic InspectionThermographic Inspection

Sensor TechnologiesSensor Technologies
Courtesy of Mike Higgins

Minnesota Bridge Collapse
Bridge Details– Carries I-35W, 8 lanes with 140,000 AADT– Deck truss bridge– Under construction (deck repair)– Rated “structurally deficient” by federal standard
Failure– August 1st, 2007– 13 people killed during rush hour traffic
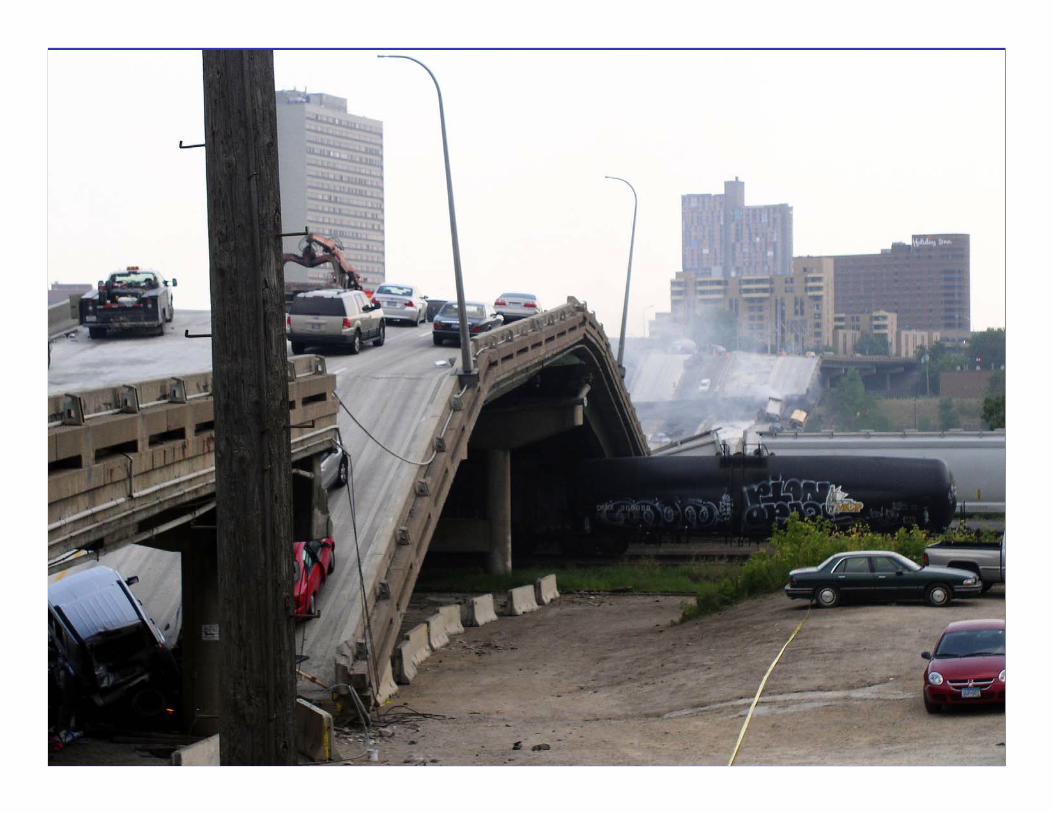

NTSB FindingsReasons for the collapse– Inadequate load capacity of connection due to a design error of the
gusset plates – Failure under a combination of:
Substantial increases in the weight of the bridge, which resulted from previous bridge modificationsTraffic and concentrated construction loads on the bridge the day of the collapse
– Recommended that owners assess the truss bridges in their inventories to identify locations where visual inspections may not detect gusset plate corrosion and use of NDE to assess gusset plate condition
FHWA plans to issue a technical advisory recommending NDE methodology to meet the above recommendation

State and Local SummaryState and Local SummaryRegion Truss Requiring Analysis % Requiring
Population Analysis Completed Analysis
1 108 22 22 20.4%
2 50 11 10 22.0%
3 41 7 7 17.1%
4 87 32 32 36.8%
5 44 9 9 20.5%
6 27 2 2 7.4%
7 70 25 25 35.7%
8 75 11 11 14.7%
9 94 11 11 11.7%
10 6 1 1 16.7%
11 2 1 1 50.0%
Sub Total 604 132 131Percentages 22% 99% 22%

Summary Of RepairsSummary Of RepairsRegion BIN Condition
1 1017670 Six gusset plates replaced due to deterioration
1 1007050 One plate retrofitted, bridge to be replaced
1 4001020 Numerous gusset plates strengthened
1 5521189 Several gusset plates strengthened due to deterioration
2 4030970 Posted 25 Tons until gusset plate repairs completed
5 1041590 Numerous gusset plates strengthened due to deterioration
8 1007140 Several gusset plates deteriorated, Bridge replaced
8 3346530 Numerous plates had severe deterioration, bridge closed
10 2000200 Several gusset plates strengthened due to deterioration
Total 9
No design deficiency was found

ASCE-AASHTO Ad hoc Group
ASCE and AASHTO formed an ad hoc group to identify critical inspection needs and improvements– White paper released in September 2008– Describes gaps, needs and issues with current
practiceReport available on ASCE web siteAlso available in Jan/Feb 2009 issue of the ASCE Journal of Bridge Engineering

Enhancing Bridge Performance Workshop
Co-sponsored by ASCE and FHWAFocused on bridge deterioration, safety, and long-term survivabilityReport is available from ASCE

Other Research
NCHRP Project to study rational based inspection criteriaReview of QC/QA programs was conducted and report available from NCHRP/FHWALong-Term Bridge Performance ProgramEvaluating Consistency/Reliability of NYS Bridge Inspection ProgramRisk based fracture critical inspections –FHWA Study

Looking into FutureLooking into Future
Points to RememberPoints to Remember–– SAFETY FIRSTSAFETY FIRST–– DecisionDecision--making process should drive the making process should drive the
programsprogramsDo not collect data which you are not going to useDo not collect data which you are not going to useDo not use technologies just because they existDo not use technologies just because they existCostCost--benefit analysisbenefit analysisRisk analysisRisk analysisReliability evaluation of technologiesReliability evaluation of technologies

Questions
1. If a bridge is “Structurally Deficient (FHWA)/Deficient (NY),” is it not safe for use by public?
2. What does a red flag mean? How many days does the owner have to address the flag condition?
3. What is the predominant cause of bridge failures in US and in NYS?
Questions
4. How often do bridges get inspected?
5. Why do we inspect bridges?
6. When was the last revision made to National Bridge Inspection Standards (NBIS)?

Contact InformationDr. Sreenivas Alampalli, P.E., MBA, F. ASCEDirector, Bridge Evaluation Services BureauNYSDOTAlbany, NY 12232Tel: (518) [email protected]