Embed Size (px)
Citation preview

NATIONAL AND STATE HEALTHCARE-ASSOCIATED INFECTIONS STANDARDIZED INFECTION
RATIO REPORTUsing Data Reported to the National
Healthcare Safety Network
CS229869
National Center for Emerging and Zoonotic Infectious DiseasesDivision of Healthcare Quality Promotion
January – December 2010
2
Background
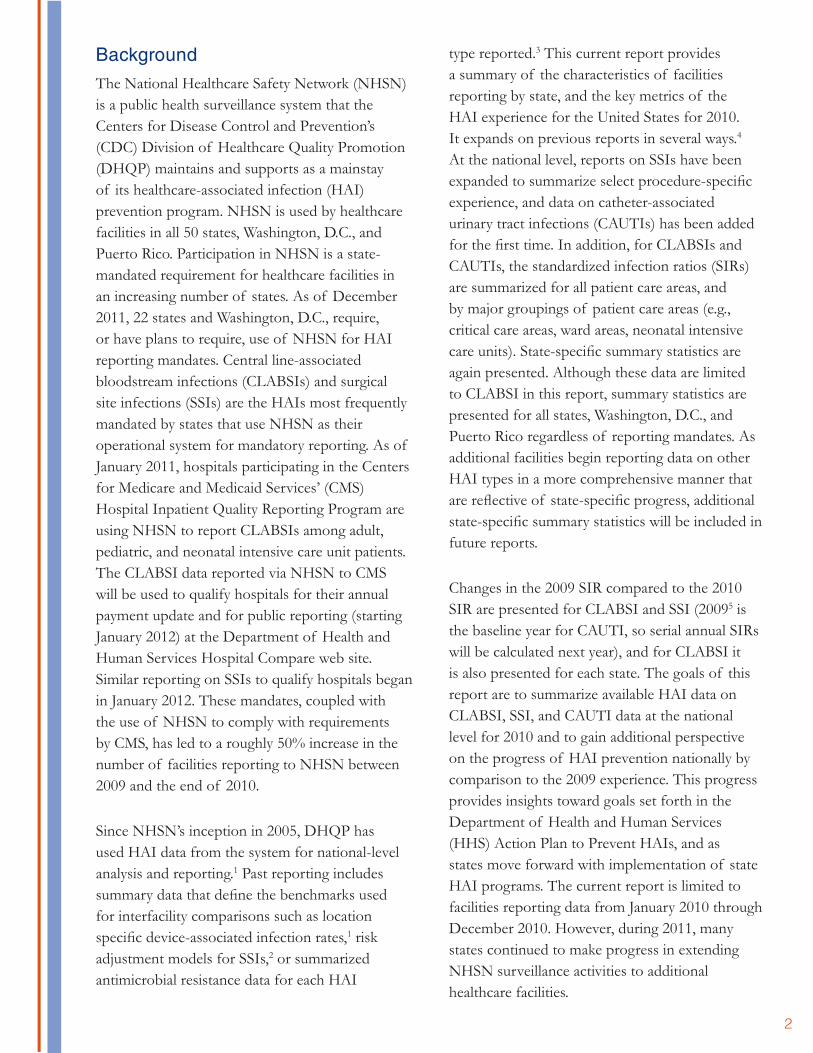
The National Healthcare Safety Network (NHSN) is a public health surveillance system that the Centers for Disease Control and Prevention’s (CDC) Division of Healthcare Quality Promotion (DHQP) maintains and supports as a mainstay of its healthcare-associated infection (HAI) prevention program. NHSN is used by healthcare facilities in all 50 states, Washington, D.C., and Puerto Rico. Participation in NHSN is a state-mandated requirement for healthcare facilities in an increasing number of states. As of December 2011, 22 states and Washington, D.C., require, or have plans to require, use of NHSN for HAI reporting mandates. Central line-associated bloodstream infections (CLABSIs) and surgical site infections (SSIs) are the HAIs most frequently mandated by states that use NHSN as their operational system for mandatory reporting. As of January 2011, hospitals participating in the Centers for Medicare and Medicaid Services’ (CMS) Hospital Inpatient Quality Reporting Program are using NHSN to report CLABSIs among adult, pediatric, and neonatal intensive care unit patients. The CLABSI data reported via NHSN to CMS will be used to qualify hospitals for their annual payment update and for public reporting (starting January 2012) at the Department of Health and Human Services Hospital Compare web site. Similar reporting on SSIs to qualify hospitals began in January 2012. These mandates, coupled with the use of NHSN to comply with requirements by CMS, has led to a roughly 50% increase in the number of facilities reporting to NHSN between 2009 and the end of 2010.
Since NHSN’s inception in 2005, DHQP has used HAI data from the system for national-level analysis and reporting.1 Past reporting includes summary data that define the benchmarks used for interfacility comparisons such as location specific device-associated infection rates,1 risk adjustment models for SSIs,2 or summarized antimicrobial resistance data for each HAI
type reported.3 This current report provides a summary of the characteristics of facilities reporting by state, and the key metrics of the HAI experience for the United States for 2010. It expands on previous reports in several ways.4 At the national level, reports on SSIs have been expanded to summarize select procedure-specific experience, and data on catheter-associated urinary tract infections (CAUTIs) has been added for the first time. In addition, for CLABSIs and CAUTIs, the standardized infection ratios (SIRs) are summarized for all patient care areas, and by major groupings of patient care areas (e.g., critical care areas, ward areas, neonatal intensive care units). State-specific summary statistics are again presented. Although these data are limited to CLABSI in this report, summary statistics are presented for all states, Washington, D.C., and Puerto Rico regardless of reporting mandates. As additional facilities begin reporting data on other HAI types in a more comprehensive manner that are reflective of state-specific progress, additional state-specific summary statistics will be included in future reports.
Changes in the 2009 SIR compared to the 2010 SIR are presented for CLABSI and SSI (20095 is the baseline year for CAUTI, so serial annual SIRs will be calculated next year), and for CLABSI it is also presented for each state. The goals of this report are to summarize available HAI data on CLABSI, SSI, and CAUTI data at the national level for 2010 and to gain additional perspective on the progress of HAI prevention nationally by comparison to the 2009 experience. This progress provides insights toward goals set forth in the Department of Health and Human Services (HHS) Action Plan to Prevent HAIs, and as states move forward with implementation of state HAI programs. The current report is limited to facilities reporting data from January 2010 through December 2010. However, during 2011, many states continued to make progress in extending NHSN surveillance activities to additional healthcare facilities.

3
The HAI data presented in this report are summarized using the SIR, a summary statistic used to measure relative difference in HAI occurrence during a reporting period compared to a common referent period (e.g., standard population). In HAI data analysis, the SIR compares the actual number of HAIs with the predicted number based on the baseline U.S. experience (e.g., standard population), adjusting for several risk factors that have been found to be most associated with differences in infection rates. The aggregate SIRs presented in this report are quantitative indicators of the current status of HAI prevention in acute care hospitals from across the United States for three major HAIs and of national progress toward their prevention. However, the SIRs are not intended to serve as comprehensive and conclusive HAI measures for all uses and users of HAI data. More specific data at the state and healthcare facility levels are needed to target specific HAI problems and monitor impact of prevention programs. Publication of this report is one step among many in providing data needed for analysis and action at all levels, with the intent of spurring additional progress toward HAI elimination throughout the United States.
Methods
Eligible Data
This report includes data from surveillance activities performed during 2010 and reported either mandatorily or voluntarily by healthcare facilities to NHSN from facilities across all 50 states, Washington, D.C., and Puerto Rico. Data used in these calculations were restricted to the most up-to-date NHSN definition for CLABSI in 2008,6 and for CAUTI in 2009.7 Any data reported from non-acute care hospitals (e.g., long-term care hospitals) and from dialysis wards or facilities were excluded from this report. All acute care hospital patient care locations were included in this report. Data were accessed October 5, 2011, to allow for a 10-month latency period to help ensure complete reporting of HAIs and
denominator data through December 2010. This is slightly extended compared to the 6-month latency period of previous reports.
To illustrate the degree to which facilities reported to NHSN during 2009 and 2010 in the United States, this report presents the number of facilities and the number of patient care locations reporting within each state. In addition to presenting an all-inclusive category of locations, locations were also stratified into three mutually exclusive groups that reported to NHSN, by state: (for this report, wards also include step-down, specialty care areas [including hematology/oncology, bone marrow transplant], and long-term acute care locations/facilities), and neonatal intensive care units (includes Level II/III and Level III). To facilitate an assessment of growing capacity for NHSN to be used for surveillance and prevention activities, these reporting characteristics have been summarized for each reporting period (2009 and 2010). Although comparisons of HAI experience were made at the location level using existing descriptions of location, further work is needed to confirm the accurate categorization of several location types by reporting facilities. These types include improved categorization of long-term acute care locations and confirmation of accurate mapping of hematology/oncology locations. Therefore, summary statistics for these distinct patient-care areas will be considered in future years after confirmation and accurate categorization has occurred.
The SSI data reported here include only a subset of the operative procedures on which facilities perform surveillance and report HAI data. This subset includes many of the more commonly reported procedures and approximates those targeted for process-of-care improvements by the Surgical Care Improvement Project (SCIP), a national program led by CMS and CMS-funded Quality Improvement Organizations.8
CDC compared these procedures to NHSN procedure categories and determined the most

4
appropriate mapping between the two groups of procedures. In several instances, multiple NHSN procedure codes were mapped to a single SCIP procedure (Appendix A). This list of procedures is the same as those procedures specified in the HHS Action Plan as targets of SSI prevention.7 However, there are notable differences between procedure groupings included in SCIP and those in this report. These include, but are not limited to, inclusion of both primary and revision hip arthroplasties in the NHSN hip arthroplasty procedure category (while only primary hip arthroplasty is included in the CMS SCIP grouping).
SSI SIRs were reported for the aggregate across all of these procedure types, as well as for each specific procedure category. Consistent with the HHS Action Plan, CDC further limits the SSIs included in this report to a subset of all SSIs reported as deep incisional and organ/space infections that were detected during the hospital admission where the operation was performed or upon readmission to that same hospital.9 Superficial incisional SSIs and any SSIs identified through post-discharge surveillance were excluded in alignment with current recommendations for public reporting summary measures.10
Basic summary statistics of characteristics of reporting by hospitals are presented for each state and nationally. Data external to NHSN were required to compile some of these metrics. Specifically, CDC consulted with each state health department to verify the number of acute care facilities eligible for reporting to NHSN, date of implementation of any mandated reporting, and the performance of any external validation of the reported data. Validation included any data quality assessment of missing or implausible values and/or detection of outlier facilities (e.g., number of infections, rates, denominators), and/or audits of medical records. Information on validation efforts was requested from all states, regardless of presence of a legislative mandate for the particular
HAI type. Some states without mandatory reporting of a given HAI have performed validation on NHSN data that is voluntarily shared with them by facilities.
Summary HAI Data and Calculation of SIRs
The referent period remained January 2006 through December 2008, as in previous SIR reports.4 However, for CAUTI, the referent period is 2009. All facilities reporting at least 1 month of relevant data to NHSN during the referent time period (regardless of any mandate) were included in the referent period; these data are comparable to those reported in the NHSN annual report.1,5 The SIRs represent comparisons of observed HAI occurrence during each distinct reporting period with the predicted occurrence based on the rates of infections among all facilities adjusting for key covariates (referent population). Illustrative examples of how an SIR is calculated are provided in previous reports (http://www.cdc.gov/HAI/surveillance/statesummary.html).4 Although over 40 patient locations are represented in the referent time period,1 during subsequent years, such as 2010, some facilities reported HAI data from location types not represented in the referent time period. In these scenarios, an SIR cannot include data from these new location types.
The CLABSI and CAUTI SIRs are adjusted for patient mix by type of patient care location, hospital affiliation with a medical school, and bed size of the patient care location. Other factors, such as hospital bed size, were not consistently associated with differences in CLABSI or CAUTI rates after accounting for patient location and, therefore, were not included in CLABSI SIR risk adjustment. For NICUs, the pooled mean umbilical catheter-associated BSI (UCAB) rate and the CLABSI infection rate within each of the five birth weight categories were used to determine the predicted number of device-associated BSIs from each reporting facility, referred to as CLABSIs for this report.1 Of note, clinical sepsis (without

5
laboratory-confirmed bloodstream infection) was not included in the calculations of CLABSI during either the reporting period or referent period. CAUTIs are not reported from NICUs.
For SSI SIRs, risk models were constructed evaluating all available procedure-related risk factors (e.g., duration of surgery, surgical wound class, use of endoscopes, status as re-operation, patient age, and patient assessment at time of anesthesiology [ASA score]) to provide the best possible adjustment for differences in patient-mix within each type of surgery. These risk models were constructed specifically for this report to predict SSIs reported as deep incisional or organ/space infections and only those detected during admission or upon readmission to the same hospital.2 A summary of the adjustment parameters are listed in Appendix A. As additional procedure-specific data become available to NHSN improved risk models can be constructed.
For the national and state SIR, all eligible data were included and the total number of infections predicted was compared to the number observed at each level of aggregation. Second, facility-specific SIRs were also calculated for each of the summary measures presented nationally. However, if a single facility’s predicted number of HAIs (e.g., CLABSI) was <1.0, a facility-specific SIR was neither calculated nor included in the determinations of the distribution of facility-specific SIRs. This report considered calculations of a facility-specific SIR as reliable only when at least one HAI would be predicted based on the data reported to NHSN from that facility. For the state-specific aggregation of HAI data, state-specific SIRs were not reported unless at least five facilities reported data. In addition, if fewer than 20 facilities had reliable facility-specific SIRs, then no key percentile distributions of facility-specific SIRs were calculated (such as occurred with abdominal aortic aneurysm repair at the national level) for that level of reporting. Because most states had sufficient reporting from facilities to calculate
reliable state-specific SIRs, including roughly half with sufficient reporting to reliably calculate key percentile distributions, state-specific summary data is reported for all states.
An SIR of 1.0 should be interpreted as indicating that the number of events the entity (e.g., state health department, healthcare facility) observed is no different than if its experience had been the same as that of the referent population. Because the SIR is an estimate based on calculations of reported data, confidence intervals (CIs) are calculated to allow for accurate interpretation of the SIR. If these CIs include a value of 1.0, the SIR should be interpreted as if it were 1.0. The CI around the SIR depends on several factors, including the number of facilities reporting data from the relevant patient care locations, the number of device days or operative procedures that were reported, and the types of facilities reporting.
Serial Comparison of SIRs
The evaluation of progress in the prevention of HAIs was assessed by comparing the SIRs between sequential years. This was first accomplished by comparing the SIRs between each of the sequential reporting periods. A second sensitivity analysis was performed by restricting the reporting facilities to only those that reported during the initial reporting period, referred to as the change in SIR for continuously reporting facilities. A conditional binomial test was performed to assess statistically significant changes in the pairs of sequential SIRs (two-sided P-value ≤.05). If the change was not statistically significant, it was reported as “no change.” Prevention success can be measured as sustained (similar SIRs between reporting periods), improved (SIRs sequentially decreasing), or slowing (SIRs sequentially increasing toward or above 1.0). Because data for this report uses all data reported to NHSN through October 5, 2011, calculations of the 2009 SIR will differ slightly from reports using datasets created earlier in time, including those reported by individual state health departments.

6
Results
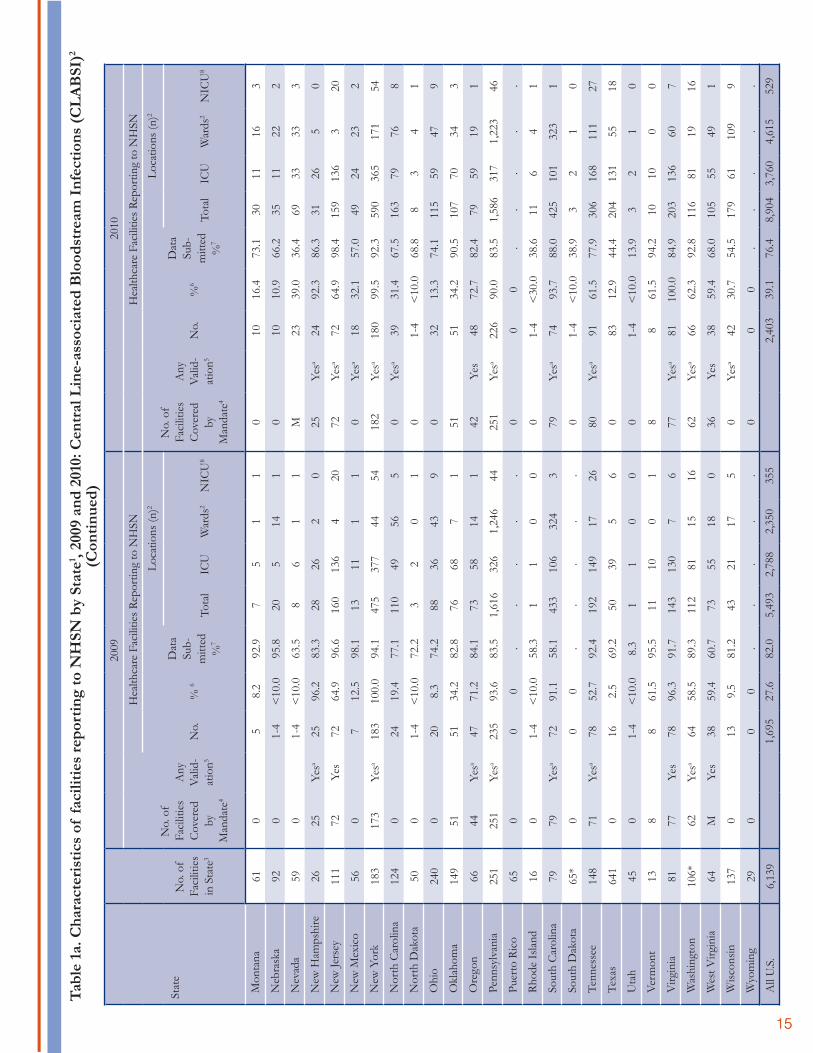
Table 1 (Tables 1a, 1b, 1c) summarize the variability and extent of HAI reporting to NHSN for each CLABSI, CAUTI, and SSI by state, respectively. CLABSI data were reported from at least one facility in 49 states and Washington, D.C., and in only seven of these 49 did fewer than five facilities contribute CLABSI data. In many instances a large number of facilities reported data in states without mandates, and overall 2,403 facilities contributed CLABSI data in 2010 compared to 1,695 (50% increase) in 2009. These facilities reported CLABSI data from 8,904 different locations (3,760, 42% critical care; 4,215, 52% ward; 529, 6% NICU). CAUTI data were reported from at least one facility in 47 states and Washington, D.C., and in only 13 of these 47 did fewer than five facilities contribute data. Overall 1,097 facilities contributed CAUTI data in 2010. These facilities reported from 4,193 different locations (1,491, 36% critical care; 2,702, 64% ward). SSI data were reported in 45 states and Washington, D.C., from 1,385 facilities (an increase of 46% from the 946 facilities reporting in 2009). Ten states had fewer than five facilities reporting SSI data. Overall, 529,038 surgical procedures were reported in 2010 compared to 420,340 during 2009 (25% increase).
Table 2 displays metrics summarizing the HAI experience for the United States. The first overall CLABSI measures include all patient care locations including non-neonatal patient care locations (critical care and wards as defined in the methods) and NICUs; during 2010, 13,812 CLABSIs were reported compared to 20,184.815 predicted for an SIR of 0.684 (95% CI 0.673-0.696). This translates to about a 32% national reduction compared to the referent period. Individual facilities reported a wide range of facility-specific SIRs; half of all facilities reported an SIR <.56 (the median), and 90% of facilities reported SIRs <1.52. This represents an improvement compared to the previous report where about 10% of facilities were
reporting SIRs > 1.99. When stratified by patient care area groupings, the SIRs were lowest among non-neonatal critical care locations (SIR 0.654), then NICUs (SIR 0.695), followed by wards (SIR 0.728). The SIR for NICUs is improved compared to the previous report of July-December 2009, where the SIR was reported as 0.86 (95% CI 0.80-0.93).4 Of note, 14 facilities reported only data from the newly defined mixed acuity locations for which there are no comparisons in the referent time period to calculate SIRs; these facilities were excluded from analysis in Table 2, resulting in 2,389 facilities contributing CLABSI data to the overall CLABSI SIR.
For CAUTIs reported from all patient care areas (excluding NICUs), 9,995 CAUTIs were reported while 10,656.872 were predicted, resulting in an SIR of 0.938 (95% CI 0.920-0.993). A slightly higher SIR was observed among critical care locations (SIR 0.967, 95% CI 0.942-0.993) compared to ward locations (SIR 0.903, 95% CI 0.876-0.930). This translates into a reduction in CAUTIs of about 3% (ICUs) to 10% (ward locations) since 2009 (the referent period for CAUTI).
The national SSI SIR was summarized across the procedure types outlined previously and was limited to SSIs classified as deep incisional or organ/space infection and detected during admission or readmission to the same hospital in which the procedure was performed. For the overall national SSI SIR, 4,737 deep incisional or organ/space SSIs were reported during initial admission or upon readmission from 529,038 procedures; based on the various factors reported for these procedures, 5,170.309 would have been predicted (SIR 0.916, 95% CI 0.89-0.943). Nationally, this experience translates to an 8% reduction in the incidence of these SSIs among this group of procedures, similar to what was reported in the July-December 2009 SIR report.4 Again, the facility-specific SIRs summarized in Table 2 demonstrate great variability; 25% of the

7
facilities reported an SIR >1.29 (75th percentile), that is, 29% more SSIs than would have been predicted, similar to the experience reported last year.
When procedure-specific SIRs were calculated, the number of procedures reported within each category was a small subset of the total. Also, the number of facilities contributing data to any of the procedure-specific SIRs varied considerably. This included lows of 21, 31, and 50 facilities reporting data on rectal surgery, abdominal aortic aneurysm repair, or peripheral vascular bypass surgery respectively, to a high of 966 reporting data on knee arthroplasty. The resulting procedure-specific SIRs range from 0.648 to 1.285. However, only three of the procedure-specific SIRs significantly differed from 1.0: knee arthroplasty (SIR 0.892, 95% CI 0.840-0.947), coronary artery bypass graft surgery (SIR 0.820, 95% CI 0.766-0.876), and colon surgery (SIR 0.909, 95% CI 0.853-0.968). This may be in part due to small sample sizes of some procedure-specific estimates or lack of successful prevention efforts for any of a variety of reasons.
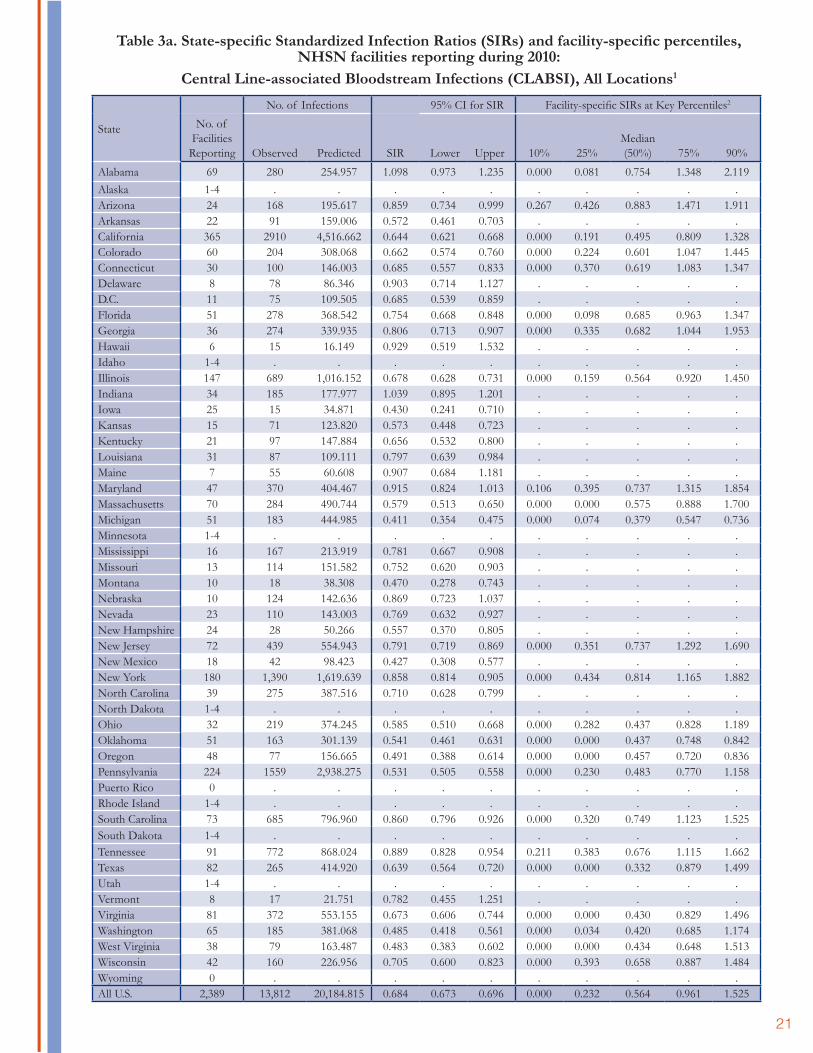
Table 3 illustrates state-specific SIR. For the overall CLABSI SIR calculations (Table 3a) in 42 states and Washington, D.C., SIR could be calculated. In 35 of these sites the SIR was significantly lower than 1.0. In roughly half of these sites, over 20 facilities reported enough data to calculate a reliable facility-specific SIR, allowing some assessment of the variability in performance across a wide range of facilities. In several states, >10% of individual facilities have considerably high SIRs (e.g., >1.9). Critical care location-specific (Table 3b), ward-specific (Table 3c), and NICU-specific (Table 3d) SIRs illustrate a similar pattern, although these estimates are less precise due to fewer data in each strata. Of note, validation activities including an external authority performing a medical record audit (YESa in Table 1) occurred in 16 states reported in Table 3b, mostly among states with a mandate to report to NHSN. The SIRs from
states reporting such validation reported summary SIRs (Table 3b) modestly higher than other states; however none were >1.0, one was no different than 1.0, and 15 were significantly <1.0. The median SIR among states reporting such validation efforts was 0.675 compared to the value of 0.654 for the entire United States.
Table 4 presents serial SIRs for specific states with sufficient data in both reporting periods, comparing 2009 to 2010. SIRs represent CLABSI from all locations. The columns under “All Reporters” include data from all facilities reporting in either of the reporting periods, while those under “Continuously Reporting Locations” represent data from only those locations and facilities reporting in both years. Of the 52 reporting sites, nine had insufficient data to report serial SIRs. Of the remaining 43, only two reported increased SIRs, neither of which was statistically significant when restricted to continuously reporting facilities. In contrast, 21 reported decreases in CLABSI SIR, of which 20 remained significant when restricted to continuously reporting locations.
Table 5 presents serial SIRs for national CLABSI and SSI data for 2009 compared to 2010. These data assess progress in preventing HAIs between two sequential reporting periods. SIRs for “All Reporters” include data reported from non-NICU critical care locations, wards, and NICUs. For CLABSI, the SIR significantly decreased between reporting periods, indicating improved reductions compared to 2009. This finding was confirmed when evaluating only those locations reporting in both periods. For SSI, serial SIRs were significantly lower in 2010 compared to 2009 for the overall SSI SIR of coronary artery bypass graft surgery and rectal surgery. However, this measure of improved prevention success was confirmed for only the latter two scenarios. Regarding rectal surgery, the metric is based on only the 11 facilities reporting during the two-year period. The remaining procedures, and all procedures combined, had

8
similar SIRs between the two years, but only knee arthroplasty, colon surgery, and coronary artery bypass graft surgery have SIRs <1.0 in 2010 and 2009 translating to successful reduction in SSIs (Table 4) compared to the baseline period.
Discussion
The HAI data summarized in this report demonstrate healthcare facilities reporting to NHSN during 2010, as a group, reported fewer CLABSIs (32%), CAUTIs (6%), and SSIs (8%) than predicted based on the case-mix of patients and locations that were monitored. Moreover, the CLABSI prevention success improved between reporting periods, as the SIR during 2010 was significantly decreased (SIR 0.684, 32% reduction in CLABSI) compared to 2009 (SIR 0.854, 15% reduction in CLABSI). This suggests that the facilities reporting during both years not only sustained the prevention success of 2009, but improved even more in 2010. Such improvement was more modest for SSIs: the overall SSI SIR decreased from 0.981 to 0.916 when including all reporting facilities, but the decrease lost statistical significance when limiting the comparison to only facilities reporting in both years. This may be a combination of a loss of power (only 904 facilities reported continuously in both years) and lack of substantial progress across all surgery types included. Regardless, there was sustained prevention success, with SIRs significantly lower than 1.0 in both 2009 and 2010. Interestingly, improved prevention success was observed among facilities reporting specifically on coronary artery bypass graft procedures (CABG), with a statistically significantly lower SIR in 2010 (0.820, 18% reduction) compared to that in 2009 (0.962, 4% reduction). While this demonstrates substantial and improved success in prevention of SSIs related to this procedure, there is opportunity for substantial SSI prevention in other procedures.
Another perspective on the potential improvements that could occur can be made
by the evaluation of the facility-specific SIRs reported for each type of HAI, and in each of the major patient-location groups. In most cases, the calculated SIR for the highest 90th percentile of facilities reporting was >1.5, translating to over 50% more HAIs than would have been predicted based on the case-mix. If these worst performing facilities reduced their SIRs to about 1.0, great progress will be realized nationally.
Overall during 2010, 2,403 facilities reported CLABSI data to NHSN, an increase of about 800 facilities compared to the previous year. This increase may be the result of federal funding to support state-based HAI detection and prevention programs in the latter half of 2009. In addition, this increase also can be attributed to the advent of new CMS reporting requirements for hospitals participating in the CMS Hospital Inpatient Quality Reporting Program, which requires participating facilities to report to CMS through NHSN starting in 2011.5 Summary data reported through NHSN to CMS as part of this program will be posted quarterly beginning early 2012. Because these data may be a subset of all data reported to NHSN (e.g., some facilities report to NHSN but do not participate in the CMS Reporting Program), the summary statistics are expected to vary slightly.
Regarding CLABSI prevention success regionally, almost half of the states reported CLABSI SIRs in 2010 significantly <1.0, confirming that the national progress has not been limited to select geographic areas. Furthermore, most of these states reported accelerated prevention success in 2010 compared to 2009.
Roughly 400 more facilities reported SSI data nationally in 2010 compared to 2009, when 946 reported SSI data. This is a reversal of the trend reported in 2009.4 Much of this increase is due to state-specific mandates and facilities beginning to comply with CMS’s Hospital Inpatient Quality Reporting Program, which required facilities to

9
report SSI data through NHSN starting in January 2012.11 Although the number of facilities reporting increased, the proportion of total months of data that could have been submitted decreased slightly in 2010. This again may be due to facilities just entering into the system and reporting in the latter part of the calendar year.
A major consideration for interpretation of these data and for future reports is assessing the confidence in the validity of the data reported. First, specific validation efforts have been focused at the state level, and there is a need for more widespread validation of HAI data reported to NHSN. In this report, completion of validation studies of CLABSI data was reported from 16 states during 2009, and 21 in 2010; evaluations included data quality assessment of missing or implausible values and/or detection of outlier facilities (e.g., number of infections, rates, denominators) in all 21 states, and an audit of medical records in 16. Information on validation efforts was requested from all states, regardless of presence of a legislative mandate for the particular HAI type. Some states without mandatory reporting of a given HAI have performed validation on NHSN data that are voluntarily shared with them by facilities. Validation efforts by state health departments represent an important step toward a more complete understanding of the HAI data reported to NHSN. In previous SIR reports including state-specific data4, validation activities including a medical record audit (YESa in Table 1) by an external authority were anecdotally noted to be associated with higher SIRs. This phenomena is less apparent in this report.
Regardless of the success of validation efforts, inherent variability in case findings of HAIs will occur between facilities, explaining some of the differences in observed infection rates and facility-specific SIRs. Several efforts are in place to improve the accuracy and confidence in these HAI data. These include the availability of
web-based NHSN surveillance training modules (http://www.cdc.gov/nhsn/training.html), including webinars, slide sets, and new, self-paced, interactive, online training courses with continuing education credits available upon successful completion of an assessment; the provision of NHSN training during CDC-hosted events and at professional meetings and conferences; continued improvements to the NHSN system including software changes such as business rules and cross-field edit checks to prevent data entry errors, system alerts to inform users of missing data, and the availability of data quality reports to inform users of aberrant data. In addition, CDC is exploring changes in methodology to minimize unreliable application of the standard definitions and data collection protocols. Finally, CDC is developing guidance and tools for efficient validation work to be implemented by states as resources become available.
The SIRs summarize complex data related to HAIs in a single set of indicators that use national data for a specified time period as a common referent. The indirect standardization technique used to calculate SIRs is the same as for standardized mortality ratios (SMRs), a commonly used method in epidemiology for comparing mortality between a group and a referent population.12 This summary measure should not be used to derive any absolute ranking of facilities or regions, but rather as a tool to identify facilities or regions that may deserve targeted evaluations, which may include validation efforts or assessing potential prevention programs.
When interpreting data in this report, it is important to understand the extent to which SIRs are risk adjusted. For device-associated infections, the risk stratification is mostly by the location of the patient, often split into different strata further by status as a teaching facility, and several times further split by number of beds in the location.1 Additional data, such as hospital-level case-mix indices, or patient-specific device use data, may result in improved risk adjustment and are being

1010
explored for incorporation into future evaluations. For SSIs, risk stratification includes procedure- and patient-specific factors.2 Secondly, despite efforts through validation and training, infection prevention staff often interprets or implements surveillance methods differently. To minimize the variability in application of standardized methods, changes in NHSN methods are planned for 2013 and beyond. As these planned changes are finalized and implemented, their impact on our ability to report consistently over time will be an ongoing challenge.
Conclusion
This report presents a set of national summary statistics for CLABSIs, CAUTIs, and SSIs for 2010, including serial SIRs for CLABSI and SSI for 2009-2010. As a single summary measure of prevention success, there has been a large reduction (32%) in CLABSIs among reporting hospitals compared to predictions and more modest reductions for CAUTI and SSI. Prevention success improved in 2010 compared to the 2009 level of success for CLABSI. For SSI, improved prevention success over the two years was documented most significantly for coronary artery bypass graft operations (in 2010, 18% SSIs prevented), while stable reductions in SSIs were evident for two of the nine other operative procedures evaluated (knee arthroplasty, 11% reduction; colon surgery, 9% reduction). Overall, there appears to be great room for improvement across the variety of operative procedures. Serial comparisons of CLABSI at the state-level provide an improved means for monitoring the impact of interventions and indicate the successes of state-based and national HAI reduction efforts. Ongoing interactions with state health departments will be critical to determine ways to improve the reporting of HAIs and to act on these data to prevent HAIs. Although comparative data on HAIs
(e.g., comparing the local facility to the referent group) are available to each participating facility at all times through the NHSN system, facility-specific SIRs have been used by an increasing number of state departments to present annual HAI summary.13-20 CDC will continue to report SIRs at the national level as a measure of progress toward the HHS HAI Action Plan targets and to gauge the impact of federal support to the states for HAI prevention. However, first and foremost, these summary data add to a comprehensive body of data related to HAI occurrence for analysis and action at the local, state, and national levels.

11
References1. Edwards J, Peterson KD, Mu W, Banerjee S, Allen-Bridson K, Morrell G, et al. National Healthcare Safety Network (NHSN)
Report: Data Summary for 2006 through 2008, issued December 2009. Am J Infect Control. 2009 Dec;37(10):783-805. Available at: http://www.cdc.gov/nhsn/PDFs/dataStat/2009NHSNReport.PDF. Accessed Mar 1, 2010.
2. Mu Y, Edwards JR, Horan TC, Berrios-Torres SI, Fridkin SK. Improving Risk-Adjusted Measures of Surgical Site Infection for the National Healthcare Safety Network. Infect Control Hosp Epidemiol 2011;32(10):970-986.
3. Hidron AI, Edwards JR, Patel J, Horan TC, Sievert DM, Pollock DA, Fridkin SK for the National Healthcare Safety Network Team and Participating National Healthcare Safety Network Facilities. Antimicrobial-resistant pathogens associated with healthcare-associated infections: annual summary of data reported to the National Healthcare Safety Netowrk at the CDC, 2006-2007. Infect Control Hosp Epidemiol 2008;29:996-1011.
4. Centers for Disease Control and Prevention. CDC’s National Healthcare Safety Network (NHSN) Healthcare-associated Infections Summary Data Reports. Available at http://www.cdc.gov/HAI/surveillance/statesummary.html. Accessed Jan 3, 2012.
5. Dudeck MA, Horan TC, Peterson KD, Allen-Bridson K, Morrell GC, Pollock DA, and Edwards JR. National Healthcare Safety Network (NHSN) Report, Data Summary for 2009, Device-associated Module. AM J Infect Control. 2011 June; 39 (5): 349-67.
6. Centers for Disease Control and Prevention. Central Line-Associated Bloodstream Infection (CLABSI) Event. Available at: http://www.cdc.gov/nhsn/PDFs/pscManual/4PSC_CLABScurrent.pdf. Accessed Jan 3, 2012.
7. Centers for Disease Control and Prevention. Catheter-Associated Urinary Tract Infection (CAUTI) Event. http://www.cdc.gov/nhsn/PDFs/pscManual/7pscCAUTIcurrent.pdf. Accessed Jan 3, 2012.
8. www.qualitynet.org/dcs/ContentServer?c=Page&pagename=QnetPublic%2FPage%2FQnetTier4&cid=1228760129036
9. US Department of Health and Human Services. Action Plan to Prevent Healthcare-Associated Infections. Washington, DC. 2009. Available at: www.hhs.gov/ophs/initiatives/hai/actionplan/index.html. Accessed Mar 1, 2010.
10. National Quality Forum. National Voluntary Consensus Standards for the Reporting of Healthcare-Associated Infection Data. Washington, DC: National Quality Forum, 2008. Available at: www.qualityforum.org/Publications/2008/03/National_Voluntary_Consensus_Standards_for_the_Reporting_of_Healthcare-Associated_Infection_Data.aspx. Accessed Oct 28, 2010.
11. Department of Health and Human Services, Centers for Medicare and Medicaid Services. 42 CFR Parts 412, 413, 415, et al. Medicare Program; Hospital Inpatient Prospective Payment Systems for Acute Care Hospitals and the Long-term Care Hospital Prospective Payment System Changes and FY2011 Rates; Provider Agreements and Supplier Approvals; and Hospital Conditions of Participation for Rehabilitation and Respiratory Care Services; Medicaid Program: Accreditation for Providers of Inpatient Psychiatric Services; Final Rule. Available at: http://edocket.access.gpo.gov/2010/pdf/2010-19092.pdf. Accessed Oct 28, 2010.
12. Fleiss JL. Statistical Methods for Rates & Proportions. 2nd ed. John Wiley & Sons; 1981.
13. Templeton J, Roitman H, Colorado Health Facility Acquired Infections Advisory Committee. State of Colorado Status Report on the Health Facility Acquired Infections Disclosure Initiative. Colorado Department of Public Health and Environment. Available at: www.cdphe.state.co.us/hf/PatientSafety/Rev%202.4.09_daniels.pdf. Accessed Mar 1, 2010.
14. Massachusetts Executive Office of Health and Human Services Department of Public Health. Healthcare Associated Infection (HAI) in Massachusetts Acute Care Hospitals, July 1, 2008 – June 30, 2009. April 2010. Available at: http://www.mass.gov/eohhs/docs/dph/quality/healthcare/hai-report.pdf. Accessed Oct 28, 2010.
15. New Hampshire Department of Health and Human Services, Division of Public Health Services, Infectious Disease Surveillance Section. State of New Hampshire Healthcare-Associated Infections 2009 Report. August 16, 2010. Available at: www.dhhs.state.nh.us/dphs/cdcs/hai/documents/hai2009.pdf. Accessed Oct 28, 2010.
16. New York State Department of Health. Hospital-Acquired Infections, New York State 2009. September 1, 2010. Available at: www.health.state.ny.us/statistics/facilities/hospital/hospital_acquired_infections/2009/docs/hospital_acquired_infection.pdf. Accessed Oct 28, 2010.
17. 2008 Report: Healthcare-Associated Infections (HAI) in Pennsylvania Hospitals. Pennsylvania Department of Health. Available at: www.portal.state.pa.us/portal/server.pt/document/746426/2008_report_-_healthcare_associated_infections_in_pennsylvania_hospitals_-_2010-01-13_pdf. Accessed Mar 3, 2010.

12
18. South Carolina Department of Health and Environmental Control. 2009 Hospital Infections Disclosure Act (HIDA) Annual Report to the General Assembly on Hospital Acquired Infections. Available at: http://www.scdhec.gov/health/disease/hai/docs/2010%20HIDA%20Annual%20Report.pdf. Accessed Mar 1, 2010.
19. Tennessee’s Report on Healthcare Associated Infections: January 1, 2008–December 31, 2010. Tennessee Department of Health. Available at: http://health.state.tn.us/ceds/PDFs/TNreportHAI0911.pdf. Accessed Jan 3, 2012.
20. State of New Hampshire Healthcare-Associated Infections 2010 Report. Available at: http://www.dhhs.state.nh.us/dphs/cdcs/hai/documents/hai2010.pdf. Accessed Jan 3, 2012.

13
2010 State-Specific and National SIR Report: CLABSI, CAUTI, and SSI
Table 1a. Characteristics of facilities reporting to NHSN by State, 2009 and 2010: Central Line-associated Bloodstream Infections (CLABSI)
Table 1b. Characteristics of facilities reporting to NHSN by State, 2010: Catheter-associated Urinary Tract Infections (CAUTIs)
Table 1c. Characteristics of facilities reporting to NHSN by State, 2009 and 2010: Surgical Site Infection (SSI)
Table 2. National Standardized Infection Ratios (SIRs) and facility-specific percentiles using HAI data reported from all NHSN facilities reporting during 2010 by HAI and patient population: CLABSIs, CAUTIs, and SSIs
Table 3a. State-specific SIRs and facility-specific percentiles, NHSN facilities reporting during 2010: CLABSIs, all locations
Table 3b. State-specific SIRs and facility-specific percentiles, NHSN facilities reporting during 2010: CLABSIs, critical care locations
Table 3c. State-specific SIRs and facility-specific percentiles, NHSN facilities reporting during 2010: CLABSI, ward (non-critical care) locations
Table 3d. State-specific SIRs and facility-specific percentiles, NHSN facilities reporting during 2010: CLABSI, neonatal intensive care units
Table 4. Changes in State-specific SIRs, 2009 compared to 2010: CLABSI, all locations
Table 5. Changes in National Standardized Infection Ratios (SIRs), 2009 compared to 2010: CLABSI and SSI

1414
Tab
le 1
a. C
hara
cter
isti
cs o
f fa
cilit
ies
repo
rtin
g to
NH
SN b
y St
ate1 ,
2009
and
201
0: C
entr
al L
ine-
asso
ciat
ed B
lood
stre
am I
nfec
tion
s (C
LA
BSI
)2
Stat
e
2009
2010
Hea
lthca
re F
acili
ties
Rep
ortin
g to
NH
SNH
ealth
care
Fac
ilitie
s R
epor
ting
to N
HSN
No.
of
Faci
litie
s in
Sta
te3
No.
of
Faci
litie
s C
over
ed
by
Man
date
4
Any
V
alid
-at
ion5
No.
% 6
Dat
a Su
b-m
itted
%
7
Loca
tions
(n)2
No.
of
Faci
litie
s C
over
ed
by
Man
date
4
Any
V
alid
-at
ion5
No.
%6
Dat
a Su
b-m
itted
%
7
Loca
tions
(n)2
Tota
lIC
UW
ards
2N
ICU
8To
tal
ICU
War
ds2
NIC
U8
Ala
bam
a12
20
1-4
<10
.067
.327
1211
40
6956
.645
.815
711
238
7
Ala
ska
290
1-4
<10
.055
.63
20
10
1-4
<20
.081
.34
30
1
Ariz
ona
105
01-
4<
10.0
100.
04
40
00
2422
.963
.753
4210
1
Ark
ansa
s10
50
65.
759
.620
127
10
2221
.052
.242
299
4
Cal
iforn
ia38
30
139
36.3
73.1
461
220
206
35M
367
95.8
74.0
2,23
954
61,
567
126
Col
orad
o10
059
Yes
6060
.091
.497
6317
1758
Yesa
6060
.082
.210
764
2617
Con
nect
icut
4230
Yesa
3071
.497
.939
380
130
Yesa
3071
.491
.541
380
3
Del
awar
e14
8Ye
s8
57.1
79.6
1813
32
8Ye
s8
57.1
85.5
1913
42
D.C
.16
01-
4<
30.0
90.6
88
00
MYe
s11
68.8
42.6
3624
75
Flor
ida
213
021
9.9
75.1
5737
155
0Ye
s51
23.9
53.2
168
8178
9
Geo
rgia
172
016
9.3
78.4
6940
236
037
21.5
67.4
154
6776
11
Haw
aii
280
1-4
<10
.075
.01
10
00
725
.045
.112
66
0
Idah
o52
01-
4<
10.0
100.
01
10
00
1-4
<10
.040
.36
23
1
Illin
ois
215
150
Yes
148
68.8
80.2
325
228
6631
149
Yesa
148
68.8
87.4
349
227
8438
Indi
ana
147
01-
4<
10.0
75.5
189
72
034
23.1
51.1
9548
416
Iow
a12
10
1-4
<10
.070
.27
52
00
2520
.740
.439
289
2
Kan
sas
156
07
4.5
79.3
2517
62
017
10.9
70.3
4125
133
Ken
tuck
y12
40
1310
.575
.854
3417
30
2116
.970
.367
4518
4
Loui
sian
a22
8*0
104.
485
.056
1932
50
3113
.652
.593
4340
10
Mai
ne36
01-
4<
20.0
79.6
2710
161
07
19.4
76.9
3012
171
Mar
ylan
d70
45Ye
sa48
68.6
97.1
114
8315
1645
Yesa
4767
.181
.114
385
4117
Mas
sach
uset
ts11
1*73
Yesa
7264
.993
.615
712
918
1073
Yesa
7164
.095
.115
112
318
10
Mic
higa
n19
00
3216
.880
.410
272
237
052
27.4
67.6
159
100
509
Min
neso
ta14
10
1-4
<10
.043
.84
40
00
1-4
<10
.061
.97
61
0
Mis
siss
ippi
106
06
5.7
89.7
4717
282
016
15.1
76.5
7827
456
Mis
sour
i15
60
85.
190
.616
122
20
138.
390
.528
186
4
1515
Stat
e
2009
2010
Hea
lthca
re F
acili
ties
Rep
ortin
g to
NH
SNH
ealth
care
Fac
ilitie
s R
epor
ting
to N
HSN
No.
of
Faci
litie
s in
Sta
te3
No.
of
Faci
litie
s C
over
ed
by
Man
date
4
Any
V
alid
-at
ion5
No.
% 6
Dat
a Su
b-m
itted
%
7
Loca
tions
(n)2
No.
of
Faci
litie
s C
over
ed
by
Man
date
4
Any
V
alid
-at
ion5
No.
%6
Dat
a Su
b-m
itted
%
7
Loca
tions
(n)2
Tota
lIC
UW
ards
2N
ICU
8To
tal
ICU
War
ds2
NIC
U8
Mon
tana
610
58.
292
.97
51
10
1016
.473
.130
1116
3
Neb
rask
a92
01-
4<
10.0
95.8
205
141
010
10.9
66.2
3511
222
Nev
ada
590
1-4
<10
.063
.58
61
1M
2339
.036
.469
3333
3
New
Ham
pshi
re26
25Ye
sa25
96.2
83.3
2826
20
25Ye
sa24
92.3
86.3
3126
50
New
Jers
ey11
172
Yes
7264
.996
.616
013
64
2072
Yesa
7264
.998
.415
913
63
20
New
Mex
ico
560
712
.598
.113
111
10
Yesa
1832
.157
.049
2423
2
New
Yor
k18
317
3Ye
sa18
310
0.0
94.1
475
377
4454
182
Yesa
180
99.5
92.3
590
365
171
54
Nor
th C
arol
ina
124
024
19.4
77.1
110
4956
50
Yesa
3931
.467
.516
379
768
Nor
th D
akot
a50
01-
4<
10.0
72.2
32
01
01-
4<
10.0
68.8
83
41
Ohi
o24
00
208.
374
.288
3643
90
3213
.374
.111
559
479
Okl
ahom
a14
951
5134
.282
.876
687
151
5134
.290
.510
770
343
Ore
gon
6644
Yesa
4771
.284
.173
5814
142
Yes
4872
.782
.479
5919
1
Penn
sylv
ania
251
251
Yesa
235
93.6
83.5
1,61
632
61,
246
4425
1Ye
sa22
690
.083
.51,
586
317
1,22
346
Puer
to R
ico
650
00
..
..
.0
00
..
..
.
Rho
de I
slan
d16
01-
4<
10.0
58.3
11
00
01-
4<
30.0
38.6
116
41
Sout
h C
arol
ina
7979
Yesa
7291
.158
.143
310
632
43
79Ye
sa74
93.7
88.0
425
101
323
1
Sout
h D
akot
a65
*0
00
..
..
.0
1-4
<10
.038
.93
21
0
Tenn
esse
e14
871
Yesa
7852
.792
.419
214
917
2680
Yesa
9161
.577
.930
616
811
127
Texa
s64
10
162.
569
.250
395
60
8312
.944
.420
413
155
18
Uta
h45
01-
4<
10.0
8.3
11
00
01-
4<
10.0
13.9
32
10
Ver
mon
t13
88
61.5
95.5
1110
01
88
61.5
94.2
1010
00
Virg
inia
8177
Yes
7896
.391
.714
313
07
677
Yesa
8110
0.0
84.9
203
136
607
Was
hing
ton
106*
62Ye
sa64
58.5
89.3
112
8115
1662
Yesa
6662
.392
.811
681
1916
Wes
t Virg
inia
64M
Yes
3859
.460
.773
5518
036
Yes
3859
.468
.010
555
491
Wis
cons
in13
70
139.
581
.243
2117
50
Yesa
4230
.754
.517
961
109
9
Wyo
min
g29
00
0.
..
..
00
0.
..
..
All
U.S
.6,
139
1,69
527
.682
.05,
493
2,78
82,
350
355
2,40
339
.176
.48,
904
3,76
04,
615
529
Tab
le 1
a. C
hara
cter
isti
cs o
f fa
cilit
ies
repo
rtin
g to
NH
SN b
y St
ate1 ,
2009
and
201
0: C
entr
al L
ine-
asso
ciat
ed B
lood
stre
am I
nfec
tion
s (C
LA
BSI
)2
(Con
tinu
ed)

16
State
Healthcare Facilities Reporting to NHSN
No. of Facilities3
NHSN Mandate4
Any Valid-ation5
No. %6
Data Submission
%7
Locations (n)2
Total ICU Wards2
Alabama 122 84 68.9 42.3 216 32 184Alaska 29 1-4 <10.0 100.0 1 1 0Arizona 105 9 8.6 50.0 20 12 8Arkansas 105 8 7.6 63.1 14 5 9California 383 73 20.6 76.2 231 91 140
Colorado 100 23 23.0 62.7 50 31 19Connecticut 42 1-4 <10.0 77.4 7 7 0Delaware 14 1-4 <30.0 73.1 9 6 3D.C. 16 1-4 <20.0 35.8 10 5 5Florida 213 Yes 35 16.4 46.7 132 55 77Georgia 172 19 11.0 80.5 89 38 51Hawaii 28 1-4 <10.0 91.7 1 1 0Idaho 52 1-4 <10.0 55.0 5 2 3Illinois 215 23 10.7 85.7 97 46 51Indiana 147 Yes 36 24.5 50.0 90 35 55Iowa 121 Yes 48 39.7 29.5 70 21 49Kansas 156 15 9.6 76.6 31 23 8Kentucky 124 12 9.7 72.3 44 29 15Louisiana 228* 14 6.1 62.1 53 19 34Maine 36 1-4 <10.0 93.0 19 5 14
Maryland 70 12 17.1 63.4 33 24 9Massachusetts 111* 11 9.9 77.1 16 12 4Michigan 190 24 12.6 69.4 89 38 51Minnesota 141 1-4 <10.0 66.7 3 2 1Mississippi 106 9 8.5 81.1 38 17 21Missouri 156 7 4.5 91.1 16 10 6Montana 61 9 14.8 82.4 27 9 18Nebraska 92 6 6.5 76.0 26 7 19Nevada 59 11 18.6 39.6 37 17 20New Hampshire 26 1-4 <20.0 37.5 10 3 7New Jersey 111 Yes Yes 72 64.9 97.3 131 128 3New Mexico 56 1-4 <10.0 41.7 5 4 1New York 183 53 29.0 84.2 147 122 25North Carolina 124 Yesa 22 17.8 71.0 93 36 57
North Dakota 50 1-4 <10.0 68.3 5 1 4Ohio 240 17 7.1 84.2 68 26 42Oklahoma 149 34 22.8 81.8 74 36 38Oregon 66 15 22.7 92.9 39 21 18Pennsylvania 251 Yes Yesa 236 94.0 88.8 1,622 315 1,307Puerto Rico 65 0 0 . . . .Rhode Island 16 0 0 . . . .South Carolina 79 10 12.7 81.3 28 6 22South Dakota 65* 1-4 <10.0 38.9 3 2 1Tennessee 148 14 9.5 78.7 47 23 24Texas 641 19 3.0 39.7 64 28 36Utah 45 0 0 . . . .Vermont 13 1-4 <10.0 97.2 3 3 0Virginia 81 24 29.6 72.6 127 50 77Washington 106* 28 26.4 87.8 52 37 15West Virginia 64 13 20.3 64.6 72 18 54Wisconsin 137 24 17.5 59.9 129 32 97Wyoming 29 0 0 . . . .All U.S. 6,139 1,097 17.9 76.3 4,193 1,491 2,702
Table 1b. Characteristics of facilities reporting to NHSN by State1, 2010: Catheter-associated Urinary Tract Infections (CAUTI)2

17
State
2009 2010Healthcare Facilities Reporting
to NHSNHealthcare Facilities Reporting
to NHSN
NHSN Mandate4
Any Validation5 No.
Data Submission
%7
No. of Procedures Reported9
NHSN Mandate4
Any Validation5 No.
Data Submission
%7
No. of Procedures Reported9
Alabama 1-4 75.0 1,643 64 41.4 7,560Alaska 0 . . 0 . .
Arizona 1-4 77.1 2,829 6 70.8 3,789Arkansas 1-4 38.9 594 6 54.2 862California 46 65.9 17,439 63 63.5 23,449Colorado Yes Yes 62 87.1 25,451 Yes Yesa 61 91.5 29,799Connecticut 1-4 97.2 2,054 1-4 88.9 1,791Delaware 1-4 100.0 78 M 6 48.6 605D.C. 1-4 16.7 1,098 1-4 38.9 849Florida 8 93.8 3,110 24 62.2 5,526Georgia 8 92.7 7,080 20 65.0 8,677Hawaii 0 . . 0 . .Idaho 1-4 54.2 302 1-4 72.2 647Illinois 7 85.7 3,244 M Yes 130 70.9 30,563Indiana 1-4 95.8 3,017 6 75.0 3,324Iowa 6 80.6 769 1-4 95.8 949Kansas 1-4 94.4 1,484 8 70.8 2,702Kentucky 7 67.9 2,204 1-4 94.4 1,738Louisiana 1-4 93.8 1,743 5 78.3 1,808Maine 1-4 100.0 1,080 1-4 100.0 1,265Maryland 1-4 93.8 3,463 M Yesa 45 54.3 13,868Massachusetts Yes Yesa 68 96.2 35,692 Yes Yesa 67 96.8 36,330Michigan 20 87.1 11,436 23 85.5 14,342Minnesota 1-4 100.0 3,088 6 48.6 2,640Mississippi 1-4 100.0 2,640 10 76.7 3,751Missouri 6 97.2 3,091 6 93.1 2,912Montana 1-4 100.0 2,582 5 45.0 2,603Nebraska 1-4 95.8 857 1-4 95.8 836Nevada 1-4 100.0 756 8 42.7 2,009New Hampshire Yes Yesa 26 91.4 6,185 Yes Yesa 26 93.9 6,642New Jersey Yes Yes 70 90.7 18,006 Yes Yes 72 97.0 29,740New Mexico 1-4 100.0 56 1-4 100.0 48New York Yes Yesa 179 98.1 61,455 Yes Yesa 179 97.4 61,355North Carolina 18 87.5 9,010 20 77.1 5,672North Dakota 0 . . 1-4 50.0 314Ohio 8 85.4 4,785 8 89.6 4,900Oklahoma 8 61.5 2,938 8 82.3 4,169Oregon Yes Yesa 49 85.2 18,289 Yes Yesa 50 88.8 20,490Pennsylvania Yes Yesa 171 92.4 95,820 Yes Yesa 166 94.1 96,846Puerto Rico 0 . . 0 . .Rhode Island 0 . . 0 . .South Carolina Yes Yesa 59 93.4 27,878 Yes Yesa 59 92.0 26,562South Dakota 0 . . 0 . .Tennessee Yes Yes 25 90.7 11,235 Yes Yes 69 62.9 16,409Texas 1-4 54.2 138 24 34.4 2,481Utah 0 . . 0 . .Vermont Yes 13 99.4 2,690 Yes 13 98.1 2,714Virginia 1-4 100.0 1,217 19 57.5 3,696Washington 15 84.4 10,168 44 80.3 27,039West Virginia 5 41.7 631 5 58.3 578Wisconsin 10 100.0 10,873 32 63.8 14,096Wyoming 1-4 50.0 142 1-4 33.3 93All U.S. 946 90.2 420,340 1,385 79.6 529,038
Table 1c. Characteristics of facilities reporting to NHSN by State1, 2009 and 2010: Surgical Site Infection (SSI)

18
Footnotes for Tables 1a, 1b, and 1c:
1. United States, Washington, D.C., and Puerto Rico.
2. Data included in this report are from 2009 (CLABSIs, SSIs) and 2010 (CLABSIs, SSIs, CAUTIs) from acute care facility ICUs (critical care units), NICUs (see 9), and wards (for this report wards also include stepdown, specialty care areas [including hematology/oncology, bone marrow transplant], LTAC locations [or facilities]). Long term care facilities (skilled nursing facilities) and dialysis locations are not included in this report.
3. The number of acute care facilities reported to CDC by the state health department. Where indicated by a “*,” this number was taken from the 2009 American Hospital Association survey of healthcare facilities and acknowledged by the state.
4. The number of acute care facilities eligible to report the HAI type under a mandate; for states in which a mandate exists to report that HAI type to the state health department using NHSN at the beginning of each reporting period. This number is reported to CDC by the state health department. If no mandate existed at the beginning of a reporting period, this number is zero. If no mandate existed at the beginning of a reporting period, but was implemented during the reporting period, the value of this column is “M” for midyear implementation. These values are presumed to be constant over sequential reporting periods unless update provided by state health department. Since mandates regarding surgical procedures vary greatly in type of procedure, the presence or absence of a mandate involving any surgical procedure for acute care facilities is indicated by Yes/No.
5. Yes indicates that the state health department reported the completion of any of the following validation studies of NHSN data reported during the reporting period: data quality assessment of missing or implausible values and/or detection of outlier facilities (e.g., number of infections, rates, denominators). Yesa indicates that the state completed one or both of these activities and also conducted an audit of medical records. Information on validation efforts was requested from all states, regardless of presence of a legislative mandate for the particular HAI type. Some states without mandatory reporting of a given HAI have performed validation on NHSN data that is voluntarily shared with them by facilities.
6. This measure is calculated using multiple data sets. It is calculated by dividing “No. of Healthcare Facilities Reporting” by “No. of Healthcare Facilities,” and multiplying by 100. The denominator comes from either the state health department’s self-reported data, or the 2009 AHA dataset. The numerator comes from the NHSN system, and includes all facilities for which data were reported for at least one month during the 12 month reporting period. For CLABSI, this does not include facilities for which zero central line-days were reported for all 12 months; for CAUTI this does not include facilities for which zero urinary catheter-days were reported for all 12 months; for SSI, this does not include facilities for which zero of the selected procedure types were performed for all 12 months. In states for which the AHA count is acknowledged by the state as the best estimate of number of healthcare facilities, this percentage assumes that all NHSN facilities are included in the AHA facilities count; that is, that the NHSN facilities are a subset of the AHA facilities. However, the AHA data do not necessarily comprise the total pool of facilities eligible to participate in NHSN. There are some AHA facilities that are not participating in NHSN; also, there are some facilities within the NHSN system that are not included in the AHA list. In states with a mandate to report HAI data using NHSN, some facilities in the number provided by the state health department (or in the AHA number) might not be included in mandate (e.g., facilities do not have the units or perform the procedures covered by the mandate; or the mandate covers only facilities above a certain bed size); or, some facilities included in the mandate might have reported zero central line-days, zero urinary catheter-days, or zero of the procedure types performed, for the full 12-month period.
7. This metric is the rate at which facilities submitted data to NHSN during the reporting period. It is calculated by dividing the number of months of data submitted to NHSN by the total number of months of data eligible to be submitted, and multiplying by 100. For CLABSI or CAUTI, a month in which zero device days were reported is not counted in the numerator; for SSI, a month in which zero of the procedure types were performed is not counted in the numerator. For SSI, this is calculated by dividing the number of months that at least 1 procedure was reported to NHSN by the total number of months any procedure could have been reported, multiplied by 100. For example, if a state has two facilities reporting to NHSN, then 24 total months of data could have been submitted to NHSN in a 12-month period. If those two facilities sent in 24 total months of data, the state participation percent is 100%. If one facility submitted data for 8 months and the other for 4 months, then the state participation percent is 50% (data were reported for 12 of 24 total months). For states with a mandate, it is possible for this percentage to be <100 for several reasons, including that some facilities reporting might not be covered by the mandate, might only be submitting selected months of data, or might not have had any central line-days, urinary catheter-days or performed any procedures in a given month to report.

19
8. NICU locations included are those classified by NHSN CDC location codes as Level II/III and Level III neonatal critical care areas. A Level II/III neonatal critical care area is defined by NHSN as: combined nursery housing both Level II and III newborns and infants. A Level III neonatal critical care area is defined by NHSN as: a hospital NICU organized with personnel and equipment to provide continuous life support and comprehensive care for extremely high-risk newborn infants and those with complex and critical illness. Level III is subdivided into four levels differentiated by the capability to provide advanced medical and surgical care.
9. SSIs included are those following select surgical procedures approximating procedures covered by SCIP, using NHSN-defined SSIs that were classified as deep incisional or organ/space, and were detected during admission or upon readmission. The SCIP procedures are listed in Appendix A.

20
Table 2. National Standardized Infection Ratios (SIRs) and facility-specific percentiles using HAI data reported from all NHSN facilities reporting during 2010 by HAI and patient population:
Central Line-associated Bloodstream Infections (CLABSIs), Catheter-associated Urinary Tract Infections (CAUTIs), and Surgical Site Infections (SSIs)
HAI and Patient Population
or Surgical Procedure
No. of Infections 95% CI for SIR Facility-specific SIRs at Key Percentiles1
No. of
Facilities
Reporting
Observed Predicted SIR Lower Upper 10% 25%Median
(50%)75% 90%
CLABSI, all2 2,389 13,812 20,184.815 0.684 0.673 0.696 0.000 0.232 0.564 0.961 1.525
ICUs3 2,140 7,206 11,020.512 0.654 0.639 0.669 0.000 0.197 0.538 0.947 1.531
Wards4 1,069 5,241 7,200.263 0.728 0.708 0.748 0.000 0.187 0.533 0.972 1.560
NICUs5 507 1,365 1,964.039 0.695 0.659 0.733 0.000 0.237 0.611 1.098 1.752
CAUTIs, all6 1,086 9,995 10,656.872 0.938 0.920 0.956 0.000 0.293 0.734 1.243 1.900
ICUs3 806 5,621 5,811.590 0.967 0.942 0.993 0.000 0.252 0.714 1.345 1.865
Wards4 688 4,374 4,845.282 0.903 0.876 0.930 0.000 0.271 0.725 1.229 1.967
No. of
Procedures
SSI, combined procedures7 1,385 529,038 4,737 5,170.309 0.916 0.890 0.943 0.000 0.325 0.799 1.292 1.813
Hip arthroplasty 954 128,721 1,091 1,123.897 0.971 0.914 1.030 0.000 0.239 0.799 1.408 2.252
Knee arthroplasty 966 192,804 1,090 1,221.747 0.892 0.840 0.947 0.000 0.000 0.695 1.329 2.143
Coronary artery bypass graft8
425 79,612868 1,058.919 0.820 0.766 0.876 0.000 0.000 0.569 1.170 1.955
Cardiac surgery 165 19,036 119 142.436 0.835 0.692 1.000 0.000 0.000 0.637 0.916 1.451
Peripheral vascular
bypass surgery50 2,575
63 67.379 0.935 0.718 1.196 0.281 0.493 0.895 1.221 1.550
Abdominal aortic
aneurysm repair 31 492
5 7.715 0.648 0.255 1.363 . . . . .
Colon surgery 462 37,383 971 1,067.917 0.909 0.853 0.968 0.000 0.257 0.788 1.367 1.871
Rectal surgery 21 685 28 21.792 1.285 0.854 1.857 0.000 0.000 1.141 1.771 2.289
Abdominal hysterectomy 604 54,113 407 382.109 1.065 0.964 1.174 0.000 0.000 0.765 1.594 2.526
Vaginal hysterectomy 233 13,617 95 76.398 1.243 1.006 1.520 0.000 0.359 0.906 1.177 1.991
Footnotes for Table 2:
1. To improve estimating SIR distributions, facility-specific key percentiles were only calculated for patient populations or surgical procedures in which ≥20 facilities had a predicted number of HAIs (e.g., CLABSIs, CAUTIs, or SSIs) ≥1 during the reporting period. If a single facility’s predicted number of HAIs was <1.0, a facility-specific SIR was neither calculated nor included in the determinations of the distribution of facility-specific SIRs.
2. Data from all ICUs, wards (and other non-critical care locations), NICUs, and LTAC locations (or facilities).
3. Data from all ICUs; excludes wards (and other non-critical care locations), NICUs, and LTAC locations (or facilities).
4. Data from all wards (for this table wards also include stepdown, specialty care areas [including hematology/oncology, bone marrow transplant], and LTAC locations [or facilities]).
5. Data from all NICU locations, including Level II/III and Level III nurseries. For purposes of this report, both umbilical-line and central line-associated bloodstream infections are considered CLABSIs.
6. Data from all ICUs, wards (and other non-critical care locations), and LTAC locations (or facilities).
7. SSIs included are those following select surgical procedures approximating procedures covered by SCIP, using only SSIs that were classified as deep incisional or organ/space, and detected upon admission or readmission. (Specific NHSN procedures are listed in Appendix A.)
8. Coronary artery bypass graft includes procedures with either chest only or chest and donor site incisions.
21
Table 3a. State-specific Standardized Infection Ratios (SIRs) and facility-specific percentiles, NHSN facilities reporting during 2010:
Central Line-associated Bloodstream Infections (CLABSI), All Locations1
State
No. of Infections 95% CI for SIR Facility-specific SIRs at Key Percentiles2
No. of Facilities
Reporting Observed Predicted SIR Lower Upper 10% 25%Median (50%) 75% 90%
Alabama 69 280 254.957 1.098 0.973 1.235 0.000 0.081 0.754 1.348 2.119Alaska 1-4 . . . . . . . . . .Arizona 24 168 195.617 0.859 0.734 0.999 0.267 0.426 0.883 1.471 1.911Arkansas 22 91 159.006 0.572 0.461 0.703 . . . . .California 365 2910 4,516.662 0.644 0.621 0.668 0.000 0.191 0.495 0.809 1.328Colorado 60 204 308.068 0.662 0.574 0.760 0.000 0.224 0.601 1.047 1.445Connecticut 30 100 146.003 0.685 0.557 0.833 0.000 0.370 0.619 1.083 1.347Delaware 8 78 86.346 0.903 0.714 1.127 . . . . .D.C. 11 75 109.505 0.685 0.539 0.859 . . . . .Florida 51 278 368.542 0.754 0.668 0.848 0.000 0.098 0.685 0.963 1.347Georgia 36 274 339.935 0.806 0.713 0.907 0.000 0.335 0.682 1.044 1.953Hawaii 6 15 16.149 0.929 0.519 1.532 . . . . .Idaho 1-4 . . . . . . . . . .Illinois 147 689 1,016.152 0.678 0.628 0.731 0.000 0.159 0.564 0.920 1.450Indiana 34 185 177.977 1.039 0.895 1.201 . . . . .Iowa 25 15 34.871 0.430 0.241 0.710 . . . . .Kansas 15 71 123.820 0.573 0.448 0.723 . . . . .Kentucky 21 97 147.884 0.656 0.532 0.800 . . . . .Louisiana 31 87 109.111 0.797 0.639 0.984 . . . . .Maine 7 55 60.608 0.907 0.684 1.181 . . . . .Maryland 47 370 404.467 0.915 0.824 1.013 0.106 0.395 0.737 1.315 1.854Massachusetts 70 284 490.744 0.579 0.513 0.650 0.000 0.000 0.575 0.888 1.700Michigan 51 183 444.985 0.411 0.354 0.475 0.000 0.074 0.379 0.547 0.736Minnesota 1-4 . . . . . . . . . .Mississippi 16 167 213.919 0.781 0.667 0.908 . . . . .Missouri 13 114 151.582 0.752 0.620 0.903 . . . . .Montana 10 18 38.308 0.470 0.278 0.743 . . . . .Nebraska 10 124 142.636 0.869 0.723 1.037 . . . . .Nevada 23 110 143.003 0.769 0.632 0.927 . . . . .New Hampshire 24 28 50.266 0.557 0.370 0.805 . . . . .New Jersey 72 439 554.943 0.791 0.719 0.869 0.000 0.351 0.737 1.292 1.690New Mexico 18 42 98.423 0.427 0.308 0.577 . . . . .New York 180 1,390 1,619.639 0.858 0.814 0.905 0.000 0.434 0.814 1.165 1.882North Carolina 39 275 387.516 0.710 0.628 0.799 . . . . .North Dakota 1-4 . . . . . . . . . .Ohio 32 219 374.245 0.585 0.510 0.668 0.000 0.282 0.437 0.828 1.189Oklahoma 51 163 301.139 0.541 0.461 0.631 0.000 0.000 0.437 0.748 0.842Oregon 48 77 156.665 0.491 0.388 0.614 0.000 0.000 0.457 0.720 0.836Pennsylvania 224 1559 2,938.275 0.531 0.505 0.558 0.000 0.230 0.483 0.770 1.158Puerto Rico 0 . . . . . . . . . .Rhode Island 1-4 . . . . . . . . . .South Carolina 73 685 796.960 0.860 0.796 0.926 0.000 0.320 0.749 1.123 1.525South Dakota 1-4 . . . . . . . . . .Tennessee 91 772 868.024 0.889 0.828 0.954 0.211 0.383 0.676 1.115 1.662Texas 82 265 414.920 0.639 0.564 0.720 0.000 0.000 0.332 0.879 1.499Utah 1-4 . . . . . . . . . .Vermont 8 17 21.751 0.782 0.455 1.251 . . . . .Virginia 81 372 553.155 0.673 0.606 0.744 0.000 0.000 0.430 0.829 1.496Washington 65 185 381.068 0.485 0.418 0.561 0.000 0.034 0.420 0.685 1.174West Virginia 38 79 163.487 0.483 0.383 0.602 0.000 0.000 0.434 0.648 1.513Wisconsin 42 160 226.956 0.705 0.600 0.823 0.000 0.393 0.658 0.887 1.484Wyoming 0 . . . . . . . . . .All U.S. 2,389 13,812 20,184.815 0.684 0.673 0.696 0.000 0.232 0.564 0.961 1.525

22
Footnotes for Table 3a:
1. Data from all ICUs, wards (for this table wards also include stepdown, specialty care areas [including hematology/oncology, bone marrow transplant], and LTAC locations [or facilities]), and NICUs.
2. To improve estimating SIR distributions, facility-specific key percentiles were only calculated for states in which ≥20 facilities had a predicted number of CLABSIs ≥1.0 during the reporting period. If a single facility’s predicted number of CLABSIs was <1.0, a facility-specific SIR was neither calculated nor included in the determinations of the distribution of facility-specific SIRs.

23
Table 3b. State-specific Standardized Infection Ratios (SIRs) and facility-specific percentiles, NHSN facilities reporting during 2010:
Central Line-associated Bloodstream Infections (CLABSI), Critical Care Locations1
States with NHSN mandates3
No. of Infections 95% CI for SIR Facility-specific SIRs at Key Percentiles2
No. of Facilities
Reporting Observed Predicted SIR Lower Upper 10% 25%Median
(50%) 75% 90%
California 313 1093 1,758.910 0.621 0.585 0.659 0.000 0.175 0.502 0.883 1.368Colorado 49 120 175.690 0.683 0.566 0.817 0.000 0.212 0.563 1.051 1.472Connecticut 30 99 131.284 0.754 0.613 0.918 0.000 0.370 0.679 1.083 1.347Delaware 8 53 62.242 0.852 0.638 1.114 . . . . .D.C. 10 49 83.867 0.584 0.432 0.772 . . . . .Illinois 143 433 648.729 0.667 0.606 0.733 0.000 0.263 0.560 0.929 1.475Maryland 47 316 309.228 1.022 0.912 1.141 0.131 0.338 0.737 1.383 1.854Massachusetts 69 212 413.632 0.513 0.446 0.586 0.000 0.000 0.483 0.872 1.556Nevada 17 99 96.349 1.028 0.835 1.251 . . . . .New Hampshire 24 20 45.696 0.438 0.267 0.676 . . . . .New Jersey 72 334 462.578 0.722 0.647 0.804 0.000 0.345 0.602 1.127 1.690New York 179 872 1,115.107 0.782 0.731 0.836 0.000 0.344 0.697 1.121 1.757Oklahoma 48 111 231.035 0.480 0.395 0.579 0.000 0.000 0.302 0.753 0.884Oregon 47 67 141.241 0.474 0.368 0.602 0.000 0.037 0.493 0.727 0.847Pennsylvania 158 500 1,100.054 0.455 0.416 0.496 0.000 0.148 0.395 0.731 1.026South Carolina 52 219 257.750 0.850 0.741 0.970 0.000 0.298 0.711 1.390 2.373Tennessee 81 418 498.199 0.839 0.761 0.923 0.091 0.377 0.538 0.956 1.853Vermont 8 17 21.751 0.782 0.455 1.251 . . . . .Virginia 79 264 391.602 0.674 0.595 0.761 0.000 0.000 0.509 0.834 1.551Washington 63 133 280.644 0.474 0.397 0.562 0.000 0.000 0.385 0.697 1.138West Virginia 37 66 126.832 0.520 0.402 0.662 . . . . .States without NHSN mandatesAlabama 67 180 176.402 1.020 0.877 1.181 0.000 0.105 0.754 1.263 2.136Alaska 1-4 . . . . . . . . . .Arizona 20 137 163.679 0.837 0.703 0.989 . . . . .Arkansas 18 60 97.445 0.616 0.470 0.793 . . . . .Florida 44 118 174.322 0.677 0.560 0.811 0.000 0.000 0.487 0.781 1.147Georgia 33 131 203.150 0.645 0.539 0.765 0.000 0.197 0.672 0.844 1.031Hawaii 5 8 15.047 0.532 0.230 1.048 . . . . .Idaho 1-4 . . . . . . . . . .Indiana 31 81 77.730 1.042 0.828 1.295 . . . . .Iowa 21 15 30.185 0.497 0.278 0.820 . . . . .Kansas 13 42 75.048 0.560 0.403 0.756 . . . . .Kentucky 20 58 97.251 0.596 0.453 0.771 . . . . .Louisiana 27 35 58.208 0.601 0.419 0.836 . . . . .Maine 6 27 26.212 1.030 0.679 1.499 . . . . .Michigan 48 131 328.728 0.399 0.333 0.473 0.000 0.000 0.334 0.525 0.666Minnesota 1-4 . . . . . . . . . .Mississippi 13 88 81.074 1.085 0.871 1.337 . . . . .Missouri 10 48 79.793 0.602 0.444 0.798 . . . . .Montana 9 6 15.381 0.390 0.143 0.849 . . . . .Nebraska 9 25 29.653 0.843 0.545 1.245 . . . . .New Mexico 18 30 68.114 0.440 0.297 0.629 . . . . .North Carolina 32 116 192.153 0.604 0.499 0.724 . . . . .North Dakota 1-4 . . . . . . . . . .Ohio 26 81 171.337 0.473 0.375 0.588 0.000 0.276 0.485 0.843 0.980Puerto Rico 0 . . . . . . . . . .Rhode Island 1-4 . . . . . . . . . .South Dakota 1-4 . . . . . . . . . .Texas 78 168 320.165 0.525 0.448 0.610 0.000 0.000 0.315 0.708 1.211Utah 1-4 . . . . . . . . . .Wisconsin 42 100 132.953 0.752 0.612 0.915 0.000 0.393 0.629 0.948 1.436Wyoming 0 . . . . . . . . . .All U.S. 2,140 7,206 11,020.512 0.654 0.639 0.669 0.000 0.197 0.538 0.947 1.531

24
Footnotes for Table 3b:
1. Data from all ICUs; excludes wards (and other non-critical care locations), NICUs, and LTACs.
2. To improve estimating SIR distributions, facility-specific key percentiles were only calculated for states in which ≥20 facilities had a predicted number of CLABSIs ≥1.0 during the reporting period. If a single facility’s predicted number of CLABSIs was <1.0, a facility-specific SIR was neither calculated nor included in the determinations of the distribution of facility-specific SIRs.
3. Mandate to report CLABSIs to state health department using NHSN in place on January 1, 2010, or was implemented during 2010.

25
Table 3c. State-specific Standardized Infection Ratios (SIRs) and facility-specific percentiles, NHSN facilities reporting during 2010:
Central Line-associated Bloodstream Infections (CLABSI), Ward (non-critical care) Locations1
State
No. of Infections 95% CI for SIR Facility-specific SIRs at Key Percentiles 2
No. of Facilities
Reporting Observed Predicted SIR Lower Upper 10% 25%Median (50%) 75% 90%
Alabama 13 65 50.280 1.293 0.998 1.648 . . . . .Alaska 0 . . . . . . . . . .Arizona 5 29 30.549 0.949 0.636 1.363 . . . . .Arkansas 6 13 33.997 0.382 0.204 0.654 . . . . .California 355 1640 2,395.747 0.685 0.652 0.718 0.000 0.124 0.474 0.888 1.499Colorado 16 55 81.682 0.673 0.507 0.876 . . . . .Connecticut 0 . . . . . . . . . .Delaware 1-4 . . . . . . . . . .Dist. of Columbia 1-4 . . . . . . . . . .Florida 21 138 160.285 0.861 0.723 1.017 . . . . .Georgia 15 91 96.008 0.948 0.763 1.164 . . . . .Hawaii 1-4 . . . . . . . . . .Idaho 1-4 . . . . . . . . . .Illinois 25 135 184.122 0.733 0.615 0.868 . . . . .Indiana 9 89 77.356 1.151 0.924 1.416 . . . . .Iowa 6 0 4.611 0.000 . 0.800 . . . . .Kansas 6 28 42.784 0.654 0.435 0.946 . . . . .Kentucky 6 27 29.689 0.909 0.599 1.323 . . . . .Louisiana 13 34 35.634 0.954 0.661 1.333 . . . . .Maine 1-4 . . . . . . . . . .Maryland 8 12 22.324 0.538 0.278 0.939 . . . . .Massachusetts 8 35 32.419 1.080 0.752 1.502 . . . . .Michigan 15 19 73.290 0.259 0.156 0.405 . . . . .Minnesota 1-4 . . . . . . . . . .Mississippi 6 56 108.919 0.514 0.388 0.668 . . . . .Missouri 1-4 . . . . . . . . . .Montana 5 11 20.990 0.524 0.262 0.938 . . . . .Nebraska 6 90 106.831 0.842 0.677 1.036 . . . . .Nevada 17 7 38.020 0.184 0.074 0.379 . . . . .New Hampshire 1-4 . . . . . . . . . .New Jersey 1-4 . . . . . . . . . .New Mexico 11 6 17.861 0.336 0.123 0.731 . . . . .New York 24 334 274.692 1.216 1.089 1.354 0.704 0.828 1.079 1.539 1.964North Carolina 18 142 150.290 0.945 0.796 1.114 . . . . .North Dakota 1-4 . . . . . . . . . .Ohio 14 133 168.594 0.789 0.660 0.935 . . . . .Oklahoma 8 44 56.099 0.784 0.570 1.053 . . . . .Oregon 9 4 8.905 0.449 0.122 1.150 . . . . .Pennsylvania 223 933 1,694.050 0.551 0.516 0.587 0.000 0.187 0.489 0.841 1.093Puerto Rico 0 . . . . . . . . . .Rhode Island 1-4 . . . . . . . . . .South Carolina 72 457 527.788 0.866 0.788 0.949 0.000 0.284 0.739 1.121 1.339South Dakota 1-4 . . . . . . . . . .Tennessee 34 280 262.185 1.068 0.947 1.201 0.000 0.206 0.637 1.083 1.685Texas 16 44 45.505 0.967 0.702 1.298 . . . . .Utah 1-4 . . . . . . . . . .Vermont 0 . . . . . . . . . .Virginia 11 85 113.290 0.750 0.599 0.928 . . . . .Washington 8 28 44.554 0.628 0.418 0.908 . . . . .West Virginia 11 13 36.598 0.355 0.189 0.607 . . . . .Wisconsin 24 44 73.939 0.595 0.432 0.799 . . . . .Wyoming 0 . . . . . . . . . .All U.S. 1,069 5,241 7,200.263 0.728 0.708 0.748 0.000 0.187 0.533 0.972 1.560

26
Footnotes for Table 3c:
1. Data from all wards (for this table wards also include stepdown, specialty care areas [including hematology/oncology, bone marrow transplant], and LTAC locations [or facilities]); excludes NICUs and other critical care locations.
2. To improve estimating SIR distributions, facility-specific key percentiles were only calculated for states in which ≥20 facilities had a predicted number of CLABSIs ≥1.0 during the reporting period. If a single facility’s predicted number of CLABSIs was <1.0, a facility-specific SIR was neither calculated nor included in the determinations of the distribution of facility-specific SIRs.

27
Table 3d. State-specific Standardized Infection Ratios (SIRs) and facility-specific percentiles, NHSN facilities reporting during 2010:
Central Line-associated Bloodstream Infections (CLABSI), Neonatal Intensive Care Units (NICUs)1
State
No. of Infections 95% CI for SIR Facility-specific SIRs at Key Percentiles2
No. of Facilities
Reporting Observed Predicted SIR Lower Upper 10% 25%Median
(50%) 75% 90%
Alabama 7 35 28.274 1.238 0.862 1.722 . . . . .
Alaska 1-4 . . . . . . . . . .Arizona 1-4 . . . . . . . . . .Arkansas 1-4 . . . . . . . . . .California 121 177 362.005 0.489 0.420 0.567 0.000 0.000 0.338 0.805 1.271Colorado 17 29 50.697 0.572 0.383 0.822 . . . . .Connecticut 1-4 . . . . . . . . . .Delaware 1-4 . . . . . . . . . .D.C. 5 5 14.975 0.334 0.108 0.779 . . . . .Florida 8 22 33.935 0.648 0.406 0.982 . . . . .Georgia 10 52 40.778 1.275 0.952 1.672 . . . . .Hawaii 0 . . . . . . . . . .Idaho 1-4 . . . . . . . . . .Illinois 38 121 183.300 0.660 0.548 0.789 0.000 0.000 0.504 0.758 1.338Indiana 6 15 22.891 0.655 0.366 1.081 . . . . .Iowa 1-4 . . . . . . . . . .Kansas 1-4 . . . . . . . . . .Kentucky 1-4 . . . . . . . . . .Louisiana 10 18 15.270 1.179 0.698 1.863 . . . . .Maine 1-4 . . . . . . . . . .Maryland 17 42 72.915 0.576 0.415 0.779 . . . . .Massachusetts 10 37 44.693 0.828 0.583 1.141 . . . . .Michigan 8 33 42.966 0.768 0.529 1.079 . . . . .Minnesota 0 . . . . . . . . . .Mississippi 6 23 23.926 0.961 0.609 1.442 . . . . .Missouri 1-4 . . . . . . . . . .Montana 1-4 . . . . . . . . . .Nebraska 1-4 . . . . . . . . . .Nevada 1-4 . . . . . . . . . .New Hampshire 0 . . . . . . . . . .New Jersey 20 96 84.930 1.130 0.916 1.380 . . . . .New Mexico 1-4 . . . . . . . . . .New York 54 184 229.840 0.801 0.689 0.925 0.000 0.432 0.695 1.237 2.338North Carolina 7 17 45.074 0.377 0.220 0.604 . . . . .North Dakota 1-4 . . . . . . . . . .Ohio 1-4 . . . . . . . . . .Oklahoma 1-4 . . . . . . . . . .Oregon 1-4 . . . . . . . . . .Pennsylvania 43 126 144.170 0.874 0.728 1.041 0.100 0.296 0.725 1.184 2.028Puerto Rico 0 . . . . . . . . . .Rhode Island 1-4 . . . . . . . . . .South Carolina 1-4 . . . . . . . . . .South Dakota 0 . . . . . . . . . .Tennessee 25 74 107.640 0.687 0.540 0.863 . . . . .Texas 18 53 49.250 1.076 0.806 1.408 . . . . .Utah 0 . . . . . . . . . .Vermont 0 . . . . . . . . . .Virginia 7 23 48.263 0.477 0.302 0.715 . . . . .Washington 16 24 55.870 0.430 0.275 0.639 . . . . .West Virginia 1-4 . . . . . . . . . .Wisconsin 8 16 20.065 0.797 0.455 1.295 . . . . .Wyoming 0 . . . . . . . . . .All U.S. 507 1,365 1,964.039 0.695 0.659 0.733 0.000 0.237 0.611 1.098 1.752

28
Footnotes for Table 3d:
1. Data from all NICU locations, including Level II/III and Level III nurseries. For purposes of this report, both umbilical line and central line-associated bloodstream infections are considered CLABSIs.
2. To improve estimating SIR distributions, facility-specific key percentiles were only calculated for states in which ≥20 facilities had a predicted number of CLABSIs ≥1.0 during the reporting period. If a single facility’s predicted number of CLABSIs was <1.0, a facility-specific SIR was neither calculated nor included in the determinations of the distribution of facility-specific SIRs.

29
Table 4. Changes in State-specific Standardized Infection Ratios (SIRs) 2009 compared to 2010: Central Line-associated Bloodstream Infections (CLABSI), All Locations1
State
All Reporters2 Continuous Reporters
2009 2010Significant
Change p-value
No. of Continuous Reporters3
Significant Change p-value4
Alabama 1.228 1.098 No 0.3296 4 No 0.3317Alaska . . . . . . .Arizona 0.443 0.859 Increase 0.0106 2 No 0.8586Arkansas 0.572 0.572 No 1.0000 6 No 0.7431California 0.856 0.644 Decrease 0.0000 133 Decrease 0.0000Colorado 0.828 0.662 Decrease 0.0182 60 Decrease 0.0182Connecticut 0.873 0.685 No 0.0754 30 No 0.0754Delaware 0.607 0.903 Increase 0.0358 7 No 0.0650Dist. of Columbia 0.476 0.685 No 0.1343 4 No 0.7840Florida 1.142 0.754 Decrease 0.0000 20 Decrease 0.0003Georgia 0.982 0.806 Decrease 0.0266 15 Decrease 0.0441Hawaii 1.684 0.929 No 0.2504 1 No 0.5636Idaho . . . . . . .Illinois 0.869 0.678 Decrease 0.0000 145 Decrease 0.0000Indiana 1.224 1.039 No 0.1896 4 No 0.1375Iowa 0.596 0.430 No 0.4860 3 No 1.0000Kansas 0.644 0.573 No 0.5409 7 No 0.5318Kentucky 0.716 0.656 No 0.5708 11 No 0.8819Louisiana 0.721 0.797 No 0.5459 10 No 0.6803Maine 1.263 0.907 No 0.0639 2 No 0.0640Maryland 1.290 0.915 Decrease 0.0000 47 Decrease 0.0000Massachusetts 0.727 0.579 Decrease 0.0043 70 Decrease 0.0043Michigan 0.467 0.411 No 0.2402 31 No 0.2546Minnesota . . . . . . .Mississippi 1.040 0.781 Decrease 0.0125 6 Decrease 0.0138Missouri 0.807 0.752 No 0.6195 8 No 0.7181Montana 0.539 0.470 No 0.8181 5 No 0.8151Nebraska 1.146 0.869 Decrease 0.0259 3 Decrease 0.0131Nevada 1.572 0.769 Decrease 0.0000 2 No 0.6651New Hampshire 0.673 0.557 No 0.5080 24 No 0.5080New Jersey 0.779 0.791 No 0.8379 72 No 0.8379New Mexico 0.376 0.427 No 0.7026 7 No 0.7913New York 1.029 0.858 Decrease 0.0000 178 Decrease 0.0000North Carolina 1.124 0.710 Decrease 0.0000 21 Decrease 0.0000North Dakota . . . . . . .Ohio 0.773 0.585 Decrease 0.0031 20 Decrease 0.0041Oklahoma 0.554 0.541 No 0.8599 50 No 0.9064Oregon 0.695 0.491 Decrease 0.0179 46 Decrease 0.0252Pennsylvania 0.711 0.531 Decrease 0.0000 222 Decrease 0.0000Puerto Rico . . . . . . .Rhode Island . . . . . . .South Carolina 1.126 0.860 Decrease 0.0000 70 Decrease 0.0000South Dakota . . . . . . .Tennessee 1.168 0.889 Decrease 0.0000 76 Decrease 0.0000Texas 0.936 0.639 Decrease 0.0001 15 Decrease 0.0278Utah . . . . . . .Vermont 0.546 0.782 No 0.3690 8 No 0.3690Virginia 0.822 0.673 Decrease 0.0078 77 Decrease 0.0069Washington 0.632 0.485 Decrease 0.0068 64 Decrease 0.0068West Virginia 0.709 0.483 Decrease 0.0191 38 Decrease 0.0191Wisconsin 0.586 0.705 No 0.1844 13 No 0.4693Wyoming . . . . . . .All U.S. 0.854 0.684 Decrease 0.0000 1644 Decrease 0.0000

30
Footnotes for Table 4:
1. SIRs are not reported for states with fewer than five facilities reporting CLABSI data to NHSN in 2010.
2. Data from all ICUs, wards (for this table wards also include stepdown, specialty care areas [including hematology/oncology, bone marrow transplant], and LTAC locations [or facilities]), and NICUs.
3. Continuous reporters include all facilities with at least one location that reported any data for CLABSIs during both 2009 and 2010.
4. Adjusted by limiting analysis to only continuous reporters (e.g., facility locations reporting for one month or more during 2009 that also reported during 2010).

31
Table 5. Changes in National Standardized Infection Ratios (SIRs), 2009 compared to 2010: Central Line-associated Bloodstream Infections (CLABSIs) and Surgical Site Infections (SSIs)1
All Reporters Continuous Reporters
SIR 2009
SIR 2010
Change in SIR p-value
No. of Continuous Reporters2
Change in SIR3 p-value3
CLABSI, all locations 0.854 0.684 Decrease <.001 1644 Decrease <.001
SSI, combined procedures1 0.981 0.916 Decrease 0.0010 904 No change 0.1630
Hip arthroplasty 0.968 0.971 No change 0.9460 678 No change 0.5749
Knee arthroplasty 0.944 0.892 No change 0.2229 579 No change 0.9012
Coronary artery bypass graft4 0.962 0.820 Decrease 0.0007 306 Decrease 0.0206
Cardiac surgery 0.859 0.835 No change 0.8443 137 No change 0.8942
Peripheral vascular bypass surgery 0.714 0.935 No change 0.2033 35 No change 0.1115
Abdominal aortic aneurysm repair 0.469 0.648 No change 0.7360 23 No change 0.7305
Colon surgery 0.971 0.909 No change 0.1609 329 No change 0.6640
Rectal surgery 2.599 1.285 Decrease 0.0044 11 Decrease 0.0234
Abdominal hysterectomy 1.173 1.065 No change 0.1761 457 No change 0.2558
Vaginal hysterectomy 1.229 1.243 No change 0.9411 154 No change 0.7339
Footnotes for Tables 5:
1. SSIs included are those following NHSN surgical procedures approximating those covered by SCIP, using only SSIs that were classified as deep incisional or organ/space, and detected upon admission or readmission. Specific NHSN procedures are listed in Appendix A.
2. Continuous reporters for CLABSIs include all facilities that reported any data from at least one location during both 2009 and 2010. Continuous reporters for SSIs include all facilities that reported any data for any of the 10 SCIP procedures during both 2009 and 2010.
3. Adjusted by limiting analysis to only continuous reporters (e.g., facility locations reporting for one month or more during 2009 that also reported during 2010).
4. Coronary artery bypass graft includes procedures with either chest only or chest and donor site incisions.

32
Appendix A
Surgical Care Improvement Project (SCIP) Procedures, NHSN Procedures Approximating SCIP Procedures, and Validated Parameters for Surgical Site Infection Risk Models in NHSN.
SCIP Procedure NHSN Procedure Validated Parameters for Risk Model
Vascular
Abdominal aortic aneurysm repair
duration of procedure, wound class
Peripheral vascular bypass surgery
age, ASA, duration of procedure, medical school affiliation
Coronary artery bypass graft
Coronary artery bypass graft with both chest and donor site incisions; Coronary artery bypass graft with chest incision only
age, ASA, duration of procedure, gender, medical school affiliation, age gender (interaction)
Other cardiac Cardiac surgery age, duration of procedure, emergency
Colon surgeryColon surgery
age, ASA, duration, endoscope, medical school affiliation, hospital bed size, wound class
Rectal surgery duration of procedure, gender, hospital bed size
Hip arthroplasty Hip arthroplastytotal/partial/revision, age, anesthesia, ASA, duration of procedure, medical school affiliation, hospital bed size, trauma
Abdominal hysterectomy Abdominal hysterectomy age, ASA, duration of procedure, hospital bed size
Knee arthroplasty Knee arthroplastyage, ASA, duration of procedure, gender, medical school affiliation, hospital bed size, trauma, revision
Vaginal hysterectomy Vaginal hysterectomy age, duration of procedure, medical school affiliation
Adapted from, Mu Y, Edwards JR, Horan TC, Berrios-Torres SI, Fridkin SK. Improving risk-adjusted measures of surgical site infection for the national healthcare safety network. Infect Control Hosp Epidemiol. 2011 Oct; 32(10):970-986.