Embed Size (px)
Citation preview
Group Corporate Affairs 500 Bourke Street Melbourne Victoria 3000 AUSTRALIA www.nabgroup.com ABN 12 004 044 937
ASX Announcement Tuesday, 25 November 2008
National Australia Bank releases Basel II Risk and Capital Report National Australia Bank Limited (the Group) today released its first Risk and Capital Report under the Basel Capital Accord (Basel II). The 2008 Risk and Capital Report addresses the requirements of APRA’s Pillar 3 public disclosure standard APS 330, and provides enhanced information about the Group’s capital adequacy, risk management practices and risk exposures.
The report is available at http://www.nabgroup.com/0,,96819,00.html For further information contact: Investor Relations Nehemiah Richardson M: +61 (0) 427 513 233 Lyndal Kennedy M: +61 (0) 400 983 038 Wendy Carter M: +61 (0) 488 318 952
2008Risk & Capital Report
National Australia Bank Limited ABN 12 004 044 937
Basel II Pillar 3 Disclosures Investor Presentation
25 November 2008
Mark Joiner, Group Chief Financial OfficerRob Giles, Deputy Group Chief Risk Officer
2
Contents
� Introduction
� Disclosures in the Risk & Capital Report
� NAB’s RWA composition
� Credit risk disclosures
� Expected Loss vs Eligible Provision
� Pro-cyclicality impacts
� Capital adequacy
� Additional information

3
Introduction
� NAB has made significant investment to achieve Basel II advanced accreditation, which has the benefit of enhancing internal risk management practices
� Advanced accreditation in all major risk categories recognises the Group’s level of sophistication in identifying and managing risk and capital adequacy
� The 2008 Risk & Capital Report is the first disclosure under APRA’s Pillar 3 market discipline APS 330 requirements and provides an enhanced degree of transparency
� Basel II risk information continues to drive improvement in NAB’s capital ratio through portfolio optimisation initiatives
4
Disclosures in the Risk & Capital Report
Same information as previously disclosed
Similar information but on a different basis
New information
Legal structure, capital structure, and market risk
e.g. Capital structure pages 11-13
Impaired assets and provisions for impaired assets which have been disclosed by industry and by Basel II segment
e.g. Credit Provisions and Losses pages 30,31
Tables that provide new data, such as the detail provided on probability of default, loss given default, and exposure at default
e.g. Portfolios subject to IRB Approach pages 37,38

5
NAB’s RWA composition
� Basel II provides a more dynamic capital adequacy measure
� Better reflecting risk in the calculation of regulatory capital
� Better alignment to internal risk management practices
� More transparent risk categories
NAB
30 Sep 08
Credit Risk Weighted Assets 90.3%
Market Risk 1.5%
Operational Risk 6.9%
IRRBB Risk 1.3%
Total Risk Weighted Assets 100.0%
Percentage comparison of RWAs by risk type
Credit risk is the key driver
6
Calculation of the NAB’s credit RWAs
Advanced
� The majority of the portfolio is subject to the Advanced IRB approach being 82% of Credit EaD
Standardised
� The remaining 18% is subject to the Standardised approach, of which 15% is the UK portfolio
Australia region, Bank of New Zealand & nabCapital
� Advanced Internal Ratings Based (AIRB) approach for non retail exposures
� Advanced Internal Ratings Based (AIRB) approach for retail exposures
Australia region, Bank of New Zealand & nabCapital
� Standardised approach to sovereign exposures and portfolios agreed with APRA as immaterial
UK Clydesdale Bank PLC
� Standardised approach has been applied to all portfolios/ exposures (opportunity exists to reduce RWAs with UK advanced accreditation)
82%
18%

7
Credit Portfolio composition*
Areas of focus
� Residential Mortgages
� Retail SME
� Standardised
� Specialised Lending
Retail housing 43% RWA / EaD
Corporate and Corporate SME 87% RWA / EaD
101%30%3Other retail
0%00%0Sovereign
57%6818%120Standardised
44%297100%675Total
39%52%12Qualifying revolving retail
23%4529%198Residential mortgage
86%153%17Specialised lending
0%00%0Retail SME
59%5213%88SME corporate
EaD $bn % of Total EaD
RWA $bn RWA / EaD %
Corporate 140 21% 98 70%
Bank 97 14% 11 12%
* Composition excludes non lending assets, equities and securitisation
16 . 7 %
2 4 . 6 %
3 3 . 2 %
8
Credit Portfolio composition*
� NAB’s exposures diversified by industry and geography reflect business strategy:
� The Personal sector is dominated by residential mortgages
� Reflects the long standing strength in small and middle market business
� Finance and insurance, primarily driven by liquidity and banks clearing activities
� Exposures predominantly in core markets of Australia, UK and NZ
Geographic distribution of exposures (EaD)
Exposures by industry classificationBusiness services
Commercial property
3.1%
10.1%
Residential mortgages3.5%
Personal Finance & Insurance
Property & Business Services
33.2%
24.6%
16.7%
250,000
200,000
150,000
100,000
50,000
0Agriculture, Forestry, Fishing &
Mining
Manufacturing Retail & Wholesale
Trade
Construction Transport & Storage
Cafes, Pubs,
Accommodation& Restaurants
Australia66%
New Zealand9%
United Kingdom22%
Other3%
* Composition excludes non lending assets, equities and securitisation
A$m
9
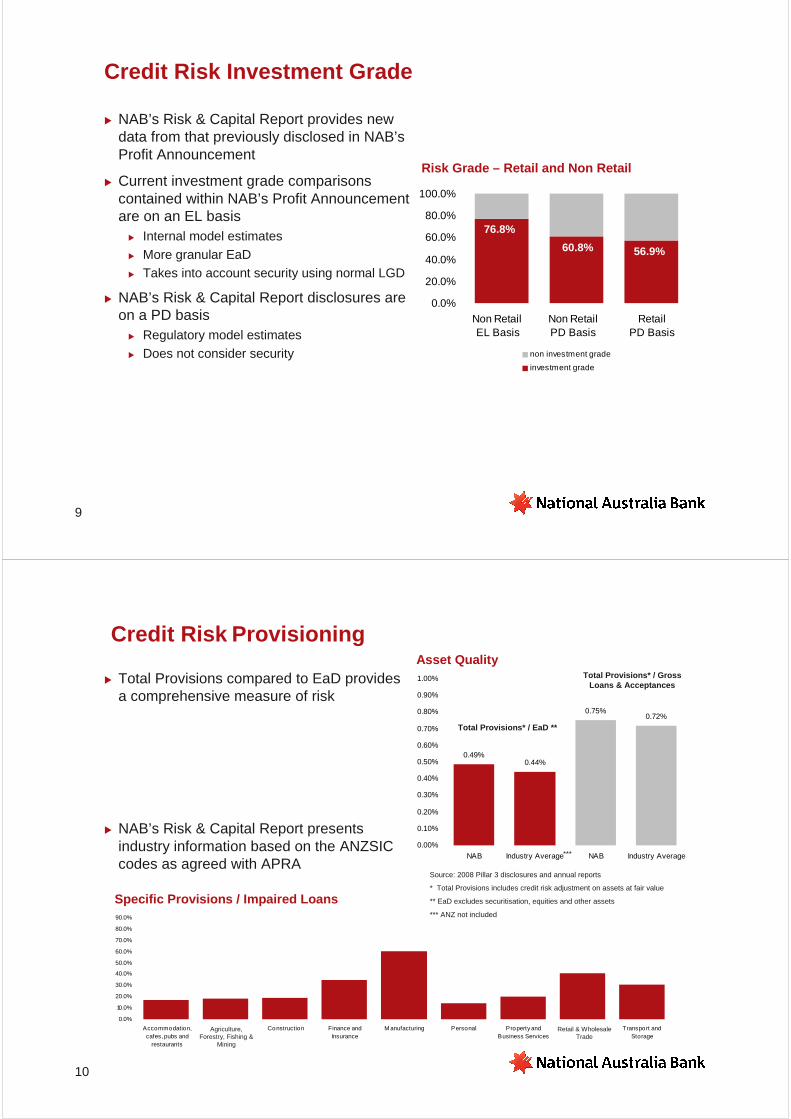
� NAB’s Risk & Capital Report provides new data from that previously disclosed in NAB’s Profit Announcement
� Current investment grade comparisons contained within NAB’s Profit Announcement are on an EL basis
� Internal model estimates� More granular EaD� Takes into account security using normal LGD
� NAB’s Risk & Capital Report disclosures are on a PD basis
� Regulatory model estimates� Does not consider security
Credit Risk Investment Grade
Risk Grade – Retail and Non Retail
0.0%
20.0%
40.0%
60.0%
80.0%
100.0%
Non Retail EL Basis
Non Retail PD Basis
Retail PD Basis
non investment grade
investment grade
76.8%
60.8% 56.9%
0.49%0.44%
0.75%0.72%
0.00%
0.10%
0.20%
0.30%
0.40%
0.50%
0.60%
0.70%
0.80%
0.90%
1.00%
NAB Industry Average NAB Industry Average
0.0%
10.0%
20.0%
30.0%
40.0%
50.0%
60.0%
70.0%
80.0%
90.0%
Accommodation,cafes, pubs and
restaurants
Agriculture, forestryand fishing
Construction Finance andInsurance
M anufacturing Personal Property andBusiness Services
Trade Transport andStorage
Retail & Wholesale Trade
Agriculture, Forestry, Fishing &
Mining
10
Credit Risk Provisioning
� Total Provisions compared to EaD provides a comprehensive measure of risk
� NAB’s Risk & Capital Report presents industry information based on the ANZSIC codes as agreed with APRA
Specific Provisions / Impaired Loans
Source: 2008 Pillar 3 disclosures and annual reports
* Total Provisions includes credit risk adjustment on assets at fair value
** EaD excludes securitisation, equities and other assets
*** ANZ not included
Asset Quality
Total Provisions* / EaD **
***
Total Provisions* / Gross Loans & Acceptances
11
Expected Loss (EL) vs Eligible Provisions (EP)
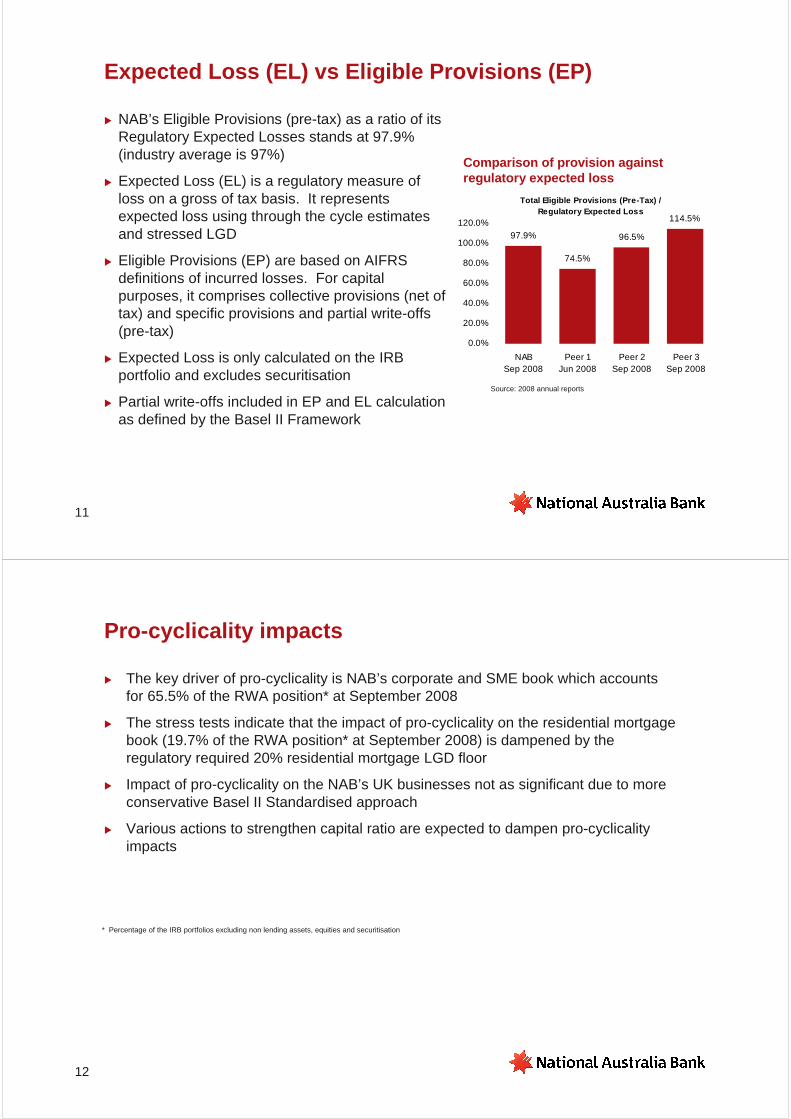
� NAB’s Eligible Provisions (pre-tax) as a ratio of its Regulatory Expected Losses stands at 97.9% (industry average is 97%)
� Expected Loss (EL) is a regulatory measure of loss on a gross of tax basis. It represents expected loss using through the cycle estimatesand stressed LGD
� Eligible Provisions (EP) are based on AIFRS definitions of incurred losses. For capital purposes, it comprises collective provisions (net of tax) and specific provisions and partial write-offs (pre-tax)
� Expected Loss is only calculated on the IRB portfolio and excludes securitisation
� Partial write-offs included in EP and EL calculation as defined by the Basel II Framework
Source: 2008 annual reports
Total Eligible Provisions (Pre-Tax) / Regulatory Expected Loss
97.9%
74.5%
96.5%
114.5%
0.0%
20.0%
40.0%
60.0%
80.0%
100.0%
120.0%
NABSep 2008
Peer 1Jun 2008
Peer 2Sep 2008
Peer 3Sep 2008
Comparison of provision against regulatory expected loss
12
Pro-cyclicality impacts
� The key driver of pro-cyclicality is NAB’s corporate and SME book which accounts for 65.5% of the RWA position* at September 2008
� The stress tests indicate that the impact of pro-cyclicality on the residential mortgage book (19.7% of the RWA position* at September 2008) is dampened by the regulatory required 20% residential mortgage LGD floor
� Impact of pro-cyclicality on the NAB’s UK businesses not as significant due to more conservative Basel II Standardised approach
� Various actions to strengthen capital ratio are expected to dampen pro-cyclicality impacts
* Percentage of the IRB portfolios excluding non lending assets, equities and securitisation

6.50%
7.00%
7.50%
8.00%
8.50%
9.00%
Tier 1 Ratio Tier 1 Ratio pro-forma Total Loss Reserve
13
Capital position is strong
� NAB is well placed, supported by:
� Strong capital position
� Sound provisioning
� Continued work on RWA optimisation
► Internal factors
► Regulatory overlays
� Total loss buffer > $6bn (post tax) in excess of 7% operational Tier 1 minimum
Tier 1 Capital September 2008
* Approximate Tier 1 ratio post capital raising
7.35%
8.29%
8.81%
Collective provision after tax
Loss reserves deducted from Tier 1
*
Tier 1 Ratio pro-forma
Questions
Additional information
Scope of APS 330 disclosuresBasel II and pro-cyclicalityDisclosures on other risk types:SecuritisationOperational riskTraded market riskEquity Risk in the Banking BookInterest Rate Risk in the Banking Book
16
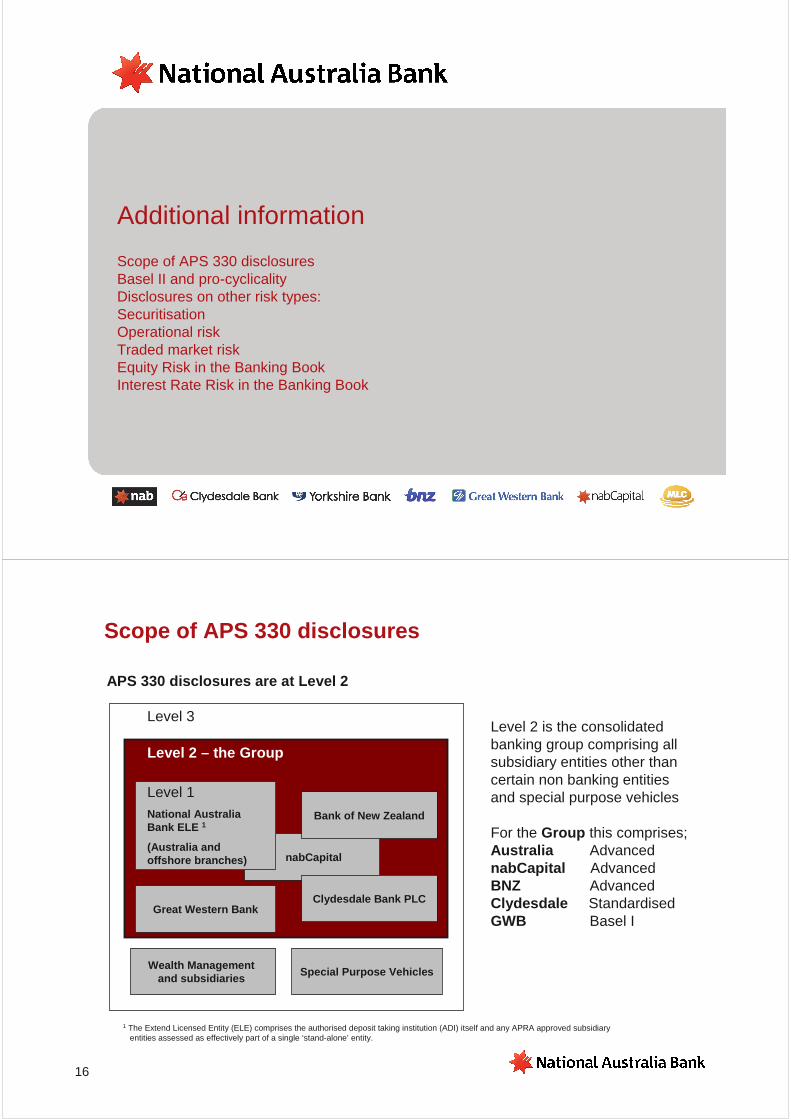
Scope of APS 330 disclosures
Level 3
Level 2 – the Group
Wealth Management and subsidiaries
nabCapital
Special Purpose Vehicles
Level 1National Australia Bank ELE 1
(Australia and offshore branches)
Clydesdale Bank PLC
Bank of New Zealand
Great Western Bank
Level 2 is the consolidated banking group comprising all subsidiary entities other than certain non banking entities and special purpose vehicles
For the Group this comprises; Australia Advanced nabCapital Advanced BNZ AdvancedClydesdale StandardisedGWB Basel I
APS 330 disclosures are at Level 2
1 The Extend Licensed Entity (ELE) comprises the authorised deposit taking institution (ADI) itself and any APRA approved subsidiary entities assessed as effectively part of a single ‘stand-alone’ entity.

17
Basel II and pro-cyclicality
� Under Basel II, risk sensitivity means that Tier 1 capital ratios are likely to decrease in a deteriorating economic environment, and improve in a favourable economic environment (referred to as pro-cyclicality)
� Approaches to pro-cyclicality differ amongst regulators
� APRA’s approach, together with a through the cycle measurement approach, provide a buffer in times of economic downturns
� Management of increasing risk under economic stress has always been a key priority for NAB and increased in importance given the current market conditions
� This focus is now combined with management of the pro-cyclical impact on provisioning and capital, and maintenance of target Tier 1 and total capital levels
Capital
Expansion Downturn
Provisioning
Basel II regulatory capital
Available capital
Buffer
Pro-cyclicality and its impact on capital
18
Other Risk DisclosureSecuritisation
� Securitisation risk is defined as the potential for loss arising from credit and operational risks associated with the NAB’s securitisation activities, as well as any losses on sale of securitised assets
� Risk weights and capital treatment are measured in accordance with APRA requirements outlined in APS 120, incorporating
� on-balance sheet and off-balance sheet risk positions held by NAB
� external rating, internal risk grading, the seniority of the exposure and the composition of the pool of securitised assets
� Ongoing business activity restricted to: assets originated by NAB customers in Australia and New Zealand; and securitisation of the bank’s own assets for risk and capital management purposes
19
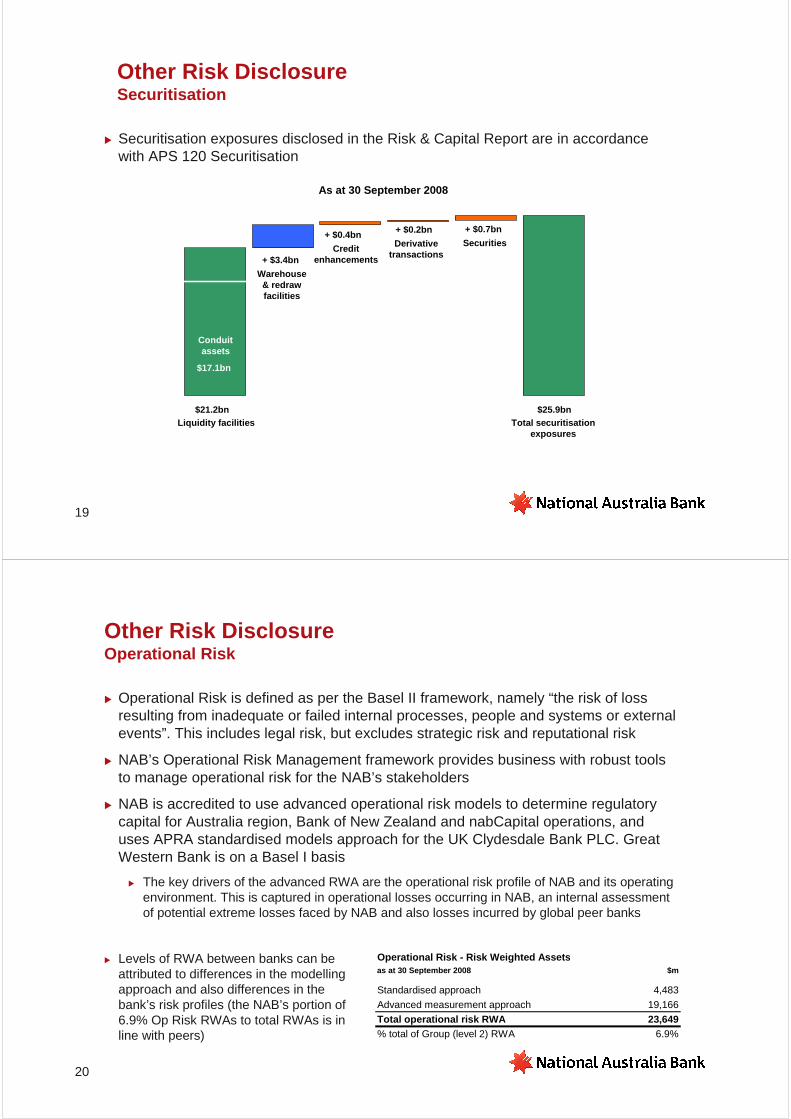
Other Risk DisclosureSecuritisation
+ $3.4bn
As at 30 September 2008
Conduitassets
Warehouse & redraw facilities
$21.2bnLiquidity facilities
$17.1bn
$25.9bnTotal securitisation
exposures
+ $0.4bn
Credit enhancements
+ $0.2bn
Derivative transactions
+ $0.7bn
Securities
� Securitisation exposures disclosed in the Risk & Capital Report are in accordance with APS 120 Securitisation
20
Other Risk DisclosureOperational Risk
� Operational Risk is defined as per the Basel II framework, namely “the risk of loss resulting from inadequate or failed internal processes, people and systems or external events”. This includes legal risk, but excludes strategic risk and reputational risk
� NAB’s Operational Risk Management framework provides business with robust tools to manage operational risk for the NAB’s stakeholders
� NAB is accredited to use advanced operational risk models to determine regulatory capital for Australia region, Bank of New Zealand and nabCapital operations, and uses APRA standardised models approach for the UK Clydesdale Bank PLC. Great Western Bank is on a Basel I basis
� The key drivers of the advanced RWA are the operational risk profile of NAB and its operating environment. This is captured in operational losses occurring in NAB, an internal assessment of potential extreme losses faced by NAB and also losses incurred by global peer banks
Operational Risk - Risk Weighted Assetsas at 30 September 2008 $m
Standardised approach 4,483
Advanced measurement approach 19,166
Total operational risk RWA 23,649% total of Group (level 2) RWA 6.9%
� Levels of RWA between banks can be attributed to differences in the modelling approach and also differences in the bank’s risk profiles (the NAB’s portion of 6.9% Op Risk RWAs to total RWAs is in line with peers)
21
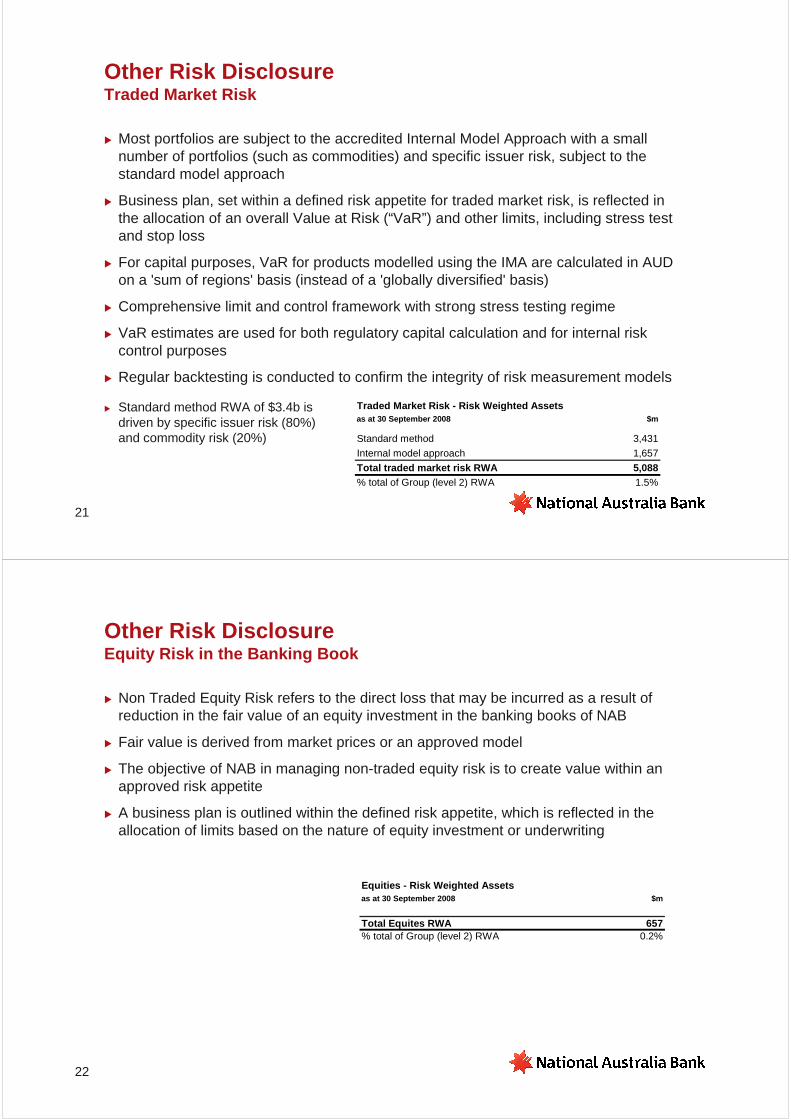
Other Risk DisclosureTraded Market Risk
� Most portfolios are subject to the accredited Internal Model Approach with a small number of portfolios (such as commodities) and specific issuer risk, subject to the standard model approach
� Business plan, set within a defined risk appetite for traded market risk, is reflected in the allocation of an overall Value at Risk (“VaR”) and other limits, including stress test and stop loss
� For capital purposes, VaR for products modelled using the IMA are calculated in AUD on a 'sum of regions' basis (instead of a 'globally diversified' basis)
� Comprehensive limit and control framework with strong stress testing regime
� VaR estimates are used for both regulatory capital calculation and for internal risk control purposes
� Regular backtesting is conducted to confirm the integrity of risk measurement models
Traded Market Risk - Risk Weighted Assetsas at 30 September 2008 $m
Standard method 3,431
Internal model approach 1,657
Total traded market risk RWA 5,088% total of Group (level 2) RWA 1.5%
� Standard method RWA of $3.4b is driven by specific issuer risk (80%) and commodity risk (20%)
22
Other Risk DisclosureEquity Risk in the Banking Book
� Non Traded Equity Risk refers to the direct loss that may be incurred as a result of reduction in the fair value of an equity investment in the banking books of NAB
� Fair value is derived from market prices or an approved model
� The objective of NAB in managing non-traded equity risk is to create value within an approved risk appetite
� A business plan is outlined within the defined risk appetite, which is reflected in the allocation of limits based on the nature of equity investment or underwriting
Equities - Risk Weighted Assetsas at 30 September 2008 $m
Total Equites RWA 657% total of Group (level 2) RWA 0.2%
23
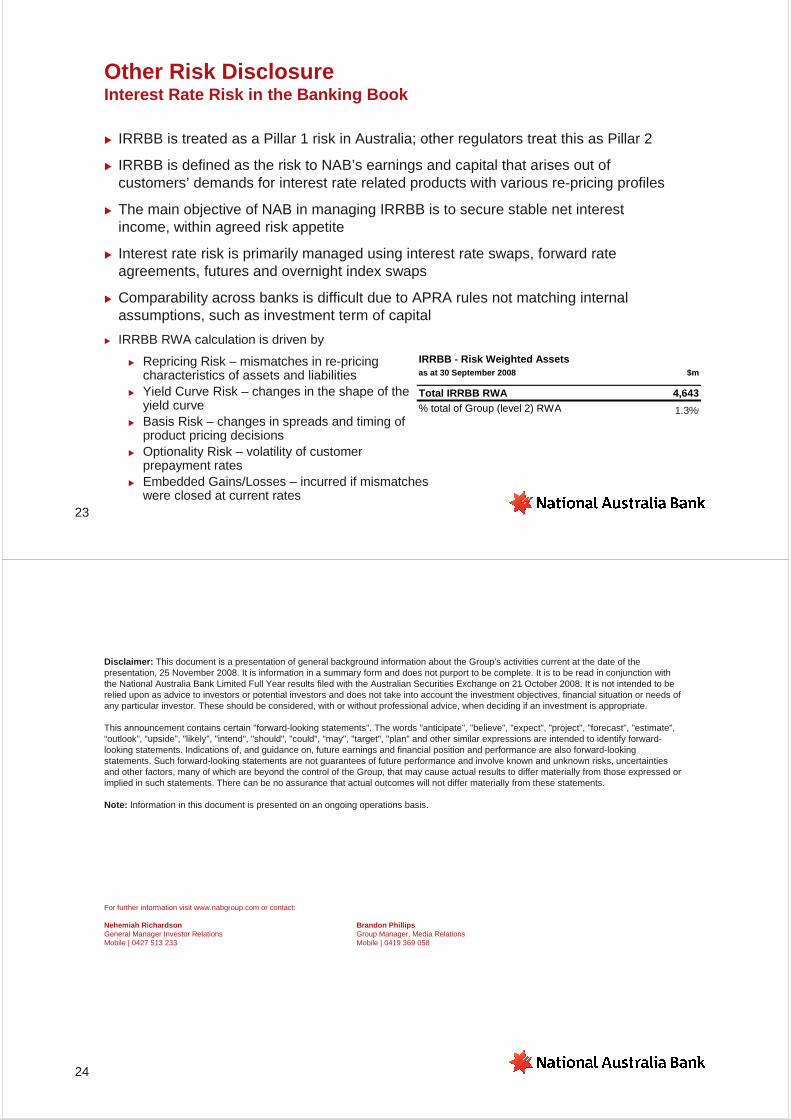
Other Risk DisclosureInterest Rate Risk in the Banking Book
� IRRBB is treated as a Pillar 1 risk in Australia; other regulators treat this as Pillar 2
� IRRBB is defined as the risk to NAB’s earnings and capital that arises out of customers’ demands for interest rate related products with various re-pricing profiles
� The main objective of NAB in managing IRRBB is to secure stable net interest income, within agreed risk appetite
� Interest rate risk is primarily managed using interest rate swaps, forward rate agreements, futures and overnight index swaps
� Comparability across banks is difficult due to APRA rules not matching internal assumptions, such as investment term of capital
� IRRBB RWA calculation is driven by
� Repricing Risk – mismatches in re-pricing characteristics of assets and liabilities
� Yield Curve Risk – changes in the shape of the yield curve
� Basis Risk – changes in spreads and timing of product pricing decisions
� Optionality Risk – volatility of customer prepayment rates
� Embedded Gains/Losses – incurred if mismatches were closed at current rates
IRRBB - Risk Weighted Assetsas at 30 September 2008 $m
Total IRRBB RWA 4,643% total of Group (level 2) RWA 1.4%1.3%
24
For further information visit www.nabgroup.com or contact:
Nehemiah Richardson Brandon PhillipsGeneral Manager Investor Relations Group Manager, Media RelationsMobile | 0427 513 233 Mobile | 0419 369 058
Disclaimer: This document is a presentation of general background information about the Group’s activities current at the date of the presentation, 25 November 2008. It is information in a summary form and does not purport to be complete. It is to be read in conjunction with the National Australia Bank Limited Full Year results filed with the Australian Securities Exchange on 21 October 2008. It is not intended to be relied upon as advice to investors or potential investors and does not take into account the investment objectives, financial situation or needs of any particular investor. These should be considered, with or without professional advice, when deciding if an investment is appropriate.
This announcement contains certain "forward-looking statements". The words "anticipate", "believe", "expect", "project", "forecast", "estimate", “outlook”, “upside”, "likely", "intend", "should", "could", "may", "target", "plan" and other similar expressions are intended to identify forward-looking statements. Indications of, and guidance on, future earnings and financial position and performance are also forward-looking statements. Such forward-looking statements are not guarantees of future performance and involve known and unknown risks, uncertainties and other factors, many of which are beyond the control of the Group, that may cause actual results to differ materially from those expressed or implied in such statements. There can be no assurance that actual outcomes will not differ materially from these statements.
Note: Information in this document is presented on an ongoing operations basis.

2008 Risk & Capital ReportIncorporating the requirements of APS 330
National Australia Bank Limited ABN 12 004 044 937 (the ‘Company’)


Introduction
2
Table of Contents
Introduction Chief Executive Officer’s Statement 4 Chief Risk Officer’s Statement 4 APS 330 Disclosure Governance 5 Presentation of Risk and Capital Information 5 Overview of Basel II 7 Scope of Application 8
Capital Capital 9 Capital Structure 11
Risk Exposure and Assessment Risk Exposure and Assessment 14 Credit Risk 24
General Disclosure 24 Credit Risk Exposures 25 Disclosures of Standardised Credit Risk Portfolios & Supervisory Slotting 32 Disclosures for Internal Rating Based Portfolios 34
Securitisation 41 Securitisation Exposures 43 The Group’s Securitised Assets 46
Market Risk 48 Operational Risk 50 Non Traded Market Risk
Equities Banking Book Position 52 Interest Rate Risk in the Banking Book 54 Funding and Liquidity 55
Attachment B Disclosures 56 Glossary of Terms 59

Introduction
3
This page has been left blank intentionally

Introduction
4
Chief Executive Officer’s Statement
The effective management of risk is fundamental to the strategy and business practices of the National Australia Bank and forms the basis of the Group’s ongoing success.
The Group undertakes sound risk management in achieving its purpose, objectives and strategies. The Group’s holistic approach to risk management is through the consideration of key risk categories of credit risk, operational risk, traded market risk and balance sheet related risks including non traded market risk. This is underpinned by a clear articulation by the Principal Board on the risk appetite, a reliable internal audit program, risk management awareness by managers at all levels, strong communication with our regulators and informed Board oversight.
Basel II is the common name for the framework issued by the Basel Committee on Banking Supervision in 2004. This framework sets new standards for the measurement of risk and capital standards that apply to all banks internationally. In Australia, the Australian Prudential Regulation Authority (“APRA”) has regulatory responsibility for the implementation of Basel II through the release of prudential standards.
At the heart of Basel II is a series of best practice risk and capital management methods that are integral to the
Group’s approach to running its business. Our substantial investment in our Basel II capabilities has enhanced the sophistication and capabilities of the Group’s risk management systems.
For the Group, Basel II is not just about meeting the technical requirements of the framework, but about embracing the framework’s objective of stronger risk management practices as a means of creating a stronger international banking industry.
The milestone achieved with the publication of this report is important, not only for the Group, but for the whole of the banking industry. While regulation of the industry is always evolving and developing, this first Basel II market disclosure report provides a new degree of transparency to the market. While work has been undertaken in sophisticated risk management for many years now, this is the first opportunity to compile this work in a single new document.
This new Risk and Capital Report addresses the requirements of APRA’s Pillar 3 public disclosure standard APS 330. It is designed to provide our stakeholders with enhanced information about the approach taken by the Group to manage risk and to determine the Group’s capital adequacy, having regard to the operating environment.
Chief Risk Officer’s Statement
The Group’s Australian, New Zealand and nabCapital banking operations have been granted Basel II advanced status for credit and operational risk management by APRA, as has the Reserve Bank of New Zealand (“RBNZ”) for the Bank of New Zealand. To achieve advanced status the Group had to demonstrate that it has the expertise and appropriate internal tools to identify and manage risk to estimate its capital requirements. In 2008, the Group also received accreditation for interest rate risk in the banking book for its banking operations, excluding Great Western Bank. The Group has had advanced accreditation for traded market risk since 2006.
The Group’s subsidiary in the United Kingdom, Clydesdale Bank PLC, regulated by the Financial Services Authority (“FSA”), received standardised operational and credit risk accreditation on 1 January 2008 in accordance with the FSA’s requirements. Clydesdale Bank PLC will move to advanced accreditation for operational and credit risk at a timing to be agreed with APRA and the FSA.
The Group’s regulatory capital and Risk Weighted Assets (“RWAs”) are now calculated in accordance with defined Basel II methodologies, with the exception of its subsidiary Great Western Bank in the USA, which is treated as Basel I. Great Western Bank is regulated by the South Dakota Division of Banking, the Federal
Deposit Insurance Corporation and the Federal Reserve Bank.
The Group defines risk as the adverse impact on the Group’s business that arises from current and future internal process or external events. Identifying, quantifying, monitoring and managing the Group’s exposure to risk is an integral part of the strategic and operational activities of the Group. Risk management permeates every aspect of the business.
The Group’s Risk Governance Framework describes the responsibility of each level of management and operations. At the highest level, the Group’s Principal Board and Executive Management are responsible for ensuring that risks facing the Group are identified and that systems are in place to monitor and manage those risks. The approved risk appetite position informs the Group’s risk, capital and business management limits and policies. It is reviewed periodically by the Principal Board as part of the strategic planning process, or as the commercial circumstances of the Group change.
This new Risk and Capital Report aims to enhance transparency in Australian financial markets by setting minimum requirements for the public disclosure of information on the risk management practices and capital adequacy of locally incorporated ADIs.

Introduction
5
APS 330 Disclosure Governance
APRA has prudential oversight of the operations of all locally incorporated ADIs in Australia. Under Prudential Standard APS 330 Capital Adequacy: Public Disclosure of Prudential Information, ADIs that are Australian owned and have been approved by APRA to use the advanced approaches, are required to disclose a range of both quantitative and qualitative prudential information annually.
The Group’s external disclosure policy defines Board and management accountabilities for APS 330 disclosure, including processes and practices to ensure the integrity and timeliness of Prudential Disclosures and compliance with Group policies.
This report covers the Group’s accountabilities under APS 330, as an ADI approved by APRA to use the Basel II advanced approaches to measuring credit risk and operational risk.
Certification and Disclosure The Group’s Chief Executive Officer attests to the reliability of the Group’s APS 330 disclosures within the declaration provided to APRA under APS 310.
Disclosure controls and procedures have been implemented to effectively manage prudential reporting risk.
Presentation of Risk and Capital Information
As a result of Basel II accreditation, several key changes have occurred to how the Group calculates its regulatory capital. These are included in the following:
Regulatory Capital under Basel II as per APRA Requirements Prudential Standard APS 111 sets out the various regulatory requirements on the capital base of ADIs. These minimum levels are applied after all required capital deductions are undertaken as follows: - Fundamental Tier 1 capital must constitute at least
75% of net Tier 1 capital (calculated as the sum of Fundamental Tier 1 and Residual Tier 1 capital less Tier 1 deductions).
- Residual Tier 1 capital is limited to 25% of net Tier 1 capital. Any excess is counted as Upper Tier 2 capital.
- Innovative Tier 1 capital is limited to 15% of net Tier 1 capital. The Group did not seek transitional relief on innovative capital, unlike some of our peer institutions. As at September 2008, this had no impact on the Group’s capital levels.
- Net Tier 1 capital must constitute at least 50% of the capital base.
- Total Tier 2 capital (net of deductions and amortisation) is limited to a maximum of 100% of net Tier 1 capital.
- Total Lower Tier 2 capital (net of deductions and amortisation) is limited to a maximum of 50% of net Tier 1 capital. As at September 2008, this had no impact on the Group’s capital levels.
- The prudential General Reserve for Credit Losses is excluded from upper Tier 2 capital.
- Capital is calculated for multiple types of risk, including credit risk, operational risk, market risk, interest rate risk in the banking book, securitised assets and equities in the banking book.
- A capital floor based on 90% of the capital required under Basel I. As at September 2008, this had no impact on the Group’s capital levels.
- Capitalised securitisation start up costs, losses on sale of assets to securitisations (in each case,
unless written off to the profit and loss accounts) and securitisation reserve or spread accounts funded by the Group, must be deducted from Tier 1 capital as capitalised expenses.
Certain regulatory deductions previously taken from Total Capital under Basel I requirements are now required to be taken 50% from Tier 1 and 50% from Tier 2. These are: - Deductions for “Equity and other investments in non-
consolidated subsidiaries and controlled entities”. - Deductions for “Credit support of a capital nature
provided to other non-level 2 entities”. - Shortfall in provisions for credit losses. The Basel II
deduction is the excess of the total Expected Loss for defaulted and non-defaulted internal ratings based (“IRB”) exposures over Total Eligible Provisions. Eligible Provisions are the sum of credit related provisions and partial write-offs. Collective provisions are determined on an after tax basis, specific provisions are determined on a pre-tax basis.
- Securitisation exposures which have an internal rating below an equivalent Standard & Poor’s rating of BB- or are unrated, and certain derivative transactions where the Group is expected to be a net payer.
- All other deductions relating to securitisation as required by Prudential Standard APS 120.
Introduction
6
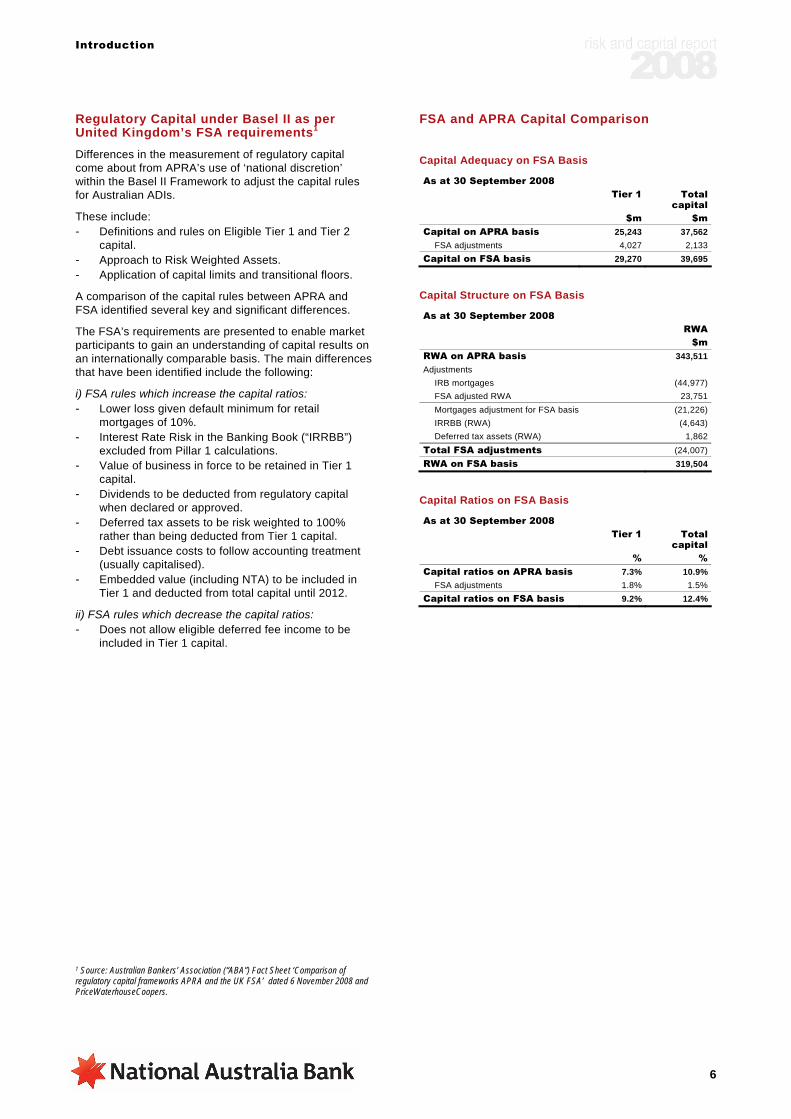
Regulatory Capital under Basel II as per United Kingdom’s FSA requirements1 Differences in the measurement of regulatory capital come about from APRA’s use of ‘national discretion’ within the Basel II Framework to adjust the capital rules for Australian ADIs.
These include: - Definitions and rules on Eligible Tier 1 and Tier 2
capital. - Approach to Risk Weighted Assets. - Application of capital limits and transitional floors.
A comparison of the capital rules between APRA and FSA identified several key and significant differences.
The FSA’s requirements are presented to enable market participants to gain an understanding of capital results on an internationally comparable basis. The main differences that have been identified include the following:
i) FSA rules which increase the capital ratios: - Lower loss given default minimum for retail
mortgages of 10%. - Interest Rate Risk in the Banking Book (“IRRBB”)
excluded from Pillar 1 calculations. - Value of business in force to be retained in Tier 1
capital. - Dividends to be deducted from regulatory capital
when declared or approved. - Deferred tax assets to be risk weighted to 100%
rather than being deducted from Tier 1 capital. - Debt issuance costs to follow accounting treatment
(usually capitalised). - Embedded value (including NTA) to be included in
Tier 1 and deducted from total capital until 2012.
ii) FSA rules which decrease the capital ratios: - Does not allow eligible deferred fee income to be
included in Tier 1 capital.
1 Source: Australian Bankers’ Association (“ABA”) Fact Sheet ‘Comparison of regulatory capital frameworks APRA and the UK FSA’ dated 6 November 2008 and PriceWaterhouseCoopers.
FSA and APRA Capital Comparison
Capital Adequacy on FSA Basis
As at 30 September 2008 Tier 1 Total
capital $m $m Capital on APRA basis 25,243 37,562
FSA adjustments 4,027 2,133Capital on FSA basis 29,270 39,695
Capital Structure on FSA Basis
As at 30 September 2008 RWA $m RWA on APRA basis 343,511Adjustments
IRB mortgages (44,977)FSA adjusted RWA 23,751Mortgages adjustment for FSA basis (21,226)IRRBB (RWA) (4,643)Deferred tax assets (RWA) 1,862
Total FSA adjustments (24,007)RWA on FSA basis 319,504
Capital Ratios on FSA Basis
As at 30 September 2008 Tier 1 Total
capital % % Capital ratios on APRA basis 7.3% 10.9%
FSA adjustments 1.8% 1.5%Capital ratios on FSA basis 9.2% 12.4%

Introduction
7
Overview of Basel II
The Basel II Capital Adequacy Framework (“the Basel II Framework”) is an international framework that sets out minimum capital and risk management requirements for banks and other financial institutions. The Basel II Framework was authored by the Basel Committee, a sub-committee of the Bank for International Settlements (“BIS”) headquartered in Basel, Switzerland. The BIS is a global organisation which fosters international monetary and financial cooperation and serves as a bank for central banks.
The objectives of the Basel II Framework are to promote the adoption of stronger risk management practices by the banking industry and strengthen the soundness and stability of the international banking system, ensuring that capital adequacy regulation is not a significant source of competitive inequality. Basel II replaces the regulatory capital adequacy requirements that have been in place since 1988, known as Basel I.
The Basel II Framework is based on three interrelated segments that are known as the "three pillars". Pillar 1 specifies the minimum capital requirements for banks and outlines the various approaches for calculation of such minimum capital for credit risk and operational risk. Pillar 2 covers the supervisory review process whereby regulators ensure that other significant risks are assessed and managed, while Pillar 3 relates to the market discipline of external disclosure.
Pillar 1 – Minimum Capital Requirements Pillar 1 provides banks with guidelines on how to measure the various types of risk they face and the capital that they should hold to cover these risks. It outlines specific measurement approaches that can be adopted for each type of risk.
With Basel II, the calculation of credit risk becomes more granular, introducing a separate capital requirement for operational risk. In addition, APRA also includes interest rate risk in the banking book (“IRRBB”) in Pillar 1 capital – (IRRBB is treated as a Pillar 2 risk in other regulatory jurisdictions). Traded Market Risk is also included.
Basel II Capital Approaches
Pillar 2 – Supervisory Review Process of Capital Adequacy Although the Basel Committee formulates broad supervisory standards and recommends guidelines to help ensure safe banking practice, it does not enforce compliance with the standards it issues. The Basel II Framework outlines a defined supervisory role for the regulator in overseeing the banks it supervises and setting compliance with the requirements of the Basel II Framework. The regulator can require additional capital to be held over and above Pillar 1 capital. Pillar 2 also provides for the Principal Board and Senior Managers to set the bank's level of risk tolerance.
Pillar 3 – Market Discipline Pillar 3 focuses on enhancing public disclosure to allow market participants to assess key information about banks’ risk profile and level of capitalisation.
The Group’s Basel II Methodologies
The Group operates in multiple regulatory jurisdictions. The following table sets out the methodologies applied across the Group as at 30 September 2008.
The Group’s Basel II Methodologies
For the advanced approaches, the Group uses internal models and data to calculate regulatory capital including any regulatory adjustment factors. For IRB, APRA requires a 20% Loss Given Default (“LGD”) floor on loans secured by residential property. APRA has also provided guidance with respect to LGD and Exposure at Default (“EaD”) estimates for other asset categories in order to conservatively model the impact of an economic downturn. The standardised approach uses the Basel II Framework methodology as defined by regulators.
The Group already had an established internal models approach for Traded Market Risk under Basel I. Under Basel II, the coverage of this approach has been enhanced to include new guidance on valuation methods, clarification of the 'trading book' definition and expanded guidance on illiquid instruments. Basel II has also closed opportunities for arbitrage between markets. The Group's internal model for calculating Traded Market Risk was re-accredited for use by APRA in December 2006.

Scope of Application
8
Scope of Application
Top Corporate Entity in the Level 2 Group to which this Disclosure Applies National Australia Bank Limited, incorporating National Australia Bank Limited (“the Company”) and the entities it controls (“the Group”).
Basis of Consolidation for Regulatory Purposes
For Basel II regulatory reporting, consolidation at Level 2 (the National Australia Bank) comprises the global operations of National Australia Bank Limited and its controlled entities, including controlled banking entities and other financial entities (e.g., finance companies and leasing companies).
Under guidelines issued by APRA, investments in and profits from life insurance and funds management entities, are deconsolidated for the purposes of calculating capital adequacy and those activities are excluded from the calculation of RWAs. In addition, the Group deconsolidates from the Level 2 Group, securitisation special purpose vehicles (“SPVs”) to which assets have been transferred in accordance with APRA’s requirements as set out in Prudential Standard APS 120: Securitisation. For regulatory purposes credit risk was removed from the sold assets, and hence, there is no requirement to hold (regulatory) capital for them.
Differences Arising in Consolidation between Regulatory and Accounting Approaches
The primary difference in consolidation between the regulatory approach and the accounting approach as defined by the Australian equivalents to the International Financial Reporting Standards (“AIFRS”) is the area of investments in life insurance funds management and securitisation. Under AIFRS, all entities are consolidated, including special purpose vehicles, where the Group has the power to govern the financial and operating policies so as to obtain benefit from their activities. This includes life insurance funds management and special purpose vehicles used to house securitised assets. A list of material controlled entities included in the consolidated group can be found in the Group’s financial report.
Restrictions on the Transfer of Funds or Regulatory Capital within the Group Transfer of Regulatory Capital
The transfer of regulatory capital and funding within the Group is subject to restrictions imposed by Group or local regulatory requirements, as reflected in internal policies.
Further, for funding transfers within the Group, APS 222: Associations with Related Entities establishes limits on the level of exposure, for example debt and equity that the Company may have to a related entity. Group policy requires compliance with these limits and that the Company takes account of risks associated with dealings with other members of the Group.
Scope of Application [APS 330 Table 1]
As at 30 September 2008 $m Capital deficiencies in non-consolidated subsidiaries
Aggregate amount of under capitalisation in non-consolidated subsidiaries of the ADI group 0
Clydesdale Bank PLC Clydesdale Bank PLC has made use of the provisions laid down in BIPRU 2.1 (Solo Consolidation Waiver). This enables some intra group exposures and investments of Clydesdale Bank PLC in its subsidiaries to be eliminated and the free reserves of such subsidiaries to be aggregated, when calculating capital resource requirements of Clydesdale Bank PLC.
Bank of New Zealand Bank of New Zealand (“BNZ”) is a wholly owned subsidiary of National Australia Bank Group and operates as a regionally autonomous, full-service bank in New Zealand. The BNZ Board is responsible for corporate governance and derives its authority from the Constitution of Bank of New Zealand and applicable New Zealand legislation.
BNZ is subject to the capital adequacy requirements applicable in New Zealand, and achieved advanced Basel II status from the Reserve Bank of New Zealand (“RBNZ”) in 2008. The capital ratios for BNZ presented in this report have been derived under the RBNZ’s Capital Adequacy Framework (Internal Models Approach). Full Basel II based disclosures are published separately under the General Disclosure Statement regime applicable to banks incorporated in New Zealand.

Capital
9
Capital
Capital Adequacy As an ADI, the National Australia Bank Limited is subject to regulation by APRA under the authority of the Banking Act 1959. APRA has set minimum regulatory capital requirements for banks that are consistent with the Basel Accord issued by the Basel Committee on Banking Supervision.
Regulatory capital requirements within this report are for the Group and its banking subsidiaries. The life insurance and funds management businesses are not consolidated for capital adequacy purposes.
APRA has set minimum ratios that compare the regulatory capital with risk-weighted assets (on and off balance sheet). Australian banks are required to maintain a minimum ratio of total eligible capital to total risk-weighted assets of 8.0%, of which a minimum of 4.0% must be held in Tier 1 capital.
In addition to the minimum capital ratio described above, APRA sets a Prudential Capital Ratio (“PCR”) at a level proportional to an ADI’s overall risk profile. A breach of the required ratios under the prudential standards may trigger legally enforceable directions by APRA, which can include a direction to raise additional capital or to cease business.
The Group monitors its capital ratios against internal capital targets that are set over and above minimum capital requirements set by the Principal Board. Target ranges are set by reference to factors such as the risk appetite of the Principal Board, and market, regulatory and rating agencies expectations. In the current environment the Group’s target Tier 1 ratio is above 7%.
Capital Adequacy Assessment The Group assesses its overall capital adequacy in relation to its risk profile using its Internal Capital Adequacy Assessment Process (“ICAAP”). ICAAP is part of the Group’s risk and capital management system, which collectively provides the Group with a framework to balance the basic need to generate an adequate return on the capital while addressing the fundamental need of solvency. As part of the ICAAP process, the Group considers adequacy of capital using the following components: - Regulatory requirements. - The Group’s risk appetite, in line with target credit
rating. - Internal capital adequacy (economic capital) models
to consider its material Pillar 1 and Pillar 2 risks. - A buffer to bottom up or accumulation of business
unit level assessment of risk capital requirements. - Peer analysis. - Qualitative factors relevant to risk management and
investor requirements. - The 3 Year Corporate Plan.
An overview of this process is illustrated below.
The Group’s Internal Capital Adequacy Assessment Process
The Group’s Basel II models assess Pillar 1 risks to determine the regulatory capital requirements for credit risk, traded market risk, operational risk and interest rate risk in the banking book. The Group’s economic capital models assess these Pillar 1 risks as well as material Pillar 2 risks, which include elements of business risk and defined benefit pension risk. Both Basel II and economic capital models are used in the ICAAP process.
The Principal Board Risk Committee (“PBRC”), in its role of approving risk appetite, initiates and reviews the Group’s enterprise-wide scenario stress testing of adverse external events and the potential impact on the Group’s capital plan. Stress testing provides a measurement of risks that may arise through events that are unexpected and of high consequence. The Group’s Risk Scenario Planning process considers the impact of a range of ‘severe but plausible’ scenarios on the Group’s balance sheet, earnings and capital position. The scenario outputs provide the basis to define a set of key triggers to provide early warning to events which may stress the Group’s business performance activities, as well as a range of mitigating actions.
The Group’s Corporate Plan and Risk Appetite Statement specify the cash earnings and ROE outcomes within the context of its target credit rating, targeted capital ratios (e.g., ACE capital, Tier 1 capital and minimum total regulatory capital), economic capital requirements and potential downside financial outcomes under 1-in-5 year and 1-in-20 year events. Downside earnings volatilities are set with reference to ability to maintain dividend policy, absorbing events within target capital ratios and managing asset growth. As the targets are cascaded to the regions, the corporate risk appetite is broken down to regional levels.
RWAs and economic capital are embedded in the corporate planning process through: - Measuring and allocating capital to assess risk-
adjusted returns from businesses, portfolios and transactions, and
Capital
10
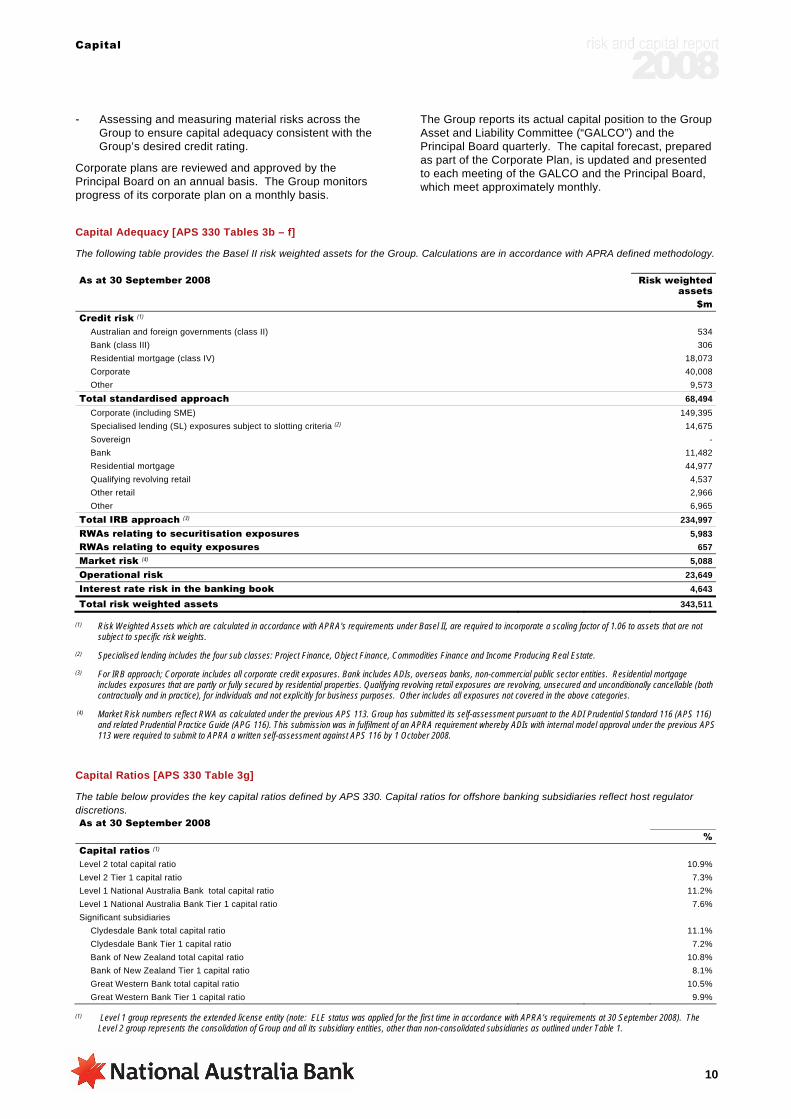
- Assessing and measuring material risks across the Group to ensure capital adequacy consistent with the Group’s desired credit rating.
Corporate plans are reviewed and approved by the Principal Board on an annual basis. The Group monitors progress of its corporate plan on a monthly basis.
The Group reports its actual capital position to the Group Asset and Liability Committee (“GALCO”) and the Principal Board quarterly. The capital forecast, prepared as part of the Corporate Plan, is updated and presented to each meeting of the GALCO and the Principal Board, which meet approximately monthly.
Capital Adequacy [APS 330 Tables 3b – f]
The following table provides the Basel II risk weighted assets for the Group. Calculations are in accordance with APRA defined methodology. As at 30 September 2008 Risk weighted
assets $m Credit risk (1)
Australian and foreign governments (class II) 534Bank (class III) 306Residential mortgage (class IV) 18,073Corporate 40,008Other 9,573
Total standardised approach 68,494Corporate (including SME) 149,395Specialised lending (SL) exposures subject to slotting criteria (2) 14,675Sovereign -Bank 11,482Residential mortgage 44,977Qualifying revolving retail 4,537Other retail 2,966Other 6,965
Total IRB approach (3) 234,997RWAs relating to securitisation exposures 5,983RWAs relating to equity exposures 657Market risk (4) 5,088Operational risk 23,649Interest rate risk in the banking book 4,643
Total risk weighted assets 343,511
(1) Risk Weighted Assets which are calculated in accordance with APRA's requirements under Basel II, are required to incorporate a scaling factor of 1.06 to assets that are not subject to specific risk weights.
(2) Specialised lending includes the four sub classes: Project Finance, Object Finance, Commodities Finance and Income Producing Real Estate.
(3) For IRB approach; Corporate includes all corporate credit exposures. Bank includes ADIs, overseas banks, non-commercial public sector entities. Residential mortgage includes exposures that are partly or fully secured by residential properties. Qualifying revolving retail exposures are revolving, unsecured and unconditionally cancellable (both contractually and in practice), for individuals and not explicitly for business purposes. Other includes all exposures not covered in the above categories.
(4) Market Risk numbers reflect RWA as calculated under the previous APS 113. Group has submitted its self-assessment pursuant to the ADI Prudential Standard 116 (APS 116) and related Prudential Practice Guide (APG 116). This submission was in fulfilment of an APRA requirement whereby ADIs with internal model approval under the previous APS 113 were required to submit to APRA a written self-assessment against APS 116 by 1 October 2008.
Capital Ratios [APS 330 Table 3g]
The table below provides the key capital ratios defined by APS 330. Capital ratios for offshore banking subsidiaries reflect host regulator discretions. As at 30 September 2008 % Capital ratios (1) Level 2 total capital ratio 10.9%Level 2 Tier 1 capital ratio 7.3%Level 1 National Australia Bank total capital ratio 11.2%Level 1 National Australia Bank Tier 1 capital ratio 7.6%Significant subsidiaries
Clydesdale Bank total capital ratio 11.1%Clydesdale Bank Tier 1 capital ratio 7.2%Bank of New Zealand total capital ratio 10.8%Bank of New Zealand Tier 1 capital ratio 8.1%Great Western Bank total capital ratio 10.5%Great Western Bank Tier 1 capital ratio 9.9%
(1) Level 1 group represents the extended license entity (note: ELE status was applied for the first time in accordance with APRA’s requirements at 30 September 2008). The Level 2 group represents the consolidation of Group and all its subsidiary entities, other than non-consolidated subsidiaries as outlined under Table 1.

Capital
11
Capital Structure
The Group’s capital structure comprises various forms of capital. For regulatory purposes, capital has two base elements, eligible Tier 1 and Tier 2 capital, from which certain deductions are made to arrive at net Tier 1 and net Tier 2 capital. Allowable items for inclusion in Tier 1, Tier 2 and total regulatory capital are defined in APS 110.
Under guidelines issued by APRA, life insurance and funds management entities activities are excluded from the calculation of Basel II risk-weighted assets, and the related controlled entities are deconsolidated for the purposes of calculating capital adequacy. The intangible component of the investment in these controlled entities is deducted from Tier 1 capital, with the balance of the investment deducted 50% from Tier 1 and 50% from Tier 2 capital under Basel II. Under Basel I, the balance of the investment was deducted 100% from the total of eligible Tier 1 and Tier 2 capital. Additionally, any profits from these activities included in the Group’s results are excluded from the determination of Tier 1 capital to the extent that they have not been remitted to the Company.
Tier 1 BNZ Income Securities
On 28 March 2008, the Group raised $380 million through the issue of 449,730,000 BNZ Income Securities (BNZIS) at NZ$1 each by BNZ Income Securities Limited. Each BNZIS earns a non-cumulative distribution, payable quarterly in arrears until 28 March 2013 at a rate of 9.89% per annum.
National Income Securities
On 29 June 1999, the Company issued 20,000,000 National Income Securities (NIS) at $100 each. These securities are stapled securities, comprising one fully paid note of $100 issued by the Company through its New York branch, and one unpaid preference share issued by the Company (NIS preference share). The amount unpaid on a NIS preference share will become due in certain limited circumstances, such as a defined event of default. Holders of NIS are entitled to non-cumulative distributions based on a rate equal to the Australian 90 day bank bill rate plus 1.25% per annum, payable quarterly in arrears.
With the prior consent of APRA, the Company may redeem each note for $100 (plus any accrued distributions) and buy back or cancel the NIS preference share stapled to the note for no consideration. NIS have no maturity date, are quoted on the ASX and on a winding-up of the Company will rank for a return of capital behind all deposit liabilities and creditors of the Company, but ahead of ordinary shareholders.
Trust Preferred Securities I and II
On 29 September 2003, the Group raised GBP400 million through the issue by National Capital Trust I of 400,000 Trust Preferred Securities at GBP1,000 each, to be used by the Company's London branch. Each Trust Preferred Security earns a non-cumulative distribution, payable half-yearly in arrears until 17 December 2018 equal to 5.62% per annum and, in respect of each five year period after that date, a non-cumulative distribution payable semi-annually in arrears at a rate equal to the sum of the
yield to maturity of the five year benchmark UK Government bond at the start of that period plus 1.93%.
With the prior consent of APRA, the Trust Preferred Securities may be redeemed by the issuer on 17 December 2018 and on every subsequent fifth anniversary, in which case the redemption price is GBP1,000 per Trust Preferred Security plus the unpaid distributions for the last six month distribution period, and otherwise only where certain adverse tax or regulatory events have occurred subject to a ‘make-whole’ adjustment. In a winding-up of the Company, the Trust Preferred Securities will generally rank equally with the holders of other preference shares and will rank for return of capital behind all deposit liabilities and creditors of the Company, but ahead of ordinary shareholders.
On 23 March 2005, the Group raised US$800 million through the issue by National Capital Trust II of 800,000 Trust Preferred Securities at US$1,000 each, to be used by the Company’s London branch. Each Trust Preferred Security earns a non-cumulative distribution, payable half-yearly in arrears until 23 March 2005, equal to 5.486%. For all distribution periods ending after 23 March 2015, each Trust Preferred Security earns a non-cumulative distribution, payable quarterly in arrears, equal to 1.5375% over three month LIBOR.
With the prior consent of APRA, the Trust Preferred Securities may be redeemed on or after 23 March 2015, in which case the redemption price is US$1,000 per Trust Preferred Security plus the distributions for the last distribution period, and otherwise only where certain adverse tax or regulatory events have occurred subject to a ‘make-whole’ adjustment. In a winding-up of the Company, the Trust Preferred Securities will generally rank equally with the holders of other preference shares and will rank for return of capital behind all deposit liabilities and creditors of the Company, but ahead of ordinary shareholders.
National Capital Instruments I and II
On 18 September 2006, the Group raised $400 million (prior to issuance costs) through the issue by National Capital Trust III of 8,000 National Capital Instruments (Australian NCIs) at $50,000 each. Each Australian NCI earns a non-cumulative distribution, payable quarterly in arrears until 30 September 2016 at a rate equal to the bank bill rate plus a margin of 0.95% per annum. For all distribution periods ending after 30 September 2016, each Australian NCI earns a non-cumulative distribution, payable quarterly in arrears, equal to the bank bill rate plus a margin of 1.95% per annum.
With the prior consent of APRA, the Australian NCIs may be redeemed on 30 September 2016 and any subsequent distribution payment date after 30 September 2016. In a winding-up of the Company, the Australian NCIs and (if issued) the Australian NCI preference shares will generally rank equally with the holders of other preference shares and will rank for return of capital behind all deposit liabilities and creditors of the Company, but ahead of ordinary shareholders.
On 29 September 2006, the Group raised EUR400 million through the issue by National Capital Instruments [Euro] LLC 2 of 8,000 National Capital Instruments (Euro NCIs)
Capital
12
at EUR50,000 each. Each Euro NCI earns a non-cumulative distribution, payable quarterly in arrears until 29 September 2016 at a rate equal to three month EURIBOR plus a margin of 0.95% per annum. For all distribution periods ending after 29 September 2016, each Euro NCI earns a non-cumulative distribution, payable quarterly in arrears, equal to three month EURIBOR plus a margin of 1.95% per annum. The notes are unsecured and all or some of them may be redeemed at the option of the Company with the prior consent of APRA.
Stapled Securities
On 24 September 2008, the Group issued AUD297 million Stapled Securities. The Stapled Securities are perpetual capital instruments. Each Stapled Security pays a non-cumulative distribution at a rate of 2.00% over the 30-Day Bank Bill Swap Rate (“BBSW”).. From 24 December 2008, subject to APRA approval, the securities are redeemable at the Group's option. In the event that the securities are not redeemed, they will convert into a variable number of National Australia Bank Limited ordinary shares on 24 September 2009, subject to the satisfaction of conversion conditions.
Convertible Notes
On 24 September 2008, the Group issued AUD297 million Convertible Notes. The Convertible Notes pay a non-cumulative distribution at a rate of 2.00% over the 30-Day BBSW From 24 December 2008, subject to APRA approval, the notes are redeemable at the Group's option. The notes are convertible at the holder's option into a variable number of National Australia Bank Limited ordinary shares from 24 July 2009.
Tier 2 Perpetual Floating Rate Notes
On 9 October 1986, the Company issued US$250 million ($460 million) undated subordinated floating rate notes. Interest is payable half-yearly in arrears, in April and October, at a rate of 0.15% per annum above the arithmetic average of the rates offered by the reference banks for six month US dollar deposits in London. The notes are unsecured and have no final maturity. All or some of the notes may be redeemed at the option of the Company with the prior consent of APRA.
Subordinated Medium-term Notes
Certain notes are subordinated in right of payment to the claims of depositors and all other creditors of the Company. Subordinated notes with an original maturity of at least five years constitute Tier 2 capital, as defined by APRA for capital adequacy purposes.
Subordinated notes have been issued under the Euro medium-term note program, US medium-term note program, Domestic debt issuance program and the Global medium-term note program of the Group: - Under the Euro medium-term note program of the
Company, the following notes are outstanding: $2,408 million (2007: $2,258 million) fixed rate notes maturing between 2015 and 2016 with fixed rates between 3.88% – 5.38% (2007: 3.88% – 5.38%); and $2,010 million (2007: $2,514 million) floating rate notes maturing 2014.
- Under the previously registered US medium-term note program of the Company, the following notes are outstanding: $1,213 million (2007: $1,579 million) fixed rate notes maturing between 0 to 5 years with a fixed rate of 8.60% (2007: 6.60% – 8.60%).
- Under the Domestic debt issuance program of the Company, the following notes are outstanding: $756 million (2007: $735 million) fixed rate notes maturing between 2014 and 2017 with fixed rates between 6.50% – 7.25% (2007: 6.50% – 7.25%); and $1,420 million (2007: $669 million) floating rate notes maturing between 2014 and 2018 are outstanding.
- Under the Global medium-term note program, the following notes are outstanding: $3,100 million (2007: $1,345 million) fixed rate notes maturing between 2016 and 2023 with fixed rates between 4.55% – 7.13% (2007: 4.55%); and $2,793 million (2007: $2,548 million) floating rate notes maturing between 2016 and 2017.
- The Group has conducted a number of stand-alone subordinated medium-term note issues: $108 million (2007: $nil) fixed rate notes maturing greater than 5 years with fixed rates between 5.47% – 7.50%; $3 million (2007: $nil) floating rate notes maturing between 0 to 5 years; and $62 million (2007: $nil) floating rate notes maturing greater than 5 years.
Capital
13
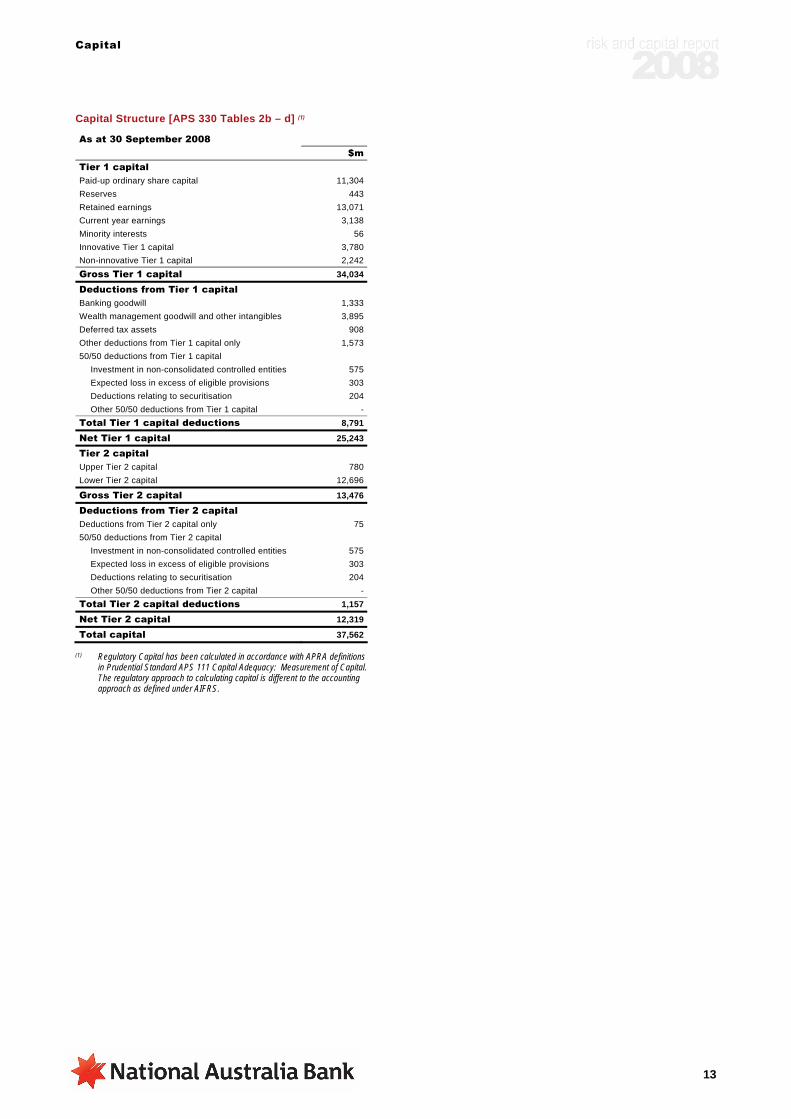
Capital Structure [APS 330 Tables 2b – d] (1)
As at 30 September 2008 $m Tier 1 capital Paid-up ordinary share capital 11,304Reserves 443Retained earnings 13,071Current year earnings 3,138Minority interests 56Innovative Tier 1 capital 3,780Non-innovative Tier 1 capital 2,242Gross Tier 1 capital 34,034
Deductions from Tier 1 capital Banking goodwill 1,333Wealth management goodwill and other intangibles 3,895Deferred tax assets 908Other deductions from Tier 1 capital only 1,57350/50 deductions from Tier 1 capital
Investment in non-consolidated controlled entities 575Expected loss in excess of eligible provisions 303Deductions relating to securitisation 204Other 50/50 deductions from Tier 1 capital -
Total Tier 1 capital deductions 8,791
Net Tier 1 capital 25,243
Tier 2 capital Upper Tier 2 capital 780Lower Tier 2 capital 12,696
Gross Tier 2 capital 13,476
Deductions from Tier 2 capital Deductions from Tier 2 capital only 7550/50 deductions from Tier 2 capital
Investment in non-consolidated controlled entities 575Expected loss in excess of eligible provisions 303Deductions relating to securitisation 204Other 50/50 deductions from Tier 2 capital -
Total Tier 2 capital deductions 1,157
Net Tier 2 capital 12,319
Total capital 37,562
(1) Regulatory Capital has been calculated in accordance with APRA definitions in Prudential Standard APS 111 Capital Adequacy: Measurement of Capital. The regulatory approach to calculating capital is different to the accounting approach as defined under AIFRS.

Risk Exposure and Assessment
14
Risk Exposure and Assessment
Introduction Identifying, quantifying, monitoring and managing the Group’s exposure to risk is an integral part of the strategic and operational activities of the Group. This section describes risk management across the Group.
Risk Governance and Strategy Risk management permeates every aspect of the business. The Group’s risk governance framework describes the responsibility of each level of management in identifying and managing risk. At the highest level, the Group’s Principal Board and Executive Management are responsible for identifying risks facing the Group and having systems in place to monitor and manage those risks.
The Principal Board establishes the formal risk appetite statement for the Group, which sets an overall limit on the total amount of risk that the Group is prepared to take, based on the returns that the Group is seeking to provide to shareholders, the credit rating that the Group is seeking to maintain, the Group’s capital position, and the Group’s desired capital ratios. The risk appetite statement informs the Group’s risk, capital and business management limits and policies. It is reviewed periodically by the Principal Board as part of the strategic planning process, or as the commercial circumstances of the Group change.
The Principal Board, upon the recommendation of the Principal Board Risk Committee (“PBRC”), approves all material risk policies, and monitors and reviews the adequacy of the Group’s risk management framework. This framework establishes responsibility and accountability for risk management through clearly defined authority, policy and controls.
The PBRC’s responsibilities include the oversight of risk management within the Group, reviewing management plans for risk mitigation and the implementation of these plans. The PBRC delegates the day-to-day oversight and control of risk to management. The delegation of authority is clearly set out and documented.
At the executive management level, the Group Risk Management Committee (“GRMC”) serves as the principal management body for risk strategy and risk policy decision making within the Group and provides the Principal Board and the PBRC with assurance on the performance of the overall risk management framework.
The GRMC is chaired by the Group’s Chief Executive Officer. The GRMC is supported by five sub-committees, each overseeing a specific risk area: Group Credit Risk Committee, Group Market Risk Committee, Group Operational Risk and Compliance Committee, Group Asset and Liability Committee, and the Group Capital Committee. The major regional businesses have Risk Management Committees comprising senior regional executives. Their role is to provide management focus on risk issues within the region.
The Group’s Chief Executive Officer, Chief Risk Officer and Chief Financial Officer provide the Principal Board with various attestations relating to the financial, risk and capital management of the Group. Attestations are also provided to APRA to assist the regulator in fulfilling its prudential oversight role.
The Group’s Risk Committee Structure

Risk Exposure and Assessment
15
The Three Lines of Defence
The Three Lines of Defence The Group’s approach to risk management is based on the principle that, to be effective, risk management capability must be embedded in front line teams, with independent oversight and assurance. This principle is designed to help ensure that: - All business decisions proactively consider risk, - Business managers use the Risk Management and
Capital Management frameworks to help balance risk and reward,
- Employees have the knowledge and tools to complete their work accurately and efficiently,
- All employees are responsible for risk management in their day-to-day activities, and
- Risk management is a core competency for all employees.
Implementation of all risk management is carried out through the Group’s three lines of defence: - In the first line of defence, each regional business
unit, including the Corporate Centre, is accountable for managing the risks associated with their activities. That is, monitoring the effectiveness of controls, the adherence to policies, limits and escalation with regular reporting of breaches and evaluation of the level and trends of material risks.
- The second line of defence comprises the Risk Management functions across the Group. That is, the specific risk management, compliance and support functions at both the Corporate Centre and regional levels that are accountable for independent monitoring and oversight.
- The third line of defence is the responsibility of Internal Audit, which operates as a global and independent function reporting directly to the Chairman of the Principal Board Audit Committee (“PBAC”). It provides independent audit, validation and oversight of business unit compliance with Group risk policies and procedures and, on an annual basis, attests to the adequacy of the Group’s Risk Management systems. Internal Audit is supported by independent testing of key controls undertaken throughout the year across the Group’s business units and Risk Management functions. It also considers the results of various external reviews and incidents.
Risk Exposure and Assessment
16
Risk Governance Credit Risk
Credit decision-making authority is delegated by the Principal Board to the PBRC and then through the organisation via the Group Chief Executive Officer and Group Chief Risk Officer, who set the Delegated Commitment Authority (“DCA”) for each level.
The GRMC oversees the processes, systems, methodologies and models for credit risk management across the Group. It is supported by the Group Credit Risk Committee (“GCRC”), which considers credit risk matters that relate to risk culture, integrated risk governance processes, risk strategy and performance.
The Transactional Credit Committee (“TCC”) is the decision making body for credit facilities that are greater than a region’s DCA. It also makes recommendations and takes actions to control or manage high-risk situations, and escalates credit risk issues to the GRMC and Group Credit Risk.
Regional Risk Management Committees are responsible for overseeing the credit risk processes, systems, methodologies and performance at the regional level.
The Group manages the levels of credit risk it undertakes by placing limits on the amount of risk accepted in relation to one borrower or groups of borrowers, and to geographic and industry segments. Such risks are monitored on a regular basis and are subject to annual or more frequent reviews.
Group Credit Policy applies globally. It provides the key principles of the Group's credit risk appetite, and the credit underwriting framework that is used to assess borrower risk. The policy conforms with various regulatory standards and is reviewed at least annually to ensure continued compliance. Amendments to the Group Credit Policy require approval by the GCRC. Each Region is responsible for operating procedures that comply with Group Credit Policy, approved in accordance with Regional Governance frameworks.
Any exemptions approved by officers based on designated authority are recorded in the Policy Exceptions Database.
Operational Risk
The Principal Board, upon the recommendation of the PBRC, is responsible for approving the Group operational risk framework, which provides a consistent and structured approach to operational risk management across the Group. Together with GRMC, the PBRC monitors and reviews the Group’s operational risk profile at their regular meetings. The Group Operational Risk and Compliance Committee (“GORCC”) meets monthly and is responsible for overseeing operational and compliance risk across the Group. GORCC has the delegated authority from GRMC to approve Group operational risk policies that are developed by Group Operational Risk. In addition, each region has its own Operational Risk Committee that typically meets monthly and presents its operational risk profile report to the GORCC half yearly along with input into the GCRO Report which goes to GRMC.
Traded Market Risk
The Principal Board, under guidance of the PBRC, monitors and reviews the adequacy of the Group’s Traded Market Risk framework, and endorses the management and reporting framework for market risk. The PBRC approves the Group traded market risk policy, which includes elements such as limits, stress testing and the definition of the trading book.
The Group Market Risk Committee (“GMRC”) monitors the Group-wide market risk profile and exposures, and provides direction and support to Group Market Risk (“GMR”). It also provides the GRMC with recommendations on policies, models and risk appetite in relation to market risk, and escalates market risk issues to the GRMC as necessary.
The PBRC and the nabCapital Risk Management Committee (“nabCapital RMC”) oversee market risk activities by monitoring key indicators, such as Value at Risk (“VaR”) and profit and loss trends, limit breaches and actions taken, and significant market risk events.
Non Traded Market Risk
Interest Rate Risk in the Banking Book (IRRBB)
The IRRBB policy, inclusive of the risk appetite and limits, is approved by the Principal Board, with Group authority delegated to the Group Asset and Liability Management Committee (“GALCO”) and Regional Asset and Liability Management Committees (“Regional ALCOs”) for implementation and monitoring. Authority for development and execution of IRRBB strategy, performance targets and implementation is delegated by GALCO to Group Treasury.
Group Non Traded Market Risk (“GNTMR”), a Group Risk function, provides oversight and the IRRBB governance framework. GNTMR is the owner of policies and APRA approved models.
Equities Risk in the Banking Book
The Principal Board, upon the recommendation of the PBRC, approves risk appetite for equity investments with a defined delegation of authority to management to undertake equity investments.
Other Material Risks:
Liquidity Risk
The Principal Board, upon the recommendation of the PBRC, approves the Group Liquidity Policy, endorses an effective management and reporting framework and monitors and review the adequacy of the Group’s liquidity framework.
The PBRC receives regular presentations on Group liquidity management activity, risk limits and sensitivity metrics.
Funding Risk
The Principal Board, upon the recommendation of the PBRC, approves the risk appetite, funding principles and objectives, and endorses the risk management and compliance framework for funding.
The PBRC, on behalf of the Principal Board, receives regular presentations on Group funding activity, risk limits and sensitivity metrics, and is informed of any significant
Risk Exposure and Assessment
17
developments in relation to external stakeholders (e.g., regulatory bodies), internal change management initiatives and other relevant items.
Securitisation Risk
Internal Securitisation
The Principal Board, upon the recommendation of the PBRC, approves the Group Owned Asset Securitisation policy and the Group’s securitisation management and reporting framework.
The governance processes related to securitisation are contained in the Group’s risk management framework. Securitisation compliance and governance by GNTMR is independent of securitisation execution.
3rd Party Securitisation
For the reporting period, the Principal Board delegated to management responsibility for the monitoring and review of the Group’s third party asset securitisation management and reporting. Process changes post 30 September 2008 are that the Principal Board will periodically monitor and review third party asset securitisation management and reporting with guidance from nabCapital RMC, GRMC and the PBRC.

Risk Exposure and Assessment
18
The First & Second Line of Defence by Risk Type
The following table provides an overview of the key activities of first and second line of defence for the specific APS 330 risk types. The third line of defence includes independent audit, validation and oversight activities, which are similar for all risk types. The third line of defence is outlined in more detail on page 15 of this report.
First line of defence Second line of defence
Credit Risk Senior and line management within each business constitute the first line of defence.
Their primary responsibility is to ensure that credit policies, processes and standards are followed in their area. This includes ensuring that credit approvals are made within designated authorities or escalated.
As part of ongoing monitoring of credit approvals, line management are required to operate within portfolio and concentration limits. Policies and procedures are in place that limit exposure to areas subject to unacceptable political or environmental risk, or where credit risk concentration is deemed to be outside risk appetite.
Line management are required to report on exposures that qualify for inclusion in relevant regulatory returns, such as APS 221: Large Exposures and APS 222: Associations with Related Entities. Line managers are required to undertake a review of most facilities at least annually.
When assessing an exposure for potential escalation to specialist credit areas, a comprehensive check list is in place to guide the assessment process.
The second line of defence is provided by Credit Management Risk functions at the Group and regional level, as well as the Risk Asset Review function.
At Group level, Group Credit Risk owns and is accountable for the credit risk policies and systems, concentration limits, large counterparty credit approvals and the management of large under-performing loans. Group Credit Risk is also responsible for ensuring that such policies and systems comply with the various regulatory and prudential requirements.
Group Credit Risk is responsible for the credit risk management architecture and for the administration of certain critical credit risk assessment processes and controls, such as credit risk identification, assessment, monitoring and reporting, and the delegation framework. They also ensure that the Regions manage their risks as required.
The Risk Asset Review (“RAR”) team is responsible for the independent review and reporting on asset quality, lending process standards and credit policy compliance across non system-based lending portfolios. RAR operates independently from the credit approval process and reports its findings to the respective business units and Regional/Group risk management committees highlighting adverse trends and required remedial action. The main areas of focus are on asset quality and the effectiveness of the lending process.
Operational Risk The Regional CEOs and the Corporate Centre Executive General Managers are accountable for managing the risks associated with their respective business activities. They constitute the first line of defence.
Through implementation of the Operational Risk Framework and related policies, business management is able to identify, assess and monitor Operational Risk exposures, implement appropriate mitigation strategies, and provide effective reporting to business, Regional and Group governance committees and, ultimately, to the Principal Board.
To achieve this, business areas continuously update their Operational Risk Profiles in line with changes in the business or its environment at least quarterly. They also conduct an annual Scenario Analysis process to identify and assess their exposure to potential extreme events, and monitor, record and act upon actual losses or ‘near misses’ they have suffered.
In addition, the effectiveness of the controls on which the business relies to mitigate its risks, are subject to regular testing and attestation, and detailed processes are in place to control and monitor specific Operational Risk types such as Business Continuity and Financial Crime.
The Group and Regional Chief Risk Officers are accountable for the specific risk management, compliance and support functions at the Group and the Regional levels, respectively.
Group Operational Risk is responsible for designing, maintaining and overseeing implementation of the Operational Risk Framework, Events Management Policy, Operational Risk capture tools, and the model for Operational Risk capital calculation. Regional Operational Risk teams monitor, oversee and report loss events, business unit Operational Risk Profiles, and implementation of policies within their respective Regions.
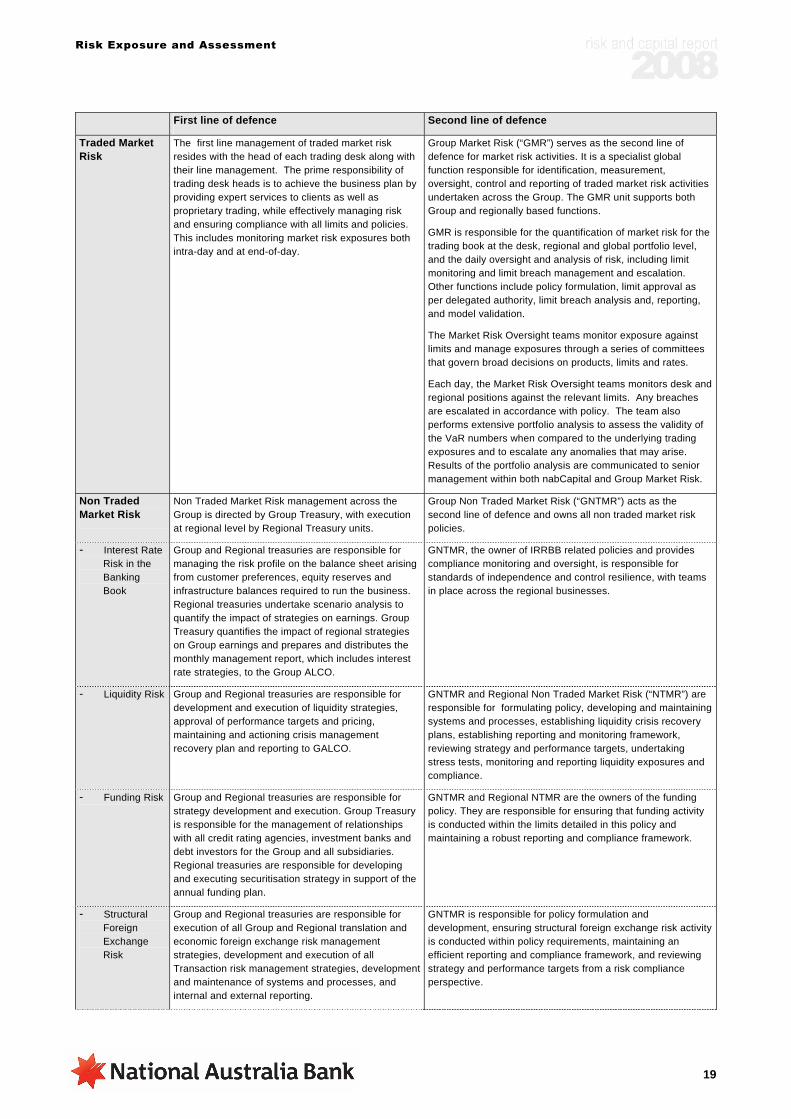
Risk Exposure and Assessment
19
First line of defence Second line of defence
Traded Market Risk
The first line management of traded market risk resides with the head of each trading desk along with their line management. The prime responsibility of trading desk heads is to achieve the business plan by providing expert services to clients as well as proprietary trading, while effectively managing risk and ensuring compliance with all limits and policies. This includes monitoring market risk exposures both intra-day and at end-of-day.
Group Market Risk (“GMR”) serves as the second line of defence for market risk activities. It is a specialist global function responsible for identification, measurement, oversight, control and reporting of traded market risk activities undertaken across the Group. The GMR unit supports both Group and regionally based functions.
GMR is responsible for the quantification of market risk for the trading book at the desk, regional and global portfolio level, and the daily oversight and analysis of risk, including limit monitoring and limit breach management and escalation. Other functions include policy formulation, limit approval as per delegated authority, limit breach analysis and, reporting, and model validation.
The Market Risk Oversight teams monitor exposure against limits and manage exposures through a series of committees that govern broad decisions on products, limits and rates.
Each day, the Market Risk Oversight teams monitors desk and regional positions against the relevant limits. Any breaches are escalated in accordance with policy. The team also performs extensive portfolio analysis to assess the validity of the VaR numbers when compared to the underlying trading exposures and to escalate any anomalies that may arise. Results of the portfolio analysis are communicated to senior management within both nabCapital and Group Market Risk.
Non Traded Market Risk
Non Traded Market Risk management across the Group is directed by Group Treasury, with execution at regional level by Regional Treasury units.
Group Non Traded Market Risk (“GNTMR”) acts as the second line of defence and owns all non traded market risk policies.
- Interest Rate Risk in the Banking Book
Group and Regional treasuries are responsible for managing the risk profile on the balance sheet arising from customer preferences, equity reserves and infrastructure balances required to run the business. Regional treasuries undertake scenario analysis to quantify the impact of strategies on earnings. Group Treasury quantifies the impact of regional strategies on Group earnings and prepares and distributes the monthly management report, which includes interest rate strategies, to the Group ALCO.
GNTMR, the owner of IRRBB related policies and provides compliance monitoring and oversight, is responsible for standards of independence and control resilience, with teams in place across the regional businesses.
- Liquidity Risk Group and Regional treasuries are responsible for development and execution of liquidity strategies, approval of performance targets and pricing, maintaining and actioning crisis management recovery plan and reporting to GALCO.
GNTMR and Regional Non Traded Market Risk (“NTMR”) are responsible for formulating policy, developing and maintaining systems and processes, establishing liquidity crisis recovery plans, establishing reporting and monitoring framework, reviewing strategy and performance targets, undertaking stress tests, monitoring and reporting liquidity exposures and compliance.
- Funding Risk Group and Regional treasuries are responsible for strategy development and execution. Group Treasury is responsible for the management of relationships with all credit rating agencies, investment banks and debt investors for the Group and all subsidiaries. Regional treasuries are responsible for developing and executing securitisation strategy in support of the annual funding plan.
GNTMR and Regional NTMR are the owners of the funding policy. They are responsible for ensuring that funding activity is conducted within the limits detailed in this policy and maintaining a robust reporting and compliance framework.
- Structural Foreign Exchange Risk
Group and Regional treasuries are responsible for execution of all Group and Regional translation and economic foreign exchange risk management strategies, development and execution of all Transaction risk management strategies, development and maintenance of systems and processes, and internal and external reporting.
GNTMR is responsible for policy formulation and development, ensuring structural foreign exchange risk activity is conducted within policy requirements, maintaining an efficient reporting and compliance framework, and reviewing strategy and performance targets from a risk compliance perspective.
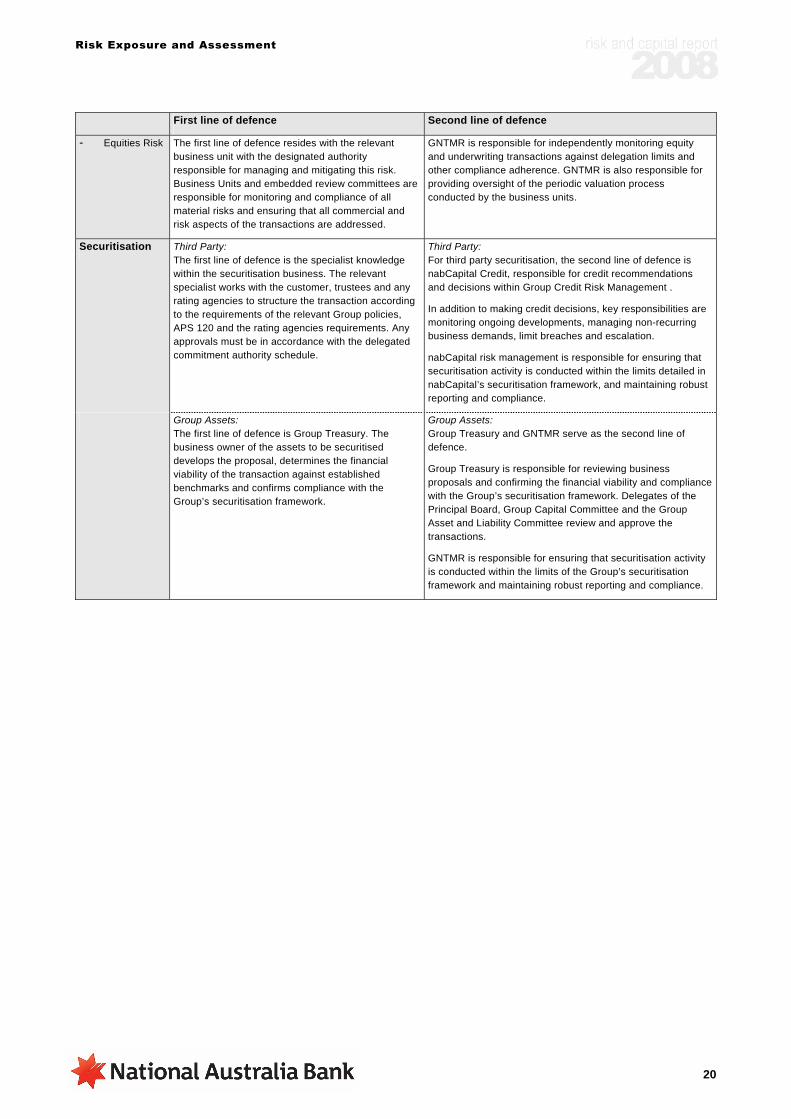
Risk Exposure and Assessment
20
First line of defence Second line of defence
- Equities Risk The first line of defence resides with the relevant business unit with the designated authority responsible for managing and mitigating this risk. Business Units and embedded review committees are responsible for monitoring and compliance of all material risks and ensuring that all commercial and risk aspects of the transactions are addressed.
GNTMR is responsible for independently monitoring equity and underwriting transactions against delegation limits and other compliance adherence. GNTMR is also responsible for providing oversight of the periodic valuation process conducted by the business units.
Securitisation Third Party: The first line of defence is the specialist knowledge within the securitisation business. The relevant specialist works with the customer, trustees and any rating agencies to structure the transaction according to the requirements of the relevant Group policies, APS 120 and the rating agencies requirements. Any approvals must be in accordance with the delegated commitment authority schedule.
Third Party: For third party securitisation, the second line of defence is nabCapital Credit, responsible for credit recommendations and decisions within Group Credit Risk Management .
In addition to making credit decisions, key responsibilities are monitoring ongoing developments, managing non-recurring business demands, limit breaches and escalation.
nabCapital risk management is responsible for ensuring that securitisation activity is conducted within the limits detailed in nabCapital’s securitisation framework, and maintaining robust reporting and compliance.
Group Assets: The first line of defence is Group Treasury. The business owner of the assets to be securitised develops the proposal, determines the financial viability of the transaction against established benchmarks and confirms compliance with the Group’s securitisation framework.
Group Assets: Group Treasury and GNTMR serve as the second line of defence.
Group Treasury is responsible for reviewing business proposals and confirming the financial viability and compliance with the Group’s securitisation framework. Delegates of the Principal Board, Group Capital Committee and the Group Asset and Liability Committee review and approve the transactions.
GNTMR is responsible for ensuring that securitisation activity is conducted within the limits of the Group’s securitisation framework and maintaining robust reporting and compliance.
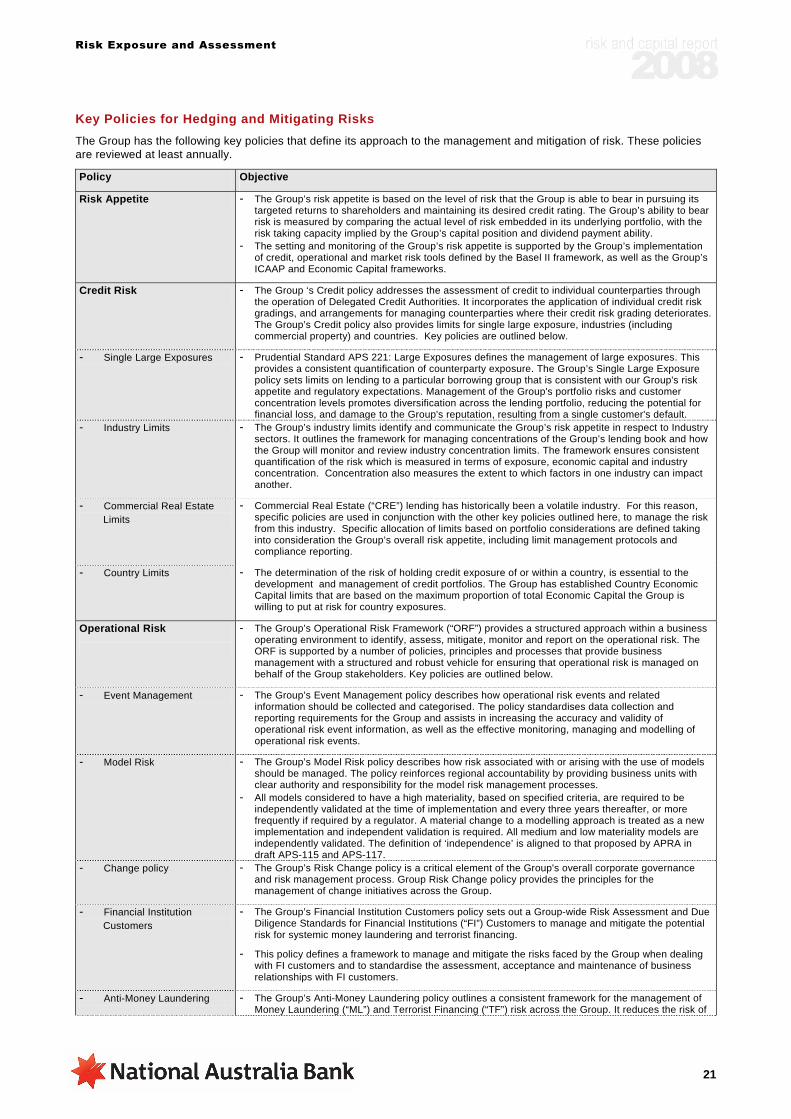
Risk Exposure and Assessment
21
Key Policies for Hedging and Mitigating Risks The Group has the following key policies that define its approach to the management and mitigation of risk. These policies are reviewed at least annually.
Policy Objective
Risk Appetite - The Group’s risk appetite is based on the level of risk that the Group is able to bear in pursuing its targeted returns to shareholders and maintaining its desired credit rating. The Group’s ability to bear risk is measured by comparing the actual level of risk embedded in its underlying portfolio, with the risk taking capacity implied by the Group’s capital position and dividend payment ability.
- The setting and monitoring of the Group’s risk appetite is supported by the Group’s implementation of credit, operational and market risk tools defined by the Basel II framework, as well as the Group’s ICAAP and Economic Capital frameworks.
Credit Risk - The Group ‘s Credit policy addresses the assessment of credit to individual counterparties through the operation of Delegated Credit Authorities. It incorporates the application of individual credit risk gradings, and arrangements for managing counterparties where their credit risk grading deteriorates. The Group’s Credit policy also provides limits for single large exposure, industries (including commercial property) and countries. Key policies are outlined below.
- Single Large Exposures - Prudential Standard APS 221: Large Exposures defines the management of large exposures. This provides a consistent quantification of counterparty exposure. The Group’s Single Large Exposure policy sets limits on lending to a particular borrowing group that is consistent with our Group's risk appetite and regulatory expectations. Management of the Group's portfolio risks and customer concentration levels promotes diversification across the lending portfolio, reducing the potential for financial loss, and damage to the Group's reputation, resulting from a single customer's default.
- Industry Limits - The Group’s industry limits identify and communicate the Group’s risk appetite in respect to Industry sectors. It outlines the framework for managing concentrations of the Group’s lending book and how the Group will monitor and review industry concentration limits. The framework ensures consistent quantification of the risk which is measured in terms of exposure, economic capital and industry concentration. Concentration also measures the extent to which factors in one industry can impact another.
- Commercial Real Estate Limits
- Commercial Real Estate (“CRE”) lending has historically been a volatile industry. For this reason, specific policies are used in conjunction with the other key policies outlined here, to manage the risk from this industry. Specific allocation of limits based on portfolio considerations are defined taking into consideration the Group’s overall risk appetite, including limit management protocols and compliance reporting.
- Country Limits - The determination of the risk of holding credit exposure of or within a country, is essential to the development and management of credit portfolios. The Group has established Country Economic Capital limits that are based on the maximum proportion of total Economic Capital the Group is willing to put at risk for country exposures.
Operational Risk
- The Group’s Operational Risk Framework (“ORF”) provides a structured approach within a business operating environment to identify, assess, mitigate, monitor and report on the operational risk. The ORF is supported by a number of policies, principles and processes that provide business management with a structured and robust vehicle for ensuring that operational risk is managed on behalf of the Group stakeholders. Key policies are outlined below.
- Event Management - The Group’s Event Management policy describes how operational risk events and related information should be collected and categorised. The policy standardises data collection and reporting requirements for the Group and assists in increasing the accuracy and validity of operational risk event information, as well as the effective monitoring, managing and modelling of operational risk events.
- Model Risk - The Group’s Model Risk policy describes how risk associated with or arising with the use of models should be managed. The policy reinforces regional accountability by providing business units with clear authority and responsibility for the model risk management processes.
- All models considered to have a high materiality, based on specified criteria, are required to be independently validated at the time of implementation and every three years thereafter, or more frequently if required by a regulator. A material change to a modelling approach is treated as a new implementation and independent validation is required. All medium and low materiality models are independently validated. The definition of ‘independence’ is aligned to that proposed by APRA in draft APS-115 and APS-117.
- Change policy - The Group’s Risk Change policy is a critical element of the Group's overall corporate governance and risk management process. Group Risk Change policy provides the principles for the management of change initiatives across the Group.
- Financial Institution Customers
- The Group’s Financial Institution Customers policy sets out a Group-wide Risk Assessment and Due Diligence Standards for Financial Institutions (“FI”) Customers to manage and mitigate the potential risk for systemic money laundering and terrorist financing.
- This policy defines a framework to manage and mitigate the risks faced by the Group when dealing with FI customers and to standardise the assessment, acceptance and maintenance of business relationships with FI customers.
- Anti-Money Laundering - The Group’s Anti-Money Laundering policy outlines a consistent framework for the management of Money Laundering (“ML”) and Terrorist Financing (“TF”) risk across the Group. It reduces the risk of

Risk Exposure and Assessment
22
Policy Objective
the Group’s products, services and reputation being used by those engaged in ML or TF activities.
- Economic and Trade Sanctions
- The Group’s Economic and Trade Sanctions policy defines the requirements for compliance with applicable legal and regulatory requirements, including the Australian International Trade and Integrity Act (“ITIA”) and protects the Group’s reputation.
- The policy sets out the Group’s approach for complying with sanctions and embargoes and governs the Group’s approach for developing and deploying appropriate resources in order to comply with these requirements.
- Fraud & Corruption - The Group’s Anti-Fraud and Anti-Corruption policy sets out the Group’s approach to deterring and detecting internal and external fraud. It defines how staff in the performance of functions of their employment, are not to dishonestly take advantage of their employment with the Group to obtain any benefit for themselves, the Group, or for another person or organisation, or to cause loss to another party or organisation .
- Business Continuity Management
- The Group’s Business Continuity Management policy is aligned to APS 232. Regions comply with the requirements and develop Business Continuity Plans to ensure the Group's Business Critical Processes continue to operate during periods of significant disruption.
Traded Market Risk - The Group’s Traded Market Risk policy and the Rates and Revaluation policy identify market risks relevant to the Group and outline limit management requirements. The policy framework also contains the Group’s Trading Book Policy Statement and articulates responsibilities and authorities for measuring, monitoring and reporting market risk.
- Limit Management - Limit management contained within the Traded Market Risk policy requires independent overview of limit compliance and staff to act in accordance with policy in the event of a limit excess. Limits are a management and control tool used to align the degree of risk assumed by trading desks within the Group’s risk tolerance and its revenue operations.
- Rates and Revaluation - The Rates and Revaluation policy outlines how end-of-day revaluation rates are sourced, validated, reviewed and reported. This ensures that rates are sourced appropriately and validated before they are employed for valuation and risk measurement.
Non Traded Market Risk - Non Traded Market Risk covers the risk inherent in the warehousing of loans and accepting deposits and other forms of borrowing from the public. As a result of these activities, the Group is exposed to potential movements in interest rates and must be able to access sufficient funds to meet both demand for new loans and withdrawal of deposits and borrowings. These risks are collectively managed as part of the Group’s Non Traded Market Risk process. Key policies are outlined below.
- Interest Rate Risk in the Banking Book
- The Group’s IRRBB policy defines compliance, the management framework and the process to ensure that:
o All interest rate risk positions in the banking book are identified, measured, managed and reported, with an aim to manage fluctuations in the Group’s economic value and earnings under different scenarios, and
o Interest rate risk positions are managed within the Principal Board approved risk appetite, both regionally and on a consolidated banking book basis.
o A consistent risk management framework is applied across the Group, with regional responsibilities for measuring, monitoring and managing interest rate risk in the banking book. A consistent Group-wide IRRBB methodology is used to assess the bank’s interest rate risk in the banking book from both an earnings and economic value perspective.
o Interest rate risk is measured, managed and monitored regionally using both a valuation and earnings approach, incorporating Value at Risk, Earnings at Risk, Economic Value Sensitivity and Net Interest Income Sensitivity limits, cashflow analysis, scenario analysis and stress testing.
- Funding policy - The Group’s Funding policy exists to ensure that Group and subsidiary balance sheet management practices do not introduce unacceptable levels of funding risk. The policy states the Principal Board’s risk appetite, guiding principles and objectives with regard to funding. The policy also details the framework by which funding activity will be governed and managed.
- Liquidity policy - The Group’s Liquidity policy ensures that the Group can meet its current and future payment obligations as they become due under diverse operating scenarios. It states the Principal Board’s risk appetite, guiding principles and guiding objectives with regard to liquidity, and details the framework by which Group’s liquidity management will be monitored and governed.
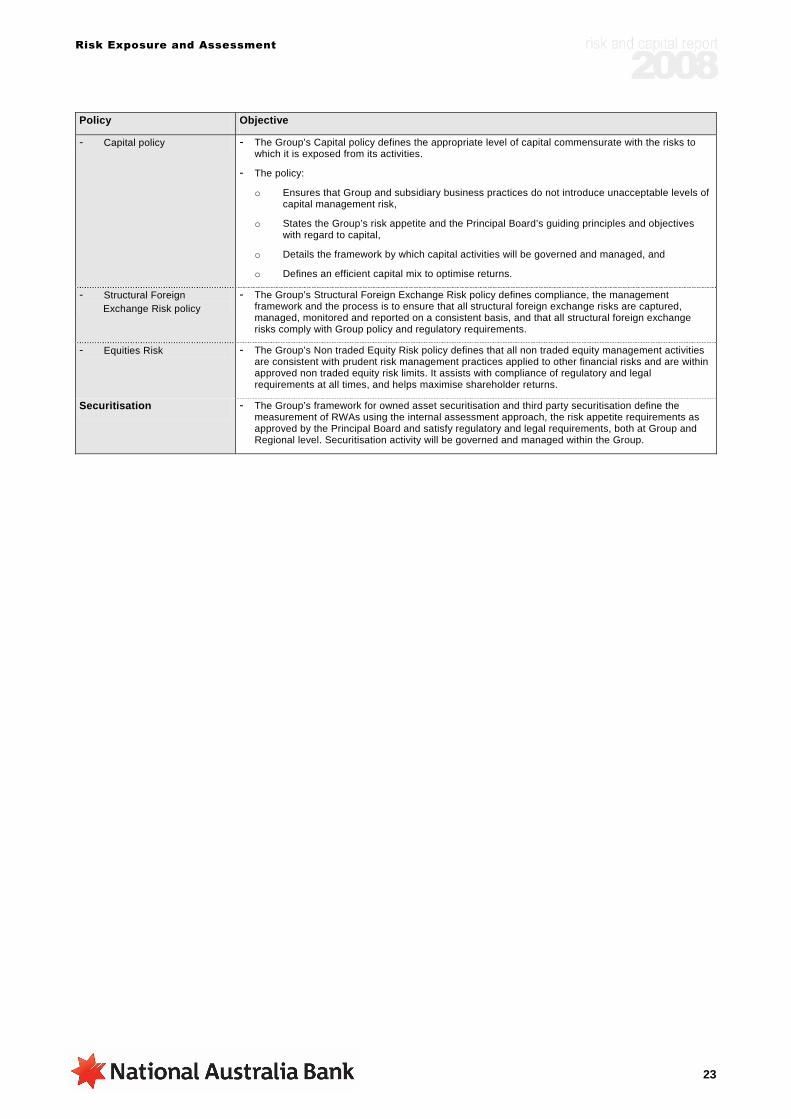
Risk Exposure and Assessment
23
Policy Objective
- Capital policy - The Group’s Capital policy defines the appropriate level of capital commensurate with the risks to which it is exposed from its activities.
- The policy:
o Ensures that Group and subsidiary business practices do not introduce unacceptable levels of capital management risk,
o States the Group’s risk appetite and the Principal Board’s guiding principles and objectives with regard to capital,
o Details the framework by which capital activities will be governed and managed, and
o Defines an efficient capital mix to optimise returns.
- Structural Foreign Exchange Risk policy
- The Group’s Structural Foreign Exchange Risk policy defines compliance, the management framework and the process is to ensure that all structural foreign exchange risks are captured, managed, monitored and reported on a consistent basis, and that all structural foreign exchange risks comply with Group policy and regulatory requirements.
- Equities Risk - The Group’s Non traded Equity Risk policy defines that all non traded equity management activities are consistent with prudent risk management practices applied to other financial risks and are within approved non traded equity risk limits. It assists with compliance of regulatory and legal requirements at all times, and helps maximise shareholder returns.
Securitisation - The Group’s framework for owned asset securitisation and third party securitisation define the measurement of RWAs using the internal assessment approach, the risk appetite requirements as approved by the Principal Board and satisfy regulatory and legal requirements, both at Group and Regional level. Securitisation activity will be governed and managed within the Group.

Credit Risk
24
Credit Risk
General Disclosure Credit is defined as any transaction that creates an actual or potential obligation for a borrower to pay the Group. Credit risk is the potential that a borrower will fail to meet its obligations to the Group in accordance with agreed terms.
Management The Group categorises and manages credit risk in two key portfolios: Non retail (business) Credit and Retail (personal) Credit. As for all forms of risk, the Group manages credit risk within an established three lines of defence framework, with control exercised through defined delegation of authority, with clear communication and escalation channels throughout the organisation.
The Credit Risk Management function is designed to provide sound management principles and practices in order to maintain appropriate asset quality across the Group. It plays a key role in managing risk appetite, portfolio measurement, assisting regions with portfolio management and measuring compliance to strategic targets and limits. This ensures all business units operate with the embedded three lines of defence.
Monitoring and Reporting A comprehensive credit and asset quality reporting process is well established within the Group. Credit risk relies on the output from a number of systems for details of exposures, risk parameters and for the assessment of credit risk. These include credit risk rating and monitoring systems and various limit reporting systems. Data is processed through systems and models owned by credit risk to provide various measures of credit risk for reporting purposes.
The Group and Regional Chief Risk Officers receive monthly reports covering credit risk, credit quality, asset concentrations and asset quality for both business and retail credit. They incorporate key credit risk measures and provide detailed analysis of concentration risk, Transactional Credit Committee approvals, and updates on defaulted counterparties. These reports are provided to the Principal Board and the Principal Board Risk Committee (“PBRC”).
On a monthly basis, the Group and Regional Credit Risk Committees are presented with a detailed analysis of asset quality measures. Periodically, Group Credit Risk provides the PBRC and the Group Risk Management Committee (“GRMC”) with portfolio and industry reviews, as well as the outcome of portfolio stress testing. Quarterly and half-yearly reports are provided to APRA.
Definitions of Default and Impairment Central to the measurement of credit risk is the application of a consistent definition of default and impairment throughout the Group. Default occurs when a loan obligation is 90 days or more past due, or when it is considered unlikely that the credit obligation to the Group will be paid in full, without recourse to actions such as realisation of security. There are no material exceptions to the Group’s definition of default.
Impaired facilities are those items for which the ultimate ability to collect principal and interest is compromised. A facility is classified as impaired, regardless of whether it is 90 days or more past due, when there is doubt as to whether the full amount due, including interest and other payments will be achieved in a timely manner.
Impaired assets consist of: retail loans (excluding credit card loans and portfolio managed facilities) which are contractually 90 days or more past due with security insufficient to cover principal and arrears of interest revenue; non retail loans that are contractually 90 days or more past due with sufficient doubt about the ultimate ability to collect principal and interest; and impaired off-balance sheet credit exposures, where current circumstances indicate that losses may be incurred. Unsecured portfolio managed facilities are classified as impaired assets when they become 180 days past due.
Creation of Specific Provisions and the General Reserve for Credit Losses The Group assesses and measures credit risk losses to fulfil a number of different objectives. One of these objectives is to determine the provisions for doubtful debts in accordance with Australian Accounting Standards.
The statutory financial accounting requirements relating to losses due to credit risk are detailed within AASB 139 Financial Instruments: Recognition and Measurement. In order to establish provisions for accounting purposes, the methodologies described in this report to assess and measure losses due to credit risk are adjusted to reflect the incurred loss methodology required under accounting standard.
A financial asset or portfolio of financial assets is impaired and impairment losses are incurred if there is objective evidence of impairment as a result of one or more loss events and it is considered that the loss event has an impact on the estimated future cash flows of the financial asset (or the portfolio).
Specific provisions are raised for assets classified as Default Loss Expected and represent the estimated shortfall between the face value of an asset and the estimated future cash flows, including the estimated realisable value of securities after meeting securities realisation costs. A specific provision will be raised when the estimated cash flows accruing to an asset are less than the face value of the asset.
The calculation and raising of specific provisions is subject to tight controls with only appropriate Categorised Asset Approval Authority (“CAAA”) holders capable of establishing these provisions. CAAA holders comprise officers within the Group and Regional Strategic Business Services or Retail Collections functions, together with relevant committees where the level of provisioning required is larger than nominated thresholds.
If the Group determines that no objective evidence of impairment exists for an individually assessed financial asset, whether significant or not, it includes the asset in a group of financial assets with similar credit risk characteristics and collectively assesses them for impairment.

Credit Risk
25
Future cash flows in a group of financial assets that are collectively evaluated for impairment are estimated on the basis of the contractual cash flows of the assets in the group and historical loss experience for assets with credit risk characteristics similar to those in the group. Historical loss experience is adjusted based on current observable data. In addition, the Group uses its experienced judgement to estimate the amount of an impairment loss. The use of such judgements and reasonable estimates is considered by management to be an essential part of the process and does not impact reliability. All assessments
are conducted within the requirements of AIFRS, which requires objective evidence.
For the purposes of this disclosure, the General Reserve for Credit Losses is calculated as the pre-tax collective provisions (excluding credit risk adjustments for fair value assets and trading derivatives). The collective provision being as disclosed in the Group's 2008 Annual Financial Report.
Credit Risk Exposures The Group has been accredited to use its internal credit models and processes in determining regulatory capital for its Australian, New Zealand and nabCapital banking operations. The Group uses the APRA Basel II standardised approach for Clydesdale Bank PLC and for defined assets that are immaterial in terms of risk weighted assets or are not required to be treated as IRB under the Basel II Framework. Great Western Bank uses Basel I.
Summary Exposures by Measurement Approach [APS 330 Table 4i]
This table provides the amount of gross credit risk exposure subject to the Standardised and Advanced IRB approaches. The Group has no credit risk exposures subject to Foundation IRB approaches. Gross credit risk exposure refers to the potential exposure that would be incurred as a result of a counterparty default prior to the application of netting and credit risk mitigation. It is defined to be the outstanding amount on drawn commitments plus a credit conversion factor on undrawn commitments on a given facility. Exposures exclude non lending assets, equities and securitisation. As at 30 September 2008
Total exposure
(EaD)
Risk weighted
assets
Regulatory expected
loss
Actual losses for
the 12 months ending
Impaired loans
Specific provisions
Exposure Type $m $m $m $m $m $m Standardised approach
Australian and Foreign Governments (class II) 6,608 534 - - - - Banks (Class III) 25,068 306 - - - - Residential Mortgage (class IV) 34,432 18,073 - 2 29 5 Corporate 45,458 40,008 - 244 379 86 Other 9,518 9,573 - 158 36 19
Total standardised approach 121,084 68,494 - 404 444 110
IRB approach Corporate (including SME) 227,945 149,395 2,057 164 1,154 442 Specialised lending (SL) 17,074 14,675 187 4 21 6 Sovereign - - - - - - Bank 96,983 11,482 18 - - - Residential mortgage 197,704 44,977 655 44 507 82 Qualifying revolving retail 11,515 4,537 226 168 2 - Other retail 2,951 2,966 149 76 21 5 Other - - - - - -
Total IRB approach 554,172 228,032 3,292 456 1,705 535
Total 675,256 296,526 3,292 860 2,149 645
General reserve for credit losses 2,318Total provisions for doubtful debts 2,963

Credit Risk
26
Credit Exposures by Measurement Approach The two tables “Total Gross Credit Exposures” and “Average Credit Risk Exposure” provide credit exposures for the standardised portfolio and the advanced portfolios within the Group as at 30 September 2008, including both on- and off-balance sheet exposures, excluding non lending assets, equities and securitisation exposures.
Total Gross Credit Exposures [APS 330 Table 4b (i)]
As at 30 September 2008 On-balance
sheet exposures
Non-market related
off-balance sheet
Market related
off-balance sheet
Total exposures
(1)
Exposure type $m $m $m $m Standardised approach Australian and foreign governments (class II) 4,935 460 1,213 6,608Banks (class III) 13,209 452 11,407 25,068Residential mortgage (class IV) 32,791 1,641 - 34,432Corporate 37,511 7,584 363 45,458Other 9,035 483 - 9,518Total standardised approach 97,481 10,620 12,983 121,084
IRB approach Corporate (including SME) 159,052 53,427 15,466 227,945Specialised lending (SL) 12,982 3,739 353 17,074Sovereign - - - -Bank 27,120 4,167 65,696 96,983Residential mortgage 168,582 29,122 - 197,704Qualifying revolving retail 5,856 5,659 - 11,515Other retail 2,474 477 - 2,951Other - - - -Total IRB approach 376,066 96,591 81,515 554,172
Total exposures (EaD) 473,547 107,211 94,498 675,256
(1) Total Credit Exposures are Exposure at Default (“EaD”) estimates of potential exposure, according to product type, for a period of 1 year including an estimate of future lending for undrawn balance sheet commitments. For off balance sheet exposures, the EaD is calculated using Credit Conversion Factors (CCFs) that convert the exposure into an on-balance sheet equivalent. EaD is measured gross of specific provisions, partial write-offs and prior to the application of netting and credit risk mitigation.
Average Credit Risk Exposure [APS 330 Table 4b (ii)]
3 months ended 30 September 2008 On-balance
sheet exposures
Non-market related
off-balance sheet
Market related
off-balance sheet
Average total
exposures (1)
Exposure type $m $m $m $m Standardised approach Australian and foreign governments (class II) 5,611 527 1,215 7,353Banks (class III) 10,602 227 7,938 18,767Residential mortgage (class IV) 30,873 1,601 - 32,474Corporate 36,100 9,322 254 45,676Other 8,836 857 - 9,693Total standardised approach 92,022 12,534 9,407 113,963
IRB approach Corporate (including SME) 160,251 61,154 16,793 238,198Specialised lending (SL) 11,847 3,906 222 15,975Sovereign - - - -Bank 27,409 4,148 62,188 93,745Residential mortgage 163,453 28,472 - 191,925Qualifying revolving retail 5,828 5,668 - 11,496Other retail 2,478 433 - 2,911Other - - - -Total IRB approach 371,266 103,781 79,203 554,250
Total exposures (EaD) 463,288 116,315 88,610 668,213
(1) Average credit exposure is equal to the sum of the Gross Credit Exposure at the beginning of the period plus the Gross Credit Exposure at the end of the reporting period divided by two.

Credit Risk
27
Geographic Distribution of Credit Risk Exposures [APS 330 Table 4c]
This table provides the total on- and off-balance sheet gross credit exposures, excluding non-lending assets, equities and securitisation exposures as at 30 September 2008, for the standardised and advanced portfolios, by major geographical areas derived from the booking office where the exposure was transacted. As at 30 September 2008 Australia New
Zealand United
Kingdom Other (1) Total
exposure Exposure type $m $m $m $m $m Standardised approach Australian and foreign governments (class II) 3,593 1,255 1,462 298 6,608Banks (class III) 4,190 420 20,345 113 25,068Residential mortgage (class IV) 953 11 33,451 17 34,432Corporate 7,623 27 36,932 876 45,458Other 207 - 5,501 3,810 9,518Total standardised approach 16,566 1,713 97,691 5,114 121,084
IRB approach Corporate (including SME) 168,725 28,446 19,370 11,404 227,945Specialised lending (SL) 14,211 1,105 1,255 503 17,074Sovereign - - - - -Bank 59,914 6,721 27,623 2,725 96,983Residential mortgage 175,557 22,147 - - 197,704Qualifying revolving retail 9,669 1,846 - - 11,515Other retail 2,633 318 - - 2,951Other - - - - -Total IRB approach 430,709 60,583 48,248 14,632 554,172
Total exposures (EaD) 447,275 62,296 145,939 19,746 675,256
(1) "Other" comprises America and Asia.
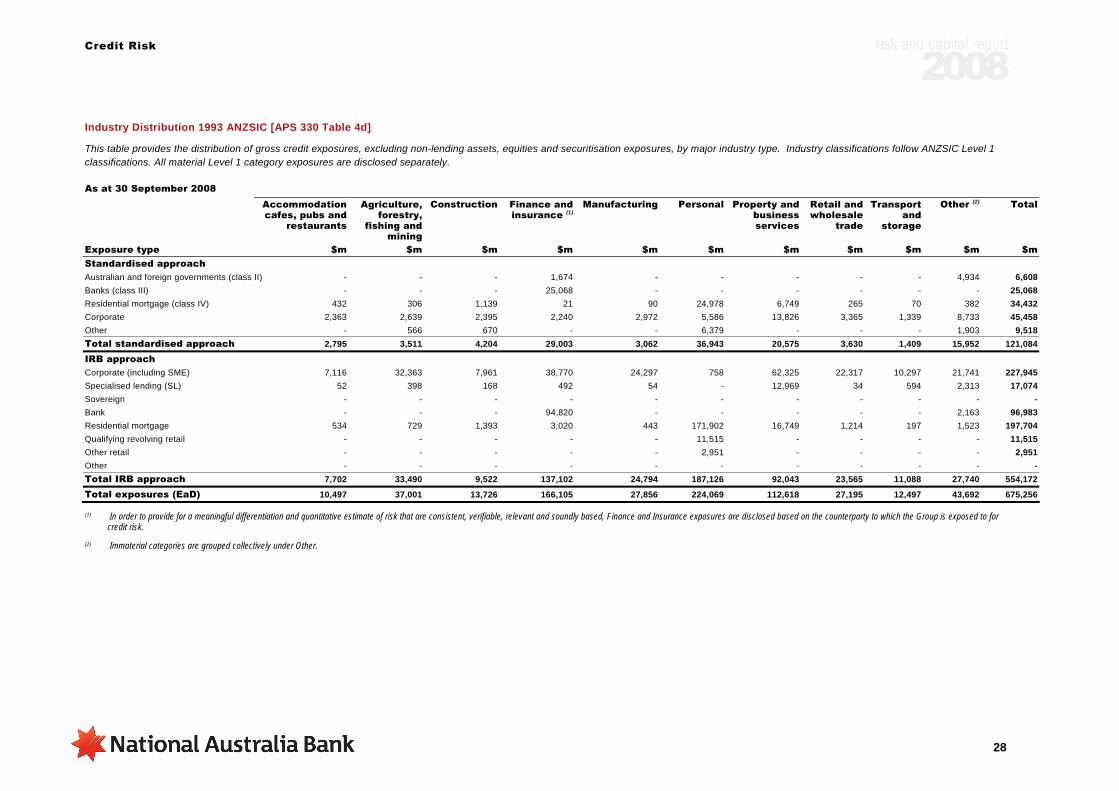
Credit Risk
28
Industry Distribution 1993 ANZSIC [APS 330 Table 4d]
This table provides the distribution of gross credit exposures, excluding non-lending assets, equities and securitisation exposures, by major industry type. Industry classifications follow ANZSIC Level 1 classifications. All material Level 1 category exposures are disclosed separately. As at 30 September 2008 Accommodation
cafes, pubs and restaurants
Agriculture, forestry,
fishing and mining
Construction Finance and insurance (1)
Manufacturing Personal Property and business services
Retail and wholesale
trade
Transport and
storage
Other (2) Total
Exposure type $m $m $m $m $m $m $m $m $m $m $m Standardised approach Australian and foreign governments (class II) - - - 1,674 - - - - - 4,934 6,608 Banks (class III) - - - 25,068 - - - - - - 25,068 Residential mortgage (class IV) 432 306 1,139 21 90 24,978 6,749 265 70 382 34,432 Corporate 2,363 2,639 2,395 2,240 2,972 5,586 13,826 3,365 1,339 8,733 45,458 Other - 566 670 - - 6,379 - - - 1,903 9,518 Total standardised approach 2,795 3,511 4,204 29,003 3,062 36,943 20,575 3,630 1,409 15,952 121,084
IRB approach Corporate (including SME) 7,116 32,363 7,961 38,770 24,297 758 62,325 22,317 10,297 21,741 227,945 Specialised lending (SL) 52 398 168 492 54 - 12,969 34 594 2,313 17,074 Sovereign - - - - - - - - - - - Bank - - - 94,820 - - - - - 2,163 96,983 Residential mortgage 534 729 1,393 3,020 443 171,902 16,749 1,214 197 1,523 197,704 Qualifying revolving retail - - - - - 11,515 - - - - 11,515 Other retail - - - - - 2,951 - - - - 2,951 Other - - - - - - - - - - - Total IRB approach 7,702 33,490 9,522 137,102 24,794 187,126 92,043 23,565 11,088 27,740 554,172
Total exposures (EaD) 10,497 37,001 13,726 166,105 27,856 224,069 112,618 27,195 12,497 43,692 675,256
(1) In order to provide for a meaningful differentiation and quantitative estimate of risk that are consistent, verifiable, relevant and soundly based, Finance and Insurance exposures are disclosed based on the counterparty to which the Group is exposed to for credit risk.
(2) Immaterial categories are grouped collectively under Other.
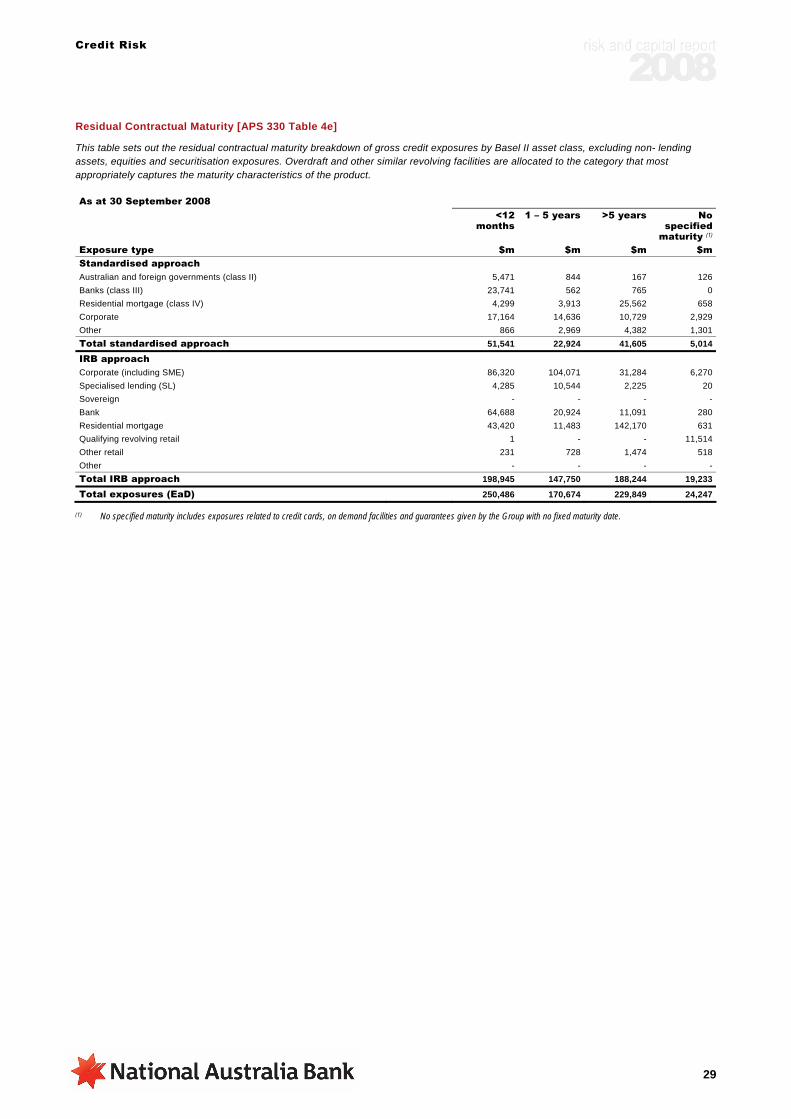
Credit Risk
29
Residual Contractual Maturity [APS 330 Table 4e]
This table sets out the residual contractual maturity breakdown of gross credit exposures by Basel II asset class, excluding non- lending assets, equities and securitisation exposures. Overdraft and other similar revolving facilities are allocated to the category that most appropriately captures the maturity characteristics of the product. As at 30 September 2008 <12
months 1 – 5 years >5 years No
specified maturity (1)
Exposure type $m $m $m $m Standardised approach Australian and foreign governments (class II) 5,471 844 167 126Banks (class III) 23,741 562 765 0Residential mortgage (class IV) 4,299 3,913 25,562 658Corporate 17,164 14,636 10,729 2,929Other 866 2,969 4,382 1,301Total standardised approach 51,541 22,924 41,605 5,014
IRB approach Corporate (including SME) 86,320 104,071 31,284 6,270Specialised lending (SL) 4,285 10,544 2,225 20Sovereign - - - -Bank 64,688 20,924 11,091 280Residential mortgage 43,420 11,483 142,170 631Qualifying revolving retail 1 - - 11,514Other retail 231 728 1,474 518Other - - - -Total IRB approach 198,945 147,750 188,244 19,233
Total exposures (EaD) 250,486 170,674 229,849 24,247
(1) No specified maturity includes exposures related to credit cards, on demand facilities and guarantees given by the Group with no fixed maturity date.

Credit Risk
30
Credit Provisions and Losses
The following two tables provide credit risk provision information by a) industry and b) geography, excluding non lending assets, equities and securitisation exposures. Definitions of impairment and past due loans are based on APRA’s APS 220 and related guidance notes. The basis of specific provisions is based on requirements under AGN 220.3. Impaired loans are disclosed in accordance with APRA’s definition of impaired facilities under AGN 220.1 paragraph 7.
Provisions by Industry [APS 330 Table 4f]
As at 30 September 2008 12 months ended 30 September 2008
Impaired
loans Past due
loans ≥90 days (1)
Specific provision balance (2)
Charges for
specific provision (3)
Write-offs (4)
$m $m $m $m $m Industry sector Accommodation, cafes, pubs and restaurants 64 23 11 31 7Agriculture, forestry, fishing and mining 145 30 26 27 16Construction 300 42 57 80 27Finance and insurance 140 23 49 130 103Manufacturing 168 19 101 80 76Personal 512 1,062 73 458 409Property and business services 426 225 86 165 119Retail and wholesale trade 137 32 56 90 56Transport and storage 49 13 15 14 10Other 208 37 171 127 37Total provisions 2,149 1,506 645 1,202 860
(1) Loans 90 days or greater past due relates to defaulted loan amounts overdue by 90 days or more that are not classified as impaired.
(2) Specific provisions for prudential purposes include all provisions for impairment assessed by an ADI on an individual basis in accordance with AIFRS; the portion of provisions assessed on a collective basis in accordance with AIFRS which are deemed ineligible to be included in the General Reserve for Credit Losses; and any provisions not already charged against profit and loss which an ADI is required to recognise as a specific provision.
(3) Charges for specific provisions relate to the net increase in specific provisions from the beginning of the reporting period to the end of the reporting period.
(4) Write-offs represent credit loss expenses recognised in the Statement of Financial Performance during the reporting period in accordance with accounting rules.
Provisions by Geographic Region [APS 330 Table 4g]
As at 30 September 2008 Impaired
loans Past due
loans ≥90 days
Specific provision
balance
General reserve for
credit losses (1)
$m $m $m $m Geographic region Australia (2) 1,348 1,079 438 1,459United Kingdom 613 346 145 678New Zealand 141 79 49 114Other (3) 47 2 13 67Total provisions 2,149 1,506 645 2,318
(1) The General Reserve for Credit Losses for the purposes of this disclosure is calculated as the pre-tax collective provisions (excluding credit risk adjustments for fair value assets and trading derivatives). The collective provision being as disclosed in the Group's 2008 Annual Financial Report. This will allow more relevant comparison to existing external disclosures.
(2) The Australian geography contains a one off central bad and doubtful debt provision against the current uncertain global environment.
(3) “Other" comprises America and Asia.

Credit Risk
31
Reconciliations of Provisions [APS 330 Table 4h]
This table discloses the reconciliation of changes in provisions. It shows movements in the balance of provisions over the reporting period for both specific and collective provisions. Totals do not include amounts relating to non lending assets, equities or securitisation exposures. 12 months ended 30 September 2008 $m General reserve for credit losses Balance at start of period 1,800Total charge to income statement for impairment loss (1,202)Net transfer to specific provision 1,692Recoveries -Balances written off -Acquisition of controlled entities 36Foreign currency translation and other adjustments (8)Total general reserve for credit losses 2,318
Specific provisions Balance at start of period 307Net transfer from general reserve for credit losses 1,202Bad debts recovered 192Bad debts written off (1,052)Acquisition of controlled entities 5Foreign currency translation and other adjustments (9)Total specific provision 645
Total provisions 2,963
Analysis of IRB Actual Losses [APS 330 Table 6e]
This table shows actual losses (i.e., write-offs and specific provisions) for each portfolio. The calculation of this amount is consistent with the corresponding disclosure requirement in table 4f, “Provisions by Industry”, on the previous page. Totals do not include amounts relating to non lending assets, equities or securitisation exposures. 12 months ended 30 September 2008 Charges
for specific
provisions
Write-offs
$m $m IRB approach Corporate (including SME) 431 164Specialised lending (SL) - 4Sovereign - -Bank - -Residential mortgage 65 44Qualifying revolving retail 160 168Other retail 78 76Other - -Total IRB approach 734 456
No discussion of the factors that impacted on the loss experience in the preceding period is provided as the Group has only operated on IRB approaches since 1 July 2008.

Credit Risk
32
Disclosures of Standardised Credit Risk Portfolios and Supervisory Slotting Standardised Credit Risk Portfolios The Group uses the standardised methodology in the Basel II Framework, as interpreted by APRA, for the calculation of Basel II credit risk capital for Clydesdale Bank PLC and for defined assets that are immaterial in terms of risk weighted assets or are not required to be treated as IRB under the Basel II Framework. For its reporting to the UK FSA, Clydesdale Bank PLC uses the standardised methodology in the Basel II Framework, as interpreted by the UK regulator, the Financial Services Authority. Clydesdale Bank PLC will move to advanced accreditation for credit risk a time to be agreed with APRA and the FSA.
Fitch, Moody’s and Standard & Poor’s credit ratings are used to determine the risk weights within the APRA standardised approach, as presented in the table below.
Across the Group, External Credit Assessment Institutions ("ECAI") ratings are used to assess sovereign exposures. In the UK, bank exposures also use ECAI ratings.
APRA’s external rating grades table is used to transfer external ratings into an "external rating grade" or Credit Rating Grade which defines the appropriate risk weight as outlined in APS 112.
External rating grade
S & P Moody Fitch
1 AAA Aaa AAA 1 AA+ Aa1 AA+ 1 AA Aa2 AA 1 AA- Aa3 AA- 2 A+ A1 A+ 2 A A2 A 2 A- A3 A- 3 BBB+ Baa1 BBB+ 3 BBB Baa2 BBB 3 BBB- Baa3 BBB- 4 BB+ Ba1 BB+ 4 BB Ba2 BB 4 BB- Ba3 BB- 5 B+ B1 B+ 5 B B2 B 5 B- B3 B- 6 CCC+ Caa1 CCC+ 6 CCC Caa2 CCC 6 CCC- Caa3 CCC- 6 CC Ca CC 6 C C C 6 D D
Standardised Credit Risk Exposures by Risk Category [APS 330 Table 5b]
The following table shows the credit exposure after risk mitigation amount in each risk category, subject to the standardised approach. For the purposes of this disclosure, an ADI’s outstandings represent its exposure (drawn balances plus EaD on undrawn) after risk mitigation. As at 30 September 2008 Credit exposure
after risk mitigation $m Standardised approach – risk weights 0% 17,58020% 5,37535% 21,35150% 3,84475% 2,334100% 54,424150% 1,233625% -937.5% -1250% -Capital deductions -Total standardised approach (EaD) (1) 106,141
(1) Exposures are reported after credit risk mitigation and net of any specific provision or associated depreciation.
Disclosures for Portfolios Subject to Supervisory Risk-Weights in the IRB Approaches The Group maps its internal rating grades to the five supervisory slotting categories of strong, good, satisfactory, weak and default (the criteria to map these exposures are found in APS 113 Attachment F). Each slotting category is associated with a specific risk weight for unexpected loss that broadly corresponds to a range of external credit assessments as detailed below:
Supervisory category
Risk weight External rating equivalent
Strong 70% BBB- or better Good 90% BB+ or BB Satisfactory 115% BB- or B+ Weak 250% B to C Default 0% N/A
Specialised lending is represented by the following four sub-asset classes: - Project Finance Exposures - Income-producing Real Estate Exposures - Object Finance Exposures - Commodities Finance Exposures
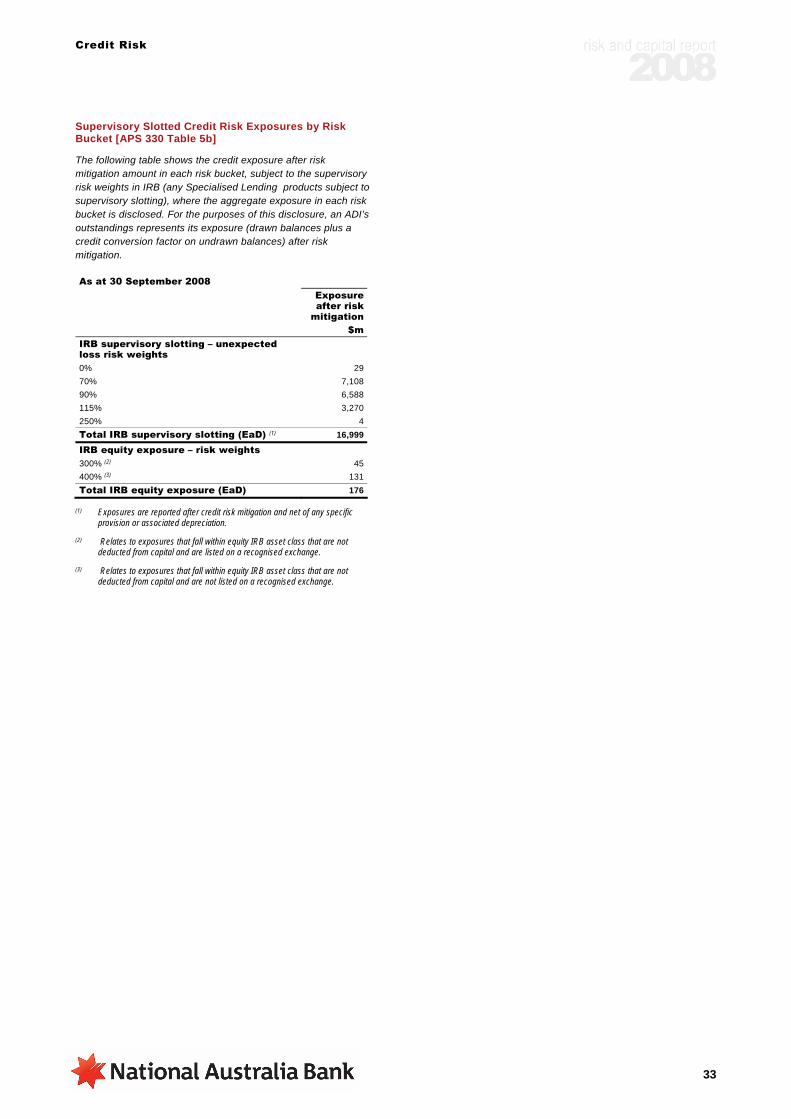
Credit Risk
33
Supervisory Slotted Credit Risk Exposures by Risk Bucket [APS 330 Table 5b]
The following table shows the credit exposure after risk mitigation amount in each risk bucket, subject to the supervisory risk weights in IRB (any Specialised Lending products subject to supervisory slotting), where the aggregate exposure in each risk bucket is disclosed. For the purposes of this disclosure, an ADI’s outstandings represents its exposure (drawn balances plus a credit conversion factor on undrawn balances) after risk mitigation. As at 30 September 2008
Exposure after risk
mitigation $m IRB supervisory slotting – unexpected loss risk weights
0% 2970% 7,10890% 6,588115% 3,270250% 4Total IRB supervisory slotting (EaD) (1) 16,999
IRB equity exposure – risk weights 300% (2) 45400% (3) 131Total IRB equity exposure (EaD) 176
(1) Exposures are reported after credit risk mitigation and net of any specific provision or associated depreciation.
(2) Relates to exposures that fall within equity IRB asset class that are not deducted from capital and are listed on a recognised exchange.
(3) Relates to exposures that fall within equity IRB asset class that are not deducted from capital and are not listed on a recognised exchange.
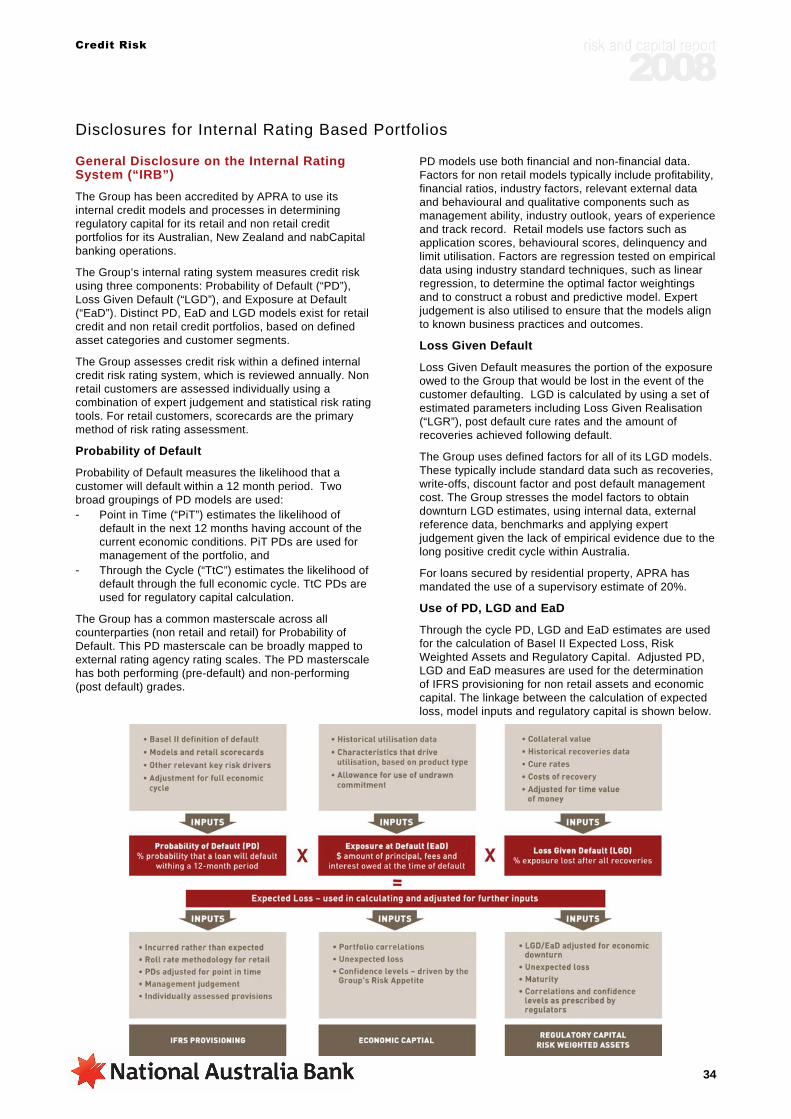
Credit Risk
34
Disclosures for Internal Rating Based Portfolios
General Disclosure on the Internal Rating System (“IRB”) The Group has been accredited by APRA to use its internal credit models and processes in determining regulatory capital for its retail and non retail credit portfolios for its Australian, New Zealand and nabCapital banking operations.
The Group’s internal rating system measures credit risk using three components: Probability of Default (“PD”), Loss Given Default (“LGD”), and Exposure at Default (“EaD”). Distinct PD, EaD and LGD models exist for retail credit and non retail credit portfolios, based on defined asset categories and customer segments.
The Group assesses credit risk within a defined internal credit risk rating system, which is reviewed annually. Non retail customers are assessed individually using a combination of expert judgement and statistical risk rating tools. For retail customers, scorecards are the primary method of risk rating assessment.
Probability of Default
Probability of Default measures the likelihood that a customer will default within a 12 month period. Two broad groupings of PD models are used: - Point in Time (“PiT”) estimates the likelihood of
default in the next 12 months having account of the current economic conditions. PiT PDs are used for management of the portfolio, and
- Through the Cycle (“TtC”) estimates the likelihood of default through the full economic cycle. TtC PDs are used for regulatory capital calculation.
The Group has a common masterscale across all counterparties (non retail and retail) for Probability of Default. This PD masterscale can be broadly mapped to external rating agency rating scales. The PD masterscale has both performing (pre-default) and non-performing (post default) grades.
PD models use both financial and non-financial data. Factors for non retail models typically include profitability, financial ratios, industry factors, relevant external data and behavioural and qualitative components such as management ability, industry outlook, years of experience and track record. Retail models use factors such as application scores, behavioural scores, delinquency and limit utilisation. Factors are regression tested on empirical data using industry standard techniques, such as linear regression, to determine the optimal factor weightings and to construct a robust and predictive model. Expert judgement is also utilised to ensure that the models align to known business practices and outcomes.
Loss Given Default
Loss Given Default measures the portion of the exposure owed to the Group that would be lost in the event of the customer defaulting. LGD is calculated by using a set of estimated parameters including Loss Given Realisation (“LGR”), post default cure rates and the amount of recoveries achieved following default.
The Group uses defined factors for all of its LGD models. These typically include standard data such as recoveries, write-offs, discount factor and post default management cost. The Group stresses the model factors to obtain downturn LGD estimates, using internal data, external reference data, benchmarks and applying expert judgement given the lack of empirical evidence due to the long positive credit cycle within Australia.
For loans secured by residential property, APRA has mandated the use of a supervisory estimate of 20%.
Use of PD, LGD and EaD
Through the cycle PD, LGD and EaD estimates are used for the calculation of Basel II Expected Loss, Risk Weighted Assets and Regulatory Capital. Adjusted PD, LGD and EaD measures are used for the determination of IFRS provisioning for non retail assets and economic capital. The linkage between the calculation of expected loss, model inputs and regulatory capital is shown below.

Credit Risk
35
Credit Rating System Control
In addition to monthly performance reporting, credit models are reviewed at least annually in accordance with the Group’s Model Risk policy. Regular independent reviews are also conducted.
The annual review involves a detailed analysis of model performance against established targets. The review assesses business processes to ensure the model assumptions remain valid and revisits the risk drivers used in the model. This review process includes assessment of external data where available, as well as technological advancements. Any new risk drivers are measured against existing drivers, and if stronger predictors are found, these are incorporated into future enhancements of the model.
The Group’s model validation methodology involves the selection of a set of customers with similar characteristics who are monitored over a full year to assess the outcomes. The validation process captures all default events for the customers during the year. This methodology is applied to the validation of all credit models (PD, LGD and EaD).
The outcomes of the model validation process, including proposed actions, are presented to the authorised Risk Committees for review and any actions endorsed for implementation.
Non Retail Credit Internal Ratings Process The Group defines four broad asset classes within the non retail credit portfolios: - Bank - Corporate, including small and medium-sized
enterprises (“SMEs”) - Sovereigns - Specialised Lending including purchased corporate
receivables
The Group measures credit risk on a more granular basis, defined along the following non retail customer segments: - Agriculture - Banks - Commercial Real Estate - Corporate - Middle Market - Non-Bank Financial Institutions (“NBFI”) - Small Medium Enterprise - Sovereigns
Non Retail – Probability of Default Models
The Group has a number of Probability of Default models that differentiate by industry or segment, counterparty size and incorporate regional variances. The rating model used is dependent on: - Industry based on ANZSIC code - Financial information available - Net sales/ total assets and exposure
Specific PD models are used to assess risk for all non retail customer segments. The Australian and New Zealand regions utilise either global models or models specific to each region, with nabCapital utilising models based on the counterparty’s risk location. The basic structure of the Group’s rating models relies on a
combination of both quantitative and qualitative assessment of counterparties.
Long run adjustments are made to the models to account for performance over an economic cycle.
PD models use both financial and non-financial data expressed as factors, with assigned weights derived using statistical analysis. These weights measure the relationship between the value of the factor and the historically observed PD for that segment.
While factors predictive of default have broad similarities across segments (e.g., debt service capability, management quality), the modelling process, based on internal empirical data, establishes those factors which are most predictive for each segment, along with their relative weightings. External benchmarking is used for certain segments that have insufficient internal data, a small population and/or low defaults. This is the case for externally rated banks and sovereigns, where external rating agencies data is used. The resulting rating is updated at least annually.
Non retail Credit – Exposure at Default Models
Exposure at Default is calculated according to the facility type. EaD is the principal, fees and interest owed at the time of default. The EaD models predict the “exposure” that a customer is likely to have outstanding if they were to default in the next 12 months, based on the Group’s internal data.
The basic formula is: EaD = Balance + (Credit Conversion Factor x Limit Headroom). Conversion factors are used for estimating off-balance sheet exposures into an equivalent on-balance sheet amount, based on internal empirical data.
Specific models are used to assess the EaD based on the Group’s following product groups: - Accommodation limits - Bills and acceptances - Business credit cards - Current accounts (overdraft and transaction
accounts) - Current accounts (debtor finance) - Guarantees - International products - Leasing - Term lending
Quantitative (financial) factors
Financial component consists of financial ratios/indicators (e.g. profitability, debt service coverage).
Weights and factors are based on empirical data.
Qualitative (non-financial) factors
Non-Financial component is based on qualitative data and expert judgement, and leverages credit officer and lender expertise (e.g. management ability, industry outlook)

Credit Risk
36
Non Retail – Loss Given Default Models
LGD for the non retail portfolio is calculated by using a set of estimated parameters including loss given realisation (“LGR”) and the probability of realisation occurring subsequent to default. LGD is calculated by business segment, as business practices and unsecured recovery experience differ widely, as does the quantity of data to support modelling.
LGR is the rate of loss sustained following the realisation of security held and is a major component of LGD. It is dependent on the bank values assigned to each asset type along with the Group’s experience with unsecured recoveries. The market value of the collateral is the primary parameter to be affected by credit cycle changes, and the credit cycle downturn impact on LGD has been incorporated into bank value calculations through a haircut to market value of the asset.
The Group also uses the following factors for non retail credit LGD models: - Relevant external benchmarks - Recovery rates - Time value of money - Write-offs
Where limited internal default data exists, data is augmented by international benchmarks, market data and expert judgement.
The economic downturn estimates are based on a combination of external data and expert judgement given the Group’s internal data does not cover a downturn part of the economic cycle.
While the corporate LGD models deliver results in a continuous curve for the calculation of regulatory capital, in practice non retail exposures are categorised into ten segments for delegated authority purposes. Segments start from “A” representing a well-secured loan through to “J” for an unsecured loan.
Retail Credit Internal Ratings Process There are three asset classes for retail credit: (i) Residential mortgages, consisting of:
o Term home loan products (including interest only type loans), and
o Revolving home loan products.
This includes lending to owner occupiers and investors in residential property (i.e., buy to let).
(ii) Qualifying revolving retail exposures, consisting of: o Retail credit card exposures.
(iii) Other retail exposures, consisting of: o Personal loan products (including any secured
personal loans products within a region),
o Overdraft products, and
o Transaction account exposures. This captures all retail operational accounts that have created an overdrawn position without the formal approval of the Group.
Risk models for PD, LGD and EaD have been developed for these key portfolios using internal data, with the
exception of LGDs for residential mortgages, which use the supervisory floor set by APRA.
Retail Credit – Probability of Default Models
Retail PD models include operational scorecards (application and behaviour scores) and transactional characteristics, such as limit utilisation and delinquency, that are relevant to each of the products. External information, in the form of credit bureau data, is utilised in the application scorecards which are a key component of the PD models. Monthly updates of behaviour scores and the relevant account transactional characteristics (limit utilisation) are assessed and each account is “scored” to assign a PD. This “scoring” process allows groups of accounts with similar scores to be pooled together and mapped to the PD masterscale, to apply a PD rating for that group of accounts.
Appropriate long run adjustments have been made to the models to account for performance over an economic cycle. Using historical actual default data for each portfolio, along with relevant external data and expert judgement, an assessment of the average default performance over a full economic cycle is performed. Based on the internal assessment of where we are in the economic cycle, adjustments are made to the assigned PD rate. This internal assessment is based on expert judgement and represents a key assumption within the models.
Retail Credit – Exposure at Default Models
EaD models use a combination of Credit Conversion Factors (“CCF”), similar to those used in non retail and scaling factors. CCFs have been developed mainly for revolving credit facility products, such as credit cards and overdrafts. Appropriate characteristics, such as delinquency and current limit utilisation are used for CCF models to estimate the amount of unutilised credit a customer may draw in the lead up to default.
Scaling factors have mainly been applied to term lending products where the customer has less availability of unutilised credit to draw from in the lead up to default. The historical performance of defaulted loans between point of observation and point of default is used to derive the appropriate scaling factors.
In the CCF models, specific characteristics are used to derive groups of accounts with similar profiles. These groupings are used to apply an assigned CCF to accounts to allow calculation of the EaD estimate.
Retail Credit – Loss Given Default Models
Key account variables, such as months exposure held and balance, are identified and modelled to provide an estimate of the probability that a loan that has defaulted would return to full performance i.e., cure.
For accounts that do not cure and are written off, internal recovery data is used to assess the ultimate loss (initial loss less recoveries achieved) incurred by the Group on these accounts. Internal data is also used to estimate all costs incurred by the Group for both cured and written off loans to ensure that estimates of LGD are based on an assessment of economic loss.
Adjustments based on external data and expert judgement are made to account for a downturn in the
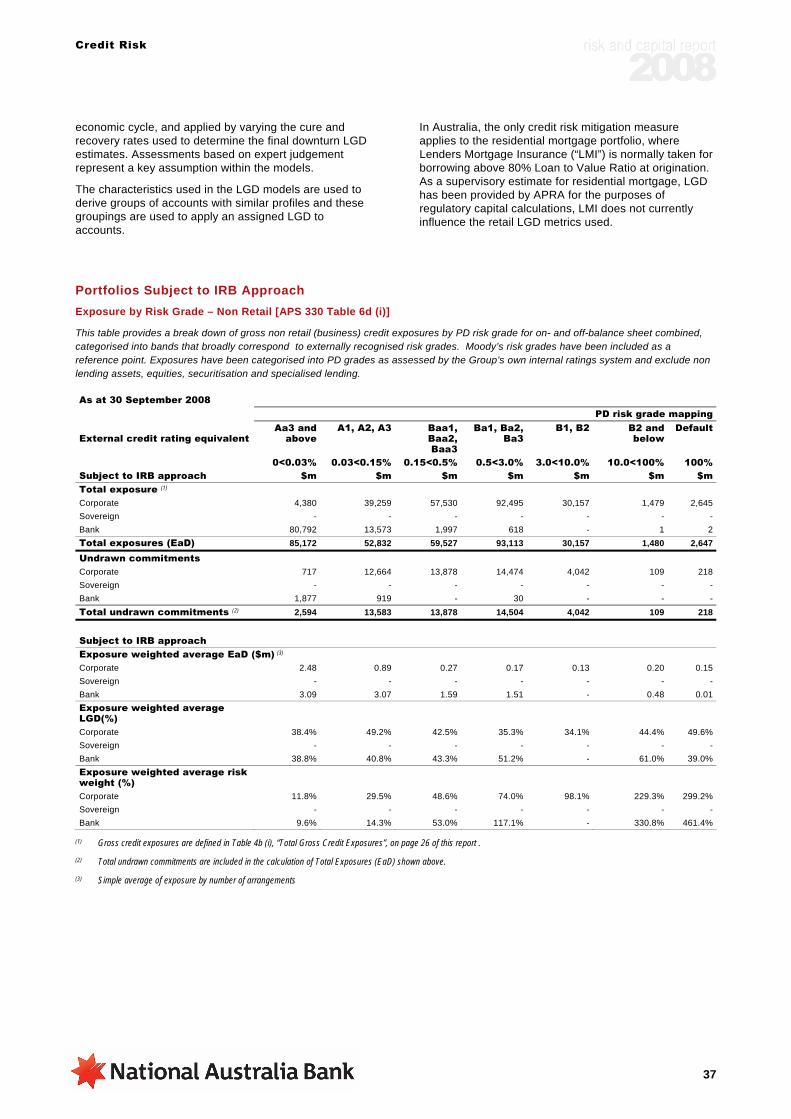
Credit Risk
37
economic cycle, and applied by varying the cure and recovery rates used to determine the final downturn LGD estimates. Assessments based on expert judgement represent a key assumption within the models.
The characteristics used in the LGD models are used to derive groups of accounts with similar profiles and these groupings are used to apply an assigned LGD to accounts.
In Australia, the only credit risk mitigation measure applies to the residential mortgage portfolio, where Lenders Mortgage Insurance (“LMI”) is normally taken for borrowing above 80% Loan to Value Ratio at origination. As a supervisory estimate for residential mortgage, LGD has been provided by APRA for the purposes of regulatory capital calculations, LMI does not currently influence the retail LGD metrics used.
Portfolios Subject to IRB Approach Exposure by Risk Grade – Non Retail [APS 330 Table 6d (i)]
This table provides a break down of gross non retail (business) credit exposures by PD risk grade for on- and off-balance sheet combined, categorised into bands that broadly correspond to externally recognised risk grades. Moody’s risk grades have been included as a reference point. Exposures have been categorised into PD grades as assessed by the Group’s own internal ratings system and exclude non lending assets, equities, securitisation and specialised lending. As at 30 September 2008 PD risk grade mapping
External credit rating equivalent Aa3 and
above A1, A2, A3 Baa1,
Baa2, Baa3
Ba1, Ba2, Ba3
B1, B2 B2 and below
Default
0<0.03% 0.03<0.15% 0.15<0.5% 0.5<3.0% 3.0<10.0% 10.0<100% 100% Subject to IRB approach $m $m $m $m $m $m $m Total exposure (1) Corporate 4,380 39,259 57,530 92,495 30,157 1,479 2,645Sovereign - - - - - - -Bank 80,792 13,573 1,997 618 - 1 2Total exposures (EaD) 85,172 52,832 59,527 93,113 30,157 1,480 2,647
Undrawn commitments Corporate 717 12,664 13,878 14,474 4,042 109 218Sovereign - - - - - - -Bank 1,877 919 - 30 - - -Total undrawn commitments (2) 2,594 13,583 13,878 14,504 4,042 109 218
Subject to IRB approach Exposure weighted average EaD ($m) (3) Corporate 2.48 0.89 0.27 0.17 0.13 0.20 0.15Sovereign - - - - - - -Bank 3.09 3.07 1.59 1.51 - 0.48 0.01Exposure weighted average LGD(%)
Corporate 38.4% 49.2% 42.5% 35.3% 34.1% 44.4% 49.6%Sovereign - - - - - - -Bank 38.8% 40.8% 43.3% 51.2% - 61.0% 39.0%Exposure weighted average risk weight (%)
Corporate 11.8% 29.5% 48.6% 74.0% 98.1% 229.3% 299.2%Sovereign - - - - - - -Bank 9.6% 14.3% 53.0% 117.1% - 330.8% 461.4%
(1) Gross credit exposures are defined in Table 4b (i), “Total Gross Credit Exposures”, on page 26 of this report .
(2) Total undrawn commitments are included in the calculation of Total Exposures (EaD) shown above.
(3) Simple average of exposure by number of arrangements
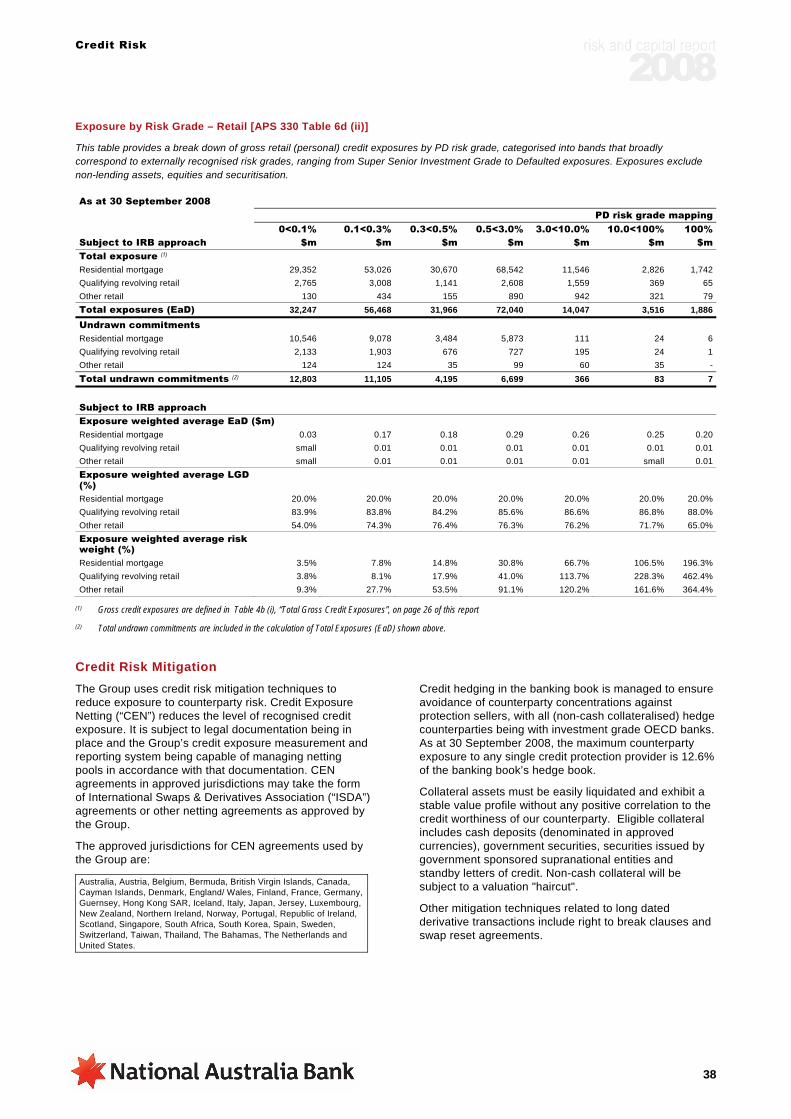
Credit Risk
38
Exposure by Risk Grade – Retail [APS 330 Table 6d (ii)]
This table provides a break down of gross retail (personal) credit exposures by PD risk grade, categorised into bands that broadly correspond to externally recognised risk grades, ranging from Super Senior Investment Grade to Defaulted exposures. Exposures exclude non-lending assets, equities and securitisation. As at 30 September 2008 PD risk grade mapping 0<0.1% 0.1<0.3% 0.3<0.5% 0.5<3.0% 3.0<10.0% 10.0<100% 100% Subject to IRB approach $m $m $m $m $m $m $m Total exposure (1) Residential mortgage 29,352 53,026 30,670 68,542 11,546 2,826 1,742Qualifying revolving retail 2,765 3,008 1,141 2,608 1,559 369 65Other retail 130 434 155 890 942 321 79Total exposures (EaD) 32,247 56,468 31,966 72,040 14,047 3,516 1,886
Undrawn commitments Residential mortgage 10,546 9,078 3,484 5,873 111 24 6Qualifying revolving retail 2,133 1,903 676 727 195 24 1Other retail 124 124 35 99 60 35 -Total undrawn commitments (2) 12,803 11,105 4,195 6,699 366 83 7
Subject to IRB approach Exposure weighted average EaD ($m) Residential mortgage 0.03 0.17 0.18 0.29 0.26 0.25 0.20Qualifying revolving retail small 0.01 0.01 0.01 0.01 0.01 0.01Other retail small 0.01 0.01 0.01 0.01 small 0.01Exposure weighted average LGD (%)
Residential mortgage 20.0% 20.0% 20.0% 20.0% 20.0% 20.0% 20.0%Qualifying revolving retail 83.9% 83.8% 84.2% 85.6% 86.6% 86.8% 88.0%Other retail 54.0% 74.3% 76.4% 76.3% 76.2% 71.7% 65.0%Exposure weighted average risk weight (%)
Residential mortgage 3.5% 7.8% 14.8% 30.8% 66.7% 106.5% 196.3%Qualifying revolving retail 3.8% 8.1% 17.9% 41.0% 113.7% 228.3% 462.4%Other retail 9.3% 27.7% 53.5% 91.1% 120.2% 161.6% 364.4%
(1) Gross credit exposures are defined in Table 4b (i), “Total Gross Credit Exposures”, on page 26 of this report
(2) Total undrawn commitments are included in the calculation of Total Exposures (EaD) shown above.
Credit Risk Mitigation The Group uses credit risk mitigation techniques to reduce exposure to counterparty risk. Credit Exposure Netting (“CEN”) reduces the level of recognised credit exposure. It is subject to legal documentation being in place and the Group’s credit exposure measurement and reporting system being capable of managing netting pools in accordance with that documentation. CEN agreements in approved jurisdictions may take the form of International Swaps & Derivatives Association (“ISDA”) agreements or other netting agreements as approved by the Group.
The approved jurisdictions for CEN agreements used by the Group are:
Australia, Austria, Belgium, Bermuda, British Virgin Islands, Canada, Cayman Islands, Denmark, England/ Wales, Finland, France, Germany, Guernsey, Hong Kong SAR, Iceland, Italy, Japan, Jersey, Luxembourg, New Zealand, Northern Ireland, Norway, Portugal, Republic of Ireland, Scotland, Singapore, South Africa, South Korea, Spain, Sweden, Switzerland, Taiwan, Thailand, The Bahamas, The Netherlands and United States.
Credit hedging in the banking book is managed to ensure avoidance of counterparty concentrations against protection sellers, with all (non-cash collateralised) hedge counterparties being with investment grade OECD banks. As at 30 September 2008, the maximum counterparty exposure to any single credit protection provider is 12.6% of the banking book’s hedge book.
Collateral assets must be easily liquidated and exhibit a stable value profile without any positive correlation to the credit worthiness of our counterparty. Eligible collateral includes cash deposits (denominated in approved currencies), government securities, securities issued by government sponsored supranational entities and standby letters of credit. Non-cash collateral will be subject to a valuation "haircut".
Other mitigation techniques related to long dated derivative transactions include right to break clauses and swap reset agreements.

Credit Risk
39
Credit Risk Mitigation [APS 330 Table 7b – c]
This table discloses the total credit exposures which are covered by the credit risk mitigants relating to each portfolio. Exposures exclude non-lending assets, equities and securitisation. As at 30 September 2008 Total
exposure of which is covered by
eligible financial
collateral (1)
of which is covered by
other eligible
collateral
of which is covered by guarantees
of which is covered by
credit derivatives
$m $m $m $m $m Standardised approach Australian and foreign governments (class II) 6,608 940 - - -Banks (class III) 25,068 11,023 - 501 -Residential mortgage (class IV) 34,432 74 34,358 - -Corporate 45,458 2,906 - - -Other 9,518 - - - -Total standardised approach (EaD) 121,084 14,943 34,358 501 -
IRB approach Corporate (including SME) 227,945 8,213 119,223 22,219 698Specialised lending (SL) 17,074 75 - - -Sovereign - - - - -Bank 96,983 32,169 773 2,581 4,580Residential mortgage 197,704 - 197,704 - -Qualifying revolving retail 11,515 - - - -Other retail 2,951 - - - -Other - - - - -Total IRB approach (EaD) (2) 554,172 40,457 317,700 24,800 5,278
(1) Eligible financial collateral, when used to reduced levels of exposure, refers to cash and cash equivalents as defined in APS 112.
(2) Exposures covered by eligible financial collateral and eligible IRB collateral are measured after the application of regulatory haircuts.
Exposures Related to Counterparty Credit Risk The Group uses an internal monitoring and control system to record, monitor and report credit exposure arising from derivative transactions, securities sales and purchases, money market lines, commodities, trade and foreign exchange transactions.
All customers with an approved derivative, money market, credit line and/or credit trading facility limit must have all limits recorded in the Group’s internal monitoring and control system. The limits will vary depending on the counterparty’s level of expertise in financial markets risk management techniques.
Credit exposure is measured using an approach where the current mark to market value of each transaction is added to the notional principal multiplied by the Potential Credit Exposure (“PCE”). The PCE factors used are intended to reflect the potential movement in the mark to market value over the remaining term to maturity.
Limit excesses, whether they are active or passive, are subject to formal approval based on delegated authority within the internal monitoring and control system.
Limit Setting
Credit risk concentration limits, expressed in economic capital terms, are set for industry segments (including commercial real estate), country and single-name exposures. Limits are approved annually by the PBRC as part of the Group’s Risk Appetite Statement and Corporate Planning process.
The Group’s credit risk economic measurement and allocation framework models credit risk on a portfolio-wide basis. The model employs Monte Carlo simulation techniques and methodologies to generate many possible future realisations of the credit portfolio in order to construct a representation of the portfolio’s expected loss distribution based on estimates of counterparty unexpected loss (“UL”) and pair-wise default correlation. Credit risk economic capital is calculated at the 99.97% percentile cut-off of the loss distribution, in line with the Group’s target level of solvency, measured over a one year horizon. Credit risk economic capital is then allocated to individual counterparty exposures based on their relative risk contribution to UL.
Monitoring of compliance with credit risk limits for industry and country exposures is based on the total Group Risk Appetite Statement economic capital position, determined at the beginning of the plan year and apportioned to individual countries and/or industries.
Credit limits are approved and assigned based on transaction complexity and counterparty credit ratings.
Counterparty credit exposures may be collateralised by an approved list of eligible collateral via market standard master agreements (ISDA and CSA). Eligible collateral may be subject to haircuts depending on asset type.
Bank systems are in place to support daily marking to market of net exposures and margin requirements, marking to market of collateral value and reconciliation of collateral receipt and holdings against collateral due.
An initial margin is lodged as security once the counterpart's net position is out-of-the-money and is

Credit Risk
40
retained for the life of the transaction. The Group requires all counterparties rated BB+/Ba1 or below to lodge an initial margin of US$5 million.
A credit downgrade may be an additional termination event in an ISDA. In such a case, the counterparty can, at its option, terminate the ISDA on occurrence of the event.
A multiple rating downgrade of the Group would have some requirements to post collateral across stand-by liquidity facilities. However, based on the dislocation in the asset backed commercial paper markets over the past 12 months, many of these have been subject to drawdown for liquidity reasons, hence materially reducing exposure to post collateral in the event of a downgrade.
Wrong Way Risk
Wrong way risk occurs when credit exposure to a counterparty is positively correlated with collateral held and any resultant market risk factors impacting a transaction – hence, credit exposures and potential losses may increase under these circumstances as a result of market conditions. The Group addresses wrong way risk through application of its credit policies and procedures, and through the transaction credit decisions made by its credit officers.

Securitisation
41
Securitisation
Introduction Securitisation risk is the potential for losses to arise from credit and operational risks associated with the Group’s securitisation activities, as well as any losses on the sale of securitised assets. Risks such as interest rate risk and securities price risk are managed as part of the overall market risk process.
The Group engages in securitisation activities for two purposes: - Securitisation of its own assets, for funding, liquidity
(including contingent liquidity) and capital management purposes, and
- Securitisation for business purposes, including arranging and managing securitisations for third parties as well as securitisation arbitrage activities, primarily through special purpose vehicles (conduits) that provide funding for multiple transactions.
The Group may undertake any of the following roles in its securitisation activities:
Role Definition Arranger Structurer of securitisation transactions. Asset liquidity provider
A provider of liquidity to cover mismatches in cashflow for securitisation structures.
Buyer of protection over assets
Entering into derivative transactions which provide credit protection over assets on the Group’s balance sheet.
Dealer Buyer and seller in the primary and secondary markets of securities.
Derivative provider
Counterparty to swaps and other derivative transactions.
First loss provider Principally for securitisation of the Group’s own assets, the provider of credit enhancement that bears the first losses (if any) incurred by the securitised pool of assets.
Investor Investor in asset backed securities. Letter of credit provider
Provider of credit enhancement to securitisation transactions.
Manager Operator of securitisation special purpose vehicles (“SPVs”), including managing assets and liabilities and providing accounting and administrative services.
Redraw provider Provider of liquidity to cover redraws for residential mortgage-backed bonds.
Seller of assets Originator and seller of assets from the Group’s balance sheet (e.g., mortgage loans).
Servicer of assets Responsible for collecting interest and principal on the securitised assets, principally for securitising the Group’s own assets.
Sponsor The entity that established the securitisation SPVs and often provides other services. NAB sponsored conduits are Titan Securitisation, TSL (USA) Inc, Quasar Securitisation, CentreStar and MiraStar Securitisation.
Standby liquidity provider
A provider of liquidity available to repay Asset Backed Commercial Paper (“ABCP”) if unable to reissue ABCP.
Warehouse facility provider
Lender to securitisation SPVs pending issuance of securities.
Management The Group manages securitisation within its established three lines of defence, with control exercised through clearly defined authorities and accountabilities.
The Group’s frameworks for owned asset securitisation and third party securitisation define the measurement of RWAs using the internal assessment approach and, in conjunction with credit, funding and liquidity policies reflect the requirements under Prudential Standard APS120 Securitisation.
For Group owned securitised assets, Group Treasury performs the role of the first line of defence as the business owner of the assets. Group Non Traded Market Risk (“GNTMR”) serves as the second line of defence.
nabCapital is engaged in the business of securitising third party assets. Third party securitisation activities follow the Group’s credit decision making and oversight processes.
The first line of defence is the nabCapital securitisation business, which works with the customer, trustees and rating agencies. The second line of defence is nabCapital Risk, GNTMR and Group Treasury.
Measurement, Monitoring and Reporting Securitisation exposures, risks and capital are measured in accordance with regulatory requirements outlined in APS 120 and include any external rating, internal risk grading, the seniority of the exposure and the composition of the pool of securitised assets.
Measurement and reporting of securitisation profit and loss and impact to capital and provisioning is undertaken in accordance with requirements set by regional finance functions and encompasses: - Total outstanding issuance and expected run-off of
outstandings, - Available pool size for future securitisation, including
details on asset type and quality, and - Assessment of the average asset quality of retained
exposures.
For Group owned securitised assets, Group Treasury, with oversight by GNTMR, is responsible for meeting all reporting requirements to Group ALCO. Reporting to Group ALCO forms the basis of all reports to GRMC, the PBRC and the Principal Board. Regional treasuries, with oversight by the relevant NTMR, are responsible for meeting all reporting requirements to their respective Regional ALCO and subsidiary Board.
For third party securitisation, funding reports containing the global amount of Commercial Paper (“CP”) and the funding of the liquidity facilities are provided weekly to the nabCapital Chief Risk Officer along with monthly reports on each liquidity facility including the limit and the credit rating. Key elements of these reports are provided to nabCapital ExCo with guidance from nabCapital RMC.
Management risk reporting consists of a comprehensive system of regular reports and reviews, with more detailed reviews for lower quality credits and continuous management where required, including:

Securitisation
42
- Securitisation management reporting, which reviews the underlying asset data, usually monthly,
- Monthly, quarterly and annual finance and management reports in relation to accounting, regulatory capital, security issuance and asset quality,
- Regular reporting to investors in the securitisation transactions,
- Regular reporting to rating agencies, APRA and the Australia Bureau of Statistics, and
- Exception reporting, where credit or other limits are exceeded.
The Group views securitisation exposures for facilities provided to securitisation transactions as “hold to maturity” exposures. The main mitigants lie in the initial structuring and assessment of the transactions, supported by the regime of reviews and reporting outlined above. Initial structuring and assessment includes an analysis of matters such as portfolio composition and quality, the level and type of credit enhancement, due diligence on, and the quality of, the servicer of the assets, and specific structural enhancements such as trigger events.
Securitisation Exposures and Definitions Securitisation exposures are on- and off-balance sheet risk positions held by the Group arising from a securitisation including, but not limited to: - Investments by the Group in securities issued by a
securitisation SPV, including retention of a subordinated tranche of securities issued by an SPV,
- Other credit enhancements, such as guarantees provided by the Group,
- Drawn and undrawn funding, underwriting, liquidity and other facilities provided by the Group to a securitisation, and
- Exposures arising from swaps and other derivative transactions with an SPV.
The Group’s securitisation exposures are categorised according to the requirements of APS 330. Key definitions are provided below.
Special Purpose Vehicle
- A special purpose vehicle, or SPV, is an entity set up solely for the purpose of securitisation, usually a trust or a company.
Origination
- Originating ADI. The Group is an "Originating ADI" if it originally sold the asset to the SPV (directly or indirectly), manages the SPV or provides a non-derivative facility to an SPV issuing commercial paper.
- Originated Assets. These refer to assets that were originally written by the Group and transferred to the SPV, or in the case of indirect origination, written directly by the SPV at the direction of the Group.
- Traditional Securitisations. Securitisations in which the pool of assets is assigned to an SPV, usually by a sale.
- Synthetic Securitisations. Securitisations in which the risk of the pool of assets is transferred to an SPV through a derivative, usually a credit default swap.
Type of Exposure
These definitions are as per APS 120.
- Liquidity facilities are provided by the Group to an SPV for the primary purpose of funding any timing mismatches between receipts of funds on underlying exposures and payments on securities issued by the SPV, or to cover the inability of the SPV to roll over securities due to market disruption.
- Funding facilities are provided by the Group to an SPV for the purchase of exposures for a pool.
- Underwriting facilities are provided where the Group agrees to buy securities from the SPV to facilitate their distribution to the market.
- Lending facilities are provided by the Group directly to investors for purposes of investing in securities issued by an SPV.
- Credit enhancements are arrangements in which the Group holds a securitisation exposure that is able to absorb losses in the pool, providing credit protection to investors or other parties to the securitisation. A first loss credit enhancement is available to absorb losses in the first instance. A second loss credit enhancement is available to absorb losses after significant first loss credit enhancements have been exhausted.
- Derivative transactions include interest rate and currency derivatives provided to securitisation SPVs.
The Group predominately uses Standard & Poor’s for rating securitisations for which the Group is an originating ADI. Moody's rates some term transactions and some asset-backed commercial paper ("ABCP") programs for the Group. Fitch rates some term transactions, but no ABCP programs.
Accounting Treatment In general, facilities provided to securitisations are treated the same way as facilities to any other borrower or counterparty.
Interest and line fees received are treated as revenue in the period in which they are accrued. Arrangement fees are treated as revenue and recognised as revenue over the life of the securitisation transaction. Derivatives such as interest rate swaps, basis swaps or cross-currency swaps have the same accounting treatment as non-securitisation derivatives.
The Group has changed its accounting policy in relation to consolidation. Under this revised policy, NAB sponsored securitisation conduits are consolidated by the Group. Refer to Note 1(g) to the 2008 Annual Financial Report for full details of the change in accounting treatment.

Securitisation
43
Securitisation Exposures The tables “Traditional Securitisations”, “Synthetic Securitisations” and “Total Originating ADI Securitisation Exposures” are broken down by the type of asset within the securitisation SPV and provide the Group’s exposures to those securitisations. These tables do not provide Group assets that have been sold to securitisations.
Total Originating ADI Securitisation Exposures [APS 330 Table 9d]
This table is the sum of tables “Synthetic Securitisation” and “Traditional Securitisations” below. It sets out the amounts of facilities as at 30 September 2008 and provides an indication of the relative extent to which the Group has exposure. As at 30 September 2008 Total outstanding exposures
Directly
originated assets
Indirectly originated
assets
Facilities provided
Other (manager services)
$m $m $m $m Underlying asset Residential mortgage 237 - 9,846 - Credit cards and other personal loans - - 574 - Auto and equipment finance - - 2,954 - CDOs/CLOs 537 - 3,773 - Commercial loans - - 113 - Commercial mortgages - - 1,574 - Corporate bonds - - 1,232 - Other - - 4,147 - Total underlying asset 774 - 24,213 -
Traditional Securitisations – Originating ADI Securitisation Exposures [APS 330 Table 9d]
Traditional Securitisations are those in which the pool of assets is assigned to an SPV, usually by a sale. The table below sets out the amounts of facilities as at 30 September 2008 and provides an indication of the relative extent to which the Group has exposure. As at 30 September 2008 Total outstanding exposures
Directly
originated assets
Indirectly originated
assets
Facilities provided
Other (manager services)
$m $m $m $m Underlying asset Residential mortgage 237 - 9,846 - Credit cards and other personal loans - - 574 - Auto and equipment finance - - 2,954 - CDOs/CLOs - - 1,864 - Commercial loans - - 113 - Commercial mortgages - - 1,574 - Corporate bonds - - 1,232 - Other - - 3,059 - Total underlying asset 237 - 21,216 -
This section does not include information about the residential mortgage backed security (“RMBS”) transaction the Group has undertaken for liquidity purposes and which is held on the balance sheet. The amount of the securitised assets for this transaction stands at $10,568 million as at 30 September 2008.

Securitisation
44
Synthetic Securitisations – Originating ADI Securitisation Exposures [APS 330 Table 9d]
Synthetic Securitisations are those in which the risk of the pool of assets is transferred to an SPV through a derivative, usually a credit default swap. As at 30 September 2008 Total outstanding exposures
Directly
originated assets
Indirectly originated
assets
Facilities provided
Other (manager services)
$m $m $m $m Underlying asset Residential mortgage - - - - Credit cards and other personal loans - - - - Auto and equipment finance - - - - CDOs/CLOs 537 - 1,909 - Commercial loans - - - - Commercial mortgages - - - - Corporate bonds - - - - Other - - 1,088 - Total underlying asset 537 - 2,997 -
Securitisation by Type of Exposure [APS 330 Table 9f]
The table below breaks down the securitisation exposures by type of facility, as defined in APS 120. The Group holds securities issued by securitisation SPVs as part of its trading book and banking book. As at 30 September 2008 $m Securitisation exposure type Liquidity facilities 21,171 Funding facilities 3,404 Underwriting facilities - Lending facilities - Credit enhancements 412 Derivative transactions 218 Securities 726 Other - Total securitisation exposures 25,931
New Facilities Provided [APS 330 Table 9j]
The table below shows new facilities provided in the last 6 months. 6 months ended 30 September 2008
Notional amount
of facilities provided
$m Securitisation exposure type Liquidity facilities 2,052 Funding facilities 22 Underwriting facilities - Lending facilities - Credit enhancements 199 Derivative transactions - Other - Total new facilities provided 2,273
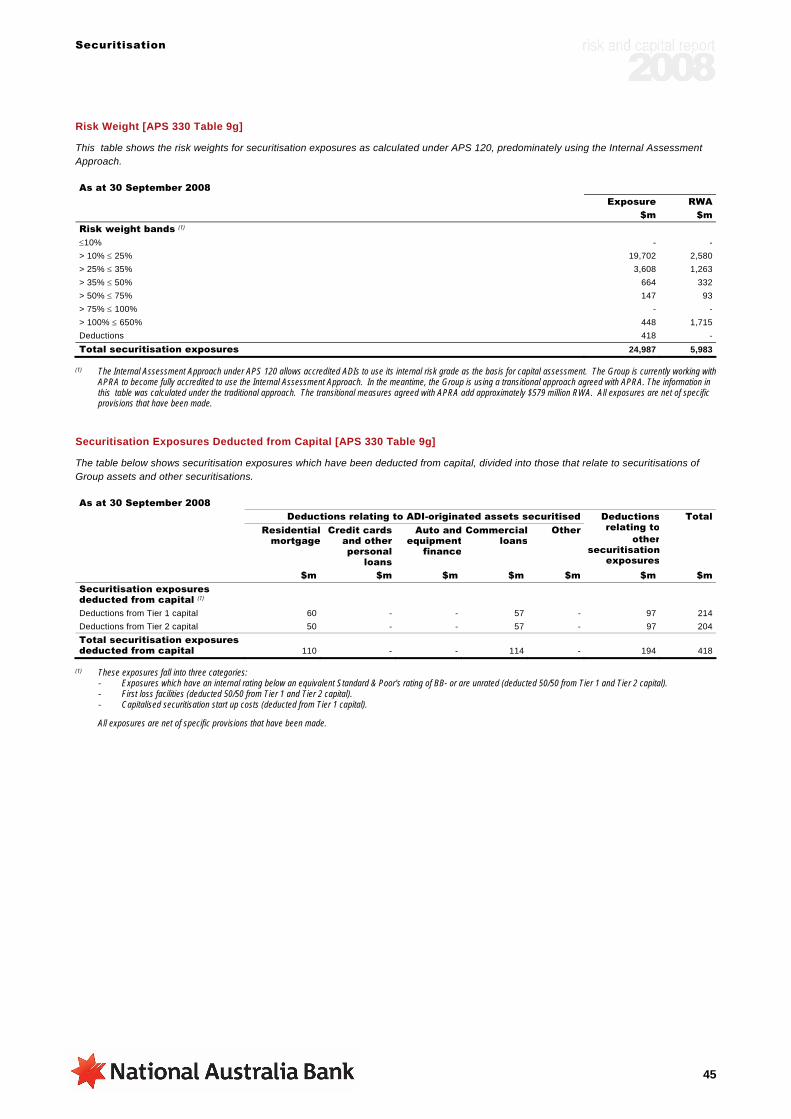
Securitisation
45
Risk Weight [APS 330 Table 9g]
This table shows the risk weights for securitisation exposures as calculated under APS 120, predominately using the Internal Assessment Approach. As at 30 September 2008 Exposure RWA $m $m Risk weight bands (1) ≤10% - - > 10% ≤ 25% 19,702 2,580 > 25% ≤ 35% 3,608 1,263 > 35% ≤ 50% 664 332 > 50% ≤ 75% 147 93 > 75% ≤ 100% - - > 100% ≤ 650% 448 1,715 Deductions 418 - Total securitisation exposures 24,987 5,983
(1) The Internal Assessment Approach under APS 120 allows accredited ADIs to use its internal risk grade as the basis for capital assessment. The Group is currently working with APRA to become fully accredited to use the Internal Assessment Approach. In the meantime, the Group is using a transitional approach agreed with APRA. The information in this table was calculated under the traditional approach. The transitional measures agreed with APRA add approximately $579 million RWA. All exposures are net of specific provisions that have been made.
Securitisation Exposures Deducted from Capital [APS 330 Table 9g]
The table below shows securitisation exposures which have been deducted from capital, divided into those that relate to securitisations of Group assets and other securitisations. As at 30 September 2008 Deductions relating to ADI-originated assets securitised
Residentialmortgage
Credit cards and other personal
loans
Auto andequipment
finance
Commercialloans
Other Deductionsrelating to
othersecuritisation
exposures
Total
$m $m $m $m $m $m $m Securitisation exposures deducted from capital (1)
Deductions from Tier 1 capital 60 - - 57 - 97 214 Deductions from Tier 2 capital 50 - - 57 - 97 204 Total securitisation exposures deducted from capital 110 - - 114 - 194 418
(1) These exposures fall into three categories: - Exposures which have an internal rating below an equivalent Standard & Poor's rating of BB- or are unrated (deducted 50/50 from Tier 1 and Tier 2 capital). - First loss facilities (deducted 50/50 from Tier 1 and Tier 2 capital). - Capitalised securitisation start up costs (deducted from Tier 1 capital).
All exposures are net of specific provisions that have been made.
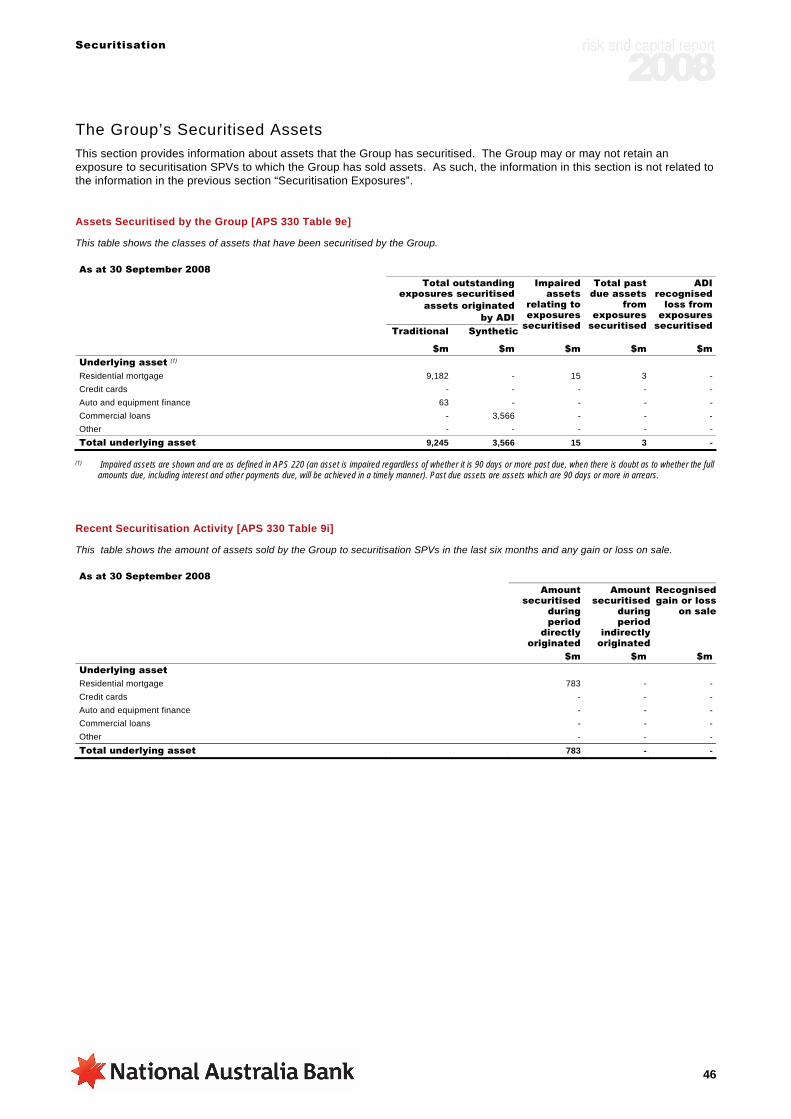
Securitisation
46
The Group’s Securitised Assets This section provides information about assets that the Group has securitised. The Group may or may not retain an exposure to securitisation SPVs to which the Group has sold assets. As such, the information in this section is not related to the information in the previous section “Securitisation Exposures”.
Assets Securitised by the Group [APS 330 Table 9e]
This table shows the classes of assets that have been securitised by the Group. As at 30 September 2008
Total outstanding exposures securitised
assets originated by ADI
Traditional Synthetic
Impaired assets
relating to exposures
securitised
Total past due assets
from exposures
securitised
ADI recognised
loss from exposures
securitised
$m $m $m $m $m Underlying asset (1) Residential mortgage 9,182 - 15 3 - Credit cards - - - - - Auto and equipment finance 63 - - - - Commercial loans - 3,566 - - - Other - - - - - Total underlying asset 9,245 3,566 15 3 -
(1) Impaired assets are shown and are as defined in APS 220 (an asset is impaired regardless of whether it is 90 days or more past due, when there is doubt as to whether the full amounts due, including interest and other payments due, will be achieved in a timely manner). Past due assets are assets which are 90 days or more in arrears.
Recent Securitisation Activity [APS 330 Table 9i]
This table shows the amount of assets sold by the Group to securitisation SPVs in the last six months and any gain or loss on sale. As at 30 September 2008
Amount securitised
during period
directly originated
Amount securitised
during period
indirectly originated
Recognised gain or loss
on sale
$m $m $m Underlying asset Residential mortgage 783 - - Credit cards - - - Auto and equipment finance - - - Commercial loans - - - Other - - - Total underlying asset 783 - -

Securitisation
47
Securitisation Subject to Early Amortisation [APS 330 Table 9h]
Attachment G of APS 120 provides for specific regulatory treatment for securitisations of certain types of assets. None of these securitisations has been undertaken by the Group. As at 30 September 2008
Aggregate drawn
exposure attributed to: Aggregate IRB capital
charge against ADI’s retained shares from:
Aggregate IRB capital charge against the ADI from investor’s shares
of:
Seller interest
Investor interest
Drawn balances
Undrawn lines
Drawn balances
Undrawn lines
$m $m $m $m $m $m Recent securitisation activity Residential mortgage - - - - - - Commercial mortgage - - - - - - Auto and equipment finance - - - - - - Commercial loans - - - - - - Corporate bonds - - - - - - CDOs - - - - - - Other - - - - - - Total recent securitisation activity - - - - - -

Market Risk
48
Market Risk
Introduction Traded market risk is the potential for losses to arise from trading activities undertaken by the Group as a result of adverse movement in market prices.
The Group undertakes trading activities to support its client and to profit in the short term from differences in market factors, such as interest rates, foreign exchange rates, commodity prices, equity prices and credit spreads. Trading activities are carried out by specialist areas within the Group and generate revenue through active management of market risk in the Group’s dealing rooms in various locations.
Management The Group manages market risk within an established three lines of defence framework, with control exercised through clearly defined delegations of authority and clear communication and escalation channels throughout the organisation.
The Principal Board defines the risk appetite for traded market risk, including setting the overall Value at Risk (“VaR”) and stress test limits.
The Group’s Traded Market Risk framework sets out the approach and policy for the management and reporting of market risk in compliance with the Principal Board directives and includes the definition of the trading book.
Measurement The Group uses both the Standard Method and the Internal Model Approach (“IMA”) for measuring traded market risk. There are two types of market risk measures related to regulatory capital – general market risk, which is related to changes in the overall market prices, and specific market risk, which is related to changes for the specific issuer. As required by Group policy, all models employed for valuation or for risk measurement in the trading book are independently validated before they are implemented in production.
Extreme events risk is measured and monitored through stress testing. Stress tests are used to identify possible material events or changes in market conditions that could adversely impact the Group. The analysis of results is used to assess the provision of capital adequacy, verify the competence of established limits and define appropriate mitigating actions. Limits are set at various levels (Group, region and desk) and are checked against the results of stress tests daily.
The Group also runs other stress scenarios based on historical events and subjective estimates as part of the stress testing program. These results are used for analysis and identifying portfolio sensitivities that are not otherwise evident. In addition, regulators provide stress scenarios, which are run against the trading portfolio and results provided to them.
Portfolios Subject to the Standard Method
The Standard Method, detailed in APS 116 Attachment B, is used for calculating general market risk for transactions in commodities, equities, ratchet swaps, carbon trading and CPI-linked instruments. The Group uses both
maturity ladder and contingent loss matrix methodologies in its calculations. In addition, specific market risk is measured for all applicable products using the Standard Method. The trading positions subject to Standard Method are small in value, except for the exposure to commodities transactions.
Market Risk – Standard Method [APS 330 Table 10b]
As at 30 September 2008 $m Risk weighted assets Interest rate risk 2,833Equity position risk -Foreign exchange risk -Commodity risk 598Total risk weighted assets - standardised (1) 3,431
(1) The following products are currently covered by the standardised approach: commodities, equities, ratchet swaps, CPI products, carbon trading, and specific market risk capital for all applicable products.
Portfolios Subject to the Internal Model Approach
The Group uses, under approval from APRA, the IMA to calculate general market risk for all transactions in the trading book other than those covered by the Standard Method detailed above. However, specific market risk capital for all applicable products including those covered by IMA is calculated using the Standard Method.
Within the trading portfolio, all instruments are treated in a consistent fashion, whether they are physical instruments (e.g., bonds and money market instruments), derivatives (e.g., options and futures) or hedging transactions.
The Group is working towards progressively bringing the products currently subject to the Standard Method under the IMA.
The traded market risk regulatory capital requirement for products eligible for inclusion in the IMA at 30 September 2008. The risk weighted asset equivalent for traded market risk using the IMA is $1,657m at 30 September 2008. This is the capital requirement multiplied by 12.5 in accordance with APS 110.
Market Risk – Total Risk Weighted Assets
As at 30 September 2008 $m Market risk Standard method approach 3,431Internal model approach 1,657Total market risk RWA 5,088
% of total Group (level 2) RWA 1.5%

Market Risk
49
Market Risk – Internal Models Approach [APS 330 Table 11d]
6 months ended 30 September 2008
Mean value
Minimum value
Maximum value
As at 30 September
2008
$m $m $m $m Value at risk at a 99% confidence level (1) Foreign exchange risk (2) 3 1 7 2Interest rate risk 8 5 10 10Volatility risk 1 1 3 3Commodities risk - - - -Credit risk 10 8 13 9Inflation risk - - - -Diversification benefit (8) (4) (16) (10)Total value at risk for physical and derivative position 14 11 17 14
(1) Value at risk is measured individually for foreign exchange risk, interest rate risk, volatility risk, commodities risk, credit risk and inflation risk. The individual risk categories do not sum up to the total risk number due to diversification benefits. Risk limits are applied in these categories separately and against the total risk position.
(2) The value at risk numbers detailed in the table above relate to traded market risk and do not include a foreign exchange exposure that occurred in the banking book in September 2008 arising from the default of a counterparty to certain derivatives contracts. The anticipated non-performance of existing Group funding related transactions with this counterparty necessitated the prompt re-hedging of the market risk pertaining to these transactions. The re-hedging was completed within 24hrs of the exposure being created, thus returning foreign exchange exposures to normal levels.
Comparison of value at risk estimates to actual gains/losses 6 months ended 30 September 2008 Number of “outliers” incurred for the trading portfolio 1
Value at Risk Estimation
The Group uses VaR estimates for both regulatory capital calculation and for internal risk control purposes. Trading book VaR is calculated using historical simulation methodology employing the following parameters: - 99th percentile outcomes - Two years of daily history of prices - Pricing data rolled monthly - One-day holding period
For calculation of regulatory capital, VaR is measured using a ten-day holding period. This measure is calculated by scaling up the one-day VaR by the square root of ten, being the holding period.
Monitoring and Reporting VaR estimates are backtested for reasonableness on a daily basis. Backtesting is a process that compares the Group’s daily VaR estimates against both theoretical and actual daily profit and loss.
For theoretical (or hypothetical) backtesting, the trading positions at the end-of-the-preceding-day are revalued using the end-of-day rates for that day and then again at the succeeding day’s closing rates. The difference between the two mark-to-market values of the portfolio, which represents the profit and loss that would have occurred had there been no transactions on the day, is compared with the VaR. Results of this test are stored for observation over an extended period of time. Additionally, VaR is compared with the actual daily traded profit and loss as a cross-check of the “reasonableness” of the theoretical portfolio movement.
All backtesting exceptions are investigated to determine whether the cause is related to model or rate or currency moves outside 99% confidence interval.
The results of backtesting are reported to senior management, the PBRC and the regulators. In addition to backtesting, the risk measurement model and all pricing
models are subject to annual assessment, periodical reviews and independent validation at frequencies specified by the Group Model Risk policy.
Backtesting Results (1)
(1) Based on actual P&L.
Backtesting Outlier Commentary
Backtesting, carried out by comparing the Group’s daily VaR estimate against actual P&L numbers, showed one exception during the six month period to 30 September 2008. This is well within the acceptable model parameters and indicates acceptable operation of the VaR model within APRA Guidelines.
-20,000,000
-15,000,000
-10,000,000
-5,000,000
0
5,000,000
10,000,000
15,000,000
20,000,000
Actual P&L VAR (99% 1 Day)
Apr May Jun Jul Aug Sep
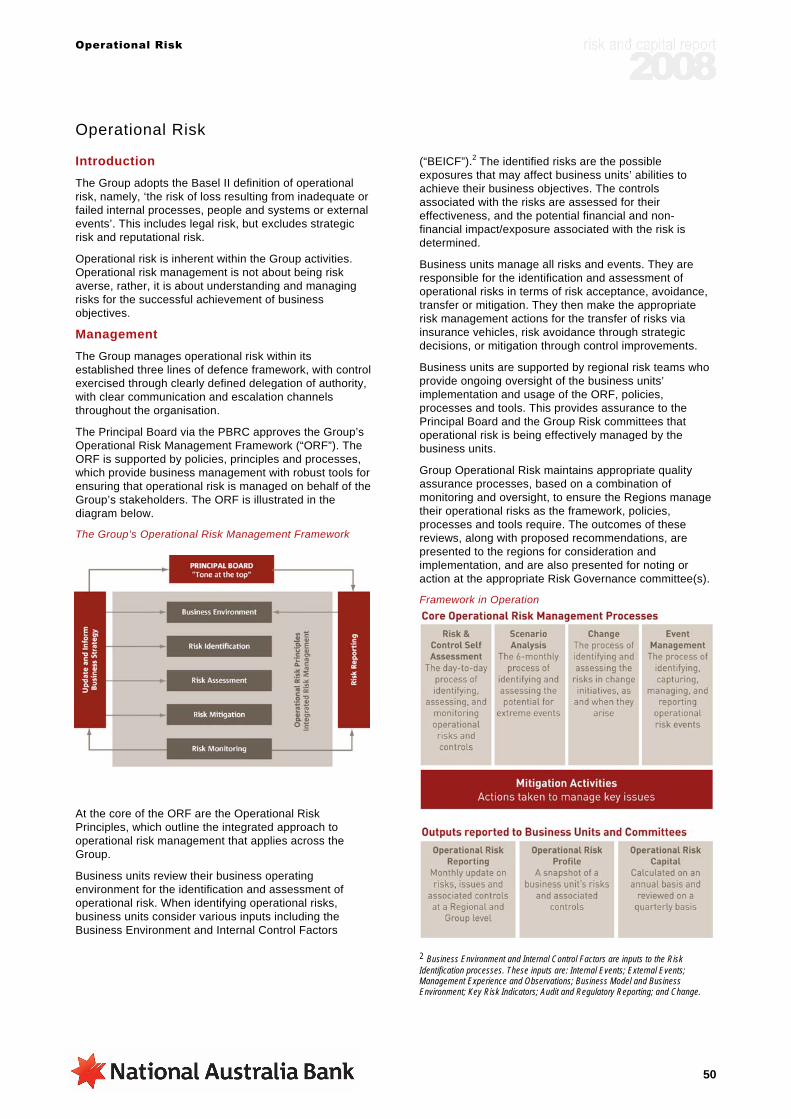
Operational Risk
50
Operational Risk
Introduction The Group adopts the Basel II definition of operational risk, namely, ‘the risk of loss resulting from inadequate or failed internal processes, people and systems or external events’. This includes legal risk, but excludes strategic risk and reputational risk.
Operational risk is inherent within the Group activities. Operational risk management is not about being risk averse, rather, it is about understanding and managing risks for the successful achievement of business objectives.
Management The Group manages operational risk within its established three lines of defence framework, with control exercised through clearly defined delegation of authority, with clear communication and escalation channels throughout the organisation.
The Principal Board via the PBRC approves the Group’s Operational Risk Management Framework (“ORF”). The ORF is supported by policies, principles and processes, which provide business management with robust tools for ensuring that operational risk is managed on behalf of the Group’s stakeholders. The ORF is illustrated in the diagram below.
The Group’s Operational Risk Management Framework
At the core of the ORF are the Operational Risk Principles, which outline the integrated approach to operational risk management that applies across the Group.
Business units review their business operating environment for the identification and assessment of operational risk. When identifying operational risks, business units consider various inputs including the Business Environment and Internal Control Factors
(“BEICF”).2 The identified risks are the possible exposures that may affect business units’ abilities to achieve their business objectives. The controls associated with the risks are assessed for their effectiveness, and the potential financial and non-financial impact/exposure associated with the risk is determined.
Business units manage all risks and events. They are responsible for the identification and assessment of operational risks in terms of risk acceptance, avoidance, transfer or mitigation. They then make the appropriate risk management actions for the transfer of risks via insurance vehicles, risk avoidance through strategic decisions, or mitigation through control improvements.
Business units are supported by regional risk teams who provide ongoing oversight of the business units’ implementation and usage of the ORF, policies, processes and tools. This provides assurance to the Principal Board and the Group Risk committees that operational risk is being effectively managed by the business units.
Group Operational Risk maintains appropriate quality assurance processes, based on a combination of monitoring and oversight, to ensure the Regions manage their operational risks as the framework, policies, processes and tools require. The outcomes of these reviews, along with proposed recommendations, are presented to the regions for consideration and implementation, and are also presented for noting or action at the appropriate Risk Governance committee(s).
Framework in Operation
2 Business Environment and Internal Control Factors are inputs to the Risk Identification processes. These inputs are: Internal Events; External Events; Management Experience and Observations; Business Model and Business Environment; Key Risk Indicators; Audit and Regulatory Reporting; and Change.
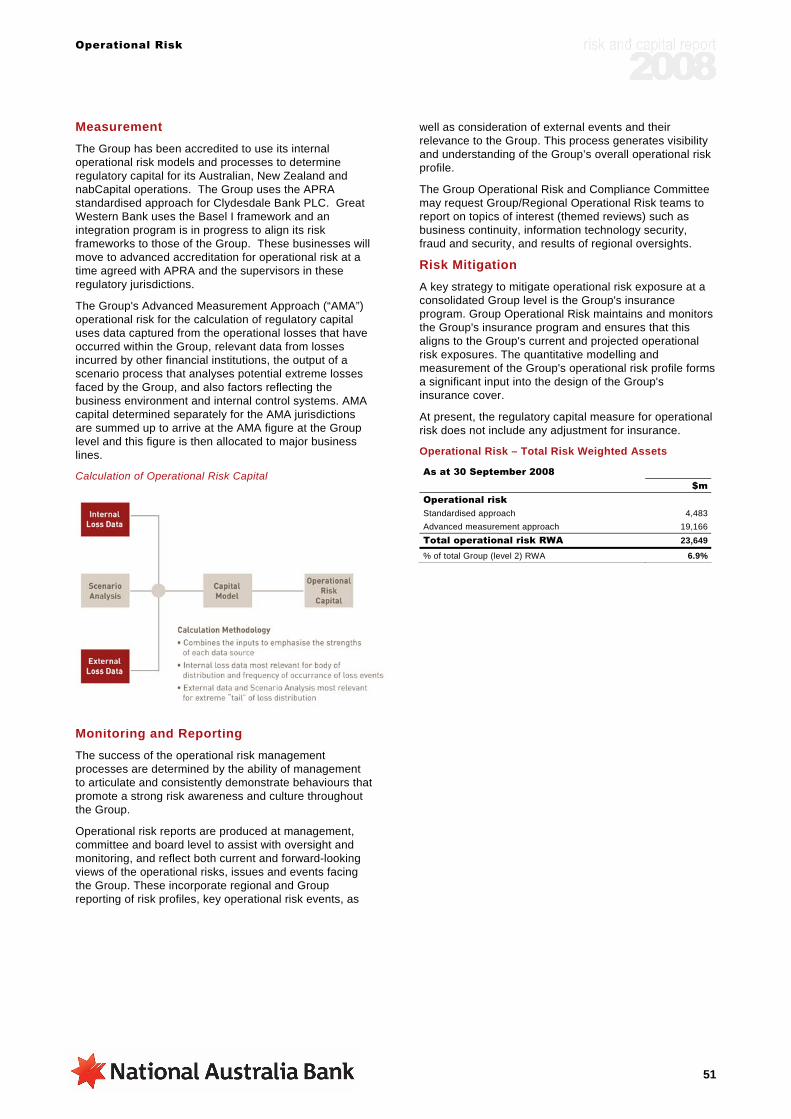
Operational Risk
51
Measurement The Group has been accredited to use its internal operational risk models and processes to determine regulatory capital for its Australian, New Zealand and nabCapital operations. The Group uses the APRA standardised approach for Clydesdale Bank PLC. Great Western Bank uses the Basel I framework and an integration program is in progress to align its risk frameworks to those of the Group. These businesses will move to advanced accreditation for operational risk at a time agreed with APRA and the supervisors in these regulatory jurisdictions.
The Group's Advanced Measurement Approach (“AMA”) operational risk for the calculation of regulatory capital uses data captured from the operational losses that have occurred within the Group, relevant data from losses incurred by other financial institutions, the output of a scenario process that analyses potential extreme losses faced by the Group, and also factors reflecting the business environment and internal control systems. AMA capital determined separately for the AMA jurisdictions are summed up to arrive at the AMA figure at the Group level and this figure is then allocated to major business lines.
Calculation of Operational Risk Capital
Monitoring and Reporting The success of the operational risk management processes are determined by the ability of management to articulate and consistently demonstrate behaviours that promote a strong risk awareness and culture throughout the Group.
Operational risk reports are produced at management, committee and board level to assist with oversight and monitoring, and reflect both current and forward-looking views of the operational risks, issues and events facing the Group. These incorporate regional and Group reporting of risk profiles, key operational risk events, as
well as consideration of external events and their relevance to the Group. This process generates visibility and understanding of the Group’s overall operational risk profile.
The Group Operational Risk and Compliance Committee may request Group/Regional Operational Risk teams to report on topics of interest (themed reviews) such as business continuity, information technology security, fraud and security, and results of regional oversights.
Risk Mitigation A key strategy to mitigate operational risk exposure at a consolidated Group level is the Group's insurance program. Group Operational Risk maintains and monitors the Group's insurance program and ensures that this aligns to the Group's current and projected operational risk exposures. The quantitative modelling and measurement of the Group's operational risk profile forms a significant input into the design of the Group's insurance cover.
At present, the regulatory capital measure for operational risk does not include any adjustment for insurance.
Operational Risk – Total Risk Weighted Assets
As at 30 September 2008 $m Operational risk Standardised approach 4,483Advanced measurement approach 19,166Total operational risk RWA 23,649
% of total Group (level 2) RWA 6.9%
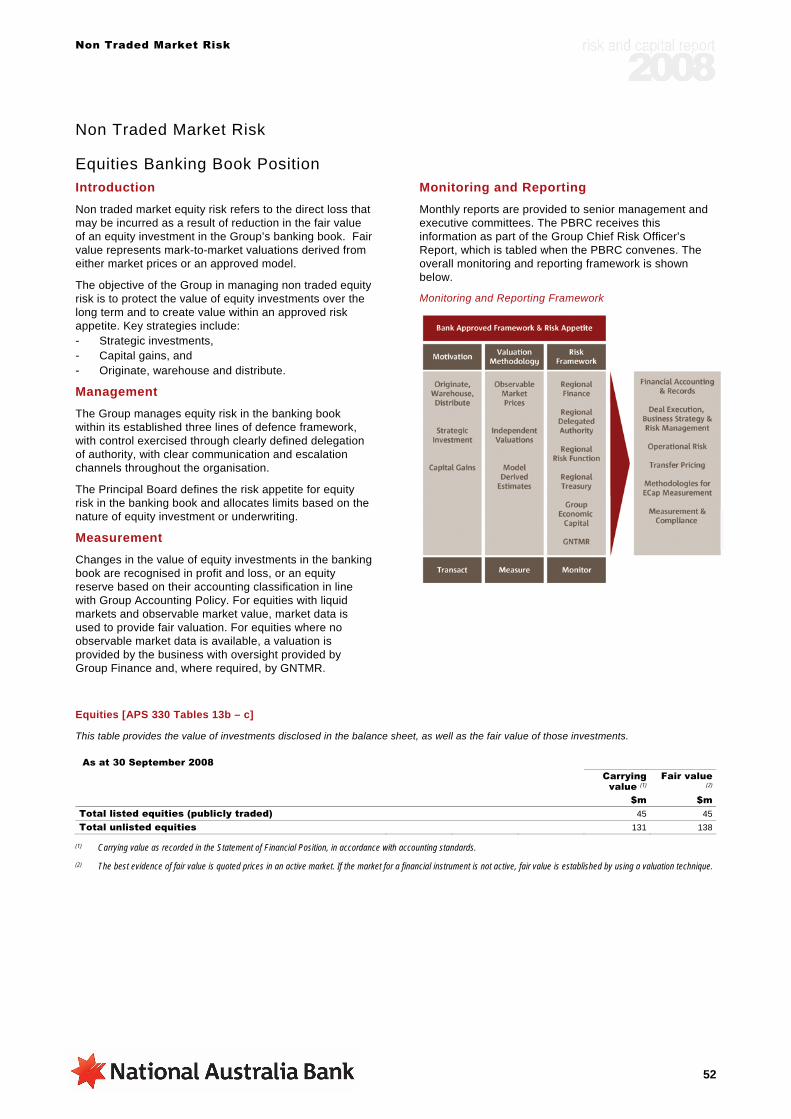
Non Traded Market Risk
52
Non Traded Market Risk
Equities Banking Book Position Introduction Non traded market equity risk refers to the direct loss that may be incurred as a result of reduction in the fair value of an equity investment in the Group’s banking book. Fair value represents mark-to-market valuations derived from either market prices or an approved model.
The objective of the Group in managing non traded equity risk is to protect the value of equity investments over the long term and to create value within an approved risk appetite. Key strategies include: - Strategic investments, - Capital gains, and - Originate, warehouse and distribute.
Management The Group manages equity risk in the banking book within its established three lines of defence framework, with control exercised through clearly defined delegation of authority, with clear communication and escalation channels throughout the organisation.
The Principal Board defines the risk appetite for equity risk in the banking book and allocates limits based on the nature of equity investment or underwriting.
Measurement Changes in the value of equity investments in the banking book are recognised in profit and loss, or an equity reserve based on their accounting classification in line with Group Accounting Policy. For equities with liquid markets and observable market value, market data is used to provide fair valuation. For equities where no observable market data is available, a valuation is provided by the business with oversight provided by Group Finance and, where required, by GNTMR.
Monitoring and Reporting Monthly reports are provided to senior management and executive committees. The PBRC receives this information as part of the Group Chief Risk Officer’s Report, which is tabled when the PBRC convenes. The overall monitoring and reporting framework is shown below.
Monitoring and Reporting Framework
Equities [APS 330 Tables 13b – c]
This table provides the value of investments disclosed in the balance sheet, as well as the fair value of those investments. As at 30 September 2008
Carrying value (1)
Fair value (2)
$m $m Total listed equities (publicly traded) 45 45Total unlisted equities 131 138
(1) Carrying value as recorded in the Statement of Financial Position, in accordance with accounting standards.
(2) The best evidence of fair value is quoted prices in an active market. If the market for a financial instrument is not active, fair value is established by using a valuation technique.

Non Traded Market Risk
53
Gains and Losses on Equity Investments [APS 330 Tables 13d – e]
This table provides the realised (actual) gains/losses arising from sales and liquidations in the reporting period recognised through the profit and loss account. Unrealised (expected) gains/losses included in Tier 1 and Tier 2 capital are gains/losses recognised in the balance sheet but not through the profit and loss account. As at 30 September 2008 $m Gains (losses) on equity investments Cumulative realised gains (losses) in reporting period (1) (7)Total unrealised gains (losses) (2) 30Total unrealised gains (losses) included in Tier 1/ Tier 2 capital
13
(1) Recognised through profit and loss according to accounting standards.
(2) Recognised in balance sheet but not through profit and loss.
Risk Weighted Assets by Equity Asset Class [APS 330 Tables 13f]
This table shows RWAs by equity asset class. Equity investments subject to a 300 per cent risk-weight are those exposures that fall within the equity IRB asset class that are not deducted from capital and that are listed on a recognised exchange. Equity investments subject to a 400 per cent risk-weight are those exposures that fall within the equity IRB asset class that are not deducted from capital and that are not listed on a recognised exchange. As at 30 September 2008 $m Risk weighted assets Equities subject to 300% RW (1) 134Equities subject to 400% RW (2) 523Total risk weighted assets 657
(1) Applies to exposures that fall within equity IRB asset class that are not deducted from capital and are listed on a recognised exchange.
(2) Applies to exposures that fall within equity IRB asset class that are not deducted from capital and are not listed on a recognised exchange.
Equity Investments Subject to Grandfathering Provision [APS 330 Tables 13f]
The Group does not have any equity investments that are subject to grandfathering provisions. As at 30 September 2008 $m Total equity investments 0
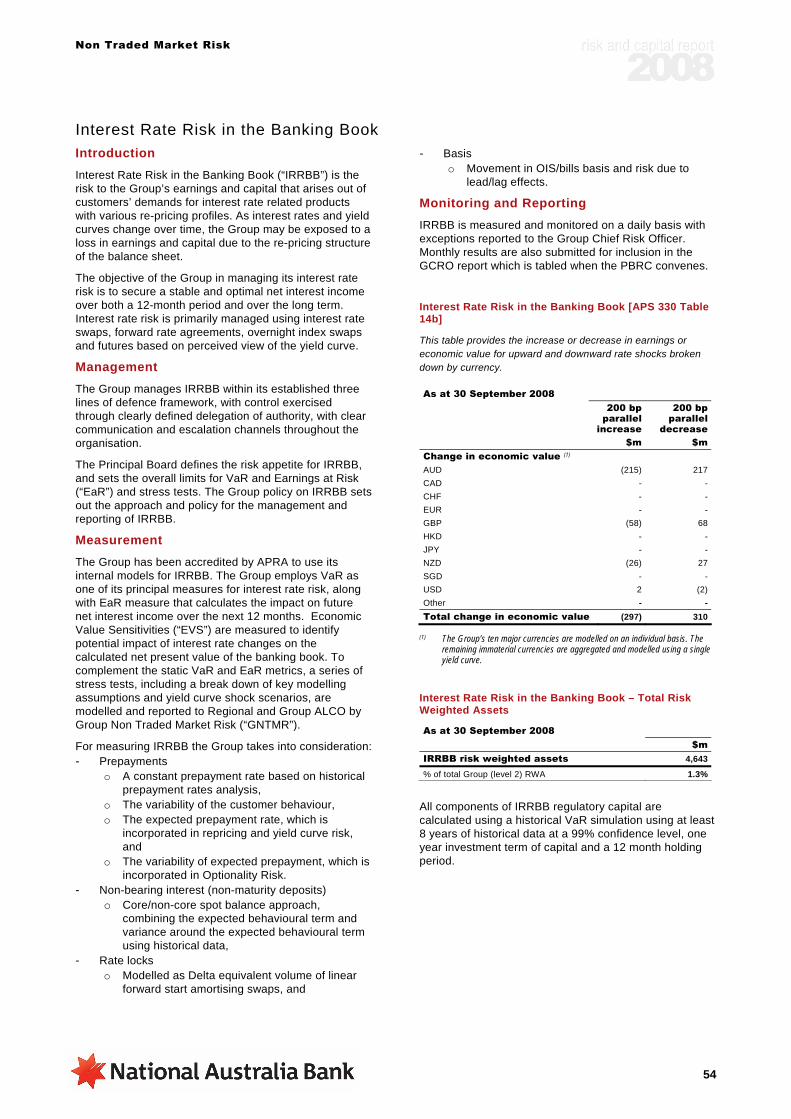
Non Traded Market Risk
54
Interest Rate Risk in the Banking Book Introduction Interest Rate Risk in the Banking Book (“IRRBB”) is the risk to the Group’s earnings and capital that arises out of customers’ demands for interest rate related products with various re-pricing profiles. As interest rates and yield curves change over time, the Group may be exposed to a loss in earnings and capital due to the re-pricing structure of the balance sheet.
The objective of the Group in managing its interest rate risk is to secure a stable and optimal net interest income over both a 12-month period and over the long term. Interest rate risk is primarily managed using interest rate swaps, forward rate agreements, overnight index swaps and futures based on perceived view of the yield curve.
Management The Group manages IRRBB within its established three lines of defence framework, with control exercised through clearly defined delegation of authority, with clear communication and escalation channels throughout the organisation.
The Principal Board defines the risk appetite for IRRBB, and sets the overall limits for VaR and Earnings at Risk (“EaR”) and stress tests. The Group policy on IRRBB sets out the approach and policy for the management and reporting of IRRBB.
Measurement The Group has been accredited by APRA to use its internal models for IRRBB. The Group employs VaR as one of its principal measures for interest rate risk, along with EaR measure that calculates the impact on future net interest income over the next 12 months. Economic Value Sensitivities (“EVS”) are measured to identify potential impact of interest rate changes on the calculated net present value of the banking book. To complement the static VaR and EaR metrics, a series of stress tests, including a break down of key modelling assumptions and yield curve shock scenarios, are modelled and reported to Regional and Group ALCO by Group Non Traded Market Risk (“GNTMR”).
For measuring IRRBB the Group takes into consideration: - Prepayments
o A constant prepayment rate based on historical prepayment rates analysis,
o The variability of the customer behaviour, o The expected prepayment rate, which is
incorporated in repricing and yield curve risk, and
o The variability of expected prepayment, which is incorporated in Optionality Risk.
- Non-bearing interest (non-maturity deposits) o Core/non-core spot balance approach,
combining the expected behavioural term and variance around the expected behavioural term using historical data,
- Rate locks o Modelled as Delta equivalent volume of linear
forward start amortising swaps, and
- Basis o Movement in OIS/bills basis and risk due to
lead/lag effects.
Monitoring and Reporting IRRBB is measured and monitored on a daily basis with exceptions reported to the Group Chief Risk Officer. Monthly results are also submitted for inclusion in the GCRO report which is tabled when the PBRC convenes.
Interest Rate Risk in the Banking Book [APS 330 Table 14b]
This table provides the increase or decrease in earnings or economic value for upward and downward rate shocks broken down by currency. As at 30 September 2008
200 bp
parallel increase
200 bp parallel
decrease $m $m Change in economic value (1) AUD (215) 217CAD - -CHF - -EUR - -GBP (58) 68HKD - -JPY - -NZD (26) 27SGD - -USD 2 (2)Other - -Total change in economic value (297) 310
(1) The Group’s ten major currencies are modelled on an individual basis. The remaining immaterial currencies are aggregated and modelled using a single yield curve.
Interest Rate Risk in the Banking Book – Total Risk Weighted Assets
As at 30 September 2008 $m IRRBB risk weighted assets 4,643
% of total Group (level 2) RWA 1.3%
All components of IRRBB regulatory capital are calculated using a historical VaR simulation using at least 8 years of historical data at a 99% confidence level, one year investment term of capital and a 12 month holding period.

Non Traded Market Risk
55
Funding and Liquidity Risk Introduction
Liquidity risk is the risk that the Group is unable to meet its financial obligations as they fall due at acceptable costs. These obligations include capital and interest payments on existing transactions and future commitments.
Funding risk is the risk arising due to change in appetite and capacity of the market to provide adequate term and short term funds to meet the National’s strategic plans and objectives at an acceptable cost. This includes the risk of over-reliance on any source of funding to the extent that a lack of diversified funding sources jeopardises the ability to raise funds at acceptable costs under diverse business conditions.
The objectives of the Group in managing its funding and liquidity risks are: - to ensure that the current and future payment
obligations of the Group are met as they become due,
- to retain confidence in its liquidity and funding compliance and management framework with external and internal stakeholders,
- to retain adequate liquidity buffers in the Group and Regional Balance Sheets so as to withstand severe market and institutional disruptions,
- to meet planned business funding needs over a 3 year forward horizon,
- to maintain sufficient unused market capacity above that required to fund above- forecast asset growth and provide for acquisition funding if required, and
- to maintain access to global short and long term debt capital markets consistent with the target credit ratings of the Group and its subsidiaries.
Management The Group manages Funding and Liquidity Risk within its established three lines of defence framework, with control exercised through clearly-defined delegation of authority, with clear communication and escalation channels throughout the organisation. The Group policies on Funding Risk and Liquidity Risk set out the approach and policy framework for the management and reporting of Funding and Liquidity risk.
Liquidity risk is managed within a defined global risk appetite and by regional management based on cumulative cash flow mismatch, gap analysis, stress tests and scenario analysis.
The Board endorses a Group Annual Funding Plan and an effective management and reporting framework (including all liquidity requirements). Target funding indices are set by Group Asset and Liability Committee (“GALCO”) at both Group and subsidiary levels and communicated to the Board in the annual funding plan. The annual funding plan includes wholesale market capacity to cover for unplanned asset growth or deposit shortfalls.
Measurement Liquidity Risk is measured, managed and monitored on a cash flow basis, using appropriate scenario analysis and
stress testing. Key scenarios include a name crisis and the continuation of current market disruption. The liquidity measurement also addresses all regulatory requirements.
Although managed on an individual currency basis, operational liquidity is measured and reported in accordance with cumulative cash flow mismatch limits. Mismatch limits are set as a percentage of total liabilities and are established (with some minor exceptions) for defined timing buckets, and scenarios. Concentration levels of funding sources, investor base, and maturity term are monitored by Group Treasury to avoid excessive concentration. Regional Treasuries also monitor term wholesale funding positions.
Monitoring and Reporting
Funding and Liquidity risk is measured and monitored on a daily basis with any non-compliance immediately escalated to the GALCO and Group Chief Risk Officer (“GCRO”). Monthly results are included in the GCRO report, which is tabled when PBRC convenes.

Attachment B Disclosures
56
Attachment B Disclosures
Scope of Application The corporate entity in the Level 2 group to which this disclosure applies is National Australia Bank Limited, incorporating National Australia Bank Limited and the entities it controls.
Capital Structure [APS 330 Table 15a – c] (1)
As at 30 September 2008 $m Tier 1 capital Paid-up ordinary share capital 11,304Reserves 443Retained earnings 13,071Current year earnings 3,138Minority interests 56Innovative Tier 1 capital 3,780Non-innovative Tier 1 capital 2,242Gross Tier 1 capital 34,034
Deductions from Tier 1 capital Banking goodwill 1,333Wealth management goodwill and other intangibles 3,895Deferred tax assets 908Other deductions from Tier 1 capital only 1,57350/50 deductions from Tier 1 capital
Investment in non-consolidated controlled entities 575Expected loss in excess of eligible provisions 303Deductions relating to securitisation 204Other 50/50 deductions from Tier 1 capital -
Total Tier 1 capital deductions 8,791
Net Tier 1 capital 25,243
Tier 2 capital Upper Tier 2 capital 780Lower Tier 2 capital 12,696Gross Tier 2 capital 13,476
Deductions from Tier 2 capital Deductions from Tier 2 capital only 7550/50 deductions from Tier 2 capital
Investment in non-consolidated controlled entities 575Expected loss in excess of eligible provisions 303Deductions relating to securitisation 204Other 50/50 deductions from Tier 2 capital -
Total Tier 2 capital deductions 1,157
Net Tier 2 capital 12,319
Total capital 37,562
(1) Regulatory Capital has been calculated in accordance with APRA definitions in Prudential Standard APS 111 Capital Adequacy: Measurement of Capital. The regulatory approach to calculating capital is different to the accounting approach as defined under AIFRS.

Attachment B Disclosures
57
Capital Adequacy [APS 330 Table 16a – e]
As at 30 September 2008
Risk
weighted assets
$m Credit risk (1)
Australian and foreign governments (class II) 534Bank (class III) 306Residential mortgage (class IV) 18,073Corporate 40,008Other 9,573
Total standardised approach 68,494Corporate (including SME) 149,395Specialised lending (SL) exposures subject to slotting criteria (2) 14,675Sovereign -Bank 11,482Residential mortgage 44,977Qualifying revolving retail 4,537Other retail 2,966Other 6,965
Total IRB approach (3) 234,997RWAs relating to securitisation exposures 5,983RWAs relating to equity exposures 657Market risk (4) 5,088Operational risk 23,649Interest rate risk in the banking book 4,643
Total risk weighted assets 343,511
Capital ratios (5) Level 2 total capital ratio 10.9%Level 2 Tier 1 capital ratio 7.3%
(1) Risk Weighted Assets which are calculated in accordance with APRA's requirements under Basel II, are required to incorporate a scaling factor of 1.06 to assets that are not subject to specific risk weights.
(2) Specialised lending includes the four sub-classes: Project Finance, Object Finance, Commodities Finance and Income Producing Real Estate.
(3) For IRB approach; Corporate includes all corporate credit exposures. Bank includes ADIs, overseas banks, non-commercial public sector entities. Residential mortgage includes exposures that are partly or fully secured by residential properties. Qualifying revolving retail exposures are revolving, unsecured and unconditionally cancellable (both contractually and in practice), for individuals and not explicitly for business purposes. Other includes all exposures not covered in the above categories.
(4) Market Risk numbers reflect RWA under the previous APS 113. Group has submitted its self assessment pursuant to the ADI Prudential Standard 116 (APS 116) and related Prudential Practice Guide (APG 116). This submission was in fulfilment of an APRA requirement whereby ADIs with internal model approval under the previous APS 113 were required to submit to APRA a written self-assessment against APS 116 by 1 October 2008.
(5) The Level 2 group represents the consolidation of Group and its subsidiary entities, other than non-consolidated subsidiaries as outlined under Table 1.
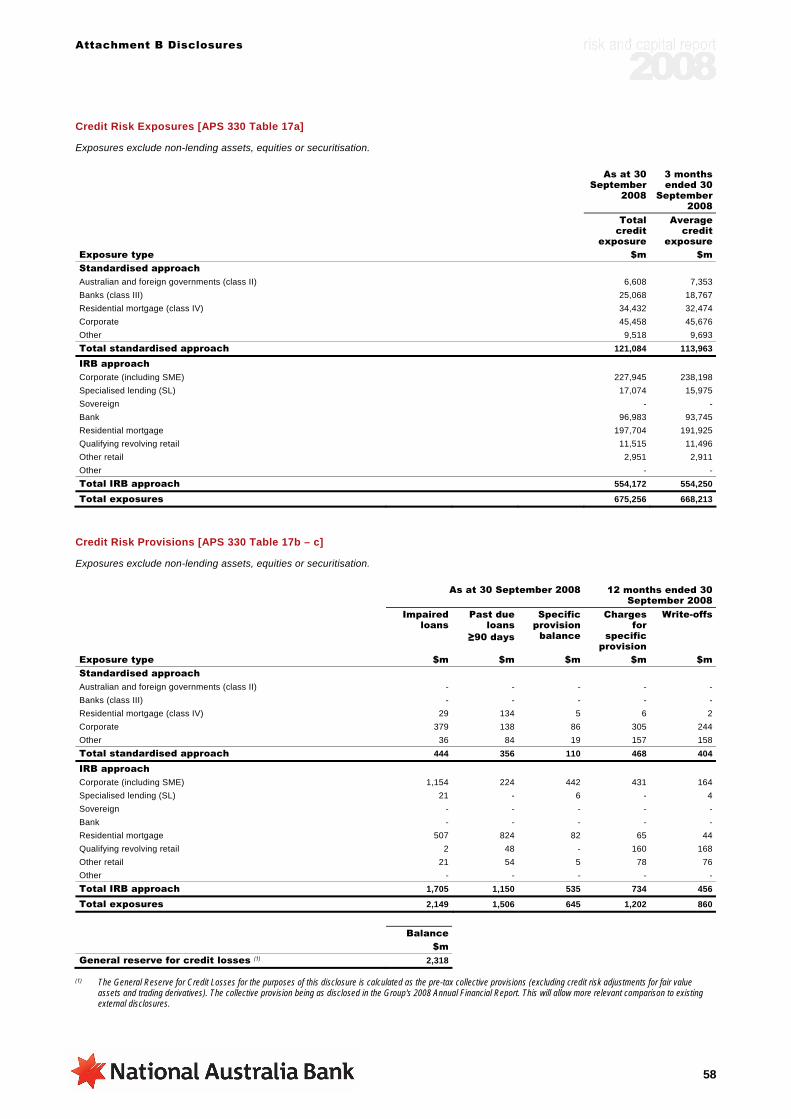
Attachment B Disclosures
58
Credit Risk Exposures [APS 330 Table 17a]
Exposures exclude non-lending assets, equities or securitisation.
As at 30 September
2008
3 months ended 30
September 2008
Total credit
exposure
Average credit
exposure Exposure type $m $m Standardised approach Australian and foreign governments (class II) 6,608 7,353Banks (class III) 25,068 18,767Residential mortgage (class IV) 34,432 32,474Corporate 45,458 45,676Other 9,518 9,693Total standardised approach 121,084 113,963
IRB approach Corporate (including SME) 227,945 238,198Specialised lending (SL) 17,074 15,975Sovereign - -Bank 96,983 93,745Residential mortgage 197,704 191,925Qualifying revolving retail 11,515 11,496Other retail 2,951 2,911Other - -Total IRB approach 554,172 554,250
Total exposures 675,256 668,213
Credit Risk Provisions [APS 330 Table 17b – c]
Exposures exclude non-lending assets, equities or securitisation. As at 30 September 2008 12 months ended 30
September 2008 Impaired
loans Past due
loans ≥90 days
Specific provision
balance
Charges for
specific provision
Write-offs
Exposure type $m $m $m $m $m Standardised approach Australian and foreign governments (class II) - - - - -Banks (class III) - - - - -Residential mortgage (class IV) 29 134 5 6 2Corporate 379 138 86 305 244Other 36 84 19 157 158Total standardised approach 444 356 110 468 404
IRB approach Corporate (including SME) 1,154 224 442 431 164Specialised lending (SL) 21 - 6 - 4Sovereign - - - - -Bank - - - - -Residential mortgage 507 824 82 65 44Qualifying revolving retail 2 48 - 160 168Other retail 21 54 5 78 76Other - - - - -Total IRB approach 1,705 1,150 535 734 456
Total exposures 2,149 1,506 645 1,202 860
Balance $m General reserve for credit losses (1) 2,318
(1) The General Reserve for Credit Losses for the purposes of this disclosure is calculated as the pre-tax collective provisions (excluding credit risk adjustments for fair value assets and trading derivatives). The collective provision being as disclosed in the Group's 2008 Annual Financial Report. This will allow more relevant comparison to existing external disclosures.
59
Glossary
Term Description
ACE Adjusted Common Equity (“ACE”) is a term used to describe an alternative approach to measuring Tier One regulatory capital, often used by ratings agencies. ACE includes common equity and retained profits, and deducts goodwill, asset revaluation reserves, investment in unconsolidated subsidiaries, deferred taxes, and tier one adjustments required by regulators and minority interests.
ADI Authorised Deposit-taking Institution (“ADI”) as defined by the Australian Prudential and Regulatory Authority (“APRA”), and authorised by APRA to take deposits from customers.
Advanced IRB approach The advanced Internal Ratings Based (“IRB”) approach refers to the processes employed by the Group to estimate credit risk. This is achieved through the use of internally developed models to assess potential credit losses using the outputs from the PD, LGD and EaD models
AGS 1008 Auditing and Assurance Guidance Statement (“AGS”) 1008 defines the audit implications of prudential reporting requirements for ADIs.
AMA Advanced Measurement Approach (“AMA”) is the risk estimation process used for the Group’s operational risk. It combines internally developed risk estimation processes with an integrated risk management process, embedded within the business with loss event management.
APRA The Australian Prudential Regulation Authority (“APRA”) is the prudential regulator of the Australian financial services industry. APRA has defined its Basel II requirements in a series of Australian Prudential Standards (“APS”).
APS 111 APS 111 refers to APRA’s prudential standard that defines the approach to be used in measuring Basel II capital for an ADI.
APS 120 APS 120 refers to APRA’s prudential standard that defines the expectations for the management of an ADI’s risk in the area of funds management and securitisation.
APS 330 APS 330 refers to APRA’s prudential standard which defines the requirements for the public disclosure of capital adequacy for a Basel II accredited ADI.
Back testing Back testing refers to the process undertaken to monitor performance of the Group’s risk models. Historical data is used to compare the actual outcomes to the expected outcomes.
Basel II Framework (Basel II or the Framework)
Basel II is the common term for the “International Convergence of Capital Measurement and Capital Standards: A Revised Framework” published in June 2004 by Bank for International Settlements (“BIS”). It defines the minimum standard for the assessment of capital adequacy and capital requirements, to be adopted by banking regulators as a replacement for the Basel I 1998 Accord on capital. Basel II has been adopted by the majority of banking regulators in the major markets in which the Group operates, via prudential standards issued by the regulators. Requirements for Basel II accreditation, and approach to the calculation of Basel II capital can, and do, vary in different regulatory jurisdictions.
BIPRU BIPRU refers to the UK Financial Services Authority’s requirements and guidance for accreditation under Basel II. It refers to the Prudential Sourcebook for Banks, Building Societies and Investment Firms.
BIS The Bank for International Settlements (“BIS”), located in Basel, Switzerland, is an international organisation which fosters international monetary and financial cooperation and serves as a bank for central banks. Established on 17 May 1930, the BIS is the world's oldest international financial organisation. Members are the central banks or monetary authorities of: Algeria, Argentina, Australia, Austria, Belgium, Bosnia and Herzegovina, Brazil, Bulgaria, Canada, Chile, China, Croatia, the Czech Republic, Denmark, Estonia, Finland, France, Germany, Greece, Hong Kong SAR, Hungary, Iceland, India, Indonesia, Ireland, Israel, Italy, Japan, Korea, Latvia, Lithuania, the Republic of Macedonia, Malaysia, Mexico, the Netherlands, New Zealand, Norway, the Philippines, Poland, Portugal, Romania, Russia, Saudi Arabia, Singapore, Slovakia, Slovenia, South Africa, Spain, Sweden, Switzerland, Thailand, Turkey, the United Kingdom and the United States, plus the European Central Bank.
Capital adequacy Capital adequacy is the outcome of identifying and quantifying the major risks the Group is exposed to, and the capital that the Group determines as an appropriate level to hold for these risks, as well as its strategic and operational objectives, including its target credit rating.
Credit derivatives Credit derivatives include single-name credit defaults and certain total rate of return swaps, cash funded credit linked notes and first and second to default credit derivative basket products. ADIs may also recognise any more complex credit derivatives that do not fall into the list above, that have been approved by APRA..
EaD Exposure at Default (“EaD”) is an estimate of the total committed credit exposure expected to be drawn at the time of default for a customer or facility that the Group would incur in the event of a default within the next 12 months. It is used in the calculation of regulatory capital.
ECAI External Credit Assessment Institutions Economic capital Economic capital represents the Group’s internal assessment of the amount of capital required to protect against
potential unexpected future losses arising from its business activities, in line with its target credit rating. ELE The Extended License Entity (“ELE”) comprises the ADI itself and any APRA approved subsidiary entities assessed as
effectively part of a single ‘stand-alone’ entity, as defined in APS 110. Eligible financial collateral Eligible financial collateral, under the standardised approach, will be the amount of cash collateral, netting and eligible
bonds and equities. Eligible financial collateral, under the IRB approach, for corporate, sovereign and bank portfolios, is limited to the collateral items detailed in paragraphs 4 and 23 of Attachment G of APS 112. Recognition of eligible financial collateral is subject to the minimum conditions detailed in that same Attachment, paragraph 6. Eligible financial collateral for retail portfolios are not applicable to this disclosure.
Economic value sensitivities Economic value sensitivities (“EVS”) refers to a modelling technique whereby the value of an asset is assessed through a number of different scenarios, such as different interest rates or period in time for loan repayment. This allows the Group to establish a price with some degree of certainty across the various scenarios and develop risk management techniques to protect the assets value.
Foundation IRB Foundation Internal Ratings Based (“FIRB”) approach refers to an alternative approach to advanced IRB defined under Basel II where a Group develops its own PD models and seeks approval from its regulator to use these in the calculation of regulatory capital, and the regulator provides a supervisory estimate for LGD and EaD.
GRMC Group Risk Management Committee Group Credit Risk Includes Group Credit Policy and Counterparty Credit, Group Credit Portfolio and Models and Strategic Business
Services.
60
Term Description
Guarantees Guarantors under the standardised approach are recognized according to APS 112 Attachment F paragraph 3. The secured portion of an exposure is weighted according to the risk weight appropriate to the guarantor and the unsecured portion is weighted according to the risk weight applicable to the original counterparty (Refer to Attachment A for the appropriate risk weights). Under the IRB approach, for corporate, sovereign and bank portfolios, the ADI may recognise credit risk mitigation in the form of guarantees and credit derivatives according to the FIRB substitution approach where an ADI uses supervisory estimates of LGD (refer to APS 113 Attachment B paragraph 49), an AIRB substitution approach where the ADI has approval from APRA to use its own estimates of LGD (refer to APS 113 Attachment B paragraph 60) and, for certain exposures, a double default approach (refer to APS 113 Attachment B paragraph 67). An ADI may decide, separately for each eligible exposure, to apply either the relevant substitution approach or the double default approach. For retail portfolios there are two approaches for the recognition of credit risk mitigation in the form of guarantees and credit derivatives under the retail IRB approach, a substitution approach (refer to APS 113 Attachment C paragraph 19) and, for certain exposures, a double default approach (refer to APS 113 Attachment C paragraph 28). An ADI may decide separately for each eligible exposure to apply either the substitution approach or the double default approach.
Guidance Notes AGN 120:3 Australian Prudential Authority’s Guidance Note AGN 120.3 details the requirements for an ADI to obtain a “clean sale” and as a result regulatory capital relief.
ICAAP Internal Capital Adequacy Assessment Process (ICAAP) is the mechanism developed and used by the Group to determine capital requirements as outlined under Basel II. It results in the Group identifying and assessing all risks to which it is exposed and allocating an appropriate level of capital to each.
IFRS / AIFRS The International Financial Reporting Standards (“IFRS”) and the Australian equivalent (“AIFRS”) define the accounting standards and provide guidance under which the Group’s financial accounts are prepared.
IMA Internal Model Approach (“IMA”) describes the approach used in the assessment of traded market risk. The Group uses, under approval from APRA, the IMA to calculate general market risk for all transactions in the trading book other than those covered by the Standard Method.
IRB
Internal Ratings Based (“IRB”) describes the approach used in the assessment of credit risk. Within this document it is used interchangeably with the term advanced Internal Ratings Based approach. This reflects the Group’s development of internal credit risk estimation models covering both retail and non retail credit.
IRRBB Interest Rate Risk in the Banking Book (“IRRBB”) quantifies the inherent risk arising from the Group’s banking operations as a result of movements in interest rates. This also includes the impact of differing maturities between assets and liabilities. Quantification of the resulting risk is used in determining capital adequacy.
LGD Loss Given Default (“LGD”) is an estimate of the expected severity of loss for a credit exposure following a default event. Regulatory LGDs reflect a stressed economic condition at the time of default. It is used in the calculation of regulatory capital.
LGR Loss Given Realisation (“LGR”) is a parameter used for estimating LGD. Loan to value ratio Loan to Value Ratio (“LVR”) is the ratio between the loan and value of the security provided. Masterscale Masterscale is a consistent series of grades applied to credit exposures that allows the Group to place every credit
exposure into a specific grade or range that represents the likelihood of a credit default. This allows comparison of customers and portfolios.
Monte Carlo Simulation A sophisticated mathematical method of random sampling of thousands of possible outcomes to define a solution to a mathematical problem. Monte Carlo simulation is widely used in the financial services industry for operational risk modelling and market risk modelling.
Non retail credit Non retail credit broadly refers to credit exposure to business customers. It excludes retail credit defined below. Non traded book Non traded book refers to the investment in securities held by the Group through to maturity. Other eligible collateral Other eligible collateral includes claims secured by commercial or residential real estate as per APS 113 Attachment B
paragraph 11 and claims secured by eligible financial receivables as per APS 113 Attachment B paragraph 15. PBRC Principal Board Risk Committee PD Probability of Default (“PD”) is an estimate of the likelihood of a customer defaulting or not repaying their borrowings
and other obligations to the Group in the next 12 months. Point in time Point in Time (“PiT”) within this document refers to risk models that estimate the likelihood of default and resulting loss
over a 12 month period having regard to the current economic conditions. Qualifying revolving retail exposures For the purposes of regulatory reporting, credit cards are referred to as qualifying revolving retail. Regulatory capital
Regulatory capital is the total capital held by the Group as a buffer against potential losses arising from the business the Group operates in. Unlike economic capital, it is calculated based on guidance and standards provided by the Group’s regulators, including APRA. It is designed to support stability in the banking system and protect depositors.
Regulatory expected loss Regulatory Expected Loss (“EL”) is a calculation of the estimated loss that may be experienced by the Group over the next 12 months. Regulatory EL calculations are based on the PD, LGD and EAD values of the portfolio at the time of the estimate, which include stressed LGDs for economic conditions As such, regulatory EL is not an estimate of long-run average expected loss (as was the case previously under dynamic provisioning).
Retail credit For the purposes of managing credit, two broad categories are used: retail credit and non retail credit. This reflects the different approaches to the sales and ongoing management of credit and is consistent with the approach taken by Basel II. Retail credit refers to the credit provided to retail or personal customers. For the purposes of regulatory capital, retail credit is categorised into three groups: residential mortgages, credit cards (or qualifying revolving credit) and other.
Risk appetite Risk appetite defines the level of risk the Group is prepared to accept as part of its business. The resulting level of risk is a direct input into the Group’s capital requirements.
RWA Risk Weighted Assets (“RWAs”) is an estimate of the Group’s banking assets after allowance for the likelihood of loss within the next 12 months.
Special purpose vehicles Special Purpose Vehicles (“SPVs”) are companies that have been established for a special purpose. Within the context of this report SPVs refer to those companies established to house assets securitised by the Group.
Standardised approach Standardised refers to an alternative approach to the assessment of risk (notably credit and operational) whereby the institution uses external rating agencies to assist in assessing credit risk and/or the application of specific values provided by regulators to determine risk weighted assets.
Stress testing Stress testing refers to a technique whereby the Group’s capital position is assessed against a number of different scenarios used to determine the movement on expected losses and subsequent impact on capital.
The Group As per the definition in the Scope of Application.

61
Term Description
Three lines of defence Three lines of defence is the Group’s a risk management technique, which ensures there is at least three areas monitoring, reviewing and assessing a given risk type. The first line of defence is the business unit. Behind this front line, support functions such as finance, risk and legal act as a second line of defence. Internal audit provides the third and final line of defence.
Through the cycle Through the Cycle (“TtC”) within this document refers to risk models that estimate the likelihood of default and resulting loss over a 12 month period having regard to the impact of an economic downturn.
Tier 1 capital Tier 1 capital comprises the highest quality components of capital that fully satisfy all of the following essential characteristics: provide a permanent and unrestricted commitment of funds; are freely available to absorb losses; do not impose any unavoidable servicing charge against earnings; and rank behind the claims of depositors and other creditors in the event of winding-up.
Tier 2 capital Tier 2 capital includes other components of capital that, to varying degrees, fall short of the quality of Tier 1 capital but nonetheless contribute to the overall strength of an entity as a going concern. It is divided into: Upper Tier 2 capital comprising components of capital that are essentially permanent in nature, including some forms of hybrid capital instrument; and Lower Tier 2 capital comprising components of capital that are not permanent.
Traded book Traded book refers to the Group’s investment portfolio that is traded or exchanged in the market from time to time that reflects market opportunities.
Value at Risk Value at Risk (“VaR”) is a mathematical technique that uses statistical analysis of historical data to estimate the likelihood that a given portfolio’s losses will exceed a certain amount. Using a minimum of one year’s historical data, VaR calculates the potential loss in earnings from adverse market movements, over a one-day time horizon, using a 99% confidence level.

62
This page has been left blank intentionally

63
www.nabgroup.com