Embed Size (px)
Citation preview

1
National Bank of Poland
Monetary Policy Council
Report on monetary policy
implementation in 2005
Warsaw, May 2006
2
Table of contents 1. Monetary policy strategy in 2005 ..............................................................................................3
2. Monetary policy in 2005 ...........................................................................................................7
3. Monetary policy instruments ...................................................................................................13
3.1 Liquidity surplus in the banking sector..................................................................................13
3.2 Monetary policy instruments .................................................................................................13
3.2.1 Interest rates ...................................................................................................................13
3.2.2 Open market operations..................................................................................................15
3.2.3 Required reserves ...........................................................................................................17
3.2.4 Standing facilities...........................................................................................................18
3.2.5 Other operations .............................................................................................................19
Appendix 1. GDP and final demand................................................................................................20
Appendix 2. Prices of consumer goods and services .......................................................................24
Appendix 3. Balance of payments...................................................................................................29
Appendix 4. Money supply .............................................................................................................33
Appendix 5. Inflation projections of the NBP .................................................................................42
Appendix 6. Voting records of Monetary Policy Council members on motions and resolutions in
2005................................................................................................................................................45

3
1. Monetary policy strategy in 2005
The present report is concerned with the implementation of the monetary policy in 2005, the
guidelines for which were formulated in the document Monetary Policy Guidelines for the Year
2005.
Pursuant to Article 227, Paragraph 1 of the Constitution of the Republic of Poland "The
National Bank of Poland shall be responsible for the value of the Polish currency”. The Act on the
National Bank of Poland of 29 August 1997 in Article 3 states that „the basic objective of NBP
activity shall be to maintain price stability, and it shall at the same time act in support of
Government economic policies, insofar as this does not constrain pursuit of the basic objective of
the NBP”.
At present, central banks understand price stability as an inflation rate that is low enough not
to negatively affect investment, savings and other important decisions taken by economic agents.
Ensuring so understood price stability is the basic way in which a central bank contributes, through
its decisions, to the achievement of a high and sustainable economic growth.
The Monetary Policy Council (MPC) bases its policy on direct inflation targeting strategy
(DIT). International experience shows that such a strategy is an effective means of ensuring price
stability. In the Monetary Policy Strategy beyond 2003, accepted in February 2003, the MPC
adopted the so-called permanent inflation target at the level of 2.5% with a symmetrical tolerance
band for deviations of +/- 1 percentage point. In February 2004, the current MPC confirmed the
fundamental elements of the Monetary Policy Strategy beyond 2003, namely, the level of inflation
target, the width of the tolerance band and the maintenance of the floating exchange rate regime
until Poland’s entry to ERM II.
The Council has emphasised on many occasions that the implementation of an economic
strategy focused on creating conditions which would ensure the introduction of the euro at the
earliest possible date would be most favourable for Poland and would contribute to a higher long-
term economic growth.
In the Monetary Policy Guidelines for the Year 2005, the Council explained how it
understood the inflation target and the way of its implementation:

4
• First, the notion of permanent target means that it refers to year-on-year inflation measured each
month in relation to the corresponding month of the previous year, as opposed to the 1999-2003
practice of measuring inflation only once a year – in December (in relation to December of the
previous year). The permanent target will remain in force until Poland joins ERM II or till the end of
term of the present MPC.
• Second, the Central Statistical Office (GUS) presents data on inflation in the form of indicators
calculated as the change in the prices of consumer goods and services (CPI) in a given month in
relation to the corresponding month of the previous year. This measure is the main basis for
interpreting the inflation target. However, for better understanding of inflation developments it is
also justified to apply quarterly and average annual inflation indices, such as those used in the
NBP’s inflation projection1 or in the central budget. The use of quarterly indicator is motivated by
the fact that the inflation projection, which is a very important point of reference for MPC decisions,
makes it possible to assess probable inflation deviations from the target on a quarterly basis. The
reasons to use the average annual indicator are as follows: (a) it eliminates temporary, accidental
deviations from the inflation target; (b) some important variables are presented in this form in the
inflation projection; and (c) it is used in the budget forecast and other government documents and
programmes.
• Third, the adopted solution means that the monetary policy is unequivocally focused on
maintaining inflation as close as possible to the level of 2.5% and not only within the tolerance
range. This is a different approach than the one pursued in a number of countries where the inflation
target is defined as a range without a central value. The adopted solution provides better anchoring
for inflation expectations.
• Fourth, inflation fluctuations within the band should be treated as a natural consequence of minor
shocks and business cycle factors. It can be assumed that these fluctuations are compensated in the
longer term and so do not normally require any action on the part of monetary authorities.
Nevertheless, in the case of unexpected and strong shocks pushing inflation out of the tolerance
band, the reaction of the central bank may be required.
1 Inflation projections are forecasts of inflationary processes in the Polish economy drawn up on the assumption of interest rates kept unchanged in the projection horizon. Projections are prepared on a quarterly basis by NBP economists using the econometric model ECMOD. Since August 2004, inflation projections are published in Inflation Reports (projection based on ECMOC model was first published in the November 2004 Report). See: information in Appendix 5: Inflation projections of the NBP.

5
• Fifth, monetary policy reaction to unexpected shocks will depend on their strength and character
and also on the degree of inertia of inflation expectations. The reaction to demand shocks is a
relatively minor problem, as in such a case inflation and output move in the same direction. An
increase in interest rates, accompanied by inertial inflation expectations, weakens the economic
activity and, in a longer perspective, inflationary pressure. Supply shocks are much more difficult to
cope with. The main problem is that in the case of supply shocks, output and inflation move in
opposite directions, as it was the case during the oil shocks of the 1970s. In their aftermath, there
was a surge in inflation in many countries and a parallel decline in output resulting from increased
costs. Inappropriate monetary policy reaction may have far-reaching negative consequences for the
economy. An attempt to fully neutralise the impact of a supply shock may lead to an excessive loss
in output, as the supply shock has in itself a negative effect on demand and investment. On the other
hand, striving to fully accommodate a supply shock leading to price increases and output reduction –
by pursuing too expansionary monetary policy – usually leads to an acceleration in inflation, which,
in turn, requires a far more restrictive monetary policy in the subsequent periods, resulting in a
relatively strong deceleration of economic growth.
• Sixth, supply shocks are usually transitory and limited in scale. Thus, they do not require
immediate reaction. However, in the case of strong shocks even temporary acceleration in price
growth may bring about a permanent rise in inflation expectations and, in turn, a further increase in
inflation due to building wage pressure. In such a situation, monetary policy should prevent
secondary effects of the supply shock (the so-called second-round effects). In countries with a short
history of low inflation the risk of such effects is substantial. Very useful in analysing supply shocks
are core inflation indices, which make it possible to distinguish, at least roughly, temporary changes
in inflationary pressure from the permanent ones.
• Seventh, because of delayed reaction of output and inflation to monetary policy, its influence on
the current inflation is limited. Any current action of the central bank affects price developments in
the future, just as the current inflation is influenced by interest rate changes made several quarters
before. Unfortunately, these lags are not constant and depend, to a large extent, on structural and
institutional changes in the economy. Changes in the transmission mechanism result in a situation
where central banks can only approximately assess the time lag between a decision and its strongest
observed impact on real variables (output, employment) and then on inflation.
• Eighth, monetary policy affects the economy not only through changing interest rates but also by
keeping them unchanged for a period of time. Lack of decision on interest rate level for several
6
periods (months or quarters) is also a decision which has substantial consequences for the economy,
whenever it leads to a gradual widening or narrowing of the output gap.
• Ninth, monetary policy is conducted under high uncertainty, which means, inter alia, that the
model utilised by the central bank for projecting inflation may not fully reflect the consequences of
structural changes taking place in the economy. This means that (a) while making decisions, it is
necessary to take into account all available information and not only the inflation projection; (b) it is
not possible to adopt a simple policy rule which could be known ex ante to market participants; and
(c) a forward-looking monetary policy has to be presented to the public as an attempt to balance risk
factors associated with achieving the inflation target, rather than as an attempt to control economic
processes.
• Tenth, in assessing the stance of monetary policy, not only the level of real interest rates should be
considered, but also the level of the real exchange rate.
7
2. Monetary policy in 2005
In view of the fact that the time elapsing between interest rate decisions and their strongest
impact on inflation extends from five to seven quarters, inflationary processes in 2005 were largely
affected by the monetary policy pursued in the years 2003-2004. In turn, the monetary policy
conducted in 2005 will, for the most part, influence inflationary processes in 2006 and 2007.
A correct monetary policy is a forward-looking one. Therefore, inflation projections are
treated as one of the inputs to monetary policy decisions. Such approach is characteristic of central
banks pursuing the DIT strategy. An important point of reference for the monetary policy under this
strategy is an interest rate level favouring medium-term stabilisation of inflation at the target level.
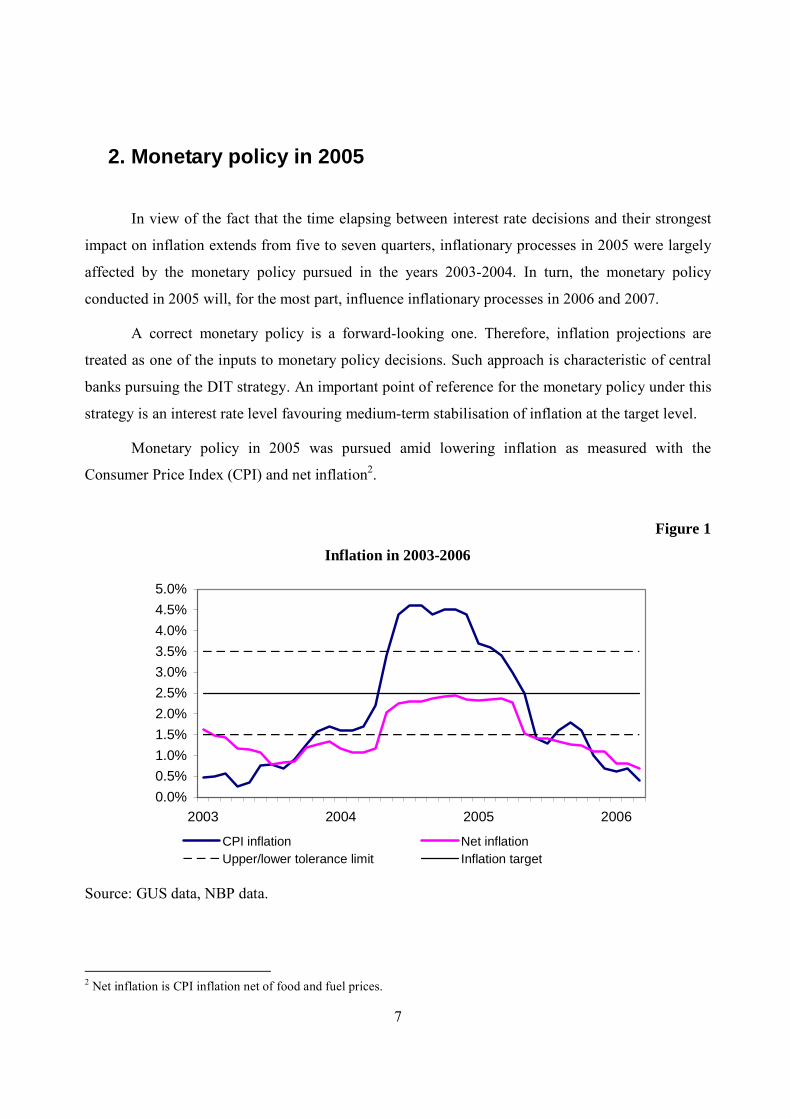
Monetary policy in 2005 was pursued amid lowering inflation as measured with the
Consumer Price Index (CPI) and net inflation2.
Figure 1
Inflation in 2003-2006
0.0%0.5%1.0%1.5%2.0%2.5%3.0%3.5%4.0%4.5%5.0%
2003 2004 2005 2006
CPI inflation Net inflationUpper/lower tolerance limit Inflation target
Source: GUS data, NBP data.
2 Net inflation is CPI inflation net of food and fuel prices.
8
In 2005 the annual average CPI inflation reached 2.1% and was lower than all available
external forecasts prepared in 2004 and 2005. The annual CPI inflation fell from 3.7% in January to
0.7% in December, while the net inflation indicator fell from 2.3% to 1.0% respectively.
This strong decline in both inflation measures was largely driven by the fading-away of a
temporary increase in inflation in 2004, connected with Poland's entry to the European Union. The
reasons behind the temporary increase in inflation include a rise in indirect taxes to the levels
consistent with EU requirements3 and a surge in foreign demand for Polish food products. Besides,
the year 2004 marked considerable price increases in the world energy and industrial commodity
markets (e.g. crude oil, coal and copper).
Low inflation in 2005 also stemmed from strong appreciation of the zloty in 2004 (14%
against the euro and 20% against the US dollar) and was achieved amid lower than forecast public
finance deficit in 2005.
Fading-out of the accession shock impacted the inflation indicator mainly in the first half of
2005. This was reflected in CPI inflation matching net inflation level. On the other hand, 2005 Q3
was marked by CPI inflation rising above net inflation, mainly as a result of a rapid oil price
increase in the world markets. CPI inflation falling below net inflation in 2005 Q4 was, in turn, the
result of decreasing food prices and lower distribution margins in fuel markets.
* * *
Relatively low growth rate of wages and prices at the end of 2004 indicated that inflation
acceleration in the aftermath of the EU accession shock had not become a factor automatically
accelerating wage growth, and, as a result, stimulating inflation. This created an opportunity for
lowering interest rates to the level close to that maintained before the 2004 increases. Those
increases were supposed to prevent a situation where temporarily heightened inflation expectations
could drive up inflation permanently if taken into account in wage negotiations and futures contracts
(the so-called second-round effects).
Lack of second-round effects, a lower than expected rise in domestic demand in 2004 Q4
and a considerable decline in inflation at the turn of 2004 and 2005 were the signals indicating that
the period of the accession effect, reflected in the 12-month CPI surge, would be followed by a
relatively strong drop in current inflation. This induced the MPC to change its monetary policy bias 3 VAT rates (among other things on construction materials, children’s apparel) and excise rates (on tobacco products) were increased.

9
into easing in February 2005, followed by two subsequent cuts in interest rates, each time by 50
basis points, in March and April 2005. As a result, NBP reference rate was lowered from 6.5% to
5.5%.
In April 2005, the MPC changed its monetary policy bias from easing to neutral. The
Council assessed that, in the medium term, the then prevailing interest rate level should ensure
inflation close to the target and favour GDP close to its potential level i.e. such that triggers neither
rise nor drop in inflation. This assessment was corroborated with the results of the May inflation
projection.
The Council’s decisions to change the monetary policy bias were motivated by the need to
pursue a forward-looking monetary policy, taking account of time lags between interest rate
decisions and their most powerful impact on inflation. In particular, the Council adopted an easing
monetary policy bias in February 2005, although the current inflation was largely above the upper
tolerance limit for deviations from the target. Likewise, in April 2005, when taking the decision to
shift into a neutral monetary policy bias, the Council forecasted that subsequent quarters will
probably see inflation running below the target, mainly as a result of a strong drop in the growth rate
of food prices. The Council assessed, however, that due to the gradual closing-up of the output gap
and the impact of high crude oil prices on inflation and economic growth, the probabilities of price
growth rate moving above and below the target were comparable in the longer term.
Based on the May 2005 inflation projection, the MPC set the NBP reference rate at the level
driving inflation back to target in the monetary policy horizon. However, the economic data flowing
in from June to August showed that the rate of economic growth and, as a result, inflationary
pressure in 2005 may in fact be considerably lower than those accounted for in the May inflation
projection. In view of these data, in June 2005 the MPC changed its monetary policy bias from
neutral to easing and lowered the NBP reference rate by 50 basis points to the level of 5.0%.
In July, the analysis of available data allowed an assessment that GPD growth in 2005 Q2,
albeit stronger than in the preceding quarter, was considerably weaker than that accounted for in the
May Inflation Report4. In view of those estimates and the appreciation of the zloty, in July 2005 the
MPC reduced the NBP reference rate by another 25 basis points.
4 Inflation Report is a quarterly published document in which the Monetary Policy Council presents its assessment of macroeconomic developments. The Report contains also inflation and GDP projections which are prepared by NBP economists. See: information contained in Appendix 5: Inflation projections of the NBP.

10
The inflation projection prepared in August accounted for previously unexpected
deterioration of economic climate. The August inflation projection, as compared with the May
projection, forecast downward inflationary path to continue in the monetary policy transmission
horizon. However, the Council took into consideration the fact that the projection could not account
for all sources of uncertainty, including, inter alia the Government's economic policy in the years to
come. Moreover, due to the time needed for its preparation, the August inflation projection did not
account for the latest information on considerably higher forecasts for crude oil prices and a
different than expected structure of GDP growth.
The data on national accounts in Q2, published by the GUS in August 2005, corroborated
earlier expectations of a slower than previously expected recovery of the Polish economy. They also
confirmed that under the assumption of unchanged potential GDP estimates, the period of a gradual
closing of the output gap could have been longer than projected in the May Report, which was an
inflation curbing factor. This information induced the MPC to lower the NBP reference rate by
another 25 basis points to the level of 4.5%. In view of the August inflation projection, the reduced
NBP reference rate remained at a level favouring inflation moving back to target in the monetary
policy horizon. However, the MPC maintained its easing monetary policy bias, taking into
consideration, inter alia, the consistently lowering core inflation rate, which was a signal of
weakening inflationary pressure.
The MPC did not change the NBP interest rates in the subsequent months, since the
economic developments turned out to be largely in line with the results of the August inflation
projection, which forecast a gradual improvement of the economic climate. The annual growth rate
of industrial output increased steadily. Also retail sales experienced a moderate upward trend.
Revival in the construction sector continued, although its growth rate fell in October and November.
Economic climate assessments communicated by enterprises in GUS business tendency surveys did
not change substantially, yet the good performance of the corporate sector recorded in the first three
quarters of 2005 pointed at a good economic condition of the surveyed enterprises: growing
revenue, high profitability and a safe liquidity level (which in 2005 Q3 hit the highest level in the
history of GUS surveys).
According to GUS data published in November, GDP growth in 2005 Q3 was higher than in
Q2 and consistent with the projection presented in the August Report. Also the growth rates of
individual consumption and investment were in line with the NBP’s expectations, running above the
Q2 levels. Net exports – despite the 2004 appreciation of the real effective exchange rate of the zloty

11
– remained the main demand factor behind economic growth. Its contribution to GDP growth
proved considerably higher than forecast.
An additional factor preventing the MPC from lowering interest rates was a risk related to
rapidly growing oil prices in the world markets.
The data on economic condition in September-December 2005 confirmed the accuracy of the
NBP projections indicating a gradual improvement of economic climate, yet, the scale of decline in
core inflation was slightly larger than accounted for in the August 2005 inflation projection. On the
other hand, CPI inflation in Q3 was somewhat higher than forecast in the August Report, while Q4
marked a considerable inflation decrease driven by a drop in the growth rate of prices of food and
non-alcoholic beverages and also of fuel prices.
The economic developments in the final months of 2005, namely a marked improvement in
the economic climate coupled with inflation maintained at a lower than previously forecast level,
induced the MPC to put greater emphasis on potential inflationary impact of such structural changes
as stronger competition in product markets, increased labour market flexibility, continued positive
trends in labour effectiveness and a weaker than previously expected pass-through of commodity
prices to domestic prices.
On the whole, the 2005 economic developments and processes affecting inflation enabled the
MPC to gradually ease its monetary policy in pursuit of the inflation target. The interest rates were
lowered on five occasions by the total of 200 basis points (from 6.5% to 4.5%). A more
expansionary monetary policy supported the rise in economic activity and job creation.
The MPC will continue to analyse thoroughly all changes in Poland’s economic and
financial situation in order to identify any threats to price stability. Faced with such threats, the MPC
will respond adequately with monetary policy instruments at its disposal.

12
Figure 2
MPC decisions in 2005
2.50%
3.50%
4.50%
5.50%
6.50%
7.50%
8.50%
Jan-05
Feb-05
Mar-05
Apr-05
May-05
Jun-05
Jul-05
Aug-05
Sep-05
Oct-05
Nov-05
Dec-05
NBP deposit rate NBP reference rate NBP lombard rate
Source: NBP data.

13
3. Monetary policy instruments 3.1 Liquidity surplus in the banking sector
Liquidity surplus in the banking sector in 2005, in contrast to the preceding year, was rising
steadily. Its level measured as the average balance of NBP money market bills amounted to PLN
16,699 million and was PLN 11,424 million higher than the average level of money market bills in
2004. The total banking sector liquidity absorption, measured by the scale of issuance of NBP
money market bills and the level of deposits held by the Ministry of Finance at the NBP, averaged
PLN 21,707 million in 2005 and was PLN 4,240 million higher than in 2004. Moreover, bonds
issued by the NBP in 2002 in the amount of PLN 7,816 million with maturity in 2012 are still in
circulation.
The banking sector liquidity in particular months of 2005 was affected by changes in
liquidity autonomous factors, which were beyond the central bank’s control. The first of those
factors, which contributed to mounting liquidity surplus, was the NBP’s net purchase of currency in
the amount of PLN 7,479 million. It was mainly driven by the use of EU funds, which were
transferred from the subsidiary (euro) account of the European Union at the NBP to the funds’
accounts and subsequently converted into the zloty at the central bank. Other major factors behind
the rise in liquidity included a PLN 6,609 million drop in the zloty deposits held by the public sector
at the central bank and the transfer of the NBP’s profit in the amount of PLN 4,168 million to the
central budget. The level of liquidity surplus was limited mainly by an increase in notes and coin in
circulation by PLN 3,864 million, increase in the banks’ reserve requirements by PLN 945 million
and repayment of refinancing loan in the amount of PLN 343 million.
3.2 Monetary policy instruments
3.2.1 Interest rates
The Monetary Policy Council determines the level of NBP interest rates, which, in turn,
affects interest rates of monetary policy instruments, i.e. open market operations, required reserves
and standing facilities.

14
The main NBP interest rate is the reference rate. This rate influences the level of interest
rates with maturity comparable to the maturity of basic open market operations. The deposit rate and
the lombard rate of the NBP determine the fluctuation band of overnight interest rates in the
interbank market.
In 2005, the Monetary Policy Council lowered the NBP’s interest rates on five occasions.
The reference rate was lowered in total from 6.50% to 4.50%, the lombard rate from 8.00% to
6.00% and the deposit rate from 5.00% to 3.00%. The tolerance band for deviations of short-term
market rates remained unchanged and amounted to +/- 1.50 percentage point.
Table 1
Decisions of the Monetary Policy Council on the level of key NBP interest rates in 2005
Decision date*
Decision:
30 March - Lowering of the minimum yield on the 7-day open market operations from 6.50% to 6.00% - Lowering of the lombard rate from 8.00% to 7.50% - Lowering of the rediscount rate from 7.00% to 6.50% - Lowering of the deposit rate from 5.00% to 4. 50%.
27 April - Lowering of the minimum yield on the 7-day open market operations from 6.00% to 5.50% - Lowering of the lombard rate from 7.50% to 7.00% - Lowering of the rediscount rate from 6.50% to 6.00% - Lowering of the deposit rate from 4.50% to 4.00%.
29 June - Lowering of the minimum yield on the 7-day open market operations from 5.50% to 5.00% - Lowering of the lombard rate from 7.00% to 6.50% - Lowering of the rediscount rate from 6.00% to 5.50% - Lowering of the deposit rate from 4.00% which lay beyond to 3.50%.
27 July -Lowering of the minimum yield on the 7-day open market operations from 5.00% to 4.75% - Lowering of the lombard rate from 6.5% to 6.25% - Lowering of the rediscount rate from 5.50% to 5.25% - Lowering of the deposit rate from 3.50% to 3.25%.
31 August - Lowering of the minimum yield on the 7-day open market operations from 4.75% to 4.50% - Lowering of the lombard rate from 6.25% to 6.00% - Lowering of the rediscount rate from 5.25% to 4.75% - Lowering of the deposit rate from 3.25% to 3.00%
Source: NBP data. *Decisions came into force on the following business day
The reference rate cuts were followed by decreases of short-term interest rates in the
interbank market. WIBOR SW rate5, directly influenced by the central bank through open market
operations, oscillated around the reference rate within the fluctuation band of the lombard rate and
5 WIBOR SW (Warsaw Interbank Offered Rate Spot Week) – rate at which banks are ready to grant loans in the unsecured interbank deposit market for the period of 7 days. It is calculated as the arithmetic mean from quotations submitted by participants of the fixing conducted each business day at 11.00 hrs.

15
the deposit rate of the NBP. The average deviation of this rate from the NBP reference rate in 2005
amounted to 9 basis points and was 7 basis points lower than in the preceding year.
Figure 3
Basic NBP rates and rates of the interbank market WIBOR SW in 2005
2.5%
3.5%
4.5%
5.5%
6.5%
7.5%
8.5%
Jan-
05
Jan-
05
Jan-
05
Feb-
05
Feb-
05
Mar
-05
Mar
-05
Apr-
05
Apr-
05
May
-05
May
-05
Jun-
05
Jun-
05
Jul-0
5
Jul-0
5
Aug
-05
Aug
-05
Aug
-05
Sep
-05
Sep
-05
Oct
-05
Oct
-05
Nov
-05
Nov
-05
Dec
-05
Dec
-05
WIBOR SW NBP reference rateNBP lombard rate NBP deposit rate
Source: NBP data.
At the beginning of 2005, the NBP introduced a new rate POLONIA (Polish Overnight Index
Average). It is the average overnight rate weighed with the transaction volume in the unsecured
interbank deposit market. The level of POLONIA rate reflects actual interest rates on overnight
interbank deposits. The average deviation of the POLONIA rate from the NBP reference rate in
2005 was 26 basis points and that of WIBOR Overnight – 22 basis points (in 2004 – 38 basis
points). The NBP publishes this rate at NBPS page at Reuters website daily at 17.00 hrs.
3.2.2 Open market operations
Open market operations are the basic instrument enabling to keep short-term interest rates at
a level close to the NBP reference rate, in line with the pursuit of the inflation target set by the MPC.
The NBP has recourse to basic, fine-tuning and structural operations.

16
In 2005, the NBP conducted basic open market operations on a regular basis, once a week,
by issuing money market bills. The minimum yield on money market bills was determined by the
NBP reference rate. In order to ensure a more precise management of the banking sector liquidity,
the NBP shortened the maturity period of issued money market bills from 14 to 7 days. This change
brought the NBP monetary policy operational framework closer to the Eurosystem standards. The
issuance of the NBP 7-day money market bills helps to curb volatility of short-term interest rates.
Figure 4
Issuance of the NBP money market bills in 1995-2005
0
5 000
10 000
15 000
20 000
25 000
30 000
Jan-
95
Jul-9
5
Jan-
96
Jul-9
6
Jan-
97
Jul-9
7
Jan-
98
Jul-9
8
Jan-
99
Jul-9
9
Jan-
00
Jul-0
0
Jan-
01
Jul-0
1
Jan-
02
Jul-0
2
Jan-
03
Jul-0
3
Jan-
04
Jul-0
4
Jan-
05
Jul-0
5
PLN
mill
ion
Dec
-05
Source: NBP data.
In 2005, open market operations were carried out with a group of 14 entities, i.e. 13 banks –
money market dealers – and the Bank Guarantee Fund. Dealer banks were selected in accordance
with uniform qualification criteria of the Dealer Activity Index (DAI). The banks demonstrated high
activity in the market of Treasury securities, NBP money market bills, interbank deposits and FX
swaps.
In 2005 there was no need to conduct fine-tuning or structural operations.
Fine-tuning operations may be undertaken to manage unexpected short-term changes in the
banking sector liquidity, leading to undesirable – from the point of view of monetary policy – short-
term interest rate fluctuations. These operations could take the form of liquidity-providing and

17
liquidity-absorbing operations (issuance of NBP money market bills, repo transactions and early
redemption of NBP money market bills).
Structural operations are aimed to change the long-term liquidity level of the banking sector.
The central bank could carry out structural operations through redemption of own bonds (held in
commercial bank portfolios), purchase of securities in the secondary market or issuance of own
long-term securities.
3.2.3 Required reserves
Required reserves are maintained in the averaged system, which means that banks are
obliged to maintain an average balance of funds on accounts with the NBP during the reserve period
at the level not lower than the reserve requirement. Such system mitigates the impact of autonomous
liquidity factors on market interest rate fluctuations.
2005 brought no changes to the principles of calculation and holding of required reserves.
Required reserves are calculated and held in the zloty. The reserve ratio for funds received from
repo transactions is 0.0% and 3.5% for other types of liabilities. Required reserves are calculated on
the basis of the bank’s collected deposits, funds obtained by selling securities and other repayable
funds. The funds taken from other domestic banks, as well as funds obtained from abroad for at least
two years are excluded from the basis for reserve calculation.
All banks reduce the amount of calculated required reserves by the equivalent of EUR 500
thousand. On 1 May 2004 the Monetary Policy Council set the interest on the required reserve funds
at the level of 0.9 bill rediscount rate.
In 2005 one of the banks following a corrective program was partially exempted from
holding required reserves on the basis of the 1999 decision of the NBP Management Board. The
exempted amount was PLN 421.7 million.
The amount of required reserves was PLN 12,065 million as at 31 December 2005, showing
an increase of PLN 968 million (8.7%) as compared with 31 December 2004. The increase in the
reserves balance in 2005 was largely driven by an 8.3% increase in deposits constituting the basis
for required reserves calculation, which were subject to the positive rate of reserve requirement.
All reserve periods in 2005 marked a slight surplus of the average balance of funds held by
banks on accounts with the NBP as compared with the level of the required reserves due. In 2005
this surplus averaged PLN 28 million, i.e. 0.24% of the required reserves, and ranged from 0.09% in
March to 0.46% in December.

18
Figure 5
Changes in the amount of required reserves held and due in 2005
10 500
11 000
11 500
12 000
12 500
31.1
2.20
04 -
30.0
1.20
05
31.0
1.20
05 -
27.0
2.20
05
28.0
2.20
05 -
30.0
3.20
05
31.0
3.20
05 -
01.0
5.20
05
02.0
5.20
05 -
30.0
5.20
05
31.0
5.20
05 -
29.0
6.20
05
30.0
6.20
05 -
31.0
7.20
05
01.0
8.20
05 -
30.0
8.20
05
31.0
8.20
05 -
29.0
9.20
05
30.0
9.20
05 -
30.1
0.20
05
31.1
0.20
05 -
29.1
1.20
05
30.1
1.20
05 -
01.0
1.20
06
Reserve periods
PLN
milli
on
Required reserves due Required reserves held
Source: NBP data.
The minimal differences between required reserves held and due in particular reserve periods
resulted mainly from: the fact that the interest on required reserve funds was only charged up to the
amount of required reserved due, an appropriate asset management at banks and the banks’ use of
instruments facilitating asset management at the NBP accounts (intraday credit, deposit and lombard
facilities). An additional driving force behind the more efficient management of banks’ liquidity was
the information published daily by the NBP on the balance of funds held by banks on NBP accounts
(NBPM page at Reuters website).
3.2.4 Standing facilities
Standing facilities, which include lombard facility and deposit facility, are initiated by
commercial banks. They are source for a short-term supplementation of the banking sector liquidity
and also allow banks to make overnight deposits of their surplus liquidity with the NBP.
These operations are aimed to prevent fluctuations of the interbank interest rates. The deposit
rate constitutes the lower limit for movements in short-term market rates. The lombard facility
19
interest rate determines the maximum cost of funding with the NBP by setting a ceiling on
fluctuations of the inter-bank rates.
In 2005 the total amount of overnight deposits placed by the banks with the NBP equalled
PLN 56.9 billion. They were almost two times lower as compared with PLN 113.6 million recorded
in the preceding year. The total value of overnight deposit placed by the banks ranged between PLN
200 thousand and PLN 4.5 billion. The average daily level of overnight deposits amounted to PLN
155.9 million as compared with PLN 310 million in 2004. The highest amounts were deposited by
the banks on the last days of the required reserve maintenance periods.
In 2005 the banks used lombard facility collateralised with Treasury securities mainly on the
last days of the required reserve maintenance periods. The total amount of the lombard facility used
throughout the year was PLN 10.3 billion as compared with PLN 8.0 billion in 2004. The average
daily use of lombard facility was PLN 28.4 million as compared with PLN 22 million in 2004.
3.2.5 Other operations
Intraday credit facility serves to facilitate settlements and liquidity management in the
banking sector during the business day. It is a non-interest bearing credit taken and repaid during the
same business day, which is collateralised with Treasury securities. In 2005 the banks used intraday
credit facility every business day. The banks’ daily debt under credit facility ranged from PLN 4.4
billion to PLN 15.3 billion.
On 7 March 2005 the NBP, through the intermediary of the central bank of Italy, joined the
TARGET system of euro settlements. One of the conditions set out in the TARGET Agreement to
be met by the NBP was the need to ensure settlement liquidity under SORBNET-EURO. This role is
played by the intraday credit in the euro granted to the national RTGS participants. As an intraday-
type credit it is repayable by the end of the business day on which it is taken and it is non-interest
bearing. It may be collateralised with Treasury bonds subject to MTS-CeTO fixing. Valuation
principles of securities – against the amounts of credit granted – are fully compliant with
Eurosystem standards. In view of rather insignificant volume of payments transmitted by banks to
the SORBNET-EURO system, the use of euro intraday credit in 2005 was very limited. The banks’
daily debt at the NBP amounted to EUR 0.3 million. Given a short period of operation of euro
intraday credit facility, its use should be expected to extend gradually.

20
Appendix 1. GDP and final demand
What has to be borne in mind while discussing the path of GDP and its components in 2005
is the fact that these data have been subject to a number of revisions announced by the GUS and thus
there may appear differences between the values quoted in the present Report and those presented in
press releases and Inflation Reports published earlier on. Especially in the first half of 2005, the data
on national accounts were characterised by large uncertainty connected with the assessment of two
developments: the speed of changes in their main components (consumption, investment and stock
building) and the impact of net exports on GDP growth rate. These issues attracted a lot of attention
during the MPC’s meetings, as the quality of these estimates is of great importance for the correct
assessment of the current and future economic situation.
In 2005, a 2.2% growth in domestic demand was recorded as compared with 6.0% growth in
2004. The decline in year-on-year growth rate of domestic demand was to a large extent the result of
significantly lower stock building than a year before, which led to capital formation rising only
0.5%. The growth rate of total consumption (2.6%) was also lower than in the preceding year. In
2005, the surplus of imports over exports in current prices fell down for the fifth consecutive year.
The growth rate of gross value added6 in 2005 was at 3.2%, while a year before this category
recorded a rise of 5.1%. The rise in gross value added in 2005 primarily resulted from a recovery in
market services and industry (their contributions to total value added growth amounted to 1.6
percentage points and 1 percentage point, respectively). The scale of increase in industrial output
was determined by the manufacturing sector whose growth rate was affected by the rising exports
and gradually recovering domestic demand.
The GDP and domestic demand growth rates, and their structure in the years 1997-2005 are
presented in Table 2, share of final demand components in GDP growth are shown in Figure 4,
while GDP and domestic demand growth rates by quarters are presented in Table 3.
6 Gross Domestic Product equals the total gross value added increased by the net balance of taxes on products (including import duties) and product subsidies.

21
Figure 6
Share of final demand components in the GDP growth
Source: NBP calculations based on GUS data.
Table 2
GDP and domestic demand in 1997 – 2005 1997 1998 1999 2000 2001 2002 2003 2004 2005 Growth rate GDP 7.1 5.0 4.5 4.2 1.1 1.4 3.8 5.3 3.4
Domestic demand 9.3 6.4 5.2 3.1 -1.4 0.9 2.7 6.0 2.2
Consumption 6.3 4.3 5.0 2.8 2.2 2.9 2.5 4.0 2.6
Individual consumption 7.1 5.0 5.4 3.0 2.2 3.3 1.9 4.3 2.0
Capital formation 21.0 13.6 6.0 3.9 -13.4 -7.2 3.3 14.7 0.5
Gross fixed capital formation 21.8 14.0 6.6 2.7 -9.7 -6.3 -0.1 6.4 6.5
Exports 12.2 14.4 -2.5 23.2 3.1 4.8 14.2 14.0 8.1
Imports 21.4 18.6 1.0 15.5 -5.3 2.7 9.3 15.2 4.9 Contribution of net exports to
GDP growth (percentage points) -2.3 -1.7 -1.0 0.9 2.6 0.5 1.1 -0.8 1.1
GDP structure in current prices
Domestic demand 103.9 104.8 105.9 106.4 103.7 103.4 102.6 102.0 100.3
Consumption 80.5 79.8 80.7 81.6 82.9 84.8 83.8 81.9 81.3
Capital formation 23.4 25.1 25.2 24.8 20.8 18.6 18.8 20.1 19.0
Net exports -3.9 -4.8 -5.9 -6.4 -3.7 -3.4 -2.6 -2.0 -0.3
Source: GUS data.

22
Table 3 GDP and domestic demand dynamics by quarters Year Q1 Q2 Q3 Q4 Q1 -Q4
Gross value added 2005 2.2 2.8 3.7 4.2 3.2 2004 6.4 5.5 4.8 4.2 5.1 Industry 2005 0.9 2.6 4.3 7.8 4.0 2004 15.7 13.6 7.6 6.3 10.5 Construction 2005 5.4 11.0 8.2 3.8 6.7 2004 -0.7 0.1 -0.2 4.9 1.8 Market services 2005 2.3 2.7 4.1 3.6 3.2 2004 4.8 4.5 4.3 3.2 4.2 GDP 2005 2.2 2.9 3.9 4.3 3.4 2004 6.8 5.9 4.8 4.0 5.3 Domestic demand 2005 1.1 0.0 1.9 5.4 2.2 2004 7.0 7.4 5.9 3.9 6.0 Total consumption 2005 2.1 2.6 2.4 3.3 2.6 2004 4.6 4.9 4.1 2.5 4.0 Individual consumption 2005 1.4 1.4 2.3 2.8 2.0 2004 5.1 5.1 4.4 2.7 4.3 Gross capital formation 2005 -4.3 -12.0 -0.3 11.4 0.5 2004 23.5 20.4 14.5 7.9 14.7 Gross fixed capital formation 2005 1.4 4.0 6.5 10.1 6.5 2004 4.8 4.9 5.3 8.6 6.4
Source: GUS data.
The growth rate of gross investment outlays in 2005 was close to the value recorded one year
earlier, while stock increases were considerably lower than a year before. The growth rate of
investment outlays was affected by the inflow of structural funds from the European Union.
The growth rate of individual consumption in 2005 was lower than a year ago and 1
percentage point lower than the growth rate of real gross disposable income of households. The
improvement of the situation in the labour market was conducive to increased income from paid
employment (a rise of 5.5% in current prices), while social benefits remained at levels close to those
recorded in 2004. Important sources of financing consumption growth in 2005 included the
increasing income from private business activity (nominal growth in operational surplus of 10.6% in
relation to 2004) and income from property (a rise of 14.1%). In the aftermath of Poland’s accession
to the European Union, an important role in income growth was played by payments to farmers
under the Common Agricultural Policy.
The year 2005 was the fourth consecutive year which saw a rise in exports and imports,
though foreign trade growth rate was not as high as in the previous year. Despite a strengthening
exchange rate, the growth of exports outpaced the growth of imports, which resulted in net exports
making an over-one-percent contribution to the real GDP growth, after this contribution being

23
negative in 2004. There was a reduction in the external imbalance as measured with the fall in
foreign savings7 in relation to GDP from approx. 4.3% in 2004 to 1.5% in 2005. To a large extent,
this was the result of improved foreign trade balance. The decline in the rate of foreign savings was
accompanied by the rise in total savings in relation to GDP from 15.8% in 2004 to 17.6% in 2005.
7 According to national accounts. The national accounts’ data on foreign trade turnover differ from those published in the NBP’s balance of payments primarily in that they account for the so-called net processing turnover (in the balance of payments this category is presented in gross terms).

24
Appendix 2. Prices of consumer goods and services
In 2005, inflation (CPI) decreased from 3.7% y/y in January to 0.7% y/y in December and
thus ran below the lower tolerance limit for deviations from the inflation target. From the point of
view of inflation processes, the year 2005 may be divided into two sub-periods. For the first five
months of 2005, the annual inflation rate remained at a high level, which resulted from price
increases in the period preceding Poland’s accession to the EU and in the first months of its
membership. The gradual fading-out of the statistical base effect8 led to a decline in annual inflation
in the subsequent months. Also conducive to the reduction of the annual price growth rate in the
final months of 2005 was a slowdown in the growth rate of the prices of food and non-alcoholic
beverages and of fuel prices. Likewise, the appreciation of the zloty exchange rate contributed to
lowering annual inflation.
The increase in prices of consumer goods and services of 0.7% y/y at the end of 2005
resulted from:
• a 1.3% y/y drop in the prices of food and non-alcoholic beverages, which lowered the CPI by
0.4 percentage point,
• a 3.4% y/y increase in regulated prices, which raised the CPI by 1.0 percentage point,
including the rise of fuel prices of 6.4% y/y, which was conducive to the CPI rising by 0.2
percentage point,
• a rise in the prices of other goods and services of 0.2% y/y, which led to an overall price
growth of 0.1 percentage point.
8 The base effect consisted in that the current price level was referred to a much lower level from the period preceding Poland's EU accession.

25
Table 4 Changes in the main price groups of consumer goods and services in 2004-2005 (y/y)
of which of which
CPI Food and non-alcoholic beverages
Regulated prices fuels
Other goods and services non-food
products services Weight structure in %
2004 100.00 26.95 27.28 3.8 45.77 27.29 18.482005 100.00 26.94 26.62 3.84 46.44 26.81 19.63
Change in relation to the corresponding period of the previous year (%) Jan 2004 1.6 2.2 2.3 5.4 0.8 -0.2 2.4
Feb 1.6 2.7 1.9 2.7 0.7 -0.3 2.3Mar 1.7 3.3 1.6 1.3 0.7 -0.2 2.1Apr 2.2 4.6 2.2 4.7 0.8 0.0 2.1May 3.4 5.2 3.7 15.3 2.1 1.9 2.4Jun 4.4 8.1 4.1 17.8 2.3 2.1 2.7Jul 4.6 9.1 3.7 16.1 2.5 2.3 2.8Aug 4.6 9.3 3.5 14.8 2.5 2.4 2.9Sep 4.4 8.1 3.7 15.9 2.6 2.4 3.0Oct 4.5 7.7 4.0 19.2 2.8 2.5 3.3Nov 4.5 7.7 4.0 19.1 2.7 2.4 3.4Dec 4.4 7.8 3.7 17.0 2.6 2.2 3.4
Jan 2005 3.7 6.7 3.4 9.9 2.3 1.6 3.2Feb 3.6 5.9 3.4 10.2 2.3 1.7 3.2Mar 3.4 5.3 3.3 9.1 2.4 1.5 3.6Apr 3.0 3.7 3.7 11.9 2.3 1.4 3.5May 2.5 4.3 3.0 6.8 1.2 -0.4 3.3Jun 1.4 0.4 3.3 8.4 0.9 -0.6 3.0Jul 1.3 -0.8 4.2 13.1 0.8 -0.7 2.9Aug 1.6 0.5 4.4 14.7 0.7 -0.9 2.8Sep 1.8 1.0 4.7 16.5 0.6 -1.0 2.9Oct 1.6 0.8 4.4 12.8 0.4 -1.1 2.6Nov 1.0 -0.5 3.9 9.6 0.2 -1.2 2.2Dec 0.7 -1.3 3.4 6.4 0.2 -1.2 2.2
Jan-Dec 2004 3.5 6.3 3.2 12.4 1.9 1.4 2.7Jan-Dec 2005 2.1 1.6 2.9 10.8 1.2 -0.1 2.9
Source: GUS data, NBP calculations.

26
Figure 7
Changes (y/y) in CPI and main price categories in 2003-2005
-4
-2
0
2
4
6
8
10
Jan-03
Mar-03
May-03
Jul-03
Sep-03
Nov-03
Jan-04
Mar-04
May-04
Jul-04
Sep-04
Nov-04
Jan-05
Mar-05
May-05
Jul-05
Sep-05
Nov-05
%CPIFood and non-alcoholic beveragesRegulated pricesOther goods and services
Source: GUS data, NBP calculations.
Figure 8
CPI breakdown (y/y)
-1.5
0.0
1.5
3.0
4.5Jan-03
Mar-03
May-03
Jul-03
Sep-03
Nov-03
Jan-04
Mar-04
May-04
Jul-04
Sep-04
Nov-04
Jan-05
Mar-05
May-05
Jul-05
Sep-05
Nov-05
%Other goods and services (total)
Regulated prices
Food and non-alcoholic beverages
CPI
Source: GUS data, NBP calculations.

27
Prices of food and non-alcoholic beverages
Prices of food and non-alcoholic beverages in December 2005 fell down by 1.3% y/y and
thus contributed to a 0.4-percentage point reduction of inflation measured with the CPI, while in the
corresponding period of 2004 they had recorded a steep increase (of 7.8% y/y).
For the first five months of 2005 there persisted a high, though falling, tendency in the 12-
month index of the prices of food and non-alcoholic beverages: it slid from 6.7% in January to 4.3%
in May 2005. In turn, in June 2005, due to the vanishing of the price effects connected with Poland’s
accession to the European Union and also due to the seasonal drop in food and non-alcoholic
beverage prices in the summer months, the annual growth rate of these prices amounted to 0.4%. In
subsequent months of 2005, the development of price growth in this group was affected by one-off
factors such as a growing supply of pork. The meat price falling tendencies were additionally
strengthened by consumers’ fears connected with the news of bird flu cases being reported in
Europe and the ban on Polish food imports introduced by Russian authorities starting from
November 2005. This strengthening effect, however, was mitigated by a rise in exports to EU
countries. The decline in prices of food and non-alcoholic beverages was also supported by a high
crop harvest in 2005, supplemented with considerable stocks from the 2004 harvest.
Regulated prices
In December 2005 the 12-month growth rate of regulated prices reached 3.4%, i.e. the same
level as had been recorded at the beginning of 2005. The most important factor which was
conducive to keeping a relative high growth rate of regulated prices over the analysed period was a
rise in prices of natural gas (by 11.3% y/y) and fuels (by 6.4% y/y) connected with oil price hikes in
the world markets. The combined increase in oil and gas prices accounted for 52% of the rise of
regulated prices (1.8 percentage points). Moreover, 2005 marked a considerable increase in prices of
tobacco products (by 7.3% y/y), which resulted from the increase of excise tax rate, due to the
obligation to harmonise it with the level required in the European Union. The change in the tariffs
for electricity raised its prices by 3.4% (y/y). On the other hand, the prices of alcoholic beverages
remained unchanged in relation to the preceding year.
28
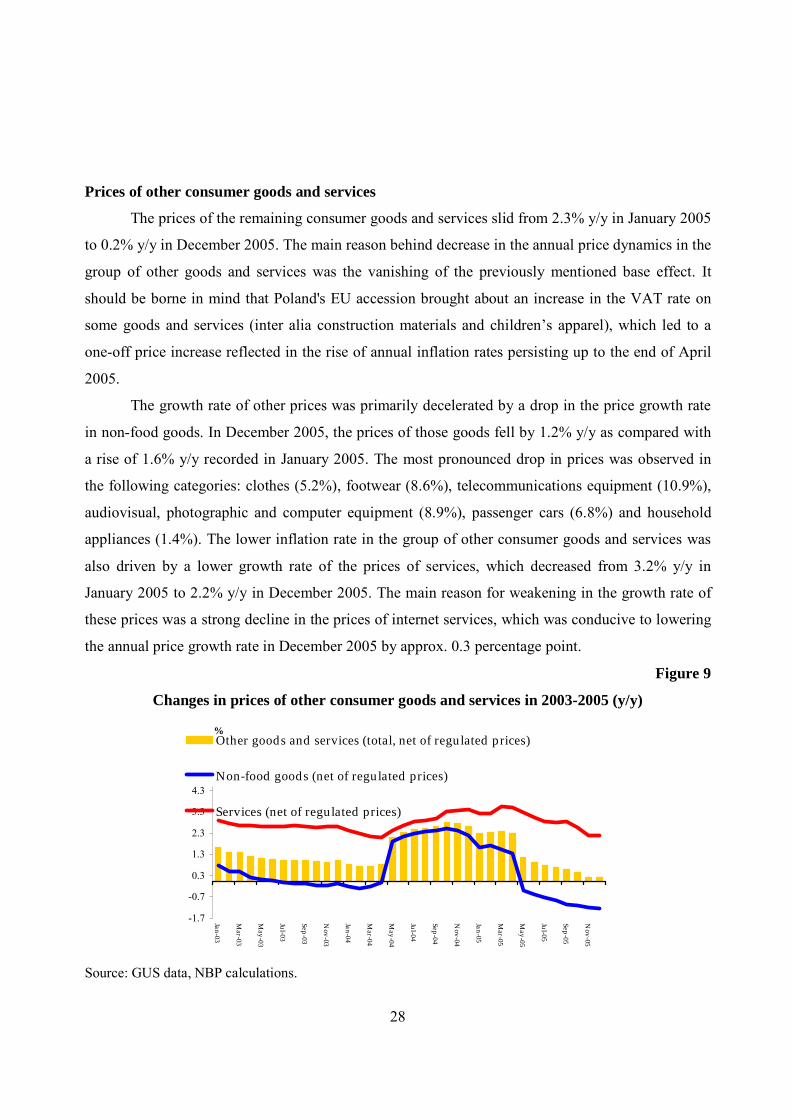
Prices of other consumer goods and services
The prices of the remaining consumer goods and services slid from 2.3% y/y in January 2005
to 0.2% y/y in December 2005. The main reason behind decrease in the annual price dynamics in the
group of other goods and services was the vanishing of the previously mentioned base effect. It
should be borne in mind that Poland's EU accession brought about an increase in the VAT rate on
some goods and services (inter alia construction materials and children’s apparel), which led to a
one-off price increase reflected in the rise of annual inflation rates persisting up to the end of April
2005.
The growth rate of other prices was primarily decelerated by a drop in the price growth rate
in non-food goods. In December 2005, the prices of those goods fell by 1.2% y/y as compared with
a rise of 1.6% y/y recorded in January 2005. The most pronounced drop in prices was observed in
the following categories: clothes (5.2%), footwear (8.6%), telecommunications equipment (10.9%),
audiovisual, photographic and computer equipment (8.9%), passenger cars (6.8%) and household
appliances (1.4%). The lower inflation rate in the group of other consumer goods and services was
also driven by a lower growth rate of the prices of services, which decreased from 3.2% y/y in
January 2005 to 2.2% y/y in December 2005. The main reason for weakening in the growth rate of
these prices was a strong decline in the prices of internet services, which was conducive to lowering
the annual price growth rate in December 2005 by approx. 0.3 percentage point.
Figure 9
Changes in prices of other consumer goods and services in 2003-2005 (y/y)
-1.7
-0.7
0.3
1.3
2.3
3.3
4.3
Jan-03
Mar-03
May-03
Jul-03
Sep-03
Nov-03
Jan-04
Mar-04
May-04
Jul-04
Sep-04
Nov-04
Jan-05
Mar-05
May-05
Jul-05
Sep-05
Nov-05
%Other goods and services (total, net of regulated prices)
Non-food goods (net of regulated prices)
Services (net of regulated prices)
Source: GUS data, NBP calculations.

29
Appendix 3. Balance of payments The negative current account balance of the balance of payments decreased in 2005 after a
temporary deepening in the previous year9. In 2005 the current account deficit amounted to EUR 3.5
billion, i.e. it was more than EUR 5 billion lower than in the preceding year. The relation of current
account deficit to GDP went down from 4.1% in 2004 to 1.5% in 2005. The improvement in the current
account balance in 2005 was primarily driven by a considerable lowering of trade deficit in goods.
Likewise, the changes in the balance of the other components contributed to a reduction in the current
account deficit.
Figure 10
Current account balance in 1994-2005 Figure 11
Exports and imports in 1994-2005
-16
-12
-8
-4
0
4
8
1994
1995
1996
1997
1998
1999
2000
2001
2002
2003
2004
2005
ECU
/EU
R b
illio
n
balance on current transfers balance on goodsbalance on income balance on servicescurrent account
Source: NBP data.
0
15
30
45
60
75
90
1994
1995
1996
1997
1998
1999
2000
2001
2002
2003
2004
2005
ECU
/EU
R b
illio
n
-16
-13
-10
-7
-4
-1
2
exports (L) imports (L) balance (R)
The year 2005 was the sixth consecutive year when the Polish foreign trade deficit was
shrinking. A strong decrease in the negative balance on goods from EUR 4.6 billion to EUR 2.2 billion
in 2005 was the reflection of the relatively large, in comparison to the previous years, difference between
the growth rates of exports and imports10.
9 The data presented in the Report on the implementation of monetary policy guidelines in 2004 pointing at an improvement in the current account balance were subsequently revised in September 2005 due to the fact that the balance of payments statistics started to account for reinvested profits from direct investment. Before the revision, the current account deficit in 2004 amounted to EUR 3.0 billion, while after it – EUR 8.5 billion. 10 According to NBP data the euro value of exports increased in 2005 by 17.1%, while the value of imports rose by 12.6% in comparison to the previous year (compared with 22.3% and 19.5% in 2004).

30
In 2005 the rise in the value of exports (expressed in the euro) remained relatively high, though it
fell slightly in relation to 200411.
In 2005 the Gross Domestic Product in the euro area, which accounted for 54% of Polish export,
increased by 1.3% as compared with 2.1% in the previous year. The rise in the demand of the export
sector in the euro area, accompanied with rising tendencies visible in this region’s investment demand,
contributed to raising Polish exports to the euro area in the second half of 2005. This is mainly due to the
fact that Polish exports to the euro area are dominated by supply goods, which are used as intermediate
products and components in the export production of the euro area.
After a significant appreciation of the zloty in 2004, in 2005 the nominal zloty exchange rate
continued to strengthen – the average annual exchange rate of the zloty was 11.2% stronger in
relation to the euro, and 11.5% – in relation to the US dollar. An appropriate measure to assess
changes in the competitive position of producers in international markets is an index reflecting
production costs. Moreover, most of trade has so far involved the products of the manufacturing
industry. For these reasons, the real exchange rate deflated with unit labour costs in manufacturing is
the appropriate indicator of the international competitive position of producers. In 2004 Q1–2005
Q4 the real effective exchange rate of the zloty deflated with unit labour costs in manufacturing
appreciated less than the nominal rate, i.e. by 5.3%. The real zloty exchange rate appreciation was
smaller in this period than the real appreciation of the Czech and Slovak koruna and Hungarian
forint, which appreciated by 13.6%, 8.9% and 6.6%, respectively.
The continuation of a relatively high growth rate of exports, despite lower import demand in
major markets and in spite of the zloty appreciation, also resulted from the continuation of the structural
changes underway in the Polish economy. The changes are connected with the growing importance of
foreign direct investment in Polish exports. This leads to an ever increasing participation of the Polish
economy in the international division of labour. The growing contribution of corporate trade12 makes
exports increasingly less sensitive both to demand changes and exchange rate fluctuations.
11 According to GUS data the growth rate of export volume in year-on-year terms fell from 18.2% in 2004 to 10.8% in 2005. The impact of the lowered growth rate of export volume was partly offset by the acceleration in the growth of euro transaction prices from 6.3% to 7.9%, respectively. In turn, the growth rate of import volume declined from 17.3% in 2004 to 4.6% in 2005, while the increase of import prices (of 8.0%) proved considerably higher in relation to the previous year (0.8%). 12 Corporate trade consists in exporting and importing goods between Polish branches of foreign corporations and the parent companies or branches located in other countries.

31
The 2005 rise in the value of imports expressed in the euro was strongly affected by the rise in
transaction prices, which was caused, primarily, by the increased fuel prices in international markets13.
The impact of high fuel prices on the value of imports was partly weakened as a result of a lower
increase in the unit prices of investment and consumer goods. This was caused by a larger contribution
of countries with lower production cost (primarily China) in total Polish imports. The rise in investment
demand that occurred in the second half of 2005 was conducive to accelerating the growth of investment
imports.
Figure 12
Current account deficit versus foreign investment inflow in 1996-2005
0
4
8
12
16
20
1996 1999 2002 2005
ECU
/EU
R b
illio
n
foreign portfolio investment in Polandforeign direct investment in Polandcurrent account deficit
Source: NBP data.
2005 marked an improvement in all major financial indicators reflecting the external equilibrium
of the Polish economy. The relation of current account deficit and trade deficit in goods to GDP declined
in relation to the period 2002-2004. The current account deficit was in 2004 and 2005 entirely financed
by in the inflow of capital in the form of foreign direct investment, which is considered safe.
13 The value of the import of crude oil to Poland (expressed in the euro) rose in 2005 by 45%. This resulted mainly from the rise in the price of oil imported to Poland of 42.3%, while the volume of supplies increased by only 1.9% in relation to the previous year.

32
Table 5
Main indicators of external equilibrium
Warning indicator 2002 2003 2004 2005
Current account balance / GDP -2.7% -2.1% -4.2% -1.5%
Trade balance / GDP -3.9% -2.7% -2.2% -0.9%
Direct investment / current account balance 76.7% 92.5% 112.9% 141.4%
(Current account balance+capital balance–direct investment) / GDP -0.6% -0.2% 0.9% 0.9%
Foreign debt servicing / exports of goods and services 28.2% 30.7% 35.4% 32.5% Foreign reserves expressed in terms of monthly imports of goods and services 5.5 4.8 4.0 4.8
Source: NBP calculations.

33
Appendix 4. Money supply
The year 2005 brought acceleration in the growth of households’ indebtedness in the banking
system. The fastest growth was observed in housing loans, particularly foreign currency ones, but
the growth rate of consumer loans also stepped up considerably. There was also a rise in the
indebtedness of enterprises, but the scale of this increase was moderate, particularly if compared
with the growth rate of investments recorded in 2005. On the other hand, there was a continuously
high growth in enterprises deposits at banks, which may point to the limited credit needs of
enterprises. The bank deposits of households increased moderately. At the same time, however,
there was a surge in the level of financial savings held by households in forms alternative to bank
accounts, primarily in investment fund units.
Loans to households
In 2005 the volume of bank loans to households increased by PLN 26.4 billion (24.0%) in
nominal terms. Some of those loans were taken in foreign currencies and so changes in the zloty
exchange rate had an effect on the growth rate of the volume of lending to this sector. In comparable
terms, after adjusting for exchange rate fluctuations, the increase in loans to households in 2005
amounted to PLN 27.8 billion (25.0%). The rising trend in the annual growth rate of loans to
households was disrupted twice in 2005 – in May and October. In the first case, a one-off increase in
the growth rate resulted from the fact that households took loans for the purchase of the shares of
LOTOS fuel company sold by the State Treasury in a public offering. In the second case, a
significant one-off growth rate drop was caused by the base effect (in October 2004 household
indebtedness had risen considerably as a consequence of the privatisation offer of Bank PKO BP
and a major publishing house WSiP).
The breakdown of household loan growth in 2005 reveals that housing loans were the main
growth component. At the same time, the contribution of consumer loans was only slightly smaller.
The volume of housing loans increased by PLN 14.6 billion in nominal terms (40.8%), which
represents PLN 15.8 billion (42.2%) after adjusting for the zloty exchange rate fluctuations. Housing
loans denominated in foreign currencies were more popular than zloty denominated loans, which
resulted from their lower interest rates and intensified marketing activities by commercial banks,
which were persuading borrowers to take loans particularly in Swiss francs. The volume of housing

34
loans (in comparable terms, i.e. after adjusting for the zloty exchange rate fluctuations) rose in 2005
by PLN 13.0 billion (61.3%), while the volume of zloty denominated housing loans – by PLN 2.8
billion (18.2%).
In 2005 the volume of consumer loans increased by PLN 10.2 billion (19.0%) in nominal
terms. After adjusting for the zloty exchange rate fluctuations this amounted to PLN 10.4 billion
(19.4%). The rising trend in consumer loans started in the mid-2004 and continued in 2005. Its roots
lie in the improvement of financial standing of households stemming from the acceleration of
economic growth over the past two years accompanied by positive developments in the labour
market.
These developments also affected the structure of bank indebtedness of households. The
share of housing loans granted to households in the total value of bank loans to that sector amounted
to 37.1%, while the contribution of consumer loans was 46.9%. In December 2004 these shares were
32.7% and 48.9%, respectively.
Figure 13
Loans to households, annual growth rate, data adjusted for the impact of exchange rate
fluctuations
0
10
20
30
40
50
Jan-04
Mar-04
May-04
Jul-04
Sep-04
Nov-04
Jan-05
Mar-05
May-05
Jul-05
Sep-05
Nov-05
total lending
housing loans
consumer loans
PKO BP and WSiP effectLOTOS effect
%
Source: NBP data.

35
Figure 14
Housing loans to households
0
5
10
15
20
25
30
35
Jul-03
Oct-03
Jan-04
Ap
r-04
Jul-04
Oct-04
Jan-05
Ap
r-05
Jul-05
Oct-05
PLN billion zloty loans foreign currency loans
Source: NBP data.
Loans to enterprises
In 2005 the indebtedness of enterprises in the Polish banking sector rose by PLN 3.0 billion,
while foreign debt of enterprises increased by EUR 3.1 billion in the same period.
The volume of bank loans to enterprises increased in 2005 by PLN 3.0 billion (2.6%) in
nominal terms. In comparable terms, after adjusting for exchange rate changes, this increase was
even bigger, i.e.: PLN 4.1 billion (3.5%). In the first half of the year, the annual growth rate was
stepping up steadily, and in the second half – it stabilised at the level of approx. 4%.
Despite the observed economic recovery, the growth rate in corporate loans in 2005 was
relatively low. This may reflect very good financial results of the sector in 2004 and 2005. With a
large amount of own funds at their disposal, enterprises are able to fund their activity with only a
limited use of bank loans.
The foreign debt of enterprises rose from EUR 42.3 billion at the end of 2004 to EUR 45.4
billion at the end of 2005, i.e. by 7.3%. There was a continuation to the dynamic growth of trade
loan debt (18.0% y/y), reflecting Poland’s growing foreign trade volume. The other debt categories,
including debt securities issued by Polish companies, were growing at a pace consistent with the
domestic debt growth (6.5% y/y).

36
Figure 15
Bank loans to enterprises, annual growth rate, data adjusted for exchange rate fluctuations
-6
-4
-2
0
2
4
6
Jan-04
Mar-04
May-04
Jul-04
Sep-04
Nov-04
Jan-05
Mar-05
May-05
Jul-05
Sep-05
Nov-05
%
Source: NBP data.
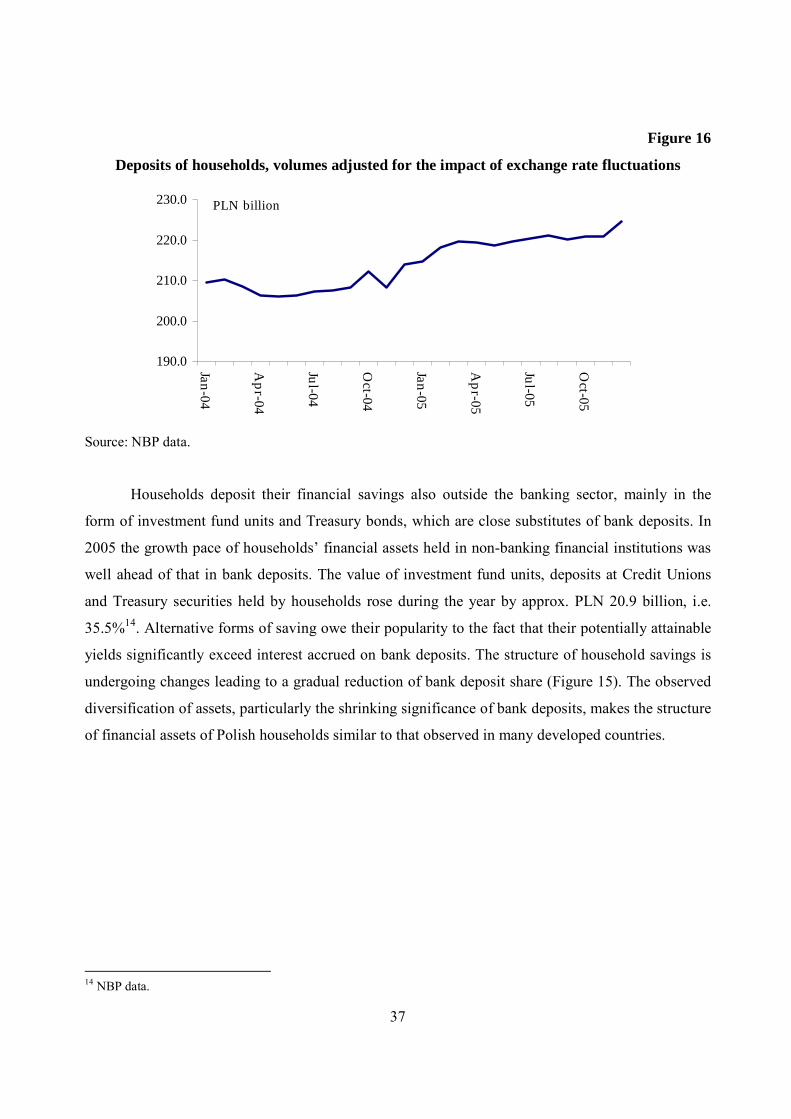
Deposits of households
In 2005 the volume of bank deposits of households increased by PLN 11.0 billion (5.2%) in
nominal terms. After adjusting for exchange rate fluctuations, the rise in deposits amounted to PLN
10.6 billion (5.0%). The increase in households’ deposits occurred in two stages: at the beginning of
2005 and in December. In the first period, from January through March 2005 the deposits rose by
PLN 5.8 billion, and in December – by PLN 3.6 billion. The remaining part of the deposit increase,
i.e. approx. PLN 1.2 billion, was evenly spread over the other months.
37
Figure 16
Deposits of households, volumes adjusted for the impact of exchange rate fluctuations
190.0
200.0
210.0
220.0
230.0
Jan-04
Ap
r-04
Jul-04
Oct-04
Jan-05
Ap
r-05
Jul-05
Oct-05
PLN billion
Source: NBP data.
Households deposit their financial savings also outside the banking sector, mainly in the
form of investment fund units and Treasury bonds, which are close substitutes of bank deposits. In
2005 the growth pace of households’ financial assets held in non-banking financial institutions was
well ahead of that in bank deposits. The value of investment fund units, deposits at Credit Unions
and Treasury securities held by households rose during the year by approx. PLN 20.9 billion, i.e.
35.5%14. Alternative forms of saving owe their popularity to the fact that their potentially attainable
yields significantly exceed interest accrued on bank deposits. The structure of household savings is
undergoing changes leading to a gradual reduction of bank deposit share (Figure 15). The observed
diversification of assets, particularly the shrinking significance of bank deposits, makes the structure
of financial assets of Polish households similar to that observed in many developed countries.
14 NBP data.

38
Figure 17
Selected financial assets of households15
Deposits of enterprises
In 2005 bank deposits of enterprises were building up dynamically. Nominal growth
amounted to PLN 14.6 billion (17.0%), i.e. PLN 14.5 billion (16.4%) in adjustment for the impact of
exchange rate fluctuations. During the year the annual growth rate of corporate deposits was
gradually decreasing – in the first months of 2005 it settled at the level of approx. 30%, while in
December it fell to 16.4%.
A rapid growth in corporate deposits was related to good financial results of enterprises. The
growth rate of deposits should be falling together with the acceleration of investments funded
mainly from own funds.
15 Figure 17 does not include all types of financial assets of households, particularly shares in their possession.
0
50
100
150
200
250
300
350
400
01q1 01q3 02q1 02q3 03q1 03q3 04q1 04q3 05q1 05q3
PLN billion bank deposits notes and coin in circulation investment funds Treasury instruments

39
Figure 18
Deposits of enterprises, annual growth rate, data adjusted for the impact of exchange rate
fluctuations
0
5
10
15
20
25
30
35
40
Jan-04
Mar-04
May-04
Jul-04
Sep-04
Nov-04
Jan-05
Mar-05
May-05
Jul-05
Sep-05
Nov-05
%
Source: NBP data.
Monetary aggregates
The above described changes in loans and deposits found reflection in the developments in
monetary aggregates. The annual growth rate of broad M3 money remained at the level of approx.
10% throughout the year. In December 2005 it stood at 10.4% in nominal terms (9.7% in real terms,
deflated with the current CPI). Narrow money M1 was growing faster than M3. The annual growth
rate of M1 at the end of the year reached 18.3% in nominal terms (17.5% in real terms, deflated with
the current CPI). After a period of decline in 2004, the growth rate of notes and coin in circulation in
2005 was growing to reach the value of 12.7%, in nominal terms in December (11.9% in real terms,
deflated with the CPI). The temporary drop in the growth rate of notes and coin in circulation in
2004 resulted from the shift in the structure of the narrow money supply (M1).

40
Table 6
Money supply in 2004 and 2005 as at 31 Dec 2004 as at 31 Dec 2005 Growth Annual nominal
growth rate Annual real growth rate*
PLN million PLN million PLN million % %
M1 money supply 175 815.4 208 033.6 32 218.2 18.3 17.5 M3 money supply 373 409.1 412 346.0 38 936.9 10.4 9.7 Notes and coin in circulation 50 710.2 57 154.7 6 444.5 12.7 11.9
Deposits and other liabilities 315 672.3 345 340.0 29 667.6 9.4 8.6
Households 196 524.5 203 549.1 7 024.6 3.6 2.9 Non-monetary financial institutions 11 395.8 15 180.6 3 784.8 33.2 32.3
Non-financial corporations 85 099.9 99 415.6 14 315.7 16.8 16.0
Non-profit institutions serving households 8 937.7 9 708.1 770.4 8.6 7.9
Local governments 11 320.7 13 702.0 2 381.2 21.0 20.2 Social security funds 2 393.6 3 784.5 1 390.9 58.1 57.0 Other M3 components 7 026.6 9 851.4 2 824.8 40.2 39.2 * Deflator: consumer goods and services price index (CPI) Source: NBP data.
Table 7
Claims and liabilities of the banking system in 2004 and 2005 as at 31 Dec 2004 as at 31 Dec 2005 Growth Annual nominal
growth rate Annual real growth rate*
PLN million PLN million PLN million % %
Total claims 272757.5 303300.3 30542.8 11.2 10.4 Households 114996.9 141251.8 26254.9 22.8 22.0 Non-monetary financial institutions 15564.6 15946.7 382.1 2.5 1.7
Non-financial corporations 123328.5 126459.9 3131.4 2.5 1.8
Non-profit institutions serving households 714.9 835.9 121.0 16.9 16.1
Local governments 13349.3 14253.8 904.6 6.8 6.0 Social security funds 4803.4 4552.2 -251.2 -5.2 -5.9 * Deflator: consumer goods and services price index (CPI) Source: NBP data.

41
Figure 19
Monetary aggregates M3 and M1, notes and coin in circulation, annual growth rates
Source: NBP data.
Figure 20
Share of cash money in M1 monetary aggregate
Source: NBP data.
-5
0
5
10
15
20
25
Mar-01
Sep-01
Mar-02
Sep-02
Mar-03
Sep-03
Mar-04
Sep-04
Mar-05
Sep-05
% M3 M1 notes and coin in circulation
26
28
30
32
34
36
Mar-02
Jul-02
Nov-02
Mar-03
Jul-03
Nov-03
Mar-04
Jul-04
Nov-04
Mar-05
Jul-05
Nov-05
% share of notes and coin in circulation in M1

42
Appendix 5. Inflation projections of the NBP
Inflation Report prepared quarterly by the MPC, together with its attached inflation
projection prepared by the NBP’s economists is a very important instrument of communication with
market participants. The Inflation Report is a document presenting the Monetary Policy Council’s
assessment of the current and future macroeconomic developments influencing inflation. It is worth
pointing out that due to the change in the time of releasing GUS data on national accounts, the
publication schedule of Inflation Reports was modified in 2005. As a result, after the February, May
and August Reports, the preparation of the next projection and Report was postponed from
November 2005 to January 2006.
In view of the need to account for delays in the transmission mechanism of monetary policy
impulses, in pursuing its forward-looking policy, the MPC made use of, among other things,
inflation projections. At the same time, the inclusion of projection results and the assessment of the
balance of factors influencing future inflation into Inflation Reports warranted the transparency of
the implemented monetary policy.
Ever since August 2004 Inflation Reports have included the results of inflation projections
(and since May 2005 – also GDP projection results). The projection presented in Chapter 4 of the
Report is prepared with the use of an econometric model of the Polish economy, called ECMOD16,
by a team of NBP economists. The projection horizon encompasses the year of its preparation and
two subsequent calendar years. The inflation projection is one of the inputs to the Monetary Policy
Council’s decision-making process on NPB interest rates.
The below presented fan charts depict the results of projections published in 2005. Fan charts
only reflect the main sources of uncertainty (e.g. uncertainty connected with exogenous
assumptions). The types of uncertainty not accounted for in the fan chart are discussed in detail in
projection descriptions in Inflation Reports (see Box below).
16 Description of the model was published in: Fic T., Kolasa M., Kot A., Murawski K., Rubaszek M., Tarnicka M., “Model gospodarki polskiej ECMOD”[ECMOD – a model of the Polish economy], Materiały i Studia, NBP, No. 194, May 2005.

43
Figure 21 Central inflation projection, fan chart of future inflation path and inflation target of the MPC
– February 2005
Source: Inflation Report, February 2005, NBP.
Figure 22 Central inflation projection, fan chart of future inflation path and inflation target of the MPC
– May 2005
-3
-2
-1
0
1
2
3
4
5
6
7
8
9
03q1 03q3 04q1 04q3 05q1 05q3 06q1 06q3 07q1 07q3
per cent
-3
-2
-1
0
1
2
3
4
5
6
7
8
9
Source: Inflation Report, May 2005, NBP.
Figure 23 Central inflation projection, fan chart of future inflation path and inflation target of the MPC
– August 2005
Source: Inflation Report, August 2005, NBP.
-3 -2 -1 0 1 2 3 4 5 6 7 8 9
03q1 03q3 04q1 04q3 05q1 05q3 06q1 06q3 07q1 07q3
per cent
-3-2-10 1 2 3 4 5 6 7 8 9
-3 -2 -1 0 1 2 3 4 5 6 7 8 9
03q1 03q3 04q1 04q3 05q1 05q3 06q1 06q3 07q1 07q3
per cent
-3 -2 -1 0123456789

44
How should fan charts be interpreted?
Every projection of future values of economic variables is subject to risk and uncertainty.
Central banks present the size and scope of quantifiable inflation projection risk through the use
of fan charts. The width of the “fan” corresponds to the overall level of risk, which usually
changes from quarter to quarter. The further ahead, the wider it gets, as the uncertainty of the
assessments of the future usually grows proportionally to the length of the time horizon.
In inflation projections prepared by the NBP, probability distribution of their possible
realisations is determined for each quarter. The most probable realisations, i.e. the mode of the
distributions in particular quarters, are adopted as the central projection. At the same time, 30-
percent confidence intervals are constructed around distribution medians. These constitute the
central band of the fan, indicated with the darkest shade. Thus, the probability of inflation settling
within this band is equal to 30%. Next the fan is expanded on both sides so that the probability of
the variable running between the extended boundaries increases by another 30 percentage points
– 15 points on the above, and 15 on the below. The subsequent extensions create successive
bands of the fan marked with increasingly lighter shades. The entire fan represents a 90-percent
band of confidence around the medians – there is a 90-percent probability of inflation running
within the fan.
For example, the chart in Figure 23, which refers to the August inflation projection, shows
that the probability of inflation staying in 2006 Q1 within the tolerance band around the inflation
target amounted to approx. 52%, the probability of higher inflation was equal to approx. 1%,
whereas the probability of lower inflation could be assessed at approx. 47%. For 2007 Q1 these
probabilities corresponded to 42%, 20% and 38%, respectively. Except for 2006 Q3 and 2007
Q1, the inflation projection was characterised by positive asymmetry, which reflects a greater
probability of inflation running above the central path than below it.
Fan charts depict the uncertainty associated with assumptions exogenous to the projection
model and connected with the inaccuracy of the model’s statistical mapping of the relations
holding between macroeconomic variables. Fan charts, however, do not account for all kinds of
uncertainty, such as the uncertainty related to possible changes in the structure of the Polish
economy, the approximate nature of any replication of economic reality by a model or the
potential instability of estimated relationships in time. A detailed discussion of the sources of
uncertainty not accounted for in the fan chart can be found in Inflation Reports.

45
App
endi
x 6.
Vot
ing
reco
rds
of M
onet
ary
Polic
y C
ounc
il m
embe
rs o
n m
otio
ns a
nd
reso
lutio
ns in
200
5
Dat
e Su
bjec
t mat
ter
of m
otio
n or
res
olut
ion
MPC
dec
isio
n V
otin
g of
the
Cou
ncil
mem
bers
26 Ja
nuar
y 20
05
Mot
ion
to c
hang
e th
e m
onet
ary
polic
y bi
as fr
om ti
ghte
ning
to n
eutra
l Th
e m
otio
n w
as n
ot p
asse
d (d
ue to
tie
vote
, the
vot
e of
the
Cha
irman
pr
evai
led)
For:
J. C
zeka
j M
. Pie
trew
icz
S. N
ieck
arz
A
. Sła
wiń
ski
A. W
ojty
na
Aga
inst
: L. B
alce
row
icz
D. F
ilar
M. N
oga
S. O
wsi
ak
H. W
asile
wsk
a-Tr
enkn
er
25 F
ebru
ary
2005
M
otio
n to
cha
nge
the
mon
etar
y po
licy
bias
from
tigh
teni
ng to
neu
tral
The
mot
ion
did
not r
ecei
ve a
maj
ority
vo
te
For:
L. B
alce
row
icz
D. F
ilar
M. N
oga
H. W
asile
wsk
a-Tr
enkn
er
Aga
inst
: J. C
zeka
j S.
Nie
ckar
z
S. O
wsi
ak
M. P
ietre
wic
z
A. Sła
wiń
ski
A
. Woj
tyna
25
Feb
ruar
y 20
05
Mot
ion
to c
hang
e th
e m
onet
ary
polic
y bi
as fr
om ti
ghte
ning
to e
asin
g Th
e M
PC c
hang
ed it
s mon
etar
y po
licy
bias
from
tigh
teni
ng to
eas
ing
For:
J. C
zeka
j S.
Nie
ckar
z
S. O
wsi
ak
M. P
ietre
wic
z
A. Sła
wiń
ski
A. W
ojty
na

46
Aga
inst
: L. B
alce
row
icz
D. F
ilar
M. N
oga
H. W
asile
wsk
a-Tr
enkn
er
30 M
arch
200
5 Re
solu
tion
on th
e le
vel o
f ref
eren
ce ra
te,
lom
bard
rate
, dep
osit
rate
and
redi
scou
nt
rate
of t
he N
atio
nal B
ank
of P
olan
d
The
MPC
redu
ced
the
leve
l of a
ll in
tere
st ra
tes b
y 0.
5 pe
rcen
tage
poi
nt
For:
L. B
alce
row
icz
J.
Cze
kaj
S. N
ieck
arz
M. N
oga
S. O
wsi
ak
M. P
ietre
wic
z A
. Sła
wiń
ski
H. W
asile
wsk
a-Tr
enkn
er
A. W
ojty
na
Aga
inst
: D. F
ilar
26 A
pril
2005
Re
solu
tion
to a
ppro
ve th
e A
nnua
l Fi
nanc
ial R
epor
t of t
he N
atio
nal B
ank
of
Pola
nd p
repa
red
as o
f 31
Dec
embe
r 200
4
Fo
r:
L
. Bal
cero
wic
z J.
Cze
kaj
D. F
ilar
S. N
ieck
arz
M. N
oga
S. O
wsi
ak
M. P
ietre
wic
z A
. Sła
wiń
ski
H. W
asile
wsk
a-Tr
enkn
er
A. W
ojty
na
27 A
pril
2005
Re
solu
tion
on th
e le
vel o
f the
refe
renc
e ra
te, l
omba
rd ra
te, d
epos
it ra
te a
nd
redi
scou
nt ra
te o
f the
Nat
iona
l Ban
k of
Po
land
All
inte
rest
rate
s red
uced
by
0.5
perc
enta
ge p
oint
For:
L. B
alce
row
icz
J. C
zeka
j D
. Fila
r S.
Nie
ckar
z M
. Nog
a S.
Ow
siak
M
. Pie
trew
icz
A. Sła
wiń
ski
H. W
asile
wsk
a-Tr
enkn
er
A. W
ojty
na

47
27 A
pril
2005
M
otio
n to
cha
nge
the
mon
etar
y po
licy
bias
from
eas
ing
to n
eutra
l Th
e M
PC c
hang
ed it
s mon
etar
y po
licy
bias
For:
L. B
alce
row
icz
J. C
zeka
j D
. Fila
r S.
Nie
ckar
z M
. Nog
a S.
Ow
siak
M
. Pie
trew
icz
A. Sła
wiń
ski
H. W
asile
wsk
a-Tr
enkn
er
A. W
ojty
na
24 M
ay 2
005
Reso
lutio
n to
app
rove
the
Repo
rt on
M
onet
ary
Polic
y Im
plem
enta
tion
in 2
004
Fo
r:
L
. Bal
cero
wic
z J.
Cze
kaj
D. F
ilar
S. N
ieck
arz
M. N
oga
S. O
wsi
ak
M. P
ietre
wic
z A
. Sła
wiń
ski
H. W
asile
wsk
a-Tr
enkn
er
A. W
ojty
na
24 M
ay 2
005
Reso
lutio
n as
sess
ing
the
activ
ities
of
NB
P M
anag
emen
t Boa
rd a
s reg
ards
m
onet
ary
polic
y im
plem
enta
tion
in 2
004
Fo
r:
L
. Bal
cero
wic
z J.
Cze
kaj
D. F
ilar
S. N
ieck
arz
M. N
oga
S. O
wsi
ak
M. P
ietre
wic
z A
. Sła
wiń
ski
H. W
asile
wsk
a-Tr
enkn
er
A. W
ojty
na
24 M
ay 2
005
Reso
lutio
n to
app
rove
the
Repo
rt on
the
Ope
ratio
ns o
f the
Nat
iona
l Ban
k of
Po
land
in 2
004
Fo
r:
L
. Bal
cero
wic
z J.
Cze
kaj
D. F
ilar
S. N
ieck
arz

48
M. N
oga
S. O
wsi
ak
M. P
ietre
wic
z A
. Sła
wiń
ski
H. W
asile
wsk
a-Tr
enkn
er
A. W
ojty
na
25 M
ay 2
005
Mot
ion
to c
hang
e th
e m
onet
ary
polic
y bi
as fr
om n
eutra
l to
easi
ng
The
mot
ion
was
not
pas
sed
(due
to ti
e vo
te, t
he v
ote
of th
e C
hairm
an
prev
aile
d)
For:
J. C
zeka
j S.
Ow
siak
M
. Pie
trew
icz
A
. Sła
wiń
ski
A. W
ojty
na
Aga
inst
: L. B
alce
row
icz
D. F
ilar
S. N
ieck
arz
M
. Nog
a
H. W
asile
wsk
a-Tr
enkn
er
29 Ju
ne 2
005
Reso
lutio
n on
the
leve
l of t
he re
fere
nce
rate
, lom
bard
rate
, dep
osit
rate
and
re
disc
ount
rate
of t
he N
atio
nal B
ank
of
Pola
nd
All
inte
rest
rate
s red
uced
by
0.5
perc
enta
ge p
oint
Fo
r:
L
. Bal
cero
wic
z J.
Cze
kaj
D. F
ilar
S. N
ieck
arz
M. N
oga
S. O
wsi
ak
M. P
ietre
wic
z A
. Sła
wiń
ski
H. W
asile
wsk
a-Tr
enkn
er
A. W
ojty
na
29 Ju
ne 2
005
Mot
ion
to c
hang
e th
e m
onet
ary
polic
y bi
as fr
om n
eutra
l to
easi
ng
The
MPC
cha
nged
its m
onet
ary
polic
y bi
as
For:
J. C
zeka
j S.
Nie
ckar
z
S. O
wsi
ak
M. P
ietre
wic
z
A. Sła
wiń
ski
A. W
ojty
na
Aga
inst
: L. B
alce
row
icz
D. F
ilar

49
M. N
oga
H
. Was
ilew
ska-
Tren
kner
27
July
200
5 Re
solu
tion
on th
e le
vel o
f the
refe
renc
e ra
te, l
omba
rd ra
te, d
epos
it ra
te a
nd
redi
scou
nt ra
te o
f the
Nat
iona
l Ban
k of
Po
land
All
inte
rest
rate
s red
uced
by
0.25
pe
rcen
tage
poi
nt
For:
J. C
zeka
j S.
Nie
ckar
z
S. O
wsi
ak
M. P
ietre
wic
z
A. Sła
wiń
ski
A. W
ojty
na
Aga
inst
: L. B
alce
row
icz
D. F
ilar
M. N
oga
H. W
asile
wsk
a-Tr
enkn
er
27 Ju
ly 2
005
Mot
ion
to m
aint
ain
the
easi
ng m
onet
ary
polic
y bi
as
Mot
ion
rece
ived
a m
ajor
ity v
ote
– th
e M
PC m
aint
aine
d its
eas
ing
mon
etar
y po
licy
bias
For:
J. C
zeka
j S.
Nie
ckar
z
S. O
wsi
ak
M. P
ietre
wic
z
A. Sła
wiń
ski
A. W
ojty
na
Aga
inst
: L. B
alce
row
icz
D. F
ilar
M. N
oga
H. W
asile
wsk
a-Tr
enkn
er
27 Ju
ly 2
005
Mot
ion
to c
hang
e th
e m
onet
ary
polic
y bi
as fr
om e
asin
g to
neu
tral
Mot
ion
did
not r
ecei
ve a
maj
ority
vot
e –
the
MPC
mai
ntai
ned
its e
asin
g m
onet
ary
polic
y bi
as
For:
L. B
alce
row
icz
D. F
ilar
M. N
oga
H
. Was
ilew
ska-
Tren
kner
A
gain
st: J
. Cze
kaj
S. N
ieck
arz
S.
Ow
siak
M
. Pie
trew
icz
A
. Sła
wiń
ski
A. W
ojty
na
31 A
ugus
t 200
5 Re
solu
tion
on th
e le
vel o
f the
refe
renc
e ra
te, l
omba
rd ra
te, d
epos
it ra
te a
nd
Red
uctio
n of
the
refe
renc
e ra
te,
lom
bard
rate
and
dep
osit
rate
by
0.25
Fo
r:
J
. Cze
kaj
S. N
ieck
arz

50
redi
scou
nt ra
te o
f the
Nat
iona
l Ban
k of
Po
land
perc
enta
ge p
oint
, and
redi
scou
nt ra
te b
y 0.
5 pe
rcen
tage
poi
nt
S. O
wsi
ak
M. P
ietre
wic
z
A. Sła
wiń
ski
A. W
ojty
na
Aga
inst
: L. B
alce
row
icz
D. F
ilar
M. N
oga
H. W
asile
wsk
a-Tr
enkn
er
31 A
ugus
t 200
5 M
otio
n to
cha
nge
the
mon
etar
y po
licy
bias
from
eas
ing
to n
eutra
l
Mot
ion
did
not r
ecei
ve a
maj
ority
vot
e –
the
MPC
mai
ntai
ned
its e
asin
g m
onet
ary
polic
y bi
as
For:
L. B
alce
row
icz
D. F
ilar
M. N
oga
H. W
asile
wsk
a-Tr
enkn
er
Aga
inst
: J. C
zeka
j S.
Nie
ckar
z
S. O
wsi
ak
M. P
ietre
wic
z
A. Sła
wiń
ski
A. W
ojty
na
27 S
epte
mbe
r 200
5 Re
solu
tion
esta
blis
hing
the
uppe
r lim
it fo
r lia
bilit
ies i
ncur
red
by th
e N
atio
nal
Bank
of P
olan
d by
way
of l
oans
from
fo
reig
n ba
nkin
g an
d fin
anci
al in
stitu
tions
Fo
r:
L
. Bal
cero
wic
z J.
Cze
kaj
D. F
ilar
S. N
ieck
arz
M. N
oga
S. O
wsi
ak
M. P
ietre
wic
z A
. Sła
wiń
ski
H. W
asile
wsk
a-Tr
enkn
er
A. W
ojty
na
28 S
epte
mbe
r 200
5 M
otio
n fo
r the
Mon
etar
y Po
licy
Cou
ncil
to c
ease
ann
ounc
ing
its m
onet
ary
polic
y bi
as
The
mot
ion
rece
ived
a m
ajor
ity v
ote
– th
e M
PC d
ecid
ed n
ot to
ann
ounc
e its
m
onet
ary
polic
y bi
as a
ny m
ore
For:
L. B
alce
row
icz
D. F
ilar
M. N
oga
S. O
wsi
ak
M. P
ietre
wic
z H
. Was
ilew
ska-
Tren
kner

51
Aga
inst
: J. C
zeka
j S.
Nie
ckar
z A
. Sła
wiń
ski
A. W
ojty
na
28 S
epte
mbe
r 200
5 Re
solu
tion
esta
blis
hing
mon
etar
y po
licy
guid
elin
es fo
r 200
6
Fo
r:
L
. Bal
cero
wic
z J.
Cze
kaj
D. F
ilar
S. N
ieck
arz
M. N
oga
S. O
wsi
ak
M. P
ietre
wic
z A
. Sła
wiń
ski
H. W
asile
wsk
a-Tr
enkn
er
A. W
ojty
na
25 O
ctob
er 2
005
Reso
lutio
n to
app
oint
a c
ertif
ied
audi
tor
to a
udit
NBP
ann
ual f
inan
cial
stat
emen
ts
for t
he b
usin
ess y
ear 2
005
and
for t
he
year
200
6
Fo
r:
L
. Bal
cero
wic
z J.
Cze
kaj
D. F
ilar
S. N
ieck
arz
M. N
oga
S. O
wsi
ak
M. P
ietre
wic
z A
. Sła
wiń
ski
H. W
asile
wsk
a-Tr
enkn
er
A. W
ojty
na
30 N
ovem
ber 2
005
Mot
ion
to c
hang
e th
e m
onet
ary
polic
y bi
as fr
om e
asin
g to
neu
tral
Mot
ion
did
not r
ecei
ve a
maj
ority
vot
e –
the
MPC
mai
ntai
ned
its e
asin
g m
onet
ary
polic
y bi
as
For:
L. B
alce
row
icz
D. F
ilar
M. N
oga
H. W
asile
wsk
a-Tr
enkn
er
Aga
inst
: J. C
zeka
j S.
Nie
ckar
z
S. O
wsi
ak
M. P
ietre
wic
z
A. Sła
wiń
ski
A. W
ojty
na

52
20 D
ecem
ber 2
005
Reso
lutio
n to
app
rove
the
Fina
ncia
l Pla
n of
the
Nat
iona
l Ban
k of
Pol
and
Fo
r:
L
.Bal
cero
wic
z
J.Cze
kaj
D
.Fila
r
S.N
ieck
arz
M
.Nog
a
S.O
wsi
ak
M
.Pie
trew
icz
A
.Sła
wiń
ski
H
.Was
ilew
ska-
Tren
kner
A.W
ojty
na
20 D
ecem
ber 2
005
Reso
lutio
n am
endi
ng th
e re
solu
tion
on
acco
untin
g po
licie
s, th
e st
ruct
ure
of
asse
ts a
nd li
abili
ties i
n th
e B
alan
ce S
heet
an
d th
e Pr
ofit
and
Loss
Acc
ount
of t
he
Nat
iona
l Ban
k of
Pol
and
Fo
r:
L
.Bal
cero
wic
z
J.Cze
kaj
D
.Fila
r
S.N
ieck
arz
M
.Nog
a
S.O
wsi
ak
M
.Pie
trew
icz
A
.Sła
wiń
ski
H
.Was
ilew
ska-
Tren
kner
A.W
ojty
na
20 D
ecem
ber 2
005
Reso
lutio
n am
endi
ng th
e re
solu
tion
on
the
rule
s of c
ondu
ctin
g op
en m
arke
t op
erat
ions
Fo
r:
L
.Bal
cero
wic
z
J.Cze
kaj
D
.Fila
r
S.N
ieck
arz
M
.Nog
a
S.O
wsi
ak
M
.Pie
trew
icz
A
.Sła
wiń
ski
H
.Was
ilew
ska-
Tren
kner
A.W
ojty
na