Embed Size (px)
Citation preview


NATIONAL BANK OF ROMANIA
Financial Stability Report
2013

Note
The Financial Stability Report was prepared by the Financial Stability Department and coordinated by Mr. Cristian Popa, Deputy Governor of the National Bank of Romania.
The Report was examined by the Supervisory Committee in its meeting on 9 September 2013. These bodies approved the main assessments of the Report and its fi nal version was approved by the National Bank of Romania Board in its meeting on 17 October 2013.
The analyses draw on the information available by 10 October 2013.
All rights reserved.Reproduction for educational and non-commercial purposes is permitted provided that the source is acknowledged.
National Bank of Romania, 25 Lipscani Street, postal code 030031, BucharestTelephone: 4021/312 43 75; fax: 4021/314 97 52Website: http://www.bnr.ro.
ISSN 1843-3251 (print)ISSN 1843-326X (online)

Abbreviations
BIS Bank for International SettlementsBSE Bucharest Stock ExchangeCCR Central Credit RegisterCDS credit default swapsCEE Central and Eastern EuropeEBA European Banking AuthorityEBIT earnings before interest and taxesEC European CommissionECB European Central BankESA European System of AccountsESRB European Systemic Risk BoardEU European UnionEurostat Statistical Offi ce of the European UnionFDI foreign direct investmentFSA Financial Supervisory AuthorityGDP gross domestic productGVA gross value addedIFRS International Financial Reporting StandardsIMF International Monetary FundLTV loan to valueMPF Ministry of Public FinanceNBFIs non-bank fi nancial institutionsNBR National Bank of RomaniaNIS National Institute of StatisticsNPLs non-performing loansNSC National Securities CommissionNTRO National Trade Register Offi cePIR Payment Incidents RegisterROA return on assetsROBOR Romanian Bid Offered Interest RateROE return on equitySMEs small- and medium-sized enterprises


Contents
1. OVERVIEW..........................................................................................................................7
2. INTERNATIONAL ECONOMIC AND FINANCIAL ENVIRONMENT....................17
3. FINANCIAL SYSTEM AND ITS RELATED RISKS.....................................................243.1. Structure of the fi nancial system...................................................................................................24
3.2. Banking sector..............................................................................................................................26
3.2.1. Challenges to the Romanian banking sector in the context of current vulnerabilities of the euro area fi nancial system................................................................26
3.2.2. Structural developments......................................................................................................27
3.2.3. Aggregate balance sheet of credit institutions.....................................................................31
3.2.3.1. Dynamics of bank assets........................................................................................32
3.2.3.2. Developments in own, raised and borrowed funds...............................................36
3.2.4. Capital adequacy..................................................................................................................38
3.2.4.1. Developments in own funds of banks, Romanian legal entities............................38
3.2.4.2. Analysis of capital adequacy indicators.................................................................41
3.2.5. Loans and credit risk...........................................................................................................46
3.2.5.1. Main credit developments.....................................................................................47
3.2.5.2. Loan quality...........................................................................................................54
3.2.6. Liquidity risk......................................................................................................................59
3.2.7. Market risk..........................................................................................................................64
3.2.8. Profi tability and effi ciency..................................................................................................66
3.2.9. Results of the banking sector solvency stress test..............................................................69
3.3. Non-bank fi nancial sector.............................................................................................................70
3.3.1. Insurance sector...................................................................................................................70
3.3.2. Private pension funds..........................................................................................................72
3.3.3. Non-bank fi nancial institutions...........................................................................................74
3.4. Financial markets..........................................................................................................................78
3.4.1. Money market.....................................................................................................................78
3.4.2. Government securities market............................................................................................82
3.4.3. Foreign exchange market....................................................................................................86
3.4.4. Capital market.....................................................................................................................88

4. RISKS RELATED TO DOMESTIC ECONOMIC AND FINANCIAL DEVELOPMENTS............................................................................914.1. Domestic macroeconomic developments.....................................................................................91
4.1.1. Real sector...........................................................................................................................91
4.1.2. Public sector........................................................................................................................94
4.2. Corporate and household lending.................................................................................................96
4.3. External balance.........................................................................................................................105
4.3.1. Current account defi cit......................................................................................................105
4.3.2. Capital fl ows.....................................................................................................................111
5. NON-FINANCIAL CORPORATIONS AND HOUSEHOLDS....................................1165.1. Risks generated by non-fi nancial corporations...........................................................................116
5.1.1. Non-fi nancial corporations’ economic and fi nancial results.............................................116
5.1.2. Payment discipline of non-fi nancial corporations.............................................................120
5.2. Risks stemming from the households’ sector.............................................................................127
5.2.1. Households’ balance sheet and saving behaviour.............................................................127
5.2.2. Households’ capacity to service debt................................................................................132
5.3. Risks generated by the real-estate sector and mortgage-backed lending...................................138
6. FINANCIAL SYSTEM INFRASTRUCTURE – STABILITY OF PAYMENT AND SECURITIES SETTLEMENT SYSTEMS.........1446.1. Stability of ReGIS payment system............................................................................................144
6.2. Stability of SENT – the small-value payment system................................................................146
6.3. Securities settlement systems......................................................................................................148
6.4. The extension of central bank’s tasks in the fi eld of payments..................................................153
7. RECENT DEVELOPMENTS AND OUTLOOK..........................................................1547.1. CRD IV/CRR impact on the Romanian banking system...........................................................154
7.1.1. Capital requirements laid down in CRD IV/CRR............................................................155
7.1.2. Credit institutions’ liquidity in the context of the CRR...................................................162
7.2. Recent developments in the prudential regulatory framework...................................................164
7.2.1. The National Committee for Macroprudential Oversight.................................................164
7.2.2. The Banking Union...........................................................................................................165

FINANCIAL STABILITY REPORT 2013 7
1 OVERVIEW
Financial stability has remained robust since the release of the previous Report, in September 2012. Financial stability has stood up to the ongoing challenges amid the further diffi cult international environment, the improvement in the balance of risks generated by domestic macroeconomic developments notwithstanding. The major weaknesses of the banking sector, namely the signifi cant level of non-performing loans – in the context of the negative dynamics of lending to the private sector – and the faster cross-border deleveraging, are further manageable. Solvency, provisioning and liquidity levels have continued to be adequate, enabling the banking sector to overcome any moderately unfavourable developments without major diffi culties. The main challenges to fi nancial stability over the period ahead are posed, the same as in most EU economies, by the sustainable resumption of lending, against the background of ongoing and even faster deleveraging internationally, and the adequate management of bank asset quality, also by striking a functional balance between the costs and benefi ts of various alternatives in addressing non-performing exposures.
The successful completion of the precautionary fi nancing arrangement with the European Union, the International Monetary Fund and the World Bank and the signing of a similar agreement conducive to the furthering of reforms meant to consolidate domestic macrostability and the Romanian fi nancial system contribute to the preservation of fi nancial stability.
The domestic banking sector has continued to be well insulated against detrimental developments both locally and internationally. Firstly, the level and quality of own funds has remained adequate: (i) the solvency ratio stood at a comfortable 14.7 percent in June 2013, considerably above the minimum required value of 8 percent; (ii) own funds consist mainly of items with a high and very high loss-absorption capacity (Tier 1 capital ratio of 13.6 percent in June 2013), and (iii) the NBR decided to keep in place prudential fi lters when calculating own funds and bank prudential indicators throughout 2013 (so that, de facto, the solvency indicators continue to be around 4 percentage points higher than the reported levels), before gradually phasing out these fi lters during 2014-2018, following the implementation of Basel III additional capital requirements.
The results of the banking sector solvency stress test spanning 2013 Q3 – 2015 Q2 show that, overall, credit institutions remain resilient to signifi cant adverse macroeconomic shocks, further maintaining an adequate level of the solvency ratio. Under an adverse scenario, incorporating a depreciation of the domestic currency by over 20 percent and a prolonged recession, assuming default rates comparable to those seen during 2009, the solvency ratio of the Romanian banking system (at aggregate level) would decrease by approximately 4 percentage points to 10.8 percent, remaining above the prudential threshold set by the NBR. As regards a few small-sized credit institutions, their lower share of interest-bearing assets in total assets, together with their strategy of covering fi xed costs via above-average interest margins, amid a riskier loan portfolio structure (meaning that the ratio of risk-weighted assets to total assets is considerably higher for these banks compared to the rest of the sector) as well as some specifi c issues relating to the management of interest rate risk, could call for additional capital or taking steps towards reducing the level of risk-weighted assets.

NATIONAL BANK OF ROMANIA8
1 Overview
Secondly, the degree of NPL coverage with IFRS provisions and prudential fi lters has remained at a comfortable level, i.e. 89.5 percent as of August 2013, one of the highest readings in the region. Such a prudent stance adds to the constraints still affecting credit institutions’ fi nancial results.
In 2012, the domestic banking sector incurred losses (lei 2.3 billion), owing to the considerable increase in the volume of credit risk provisions, against the backdrop of higher NPL volumes and collateral revaluation. Nevertheless, the profi tability levels of larger banks generally stayed in positive territory. At the end of August 2013, the domestic banking sector reported a profi t of lei 1.5 billion on account of lower provisioning costs when compared to the same period of the previous year, as well as the reduction in fi nancing costs amid the improvement in Romania’s sovereign risk perception. The ROA and ROE profi tability indicators returned to positive territory, i.e. 0.6 percent and 5.9 percent respectively. The sustainable resumption of lending to the private sector is, however, the key prerequisite for fi nancial results to remain positive over the longer term.
The relatively high non-performing loan ratio, which has a detrimental impact on bank profi tability, is also due to bank portfolios further comprising a signifi cant share of borrowers with overdue loans, including those with a proven very low likelihood of repayment. For instance, as regards the portfolio of household loans, around 70 percent of non-performing borrowers (recipients of either real-estate credit or mortgage-backed consumer credit) had been in a state of default for more than a year or had recorded multiple defaults as of June 2013. Banks resorted on a relatively wide scale to loan restructuring/rescheduling and foreclosure, yet the effectiveness of these NPL management techniques has so far remained below potential. Other two alternatives, i.e. disposal of claims and debt cancellation, were less resorted to, although they might prove more effective in cleaning up credit institutions’ balance sheets. The most visible positive effect of a wider recourse to the aforementioned solutions would be the improved image of the domestic banking sector via a reduction in the volume of low-quality assets. For example, the removal from the balance sheet of any non-performing exposures vis-à-vis the corporate sector (through disposal of claims or debt cancellation) would diminish this sector’s NPL ratio from 23.4 percent (the August 2013 reading) to 7.5 percent. This would result from the contraction in the large volume of non-performing loans generated by borrowers with a low likelihood of servicing their debt (loans overdue for more than 365 days amounted to lei 19.7 billion, making up 74 percent of total NPLs, as of August 2013).
Thirdly, banks’ liquidity position has remained adequate, with suffi cient buffers to weather any adverse developments such as a reduction in funding by parent banks or potential shocks related to the early withdrawal of corporate and household deposits. The NBR ensured the adequate management of liquidity across the banking sector, inter alia by supplementing the regulatory framework and providing liquidity via weekly repos. In addition, during 2013 H1, credit institutions’ recourse to central bank reserves supplied via repos declined systematically, given the progressive rise in the volume of structural liquidity in the banking system. These developments helped abate the volatility of interbank money market rates and enhance the transmission of monetary policy signals, resulting in the gradual and sustainable narrowing of the spread between lei- and euro-denominated interest rates.
Parent banks’ exposure to their subsidiaries in Romania has so far diminished in an orderly manner, although at a faster pace since end-2012, with subsidiaries offsetting the 26.2 percent reduction seen December 2011 through August 2013 (from EUR 20.3 billion to EUR 15 billion) by raising deposits on the domestic market. Deleveraging effects to date have been largely corrective: banks’ reliance on

FINANCIAL STABILITY REPORT 2013 9
1 Overview
external fi nancing has gradually declined, the relatively high degree of household indebtedness has inched down, while the business sectors with the potential to sustainably alter Romania’s economic growth pattern have generally received additional funding compared to the other sectors. Assuming the deleveraging process that the major banking groups embarked upon continued to gain pace, entailing liquidity shocks across the domestic banking sector over a short time horizon, the latter would be resilient to these unfavourable developments, certain vulnerabilities notwithstanding. According to the results of the macroprudential liquidity stress-testing exercise, challenges relate to fund conversion from lei into euro, certain asset sales and the impact on real sector funding.
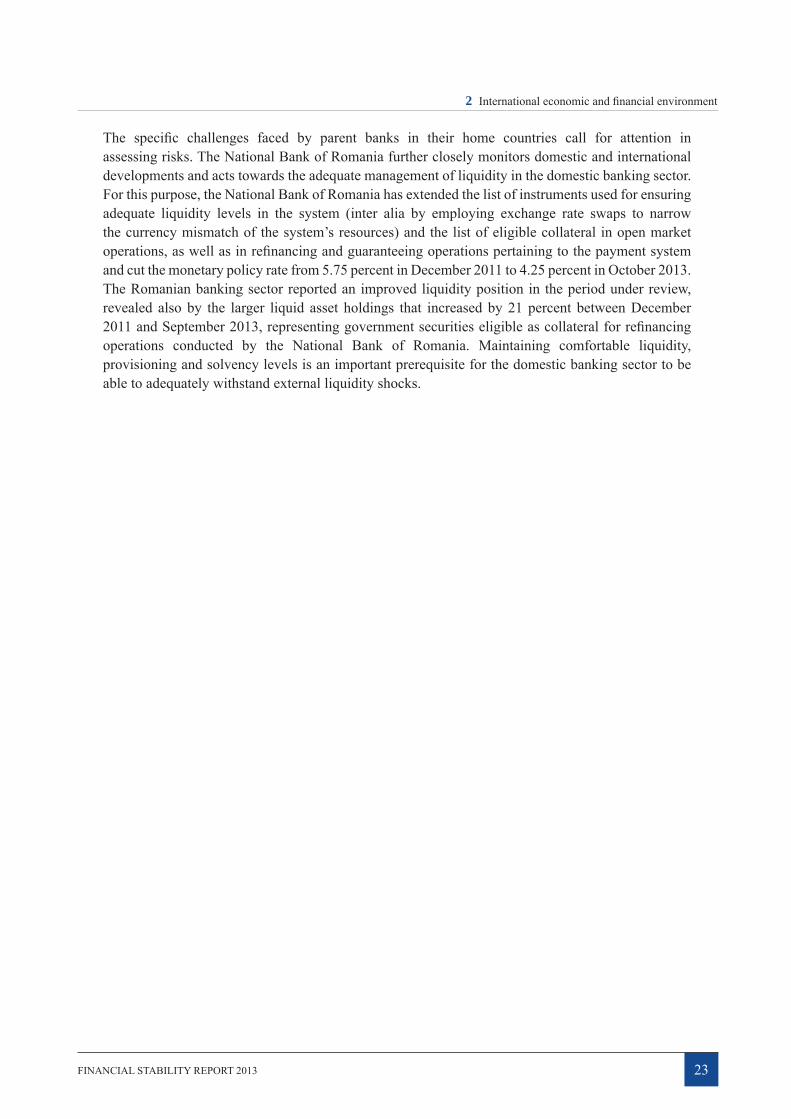
The recent events in Cyprus have not exerted a noticeable impact on the domestic fi nancial sector, since the crisis had effects only on banks with Cypriot capital (whose share in total assets of the Romanian banking sector was 1.4 percent in August 2013), with household and corporate deposits witnessing normal fl uctuations. Domestic banks owned by fi nancial institutions from euro area countries perceived by international markets as bearing the brunt of the sovereign debt crisis and of its negative feedback loops with investor concerns regarding the quality of banks’ balance sheets (the GCIIPS countries – Greece, Cyprus, Italy, Ireland, Portugal and Spain) report overall solvency ratios above the system-wide average, while the provisioning coverage ratio of non-performing loans and the asset quality are close to the system’s average. Moreover, the share of short-term external loans in total external loans of banks in this category was signifi cantly below the system-wide average in August 2013. The specifi c challenges faced by parent banks in their home countries call for attention in assessing risks. The National Bank of Romania further closely monitors local and international developments and acts towards the adequate management of liquidity in the domestic banking sector. Maintaining comfortable liquidity, provisioning and solvency levels is an important prerequisite for the Romanian banking sector to adequately weather any adverse developments, including those triggered abroad.
Aside from the orderly progress in deleveraging, two other preconditions for the sustainable resumption of lending to companies and households are the maintenance of the latest trends in terms of more balanced developments in new loans by currency and the consolidation of sustainable structural changes in banks’ business model as regards lending to non-fi nancial corporations. Keener demand for loans in domestic currency and the new steps taken by the NBR starting 2011, prompted both by the currency risk likely to impact unhedged borrowers’ capacity to service loans and by the need to comply with the relevant ESRB recommendations, have contributed to more balanced dynamics of the fl ow of new business since the release of the previous Report. For instance, the share of new EUR-denominated loans to households shrank considerably in the case of consumer loans (from 35.7 percent in 2011 to 10.3 percent December 2011 through August 2013) and to a lesser extent when looking at housing loans (from 97.8 percent in 2011 to 86.4 percent during December 2011 – August 2013). The non-performing loan ratio for foreign currency loans stood at 11.1 percent in June 2013 (versus 8.9 percent for lei-denominated credit), up 2.5 percentage points from December 2011. The volume of non-performing corporate loans in foreign currency soared 73.7 percent December 2011 through August 2013, while that of non-performing loans in lei expanded by 53 percent during the same period. After reaching 4.3 percentage points at end-2011, the gap between NPL ratios in domestic and foreign currencies was bridged in August 2013, when they came in at 23.4 percent and 23.5 percent respectively. The implementation of the “First Home” programme solely for lending in domestic currency starting August 2013 and the lower interest rates on lei-denominated credit, also in response to the central bank’s decisions to cut the monetary policy rate by a cumulated 100 basis points July through September 2013, are expected to help alleviate

NATIONAL BANK OF ROMANIA10
1 Overview
the currency mismatch in the case of housing loans as well. The same trend is also anticipated for corporate lending, since the steps taken by the NBR at end-2012 for better management of credit risk generated by unhedged borrowers are seen leading to more balanced developments in new business by currency.
Corporate funding witnessed favourable structural developments December 2011 through June 2013, the most noteworthy being: (i) lending to fi rms producing high value added goods (medium high-tech and high-tech) went up 4.3 percent, whereas the volume of loans granted to companies producing lower value added goods (low-tech and medium low-tech) contracted 1 percent; (ii) companies in the tradable sectors reported a 0.6 percent rise in fi nancing, while the non-tradable sectors posted a decline of 1.1 percent, and (iii) looking at the business profi le, agriculture reported a 20.9 percent increase in funding, followed by trade and manufacturing with an advance of 3.3 percent and 0.6 percent respectively. Furthermore, SMEs received additional fi nancing from domestic and foreign creditors (up 0.9 percent), with loans extended by domestic banks posting the fastest dynamics (2.5 percent). Conversely, lending to knowledge-intensive services companies dropped 6.2 percent, while the volume of funds channelled to less knowledge-intensive services companies stood 0.2 percent lower (nominal values adjusted for the exchange rate effect).
Financial intermediation, assessed in terms of the fi nancial system’s assets as a share in GDP, slightly decreased in 2012, given the slower economic growth rate in Romania and the ongoing tensions on global fi nancial markets. The dominant position of the banking sector weakened at end-2012 and in 2013 H1. The direct contagion risk within the Romanian fi nancial system remains subdued for the banking sector, whereas the other fi nancial institutions may be vulnerable to the concentration of exposures to domestic credit institutions or of funds raised from the latter.
Domestic and external developments had a strong bearing on the non-bank components of the fi nancial system. In particular, the insurance sector witnessed a consolidation during 2012, when the share of gross premiums written in GDP saw its previous years’ decline come to a halt. The non-life insurance market recorded positive real dynamics for the fi rst time in the past four years, with a constant share of gross claims paid in total gross premiums written. The profi tability of insurance companies remained in negative territory in 2012 as well, despite a slight improvement versus the year-earlier reading.
The private pension system is not exposed to signifi cant risks in terms of fi nancial stability, given the still low level of overall assets held by private pension funds vis-à-vis the rest of the fi nancial system and judging by the investment portfolios, which point to a low risk profi le. The performance of pension funds improved in 2012 on account of favourable domestic developments, while the share of foreign exposures in total fi nancial assets continued to narrow.
Non-bank fi nancial institutions (NBFIs) saw their business shrink slightly January 2012 through June 2013. The non-performing loan ratio of NBFIs is further high, yet the provisions set up to cover expected losses help mitigate these entities’ credit risk. NBFI profi tability returned into positive territory at end-2012, thanks to streamlining operating costs and cutting net expenses with provisions amid the improved domestic macroeconomic context.

FINANCIAL STABILITY REPORT 2013 11
1 Overview
Financial market volatility decreased in the early months of 2013. The decline in investors’ risk aversion sent short-term interbank money market rates lower and caused the yields on the government securities market to fall. However, the market saw sharper fl uctuations in the period May-June 2013, amid heightened uncertainty over the timing of the start and scale of the tapering of the US Federal Reserve’s fi nancial asset purchase programme. CDS prices for Romania’s sovereign risk were closely linked to investors’ trends across the region as a whole. In 2013, the CDS quotes hovered around 200 basis points, compared with an average of approximately 346 basis points in 2012. In June 2013, global fi nancial market strains also temporarily affected the CDS prices, but the volatility peak remained below the previous years’ levels thanks to the improvement in economic fundamentals, which fostered a reduction in the volatility of exposure to Romania compared to other countries and a relative balancing of short-term capital movements.
Lending and risk profi le of the fi nancial system were under the mixed impact of the domestic and global macroeconomic environment. The balance of risks stemming from domestic macroeconomic developments improved as against that presented in the previous Report: economic growth stayed in positive territory at 0.7 percent in 2012, even though it was further below potential and lower than the 2011 GDP growth of 2.2 percent, under the impact of supply-side shocks, fi scal consolidation carried on, while external accounts witnessed a considerable improvement in 2013 H1. The projections for the years ahead point to moderate, but above EU average, GDP dynamics, thereby underpinning the progress of real convergence, despite the negative output gap narrowing only gradually. The GDP dynamics sustainability is also refl ected by the key macroeconomic indicators remaining below the alert threshold in the European Commission’s Scoreboard for the surveillance of macroeconomic imbalances.
An essential prerequisite in the coming years is to preserve domestic macroeconomic stability amid the consolidation of fi nancial stability with a view to strengthening the confi dence of the main stakeholders (resident and non-resident investors, consumers, the fi nancial system, etc.) in the Romanian economy. In order to maintain and enhance macrostability and fi nancial stability, structural reforms in the economy should continue, labour market conditions should improve, the absorption rate for EU funds should increase, innovation should play a more prominent role in economic development, fi scal consolidation should carry on, and payment discipline should tighten for all system participants. The general government defi cit narrowed to 2.9 percent of GDP (according to ESA95 methodology) in 2012 versus 5.6 percent of GDP a year earlier, so that the EU Council approved the abrogation of the excessive defi cit procedure for Romania in June 2013. For 2013, the government envisages to bring the defi cit down to 2.4 percent of GDP (according to ESA95 methodology), or 2.3 percent of GDP (according to national methodology), and to cut the structural defi cit to 1.7 percent of GDP from 2.7 percent of GDP in 2012.
Public fi nance sustainability is refl ected by the developments in and composition of public debt, which accounted for 37 percent of GDP in May 2013 (according to ESA95 methodology), well below the 60 percent reference value in the Treaty on European Union and one of the lowest readings across the EU. In 2012, the Romanian government started to issue USD-denominated bonds, thus diversifying its investor base. The maturity breakdown remains comfortable (the share of medium- and long-term debt widened to 84 percent of total debt in 2012 and 92 percent in May 2013, from 77 percent in 2011), the share of lei-denominated public debt remains elevated at 41 percent in May 2013, down slightly against 2011, and the bulk of sovereign debt is held by residents. Non-resident investors’ participation in the domestic market for debt securities (in lei and euro)

NATIONAL BANK OF ROMANIA12
1 Overview
issued by the Romanian government went up sharply in 2012 and the fi rst seven months of 2013 (these investors accounted for 24.5 percent of the securities outstanding at end-July 2013, compared with 14 percent at end-2012 and 11.7 percent at end-2011), but remained well below the levels seen in other countries in the region (53 percent in Hungary, 36 percent in Poland). With a view to dealing with any unfavourable developments in the access to funding, the Romanian government moved to establish a foreign currency buffer as early as 2010, so that budget fi nancing requirements are met for a period of at least four months, and intends to preserve it in the years ahead as well.
Companies’ fi nancial position improved slightly in 2012, against the background of the modest 0.7 percent increase in real GDP and a still tension-ridden global environment, pointing to the frailty of this improvement. Corporate performance was mixed, but the sustainable change in the economic growth pattern carried on gradually. Payment discipline however remained loose for a signifi cant number of companies and insolvency became increasingly pronounced starting 2012. The measures taken by the authorities to address this situation were aimed at tightening the discipline in fi ling for insolvency as well as the payment discipline for all participants in the system, but there is still a need for hard budget constraints, also on private companies. In this vein, the legislative framework governing commercial, fi scal and accounting matters should be further improved in order to enhance commercial and fi nancial discipline across the real sector, which is expected to support banking system soundness and stability as well as the public fi nance and the fi nancial sector as a whole. The relatively high heterogeneity of the corporate sector has led to the fact that, although microeconomic fundamentals improved on an aggregate basis, the companies that grappled with diffi culties in the past have generally failed to surmount them; as a result, companies’ capacity to service their bank debts was further constrained (the non-performing loan ratio rose to 23.4 percent in August 2013 from 14.4 percent at end-2011). The outlook for the non-performing loan ratio reveals that, in the absence of more comprehensive measures taken by banks to clean up their balance sheets, its worsening will most likely continue in the period ahead, albeit at a slower pace. Credit institutions report adequate capital and provision levels to cover the risks related to corporate fi nancing and have available risk management techniques, which are yet to be used to the fullest. Furthermore, the National Bank of Romania took additional prudential steps to preserve solvency and provision buffers, addressing unhedged borrowers in particular, in line with EU-wide recommendations in the fi eld. Moreover, the new 24-month economic programme concluded with the European Union and the International Monetary Fund provides for further implementation of structural reforms in the economy, which is expected to alleviate the vulnerabilities of non-fi nancial corporations.
The risks arising from households’ balance sheets posted a balanced evolution, while the strongest vulnerability of this sector, i.e. high indebtedness, especially in foreign currency, followed a slightly downward path, in line with deleveraging moving gradually ahead for this category of debtors. The positive developments were uneven across households’ income classes, as low-income and very-low-income groups broadly reported a deterioration of their fi nancial standing. The ability of this sector as a whole to service its bank debt kept diminishing, albeit at a slower pace than in the previous period, and prospects are mixed. The non-performing loan ratio went up by 2.2 percentage points in December 2011-June 2013 to 10.4 percent from 8.2 percent, while the volume of non-performing loans increased by 28 percent over the same period. The Romanian banking sector is adequately covered against risks stemming from household lending: (i) capital adequacy ratio remains signifi cantly above the minimum required level; (ii) expected risks from household lending are almost entirely covered by IFRS provisions, including prudential fi lters (96.3 percent in August 2013), and

FINANCIAL STABILITY REPORT 2013 13
1 Overview
(iii) the value of collateral in banks’ portfolio remains high enough to cover the risks stemming from renewed unfavourable developments (the loan-to-value – LTV – ratio for housing loans reached roughly 85 percent in June 2013, with this increase being also driven by collateral revaluation).
The prospects for the developments in households’ repayment capacity are mixed, but indicate a future slowdown in the growth of the non-performing loan ratio (or even a lower ratio provided that banks will take stronger balance sheet clean-up measures). The non-performing loan portfolio breakdown reveals three vulnerabilities, also identifi ed in the previous Report, which are closely connected to the challenges to household indebtedness structure. First, credit risk associated with foreign currency-denominated loans continued to increase, at a faster pace than that of the risk posed by lei-denominated loans. Second, borrowers with a net income lower than the whole-economy average are still the most vulnerable category across the banking sector, accounting for about 70 percent of total non-performing loans. Third, the loans granted under looser terms and conditions during thepre-crisis years put further pressure on bank asset quality. The riskiest loan portfolios are those extended in the period 2007-2008, with the volume of non-performing loans making up roughly 70 percent of total non-performing loans in June 2013. The non-performing loan ratio for these exposures is considerably above the average (15.4 percent and 18.4 percent for the loans extended in 2007 and 2008 respectively, compared with 10.4 percent on average in June 2013) and is still rising quicker than the average. These fi gures are further evidence that lending should resume on a sustainable basis, as the credit institutions’ loosening of lending standards in the period preceding the fi nancial crisis led to a build-up of vulnerabilities.
Most of the loans granted to companies and households are mortgage-backed (67 percent, or lei 147.4 billion, in June 2013), whereas real-estate market weakness over the past few years has posed three challenges to the bank loan portfolio, as follows: (i) to preserve mortgage collateral at an appropriate value; (ii) to adequately manage the growing risk relative to mortgage-backed lending, also by ensuring a functional balance between costs and benefi ts of various solutions to manage non-performing loans, and (iii) to review bank policy effectiveness in terms of the type of collateralisation given the pro-cyclical tightening of lending standards.
The recent housing price downward correction has led to a decline in the collateral coverage of housing loans to households, as refl ected by developments in the LTV ratio, which climbed from almost 78 percent in December 2011 to 85 percent in June 2013. As for corporate loans, the LTV ratio also worsened, nearing 90 percent as against 79 percent (June 2013 versus end-2011). Empirical evidence shows that the LTV ratio is an important element of debt servicing, which calls for credit institutions to maintain it at prudent levels. The National Bank of Romania took steps so that the LTV ratio for new business should be adequate and the LTV ratio for the outstanding loans should capture the decline in the prices of real-estate assets held by banks as collateral.
Domestic macrostability strengthened amid a still intricate global environment characterised by: (i) weaker-than-expected growth both of the world economy and the EU’s advanced economies; (ii) the ongoing balance sheet adjustment by the major European banking groups, including from a cross-border perspective, along with the efforts made towards early fulfi lment of the new capital requirements, liquidity requirements and for identifying sources to cover bail-in-able capital tranches, as well as by (iii) the uncertainty surrounding the potential capital movements if the major central banks around the world were to decide to gradually taper their far-reaching non-standard monetary policy measures implemented thus far. The key consequences of the tension-ridden global environment

NATIONAL BANK OF ROMANIA14
1 Overview
on Romania have materialised in challenges to preserving an orderly deleveraging process across the local banking sector, strengthening resilience to foreign capital fl ow volatility and containing the adverse effects of modest economic growth in Romania’s main trading partners.
The delay in resuming growth in major EU economies, Romania’s main trading partners, has a detrimental impact on domestic economic growth and may affect foreign trade companies’ ability to withstand various unfavourable developments. So far, such risks have been contained particularly by: (i) exporters’ capacity to diversify their markets, reducing their exposure to euro area countries in relative terms (down 1.5 percentage points in 2012) by switching to new foreign markets; (ii) preserving foreign trade companies’ access to funding (e.g., non-resident parent undertakings raised the loan volume to local net exporting companies by 10.6 percent in the period December 2011 – June 2013), and (iii) maintaining the economic and fi nancial standing of foreign trade companies at a satisfactory level, above the economy-wide average. Romania’s exports with high value added and innovative technology have remained on an upward path. Thus, medium-high technology products, making up the bulk of domestic companies’ exports, have advanced markedly of late. As a matter of fact, providing incentives to innovative industries is a key goal, as mentioned in the Europe 2020 Strategy currently under implementation. Its achievement should be regarded as a priority and it would represent a potential advantage, as these industries proved their capacity to weather the crisis better than other sectors, with their share of value added increasing economy-wide, amid reasonable profi t margins and considerable investment efforts.
In turn, enhanced resilience to the possible heightening of capital fl ow volatility calls for strengthening external debt service sustainability so as, together with maintaining domestic macrostability, to preserve the access to external funding under adequate conditions and improve the structure of external fi nancing fl ows, thereby contributing to the sustainable change in the growth pattern for the Romanian economy.
Potential risks to fi nancial stability associated with the dynamics or structure of external capital fl ows have further been manageable and are expected to remain so. Following some capital outfl ows in the period May-June 2013, occurring simultaneously with similar events on other emerging markets, portfolio investments in Romania bounced back to levels close to those seen prior to the reduction in exposure to emerging economies in terms of asset class. This evolution validates the fact that capital fl ows are further directed particularly towards the economies where the major macroeconomic equilibria have already been adjusted or their adjustment is underway, as well as towards the countries implementing structural reform programmes.
First, Romania’s short-term external debt followed a downward path, contracting by more than 12 percent in the period December 2011 – June 2013 (from EUR 22.8 billion to EUR 19.9 billion). Furthermore, the offi cial foreign currency reserve provides an adequate coverage for the short-term external debt, the best across the region. Second, the companies generating the country’s private external debt enjoy a satisfactory economic and fi nancial standing, which enables them to withstand moderately unfavourable developments.
Third, the short-term external debt of non-fi nancial corporations is accounted for nearly 60 percent by parent undertakings, with evidence showing that such debt proved among the most stable.

FINANCIAL STABILITY REPORT 2013 15
1 Overview
Fourth, medium- and long-term external fi nancing of non-fi nancial corporations provided by creditors in countries perceived on international markets as being more severely hit by the sovereign debt crisis (the GCIIPS, namely Greece, Cyprus, Italy, Ireland, Portugal, and Spain) holds a moderate share in total medium- and long-term external debt (15 percent in June 2013). Assuming adverse developments in fi nancing extended by creditors from those countries, their direct impact on the Romanian economy or the Romanian banking sector via the corporate debtor channel is most likely low, also due to the maturity of the loans.
Fifth, the Romanian banking sector is able to withstand a moderate shock of a failure to roll over foreign borrowings, due to banks’ higher stock of liquid assets, their gradual reduction in reliance on external fi nancing (the share of external funding in total bank liabilities net of capital shrank 5 percentage points, while the loan-to-deposit ratio fell from 119.1 percent at end-2011 to 109 percent in August 2013) and to the enforcement of NBR measures aimed at strengthening credit institutions’ capacity to cope with adverse developments in foreign capital fl ows. Among these measures, the following deserve mention: (i) broadening the range of eligible collateral by including foreign currency-denominated securities launched by the Romanian government and lei-denominated bonds issued by fi nancial institutions; (ii) preserving the banking sector’s prudential indicators on solvency and the degree of provisioning for non-performing loans at adequate levels, and (iii) ensuring an appropriate amount of eligible collateral by banks for their monetary policy operations in order to make available the necessary liquidity for the banking sector, if required. Last but not least, Romania has signed a new precautionary arrangement with the international fi nancial institutions (the European Union and the International Monetary Fund) tantamount to approximately EUR 4 billion; the Romanian authorities may draw on the programme only in the case of a serious and unexpected worsening of the economic and/or fi nancial situation triggered by factors outside the scope of domestic decision-makers, should the already in place buffers set up by the authorities prove insuffi cient.
ReGIS payment system ran smoothly from January 2012 to June 2013, but the value of transactions started to decline at mid-2012. Although the aggregate liquidity available to the participants in the system was higher than the demand for resources, there were slight tensions affecting some participants’ liquidity in the course of 2012, which however alleviated in 2013 H1. The value of transactions in ReGIS increased during the fi rst part of 2012, as the central bank expanded its repo operations on the money market and the credit institutions resorted to signifi cant intra-day credit operations; however, the amounts settled via this payment system fell subsequently to 2011 levels. Even though the SENT system experienced some operational incidents, they did not affect its stable and predictable functioning. The incidents had a marginal and isolated impact on the participants in the system. DSClear, RoClear and SaFIR clearing systems also operated smoothly throughout 2012 and in 2013 H1, with the major indicators on system performance remaining at high levels, thereby confi rming their robustness.
The step-up in the volume of transactions on the secondary market for government securities, the larger amount of issues launched by the Ministry of Public Finance on the local market as well as the rise in National Bank of Romania’s operations translated into an upturn in the number and especially in the value of instructions settled via SaFIR system in the course of 2012. The fi rst half of 2013 witnessed negative growth of the total value of instructions processed as against a year earlier, the further upward trend in the number of settlement instructions notwithstanding.

NATIONAL BANK OF ROMANIA16
1 Overview
After having assessed the DSClear and RoClear systems in view of the applicable European standards, the National Bank of Romania made several recommendations and the system administrators took tangible steps to correct the identifi ed defi ciencies, while relatively minor inadequacies are still to be remedied in the upcoming period.
The micro- and macroprudential regulatory framework is currently in a process of thorough revision both at EU and national level. The outcome of assessments regarding the impact of the CRD IV/CRR package shows that the credit institutions operating in Romania generally meet the requirements of European regulations. As the key elements of the banking union, namely the single supervisory mechanism, the single resolution mechanism and the national deposit guarantee schemes, are put in place, the segregation of duties between European and national authorities, as well as the sharing of fi nancial obligations among the participating Member States will weigh on the effectiveness of the implemented mechanisms and non-euro area countries’ interest in joining them.

FINANCIAL STABILITY REPORT 2013 17
2 INTERNATIONAL ECONOMIC AND FINANCIAL ENVIRONMENT
The major external developments with an unfavourable impact on fi nancial stability in Romania have remained those identifi ed in the previous report: (A) the persistently fragile international economic environment, especially at European level, amid (B) the ongoing balance sheet adjustment by large European banking groups, entailing the reduction of exposures, including those to the domestic banking sector.
(A) The tensions in global fi nancial markets have alleviated somewhat since the release of the previous report, apart from brief episodes of renewed risk aversion. The outlook remains surrounded by uncertainty, against the background of weaker-than-expected global economic growth1 and possible unpredictable developments in capital fl ows once the major central banks start to gradually unwind the extensive unconventional monetary policy measures implemented so far. The abovementioned outlook poses two major challenges for Romania, namely: (A1) the prudential and structural measures’ appropriate response, in terms of macroeconomic policies, to the potentially high volatility of foreign capital fl ows, and (A2) the containment of the adverse impact exerted by the mild economic growth seen in Romania’s main trading partners.
(A1) EU authorities furthered their efforts to maintain fi nancial stability and resume sustainable lending to the real sector. Firstly, a new architecture of banking supervision and regulation was defi ned with the creation of the European Banking Union (European Council, 28/29 June 2012), a project that includes the following components: (i) the harmonisation of the banking regulatory and supervisory framework, the fi rst step implying the adoption of a new prudential framework2 and the creation of the Single Supervisory Mechanism aiming, among others, to avoid the fragmentation of the EU fi nancial market; (ii) the establishment of the common bank resolution framework at European level, through the creation of the Single Resolution Mechanism (necessary for integrating bank resolution decision-making bodies and bringing them in line with the European supervisory measures) and the completion of the European draft directive setting up a framework for redressing and solving crisis situations facing credit institutions and investment companies; (iii) the harmonisation of the operating framework of deposit guarantee schemes.
Secondly, fi nancial assistance programmes targeted at countries facing severe fi nancial problems3 improved. In particular, the European Stability Mechanism was tested during the Cyprus crisis, when the Cypriot government received a EUR 10 billion bailout (of which EUR 9 billion through the ESM) so as to cover the fi nancing needs of the country’s economy, i.e. for budget defi cit fi nancing, repayment of medium- and long-term debts and recapitalisation of fi nancial institutions (except for 1 In July 2013, the IMF further revised downward its global growth forecast for 2013 to 3.1 percent, 0.2 percentage points
lower than in its April 2013 forecast.2 Directive 2013/36/EU on access to the activity of credit institutions and the prudential supervision of credit institutions
and investment fi rms, amending Directive 2002/87/EC and repealing Directives 2006/48/EC and 2006/49/EC, and Regulation (EU) No. 575/2013 on prudential requirements for credit institutions and investment fi rms and amending Regulation (EU) No. 648/2012.
3 The European Stability Mechanism (ESM) took over the prerogatives of the European Financial Stability Facility on 1 July 2013 and provides for tools such as granting funding to countries in view of recapitalising credit institutions, intervening on the primary and secondary markets of government securities and precautionary fi nancing agreements. The ESM has currently signed two agreements with Spain and Cyprus for supporting fi nancial systems, amounting to EUR 100 billion and EUR 9 billion respectively.

NATIONAL BANK OF ROMANIA18
2 International economic and fi nancial environment
the fi rst two largest banks, namely the Bank of Cyprus and Cyprus Popular Bank, in whose cases the Cypriot government implemented measures for bank restructuring and resolution, including the participation of creditors and large depositors).
The events in Cyprus have not exerted a signifi cant impact on domestic fi nancial markets. As regards the Romanian banking sector, the crisis had repercussions only on banks with Cypriot capital (whose share in total assets of the domestic banking sector was 1.4 percent in August 2013), with household and corporate deposits witnessing normal fl uctuations.
Thirdly, the efforts to develop, at European level, instruments for monitoring fi nancial sector risks continued. The vulnerabilities identifi ed in 2013, according to these analyses, are as follows: (i) worsening profi tability of credit institutions given a weak economic environment; (ii) persistence of tensions generated by the sovereign debt crisis; however, these have alleviated since the release of the previous report; (iii) reassessment of risk premiums on global fi nancial markets, and (iv) increased risk of fi nancing credit institutions in countries facing fi nancial diffi culties in the public sector. Likewise, a set of measures aimed at boosting confi dence in the banking sector by recapitalising fi nancial institutions based on results of stress-testing analyses were implemented at European level. A fi rst step, completed in June 2012, intended to reduce risks regarding banks’ exposures to the government sector, as well as to maintain capital at an appropriate level (the minimum recommended level of Tier 1 capital ratio being 9 percent)4. At present, the European Banking Authority intends to conduct a new stress-testing exercise, and the European Central Bank will carry out a banks’ balance sheet and asset quality review, in the context of the Single Supervisory Mechanism.
Chart 2.1. Developments in the spreads5 of credit default swaps (CDS) and sovereign bonds for EU Member States (January 2012 – October 2013*)
Chart 2.2. Developments in external exposures and impact on corporate and household lending
0
200
400
600
800
1,000
1,200
1,400
1,600
1,800
2,000
PT IE ES IT FR AT
NL
HU SI RO PL SK
basis points
CDSbonds
* The bar shows the change in spreads in theaforementioned period, whereas the line pointsto the reading posted as at 9 October 2013.
Source: Bloomberg
0
30
60
90
120
150
0
5
10
15
20
25
Dec
.11
Dec
.12
Aug
.13
Dec
.11
Dec
.12
Aug
.13
Dec
.11
Dec
.12
Aug
.13
Parent bankfunding
Loans to non-financial
corporations(rhs)
Loans tohouseholds
(rhs)
banks with French capitalbanks with Austrian capitalother banksbanks with Greek capital
lei bn.EUR bn.
Source: NBR, NBR calculations4 In December 2011 – June 2012, as part of the recapitalisation exercise of credit institutions, 37 banks carried out capital
increases of EUR 115.7 billion or EUR 200 billion, should governments’ recapitalisation programmes and programmes conducted through the European Financial Stability Facility also be taken into consideration. The largest part of the capital came from new equity contributions and only to a small extent from reductions in risk-weighted assets (European Banking Authority, October 2012).
5 Spreads on sovereign bonds are determined relative to German government bond yields, for 5-year euro-denominated bonds issued on the external markets. The chart presents spreads and CDS readings for 5-year government bonds.

FINANCIAL STABILITY REPORT 2013 19
2 International economic and fi nancial environment
The aforementioned measures also contributed to boosting investors’ confi dence in EU economies (Chart 2.1.). In the case of Romania, however, idiosyncratic factors were dominant. First, the strengthening of domestic macrostability (for further details see Chapter 4. “Risks related to domestic economic and fi nancial developments”) and Romania’s exiting the excessive defi cit procedure had a major contribution to restoring foreign investor confi dence.
Second, Romania saw a signifi cant improvement in its macroeconomic framework as compared to other European countries in the region (Chart 2.3.). Economic growth in this region stayed mostly in negative territory in 2012, except for Poland (1.9 percent), Bulgaria (0.8 percent) and Romania (0.7 percent). The European Commission forecasts for 2013 point to Romania as having the fastest-growing economy in the region, given the ongoing fi scal consolidation and the further relatively low public debt.
Chart 2.3. Macroeconomic indicators for Romania and other countries in the region
-2
-1
0
1
2
BG HU PL RO
percent
a) economic growth
0
2
4
6
8
10
12
14
BG HU PL RO-5
-4
-3
-2
-1
0
BG HU PL RO0
20
40
60
80
100
BG HU PL RO
Note: The red bars display the projected values for 2013; the blue bars show the values for 2012, except for theunemployment rates, which are as at March 2013.
Source: Eurostat, European Commission Economic Forecast, Spring 2013
c) fiscal deficitpercent of GDP
b) unemployment rate d) public debtpercent of GDPpercent
Third, additional factors contributing to strengthening foreign investor confi dence in Romania included the successful completion of the precautionary fi nancing arrangement with the EU, the IMF and the World Bank, as well as the signing of a similar agreement conducive to the furthering of reforms meant to consolidate the domestic macroeconomic and fi nancial framework. Fourth, the increased interest in the local market was also due to including, as of March 2013, securities issued by the Romanian government in the composition of major indices of emerging market government bonds (Barclays Capital and JP Morgan).
The favourable fi nancial market sentiment towards Romania refl ected also in the developments of spreads as of mid-2012, which, in some cases, reverted to levels close to those recorded prior to the onset of the crisis (CDS spreads dropped to half, from over 450 basis points in June 2012 to around 190 basis points in October 2013; government bond spreads witnessed similar developments, decreasing from over 500 basis points, as recorded in June 2012, to below 270 basis points in October 2013).

NATIONAL BANK OF ROMANIA20
2 International economic and fi nancial environment
In order to manage high capital fl ow volatility (that impacts signifi cantly on small open economies, such as Romania), the National Bank of Romania used a combination of three factors in implementing monetary policy, namely: (i) consenting to a certain fl exibility in exchange rate developments; (ii) using the foreign currency reserve to abate exchange rate volatility, and (iii) allowing a certain interest rate fl uctuation on the money market. Moreover, so as to offset volatility effects on the economy, the National Bank of Romania implemented additional macroprudential measures concerning new foreign currency loans for unhedged debtors (for further details see Chapter 4.2. “Corporate and household lending”), as well as new microprudential measures aimed at enhancing the resilience of credit institutions (such as introducing prudential fi lters, maintaining the solvency and provisioning coverage ratios at adequate levels). Developments in capital fl ows occurred against the background of strengthened sustainability of short- as well as medium- and long-term external debt service and improved structure of external fi nancing fl ows to the real economy (for further details see Section 4.3.2. “Capital fl ows”).
(A2) The delay in resuming growth in major EU economies, Romania’s main trading partners, has a detrimental impact on domestic economic growth and may affect foreign trade companies’ resilience. So far, these risks were contained particularly by: (i) exports converging towards countries with a faster economic rebound (Germany being Romania’s main export partner) and exporters’ ability to diversify their external markets so as to reduce their exposure to euro area countries (down 1.5 percentage points in 2012 as compared to the previous year); (ii) foreign trade companies preserving their access to funding (e.g., non-resident parent companies increased the loan volume to local net exporting companies by 10.6 percent between December 2011and June 2013), and (iii) foreign trade companies maintaining their economic and fi nancial standing at a satisfactory level, above the economy average (for further details see Section 4.3.1. “Current account defi cit”).
The fi scal consolidation programmes initiated by several euro area countries are in line with the commitment to reduce fi scal defi cit according to the provisions of the Stability and Growth Pact and to the excessive defi cit procedure (Chart 2.4.), as well as with the structural programmes linked to fi nancial assistance plans offered by international fi nancial institutions (in the case of Spain, Portugal, Ireland, Cyprus and Greece), and will contribute over the medium term to the sustainable resumption of economic growth in these countries. The measures adopted at EU level with a view to counteract the potential short-term adverse impact of fi scal adjustment programmes on economic growth included: (i) strengthening the new economic governance framework by adopting two new regulations that set out to simplify the fi scal surveillance procedure for countries in fi nancial distress and restrict cross-border contagion effects of fi scal consolidation measures, and (ii) adopting a pact for encouraging economic growth, competitiveness and employment (Growth and Jobs Pact, June 2012). In order to spur economic growth resumption, the pact provides, among other things, for EUR 120 billion in investments (a EUR 60 billion increase in the European Investment Bank’s funds, with EUR 55 billion from European Structural Funds and EUR 5 billion from project funding instruments), as well as for adopting a job creation plan.
(B) The second major external challenge to fi nancial stability in Romania consists in preserving the orderly nature of deleveraging following the balance sheet adjustment by main European banking groups. Given that these groups hold over 80 percent of the domestic banking sector assets, the manner of implementing strategies for reducing their indebtedness at group level may have a signifi cant impact on the activity of local subsidiaries.

FINANCIAL STABILITY REPORT 2013 21
2 International economic and fi nancial environment
Chart 2.4. The fi scal position of EU Member States
-15
-10
-5
0
5
0
50
100
150
200
Gre
ece
Italy
Irel
and*
**Po
rtuga
l***
Cyp
rus
Bel
gium
*EA
UK
***
Fran
ce**
*Sp
ain
EUG
erm
any
Hun
gary
The
Net
herla
nds*
*M
alta
**A
ustri
a*Sl
oven
ia**
*Po
land
**Fi
nlan
dSl
ovak
ia*
Cze
ch R
ep.*
Den
mar
k*La
tvia
Swed
enLi
thua
nia
Rom
ania
Luxe
mbo
urg
Bul
garia
Esto
nia
public debt/GDP - 2013 public debt/GDP - 2014
net lending (+)/net borrowing (-)/GDP - 2013 (rhs) net lending (+)/net borrowing (-)/GDP - 2014 (rhs)
percent percent
Note: The deadline for exiting the excessive deficit procedure * 2013, ** 2014 and *** 2015.
Source: Eurostat, European Commission Economic Forecast, Spring 2013
The adjustment in European banks’ exposures refl ected on all countries in the region, despite the prevailing favourable risk sentiment towards emerging economies in terms of asset class. The latest monitoring report on deleveraging, drawn up by the Vienna Initiative, notes an ongoing decline in external funding from Western banks towards Central, Eastern and South-Eastern European countries. The period July 2011 – March 2013 witnessed the largest contractions that amounted to 23 percent of GDP in Hungary and 17 percent of GDP in Slovenia, Romania being included in the group of countries with average adjustments.
The deleveraging process unfolded at a faster pace during the reference period, yet in an orderly manner so far. Parent banks’ exposures to their subsidiaries in Romania declined by 26.2 percent December 2011 through August 2013, to reach EUR 15 billion (Chart 2.2.), a trend offset by deposit-taking operations on the local market by subsidiaries (for further details see Chapter 4.2. “Corporate and household lending”). Furthermore, reduced exposures do not appear to have posed the main constraint to lending, given that the slightly lower levels of corporate and household funding (a 2 percent decrease, value adjusted for the exchange rate effect, from December 2011 to August 2013) were also the result of weaker demand.
The conclusion holds true both at system level and by categories of domestic credit institutions, according to the nationality of the banking groups they belong to. Therefore, the corrections occurring in banks pertaining to Austrian and French banking groups focused on strengthening internal resources and, at the same time, maintaining their market share, whereas in the case of banks with Greek and Cypriot capital, balance sheet adjustments, albeit progressing orderly, exerted a moderate impact on the volume of loans to the real sector. From December 2011 to August 2013, fi nancing granted to households and non-fi nancial corporations fell by 7.4 percent in the case of banks with Greek and Cypriot capital, while in the case of Austrian and French banks, it moved down by 2.9 percent and 1 percent respectively (values adjusted for the exchange rate effect).

NATIONAL BANK OF ROMANIA22
2 International economic and fi nancial environment
In this context of deleveraging, the volume of net loan sales does not pose concerns as regards fi nancial stability, given the lack of signals pointing to domestic banks selling a signifi cant share of their assets for restructuring their balance sheets and preserving an adequate solvency ratio. Net asset sales ran at lei 3 billion in 2012 (approximately 1.3 percent of the non-government credit balance, in December 2012), from lei 2.5 billion in the previous year. During January-August 2013, net asset sales amounted to approximately lei 1.7 billion.
The Central European Bank further contributed signifi cantly to mitigating the risk of a disorderly development in the lending conditions across the EU. The main measures that were implemented in this respect are the following: (i) announcing a sovereign bond-buying programme on the secondary market in September 2012 (Outright Monetary Transactions); (ii) continuing longer-term refi nancing operations with full allotment (3-month repos); (iii) extending the list of assets eligible as collateral in Eurosystem credit operations, and (iv) cutting the policy rate to 0.5 percent (in May 2013).
Assuming that the deleveraging process started by large banking groups would speed up considerably, triggering liquidity shortages in the short run, the results of the macroprudential stress-testing exercise point to the domestic banking sector’s resilience, but challenges persist, being mainly posed by fund conversion from lei into euro, certain asset sales and the impact on real sector funding. As the previous report also noted, domestic banks with Greek and Cypriot capital are relatively well prepared to withstand a potentially severe funding liquidity shock, as they display prudential indicators suited to the existing risks. Most Greek and Cypriot banks report solvency ratios above the system-wide average (in June 2013, Greek and Cypriot banks’ solvency ratios stood at 16.4 percent and 15.7 percent respectively, versus 14.7 percent, the banking system average). Liquidity ratios are higher than required for both Greek and Cypriot banks (in August 2013, 1.38 for banks with Greek capital and 1.1 for banks with Cypriot capital versus 1.5 at aggregate level).
The share of short-term loans (i.e. with a maturity of up to one year) in overall external loans granted by Greek and Cypriot parent banks (7.4 percent) is below the system-wide average, standing at 18.9 percent in August 2013. The quality of loan portfolios of credit institutions with Greek and Cypriot capital is close to the average (in August 2013, the non-performing loan ratio was 21.1 percent and 24.6 percent respectively, versus 21 percent, the system-wide average). As a matter of fact, domestic banks majority-owned by fi nancial institutions from countries perceived by international markets as bearing the brunt of the sovereign debt crisis (the GCIIPS, namely Greece, Cyprus, Italy, Ireland, Portugal, and Spain) report overall solvency ratios above the system-wide average (in June 2013) and levels close to the average of the NPL provisioning coverage ratio and of the asset quality, given that the share of short-term external loans in total external loans is signifi cantly lower than the banking sector’s average (in August 2013).
In the event of a potential external liquidity shock affecting a third country linked to the Romanian banking sector via the common lender channel6, analyses point to the contagion risk further posting similar levels to those in the previous report. Moreover, the risk of transferring a potential shock via the direct channel of euro area government security holdings is marginal, given the low volume of such instruments in the Romanian credit institutions’ asset portfolios (0.2 percent of total bank assets in August 2013). Furthermore, euro area government securities are not eligible guarantees in the refi nancing operations conducted by the National Bank of Romania.6 For calculating regional exposures we used the contagion indicator put forward by Fratzscher, M., On Currency Crises
and Contagion, ECB Working Paper No. 139, April 2002. According to this analysis, the countries in the region likely to pose the strongest challenges on the Romanian banking sector via the common lender channel in the event of adverse developments are Poland and the Czech Republic.
FINANCIAL STABILITY REPORT 2013 23
2 International economic and fi nancial environment
The specifi c challenges faced by parent banks in their home countries call for attention in assessing risks. The National Bank of Romania further closely monitors domestic and international developments and acts towards the adequate management of liquidity in the domestic banking sector. For this purpose, the National Bank of Romania has extended the list of instruments used for ensuring adequate liquidity levels in the system (inter alia by employing exchange rate swaps to narrow the currency mismatch of the system’s resources) and the list of eligible collateral in open market operations, as well as in refi nancing and guaranteeing operations pertaining to the payment system and cut the monetary policy rate from 5.75 percent in December 2011 to 4.25 percent in October 2013. The Romanian banking sector reported an improved liquidity position in the period under review, revealed also by the larger liquid asset holdings that increased by 21 percent between December 2011 and September 2013, representing government securities eligible as collateral for refi nancing operations conducted by the National Bank of Romania. Maintaining comfortable liquidity, provisioning and solvency levels is an important prerequisite for the domestic banking sector to be able to adequately withstand external liquidity shocks.

NATIONAL BANK OF ROMANIA24
3 FINANCIAL SYSTEM AND ITS RELATED RISKS
3.1. Structure of the fi nancial system
The fi nancial intermediation ensured by the Romanian fi nancial system declined slightly in 2012, against the background of the slowdown in economic growth and the persistent tensions on the international fi nancial markets. Credit institutions further held the largest share in the fi nancial system. The direct contagion risk of the banking sector stemming from the other fi nancial system components has been low, without recording signifi cant changes. On the other hand, the concentration of exposures to credit institutions and of the funds raised from them may represent vulnerabilities for the institutions operating in the other fi nancial sectors.
In the economic context infl uenced by the protracted tensions on the international fi nancial markets and by the deceleration of real GDP dynamics domestically, the level of fi nancial intermediation, assessed in terms of the fi nancial system’s assets as a share in GDP, continued to decrease in 2012 (Chart 3.1.), yet at a slower pace than in the previous year. Credit institutions held the largest share of the fi nancial system’s assets, followed by non-bank fi nancial institutions (NBFIs) and investment funds. In 2012, banking sector assets recorded a modest increase, while the assets of NBFIs saw a contraction.
Chart 3.1. Structure of the fi nancial system (assets as a share in GDP)
Chart 3.2. Components of the fi nancial system (quarterly change in sectoral shares)
0102030405060708090
100
2010 2011 2012investment fundsprivate pension fundsinsurance companiesnon-bank financial institutionscredit institutions
percent
Source: NBR, FSA Note: Investment funds include Proprietatea Fund.
-1
0
1
Mar
.201
2
Jun.
2012
Sep.
2012
Dec
.201
2
Mar
.201
3
Jun.
2013
investment fundsprivate pension fundsinsurance companiesnon-bank financial institutionscredit institutions
points
Source: NBR, FSA
In the period under review, the developments in fi nancial system components showed the continued uptrend in the share of private pension funds, along with the persistent downtrend in the share of NBFIs (Chart 3.2.). In 2012 Q4 and in 2013 H1, the main changes consisted in the slight decline in the share of credit institutions and the rise in that of investment funds.

FINANCIAL STABILITY REPORT 2013 25
3 Financial system and its related risks
Credit institutions’ direct dependence on the other fi nancial system components remained at low levels in the period under review, in terms of both investments made and funds raised. At end-2012, the exposures to other domestic fi nancial institutions accounted for less than 3 percent of total assets of credit institutions, the largest share being held by (mostly short-term) interbank exposures (Chart 3.3.).
Chart 3.3. The share of exposures to domestic fi nancial institutions in the balance sheet of credit institutions
Chart 3.4. The share of funds raised from domestic fi nancial institutions in the balance sheet of credit institutions
0.0
0.5
1.0
1.5
2.0
2.5
3.0
3.5
4.0
Dec
.201
0Fe
b.20
11A
pr.2
011
Jun.
2011
Aug
.201
1O
ct.2
011
Dec
.201
1Fe
b.20
12A
pr.2
012
Jun.
2012
Aug
.201
2O
ct.2
012
Dec
.201
2Fe
b.20
13A
pr.2
013
Jun.
2013
equity capital in financial institutionsother financial institutionsinsurance companies and private pension fundscredit institutions
percent
Source: NBR
0
1
2
3
4
5
6
Dec
.201
0Fe
b.20
11A
pr.2
011
Jun.
2011
Aug
.201
1O
ct.2
011
Dec
.201
1Fe
b.20
12A
pr.2
012
Jun.
2012
Aug
.201
2O
ct.2
012
Dec
.201
2Fe
b.20
13A
pr.2
013
Jun.
2013
other financial institutionsinsurance companies and private pension fundscredit institutions
percent
Source: NBR
The funds raised from domestic fi nancial institutions made up about 5 percent of total assets of credit institutions (Chart 3.4.). The low and relatively steady levels of inter-sectoral exposures and funds of credit institutions point to limited direct contagion risks to the banking sector.
In the structure of the Romanian fi nancial system, the main direct inter-sectoral dependencies are the exposures to the banking sector and the funds raised from banks (Chart 3.5.). At end-2012, investment funds, NBFIs and insurance companies had the most signifi cant exposures to credit institutions. At the same time, credit institutions held a considerable share in the funds raised by NBFIs, whereas the banking sector had a relatively limited contribution to the resources of the other fi nancial sectors.
Chart 3.5. Main linkages between the banking sector and the other components of the fi nancial system (December 2012)
-10123456789
-5 5 15 25
credit institutionsnon-bank financial institutionsinsurance companiesprivate pension fundsinvestment funds
The
shar
e of
fund
s rai
sed
from
cre
dit
inst
itutio
ns in
the
bala
nce
shee
t (pe
rcen
t)
The share of exposures to credit institutions in the balance sheet (percent)
Note: The circle size represents the relative shareof the financial system components.
Source: NBR, FSA

NATIONAL BANK OF ROMANIA26
3 Financial system and its related risks
The number of fi nancial institutions operating in the domestic fi nancial sector saw slight variations, further to the changes seen in the previous year (Table 3.1.). The banking sector comprised 40 entities at end-2012 and 41 entities at end-August 2013. Moreover, the number of insurance companies, fi nancial investment services companies and NBFIs recorded in the General Register went down, whereas the number of investment funds and NBFIs in the Entry Register increased.1
Table 3.1. Number of fi nancial institutions operating in Romania
end of period2010 2011 2012
Credit institutions 42 41 40
Insurance companies 43 43 39
Insurance brokers 567 584 584
Private pension funds 22 20 20
Investment funds 76 83 87
Financial investment services companies 6 6 6
Financial investment companies (FICs) 55 52 46
Non-bank fi nancial institutions (General Register)1 210 203 187
Non-bank fi nancial institutions (Entry Register) 5,043 5,286 5,420
Source: NBR, FSA
3.2. Banking sector
3.2.1. Challenges to the Romanian banking sector in the context of current vulnerabilities of the euro area fi nancial system
At European level, a worsening of the sovereign debt crisis and a further deterioration of the macrofi nancial context are considered the most severe risks to fi nancial stability. In this context, the low profi tability of the euro area banking sector undermined banks’ capacity to build up capital reserves based on retained earnings. Despite the improved operating profi t, European credit institutions continued to report profi tability ratios signifi cantly lower than in the pre-crisis period. Credit institutions’ vulnerability in terms of a potential worsening of the sovereign debt crisis in the euro area derives from the large holdings of bonds issued by countries with a high public debt-to-GDP ratio. The uncertainties surrounding the quality of the fi nancial assets in credit institutions’ balance sheet, as well as the lack of a uniform treatment of the risk weights used to determine capital requirements for exposures with similar characteristics undermined investor confi dence in the existence of an adequate capital level of credit institutions, able to absorb potential losses in full, without jeopardising debt holders’ interests.
Credit institutions in Romania are not affected by risks stemming from holdings of securities issued by euro area Member States. In addition, the share of claims on the Romanian government sector in total banking system assets, albeit signifi cant (18.5 percent in August 2013), is unlikely to pose threats to capital adequacy in the event of unfavourable domestic macroeconomic and/or political developments, the risks being limited to some shocks of unexpected increase in interest rates materialising.
1 In compliance with Law No. 93/2009 on non-bank fi nancial institutions.

FINANCIAL STABILITY REPORT 2013 27
3 Financial system and its related risks
The downtrend in the share of loans to the real sector against the background of weak demand for loans (partially compensated by the higher share of government securities), as well as the pro-cyclical strengthening of lending conditions and the change in the loan structure, in order to contain capital requirements by lowering the shares of high risk items, have a negative impact on the capacity to generate operating profi t.
The tendency of the major foreign credit institutions operating in Romania to lower their exposure (as a result of liquidity constraints, of the measures taken by the NBR to contain foreign currency loans to unhedged borrowers and of the future implementation of the new CRD IV/CRR package) may raise sustainability issues of the business model for their subsidiaries in Romania, under the assumption of domestic savings insuffi cient to ensure adequate fi nancing for the loan portfolio development.
The tighter capital requirements imposed on credit institutions in the context of the new legislative and regulatory framework, albeit desirable in terms of fi nancial stability, brought about challenges that might generate unwanted spillover effects likely to put a damper on lending.
Unlike credit institutions in the euro area, forbearance, although identifi ed in certain circumstances, does not pose a signifi cant latent threat to the banking sector. Specifi c analyses identifying the time consistency of the loan classifi cation methodology from a prudential perspective confi rm the consistent mapping between internal risk assessment systems and the prudential classifi cation categories, as well as the strong correlation between the level of risk implied by the classifi cation and the respective default rates.
3.2.2. Structural developments
In 2012 and the fi rst half of 2013, credit institutions’ ownership did not show any major changes. As regards the market share, the banks with Austrian, French and Greek capital came in fi rst, while the group of banks with domestic capital saw their share narrowing after the reclassifi cation of some banks. In 2012, fi nancial intermediation2 followed a slight downtrend amid weak lending activity. The concentration of assets, loans and deposits in the Romanian banking system, refl ected by the share of the top fi ve banks in the system, remained moderate as compared to other countries in the region.
In 2012 and 2013 H1, the structure of the domestic banking sector refl ected the changes in credit institutions’ ownership. Thus, the number of credit institutions fell in 2012 versus 2011 after the merger through absorption of C.R.Firenze bank with Intesa SanPaolo Bank in 2012 Q4. In 2013 Q1, the number of credit institutions increased as a result of TBI Bank EAD Sofi a entering the Romanian market by opening a local branch. There are 41 credit institutions operating in Romania, out of which 27 have foreign majority private capital, 2 have domestic majority private capital, 2 have fully or majority state-owned capital and 9 are foreign bank branches, to which adds a cooperative credit institution as well (Table 3.2.). In 2012, 27 EU credit institutions notifi ed the NBR about their intention to directly provide fi nancial services on the Romanian market based on the European Passport.
2 Financial intermediation was calculated based on the monetary survey statistics as a ratio of gross loans to the private sector, gross assets, and corporate and household deposits, respectively, to GDP.

NATIONAL BANK OF ROMANIA28
3 Financial system and its related risks
Table 3.2. Structural indicators of the Romanian banking system
end of period
2006 2007 2008 2009 2010 2011 2012 2013 Aug.
Number of credit institutions 39 42 43 42 42 41 40 41Number of credit institutions with majority private capital3 37 40 41 40 40 39 38 39Number of banks with majority foreign capital, 33 36 37 35 35 34 34 36
of which:
– foreign bank branches 7 10 10 10 9 8 8 9Assets of banks with majorityprivate capital/Total assets (%) 94.5 94.7 94.6 92.5 92.4 91.6 91.6 92Assets of banks with foreigncapital/Total assets (%) 88.6 88.0 88.2 85.3 85.0 83.0 89.8 90.8Assets of top fi ve banks/Total assets (%) 60.3 56.3 54.3 52.4 52.7 54.6 54.7 54Herfi ndahl-Hirschmann index (points) 1,171 1,046 926 857 871 878 852 834
Source: NBR
The market share of banks with majority foreign capital in total banking system assets rose markedly in 2013 to reach 90.8 percent at end-August 2013. The higher market share was ascribable to the reclassifi cation of some banks with majority domestic capital under the category of banks with majority foreign capital4. Following these changes, the market share of banks with majority domestic capital dropped by half (9.2 percent in August 2013 against 18.8 percent in June 2012), standing lower than that of banks with majority French and Greek capital (13.2 percent and 12.4 percent respectively in August 2013). Similarly to the previous years, banks with majority Austrian capital held the largest market share in the Romanian banking system, i.e. 38 percent in August 2013.
During June 2012 – June 2013, the share capital of the Romanian banking sector remained relatively unchanged, rising by nearly lei 100 million (0.37 percent) due to the capital contribution by the private sector. Greek capital further prevailed (20.6 percent) in the domestic banking system, but remained on the downtrend it had embarked upon in 2010 (Chart 3.6.). Austrian capital came in second with a share of 20.3 percent, ahead of the banks with domestic capital holding a share of 20.1 percent. The shares of French, Hungarian and Cypriot capital posted increases as compared with 2011, whereas the shares of the Romanian and Greek capital declined.
3 Including the Central Cooperatist Bank CREDITCOOP.4 In December 2012, Banca Transilvania shifted from the banks with majority domestic capital to the banks with majority
foreign capital and diversifi ed ownership, while in March 2013, Libra Internet Bank shifted from the banks with majority domestic capital to the banks with majority Cypriot capital.

FINANCIAL STABILITY REPORT 2013 29
3 Financial system and its related risks
Chart 3.6. Weight of credit institutions’ share capital in total capital of the banking system and their market share (in terms of assets) by country of origin
0510152025303540
05
10152025303540
2010
2011
2012
2013
Q2
2010
2011
2012
2013
Q2
2010
2011
2012
2013
Q2
2010
2011
2012
2013
Q2
2010
2011
2012
2013
Q2
2010
2011
2012
2013
Q2
2010
2011
2012
2013
Q2
2010
2011
2012
2013
Q2
2010
2011
2012
2013
Q2
2010
2011
2012
2013
Q2
Romania Greece Austria TheNetherlands
Hungary France Portugal Italy Cyprus Other
capital share by countrymarket share (rhs)
percent percent
Source: NBR
The Romanian banking system has further had a high connectivity degree to the European banking system (Chart 3.7.).
Chart 3.7. Market share and number of credit institutions with foreign capital (international comparison)
0
50
100
150
200
250
0
20
40
60
80
100
Aus
tria
Bul
garia
Cze
ch R
ep.
Esto
nia
Fran
ce
Ger
man
y
Gre
ece
Italy
Latv
ia
Lith
uani
a
The
Net
herla
nds
Pola
nd
Portu
gal
Slov
akia
Slov
enia
Spai
n
Hun
gary
Rom
ania
*
assets of foreign-owned credit institutions as a share in total assets
credit institutions (branches and subsidiaries) with foreign capital (rhs)
percent number
Source: NBR, ECB (Statistical Data Warehouse)
*Aug. 2013
The tendency to cut costs with bank units and staff numbers, which started in 2009, continued in 2012 and in 2013 H1 as well. Branches and staff numbers decreased at a faster pace than in the previous year in line with balance sheet adjustment in the real sector and at the level of fi nancial intermediaries. The number of branches declined by 323 in 2012 and by another 194 in the fi rst half of 2013. The number of payrolls in the banking system dropped by 4,003 in 2012 and by 1,946 in 2013 H1 (Chart 3.8.). Consequently, the Romanian banking system further stood below the EU average as regards the number of branches and the number of credit institutions per 100,000 inhabitants (Chart 3.9.).

NATIONAL BANK OF ROMANIA30
3 Financial system and its related risks
Chart 3.8. Number of branches and bank employees
Chart 3.9. Number of credit institutions and branches per 100,000 inhabitants (international comparison)
58
60
62
64
66
68
70
72
5,400
5,600
5,800
6,000
6,200
6,400
6,600
6,800
Dec
.200
7Ju
n.20
08D
ec.2
008
Jun.
2009
Dec
.200
9Ju
n.20
10D
ec.2
010
Jun.
2011
Dec
.201
1Ju
n.20
12D
ec.2
012
Jun.
2013
total number of branchestotal number of bank employees (rhs)
branches thou. employees
Source: NBR
0123456789
0102030405060708090
Aus
tria
Bul
garia
Cze
ch R
epub
licEs
toni
aFr
ance
Ger
man
yG
reec
eIta
lyLa
tvia
Lith
uani
aTh
e N
ethe
rland
sPo
land
Portu
gal
Slov
akia
Slov
enia
Spai
nH
unga
ryEU
-27
aver
age
Rom
ania
201
1R
oman
ia 2
012
Rom
ania
201
3 Q
2
branches per 100,000 inhabitantscredit institutions per 100,000 inhabitants (rhs)
branches branches
Source: NBR, ECB (Statistical Data Warehouse)
Financial intermediation in nominal terms, calculated as the ratio of loans to the private sector to GDP stood at 37.1 percent in June 2013, down from 38.4 percent in December 2012, against the background of weak lending activity; the share of gross bank assets in GDP stayed on the downtrend it had embarked on in 2011, to reach 66 percent in June 2013, as nominal GDP rose at a faster pace than nominal gross assets (Chart 3.10.). With regard to the share of corporate and household deposits in GDP (33.5 percent in June 2013), fi nancial intermediation remained at a level similar to that recorded in December 2011 and December 2012. In comparison with the other Member States, in 2012, fi nancial intermediation in Romania was still far below the EU-27 average (Chart 3.11.).
Chart 3.10. Financial intermediation in Romania
Chart 3.11. Financial intermediation, December 2012 (international comparison)
0
10
20
30
40
50
60
70
80
2008
2009
2010
2011
2012
Jun.
2013
2008
2009
2010
2011
2012
Jun.
2013
2008
2009
2010
2011
2012
Jun.
2013
Assets/GDP Loans/GDP Deposits/GDP
percent
Source: NBR, monetary statistics, NIS
0
100
200
300
400
500
600
Aus
tria
Bulg
aria
Czec
h R
epub
licEs
toni
aFr
ance
Ger
man
yG
reec
eIta
lyLa
tvia
Lith
uani
aTh
e N
ethe
rland
sPo
land
Portu
gal
Slov
akia
Slov
enia
Spai
nH
unga
ryEU
-27
Rom
ania
assets/GDPloans/GDPdeposits/GDP
percent
Source: NBR, ECB (Statistical Data Warehouse)

FINANCIAL STABILITY REPORT 2013 31
3 Financial system and its related risks
The concentration of the Romanian banking system, as refl ected by the share of the top fi ve banks in total bank assets, declined slightly to 54 percent (Chart 3.12.). Deposits also followed a similar trend, as in August 2013, the top fi ve banks (in terms of their asset size) accounted for 53.5 percent of the deposits taken. The relative decline in the banking system’s concentration in the fi rst half of 2013 shows the stiffer competition among credit institutions in terms of deposits taken. The concentration of loans granted rose somewhat since the release of the 2011 Report (53.2 percent in August 2013). The Herfi ndahl-Hirschmann index, calculated for August 2013, highlights a higher concentration of loans (875 points) than that of deposits (825 points) and assets (834 points), respectively. The Herfi ndahl-Hirschmann index for assets shows a moderate concentration and places the Romanian banking system below the EU-27 average (Chart 3.13.).
Chart 3.12. Concentration of the Romanian banking system
Chart 3.13. Asset concentration (international comparison)
45
48
51
54
57
60
2008
2009
2010
2011
2012
Aug
. 201
3
2008
2009
2010
2011
2012
Aug
. 201
3
2008
2009
2010
2011
2012
Aug
. 201
3percent
Source: NBR
Assets of top five banks as
a share in total assets
Loans of top five banks as
a share in total loans
Deposits of top five banks as a share in total deposits
03006009001,2001,5001,8002,1002,4002,7003,000
0102030405060708090
100
Aus
tria
Bul
garia
Cze
ch R
epub
licEs
toni
aFr
ance
Ger
man
yG
reec
eIta
lyLa
tvia
Lith
uani
aTh
e N
ethe
rland
sPo
land
Portu
gal
Slov
akia
Slov
enia
Spai
nH
unga
ryEU
-27
aver
age
Rom
ania
*market share of top five banksHH index (rhs)
percent points
Source: NBR, ECB (Statistical Data Warehouse)
* Aug. 2013
3.2.3. Aggregate balance sheet of credit institutions
The period lapsed since the release of the previous report was mainly characterised by: (i) the contraction in banking activity, owing to lower exposures to both the real sector (foreign currency-denominated loans, in particular) and the government sector; (ii) the fast decline in external fi nancing on the back of the drop in intra-group loans, which was partially offset by the deposits taken from the domestic market; (iii) the broadening of the domestic deposit base in foreign currency, and (iv) the supplementation of capital reserves due to the contribution of credit institutions’ private shareholders. Despite the considerable drop in the fl ow of new foreign currency-denominated loans, the large stock of loans in foreign currency and the maturity mismatch between (particularly short-term) funds and fi nancial assets are potential sources of vulnerability.
The persistent worldwide uncertainties and parent banks’ strategy reassessments could enhance the changes in the balance sheets of credit institutions in Romania, particularly those with majority foreign capital.

NATIONAL BANK OF ROMANIA32
3 Financial system and its related risks
3.2.3.1. Dynamics of bank assets
The aggregate balance sheet assets, in gross value terms5 totalled lei 404,992.5 million at end-2012, up 3.1 percent (down 1.8 percent in real terms) as compared with 2011. In the fi rst eight months of 2013, the dynamics of bank assets followed a downtrend, entering negative territory starting with April (annual change of -2.2 percent in August 2013, in nominal terms, and -5.7 percent in real terms, respectively). This development refl ects the ongoing orderly balance sheet adjustment by some credit institutions, particularly those with majority foreign capital given (i) the persistence of unfavourable expectations on euro area economic growth, and (ii) the improvement in the risk profi le of the bank asset portfolio in view of the anticipated ahead-of-schedule implementation by credit institutions of the Basel III requirements via the CRD IV/CRR package6. The deceleration is in line with the regional trend, as well as with the trend manifest across the economies of most EU Member States.
During August 2012 – August 2013, the following developments deserve mention:
(A) the annual change in loans to the private sector7 followed a downward path, entering negative territory in March 2013 (-6.1 percent in August 2013, real terms); the decline was observed for both of the main categories of customers, being sharper in the case of foreign currency-denominated loans, and largely refl ects the slow pace of economic recovery, the high credit risk and the ongoing balance sheet adjustment in the fi nancial and non-fi nancial sectors;
(B) the positive annual dynamics of claims on the government sector saw a trend reversal starting with February 2013 for the fi rst time since the global fi nancial crisis fallout affected the Romanian economy (-7.5 percent at end-August 2013, real terms), due chiefl y to non-residents’ larger holdings of government securities and the slower pace of increase of public debt-to-GDP ratio;
(C) the annual rate of decline of credit institutions’ holdings with the central bank slowed down (from -14.8 percent in December 2012 to -8.6 percent in August 2013, real terms), partly as a result of lower external fi nancing across the whole maturity spectrum; minimum reserve requirements remain an important liquidity reserve of the Romanian banking sector, with a prudential role as well.
In the period under review, the mentioned developments had only a marginal impact on the weights of the main balance sheet items in the aggregate asset structure (Table 3.3.).
Loans to the private sector posted relatively homogeneous developments in terms of main categories of debtors, both of them reporting a trend reversal in their annual growth rates8, which entered negative territory as a result of: (i) the further high risk aversion of banks, as refl ected by tighter lending terms and conditions9; (ii) the high indebtedness of some categories of borrowers and their efforts towards adjusting their balance sheets and (iii) the larger number of companies falling under the insolvency law. The shares of the two institutional sectors in the loans to the private sector remained relatively unchanged, marginally in favour of non-fi nancial corporations (52.2 percent in August 2013) to the detriment of households.
5 The data source for the entire section is the monetary survey of credit institutions.6 The implementation schedule of the CRD IV/CRR package envisages the regulations to enter into force as of 2014.7 During August 2012 – August 2013, the contraction in lending totalled lei 6 billion.8 From 4.1 percent in real terms in August 2012 to -6.4 percent in August 2013 for non-fi nancial corporations and from
-0.8 percent to -5.8 percent for households, during the same period.9 According to the NBR’s Bank Lending Survey, August 2013.

FINANCIAL STABILITY REPORT 2013 33
3 Financial system and its related risks
Table 3.3. Asset structure of credit institutions operating in Romania
percent of total assets
2008 Dec.
2009 Dec.
2010 Dec.
2011 Dec.
2012 Jun.
2012 Aug.
2012 Dec.
2013 Mar.
2013 Jun.
2013 Aug.
Domestic assets, 98.0 96.6 96.8 97.7 97.8 97.3 97.2 96.7 96.8 96.8
of which:Claims on the NBR and credit institutions, 23.8 18.6 16.5 15.3 13.9 13.4 13.4 13.4 13.0 13.5
of which:
– claims on the NBR 21.8 15.8 14.2 13.7 12.3 11.9 11.9 11.7 10.9 11.5Claims on the domestic non-bank sector, 63.4 67.6 70.1 74.5 75.6 75.1 75.2 74.8 75.0 74.5
of which: – claims on the government sector 5.0 12.7 15.7 17.7 19.8 18.9 19.5 18.4 18.7 18.5
– claims on companies 29.2 27.4 27.9 30.3 29.9 30.2 30.0 30.3 30.1 29.9
– claims on households 29.2 27.5 26.5 26.5 25.9 26.1 25.8 26.1 26.1 26.0
Other assets 10.8 10.3 10.3 7.9 8.3 8.7 8.6 8.5 8.9 8.9Foreign assets 2.0 3.4 3.2 2.3 2.2 2.7 2.8 3.3 3.2 3.2
Source: NBR – Aggregate monetary survey of credit institutions
During August 2012 – August 2013, the decline was sharper in the case of foreign currency-denominated loans10, for both non-fi nancial corporations (by 6.5 percent) and households (by 2.6 percent), largely as a result of: (i) the prudential measures taken by the central bank with a view to tightening lending conditions on foreign currency loans granted to unhedged borrowers, the most recent action being the adoption of NBR Regulation No. 17 of 12 December 2012 on certain lending conditions; (ii) credit institutions’ steps to narrow the currency mismatch in order to reduce the vulnerabilities associated with the signifi cantly lower fi nancing in foreign currency, and (iii) the statistical effect exerted by the leu exchange rate movements. Looking at non-fi nancial corporations, these developments caused the share of outstanding foreign currency-denominated loans to shrink by 2.2 percentage points (from 60.2 percent in August 2012 to 58 percent in August 2013), while in the case of households, the share of foreign currency-denominated loans remained relatively unchanged (67.1 percent in August 2013).
The contraction in foreign currency lending was seen on all three maturity terms for both of the main categories of debtors, being sharper in the case of short-term loans; the maturity breakdown revealed more substantial changes in the case of the corporate sector (Charts 3.14. and 3.15.).
10 At end-August 2013, the stock of foreign currency-denominated loans to the private sector, expressed in lei, narrowed by 4.6 percent versus August 2012 (when expressed in euro, foreign currency-denominated loans went down 4.1 percent).

NATIONAL BANK OF ROMANIA34
3 Financial system and its related risks
Chart 3.14. Breakdown of foreign currency-denominated loans to companies
Chart 3.15. Breakdown of foreign currency-denominated loans to households
0
10
20
30
40
50
60
70
80
90
100
Dec
.201
1Ja
n.20
12Fe
b.20
12M
ar.2
012
Apr
.201
2M
ay.2
012
Jun.
2012
Jul.2
012
Aug
.201
2Se
p.20
12O
ct.2
012
Nov
.201
2D
ec.2
012
Jan.
2013
Feb.
2013
Mar
.201
3A
pr.2
013
May
.201
3Ju
n.20
13Ju
l.201
3A
ug.2
013
short-term medium-term long-term
Source: NBR
percent
Turning to leu-denominated loans, the real contraction manifest starting with September 2012 was marginal (annual changes ranging from -1.8 percent to -0.3 percent) before becoming more pronounced since end-June 2013 (-2.9 percent in August 2013), mainly on account of the persistently sharp rates of decline of household loans (-5.2 percent in August 2013) and the slower dynamics reported by corporate loans (from 6.4 percent in August 2012 to -1.2 percent in August 2013).
Chart 3.16. Breakdown of leu-denominated loans to companies
Chart 3.17. Breakdown of leu-denominated loans to households
0
10
20
30
40
50
60
70
80
90
100
Dec
.201
1Ja
n.20
12Fe
b.20
12M
ar.2
012
Apr
.201
2M
ay.2
012
Jun.
2012
Jul.2
012
Aug
.201
2Se
p.20
12O
ct.2
012
Nov
.201
2D
ec.2
012
Jan.
2013
Feb.
2013
Mar
.201
3A
pr.2
013
May
.201
3Ju
n.20
13Ju
l.201
3A
ug.2
013
short-term medium-term long-term
Source: NBR
percent

FINANCIAL STABILITY REPORT 2013 35
3 Financial system and its related risks
In terms of maturity breakdown, the rate of change of leu-denominated loans was spurred by medium-term loans to both non-fi nancial corporations (29.8 percent in August 2013, real annual changes) and households (23.7 percent). In fact, this category was the only one to see its share in the loan stock of both institutional sectors rising (Charts 3.16. and 3.17.).
In view of the persistent uncertainties associated with the global economic recovery, particularly in the euro area, deleveraging11 became relatively broad-based across the EU. Although inevitable given the need to correct the unsustainable indebtedness generated during the expansion stage of the business cycle (adjustment that may contribute to alleviating some vulnerabilities, such as the relatively high private external debt ratio), the magnitude and the speed of deleveraging are matters of concern, as its possible disorderly developments could put additional pressure on the companies’ profi t and loss accounts, as well as on the ability of households to ensure their debt service in an European macroeconomic context marked by modest economic growth rates and reluctance to grant new loans. Thus, deleveraging may pose a signifi cant risk to fi nancial stability.
So far, deleveraging in Romania has been orderly, considering that: (i) the annual dynamics of aggregate assets, in gross value terms (Chart 3.18.), saw positive nominal values throughout 2012 (which ranged between 3.1 percent and 8.0 percent) and in the fi rst quarter of 2013 (changes around 1 percentage point) and then declined, before stabilising at around -2 percent at end-August 2013; (ii) in August 2012 – August 2013, the loan-to-deposit ratio dropped by almost 9 percentage points (from 117.7 percent to 109 percent) and by 24 percentage points in the case of foreign currency loans (from 213 percent to 188.9 percent), as a result of the contraction in the volume of loans to the private sector and the broadening of the domestic deposit base; (iii) net sales of bank assets followed a downtrend and concerned primarily non-performing loans; (iv) the share of loans to the real sector in GDP narrowed by 1.7 percentage points to 38.4 percent in 2012; (v) the share of foreign liabilities followed a downward path (23.9 percent in August 2012; 23.2 percent in December 2012; 21.4 percent in August 2013); (vi) the ratio of gross bank assets to equity fl uctuated marginally around 11 throughout the period under review.
Chart 3.18. Developments in the main indicators relevant to assessing the magnitude of deleveraging
10.010.210.410.610.811.011.211.411.611.812.012.212.412.6
-15-10-505
101520253035404550
Jan.
2012
Feb.
2012
Mar
.201
2
Apr
.201
2
May
.201
2
Jun.
2012
Jul.2
012
Aug
.201
2
Sep.
2012
Oct
.201
2
Nov
.201
2
Dec
.201
2
Jan.
2013
Feb.
2013
Mar
.201
3
Apr
.201
3
May
.201
3
Jun.
2013
Jul.2
013
Aug
.201
3
assets (gross value) loans to the private sectordeposits of non-bank customers equityforeign liabilities assets/equity (rhs)
nominal annual percentage change
Source: NBR
index
11 According to the dedicated literature and in the ECB’s opinion, deleveraging is associated with banks’ balance sheet adjustment.

NATIONAL BANK OF ROMANIA36
3 Financial system and its related risks
Developments in the stock of loans to the private sector were relatively similar to those posted by balance sheet assets, refl ecting the persistence of a negative output gap and the pro-cyclical stance of commercial banks in granting new loans.
The analysis above shows the concern of the Romanian subsidiaries to adjust assets in relation to equity, namely to mitigate the risks associated with impaired assets.
3.2.3.2. Developments in own, raised and borrowed funds
The domestic deposit base continued to cover the largest part (51 percent in August 2013) of bank asset fi nancing (Table 3.4.). The increased granularity attributed to the fact that around two thirds of the deposit volume were made by households has ensured higher stability in terms of deposit steadiness. In fact, ever since 2010, households have acted as a net creditor vis-à-vis the banking sector.
The share of household deposits in the balance sheet liabilities of the Romanian banks is relatively high as compared with the structure of fi nancing sources of credit institutions in the euro area, where non-bank clients hold virtually 30 percent of total liabilities.
Table 3.4. Liability structure of credit institutions operating in Romania
percent of total liabilities2008 Dec.
2009 Dec.
2010 Dec.
2011 Dec.
2012 Jun.
2012 Aug.
2012 Dec.
2013 Mar.
2013 Jun.
2013 Aug.
Domestic liabilities, 69.3 73.6 73.2 73.5 75.2 76.1 76.8 77.8 78.0 78.6
of which:
– interbank deposits 2.1 5.4 3.4 3.4 5.0 4.7 4.6 2.5 2.2 1.9
– government sector deposits 3.1 2.1 1.7 1.4 1.5 1.4 1.3 1.3 1.3 1.4
– corporate deposits 20.2 19.3 19.0 19.0 17.7 18.3 18.5 18.9 19.1 19.5
– household deposits 24.4 26.7 27.0 28.7 29.2 29.5 30.2 31.7 31.6 31.8
– capital and reserves 10.6 12.0 14.2 16.2 16.9 17.3 18.0 18.8 19.3 19.7
– other liabilities 8.9 8.1 7.9 4.8 4.9 4.9 4.2 4.6 4.4 4.3
Foreign liabilities 30.7 26.4 26.8 26.5 24.8 23.9 23.2 22.2 22.0 21.4
Source: NBR – Aggregate monetary survey of credit institutions
The positive dynamics of deposits taken from resident non-government customers decelerated signifi cantly during August 2012 – August 2013 (from 4.7 percent to 1.4 percent, real annual change). The slowdown was more pronounced in the case of leu-denominated deposits. These developments show (i) the sharper declines in the interest rates on leu- and foreign currency-denominated deposits applied by banks to both companies and households in 2013; (ii) the lower amounts available for saving in the context of the slower dynamics of average net wage12 and the relatively high indebtedness, and (iii) the statistical effect of the transitory increase in the annual infl ation rate.
12 According to the NIS press releases on average net wage earnings.

FINANCIAL STABILITY REPORT 2013 37
3 Financial system and its related risks
Non-fi nancial corporations had a small contribution to the expansion in the volume of deposits, the 5.5 percent nominal rise recorded at end-August 2013 being largely attributed to a base effect; in real terms, the annual rate of change of corporate deposits was negative for the entire period under review (except the 1.8 percent advance seen in August 2013), indicating that deposits were used to offset the more diffi cult access to new fi nancing. The annual growth rate of household deposits followed a sharp downtrend, yet it remained in positive territory (from 6.9 percent in August 2012 to 1.7 percent in August 2013, real terms).
For both sectors, the deceleration was mostly ascribable to leu-denominated deposits13, whereas foreign currency-denominated deposits saw positive changes throughout the period under consideration, which were higher in the case of household deposits14. The divergent developments in the foreign currency-denominated loans to the private sector and the foreign currency funds raised from the domestic market indicate banks’ concern to lower the vulnerabilities related to the currency mismatch of bank operations.
The maturity breakdown showed the mixed preferences of customers, namely the rise in household deposits with maturities of more than one year and the increase in non-fi nancial corporations’ overnight deposits. The former development, together with the negative dynamics of long-term loans to the real sector, suggests banks’ more prudent concern to ensure a balanced maturity structure of the balance sheet.
Nevertheless, short-term deposits (overnight and up to one year) further held a prevailing share (Chart 3.19.), thus representing a potentially signifi cant source of vulnerability for the Romanian banking sector, given that they ensure the fi nancing of long-term assets in particular.
Chart 3.19. Share of deposits taken from residents (companies and households) and non-residents in total liabilities by maturity
01020304050607080
Dec
.200
8
Dec
.200
9
Mar
.201
0
Jun.
2010
Sep.
2010
Dec
.201
0
Mar
.201
1
Jun.
2011
Sep.
2011
Dec
.201
1
Mar
.201
2
Jun.
2012
Sep.
2012
Dec
.201
2
Mar
.201
3
Jun.
2013
Jul.2
013
Aug
.201
3
percent
share of residents’ medium- and long-term deposits share of residents’ short-term depositsshare of non-residents’ medium- and long-term deposits share of non-residents’ short-term deposits
Source: NBR
13 The annual growth rate of household leu-denominated deposits slowed down to -0.8 percent in August 2013 from 6.4 percent in August 2012 (real terms); as regards non-fi nancial corporations, the annual rate of change saw a relative improvement at end-August 2013 (3 percent in real terms) after 14 consecutive months of annual negative dynamics.
14 Household foreign currency-denominated deposits (expressed in lei) went up 9.8 percent in August 2013 (when expressed in euro, they rose by 10.4 percent), while those of non-fi nancial corporations increased by 2.7 percent (3.2 percent).

NATIONAL BANK OF ROMANIA38
3 Financial system and its related risks
The rate of decline of foreign fi nancing (accounting for 21.4 percent of aggregate liabilities at end-August 2013) gained speed in August 2012 – August 2013 (from -7.1 percent to -15.5 percent, real annual change). Behind this development stood: (i) the capital increases necessary for parent banks to consolidate their capital base in view of the fast implementation of the Basel III capital requirements via the CRD IV/CRR package; (ii) banks’ shift in focus towards granting loans depending on the non-performing loan ratio developments at sectoral level and capping lending to certain sectors considered risky following the decisions taken by credit institutions, as well as the lending policy pursued by parent banks. The decline was visible across the whole maturity spectrum, being sharper for funds raised with maturities of up to two years, which supports the assessment according to which deleveraging has unfolded orderly so far. The share of long-term funds raised was further prevalent in total foreign liabilities (70 percent in August 2013).
Own capital remained robust, about 70 percent of its volume being accounted for by the contribution of private shareholders of credit institutions in the form of share/endowment capital.
3 .2.4. Capital adequacy
Adequate capitalisation has remained a characteristic of the Romanian banking system, being supported by the regulatory and prudential supervisory measures adopted by the central bank in recent years. The comfortable solvency and Tier 1 capital ratios create the pre-requisites for the adequate implementation of the additional capital requirements imposed by the new Basel III regulations, which are to be transposed in the national legislation in the period ahead.
3.2.4.1. Developments in own funds of banks, Romanian legal entities
The still fragile macroeconomic conditions in which banks carried out their activity in the period lapsed since the release of the previous Financial Stability Report continued to put pressure on the own funds of banks, Romanian legal entities15 (the volume of total own funds16 decreased by 5.9 percent in December 2012 and by 9.5 percent in August 2013; year on year, nominal terms). In real terms, the decline in own funds was sharper in 2013 H1 (down by about 12 percent in August 2013) for both total own funds and Tier 1 capital (Chart 3.20.). Mention should be made that the decrease was accelerated by the high infl ation rate during the reference period (over 5 percent during September 2012 – June 2013).
15 According to NBR Regulation No. 18 (r1) of 14 December 2006 (republished in Monitorul Ofi cial al României, Part One, No. 311 of 5 May 2011) on own funds of credit institutions and investment fi rms, foreign bank branches originating in the EU Member States, which perform banking services in Romania, do not submit reports on own funds to the authority in the host country, considering that the parent bank has to observe capital requirements at consolidated level, according to the EU regulations. In August 2013, the Romanian banking system did not comprise any non-EU foreign bank branches.
16 The volume of banks’ own funds totalled lei 27.2 billion at end-August 2013 (compared with lei 30.0 billion in August 2012 and lei 29.0 billion in December 2012).

FINANCIAL STABILITY REPORT 2013 39
3 Financial system and its related risks
Chart 3.20. Total own funds and Tier 1 capital
-20-1001020304050
05
101520253035
Dec
.200
3
Dec
.200
4
Dec
.200
5
Dec
.200
6
Dec
.200
7
Sep.
2008
Dec
.200
8
Mar
.200
9
Jun.
2009
Sep.
2009
Dec
.200
9
Mar
.201
0
Jun.
2010
Sep.
2010
Dec
.201
0
Mar
.201
1
Jun.
2011
Sep.
2011
Dec
.201
1
Mar
.201
2
Jun.
2012
Sep.
2012
Dec
.201
2
Mar
.201
3
Jun.
2013
Aug
.201
3
Tier 1 capital total own funds
Tier 1 capital - real annual changes (rhs) total own funds - real annual changes (rhs)
lei bn. percent
Source: NBR, NIS
Nevertheless, the level and quality of own funds of the Romanian banks may be assessed as adequate, considering that: (i) they further support a high solvency ratio (14.7 percent in June 2013); (ii) they consist mostly of Tier 1 capital17, which has a permanent nature; (iii) the NBR decided to further use prudential fi lters18 for the calculation of own funds and prudential indicators throughout 2013 and to gradually phase them out while implementing the additional Basel III capital requirements (2014-2018). The central bank’s estimates indicate that the solvency ratio, calculated by removing prudential fi lters, is about 4 percentage points higher than the reading reported in compliance with the prudential regulations in force; the estimated solvency ratio in the absence of prudential fi lters shows that capital adequacy is above the levels recorded by many other countries in the region.
In the fi rst eight months of 2013, the structure of aggregate own funds (Table 3.5.) did not see signifi cant changes as compared with the previous year. Tier 1 capital further held an overwhelming share (nearly 93 percent) in total own funds of credit institutions. The marginal contribution of Tier 2 capital (about 7 percent) may be attributed not only to the lower volume of funds in this category (mostly revaluation reserves and subordinated debt), but also to the methodology of implementing prudential fi lters (these funds are diminished by 50 percent of the positive difference between total prudential valuation adjustments and total adjustments for impairment allocated to the fi nancial assets representing loans/investments, within the limit of the gross value of Tier 2 capital).
17 In line with the prudential regulations in force, funds are classifi ed as Tier 1 capital provided that they may be used at any time and primarily to absorb losses, do not imply fi xed costs for the credit institution and they are readily available for the credit institution, namely they have been paid in full.
18 The most signifi cant prudential fi lter specifi c to Romania refers to the positive difference between prudential value adjustments and adjustments for impairment (IFRS provisions) related to loans to non-bank clients for which banks establish minimum capital requirements at individual level, according to the standard approach.

NATIONAL BANK OF ROMANIA40
3 Financial system and its related risks
Table 3.5. Own funds and capital adequacy indicators
percent2008 Sep.
2008 Dec.
2009 Dec.
2010 Dec.
2011 Dec.
2012 Jun.
2012 Dec.
2013 Mar.
2013 Jun.
2013 Aug.
Percent of total own funds: 100 100 100 100 100 100 100 100 100 100
Tier 1 capital 76.9 77.3 78.6 80.8 80.7 93.0 92.3 92.4 92.6 93.4
Tier 2 capital 23.1 22.7 21.4 19.2 19.3 7.0 7.7 7.6 7.4 6.6
Solvency ratio(> 8 percent) 11.9 13.8 14.7 15.0 14.9 14.7 15.0 15.0 14.7 -Tier 1 capital ratio for credit risk 10.0 11.8 13.4 14.2 14.3 16.4 16.6 16.7 16.4 -Tier 1 capital ratio - - - 12.1 12.0 13.7 13.8 13.9 13.6 -
Source: NBR
The structure of Tier 1 capital refl ects its adequate quality (Chart 3.21.), as well as the unconditioned loss-absorbing capacity: (i) share capital (gross)19 remained the prevalent item (84.7 percent of total Tier 1 capital in December 2012 and 88.3 percent in August 2013), being made readily available to the bank and paid in full (shareholders’ new capital contributions amounted to EUR 111 million in 2012 and to EUR 42 million in 2013 H1); (ii) share premiums, which added to the capital made available by shareholders, further posted a signifi cant level (8.1 percent of total Tier 1 capital in December 2012 and 8.5 percent in August 2013); (iii) the volume of reserves20 was further high, although it was partially offset by the volume of deductible items21 introduced in order to preserve the adequate quality of Tier 1 capital. The negative fi nancial result recorded by banks in 2012 eroded signifi cantly Tier 1 capital (down 12 percent), the impact of losses being much lower in the fi rst eight months of 2013 (down 2.2 percent in August 2013) amid the improved fi nancial position of the banking system. The credit institutions which reported positive fi nancial results used the audited profi t to increase their own funds (up 2.5 percent in December 201222 and 3.3 percent in August 2013).
Although the prudential regulations applicable in Romania, harmonised with the EU regulations in 201023, allow the use of hybrid capital instruments to increase Tier 1 capital, credit institutions 19 From a methodological point of view, in line with the IFRS accounting standards used as an accounting basis starting
1 January 2012, share capital is adjusted for infl ation, with retained earnings as the corresponding account, so that total Tier 1 capital is not affected.
20 As of 1 January 2012, the gross value of reserves (namely the “retained earnings” item) includes the difference between prudential provisions set up in compliance with NBR Regulation No. 3/2009 as of 31 December 2011 and the adjustments for impairment under IFRS calculated as at 1 January 2012. In addition, as of 1 January 2012, the positive difference from the prudential valuation adjustments determined based on the prudential regulations applicable starting with the 2012 fi nancial year and the adjustments for impairment under IFRS is recorded in the off-balance sheet account 995 “Prudential fi lters”.
21 Starting with 1 January 2012, the deductible items specifi c to IFRS provisions, as well as those specifi c to Romania (a signifi cant impact having the prudential fi lter determined as the positive difference between prudential value adjustments and adjustments for impairment under IFRS, 50 percent of which being deductible from Tier 1 capital and 50 percent from Tier 2 capital) added to the prudential deductible items used in the period of implementing accounting regulations compliant with EU directives.
22 12 of the 31 credit institutions, Romanian legal entities, reported a profi t for the 2012 fi nancial year. 23 NBR-NSC Regulation No. 15/18/30 September 2010 amending and supplementing NBR-NSC Regulation No. 18/23/2006
on own funds of credit institutions and investment fi rms transposed into national law Directive 2009/111/EC of the European Parliament and of the Council of 16 September 2009 amending Directives 2006/48/EC, 2006/49/EC and 2007/64/EC (published in the Offi cial Journal of the European Union L 302 of 17 November 2009), supplementing the regulatory framework with the possibility provided to banks of using hybrid capital instruments within Tier 1 capital. At the same time, the central bank imposed a number of requirements that banks have to meet in case they resort to this option, with a view to ensuring the adequate quality of the aforementioned component of own funds.

FINANCIAL STABILITY REPORT 2013 41
3 Financial system and its related risks
made no resort so far to such category of resources, which indicates once more the adequate quality of Tier 1 capital, based exclusively on traditional sources of funds (capital, share premiums, reserves and audited profi t.
Chart 3.21. Breakdown of Tier 1 capital taken into account for determining solvency
-40
-20
0
20
40
60
80
100
120
140
Sep.
2008
Dec
.200
8M
ar.2
009
Jun.
2009
Sep.
2009
Dec
.200
9M
ar.2
010
Jun.
2010
Sep.
2010
Dec
.201
0M
ar.2
011
Jun.
2011
Sep.
2011
Dec
.201
1M
ar.2
012
Jun.
2012
Sep.
2012
Dec
.201
2M
ar.2
013
Jun.
2013
Aug
.201
3
percentdeductible items
current loss
current profit(audited)
legal reserves
share premiums
share capital
Source: NBR
3.2.4.2. Analysis of capital adequacy indicators
The robust level of capital adequacy has remained a characteristic of the Romanian banking system, due also to the regulatory and prudential supervisory measures adopted by the central bank once the fallout from the international fi nancial crisis was manifest in Romania, namely: (i) imposing a 10 percent minimum prudential threshold set in the supervisory process for the solvency ratio (as compared to the 8 percent minimum required level applicable in Romania and in the EU) on credit institutions considered to have a high risk profi le in order to enhance banks’ capacity to withstand endogenous and exogenous shocks generated by the challenging international macroeconomic context; (ii) introducing prudential fi lters, also at individual level, along with the implementation by banks of the IFRS as an accounting basis, which resulted in the increased capacity of own funds’ to absorb losses from the banking business and the preservation of prudent levels of the solvency ratio24.
24 The solvency ratio estimated for 2012, excluding prudential fi lters, stands signifi cantly higher than that reported by credit institutions in compliance with the regulations in force (i.e. 18.7 percent, about 4 percentage points above the reported level). The positive difference has been maintained in 2013, considering that the volume of prudential fi lters remained relatively unchanged in 2012 and 2013 H1.

NATIONAL BANK OF ROMANIA42
3 Financial system and its related risks
Chart 3.22. Capital adequacy indicators
0
5
10
15
20
25
2004
2005
2006
2007
Mar
.200
8
Jun.
2008
Sep.
2008
Dec
.200
8
Mar
.200
9
Jun.
2009
Sep.
2009
Dec
.200
9
Mar
.201
0
Jun.
2010
Sep.
2010
Dec
.201
0
Mar
.201
1
Jun.
2011
Sep.
2011
Dec
.201
1
Mar
.201
2
Jun.
2012
Sep.
2012
Dec
.201
2
Mar
.201
3
Jun.
2013
solvency ratio
Tier 1 capital ratio for credit risk
Tier 1 capital ratio
percent
Source: NBR
In this context, in the period lapsed from the previous Financial Stability Report, the indicators used to assess the capital adequacy, calculated for the Romanian banking system (Chart 3.22.), further reported high levels, as follows:
(a) the solvency ratio25 stood at 15 percent in December 2012 and at 14.7 percent in June 2013 (a level similar to that recorded in June 2012);
(b) Tier 1 capital ratio for credit risk26 remained at the high level recorded in the previous period (16.4 percent in June 2013);
(c) Tier 1 capital ratio27, which takes into account the total capital requirement (namely the total requirements for credit risk, operational risk, market risk and settlement/delivery risk), was 13.6 percent in June 2013 (a level similar to that seen in the same year-ago period). The level of Tier 1 capital ratio is very close to that of the solvency ratio, which refl ects the high quality of own funds of banks, Romanian legal entities, as well as their capacity to withstand potentially adverse shocks.
The level of the capital adequacy indicators reported by the Romanian banking system creates the conditions for the adequate implementation of the additional capital requirements imposed by Basel III regulations, which are to be introduced in the national legislation via the CRD IV/CRR package28 applicable starting with 2014 (the package will be gradually implemented until the end of 2018).
25 The minimum required level of the solvency ratio is 8 percent, considering the ratio of own funds to capital requirements is 1 at least.
26 Tier 1 capital ratio for credit risk is determined as a ratio of Tier 1 capital to total risk-weighted assets and off-balance-sheet items.
27 Tier 1 capital ratio is calculated as a ratio of Tier 1 capital to total capital requirements.28 Directive 2013/36/EU of the European Parliament and of the Council of 26 June 2013 on the access to the activity of
credit institutions and the prudential supervision of credit institutions and investment fi rms and Regulation No. 575/2013 of the European Parliament and of the Council of 26 June 2013 on prudential requirements for credit institutions and investment fi rms.

FINANCIAL STABILITY REPORT 2013 43
3 Financial system and its related risks
The Regulation on prudential requirements for credit institutions of the European Parliament (directly applicable by credit institutions in order to avoid implementation discrepancies) imposes a minimum Common Equity Tier 1 capital requirement29 of 4.5 percent of the risk-weighted assets (which is signifi cantly higher than the minimum level of 2 percent, applicable in compliance with Basel II regulations). The total capital requirements (including both Tier 1 capital and Tier 2 capital) remained unchanged at 8 percent of risk-weighted assets. In terms of fl exibility at national level, the European Parliament’s Regulation allows Member States’ authorities to impose, for a period of 2 years which may be extended, tighter macroprudential requirements for authorised entities in order to mitigate the macroprudential risk or the systemic risk (these may be applied to own funds, liquidity requirements, large exposures, capital conservation buffer, exposures to other fi nancial entities, risk weights used to diminish the unsustainable increase in real estate prices or to transparency and disclosure requirements, etc.). The CRD IV/CRR package that Member States have to transpose into national legislation imposes additional requirements apart from those above-mentioned, namely: (i) a common requirement for all the EU banks consisting in holding/maintaining a capital conservation buffer (in the form of Common Equity Tier 1 capital of 2.5 percent of risk-weighted assets), and (ii) a requirement applicable in relation to the specifi c situation concerning the setting of a countercyclical capital buffer of up to 2.5 percent. Additionally, Member States may introduce a systemic risk buffer (in the form of Common Equity Tier 1 capital) for the fi nancial sector as a whole or for one or more subsets of institutions, as well as two capital buffers considering the systemic importance of institutions (a capital buffer for global systemically important institutions, imposed strictly at consolidated level, and a capital buffer for domestic systemically important institutions, imposed at a consolidated, individual or sub-consolidated level, as appropriate). Mention should be made that such capital buffers are generally not cumulative.
The solvency ratio for the Romanian banking system, calculated in line with prudential regulations in force (which is lower by about 4 percentage points, following the impact of prudential fi lters on own funds), is similar to those reported by the countries in the region (Chart 3.23.). Moreover, the home countries of the parent banks with subsidiaries in Romania have an adequate level of capitalisation (Austria stands out with a solvency ratio of 16.1 percent in 2012, which ensures a certain comfort to host countries, including Romania, given that in August 2013, the Austrian banks held 38 percent of the Romanian bank assets). The exception is Greece, which reported a solvency ratio of 10.2 percent in 2012 (however, the indicator has followed a recovery trend after the 7 percent reading recorded in the previous year).
29 Only common shares are taken into account in the calculation of Common Equity Tier 1 capital, the preferred shares being excluded.

NATIONAL BANK OF ROMANIA44
3 Financial system and its related risks
Chart 3.23. Solvency ratio in selected EU Member States
0
4
8
12
16
20B
ulga
ria
Cze
chR
epub
lic
Hun
gary
Pola
nd
Rom
ania
Aus
tria
Gre
ece
Italy
The
Net
herla
nds
Fran
ce
2007 2008 2009 2010 2011 2012
percent
Source: IMF (Financial Soundness Indicators, FSI Tables, April 2013); NBR calculations
A more in-depth analysis of capital adequacy, by monitoring the breakdown of solvency ratio by group of banks in terms of asset size30 (Chart 3.24.), reveals the improvement in the position of large banks (the solvency ratio added 0.5 percentage points in June 2013 versus June 2012 to 13.4 percent). The solvency ratio calculated for the other two groups of banks followed a downward path during June 2012 – June 2013, against the background of the negative fi nancial results that affected the volume of own funds. Nevertheless, mention should be made that the solvency ratio for the two groups of banks was above the system average.
Bank distribution in terms of solvency ratio (Chart 3.25.) shows that most banks (i.e. 14) stood in the 12-16 percent range in June 2013. One small-sized bank (holding 0.12 percent of the banking system assets) recorded a solvency
ratio below 10 percent at end-June 2013 (however, the reported solvency ratio was higher than the minimum required threshold of 8 percent) and therefore supervisory measures were applied to it. The number of entities which posted high solvency ratios (over 16 percent) went down to 11 in June 2013 (from 17 in June 2012).
30 The NBR classifi es credit institutions in terms of their asset shares in total assets of the banking system, as follows: large banks, with a share of assets higher than 5 percent of total bank assets, medium-sized banks whose assets hold shares ranging between 1 and 5 percent of total assets and small-sized banks whose assets account for less than 1 percent of aggregate assets.
Chart 3.24. Solvency ratio by group of banks in terms of asset holdings
0
5
10
15
20
25
30
35
Dec
.200
4D
ec.2
005
Dec
.200
6D
ec.2
007
Sep.
2008
Dec
.200
8M
ar.2
009
Jun.
2009
Sep.
2009
Dec
.200
9M
ar.2
010
Jun.
2010
Sep.
2010
Dec
.201
0M
ar.2
011
Jun.
2011
Sep.
2011
Dec
.201
1M
ar.2
012
Jun.
2012
Sep.
2012
Dec
.201
2M
ar.2
013
Jun.
2013
large banksmedium-sized bankssmall-sized banks
percent
Source: NBR

FINANCIAL STABILITY REPORT 2013 45
3 Financial system and its related risks
Chart 3.25. Bank distribution in terms of solvency ratio
Chart 3.26. Bank asset distribution in terms of solvency ratio
0
2
4
6
8
10
12
14
16
18
Dec
.200
8
Dec
.200
9
Dec
.201
0
Dec
.201
1
Jun.
2012
Dec
.201
2
Mar
.201
3
Jun.
2013
8 - 10% 10 - 12% 12 - 16% 16 - 20%20 - 24% 24 - 30% above 30%
number of banks
Source: NBR
0
10
20
30
40
50
60
70
80
90
Dec
.200
8
Dec
.200
9
Dec
.201
0
Dec
.201
1
Jun.
2012
Dec
.201
2
Mar
.201
3
Jun.
2013
8 - 10% 10 - 12% 12 - 16%16 - 20% 20 - 24% 24 -30%above 30%
percent
Source: NBR
Bank asset distribution in terms of the solvency ratio (Chart 3.26.) reveals their concentration in the 12-16 percent range (69.1 percent in June 2013). The share of assets held by banks with high solvency ratios (over 16 percent) remained unchanged at 14 percent in December 2012 and June 2013.
For analysis purposes, the central bank also uses the leverage ratio31, an indicator measuring the extent to which banks use own sources to fi nance their activity (Chart 3.27.). The indicator relevance derives from using the accounting values of assets, being complementary to indicators determined based on the risk-weighted assets. The leverage ratio calculated for the Romanian banking sector was further high in the period under consideration (8 percent in December 2012 and June 2013), refl ecting the comfortable capitalisation of banks. The Regulation on prudential requirements for credit institutions issued by the European Parliament for the implementation of Basel III requirements imposes a minimum leverage ratio, whose level will be determined based on a report submitted by the European Commission by 31 December 2016, followed by an observation period. As of 1 January 2015, banks shall report the level of this indicator.
31 The leverage ratio is calculated as a ratio of Tier 1 capital to total assets at average value (the accounting value of assets is used).
Chart 3.27. Leverage ratio – total and by group of banks
0
2
4
6
8
10
12
14
16
18
2004
2005
2006
2007
Mar
.200
8Ju
n.20
08Se
p.20
08D
ec.2
008
Mar
.200
9Ju
n.20
09Se
p.20
09D
ec.2
009
Mar
.201
0Ju
n.20
10Se
p.20
10D
ec.2
010
Mar
.201
1Ju
n.20
11Se
p.20
11D
ec.2
011
Mar
.201
2Ju
n.20
12Se
p.20
12D
ec.2
012
Mar
.201
3 Ju
n.20
13
totallarge banksmedium-sized bankssmall-sized banks
percent
Source: NBR

NATIONAL BANK OF ROMANIA46
3 Financial system and its related risks
The Regulation will set different levels for the minimum threshold based on the business models of the banks.
The leverage ratio by bank asset size (Chart 3.27.) shows similar developments compared to the previous period, namely the indicator associated with large banks was slightly below the system average, whereas medium-sized banks further reported above-average capitalisation by about one percentage point. The indicator calculated for the group of small-sized banks saw a contraction, particularly as a result of the negative fi nancial results recorded in 2012 and in the fi rst half of 2013.
The leverage ratio registered by the Romanian banking system (about 8 percent during 2010-2012) was similar to that reported by other countries in the region (Chart 3.28.) and signifi cantly higher than those reported by the home countries of the parent banks with Romanian subsidiaries. The highest leverage ratio was recorded by Austria with a level of 7.6 percent in 2012, while France, the Netherlands and Italy reported lower levels of nearly 5 percent; Greece posted a negative leverage ratio in the past two years, against the background of the macroeconomic diffi culties that adversely hit the banking system.
Chart 3.28. Leverage ratio in selected EU Member States
-3
0
3
6
9
12
Bul
garia
Cze
chR
epub
lic
Hun
gary
Pola
nd
Rom
ania
Aus
tria
Gre
ece
Italy
Fran
ce
The
Net
herla
nds
2007 2008 2009 2010 2011 2012
percent
Source: IMF (Financial Soundness Indicators, FSI Tables, April 2013); NBR calculations
3.2.5. Loans and credit risk
Given the efforts to adjust their own balance sheets, in the context of the ongoing deleveraging at EU level, as well as of maintaining a prudent stance in lending activity, the Romanian banking system contained new loans to the real sector in 2013 H1. The development is similar to that recorded in the euro area and in most countries in the region, against the backdrop of still fragile macroeconomic conditions. The NBR measures to counteract the heightened risks associated with foreign currency-denominated loans to unhedged borrowers resulted in the reversal of the uptrend in foreign currency lending which had been manifest since 2007.
The quality of loan portfolios has remained a vulnerability to the Romanian banks’ balance sheets owing to the pressure put on debtors’ fi nancial standing and the restraint in lending. Nevertheless,

FINANCIAL STABILITY REPORT 2013 47
3 Financial system and its related risks
non-performing loans are comfortably provisioned particularly following the NBR decision to further use prudential fi lters in the calculation of own funds and prudential indicators.
3.2.5.1. Main credit developments
The positive dynamics of lending which started in the latter half of 2011 reversed in 2012 Q4 (Chart 3.29.), the same downtrend being further manifest in the fi rst eight months of 201332. Against this background, in August 2013, the volume of loans granted by the Romanian banking system to the private sector was similar to that outstanding at end-2011.
In nominal terms, the annual growth rate of lending was modest, yet positive at end-2012 (1.3 percent), entering negative territory in March 2013 and reaching -2.6 percent in August 2013. The contraction in lending seen in Romania has been in line with the trends manifest in the euro area and in most countries in the region, on the back of the still challenging international macroeconomic developments, which affect both credit demand and lending standards and conditions applied by commercial banks, as well as owing to the
ongoing deleveraging, the efforts to comply with the requirements derived from the transposition of the Basel III Accord into the national legislation and the management of a large volume of non-performing loans across many EU economies.
Refl ecting lending developments, the annual growth rate of bank assets (gross value)33 turned negative in the current year (-2.2 percent in August 2013, nominal terms), after the relatively modest pick-up (3.1 percent) posted at end-2012, amid the still below-potential economic growth.
Behind the aforementioned developments stood the prevalence of factors having a potentially contractionary impact on lending. As regards the credit supply, the following deserve mention: (i) the increased concern of the Romanian banks to adjust their own balance sheets, in the context of the persistent deleveraging manifest at EU level (affecting the decline in loans from the parent banks) and the additional capital requirements imposed by Basel III Accord; (ii) a further prudent stance in lending, amid the ongoing deterioration of the loan portfolio quality and the high provisioning costs of credit risk; (iii) the limited volume of medium- and long-term leu-denominated fi nancing sources. On the demand side, the factors with potentially negative impact on lending were: (i) the relatively modest economic growth and the only gradual adjustment of this trend in the period ahead, in the context of a persistent negative output gap; (ii) the persistence of risk aversion and the continued adjustment of households’ and domestic companies’ balance sheets, a trend that is part of a EU-wide
32 At end-August 2013, loans to the private sector amounted to lei 221.9 billion, being on a decline from the same year-ago period (lei 227.9 billion) and the end of 2012 (lei 225.8 billion).
33 The volume of bank assets (gross value) followed a downtrend in the period under review, decreasing from lei 405.6 billion in August 2012 to lei 404.9 billion in December 2012 and to lei 396.5 billion in August 2013. The data source is the monetary survey.
Chart 3.29. Bank assets and loans to private sector
0
100
200
300
400
500
600
700
2001
2002
2003
2004
2005
2006
2007
2008
2009
2010
2011
2012
bank assetsloans to private sectorGDP
lei bn.
Source: NBR, NIS

NATIONAL BANK OF ROMANIA48
3 Financial system and its related risks
process34. Limiting the foreign currency-denominated loans to unhedged borrowers via the regulatory measures adopted by the central bank and coordinated at EU level, following the implementation of the European Systemic Risk Board recommendations35, should be mentioned as a macroprudential factor acting on both the demand and supply side.
With a view to ensuring the necessary conditions for the sustainable resumption of lending and economic growth convergence towards its potential, the central bank maintained a prudent monetary policy stance in order to anchor infl ation expectations and tailored its liquidity management in the banking system36 so as to consolidate the pass-through of monetary policy impulse to the fi nancial and real sectors. Moreover, in 2013, the central bank sent renewed signals aimed at prompting a gradual downturn in the costs of loans, by resuming the progressive and prudent policy rate cut37 started when the fallout from the global fi nancial crisis fi rst hit Romania38.
In the period lapsed since the release of the previous report, the dynamics of private sector loans (Chart 3.30.) re-entered negative territory. The decline accelerated gradually, from 1.1 percent in September 2012 to 8.4 percent in July 2013 (annual dynamics, real terms), slowing down by 2.3 percentage points to 6.1 percent in August 2013. The downtrend was manifest in the case of both leu- and foreign currency-denominated loans. Nevertheless, the contraction in the foreign currency component39 was sharper (the rate of decline accelerated starting with January 2013 to reach -4.6 percent in August 2013). With regard to the developments in the leu-denominated credit40, the contraction was moderate until May 2013 (1.3 percent in real terms), then it stabilised at around 3 percent (2.9 percent in August 2013).
It is worth noting that the real growth rate of leu-denominated credit was strongly infl uenced
34 European Central Bank – Annual Report 2012.35 The specifi ed measure was implemented as a result of the higher risk associated with this category of debtors, which
may induce a systemic risk across the fi nancial system. The objectives of the Recommendation of the European Systemic Risk Board on lending in foreign currencies (ESRB/2011/1) are to: (i) limit exposures to credit and market risks, thus increasing the resilience of the fi nancial system; (ii) control excessive foreign currency credit growth and avoid asset price bubbles; (iii) limit funding and liquidity risks, thus narrowing this contagion channel; (iv) create incentives to improve risk pricing associated with foreign currency lending, and (v) avoid circumvention of national measures through regulatory arbitrage.
36 As of January 2013, the NBR Board decided to resume the adequate liquidity management in the banking system, by gradually increasing the volume of liquidity injected via weekly repo auctions (from lei 4 billion to lei 9 billion in January 2013, lei 11 billion in February 2013, before eliminating this ceiling and resorting to auctions with full allotment starting March 2013), thus infl uencing the downward movements of interbank rates.
37 The NBR Board decided to lower the monetary policy rate to 5.0 percent per annum from 5.25 percent starting 2 July 2013, to 4.5 percent per annum from 5.0 percent starting with 6 August 2013 and to 4.25 percent starting with 1 October 2013.
38 Starting with September 2008, the NBR cut the monetary policy rate by 6 percentage points (from 10.25 percent to 4.25 percent).
39 The volume of foreign currency-denominated loans totalled lei 137.8 billion in August 2013 (versus lei 144.3 billion in August 2012 and lei 141.1 billion in December 2012).
40 The volume of leu-denominated loans to the real sector amounted to lei 84.1 billion in August 2013 (versus lei 83.6 billion in August 2012 and lei 84.7 billion in December 2012).
Chart 3.30. Real annual growth rate of loans to private sector
-20
0
20
40
60
80
100
Dec
.08
Dec
.09
Dec
.10
Dec
.11
Mar
.12
Jun.
12 S
ep.2
012
Dec
.201
2Ja
n.20
13Fe
b.20
13M
ar.2
013
Apr
.201
3M
ay.2
013
Jun.
2013
Jul.2
013
Aug
.201
3
percent
loans to private sector in domestic currency
loans to private sector in foreign currency
total loans to private sector
Source: NBR, NIS

FINANCIAL STABILITY REPORT 2013 49
3 Financial system and its related risks
by the infl ation rate, which stayed above the upper limit of the variation band around the central target (in a range between 4.56 percent and 5.97 percent) starting with September 2012. The nominal growth rate of leu-denominated loans was in positive territory for the entire period lapsed since the release of the previous report, standing at about 4 percent during July 2012 – May 2013 and then posting more modest readings (0.6 percent in August 2013).
The currency breakdown of loans to the private sector showed the reversal of the uptrend in the share of foreign currency-denominated loans, which had started in 2007 (Chart 3.31.). This development was originally manifest as a slower growth (in July-November 2012, the pace of increase of foreign currency-denominated loans decelerated from 9 percent to 1.5 percent) and then continued with an initially modest contraction (-0.2 percent in December 2012), which accelerated thereafter (-4.6 percent in August 2013). Behind this stood chiefl y the NBR measures41 imposing on credit institutions and non-bank fi nancial institutions a more prudent stance with regard to lending conditions42, particularly for foreign currency-denominated loans granted to unhedged borrowers43 (both individuals and non-fi nancial corporations), also including the obligation to notify customers of the impact generated by a potentially severe domestic currency depreciation on the debt service. The downward trend in foreign currency-denominated loans was also infl uenced by the supply-side factors which are related to the structural change in the balance sheets of banks with majority foreign capital, namely the decline in the volume of foreign currency funding. These factors led to the nearly 2 percentage point drop in the share of foreign currency loans in total credit to the private sector, from 64.0 percent in July 2012 to 62.1 percent in August 2013. The contraction in the volume of foreign currency-denominated loans was manifest across the whole maturity spectrum, yet it affected short-term loans in particular.
Chart 3.31. Loans to private sector by currency Chart 3.32. Loans to private sector by maturity
0102030405060708090
100
Dec
.200
1D
ec.2
002
Dec
.200
3D
ec.2
004
Dec
.200
5D
ec.2
006
Dec
.200
7D
ec.2
008
Dec
.200
9D
ec.2
010
Dec
.201
1M
ar.2
012
Jun.
2012
Sep
.201
2D
ec.2
012
Jan.
2013
Feb.
2013
Mar
.201
3A
pr.2
013
May
.201
3Ju
n.20
13Ju
l.201
3A
ug.2
013
percent
loans to private sector in foreign currencyloans to private sector in domestic currency
Source: NBR
0
10
20
30
40
50
60
70
80
90
100
Dec
.200
1D
ec.2
002
Dec
.200
3D
ec.2
004
Dec
.200
5D
ec.2
006
Dec
.200
7D
ec.2
008
Dec
.200
9 D
ec.2
010
Dec
.201
1M
ar.2
012
Jun.
2012
Sep.
2012
Dec
.201
2Ja
n.20
13Fe
b.20
13M
ar.2
013
Apr
.201
3M
ay.2
013
Jun.
2013
Jul.2
013
Aug
.201
3
percent
short-term medium-term long-term
Source: NBR
41 NBR Regulation No. 17/2012 on certain lending conditions published in Monitorul Ofi cial al României, Part One, No. 855 of 18 December 2012.
42 The most important provisions of the new regulations refer to: (i) providing the underlying assumptions of the calculation method for the maximum levels of overall indebtedness using standard levels of exchange rate, interest rate and income-related shocks; (ii) taking into account only the eligible income, namely the continuous income streams; (iii) setting a minimum level of 133 percent for consumer loan collateral; (iv) establishing a maturity of up to fi ve years for consumer loans, and (v) capping real estate loans in relation to the mortgage collateral value.
43 The Regulation defi nes the “unhedged borrower” as the individual or the non-fi nancial entity which does not have the necessary resources denominated or indexed to the currency in which the loan is taken/granted.

NATIONAL BANK OF ROMANIA50
3 Financial system and its related risks
The maturity breakdown of private sector loans changed in the reviewed period (Chart 3.32.), in favour of the increase in medium-term loans44 (whose share stood at 23.2 percent in August 2013), up 3 percentage points compared to the fi gure recorded in the same year-ago period, due solely to developments in the leu-denominated component. The effect of this restructuring materialised in the 2.6 percentage point drop in the share of short-term loans45 in total loans to the private sector to 22.3 percent in August 2013. Long-term loans46 further held a prevailing share in banks’ balance sheets (54.5 percent of total loans to the private sector at end-August 2013, a level similar to that recorded a year earlier), which continues to pose challenges in terms of maturity matching with the fi nancing sources. In this context, banks’ balance sheet structure will improve as local fi nancial markets develop, thereby providing medium- and long-term fi nancing sources denominated in the national currency and thus facilitating the sustainable resumption of lending.
Although the general features previously seen in the maturity breakdown of credit components by currency remained unchanged, the developments posted during August 2012 – August 2013 brought about several changes. Specifi cally, long-term loans consolidated their position in the foreign currency-denominated loan portfolio (Chart 3.34.), adding 2 percentage points in the reference period to reach 68 percent in August 2013, given the contraction reported by short-term loans. The leu-denominated loan portfolios further saw a balancing in terms of maturity (Chart 3.33.), on the back of the marked increase in the share of medium-term loans to 32 percent in August 2013 (up 7.5 percentage points versus August 2012) and the contractions by 4 percentage points to 35.7 percent in short-term loans and by 3.5 percentage points to 32.3 percent in long-term loans.
Chart 3.33. Loans to private sector in domestic currency by maturity
Chart 3.34. Loans to private sector in foreign currency by maturity
0
10
20
30
40
50
60
70
80
90
100
Dec
.200
2D
ec.2
005
Sep
.200
8Fe
b.20
09M
ay.2
009
Aug
.200
9N
ov.2
009
Feb.
2010
May
.201
0A
ug.2
010
Nov
.201
0Fe
b.20
11M
ay.2
011
Aug
.201
1N
ov.2
011
Feb.
2012
May
.201
2A
ug.2
012
Nov
.201
2Fe
b.20
13M
ay.2
013
Aug
.201
3
percent
long-term medium-term short-term
Source: NBR
44 The volume of medium-term loans amounted to lei 51.6 billion in August 2013 (versus lei 46.1 billion in August 2012 and lei 46.9 billion in December 2012).
45 In the period under consideration, the volume of short-term loans contracted to lei 49.4 billion in August 2013 (as against lei 56.6 billion in August 2012 and lei 54.8 billion in December 2012).
46 The fl uctuations in the volume of long-term loans were less pronounced than those recorded by the other components of loans to the real sector. Thus, in August 2013, long-term loans went down to lei 120.9 billion (from lei 125.3 billion in August 2012 and lei 124.2 billion in December 2012).

FINANCIAL STABILITY REPORT 2013 51
3 Financial system and its related risks
During August 2012 – August 2013, the main categories of debtors saw a reversal of the previous developments, as the volume of loans increased at a slower pace and then headed downwards. Loans to households started to fall in annual terms as of August 2012 (-0.8 percent in real terms), posting a 4.5 percent contraction at end-2012. In January-August 2013, the decline was sharper (ranging from -6 percent to -7.8 percent), with long-term loans being the most adversely hit. The annual dynamics of loans to non-fi nancial corporations entered negative territory towards end-2012 (-1.0 percent in November, real terms). The deceleration was faster in the fi rst eight months of 2013, particularly that of the short-term component. The magnitude of this development was high enough to become manifest in nominal terms as well for both categories of debtors47. However, the aforementioned developments did not produce signifi cant changes in the breakdown of private sector loans by recipient (Chart 3.35.), with loans to non-fi nancial corporations further holding a prevailing share (52.2 percent in total private sector loans in August 2013).
Chart 3.35. Loans to private sector by component Chart 3.36. Breakdown of loans to private sector by recipient
-10
0
10
20
30
40
50
0
20
40
60
80
100
120
Dec
.200
8D
ec.2
009
Dec
.201
0D
ec.2
011
Mar
.201
2Ju
n.20
12Se
p.20
12D
ec.2
012
Jan.
2013
Feb.
2013
Mar
.201
3A
pr.2
013
May
.201
3Ju
n.20
13Ju
l.201
3A
ug.2
013
percentlei bn.
household loans (volume)corporate loans (volume)household loans (real annual growth rate), rhscorporate loans (real annual growth rate), rhs
Source: NBR
0102030405060708090
100D
ec.2
008
Dec
.200
9D
ec.2
010
Dec
.201
1M
ar.2
012
Jun.
2012
Sep.
2012
Dec
.201
2Ja
n.20
13Fe
b.20
13M
ar.2
013
Apr
.201
3M
ay.2
013
Jun.
2013
Jul.2
013
Aug
.201
3
percent
loans to non-monetary financial institutionsloans to companiesloans to households
Source: NBR
For June 2012 – August 2013, the analysis of average interest rates on outstanding loans and deposits (Chart 3.37.) shows the following developments:
(i) the interest rate on leu-denominated household loans added 0.4 percentage points in the latter half of 2012 and in 2013 Q1 to a peak of 13.4 percent in March 2013, refl ecting the domestic macroeconomic conditions, as well as the persistence of high risk perception relative to this segment (loans granted are generally consumer loans). During April-August 2013, interest rates were revised downwards to 12.5 percent at end-August, a level similar to that calculated for the same year-ago period, but which can be deemed high, considering that it is about 8 percentage point higher than the monetary policy rate. The average interest rates on leu-denominated loans to non-fi nancial corporations were about 4 percentage point lower (8.8 percent in August 2013, down 1 percentage point as against the same period a year earlier), mirroring the change in the business model of banks in favour of this category of customers;
47 In the reviewed period, the volume of loans to households narrowed to lei 103.2 billion in August 2013 (from lei 105.7 billion in August 2012 and lei 104.5 billion in December 2012). The volume of loans to non-fi nancial corporations dropped to lei 115.9 billion in August 2013 (from lei 119.4 billion in August 2012 and December 2012).

NATIONAL BANK OF ROMANIA52
3 Financial system and its related risks
Chart 3.37. Interest rate margins on outstanding loans and deposits
Chart 3.38. Interest rate margins on new loans and deposits
0
2
4
6
8
10
Sep.
2008
Dec
.200
8M
ar.2
009
Jun.
2009
Sep.
2009
Dec
.200
9M
ar.2
010
Jun.
2010
Sep.
2010
Dec
.201
0M
ar.2
011
Jun.
2011
Sep.
2011
Dec
.201
1M
ar.2
012
Jun.
2012
Sep.
2012
Dec
.201
2M
ar.2
013
Jun.
2013
percentage points
interest rate margin in domestic currency(households)interest rate margin in domestic currency(companies)interest rate margin in euro (households)
interest rate margin in euro (companies)
Source: NBR
012345678
Dec
.200
8D
ec.2
009
Dec
.201
0D
ec.2
011
Mar
.201
2Ju
n.20
12Ju
l.201
2Se
p.20
12D
ec.2
012
Jan.
2013
Feb.
2013
Mar
.201
3A
pr.2
013
May
.201
3Ju
n.20
13Ju
l.201
3A
ug.2
013
percentage points
interest rate margin in domestic currency(households)interest rate margin in domestic currency(companies)interest rate margin in euro (households)
interest rate margin in euro (companies)
Source: NBR
(ii) banks gradually cut the interest rate on EUR-denominated household loans to 5.4 percent in August 2013 (0.7 percentage points below the year-ago fi gure). This may be attributed to lower risks associated with these loans (a large part of which are mortgage-backed), the decrease in the fi nancing cost on the back of extremely low interbank rates in the euro area, as a result of the ECB actions to ensure comfortable liquidity levels. A similar trend was manifest for foreign currency-denominated loans to non-fi nancial corporations (the interest rate on which dropped to 4.7 percent in August 2013, 0.2 percentage points below that applied in the same year-ago period);
(iii) the average interest rate on leu-denominated time deposits stayed on the downtrend it embarked upon in the previous period, for both categories of customers, standing at 4.6 percent in August 2013 for households (0.8 percentage points below the interest rate paid by banks in August 2012) and at 3.7 percent for non-fi nancial corporations (down 1.3 percentage points versus the same period a year earlier). Interest rate adjustment was circumscribed to the improvement in the domestic macroeconomic conditions. The interest rate on household deposits is further higher than that on corporate deposits, as a result of differences in the degree of stability coming from a longer average maturity in the case of the former;
(iv) unlike the previous period when the interest rates on foreign currency-denominated deposits remained unchanged, in 2012 H1 and in the fi rst eight months of 2013, average interest rates on EUR-denominated deposits applied by credit institutions declined markedly (down 0.8 percentage points for household deposits to 2.5 percent in August 2013 and down 0.8 percentage points for corporate deposits to 2 percent), in the context of banks’ general strategy to cut fi nancing costs and of the persistence of low interest rates on the international fi nancial markets;
(v) the interest rate margins calculated between leu-denominated loans and deposits increased versus June 2012 (up 0.1 percentage points for households to 7.8 percentage points in August 2013 and 0.3 percentage points for companies to 5.1 percentage points), refl ecting the high costs associated with credit risk and the need to rise the operating profi t. Interest rate margins between loans and

FINANCIAL STABILITY REPORT 2013 53
3 Financial system and its related risks
deposits in foreign currency were signifi cantly lower (2.8 percentage points in August 2013 for both categories of customers).
In June 2012 – August 2013, average lending and deposit rates on new business to non-bank customers (Chart 3.38.), which indicate the most recent strategies pursued by banks to promote their fi nancing and savings products, posted the following developments:
(i) the average interest rate on new leu-denominated loans to households rose considerably (1.5 percentage points) in the latter half of 2012 and in 2013 Q1 (to a peak of 12.6 percent in March 2013), a trend which reversed in April-August 2013. In August 2013, this indicator stood at 11.1 percent, a similar level to that recorded in June 2012. However, it was 1.4 percentage point lower than the average interest rate calculated for outstanding loans (12.5 percent). In contrast, the interest rate on new corporate loans (8.7 percent in August 2013) saw a substantial decline compared with the reading posted in June 2012 (9.5 percent), being similar to that calculated based on outstanding loans;
(ii) average interest rates on new foreign currency-denominated loans to households (4.6 percent in August 2013) was 0.5 percentage points below the June 2012 reading and 0.8 percentage points below that calculated based on the average outstanding loans, a strategy that is likely to foster demand. In addition, banks lowered the costs associated with new foreign currency-denominated loans to companies (6 percent in August 2013, down 0.6 percentage points versus June 2012);
(iii) starting with 2013 Q2, the interest rate on new deposits in domestic currency followed a downward course compared with June 2012 (down 1 percentage point for retail customers to 4.6 percent and 1.6 percentage points for companies to 3.4 percent at end-August 2013), on the back of the improved domestic macroeconomic conditions. Given the prevailing short maturities of deposits taken, the average deposit rates on new business are similar to those calculated based on outstanding deposits;
(iv) the downtrend in banks’ fi nancing costs was also manifest for new foreign currency-denominated deposits taken from both categories of customers (the interest rate paid by banks in August 2013 stood 1 percentage point below that reported in June 2012 to 2.5 percent for households and 1.6 percent for companies);
(v) compared with June 2012, the interest rate margin between new loans and deposits in domestic currency rose substantially for both households (up 1 percentage point to 6.5 percentage points) and companies (up 0.8 percentage points to 5.4 percentage points), in the context of the strategy to improve the operational effi ciency. As for foreign currency-denominated loans and deposits, the interest rate margin rose at a slower pace in the case of non-fi nancial corporations (0.2 percentage points) and at a faster pace in the case of households (0.6 percentage points to 2.2 percentage points in August 2013). As a general feature, the interest rate margin related to business in foreign currency remained lower than that between loans and deposits in domestic currency. However, mention should be made that the interest rate margin between new household loans and deposits is lower than that calculated based on outstanding amounts, due mainly to the decrease in lending rates. An opposite development was recorded by new corporate loans and deposits (the related interest rate margin was higher than that calculated based on outstanding amounts, i.e. by 0.2 percentage points for leu-denominated loans and deposits and 0.3 percentage points for business in foreign currency in August 2013), owing to the anticipated costs in the event of credit risk materialising.

NATIONAL BANK OF ROMANIA54
3 Financial system and its related risks
In the period ahead, adjustments in the interest rate margins are necessary so as to allow the sustainable resumption of lending as well as the fostering of saving. The gradual decline in lending rates, correlated with the signals transmitted by the central bank via the policy rate cut, will support demand for loans.
3.2.5.2. Loan quality
The period lapsed since the release of the previous Report was further marked by pressures on the balance sheets of non-bank customers (both non-fi nancial corporations and households), mainly affected by the economic growth below potential. The still modest economic growth pace, associated with the downtrend in lending (as a base effect), caused the further accumulation of non-performing loans, with a detrimental impact on the quality of banks’ loan portfolios.
For the purpose of fi nancial stability analyses, the NBR uses the non-performing loan ratio48, calculated based on prudential reports on loan classifi cation, to assess the loan portfolio quality. The defi nition of the NPL ratio is compliant with the provisions of the IMF’s Compilation Guide on Financial Soundness Indicators49 and is the most widely used at international level. From a methodological point of view, it is worth noting that the defi nition used has a conservative nature as the non-performing loan ratio takes into account the gross value of loans50 (the loan accounting value is not adjusted by provisions and/or the value of collateral).
The still fragile macroeconomic context caused the further increase in the volume of non-performing loans reported by credit institutions, yet at a slower pace (17.0 percent in August 2013 and 22.0 percent in December 2012 as against 28.9 percent in 2011 and 59.8 percent in 2010, annual growth rate, nominal terms). As a result, the share of non-performing loans (gross exposure) in total classifi ed loans and interest stayed on an upward path (Chart 3.39.), reaching 18.2 percent in December 2012 and 21.0 percent in August 2013. The magnitude of developments in the non-performing loan ratio was also attributed to a base effect, given the contraction in the volume of loans51. So far, banks used the debt cancellation techniques to a limited extent in the context of non-performing loan portfolio restructuring.
48 Non-performing loan ratio is calculated as a ratio of loans (in compliance with the provisions of NBR Regulation No. 16/2012, the components of fi nancial assets representing loans are: (1) principal, (2) related claims and (3) amortisation) overdue for more than 90 days and/or in which case legal proceedings were initiated (classifi ed in national regulations under “Loss 2”) to total classifi ed loans in the portfolio of credit institutions for which capital requirements for credit risk are established according to the standard approach. NBR Regulation No. 16/12 December 2012 on the classifi cation of loans and investments, as well as on the establishment and use of prudential valuation adjustments defi nes the initiation of legal proceedings as being at least one of the following measures taken to recover claims: (a) the court’s decision to initiate the insolvency procedure, and (b) the initiation of the forced sale procedure against individuals and/or legal entities. The same applies to the enforceability of loan contracts, collateral arrangements and the fi nal court decisions regarding loan contracts, collateral arrangements or investment contracts, as the case may be.
49 The IMF’s Compilation Guide on Financial Soundness Indicators (including the amendments approved in 2007) recommends that “non-performing loans” should be defi ned based on the uniform criterion of principal and interest payments overdue for more than 90 days. Compared with the previous version of the Guide, the defi nition does not include stricter approaches. The Guide also specifi es that the recommended defi nition of “non-performing loans” does not entirely correspond to impaired assets, thus defi ned in IAS 39.
50 NBR Regulation No. 16/12 December 2012 on the classifi cation of loans and investments, as well as on the establishment and use of prudential valuation adjustments defi nes the gross value of the fi nancial assets representing loans/investments as the value at which the fi nancial asset is assessed at the initial recognition date less principal repayments, plus or minus the accumulated amortisation, using the effective interest rate method, of any difference between the initial value and the maturity value.
51 According to the reports on loan classifi cation submitted by banks, the volume of loans (gross value) totalled lei 208.5 billion at end-August 2013 (compared with lei 212.5 billion in August 2012 and lei 210.4 billion at end-2012). The amounts include (1) principal, (2) related claims and (3) amortisation.

FINANCIAL STABILITY REPORT 2013 55
3 Financial system and its related risks
The analysis at the level of bank group in terms of asset holdings (Chart 3.40.) shows a tendency to homogenisation of the asset portfolio quality in 2013 Q2, mainly as a result of the faster rise in the volume of non-performing loans in the large banks’ balance sheets.
Chart 3.39. Non-performing loans at aggregate level
Chart 3.40. Non-performing loans by group of banks in terms of asset size
0
5
10
15
20
25
0
10
20
30
40
50
Dec
.200
8D
ec.2
009
Dec
.201
0D
ec.2
011
Mar
.201
2Ju
n.20
12Se
p.20
12D
ec.2
012
Jan.
2013
Feb.
2013
Mar
.201
3A
pr.2
013
May
.201
3Ju
n.20
13Ju
l.201
3 A
ug.2
013
volume of loans overdue for more than 90 days(gross exposure)
share of loans overdue for more than 90 days(gross exposure) in total classified loans (rhs)
lei bn. percent
Source: NBR
5
10
15
20
25
Dec
.200
9
Mar
.201
1
Sep.
2011
Jan.
2012
Mar
.201
2
May
.201
2
Jul.2
012
Sep.
2012
Nov
.201
2
Jan.
2013
Mar
.201
3
May
.201
3
Jul.2
013
share of loans overdue for more than 90 days(gross exposure) across the banking systemshare of loans overdue for more than 90 days(gross exposure) for large banksshare of loans overdue for more than 90 days(gross exposure) for medium-sized banksshare of loans overdue for more than 90 days(gross exposure) for small-sized banks
percent
Source: NBR
These developments were similar to those seen on other European banking markets (Chart 3.41.), which remained under the infl uence of a challenging international macroeconomic context. The worsening of the loan portfolio quality affected mostly the countries in the region (e.g. Slovenia, Hungary, Bulgaria; Greece reported the highest non-performing loan ratio, i.e. 22.5 percent in 2012, up 6.5 percentage points versus 2011) and, to a smaller extent, Western Europe countries52. This is 52 Considering that there is no single defi nition of non-performing loans at European or international levels, the differences
between the accounting standards and prudential regulations enforced at national level may infl uence non-performing loan ratio and its comparability between various states (for instance, only impaired assets and not overdue loans are taken into account; only the exposures of domestic banks are considered and the non-performing loans of foreign branches are not added; exposure net of provisions instead of gross exposure is employed; non-performing criteria other than that of maturity “overdue for more than 90 days” are used; the indicator is not calculated for the banking system as a whole, but only for a relevant sample of banks; the indicator is calculated based on exposures to residents alone; the indicator scope is different, as it may include loans to government, other credit institutions or to non-residents, together with private sector loans; non-performing loan ratio may comprise restructured and refi nanced loans; some countries use the criterion of maturity overdue for more than 180 days, while others consider a loan overdue for more than 30 days as non-performing).
The European Banking Authority is about to fi nalise the Implementing Technical Standards for reporting non-performing exposures, which are to enter into force in the period ahead as they are to be added to the FINREP reporting framework. EBA’s defi nition of non-performing exposures is based on (a) material exposures overdue for more than 90 days or (b) exposures incurring the risk of not being paid in full without realisation of collateral, regardless of the existence of any past-due amount or of the number of days past due, as well as all default exposures (according to Art. 178 of EU Regulation No. 575/2013) or impaired exposures (in line with IFRS). The main methodological notes on the above-mentioned defi nition refer to: (i) including all debt instruments (loans and advances, debt securities) irrespective of their classifi cation for accounting or prudential purposes, as well as the off-balance sheet exposures; (ii) classifying as non-performing all on- and off-balance sheet exposures to a certain debtor with an exposure overdue for more than 90 days accounting for at least 20 percent of its total exposures or when the debtor’s overdue amounts represent at least 5 percent of the bank’s total exposure to the debtor; (iii) considering exposures as being no longer non-performing when the following conditions are fulfi lled simultaneously: (1) the debtor’s situation has improved so that the debtor is likely to pay all the amounts due in line with the initial maturities or the renegotiated conditions and (2) the debtor no longer has overdue amounts.

NATIONAL BANK OF ROMANIA56
3 Financial system and its related risks
the result of an unsustainable increase in the loans granted during 2003-2008 (a period witnessing the easing of lending standards) and the challenges to resuming economic growth at global level once the fallout from the global fi nancial crisis emerged, as well as of legal, judicial, fi scal and regulatory obstacles hindering the rapid resolution of non-performing loans53.
The analyses on the relative infl uence of determinants54 indicated that macroeconomic factors (economic growth, domestic currency depreciation, infl ation, unemployment, risk aversion) had a greater impact than those specifi c to banking activity (the capital-to-asset ratio and ROE are slightly negatively correlated to non-performing loan ratio, whereas excessive lending, determined based on the loan-to-asset ratio and the pace of credit growth, showed a positive correlation). Moreover, research shows a high autocorrelation coeffi cient in the case of non-performing loans, considering that a shock in the volume of non-performing loans will most likely have a longer-term effect on the banking system. Thus, the worsening quality of bank asset portfolios causes the contraction of loan supply, with an implicit negative impact on the resumption of economic growth.
Chart 3.41. Loans portfolio quality in selected EU countries (share of non-performing loans in total loans)
0
5
10
15
20
25
Bul
garia
Cze
chR
epub
lic
Cro
atia
Pola
nd
Slov
enia
Hun
gary
Rom
ania
Aus
tria
Fran
ce
Italy
Gre
ece
Uni
ted
Kin
gdom
2007 2008 2009 2010 2011 2012
percent
Source: IMF (Financial Soundness Indicators, FSI Tables, April 2013); NBR calculations
The risk attached to the loan portfolios in the balance sheets of banks in Romania is mitigated by the comfortable provisioning (Chart 3.42.), which covers expected losses; another instrument used by the NBR in order to ensure banks’ capacity to absorb credit risk losses is capital adequacy, namely maintaining comfortable solvency and Tier 1 capital adequacy ratios, including by using prudential fi lters and setting buffers to be used for covering unexpected losses.
53 European Banking Coordination “Vienna Initiative” – “Working Group on NPLs in Central, Eastern and Southeastern Europe” (March 2012).
54 IMF – “Non-Performing Loans in CESEE: Determinants and Impact on Macroeconomic Performance” (March 2013).

FINANCIAL STABILITY REPORT 2013 57
3 Financial system and its related risks
Chart 3.42. Prudential valuation adjustments and IFRS-based valuation adjustments calculated at the banking system level; coverage ratio of non-performing loans with IFRS provisions and prudential fi lters for NPLs
80
82
84
86
88
90
10
20
30
40
50
60
Jan.
2012
Feb.
2012
Mar
.201
2
Apr
.201
2
May
.201
2
Jun.
2012
Jul.2
012
Aug
.201
2
Sep.
2012
Oct
.201
2
Nov
.201
2
Dec
.201
2
Jan.
2013
Feb.
2013
Mar
.201
3
Apr
.201
3
May
.201
3
Jun.
2013
Jul.2
013
Aug
.201
3
prudential valuation adjustments (total)IFRS-based valuation adjustments (total)NPL coverage with IFRS provisions and prudential filters for NPLs (rhs)
lei bn. percent
Source: NBR
The volume of prudential valuation adjustments55 calculated for the banking system stayed on an uptrend in the period under consideration (outstanding prudential adjustments56 grew by 22.4 percent in August 2013 and by 27.5 percent in December 2012, year on year, nominal terms). Adjustments for impairment calculated in line with IFRS accounting standards57 posted a faster rate of increase (25.7 percent in August 2013 and 32.9 percent in 2012, year on year, nominal terms). Only the adjustments for impairment calculated in line with IFRS accounting standards are registered in the balance sheet, but the positive difference between total prudential valuation adjustments and total adjustments for impairment is used as a prudential fi lter to determine own funds and prudential indicators. The differences between prudential valuation adjustments and adjustments for impairment (IFRS provisions) are mainly determined by the methodology for the recognition of collateral for non-performing loans58.
55 Prudential valuation adjustments are calculated based on prudential regulations enforced at national level, namely the regulation on classifi cation of loans and investments. NBR Regulation No. 16/12 December 2012 on the classifi cation of loans and investments, as well as on the establishment and use of prudential valuation adjustments sets the differentiated prudential adjustment coeffi cients, which apply to the following loan categories: (i) loans granted to hedged borrowers are as follows: “standard” – 0, “watch” – 0.05, “substandard” – 0.2, “doubtful” – 0.5; “loss” – 1; (ii) loans granted to unhedged borrowers, natural entities, in which case coeffi cients are higher than those mentioned above, namely “standard” – 0.07, “watch” – 0.08, “substandard” – 0.23, “doubtful” – 0.53, “loss” – 1.
56 The volume of prudential valuation adjustments totalled lei 44.8 billion in August 2013, up compared with lei 39.2 billion in December 2012 and lei 36.6 billion in August 2012.
57 The volume of adjustments for impairment (IFRS provisions) at the banking system level rose from lei 22.1 billion in January 2012 to lei 26.5 billion in August 2012, lei 29.4 billion in December 2012 and lei 33.3 billion in August 2013 respectively.
58 Pursuant to NBR Regulation No. 16/12 December 2012 on the classifi cation of loans and investments, as well as on the establishment and use of prudential valuation adjustments, the guarantees for exposures representing the principal of loans/investments classifi ed under “loss”, in which case debt service exceeds 90 days and/or legal proceedings were initiated, are adjusted by coeffi cients that should not exceed 0.25. Furthermore, the guarantees for exposures representing related claims and amortisation of loans/investments classifi ed under “loss” are not taken into account, the coeffi cient applied to the guarantee amounts being equal to zero. The prudential approach envisages the depletion of collateral in the case of illiquid markets. On the other hand, in line with IFRS accounting standards, the cash fl ows relating to guarantees are taken into consideration when determining the adjustments for impairment; according to IAS 39.AG84, “the calculation of the present value of the estimated future cash fl ows of a collateralised fi nancial asset refl ects the cash fl ows that may result from foreclosure less costs for obtaining and selling the collateral, whether or not foreclosure is probable”.

NATIONAL BANK OF ROMANIA58
3 Financial system and its related risks
For fi nancial stability analysis purposes, starting with 2012, the central bank uses the coverage ratio of non-performing loans with IFRS provisions and prudential fi lters for NPLs59 in order to assess provisioning adequacy. Including prudential fi lters in the calculation of the indicator, along with the IFRS provisions registered in the balance sheet, is justifi ed by the fact that the prudential fi lter represents an amount deducted from own funds with a view to increasing their capacity of absorbing credit risk losses. The central bank decided to further use in 2013 the prudential fi lters introduced in 2012 along with the implementation of IFRS and to gradually phase them out during 2014-2018 (i.e. to gradually lower by 20 percent per annum the share of deductible items in own funds for the purpose of determining prudential indicators), in the context of implementing Basel III requirements via the CRD IV/CRR package60. From a methodological point of view, the indicator is calculated based on the gross exposure of non-performing loans (which ignores the mitigating effect of collateral related to non-performing loans on the credit risk), refl ecting a prudential approach.
The coverage ratio of non-performing loans with IFRS provisions and prudential fi lters for NPLs may be assessed as comfortable throughout the period under review (Chart 3.42.), standing at 86.3 percent in December 2012 and at 89.5 percent in August 2013. The same conclusion is drawn from the analysis of the indicator determined only on an accounting basis, the coverage ratio of non-performing loans with IFRS provisions following an upward path (from 61 percent in December 2012 to 63.3 percent in August 2013).
Chart 3.43. Coverage ratio of non-performing loans in selected EU Member States
0
20
40
60
80
100
120
Bulgaria CzechRepublic
Poland Hungary Slovenia Romania UnitedKingdom
Austria France Greece Italy
2007 2008 2009 2010 2011 2012
percent
Source: IMF (Financial Soundness Indicators, FSI Tables, April 2013); NBR calculations
59 The coverage ratio of non-performing loans with IFRS provisions and prudential fi lters for NPLs is calculated by taking into account the IFRS provisions and the prudential fi lters corresponding solely to non-performing loans as the numerator and the non-performing loans, namely the loans and interest overdue for more than 90 days and/or for which legal proceedings were opened (“Loss 2”) as denominator.
60 Directive 2013/36/EU of the European Parliament and of the Council of 26 June 2013 on access to the activity of credit institutions and the prudential supervision of credit institutions and investment fi rms and Regulation No. 575/2013 of the European Parliament and of the Council of 26 June 2013 on prudential requirements for credit institutions and investment fi rms.

FINANCIAL STABILITY REPORT 2013 59
3 Financial system and its related risks
The provisioning level calculated for the Romanian banking system61 is the highest among the countries in the region and the home countries of shareholders of credit institutions, Romanian legal entities, which are foreign bank subsidiaries (Chart 3.43.). However, mention should be made that there is no EU harmonised defi nition of this indicator62.
3.2.6. Liquidity risk
The liquidity position of banks remained at a comfortable level. Systemic risk has further been small, as bilateral interbank exposures in Romania have been low in relation to own funds and liquid assets of creditor banks. The adjustment in funding from parent banks generally unfolded in an orderly manner. However, starting September 2012, it evolved at a signifi cantly faster pace than that reported since the drafting of the previous Report. The adjustment of credit institutions’ balance sheet assets on the back of limited granting of new loans (EUR-denominated loans in particular) contributed to the alleviation of the currency mismatch between loans and deposits. The NBR ensured the adequate liquidity management in the banking system by supplementing the regulatory framework and providing liquidity via weekly repo operations, so that the liquidity position of the Romanian banking system improved during the current year.
Chart 3.44. Loan-to-deposit ratio Chart 3.45. Loan-to-deposit ratio for banks with majority Greek and Austrian capital
100
105
110
115
120
125
130
135
Dec
.200
7D
ec.2
008
Dec
.200
9D
ec.2
010
Mar
.201
1Ju
n.20
11Se
p.20
11D
ec.2
011
Mar
.201
2Ju
n.20
12Se
p.20
12D
ec.2
012
Mar
.201
3Ju
n.20
13 A
ug.2
013
Romania
percent
Source: NBR
0
20
40
60
80
100
120
140
160
180
200
220
Dec
.200
7D
ec.2
008
Dec
.200
9D
ec.2
010
Mar
.201
1Ju
n.20
11Se
p.20
11D
ec.2
011
Mar
.201
2Ju
n.20
12Se
p.20
12D
ec.2
012
Mar
.201
3Ju
n.20
13Ju
l.201
3 A
ug.2
013
banks with Greek majority capital
banks with Austrian majority capital
percent
Source: NBR
The imbalance between credit to the private sector and funding from local sources narrowed starting with 2012 H2, on the back of the lower stock of loans and a slight increase in the volume of deposits taken. Loan-to-deposit ratio improved gradually in the period under consideration (Chart 3.44.), 61 For Romania, the indicator calculated as a ratio of total provisions to the gross exposure of loans overdue for more
than 90 days and/or for which legal proceedings were opened (considering that prudential provisions were registered in the balance sheet up to 31 December 2011) was used for the 2007-2011 period. In 2012, the coverage ratio of non-performing loans with IFRS provisions and prudential fi lters for NPLs, which assesses provisioning adequacy in the context of implementing the IFRS accounting standards and using prudential fi lters in the calculation of own funds, was used for Romania.
62 The methodology for this indicator may differ across countries, as general provisions may be taken into account, together with specifi c provisions for credit losses; provisions for related claims may be included or not; in the context of the IFRS standards, collective provisions along with individual provisions may be considered.

NATIONAL BANK OF ROMANIA60
3 Financial system and its related risks
reaching an all-time low since the fi nancial crisis onset (109 percent in August 2013 versus 119 percent in June 2012) in line with regional developments (Chart 4.10.).
Banks with majority Greek capital63 witnessed a signifi cant adjustment of the loan-to-deposit ratio (Chart 3.45.), as a result of changes reported by the banks in this category (in June 2011, Marfi n Bank became a bank with Cypriot capital, while in June 2012, Emporiki Bank became a French-owned bank) and the negative lending developments, amid the efforts to strengthen the local deposit base.
Corporate and household deposits remained the main funding source for banks (51.3 percent of total liabilities at end-August 2013), up 4 percentage points versus the same year-ago period, against the background of the ongoing uptrend in domestic saving.
At end-August 2013, the share of external fi nancing in total liabilities of the banking system stood at 21.3 percent, down 3.5 percentage points against June 2012. However, this value further exceeded the average for the countries in the region (Chart 3.46.); external fi nancing went down about EUR 3.4 billion in 2013 H1 versus the same period a year earlier. The faster adjustment dynamics,, although inducing declines in the external debt of the private sector, are likely to generate the risk of constraints on the real economy, particularly that the cut in intra-group credit lines gained speed during a period of low risk aversion to emerging market exposures (January-May 2013).
Chart 3.46. Foreign liabilities (international comparison)
0
10
20
30
40
50
60
0
10
20
30
40
50
60
Dec
.200
8D
ec.2
010
Mar
.201
2Se
p.20
12M
ar.2
013
Aug
.201
3D
ec.2
008
Dec
.201
0M
ar.2
012
Sep.
2012
Mar
.201
3 A
ug.2
013
Dec
.200
8D
ec.2
010
Mar
.201
2Se
p.20
12M
ar.2
013
Aug
.201
3D
ec.2
008
Dec
.201
0M
ar.2
012
Sep.
2012
Mar
.201
3 A
ug.2
013
Dec
.200
8D
ec.2
010
Mar
.201
2Se
p.20
12M
ar.2
013
Aug
.201
3
foreign liabilities (rhs)
foreign liabilities in total liabilities
percent EUR bn.
Source: ECB
Hungary Romania Bulgaria Poland Czech Republic
The large share of medium- and long-term external fi nancing has a mitigating impact on liquidity risks. The orderly, yet considerable reduction in external fi nancing led to a gradual rise in the average maturity of parent bank funding, exceeding 23 months in August 2013 (Chart 3.47.). In terms of currency breakdown, the fi nancing in euro held a prevailing share of 74.8 percent of total parent bank funding in August 2013, the leu-denominated component accounting for 15.2 percent, while the fi nancing in US dollars and other currencies continued to be modest.
63 At end-August 2013, the group of banks with majority Greek capital comprised Alpha Bank, ATE Bank, Banca Românească, Bancpost and Piraeus Bank.

FINANCIAL STABILITY REPORT 2013 61
3 Financial system and its related risks
The share of capital and other reserves in total liabilities continued its upward path, reaching 19.66 percent at end-August 2013, up 2.8 percentage points since the release of the previous Financial Stability Report (i.e. 16.9 percent in June 2012). The share of domestic interbank deposits in total liabilities increased marginally, to 1.72 percent at end-August 2013, the contamination risk in the domestic banking system via this channel being further contained.
Chart 3.47. Breakdown of parent bank funding by maturity
Chart 3.48. Holdings of available securities (unpledged and not used in repo operations with the NBR)
0102030405060708090
100
Dec
.201
1Ja
n.20
12Fe
b.20
12M
ar.2
012
Apr
.201
2M
ay.2
012
Jun.
2012
Jul.2
012
Aug
.201
2Se
p.20
12O
ct.2
012
Nov
.201
2D
ec.2
012
Jan.
2013
Feb.
2013
Mar
.201
3A
pr.2
013
May
.201
3Ju
n.20
13Ju
l.201
3 A
ug.2
013
<1 month 1-3 months 3-6 months6-12 months 1-2 years over 2 years
percent
Source: NBR
0
10
20
30
40
50
60
Jun.
2011
Dec
.201
1
Jun.
2012
Dec
.201
2
Jun.
2013
Aug
.201
3
lei EUR-denominated (lei equivalent)
lei bn.
Source: NBR, SaFIR
Banks’ holdings of unpledged government securities not used in repo operations with the NBR continued to rise in 2012 and in 2013 H1, helping improve the liquidity position of the banking sector (Chart 3.48.). Raising short-term liquidity by pledging government securities in interbank borrowing is low, given that only 0.7 percent of holdings of available securities64 were pledged at end-August 2013.
The NBR provides liquidity to credit institutions via repo operations conducted through fi xed-rate auctions (the monetary policy rate – 4.25 percent per annum in October 2013). Liquidity-providing repo operations are held on a weekly basis and the funds offered to the bidders have one-week maturity. The funds raised by banks via repo operations increased markedly in 2012 H1, under the contractionary impact of the autonomous liquidity factors. In the latter half of 2012, the external environment was volatile and fraught with uncertainties surrounding the sustainable resolution of the euro area sovereign debt crisis and the performance of the banking systems in certain EU countries, against the backdrop of worsening outlook for worldwide economic growth. In the context of high volatility of investor risk aversion, with a negative impact on net capital fl ows, the NBR shifted from an adequate to a fi rm liquidity management. In order to contain the excessive exchange rate volatility, the central bank pursued, during 2012 H2, a policy to cap the amounts provided via repo operations. The capping was initially established for August 2012, being subsequently resumed in October 2012.
64 The updated value of leu-denominated government securities held by participants in the SaFIR system on 30 August 2013.

NATIONAL BANK OF ROMANIA62
3 Financial system and its related risks
At the end of 2013 Q1, due to the lower risk aversion on the external markets and the improved investor perception of sovereign risk, the NBR reverted to an adequate liquidity management, by gradually removing the cap on the amounts provided through fi xed-rate auctions, yet the decline in banks’ liquidity needs caused the contraction in the amounts raised via repo operations (Chart 3.49.).
Chart 3.49. Liquidity provided through repo operations
4.0
4.5
5.0
5.5
6.0
6.5
7.0
7.5
8.0
8.5
0
2
4
6
8
10
12
14
16
18
Feb.
2011
Mar
.201
1A
pr.2
011
May
.201
1Ju
n.20
11Ju
l.201
1A
ug.2
011
Sep.
2011
Oct
.201
1N
ov.2
011
Dec
.201
1Ja
n.20
12Fe
b.20
12M
ar.2
012
Apr
.201
2M
ay.2
012
Jun.
2012
Jul.2
012
Aug
.201
2Se
p.20
12O
ct.2
012
Nov
.201
2D
ec.2
012
Jan.
2013
Feb.
2013
Mar
.201
3A
pr.2
013
May
.201
3Ju
n.20
13Ju
l.201
3A
ug.2
013
amount provided monetary policy rate (fixed rate), rhs
lei bn. percent
Source: NBR
FX swaps with non-resident credit institutions gained increasing importance, turning into an instrument for the management of the currency mismatch between assets and liabilities. Thus, these operations witnessed a rise in 2012 and in 2013 H1, the daily net volume of the funds raised totalling about EUR 7 billion. The system-wide average maturity of the funds raised via FX swaps with non-resident credit institutions fl uctuates around 90 days. At end-June 2013, the monthly average traded volumes via swaps with non-resident credit institutions made up nearly 38 percent of total funds taken by banks from foreign fi nancial institutions (Chart 3.50.). Banks resort to these types of operations in particular to mitigate the currency mismatch between assets and liabilities, the main banks conducting activity on the FX swap market being those with a high loan-to-deposit ratio for EUR-denominated funds. The upside of these instruments is the low cost in cases of high liquidity. The downside is the short maturity of these operations, which implies the need of frequent refi nancing and the dependence on this market’s liquidity, whose volatility is affected by numerous exogenous factors.
EUR-denominated funding of the Romanian non-bank sector via FX swaps rose considerably in 2012 and in 2013 H1, the daily net balance of euro funding to this sector via FX swaps standing close to EUR 300 million in 2013 Q2. Despite the high growth rate, this type of funding accounts for less than 1 percent of EUR-denominated credit to the non-bank sector. Only a limited number of banks conduct FX swaps with the non-bank sector and they generally cover their short/long positions by taking long/short positions with non-resident credit institutions, parent banks included.

FINANCIAL STABILITY REPORT 2013 63
3 Financial system and its related risks
Chart 3.50. Daily net balance of EUR-denominated funds from FX swaps with non-resident credit institutions
0
1
2
3
4
5
6
7
8
Jan.
2012
Feb.
2012
Mar
.201
2
Apr
.201
2
May
.201
2
Jun.
2012
Jul.2
012
Aug
.201
2
Sep.
2012
Oct
.201
2
Nov
.201
2
Dec
.201
2
Jan.
2013
Feb.
2013
Mar
.201
3
Apr
.201
3
May
.201
3
Jun.
2013
Jul.2
013
Aug
.201
3
total banking system Greek-owned banks
Austrian-owned banks Romanian-owned banks
EUR bn.
Source: NBR
Liquidity stress tests highlighted a good capacity of absorbing the shocks generated by the partial withdrawal of some fi nancing sources. In the context of a sharper decrease in external fi nancing, mainly as a result of lower intra-group exposure, the currency mismatch between assets and liabilities could raise some liquidity issues for the foreign currency-denominated component, particularly in the assumption that credit institutions’ access to the FX swap market would be contained.
Liquidity risk management is a key factor of credit institutions’ soundness, mainly in the context of high fi nancial market volatility. The central bank attaches particular importance to liquidity management system-wide, including via adequately tailoring the regulatory framework65. In 2012 and in 2013 H1, the NBR ensured the adequate liquidity management in the banking system, except during November 2012 – January 2013, when the central bank pursued a fi rm liquidity management. Monetary policy rate remained unchanged at 5.25 percent for 14 months during April 2012 – June 2013. In July, August and September 2013, the NBR successively cut the policy rate by 25, 50 and 25 basis points to the current level of 4.25 percent, thus sending a positive signal to the economic environment in order to prompt a gradual reduction in the costs of lei-denominated loans and foster lending. Moreover, in May 2013, the NBR Board decided to narrow the corridor around the policy rate defi ned by the interest rates on standing facilities to ±3 percentage points from ±4 percentage points, in order to lower the interest rate volatility on money and banking markets.
65 On 13 November 2012, the following pieces of legislation entered into force:
• NBR Regulation No. 14/12 November 2012 on amending NBR Regulation No. 1/2000 on the open market operations performed by the National Bank of Romania and the standing facilities granted to eligible participants;
• NBR Order No. 12 of 12 November 2012 amending NBR Order No. 8/2006 on the working procedures for the open market operations performed by the National Bank of Romania and the standing facilities granted to eligible participants.
The changes brought about by the new regulations envisaged the elimination of restrictions on the number of options included in the bids put forward by the eligible participants for the fi xed- and variable-rate auctions organised by the NBR for monetary policy operations, except fi xed-rate auctions for FX swaps and deposit-taking, in which case bids shall contain a single option.

NATIONAL BANK OF ROMANIA64
3 Financial system and its related risks
3.2.7. Market risk
At end-June 2013, the interest rate risk was slightly lower year on year. The adverse scenario of a permanent shock, consisting in a 200 basis point increase in interest rates implying a parallel shift of the yield curve, would have a negative impact of around 7.4 percent on own funds, down 0.6 percentage points compared with the impact assessed based on the same scenario in June 2012. Currency risk has remained very low.
Interest rate risk
Unlike the previous periods, in 2012 H2 and early 2013, the share of government securities holdings in the balance sheet no longer expanded, stabilising at around 21 percent. The attractiveness of these low credit risk items notwithstanding, amid the expected interest rate adjustments, the development may be ascribable to the much slower pace of increase in the share of public debt in GDP, accompanied by foreign investors’ keener interest in government securities, as shown by the larger volume of government securities held by non-residents (almost 28 percent in May 2013 versus 14 percent in December 2012, an increase attributable to Romania’s inclusion in the JP Morgan and Barclays Capital emerging market government bond indices in March 2013 and April 2013 respectively).
Assuming a potential permanent shock implying a 200 basis point parallel shift of the yield curve66, in the context of higher interest rates, the losses generated by the maturity mismatch of interest rate risk-sensitive assets and liabilities would account for around 7.4 percent of credit institutions’ own funds. The impact is lower than in June 2012, when it was estimated at roughly 8 percent, especially following the drop in fi xed interest-bearing assets of credit institutions and, implicitly, of the average maturity of fi nancial assets. The distribution of these losses is heterogeneous among credit institutions, the impact ranging from a 35 percent loss to a 12 percent gain of own funds, particularly as a result of the differences in the structure of assets (credit institutions show a lower sensitivity when loans hold a large share in their total fi nancial assets). Although in the case of some credit institutions the funding costs are barely impacted by the short-term interest rate developments (stable funding sources in terms of repricing and, implicitly, with high residual maturity), most credit institutions attract funding sources whose costs are based on short-term developments. Thus, overall, credit institutions would incur losses in case of an unexpected increase in interest rates.
The sensitivity of fi xed interest-bearing assets, other than loans, estimated based on the change in the market value of government securities following the unexpected and persistent 200 basis point rise in interest rates would induce losses tantamount to roughly 3.4 percent of banks’ own funds. The assessment of the impact did not take into account the government securities held to maturity (around 30 percent of total holdings of government securities), following their specifi c accounting treatment67, which does not require their mark-to-market and does not affect the profi t and loss account or the capital adjustment based on the unrealised loss.
The share of the capital requirement for market risk in total capital requirements for risks witnessed an almost continuous increase March 2008 through March 2013, but it fell somewhat in June 2013, in line with the slight decline in interest rate risk. Nevertheless, the level of this share (roughly 2 percent)
66 The yield curve was estimated based on the transactions in Treasury certifi cates and government bonds on the secondary market.
67 The government securities held to maturity generally have maturities notably higher than those specifi c to the securities in the other categories and, therefore, interest rates are unlikely to stay high throughout their maturity, given the fading of infl ationary shocks in the long run.

FINANCIAL STABILITY REPORT 2013 65
3 Financial system and its related risks
is marginal compared with the share of credit risk (about 83 percent) and operational risk (around 15 percent).
Chart 3.51. Capital requirements by risk covered
75
80
85
90
95
100
Mar
.200
8
Jun.
2008
Sep.
2008
Dec
.200
8
Mar
.200
9
Jun.
2009
Sep.
2009
Dec
.200
9
Mar
.201
0
Jun.
2010
Sep.
2010
Dec
.201
0
Mar
.201
1
Jun.
2011
Sep.
2011
Dec
.201
1
Mar
.201
2
Jun.
2012
Sep.
2012
Dec
.201
2
Mar
.201
3
Jun.
2013
capital requirement for market risk capital requirement for operational riskcapital requirement for credit risk
percent
Source: NBR
The use of hedging derivatives is low; their accounting value in total assets is insignifi cant and their share in total liabilities stood at nearly 0.4 percent. Transactions are carried out especially on OTC markets and the organised markets and the instruments usually traded on these markets (options, futures, etc.) are only occasionally resorted to.
Chart 3.52. Balance sheet recognition of security holdings
Chart 3.53. Credit institutions ranked by the impact of a 200 bp shock on own funds
0
20
40
60
80
100
Jan.
2012
Feb.
2012
Mar
.201
2A
pr.2
012
May
.201
2Ju
n.20
12Ju
l.201
2A
ug.2
012
Sep.
2012
Oct
.201
2N
ov.2
012
Dec
.201
2Ja
n.20
13Fe
b.20
13M
ar.2
013
Apr
.201
3M
ay.2
013
Jun.
2013
securities held to maturity
securities available for sale
securities held for trading
securities designated at fair value through profit or loss
Source: NBR
percent
-40
-30
-20
-10
0
10
20
30
1 5 9 13 17 21 25 29
potential impact on own fundsloss > 20% for 200 bp increaseloss > 20% for 200 bp decrease
Source: NBR
percent

NATIONAL BANK OF ROMANIA66
3 Financial system and its related risks
Currency risk
The currency risk across the fi nancial system, quantifi ed in an adverse scenario via the direct impact of an exchange rate shock on credit institutions’ fi nancial statements, stayed low. The maximum level of historical VaR68 remained below the 0.1 percent band in total own funds June 2012 through August 2013. Since the drafting of the previous report, the risk associated with exchange rate volatility is on the rise, due to the larger share of government securities held by non-residents69, as well as to banks’ shift towards reducing the volume of foreign assets, which has led to a faster deleverage, manifest at European level.
Chart 3.54. Daily VaR as a share in total own funds across the banking sector based on the net foreign currency position of credit institutions
0.00
0.02
0.04
0.06
0.08
0.10
0.12
Mar
.201
2
Apr
.201
2
May
.201
2
Jun.
2012
Jul.2
012
Aug
.201
2
Sep.
2012
Oct
.201
2
Nov
.201
2
Dec
.201
2
Jan.
2013
Feb.
2013
Mar
.201
3
Apr
.201
3
May
.201
3
Jun.
2013
Jul.2
013
Aug
.201
3
Sep.
2013
percent
Source: NBR
3.2.8. Profi tability and effi ciency
At end-2012, the Romanian banking system posted a negative fi nancial result, following the substantial growth of the volume of provisions for credit risk, owing to the impairment of fi nancial assets (especially in the case of exposures towards non-fi nancial corporations) and the effect of collateral revaluation. Operating revenues had a negative growth due to the drop in net interest income in the context of a low volume of new loans to the real economy. Credit institutions’ concerns regarding the balance sheet adjustment and the cut in fi xed costs led to the decline in operating expenses, turning operating profi tability slightly positive in the last part of 2012.
The slower dynamics of expenses for loan loss provisions sets the stage for a better fi nancial result in 2013. Therefore, data at end-August 2013 illustrate the comeback of profi tability indicators, i.e. return on equity – ROE and return on assets – ROA, to positive territory (0.6 percent and 5.9 percent respectively). Recent assessments show an improvement trend in the profi tability of the banking system, conditional upon the resumption of lending to the non-government sector. The low
68 VaR (value at risk) is calculated at the 99th percentile considering the daily movements in the exchange rate of the leu for a 3-year period and the daily currency holdings in each credit institution’s portfolio, assuming that the position will be liquidated in 10 working days.
69 In May 2013, the volume of government securities held by foreign investors was considerable (its share in total government securities equalled almost 28 percent).

FINANCIAL STABILITY REPORT 2013 67
3 Financial system and its related risks
funding costs, against the background of improved perception on sovereign risk and the one-off nature of impairment charges, generated by collateral reassessment amid low market liquidity, are the elements that justify the expected results70.
At end-2012, the Romanian banking system reported a lei 2.3 billion loss71. The major profi tability indicators (return on equity – ROE and return on assets – ROA) reported negative values of -0.6 percent and -5.9 percent respectively.
The market share of loss-making banks rose by around 15 percentage points year on year, to 59.8 percent, especially following the growth of net expenses for IFRS provisions72 (Chart 3.55.). Nevertheless, 18 out of the 40 credit institutions doing business in Romania at that time reported a profi t, mainly concentrated in some large banks73.
The slightly improved effi ciency of operational activity in H2, illustrated by the decline in the value of the cost/income ratio compared with the level recorded at end-June 2012 was insuffi cient to offset the evolution of net expenses for IFRS provisions (Chart 3.56.). Thus, starting with August 2012, the profi tability of the Romanian banking system re-entered negative territory, against the background of the further build-up of non-performing loans and following the ample collateral revaluation conducted at the request of the NBR.
Chart 3.55. Breakdown of credit institutions’ market share by ROA
Chart 3.56. Net profi t and ROE
0
10
20
30
40
50
60
70
2008
2009
2010
2011
2012
ROA<0 0<=ROA<1 1<=ROA<2
2<=ROA<3 ROA=>3
percent
Source: NBR
-30
-20
-10
0
10
20
30
40
50
-3
-2
-1
0
1
2
3
4
5
Dec
.200
8D
ec.2
009
Dec
.201
0M
ar.2
011
Jun.
2011
Sep.
2011
Dec
.201
1M
ar.2
012
Jun.
2012
Sep.
2012
Dec
.201
2M
ar.2
013
Jun.
2013
Aug
.201
3
net profit/loss ROE (rhs)
percentlei bn.
Source: NBR
70 In 2012, following the collateral reassessment during the impairment audit, the fi nancial results of credit institutions were negatively affected by around lei 2.7 billion; the estimation of the impact of the ongoing collateral revaluation in 2013 indicates a marginal impact on the profi t and loss account.
71 Banks’ fi nancial results were impacted by the persistent aggregate demand defi cit, which was infl uenced by the moderate dynamics of retail trade and the ongoing recession in the euro area, affecting the Romanian exports and the industrial output.
72 The phrase “net expenses for IFRS provisions”, used in Section 3.2.8. “Profi tability and effi ciency”, corresponds to impairment expenses net of revenues used in the International Financial Reporting Standards (IFRS).
73 Large banks are defi ned as entities with assets of more than 5 percent of total bank assets.

NATIONAL BANK OF ROMANIA68
3 Financial system and its related risks
After having fl uctuated slightly, the dynamics of operating profi t re-entered positive territory at end-May 2013, in the context of operating costs declining at a faster pace than that of operating income (Chart 3.57.). Net interest income, the main item under operating revenues, witnessed further negative growth amid lending showing a downward trend starting with 2012 Q4. January through August 2013, the volume of interest-bearing fi nancial assets, including holdings of securities held to maturity and available for sale, kept going down. The decline may be attributed to the lower external funding from parent banks, as well as to the redefi ning of the segments worth lending to, taking into account their relative performance (quantifi ed based on the evolution of non-performing loans within each segment).
Chart 3.57. Annual real growth rates of operating revenues, expenses and profi t
Chart 3.58. Annual real growth rates of interest revenues, expenses and net interest revenues
-40
-30
-20
-10
0
10
20
30
Dec
.09/
Dec
.08
Dec
.10/
Dec
.09
Dec
.11/
Dec
.10
Mar
.12/
Mar
.11
Jun.
12/J
un.1
1
Sep.
12/S
ep.1
1
Dec
.12/
Dec
.11
Mar
.13/
Mar
.12
Jun.
13/J
un.1
2
Aug
.13/
Aug
.12
operating revenues operating expensesoperating profit
percent
Source: NBR
-50-40-30-20-10
0102030
Dec
.09/
Dec
.08
Dec
.10/
Dec
.09
Dec
.11/
Dec
.10
Mar
.12/
Mar
.11
Jun.
12/J
un.1
1
Sep.
12/S
ep.1
1
Dec
.12/
Dec
.11
Mar
.13/
Mar
.12
Jun.
13/J
un.1
2
Aug
.13/
Aug
.12
net interest revenue interest revenue
interest expenses
percent
Source: NBR
Credit institutions’ fi nancing cost dynamics, as refl ected by interest expenses, decelerated in 2012 Q4, due to lower deposit rates on the domestic market, in the context of low interbank interest rates in the euro area (Chart 3.58.). Net income from commissions further declined in annual terms in 2012 H2, as well as January through August 2013, as a result of the drop in non-government credit. On the other hand, gains from trading in Treasury certifi cates and government bonds were on the rise, on the back of interest rate adjustments.
Banks’ concern to cut down operating expenses translated into the negative dynamics of staff costs (-5.7 percent in December 2012 and -3.6 percent in August 2013) and depreciation costs (-14 percent in December 2012 and -11.3 percent in August 2013). At end-August 2013, the market share of banks incurring operating losses (4 percent) contracted by 1.1 percentage points from a year earlier.
According to the simulations conducted for the purpose of estimating short-term profi tability, the banking system is expected to record positive fi nancial results at end-2013. The existence of a signifi cant spread between lending and deposit rates, as well as the enhanced operating effi ciency refl ected by the lower share of fi xed costs in total operating expenses, offsets the effects of the negative dynamics of non-government credit.

FINANCIAL STABILITY REPORT 2013 69
3 Financial system and its related risks
3.2.9. Results of the banking sector solvency stress test
The National Bank of Romania conducts stress tests of credit institutions’ capital adequacy on a regular basis, consistent with a methodology developed in cooperation with the IMF. The simulations are meant to identify any vulnerability that could generate disruptions across the banking sector, assuming that adverse macroeconomic scenarios materialise. The aim of the simulations is to prevent the accumulation of systemic risks, in case the risk factors considered show unfavourable developments. The stress test framework implies the estimation of the fi nancial results banks would get under the analysed scenarios and the additional capital they should raise in order to cover losses incurred according to the scenarios, with a view to restoring the minimum required capital adequacy ratio for all the credit institutions.
The latest solvency stress test covered a two-year horizon (2013 Q3 – 2015 Q2) and was based on an adverse macroeconomic scenario that assumed a strong and persistent depreciation of the national currency (over 20 percent versus the euro), amid a negative economic growth, a marked rise in funding costs, an external environment hit by recession in the euro area, as well as a gradual depreciation of the euro versus the US dollar. According to the scenario, the probabilities of default considered in the case of loans to non-fi nancial corporations and households respectively are comparable with their historical maximum, recorded in 2009. Moreover, as regards housing loans, the maximum default rate considered stood at roughly 6 percent, a value markedly higher than the historical one. This may be attributed to the prevalence of EUR-denominated loans in this category.
The stress test results show that banks would maintain an adequate capitalisation level under the scenario, despite a noticeable contraction in the solvency ratio. Specifi cally, at the end of the period under review, the solvency ratio would drop by almost 4 percentage points (to 10.8 percent in June 2015, from 14.7 percent in June 2013). During the period under consideration, valuation adjustments for impairment of fi nancial assets would rise by around 27 percent when it comes to exposures to households and by about 31 percent in the case of exposures to companies. Under this scenario, a small number of small-sized credit institutions (without systemic impact) might require additional capital. This can be associated with the current portfolio structure of the institutions in this category, with loans holding a smaller share in total interest-bearing fi nancial assets compared with the previous years. The inability to generate a signifi cant operating profi t (as a primary source to cover the losses generated by the impairment of fi nancial assets) is the main factor justifying the results obtained in the case of these credit institutions (the share of fi xed costs in total operating expenses is signifi cantly larger than that held by large credit institutions, as a result of the economies of scale reported by the latter).
The results do not take into account the positive impact of the expected increase in own funds considered when determining the solvency ratio over the reviewed period, following the gradual removal of the currently used deductions, also known as prudential fi lters. During the simulations, a constant spread was maintained, for prudential reasons, between prudential valuation adjustments and the IFRS-based specifi c adjustments, in order to minimise a potential need for additional capital contributions. Moreover, mention should be made that the stress test results are consistent with the high severity level of the scenario, exceeding the severity level of the scenarios considered by ABE within the EU-wide stress tests.

NATIONAL BANK OF ROMANIA70
3 Financial system and its related risks
3.3. Non-bank fi nancial sector
3.3.1. Insurance sector
The insurance sector strengthened in 2012, against the background of economic growth remaining in positive territory. Financial intermediation ratio, assessed in terms of gross premiums written as a share in GDP, discontinued its negative performance seen in the previous years, standing at the level recorded in 2011. The non-life insurance market expanded slightly in real terms, for the fi rst time in the past four years, while the related ratio of gross claims paid to gross premiums written remained constant. The average profi tability ratio of insurance companies witnessed a slight recovery, but remained in negative territory.
Gross premiums written in the Romanian insurance sector went up 5.56 percent in 2012, mainly on account of the 6.09 percent advance of the non-life insurance market.
In real terms, the slight decline of the life insurance market was offset by the non-life insurance market re-entering positive territory (Chart 3.59.). The insurance sector therefore posted a modest real increase, strengthening after having witnessed a series of unfavourable developments in the past years. The growth of gross premiums written related to civil liability insurance for motor vehicle owners and insurance products under “Other” (especially general civil liability insurance and other property insurance) had a signifi cant contribution to the recovery of non-life insurance market.
The moderate real changes in the gross premiums written caused the fi nancial intermediation in the insurance sector to stick to the level seen in 2011 (Chart 3.60.). The discontinuation in the downward trend in gross premiums written as a share in GDP, which had started in 2009, shows that real GDP growing for the second consecutive year had a positive impact on the insurance sector.
Chart 3.59. Insurance sector and GDP dynamics Chart 3.60. Insurance sector – share of gross premiums written in GDP
-20
-15
-10
-5
0
5
10
15
20
25
2008 2009 2010 2011 2012
real growth rate of non-life insurancereal growth rate of life insuranceGDP real growth rate
percent
Source: FSA, NBR, NIS
0.0
0.4
0.8
1.2
1.6
2.0
2.4
2008 2009 2010 2011 2012
intermediation ratio for life insurance
intermediation ratio for non-life insurance
percent
Source: FSA, NBR, NIS

FINANCIAL STABILITY REPORT 2013 71
3 Financial system and its related risks
Both gross claims paid for non-life insurance and gross premiums written on this segment moved up in 2012, posting roughly equal rates of increase. As a result, the ratio of the two elements remained relatively steady (Chart 3.61.). The rise in the gross claims paid for non-life insurance was largely attributed to the evolution of this indicator for civil liability insurance for motor vehicle owners.
The breakdown of investments made by insurance companies remained largely unchanged in 2012 year on year (Chart 3.62.). Bonds and other fi xed-income securities further held the largest share in total investments, albeit falling for the fi rst time since the onset of the crisis. Moreover, deposits with credit institutions continued to decline, while life insurance investments for which exposure to investment risk is transferred to customers saw an increase. These changes took place against the background of low returns both domestically and internationally, as insurance companies shifted to life insurance plans with an investment component, in response to customers’ interest in such products.
The aggregate fi nancial result of insurance companies was negative in 2012 as well. The average ROA for the ten largest insurance companies in terms of asset value rose slightly, but remained in negative territory for the second consecutive year (Chart 3.63.).
Chart 3.61. Share of gross claims paid in total gross premiums written for non-life insurance
Chart 3.62. Key investments of insurance companies
0
10
20
30
40
50
60
70
80
2008 2009 2010 2011 2012
percent
Source: FSA
0
25
50
75
100
2008 2009 2010 2011 2012
land and buildings
investments related to life insurance for whichexposure to investment risk is transferred to clientsdeposits with credit institutions
bonds and other fixed-income securities
shares and other variable-income securities
percent
Source: FSA
At end-2012, the average solvency ratio for non-life insurance companies fell slightly, while that for life insurance companies stood at a level similar to that reported at end-2011 (Chart 3.64.).

NATIONAL BANK OF ROMANIA72
3 Financial system and its related risks
Chart 3.63. ROA for the top ten insurance companies in terms of asset value
Chart 3.64. Average solvency ratio of insurance companies
-20
-15
-10
-5
0
5
10
2008 2009 2010 2011 2012
maximum ROAaverage ROAminimum ROA
percent
Source: FSA, MPF
0
1
2
3
4
5
6
2008 2009 2010 2011 2012
non-life insurance life insurance
Source: FSA
3.3.2. Private pension funds
The private pension funds are not exposed to signifi cant risks that might have an adverse impact on the fi nancial system stability, as their total assets still stand at a low level compared to those of the other fi nancial system components. The breakdown of the investment portfolios shows a low risk profi le, given the large share of government securities. The performance of the private pension funds improved in 2012 due to the favourable domestic developments, while the share of exposures to the external markets in total fi nancial assets followed a downward path.
During the period since the release of the previous report, the private pension funds continued to collect contributions and the number of participants went up, while the payment obligations stood at a low level. Thus, net assets under Pillar II and Pillar III grew by 45.6 percent and 34.2 percent, respectively, during June 2012 – June 2013. At end-2012, total assets of privately-managed pension funds and optional pension funds accounted for 1.64 percent and merely 0.1 percent respectively of GDP. The monthly gross contributions transferred to Pillar II increased in the period under review, despite a nearly fl at performance in 2012 H2, amid the slower GDP growth, the larger number of participants for whom contributions were paid and the rise in the contribution quota to 4 percent in January 201374 representing the main supporting factors (Chart 3.65.).
74 The contributions for January 2013 were paid in March 2013.

FINANCIAL STABILITY REPORT 2013 73
3 Financial system and its related risks
Chart 3.65. Contributions to Pillar II Chart 3.66. Breakdown of investment portfolios
3.3
3.4
3.5
3.6
3.7
3.8
3.9
0
50
100
150
200
250
300
Jan.
2012
Feb.
2012
Mar
.201
2A
pr.2
012
May
.201
2Ju
n.20
12Ju
l.201
2A
ug.2
012
Sep.
2012
Oct
.201
2N
ov.2
012
Dec
.201
2Ja
n.20
13Fe
b.20
13M
ar.2
013
Apr
.201
3M
ay.2
013
Jun.
2013
monthly gross contributions
number of participants for whom monthly grosscontributions were paid (rhs)
lei mn. millions of participants
Source: FSA
0102030405060708090
100
Jun.12 Dec.12 Jun.13 Jun.12 Dec.12 Jun.13
Pillar II Pillar III
other assetssharesdeposits with credit institutionscorporate bondsgovernment securities
percent
Source: FSA
As regards the diversifi cation of the investment portfolios of private pension funds, the share of government securities stayed high for both Pillar II and Pillar III, posting a slight increase in June 2013 against the same year-ago period. Apart from investments in government securities, the privately-managed pension funds opted for investing the recently collected contributions mainly in bank deposits, while optional pension funds decided to increase stock holdings, in view of their higher yields compared with the returns on money market instruments (Chart 3.66.). Thus, the pension funds attempted to strike a balance between achieving a satisfactory level of total returns and maintaining a low risk profi le. Concurrently, the exposure to the negative developments on the external fi nancial markets kept narrowing, mainly as a result of the smaller share of investments in bonds issued by companies in EU Member States (Chart 3.67.).
All the categories of fi nancial instruments in which the private pension funds had invested reported positive returns in 2012, the stock acquisitions and investments in undertakings for collective investment in transferable securities (UCITS) switching from negative returns in 2011 to signifi cant yields due to the overall positive performance of capital markets. In addition, the higher returns on government securities contributed to an improved overall performance of pension funds compared with the previous year (Chart 3.68.).
While the average maturity of fi xed-income instruments held by the private pension funds remained at almost six years, the average maturity of deposits with credit institutions kept declining to 32 days in 2012 from 35 days in 2011. Most corporate bonds in the category of fi xed-income instruments had maturities longer than 10 years, yet roughly 95 percent of the government securities featured shorter maturities on account of the low volume of long-term securities issued so far. The large stock of short- and medium-term fi nancial instruments limits the pension funds’ capacity to manage future pension obligations more effi ciently.

NATIONAL BANK OF ROMANIA74
3 Financial system and its related risks
Chart 3.67. Investment portfolio by residence of issuer
Chart 3.68. Average annual returns on key fi nancial investments in 2012
88
90
92
94
96
98
100
Jun.2012 Jun.2013 Jun.2012 Jun.2013
Pillar II Pillar III
municipal bonds issued in the EUgovernment securities issued in the EUUCITS issued in the EUshares issued in the EUcorporate bonds issued in the EUsecurities issued in third countriessecurities issued in Romania
percent
Source: FSA
0
5
10
15
20
25
30
35
40
gove
rnm
ent
secu
ritie
s
bond
s
shar
es
UC
ITS
depo
sits
with
cred
it in
stitu
tions
Pillar II
Pillar III
percent
Source: FSA
3.3.3. Non-bank fi nancial institutions
The activity of non-bank fi nancial institutions (NBFIs) saw a slight decline during January 2012 – June 2013. The NPL ratio is still high, but credit risk is contained due to the provisions set up to cover expected losses. The latest macroeconomic developments had a favourable impact on the profi tability of NBFIs, which reverted to positive territory at end-2012, following the improved operating effi ciency and the cut in net provisioning costs.
Since the release of the previous report, the activity in the NBFI sector contracted somewhat. Thus, at end-June 2013, the aggregate assets of this sector totalled lei 32.8 billion, while loans granted equalled lei 22 billion, declining, in nominal terms, by 1.6 percent and 5.4 percent respectively compared to June 2012 (Chart 3.69.). During the same period, the market share of the NBFIs, determined based on the share of loans to the private sector, narrowed slightly to 8.9 percent. The rate of change of loans granted by the NBFIs was further correlated with the changes in the loan portfolio of credit institutions, the domestic and external economic environment affecting the lending conditions in both sectors of the fi nancial system (Chart 3.70.).

FINANCIAL STABILITY REPORT 2013 75
3 Financial system and its related risks
Chart 3.69. Developments in the NBFI sector Chart 3.70. Lending and GDP dynamics (annual change)
02468101214161820
05
101520253035404550
Mar
.200
8Ju
n.20
08Se
p.20
08D
ec.2
008
Mar
.200
9Ju
n.20
09Se
p.20
09D
ec.2
009
Mar
.201
0Ju
n.20
10Se
p.20
10D
ec.2
010
Mar
.201
1Ju
n.20
11Se
p.20
11D
ec.2
011
Mar
.201
2Ju
n.20
12Se
p.20
12D
ec.2
012
Mar
.201
3 Ju
n.20
13
percentlei bn.
total assets balance of loansmarket share (rhs)
Source: NBR
-9
-6
-3
0
3
6
9
-30
-20
-10
0
10
20
30
Mar
.200
9Ju
n.20
09Se
p.20
09D
ec.2
009
Mar
.201
0Ju
n.20
10Se
p.20
10D
ec.2
010
Mar
.201
1Ju
n.20
11Se
p.20
11D
ec.2
011
Mar
.201
2Ju
n.20
12Se
p.20
12D
ec.2
012
Mar
.201
3 Ju
n.20
13
percentpercent
real GDP (rhs)loans granted by NBFIsloans granted by credit institutions
Source: NBR, NIS
The contraction in loans granted by the NBFIs to the private sector was attributed to the evolution of funding of non-fi nancial corporations. Therefore, at end-June 2013, the segment of non-fi nancial corporations contracted by roughly 8 percent in annual terms, while the stock of loans to households moved up 5.2 percent (Chart 3.71.). In terms of currency, the share of leu-denominated loans widened for both households and non-fi nancial corporations, following the implementation of the NBR regulations aimed at deterring foreign-currency lending to unhedged borrowers. In addition, over the past years, the NBFIs’ business model changed, implying a shift towards other types of fi nancing to the detriment of fi nancial leasing operations.
Chart 3.71. Loans granted by NBFIs by borrower and currency
0
5
10
15
2025
30
35
40
Mar
.200
8Se
p.20
08M
ar.2
009
Sep.
2009
Mar
.201
0Se
p.20
10M
ar.2
011
Sep.
2011
Mar
.201
2Se
p.20
12M
ar.2
013
Mar
.200
8Se
p.20
08M
ar.2
009
Sep.
2009
Mar
.201
0Se
p.20
10M
ar.2
011
Sep.
2011
Mar
.201
2Se
p.20
12M
ar.2
013
Mar
.200
8Se
p.20
08M
ar.2
009
Sep.
2009
Mar
.201
0Se
p.20
10M
ar.2
011
Sep.
2011
Mar
.201
2Se
p.20
12M
ar.2
013
Households Non-financial corporations Total
lei bn.
currencylei
Source: NBR

NATIONAL BANK OF ROMANIA76
3 Financial system and its related risks
As for the NBFIs’ fi nancing by economic sector, during June 2012 – June 2013, loans to agriculture rose by 29 percent (12 percent in total loan portfolio), while the exposure to the services sector, accounting for around 50 percent of the total loan portfolio, narrowed by 7 percent.
The guarantees provided by the guarantee funds with a view to supporting the lending activity witnessed an upward trend, due to both the continuation of the “First Home” programme and the rise in the guarantees provided under other government programmes (Chart 3.72.). Accordingly, at end-June 2013, the total guarantees assumed by these entities accounted for 7 percent of credit to non-government, up 1.3 percentage points compared with 2012 Q2.
The NPL ratio for the NBFI sector reached 21 percent in June 2013 (compared with 19.7 percent a year earlier). The upward trend in the NPL ratio was a common feature of the NBFIs and credit institutions (Chart 3.73.), as a result of the constraints on borrowers’ fi nancial standing in the context of modest GDP growth. Nevertheless, the spread between the NPL ratios for the two fi nancial sub-sectors narrowed in 2013 Q1 year on year. Credit risk is mitigated by the provisions made for expected losses (the provisioning coverage ratio for loans under “Loss” was 95 percent in June 2013). The removal of non-performing loans from the balance sheet and the foreclosure on collateral, in the context of a large volume of overdue loans in the portfolio of the NBFIs since the onset of the crisis, pose a challenge to the entire sector in the period ahead.
Chart 3.72. Provision of guarantees Chart 3.73. Non-performing loans
0
5
10
15
20
25
30
35
40
0
2
4
6
8
10
12
14
16
Mar
.200
8Ju
n.20
08Se
p.20
08D
ec.2
008
Mar
.200
9Ju
n.20
09Se
p.20
09D
ec.2
009
Mar
.201
0Ju
n.20
10Se
p.20
10D
ec.2
010
Mar
.201
1Ju
n.20
11Se
p.20
11D
ec.2
011
Mar
.201
2Ju
n.20
12Se
p.20
12D
ec.2
012
Mar
.201
3 J
un.2
013
percent
“First Home” programmeguarantees excl. “First Home”capital ratio (rhs)
lei bn.
Source: NBR
0
5
10
15
20
25
30
0
1
2
3
4
5
6
Mar
.200
8Ju
n.20
08Se
p.20
08D
ec.2
008
Mar
.200
9Ju
n.20
09Se
p.20
09D
ec.2
009
Mar
.201
0Ju
n.20
10Se
p.20
10D
ec.2
010
Mar
.201
1Ju
n.20
11Se
p.20
11D
ec.2
011
Mar
.201
2Ju
n.20
12Se
p.20
12D
ec.2
012
Mar
.201
3 Ju
n.20
13
percentlei bn.
volume of NPLsNPL ratio – credit institutions (rhs)NPL ratio – NBFIs (rhs)
Source: NBR
The analysis of the leverage ratio (Chart 3.74.), determined as a ratio of own funds to total assets, reveals the improvement of funding from own sources. This favourable development stemmed from shareholders’ further efforts to support the NBFIs’ activity. Specifi cally, the NBFIs recorded in the Special Register performed capital increases to cover the losses reported in the previous years and to comply with the NBR’s prudential requirements. Moreover, the breakdown of own funds reveals a larger share of equity capital (54 percent in June 2013 versus 35 percent a year earlier), with part of the subordinated loans being converted into share capital.

FINANCIAL STABILITY REPORT 2013 77
3 Financial system and its related risks
The improvement in the domestic macroeconomic environment was refl ected by the profi tability of the NBFI sector (Chart 3.75.). For the fi rst time in the past four years, the NBFI sector ended the year on a profi t at aggregate level, due to the improved operating effi ciency and the cut in net provisioning costs. In early 2013, the aggregate fi nancial result remained in positive territory.75 76
Chart 3.74. Leverage ratio75 Chart 3.75. Profi tability of the NBFI sector76
0
10
20
30
40
50
60
Mar
.201
0Ju
n.20
10Se
p.20
10D
ec.2
010
Mar
.201
1Ju
n.20
11Se
p.20
11D
ec.2
011
Mar
.201
2Ju
n.20
12Se
p.20
12D
ec.2
012
Mar
.201
3 Ju
n.20
13
percent
interquartile range
mean
median
Source: NBR
-10
-8
-6
-4
-2
0
2
4
-1,000
-800
-600
-400
-200
0
200
400
Mar
.200
8Ju
n.20
08Se
p.20
08D
ec.2
008
Mar
.200
9Ju
n.20
09Se
p.20
09D
ec.2
009
Mar
.201
0Ju
n.20
10Se
p.20
10D
ec.2
010
Mar
.201
1Ju
n.20
11Se
p.20
11D
ec.2
011
Mar
.201
2Ju
n.20
12Se
p.20
12D
ec.2
012
Mar
.201
3 Ju
n.20
13
percentlei mn.
financial result ROA (rhs)
-1,362
Source: NBR
In terms of fi nancing sources, the main resources were taken by the NBFIs directly from the international markets (Chart 3.76.). The deleveraging pursued by the European fi nancial groups also had an impact on the funding structure of the NBFIs. In relative terms, during June 2012 – June 2013, the share of loans from residents increased by around 3 percentage points (to 18.7 percent), following the drop in foreign liabilities and the slight increase in the exposures of the fi nancing entities in Romania.
In the Romanian fi nancial system, the contagion risk between the NBFI sector and the credit institution sector, determined based on the balance sheet interlinkages, stayed at relatively low levels. The connections between the two sectors may be chiefl y indirect, as they belong to certain European fi nancial groups and share the same fi nancing sources. The loans granted by domestic credit institutions to the NBFIs amounted to lei 2.4 billion at end-June 2013, accounting for roughly 1 percent of total non-government loans provided by the banking sector, the largest part consisting of intragroup loans. From the NBFIs’ perspective, the balance sheet interlinkages between the two sectors are apparent especially on the asset side, with the claims on the banking sector, mainly in the form of deposits, accounting for approximately 12 percent of total assets, while, on the liabilities side, capital and borrowings from credit institutions held around 8 percent.
75 Note: The interquartile range comprises the values between quartile 1 and quartile 3 of the distribution. The sample may be subject to changes depending on the NBFIs recorded in the Special Register.
76 Profi tability is assessed based on the reports submitted by the NBFIs recorded in the Special Register. The fi nancial result includes the gross cumulative result since the start of the year, while ROA was determined based on the annualised values of the quarterly gross fi nancial result.

NATIONAL BANK OF ROMANIA78
3 Financial system and its related risks
Chart 3.76. Breakdown of borrowings by NBFIs by country of origin
0
10
20
30
40
50
0
2,000
4,000
6,000
8,000
10,000
Jun.
2010
Jun.
2011
Jun.
2012
Jun.
2013
Jun.
2010
Jun.
2011
Jun.
2012
Jun.
2013
Jun.
2010
Jun.
2011
Jun.
2012
Jun.
2013
Jun.
2010
Jun.
2011
Jun.
2012
Jun.
2013
Jun.
2010
Jun.
2011
Jun.
2012
Jun.
2013
Jun.
2010
Jun.
2011
Jun.
2012
Jun.
2013
Jun.
2010
Jun.
2011
Jun.
2012
Jun.
2013
Jun.
2010
Jun.
2011
Jun.
2012
Jun.
2013
Jun.
2010
Jun.
2011
Jun.
2012
Jun.
2013
Austria Romania France TheNetherlands
Turkey Luxembourg UnitedKingdom
Germany Italy
percentlei mn.
loans taken share in total loans taken (rhs)
Source: NBR
3.4. Financial markets
At end-2012, fi nancial market volatility embarked on a downward trend, which persisted over the fi rst fi ve months of 2013. The favourable developments in investors’ risk aversion caused short-term interest rates and yields on government securities to decline. A somewhat higher instability was manifest only from mid-May until the fi rst part of July 2013, as a result of net capital outfl ows associated with global shifts in exposure to emerging markets induced by heightened investor uncertainties surrounding the timing and magnitude of the tapering-off by the Federal Reserve System (Fed) of its quantitative easing in the USA.
3.4.1. Money market
At the beginning of 2012 Q2, interbank money market rates rose for all maturities following the change in liquidity conditions and the credit institutions’ revised expectations on liquidity developments and the monetary policy rate (Chart 3.77.). The upturn in interbank money market rates persisted during the next quarters of 2012, once the National Bank of Romania tightened its control over banking system liquidity. Average interest rates on the interbank money market peaked in December 2012, when the 3M and the 12M ROBOR rates stood by approximately 1.55 percentage points and 0.73 percentage points respectively above their March readings. Early 2013 saw a trend reversal in ROBOR rates, which hit a 2-year low in May. These developments were mainly the result of adequate liquidity management by the central bank that decided to increase successively the ceiling on its money injections via repos with one-week maturity in the period January-February 2013.

FINANCIAL STABILITY REPORT 2013 79
3 Financial system and its related risks
Chart 3.77. Average interbank money market rates
Chart 3.78. Stochastic volatility77 of interbank money market rates
3.5
4.0
4.5
5.0
5.5
6.0
6.5
7.0
7.5
Jan.
2011
Mar
.201
1M
ay.2
011
Jul.2
011
Sep.
2011
Nov
.201
1Ja
n.20
12M
ar.2
012
May
.201
2Ju
l.201
2Se
p.20
12N
ov.2
012
Jan.
2013
Mar
.201
3M
ay.2
013
3M ROBOR
12M ROBOR
percent
Source: NBR
0
2
4
6
8
10
12
14
16
18
20
Jan.
2011
Mar
.201
1M
ay.2
011
Jul.2
011
Sep.
2011
Nov
.201
1Ja
n.20
12M
ar.2
012
May
.201
2Ju
l.201
2Se
p.20
12N
ov.2
012
Jan.
2013
Mar
.201
3M
ay.2
013
3M ROBOR
12M ROBOR
percent
Source: NBR, NBR calculations
Moreover, starting March 2013, the monetary authority also organised full allotment tenders for the amounts requested by credit institutions via market operations. The downward path in interbank money market rates January through April 2013 was also ascribed to some endogenous liquidity factors such as the increase in net government securities redemptions performed by the Ministry of Public Finance and the recovering economic activity in the real sector. On the other hand, global fi nancial market tensions were rekindled by the Fed’s possible tapering-off of its quantitative easing in the USA and contributed to the adjustment of credit institutions’ expectations regarding the developments in liquidity conditions and the monetary policy rate, weighing heavily on the 3M and 12M ROBOR rates. As a result, in the period 15 May – 15 June 2013 the 3M and 12M ROBOR rates saw maximum rises of 0.86 percentage points and 0.34 percentage points respectively.77
At the same time, the global fi nancial market turmoil sparked by the uncertainty surrounding the outlook for the Fed to carry on its liquidity injections into the US fi nancial system caused the widest fl uctuations in 3M and 12M ROBOR rates in 2013 (Chart 3.78.). The volatility peaks in the period May-June 2013 were similar in height to those induced by domestic tensions in July 2012. During the bank crisis in Cyprus, volatility posted moderate growth which impacted the 3M ROBOR rate alone. Starting with 2012, the interest rate volatility spread for the considered maturities narrowed on a yearly basis.
77 In order to calculate stochastic volatility, a data generating process based on the fi rst order autoregressive model for the mean equation and a geometric Brownian move for variance dynamics was considered. With a view to estimating the considered model, Bayesian techniques based on Markov Chain Monte-Carlo (MCMC) simulations were resorted to. Unlike the conditioned volatility, actually a linear dependency function relative to the previous temporal evidence, stochastic volatility is characterised by sensitivity not as high as the considered mean equation and, implicitly, the used data sample.

NATIONAL BANK OF ROMANIA80
3 Financial system and its related risks
Chart 3.79. Developments in transition probabilities between stress regimes in the interbank money market
Chart 3.80. Spread between 3M money market rates in the region and those in the euro area
0.0
0.2
0.4
0.6
0.8
1.0
Jan.
2011
Mar
.201
1M
ay.2
011
Jul.2
011
Sep.
2011
Nov
.201
1Ja
n.20
12M
ar.2
012
May
.201
2Ju
l.201
2Se
p.20
12N
ov.2
012
Jan.
2013
Mar
.201
3M
ay.2
013
rising moderating falling
Source: NBR
-2
-10
12
34
5
67
8
Jan.
2011
Mar
.201
1M
ay.2
011
Jul.2
011
Sep.
2011
Nov
.201
1Ja
n.20
12M
ar.2
012
May
.201
2Ju
l.201
2Se
p.20
12N
ov.2
012
Jan.
2013
Mar
.201
3M
ay.2
013
3M ROBOR 3M BUBOR3M PRIBOR 3M WIBOR
percentage points
Source: Bloomberg, NBR calculations
Jul.2
013
Stress conditions78 in the interbank money market waned signifi cantly in 2013 (Chart 3.79.). Endogenous factors of the Romanian interbank money market were the main source of the persistently favourable bank fi nancing conditions from February to mid-May 2013, given that the ECB decided to perform a 0.25 percentage point cut in its key interest rate no sooner than May. The average rate of increase of the spread stood at approximately 4 percent under stress conditions and -3.3 percent when fi nancing conditions loosened up.
Compared to the developments across the region, the downtrend in the spread between the 3M ROBOR rate and the 3M EURIBOR rate was a feature common to the money markets of Poland and Hungary as well (Chart 3.80.). Starting November 2012, the PRIBOR/EURIBOR rate spread reverted to negative territory, which points to improved investor perception towards the regional risk.
The risk premium79 that investors charge for the risk associated with future developments in the short-term interbank money market rate in Romania followed a downward drift in 2012 (Chart 3.81.). However, starting February 2013, the risk premium started to expand, while the monetary policy rate was left unchanged at 5.25 percent per annum. This trend persisted until mid-May when a reversal occurred, simultaneously with the increase in the 3M ROBOR rate, which came closer to the policy rate. From the latter half of June 2012 onwards, interbank money market liquidity80 recorded relatively
78 In order to analyse stress conditions related to money market fi nancing, the spread between 3M ROBOR (Romania) and 3M EURIBOR rates was considered. This methodology is based on a Markov model allowing the interest rate spread dynamics to shift between the different regimes. Considering that a high probability relative to the shift to a growing interest rate spread regime is indicative of heightening stress conditions in the interbank money market, applying a Markov model provides an overview of the developments in short-term bank fi nancing pressures.
79 he risk premium charged by investors for the assumed risk is the difference between the forward rate and the expected change in the short-term interbank money market rate. The analysis considered 1M ROBOR and 1M forward rates. In order to calculate the risk premium, an affi ne model was used for the term structure of short-term rates, thus applying the Mahdavi method that leaves out arbitraging opportunities.
80 Liquidity was measured by the volume of interbank transactions.

FINANCIAL STABILITY REPORT 2013 81
3 Financial system and its related risks
stable developments, ranging from lei 1.3 billion to lei 1.5 billion (Chart 3.82.). The only exceptions were December 2012 and January 2013, when interbank liquidity hovered around lei 2.1 billion. Interbank liquidity in the money market trended upwards in the period May-June 2013.
Chart 3.81. Risk premium charged by investors for the risk associated with future interest rate developments
Chart 3.82. Interbank money market transactions
5.0
5.2
5.4
5.6
5.8
6.0
6.2
6.4
0.0
0.1
0.2
0.3
0.4
0.5
0.6
0.7
Jan.
2011
Mar
.201
1M
ay.2
011
Jul.2
011
Sep.
2011
Nov
.201
1Ja
n.20
12M
ar.2
012
May
.201
2Ju
l.201
2Se
p.20
12N
ov.2
012
Jan.
2013
Mar
.201
3M
ay.2
013
risk premium policy rate (rhs)
percent per annumpercentage points
Source: NBR
0
2
4
6
Jan.
2011
Mar
.201
1M
ay.2
011
Jul.2
011
Sep.
2011
Nov
.201
1Ja
n.20
12M
ar.2
012
May
.201
2Ju
l.201
2Se
p.20
12N
ov.2
012
Jan.
2013
Mar
.201
3M
ay.2
013
interbank deposits (stock)interbank deposits (flow)
lei bn.
Source: NBR, NBR calculations
At the same time, against the backdrop of an improving economic environment in Europe, partly due to market expectations of an exit from the recession in the course of 2013, and the ongoing fi scal consolidation, risk aversion on Europe’s fi nancial markets declined. These factors caused a sharply downward trend in CDS quotes for euro area countries and CEECs starting May 2012 (Charts 3.83. and 3.84.).
The developments in CDS quotes for Romania followed the investors’ trend across the region. In 2013, they posted relatively moderate volatility, hovering around 200 basis points, compared with approximately 346 basis points, on average, during 2012. The turmoil stemming from information on a possible tapering-off by the Fed of its quantitative easing in the USA prompted a short-lived rise in CDS spreads for the countries in the region, except the Czech Republic where the negative signals on fi nancial markets had a negligible impact on the country’s CDS quotes.
At the same time, the initial exposure reduction in the entire emerging market asset class translated into a temporary increase in CDS and government bond spreads. Subsequently however, investors reconsidered their exposures and chose to invest in countries that reported improved economic fundamentals and where the fi scal and external defi cits were being adjusted or recorded low levels. Noteworthy is the case of Romania, where the share of government securities held by non-residents reverted to its May 2013 level.

NATIONAL BANK OF ROMANIA82
3 Financial system and its related risks
Chart 3.83. Developments in 5Y CDS quotes for some euro area countries
Chart 3.84. Developments in 5Y CDS quotes for some countries in the region
0
1,000
2,000
3,000
4,000
5,000
6,000
7,000
0
200
400
600
800
1,000
1,200
1,400
Jan.
2011
Mar
.201
1M
ay.2
011
Jul.2
011
Sep.
2011
Nov
.201
1Ja
n.20
12M
ar.2
012
May
.201
2Ju
l.201
2Se
p.20
12N
ov.2
012
Jan.
2013
Mar
.201
3M
ay.2
013
Jul.2
013
Germany IrelandItaly SpainGreece (rhs) Portugal
basis points
Source: Bloomberg
basis points
0
100
200
300
400
500
600
700
800
Jan.
2011
Mar
.201
1M
ay.2
011
Jul.2
011
Sep.
2011
Nov
.201
1Ja
n.20
12M
ar.2
012
May
.201
2Ju
l.201
2Se
p.20
12N
ov.2
012
Jan.
2013
Mar
.201
3M
ay.2
013
Jul.2
013
Romania Czech RepublicPoland Hungary
basis points
Source: Bloomberg
3.4.2. Government securities market
The term structure of the newly-issued government securities improved further in 2013 H1, as medium- and long-term bonds went up in terms of value (Chart 3.85.). The marked decline in the newly-fl oated Treasury certifi cates with maturity of up to one year is in line with the fi scal consolidation, which took some pressure off the government budget in the short run.
Chart 3.85. Breakdown of government securities issuance by maturity (M)
Chart 3.86. Transactions in government securities on the interbank secondary market
0
5
10
15
20
25
30
35
M6
mon
ths
0.5<
M1
year
1<M
3 ye
ars
3<M
5 ye
ars
5<M
10 y
ears
>10
year
s
lei bn.
2011
2012
2013 H1
Source: NBR
0
10
20
30
40
50
60
70
Jan.
2011
Mar
.201
1M
ay.2
011
Jul.2
011
Sep.
2011
Nov
.201
1Ja
n.20
12M
ar.2
012
May
.201
2Ju
l.201
2Se
p.20
12N
ov.2
012
Jan.
2013
Mar
.201
3M
ay.2
013
outright transactions repos
lei bn.
Source: NBR, NBR calculations

FINANCIAL STABILITY REPORT 2013 83
3 Financial system and its related risks
Traded volumes in the secondary interbank market for government securities dropped sizeably in 2012 H2, but rebounded somewhat in 2013 H1 amid the stabilising state-of-affairs in Romania and growing non-resident investor interest in local government bonds. In January 2013, traded volumes surged once JP Morgan announced its decision to include Romanian bonds in the GBI-EM global index, while Barclays Capital subsequently included these securities into its EM Local Currency Government Index (Chart 3.86.). Government securities are also traded on the Bucharest Stock Exchange, but here traded volumes account for less than 1 percent of the secondary interbank market turnover.
The relatively favourable domestic and external environment, coupled with adequate bank liquidity and the inclusion of Romanian government bonds into JP Morgan and Barclays Capital indices for local currency-denominated bonds issued in the emerging economies helped narrow the yields on government securities starting January 2013 (Chart 3.87.). The spread between yields on 5Y and 1Y securities widened in 2013 H1, partly accounting for the increase in the average maturity of government bond issues (Chart 3.88.).
Chart 3.87. Annual yield on government securities with residual maturity of one year
Chart 3.88. Spread between yields on 5Y and 1Y government securities
3.0
3.5
4.0
4.5
5.0
5.5
6.0
6.5
7.0
7.5
Jan.
2011
Mar
.201
1M
ay.2
011
Jul.2
011
Sep.
2011
Nov
.201
1Ja
n.20
12M
ar.2
012
May
.201
2Ju
l.201
2Se
p.20
12N
ov.2
012
Jan.
2013
Mar
.201
3M
ay.2
013
percent
Source: NBR, NBR calculations
-0.5
0.0
0.5
1.0
1.5
2.0
2.5
Jan.
2011
Mar
.201
1M
ay.2
011
Jul.2
011
Sep.
2011
Nov
.201
1Ja
n.20
12M
ar.2
012
May
.201
2Ju
l.201
2Se
p.20
12N
ov.2
012
Jan.
2013
Mar
.201
3M
ay.2
013
percentage points
Source: NBR, NBR calculations
The downward trend in yields on government securities was relatively proportional over the entire yield curve (Charts 3.89. and 3.90.). Thus, at the end of 2013 Q1 the average monthly yield on government securities with residual maturity of one year contracted from December 2012 by approximately 0.94 percentage points and the average monthly yield on government securities with 10Y residual maturity declined by about 0.8 percentage points, but in the following months the speed of adjustment of these yields slowed, dropping by 0.3 percentage points and 0.5 percentage points respectively.

NATIONAL BANK OF ROMANIA84
3 Financial system and its related risks
Chart 3.89. Yield curve81 in the secondary market in 2012 Q2 and Q4
Chart 3.90. Yield curve in the secondary market in 2013 Q1 and Q2
4.0
4.5
5.0
5.5
6.0
6.5
7.0
6M 12M 36M 60M 120M
June 2012
December 2012
percent
Source: NBR, NBR calculations
4.0
4.5
5.0
5.5
6.0
6.5
7.0
6M 12M 36M 60M 120M
March 2013
June 2013
percent
Source: NBR, NBR calculations
Yields on Romania’s government securities are among the most volatile across the region (Chart 3.91.). The local market saw two major periods of elevated volatility in the past few months, namely January 2013 when non-resident investors showed a stronger interest in the Romanian government bonds and the period May-June 2013 characterised by substantial capital outfl ows from the emerging markets for fear of a relatively fast and large-scale implementation of the Fed’s tapering-off of its quantitative easing in the USA. The yield on Romania’s government securities is also among the highest in the region, whereas the spread between local bonds and those issued by other CEECs remained unchanged or even improved slightly during 2013 H1. At mid-2013, the yield on Romania’s 1Y government securities stood by approximately 4 percentage points above those on the German Bunds (Chart 3.92.).81
81 In order to estimate the yield curve, the transactions in lei-denominated government securities on the interbank secondary market were used. Their yield was directed towards various maturity buckets, depending on the residual maturity of a particular security. The yield curve draws on the results of the third degree polynomial functions.

FINANCIAL STABILITY REPORT 2013 85
3 Financial system and its related risks
Chart 3.91. Volatility of yields on local currency-denominated government securities issued in Central and Eastern Europe
Chart 3.92. Spread between yields on government securities in Romania and those on 1Y bonds issued by other European countries
0
5
10
15
20
25
30
Jan.
2011
Apr
.201
1
Jul.2
011
Oct
.201
1
Jan.
2012
Apr
.201
2
Jul.2
012
Oct
.201
2
Jan.
2013
Apr
.201
3
Jul.2
013
RO HU PL CZ
percent
Note: Volatility was calculated on the basis ofRiskMetrics method with exponentiallyweighted historical yields.
Source: NBR, Thomson Reuters, NBR calculations
-4
-2
0
2
4
6
8
Jan.
2011
Apr
.201
1
Jul.2
011
Oct
.201
1
Jan.
2012
Apr
.201
2
Jul.2
012
Oct
.201
2
Jan.
2013
Apr
.201
3
Jul.2
013
RO-GE spread RO-HU spreadRO-PL spread RO-CZ spread
percentage points
Source: NBR, Thomson Reuters, NBR calculations
Yields on local currency-denominated government securities in CEECs are tightly correlated with CDS spreads on sovereign debt. The countries for which international investors perceive a stronger risk attached to these instruments provide higher yields to offset the risk premium. This relation remains strong for both short-term yields (1Y) and medium-term yields (5Y). Nevertheless, evidence shows a stronger correlation for medium-term yields on Romania’s government bonds, whilst short-term yields rely to a larger extent on other factors than CDS spreads compared to other countries in the region (Charts 3.93. and 3.94.).
Yields on Romania’s EUR-denominated government securities launched on the local market displayed a similar performance as those denominated in lei, staying on a downward trend in the course of 2012 and in 2013 H1. Although the volume of dealings in EUR-denominated government securities is much lower than that in local currency-denominated instruments, there is a stronger connection between CDS spreads and the yields on short-term government securities denominated in euro. The explanation for the stronger correlation may lie with the currency risk incorporated in the yields on Romania’s EUR-denominated government securities, which is sensitive to sovereign risk.

NATIONAL BANK OF ROMANIA86
3 Financial system and its related risks
Chart 3.93. Sovereign CDS and yields on 1Y government bonds across the region (RO, HU, PL, CZ) January 2011 through June 2013 (quarterly averages)
Chart 3.94. Sovereign CDS and yields on 5Y government bonds across the region (RO, HU, PL, CZ) January 2011 through June 2013 (quarterly averages)
0
100
200
300
400
500
600
700
0 5 10
CD
S (b
asis
poi
nts)
Yield (percentage points)
Note: in blue – trend in the region (RO, HU, PL, CZ);in red – trend in Romania
Source: Thomson Reuters, Bloomberg
0
100
200
300
400
500
600
700
0 5 10
CD
S (b
asis
poi
nts)
Yield (percentage points)
Note: in blue – trend in the region (RO, HU, PL, CZ);in red – trend in Romania
Source: Thomson Reuters, Bloomberg
3.4.3. Foreign exchange market
Against the background of a shift in investors’ risk appetite towards Romania, the local currency was traded at historical lows against the euro in July 2012 (Chart 3.95.). The shift in risk perception was prompted by external factors such as fi scal tensions in the euro area and their negative externalities on the fi nancial sector as well as tensions on the local political scene. A major role also played Moody’s downgrading of Romania’s sovereign risk outlook to negative at the end of June. From July 2012 onwards, the trend in the EUR/RON exchange rate departed from those of other currencies in the region. The completion of the electoral process, the improvement in investors’ risk perception towards the Romanian fi nancial market, together with the decline in global risk aversion and stronger non-residents’ demand for local currency-denominated debt instruments, helped put the EUR/RON exchange rate onto a sharply downward path December 2012 through January 2013. The leu was relatively stable versus the euro until end-May, when global market tensions caused a signifi cant depreciation of the Romanian currency and the major currencies in the region against the euro.
The annualised volatility of the exchange rate posted wider fl uctuations in the period July 2012 – June 2013 than in January 2011 – June 2012 (Chart 3.96.). Early 2013 saw lower exchange rate volatility after the considerable strengthening of the leu to the euro at the end of 2012. Subsequently however, amid international market tensions and net capital outfl ows from the emerging markets, the EUR/RON exchange rate volatility increased considerably, peaking at 12.2 percent in June 2013.
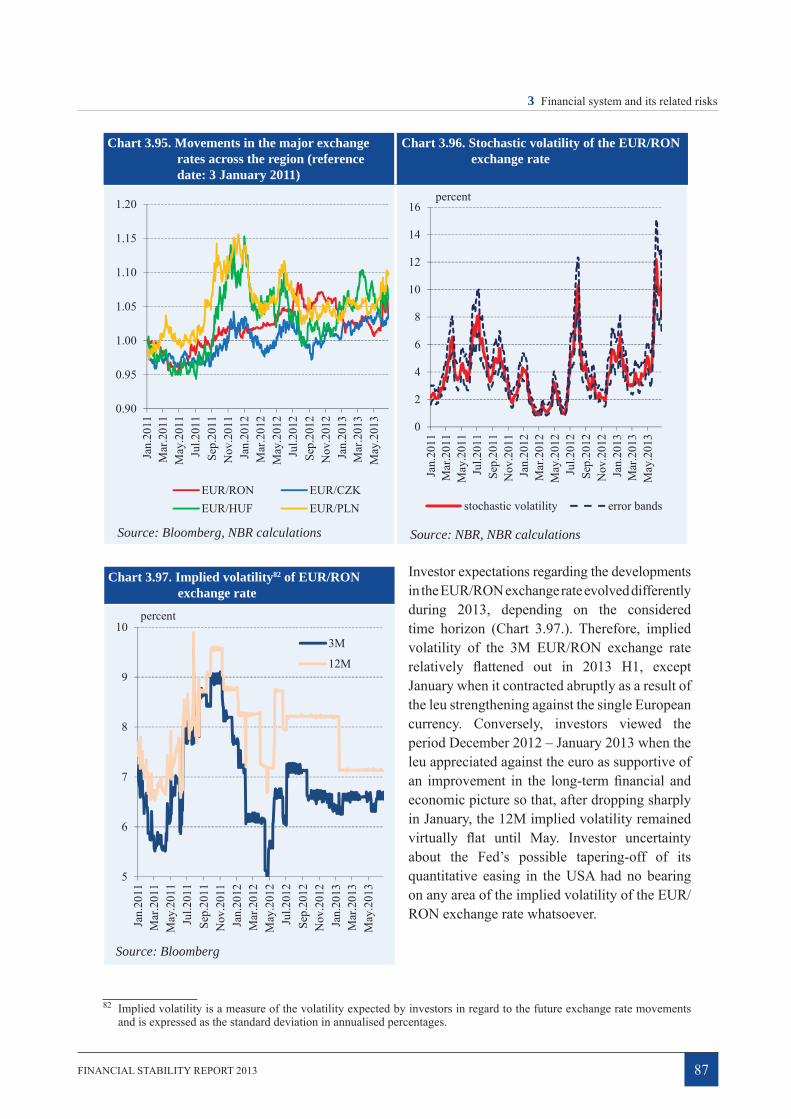
FINANCIAL STABILITY REPORT 2013 87
3 Financial system and its related risks
Chart 3.95. Movements in the major exchange rates across the region (reference date: 3 January 2011)
Chart 3.96. Stochastic volatility of the EUR/RON exchange rate
0.90
0.95
1.00
1.05
1.10
1.15
1.20
Jan.
2011
Mar
.201
1M
ay.2
011
Jul.2
011
Sep.
2011
Nov
.201
1Ja
n.20
12M
ar.2
012
May
.201
2Ju
l.201
2Se
p.20
12N
ov.2
012
Jan.
2013
Mar
.201
3M
ay.2
013
EUR/RON EUR/CZKEUR/HUF EUR/PLN
Source: Bloomberg, NBR calculations
0
2
4
6
8
10
12
14
16
Jan.
2011
Mar
.201
1M
ay.2
011
Jul.2
011
Sep.
2011
Nov
.201
1Ja
n.20
12M
ar.2
012
May
.201
2Ju
l.201
2Se
p.20
12N
ov.2
012
Jan.
2013
Mar
.201
3M
ay.2
013
stochastic volatility error bands
percent
Source: NBR, NBR calculations
Investor expectations regarding the developments in the EUR/RON exchange rate evolved differently during 2013, depending on the considered time horizon (Chart 3.97.). Therefore, implied volatility of the 3M EUR/RON exchange rate relatively fl attened out in 2013 H1, except January when it contracted abruptly as a result of the leu strengthening against the single European currency. Conversely, investors viewed the period December 2012 – January 2013 when the leu appreciated against the euro as supportive of an improvement in the long-term fi nancial and economic picture so that, after dropping sharply in January, the 12M implied volatility remained virtually fl at until May. Investor uncertainty about the Fed’s possible tapering-off of its quantitative easing in the USA had no bearing on any area of the implied volatility of the EUR/RON exchange rate whatsoever.82
82 Implied volatility is a measure of the volatility expected by investors in regard to the future exchange rate movements and is expressed as the standard deviation in annualised percentages.
Chart 3.97. Implied volatility82 of EUR/RON exchange rate
5
6
7
8
9
10
Jan.
2011
Mar
.201
1M
ay.2
011
Jul.2
011
Sep.
2011
Nov
.201
1Ja
n.20
12M
ar.2
012
May
.201
2Ju
l.201
2Se
p.20
12N
ov.2
012
Jan.
2013
Mar
.201
3M
ay.2
013
3M
12M
percent
Source: Bloomberg

NATIONAL BANK OF ROMANIA88
3 Financial system and its related risks
3.4.4. Capital market
The BET index outperformed its peers across the region in the period January 2012 – June 2013 (Chart 3.98.). On the whole, major stock market indices in Romania, the Czech Republic and Poland moved in tandem, with the magnitude of fl uctuations being different from one stock exchange to another, depending on the economic and fi nancial conditions as well as the perceived country-specifi c risk.
The upturn in stock market indices in the region that had begun in 2012 Q2 came to a halt in 2013 Q1. Moreover, the beginning of 2013 Q2 experienced corrections on the region’s stock exchanges, due largely to the slowing US economic recovery after the release of several reports on fi rst-quarter economic activity. Apart from the correlation of the correction of BSE indices with that in US indices, investors in Bucharest also stayed on sidelines amid low liquidity levels on a daily basis. The BET index was particularly resilient to negative shocks on the world’s stock markets, as refl ected in the cumulated distribution of returns (Chart 3.99.). Factors such as stronger demand for lei-denominated investments, higher-than-expected performance of some macroeconomic indicators and the ongoing fi scal consolidation also helped lift the BET index.
Chart 3.98. Regional stock market index dynamics (reference period: January 2011)
Chart 3.99. Cumulated distribution of returns83 for the period January 2012 – June 2013
0.2
0.4
0.6
0.8
1.0
1.2
1.4
Jan.
2011
Mar
.201
1M
ay.2
011
Jul.2
011
Aug
.201
1O
ct.2
011
Dec
.201
1Fe
b.20
12A
pr.2
012
Jun.
2012
Aug
.201
2O
ct.2
012
Dec
.201
2Fe
b.20
13A
pr.2
013
Jun.
2013
BET (RO) WIG (PL)
BUX (HU) FTASE (GR)
Source: Bloomberg, NBR calculations
0.0
0.2
0.4
0.6
0.8
1.0
-0.1 -0.05 0 0.05 0.1
BET (RO)
WIG (PL)
BUX (HU)
FTASE (GR)
Source: Bloomberg, NBR calculations83
In the period May 2012 – April 2013, Bucharest Stock Exchange capitalisation trended slightly upwards, due to both the correlation with the positive developments on the US capital market and the improvement in investors’ risk perception (Chart 3.100.). Subsequently, international market tensions brought about a decline in market capitalisation. Annualised liquidity84 followed a downward drift in the course of 2012. In contrast, the onset of 2013 saw a sizeable increase in stock market liquidity, which reached a peak in May. In June 2013, wary investors caused stock market liquidity to halve. 83 Cumulated probability distribution of returns in respect of four stock exchange indexes was calculated using a Kaplan-
Meier estimation function. Oy axis shows fi gures in the [0,1] range of probability levels for which the function was estimated. Ox axis shows various readings of index returns related to probability levels.
84 Monthly trades * 12 / Market capitalisation at the end of the month.

FINANCIAL STABILITY REPORT 2013 89
3 Financial system and its related risks
Chart 3.100. Domestic market capitalisation and annualised liquidity
Chart 3.101. Daily VaR for returns on BSE indices
0
4
8
12
16
0
40
80
120
160
Jan.
2011
Mar
.201
1M
ay.2
011
Jul.2
011
Sep.
2011
Nov
.201
1Ja
n.20
12M
ar.2
012
May
.201
2Ju
l.201
2Se
p.20
12N
ov.2
012
Jan.
2013
Mar
.201
3M
ay.2
013
percentlei bn.
BSE capitalisation - “International”RASDAQ capitalisation
BSE capitalisation excluding “International”turnover/capitalisation - annualised data (rhs)
Source: BSE, NBR calculations
1
6
11
16
21
26
Jan.
2011
Mar
.201
1M
ay.2
011
Jul.2
011
Aug
.201
1O
ct.2
011
Dec
.201
1Fe
b.20
12A
pr.2
012
Jun.
2012
Aug
.201
2O
ct.2
012
Dec
.201
2Fe
b.20
13A
pr.2
013
Jun.
2013
BET BET-FI
percent
Source: BSE, NBR calculations
Market risk85 of major stock exchange indices in Romania followed an overall downward path in the period January 2012 – June 2013 (Chart 3.101.). In 2013, fl uctuations in the VaR for market risk were larger in the case of the BET-FI, refl ecting investor perceptions towards riskier investments. Average VaR for 2013 H1 was below the levels recorded in 2012 and 2011, amid the shift in investors’ risk appetite given the fi nancial environment in Romania.
Capital market volatility has remained low recently, since no destabilising events were manifest either domestically or internationally (Chart 3.102.). The fi nancial sector is the most volatile, but features the highest traded volumes. High liquidity is normally perceived as a steadying factor for stock market indices. However, as the Romanian stock exchange faces relatively low liquidity levels, volatility of the most heavily traded shares tends to grow, as
compared with that of the stocks of other listed issuers in which investors are far less interested.
85 Daily VaR (Value at Risk) is estimated for a 10-day horizon and for the 99th percentile of the distribution function, in compliance with the provisions of Basel II Accord on market risk management. In this case, the highest possible loss for a 10-day horizon will most likely not exceed the daily VaR. Underlying the VaR calculation is the standard normal distribution (with the mean of 0 and variance equalling 1) and stochastic volatility relative to a data generating process comprising the fi rst order autoregressive model for the mean equation and a geometric Brownian motion for variance dynamics.
Chart 3.102. Volatility of BSE indices
0
10
20
30
40
50
Jan.
2011
Mar
.201
1M
ay.2
011
Jul.2
011
Sep.
2011
Nov
.201
1Ja
n.20
12M
ar.2
012
May
.201
2Ju
l.201
2Se
p.20
12N
ov.2
012
Jan.
2013
Mar
.201
3M
ay.2
013
Jul.2
013
BET BET-C BET-FI
percent
Source: BSE, NBR calculations

NATIONAL BANK OF ROMANIA90
3 Financial system and its related risks
Over the last few years, share prices of banks listed on the capital market dropped, as investors regarded the banking sector as having weaker development and profi tability prospects than the economy as a whole in the short and medium term (Chart 3.103.). From January 2011 to June 2013, bank shares lost, on average, almost 36 percent, whereas the aggregate stock market index shed merely 8 percent.
Chart 3.103. Credit institutions’ share prices in Romania (computed index)
Chart 3.104. Credit institutions’ share prices in the region (RO, HU, PL, CZ)
50
60
70
80
90
100
110
120
130
140
Jan.
2011
Mar
.201
1M
ay.2
011
Jul.2
011
Sep.
2011
Nov
.201
1Ja
n.20
12M
ar.2
012
May
.201
2Ju
l.201
2Se
p.20
12N
ov.2
012
Jan.
2013
Mar
.201
3M
ay.2
013
points
Source: FSA, NBR calculations
-80
-60
-40
-20
0
20
40
60
RO HU PL CZ
2011-2012
2012 - 2013 H1
15 Sep. 2008 - 2013 H1
percent
Note: Share prices are expressed in euro.
Source: FSA, Thomson Reuters, NBR calculations
The Romanian banking sector’s returns on the capital market were among the lowest in the region. Even though volatility was relatively low, investors viewed the Romanian banking sector as providing weaker growth prospects than its peers in other countries in Central and Eastern Europe. Among the relevant factors stood also the much lower profi tability of credit institutions in Romania. From the bankruptcy of Lehman Brothers in mid-September 2008, the event that is considered to have triggered the global fi nancial crisis, until end-June 2013 share prices of banks listed on the BSE fell 60 percent in euro terms (Chart 3.104.).

FINANCIAL STABILITY REPORT 2013 91
4 RISKS RELATED TO DOMESTIC ECONOMIC AND FINANCIAL DEVELOPMENTS
4.1. Domestic macroeconomic developments
The balance of risks generated by domestic macroeconomic developments improved since the release of the previous report amid the challenging external environment: domestic economic growth remained low, despite having embarked upon an acceleration trend, fi scal consolidation carried on, while external accounts witnessed a considerable improvement. An essential prerequisite in the coming years is to preserve domestic macrostability with a view to strengthening the confi dence of the main stakeholders (resident and non-resident investors, consumers, the fi nancial system, etc.) in the Romanian economy. In order to fulfi l this objective: (A) structural reforms in the economy should be implemented at a faster pace, and (B) fi scal consolidation should carry on, while payment discipline should tighten for all system participants, including the authorities.
4.1.1. Real sector
Romania’s economic growth was relatively modest in 2012 (+0.7 percent), markedly below potential and lower than the 2011 real GDP growth of 2.2 percent. This result was largely ascribed to the high dependence of economic growth on agricultural output developments (leaving aside agriculture’s severe contraction owing to the adverse weather conditions of 2012 as well as to an unfavourable base effect, real GDP dynamics in 2012 would have been similar to those of 2011). In 2013 H1, GDP growth stood at 1.8 percent as compared to 2012 H1. The projections for the year ahead point to moderate, above EU average1, GDP dynamics, given the persistent uncertainty surrounding external economic developments. These dynamics underpin the real convergence process of income per capita in Romania towards the euro area average (Chart 4.1.), despite the only gradual narrowing of the negative output gap. The GDP dynamics sustainability is refl ected by the key macroeconomic indicators remaining below the alert threshold in the European Commission’s Scoreboard for the surveillance of macroeconomic imbalances (Chart 4.2.).
In order to maintain and consolidate domestic macrostability, it is required that: (a) structural reforms in the economy should continue at a faster pace, (b) labour market constraints should loosen, (c) the absorption rate for EU funds should increase, and (d) innovation should play a more prominent role in economic development.
(a) The main pillars of structural reforms in the economy include reforming ineffi cient state-owned enterprises, boosting investment and effi ciency in the transport and energy sectors and implementing the reform agenda in the healthcare sector, measures that the authorities have committed to push forward in the period ahead. These measures are included in the new economic programme that is part of the 24-month precautionary fi nancing agreement concluded in September 2013 with the European Union and the International Monetary Fund. Structural reforms concerned will also have
1 The European Commission anticipates an economic growth of 1.6 percent for Romania in 2013 and of 2.2 percent in 2014, while the EU average is projected to stand at -0.1 percent and 1.4 percent respectively (European Commission Economic Forecast, spring 2013). The International Monetary Fund forecasts an economic growth of 2 percent for Romania in 2013 (July 2013).

NATIONAL BANK OF ROMANIA92
4 Risks related to domestic economic and fi nancial developments
a positive impact on strengthening the economy’s capacity to cope with constraints, especially in the real convergence process.
Chart 4.1. Average annual convergence rate in EU-10
Chart 4.2. Development of imbalances monitored by the EC via the scoreboard2
BG
CZ
EE
LV
LT
HU
PLRO
SI
SK
BG CZ
EE
LVLT
HU
PLRO
SI
SK
-0.5
0.0
0.5
1.0
1.5
2.0
2.5
3.0
40 60 80 100
20132014
percent
GDP/capita of CEE countries compared to GDP/capita for euro area (2012)
Fore
cast
ed g
row
th ra
te o
f GD
P/ca
pita
com
pare
d to
G
DP/
capi
ta fo
r eur
o ar
ea fo
r 201
3-20
14
Source: Eurostat, NBR calculations
76.3
75.0
73.7
707580859095
100 201020112012threshold
160
30.5
6.6 23
.434.7
7.2 1.3
37.8
7.2 4.8
10 12
0
15
3045
60
Priv
ate
sect
orde
bt (%
of G
DP)
Publ
ic d
ebt
(% o
f GD
P)
Une
mpl
oym
ent
rate
(%, 3
-yea
rav
erag
e)
Nom
inal
uni
tla
bour
cos
t(%
, 3-y
ear
aver
age)
60
Source: Eurostat
(b) Labour market conditions witnessed mixed developments since the release of the previous report. The average annual unemployment rate continued to stay below the average EU values in 2012 (7 percent versus 10.5 percent in the EU), down against 2011 (7.4 percent)3. The downward trend reported throughout 2012 saw a reversal in the fi rst months of 2013 (unemployment rate rose to 7.5 percent in August 2013), but the European Commission’s forecast envisages the drop of this indicator to 6.9 percent at end-2013. The long-term unemployment rate (over 12 months) remained virtually unchanged in 2012 (3.2 percent versus 3.1 percent in 2011). Structural developments raise concerns: against the backdrop of the aging population process, the labour force participation rate is further low. The employment rate of the population aged 20-64 was 63.8 percent in 2012. This rate, albeit on the rise against the preceding year (62.8 percent), is markedly below the EU average (68.5 percent) and far below the domestic target of the Europe 2020 Strategy (70 percent). The employment rate among young people aged 15-24 remains low (23.9 percent), below the EU average (32.9 percent), one of the lowest readings among the EU-10 countries.
(c) Romania’s EU fund absorption rate stood at 11.5 percent at end-20124. In 2013, this indicator saw an improvement (21.9 percent in August 2013), remaining however low. Romania received additional EU funds available for 2014-2020, amounting to EUR 39.3 billion, of which EUR 21.8 billion from Structural and Cohesion Funds. By comparison, in 2007-2013 fi scal years, Romania received EUR 34.6 billion in funding and EUR 19.7 billion respectively. In order to improve the absorption of EU funds, the authorities launched a set of measures aimed particularly at: (i) the human and material
2 The scoreboard is the instrument underlying the analysis of the Report on the alert mechanism that forms a component of the new framework for monitoring macroeconomic imbalances at European level.
3 According to ILO (International Labour Offi ce) 4 According to the Ministry of European Funds.

FINANCIAL STABILITY REPORT 2013 93
4 Risks related to domestic economic and fi nancial developments
infrastructure involved in this activity; (ii) the process of managing public projects eligible for EU funding; (iii) ensuring fl exibility and liquidity of EU-funded projects, by granting short-term governmental loans, as increasing efforts to attract EU structural and cohesion funds is deemed a priority5.
The lower EU fund absorption rate did not weigh much on public and private investment that posted high growth rates in 2012 (+4.9 percent in real terms). The level of public and private investment in Romania remained the highest among the EU-10 countries in 2012, standing at 7.2 percent of GDP and 19.5 percent of GDP respectively in Romania versus 4.7 percent and 16.4 percent respectively, as reported, on average, by the EU-10 countries.6
(d) Innovation-based economic growth is an important objective for Romania, established in the National Reform Programme 2011-2013 and in line with the Europe 2020 Strategy. Romania’s target in terms of R&D expenditure is to reach 2 percent of GDP in 2020 (1 percent from public sources and 1 percent from private sources). However, Romania’s performance so far is unsatisfactory, with low R&D expenditures (0.5 percent of GDP in 2011), markedly lower than the EU-10 average (1 percent of GDP in 2011). According to the data presented by the European Commission in the Innovation Union Scoreboard, Romania is part of the lowest-ranked performance group, that of modest innovators, next to Bulgaria, Latvia and Poland. Romania ranks the last in terms of R&D expenditure in the business sector, while the most signifi cant efforts are currently geared towards training human resources (Chart 4.3.).
A recent Tax Code amendment act7 encourages private sector innovation and provides for: (i) increasing the maximum deductibility threshold for tax profi t calculation (from 20 to 50 percent), and (ii) expanding the scope of R&D expenditure under preferential tax treatment.
5 In the National Strategic Report for 2012, Romania set out to increase EU fund absorption rates to 50-80 percent until 2015.
6 According to the Innovation Union Scoreboard, the main types of indicators cover the following innovation dimensions: Economic effects covers sales, exports, employment in knowledge-intensive activities; Innovators refers to SMEs introducing product or process innovations and SMEs introducing marketing or organisational innovations; Intellectual assets refers to PCT patent applications, Community trademarks and Community designs; Linkages & entrepreneurship refers to SMEs that innovate in-house, innovating SMEs collaborating with others; Firm investments refers to innovation expenditure in the business sector; Finance and support covers R&D expenditure in the public sector and venture capital investment; Open, excellent and attractive research systems refers to international scientifi c co-publications and non-EU doctorate students; Human resources refers to new doctorate graduates, total population having completed tertiary education and youth having attained at least upper secondary level school.
7 Government Ordinance No. 8/2013 amending and supplementing Law No. 571/2003 on the Tax Code and regulating some fi nancial and fi scal measures.
Chart 4.3. Contributions to innovation-based development (2012)6
0 0.2 0.4 0.6 0.8
Human resources
Finance and support
Firm investments
Linkages &entrepreneurship
Intellectual assets
Innovators
Economic effects
EU-27Romania
Innovation indexSource: Innovation Union Scoreboard 2013, EC
Open, excellent andattractive research
systems

NATIONAL BANK OF ROMANIA94
4 Risks related to domestic economic and fi nancial developments
4.1.2. Public sector
Fiscal consolidation – the centrepiece of domestic macrostabilisation – carried on in 2012 and in the fi rst months of 2013. The general government defi cit narrowed to 2.9 percent of GDP (according to ESA95 methodology) in 2012 versus 5.6 percent of GDP a year earlier. In the fi rst eight months of 2013, this indicator stood at 1.27 percent of GDP versus 1.17 percent of GDP in the same year-ago period (national methodology). For 2013, the government envisages to bring the defi cit down to 2.4 percent of GDP (according to ESA95 methodology), or 2.3 percent of GDP (according to national methodology), in line with the expectations8. The fulfi lment of commitments taken under the fi nancing arrangement signed with the international fi nancial institutions led to the narrowing of the budget defi cit below 3 percent of GDP in 2013 and, as a result, the EU Council approved the abrogation of the excessive defi cit procedure for Romania in June 20139.
Structural budget defi cit showed the same tendency, narrowing to 2.7 percent of GDP in 2012 from 4 percent of GDP in 2011, and the forecasts indicate further decline to 1.7 of GDP in 201310. Structural fi scal defi cit dynamics are consistent with Romania’s commitments to ensure a long-term sustainable policy, envisaging a 1 percent of GDP structural defi cit target as of 2014, in line with the framework for ensuring economic governance at EU level, maintaining macrostability and encouraging economic growth. In order to fulfi l this objective, specifi c and detailed measures were established in the fi scal-policy strategy11.
Public fi nance sustainability is refl ected by the developments in and composition of public debt. First, the public debt-to-GDP ratio has remained well below the 60 percent reference value in the Treaty on European Union and one of the lowest readings across the EU. The upward trend of this indicator, manifest since 2008, saw a reversal in the fi rst part of 2013, public debt declining from 37.8 percent of GDP in 2012 to 37 percent of GDP in May 2013 in ESA95 terms (Chart 4.4.).
Second, the changes that occurred in the composition of public debt since the release of the previous report strengthen the authorities’ capacity to cope with adverse developments: (i) in 2012, the Romanian government started to issue USD-denominated bonds, thus diversifying its investor base (these bond issues currently account for 7.4 percent of total public debt); (ii) the maturity breakdown remains comfortable (the share of medium- and long-term debt widened to 85 percent of total debt in 2012 and 92 percent in May 2013, from 77 percent in 2011); (iii) the share of lei-denominated public debt remains elevated at 41 percent in May 2013, down slightly against 2011, and (iv) the bulk of sovereign debt is held by residents. Non-resident investors’ participation in the domestic market for government securities (in lei and euro) went up sharply in 2012 and the fi rst seven months of 2013 (these investors accounted for 24.5 percent of the securities outstanding at end-July 2013, compared with 14 percent at end-2012 and 11.7 percent at end-2011). Although on an upward trend, the share of non-residents’ holdings in total government securities on the domestic market remained well below
8 The European Commission anticipates a fi scal defi cit of 2.6 percent of GDP (European Economic Forecast, Spring 2013).
9 Concurrently with the statement released on Romania, the EC Council announced the abrogation of the excessive defi cit procedure for Italy, Latvia, Lithuania, and Hungary, following its June 2013 decision to extend this procedure for Spain, France, the Netherlands, Poland, Portugal and Slovenia. Romania entered the excessive defi cit procedure in 2009.
10 European Commission Economic Forecast, Spring 2013.11 The objectives regarding fi scal policy, agreed upon with the signature of the Fiscal Compact, are implemented into the
national legislation by the Fiscal Responsibility Law No 69/2010 regulating the fi scal policy strategy. This strategy establishes quantitative targets for a future three-year period that are implemented under additional laws and submitted for analysis to the Fiscal Council (Law No 4/2013 approving ceilings for indicators mentioned in the fi scal policy framework, as later amended, establishes targets for 2013 and 2014).

FINANCIAL STABILITY REPORT 2013 95
4 Risks related to domestic economic and fi nancial developments
the levels seen in other countries in the region (53 percent in Hungary and 36 percent in Poland, in July 2013). The increased volume of non-residents’ holdings of leu-denominated government securities may heighten exchange rate volatility, negatively impacting on infl ation and interbank market rates, given potential signifi cant capital outfl ows from the domestic market. Among resident entities, the Romanian banking sector is the leading fi nance-provider of the government sector. This reiterates the importance of continuing the fi scal consolidation process, so as to avoid the crowding-out of the private sector in the future, given that the loan demand from non-fi nancial corporations and households is to be resumed, while the deleveraging process will squeeze the banks’ funds available for lending (the share of government exposures in the banks’ balance sheets stood at 18.5 percent in August 2013, up 0.8 percent against December 2011, Chart 4.5.).
Chart 4.4. Public debt and its composition Chart 4.5. Bank lending to the public and non-fi nancial corporate sectors
0
10
20
30
40
50
0
50
100
150
200
250
2008 2009 2010 2011 2012 May2013
local government debtcentral government debt - long termcentral government debt - short termpublic debt (% of GDP, rhs)
lei bn. percent
Source: MPF, NIS
0
5
10
15
20
25
30
35
Apr
.200
9A
ug.2
009
Dec
.200
9A
pr.2
010
Aug
.201
0D
ec.2
010
Apr
.201
1A
ug.2
011
Dec
.201
1A
pr.2
012
Aug
.201
2D
ec.2
012
Apr
.201
3A
ug.2
013
public sector (% of total bank assets)real sector (% of total bank assets)
percent
Source: NBR
Third, with a view to avoiding any pressures stemming from the volatility of fi nancing conditions, the Romanian government moved to establish a foreign currency fi scal buffer as early as 2010, so that budget fi nancing requirements are met for a period of at least four months. The government intends to preserve it in the years ahead as well.
Therefore, even amid the rise in external debt service in 2013-2015, due to repayments of loans taken from the EU and the IMF in the previous years (Chart 4.6.), the public debt service puts forward a sustainable profi le. In order to preserve the results gained in recent years in terms of fi scal consolidation and public debt management, the authorities undertook to carry on with the measures designed to: (i) adjust and streamline budget expenditures; (ii) consolidate revenues and cut tax evasion; (iii) maintain the fi scal buffer so as to cover fi nancing needs for a four-month period, and (iv) move to a multiannual budgetary framework. In order to increase the effi ciency of tax collection, corroborated with the fi ght against tax evasion, Romania, in partnership with the World Bank, has launched a project for modernising fi scal administration.
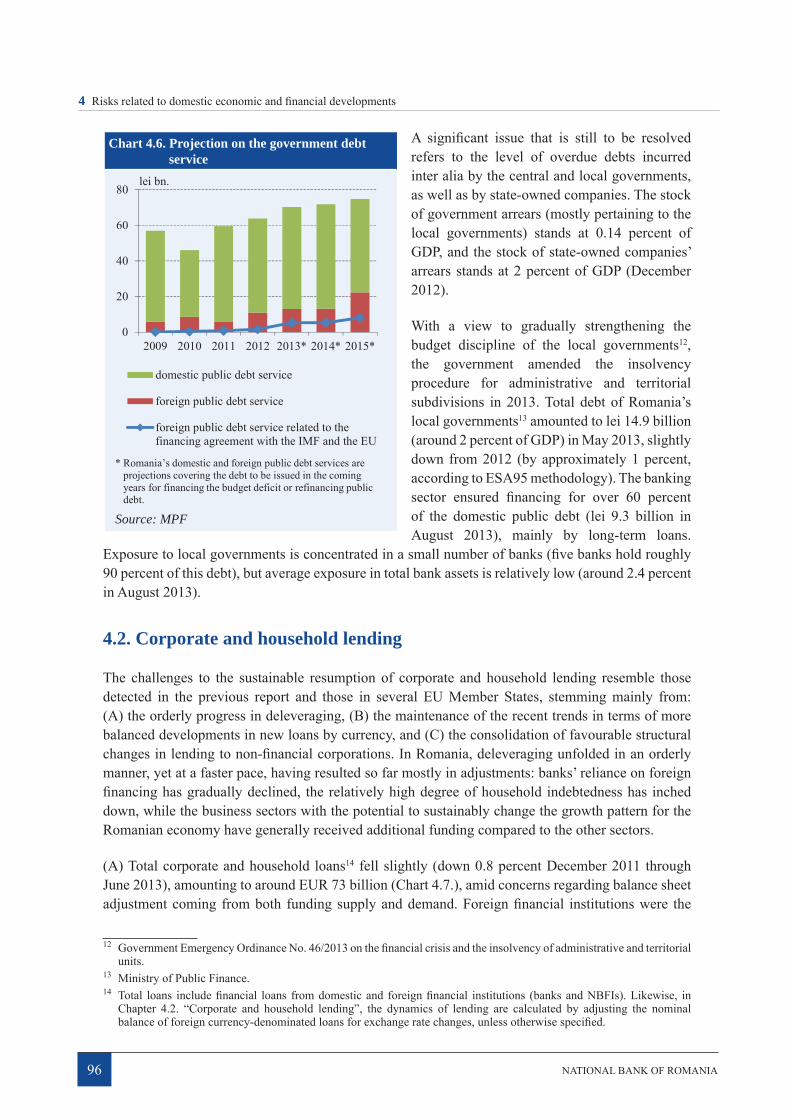
NATIONAL BANK OF ROMANIA96
4 Risks related to domestic economic and fi nancial developments
A signifi cant issue that is still to be resolved refers to the level of overdue debts incurred inter alia by the central and local governments, as well as by state-owned companies. The stock of government arrears (mostly pertaining to the local governments) stands at 0.14 percent of GDP, and the stock of state-owned companies’ arrears stands at 2 percent of GDP (December 2012).
With a view to gradually strengthening the budget discipline of the local governments12, the government amended the insolvency procedure for administrative and territorial subdivisions in 2013. Total debt of Romania’s local governments13 amounted to lei 14.9 billion (around 2 percent of GDP) in May 2013, slightly down from 2012 (by approximately 1 percent, according to ESA95 methodology). The banking sector ensured fi nancing for over 60 percent of the domestic public debt (lei 9.3 billion in August 2013), mainly by long-term loans.
Exposure to local governments is concentrated in a small number of banks (fi ve banks hold roughly 90 percent of this debt), but average exposure in total bank assets is relatively low (around 2.4 percent in August 2013).
4.2. Corporate and household lending
The challenges to the sustainable resumption of corporate and household lending resemble those detected in the previous report and those in several EU Member States, stemming mainly from: (A) the orderly progress in deleveraging, (B) the maintenance of the recent trends in terms of more balanced developments in new loans by currency, and (C) the consolidation of favourable structural changes in lending to non-fi nancial corporations. In Romania, deleveraging unfolded in an orderly manner, yet at a faster pace, having resulted so far mostly in adjustments: banks’ reliance on foreign fi nancing has gradually declined, the relatively high degree of household indebtedness has inched down, while the business sectors with the potential to sustainably change the growth pattern for the Romanian economy have generally received additional funding compared to the other sectors.
(A) Total corporate and household loans14 fell slightly (down 0.8 percent December 2011 through June 2013), amounting to around EUR 73 billion (Chart 4.7.), amid concerns regarding balance sheet adjustment coming from both funding supply and demand. Foreign fi nancial institutions were the
12 Government Emergency Ordinance No. 46/2013 on the fi nancial crisis and the insolvency of administrative and territorial units.
13 Ministry of Public Finance.14 Total loans include fi nancial loans from domestic and foreign fi nancial institutions (banks and NBFIs). Likewise, in
Chapter 4.2. “Corporate and household lending”, the dynamics of lending are calculated by adjusting the nominal balance of foreign currency-denominated loans for exchange rate changes, unless otherwise specifi ed.
Chart 4.6. Projection on the government debt service
0
20
40
60
80
2009 2010 2011 2012 2013* 2014* 2015*
domestic public debt service
foreign public debt service
foreign public debt service related to thefinancing agreement with the IMF and the EU
lei bn.
* Romania’s domestic and foreign public debt services areprojections covering the debt to be issued in the comingyears for financing the budget deficit or refinancing publicdebt.
Source: MPF

FINANCIAL STABILITY REPORT 2013 97
4 Risks related to domestic economic and fi nancial developments
sole category of creditors that decided to increase their exposure to the domestic private sector15, i.e. up 2.9 percent in the period December 2011 – June 2013. Although domestic banks and NBFIs further extended loans to certain economic sectors, their total lending to the private sector declined as a whole (down 1.2 percent in the case of banks and 9.9 percent in that of NBFIs in the same period, with values adjusted for exchange rate changes16). In June 2013, the ranking of the fi nancial creditors of companies and households revealed that their debt was held as follows: over two thirds (67.7 percent) – resident banks, roughly a quarter (25.8 percent) – foreign creditors and the rest (6.5 percent, i.e. half of the 2008 fi gure) – resident NBFIs. The breakdown by currency shows that only lei-denominated loans to companies witnessed positive annual growth rates in nominal terms, whereas foreign currency lending posted negative dynamics as of the latter half of 2012 (Chart 4.8.).
Chart 4.7. Total corporate and household loans by creditor and currency
Chart 4.8. Growth rate of total loans granted to companies and households by domestic and foreign fi nancial institutions (nominal annual change)
0
10
20
30
40
50
60
70
80
Dec
.200
9
Dec
.201
0
Dec
.201
1
Dec
.201
2
Jun.
2013
loans from non-resident financial institutionsfx loans from resident NBFIsloans in lei from resident NBFIsfx loans from resident banksloans in lei from resident banks
EUR bn.
Source: NBR, NBR calculations
-10
0
10
20
30
40
50
60M
ar.2
009
Jun.
2009
Sep.
2009
Dec
.200
9M
ar.2
010
Jun.
2010
Sep.
2010
Dec
.201
0M
ar.2
011
Jun.
2011
Sep.
2011
Dec
.201
1M
ar.2
012
Jun.
2012
Sep.
2012
Dec
.201
2M
ar.2
013
Jun.
2013
percent
companies leicompanies fx*households leihouseholds fx*
* series adjusted for exchange rate changes
Note: Series are calculated as a 3-month movingaverage.
Source: NBR, NBR calculations
The developments in funding supply for the domestic private sector rely on the pace of deleveraging at EU level. The European banking groups further evinced a trend towards deleveraging, taking measures to scale down their assets as of the latter half of 2012, after they had reduced the leverage ratio mainly via increased capitalisation. There are heterogeneous estimates on the magnitude of future deleveraging in the case of large European banking groups: the IMF17 forecasts around USD 1.5 trillion in 2012 Q4 – 2013 Q4, while the ECB18 forecasts range between EUR 20 billion and EUR 1.3 trillion in 2013-2014.
15 In this subchapter, private sector shall refer to non-fi nancial corporations and households. 16 In nominal terms, domestic banks increased their loans to companies and households by 0.8 percent December 2011
through June 2013, while domestic NBFIs reduced this exposure by 7.7 percent in the same period.17 IMF, Global Financial Stability Report, April 2013.18 ECB, Financial Stability Review, May 2013.

NATIONAL BANK OF ROMANIA98
4 Risks related to domestic economic and fi nancial developments
These developments across the European banking sector had a mixed impact on Romanian entities: European banks’ exposures to the domestic non-fi nancial private sector continued to rise, whereas those to the Romanian banking sector decreased. December 2011 through August 2013, domestic banks’ funding from parent banks (accounting for over 80 percent of their foreign fi nancing) lost 26.2 percent. Domestic banks altered their business model with respect to their funding structure in order to offset the aforementioned decline, causing their reliance on foreign sources (foreign fi nancing as a share in total assets) to adjust from 26.5 percent to 21.4 percent in the period December 2011 – August 2013. At the same time, banks tapped domestic resources to a larger extent, thereby partly making up for the foreign fi nancing withdrawal. This led to an improved loan-to-deposit ratio for the non-government sector, i.e. from 119.1 percent in December 2011 to 109 percent in August 2013 (Chart 4.9.), pressing however domestic saving, which can increase only gradually, over a longer-term horizon.
Chart 4.9. Loan-to-deposit ratio for the non-government sector by currency
Chart 4.10. Loan-to-deposit ratio for the non-government sector – regional comparisons
160
170
180
190
200
210
220
230
240
60
70
80
90
100
110
120
130
140
Feb.
2009
May
.200
9A
ug.2
009
Nov
.200
9Fe
b.20
10M
ay.2
010
Aug
.201
0N
ov.2
010
Feb.
2011
May
.201
1A
ug.2
011
Nov
.201
1Fe
b.20
12M
ay.2
012
Aug
.201
2N
ov.2
012
Feb.
2013
May
.201
3A
ug.2
013
LTD totalLTD leiLTD fx (rhs)
percent percent
Source: NBR, NBR calculations
100
110
120
130
140
150
160A
pr.2
009
Jul.2
009
Oct
.200
9Ja
n.20
10A
pr.2
010
Jul.2
010
Oct
.201
0Ja
n.20
11A
pr.2
011
Jul.2
011
Oct
.201
1Ja
n.20
12A
pr.2
012
Jul.2
012
Oct
.201
2Ja
n.20
13A
pr.2
013
Jul.2
013
percent
Bulgaria HungaryPoland RomaniaEU-27
Source: ECB, NBR calculations
The adjustment of the loan-to-deposit ratio of the Romanian banking sector is in line with regional developments (Chart 4.10.) and will most likely carry on, as the indicator ranks among the highest in the region, i.e. 110.5 percent versus the EU average of 105.8 percent, in July 2013. The loan-to-deposit ratio in the EU may remain on a downtrend over the medium term, as supported by the previous experiences with global banking crises. Under the circumstances, the change in the management of fi nancial resources within banking groups through the increased focus on domestic funds for the extension of new loans is benefi cial to fi nancial stability in host countries in the long run, but its implementation should proceed gradually and take into account that the volume of funds that can be raised on the domestic market is limited, given the relatively low domestic saving. Reducing the mismatch between loans and deposits via host-country banks keeping higher than usual deposit rates may impact lending through the relative rigidity of interest margins, which limits the downward adjustment of interest rates on new loans.

FINANCIAL STABILITY REPORT 2013 99
4 Risks related to domestic economic and fi nancial developments
December 2011 through August 2013, at the level of the domestic banking sector the adjustment of the loan-to-deposit ratio did not entail any signifi cant constraints in terms of deposit rate-related costs. The LTD ratio declined largely on the back of the foreign currency component (from 225.3 percent to 188.9 percent in the period December 2011 – August 2013), whereas the lei-denominated component witnessed a marginal drop (from 65.6 percent to 64.4 percent in the same period). The improved ratio owes particularly to the higher volume of deposits raised (up 8.7 percent in December 2011 – August 2013) and, to a lower extent, to a contraction in the loans granted (down 0.5 percent in nominal terms during the same period).
The demand for loans saw the same efforts towards balance sheet adjustment as well. Both companies and households are in a stage characterised by lower appetite for taking on new debt by the time they repay, to a certain extent, that already incurred. Households show a relatively high degree of indebtedness and currently grapple with diffi culties servicing their debt following last years’ euphoria over taking loans. This is all the more so as many of the goods purchased by credit are worth far less than the debt still to be repaid. The collateral used also posted an unfavourable development from the point in time when the loans were granted, as it is mostly real estate collateral, being impacted by price adjustments (for further details, see Chapter 5.2. “Risks stemming from the households’ sector”). As for non-fi nancial corporations, although the indebtedness situation is more nuanced, the substance of the matter may remain the same. The degree of indebtedness of Romanian companies saw a steadfast increase since the outbreak of the crisis and certain business sectors incurred signifi cant debt (as a share in equity). Moreover, certain companies tend to manage their debts by implementing measures to the detriment of creditors, either because of their being constrained by the currently unfavourable circumstances or in a deliberate manner (for further details, see Chapter 5.1. “Risks generated by non-fi nancial corporations”).
The efforts of loan demand and supply towards balance sheet adjustment are directly refl ected by lending. Thus, the loan supply conditions have tightened since the release of the previous report in the case of both companies (as of 2013 Q1) and households, in line with similar developments in the euro area (Chart 4.11.). Banks account for the tighter lending standards for companies through the signifi cantly higher credit risk and, as of 2013 Q1, through the NBR’s decisions related to Regulation No. 17/2012 on certain lending conditions that included the recommendations made by the European Systemic Risk Board on foreign currency lending to unhedged borrowers. Loan demand from households remained usually in the negative territory during 2012 and in 2013 H1, in line with the ongoing deleveraging mentioned as a trend in the previous Financial Stability Reports, whereas that from companies reported a slight rise, especially with respect to short-term loans (Chart 4.12.).

NATIONAL BANK OF ROMANIA100
4 Risks related to domestic economic and fi nancial developments
Chart 4.11. Lending standards Chart 4.12. Loan demand
-50
-25
0
25
50
75
100
2008
Q1
2008
Q4
2009
Q3
2010
Q2
2011
Q1
2011
Q4
2012
Q3
2013
Q2
2008
Q1
2008
Q4
2009
Q3
2010
Q2
2011
Q1
2011
Q4
2012
Q3
2013
Q2
2008
Q1
2008
Q4
2009
Q3
2010
Q2
2011
Q1
2011
Q4
2012
Q3
2013
Q2
Corporate loans Household realestate loans
Consumer loans
Romania euro area
balance of answers - percent
Note: A positive balance of answers indicatestighter lending standards.
-100
-80
-60
-40
-20
0
20
40
60
80
2008
Q1
2008
Q4
2009
Q3
2010
Q2
2011
Q1
2011
Q4
2012
Q3
2013
Q2
2008
Q1
2008
Q4
2009
Q3
2010
Q2
2011
Q1
2011
Q4
2012
Q3
2013
Q2
2008
Q1
2008
Q4
2009
Q3
2010
Q2
2011
Q1
2011
Q4
2012
Q3
2013
Q2
Corporate loans Household realestate loans
Consumer loans
Romaniaeuro area
balance of answers - percent
Note: A positive balance of answers indicatesa higher loan demand.
Source: NBR – The Survey on lending to non-fi nancial corporations and households, August 2013; ECB – The Euro Area Bank Lending Survey, July 2013.
(B) The large stock of foreign currency-denominated loans is a vulnerability of the domestic banking sector originating particularly in the lending boom, but which has started to lower. An analysis of the destination of foreign currency loans explains corporate and household indebtedness behaviour to a certain extent, as the aforementioned loans were mostly real estate loans in the case of both sectors (Chart 4.13.). Prospects are for the stock of foreign currency-denominated loans to continue to decline, concurrently with the rise in the lei-denominated one. Since the release of the previous report, fewer foreign currency loans were granted, so that the share of new EUR-denominated loans extended by domestic banks narrowed to 44.7 percent in 2012 and to 39.1 percent of the new total fl ow of loans to companies and households in January-August 2013 (versus 52.5 percent in 2011). These trends supported the adjustment of the share held by foreign currency loans in the stock of corporate and household loans to 62.3 percent in August 2013 from 63.7 percent in December 2011. Nevertheless, Romania further ranks among the EU Member States with higher levels of foreign currency lending, together with Latvia – over 80 percent, Lithuania – over 70 percent, Bulgaria – around 64 percent and Hungary – about 54 percent.

FINANCIAL STABILITY REPORT 2013 101
4 Risks related to domestic economic and fi nancial developments
Chart 4.13. Loans granted by domestic banks and NBFIs by destination and currency
0
2
4
6
8
10
12
2009
2010
2011
2012
Jul.2
013
2009
2010
2011
2012
Jul.2
013
2009
2010
2011
2012
Jul.2
013
2009
2010
2011
2012
Jul.2
013
Treasury loans Inventory andequipment
purchase loans
Real estateloans
Other
fx lei
EUR bn.
Source: CCR, NBR calculations
a) non-financial corporations
0
2
4
6
8
10
12
14
2009
2010
2011
2012
Jun.
2013
2009
2010
2011
2012
Jun.
2013
2009
2010
2011
2012
Jun.
2013
Mortgage loans Mortgage-backedconsumer loans
Non-mortgagebacked consumer
loans
fx lei
EUR bn.
Source: Monetary survey, balance sheets of NBFIs, CCR, Credit Bureau, NBR calculations
b) households
The enforcement of the NBR Regulation on loans to households19 as of October 2011 also contributed to the more balanced developments in new loans by currency. The fl ow of new EUR-denominated loans shrank: (i) considerably in the case of consumer loans (from 35.7 percent in 2011 to 17.1 percent in 2012 and 10.3 percent in January-August 2013) and (ii) to a lesser extent when looking at housing loans (from 97.8 percent in 2011 to 91.9 percent in 2012 and 86.4 percent in January-August 2013). The implementation of the “First Home” programme solely for lending in domestic currency as of the closing period of 2013 and the lower interest rates on lei-denominated credit, also in response to the central bank’s decisions to cut the monetary policy rate by a cumulated 100 basis points July through September 2013, are likely to help improve, in time, the currency composition of housing loans as well.
Foreign currency lending also accounted for a decreasing share in the total fl ow of new loans to companies (42.7 percent in 2012 and 36.2 percent in January-August 2013 versus 51.2 percent in 2011). This trend is expected to continue amid the introduction of a 2012 NBR regulation20 on foreign currency lending to unhedged non-fi nancial corporations that shall apply to all credit institutions and NBFIs, Romanian legal entities (registered with the Special Register), as well as to foreign bank branches. The said regulation specifi es that foreign currency-denominated loans and loans indexed to an exchange rate shall be granted only to the extent that, in accordance with the criteria laid down in creditors’ own regulations, companies evince a good repayment capacity of foreign currency credit, even if the currency their income is denominated in or indexed to witnesses a sharp depreciation or the lending rate increases, respectively.
19 NBR Regulation No. 24 of 28 October 2011.20 NBR Regulation No. 17 of 12 December 2012.

NATIONAL BANK OF ROMANIA102
4 Risks related to domestic economic and fi nancial developments
The measures taken by the NBR with respect to corporate lending are warranted by both the level of risks associated with the foreign currency loan portfolio and the need of harmonisation with the best practices related to fi nancial stability that were set forth within the recommendations of the European Systemic Risk Board (ESRB). The volume of non-performing corporate loans in foreign currency soared 73.7 percent December 2011 through August 2013, while that of non-performing loans in lei expanded by 53 percent during the same period. After reaching 4.3 percentage points at end-2011, the gap between NPL ratios in domestic and foreign currencies was bridged in August 2013, when they came in at 23.4 percent and 23.5 percent respectively. The corporate sector is exposed to the currency risk to a signifi cant extent as only a small number of companies derive foreign currency income from their exports. In June 2013, companies that are not naturally hedged21 accounted for 93.5 percent of the companies with foreign currency-denominated loans and their foreign currency loan portfolio held 76.7 percent of total domestic and external corporate loans. Their NPL ratio is higher than both the corporate sector average, i.e. 24.1 percent versus 22 percent in June 2013, and that of naturally hedged companies (9.3 percent in June 2013), while their economic and fi nancial performance is weaker. The credit risk of companies with loans in foreign currency is also highlighted by their high gross foreign currency position22 (101.4 percent of equity in December 2012). Thus, the gross foreign currency position of unhedged companies is about three times larger than that of hedged companies, i.e. 142.7 percent against 54.3 percent in December 2012.
The NBR regulation may exert a signifi cant impact on unhedged borrowers over the short term. Foreign currency-denominated loans with maturity shorter than one year granted to unhedged companies play an important part both in terms of volume, i.e. EUR 13.1 billion, and as a share in total loans in foreign currency (38.3 percent in June 2013, Chart 4.14.). About half of these foreign currency-denominated short-term loans are granted directly by European banks. Should these loans be rolled over still into loans in foreign currency, lending conditions need to be tighter, similar to those in the home country of the respective unhedged company (according to the ESRB recommendations). Therefore, certain conditions are in place for at least some of these companies to look for domestic currency funding from domestic banks. In addition, lei-denominated fi nancing costs should decline given: (i) the NBR’s decisions to signifi cantly cut the monetary policy rate (by a cumulated 100 basis points since the release of the previous report), and that (ii) the risk premium set by banks for hedged borrowers should be considerably lower than that set for unhedged borrowers.
21 Naturally hedged non-fi nancial corporations were defi ned as the companies whose exports accounted for at least 20 percent of their currency exposure (domestic and external loans in foreign currency from banks and NBFIs). Data related to the 2012 exports and lending in June 2013 were used. All the other non-fi nancial corporations that took foreign currency-denominated loans and do not meet this criterion are not naturally hedged companies. Nevertheless, some of them may be fi nancially hedged via various fi nancial instruments or contractual provisions. However, this information is not available.
22 The gross foreign currency position is computed as a ratio of total loans in foreign currency (both domestic and external loans, intra-group loans included) taken by all companies to their equity.

FINANCIAL STABILITY REPORT 2013 103
4 Risks related to domestic economic and fi nancial developments
Chart 4.14. Foreign currency-denominated loans to companies not naturally hedged by residual maturity (June 2013)
Chart 4.15. Contribution to value added and employment in the non-fi nancial corporate sector (2012) by funding source as at June 2013
0
5
10
15
20
25
30
FFI* Banks NBFIs FFI* Banks NBFIs
Companies -total loans
Companies notnaturally hedged -
fx loans
medium and long term
short term
EUR bn.
* foreign financial institutions
Source: NBR, NBR calculations
0
10
20
30
40
50
60
70
80
0
3
6
9
12
15
18
21
24
Banks Banksand
NBFIs
Banksand
externaldebt
Externaldebt
Other
share of GVAshare of employeesno. of companies (rhs)
percent thou.
Source: NBR, MPF, NBR calculations
(C) Along with the sustainable resumption of lending, including via more balanced loan developments by currency, (C1) an improved relationship between lending and value added in the economy and (C2) the consolidation of sustainable structural changes in banks’ business model with respect to lending to non-fi nancial corporations are also necessary.
(C1) The direct relationship between household lending and value added in the economy points to low effi ciency. Consumer loans were used to purchase largely imported goods (motor cars, household appliances, etc.). As for companies, the aforementioned relationship is stronger. However, the lending structure has favoured companies in the non-tradable sectors, especially in the years of economic expansion, with loans to such companies currently holding the larger share, i.e. 65.9 percent of total loans to non-fi nancial corporations in June 2013. Moreover, companies made low recourse to domestic bank funding in their economic activity. Thus, (i) a small number of companies had outstanding loans from Romanian banks, i.e. 13 percent of operating companies23 in December 2012, and (ii) the loans from domestic banks have a low share in total funding sources, accounting for 9.6 percent of total balance sheet liabilities of non-fi nancial corporations as compared with capital contributions from shareholders, which are almost three times larger (26.5 percent of total liabilities in December 2012). Domestic banks should play a more important role in real sector funding in appropriate conditions. In fact, non-resident creditors extended loans to companies to a larger extent than domestic banks, with the loans taken from foreign banks and parent companies amounting to EUR 36 billion (June 2013), while those from Romanian banks totalled EUR 26 billion (June 2013).
A large number of companies, i.e. around 77,000, took only domestic loans24. They account for 33.6 percent of the value added by non-fi nancial corporations as a whole and employ 36.2 percent of 23 Companies that submitted their balance sheets to the Ministry of Public Finance in 2012.24 In this chapter, companies with domestic loans shall refer to companies that took loans from domestic banks or possibly
in tandem with loans from NBFIs, but not external loans or intra-group loans.

NATIONAL BANK OF ROMANIA104
4 Risks related to domestic economic and fi nancial developments
the staff in this sector (December 2012, Chart 4.15.). These companies were extended a signifi cant stock of loans by domestic banks, tantamount to lei 89.7 billion, i.e. 77.5 percent of the balance of loans to non-fi nancial corporations in June 2013. There are around 7,000 companies that took only external loans (from either banks or parent companies) or a mixture of foreign and domestic funding and they made a similar contribution to value added as those in the fi rst category, i.e. 28.7 percent of total value added, employing however less than half of the latter’s staff, i.e. 14.8 percent of total employees.
Lending to companies impacts economic growth, but to various degrees depending on their business sectors. For instance, companies in agriculture that took domestic loans account for around 52 percent of the value added by all the companies in the aforementioned sector. Conversely, the corresponding businesses in the real estate sector contributed about 20 percent of the total value added in the respective sector in December 2012.
(C2) The need to ensure companies’ better access to funding should be further accompanied by a favourable structure of fl ows of new loans to non-fi nancial corporations. Over the last years, tendencies to change banks’ business model have taken shape, with a stronger focus on the corporate sector, to the detriment of fi nancing households, as their relatively high degree of indebtedness and the prospects for the related ongoing deleveraging warrant moderate developments in lending to this sector in the future as well. During December 2011 – June 2013, the loans granted by domestic and foreign banks and NBFIs to companies increased by 0.5 percent, whereas those to households declined by 3.1 percent. Foreign creditors were the sole to account for the rise in corporate sector lending (+4.9 percent). Lei-denominated corporate loans extended by domestic banks rose by 9.5 percent. However, the decline in the stock of foreign currency loans (down 6.2 percent) caused banks’ total exposure to narrow by 0.3 percent (adjusted for the exchange rate effect).
In terms of quality, corporate funding witnessed favourable structural developments December 2011 through June 2013, the most noteworthy being: (i) lending to fi rms producing high value added goods (medium high-tech and high-tech) went up 4.3 percent, whereas the volume of loans granted to companies producing lower value added goods (low-tech and medium low-tech) contracted 1 percent; (ii) companies in the tradable sectors reported a 0.6 percent rise in fi nancing, while the non-tradable sectors posted a decline of 1.1 percent; and (iii) looking at the business profi le, agriculture reported a 20.9 percent increase in funding, followed by trade and manufacturing, with an advance of 3.3 percent and 0.6 percent respectively. Conversely, lending to knowledge-intensive services companies dropped 6.2 percent, while the volume of funds channelled to less knowledge-intensive services companies stood 0.2 percent lower.
Eligible SMEs’ access to funding is further a challenge, the same as in most European countries, and represents a priority of EU policy strategies with a view to resuming sustainable economic growth. December 2011 through June 2013, domestic SMEs received additional fi nancing from domestic and foreign creditors (up 0.9 percent), with loans extended by domestic banks posting the fastest dynamics (2.5 percent, Chart 4.16.). During the same period, the number of SMEs with onstanding loans rose marginally (up 0.8 percent, namely approximately 600), remaining however clearly below that reported in December 2008, i.e. 77,500 versus 91,200, consistent with the existence of a credit channel in Romania’s economy favouring large companies with a higher volume of assets, longer relations with creditors and substantial cash fl ows.

FINANCIAL STABILITY REPORT 2013 105
4 Risks related to domestic economic and fi nancial developments
Chart 4.16. Loans to SMEs and large companies from resident banks and NBFIs and non-resident banks
0
1
2
3
4
5
6
7
8
Jun.
2008
Jun.
2009
Jun.
2010
Jun.
2011
Jun.
2012
Jun.
2013
Jun.
2008
Jun.
2009
Jun.
2010
Jun.
2011
Jun.
2012
Jun.
2013
Jun.
2010
Jun.
2011
Jun.
2012
Jun.
2013
Jun.
2008
Jun.
2009
Jun.
2010
Jun.
2011
Jun.
2012
Jun.
2013
Jun.
2008
Jun.
2009
Jun.
2010
Jun.
2011
Jun.
2012
Jun.
2013
Jun.
2010
Jun.
2011
Jun.
2012
Jun.
2013
Resident banks Non-residentbanks
NBFIs Resident banks Non-residentbanks
NBFIs
SMEs Large companies
agriculturemanufacturing and miningservices and utilitiesreal estate and constructiontrade
EUR bn.
Source: NBR, NBR calculations
4.3. External balance
4.3.1. Current account defi cit
Since the release of the previous report, the developments in the current account and foreign trade companies highlight three main challenges: (A) to strengthen the sustainability of the current account defi cit, (B) to preserve the ability of Romanian foreign trade companies to stand up to challenges on the external markets, and (C) to ensure a larger weight of such companies, particularly exporting ones, in domestic banks’ loan portfolios.
(A) The current account defi cit kept on adjusting in 2012 and in the fi rst part of 2013 and is expected to narrow to 2-2.5 percent of GDP in 2013-201425. The last three-year (2010-2012) moving average of the current account defi cit (the scoreboard indicator monitored by the European Commission in the Alert Mechanism Report for the prevention and correction of macroeconomic imbalances in the EU) stands at 4.3 percent of GDP, remaining slightly above the indicative threshold of 4 percent. In 2012, the current account defi cit in Romania accounted for 3.9 percent of GDP (Chart 4.17.), so that there are prospects for the European Commission’s alert indicator to go below the indicative threshold starting 2013. The signifi cant additional adjustment of the current account balance in January-June 2013 (EUR 3.5 billion), which resulted in a EUR 0.65 billion surplus accounting for 1.1 percent of GDP (as compared with a EUR 2.8 billion defi cit in the same year-ago period), is also in favour of the aforementioned conclusion.
25 Statement by the IMF and the EC on Joint Discussions on a New Economic Program for Romania, as published on 31 July 2013, http://www.imf.org/external/np/sec/pr/2013/pr13286.htm

NATIONAL BANK OF ROMANIA106
4 Risks related to domestic economic and fi nancial developments
Chart 4.17. Current account developments in EU-10 – total and components
Chart 4.18. Trade balance of goods by technological intensity26
-15
-10
-5
0
5
10
15
20
2011
2012
2011
2012
2011
2012
2011
2012
2011
2012
2011
2012
BG HU PL SK RO* EU-10
goods servicesincome current transferscurrent account
percent of GDP
Source: Eurostat, NBR calculations*) according to domestic sources
-16
-14
-12
-10
-8
-6
-4
-2
0
2
2007 2008 2009 2010 2011 2012 2013Q1
low-techmedium low-techmedium high-techhigh-techother
percent of GDP
Note: The microeconomic database for foreign tradehas a 97 percent coverage in macroeconomicdata.
Source: Eurostat, NIS, NBR calculations 26
Export breakdown points to three elements that call for a close monitoring. First, even though Romania’s exports will necessarily remain channelled mostly towards its EU trading partners, the diversifi cation of external markets would relatively reduce the vulnerabilities to the negative developments seen notably in a certain area. The economic picture in most EU Member States is further unfavourable to domestic exports. In 2012, euro area economic growth stood at -0.6 percent, with the 2013 forecast remaining negative (-0.4 percent27), while Romania’s exports to this area account for a signifi cant share in total exports, i.e. 51.6 percent in 2012. Domestic companies proved somewhat fl exible in redirecting their export fl ows to countries enjoying better prospects for economic growth, so that December 2011 through March 2013 the share of Romania’s exports to the euro area declined by 1.4 percentage points from 2011. During the same period, the weights of exports to Italy and France lost 0.7 percentage points (to 12 percent) and 0.4 percentage points (to 7 percent) respectively, whereas those of sales to the United Kingdom and Germany added 0.6 percentage points (to 3.8 percent) and 0.3 percentage points (to 18.8 percent) respectively. Overall, between December 2011 and March 2013 exports to the non-EU regions saw an increase. In the same period, export breakdown shows higher shares of sales to countries in Northern Africa28 and the BRICS29 than in 2011 (up 1 percentage point, to 2.8 percent, and 0.2 percentage points, to 4.4 percent respectively), while that of exports to the Middle East30 became slightly lower (down 0.5 percentage points, to 3.2 percent).
26 “Other” includes goods that are not classifi ed in divisions 10-33 under manufacturing based on NACE Rev. 2.27 According to the European Commission Economic Forecast, Spring 2013.28 Egypt, Libya, Morocco, Tunisia and Algeria.29 Brazil, Russia, India, China and South Africa.30 Bahrain, Iran, Iraq, Israel, Jordan, Kuwait, Lebanon, Oman, Qatar, Saudi Arabia, Syria, the United Arab Emirates and
Yemen.

FINANCIAL STABILITY REPORT 2013 107
4 Risks related to domestic economic and fi nancial developments
Second, the diversifi cation of external fl ows also takes into account the breakdown of domestic exports. Thus, the share of components with high value added and innovative technology needs to widen, with high-tech goods31 playing an increasing role, as these Romanian industries proved their capacity to weather the crisis better than other sectors – their weight in total value added rose, amid above-average profi t margins and considerable investment efforts. Medium high-tech goods32 hold the highest share in domestic companies’ exports, having advanced markedly of late, to 41.5 percent in March 201333, up over 3 percentage points against December 2011. These goods performed best in 2013 Q1, accounting for a trade surplus of 0.5 percent of GDP (Chart 4.18.). On the other hand, in 2012 high-tech goods posted the largest trade defi cit among the goods classifi ed by technological intensity, i.e. 2.3 percent of GDP. Capital goods take a signifi cant weight in imports of high-tech goods, so that the defi cit thus generated is the result of an ongoing overhaul, even though it was not associated with a larger fl ow of foreign direct investment. Exports of high-tech goods embarked on a downtrend as a share in Romania’s exports (from 10.7 percent in December 2011 to 8 percent in March 2013).
Third, exports show a relatively high concentration degree, which could put some constraints on preserving a sustainable current account defi cit should any of the businesses enjoying signifi cant exports (most often part of a multinational foreign-owned company) decide to withdraw from Romania. The top 20 companies that generate trade surplus make an approximately 3.5 percent of GDP contribution to the current account balance, i.e. 29.9 percent of the trade surplus of exporters as a whole in 2012. These companies are important to the economy as well, as they account for 2.9 percent of the value added by non-fi nancial corporations as a whole and employ 1.3 percent of the latter’s staff (December 2012).
As for imports, the companies that contribute to trade defi cit are largely heterogeneous. Special mention should be made of the occasional foreign trade companies34, which are engaged mostly in imports and play an enhanced role in the sustainability of the current account. Despite their relatively low share in trade as a whole (4.2 percent of exports and 10.5 percent of imports in 2012), the aforementioned businesses systematically contribute approximately 2.5 percent of GDP to trade defi cit (Chart 4.19.), i.e. 62.5 percent of the current account defi cit in 2012.
(B) Romanian foreign trade companies further evince a good capacity to cope with the potentially unfavourable developments that might occur either externally or domestically. They play an important and slightly increasing role in the economy, which could cause the potentially adverse developments that may impact them have a bearing outside the sector as well. In 2012, the aforementioned businesses accounted for 42 percent of the gross value added by non-fi nancial corporations (up 0.7 percentage points from a year earlier) and employed 26.1 percent of the latter’s staff (up 0.5 percentage points from 2011).
31 Goods breakdown by technological intensity is in line with the Eurostat classifi cation based on NACE Rev. 2.32 The most important goods in this category are: (i) transport means; (ii) mechanical apparatus and devices, and
(iii) electrical machinery and equipment. 33 The share of exports of goods by technological intensity is calculated for the last four quarters.34 The occasional foreign trade companies refer to companies that are not engaged in any signifi cant imports or exports on
an ongoing basis. They are numerous and focus mainly on imports, i.e. 23,561 importing companies and 4,117 exporting companies.

NATIONAL BANK OF ROMANIA108
4 Risks related to domestic economic and fi nancial developments
Despite crisis-induced unfavourable developments, net exporting companies have had the ability to increase their presence on external markets. Over the last years, they have made a larger contribution to a narrower current account defi cit and their volume of net exports climbed from 9.7 percent of GDP in 2008 to 11.8 percent of GDP in 2012 (Chart 4.19.). In 2012, the turnover of net exporters rose at a faster pace than the economy-wide average, i.e. 11.5 percent against 5.6 percent.3536
Chart 4.19. Trade balance by type of foreign trade companies35
Chart 4.20. Indicators for foreign trade companies versus non-fi nancial corporations36
-20
-15
-10
-5
0
5
10
15
Netexporters
Netimporters
Occasionalforeigntrade
companies
Totaltrade
deficit
2007 2008 2009
2010 2011 2012
percent of GDP
Source: Eurostat, NIS, NBR calculations
0
5
10
15
20
25
30
35
Return onequity (%)
Non-performingloan ratio (%)
Leverageratio
exporters to euro areanet exportersnet importerstotal companies economy-wide
Source: NIS, MPF, NBR, NBR calculations
At aggregate level, net exporters recorded lower profi tability, while at individual level the number of net exporting companies that incurred losses was on the rise. Net exporters’ return on equity was further above the economy-wide average, i.e. 13.4 percent versus 8.4 percent in 2012 (Chart 4.20.). Nevertheless, in 2012 the dynamics of this indicator followed a downward path as compared with the previous year. Thus, in 2012 ROE saw a 1.6 percentage point drop versus a 5.5 percentage point advance in 2011. The main driver of the deteriorating return on equity was the decline in asset turnover (by 9.3 percentage points), which more than offset the favourable impact of the higher leverage ratio (up 3.9 percentage points).
Net importing companies also enjoy a better economic and fi nancial standing than the economy-wide average, albeit below net exporters. In 2012, the return on equity remained slightly higher than the economy-wide average, i.e. 9.7 percent versus 8.4 percent, embarking on an uptrend after coming in at 8.7 percent in 2011. Behind importers’ improved return on equity stood the higher asset turnover
35 Net exporting companies are foreign trade companies with net exports (trade surplus), whereas net importing companies are those with net imports (they generate trade defi cit). Only the companies that are engaged in signifi cant exports or imports – worth more than EUR 100,000 in each quarter over a year – on an ongoing basis were taken into account. The above-mentioned businesses accounted for 95.5 percent of the exports of non-fi nancial corporations and 89.4 percent of their imports, respectively, in 2012.
36 The return on equity and the leverage ratio are calculated for December 2012, whereas the non-performing loan ratio is calculated for August 2013.

FINANCIAL STABILITY REPORT 2013 109
4 Risks related to domestic economic and fi nancial developments
(up 6.3 percentage points), while the leverage ratio and the profi t margin remained relatively unchanged. The turnover of net importers rose at a slower tempo than the economy-wide average (4.3 percent against 5.6 percent annual change in 2012). Many net importing companies incur losses, i.e. 629, accounting for a trade defi cit of 3.4 percent of GDP and holding a 17.8 percent share in the total number of net importers. Nevertheless, in 2012 the situation remained broadly unchanged.
(C) Foreign trade companies and particularly net exporters have a relatively low weight in domestic banks’ loan portfolio. An increase in this weight would benefi t fi nancial stability, as the aforementioned businesses showed greater resilience amid the crisis and their capacity to service their bank debt is signifi cantly higher than that of the other non-fi nancial corporations.
In line with international practice, foreign trade companies – net exporters and net importers alike – resort mainly to foreign funding. In June 2013, loans from non-resident fi nancial institutions and intra-group loans accounted for 73.1 percent of total loans to net exporters and for 58.4 percent of those to net importers, respectively (Chart 4.21.). December 2011 through June 2013, both net exporters and net importers resorted to foreign fi nancing to a larger extent, with higher shares of such loans in total funding, i.e. up 2.7 percentage points and 3.7 percentage points respectively.
Chart 4.21. Foreign trade companies funding
0
2
4
6
8
10
12
14
2008
Q2
2008
Q4
2009
Q2
2009
Q4
2010
Q2
2010
Q4
2011
Q2
2011
Q4
2012
Q2
2012
Q4
2013
Q2
2008
Q2
2008
Q4
2009
Q2
2009
Q4
2010
Q2
2010
Q4
2011
Q2
2011
Q4
2012
Q2
2012
Q4
2013
Q2
2008
Q2
2008
Q4
2009
Q2
2009
Q4
2010
Q2
2010
Q4
2011
Q2
2011
Q4
2012
Q2
2012
Q4
2013
Q2
2008
Q2
2008
Q4
2009
Q2
2009
Q4
2010
Q2
2010
Q4
2011
Q2
2011
Q4
2012
Q2
2012
Q4
2013
Q2
Financial loans Intra-group loans Financial loans TotalExternal loans Loans from domestic banks Indebtedness*
EUR bn.
net exporters
net importers
* does not include loans from domestic NBFIs
Source: NBR calculations
Net exporters hold a low share of the Romanian banking sector’s loan portfolio and service their debt signifi cantly better than the rest of economic operators. Domestic loans to net exporters account for 8.9 percent of total loans to non-fi nancial corporations (June 2013). This type of fi nancing, tantamount to approximately EUR 2.3 billion, holds 25.6 percent of total lending to net exporting companies by both domestic and foreign fi nancial institutions or parent companies (June 2013, Chart 4.21.). In June 2013, total funding amounted to EUR 9.1 billion, being on the rise (up 2.3 percent from December 2011) on account of: (i) the 15.6 percent increase in short-term external loans, and (ii) the 17.4 percent advance in intra-group loans, while (iii) the loans granted by domestic banks lost 6.5 percent. Certain opportunities to replace foreign funding with domestic fi nancing might emerge in

NATIONAL BANK OF ROMANIA110
4 Risks related to domestic economic and fi nancial developments
case the deleveraging announced by large EU banking groups led net exporters’ loan demand to shift from foreign creditors to domestic ones. Net exporters further enjoy a good indebtedness capacity, as the leverage ratio (debt/equity) stood at 1.2 in 2012, below the alert threshold, i.e. 2, and the economy-wide average, i.e. 2.4. Moreover, net exporting companies showed a satisfactory bank debt servicing capacity. Their non-performing loan ratio37 came in at 12.6 percent (Chart 4.20.), whereas that of non-fi nancial corporations as a whole reached 23.4 percent in August 2013.
Net importers hold a larger weight of the domestic bank loan portfolio (19.6 percent of total loans to non-fi nancial corporations in June 2013). As a matter of fact, domestic banks are an important funding source for such companies, accounting for 38.9 percent of total credit from foreign and domestic fi nancial institutions or parent companies in June 2013, ranking second after intra-group loans, which hold 40.3 percent. Net importers’ total fi nancial debt amounts to EUR 13.1 billion, up 6.2 percent in June 2013 from December 2011 on the back of: (i) the 22 percent rise in intra-group loans, while (ii) loans from foreign fi nancial institutions saw a 1.7 percent drop, and (iii) those from domestic banks fell by 2.5 percent. Net importers further enjoy a sustainable indebtedness capacity, as the leverage ratio (debt/equity) stood at 1.2 in 2012 and their interest coverage ratio is further above par, i.e. 3.4. In addition, net importers evinced a very good bank debt servicing capacity, standing higher than that of net exporters (Chart 4.22.), with the non-performing loan ratio coming in at 3.5 percent in August 2013 (while that of non-fi nancial corporations as a whole was 23.4 percent).
Chart 4.22. NPL ratios of foreign trade companies and occasional foreign trade companies
Chart 4.23. NPL ratio of net importing companies by loan currency
0
5
10
15
20
25
30
35
40
Feb.
2010
Apr
.201
0Ju
n.20
10A
ug.2
010
Oct
.201
0D
ec.2
010
Feb.
2011
Apr
.201
1Ju
n.20
11A
ug.2
011
Oct
.201
1D
ec.2
011
Feb.
2012
Apr
.201
2Ju
n.20
12A
ug.2
012
Oct
.201
2D
ec.2
012
Feb.
2013
Apr
.201
3Ju
n.20
13A
ug.2
013
percent
occasional exportersoccasional importersnet exportersnet importers
Source: NIS, NBR calculations
0.0
0.1
0.2
0.3
0.4
0.5
0.6
0.7
0.8
0.9
0.0
0.5
1.0
1.5
2.0
2.5
3.0
3.5
4.0
4.5
Feb.
2010
Apr
.201
0Ju
n.20
10A
ug.2
010
Oct
.201
0D
ec.2
010
Feb.
2011
Apr
.201
1Ju
n.20
11A
ug.2
011
Oct
.201
1D
ec.2
011
Feb.
2012
Apr
.201
2Ju
n.20
12A
ug.2
012
Oct
.201
2D
ec.2
012
Feb.
2013
Apr
.201
3Ju
n.20
13
NPL stock - lei (rhs) NPL stock - fx (rhs) NPL ratio - lei NPL ratio - fx
percent lei bn.
Source: NIS, NBR calculations
Aug
.201
3
37 The non-performing loan ratio is the share of loans granted to companies overdue for more than 90 days and/or for which legal proceedings have been opened (with contamination at company level) in total loans to companies.

FINANCIAL STABILITY REPORT 2013 111
4 Risks related to domestic economic and fi nancial developments
Thus, a rise in the share held by net importing companies in the domestic bank loan portfolio is likely to have a positive bearing on the quality of bank assets, also in view of the expected increase in lei-denominated funding, against the backdrop of the implementation of the ESRB recommendations on foreign currency lending at EU level. In June 2013, net importers’ foreign currency-denominated loans from non-resident banks that are to reach maturity by June 2014 totalled EUR 2.1 billion. The renewal of some of these foreign currency loans extended by foreign banks by converting them into lei-denominated loans granted by domestic banks (as the latter have cheaper lei-denominated resources than non-resident banks) would exert a favourable impact, including over the longer term, on the quality of domestic bank assets (Chart 4.23.), the income of credit institutions and the sustainability of lending in Romania.
4.3.2. Capital fl ows
Romania has further benefi tted from net capital infl ows, amid a tension-ridden external environment that overlapped domestic developments associated with elections in the latter half of 2012. Following some capital outfl ows in the period May-June 2013, occurring simultaneously with similar events on other emerging markets, portfolio investments in Romania bounced back to levels close to those seen prior to the reduction in exposure to emerging economies in terms of asset class, validating the fact that capital fl ows are further directed particularly towards the economies where the major macroeconomic equilibria have already been adjusted or their adjustment is underway, as well as towards the countries implementing structural reform programmes.
The main risks to fi nancial stability generated by the developments in capital fl ows refer to: (A) the further strengthening of the sustainability of the short-, medium- and long-term external debt service, so as, together with maintaining domestic macrostability, to preserve the access to foreign funding under adequate conditions, and (B) the improved structure of foreign fi nancing fl ows, thereby contributing to the sustainable change in the growth pattern for the Romanian economy.
(A) Potential risks to fi nancial stability associated with the dynamics or structure of foreign capital fl ows have remained manageable and are expected to retain the same features. First, Romania’s short-term external debt followed a downward path, contracting by more than 12 percent in the period December 2011 – June 2013 (from EUR 22.8 billion to EUR 19.9 billion). Furthermore, the offi cial foreign currency reserve provides an adequate coverage for the short-term external debt, the best across the region (Chart 4.24.).
Second, the companies generating the country’s private external debt enjoy a satisfactory economic and fi nancial standing, which enables them to withstand moderately unfavourable developments. Despite posting, in 2012, a lower return on equity than the economy-wide average (6.2 percent versus 8.4 percent in December 2012), the aforementioned businesses reported faster dynamics of their value added and serviced their debts to the domestic banking sector better (Chart 4.25.). Their non-performing loan ratio is below the system-wide average (15 percent against 23.4 percent economy-wide in August 2013) and the pace of deterioration of their debt servicing capacity is slower than the system-wide average.

NATIONAL BANK OF ROMANIA112
4 Risks related to domestic economic and fi nancial developments
Chart 4.24. Foreign reserve coverage of short-term external debt in the region (excluding short-term intra-company loans)
Chart 4.25. Financial standing of companies with external debt
0
20
40
60
80
100
120
Dec
.200
8
Dec
.200
9
Dec
.201
0
Dec
.201
1
Dec
.201
2
Mar
.201
3
Bulgaria Czech RepublicHungary PolandRomania Romania*
percent
* includes short-term intra-company loans
Source: central banks, NBR calculations
0
5
10
15
20
25
30
35
40
0
5
10
15
20
25
30
35
40
Companies- total
Companies- with FDI
Companies- with
externaldebt
Companies- with STexternal
debt
NPL ratio (June 2013)return on equity (ROE, 2012)debt/equity (2012, rhs)
percent index
Source: MPF, NBR, NBR calculations
Third, the short-term external debt of non-fi nancial corporations is accounted for nearly 60 percent by parent companies. The evidence shows that such fi nancing proved among the most stable. The orderly developments in short-term foreign funding depend on both parent companies’ capacity to adequately manage their liquidity resources at group level and their interest in investing further in Romania. In 2012, the return on equity of domestic companies that have incurred short-term external debt was close to the average in the real economy (8.3 percent versus 8.4 percent). The rollover ratio of non-fi nancial corporations’ short-term external debt is relatively high, i.e. over 75 percent June 2012 through June 2013.
Fourth, medium- and long-term foreign fi nancing of non-fi nancial corporations provided by creditors in countries perceived on international markets as being more severely hit by the sovereign debt crisis (the GCIIPS countries, namely Greece, Cyprus, Italy, Ireland, Portugal, and Spain) holds a moderate share in total medium- and long-term external debt (15 percent in June 2013). Assuming adverse developments in fi nancing extended by creditors from those countries, their direct impact on the Romanian economy or the Romanian banking sector via the corporate debtor channel is most likely low, also due to the maturity of the loans. Companies with medium- and long-term external debt from creditors in the GCIIPS countries make a low contribution to the domestic economy, as they account for 6.3 percent of the value added by non-fi nancial corporations, hold 7.9 percent of the latter’s assets and employ less than 1.8 percent of the staff in all businesses (December 2012). In addition, the above-mentioned companies make up 3.4 percent of total loans granted by banks to the corporate sector (August 2013).

FINANCIAL STABILITY REPORT 2013 113
4 Risks related to domestic economic and fi nancial developments
Fifth, the Romanian banking sector is able to withstand a moderate shock of a failure to roll over foreign borrowings, the main drivers being: banks’ higher stock of liquid assets, their gradual reduction in reliance on foreign fi nancing (the share of foreign funding in total bank liabilities net of capital shrank 5 percentage points, while the loan-to-deposit ratio fell from 119.1 percent at end-2011 to 109 percent in August 2013) and the enforcement of NBR measures aimed at strengthening credit institutions’ capacity to cope with adverse developments in foreign capital fl ows. Among these measures, the following deserve mention: (i) preserving the banking sector’s prudential indicators on solvency and provisioning coverage of non-performing loans at adequate levels; (ii) ensuring that banks hold an appropriate amount of eligible collateral for the central bank’s monetary policy operations aimed at making available the necessary liquidity for the banking sector, if required, and (iii) broadening the range of eligible collateral to ensure access to the NBR’s open market operations and credit facility by including USD-denominated securities issued by the Romanian government and lei-denominated bonds issued by international fi nancial institutions.
Sixth, as of 2010 the Romanian government set up a foreign currency fi scal buffer with a view to covering budget fi nancing needs for four months (for further details, see Chapter 4.1. “Domestic macroeconomic developments”).
Seventh, Romania agreed on a new economic programme supported by a 24-month precautionary Stand-By Arrangement with the International Monetary Fund and a new precautionary Balance of Payments assistance programme with the European Union, amounting to EUR 4 billion as a whole. These funds would be a last resort solution should extremely unfavourable developments occur on international markets and the already-in-place fi scal buffers set up by the Romanian authorities prove insuffi cient.
(B) Since the release of the previous report, the breakdown of capital fl ow dynamics saw mixed developments. On the one hand, (B1) net foreign capital infl ows occurred and (B2) they were channelled, to a larger extent, towards business sectors that contribute to the sustainable change in the growth pattern for the Romanian economy. On the other hand, (B3) the access of domestically-owned companies to foreign funding remains relatively low, (B4) foreign direct investment follows a downtrend, while (B5) although modest, the infl ows of European funding posted faster dynamics.
(B1) Foreign creditors maintained their exposures to Romania, whose external debt rose marginally to EUR 98.8 billion in June 2013 from EUR 98.7 billion in December 2011 (Chart 4.26.). In 2011 Q4 – 2013 Q2, the private external debt contracted by approximately EUR 3 billion as a result of mixed changes by debtor type. Non-fi nancial corporations’ external debt added roughly EUR 1.8 billion, (+5.3 percent in 2011 Q4 – 2013 Q2), of which more than a third is accounted for by the medium- and long-term component. Non-fi nancial corporations were further supported by parent companies, particularly via short-term loans. By contrast, the external debt of the fi nancial private sector and especially of the banking sector declined by about 17 percent in 2011 Q4 – 2013 Q2 (for further details, see Chapter 4.2. “Corporate and household lending”). The authorities offset the reduction in net private capital infl ows by raising funds on external markets. Foreign investors showed increasing interest in the securities issued by the Romanian government chiefl y due to the domestic macroeconomic consolidation and the favourable prospects for the coming

NATIONAL BANK OF ROMANIA114
4 Risks related to domestic economic and fi nancial developments
years. In 2011 Q4 – 2013 Q2, the external public debt rose by EUR 2.3 billion, with the amounts raised through the issue of bonds largely making up for the repayments of the loan taken from the EU and the IMF in the previous years.
Chart 4.26. Romania’s external debt Chart 4.27. Net capital fl ows in selected countries in the region
0
20
40
60
80
100
120
0
10
20
30
40
50
60
Dec
.200
9
Dec
.201
0
Dec
.201
1
Dec
.201
2
Jun.
2013
external debt - financial private sectorexternal debt - non-financial private sectorexternal debt - public sectorexternal debt - total (rhs)
EUR bn. EUR bn.
Source: NBR
-15
-10
-5
0
5
10
15
2009
2010
2011
2012
2013
Q1
2009
2010
2011
2012
2013
Q1
2009
2010
2011
2012
2013
Q1
2009
2010
2011
2012
2013
Q1
PL CZ RO HU
change in official reserve other investmentportfolio investment foreign direct investmentcapital account
percent
Source: Eurostat
(B2) Companies in the tradable sectors benefi tted from increasing foreign funding. The external debt stock of such companies added around EUR 1.5 billion (+13 percent in 2011 Q4 – 2013 Q2) versus EUR 1.2 billion (+7 percent over the same period) in the case of companies in the non-tradable sectors. The latter further hold the larger share in foreign fi nancing, accounting for 59 percent of total external debt and for 48 percent of short-term external debt in 2013 Q2. The foreign funding of companies manufacturing medium high-tech and high-tech goods rose at a faster tempo than that of companies operating in low-tech and medium low-tech industries (+30 percent as compared with +3 percent in 2012 Q2 – 2013 Q2), with the latter further reporting a higher external debt stock, i.e. EUR 5.5 billion in 2013 Q2.
(B3) Domestically-owned companies do not enjoy the same diversifi ed funding sources as foreign-owned businesses. Companies where non-resident shareholders hold the majority stake (more than a 50 percent equity stake) account for almost 70 percent of the non-fi nancial private external debt (over EUR 24.7 billion in 2013 Q2).
(B4) Foreign fi nancing classifi ed as foreign direct investment further witnessed unfavourable developments. In 2012, net FDI infl ows contracted by 4 percent from a year earlier and by about 29 percent in the fi rst seven months of 2013 in year-on-year comparison. The reduction in FDI fl ows was manifest across all the countries in the region except for the Czech Republic (Chart 4.27.).

FINANCIAL STABILITY REPORT 2013 115
4 Risks related to domestic economic and fi nancial developments
Nevertheless, the Romanian companies benefi tting from FDI fl ows enjoy a better fi nancial standing than the economy-wide average, which is indicative of a potential resumption of such fl ows. The aforementioned companies post a 10.7 percent return on equity (versus an 8.4 percent average of non-fi nancial corporations in December 2012), low indebtedness (1.6 percent leverage ratio in December 2012) and a substantially lower non-performing loan ratio than the system-wide average (10.5 percent against 23.4 percent in August 2013).
(B5) Despite improving somewhat, EU funds absorption, which is another non-interest bearing fi nancing source, was further modest (for further details, see Chapter 4.1. “Domestic macroeconomic developments”). These funds accounted for approximately 5 percent of domestic investment in 2012 and for less than 6 percent in 2013 H1.

NATIONAL BANK OF ROMANIA116
5 NON-FINANCIAL CORPORATIONS AND HOUSEHOLDS
5.1. Risks generated by non-fi nancial corporations
Companies’ economic and fi nancial standing saw a slight improvement in 2012, with the vulnerabilities that emerged in the pre-crisis period of unsustainable growth ameliorating somewhat. Performance has been mixed across types of companies since the previous report, but the economic growth pattern has continued to alter sustainably. Companies’ relatively high degree of heterogeneity led to the situation in which, although the microeconomic fundamentals improved at aggregate level, the fi rms having encountered diffi culties in the past were usually not able to overcome them and hence payment discipline remained loose and companies’ capacity to service their outstanding bank debt continued to diminish. Credit institutions hold adequate levels of capital and provisions to cover the risks stemming from corporate fi nancing and have available techniques for managing non-performing loan portfolios that have not yet been used to the fullest. In order for banks to preserve the solvency and provision buffers, the National Bank of Romania implemented additional prudential measures, especially concerning the unhedged borrowers, in line with the macroprudential recommendations at European level. Furthermore, the new precautionary agreement signed with the European Union and the International Monetary Fund for a 24-month period includes provisions on carrying on structural reforms across the economy, which is likely to alleviate part of the vulnerabilities identifi ed in the non-fi nancial corporations sector.
5.1.1. Non-fi nancial corporations’ economic and fi nancial results
Companies’ fi nancial soundness improved slightly in 2012, against the background of a modest GDP growth (+0.7 percent), whereas the international climate remained tense, which highlights the frailty of this improvement. The main challenges identifi ed in the previous report are still in place: (A) the economic growth pattern continued to alter sustainably, but at a signifi cantly lower speed, which calls into question the durability of these changes. Several weaknesses related to economic growth persist, including in terms of its variability, and the faster economic growth rate in 2013 will most likely be the result of unequal developments in the main components (with private consumption and gross fi xed capital formation having a more modest contribution), and (B) companies’ economic and fi nancial performance improved, but their developments were heterogeneous and structural vulnerabilities are still manifest.
(A) The sectors having the capacity to cause a sustainable change in the economic growth pattern witnessed mixed developments. First, the fi rms in the tradables sectors1: (i) continued to consolidate their position across the economy, albeit at a low speed (the share of the gross value added generated by these fi rms in the total gross value added generated by non-fi nancial corporations rose to 37.9 percent in December 2012, compared to 37.3 percent in December 2011, Chart 5.1.); (ii) recorded positive and upward total cash fl ows, but (iii) the return on equity decreased (to 7.7 percent in December 2012, i.e. 0.7 percentage points below the level posted in December 2011), against the background of a 1 Tradables sectors cover companies in agriculture, hunting and forestry, industry and energy and might as well encompass
companies providing international transport, communication, external travel services etc. but the available statistics do not allow a clear and precise identifi cation of the mentioned fi rms. Non-tradables sectors include companies in construction, trade and services and transport, warehousing and communications.

FINANCIAL STABILITY REPORT 2013 117
5 Non-fi nancial corporations and households
decreasing profi t margin and asset turnover (by contrast, the fi rms in the non-tradables sectors saw an increasing return on equity, up 1.3 percentage points, to 9.3 percent in December 2012).
In their turn, banks contributed to the change in the economic growth pattern, increasing slightly their exposure to the tradables sector (by 0.2 percent in December 2011 – August 2013, while marginally reducing their exposure to the non-tradables sector by 1.6 percent over the same period; exchange rate effect-adjusted values). This fi nancing pattern might persist, as companies in the tradables sector have a relatively better debt-servicing profi le than those in the non-tradables sector (the non-performing loan ratio2 was 20.1 percent in the former case and 25.2 percent in the latter one, in August 2013).
Second, net exporting companies3 followed the same trend as the tradables sector overall: (i) they increased their contribution to the GVA generated by non-fi nancial corporations (from 16.5 percent in December 2011 to 17.8 percent in December 2012); (ii) they posted positive and upward total cash fl ows; (iii) they serviced their bank debt signifi cantly better than the economy-wide average (the non-performing loan ratio was 13.3 percent compared to 23.4 percent, in August 2013), but (iv) the return on equity declined (from 15 percent in December 2011 to 13.4 percent in December 2012), remaining, however, above the economy-wide average (8.4 percent in December 2012).
Chart 5.1. Breakdown of gross added value generated by non-fi nancial corporations, December 2012
0
20
40
60
80
100
By size
corporate sector
micro-entreprises
small-sized entreprises medium-sized entreprises atypical
Source: MPF, NBR calculations
By sector
agriculture
construction and real estate utilities and services
industry
trade
By external tradeactivity
net exporters
net importers
the rest of the economy
By capital origin
companies with majority state-owned capital companies with majority private capital
By type of goods
non-tradables
tradables
percent
Third, fi rms operating in the sectors producing highly innovative technological goods and services (high-tech, medium high-tech and knowledge-intensive services companies4) raised their contribution to the gross added value generated by non-fi nancial corporations (from 25.6 percent in December 2011 to 26.1 percent in December 2012) amid the deceleration in the dynamics of the turnover 2 The non-performing loan ratio is defi ned as a share of the loans to companies with payments overdue for more than
90 days and/or against which legal proceedings were initiated, in total loans to companies. The defi nition is based on the information in the Central Credit Register (CCR) database and does not cover the overdue interest (as this is not reported to the CCR).
3 Only fi rms having recorded exports or imports worth more than EUR 100,000 in each quarter of 2012 were taken into consideration.
4 Classifi cation according to Eurostat.

NATIONAL BANK OF ROMANIA118
5 Non-fi nancial corporations and households
(5 percent in 2012, slightly below the economy-wide average of 5.6 percent, with high-tech fi rms posting a considerably slower growth rate). The return on equity saw mixed developments, going down for high-tech and medium high-tech companies (from 9.2 percent in December 2011 to 7.5 percent in December 2012) and moving up for knowledge-intensive services fi rms (from 16.4 percent in December 2011 to 17.3 percent in December 2012, Chart 5.2.). Moreover, the interest coverage ratio remained satisfactory, which translated also into a better debt servicing compared to the rest of the economy.
Taking into account the manner in which non-fi nancial corporations, by sector of activity, serviced their debt over the last seven years, and considering the necessity to continue the change process of the economic growth pattern, credit institutions may consider implementing internal lending standards that would favour companies operating in the sectors that can contribute to the mentioned change, inasmuch as their own analyses might indicate this. The NBR’s preliminary results show that the fi rms grouped into medium-high tech and high-tech sub-sectors posted an average non-performing loan ratio below the economy-wide average over the last seven years5 (Chart 5.3.).
Chart 5.2. Main fi nancial soundness indicators for companies, by technological intensity
Chart 5.3. Non-performing loan ratio for companies, by technological intensity
0
10
20
30
40
0
100
200
300
400
2011
2012
2011
2012
2011
2012
2011
2012
EBIT/Interest
expenses
Leverageratio
(debt/equity
capital)
ROE(rhs)
Turnovergrowth
rate (rhs)
low and medium-low techhigh and medium-high techless knowledge intensive servicesknowledge intensive services
percentpercent
Source: MPF, NBR calculations
0
5
10
15
20
25
30
May
.200
9A
ug.2
009
Nov
.200
9Fe
b.20
10M
ay.2
010
Aug
.201
0N
ov.2
010
Feb.
2011
May
.201
1A
ug.2
011
Nov
.201
1Fe
b.20
12M
ay.2
012
Aug
.201
2N
ov.2
012
Feb.
2013
May
.201
3 A
ug.2
013
low-tech and medium low-techmedium high-tech and high-techless knowledge-intensive servicesknowledge-intensive services
percent
Source: MPF, CCR, NBR calculations
Where banks’ lending standards would discriminate more strongly between fi rms based on the credit risk posted throughout an economic cycle, access to fi nancing might improve for those sectors playing an important role in generating added value across the economy. The fi rms in the sectors with the largest share in the GVA generated by non-fi nancial corporations that rely signifi cantly on bank fi nancing service their debt well compared to the rest of the economy (Chart 5.4.). As a matter of fact, discriminating between lending conditions by economic sector is part of the macroprudential toolkit that is to be used across the EU6.5 The marked increase in the non-performing loan ratio of medium high-tech and high-tech fi rms highlighted by Chart 5.3.
is ascribable to a single fi rm with majority state-owned capital.6 The mentioned macroprudential instrument was explicitly referred to by the European Systemic Risk Board on the
indicative list of instruments that should be included in the macroprudential authorities’ portfolio (Recommendation of the ESRB on intermediate objectives and instruments of macroprudential policy, ESRB/2013/1).

FINANCIAL STABILITY REPORT 2013 119
5 Non-fi nancial corporations and households
(B) At aggregate level, non-fi nancial corporations witnessed positive developments. The return on equity edged up (from 8.2 percent in December 2011 to 8.4 percent in December 2012), the interest coverage ratio remained unchanged at an above-par level (1.79 in December 2012), while the turnover went up by 5.6 percent (yet considerably less than the 14.0 percent increase seen in 2011). Structural analysis shows mixed developments, while the vulnerabilities identifi ed in the previous report were further manifest.
Chart 5.4. Economic sectors with the largest shares in GVA generated by non-fi nancial corporations resorting to a larger extent to bank funding
0 5 10 15 20 25 30non-performing loan ratio the share of bank debt in total balance sheet debt
Source: MPF, CCR, NBR calculations (with the share of GVA generated by the mentioned sector in brackets)
Manufacture of fabricated metal products, except machinery and equipment (1.7 percent)
Real-estate activities (1.9 percent)
Special construction works (2.4 percent)
Food industry (2.4 percent)
Agriculture, hunting and ancillary services (2.6 percent)
Warehousing and transport support services (2.7 percent)
Civil engineering works (3.1 percent)
Telecommunications (3.5 percent)Electricity, gas, steam and air conditioning production and supply
(4.9 percent)Building construction (5.2 percent)
Land transport and transport via pipelines (5.4 percent)
Retail trade, except for motor vehicles and motorcycles (5.6 percent)Wholesale trade, except for motor vehicles and motorcycles
(9.9 percent)
First, the economic situation continues to differ signifi cantly across the fi rms classifi ed based on their size. Small- and medium-sized enterprises (SME) fi nd it harder to cope with the crisis compared with large enterprises, development consistent with the credit channel effect during sluggish growth stages of the business cycle. Although the return on equity (ROE) was similar for corporations and SMEs (8.4 percent in December 2012), the latter witnessed large differences depending on their size: small-sized enterprises posted the best return on equity (11.7 percent), while micro-enterprises saw a larger loss (from -14.6 percent in December 2011 to -16.8 percent in December 2012). As a matter of fact, micro-enterprises posted: (i) very high indebtedness (against the background of a 34.5 percent drop in equity capital in 2012); (ii) signifi cant losses (lei 1.5 billion before paying interest and the tax on profi t7, in December 2012); (iii) a high non-performing loan ratio (46 percent in August 2013), and (iv) a very long claim-collection period (180 days, whereas the economy-wide average was 103 days, in December 2012). At the opposite pole were corporations with a low indebtedness at aggregate level (the leverage ratio stood at 1.3 in December 2012) and a very good interest coverage ratio (3.5 in December 2012).
7 Earnings before interest and taxes (EBIT).

NATIONAL BANK OF ROMANIA120
5 Non-fi nancial corporations and households
Second, fi rms by economic sector recorded mixed developments. The fi nancial results of fi rms in agriculture remained positive overall, albeit lower in 2012 than in the previous year, with: a high return on equity (17.9 percent in December 2012), a large increase in their turnover (up 10.7 percent in 2012 compared to 2011), and a debt-servicing capacity above the average (the NPL ratio stood at 14.9 percent compared to 23.4 percent on average in August 2013). At the opposite pole were further fi rms in the construction and real-estate sectors. Firms in the latter sector continued to incur losses in 2012 too, against the background of high and increasing indebtedness (owing to the 20.5 percent drop in equity capital in 2012) and a foreign currency exposure of about 400 percent of equity capital (in December 2012), with external debt constituting these companies’ main fi nancing source. Firms in the real-estate sector took considerable loans from local banks as well (approximately 16 percent of the corporate bank portfolio in August 2013). Construction fi rms posted the highest non-performing loan ratio (39.7 percent in August 2013), with their turnover diminishing by 2 percent in 2012, concurrently with the 1.2 percentage point decrease in the contribution to the GVA generated by non-fi nancial corporations in 2012 (to 10 percent in December 2012).
Third, fi rms with majority private capital recorded positive developments overall, while fi rms with majority state-owned capital continued to post mixed developments, as shown in the previous report. On the other hand, state-owned companies continued to service their bank debt better than private companies (the non-performing loan ratio generated by fi rms with majority state-owned capital was 11.5 percent, while the economy-wide average was 23.4 percent in August 2013), amid low indebtedness (the leverage ratio was 1.2 compared to 2.8 for privately-owned fi rms, in December 2012). State-owned companies saw a worsening of their aggregate results: (i) the return on equity declined to 0.3 percent (compared to 10.6 percent for fi rms with majority private capital, in December 2012); (ii) turnover contracted by 23 percent in 2012, and (iii) the contribution to the GVA generated by non-fi nancial corporations went down by 1.8 percentage points (to 7.2 percent in December 2012).
The vulnerabilities described above are expected to moderate in the future, as economic growth consolidates sustainably and the 7.7 percent decrease in GDP in 2009-2010 is recovered. In addition, the new economic programme signed for a 24-month period with Romania’s main international partners (the European Union and the International Monetary Fund) comprises provisions for continuing structural reforms in the economy, with that relative to the improvement in the governance of state-owned enterprises being deemed a priority.
5.1.2. Payment discipline of non-fi nancial corporations
The vulnerabilities identifi ed in the previous report relative to the risks to fi nancial stability posed by companies persisted: (A) the non-performing loan ratio generated by companies across banks’ and NBFIs’ portfolio continued to increases (B) the debt payment discipline towards trading partners and authorities was further loose, and (C) insolvency, including its abusive use, became more pronounced in 2012.
(A) The quality of the loan portfolio to fi rms continued to diminish. The pro-cyclical tightening of bank lending standards, amid the heterogeneous effect of the credit channel on fi rms, contributed to the decline in the companies’ capacity to service their debt. The non-performing loan ratio went up to 23.4 percent in August 2013 (compared to 14.4 percent in December 2011, Chart 5.5.). This increase was mainly ascribable to the stronger rise in the volume of non-performing loans compared to that in the volume of loans granted by domestic banks (65 percent, compared to 1.4 percent, December 2011 – August 2013), against the background of a lower demand for fi nancing and further tightening of lending standards by banks. Financing in foreign currency of fi rms has remained riskier

FINANCIAL STABILITY REPORT 2013 121
5 Non-fi nancial corporations and households
than fi nancing in lei, which advocates furthering the ongoing rebalancing of lending by currency. The growth rate of the volume of non-performing loans in foreign currency has outpaced that of the volume of non-performing loans in domestic currency and thus, starting with August 2013, the ratio of non-performing loans in foreign currency has exceeded the ratio of non-performing loans in lei (23.5 percent compared to 23.4 percent).8
Chart 5.5. Non-fi nancial corporations’ non-performing loans by currency
Chart 5.6. The interest margin related to the fi nancing of companies in Romania and the euro area8
0
1
2
3
4
5
0
5
10
15
20
25
Apr
.201
0Ju
n.20
10A
ug.2
010
Oct
.201
0D
ec.2
010
Feb.
2011
Apr
.201
1Ju
n.20
11A
ug.2
011
Oct
.201
1D
ec.2
011
Feb.
2012
Apr
.201
2Ju
n.20
12A
ug.2
012
Oct
.201
2D
ec.2
012
Feb.
2013
Apr
.201
3Ju
n.20
13 A
ug.2
013
growth rate of non-performing loans in lei (rhs)
growth rate of non-performing loans in foreigncurrency (rhs)non-performing ratio for loans in lei
non-performing ratio for loans in foreign currency
non-performing loan ratio
percent lei bn.
Source: MPF, CCR, NBR calculations
0
1
2
3
4
5
6
Feb.
2012
Mar
.201
2A
pr.2
012
May
.201
2Ju
n.20
12Ju
l.201
2A
ug.2
012
Sep.
2012
Oct
.201
2N
ov.2
012
Dec
.201
2Ja
n.20
13Fe
b.20
13M
ar.2
013
Apr
.201
3M
ay.2
013
Jun.
2013
Jul.2
013
Aug
.201
3
risk premium differential between Romania andthe euro areainterest margin for EUR-denominated loans,Romaniainterest margin for EUR-denominated loans, theeuro areainterest margin for loans in lei
percentage points
Source: ECB, NBR, NBR calculations
Although the risk related to lending to Romanian companies went up, it is most likely that it has stayed broadly unchanged compared to the risk related to lending to fi rms in the euro area. Thus, the risk premium differential between Romanian companies and companies in the euro area remained relatively unchanged (approximately 200 basis points, Chart 5.6.). Banks’ interest margin (relative to 3M ROBOR) on new loans in lei rose markedly, although the risk arising from lending in local currency proved to be lower than that in foreign currency. The National Bank of Romania’s decisions to cut the policy rate (in three stages, by 0.25 percentage points, 0.5 percentage points and 0.25 percentage points respectively, in July, August and September 2013, to 4.25 percent) alongside the better risk profi le for fi nancing in lei should lead to lower fi nancing costs related to loans in domestic currency.
The outlook for the non-performing loan ratio shows that, most likely, unless banks take stronger measures to clean their balance sheets (for further details, see Chapter 5.3. “Risks generated by the real-estate sector and mortgage-backed lending”), the deterioration will continue over the next period, albeit at a slower pace. First, the borrower migration matrix by number of overdue payment days (Chart 5.7.) indicates that most companies with payments overdue for more than 90 days stay in this category. More than 50 percent of the companies falling within B, C and D overdue buckets witnessed a risk profi le worsening, while about 28 percent started to better service their debt. Second, the average probability of default fell to 6.2 percent in December 2013 compared to 7.3 percent at the end of the previous year, hinting at a further anticipated slowdown in the worsening of the 8 Calculated as the spread between the interest rate on new loans to companies and the 3-month money market rate. For reasons
of comparison with the euro area, the risk premium for Romania was calculated for loans in euro only.

NATIONAL BANK OF ROMANIA122
5 Non-fi nancial corporations and households
non-performing loan ratio, should the macroeconomic environment remain in line with expectations (Chart 5.8.). Thirdly, the number of the companies downgraded to a higher risk category is higher than that of fi rms improving their risk profi le, and the number of the companies further falling within the riskiest category has remained very high (over 73 percent of the total volume of non-performing loans are more than one year overdue). Fourthly, the effectiveness of credit risk management techniques that banks resorted to has been below their potential so far, refl ecting inter alia credit institutions’ hesitations to fi rmly address non-performing loan management, also in light of the impact on the additional provisioning requirements. However, the share of the volume of rescheduled/refi nanced loans having become non-performing in total rescheduled/refi nanced loans went up (from 25 percent to 42.3 percent, in the December 2011 – August 2013 period), while banks intend to sell a relatively low volume of non-performing loans (about lei 400 million9) in 2013 H2.
Chart 5.7. Borrower migration matrix by number of overdue payment days (August 2012 – August 2013)
Chart 5.8. Non-fi nancial corporations’ annual rate of default, according to the baseline macroeconomic scenario
% A B C D E
A 89.0 1.7 2.6 1.7 5.0
B 31.4 14.4 13.0 12.1 29.1
C 25.7 4.9 15.6 14.8 38.9
D 15.1 2.8 11.4 21.8 48.9
E 1.3 0.2 0.5 0.6 97.4
A – payments overdue for up to and including 15 days
Source: MPF, CCR, NBR calculations
B – payments overdue for 16 days up to and including 30 daysC – payments overdue for 31 days up to and including 60 daysD – payments overdue for 61 days up to and including 90 daysE – payments overdue for more than 90 days
0
2
4
6
8
10
12
14
16Ju
n.20
06D
ec.2
006
Jun.
2007
Dec
.200
7Ju
n.20
08D
ec.2
008
Jun.
2009
Dec
.200
9Ju
n.20
10D
ec.2
010
Jun.
2011
Dec
.201
1Ju
n.20
12D
ec.2
012
Jun.
2013
Dec
.201
3 Ju
n.20
14
percent
Source: NBR calculations
Although the quality of the loan portfolio to companies continued to deteriorate, the banking sector in Romania holds adequate buffers to cover both expected and unexpected risks. The solvency ratio is further adequate (14.7 percent, in June 2013), while the coverage ratio of companies’ non-performing loans with IFRS provisions and prudential fi lters is at an appropriate level (84.9 percent when including prudential fi lters for calculation; considering the IFRS provisions only, the level stood at 62 percent in August 2013). The NBR will continue to carefully oversee the trends in fi rms’ capacity to service their debt and will adopt the necessary measures so that the banking sector maintains its capacity to manage the unfavourable developments that might arise.
In 2012, the NBR supplemented the regulatory framework on the lending activity, so as to lay the groundwork for improving the repayment of new loans in foreign currency granted to unhedged fi rms even in the event of adverse developments in the interest rate or the exchange rate.
(B) Firms’ payment discipline deteriorated relative to both business partners and the state.
9 According to the Questionnaire on Loan Portfolio Management Techniques, May 2013.

FINANCIAL STABILITY REPORT 2013 123
5 Non-fi nancial corporations and households
The loose payment discipline was due also to the liquidity constraints across the economy, arising against the background of tighter lending terms and conditions by banks and overdue payments generated by fi rms among themselves or by the state. The average period for companies to collect claims remained at a level similar to that seen a year ago (103 days in 2012, compared to 100 days in 2011, Chart 5.9.). Looking at the breakdown by the fi rm’s size, the claim-collection period saw uneven developments: (i) it rose in the case of micro-enterprises (from 172 days to 180 days), most likely owing to these entities’ lower negotiation power of contractual terms and conditions; (ii) it stabilised across SMEs, and (iii) it edged up in the case of large enterprises (from 79 days in December 2011, to 82 days in December 2012), remaining, however, at low levels.
The volume of overdue payments across the economy continued to grow (from lei 97 billion in 2011 to lei 102.6 billion in 2012), posting mixed structural developments (Chart 5.10.). Thus:
(B1) Companies’ overdue payments to the government diminished by 5 percent in 2012 compared to 2011 (to reach lei 25 billion in December 2012). The dynamics were mainly shaped by state-owned companies whose overdue payments went down by 22 percent; however this evolution is ascribable to the cancellation of some overdue debts to the state. Private companies’ overdue payments to the state advanced by more than 14 percent in 2012. The concentration of companies producing such overdue payments has remained high, with the top 10 companies (most of them with majority state-owned capital) generating more than 41 percent of total overdue payments to the state (in December 2012).
(B2) Companies’ overdue payments to suppliers picked up by 9.6 percent in 2012, to reach lei 58.6 billion (of which more than 70 percent were arrears10). The concentration of fi rms producing arrears advanced in 2012, with the fi rst 10 companies (most of them with majority state-owned capital) generating 19 percent of the arrears to suppliers in the economy, compared to 16 percent in 2011. Private fi rms pay their liabilities to suppliers better than state-owned companies (the rate of default11 for commercial debt is 15 percent, compared with 39 percent for state-owned companies). At sectoral level, private construction and real-estate companies continued to post the highest rates of default (22 percent and 18 percent, respectively).
(B3) Government arrears to companies rose marginally (from lei 0.84 billion in December 2011 to lei 0.86 billion in December 2012, according to the IMF), with local governments being further the main entities generating overdue payments (the share of arrears generated by local governments went up to 96 percent in December 2012, compared to 89 percent in the previous year.) On the other hand, the government’s overdue payments ratio12 on its debt to companies fell to 3.2 percent (in December 2012, from 4.2 percent in December 2011), while the number of companies holding similar overdue claims decreased to 11,000 (in December 2012, from 14,700 in December 2011). The companies holding overdue claims on the government generated about 14 percent of the added value (December 2012) and took about 8 percent of bank loans to companies (in August 2013).
10 The arrears were defi ned as payments overdue for more than 90 days. The defi nition is in line with the provisions of the agreement with the IMF. Unless otherwise specifi ed, the data based on which arrears were calculated originate in the regular balance sheet reports by the non-fi nancial corporations to the MPF.
11 Calculated as a ratio of companies’ overdue payments to suppliers and total commercial debt of fi rms generating the respective overdue payments.
12 Calculated as a ratio of the value of overdue claims on the government to non-fi nancial corporations’ claims on the government.

NATIONAL BANK OF ROMANIA124
5 Non-fi nancial corporations and households
Chart 5.9. Claim-recovery period Chart 5.10. Breakdown of overdue payments across the economy
60
80
100
120
140
160
180
200
Dec
.200
5
Dec
.200
6
Dec
.200
7
Dec
.200
8
Dec
.200
9
Dec
.201
0
Dec
.201
1
Dec
.201
2
micro-enterprisessmall-sized enterprisesmedium-sized enterpriseslarge companieseconomy
number of days
Source: MPF, NBR calculations
020406080100120
05
1015202530
Dec
.201
0
Dec
.201
1
Dec
.201
2
Dec
.201
0
Dec
.201
1
Dec
.201
2
Companies withmajority
state-ownedcapital
Companies withmajority private
capital (rhs)
other creditorsgeneral government budgetsuppliers for more than 1 yearsuppliers for more than 90 dayssuppliers for more than 30 days
lei bn. lei bn.
Source: MPF, NBR calculations
(B4) The volume of major payment incidents generated by companies in December 2011 – August 2013 rose slightly (by 4.8 percent compared to December 2010 – August 2012), whereas the number of companies generating such incidents plunged (by 27 percent, Chart 5.11.). The concentration of the top 100 companies remains high (47 percent of the volume of major payment incidents, up 16 percentage points compared to the previous period). The companies generating major payment incidents play a moderate part in the economy (they generate 4 percent of the added value of non-fi nancial corporations and hire 6 percent of the number of employees in this sector, in December 2012), but they play an important part in the dynamics of non-performing loans (34 percent of the volume of non-performing loans were generated by these companies in August 2013). At sectoral level,
fi rms in construction and real-estate sectors are further the entities that produce a signifi cant volume of payment incidents.
(C) Insolvency accelerated signifi cantly in 2012. The number of companies against which insolvency or bankruptcy proceedings were initiated rose by 17 percent (in 2012 compared to 2011), to reach about 26,800. The fi rst eight months of 2013 saw a slight increase compared to the same year-ago period (the number of insolvency cases increasing by 2.7 percent). The number of newly-established companies exceeds signifi cantly that of companies undergoing insolvency proceedings.
Chart 5.11. New major payment incidents
0
5
10
15
20
25
30
35
40
45
0
1
2
3
4
5
6
7
8
9
2007
2008
2009
2010
2011
2012
Aug
.201
3
total amount number of companies (rhs)
lei bn. thousands
Source: MPF, PIR, NBR calculations

FINANCIAL STABILITY REPORT 2013 125
5 Non-fi nancial corporations and households
Thus in 2009 – August 2013, the annual number of newly-established companies is, on average, 150 times higher than the number of companies against which insolvency or bankruptcy proceedings were initiated. It is possible that the companies having undergone insolvency proceedings may have left their liabilities to the lenders and may have transferred the assets to new companies prone to act similarly when facing a fi nancial deadlock.
Most fi rms undergoing insolvency or bankruptcy proceedings: (i) have as core activity retail trade, wholesale trade and building construction (the same as in the last six years); (ii) their capital is primarily domestically-owned (89 percent of fi rms, in December 2012), and (iii) they are mainly small fi rms (particularly micro-enterprises); an alarm signal is sent by the increasing number of corporations undergoing insolvency proceedings, as well as by the abusive use of this ultimate resort procedure by some fi rms. The recovery through reorganisation of the insolvent companies is low. 86 percent of the companies having undergone insolvency proceedings during January 2009 – August 2013 faced bankruptcy (and 77 percent of them have already been struck off), with only 1.2 percent being reorganised. The results prove that the permissive legislation on insolvency has most likely made a contribution to creating the possibility for companies, especially for those with majority private capital, to adjust to a small extent through their own efforts and to a signifi cant extent on account of the lenders – especially general government budget and banks. With a view to improving payment discipline across the economy, the authorities adopted a new legal act relative to insolvency which came into force in October 201313.
The role that the companies against which insolvency or bankruptcy proceedings were initiated play in the economy and bank balance sheets is on the increase. Compared to the companies having undergone insolvency proceedings in 2011, those that underwent such proceedings in 2012 have 20 percent more employees, their total assets are almost double, and their bank debt is considerably higher (lei 7.9 billion in the case of companies undergoing insolvency proceedings in 2012, compared to lei 4.4 billion in the case of companies having undergone insolvency proceedings in 2011, Chart 5.12.).
Chart 5.12. Bank loans of insolvent companies, by year of insolvency
Chart 5.13. Major payment incidents generated by insolvent companies
01020304050607080
012345678
2007
2008
2009
2010
2011
2012
Aug
.201
3
bank loans
share of Treasury loans (rhs)
share of inventory and equipment purchase loans(rhs)
lei bn. percent
Source: NTRO, CCR, NBR calculations
0
500
1,000
1,500
2,000
2,500
3,000
t-4 t-3 t-2 t-1 t t+1 t+2 t+3 t+4
200720082009201020112012 Aug.2013
lei mn.
Source: NTRO, PIR, NBR calculations
Note: t represents the year when insolvencyproceedings were initiated.
13 Government Emergency Ordinance No. 91/2013 on insolvency and insolvency prevention proceedings.

NATIONAL BANK OF ROMANIA126
5 Non-fi nancial corporations and households
The local fi nancial system is further signifi cantly affected by the low capacity of insolvent companies to service their debt, as refl ected by the ongoing upward trend of non-performing loans. The volume of loans granted by banks and NBFIs to companies undergoing insolvency or bankruptcy proceedings was considerable (lei 24.2 billion, accounting for 18.9 percent of total loans granted to non-fi nancial corporations by banks and NBFIs, in August 2013). The volume of loans overdue for more than 90 days generated by these fi rms was of roughly lei 20.8 billion (taking 85.8 percent of the total volume of loans to companies overdue for more than 90 days, in August 2013). A large part of the bank loans to insolvent companies were mainly mortgage-backed (approximately 45.6 percent of exposures; loans without collateral accounted for 12.3 percent of total, in August 2013).
The diffi culties insolvent fi rms have had in servicing their debt could affect their external creditors as well. Their external debt amounted to approximately EUR 2.2 billion in June 2013 (accounting for 6.7 percent of non-fi nancial corporations’ external debt). The short-term external debt accounted for 34 percent of total external debt and consisted primarily of loans from parent banks to their subsidiaries (56.1 percent and roughly EUR 0.4 billion respectively, in June 2013). Medium- and long-term external debt of insolvent companies came in at EUR 1.5 billion (of which 26.5 percent were loans from parent banks to their subsidiaries, in June 2013). Insolvent companies with large external debt came from the real-estate sector (43.8 percent, followed by services with 18 percent and utilities with 14.4 percent, in June 2013), and the concentration of external debt was further high (10 companies holding 43.9 percent of the volume of external loans to insolvent companies, in June 2013).
There is a tight correlation between the deterioration of the payment discipline to trading partners or fi nancial creditors and the initiation of insolvency proceedings. The volume of overdue liabilities to suppliers saw a fast-paced growth rate in the year preceding the initiation of insolvency proceedings (up by 50 percent to 160 percent). In addition, the fi rms undergoing insolvency proceedings generated a signifi cant part of major payment incidents (lei 3.3 billion, making up 65 percent of the volume of major payment incidents caused by non-fi nancial corporations in 2012, Chart 5.13.). Furthermore, the business partners of the insolvent fi rms were negatively affected, to a signifi cant extent, by the non-collection of claims (the volume of total overdue payments generated by insolvent companies ran at lei 36.5 billion, i.e. about 34.4 percent of total overdue payments economy-wide, while lei 13.9 billion represented overdue payments to suppliers, in December 2012). On the other hand, companies underwent insolvency proceedings also amid the diffi culties in recovering their own claims (the claim-recovery period for these fi rms was of 286 days, i.e. almost 2.8 times longer than the economy-wide average, in December 2012).
To sum up, it is necessary to continue to improve the commercial, fi scal and accounting legislation framework with a view to enhancing the commercial and fi nancial discipline in the real economy, with favourable effects on the soundness and stability of the banking system and on public fi nances and fi nancial sector overall.

FINANCIAL STABILITY REPORT 2013 127
5 Non-fi nancial corporations and households
5.2. Risks stemming from the households’ sector
The risks arising from households’ balance sheets were balanced, and indebtedness, especially in foreign currency – the largest vulnerability of this sector – entered a slightly downward path in line with the unfolding of the deleveraging process. However, the identifi ed positive developments were uneven among the different categories of income earners, with households earning low and very low incomes generally posting a deterioration of their balance sheet. The sector’s overall capacity to service its bank debt continued to diminish, albeit at a slower pace, while prospects are mixed. The riskiest portfolios are those granted under the loose prudential conditions in the years prior to the crisis, which constitutes yet another reason that lending should resume on a sustainable basis, under prudent credit risk assessment conditions. The banking sector holds adequate capital and provisioning buffers for covering the risks arising from household lending and this protection can only be ensured by maintaining an appropriate prudential framework.
5.2.1. Households’ balance sheet and saving behaviour
The risks arising from households’ balance sheets have been balanced since the previous report. On the one hand, (A) the indebtedness and (B) the net debtor foreign exchange position were further high, staying, however, on a downward trend. On the other hand, (C) households’ net creditor position towards banks continued to strengthen and (D) net wealth rose for the fi rst time in fi ve years, also due to the improvement in the liquidity of fi nancial assets. There are, however, signifi cant differences between the categories of households by income breakdown. Since the outbreak of the fi nancial crisis, low income earners have been the most affected category of households and the risks arising from the developments in their balance sheets have intensifi ed.
(A) The high indebtedness remains the main vulnerability of households’ balance sheet, but this risk alleviated in the course of 2012 and the fi rst part of 2013 (Chart 5.14.). The elements based on which indebtedness is quantifi ed contributed to this improvement as well: households’ total fi nancial debt and debt service (standing for the numerator of the ratios based on which indebtedness was determined) decreased in the aforementioned period (including as a result of the cut in interest rates), whereas households’ net wealth, total assets, disposable income and the GDP (standing for the denominator of the respective ratios) posted an increase.
Households’ indebtedness has remained relatively high, after having posted in the pre-crisis years a rapid convergence process towards the values in the euro area. Apart from the level indicators, comparisons across regions concerning households’ indebtedness should consider the structural features in Romania. First, in terms of the number of affected households, Romanian households’ over-indebtedness is higher than the EU average. According to a survey by the European Commission14, more than 30 percent of households in Romania were over-indebted15 (in 2011), which places our country in the upper tail of the distribution (alongside Bulgaria and Greece, with the EU average standing at 11.4 percent; in the lower tail of the distribution are Germany, the Netherlands and Luxembourg, where the share of the over-indebted population is below 6 percent). Most EU countries saw an increase in the number of over-indebted households, especially after the outbreak of the fi nancial crisis, pointing out that EU banks’ lending standards in the pre-crisis period were 14 The over-indebtedness of European households: updated mapping of the situation, nature and causes, effects and
initiatives for alleviating its impact, study conducted in January 2013 by Civic Consulting of the Consumer Policy Evaluation Consortium for the European Commission.
15 In the mentioned paper, households are viewed as over-indebted where they encounter diffi culties in servicing their debt on a continuous basis, be it either the bank debt service payment or the payment of rent, utilities or of other bills. The envisaged indicators are: overdue loans, loan non-performance, utilities and rent overdue payments or the use of administrative proceedings such as insolvency proceedings.

NATIONAL BANK OF ROMANIA128
5 Non-fi nancial corporations and households
not prudent enough to cover the risk of simultaneous highly adverse macroeconomic developments. As a matter of fact, more than 90 percent of respondents indicated macroeconomic factors as being the main determinants of over-indebtedness. Among these factors, unemployment is the most signifi cant, followed by wages, fl uctuations in the interest rate and movements in the exchange rate. Starting with August 2008, the National Bank of Romania has implemented new prudential requirements aimed at ensuring ex-ante that borrowers could deal with unfavourable interest rate and exchange rate developments and, as of 2011, the requirements have extended to also cover the risk of a decrease in disposable income.
Second, the share of the debt service in households’ monthly gross income stands relatively high in Romania compared to other EU countries (Chart 5.15.). A signifi cant determinant thereof has been the interest rate spread between loans in domestic currency and those in the single European currency that has recently seen a signifi cant decline. Another contributor to the higher interest rate spread has also been the large share of consumer loans in total loans to households (54 percent in Romania, compared to 27 percent in the euro area, in June 2013), considering the generally higher interest rates on consumer loans than those on real-estate loans. Where the interest rate infl uence is not taken into account and indebtedness is calculated only based on the debt in stock (the principal), the levels of indebtedness in Romania become comparable or even lower than those in the euro area (for example, the share of bank loans to households in GDP was 17.2 percent, compared to a 55.1 percent average in the euro area, in June 2013). The National Bank of Romania’s decision to cut the policy rate (from 5.25 percent upon the release of the previous report, to 4.25 percent in September 2013) should contribute to a decrease in the interest rates on households’ loans, including new loans (and implicitly to the decline in their debt service and indebtedness), considering the high share of loans with a variable interest rate.16
Chart 5.14. Households’ indebtedness – aggregate indicators
Chart 5.15. Households’ indebtedness – EU comparisons16 (median values)
0
20
40
60
80
100
120
140
2005
2007
2009
2011
2012
2005
2007
2009
2011
2012
2005
2007
2009
2011
Mar
.201
320
0520
0720
0920
11M
ar.2
013
2005
2007
2009
2011
Mar
.201
3
Liabilities/Assets
Liabilities/Net
wealth
Liabilities/Disposableincome*
Liabilities/GDP
Debtservice/
Disposableincome*
percent
Romania Euro area (17)
* Total household disposable income, net values. The debtservice/disposable income is not available for the euro area.
Source: ECB, NBR, NIS, NBR calculations
0
50
100
150
200
250
0
5
10
15
20
25
Euro
are
aB
ED
EG
R ES FR IT CY LU MT
NL
AT PT SI SK RO
percentpercent
monthly debt service/monthly gross incomedebt/annual gross income (rhs)
Source: for the euro area countries: EurosystemHousehold Finance and ConsumptionSurvey; for Romania: CCR, CreditBureau, MPF, NBR calculations
16 Data for 2010 refer to Belgium, Germany, Spain, France, Italy, Cyprus, Luxembourg, Malta, Austria, Portugal, Slovakia; data for 2009 refer to Greece, the Netherlands and data for 2008 refer to Spain. The monthly debt service/the gross monthly income indicator is calculated for the indebted household and does not include credit lines, overdraft and credit cards. The debt/annual gross income indicator shows the household’s debt to the fi nancial system. Data for Romania refer to June 2013. The median values of the monthly debt service/monthly gross income and debt/annual gross income indicators are calculated for a sample of persons indebted to banks, accounting for 40 percent of total borrowers, natural entities, and 60 percent of the volume of bank loans.

FINANCIAL STABILITY REPORT 2013 129
5 Non-fi nancial corporations and households
Third, the share of consumer spending for meeting mainly basic needs, more exactly for purchasing food items, is signifi cantly higher for Romanian households than the EU average (44.2 percent compared to 16.8 percent in 2005; the share for Romania saw a decrease to 35 percent in March 2013). In this case, the occurrence of unfavourable developments in the interest rate or the exchange rate can be more diffi cult to manage when there are constraints on disposable income and savings increase only gradually.
Fourth, in Romania borrowers with low incomes hold a relatively signifi cant share of banks’ portfolio. Owing to their high indebtedness, this type of borrower is the most exposed to the unfavourable developments in the interest rate and the exchange rate (Chart 5.16.). Borrowers with net incomes below the economy-wide minimum wage17 posted the highest indebtedness (62 percent, compared to 37 percent economy wide, median values, in June 2013), and the highest asymmetry of indebtedness, with a more pronounced deterioration trend compared to higher income earners. Low income earners are generally the most exposed to face problems in timely repaying their fi nancial obligations18. In Romania, borrowers with monthly net incomes below the economy-wide average19 call for special attention from the risk management perspective. In the case of both consumer loans and mortgage loans, the indebtedness of non-performing borrowers with monthly net incomes below the economy-wide average is higher than that of total non-performing borrowers. This higher indebtedness is tightly correlated with a higher non-performing loan ratio of below-average income earners (Chart 5.17.).20 21
Chart 5.16. Indebtedness breakdown by monthly net income categories20 (June 2013)
Chart 5.17. Non-performing loan ratio21 by monthly income category (June 2013)
0
20
40
60
80
100
120
<=70
0
(700
, 1,
500]
(1,5
00 ,
2,50
0]
(2,5
00 ,
3,50
0]
(3,5
00 ,
5,00
0]
(5,0
00 ,
7,00
0]
>7,0
00
monthly net income, lei
25th percentilemedian75th percentile
percent
Source: MPF, NBR, NBR calculations
0
1
2
3
4
5
0
10
20
30
40
50
<=70
0
(700
, 1,
500]
(1,5
00 ,
2,50
0]
(2,5
00 ,
3,50
0]
(3,5
00 ,
5,00
0]
(5,0
00 ,
7,00
0]
>7,0
00
lei bn.percent
non-performing loan ratio - real-estate loansnon-performing loan ratio - consumerloansvolume of non-performing consumerloans (rhs)volume of non-performing real-estateloans (rhs)
Source: CCR, Credit Bureau, MPF, NBR,NBR calculations
17 Borrowers with monthly net incomes below the economy-wide minimum wage are highlighted by the calculation method, namely the distribution of the annual net income in equal tranches.
18 According to The over-indebtedness of European households: updated mapping of the situation, nature and causes, effects and initiatives for alleviating its impact, study conducted in January 2013 by Civic Consulting of the Consumer Policy Evaluation Consortium for the European Commission.
19 They account for about 60 percent of the number of borrowers, natural entities, and 35 percent of the bank loans granted to households, included in the sample of data available at individual level on both incomes and bank exposures.
20 Indebtedness is calculated only for households with bank loans, by using constant annuities and without considering co-borrowers. The incomes used refer to December 2012. The coverage ratio is of almost 60 percent of total exposures and 40 percent of the number of borrowers (in June 2013).
21 Non-performing loan ratio was calculated without borrower contamination (at bank level), by using the exposures in June 2013 and the wage incomes in December 2012.

NATIONAL BANK OF ROMANIA130
5 Non-fi nancial corporations and households
Fifth, the indebtedness breakdown by currency enhances households’ vulnerability in the event of adverse developments in the exchange rate. The share of fi nancial debt in foreign currency, albeit on a slight decrease, continued to be high (67 percent of total, in July 2013). The new measures on lending in foreign currency that were implemented by the National Bank of Romania in 2011 and harmonised with ESRB recommendations at EU level in 2012, as well as banks’ tendency to change their lending strategies in order to achieve a more balanced evolution of new business in terms of currency, led to a decline in the share of the new business in foreign currency in total new business fl ow (47 percent January 2012 – July 2013, compared to 56 percent, during January 2011 – July 2012). Real-estate loans were further granted by banks overwhelmingly in foreign currency (90 percent of real-estate loans, January 2012 – July 2013). The risks related to these real-estate loans in foreign currency are likely to increase, considering that: (i) these loans have very long maturities, and (ii) at present, the interest rates on loans in foreign currency are at historical lows, and the probability that they may increase until the loans mature is high.
Sixth, indebtedness has remained relatively widespread across Romanian households and debt is generally contracted on the long term: (i) 4.31 million persons were indebted to banks and NBFIs in June 2013, accounting for 43 percent of the active population; (ii) the average loan duration is 21 years for mortgage-backed exposures and 6 years for non-mortgage consumer loans, respectively, and (iii) the value of indebtedness with banks and local NBFIs (including externalised loans) is signifi cant (lei 115.3 billion in June 2013, down from lei 116.5 billion in December 2011). Overall, households’ demand for both consumer loans and real-estate loans fell marginally in December 2011 – June 2013, in line with the deleveraging process unfolding in the EU22.
(B) Households’ net debtor foreign exchange position23 towards the fi nancial system – the second important vulnerability of households’ balance sheets – has broadly the same features as indebtedness: its level has remained high (lei 28.3 billion in June 2013, Chart 5.18.), but entered a downward path starting with 2012, with the breakdown of households by income showing considerable differences. The short foreign exchange position is owed to households’ indebtedness especially in foreign currency, while saving is primarily made in the national currency. The risks related to this foreign exchange position materialised partly into higher non-performing loan ratios for loans in foreign currency than for those in lei (for further details, see Chapter 5.2. “Risks stemming from the households’ sector”). Improving policies of managing lending risks, overall, and especially foreign currency fi nancing risks will cause the downward trend of the short foreign exchange position to continue amid the unfolding deleveraging process. Likewise, the change in the lending conditions applied by the First Home Programme, stipulating that new businesses should be granted in national currency only, is likely to contribute to the improvement in the mentioned vulnerabilities.
(C) Households’ net creditor position towards the national and international fi nancial system24 consolidated steadily in 2012 and the fi rst half of 2013, against the background of the slight fall in indebtedness and the further increase in bank saving, both developments being characteristic of the deleveraging process across the EU (Chart 5.18.). This evolution also contributes to improving households’ capacity to service their debt. Nevertheless, the mentioned positive effect is most likely 22 For example, in the euro area, the negative dynamics of household lending are to a larger extent determined by the lower
demand, than by supply-side constraints (ECB, Financial Stability Review, May 2013). Home ownership in Romania is above the EU average and the euro area average respectively (96.6 percent compared to 70.9 percent and 67 percent respectively in 2011, according to Eurostat) which is largely indicative of households maintaining their demand for real-estate loans.
23 Households’ position towards banks and NBFIs was calculated as the difference between total deposits made by households with banks and the total loans granted by banks (including externalised loans) and NBFIs to households. The short foreign exchange position is equivalent to the net debtor position on the foreign exchange component.
24 The calculation included bank loans and deposits, loans from NBFIs and externalised loans.

FINANCIAL STABILITY REPORT 2013 131
5 Non-fi nancial corporations and households
asymmetrical at individual level. The persons with incomes below the economy-wide average net wage are highly indebted (Chart 5.16.), while having a lower capacity to service their debt (Chart 5.17.). The saving potential of this category of households is affected, generating most probably a net debtor position at individual level.
Chart 5.18. Households’ position towards banks (including externalised loans) and NBFIs
Chart 5.19. Households’ net wealth
-8
0
8
16
24
32
40
-45
-30
-15
0
15
30
45
Q1
Q2
Q3
Q4
Q1
Q2
Q3
Q4
Q1
Q2
Q3
Q4
Q1
Q2
Q3
Q4
Q1
Q2
Q3
Q4
Q1
Q2
2013
percentlei bn.
position-leiposition-foreign currencynet total positionannual real growth rate of deposits (rhs)
Source: NBR, NBR calculations
2008 2009 2010 2011 20120
200
400
600
800
1,000
1,200
0
200
400
600
800
1,000
1,200
2002
2003
2004
2005
2006
2007
2008
2009
2010
2011
2012
net financial assets real-estate assetsnet wealth (rhs)
lei bn.as a share of annual disposable income
Source: NIS, FSA, NBR calculations
(D) The further advance in households’ saving with banks, although posting downward annual growth rates, contributed to alleviating the related risks to fi nancial stability and, implicitly, to the increase in riskless liquid fi nancial assets. Saving is largely made for prudential reasons. The annual dynamics of bank deposits continued to be positive in real terms in 2012 and the fi rst part of 2013 (4.2 percent in December 2011 – July 2013, Chart 5.18.). The deceleration in the growth rate of deposits took place also amid households’ relative decline in potential saving resources25 (8.3 percent in 2013 Q1, compared to 9.5 percent in 2012 Q1).
The prospects for further saving are mixed and, most likely, saving will be supported at aggregate level by higher income earners. The factors that favour an increase in saving are: (i) the maintenance of the precautionary saving motivation and the need to set up reserves in order to ensure the debt service of the loans taken, in the context of the uncertainties relative to developments in unemployment; (ii) the slight improvement of expectations on saving for June 2013 – June 2014, more pronounced (ever since 2010) for above-average income earners, than for below-average income earners26; (iii) the maintenance of more restrictive lending standards, which imply a higher advance for getting loans, and (iv) households becoming more aware of the fact that the incomes due from the current government pension scheme (Pillar I) depend on the contributions by prospective employees (similarly to the situation in most EU countries), which advocates a supplementary saving method on own behalf.
25 According to NIS surveys on Household income and expenditure, the ratio of potential saving resources was calculated as a ratio of household income minus expenditure to total income, July 2013.
26 The European Commission survey on consumer confi dence indicator, June 2013.

NATIONAL BANK OF ROMANIA132
5 Non-fi nancial corporations and households
Structural analysis by household income shows that saving is heterogeneous, with higher income earners saving probably the most (below-average income earners have a weaker saving intention and fi nd it more diffi cult to manage their fi nancial situation27). As a matter of fact, the fi nancial crisis has strongly affected the saving capacity of low income households. In the pre-crisis period (end of 2008), the persons with incomes in the fi rst quartile (those with low and very low incomes) would describe their fi nancial situation as more favourable to saving compared to households with incomes in the second and third quartiles. Once with the outbreak of the crisis, households with incomes in the fi rst quartile witnessed the largest deterioration in terms of their saving capacity.
Chart 5.20. Breakdown of households’ fi nancial assets and liabilities
0
20
40
60
80
100
2011 2012 2011 2012
Assets Liabilities
percentMortgage NBFI loans
NBFI loans for consumption andother purposesBank loans for other purposes*
Mortgage bank loans*
Consumer bank loans*
Life insurance and pension funds
Illiquid shares and capital holdings
Liquid shares
Bank deposits and governmentsecuritiesCash
Liabilities
Assets
Source: NIS, FSA, NBR calculations* including externalised loans
The increase in bank saving had a favourable effect on both the breakdown and the dynamics of households’ net wealth (Chart 5.19.). The expansion in bank deposits, alongside the advance in holdings of cash and government securities, improved liquidity and reduced the risk of households’ fi nancial assets (Chart 5.20.). The share of riskless liquid assets28 in total fi nancial assets continued to increase during 2012 (to reach 43 percent of total fi nancial assets). The pick-up in bank deposits and in the other liquid assets, concurrently with the reduction of debt, led to a faster increase in net fi nancial assets, than in real-estate assets and to the reversal of the downward trend in net wealth manifest as of 2008 (net wealth rose by 6.3 percent in 2012, Chart 5.19.).
5.2.2. Households’ capacity to service debt
Households’ debt servicing capacity has continued to decline since the release of the previous report, although at a slower pace than in the preceding period. The non-performing loan ratio (NPL
27 The European Commission survey on consumer confi dence indicator, June 2013.28 Cash, bank deposits and government securities.

FINANCIAL STABILITY REPORT 2013 133
5 Non-fi nancial corporations and households
ratio)29 reported by banks went up by 2.2 percentage points in December 2011 – June 2013 (from 8.2 percent to 10.4 percent), while the volume of non-performing loans expanded by 28 percent (over the same period). The Romanian banking sector is adequately covered against the risks stemming from household lending: (i) the capital adequacy ratio (14.7 percent, in June 2013) remains signifi cantly above the minimum required value30; (ii) the IFRS provisioning coverage was 68.7 percent (in August 2013), while the expected risks were almost entirely covered by NBFIs provisions supplemented by prudential fi lters31 (96.3 percent, in August 2013), and (iii) the value of the collateral in banks’ portfolio remains large enough to manage risks in the event of unfavourable developments (the LTV indicator32 for real-estate loans reached almost 85 percent, in June 2013, with the increase being also determined by the collateral revaluation).
The prospects on households’ debt service capacity are mixed, but seem to indicate overall a slowdown in the dynamics of non-performing loan ratio (or even a decrease of the ratio if banks implement broader measures for cleaning their balance sheets) in the future. The main signs showing households’ improved debt servicing capacity are: (i) the recovery rate33 of loans overdue for 1 day to 90 days rose slightly in 2013 H1 (84 percent compared to 82.5 percent in 2012), and (ii) the number of borrowers34 that posted for the fi rst time payment delays of more than 90 days in January 2012 – June 2013 diminished (by 6.4 percent compared to the same year-ago period). The persistence of non-performance is indicated by: (i) a signifi cant share (about 40 percent) of borrowers that become non-performing continue to be non-performing for at least two years; (ii) the rescheduling measures taken by banks with a view to improving the quality of non-performing loans have so far failed to reach their full potential (for further details, see Box 1 entitled “Credit risk management techniques”); (iii) foreclosure usually takes a long time (24 months for non-mortgage consumer loans and about 18 months for mortgage-backed consumer loans35 ), and (iv) credit institutions expect an increase by about 10 percent in the volume of non-performing loans in 2013 H236, with the rise being more pronounced for mortgage-backed loans.
Structural analysis of non-performing loans shows the persistence of three vulnerabilities identifi ed in the previous report, which are closely connected with the challenges relating to the structure of households’ indebtedness. First, the credit risk for the foreign currency portfolio continued to increase at a faster pace than the risk related to the domestic currency portfolio. The non-performing loan ratio of foreign currency loans reached 11.1 percent in June 2013 (compared to that of
29 Unless otherwise specifi ed, in Chapter 5 the non-performing loan ratio (NPL – non-performing loans) is defi ned as the share of loans held by borrowers with payments overdue for more than 90 days (with debtor contamination) in total loans granted. The defi nition draws on the information in the database of the Central Credit Register (CCR). The main difference between this defi nition and that for the “Loss 2” indicator (used in Chapter 3.2. “The banking sector”) is that overdue interest is not taken into consideration, since such data are not reported to the Central Credit Register. The defi nition in this chapter enables an in-depth analysis of non-performance. The difference between the non-performing loan ratio calculated under this section and the “Loss 2” indicator is of 1.8 percentage points for the entire portfolio of loans to households (namely 10.4 percent, compared to 12.25 percent, in June 2013).
30 The minimum prudential level aimed at by the NBR since the outbreak of the international fi nancial crisis is 10 percent.31 The coverage of non-performing loans by IFRS provisions and prudential fi lters related to this category was calculated as
a ratio of IFRS provisions and prudential fi lters allocated to non-performing loans only to non-performing loans recorded by households under “Loss 2”.
32 According to the NBR’s Bank Lending Survey, August 2013.33 The recovery rate is the actual probability to group loans into lower overdue buckets (the bucket with 0-day delays in this
case) or their keeping in the same bucket compared to the initial moment, over the course of one year. The readings refer to loans worth more than lei 20,000, as reported by the Central Credit Register.
34 Borrowers with a cumulative exposure of over lei 20,000 lei that are registered with the Central Credit Register.35 See Box 1 entitled “Credit risk management techniques”.36 According to the Questionnaire on Loan Portfolio Management Techniques, May 2013.

NATIONAL BANK OF ROMANIA134
5 Non-fi nancial corporations and households
lei-denominated loans which stood at 8.9 percent), up 2.5 percentage points compared to December 2011 (Chart 5.21.). The volume of non-performing loans in foreign currency rose by 32 percent during the same period (compared to a 20 percent increase for non-performing loans in lei), even though such loans receive greater attention from banks as concerns restructuring (about 80 percent of the volume of restructured loans targeted non-performing loans in foreign currency, outstanding as at May 2013). The vulnerabilities of the foreign currency portfolio arise from: (i) the unfavourable developments in mortgage-backed loans (see further details in Chapter 5.3. “Risks generated by the real-estate sector and mortgage-backed lending”), as well as from (ii) the higher indebtedness37 of borrowers in foreign currency (49 percent, exceeding the 34 percent indebtedness of borrowers in lei – median values, in June 2013). In order to mitigate the vulnerabilities generated by unsustainable indebtedness, in December 2012, the National Bank of Romania implemented new measures38, in line with the recommendations of the European Systemic Risk Board on lending in foreign currencies, for creating the premises for borrowers to be able to service their debt even in the event of unfavourable developments in the exchange rate and the interest rate.
Chart 5.21. Banks’ NPL ratio, by currency Chart 5.22. Banks’ NPL ratio, by vintage
-4-202468
1012
Sep.
2008
Dec
.200
8M
ar.2
009
Jun.
2009
Sep.
2009
Dec
.200
9M
ar.2
010
Jun.
2010
Sep.
2010
Dec
.201
0M
ar.2
011
Jun.
2011
Sep.
2011
Dec
.201
1M
ar.2
012
Jun.
2012
Sep.
2012
Dec
.201
2M
ar.2
013
Jun.
2013
differential of NPL ratio in foreign currency toNPL ratio in leilei
foreign currency
total
percent
Source: CCR, Credit Bureau, NBR calculations
0
2
4
6
8
10
12
14
16
18
20
2004
2005
2006
2007
2008
2009
2010
2011
2012
2013
June 2013
December 2011
percent
Source: CCR, Credit Bureau, NBR calculations
Secondly, borrowers with net incomes below the average economy-wide continue to be the riskiest category for the banking sector, accounting for around 70 percent of the volume of non-performing loans (for both real-estate and consumer loans, Chart 5.17.). The shift to non-performance was tightly correlated with the deterioration of incomes, especially after the outbreak of the fi nancial crisis. The income of non-performing borrowers saw a decrease39 in 2012 from the outbreak of the fi nancial crisis (2008), while those of performing borrowers remained relatively stable. This evidence 37 Data used refer to wage incomes in December 2012 and borrowers’ exposures in June 2013. The coverage ratio is
72 percent of total exposures to households in June 2013.38 NBR Regulation No. 17 of 12 December 2012 on certain lending conditions.39 Borrowers with consumer loans who could no longer service their debt in due time in 2012 saw an income correction of
over 15 percent, while borrowers with real-estate loans who became non-performing in 2012 witnessed a correction of over 10 percent during the same period (median values). Data were based on a sample of borrowers in credit institutions’ portfolios in 2008-2012.

FINANCIAL STABILITY REPORT 2013 135
5 Non-fi nancial corporations and households
advocates the incorporation of unfavourable scenarios on the disposable income including also when establishing the maximum indebtedness level accepted for real-estate loans.
Running a stress scenario on the average interest rate on loans in euro (which currently stands at historical lows and will most likely post a rise on a medium-term horizon) supports the need for banks to have a pro-active stance in establishing the maximum indebtedness level by borrowers’ income and the type of loan (consumer or real-estate). In the context of the extended maturities of household loans and the large share of loans in foreign currency, a 1 percentage point rise in the interest rate on loans in euro would generate an increase in the debt service of 5.8 percent for real-estate loans, 1.3 percent for consumer loans, and 2.2 percent for households’ total loans (scenario run for June 2013). The risk stemming from the asymmetry and heterogeneity of borrowers by income is much higher for mortgage loans. Mortgage indebtedness is the most sensitive to a higher interest rate, especially as concerns low income borrowers (indebtedness can increase by up to 11.4 percentage points in the case of borrowers
with the net income below the economy-wide minimum wage following a 1 percentage point rise in the interest rate, Chart 5.23.).
Thirdly, the loans granted under looser conditions in the years prior to the crisis continue to affect the quality of bank assets. The riskiest loan portfolios are those granted in 2007-2008. The non-performing volumes of these exposures account for almost 70 percent of the total volume of non-performing loans (in June 2013). The non-performing loan ratio of this portfolio is signifi cantly higher than the average (15.4 percent for loans granted in 2007, 18.4 percent for loans granted in 2008, compared to the 10.4 percent average value in June 2013, Chart 5.22.) and continues to grow stronger than the average. The non-performance of the mentioned portfolios is expected to increase further, considering that they were primarily granted in foreign currency (about 80 percent), on long terms and feature one of the lowest collateral coverage (for mortgage-backed loans, LTV was about 90 percent in June 2013 for loans granted in 2007 and 99 percent for loans extended in 2008 respectively – for further details, see Chapter 5.3. “Risks generated by the real-estate sector and mortgage-backed lending”). This evidence stands for yet another reason that lending should resume on a sustainable basis, as credit institutions’ easing of lending standards before the fi nancial crisis led to a build-up of vulnerabilities. At European level, the implementation of the proposal for a Directive of the European Parliament and of the Council40 on credit agreements relating to residential property aims at improving the management of the credit risk associated with mortgage-backed loans to households. The Directive adopted a series of proposals, in line with the recommendations of the European Systemic Risk Board formulated
40 Information based on a proposal for a Directive on credit agreements relating to residential property, http://register.consilium.europa.eu/pdf/en/13/st08/st08895.en13.pdf.
Chart 5.23. The impact exerted by a 1pp shock in euro interest rate on the indebtedness of mortgage loan borrowers by monthly net income category (June 2013)
0
4
8
12
16
20
<=70
0
(700
, 1,
500]
(1,5
00 ,
2,50
0]
(2,5
00 ,
3,50
0]
(3,5
00 ,
5,00
0]
(5,0
00 ,
7,00
0]
>7,0
00
monthly net income, lei
25th percentilemedian75th percentile
percentage points
Source: CCR, Credit Bureau, MPF, NBR,NBR calculations

NATIONAL BANK OF ROMANIA136
5 Non-fi nancial corporations and households
in 2011 on foreign currency lending: (i) raising awareness on risks among borrowers, by ensuring transparency of information; (ii) introducing creditors’ obligation to assess clients’ creditworthiness; (iii) the possibility of early repayment of loans, and (iv) the possibility to convert loans in foreign currency into loans in local currency.
In order to manage the credit risk, banks resorted to a set of measures to clean their balance sheets and manage non-performing assets (for further details see Box 1 entitled “Credit risk management techniques”). One of the solutions most employed was the initiation of foreclosure, applied to approximately 60 percent of the volume of non-performing loans (more specifi cally, the share stands at 30 percent for consumer loans without collateral and more than 55 percent for mortgage-backed loans, in May 201341). Moreover, there are signals that the recovery rate of non-performing loans is higher in case of foreclosure with seizure of assets (compared to foreclosure without seizure of assets), but the former solution is implemented by a small number of banks42, which is motivated by credit institutions in view of the further uncertain prospects for the real-estate market. As regards the cession of non-performing assets, banks anticipate that in 2013 H2 more than 70 percent of the forecasted cessions will relate to non-mortgage-backed consumer loans.
Box 1. Credit risk management techniques
For a better understanding of credit risk management techniques employed by banks, the NBR sent a questionnaire on this issue in June 2013. The questionnaire covered 80 percent of all credit institutions operating in Romania.
In view of the need to make credit risk management more effective, particularly following the increase in the non-performing loan ratio, banks resorted to several specifi c techniques. Credit institutions usually apply a combination of three or four loan portfolio management methods. The most resorted to methods are as follows: (A) loan restructuring (88 percent of the respondents), (B) debt cancellation (75 percent of the respondents), (C) take-over of real-estate assets set up as collateral for non-performing loans (69 percent of the respondents) and (D) cession of non-performing loans to entities outside the group (56 percent of the respondents). Additionally, less resorted to techniques include: (i) cession of performing loans to entities in the same group or from outside it (28 percent of the respondents); (ii) cession of non-performing loans to entities in which the bank is a major shareholder, and (iii) cession to fi nanced entities and/or to entities in which the parent bank or other entity in the group is a shareholder of fi xed assets from foreclosure or take-over of collateral.
Every non-performing loan recovery method is preceded by in-house amiable recovery procedures. Implementing such management techniques is viewed as an alternative to foreclosure proceedings, as they are deemed less costly in terms of human resources investment, time and legal fees. These techniques serve to improve fi nancial performance by maximising recoveries within a short timeframe and removal by banks from the balance sheet of some assets with signifi cantly lower economic value than accounting value. The entities being ceded loan portfolios by fi nancial institutions are generally incorporated locally (89 percent) and not included in the bank’s/banking group’s consolidation scope (82 percent).
(A) The restructuring of loans granted to non-fi nancial corporations and households has gathered momentum over the past three years. A sample comprising nine banks43 refl ects the larger share of restructured loans in total bank credit, from 6.5 percent in December 2010 (9.8 percent in December 2011) to 19.3 percent in
43
41 The shares are calculated as a ratio of the loans for which forced sale proceedings were initiated in total non-performing loans for the two categories of loans.
42 Out of the 32 banks participating in the Questionnaire on Loan Portfolio Management Techniques (May 2013), only a few declared their option for such a measure: fi ve banks in the case of mortgage-backed consumer loans and eight banks in the case of real-estate loans.
43 This sample ensures comparability in time by drawing on the previous years’ surveys. In May 2013, banks in this sample covered approximately 55 percent of total exposure to households and non-fi nancial corporations.

FINANCIAL STABILITY REPORT 2013 137
5 Non-fi nancial corporations and households
May 2013. According to the latest data44, loan restructuring accounts for 17.6 percent of total exposure to non-fi nancial corporations and households, namely 24.1 percent of total exposure to the former and 10.7 percent of total exposure to the latter (May 2013). The breakdown reveals a number of features, as follows: (i) banks resorted to restructuring mainly in the case of foreign currency-denominated loans (66.8 percent of total corporate loans and 81 percent of total household loans); (ii) as for non-fi nancial corporations, the loans overdue for more than 90 days (51 percent of total) are chiefl y subject to restructuring, while (iii) in the case of households, the loans overdue for less than 90 days (69 percent of total) make up the bulk of restructured loans.
Loan rescheduling, one of the most resorted to restructuring methods, has not proved very effi cient in improving borrowers’ repayment behaviour. For both households and non-fi nancial corporations, the rate of recovery to the performance bucket of rescheduled loans between 1 and 90 days past-due is lower than the recovery rate of the loans for which no contractual changes were made. Moreover, rescheduling does not lead to a signifi cant improvement in non-performing loans either, as recovery rates are relatively similar. It also appears to be driven by the credit institutions’ concern to reduce additional provisioning requirements).
Average annual probability of transition by overdue bucket for loans worth more than lei 20,000 granted to households and non-fi nancial corporations (June 2013)
0
25
50
75
100
Recoveryrate
90+ Recoveryrate
90+
[1,90] 90+
rescheduled loans non-rescheduled loans
0
25
50
75
100
Recoveryrate
90+ Recoveryrate
90+
[1,90] 90+
Households Non-financial corporations
Note: For non-performing loans (90+), the recovery rate was assimilated to the exit from this overdue bucket. The analysis looked at the annual evolution of rescheduled loans compared to those for which no contractual changes were made; the initial moment is not necessarily that when rescheduling measures were taken.
Source: CCR, NBR calculations
(B) Debt cancellation remains one of the procedures that banks avoid, even though most credit institutions cited their marginal resort to this method and their intention to use it in the future as well.
(C) The take-over into banks’ balance sheet of real-estate assets pledged as collateral for non-performing loans is done mostly by purchasing the fi xed assets at public auction, as banks seek to avoid collateral sale at too low a price. Goods are acquired at 75 percent or more of their market value in order to be sold at a later date. Banks avoid the acquisition of hard-to-sell goods, such as dilapidated land or buildings. The total market value of assets acquired in exchange for claims by end-May 2013, as indicated by respondents(directly or via entities included in the consolidation scope), stood at lei 833 million, whereas their purchase value came in at lei 817 million (0.2 percent of bank assets). Ten banks stated their intention to acquire assets at an estimated market value of lei 309 million and a purchase value of lei 251 million by year-end.
(D) The cession of non-performing loans to entities outside the group is made via disposal of claims or of the non-performing loan portfolio after all the internal management techniques have been explored. Among the indicators helping to identify the non-performing loans slated for sale is the level of delinquency, the loan value, the quality of collateral and the borrower’s job profi le or core business.
44
44 Data on restructuring (May 2013) cover 68 percent of banks (accounting for 96 percent of loans to the private sector, 93 percent of loans to non-fi nancial corporations and 99 percent of loans to households).

NATIONAL BANK OF ROMANIA138
5 Non-fi nancial corporations and households
5.3. Risks generated by the real-estate sector and mortgage-backed lending
The analysis of banks’ mortgage-backed loan portfolio is indicative of three challenges: (A) to preserve mortgage collateral at an adequate value, especially that mortgage loans make up the bulk of bank assets, (B) to ensure adequate management for the growing risk stemming from mortgage-backed lending, including to strike the right balance between costs and benefi ts of various solutions to manage non-performing loans and (C) to improve bank policies as regards the type of collateral required in lending.
(A) Mortgage-backed loans45 make up the majority of banks’ loan portfolio (67 percent of total loans to companies and households, equivalent to lei 147.4 billion in June 2013). Lending based on such collateral was more widely resorted to by non-fi nancial corporations (72 percent of banks’ corporate loans); as for household fi nancing, mortgage-backed loans accounted for 60 percent in June 2013.
Considering the large share of mortgage-backed loans in the bank portfolio, the related collateral needs to remain at an adequate level so as to counter the risk of a downturn in real-estate asset prices. The recent correction in housing prices has caused a reduction in the collateral coverage of real-estate loans to households (LTV ratio rose from about 78 percent in December 2011 to 85 percent in June 2013)46. Turning to corporate loans, the LTV worsened over the same period from 79 percent to nearly 90 percent46.
The LTV ratio proved an important element of debt servicing, which calls on credit institutions to maintain it at prudent levels. According to banks47, loans to households (both mortgage-backed consumer loans and real-estate loans) overdue for more than 90 days usually posted larger differences between the LTV ratio at the loan origination date and the current LTV level (May 2013), possibly also as a result of non-performing loan concentration in the period that saw the sharpest house price corrections. Moreover, these loans, which were extended when LTV requirements were rather loose (particularly in 2007-2008, Chart 5.24.), reported the highest non-performing loan ratio (15 percent against 9.1 percent on an aggregate basis in June 2013), accounting for the prevailing share, i.e. 75 percent of non-performing loan stock.
The National Bank of Romania took steps to ensure an adequate LTV ratio for the new business and for the LTV ratio related to outstanding loans to capture the unfavourable developments in the prices for real-estate assets held by banks as collateral. First, in line with the ESRB recommendations on lending in foreign currencies at the EU level, a new regulation on lending to households and companies was issued in December 2012. It contains explicit provisions on establishing the LTV ratio based on the borrower’s capacity to cover the exchange rate risk through wage income, which is differentiated by currency (lei, euro, and other – NBR Regulation No. 17/2012 on some lending conditions amending and supplementing Regulation No. 24/2011 on loans to households).
Second, in 2012 H1, the external auditors of banks were asked to make an independent assessment of the value of collateral in credit institutions’ portfolios. As a result, the value of real-estate collateral
45 “Mortgage-backed loans to households” include: (i) real-estate loans (for purchasing a dwelling or land), and (ii) mortgage-backed consumer loans (consumer loans for which a prime mortgage was set up as collateral). As for non-fi nancial companies, this category includes the loans collateralised by, inter alia, a mortgage.
46 According to the NBR’s Bank Lending Survey, August 2013.47 According to bank information in the Questionnaire on Loan Portfolio Management Techniques, May 2013.

FINANCIAL STABILITY REPORT 2013 139
5 Non-fi nancial corporations and households
saw a correction, also refl ected by a rise in the LTV ratio, and the adjustment was fully covered by an almost EUR 600 million additional credit risk provisioning. With a view to ensuring appropriate recognition of real-estate collateral market value in banks’ balance sheets, a new similar exercise, in cooperation with the external auditors, is to be conducted in the course of 2013.
The above-mentioned measures are all the more necessary as the developments in the real-estate market have remained mixed, with a rather negative balance. Thus, housing prices kept declining in 2012 (down 1.3 percent year on year), and banks expect this trend to persist during 201346. The number of residential building permits hit a 7-year low in 2012 (4 percent below the year-earlier level) and contracted by another 2.5 percent (in annual terms) in the fi rst seven months of 2013. The number of completed dwellings decreased in 2012 (down 4 percent over the year before), but bounced back in 2013 H1 (up 4.9 percent). The number of real-estate transactions went up in 2012 (17 percent year on year), but is below its 2007 peak. The increase continued in the fi rst eight months of 2013 (9.5 percent versus the same year-earlier period), also fuelled by the “First Home” programme.
Chart 5.24. NPL ratio for mortgage-backed loans by vintage (LTV and NPL levels as of June 2013)
Chart 5.25. NPL ratio for mortgage-backed loans granted by banks
0
4
8
12
16
20
0
20
40
60
80
100
2005
2006
2007
2008
2009
2010
2011
2012
LTV ratio NPL ratio (rhs)
Source: CCR, NBR calculations
percent percent
0
4
8
12
16
20
Q3
Q4
Q1
Q2
Q3
Q4
Q1
Q2
Q3
Q4
Q1
Q2
Q3
Q4
Q1
Q2
Q3
Q4
Q1
Q2
2008 2009 2010 2011 2012 2013
percent
real-estate loansmortgage-backed consumer loansmortgage-backed loans
Source: CCR, Credit Bureau, NBR calculations
(B) The risk associated with mortgage-backed loans granted by banks was on the rise in the period under review, but the pace of worsening slowed further. In the case of household loans, the non-performing loan ratio48 reached 9.1 percent in June 2013 from 7.25 percent in December 2011 (Chart 5.25.) and the volume of non-performing loans climbed by 36 percent over the same period. The outlook is mixed: households’ balance sheet improved (for further details, see Chapter 5.2. “Risks stemming from the households’ sector”) and the number of debtors whose loans turned non-performing in the period December 2011 – August 2013 fell by 1.6 percent over the period December 2010 – August 2012. On the other hand, low-income borrowers face growing diffi culties in debt servicing and the recovery49 for non-performing loans declined (from 17.1 percent to 16 percent for
48 The non-performing loan ratio is defi ned as the share of loans held by debtors with payments overdue for more than 90 days (with debtor contamination) in total loans granted to households.
49 For non-performing loans (90+), the recovery rate was the exit from this overdue bucket in the course of one year.

NATIONAL BANK OF ROMANIA140
5 Non-fi nancial corporations and households
mortgage-backed consumer loans and from 13.1 percent to 11.15 percent for real-estate loans in the fi rst eight months of 2013 against the average for 2012).
Turning to corporate loans, the non-performing loan ratio stood at 25.7 percent (in August 2013), up 9.5 percentage points versus December 2011, and the volume of non-performing loans grew by 60.1 percent in the period December 2011 – August 2013 (compared with 60.7 percent in December 2010 – June 2012). The companies doing business in the sectors that are closely connected to the real-estate market also face serious diffi culties in servicing their debts. Construction fi rms (accounting for 9.5 percent of banks’ corporate loan portfolio in August 2013) generate the highest non-performing loan ratio economy-wide (39.7 percent in August 2013, up from 22.1 percent in December 2011). The average number of companies that have recently gone into default climbed by 9.7 percent in the period December 2011 – August 2013 against the period from December 2010 to August 2012. Moreover, these companies’ contribution to major payment incidents economy-wide was signifi cant (20.8 percent) and rising (27.2 percent) in the period December 2011 – August 2013. Real-estate fi rms (constituting 16.1 percent of total corporate loans granted by banks in August 2013) reported a non-performing loan ratio of 22.7 percent in August 2013 (over 13.6 percent in December 2011), even though approximately 25.2 percent of these exposures (lei 4.6 billion) were rescheduled loans.
The relatively high non-performing loan ratio for mortgage-backed loans is also attributed to maintaining in banks’ portfolios a signifi cant share of borrowers with overdue loans, including those who proved a low probability to repay their debts. For example, in the case of households, around 70 percent of non-performing borrowers (having taken either real-estate loans or mortgage-backed consumer loans in June 2013) had been in default for more than one year or had recorded multiple defaults. Banks commenced foreclosure proceedings for approximately 55 percent of total non-performing mortgage-backed loans, but tangible results are produced no earlier than two years (legal action starts, on average, six months after loans become non-performing and lasts usually more than 1½ years). Banks have stated that the degree of recovering the loans subject to foreclosure is about 55 percent, but the level is considerably higher in the case of foreclosure with seizure of assets (approximately 70 percent for mortgage-backed consumer loans and 80 percent for real-estate loans)50. As far as corporate loans are concerned, credit institutions proceeded to rescheduling, also given their interest in reducing additional provisioning requirements in the short term, but this measure failed to signifi cantly improve the borrowers’ repayment behaviour. Around 21.6 percent of the mortgage-backed loans were rescheduled (outstanding stock in August 2013), of which 41.3 percent reported payments overdue for more than 90 days. Banks also resorted to foreclosure proceedings, but the process is lengthy (legal action commences, on average, fi ve months after loans become non-performing and lasts about 22 months, whether the collateral is or not commercial or residential property, or land) and the recovery rate of loans through foreclosure is, on average, 55 percent as well.
Along with the two solutions that banks resorted to on a relatively large scale with a view to managing credit risk (restructuring/rescheduling and foreclosure), two other solutions have so far been rather seldom employed, but they could prove more successful in lowering the non-performing loan stock: disposal of claims and debt cancellations. Such measures, albeit proving effective in balance sheet clean-ups, have mixed effects on banking as a whole. The fi rst positive effect would be a brighter
50 This solution is employed by few credit institutions: fi ve banks have used it for mortgage-backed consumer loans and eight for real-estate loans (according to the Questionnaire on Loan Portfolio Management Techniques, May 2013). This is deemed to be a prudent decision, given the still uncertain prospects on real-estate market.

FINANCIAL STABILITY REPORT 2013 141
5 Non-fi nancial corporations and households
picture of the Romanian banking sector, with the non-performing loan ratio improving noticeably51. For instance, the removal from the balance sheet of the non-performing exposures to the corporate sector (via disposal of claims or debt cancellations) would reduce the sector’s non-performing loan ratio from 23.4 percent (in August 2013) to 7.5 percent. The decline would be ascribable to the cut in the large stock of non-performing loans, with a low probability of recovery. Thus, loans overdue for more than 365 days (likely to remain in this overdue bucket, since the debt can no longer be extinguished) amounted to lei 19.7 billion (74 percent of total non-performing loans in August 2013). The volume of non-performing loans (overdue for more than 90 days) falling due in 2013 and already subject to refi nancing/rescheduling in the past with a view to improving the borrower’s repayment capacity stood at lei 6.6 billion (5.8 percent of total loans granted to non-fi nancial corporations in August 2013)52. Non-performing loans falling due in 2013 or already overdue came in at lei 19.9 billion (17.4 percent of total loans granted to non-fi nancial corporations in August 2013).
Another positive effect would be that the aforementioned balance sheet clean-up methods targeting banks would leave economic growth unharmed. The companies that have entered payment default and whose loans fall due in 2013, albeit already subject to refi nancing/rescheduling in the past, contributed merely 0.5 percent to the GVA generated by non-fi nancial corporations and had almost 1 percent of all employees in Romania on their payrolls (in December 2012). All non-performing loans due in 2013 or previously were extended to the companies contributing 1.5 percent to the GVA generated by non-fi nancial corporations and accounting for 2.6 percent of the sector’s payrolls (in December 2012).
Apart from the above-mentioned positive effects, there may also be negative effects. First, potential future income that a bank may get from the cession of non-performing loans decreases signifi cantly (in the case of the disposal of claims, the bank is paid the price that the buyer of the non-performing claim is willing to pay after bargaining)53. Given that credit institutions are increasingly establishing in-house non-performing loan management units, it appears that they deem the benefi ts of resorting to a balance sheet clean-up to be lower than those associated with no action taken altogether. This stance is also attributed to the fact that most of the non-performing loans (51 percent in June 2013) overdue for more than 365 days have been collateralised with real-estate assets.
Second, balance sheet clean-up would imply a sizeable contraction of the loan stock. For instance, taking such a measure in regard to non-performing loans overdue for more than 365 days generated by companies would bring about a reduction in the loans granted to this sector by lei 19.7 billion (17.3 percent) in only one year (in the years ahead, this effect would weaken markedly). This could be regarded as deleveraging and could spark herd behaviour on the part of foreign creditors.
Consequently, the methods that banks employ to manage non-performing loans should be applied by striking a functional balance between their cost and benefi ts. For instance, if reputational benefi ts take precedence (particularly in terms of the non-performing loan ratio), disposal of claims and debt cancellation should prove useful.
51 Adding to the higher non-performing loan ratio are the low forbearance of the supervisory authority, the further build-up of penalty interest on non-performing loans, as well as Romania’s using a stricter defi nition of non-performing loans. Romania takes account of the IMF’s recommended defi nition, which enjoys higher global comparability, but the EU is expected to make a unitary approach after EBA released a calculation methodology.
52 Total non-performing loans due in 2013 or previously add up to lei 18.6 billion, so that potential debt cancellations would have a signifi cantly stronger impact on the stock of loans to non-fi nancial corporations.
53 Moreover, solvency rate could decline after recognising debt cancellation of non-performing loans on the expenditure side.

NATIONAL BANK OF ROMANIA142
5 Non-fi nancial corporations and households
(C) Having set up a mortgage as collateral failed, in some cases, to improve the borrowers’ debt service behaviour: counterintuitively, the NPL ratio for mortgage-backed loans is well above that for exposures without such collateralisation for most bank loan types. For instance, mortgage-backed consumer loans have become the riskiest among all bank loans to households (the NPL ratio reached 14 percent and exceeded the non-performance relative to non-mortgage-backed consumer loans equalling 13.6 percent in June 2013). This is attributed to the fact that the defaulting borrowers hold several real-estate assets compared to the good payment discipline of borrowers residing in the mortgaged house.
As far as companies are concerned, the NPL ratio for mortgage-backed loans is still higher than that for the loans lacking such collateral (25.7 percent against 17.1 percent in August 2013). This behaviour was manifest for both SMEs (29.8 percent versus 25.4 percent) and corporations (9.6 percent against 7.9 percent in August 2013, Chart 5.26.). Moreover, unlike mortgage-backed loans, the loans for which guarantees from central government institutions or other similar entities were set up as well as the loans for which collateral deposits were pledged54 enjoy a far better debt service. The non-performing loans for which the aforementioned guarantees were set up make up 8.8 percent and 8 percent respectively of the loan stock (compared with a 25.7 percent NPL ratio for mortgage-backed loans in August 2013).
Chart 5.26. NPL ratio for corporate loans by company size and collateral type
0
5
10
15
20
25
30
35
Mar
.201
1
Jun.
2011
Sep
.201
1
Dec
.201
1
Mar
.201
2
Jun.
2012
Sep.
2012
Dec
.201
2
Mar
.201
3
Jun.
2013
Aug
.201
3
Mar
.201
1
Jun.
2011
Sep
.201
1
Dec
.201
1
Mar
.201
2
Jun.
2012
Sep.
2012
Dec
.201
2
Mar
.201
3
Jun.
2013
Aug
.201
3
SMEs Large enterprises
mortgage-backed loans
non-mortgage backed loans
percent
Source: CCR, MPF, NBR calculations
Under the circumstances, a possible solution for improving credit risk management is that the exposures of non-fi nancial corporations for which real-estate collateral is set up should be attached a lower LTV ratio than the loans for which other types of collateral are used (e.g., exposures collateralised by loan guarantee funds, cash collateral, etc.), if the NPL ratios for collateralised loans and non-mortgage-backed loans, respectively, validate the risk differentiation.
54 This analysis covers the loans extended to non-fi nancial corporations for which, inter alia, guarantees from central government institutions or other similar entities, or collateral deposits, were set up.

FINANCIAL STABILITY REPORT 2013 143
5 Non-fi nancial corporations and households
This measure would entail, inter alia, a more prominent role played by loan guarantee and counter-guarantee funds in the collateralisation of loans granted to SMEs. These funds usually operate below potential, since there are signifi cant resources available for boosting their activity. The collateral put forward is highly liquid and its market value remains unchanged (compared with real-estate collateral which has very poor liquidity and its market value changes). Over the medium term, the envisaged solution should be reassessed in terms of the funds’ capacity to adequately manage risks and ensure that the negative feedback loops between governments and banks are not strengthened (bearing in mind that loan guarantee and counterguarantee funds are overwhelmingly state-owned entities). Another effect could be banks’ lower reliance on mortgages required to be pledged as collateral for the new loans granted to companies in favour of loans collateralised by the borrower’s future cash fl ows, which might result in better lending conditions. Taking such an approach could lay the groundwork for a shift in the banking sector’s business pattern towards lending to non-fi nancial corporations by improving the expertise in the assessment of companies’ fi nancial statements and of the risks arising from the business plans they submitted to the banks.

NATIONAL BANK OF ROMANIA144
6 FINANCIAL SYSTEM INFRASTRUCTURE – STABILITY OF PAYMENT AND SECURITIES SETTLEMENT SYSTEMS
In the period since the release of the previous report, payment1 and securities settlement systems continued to operate within adequate parameters, thereby contributing to the strengthening of fi nancial stability. Having in view that one of the NBR’s main statutory tasks consists in promoting and overseeing the smooth functioning of the systems, the central bank pursues the implementation of the measures necessary for these infrastructures to perform their critical role within the fi nancial system and the economy.
The fi nancial infrastructures encompass various types of contractual, procedural and technical multilateral arrangements, implemented by infrastructure administrators with a view to performing transfers of funds and/or securities between the participating entities.
6.1. Stability of ReGIS payment system
ReGIS remained stable during January 2012 – June 2013, while the value of transactions entered a downward trend at mid-2012. The participants’ aggregate available liquidity exceeded the necessary resources, yet certain participants experienced slight tensions on liquidity during 2012, but the situation improved in 2013 H1.
The average availability ratio of the services provided by ReGIS in the past 12 months was 99.99 percent and the average daily settlement ratio stood at 99.97 percent. Both indicators illustrate the smooth functioning of ReGIS, free of any serious defi ciencies.
The number of transfer orders settled through ReGIS remained well below the projected maximum processing capacity of the system (30,000 transactions per working day), but the maximum daily volume, of more than 25,000 transfer orders, recorded in December 2012
points to the need to raise this ceiling over a medium-term horizon (Chart 6.1.). 1 In Romania, there are in place two payment systems for the settlement of payment obligations, in domestic currency, in
central bank money: ReGIS payment system, operated by the NBR and SENT net settlement payment system, operated by STFD – TRANSFOND S.A.
In compliance with Order No. 637/15 June 2011, issued by the NBR Governor, the two systems shall be governed by Law No. 253/2004 on settlement fi nality in payment and securities settlement systems, as subsequently amended and supplemented.
Chart 6.1. Maximum daily number of transfer orders settled via ReGIS
0
5,000
10,000
15,000
20,000
25,000
30,000
Jan.
2011
Mar
.201
1M
ay.2
011
Jul.2
011
Sep.
2011
Nov
.201
1Ja
n.20
12M
ar.2
012
May
.201
2Ju
l.201
2Se
p.20
12N
ov.2
012
Jan.
2013
Mar
.201
3M
ay.2
013
number
Source: NBR
Jun.
2013

FINANCIAL STABILITY REPORT 2013 145
6 Financial system infrastructure – stability of payment and securities settlement systems
The value of transactions increased in the fi rst part of 2012 amid the pick-up in repo operations of the central bank and the large intraday liquidity volume accessed by credit institutions from the NBR, but subsequently the values settled through ReGIS reverted to the level seen in 2011 (Chart 6.2.). The transactions with the State Treasury hold a very small share in ReGIS. The low GDP growth, along with the stagnation in the fi nancial intermediation ratio, hindered the values of transactions settled through ReGIS from rising signifi cantly.
The liquidity usage ratio within ReGIS has stabilised starting with 2012, after having fl uctuated strongly in 2011 H1. The roughly 25 percent average level of the liquidity usage ratio recorded in 2013 H1 shows that the resources of the banking system exceeded the liquidity needs within ReGIS (Chart 6.3.).
Chart 6.2. Value of transfer orders settled via ReGIS
Chart 6.3. Liquidity utilisation via ReGIS
0
100
200
300
400
500
600
700
800
Jan.
2011
Mar
.201
1M
ay.2
011
Jul.2
011
Sep.
2011
Nov
.201
1Ja
n.20
12M
ar.2
012
May
.201
2Ju
l.201
2Se
p.20
12N
ov.2
012
Jan.
2013
Mar
.201
3M
ay.2
013
credit institutions State Treasury NBR
lei bn.
Source: NBR
Jun.
2013
0
5
10
15
20
25
30
35
Jan.
2011
Mar
.201
1M
ay.2
011
Jul.2
011
Sep.
2011
Nov
.201
1Ja
n.20
12M
ar.2
012
May
.201
2Ju
l.201
2Se
p.20
12N
ov.2
012
Jan.
2013
Mar
.201
3M
ay.2
013
percent
Source: NBR
Jun.
2013
The total maximum value of queues in ReGIS indicates a stronger pressure on the participants’ liquidity resources during 2012, mainly in H2 (Chart 6.4.). Even though the liquidity usage ratio did not increase in the period under review, the estimated value of queues illustrates a more pronounced asymmetry of liquidity resources within the system. Tensions almost faded away in 2013 H1, when the participants reporting a resource shortfall balanced their liquidity positions.
The NBR open market operations tend to intensify during the periods when pressures on the resources in ReGIS build up (Chart 6.5.) Both money market volatility and the value of queues in ReGIS are indicators of short-term liquidity in the fi nancial system. The NBR’s intervention in the money market via repo transactions when a liquidity shortfall emerged in ReGIS illustrates the high importance of the indicator on total maximum value of queues in ReGIS for measuring liquidity risk in the banking sector.

NATIONAL BANK OF ROMANIA146
6 Financial system infrastructure – stability of payment and securities settlement systems
Chart 6.4. Total maximum value of queues in ReGIS
Chart 6.5. Relation between NBR repo transactions and the maximum value of queues in ReGIS (January 2011 – June 2013)
0
5
10
15
20
25
30
35
40
45
50
Jan.
2011
Mar
.201
1M
ay.2
011
Jul.2
011
Sep.
2011
Nov
.201
1Ja
n.20
12M
ar.2
012
May
.201
2Ju
l.201
2Se
p.20
12N
ov.2
012
Jan.
2013
Mar
.201
3M
ay.2
013
lei bn.
Source: NBR
0
10
20
30
40
50
60
0 20 40 60
Total queues in ReGIS (lei bn.)
NB
R re
po tr
ansa
ctio
ns (l
ei b
n.)
Source: NBR
6.2. Stability of SENT – the small-value payment system
During July 2012 – June 2013, SENT remained stable, no major incidents being reported, and the limits set when the system was designed were generally observed.
July 2012 through June 2013, SENT saw a series of incidents which led to the drop in the minimum monthly availability ratio of the system, without falling below the level set by the system rules (Chart 6.6.), given that the average monthly availability ratio exceeded 99.94 percent. However, the impact of these operational incidents on the participants and their clients (households and companies) was not material, as it was short-lived and insulated.
In the period under review, payment transactions resulting from the transfer orders initiated by the 42 participants, with an average netting ratio2 of around 20 percent, were netted on a daily basis through SENT. The system operated within parameters, the netting ratio occasionally nearing the 10 percent level, which is seen as a premise for the emergence of the domino effect3, where a participant fails to fulfi l its payment obligations to the system (Chart 6.7.). As a credit risk management measure, the system ensures the settlement of all the net positions resulting from clearing, by using a unilateral guarantee scheme involving assets eligible to access central bank operations.
2 Determined as a ratio of the cumulative value of net debit positions calculated during a clearing cycle to the cumulative value of transfer orders netted during the respective clearing cycle. A low level of the netting ratio suggests a high netting effect.
3 A netting ratio lower than or equal to 10 percent, a concentration ratio of at least 80 percent and net debit positions of the participants of at least EUR 1 billion are seen by the ECB as factors that may trigger the domino effect; Assessment of euro retail payment systems against the applicable Core Principles, August 2005. http://www.ecb.int/pub/pdf/other/assessmenteuroretailpaymentsystems200508en.pdf.

FINANCIAL STABILITY REPORT 2013 147
6 Financial system infrastructure – stability of payment and securities settlement systems
Chart 6.6. Availability ratio of SENT Chart 6.7. Netting ratio of SENT
99.0
99.5
100.0
Jul.2
012
Aug
.201
2
Sep.
2012
Oct
.201
2
Nov
.201
2
Dec
.201
2
Jan.
2013
Feb.
2013
Mar
.201
3
Apr
.201
3
May
.201
3
Jun.
2013
percent
Note: The green flat line stands for the minimummonthly availability ratio of SENT set bysystem rules.
Source: STFD – TRANSFOND S.A.
0
5
10
15
20
25
30
35
40
45
Jul.2
012
Aug
.201
2
Sep.
2012
Oct
.201
2
Nov
.201
2
Dec
.201
2
Jan.
2013
Feb.
2013
Mar
.201
3
Apr
.201
3
May
.201
3
Jun.
2013
Note: The red flat line stands for the alert thresholdindicative of the potential emergence of thedomino effect.
Source: STFD – TRANSFOND S.A.
Since 2010, the concentration ratio4 of the system, calculated based on both volume and value of the netted transfer orders, has remained constant, ranging between 57 percent and 58 percent, (well below the 80 percent threshold that may lead to the emergence of the domino effect). The top three out of the fi ve positions taken into account when calculating this indicator are occupied by the same participants holding comparable individual market shares (Chart 6.8. and Chart 6.9.).
Chart 6.8. Market share of the participants (volume of transfer orders netted)
Chart 6.9. Market share of the participants (value of transfer orders netted)
0
20
40
60
80
100
0
3
6
9
12
15
1 2 3 4 5 6 7 8 9 10 11 12 13 14 15 16 17 18 19 20
market share
concentration ratio(rhs)
percentpercent
Source: STFD – TRANSFOND S.A.
0
20
40
60
80
100
0
3
6
9
12
15
1 2 3 4 5 6 7 8 9 10 11 12 13 14 15 16 17 18 19 20
market share
concentration ratio(rhs)
percentpercent
Source: STFD – TRANSFOND S.A.
4 Calculated as the sum of the top fi ve individual market shares.

NATIONAL BANK OF ROMANIA148
6 Financial system infrastructure – stability of payment and securities settlement systems
The SENT administrator opted for enhancing the activity of the system by amending the rules, i.e. by widening the range of participants eligible for entering the system, on the one hand, and by introducing the indirect participation option, on the other hand.
Both amendments were accompanied by adequate measures for the management of system-related risks, by requesting a legal opinion5 on the capacity of the participant, where it resides in a country outside the European Economic Area, to fulfi ll its obligations as a participant in the system, and by making the necessary adjustment to the unilateral guarantee scheme and the settlement pattern.
6.3. Securities settlement systems
The securities settlement systems in Romania - DSClear operated by the Sibex Depository, RoClear operated by the Central Securities Depository6 and SaFIR7 operated by the NBR – provide post-trading services for the domestic capital market and the government securities market. In assessing their role in relation with the fi nancial market, the smooth and effi cient functioning of these infrastructures is a prerequisite for maintaining fi nancial stability and containing systemic risk.
The functioning of the securities settlement systems in Romania
The smooth functioning of DSClear, RoClear and SaFIR carried on throughout 2012 and 2013 H1.The main performance indicators posted high levels, illustrating once again the soundness of these systems. Thus, the settlement ratios8 over the past 12 months stood at 100 percent for DSClear and RoClear and exceeded 99.9 percent (in terms of both number and value of the instructions) for SaFIR. According to the ESCB-CESR Recommendation 3 for the securities settlement systems in the EU, a level lower than 95 percent of the transactions settled (in value terms) is seen to trigger concern. The values of these indicators show that the systems in Romania operate at comfortably safe parameters due to the effective measures aimed at promoting settlement discipline. Moreover, during the past 12 months, the availability ratios9 for DSClear and RoClear stood at 100 percent and exceeded 99.99 percent for SaFIR. The availability ratio for SaFIR is higher than the level agreed upon with the NBR and STFD – TRANSFOND (the technical operator of this system), no major failures being reported.
5 The request of a legal opinion is also mentioned in Core Principles for Systemically Important Payment Systems, issued by the BIS, January 2001, http://www.bis.org/publ/cpss43.htm.
6 DSClear and RoClear systems are used mainly for depositing securities and settling the transactions in securities within the markets/systems operated by Sibiu Stock Exchange and Bucharest Stock Exchange, as well as on the OTC market.
7 SaFIR ensures (i) the depositing of government securities issued by the Ministry of Public Finance on the domestic market and the certifi cates of deposit issued by the NBR, as well as (ii) the registration of other securities eligible for transactions with the NBR, deposited with systems in Romania and abroad, with which various types of connections have been established - RoClear (Romania), Euroclear (Belgium), Clearstream (Luxembourg) and DTC (SUA). Moreover, SaFIR (1) settles transactions made on the primary and secondary markets fo government securities, including those resulting from monetary policy operations and the transactions intended as collateralising the liquidity provided by the NBR with a view to improving the settlement fl ow in ReGIS payment system; (2) manages the collateral associated with the settlement of net debit positions calculated by the administrators of other systems (DSClear and RoClear) and payment schemes (Visa Europe and MasterCard International); (3) processes corporate actions for the securities deposited with SaFIR.
8 The settlement ratio represents the percentage ratio of transactions settled on the specifi ed settlement date to total transactions within the system, during an assessment period; the indicator measures particularly the effectiveness of the measures intended to promote settlement discipline.
9 The availability ratio represents the percentage ratio of the actual duration and the scheduled duration of the functioning of a system during the reference period; it is one of the key indicators illustrative of the operational risk management in terms of the technical availability of a system.

FINANCIAL STABILITY REPORT 2013 149
6 Financial system infrastructure – stability of payment and securities settlement systems
Activity of SaFIR settlement system
In terms of the relevance for the fi nancial sector and the economy in general, SaFIR stands out from among the other settlement systems operating at national level, as a result of: (i) the role of SaFIR in the domestic fi nancial architecture; (ii) the market share of this system in terms of the total value of processed instructions10; (iii) the features of the processed transfer instructions11; (iv) the impossibility of a fast substitution of the services to the government securities market, and (v) the small size of the Romanian capital market served by DSClear and RoClear.
The number of participants in SaFIR remained relatively constant over the past years12, which is a relatively different trend from that seen in other systems owned by central banks in the EU (Chart 6.10.), where the number of participants posted ample fl uctuations. The constant number of participants in SaFIR can also be attributed to the fact that participating in this system is one of the conditions that credit institutions need to fulfi l in order to be eligible for monetary policy operations involving trades in government securities and/or certifi cates of deposit, as well as for having access to the intraday liquidity facility, provided by the NBR with a view to improving the settlement fl ow in ReGIS.
The positive balance on government securities issues by the Ministry of Public Finance (MPF) in relation to redemptions refl ected in the sustained increase in the total value13 of the securities registered with SaFIR (Chart 6.11), with its steady growth rate, faster than that
reported by other similar infrastructures, being expected to slow down in the period ahead should the fi scal consolidation carry on. In the past, the funding needs for covering the budget defi cit, on the one hand, and investors’ reluctance regarding longer-term maturities, on the other hand, pushed the total value of Treasury certifi cates registered with SaFIR higher. Nevertheless, the efforts made by the MPF in the past two years to improve the term structure of public debt, in favour of medium- and long-term funds, including from the domestic market, contributed to the reversal of the trend manifest in the previous years in the share of Treasury certifi cates in the total value of the securities registered with SaFIR. At end-June 2013, Treasury certifi cates accounted for 13 percent of the total value of the securities (the value of Treasury certifi cates equalled roughly lei 14 billion), compared
10 Based on the total value of processed instructions, the market shares of the securities settlement systems in Romania in 2012 were: 99.34 percent – SaFIR; 0.65 percent – RoClear; below 0.01 percent – DSClear.
11 On the one hand, most of the instructions processed within SaFIR may be seen as critical in terms of the time by which they need to be settled. On the other hand, the average value of instructions settled in 2012 totalled around lei 71 million.
12 At end-September 2013, SaFIR comprised 38 participants, among which two administrators of central securities depositories and securities settlement systems (Clearstream Banking Luxembourg and Central Securities Depository).
13 The nominal value of: (i) Treasury certifi cates and government bonds deposited with SaFIR; (ii) bonds deposited with Euroclear, DTC, Clearstream and RoClear, transferred to and registered with SaFIR.
Chart 6.10. Number of participants in various systems held by central banks (international comparison, end of period)
0
15
30
45
60
75
90
2008 2009 2010 2011 2012
SaFIR (Romania) RPW (Poland)BOGS (Greece) SITEME (Portugal)GSD (Bulgaria) SKD (Czech Republic)
participants
Source: ECB (Securities trading, clearingand settlement, July 2013)

NATIONAL BANK OF ROMANIA150
6 Financial system infrastructure – stability of payment and securities settlement systems
with around 51 percent in 2009 and 2010 (Chart 6.12.). The breakdown of securities registered with SaFIR was also marginally infl uenced by making the links with Euroclear and RoClear operational (October 2011 and April 2012 respectively), which allowed the transfer to the system held by the NBR of the foreign currency-denominated government bonds issued by the MPF abroad, as well as of leu-denominated bonds issued by the international fi nancial institutions on the domestic and foreign capital markets14. At end-June 2013, the total value of bonds registered with SaFIR was tantamount to around lei 97 billion.
Chart 6.11. Value of securities registered with various systems held by central banks (international comparison, end of period)
Chart 6.12. Breakdown of securities registered with SaFIR by value (end of period)
010203040506070
2008
2009
2010
2011
2012
Jun.
2013
EUR bn.
SaFIR (Romania)RPW (Poland)SITEME (Portugal)GSD (Bulgaria)SKD (Czech Republic)
Source: ECB (Securities trading, clearingand settlement, July 2013), NBR
Note: The latest available data for foreignsystems refer to end-2012.
0
20
40
60
80
100
2008
2009
2010
2011
2012
Jun.
2013
percent
bonds Treasury certificates
Source: NBR
The number and value of issues/redemptions of bonds within SaFIR were almost permanently lower than those of Treasury certifi cates in the past years, on account of both the latter’s shorter maturities, which involves the frequent rollover of public debt, and the fact that the issues of Treasury certifi cates are exclusively registered with SaFIR. Year 2012 and 2013 H1witnessed a different picture as regards the number and value of bond issues in relation to the Treasury certifi cate issues, following the efforts to raise medium- and long-term funds (Charts 6.13. and 6.14.).
14 At end-June 2013, the value of securities transferred to SaFIR via the links established with other systems was about lei 444 million.

FINANCIAL STABILITY REPORT 2013 151
6 Financial system infrastructure – stability of payment and securities settlement systems
Chart 6.13. Number and value of issues registered with SaFIR
Chart 6.14. Number and value of redemptions via SaFIR
0
14
28
42
56
70
0
10
20
30
40
50
2008
2009
2010
2011
2012
Jun.
2013
number of bond issuesnumber of Treasury certificate issuesvalue of bond issues (rhs)value of Treasury certificate issues (rhs)
Source: NBR
issues lei bn.
0
10
20
30
40
50
0
10
20
30
40
50
2008
2009
2010
2011
2012
Jun.
2013
number of bond redemptionsnumber of Treasury certificate redemptionsvalue of bond redemptions (rhs)value of Treasury certificate redemptions (rhs)
Source: NBR
redemptions lei bn.
The pick-up in activity on the secondary market for government securities, correlated with the higher value of issues by the MPF and the increase in the NBR’s operations, translated in the upward trend in the number and value of instructions settled through SaFIR over the past years (Chart 6.15.), year 2012 witnessing a fast-paced growth of the total value settled via this system (the equivalent of about EUR 437 billion). 2013 H1 shows a year-on-year decline in the value of instructions settled, despite the persistent upward path in the number of instructions settled (around 18 thousands).
The weight of delivery versus payment instructions settled in lei declined in the past years, in terms of both number (Chart 6.16.) and value (Chart 6.17.), given the larger share of instructions settled in euro. In 2012, the downward trend in the share of the instructions settled in lei saw a reversal (especially in value
terms), as a result of the central bank’s liquidity injections. On the other hand, in 2013 H1, the number
Chart 6.15. Number and value of instructions settled via SaFIR
0
100
200
300
400
500
600
0
5
10
15
20
25
30
2008
2009
2010
2011
2012
Jun.
2013
number of settled instructions
value of settled instructions (rhs)
Source: NBR
instructions thou. EUR bn.

NATIONAL BANK OF ROMANIA152
6 Financial system infrastructure – stability of payment and securities settlement systems
and value of free of payment transactions increased their weights (to around 8 percent and 6 percent respectively)15.
Chart 6.16. Breakdown of instructions settled via SaFIR by number
Chart 6.17. Breakdown of instructions settled via SaFIR by value
70
80
90
100
2008
2009
2010
2011
2012
Jun.
2013
percent
free of payment instructions
instructions settled in EUR
instructions settled in lei*
70
80
90
100
2008
2009
2010
2011
2012
Jun.
2013
percent
free of payment instructionsinstructions settled in EURinstructions settled in lei*
* The shares of settlement instructions in lei also refer to the settlement instructions in US dollars, with the latter holding a very low weight.
Source: NBR
Changes to the architecture and operational rules of DSClear and RoClear securities settlement systems
Having in view its tasks set by law on the oversight of payment and securities settlement systems, the NBR completed in 2012 the assessments of DSClear and RoClear systems based on the applicable EU standards (ESCB-CESR Recommendations for securities settlement systems in the EU). The assessments focused on the degree of compliance of the architecture of the said systems and their functioning with the relevant EU standards, on the one hand, and on the measures to be taken to correct the defi ciencies, on the other hand. The fi ndings of these assessments, presented in detail in the previous report, revealed certain small-scale defi ciencies associated with the legal and operational risk management, as well as with the need to mitigate liquidity and credit risk, especially in the case of settlement on a net basis.
Subsequent to the completion of the assessments, the administrators of DSClear and ROClear took the necessary steps to correct the defi ciencies identifi ed by the NBR and progress was made with respect to: (i) ensuring compliance of these systems’ rules with the applicable primary and secondary legislation; (ii) mitigating the replacement cost risk; (iii) assessing the implications of a shorter settlement cycle for securities transactions anticipated at EU level; (iv) analysing the opportunity 15 Based on SaFIR rules, free of payment transactions include mainly transfers of portfolios; updates of the participants
account balances following the transactions settled in the systems of other central securities depositories; foreclosure of collateral by appropriation; substitutions and margin calls within repo transactions.

FINANCIAL STABILITY REPORT 2013 153
6 Financial system infrastructure – stability of payment and securities settlement systems
to use a central counterparty in order to guarantee the settlement of transactions, and (v) shortening the period of time during which the funds are blocked in the net settlement process. Nevertheless, there are still various aspects for the administrators of DSClear and ROClear to correct in the period immediately ahead, among which: (1) improving the transparency of the legal framework applicable to the systems and their functioning, (2) strengthening the good governance of the systems’ administrators, (3) using, for the purpose of system operation, of main and secondary locations with different risk profi les, (4) formulating a preliminary plan to allow the participants’ continuity of access to the central depositories’ functions even in case of the latter’s insolvency. The adoption of the measures aimed at the management of risks specifi c to net settlement systems, particularly the measures that ensure the necessary conditions for the timely settlement where the participant having the largest net debit position is unable to settle, is of utmost importance. In this respect, the NBR formulated and forwarded to the administrators of DSClear and RoClear specifi c proposals regarding the adequate level, in terms of relevant EU standards, of the fi nancial collateral set up with the systems, as well as regarding the extension of the lists of assets that can be used as collateral. The implementation of the latter measure proposed by the NBR will also lead to a lower opportunity cost incurred by the participants.
It is noteworthy that most of the above-mentioned unsolved aspects are the subject to new international standards and EU draft regulations so that the consistent and full implementation of all the measures recommended by the NBR following the assessment of DSClear and RoClear systems will contribute to the harmonisation of the new regulations in the fi eld over a reasonable time horizon.
6.4. The extension of central bank’s tasks in the fi eld of payments
The EU regulatory framework in the payments area was amended by Regulation (EU) No. 260/2012 of the European Parliament and of the Council establishing technical and business requirements for credit transfers and direct debits in euro and amending Regulation (EC) No. 924/2009.
The drafting of this regulation was aimed at speeding up the completion of an integrated market for intra-EU electronic payments, such as credit transfers and direct debits in euro. To this end, this piece of legislation sets clear and mandatory deadlines relative to the migration to the SEPA standards for all EU providers of payment services, such as credit transfers and direct debits in euro, and requires the use of technical standards for this type of transactions.
The use of these standards is a precondition for ensuring the full interoperability in the EU and will allow the payment services users to perform, under similar conditions, credit transfers and direct debits in euro across the EU.
In view of enforcing the EU law setting forth, among other, the Member States’ obligations to appoint one or several competent national authorities charged with the observance of the regulation, a legislative process was initiated in Romania amending the national legal framework in the fi eld.

NATIONAL BANK OF ROMANIA154
7 RECENT DEVELOPMENTS AND OUTLOOK
In the context of changes to the micro- and macroprudential regulatory framework across the European Union, the outcome of the assessments on the impact of the CRD IV/CRR package generally points to the compliance of credit institutions in Romania both with the new capital requirements and with the liquidity requirements. The efforts meant to revise the regulatory framework include the establishment of the National Committee for Macroprudential Oversight and, in particular, the development, transposition and implementation of various components underlying the proposal for a Banking Union.
7.1. CRD IV/CRR impact on the Romanian banking system
The ongoing global fi nancial crisis, which broke out in the Unites States as a subprime mortgage crisis and continued with several bank failures before extending into a sovereign debt crisis, has revealed to national and European authorities the weaknesses of the regulatory and supervisory framework in place, characterised by deregulation, loose capital requirements and unsustainable credit growth. Hence, with a view to safeguarding fi nancial stability, many governments had to provide fi nancial assistance to ailing banks, via bailouts of unprecedented magnitude.
The CRD IV/CRR legislative package adopted by the European Parliament and implementing the new Basel III requirements draws on the lessons of the recent crisis and includes provisions on: (i) applying stricter requirements in terms of capital quantity and quality compared to the previous regulations (Basel I and Basel II); (ii) introducing an additional item to capital requirements, namely the leverage ratio1; (iii) introducing minimum standards on liquidity risk, and (iv) introducing specifi c requirements aimed at mitigating the pro-cyclicality of lending. They are described in further detail below.
The overarching goal of the new rules is to strengthen fi nancial system resilience in each Member State and hence across the entire European Union. The new capital and liquidity requirements ensure that credit institutions are better placed to absorb economic shocks and better prepared to fulfi l their fi nancial intermediation task, namely continuing to sustainably fi nance the real sector. Special importance is also attached to the cooperation among authorities in the Member States and between the latter and various EU bodies, such as the ECB, the ESRB and the EBA. This approach will guarantee the coordination of regulatory and supervisory measures, given the high degree of fi nancial system interconnectedness worldwide and the need to ensure a level playing fi eld for all fi nancial institutions while limiting regulatory arbitrage.
1 See Chapter 3.2. “The banking sector”, Section 3.2.4. “Capital adequacy”, for a more in-depth analysis of this requirement. Pursuant to the provisions of Regulation (EU) No. 575/2013 of the European Parliament and of the Council on prudential requirements for credit institutions and investment fi rms, aimed at implementing Basel III requirements, the leverage ratio shall be calculated based on total exposure, i.e. total assets and off-balance sheet items not deducted when determining the Tier 1 capital at book value. The leverage ratio is a supplementary measure to the indicators calculated based on risk-weighted exposures.

FINANCIAL STABILITY REPORT 2013 155
7 Recent developments and outlook
7.1.1. Capital requirements laid down in CRD IV/CRR
The new prudential regulatory framework sets forth a minimum requirement for Common Equity Tier 1 capital2 (CET1) equal to 4.5 percent of risk-weighted assets (the minimum requirement according to the current regulation is 2 percent). The total capital requirement (both Tier 1 and Tier 2) an institution will need to hold remains at 8 percent of risk-weighted assets. Some requirements are added to the aforementioned minimum requirements, which need to be met with an additional amount of the highest quality of capital (i.e. CET1 capital), as follows: (i) a capital conservation buffer of 2.5 percent of risk-weighted assets, applicable on a permanent basis to all EU banks; (ii) a countercyclical capital buffer (of up to 2.5 percent), applicable by each Member State depending on the economic cycle; (iii) a systemic risk buffer for the fi nancial sector as a whole or one or more subsets of institutions; (iv) a systemic institution buffer, applicable to both globally and domestically important institutions.
The objective of the capital conservation buffer is to build up reserves in good times so as to absorb losses during a downturn. The requirement is mandatory for all credit institutions and large investment fi rms. By way of derogation, a Member State may exempt small and medium-sized investment fi rms from this requirement provided that: a) the decision is fully reasoned and includes an explanation as to why the exemption does not threaten the stability of the fi nancial system of the Member State; b) the exact defi nition of the small and medium-sized investment fi rms which are exempt is provided.
The countercyclical capital buffer
The CRD IV/CRR package, which has introduced the Basel III provisions into the EU legal framework and is pending transposition into national law, brings to the fore – alongside more conservative capital requirements – the implementation of a countercyclical buffer. The purpose of the tool is to enhance banking sector resilience to potential losses induced by excessive credit growth.
The setup of this buffer during expansionary credit growth, as an addition to the capital conservation buffer, allows for the release of the reserves during the contraction phase of the economic cycle in order to absorb losses, but it also has an indirect positive effect by preventing excessive bank deleveraging. According to Recommendation ESRB/2013/13, the implementation of this countercyclical tool aims to attain an intermediate objective of macroprudential policies, i.e. “to mitigate and prevent excessive credit growth and leverage”. The buffer could help contain the credit growth cycle via a reduction in credit supply and hence a corresponding increase in lending costs.
According to the guidelines4 released by the Basel Committee on Banking Supervision (BCBS), the starting point in determining the countercyclical buffer should be the credit-to-GDP ratio measured as a deviation from its long-term trend. The national authorities would activate the countercyclical buffer if the credit-to-GDP ratio exceeded an upper threshold set beforehand based on quantitative analyses. However, the signals conveyed by the credit-to-GDP guide should be properly assessed, so as to avoid any unnecessary action or, on the contrary, inaction. The document issued by the Basel Committee proposes the following methodology, developed to assist the authorities in the implementation of this instrument: (1) calculate the aggregate credit-to-GDP ratio5, (2) estimate the credit-to-GDP gap 2 Only common shares are taken into account when calculating CET1, whereas preferred shares are excluded.3 Recommendation of the European Systemic Risk Board on intermediate objectives and instruments of macroprudential
policy.4 Guidance for national authorities operating the countercyclical capital buffer (2010). The main variables proposed refer
to asset prices, CDS spreads, credit conditions, real GDP growth, etc.5 The methodology uses a broad defi nition of credit, capturing all sources of debt funds for the private sector (including
funds raised abroad).

NATIONAL BANK OF ROMANIA156
7 Recent developments and outlook
(the gap between the ratio and its long-term trend), using a Hodrick-Prescott fi lter6, (3) set the thresholds for activating the buffer and defi ne the calculation method based on the deviation from the trend7 and, possibly, (4) supplement the buffer with other macroprudential tools. The buffer should be released in the event of the following scenarios materialising: (i) when losses in the banking system pose a risk to fi nancial stability, and (ii) in times of stress across the fi nancial system.
Empirical evidence generally points to a good predictive power of the credit-to-GDP indicator variable, except for developing countries8. The drawbacks of a purely statistical measure call for the need that authorities retain a degree of fl exibility at national level9. In this vein, the Basel Committee recommendations refer to complementing the assessment based on the credit/GDP guide with additional evidence supplied by indicator variables that help identify credit cycle phases. These variables can be divided into the following groups: (1) macroeconomic or macrofi nancial variables likely to capture the build-up of systemic vulnerabilities (credit growth, information on the structure of credit, DSR (debt service ratio)10, LTV, equity prices, credit spread, indicators on the country’s external position, etc.), and (2) aggregate measures of banking sector performance, for quantifying the sector’s vulnerability to external shocks and the potential to generate fi nancial instability (solvency, profi tability, liquidity indicators). In line with the CRD IV framework, national authorities may decide on the actual date of applying or releasing the buffer, subject however to the prior notifi cation of activation decisions.
In the context of the national authorities introducing this buffer, pursuant to Directive 2013/36/EU, the ESRB may issue recommendations on the measurement and calculation of the deviation from long term trends of the credit-to-GDP ratio, as well as guidance on other signifi cant variables that indicate excessive credit growth. The authorities shall assess the countercyclical buffer on a quarterly basis and shall implement it gradually, should the national authority pass a decision in this regard, in the period from 2016 to 2018.
Based on the methodology developed by the BIS, the analysis conducted for Romania11 spanning the period from March 2000 to June 2013 points to excessive credit growth to non-fi nancial corporations and households both during September 2007 – June 2010 and early on into the analysed period (Chart 7.1.). The outcome for Romania highlights several drawbacks of this approach: (i) the short length of available time series impacts the reliability of results; (ii) the sensitivity of results to setting the methodology parameters, with a direct impact on the countercyclical buffer rate; (iii) a possible discrepancy between the credit level and short-term GDP dynamics, manifest June 2009 through June 2010; unfavourable GDP developments and the relatively unchanged bank 6 The methodology proposes a lambda of 400,000 for quarterly observations, assuming a credit cycle with a longer duration.7 The countercyclical buffer (as a percentage of risk-weighted assets) is activated when the credit-to-GDP ratio exceeds
its long-term trend by more than 2 percentage points. The buffer will linearly increase, reaching its maximum level (2.5 percent of risk-weighted assets) when the gap between the ratio and its trend is of minimum 10 percentage points.
8 According to Geršl, A. and Seidler, J. – Credit Growth and Countercyclical Capital Buffers: Empirical Evidence from Central and Eastern European Countries (2012), the methodology based strictly on the approach proposed by the BCBS has failed to yield optimal results for CEE countries; instead, the authors suggest an approach that incorporates a country’s economic fundamentals in order to identify excessive credit growth.
9 Usually, implementing any macroprudential instrument also raises the issue of opting for the type of approach, i.e. rules versus discretion (Report submitted by the Committee on the Global Financial System (2010), Macroprudential instruments and frameworks: a stocktaking of issues and experiences).
10 According to Drehmann, M. and Juselius, M. – Do debt service costs affect macroeconomic and fi nancial stability?, BIS Quarterly Review (2012), DSR tends to peak just before a systemic banking crisis materialises, and during a period of one year before the crisis, this indicator represents a better early warning signal than the one provided by the credit-to-GDP gap.
11 Credit-related data used in the simulation of results for Romania do not entirely refl ect the broad defi nition of credit, in line with BIS recommendations, covering only domestic bank loans to households and non-fi nancial corporations.

FINANCIAL STABILITY REPORT 2013 157
7 Recent developments and outlook
exposures in the context of the European Bank Coordination Initiative launched in January 2009 (whose key objective was, inter alia, preventing the wide-scale withdrawal of external fi nancing), and (iv) the need to complement it with an assessment of the credit breakdown. Had the countercyclical buffer been implemented during the aforementioned period, it would have been activated, without however reaching the maximum value (Chart 7.1.). Irrespective of the approach, there are currently no signals requiring the activation of the countercyclical buffer.
Chart 7.1. Credit-to-GDP gap in Romania (March 2000 – June 2013)
0.000.250.500.751.001.251.501.752.002.252.502.75
-10-8-6-4-202468
1012
2000
Q1
2000
Q3
2001
Q1
2001
Q3
2002
Q1
2002
Q3
2003
Q1
2003
Q3
2004
Q1
2004
Q3
2005
Q1
2005
Q3
2006
Q1
2006
Q3
2007
Q1
2007
Q3
2008
Q1
2008
Q3
2009
Q1
2009
Q3
2010
Q1
2010
Q3
2011
Q1
2011
Q3
2012
Q1
2012
Q3
2013
Q1
percentpercentage points
deviation from the trend lower threshold upper threshold countercyclical buffer rate (rhs)
Source: Monetary survey, NIS, NBR calculations
The analysis of lending to households and non-fi nancial corporations, complemented by indicators on households’ indebtedness level, lending standards, as well as the assessment of credit risk associated with bank lending, have pinpointed the alert credit growth that characterised the years 2007 and 2008. This allowed the NBR to signal the vulnerability on an ex ante basis and take further steps towards curbing fast lending growth, particularly in the case of the foreign currency component12.
The macroprudential toolkit for systemic risks and institutions
CRD IV allows the authorities to introduce in the national law additional capital requirements applicable to credit institutions and investment fi rms, with a view to mitigating (i) systemic risk, and (ii) the risks generated by systemic entities across the entire fi nancial system. The aforementioned additional requirements complement those on the capital conservation buffer and on the countercyclical capital buffer and need to be set up as Common Equity Tier 1. National authorities have three macroprudential instruments available to cover the mentioned systemic risks: (a) a systemic risk buffer, which may be required of all entities making up the fi nancial sector or one or more subsets; (b) a global systemic institution buffer, which may be enforced strictly at a consolidated level; (c) other systemic institution buffer, which includes domestically important institutions and may be enforced, as applicable, at a consolidated, individual or sub-consolidated level. The three buffers are structural in nature and they are not set depending on the economic cycle. As a rule, according to the provisions of the Directive, the above-mentioned macroprudential tools are not cumulative, but rather the highest buffer shall be applicable.
12 For further details, see Box 3. “Key measures that the National Bank of Romania initiated to curb the fast foreign currency-denominated lending growth in 2001-2010” in the 2011 Financial Stability Report.
NATIONAL BANK OF ROMANIA158
7 Recent developments and outlook
The use of this macroprudential toolkit will help achieve the objective of enhancing banks’ resilience to endogenous and exogenous shocks, by consolidating their loss-absorbing capacity, thus increasing fi nancial system resilience overall. The larger capital base will also contribute to containing the contagion effect, namely the impact that ailing entities could have on the fi nancial system and the real economy, particularly via the lending channel. Specifi cally, in good times, the enforcement of additional capital requirements may limit credit supply, thus containing unsustainable growth of asset prices13; during economic downturns, higher capital levels ensure a better loss-absorbing capacity, thereby enabling banks to ensure the continuation of the credit fl ow for the sustainable funding of the real sector, contributing to lower volatility of the gross domestic product.
a) Systemic risk buffer
Each Member State may introduce a systemic risk buffer in order to prevent and mitigate long-term non-cyclical systemic or macroprudential risks. The systemic risk buffer may apply to domestic exposures, to exposures located in other Member States, and to exposures in third countries. It shall be set in gradual or accelerated steps of adjustment of 0.5 percentage points. The systemic risk buffer rate ranges between 1 percent and 5 percent of the total risk exposure on an individual, consolidated and/or sub-consolidated basis. Moreover, national authorities may decide on setting the systemic risk buffer rate above 5 percent in the event of a signifi cant systemic risk becoming manifest. Different requirements may be introduced for different subsets of the fi nancial sector, depending on the magnitude of the identifi ed systemic risk.
According to the Directive, when requiring a systemic risk buffer to be maintained, the competent authority or the designated authority shall comply with the following: (a) the systemic risk buffer must not entail disproportionate adverse effects on the fi nancial system of other Member States or of the Union as a whole, forming or creating an obstacle to the functioning of the internal market; (b) the systemic risk buffer must be reviewed by the competent authority or the designated authority at least every second year. Before setting a systemic risk buffer rate, the competent authority or the designated authority shall notify the Commission, the ESRB, EBA and the competent and designated authorities of the Member States concerned. If the buffer applies to exposures located in third countries, the competent authority or the designated authority shall also notify the supervisory authorities of those third countries. Where the systemic risk buffer rate is to be set between 3 percent and 5 percent, the national authority shall await the opinion of the Commission before adopting the measures in question. The national authority shall publicly announce the setting of the systemic risk buffer. Member States shall apply the provisions of the Directive from 31 December 2013.
The National Bank of Romania shall assess in the period ahead the appropriateness of setting the systemic risk buffer either across the entire banking sector or for one subset of the sector, as well as the buffer rate depending on the identifi ed vulnerabilities. Where the credit institution is a subsidiary of a parent undertaking authorised in another Member State, the systemic risk buffer shall be set following the stages described in the European Directive (which include the notifi cation of the Commission, the ESRB and, if applicable, the EBA, and the adoption by the Commission of the decision enforcement act).
b) Global systemically important institution buffer
In line with the Directive, national authorities shall identify global systemically important institutions (G-SIIs)14 and update the list of identifi ed institutions on an annual basis, while allocating them to 13 From this perspective, the enforcement of additional capital requirements can reduce ex ante the likelihood of crises and/
or their magnitude on the fi nancial system and the real economy, both nationally and regionally/internationally. 14 For the purposes of the Directive, systemic signifi cance is the expected impact exerted by the G-SIIs’ distress on the
global fi nancial market.

FINANCIAL STABILITY REPORT 2013 159
7 Recent developments and outlook
various sub-categories. The result of the analysis shall be reported to the Commission, the ESRB and EBA and to the systemically important institutions concerned. The Directive also sets forth the obligation to disclose the updated list of identifi ed systemically important institutions to the public, as well as the sub-category15 into which each identifi ed G-SII is allocated. The identifi cation methodology for G-SIIs shall be based on the following categories: (a) size of the group; (b) interconnectedness of the group with the fi nancial system; (c) substitutability of the services or of the fi nancial infrastructure provided by the group; (d) complexity of the group; (e) cross-border activity of the group, including cross-border activity between Member States and between a Member State and a third country. The level of the buffer which may be set by the competent authorities as CET1 may range between 1 percent and 3.5 percent CET1 and apply from 1 January 2016 onwards, on a gradual basis until 2019.
Until the coming into force of the European Directive, the Financial Stability Board is in charge of identifying and publishing the list of global systemically important institutions on an annual basis, using the methodology developed by the BCBS. Based on the list disclosed on 1 November 2012, 28 banks have been identifi ed as global systemically important institutions. The Romanian banking system does not include any G-SIIs, but six of them have subsidiaries/branches in Romania, namely Citigroup, Royal Bank of Scotland, Groupe Credit Agricole, ING Bank, Société Générale, and Unicredit Group.
c) Other systemically important institution buffer
Similarly to the procedure stipulated in the Directive for the global systemically important institution buffer, national authorities shall: (i) identify and review on a yearly basis the list of “other” systemically important institutions (O-SIIs), which include domestically important institutions and EU important institutions; (ii) report the list to the Commission, the ESRB and EBA, and to the systemically important institutions concerned, and (iii) disclose the list of identifi ed systemically important institutions to the public.
Alongside the key objective of the buffer, i.e. improved resilience of domestic systemically important institutions, the use of this macroprudential instrument can help (i) address and control concentration risk across the domestic fi nancial system (given the capital surcharge applicable to these entities), and (ii) ensure a level playing fi eld for small and medium-sized entities, since systemic institutions’ lower funding cost is offset by the higher cost of capital.
According to the Directive, systemic importance shall be assessed on the basis of at least any of the following criteria: (a) size; (b) importance for the economy of the Union or of the relevant Member State; (c) signifi cance of cross-border activities; (d) interconnectedness of the institution or group with the fi nancial system. After consulting the ESRB, EBA shall publish by 1 January 2015 guidelines on the criteria for assessing O-SIIs, which shall take into account both the international framework16 and Union and national specifi cities. The O-SII buffer shall not exceed 2 percent of the total risk exposures.
Where an O-SII is a subsidiary of either a G-SII or an O-SII which is an EU parent institution and subject to an O-SII buffer on a consolidated basis, the buffer that applies at individual or sub-consolidated level for the O-SII shall not exceed the higher of: (a) 1 percent of the total risk exposures; and (b) the G-SII or O-SII buffer rate applicable to the group at consolidated level.
15 In line with the Directive, there shall be at least fi ve sub-categories of global systemically important institutions.16 A framework for dealing with domestic systemically important banks (D-SIBs), developed by the Basel Committee on
Banking Supervision and published in October 2012, which includes a set of principles on the assessment methodology for domestically important institutions and their additional loss absorbency requirements.

NATIONAL BANK OF ROMANIA160
7 Recent developments and outlook
Box 2. The impact of capital surcharges applicable to domestic systemically important banks on the Romanian system banking
The National Bank of Romania reviews the banking system from the perspective of systemically important credit institutions on a regular basis, following internal procedures based on the following criteria: (a) the credit institution’s contribution to the fi nancing of the real economy, calculated via the volume of corporate loans and the degree of substitution of lending to non-fi nancial corporations; (b) the credit institution’s contribution to fi nancial intermediation, calculated via the volume of household and corporate deposits; (c) the credit institution’s activity on the interbank market and assessing the contagion effect by incorporating the feedback loops generated by the real sector; (d) assessment of systemically important institutions within the ReGIS payment system; (e) the credit institution’s activity on the government securities market; (f) vulnerability to contagion in the parent-subsidiary relationship via the common lender channel (home country of the capital). The methodology for identifying systemically important credit institutions encompasses both quantitative and qualitative analyses. The assessments conducted by the central bank during 2013 H1 revealed seven credit institutions of high systemic importance, six of which are Romanian legal entities and one is a subsidiary of a foreign bank.
The simulations conducted by the NBR on credit institutions’ compliance with the new capital requirements introduced by the CRD IV/CRR package have shown that systemically important institutions fulfi l the minimum applicable capital requirements (i.e. a total capital of at least 8 percent of risk-weighted assets, plus the capital conservation buffer of 2.5 percent and the O-SII buffer of up to 2 percent), irrespective of whether the additional capital conservation requirements are implemented gradually or in advance. At end-2013 H1, the market share of systemically important credit institutions in total bank assets stood at 65.5 percent.
In line with the Directive, when requiring an O-SII buffer to be maintained, the competent authority or the designated authority shall comply with the same terms and conditions as in the case of the systemic risk buffer, i.e. it should not form or create an obstacle to the functioning of the internal market. The national authority shall review the buffer rate on an annual basis. Before setting or resetting an O-SII buffer, the competent authority or the designated authority shall notify17 the Commission, the ESRB, EBA and the competent and designated authorities of the Member States concerned one month before the publication of the decision.
The impact of CRD IV/CRR on credit institutions’ solvency
The NBR assessed the impact of introducing the new capital requirements set forth in CRD IV on the banking system via a questionnaire developed in line with EBA recommendations. Data reported by credit institutions should be interpreted with caution in this exercise, since CRD IV standards are under implementation in Romania. The 31 respondents, credit institutions Romanian legal entities, were classifi ed into 8 large credit institutions and 23 small-sized banks based on the distribution of total assets held.
The average capital ratio of small credit institutions, calculated in line with the new capital requirements laid down in CRD IV, exceeds by far that posted by large banks, although the latter reported a high ratio as well (Table 7.1.). The explanation for the close values of the three average capital ratios lies with the high and very high loss-absorption capacity of domestic credit institutions’ own funds, namely the relatively low volume of own funds other than CET1.
17 The Directive specifi es that the notifi cation shall describe in detail: (a) the justifi cation for why the O-SII buffer is considered likely to be effective and proportionate to mitigate the risk; (b) an assessment of the likely positive or negative impact of the O-SII buffer on the internal market, based on information which is available to the Member State; (c) the O-SII buffer rate that the Member State wishes to set.

FINANCIAL STABILITY REPORT 2013 161
7 Recent developments and outlook
Table 7.1. Capital ratios of credit institutions in Romania, according to the new capital requirements set forth in CRD IV (data as of 31 March 2013, average)
Number of credit
institutions
Common Equity Tier 1(CET1)
%Tier 1 capital
%Total capital
(Tier 1 + Tier 2) %
Large credit institutions 8 13.94 14.05 15.14Small credit institutions 23 21.59 21.59 22.63Total credit institutions 31 19.61 19.64 20.70Source: NBR
Unlike the large banks group, smaller credit institutions display a high degree of capital ratio heterogeneity (Chart 7.2.). Furthermore, the distribution of the three capital ratios across the Romanian banking sector highlights marginal differences between Common Equity Tier 1 (CET1) and Tier 1 capital, as well as slightly higher readings for total capital (Tier 1 + Tier 2), as a result of the overall high quality of own funds in the domestic banking sector at both aggregate and individual levels.
Chart 7.2. Capital ratios of credit institutions in Romania, according to the new defi nition of capital in CRD IV (data as of 31 March 2013)
Common Equity Tier 1 (CET1) Tier 1 capital Total capital (Tier 1 + Tier 2)
0
2
4
6
8
10
12
14
16
18
20
large creditinstitutions
small creditinstitutions
1st quartile median 3rd quartile
percentage points
0
2
4
6
8
10
12
14
16
18
20
large creditinstitutions
small creditinstitutions
0
2
4
6
8
10
12
14
16
18
20
large creditinstitutions
small creditinstitutions
Source: NBR
percentage points percentage points
Following the shift to the international accounting standards (IFRS), the NBR adopted Regulation No. 11 of 2011 on the classifi cation of loans and investments, as well as the establishment and use of prudential valuation adjustments18, whereby prudential fi lters were introduced, so that the shift to the IFRS would not entail the artifi cial improvement of prudential indicators and to avoid any detrimental impact on fi nancial stability.
Under a scenario incorporating the full implementation of the capital conservation buffer (2.5 percent) and of the O-SII surcharge (2 percent), all large credit institutions would comply with the CRD IV prudential rules, while only two smaller credit institutions would fail to fully meet the new capital 18 Later repealed by NBR Regulation No. 16 of 2012 on the classifi cation of loans and investments, as well as the
establishment and use of prudential valuation adjustments.

NATIONAL BANK OF ROMANIA162
7 Recent developments and outlook
requirements (Table 7.2.). As regards systemically important credit institutions, they are among the eight large banks and are bound to additionally fulfi l the requirement related to the systemic institution buffer. The countercyclical buffer is currently set at 0 percent, according to the results of the assessment described above.
Table 7.2. The number of credit institutions that meet the minimum capital requirements laid down in CRD IV, under a scenario incorporating the full implementation of the capital conservation buffer starting in the fi rst year of enforcing CRD IV requirements (data as of 31 March 2013)
Common Equity Tier 1
(CET1)
Tier 1 capital(Tier 1)
Total capital
(Tier 1 + Tier 2)
Capital conservation
bufferO-SII buffer
Large credit institutions 8/8 8/8 8/8 8/8 8/8Small credit institutions 22/23 22/23 22/23 21/23 23/23Total credit institutions 30/31 30/31 30/31 29/31 31/31
Note: The 31 credit institutions participating in the nationwide assessment were classifi ed into eight large banks and 23 small institutions.
Source: NBR
Assuming a gradual implementation of the capital conservation buffer, only one small credit institution would fail to fully meet the new capital requirements set forth in CRD IV. To sum up, the CRD IV has a low impact in terms of capital requirements for credit institutions Romanian legal entities, since only one or two small entities would need to raise additional capital or to adjust capital items or the risk exposure values.
7.1.2. Credit institutions’ liquidity in the context of the CRR
Regulation (EU) No. 575/2013 of the European Parliament and of the Council on prudential requirements for credit institutions and investment fi rms and amending Regulation (EU) No. 648/2012 (the Capital Requirements Regulation – CRR) defi nes and standardises two liquidity risk indicators: the liquidity coverage ratio (LCR) and the net stable funding ratio (NSFR).
According to the liquidity coverage requirement, credit institutions should have a suffi cient stock of liquid assets available at any time to enable them to cope with liquidity mismatches in case of net cash outfl ows in stressed conditions over a thirty day period. The stable funding requirement is a longer-term structural indicator of potential maturity mismatches, aimed at encouraging credit institutions to use stable sources of funding.
The CRR, which shall apply from 1 January 2014, only provides for credit institutions’ obligation to report the two indicators, while minimum binding standards shall be introduced at a later stage, via delegated acts adopted by the European Commission. Specifi cally, the CRR stipulates the phase-in of the LCR from 60 percent as of 1 January 2015 and increasing on a graduated basis to 100 percent in January 2018. The introduction of a 100 percent binding minimum standard for the liquidity coverage requirement may be deferred until 1 January 2019. As far as the NSFR is concerned, the CRR does not specify a clear date for its introduction as a binding standard. Instead, the Regulation sets forth that, by 31 December 2016, the Commission shall submit a legislative proposal to the European Parliament and the Council on how to ensure that credit institutions use stable sources of funding. At the same time, Member States may accelerate the implementation of indicators at national level.

FINANCIAL STABILITY REPORT 2013 163
7 Recent developments and outlook
Box 3. The impact of the CRR liquidity requirements on the domestic banking sector
In order to assess the impact of the new requirements on the Romanian banking sector, the NBR launched in 2013 a data collection exercise19 in line with European legislation. A caveat is warranted in relation to the outcome of the exercise, since the results are based on the fi rst reporting of data according to the CRR and hence there may have been differences in interpreting the Regulation provisions by credit institutions. In order to validate the results, an impact assessment was conducted in parallel, using the data reported by credit institutions pursuant to the domestic legislation in force in the area of liquidity risk (Regulation 25/2011 on credit institutions’ liquidity). The reported values of various balance-sheet or off-balance-sheet items under consideration are not fully comparable, especially in terms of data granularity. Although there have been differences in the value of the indicator calculated via the two methods, both approaches have generally yielded similar results regarding credit institutions’ compliance or non-compliance with the limits set for the LCR. The questionnaire-based results of the assessment were obtained from data collected from 34 credit institutions, accounting for 97.4 percent of total banking system assets.The main liquid assets currently in credit institutions’ portfolio are Romanian government securities and funds held with the central bank, particularly as minimum required reserves20. As regards the latter category, a decision will be taken at national level in the period ahead whether to include the minimum required reserve or not in the stock of liquid assets for the purposes of the LCR indicator.According to data as at 31 March 2013, all credit institutions meet the 60 percent minimum requirements laid down in the Regulation for the LCR on 1 January 2015, with a signifi cant share of these entities complying with the 100 percent threshold. Thus, systemically important credit institutions fulfi l the 100 percent minimum requirement, whereas four non-systemically important entities only meet the 60 percent threshold. Credit institutions with an above-par LCR make up around 91 percent of total bank assets. The indicator has been determined by incorporating the minimum required reserve in the liquid assets category (Chart 7.3.).
Chart 7.3. The LCR indicator including required reserves
Chart 7.4. The LCR indicator excluding required reserves
0
3
6
9
12
15
Systemically importantinstitutions
Non-systemicallyimportant institutions
minimummedianmean
Source: NBR questionnaire, NBR calculations
interquartile range
0
1
2
3
4
5
6
7
8
Systemically importantinstitutions
Non-systemicallyimportant institutions
minimummedianmean
Source: NBR questionnaire, NBR calculations
interquartile range
If the required reserve is excluded, 26 entities (accounting for about 77 percent of total assets in the banking system) would meet the 60 percent minimum requirements for LCR, with only one systemically important institution failing to comply with the threshold (Chart 7.4.). The CRR does not specify the methodology for calculating the NSFR indicator, which is to be set at a later stage.Over the period ahead, the NBR will continue to conduct several assessments in order to determine the impact, the limits and the manner of using national options in line with the new European legislative framework vis-à-vis the domestic banking sector.
19 20
19 The exercise used the reporting templates in the consultation paper EBA/CP/2013/04.20 As at 31 March 2013, the minimum required reserve across the banking system accounted for approximately 11 percent
of total assets or 41 percent of liquid assets reported by credit institutions in the questionnaire.

NATIONAL BANK OF ROMANIA164
7 Recent developments and outlook
7.2. Recent developments in the prudential regulatory framework
Since the fi nancial crisis has highlighted the need for adequate regulation and effective supervision of the fi nancial system, signifi cant changes are underway in the micro- and macroprudential regulatory framework both across the European Union and at national level.
7.2.1. The National Committee for Macroprudential Oversight
According to the Recommendation of the ESRB of 22 December 2011 on the macroprudential mandate of national authorities (ESRB/2011/3), each Member State shall designate in the national legislation an authority entrusted with the conduct of macroprudential policy across the domestic fi nancial system. A draft Government Emergency Ordinance on the macroprudential oversight of the national fi nancial system has been prepared in light of the ESRB Recommendation.
In particular, the draft ordinance provides for the establishment of the National Committee for Macroprudential Oversight (hereinafter “the Committee”) as an inter-institutional cooperation forum and non-legal entity, whose objective is to ensure the coordination of macroprudential oversight of the domestic fi nancial system by defi ning the macroprudential policy and determining the adequate tools for its enforcement. The Committee incorporates the authorities playing a signifi cant role in safeguarding fi nancial stability, namely the NBR, the FSA and the MPF. The organisational structure of the Committee includes the General Board, a technical committee on systemic risk, a technical committee on fi nancial crisis management and a Secretariat, ensured by the NBR. General Board meetings are also attended by a representative of the Bank Deposit Guarantee Fund as observer.
The fundamental objective of the Committee is to contribute to safeguarding fi nancial stability, also by enhancing fi nancial system resilience and by containing the build-up of systemic risks, thereby ensuring a sustainable contribution of the fi nancial sector to economic growth. In the pursuit of its objective, the Committee shall be operationally independent, in the sense that it cannot receive instructions from other public or private entities.
The key tasks of the Committee include: (i) identifying, monitoring and assessing systemic risks; (ii) identifying the fi nancial institutions and structures that are systemically relevant; (iii) preparing the strategy on the macroprudential policy; (iv) issuing recommendations and warnings with a view to preventing or mitigating systemic risks; (v) monitoring the implementation of recommendations issued by the ESRB or the Committee and of the measures taken by the national authorities as a follow-up to recommendations or warnings from the two entities.
In addition, the Committee shall cooperate and exchange information with microprudential supervisory authorities and equivalent authorities in other Member States or at EU level. The Committee may issue recommendations both for national microprudential supervisory authorities, according to their areas of competence, and for the government, when legislative proposals are warranted in order to preserve fi nancial stability. Non-compliance with ESRB recommendations needs to be adequately justifi ed.
As regards transparency and accountability, the Committee shall: (i) ensure the timely disclosure of macroprudential policy decisions to the public, unless there are risks to fi nancial stability in doing so,

FINANCIAL STABILITY REPORT 2013 165
7 Recent developments and outlook
(ii) have the power to make statements on systemic risk, (iii) be held accountable to the Parliament, and (iv) enjoy legal protection, its staff included, when they act in good faith.
Assigning a leading role to the NBR in the macroprudential policy and ensuring that macroprudential policy does not undermine its independence are both in line with EU-wide approaches, including with the provisions of the ESRB Recommendation of 22 December 2011, regarding central banks’ powers and responsibilities in the area of fi nancial stability and, where applicable, in the area of microprudential supervision.
7.2.2. The Banking Union
The EU economic governance framework has undergone extensive reconfi guration since the latest Financial Stability Report. Particular mention should be made of the Banking Union project, initially developed as a solution across the euro area and participating Member States to address several challenges facing the European fi nancial system in the wake of the recent global fi nancial crisis. The Banking Union project aims, inter alia, to: (i) halt the fragmentation trend on EU fi nancial markets, which is at odds with the EMU and the single market; (ii) strengthen fi nancial stability; (iii) break the negative feedback loop between banks and sovereigns; (iv) restore the proper functioning of the monetary policy transmission mechanism, and (v) establish a single supervisory mechanism operated by the ECB across the euro area, as a prerequisite for the direct recapitalisation of ailing credit institutions via the European Stability Mechanism. The Banking Union is based on a single rulebook and its key building blocks are the Single Supervisory Mechanism (SSM), the Single Resolution Mechanism (SRM) and the network of deposit guarantee schemes (DGS).
The recommendation for the establishment of a single rulebook for European fi nancial institutions dates back to the European Council of June 2009. In the context of this recommendation, the harmonised framework for the prudential regulation and supervision of credit institutions is implemented both through the efforts of the European Banking Authority – namely detailing the European legislative framework and issuing the binding technical standards, along with guidelines and recommendations – and by transposing the Basel III international standards into European law. The latter shall occur upon the coming into force of the CRD IV package of prudential regulations on credit institutions’ own funds requirements. Consequently, the single rulebook will help reduce regulatory arbitrage and will require credit institutions to maintain suffi cient levels of own funds and liquidity so as to enable them to better manage operational risks and cover potential losses.
Under the Single Supervisory Mechanism21, the ultimate responsibility for prudential supervisory tasks related to the fi nancial stability of all euro area banks lies with the ECB. Specifi cally, the ECB shall: (i) ensure the uniform application of the single rulebook on a group-wide basis for euro area credit institutions; (ii) supervise directly the most signifi cant credit institutions, and (iii) monitor the supervisory practices of less signifi cant credit institutions by the competent national authorities. For SSM purposes, credit institutions shall be considered as signifi cant depending on their asset size, the asset-to-GDP ratio, cross-border activity and on direct fi nancial assistance from the European Stability Mechanism. In addition to directly supervising smaller banks, national supervisors will assist the ECB in the supervision of signifi cant credit institutions and carry out day-to-day supervisory tasks relating to money laundering and payment services. The SSM is open to allnon-Eurozone countries willing to participate, based on a close cooperation agreement between the
21 Commission proposal of 12 September 2012 on new ECB powers for banking supervision as part of a banking union.

NATIONAL BANK OF ROMANIA166
7 Recent developments and outlook
competent national authorities and the ECB. The European Banking Authority will be responsible for ensuring effective and consistent implementation of the single rulebook both within the SSM and in member countries outside this mechanism.
The introduction of a harmonised EU-wide resolution framework via the proposal for a Directive of the European Parliament and of the Council establishing a framework for the recovery and resolution of credit institutions and investment fi rms (the Bank Recovery and Resolution Directive – BRRD) will help minimise the systemic and fi scal consequences of bank failures. The shift in the resolution costs from governments to credit institutions’ shareholders and creditors (burden sharing arrangement, bail-in versus bail-out, when taxpayers take the fi scal burden of a bank failure) shall observe the “no creditor worse off” principle, according to which no creditor incurs greater losses than would be incurred if the institution were to be wound down under normal insolvency proceedings.
The Single Resolution Mechanism proposed by the Commission, with its Single Bank Resolution Fund22, is a complementary solution to SSM participation, aimed at the consistent and effective implementation of the BRRD by setting up an adequate bank resolution framework, which could be used when the troubles faced by a credit institution would raise problems from a public interest point of view. The Single Resolution Mechanism would work as follows: (i) the ECB would signal when a credit institution needs to be resolved; (ii) the Single Resolution Board, consisting of an Executive Director, a Deputy Executive Director and representatives from the ECB, the European Commission and the relevant national authorities, would defi ne the approach for resolving the bank; (iii) on the basis of the Single Resolution Board’s recommendation, the Commission would decide whether and when to place a bank into resolution, and (iv) national resolution authorities would be in charge of the execution of the resolution plan. As regards the fi nancing of the resolution process, the Banking Union’s Single Bank Resolution Fund may make a contribution only after having exhausted the internal resources (at least 8 percent of the liabilities and own funds of the institution under resolution), provided that the contribution does not exceed 5 percent of the total liabilities including own funds of the institution under resolution. Where the 5 percent limit has been reached, in extraordinary circumstances, further funding may be sought from alternative fi nancing sources for euro area credit institutions, including via the European Stability Mechanism. The implementation of the Single Resolution Mechanism and hence of the Single Bank Resolution Fund is currently met with opposition from several Member States invoking the absence of legal grounds and the possibility of resorting to this authority after amending the EU Treaty.
As regards deposit guarantee schemes, it is not envisaged to equip the Banking Union with a single supranational DGS at this stage. A possible intermediate step in this sense would be adopting the DGS Directive and setting up a common network of national deposit guarantee schemes, with properly funded deposit guarantee funds. The adoption of the DGS Directive is a priority at European level, given its complementarity with the other two components of the Banking Union project.
The Banking Union project will impact both the microprudential supervisory practices and the macroprudential supervisory framework in the euro area and in the participating Member States. The scope of macroprudential supervision in the EU includes, at a cross-border level, the ESRB tasks on monitoring, preventing and mitigating systemic risk across the European fi nancial system, issuing warnings and recommendations, as well as its advisory tasks at EU level. Furthermore,
22 Commission proposal of 10 July 2013 for a Single Resolution Mechanism for the Banking Union.

FINANCIAL STABILITY REPORT 2013 167
7 Recent developments and outlook
at a national level, the competent authorities or designated authorities may enforce policies and use macroprudential tools, either on their own initiative or following ESRB recommendations or warnings. These two levels are complemented by the Single Supervisory Mechanism, which applies to credit institutions in participating Member States. As part of this mechanism, the ECB may adopt stricter measures than those taken by competent or designated national authorities with regard to capital buffers or systemic risk mitigation.
The Banking Union has an opt-in mechanism for non-euro area Member States, Romania included. Among the benefi ts of participating in this project, with direct positive implications at national level, are: strengthening fi nancial stability, increasing confi dence in the domestic banking system amid harmonised supervisory practices and deposit guarantee schemes, as well as supporting lending and economic growth by reducing fragmentation on European fi nancial markets. On the other hand, participation in the Banking Union would entail a reduction in terms of tools and decision-making at national level, primarily in the areas of prudential supervision and bank resolution, and would lead to expenses related to national contributions to the fi nancing of implemented mechanisms, especially for the Single Resolution Mechanism and the deposit guarantee schemes. Against this background, the assessments underlying the opt-in/opt-out mechanism should take into account both the segregation of duties, tasks and responsibilities among participating entities and the ensuing fi nancial obligations. Hence, particular attention should be attached to the outcome of the talks on outstanding issues at European level.
According to the Memorandum titled “Romania’s position vis-à-vis the consolidation measures of the Economic and Monetary Union (EMU)”23, Romania supports the establishment of a genuine Banking Union and the strengthening of euro area governance, with the caveat that the process should not be detrimental to non-euro area Member States and thus contribute to fragmentation across the European Union.
Moreover, the NBR is of the opinion that the extension of the SSM scope so as to include all EU Member States would prove timely only after a reasonable transition period. However, SSM operation should take into consideration the need to strike a balance between feasibility and pace of implementation, given the ECB’s gradual take-up of actual responsibilities regarding the supervision of euro area credit institutions, in cooperation with and delegating tasks to relevant national supervisors. Several issues still need to be addressed from this point of view.
First, the other two components of the Banking Union, i.e. the SRM and the common network of national deposit guarantee schemes, need to be implemented in parallel and within a reasonable time frame, considering the complementarity of the Banking Union pillars, by understanding and solving from a political point of view their signifi cant implications on Member States’ public fi nances.
Second, stakeholders need to assess the possible negative consequences that SSM/Banking Union implementation in the euro area could have on non-Eurozone countries and take steps towards eliminating any such consequences. In particular, additional fi nancial sector fragmentation may occur owing to possible banking structure changes in non-euro area host Member States (with parent banks converting their subsidiaries into branches), compounded by possible incentives for deleveraging, also due to circumstantial reasons.
23 Approved by the Government of Romania on 4 December 2012.

NATIONAL BANK OF ROMANIA168
7 Recent developments and outlook
Third, the implementation of a two-layer prudential supervisory framework (the ECB plus the national authorities) calls for identifying an effective cooperation mechanism between these entities and sorting out the actual mechanism for settling any divergent opinions among home-host authorities.
Additionally, prudential indicators in non-euro area Member States consolidated at levels above those recorded in parent banks’ home countries, thus counterbalancing the labelling of these emerging economies as vulnerable. Avoiding the erosion of these indicator readings over the medium term would underpin the efforts made by non-Eurozone countries towards preserving fi nancial stability.
At the same time, another relevant issue concerns the access to the ECB’s liquidity-providing facilities. Specifi cally, recourse to ESM and ELA (Emergency Liquidity Assistance), which is possible for euro area banks, but not for credit institutions outside the Eurozone, can be a serious threat to a level playing fi eld within domestic banking systems.
In light of the above, the NBR believes that fair conditions are warranted in terms of the rights and obligations of each participating Member State. Moreover, the actual procedure to be followed by non-euro area countries willing to join the Single Supervisory Mechanism or the Banking Union should be confi gured in a careful and balanced manner.


![DNVGL-RP-0360 Subsea power cables in shallow water · — [3.2.4.2] Addition of the guidance notes regarding cable design and removing the use of up-rating / de-rating factors for](https://img.pdfslide.net/doc/110x75/5e7f4c2c466d4253b4794656/dnvgl-rp-0360-subsea-power-cables-in-shallow-water-a-3242-addition-of-the.jpg)