Embed Size (px)
Citation preview

Elena BojeşteanuAna Simona Manu
National Bank of Romania
Disentangling the factors behind the external adjustment in the New Member States during the crisis

NATIONAL BANK OF ROMANIA2
The financial crisis has rekindled the interest in the analysis of the external imbalances adjustment. Both the current account balance and measures of relative prices receive much attention from policymakers …
… these indicators are monitored in The Scoreboard designed by the European Commission to detect macroeconomic imbalances
Key questions
What lies behind the different patterns of external imbalance reduction in the New Member States (NMS) during the crisis? Possible policy insights: understanding the drivers of import demand is crucial when addressing large external deficits
Is exchange rate flexibility as a shock absorber overrated or are other factors more important to macroeconomic adjustment?
Motivation

NATIONAL BANK OF ROMANIA3
This study focuses on the case of the NMS*, which confirms that the impact of the crisiswas more severely felt in those countries with the widest pre‐crisis external imbalances (Lane and Milesi‐Ferretti, 2011)and led to a more painful adjustment (Medaiskyte and Klyviene, 2012)
NMS is a heterogeneous group with respect to the magnitude of external imbalances and their adjustment:
Group 1: LV, LT, EE, BG and RO underwent a sharper contraction of the current account deficit during the crisis
Group 2: CZ, PL, HU, SI and SK registered a smaller decline in the current account deficit
Introduction [1]
*excluding Malta and Cyprus

NATIONAL BANK OF ROMANIA4
On average, the compression of the CA deficit occurred in 2008 and 2009
The current account was favourably influenced in all cases by the decline in imports (IMF WEO Oct. 2010); a comparable export contraction offset this influence for countries in Group2
We estimate country‐specific import demand ECMs and we conduct counterfactual simulations in order to disentangle the contribution stemming from each independent variable to import dynamics during 2008 – 2009
The main results show that, on average, for Group1, depressed domestic demand accounted for most of the adjustment, while for Group2, external demand (feeding through exports) played the major role in import contraction
REERswere statistically significant for floaters, but had a modest contribution to external adjustment, with the exception of RO. The volatility of REER seems to have played a role, albeit minor, in most cases
Introduction [2]

NATIONAL BANK OF ROMANIA5
Capital inflow constraints can be a strong mechanism behind the current account adjustment
Source: Eurostat
‐4‐2024681012
2000
2001
2002
2003
2004
2005
2006
2007
2008
2009
2010
2011
Direct investment Portfolio investment Total
‐15.0
‐10.0
‐5.0
0.0
2000
2001
2002
2003
2004
2005
2006
2007
2008
2009
2010
2011
% of GDP
Average foreign investment in NMS
Average current account deficit in NMS % of GDP

NATIONAL BANK OF ROMANIA6
Source: Eurostat, authors’ calculations
The contribution of financing sources to the current account deficit reduction in 2008‐2009
Generally, the contraction of “other investments” played the most important role in the adjustment process
In the absence of the support from the IMF and other IFIs, the contraction under “other investment” would have been much sharper in LV, RO and HU.
‐50
‐40
‐30
‐20
‐10
0
10
20
30
RO BG EE LV LT CZ HU PL SI SK
Direct investment Portfolio investmentOther investment Official reserve assetsCapital account Net errors and omissionscurrent account balance
[92%]
% of GDP, 2009 vs. 2007

NATIONAL BANK OF ROMANIA7
The economic context after 2007 triggered a process of external deficit adjustment [1]
The more pronounced the pre‐crisis external imbalance, the more severe the adjustment(note the situation in the Baltic States, Bulgaria and, to a lesser extent, Romania)
Source: Eurostat, authors’ calculations

NATIONAL BANK OF ROMANIA8
The economic context after 2007 triggered a process of external deficit adjustment [2]
The credit boom was accompanied by the accumulation of current account deficits
Source: Eurostat, authors’ calculations

NATIONAL BANK OF ROMANIA9
Countries in Group1 exhibited a current account adjustment in 2008 ‐ 2009
Source: Eurostat
‐30.0
‐25.0
‐20.0
‐15.0
‐10.0
‐5.0
0.0
5.0
10.0
2000 2001 2002 2003 2004 2005 2006 2007 2008 2009 2010 2011
BGROEELVLT
% of GDP
NATIONAL BANK OF ROMANIA10
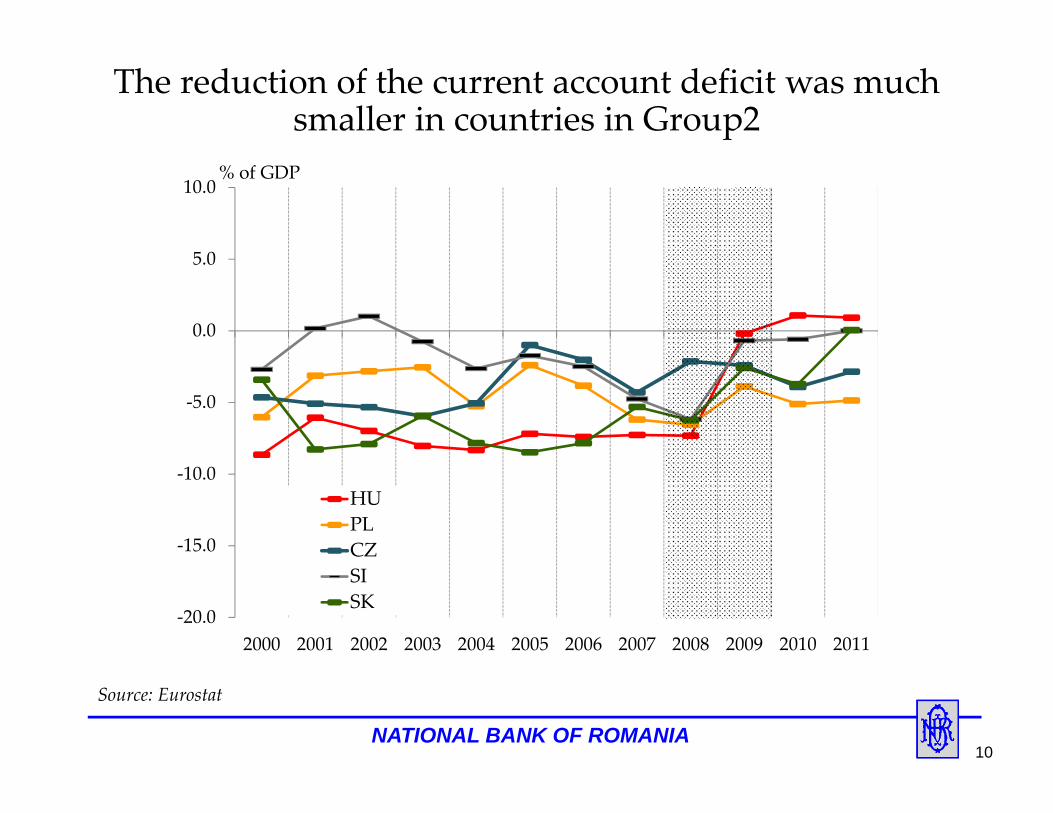
The reduction of the current account deficit was much smaller in countries in Group2
Source: Eurostat
‐20.0
‐15.0
‐10.0
‐5.0
0.0
5.0
10.0
2000 2001 2002 2003 2004 2005 2006 2007 2008 2009 2010 2011
HUPLCZSISK
% of GDP

NATIONAL BANK OF ROMANIA11
The contribution of the current account components to deficit reduction in 2008‐2009
Trade balance of goods had the most important contribution to the current account adjustment
In the Baltic States, most of the contribution of the income balance can be associated with the losses incurred by foreign‐owned companies
*Computed as the difference between current account balance (as share of GDP) at the end of the adjustment period and 2007*[x%] percentage contribution of the trade balance of goods adjustment to the current account correction
8.511.6 12.1
16.911.5
3.31.1 2.7 3.4 2.7
9.3
16.3
19.4
31.0
18.2
7.1
1.9 2.34.1 2.7
‐30369121518212427303336
RO BG EE LV LT HU CZ PL SI SK
balance of goodsbalance of servicesincome balancecurrent transfers balancecurrent account balance
[92%][71%] [63%] [64%]
Source: Eurostat, authorsʹ calculations
[54%]
% of GDP, 2009 vs. 2007

NATIONAL BANK OF ROMANIA12
The fall in imports of goods is the main factor behind large adjustments
Source: Eurostat, authors’ calculations
The contribution to the cumulated dynamics in 2008 – 2009
‐45
‐40
‐35
‐30
‐25
‐20
‐15
‐10
‐5
0
5Imports
Exports
Imports
Exports
Imports
Exports
Imports
Exports
Imports
Exports
Imports
Exports
Imports
Exports
Imports
Exports
Imports
Exports
Imports
Exports
BG EE LV LT RO CZ HU PL SI SK
goods contribution (pp) services contribution (pp)
pp

NATIONAL BANK OF ROMANIA13
The domestic demand contraction was significantly more pronounced in the Baltic States
Source: Eurostat, authors’ calculations
60
65
70
75
80
85
90
95
100
105
110
2007Q4
2008Q2
2008Q4
2009Q2
2009Q4
2010Q2
2010Q4
2011Q2
2011Q4
2012Q2
RO
BG
EE
LV
LT
Volume index (2007Q4=100)
Domestic demand
70
80
90
100
110
120
130
140
150
2007Q4
2008Q2
2008Q4
2009Q2
2009Q4
2010Q2
2010Q4
2011Q2
2011Q4
2012Q2
Exports of goods
Volume index (2007Q4=100)

NATIONAL BANK OF ROMANIA14
Source: Eurostat, authors’ calculations
In Group2, Poland witnessed an atypical evolution of the domestic demand
80
85
90
95
100
105
110
115
2007Q4
2008Q2
2008Q4
2009Q2
2009Q4
2010Q2
2010Q4
2011Q2
2011Q4
2012Q2
CZ
HU
PL
SI
SK
Volume index (2007Q4=100)
Domestic demand
60
70
80
90
100
110
120
130
2007Q4
2008Q2
2008Q4
2009Q2
2009Q4
2010Q2
2010Q4
2011Q2
2011Q4
2012Q2
Exports of goods
Volume index (2007Q4=100)

NATIONAL BANK OF ROMANIA15
Country‐specific import demand ECMs to account for different patterns of adjustmentEstimation method for the cointegrating vector: DOLS (Stock and Watson, 1993), as in Reininger (2008)Explanatory variables for the volume of imports of goods (IMP):
Domestic demand (DD)Relative prices (REER)
– various proxies : REER* based on CPI, HICP, ULC, ULCM and GDP deflator, Imports deflator/Domestic demand deflator, Import value index/Domestic demand deflator
Exports of goods (EXP)Stock of FDI (was not found statistically significant, but proxyed by a trend variable in the long term equation)
Sample: 2000Q1:2012Q2 (sample ending in 2011Q3 for BG)
Methodology
*REER deflated by CPI: computed by the Bank of International Settlements, broad indicesREER deflated by HICP, ULC, ULCM, GDP deflator: computed by the European Commission (IC36)The estimation results are reported only for equations including REER_CPI computed by BIS

NATIONAL BANK OF ROMANIA16
Cointegration tests validate the existence of a long‐term relationship between variables
tau‐statistic z‐statistic tau‐statistic z‐statistic
BG LOG(IMP_B) LOG(DD) LOG(EXP_B) VOL3Y_REER_CPI C @TREND @TREND^2
‐8.16*** ‐51.49*** ‐8.20*** ‐50.74***
EE LOG(IMP_B) LOG(DD) LOG(EXP_B) VOL1Y_REER_CPI C @TREND
‐4.56* ‐37.32*** ‐7.82*** ‐55.06***
LV LOG(IMP_B) LOG(DD) LOG(EXP_B) VOL1YREER_CPI C @TREND @TREND^2
‐5.40** ‐38.05** ‐5.43** ‐38.80**
LT LOG(IMP_B) LOG(DD) LOG(EXP_B) VOL3Y_REER_CPI C
‐4.97** ‐33.42*** ‐4.93** ‐32.08**
RO LOG(IMP_B) LOG(DD) LOG(EXP_B) LOG(REER_CPI) VOL1YREER_CPI C @TREND @TREND^2
‐5.23* ‐33.47 ‐5.16* ‐30.18
CZ LOG(IMP) LOG(DD) LOG(EXP) LOG(REER_CPI) VOL1Y_REER_CPI C @TREND @TREND^2
‐6.01** ‐37.96** ‐6.01** ‐37.20**
HU LOG(IMP) LOG(DD) LOG(EXP) LOG (REER_CPI) VOL1YREER_CPI C @TREND @TREND^2
‐6.42*** ‐41.35** ‐6.43*** ‐40.42**
PL LOG(IMP) LOG(DD) LOG(EXP) LOG(REER_CPI) C @TREND
‐6.84*** ‐47.94*** ‐6.86*** 44.24***
SI LOG(IMP_B) LOG(DD) LOG(EXP_B) VOL1YREER_ULC C @TREND @TREND^2
‐5.68** ‐38.57** ‐5.66** ‐37.40**
SKLOG(IMP_B) LOG(DD) LOG(EXP_B) VOL1YREER_CPI C @TREND
‐4.94** ‐33.15** ‐4.92** ‐32.67**
Country SpecificationEngle‐Granger Philips‐Ouliaris
* indicates rejection of the null hypothesis at a 10% significance level ** indicates rejection of the null hypothesis at a 5% significance level *** indicates rejection of the null hypothesis at a 1% significance level

NATIONAL BANK OF ROMANIA17
The sensitivity of imports to REER is much lower than that to demand factors [1]
BG EE LV LT RODomestic demand 1.22 0.69 1.16 0.75 1.23Exports of goods 0.34 0.72 0.21 0.53 0.89REER ‐ ‐ ‐ ‐ 0.62Volatility of REER ‐0.02 ‐0.02 ‐0.02 ‐0.01 ‐0.02
BG EE LV LT RODomestic demand 1.47 0.52 1.06 0.91 0.80
Domestic demand (‐1) ‐ ‐ ‐ ‐
Exports of goods 0.43 0.37 0.20 0.44 0.72Exports of goods (‐1) ‐ 0.22 0.19 0.16 ‐REER ‐ ‐ ‐ ‐ 0.44REER(‐1) ‐ ‐Volatility of REER ‐0.03 ‐ ‐ ‐ ‐Speed of adjustment ‐1.35 ‐0.58 ‐0.75 ‐0.75 ‐0.69Half‐time back to equilibrium (months)
2.1 4.8 3.7 3.7 4.0
Adjusted R^2 0.86 0.90 0.89 0.83 0.76
Long‐term elasticities
Short‐term elasticities

NATIONAL BANK OF ROMANIA18
The sensitivity of imports to REER is much lower than that to demand factors [2]
CZ HU PL SI SKDomestic demand 0.65 0.77 1.60 0.84 0.57Exports of goods 0.49 0.72 0.55 0.71 0.88REER 0.34 0.15 0.10 ‐ ‐Volatility of REER ‐0.02 ‐0.007 ‐ ‐0.03 ‐0.02
CZ HU PL SI SKDomestic demand 0.98 0.54 2.04 1.16 0.61
Domestic demand (‐1) ‐ ‐ ‐ ‐ ‐
Exports of goods 0.86 0.71 0.20 0.57 0.59Exports of goods (‐1) ‐ ‐ ‐ ‐ 0.19REER ‐ 0.16 0.19 ‐ ‐REER(‐1) ‐ ‐ 0.12 ‐ ‐Volatility of REER ‐ ‐ ‐ ‐ ‐0.01Speed of adjustment ‐0.70 ‐1.11 ‐0.95 ‐0.55 ‐0.81Half‐time back to equilibrium (months)
4.0 2.5 2.9 5.0 3.4
Adjusted R^2 0.90 0.85 0.71 0.93 0.84
Long‐term elasticities
Short‐term elasticities

NATIONAL BANK OF ROMANIA19
Contributions to import contraction based on counterfactual simulations of the ECMs [1]
‐45
‐35
‐25
‐15
‐5
5
15
2007Q4
2008Q1
2008Q2
2008Q3
2008Q4
2009Q1
2009Q2
2009Q3
2009Q4
DD EXP VOL OTHER IMP
%, 2007Q4=100BULGARIA
‐45
‐35
‐25
‐15
‐5
5
15
2007Q4
2008Q1
2008Q2
2008Q3
2008Q4
2009Q1
2009Q2
2009Q3
2009Q4
%, 2007Q4=100ESTONIA

NATIONAL BANK OF ROMANIA20
Contributions to import contraction based on counterfactual simulations of the ECMs [2]
‐50
‐40
‐30
‐20
‐10
0
10
20
2007Q4
2008Q1
2008Q2
2008Q3
2008Q4
2009Q1
2009Q2
2009Q3
2009Q4
DD EXP OTHER VOL1Y IMP
LATVIA
‐50
‐40
‐30
‐20
‐10
0
10
20
2007Q4
2008Q1
2008Q2
2008Q3
2008Q4
2009Q1
2009Q2
2009Q3
2009Q4
%, 2007Q4=100LITHUANIA
%, 2007Q4=100

NATIONAL BANK OF ROMANIA21
Contributions to import contraction based on counterfactual simulations of the ECMs [3]
‐35
‐30
‐25
‐20
‐15
‐10
‐5
0
5
10
2007Q4
2008Q1
2008Q2
2008Q3
2008Q4
2009Q1
2009Q2
2009Q3
2009Q4
DD EXP REER VOL1Y OTHER IMP
%, 2007Q4=100HUNGARY
‐35
‐30
‐25
‐20
‐15
‐10
‐5
0
5
10
2007Q4
2008Q1
2008Q2
2008Q3
2008Q4
2009Q1
2009Q2
2009Q3
2009Q4
ROMANIA%, 2007Q4=100

NATIONAL BANK OF ROMANIA22
Contributions to import contraction based on counterfactual simulations of the ECMs [4]
‐25
‐20
‐15
‐10
‐5
0
5
10
15
2007Q4
2008Q1
2008Q2
2008Q3
2008Q4
2009Q1
2009Q2
2009Q3
2009Q4
DD EXP OTHER REER VOL1Y IMP
%, 2007Q4=100CZECH REPUBLIC
‐25
‐20
‐15
‐10
‐5
0
5
10
15
2007Q4
2008Q1
2008Q2
2008Q3
2008Q4
2009Q1
2009Q2
2009Q3
2009Q4
POLAND%, 2007Q4=100

NATIONAL BANK OF ROMANIA23
Contributions to import contraction based on counterfactual simulations of the ECMs [5]
‐30
‐25
‐20
‐15
‐10
‐5
0
5
10
2007Q4
2008Q1
2008Q2
2008Q3
2008Q4
2009Q1
2009Q2
2009Q3
2009Q4
DD EXP VOL1Y OTHER IMP
SLOVENIA
‐30
‐25
‐20
‐15
‐10
‐5
0
5
10
2007Q4
2008Q1
2008Q2
2008Q3
2008Q4
2009Q1
2009Q2
2009Q3
2009Q4
SLOVAKIA%, 2007Q4=100%, 2007Q4=100

NATIONAL BANK OF ROMANIA24
A comparative analysis of the factors behind import contraction
‐45
‐35
‐25
‐15
‐5
5BG EE LV LT RO HU CZ PL SI SK
DD EXP REER REER volatility Other IMP
Decomposition of cummulated import contraction (2009Q4 / 2007Q4)

NATIONAL BANK OF ROMANIA25
The existence of a level relationship among the analyzed variables was investigated by means of the bounds procedure as in Pesaran et al. (2001). This method circumvents the problem of potential different orders of integration of the regressors and performs better in small samples
The conditional error correction version of the ARDL models were estimated using OLS
The existence of cointegration relations was confirmed by comparing the Wald statistic of the lagged level variables to the critical values tabulated by Pesaran et al. (2001)
A robustness check
NATIONAL BANK OF ROMANIA26
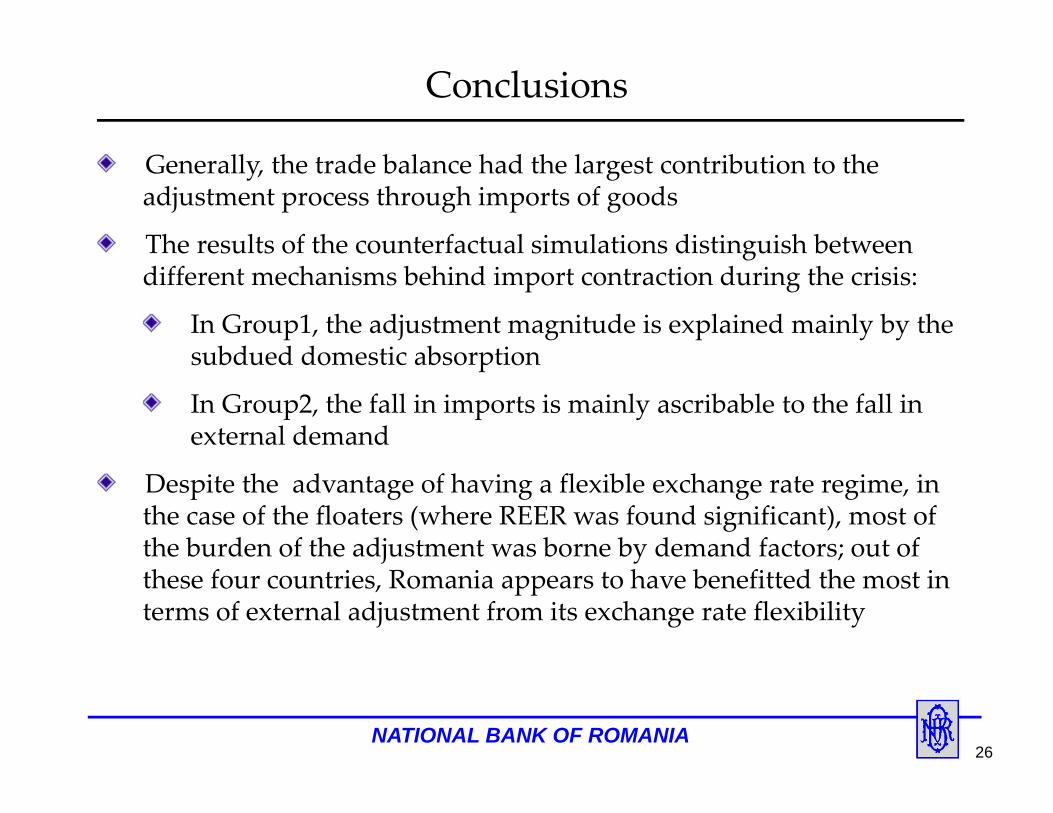
Generally, the trade balance had the largest contribution to the adjustment process through imports of goods
The results of the counterfactual simulations distinguish between different mechanisms behind import contraction during the crisis:
In Group1, the adjustment magnitude is explained mainly by the subdued domestic absorption
In Group2, the fall in imports is mainly ascribable to the fall in external demand
Despite the advantage of having a flexible exchange rate regime, in the case of the floaters (where REER was found significant), most of the burden of the adjustment was borne by demand factors; out of these four countries, Romania appears to have benefitted the most in terms of external adjustment from its exchange rate flexibility
Conclusions

NATIONAL BANK OF ROMANIA27
In countries exhibiting the largest pre‐crisis imbalances, the external adjustment process occurred mainly through changes in domestic demand, which suggests the predominant cyclical nature of the adjustment (as previously pointed by Algieri and Bracke, 2007).
a potential threat for the catching‐up economies is that imbalances may accumulate in the future the design of domestic policies will have to be strongly counter‐cyclical
Generally, in countries with a stronger export‐import link, the fall in imports occurred mainly via the external demand channel, which lowered the magnitude of the external adjustment, but mitigated the social costs associated to domestic demand compression the implication is not less trade, but developing better safeguards against financial constraints
Imports are not sufficiently price sensitive to achieve external adjustment through relative price changes the role of the exchange rate as a shock absorber appears to be overrated and the exchange rate policies less effective than expenditure‐reducing policies in correcting trade deficits.
Policy implications and suggestions

NATIONAL BANK OF ROMANIA28
Assessing the relative importance of domestic demand components (consumption and investment) to import dynamics
Estimating ECMs for export volumes in order to:
disentangle the drivers of export growth; and
build more comprehensive models for import dynamics to better capture the influence of REER via endogenous exports and more adequately assess the import‐export link.
Ongoing research

NATIONAL BANK OF ROMANIA29
Algieri B., and T. Bracke 2007. Patterns of Current Account Adjustment. Insights from Past Experience.ECB Working Paper 762.
Allard C. 2009. Competitiveness in Central‐Europe: What Has Happened Since EU Accession? IMFWorking Paper WP/09/121
Bakker, B. B. and C. Klingen 2012. How Emerging Europe Came through the 2008/09 Crisis. An accountby the Staff of IMF’s European Department, IMF
Klyvienè V. and R. Medaiskytè 2012. The Effectiveness of Internal Devaluation in Lithuania and Latvia.Ekonomika, Vol. 91(1), pp. 59‐78
Lane, P. R. and G. M. Milesi‐Ferretti 2011. External Adjustment and the Global Crisis. IMF Working PaperWP/11/197
Penkova‐Pearson, E. 2011. Trade, Convergence and Exchange Rate Regime: Evidence from Bulgaria andRomania. NBB Discussion Paper DP/85/2011
Pesaran, M.H, Shin, Y., and R.J. Smith, 2001. Bounds Testing Approaches to the Analysis of LevelRelationships, Journal of Applied Econometrics 16, pp. 289‐326.
Reininger, T. 2008. Factors Driving Import Demand in Selected Central, Eastern and SoutheasternEuropean Countries. Focus on European Economic Integration, Issue 1, pp. 100‐125
Stock, J., and M.W. Watson, 1993. A Simple Estimator of Cointegrating Vectors in Higher OrderIntegrated Systems. Econometrica, 61(4), pp. 783‐820.
References