Embed Size (px)
Citation preview
1
Annexure – II
NATIONAL BOARD OF ACCREDITATION
Compliance Report Format
(UG Pharmacy)
PART- A: Institutional Information
A1. Name and Address of the College:-
City:- State:- Pin Code:- Phone No (including STD Code):- Fax Website:- E-mail:-
A2. Year of Establishment:-
A3. First Approval Letter No.: Date:
A4. Head of the Institution:-
Name:- Designation:- Nature of Appointment:- Phone No:- Mobile:-
E-mail:- Fax No:-
A5. Name and Address of the Affiliating University:- City:- State:- Pin Code:-
Website:- E-mail:- Phone No (Including STD Code):- Fax:-
A6. Type of the Institution:
Institute of National Importance Autonomous
University *Any other (Please specify)
Deemed University
*Provide Details:
A7. Ownership Status:
Central Government Trust
State Government Society
Government Aided Section 25 Company
Self financing *Any Other (Please specify)
*Provide Details:

2
A8. Students Admissions (In First year at institute level)
A8.1- For UG Program
Item CAY CAYm1 CAYm2
Sanctioned intake
Number of students
admitted
Total
Admitted/Sanctioned
Intake= % Admitted
Average % Admitted
Table A8.1
A8.2- For all PG Programs
Item CAY CAYm1 CAYm2
Sanctioned intake
Number of students
admitted
Total
Admitted/Sanctioned
Intake= % Admitted
Average % Admitted
Table A8.2
CAY: Current Academic Year
CAYm1: Current Academic Year minus 1 = Current Assessment Year
CAYm2: Current Academic Year minus 2 = Current Assessment Year minus 1
Note: Academic year is July to June
A9. Student Admission details at Lateral Entry/Separate Division
Item CAY CAYm1 CAYm2
Number of students actually admitted through
Lateral Entry
Number of students admitted through Separate Division
Total Number of students
admitted in the second year
Table A9
Note: Provide student details of the second shift (if applicable)
A10.Total number of employees in the institution:
A10.1. Regular Employees (Faculty and Staff):
Items CAY CAYm1 CAYm2
Min Max Min Max Min Max

3
Faculty in Pharmacy
M
F
Faculty in Science &
Humanities
M
F
Non-teaching staff
M
F
Table A10.1
A10.2. Contractual Staff Employees (Faculty and Staff): (Not covered in Table A10.1):
Items CAY CAYm1 CAYm2
Min Max Min Max Min Max
Faculty in Pharmacy
M
F
Faculty in Science &
Humanities
M
F
Non-teaching staff
M
F
Table A10.2
Note: Specify the reason if there is drop in number of faculty members during the specified academic years. Provide Faculty details of the second shift (if applicable)
A11. Provide separate Information for each of the program(s) for which compliance is to be
submitted
Name of
the Departm
ent
Name of the
programs
being offered
Name of
the
program to be
considered
Yea
r of Start
Intake
Increase/Decrease in intake,
if any
Year of increase/Decre
ase
AICTE Appro
val
Accreditation
Status*
Table A11
* Write applicable one:
Applying first time
Granted provisional accreditation for two/three years for the period(specify period)
Granted accreditation for 5 / 6 years for the period (specify period)
Not accredited (specify visit dates, year)
Withdrawn (specify visit dates, year)
Not eligible for accreditation
Eligible but not applied
4
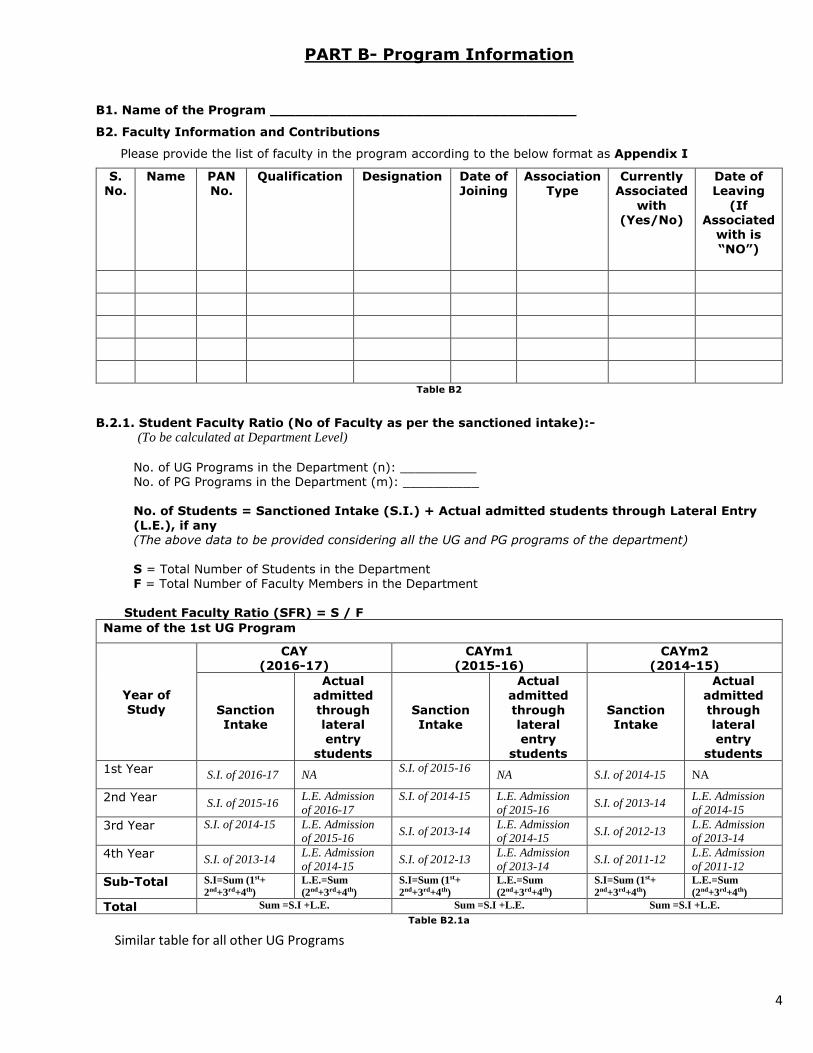
PART B- Program Information
B1. Name of the Program ____________________________________
B2. Faculty Information and Contributions
Please provide the list of faculty in the program according to the below format as Appendix I
S. No.
Name PAN No.
Qualification Designation Date of Joining
Association Type
Currently Associated
with (Yes/No)
Date of Leaving
(If Associated
with is “NO”)
Table B2
B.2.1. Student Faculty Ratio (No of Faculty as per the sanctioned intake):-
(To be calculated at Department Level)
No. of UG Programs in the Department (n): __________ No. of PG Programs in the Department (m): __________ No. of Students = Sanctioned Intake (S.I.) + Actual admitted students through Lateral Entry (L.E.), if any (The above data to be provided considering all the UG and PG programs of the department)
S = Total Number of Students in the Department
F = Total Number of Faculty Members in the Department Student Faculty Ratio (SFR) = S / F
Name of the 1st UG Program
Year of Study
CAY (2016-17)
CAYm1 (2015-16)
CAYm2 (2014-15)
Sanction Intake
Actual admitted
through lateral entry
students
Sanction Intake
Actual admitted
through lateral entry
students
Sanction Intake
Actual admitted
through lateral entry
students
1st Year S.I. of 2016-17 NA
S.I. of 2015-16
NA S.I. of 2014-15 NA
2nd Year S.I. of 2015-16
L.E. Admission
of 2016-17
S.I. of 2014-15
L.E. Admission
of 2015-16 S.I. of 2013-14
L.E. Admission
of 2014-15
3rd Year S.I. of 2014-15
L.E. Admission
of 2015-16 S.I. of 2013-14
L.E. Admission
of 2014-15 S.I. of 2012-13
L.E. Admission
of 2013-14
4th Year S.I. of 2013-14
L.E. Admission
of 2014-15 S.I. of 2012-13
L.E. Admission
of 2013-14 S.I. of 2011-12
L.E. Admission
of 2011-12
Sub-Total S.I=Sum (1st+
2nd+3rd+4th)
L.E.=Sum
(2nd+3rd+4th)
S.I=Sum (1st+
2nd+3rd+4th)
L.E.=Sum
(2nd+3rd+4th)
S.I=Sum (1st+
2nd+3rd+4th)
L.E.=Sum
(2nd+3rd+4th)
Total Sum =S.I +L.E. Sum =S.I +L.E. Sum =S.I +L.E.
Table B2.1a
Similar table for all other UG Programs

5
Name of the 1st PG Program
Year of
Study
CAY (2016-17)
CAYm1 (2015-16)
CAYm2 (2014-15)
Sanction Intake Sanction Intake Sanction Intake 1st Year S.I. of 2016-17 S.I. of 2015-16 S.I. of 2014-15
2nd Year S.I. of 2015-16 S.I. of 2014-15 S.I. of 2013-14
Total =Sum (1st+2nd) =Sum (1st+2nd)
=Sum (1st+2nd)
Table B2.1b
Similar table for all other PG Programs Table B2.1c
Note: The years mentioned in the headers are exemplary. Institute has to consider the years as per
the definition of the CAY, CAYm1 and CAYm2.
B2.2. Faculty Information
S. No. Faculty Details Number of Faculty in the Department for both UG and PG
CAY CAYm1 CAYm2
1. Professor
2. Associate Professor
3. Assistant Professor
4. Number of Ph. D (as per the AICTE norms)
Table B2.2
B2.3. Faculty Cadre Proportion
The reference Faculty cadre proportion is 1(F1):2(F2):6(F3)
F1: Number of Professors required = 1/9 x Number of Faculty required to comply with 15:1 Student-
Faculty ratio based on no. of students (N) as per B2.1
F2: Number of Associate Professors required = 2/9 x Number of Faculty required to comply with 15:1
Student-Faculty ratio based on no. of students (N) as per B2.1
F3: Number of Assistant Professors required = 6/9 x Number of Faculty required to comply with 15:1
Student-Faculty ratio based on no. of students (N) as per B2.1
Description CAY (2016-17)
CAYm1 (2015-16)
CAYm2 (2014-15)
Total No. of Students in the Department (S)
Sum total of all (UG + PG) students (From table B2.1a and B2.1b)
Sum total of all (UG + PG) students (From table B2.1a and B2.1b)
Sum total of all (UG + PG) students (From table B2.1a and B2.1b)
No. of Faculty in the Department
(F)
F1 F2 F3
Student Faculty Ratio (SFR)
SFR1=S1/F1 SFR2= S2/F2 SFR3= S3/F3
Average SFR SFR=(SFR1+SFR2+SFR3)/3

6
Year Professors Associate Professors Assistant Professors
Required F1 Available Required F2 Available Required F3 Available
CAY
CAYm1
CAYm2
Average
Numbers
RF1= AF1= RF2= AF2= RF3= AF3=
Table B2.3
B2.4. Faculty as participants in Faculty development/training activities/STTPs
Name of the Faculty
Details of the participation (Faculty development/training
activities/STTPs)
CAYm1 CAYm2 CAYm3
Table B2.4
B2.5. Research and Development
Name of the faculty
Academic Research
Number of quality publications in refereed/SCI Journals, citations,
Books/Book Chapters etc.
Ph.D. guided /Ph.D. awarded during the assessment period while working in the institute
As provided in
SAR
After evaluation
(till the date of compliance report)
As provided
in SAR
After evaluation
(till the date of compliance
report)
Table B2.5
B2.6. Sponsored Research/Consultancy
(I) Details as provided in the SAR previously
Name of the faculty
Project Title
Project Type Research/Consultancy
Funding Agency
Amount Duration

7
Table B2.6(I)
(II) Details after evaluation (till the date of Compliance Report)
Name of the faculty
Project Title
Project Type Research/Consultancy
Funding Agency
Amount Duration
Table B2.6(II)

8
B3. Students’ Performance
Student Intake Table
Table B3a
Academic Performance Table
Year of entry N1 + N2 + N3
(As defined
above)
Number of students who have successfully
graduated
I Year II Year III Year IV Year
CAY
CAYm1
CAYm2
CAYm3
CAYm4 (LYG)
CAYm5 (LYGm1)
CAYm6
(LYGm2)
Table B3b
B3.1. Success rate without backlog in stipulated period
SI= (Number of students who graduated from the program without backlog in the stipulated period
of course duration)/ (Number of students admitted in the first year of that batch and actually
admitted in 2nd year via lateral entry and separate division, if applicable)
Item LYG (CAYm3) LYGm1(CAYm4) LYGm2 (CAYm5)
Number of students admitted in the corresponding First Year + actually admitted in 2nd year via lateral entry and separate division, if applicable
Number of students who have graduated without backlogs in the stipulated period
Success Index (SI)
Table B3.1
Item
(Information to be provided cumulatively for all the shifts with explicit headings, wherever applicable)
CAY CAYm1 CAYm2 CAYm3
Sanctioned intake of the program (N)
Total number of students admitted in first year minus number of
students migrated to other programs/institutions, plus no. of students migrated to this program (N1)
Number of students actually admitted in 2nd year in the same batch
via lateral entry (N2)
Separate division students, if applicable (N3)
Total number of students admitted in the Program (N1 + N2 + N3)

9
B3.2. Success rate with backlog in stipulated period of study
SI= (Number of students who graduated from the program with backlog in the stipulated period of
course duration)/ (Number of students admitted in the first year of that batch and actually admitted
in 2nd year via lateral entry and separate division, if applicable)
Item LYG (CAYm3) LYGm1(CAYm4) LYGm2 (CAYm5)
Number of students admitted in the corresponding First Year + actually admitted in
2nd year via lateral entry and separate division, if applicable
Number of students who have graduated with
backlogs in the stipulated period
Success Index (SI)
Table B3.2
B3.3. First Year Academic Performance
Academic Performance = ((Mean of 1st Year Grade Point Average of all successful Students on a 10
point scale) or (Mean of the percentage of marks in First Year of all successful students/10)) x
(number of successful students/number of students appeared in the examination)
Successful students are those who are permitted to proceed to the second year.
Table B3.3
B3.4. Academic Performance in Second Year
API = ((Mean of 2nd Year Grade Point Average of all successful Students on a 10 point scale) or
(Mean of the percentage of marks of all successful students in Second Year/10)) x (number of
successful students/number of students appeared in the examination)
Successful students are those who are permitted to proceed to the Third year.
Academic Performance CAYm1 CAYm2 CAYm3
Mean of CGPA or Mean Percentage of all successful
students (X)
Total no. of successful students (Y)
Total no. of students appeared in the examination (Z)
API = x* (Y/Z) AP 1 AP 2 AP 3
Average API = (AP1 + AP2 + AP3)/3
Academic Performance CAYm1 CAYm2 CAYm3
Mean of CGPA or Mean Percentage of all successful students
(X)

10
Table B3.4
B3.5. Academic Performance in Third Year
API = ((Mean of 3rd Year Grade Point Average of all successful Students on a 10 point scale) or
(Mean of the percentage of marks of all successful students in Third Year/10)) x (number of
successful students/number of students appeared in the examination)
Successful students are those who are permitted to proceed to the final year.
Table B3.5
B3.6. Placement, Higher Studies and Entrepreneurship
Item CAYm1 CAYm2 CAYm3
Total No. of Final Year Students (N)
No. of students placed in Industries/Hospitals/Government Sector
through on/off Campus recruitment or opted for Entrepreneurship
(x)
No. of students admitted to higher studies with valid scores in
various qualifying exams (y)
x + y =
Placement Index : (x + y)/N P1 P2 P3
Average placement= (P1 + P2 + P3)/3
Table B3.6
Total no. of successful students (Y)
Total no. of students appeared in the examination (Z)
API = X* (Y/Z) AP1 AP2 AP3
Average API = (AP1 + AP2 + AP3)/3
Academic Performance CAYm1 CAYm2 CAYm3
Mean of CGPA or Mean Percentage of all successful students
(X)
Total no. of successful students (Y)
Total no. of students appeared in the examination (Z)
API = x* (Y/Z) AP 1 AP 2 AP 3
Average API = (AP1 + AP2 + AP3)/3

11
C. Criterion wise Compliance Status
S.N. Criteria Observations made by NBA
(During the last accreditation visit)
Compliance Status
(Action taken by the
institution)
1 Vision, Mission & PEOs
1.1. Formulation
1.2. Dissemination
1.3. Assessment
1.4. Any other observations of the
NBA
2 Course outcome and Program
outcomes
2.1. Formulation
2.2. Mapping
2.3. Any other observations of the NBA
3. Curriculum Design, if
applicable
3.1. Process to identify the gap, if
applicable and action taken
thereof
3.2. Curriculum Structure &
Component (as applicable)
3.3. Any other observations of the
NBA
4 Details of the Action taken on the Observation of NBA during last visit:
Table C

12
Declaration
It is hereby declared that information provided in this Compliance Report is factually correct. I
understand and agree that an appropriate action against the Institute will be initiated by the NBA (which
may include debarring the institution for three years), in case any false statement/information is
observed during the assessment of the compliance report.
Date: Signature & Name
Place: Head of the Institution with seal