Embed Size (px)
Citation preview
NBER WORKING PAPER SERIES
SHOW ME THE MONEY:DOES SHARED CAPITALISM SHARE THE WEALTH?
Robert BucheleDouglas KruseLoren RodgersAdria Scharf
Working Paper 14830http://www.nber.org/papers/w14830
NATIONAL BUREAU OF ECONOMIC RESEARCH1050 Massachusetts Avenue
Cambridge, MA 02138April 2009
Earlier drafts of this paper were presented at the Russell Sage/NBER conference in New York City,October 6-7, 2006 and at the Labor and Employment Relations conference, Boston, Massachusetts,January 5-8, 2006. We have benefited from comments on these drafts by Mark Aldrich, Joseph Blasi,Eric Kaarsemaker, Jeffrey Keefe and Christopher Mackin. This research is supported by a grant fromthe Russell Sage Foundation and the Rockefeller Foundation. Additional funding for the General SocialSurvey questions was provided by the Beyster Institute of the University of California at San Diego,the ESOP Association, the Employee Ownership Foundation, Hewitt Associates, the National Centerfor Employee Ownership, the Profit Sharing Council of America, and American Capital. The NationalOpinion Research Center at the University of Chicago provided valuable assistance with the U.S. GeneralSocial Survey that provides a national sample comparison group in our analysis. The views expressedherein are those of the author(s) and do not necessarily reflect the views of the National Bureau ofEconomic Research.
NBER working papers are circulated for discussion and comment purposes. They have not been peer-reviewed or been subject to the review by the NBER Board of Directors that accompanies officialNBER publications.
© 2009 by Robert Buchele, Douglas Kruse, Loren Rodgers, and Adria Scharf. All rights reserved.Short sections of text, not to exceed two paragraphs, may be quoted without explicit permission providedthat full credit, including © notice, is given to the source.
Show Me the Money: Does Shared Capitalism Share the Wealth?Robert Buchele, Douglas Kruse, Loren Rodgers, and Adria ScharfNBER Working Paper No. 14830April 2009JEL No. D31,J33,J54
ABSTRACT
This paper examines the effect of a variety of employee ownership programs on employees' holdingsof their employers' stock, their earnings and their wealth. Two major datasets are employed: the NBERShared Capitalism Research Project employee survey dataset and the 2002 and 2006 national GeneralSocial Surveys (GSS). The GSS national survey shows that 29% of permanent, full-time employeeswith at least one year on the job own their employers' stock, compared to the unsurprisingly higher87% of employees in the NBER "shared capitalist" firms. The employees in the national sample holdan average of $10,600 of employer stock, compared to $52,800 in the NBER sample. Employee ownersin NBER companies with broad-based ownership structures fare better: those in majority-owned ESOPshold on average $86,000 in company stock and those in broad-based stock option plans hold optionsworth an average of $283,000. We find no evidence – either between datasets or between employee-ownersand non-owners within datasets – of substitution of company stock ownership for pay or benefits.Moreover, our analysis suggests that company stock ownership substantially raises total employeewealth, though it appears to have little effect on the overall distribution of wealth. These results suggestthat employee ownership tends to raise both ownership stakes and economic resources of Americanworkers across the economic spectrum.
Robert BucheleDepartment of EconomicsSmith College10 Prospect St., #103Northampton, MA [email protected]
Douglas KruseSchool of Management and Labor RelationsRutgers University94 Rockafeller RoadPiscataway, NJ 08854and [email protected]
Loren RodgersNational Center for Employee Ownership1736 Franklin Street8th FloorOakland CA [email protected]
Adria ScharfOwnership Associates122 Mt. Auburn StreetCambridge, MA [email protected]

1
Cheerleaders for the “ownership society” tout the growing share of U.S. households
owning stock – up from 31.7 percent in 1989 to 51.9 percent in 2001.1 What is less often
advertised is that stock ownership remains highly concentrated. The bottom 90 percent of
households owns only 23 percent of all stock and just 12 percent of all directly held stock (which
confers direct control or voting rights on stockholders).2 Only 27 percent of households in the
bottom 90 percent of the wealth distribution own (directly or indirectly) more than $10,000 of
stock (calculated from Wolff, 2004: Table 13a). If ownership is measured by households’
ownership stake in the corporate sector of the U.S. economy, a large majority of American
households have little or no meaningful claim to membership in the ownership society.
This concentration of stock ownership implies a corresponding concentration of income
from capital, which contributes to growing income inequality since dividends and capital gains
have been a growing share of market-based income in the past 30 years, and capital income
disproportionately goes to high-income households (Mishel et al, 2007: 79, 81). Employee stock
ownership may help reduce this growing inequality by contributing to broad-based wealth
building and income growth across the economic spectrum.
This paper addresses four sets of questions surrounding employee stock ownership as a
wealth-sharing tool, going beyond previous studies in the scope of the inquiry and the use of the
new data sources. First, how much on average do employee owners own in “shared capitalist”
firms (those with broad-based employee ownership, profit sharing, gainsharing, and/or stock
1 This figure includes both directly held stock and indirect holdings in mutual funds and retirement accounts. See Wolff (2004: Table 12b). An important reason why the incidence of stock ownership has risen in recent decades is the replacement of defined benefit with defined contribution pension plans. Nevertheless, 34 percent of households have no (defined benefit or defined contribution) pension plan (Wolff, 2005: Table 5), and “more than one-fifth of all households nearing retirement (those between the ages of 56 and 64) had no retirement savings other than Social Security” (Weller and Wolff, 2005: 2). 2 These statistics are from Wolff (2004: Table 13a) and Kennickell (2003: Table 10), respectively. All statistics in this section are for 2001.
2
options), and more generally? Second, how is company stock distributed among employee-
owners, which ownership structures distribute wealth most equitably, and how does the
distribution of employee stock ownership wealth compare to the distribution of wealth among
U.S. households? Third, to what extent does employer stock substitute for other forms of
compensation (higher pay and benefits) and for other forms of wealth? And fourth, what effect
might universal employee ownership of employer stock have on the overall distribution of stock
ownership and pension wealth in the U.S?
History and Review of Employee Ownership
Employee Stock Ownership Plans (ESOPs) were first promoted as a matter of public
policy by a provision in the Employee Retirement and Security Act of 1974 (ERISA), authored by
Senator Russell Long, allowing for tax deductible contributions of company stock to a workers’
trust. Long was influenced by Louis Kelso, a San Francisco investment banker and lawyer who
set up the first ESOP at a California newspaper in 1956 and published The Capitalist Manifesto
(with Mortimer Adler) in 1958. Kelso advocated employee ownership as a means of
counteracting (in his view) a declining share of labor income inevitably resulting from labor-
saving technical change (Kelso and Adler, 1958: Ch. 4). Long advocated employee ownership on
other grounds as well – including promoting labor peace, securing workers’ allegiance to the
capitalist system and improving workers’ motivation and productivity. But Long and Kelso’s
chief interest in ESOPs was as a vehicle for building workers’ wealth and increasing their share of
capital and income from capital.3 And a chief interest of this paper is to determine the extent to
which companies with shared capitalism plans do this.
3 Paraphrasing Mill, Kelso and Adler (1958:85) wrote that “no man’s ownership of (capital) should be so extensive as to exclude others from an economically significant participation in the production of wealth.”
3
The stock of companies with ESOPs can be publicly traded or privately held and can be
minority-owned or 100% owned by the employees. But in any case, ownership must be broad-
based. With few exceptions, ESOPs are required by law to cover all employees age 21 and over
who work more than 1,000 hours per year and have at least a year of service with the company.
Several recent studies have estimated the size of employees’ ownership stakes in employee
stock ownership plans. A census of Washington State ESOPs (Kardas, Scharf and Keogh 1998)
found median pension assets per participant of $31,600 (vs. $5,400 for a matching sample of non-
ESOP control companies). A 2005 study of Ohio companies found median ESOP account
balances of $30,000 (cited in Rosen, 2005:4), and two surveys of Massachusetts ESOPs found
average assets to range from $39,900 per participant (Scharf and Mackin 2000) to $56,200 per
participant (Mackin 2005). Finally, a survey of 16 S-corporation ESOPs found median employee
account balances of $75,000 to $100,000 (Rosen, 2005).
In addition to ESOPs, there are a number of other popular employee ownership
mechanisms: employee stock purchase plans (ESPPs), company stock in 401k plans, and broad-
based stock option plans. Each of these plans – like ESOPs – has implications for retirement
savings and employee risk.
ESPPs emerged gradually in the late 1800s and early 1900s as various industrialists sought
ways to encourage workers to buy company stock in order to secure loyalty and create a common
bond between labor and management. These plans spread rapidly in the context of welfare
capitalism before the crash of 1929. They grew again in popularity after WWII, encouraged by a
variety of tax incentives created by changes in the federal Internal Revenue Code.
Today, ESPPs constitute one of the “quiet” mechanisms of employee ownership in many
major American corporations. In recent times, companies have typically allowed workers to buy
4
stock through a payroll deduction at 85% of the market price. Many workers have come to see
ESPPs as a supplement to their retirement savings, however long-term employees can accumulate
substantial ESPP investments that dominate their retirement savings and raise serious issues of
diversification.
Another form of employee ownership is the 401k retirement plan. While the U.S. Congress
worked intentionally to expand employee ownership through ESOPs, other models of employee
ownership emerged with little governmental guidance. In the late seventies, the Internal Revenue
Code was amended to allow for company contributions to tax-sheltered individual retirement
trusts. The idea was that both company and worker contributions to these plans would be invested
in stocks, bonds, and other assets, and this accumulated wealth would provide a supplement to the
worker’s main retirement fund – a defined benefit pension plan. These 401k defined contribution
plans (called that because only the initial employer contribution, and not the final benefit, was
defined) were originally intended for top management. But many companies have replaced their
workers’ defined benefit pension plans with defined contribution plans, shifting the risk associated
with retirement income planning from employers to employees. (The risk issue is addressed in the
companion paper using these data by Blasi, Kruse, and Markowitz, 2008).
Increasingly, workers came to see these plans as useful supplements to their retirement.
As the plans grew in number and popularity in the late eighties and early nineties, companies
began matching employee contributions in company stock, and 401k plans emerged as vehicles
for employee ownership. Companies next added company stock as an investment choice whereby
workers could direct their own contributions to be used to buy company stock. Many companies
found that employee ownership often grew rapidly under such plans. However, 401k plans as
vehicles for employee ownership have come under criticism in recent years because (unlike
5
ESOPs) they finance employee ownership with worker savings and raise concerns about
diversification when retirement plans are excessively invested in company stock. Most observers
agree however that matching contributions of company stock to 401k retirement plans – within
reason – has a useful role to play in expanding employee ownership.
The most recent development in the world of employee ownership is the “broad-based”
stock option plan. These gained currency in the 1980s when high-tech firms began offering them
to workers involved in developing computer and information systems hardware and software, and
often more broadly to all employees in these firms (see Blasi, Kruse and Bernstein, 2003). Unlike
ESPPs and employee purchases of company stock in 401k plans, employee stock options require
no investment of employees’ savings. Employees are awarded options to buy company stock
(after a vesting period), typically at the price it is trading on the day the options are awarded, for a
ten year period. If employees exercise their options and hold the stock, broad-based stock options
become a way to finance ongoing employee ownership. If employees exercise their stock options
and immediately sell the stock (which is much more usually the case) they can pocket the profit on
the stock price’s increase. In this case, the stock options serve as a form of cash profit sharing,
based on company performance as measured by its stock price.
Broad-based stock option plans have become more common in a variety of manufacturing
and service businesses. Stock options for employees, like ESOPs, involve lower risk for workers
because they do not require the investment of workers’ savings. However, when stock options are
used in lieu of higher base pay or conventional retirement plans – as was sometimes the case in the
tech sector start-ups of the 1980s and early 1990s – they are, in effect, risking employees’ savings.
Mature high-tech companies today, however, typically use broad-based stock options in
combination with market level base pay and benefits.
6
Today, employee stock ownership is well established in the U.S. economy. Blasi, Kruse
and Bernstein (2003: Appendix C) calculate that in 2002 there were 24.1 million participants in
11,561 pension plans that held company stock.4 About 8.2 million (34%) of these participants
were in employee stock ownership plans (including ESOPs and similar plans called KSOPs),5 and
these held 59 percent of all company stock in employee pension plans. ESOPs are “by far the
most common form of employee ownership in the U.S.” (Rosen, 2005: 5). Another 13.6 million
employees held company stock in 401(k) plans and 1.4 million in ESPPs. In addition 10.6 million
employees held stock options in the companies they work for.
Employee-owners bear two distinct types of risk: First, employees who have their own
“skin in the game,” having purchased company stock with their own funds, bear the risk of
potential investment loss. This risk is minimized in ESOPs because the company stock allocated
to workers’ ESOP accounts is almost always contributed by the employer with no out-of-pocket
cost to the employee.6 At the other extreme, company stock acquired through employee stock
purchase plans is financed primarily by employee savings.
Second, employees who have concentrations of assets invested in a single company bear
risk associated with inadequate diversification. This problem is exacerbated by a firm-specific
risk for employee-owners whose jobs (and incomes), as well as a substantial portion of their
savings, depend on the fortunes of the company they work for. This is an inevitable feature of any
form of employee ownership, but it is likely to be greatest for ESOP employees who accumulate
4 As Kruse (2002) points out, these figures double count companies and employees who have more than one plan. His calculations (for 1998) suggest a lower-bound estimate of around 20 million employees (or 18 percent of all private sector workers) holding stock in their companies through various defined contribution pension plans (ESOPs, KSOPs and 401(k)s that hold employer stock) and profit sharing and employee stock purchase plans in 2002. 5 A KSOP is a combination ESOP and 401(k) plan in which employees’ 401(k) contributions are matched by employer contributions of company stock to their ESOP accounts. 6 In one company the initial purchase of company stock at the founding of the KSOP was financed by a rollover from employees’ existing 401(k) accounts. Employees of this company are an exception to the ‘no skin in the game’ depiction of ESOP participants. Subsequent stock allocations to the KSOP have been provided by the employer.

7
company shares in retirement accounts with limited opportunities for diversification. The risk,
however, appears generally to be manageable: portfolio theory suggests that a moderate amount
of employee ownership can be part of a prudent portfolio depending on how other assets are
diversified (Blasi, Kruse, and Markowitz, 2008).
The inadequate diversification issue has come up most frequently with respect to ESOPs
because of their retirement-plan structure. Although ESOPs are legally organized as retirement
plans, scholars caution that they should not be thought of as a substitute for a diversified
retirement plan (e.g., see Kruse 2002), and indeed, all but one of the 14 companies (including nine
ESOPs) in the NBER study also have regular diversified 401(k) retirement plans. Among the
subset of nine ESOPs, surveyed employees at three companies had less than half of their pension
assets in the employer’s stock, while employees at three other companies had between half and
three-quarters, and employees at another three companies had over three-quarters of pension
assets invested in their employer’s stock. Clearly, many of these plans should be more diversified,
but we need to bear in mind that employee-owners inevitably face greater ownership risk. To the
extent that employee ownership increases wealth as well as risk, the question becomes whether
this wealth-risk tradeoff leaves employee-owners better off or not. 7
Profile of the SCRP Companies and the GSS National Sample
The NBER Shared Capitalism Research Project includes fourteen companies with one or
more forms of shared ownership.8 These companies come from a variety of industries – including
7 We thank Jeff Keefe for this point and for pointing out that the U.S. system of employment-based health insurance, life insurance, savings plans, etc. exposes American workers in general to high levels of firm specific risk. Employee-ownership further increases this risk. The better these benefits (including ownership) are, the greater the firm specific risks are. But this does not mean that employees would be better off without them. 8 An overview of the data is contained in Kruse, Blasi, and Park (2008). Other papers using these data include Blasi, Kruse, and Markowitz (2008), Blasi et al. (2008), Freeman, Kruse, and Blasi (2008), Harden, Kruse, and Blasi (2008), and Kruse, Freeman, and Blasi (2008).

8
manufacturing (8), professional services (3), high tech (2) and finance (1) and vary in size from a
few hundred to almost 50,000 employees. Four have publicly traded stock, and ten are privately
held. Many of these companies are very successful, high wage employers and industry leaders.
Others (5 of these 14 companies) are in relatively low wage industries and pay below (U.S.)
average wages. This study reflects their experiences too, and is relevant to their (lower to middle
income) employees.
Employee surveys, conducted between 2001 and 2005, yielded over 41,000 valid surveys,
of which over 26,000 were of permanent, full-time employees. These companies were not
randomly selected to participate in this study. Their participation hinged on their willingness to
allow their employees to be surveyed, and in some cases their involvement grew out of prior
professional contacts with project researchers. They are a unique group of companies – certainly
more exemplary than representative – with stronger than average wealth-sharing practices and
managers who were willing to devote time and organizational resources to participate in this
study.
We also draw on the 2002 and 2006 General Social Surveys to provide a nationally
representative baseline. The GSS is administered to a national random sample of adults by the
National Opinion Research Center of the University of Chicago. The combined surveys include
over 5,000 respondents. Excluding non-employees, part-time employees and employees with less
than a year on the job reduces the sample to 1,384. Twenty-nine percent of this subsample reports
owning their employer’s stock.
The 14 NBER companies have a variety of different stock sharing programs in place. As
Table 1 indicates, these include nine ESOP-type plans (eight ESOPs and one KSOP), three 401(k)
plans that invest in the employer’s stock as well as other assets, five employee stock purchase

9
plans (ESPPs), and six stock option plans (SOPs). Nine of these companies (identified with bold
company numbers in Table 1) are majority employee-owned ESOP-type plans (including one
KSOP and one set up as a 401(k)).9 In some of the following tables, we report results for this
subset of majority-owned ESOP companies.
All of the privately held ESOP companies in the NBER study are majority owned; most
are 100% employee owned. Overall participation rates of eligible employees (the percent of
employees participating in at least one plan) are high, especially in the ESOPs.10 The average
value of company stock holdings (for employees with any stock) varies widely across companies –
from just under $8,000 to over $239,000.
Ownership Stakes
In this section we examine the extent of participation in employee stock ownership, the
size of employees’ ownership stakes, the importance of ownership relative to base pay, and the
value of company stock in relation to employee’s total wealth. These measures are reported for all
14 companies in the NBER study, a subsample of the nine ESOP companies in the NBER study,
and for the combined 2002 and 2006 General Social Surveys. The measures are also broken down
by position: management vs. non-management.
Table 2 presents various measures of employee stock ownership in the NBER shared
capitalism companies and the GSS national samples.11 Panel A confirms a very high participation
rate, for managers and non-managers alike, in the NBER companies, with nearly 87% of surveyed
9 One of the companies included in this group holds its company stock in a 401(k) rather than an ESOP. One became majority owned shortly after its employee survey was conducted. 10 As noted in Table 1, overall about 15% of the employees surveyed responded that they did not know if they held any employer stock. Here these employees are counted as non-participants (rather than dropped from the sample), significantly reducing reported participation rates for some companies. In the remaining tables they are excluded from the calculation of participation rates and company stock values. 11 All stock ownership and pay estimates presented here and below are reported in 2006 dollars.
10
employees in these firms reporting that they own employer stock – far higher than the 29%
incidence of employee ownership in the national sample of private-sector employees.12
The two most important sources of company stock ownership in the NBER study are (1)
ESOPs (including KSOPs and 401(k) plans that hold company stock), in which stock accumulates
in employees’ retirement accounts and (2) stock option plans, where employees are free to (and
usually do) sell their shares immediately upon exercising their options. Consequently, we expect
company stock ownership to be higher for employees in the subset of nine ESOP companies than
for employees of all of the companies in the NBER study, and indeed this is the case (see Panel B
of Table 2). Company stock holdings per employee (including those with no stock) are about
$52,800 in the NBER full dataset, and $76,000 for the nine NBER ESOPs. Based on the General
Social Surveys, employees nationwide own on average $10,600 worth of their employers’ stock.
We see in Panel C that the average stake of employee-owners (i.e., employees who own
some company stock) is $61,000 for all NBER companies and $85,900 for the NBER ESOPs.
The average ownership stake of employee-owners in the GSS national sample is $48,000. For the
NBER shared capitalist firms, non-managers (“Others”) own roughly one-third as much company
stock as managers, and the median holdings of the employee-owners is only about a quarter of the
12 The GSS asked respondents: “Do you own any shares of stock in the company where you now work, either directly or through some type of retirement or stock plan?” Those who answered affirmatively were asked for “a general estimate of how much cash you would get if all this stock were sold today.” They were not asked how they acquired their company stock, but it is likely that the majority of the GSS employee-owners did so through an employer sponsored program (rather than simply through open market purchases). Freeman (2007:2) indicates that the great majority of private sector employees who own shares in their company do so via either ESOPs or 401(k) plans.
The incidence of company stock ownership among GSS respondents may itself seem surprisingly high. Note that this estimate is based on a sample of permanent, full-time, private sector employees, who are 18 or over and have been in their current job for at least one year, and excludes respondents who didn’t know if they owned company stock – all conditions favoring a high participation rate.
11
mean.13 Although skewed toward the top, the distribution of employee-owned stock is
considerably less skewed than is the distribution of wealth in general.
Company stock contributions to ESOP accounts are governed by ERISA and generally
vary in proportion to participants’ taxable earnings (with a cap of $170,000 in 2001). But the
longer an employee has been in the plan, the more stock he or she can potentially accrue, so
differences in ownership stakes among employees can be due to differences in length of service as
well as differences in pay levels. In the case of the NBER ESOPs, controlling for job tenure
reduces the manager vs. non-manager gap in average company stock holdings in Panel C by just
9%, because in fact, there is little difference between managers and others in average job tenure.14
But it reduces the mean-median gap for all employees by 50%.15 ESOP account balances
increase, on average, by about $8,400 per year of service. As a result, a large part of the variation
in account balances among ESOP participants at any point in time is not due to unequal stock
allocations to ESOP accounts, but simply to differences in time-in-plan.
Panel D shows the value of employer stock holdings relative to base pay. In all cases
employee-owners own stock worth two-thirds or more of their annual base pay, with a higher ratio
for managers than for others in the NBER companies but a higher ratio for others than for
managers in the GSS. This reversal – with stock being more important (relative to pay) for non-
management employees than for managers – is due more to their relatively low pay than to large
company stock holdings.
13 The ratio of mean to the median employer stock holdings is a rough measure of the degree to which the distribution of company stock ownership is skewed to the right, with a relatively small number of employee-owners holding much more stock than the bulk of more typical owners. For perspective, Wolff (2004: Table1) reports a 13:1 ratio of mean to median household financial net worth in 2001 ($298,500 vs. $23,200). 14 Tenure-adjusted stock values for non-managerial employees are obtained by regressing stock value on job tenure for these employees and using this regression equation to find the expected stock value for non-managerial employees who have the mean job tenure of managerial employees. 15 Tenure-adjusted stock values are obtained by adjusting each employee’s stock value by the expected difference in value for someone with that employee’s job tenure vs. the mean job tenure for the sample.

12
Finally, Panel E reports employees’ estimates of the value of their company stock relative to
their total wealth. While company stock represents somewhat over half of pension assets, on
average, for the full sample of NBER employees (not shown in tables), it represents only about 20
percent, on average, of their total wealth. In the GSS as well, employee-owners hold just under 20%
of their wealth in company stock.
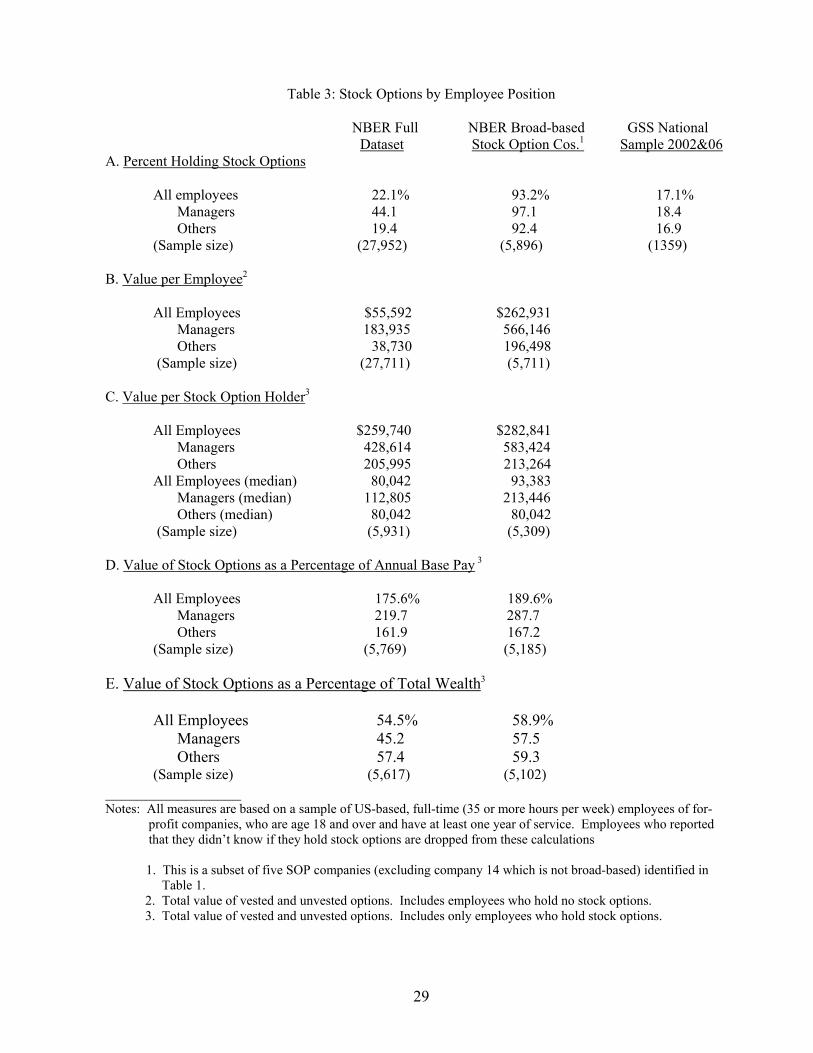
Table 3 (Panel A) reports the value of stock options held by employees in the NBER and the
2006 GSS datasets. Just 22% of employees in the NBER companies and 17% of employees in the
GSS hold stock options, but among the five broad-based stock option companies in the NBER study,
93% hold options to purchase their employers’ stock. The average value of these options is
$262,000 per employee (panel B) or $283,000 per option holder (Panel C).16
Focusing on the broad-based stock-options companies, we see that on average management
holds options worth about 2.5 times more than other employees’ options ($583,400 vs. $213,300).
On average, employees in these companies hold options worth almost two years pay (Panel D), and
in the case of managers almost three years pay. On average, over half of their wealth is held in these
stock-options (Panel E).
Do Employee-Owners Pay with Lower Wages?
Skeptics of employee ownership suggest that (for equivalent workers and working
conditions) whatever value ownership confers on employees must be offset by correspondingly
lower wages, since the market insures that total (risk-adjusted) compensation must be the same
everywhere. And there are reasons, besides competitive theory, to suppose that employees
receiving company stock might pay for it with lower wages. Unionized workers in airlines and
16 The values reported here are the net gain the employee would realize if his/her stock options were exercised and the stock sold.

13
trucking – industries under pressure of deregulation in the late 1970s and ‘80s – made large wage
concessions in return for ownership shares to save their companies and their jobs (Blasi, 1988:94;
Russell, 1985:200). Some high-tech startups, such as Amazon, acknowledged a compensation
strategy of luring talent on the cheap with stock options and below-market pay.17
The preponderance of empirical evidence, however, goes the other way. In a pre/post
study of ESOPs adopted by public companies between 1980 and 2004, Kim and Ouimet (2008)
find significant increases in employee compensation following the adoption of ESOPs,
particularly for ESOPs owning more than 5% of a company where the long-term increase in
compensation is 4.5%. A study of 490 firms with broad-based stock options found that these
companies paid their employees 8% more than all other public companies when most of them
introduced their stock-option plans in the mid 1980s, and continued to pay 8% more a decade later
(Sesil et al., 2007). Blasi, Conte and Kruse (1996) found that compensation per employee was 23
percent higher in publicly traded companies with more than 5 percent of their stock held in broad-
based employee stock ownership plans than it was in other firms. Kardas, Scharf, and Keogh
(1998) found mean and median wages of ESOP companies in Washington State to be higher than
a matched set of control companies. And Kruse and Blasi (2001), matching 1,176 pairs of ESOP
and non-ESOP companies, found that the ESOP companies were over four times more likely to
have traditional defined benefit plans and over five times more likely to have 401(k) plans – in
addition to their ESOPs.
What do our data say on this issue? Employees in the NBER companies receive higher
pay than employees in the GSS, but this simple comparison does not account for the select nature
17 Statistical evidence for wage substitution is harder to come by than anecdotal evidence. One tangentially related study of Italian producer co-ops by Pencavel, Pistaferri and Schivardi (2006) finds that “a worker in a co-op earned 15-16% less than a worker in a capitalist enterprise,” controlling for age, gender, region, establishment size, industry and occupation.

14
of the NBER firms. For a more finely tuned examination of the relationship between employee
ownership and pay levels, we compare wages (and perceptions about them) of employee-owners
and non-owners within datasets. First we consider employees’ views about their base pay relative
to the base pay of similarly qualified employees in similar jobs at other companies. Responses to
this question are reported in Table 4. Differences in the pattern of responses between owners and
non-owners in the NBER data are consistent with the substitution hypothesis, and they are
statistically significant. However, they are very small. In particular, the percentage of employee-
owners who felt that they were paid below market was only one percentage point more than the
percentage of non-owners who felt that they were paid below market (39.5% vs. 38.5%).
Responses of GSS employee-owners and non-owners do not differ significantly (due in part to the
much smaller sample size) and are not consistent with substitution. In fact a substantially higher
percentage of employee-owners felt that they were paid above market (29.2% vs. 21.4%).
Next we consider the relationship between employees’ pay and their ownership stakes
(more specifically, the annual increase in their ownership stake). The key independent variable in
this analysis is the ratio of the value of the employee’s accrued company stock per year of service
(indicating the annual growth of his/her ownership stake) to his or her annual base pay. A
negative relationship between this variable and pay suggests that the more important ownership
growth is relative to pay, the lower pay will be – in other words, ownership substitutes for pay. A
positive relationship is inconsistent with the substitution hypothesis.18
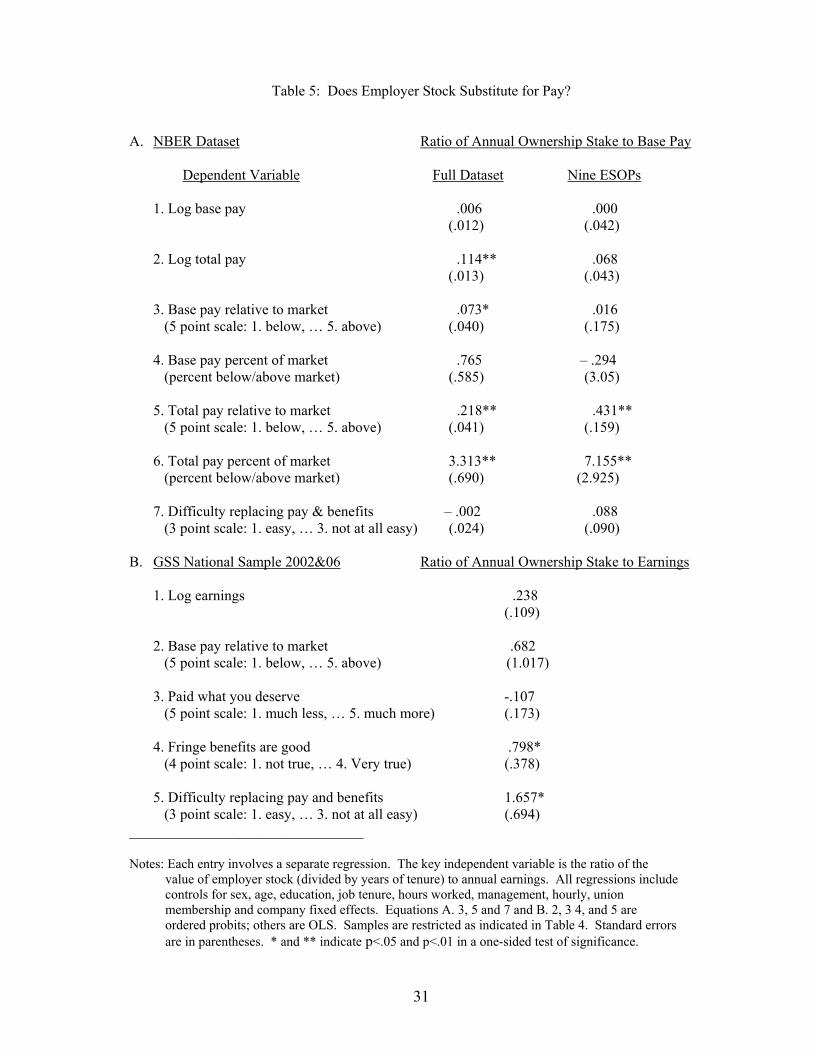
In Table 5A seven different measures of pay are regressed on this independent variable
(i.e., the annual increase in stock ownership relative to annual pay), controlling for an extensive
list of personal and job-related determinants of pay. The first two dependent variables in Panel A
18 We use the average annual increase in ownership stake since the level of stock ownership depends heavily on years of service, which obscures the relationship between pay and ownership.
15
are the log of base pay and of total pay. The next four are employees’ assessments of their pay
(fixed and total) relative to the pay of employees in similar jobs at other companies in their region.
The last dependent variable indicates respondents’ assessment of how hard would it be to find
another job with pay and benefits comparable to what they now have. In 12 of the 14 regressions,
the coefficient of the key ownership share variable is positive; in six of these it is statistically
significant (at better than a 5% level of significance), and in every case where the relationship is
statistically significant, it is positive. These results suggest that if there is any relationship
between company stock ownership and pay, it is a complementary one.
Panel B of Table 5 presents similar regressions based on the GSS data. Here the five
dependent variables are log earnings, perceptions of pay relative to market, assessments of pay and
fringe benefits, and the difficulty of finding another job with comparable pay and benefits. In four
of these five regressions the signs of the key coefficient are positive and in all of the statistically
significant estimates the coefficients are positive.
The main finding here is that there is no evidence that employee ownership substitutes for
wages or benefits. On the contrary, it appears on average to be an add-on, with employees’
ownership stake growing without sacrificing pay.19
Does Employee Ownership Build Wealth?
Here we turn to the question of whether employee ownership actually adds to wealth or
just changes the composition of wealth, substituting company stock for other forms of wealth
(e.g., assets in a 401(k) account or an IRA). Do employees, for example, buy company stock
19 These relationships were also estimated for samples restricted to non-managers and for the five NBER companies with the lowest pay, all with similar results. In no case was there statistically significant evidence of substitution of ownership for pay or benefits.
16
through an employee stock purchase plan instead of buying other stock or in addition to other
stock? In this case, employee ownership would just be a substitute for other forms of wealth,
rather than an addition to them.
Of course, we cannot know what the wealth levels of employee-owners would have been
in the absence of employee ownership, but we can see whether employee ownership is associated
with higher levels of overall wealth or not. If it is, that is prima facie evidence that employee
ownership does not fully substitute for other forms of wealth and thus increases total wealth.20
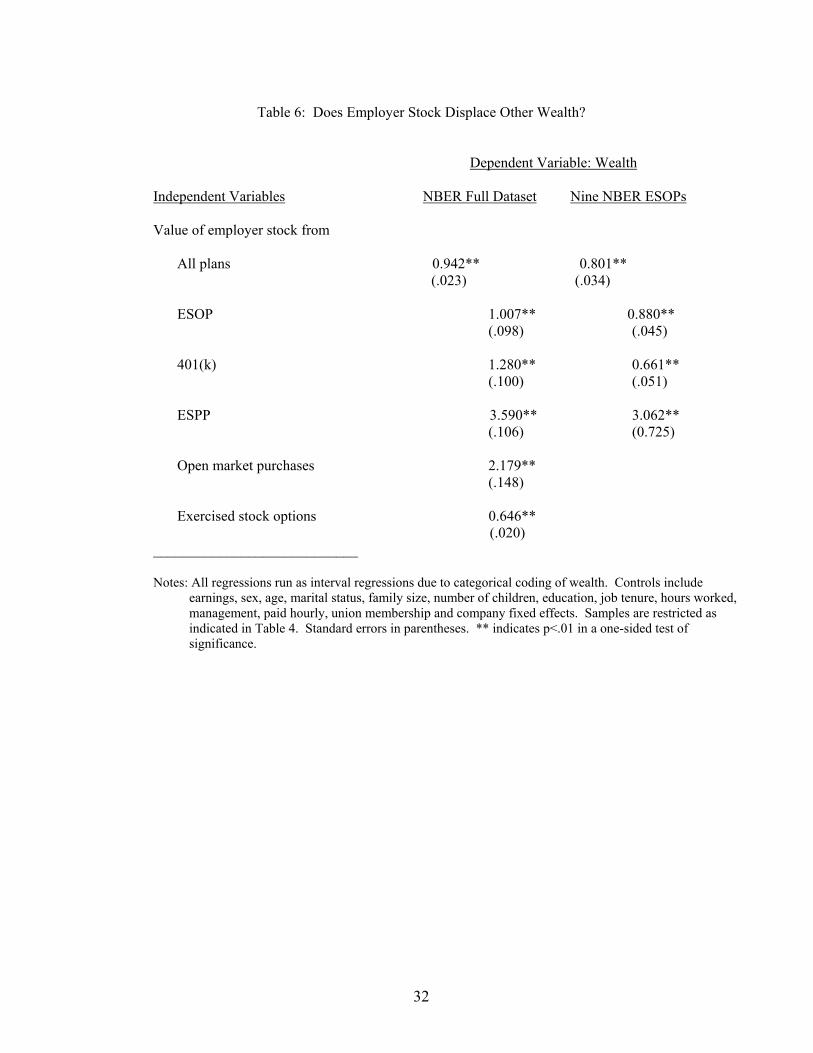
Table 6 presents some evidence on this question. Two regressions are reported for the
NBER full data set and two for the nine NBER ESOP companies. In each regression the
dependent variable is the employee’s wealth. Because wealth is a categorical variable in this
dataset, interval regressions are used to assess the relationship of employee ownership to overall
wealth.21 The key independent variable in the first regression on each dataset is the value of
company stock held in all plans. In the second regression this variable is replaced by the value of
company stock in each plan. All regressions also include a set of controls for other potential
determinants of wealth which might be correlated with the level of company stock holdings (see
table notes).
The first and most general result is the coefficient of 0.942 on company stock in all plans
in the first regression, which implies that each additional dollar of employer stock is associated
with 94.2 cents of higher wealth. That is, there appears to be very little reduction in other wealth
associated with increasing employee ownership (only about 6 cents less other wealth as employee 20 Moreover, as Joseph Blasi has pointed out to us, even if employee ownership is substituting for other wealth dollar for dollar, that does not mean there is no net gain for the employee. It still allows for a higher level of consumption at the same level of wealth. This is especially relevant for stock options, where options are usually exercised and the stock immediately sold. The proceeds can be reinvested (increasing wealth) or spent (increasing consumption), but in either case there is a welfare gain. 21 The NBER surveys asked employees to put their wealth into one of between 9 and 16 categories (depending on the survey). The regressions were run using Stata’s intreg command, with dollar values adjusted for inflation to represent 2006 values.

17
ownership increases by one dollar). For nine NBER ESOPs the corresponding coefficient is
0.801, which indicates that wealth rises 80.1 cents as employee ownership increases by one dollar,
so other wealth is decreasing by only 20 cents. While we cannot know what the wealth of
employees would have been in the absence of employee ownership, these results cast doubt on a
simple story of dollar-for-dollar substitution.
The regressions that include all plan types indicate the effect on total wealth of increases in
the value of company stock in each of the various methods of stock ownership – ESOPs, 401(k)’s,
Employee Stock Purchase Plans (ESPPs), exercised stock options, and open market purchases. In
these regressions, all of the coefficients are positive and statistically significant, indicating that
employee ownership is associated with higher wealth. The ESOP coefficient in the full dataset is
not significantly different from one, indicating no substitution of ESOP stock with other wealth,
while the coefficient of 0.880 in the ESOP-only regression indicates only minimal substitution for
other wealth. The coefficients on open market purchases and stock purchased through ESPPs are
much larger than one, which probably indicates that increases in (other) wealth lead to increased
investment in the employer’s stock.22 Exercised stock options have a coefficient of 0.646,
suggesting that an extra dollar of stock from stock options is associated with 64.6 cents of greater
wealth, and the remainder of the extra dollar (35.4 cents) may be substituting for other wealth as
employees save less as this form of wealth increases. A similar story may apply to the 401(k)
coefficient in the ESOP-only regression. While these estimates are necessarily rough, they are
generally inconsistent with the idea that employee ownership is substituting for other wealth, and
22 The large ESPP coefficient might also be partly due to the fact that company stock in ESPPs is typically bought at a 20% discount, so every $1 of stock purchased automatically raises wealth by $1.25. Also employees are most likely to buy company stock when its price is rising, and if the price does rise the value of their wealth will rise more than their dollar investment.
18
more consistent with the idea that increasing employee stock ownership by a dollar tends to raise
employee wealth by almost a dollar.
Another way to examine the wealth impact of employee ownership across the economic
spectrum is to compare the distribution of wealth classes with and without employee ownership.
Figures 1 to 3 provide such a comparison for the GSS sample, full NBER sample, and NBER
ESOP sample. Within each of these samples, the distribution of employees by wealth class was
predicted using multinomial logits, and the probabilities of membership in each class were then
predicted with the value of employer stock set to zero.23 If employee ownership makes no
difference in the levels or distribution of wealth (that is, if it fully substitutes for other wealth) then
these predicted and actual distributions will be identical.
As seen in Figure 1, the predicted and actual distributions by wealth class in the GSS
sample are fairly similar but employee ownership seems to shift the distribution to the right,
slightly decreasing the likelihood of being in the two lowest wealth classes (<$20,000) and slightly
increasing the likelihood of being in the $150,000-250,000 and >$500,000 wealth classes. Figure
2 shows a larger difference for employee ownership among the NBER shared capitalism
employees, where it appears to decrease membership in the six lowest wealth classes (<$150,000)
and increase membership in the classes above that, particularly in the >$500,000 class. Figure 3
finds the same pattern among employees in ESOP companies, but with more dramatic differences.
Combined membership in the four lowest wealth categories (<$75,000) is 47% without employee
ownership, and 34% with employee ownership. These figures are consistent with the idea that
employee ownership is enhancing wealth, not substituting for other forms of wealth.
23 The predictors used in the multinomial logits were gender, age, married, BA degree, graduate degree, black, Hispanic, household size, number of children, tenure, natural logarithm of annual earnings, and dollar value of employer stock held. The predicted likelihoods were averaged within each wealth class for an estimate of the percent of employees who would be in each wealth class.

19
The Distribution of Employee Stock Ownership and the Distribution of Wealth
Finally, we assess the distribution of company stock ownership and of all wealth (net
worth). Table 7A shows the distribution of employer stock across employees (for the NBER
companies and GSS employees) and compares it with Edward Wolff’s estimates of the
distribution of all stock across households. In both the NBER full sample and the ESOP
subsample the top 10% of employees hold about 64% of employer stock and the next 50% hold
almost all the rest. In the GSS the top 10 percent hold an estimated 73% of the company stock
(which is likely to be a lower bound estimate24), and the next 50% hold the remaining 27%. By
way of a rough comparison, Wolff (2004) finds that the top 10 percent of households hold 77% of
all stock.25 It is not surprising to find a more equal distribution of company stock among
employees of the “shared capitalism” companies in the NBER study (with over a third of company
stock held by those between the 40th and 90th percentile). Many fewer GSS respondents are
employee-owners and even fewer of them are likely to be employed in companies with a broad-
based employee ownership plan.
24 A problem with estimating the distribution of company stock ownership in the GSS sample is that 30% of the respondents who reported that they owned company stock did not report the value of that stock (usually because they didn’t know, rather than refused to say). Omitting these respondents from the calculation lends an upward bias to the distribution, resulting in an estimate that 91% of the company stock is held by the top 10%. We have no way of knowing the actual stock holdings of those who did not respond to the question. The GSS estimates in Table 7 are based on imputing stock values for employees who said they owned company stock but didn’t report how much. This imputation was done by regressing stock value on pay, sex, age, education, tenure and position (management vs. other) for the portion of the sample of employees who report stock value and using the resulting equation to estimate stock values for those who didn’t report. This procedure relies on the assumption that employee-owners who are statistically alike in their personal characteristics will have similar company stock holdings. Since it is likely that employee-owners who do not know the value of their company stock do not hold as much of it as their statistically similar counterparts who do know, we take 73.3% as a rough ‘lower bound’ estimate of the share of company stock held by the top 10% of GSS employees. 25 Comparisons in panel A of this table are confounded by inconsistencies in the unit of observation between the NBER/GSS data (company stock value per employee) and Wolff’s data (stock value per household). This observation does not apply to panel B, where the unit of observation is the household in the NBER/GSS data, as well as Wolff’s data.

20
Turning to Panel B of Table 7, we find that for both the NBER full sample and ESOPs and
the GSS, the top 10 percent of households hold around 55-58% of all wealth and the next 50%
hold 37-41%.26 The similarity of the numbers provides little evidence that employee ownership
has a significant impact on the wealth distribution. Comparisons among these samples may,
however, be affected by demographic differences (e.g., age, marital status, and household size)
that are related to wealth levels. This was checked in two ways. First, the NBER wealth
distribution was imputed based on predictors of wealth in the GSS sample, to see what the
distribution would look like if the NBER employees had the same wealth levels of
demographically-similar people in the general population. 27 The result (not reported in the table)
was that 55.9% of the wealth among NBER employees was predicted to be held by the top 10
percent, and 38.9% by the next 50 percent, indicating that the actual NBER wealth distribution is
similar to, but slightly less equal than, the NBER distribution predicted from the GSS.
A second and more straightforward way to examine the influence of employee ownership
on wealth distribution is to calculate the distribution for employees both with and without
employer stock (assuming that employer stock is not substituting for other forms of wealth, as is 26 Because the NBER and GSS wealth data are based on categorical variables rather than exact dollar values, the figures in Table 7B are approximations. The calculation of the wealth distribution is based on assigning mean dollar values to each category using data from the 2004 Survey of Consumer Finances (SCF). When the 90th and 40th percentiles fell within a wealth category, the distribution of wealth within that category in the SCF was used in order to estimate the total wealth of those above and below those percentiles. E.g., if those in the $500,000-1,000,000 wealth category covered the 85th to 95th percentiles of the NBER distribution, the median of the $500,000-1,000,000 category was identified in the SCF distribution, and the mean wealth was calculated above that median and multiplied by the number of NBER employees in the 90th to 95th percentiles for an estimate of total wealth among employees in that part of the distribution. That figure was then added to an estimate of total wealth for those in the 95th to 100th percentiles, using mean SCF wealth for each category multiplied by the number of employees in that category, to determine the total held by the top 10 percent. This procedure assumes that wealth is distributed similarly within each category for the NBER, GSS, and SCF samples. While only an approximation, it is unlikely to lead to any systematic bias. 27 The imputations were done using multinomial logits with the GSS data to predict membership in the wealth categories, then using these estimates to make predictions in the NBER sample of the likelihood of being in each wealth category. The predicted likelihoods were averaged within each wealth category for an estimate of the percent of employees who would be in each wealth category. The wealth distribution was then estimated using the procedure described in the previous footnote. The predictors used in the multinomial logits were gender, age, married, BA degree, graduate degree, black, Hispanic, household size, number of children, tenure, and natural logarithm of annual earnings.

21
strongly suggested by the earlier results). Panel C of Table 7 shows that when employee
ownership is subtracted from estimated wealth holdings, the share of wealth held by the top 10
percent is 57.0% among NBER employees, just slightly higher than the 56.3% figure that includes
employer stock (panel B). Both the middle and lower groups see slightly increased shares of
wealth from adding employee ownership. A similar pattern appears in the GSS data, where the
presence of employer stock slightly decreases the share of wealth among the top 10 percent from
55.9% (panel C) to 55.4% (panel B). The difference is larger in the ESOP sample, where 61.0%
of the wealth excluding employer stock is held by the top 10 percent, and adding employer stock
decreases that share to 58.5%, with increases in the shares of both the middle and bottom wealth
holders. This indicates that ESOPs may play a stronger role than other forms of employee
ownership in broadening ownership of wealth.
Examination of employee ownership by wealth class can also shed light on how employee
ownership affects the wealth distribution. Table 8 shows that average employee ownership, as a
percent of wealth, is very similar across the wealth categories for the NBER sample, with only a
slightly higher figure (19.5%) for the richest class compared to the poorest class (16.3%). There is
a similar pattern for ESOPs, with fairly uniform percentages across the wealth classes although a
higher percentage in the richest class. This indicates that while employee ownership may increase
wealth, it appears unlikely to have much effect on the distribution of wealth across workers since
everyone’s wealth is going up by a similar percentage (assuming a similar rate of substitution of
employee ownership for other wealth across the categories). The NBER-SCF comparison in
Table 8 clearly shows that employee ownership increases stock ownership as a percentage of
wealth across all of the wealth categories. This reinforces the finding at the top of Table 7 that

22
stock ownership is greater amid middle and lower employees in the NBER companies than in the
national samples.
The data in Tables 6 to 8 and Figure 1 point toward a wealth-enhancing effect of employee
ownership but suggest that the shape of the wealth distribution (reflecting the relative amounts
held by those at the top, middle, and bottom) may not be greatly affected by employee ownership.
This is not surprising when one considers that employee ownership plans often distribute company
stock in proportion to salary, and salary is also distributed unequally. Some simple calculations
illustrate this point. If each person in the NBER dataset were simply given an amount of company
stock equal to 10% of their yearly pay, we estimate that the percent of wealth held by the top 10
percent would fall from 56.3% (Table 7) to 55.7%. If a similar total were distributed in equal
dollar amounts ($5989) to each employee, that figure would fall only to 55.5%. The fact that
employee ownership is only a small portion of most workers’ wealth, and is often distributed in
proportion to pay which is itself unequal, indicates that employee ownership, as currently
practiced, is unlikely to significantly impact the existing distribution of wealth.
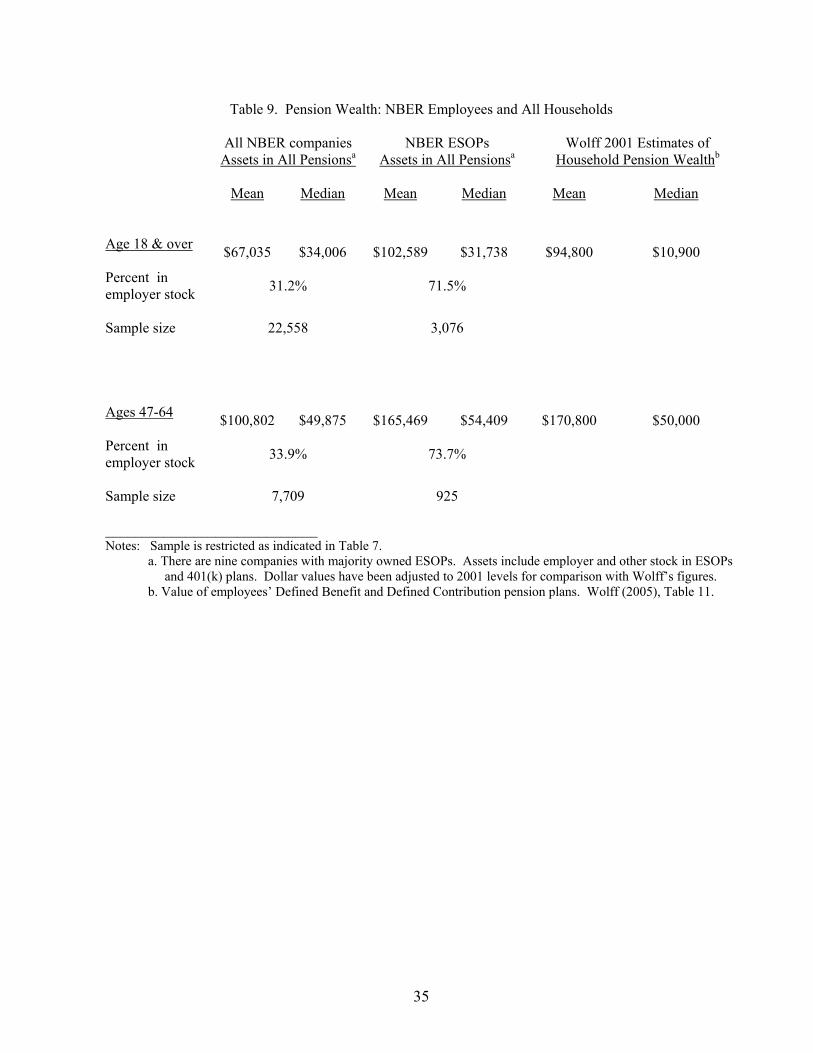
Finally, Table 9 compares the mean and median pension wealth of employees in the NBER
(full sample and ESOPs) with Wolff’s estimates of mean and median household pension wealth.
Here again we run into the problem of inconsistent units of observation, and the comparison likely
favors Wolff’s measure because households may have more than one member with a pension plan
and therefore more pension assets.
We expect pension values to be higher for the NBER ESOP companies than for all NBER
companies because ESOPs operate as retirement plans, with stock accumulating in them until the
employee retires (or otherwise leaves the company). The mean pension wealth for the ESOPs is
just a little higher than the mean in Wolff’s Survey of Consumer Finances data, but the median is
23
almost three times higher ($32,000 vs. $11,000), suggesting that companies with broad-based
employee ownership do benefit mid-level or median employees in their effect on the distribution
of pension assets. Turning to the “pre-retirement,” 47-64 age group, however, we find no practical
difference between the median pension assets of employees of these ESOPs vs. Wolff’s
households.
Conclusion
The NBER Shared Capitalism Research Project employee surveys indicate that shared
ownership builds wealth for employees. The average value of company stock held by employee
owners in the nine majority-owned ESOP companies is almost $86,000, and the average value of
stock options held by option holders in the five broad-based stock option companies is almost
$283,000. Median holdings are considerably lower ($22,800 and $93,400, respectively), and non-
managers’ holdings are only about one-third those of managers, on average. Nonetheless,
comparison of the NBER and GSS datasets shows that if all employees worked for companies
with broad-based employee-ownership plans like the NBER firms, a lot more employees would
own a lot more company stock.
There is no evidence that employees’ ownership gains are offset by lower wages or
benefits. While increases in company stock ownership appear to be partially offset by decreases in
other wealth, there is a substantial net gain in total wealth resulting from increases in employee
ownership – with a one dollar increase in ownership associated with almost a one dollar increase
in total wealth. We find some evidence here that the general pattern of capital ownership and
income going almost exclusively to the top is partly reversed by employee ownership, with
expanded stock ownership among those at the middle and bottom of the wealth distribution.

24
While employee-ownership inevitably increases employees’ firm specific risks in
proportion to the value of company stock owned, the risk-reward tradeoff appears to be
manageable (Blasi, Kruse, and Markowitz, 2008). Since employee ownership does not cause a
substantial decrease in ownership of other assets, this increased risk applies only to assets that
employees would not have if they worked at a non employee-ownership company. In addition,
employee ownership is only a small portion of wealth for most employee owners, consistent with
the bounds suggested by portfolio theory (assuming other assets are properly diversified). These
results indicate that broad-based employee ownership may be raising wealth for many workers
without unduly increasing worker risk.

25
Bibliography
Blasi, Joseph. 1988. Employee Ownership: Revolution or Ripoff? Ballinger. Blasi, Joseph, Michael Conte and Douglas Kruse. 1996. “Employee Stock Ownership and
Corporate Performance Among Public Companies,” Industrial and Labor Relations Review. v. 50, n. 1, October.
Blasi, Joseph, Douglas Kruse, and Aaron Bernstein. 2003. In the Company of Owners: The Truth
About Stock Options (And Why Every Employee Should Have Them). New York: Basic Books. Blasi, Joseph, Richard Freeman, Chris Mackin, and Douglas Kruse. 2008. “Creating a Bigger
Pie? The Effects of Employee Ownership, Profit Sharing, and Stock Options on Workplace Performance,” NBER Working Paper 14230, August.
Blasi, Joseph, Douglas Kruse, and Harry Markowitz. 2008. “Risk and Lack of Diversification
Under Employee Ownership and Shared Capitalism,” NBER Working Paper 14229, August. Freeman, Richard, Douglas Kruse and Joseph Blasi. 2008. “Worker Responses to Shirking under
Shared Capitalism,” NBER Working Paper 14227, August. Freeman, Steven F. 2007. “Effects of ESOP Adoption and Employee Ownership: Thirty Years of
Research and Experience,” Organizational Dynamics Working Paper #07-01, University of Pennsylvania.
Harden, Erika, Douglas Kruse, and Joseph Blasi. 2008. “Who Has a Better Idea? Innovation,
Shared Capitalism, and HR Policies,” NBER Working Paper 14234, August. Kardas, Peter, Adria Scharf and Jim Keogh. 1998. “Wealth and Income Consequences of ESOPs
and Employee Ownership: A Comparative Study from Washington State," Journal of Employee Ownership Law and Finance. v. 10, n. 4, Fall.
Kelso, Louis O. and Mortimer Adler. 1958. The Capitalist Manifesto. Random House. Kennickell, Arthur B. 2003. “A Rolling Tide: Changes in the Distribution of wealth in the U.S.,
1989-2001.” Working Paper, Board of Governors of the Federal Reserve System. Kim, E. Han, and Paige Ouimet. 2008. “Employee Capitalism or Corporate Socialism? Broad-based
Employee Stock Ownership,” Draft, Ross School of Business, University of Michigan, October. Kruse, Douglas. 2002. “Research Evidence on Prevalence and Effects of Employee Ownership,”
Journal of Employee Ownership Law and Finance. v. 14, n. 4. Fall Kruse, Douglas and Joseph Blasi. 2001. A Population Study of the Performance of ESOP and
Non-ESOP Privately-held Companies. New Brunswick, N.J. School of Management and labor Relations, Rutgers University. May.

26
Kruse, Douglas, Joseph Blasi, and Rhokeun Park. 2008. “Shared Capitalism in the U.S. Economy: Prevalence, Characteristics, and Employee Views of Financial Participation in Enterprises,” NBER Working Paper 14225, August.
Kruse, Douglas, Richard Freeman, and Joseph Blasi. 2008. “Do Workers Gain by Sharing?
Employee Outcomes Under Employee Ownership, Profit Sharing, and Broad-based Stock Options,” NBER Working Paper 14233, August.
Mackin, Christopher. 2005. “2005 Census of Massachusetts Companies with Employee Stock
Ownership Plans (ESOPs).” Boston: Commonwealth Corporation. Mishel, Lawrence, Jared Bernstein, and Sylvia Allegretto. 2007. The State of Working America
2006/2007. Ithaca, NY: Cornell University Press. Pencavel, John, Luigi Pistaferri and Fabiano Schivardi. 2006. “Wages, Employment and Capital in
Capitalist and Worker-Owned Firms” Industrial and Labor Relations Review. V. 60, n. 1. October
Piketty, Thomas and Emmanuel Saez. 2003. “Income Inequality in the United States, 1913-1998.”
The Quarterly journal of Economics. v. 118, n. 1, February. Rodrick, Scott S. 2005. An Introduction to ESOPs. Seventh edition. Oakland: The National
Center for Employee Ownership. Rosen, Corey. 2005. “Retirement security and Wealth Accumulation in S ESOP Companies.”
Oakland: The National Center for Employee Ownership. Russell, Raymond. 1985. Sharing Ownership in the Workplace. State University of New York
Press. Scharf, Adria and Christopher Mackin. 2000. “Census of Massachusetts Companies with
Employee Stock ownership Plans (ESOPs),” Boston: Commonwealth Corporation. Sesil, James, Maya Kroumova, Douglas Kruse, and Joseph Blasi. 2007. “Broad-based Employee
Stock Options in the United States: Company Performance and Characteristics,” Management Revue, Vol. 18, No. 2, pp. 5-22.
Weller, Christian and Edward N. Wolff. 2005. “Retirement Income: The Crucial Role of Social Security.” Washington, D. C.: Economics Policy Institute.
Wolff, Edward N. 2004. “Changes in Household Wealth in the 1980s and 1990s in the U.S.”
The Levy Institute of Bard College, Working Paper No. 407. Wolff, Edward N. 2005. “Is the Equalizing Effect of Retirement Wealth Wearing Off?” The
Levy Institute of Bard College, Working Paper No. 420.

27
Table 1: NBER Company Plans and Disposition of Company Stock
Stock is Publicly Percent of Stock Participation Rate Value per Company1 Plans Traded/Privately Held Held by Employees (% holding co. stock)4 Employee-Owner4,5
1 ESOP Private 100% 88.5% $239,139
2 ESOP Private 100 81.9 23,827
3 ESPP, SOP Public n.a. 97.1 138,430
4 ESOP Private 77 64.1 26,155
5 ESOP Private 332 39.1 7,877
6 401(k), ESPP, SOP Private 100 88.5 36,623
7 ESOP, ESPP, SOP Public 53 88.1 15,865
8 KSOP Private 100 77.5 166,713
9 ESOP Private 100 69.3 38,411
10 ESOP Private 75 52.0 40,407
11 401(k), ESPP, SOP Public n.a. 82.0 39,547
12 ESOP Private 100 87.1 99,000
13 ESPP, SOP Public n.a. 60.3 175,687
14 401(K), SOP Public n.a. 67.7 27,952
___________________ Notes: ESOP – Employee Stock Ownership Plan
KSOP – A 401(k) plan with matching contributions of company stock to a companion ESOP. 401(k) – A 401(k) plan that holds company stock, as well as other assets. (Note: All but one of these companies has a regular 401(k) plan.) ESPP – Employee Stock Purchase Plan SOP – Company grants stock options (broad based in all but one case) 1. Bold numbers indicate a subset of 9 ESOPs (or near-ESOPs) that are broken out in some subsequent analyses. 2. 33% at the time of the survey, soon after increased to 67%. 3. 15% including unexercised stock options. 4. Includes only U.S. based, full-time employees (35 or more hours per week), age 18 and over, with at least one year of service. Employees who didn’t know if they owned their employer’s stock (about 15% of this subsample) are assumed not to. In the case of stock option plans, employees who have ever received stock options are counted, even if they do not currently hold company stock. 5. Average value of employer stock for employees owning company stock.

28
Table 2: Employee Stock Ownership by Employee Position
NBER Full NBER ESOP GSS National Dataset Companies1 Sample 2002&06 A. Percent Owning Employer Stock
All employees 86.8% 88.6% 29.3% Managers 96.5 97.1 33.9 Others 85.6 87.4 28.5
(Sample size) (24,918) (3,889) (1370)
B. Value per Employee2
All Employees $ 52,759 $76,041 $10,590 Managers 126,948 202,078 17,814 Others 41,745 55,756 9,576 (Sample size) (24,202) (4,314) (1245)
C. Value per Employee-Owner3
All Employees $61,059 $85,926 $47,961 Managers 131,654 208,190 63,281 Others 49,030 63,874 45,109 All Employees (median) 15,484 22,767 15,000 Managers (median) 46,452 70,560 28,016 Others (median) 13,340 20,645 11,206 (Sample size) (20,912) (3,423) (276)
D. Value of Employer Stock as a Percentage of Annual Base Pay (NBER) or Earnings (GSS) 3
All Employees 65.4% 118.5% 75.8% Managers 95.5 179.8 62.0 Others 60.0 107.3 78.3 (Sample size) (18,796) (2,527) (269)
E. Value of Employer Stock as a Percentage of Total Wealth3
All Employees 19.5% 28.0% 18.2%4
Managers 21.9 34.1 13.5 Others 19.0 26.7 19.0
(Sample size) (18,789) (2,419) (113) _________________ Notes: All measures are based on a sample of US-based, full-time (35 or more hours per week) employees of for- profit companies, who are age 18 and over and have at least one year of service. Employees who reported that they didn’t know if they owned their employer’s stock are dropped from these calculations. 1. This is a subset of nine majority owned, privately held ESOP companies identified in Table 1. 2. Includes employees who own no employer stock. 3. Includes only employees who own employer stock. 4. Based on 2006 GSS only.
29
Table 3: Stock Options by Employee Position
NBER Full NBER Broad-based GSS National Dataset Stock Option Cos.1 Sample 2002&06 A. Percent Holding Stock Options
All employees 22.1% 93.2% 17.1% Managers 44.1 97.1 18.4 Others 19.4 92.4 16.9
(Sample size) (27,952) (5,896) (1359)
B. Value per Employee2
All Employees $55,592 $262,931 Managers 183,935 566,146 Others 38,730 196,498 (Sample size) (27,711) (5,711)
C. Value per Stock Option Holder3
All Employees $259,740 $282,841 Managers 428,614 583,424 Others 205,995 213,264 All Employees (median) 80,042 93,383 Managers (median) 112,805 213,446 Others (median) 80,042 80,042 (Sample size) (5,931) (5,309)
D. Value of Stock Options as a Percentage of Annual Base Pay 3
All Employees 175.6% 189.6% Managers 219.7 287.7 Others 161.9 167.2 (Sample size) (5,769) (5,185)
E. Value of Stock Options as a Percentage of Total Wealth3
All Employees 54.5% 58.9% Managers 45.2 57.5 Others 57.4 59.3
(Sample size) (5,617) (5,102) _________________ Notes: All measures are based on a sample of US-based, full-time (35 or more hours per week) employees of for- profit companies, who are age 18 and over and have at least one year of service. Employees who reported that they didn’t know if they hold stock options are dropped from these calculations 1. This is a subset of five SOP companies (excluding company 14 which is not broad-based) identified in Table 1. 2. Total value of vested and unvested options. Includes employees who hold no stock options. 3. Total value of vested and unvested options. Includes only employees who hold stock options.

30
Table 4: Perceptions of Base Pay Relative to Market for Employee-owners and Non-owners
NBER Full Dataset GSS 2006 National Sample
Employee- Non- Employee- Non- owners owners owners owners
1 Below market 14.2% 17.8% 15.5% 18.5%
2 25.3 20.7 14.3 11.0 3 At market 42.5 41.8 41.1 49.1 4 15.1 15.0 15.5 10.6 5 Above market 2.9 4.7 13.7 10.8 χ2 = 72.9 (p=.000) χ2 = 6.90 (p=.141) Sample size 19,093 2,836 168 464 _____________________ Notes: All subsamples are restricted to US-based employees of for-profit, private sector companies, who are 18 or over, usually work at least 35 hours per week and have at least one year of service with their employer. Respondents were asked “Do you believe your fixed annual wages last year were higher or lower than those of employees with similar experience and job descriptions in other companies in your region?”
31
Table 5: Does Employer Stock Substitute for Pay?
A. NBER Dataset Ratio of Annual Ownership Stake to Base Pay
Dependent Variable Full Dataset Nine ESOPs
1. Log base pay .006 .000 (.012) (.042) 2. Log total pay .114** .068 (.013) (.043) 3. Base pay relative to market .073* .016 (5 point scale: 1. below, … 5. above) (.040) (.175) 4. Base pay percent of market .765 – .294 (percent below/above market) (.585) (3.05) 5. Total pay relative to market .218** .431** (5 point scale: 1. below, … 5. above) (.041) (.159) 6. Total pay percent of market 3.313** 7.155** (percent below/above market) (.690) (2.925)
7. Difficulty replacing pay & benefits – .002 .088 (3 point scale: 1. easy, … 3. not at all easy) (.024) (.090)
B. GSS National Sample 2002&06 Ratio of Annual Ownership Stake to Earnings
1. Log earnings .238 (.109) 2. Base pay relative to market .682 (5 point scale: 1. below, … 5. above) (1.017) 3. Paid what you deserve -.107 (5 point scale: 1. much less, … 5. much more) (.173) 4. Fringe benefits are good .798* (4 point scale: 1. not true, … 4. Very true) (.378) 5. Difficulty replacing pay and benefits 1.657* (3 point scale: 1. easy, … 3. not at all easy) (.694)
________________________________
Notes: Each entry involves a separate regression. The key independent variable is the ratio of the value of employer stock (divided by years of tenure) to annual earnings. All regressions include controls for sex, age, education, job tenure, hours worked, management, hourly, union membership and company fixed effects. Equations A. 3, 5 and 7 and B. 2, 3 4, and 5 are ordered probits; others are OLS. Samples are restricted as indicated in Table 4. Standard errors are in parentheses. * and ** indicate p<.05 and p<.01 in a one-sided test of significance.
32
Table 6: Does Employer Stock Displace Other Wealth?
Dependent Variable: Wealth
Independent Variables NBER Full Dataset Nine NBER ESOPs Value of employer stock from All plans 0.942** 0.801** (.023) (.034) ESOP 1.007** 0.880**
(.098) (.045) 401(k) 1.280** 0.661** (.100) (.051) ESPP 3.590** 3.062** (.106) (0.725) Open market purchases 2.179** (.148) Exercised stock options 0.646**
(.020) ____________________________ Notes: All regressions run as interval regressions due to categorical coding of wealth. Controls include
earnings, sex, age, marital status, family size, number of children, education, job tenure, hours worked, management, paid hourly, union membership and company fixed effects. Samples are restricted as indicated in Table 4. Standard errors in parentheses. ** indicates p<.01 in a one-sided test of significance.

33
Table 7. Distribution of Stock Ownership and Wealth
Wealth Class
NBER Employees
Full Sample
NBER Employees
ESOPs
GSS Employees National Sample
2002 & 2006
Wolff 2001
(Households) A. Share of Employer Stock Share of All
Stock Top 10%
64.0% 64.0% 73.3%a 76.9%b
Next 50%
34.9 34.5 26.7 22.4
Bottom 40%
1.1 1.6 0.0 0.7
B. Share of All Wealth (Net Worth) Top 10%
56.3% 58.5% 55.4% 71.5%c
Next 50%
39.5 37.4 40.8 28.2
Bottom 40%
4.2 4.0 3.7 0.3
C. Share of All Wealth Excluding Employer Stock Top 10%
57.0% 61.0% 55.9%
Next 50%
39.2 36.0 40.5
Bottom 40%
3.8 3.0 3.6
_____________________________ Note: NBER and GSS samples are restricted as indicated in Table 4. NBER sample employees who reported that they did not know if they owned employer stock are excluded.
a. Imputes the value of employer’s stock for employee-owners who didn’t report it (see footnote 23). b. Wolff (2004), Table 13a. c. Wolff (2004), Table 2.

34
Table 8. Employee Ownership Distribution by Wealth Class Percent of employee’s wealth in: Wealth class Employee ownership All stocks
NBER full sample
NBER ESOPs SCF NBER
<$5000 16.3% 26.8% 1.4% 19.6% $5000-20,000 16.7% 18.7% 8.9% 23.0% $20,000-40,000 16.4% 19.1% 13.7% 23.3% $40,000-75,000 17.7% 22.4% 12.9% 26.2% $75,000-100,000 18.0% 24.8% 13.6% 28.2% $100,000-150,000 17.2% 24.7% 14.4% 29.0% $150,000-250,000 17.8% 26.6% 16.9% 31.9% $250,000-500,000 17.3% 27.9% 19.4% 34.3% $500,000 or more 19.5% 35.3% 26.8% 39.4%
35
Table 9. Pension Wealth: NBER Employees and All Households
All NBER companies Assets in All Pensionsa
NBER ESOPs
Assets in All Pensionsa
Wolff 2001 Estimates of
Household Pension Wealthb Mean Median Mean Median Mean Median Age 18 & over $67,035 $34,006 $102,589 $31,738 $94,800 $10,900
Percent in employer stock 31.2% 71.5%
Sample size
22,558 3,076
Ages 47-64 $100,802 $49,875 $165,469 $54,409 $170,800 $50,000
Percent in employer stock 33.9% 73.7%
Sample size
7,709 925
_____________________________ Notes: Sample is restricted as indicated in Table 7.
a. There are nine companies with majority owned ESOPs. Assets include employer and other stock in ESOPs and 401(k) plans. Dollar values have been adjusted to 2001 levels for comparison with Wolff’s figures. b. Value of employees’ Defined Benefit and Defined Contribution pension plans. Wolff (2005), Table 11.

36

37


![April 12, 20041 Employee Ownership Legal Update [Executive Summary] David R. Johanson Johanson Berenson LLP 707.226.8997 drj@esop-law.com 18 th Annual](https://img.pdfslide.net/doc/110x75/56649d815503460f94a656c5/april-12-20041-employee-ownership-legal-update-executive-summary-david-r.jpg)