Embed Size (px)
Citation preview
1
National case studies on potential waste and residue availability for cellulosic biofuel production in the EU Addendum to “Availability of cellulosic residues and wastes in the EU”
Stephanie Searle and Chris Malins, The International Council on Clean Transportation
Objective The report “Availability of cellulosic residues and wastes in the EU” (Searle and Malins, 2013), part of the Wasted project,1 estimated the amount of cellulosic wastes and residues that could be sustainably collected for use in cellulosic biofuel in the EU as a whole. This addendum provides disaggregated assessments of cellulosic waste and residue potential at the national level in 12 EU Member States. For these states, it assesses the amount of agricultural residues, forestry residues, and municipal waste that could be sustainably collected and used for biofuel. It also estimates of the number of bio-refineries that could be sustained on this quantity of feedstock, the number of jobs that would be created by this level of industry expansion, and the quantity of biofuel that could be produced. A number of methodological developments from Searle and Malins (2013) are presented, and utilized in these national assessments. Sustainable biomass availability is estimated for the present and projected to 2020 and 2030.
The following 12 EU countries are included: Czech Republic Denmark Finland France Germany Italy Poland Romania Slovakia Spain Sweden United Kingdom
Below we present results of the case studies as well as details on the data sources and calculation methodology used.
1 http://www.theicct.org/wasted-europes-untapped-resource-report
2
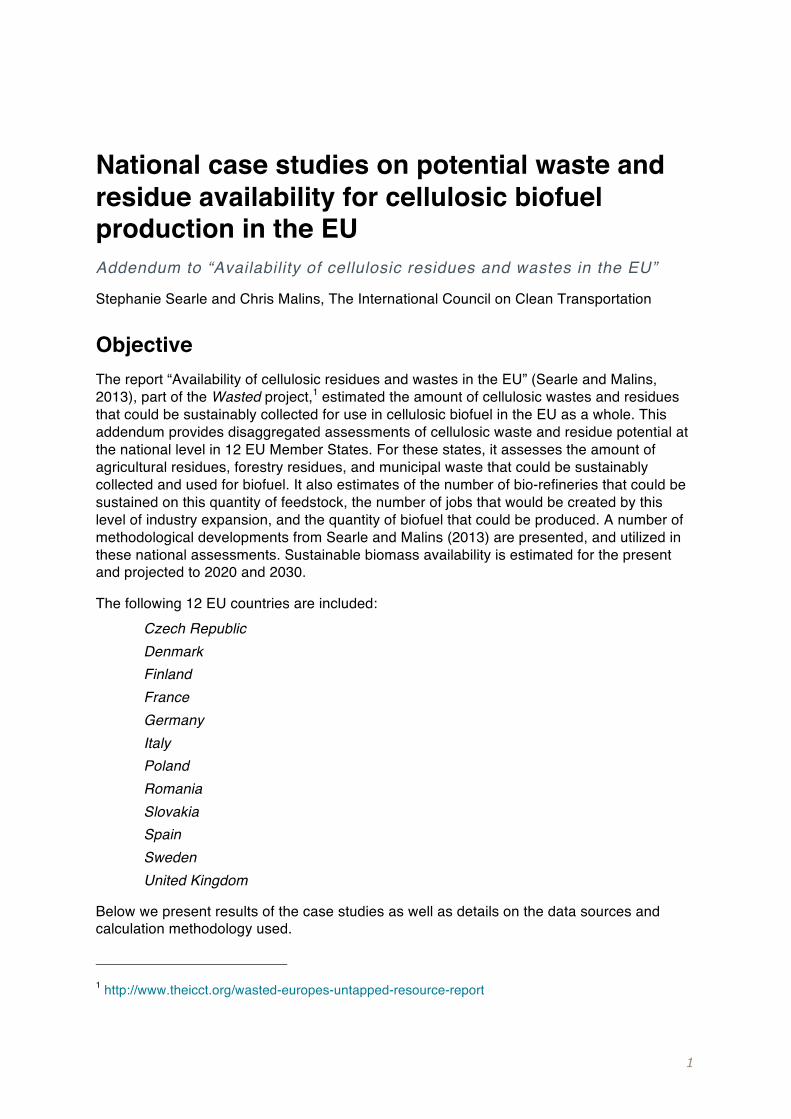
Summary of results As in Searle and Malins (2013), the amount of sustainable cellulosic wastes and residues in EU countries that is available for biofuel is estimated as the quantity of each feedstock left over after environmental concerns and existing uses are taken into account. In all calculations, national-level data is used where available. For agricultural and forestry residues, some amount of material should be left on site under sustainable harvesting practices to protect against soil erosion and soil carbon loss. Some agricultural residues have other existing uses, including livestock bedding and feed, mushroom cultivation, and horticultural uses, and should not be considered available for biofuel. Some these residues are also already collected to generate heat, electricity, and biogas – this resource could potentially be considered available if the use of wastes and residues in biofuel is prioritized over other energy production. Waste availability includes biogenic fractions that are not recycled or composted; as with agricultural and forestry residues, waste that is currently used to produce heat, power or biogas could potentially be considered sustainably available. The total amount of available cellulosic wastes and residues at the present is shown for each of the 12 countries in Figure A. In this figure, and other figures in this addendum, wastes and residues being used for bioenergy are shown as hatched bars.
Figure A Current sustainable availability* of cellulosic feedstock from agricultural residues, forestry residues, and waste in each country
*Here and throughout the report, hatched areas in bar charts represent material expected to be consumed for heat, power and biogas production. The color of the hatching indicates the resource in question
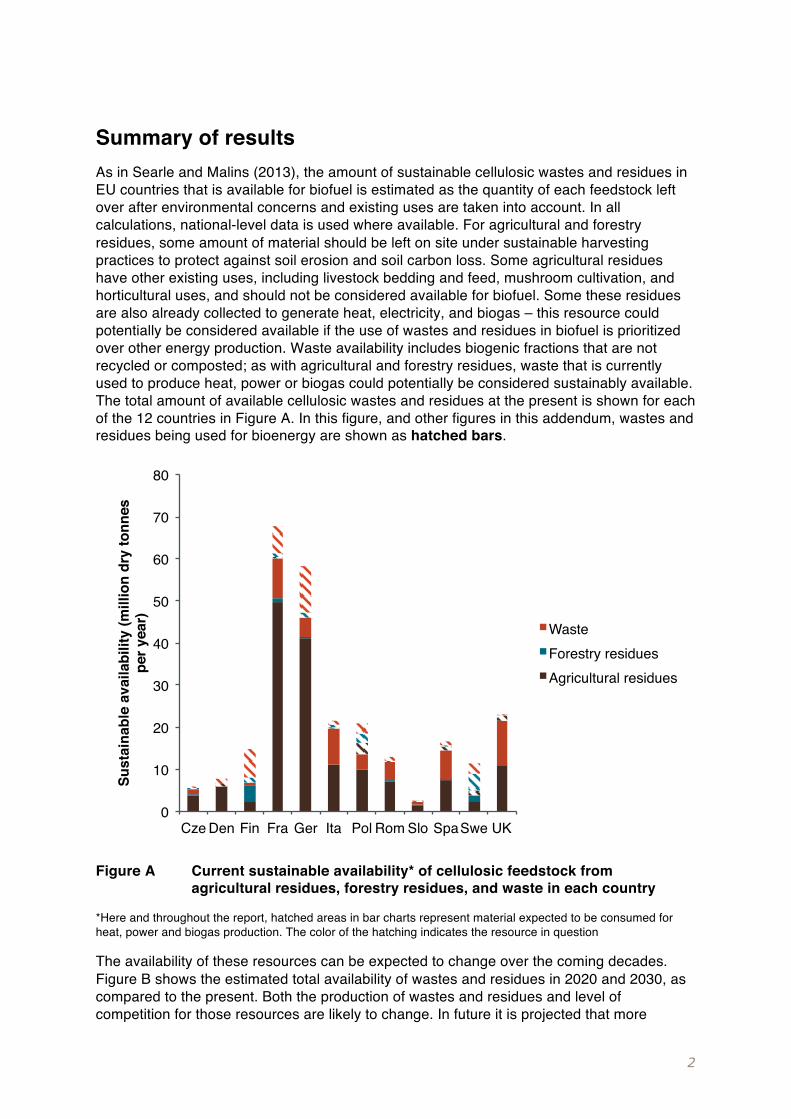
The availability of these resources can be expected to change over the coming decades. Figure B shows the estimated total availability of wastes and residues in 2020 and 2030, as compared to the present. Both the production of wastes and residues and level of competition for those resources are likely to change. In future it is projected that more
0
10
20
30
40
50
60
70
80
Cze Den Fin Fra Ger Ita Pol Rom Slo SpaSwe UK
Sust
aina
ble
avai
labi
lity
(mill
ion
dry
tonn
es
per y
ear)
WasteForestry residuesAgricultural residues
3
agricultural residues will be produced as total crop production increases, but some countries are expected to utilize an increasing amount of this resource for heat, power, and biogas. There is no clear indication of how forestry harvests, and thus forestry residue production, will change to 2020 and 2030, but as with agricultural residues the usage of this feedstock for heat and power will likely increase in most countries. Finally, as efforts to increase recycling and reduce generation of waste continue, the availability of waste for biofuel is expected to decrease in every European country. In some countries like France, the net of all these effects is that the sustainable availability of wastes and residues is projected to increase to 2020 and 2030, but in others like Poland net availability is expected to decrease slightly over time.
Figure B Total sustainable availability of cellulosic wastes and residues in each country at present and projected availability in 2020 and 2030
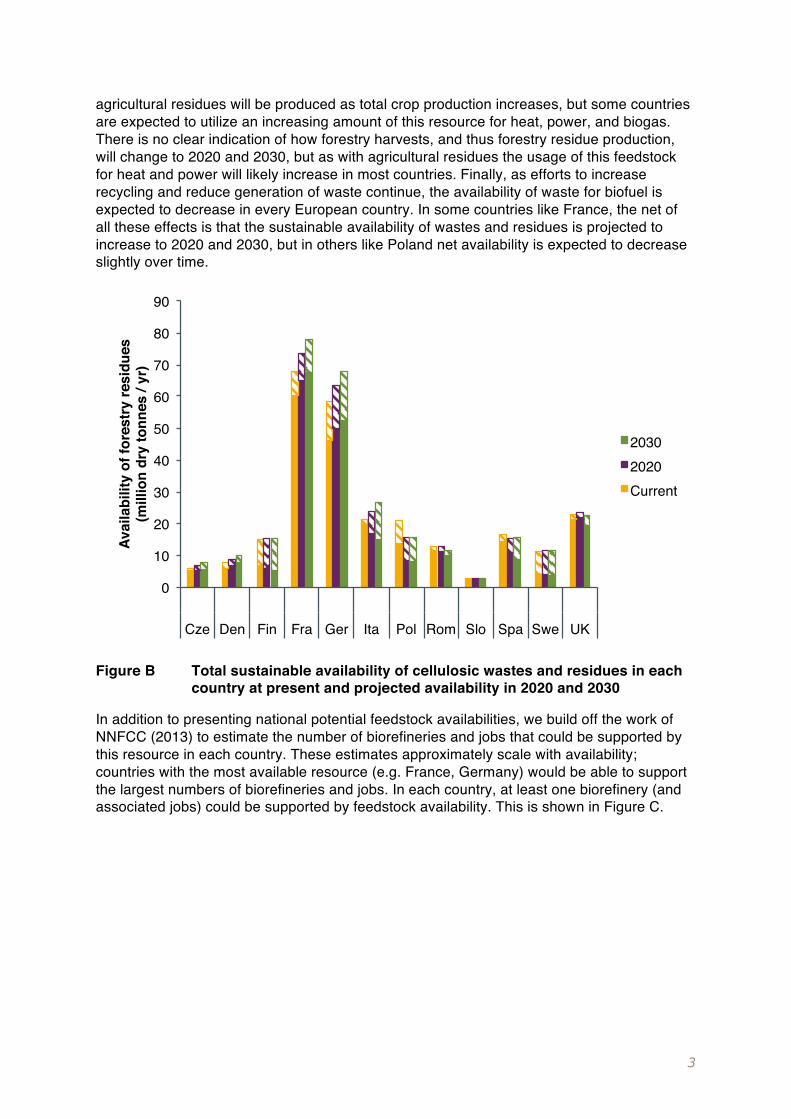
In addition to presenting national potential feedstock availabilities, we build off the work of NNFCC (2013) to estimate the number of biorefineries and jobs that could be supported by this resource in each country. These estimates approximately scale with availability; countries with the most available resource (e.g. France, Germany) would be able to support the largest numbers of biorefineries and jobs. In each country, at least one biorefinery (and associated jobs) could be supported by feedstock availability. This is shown in Figure C.
0
10
20
30
40
50
60
70
80
90
Cze Den Fin Fra Ger Ita Pol Rom Slo Spa Swe UK
Avai
labi
lity
of fo
rest
ry re
sidu
es
(mill
ion
dry
tonn
es /
yr)
20302020Current
4
Figure C Ranges of numbers of biorefineries and jobs that could be supported by the available cellulosic feedstock at present in each country
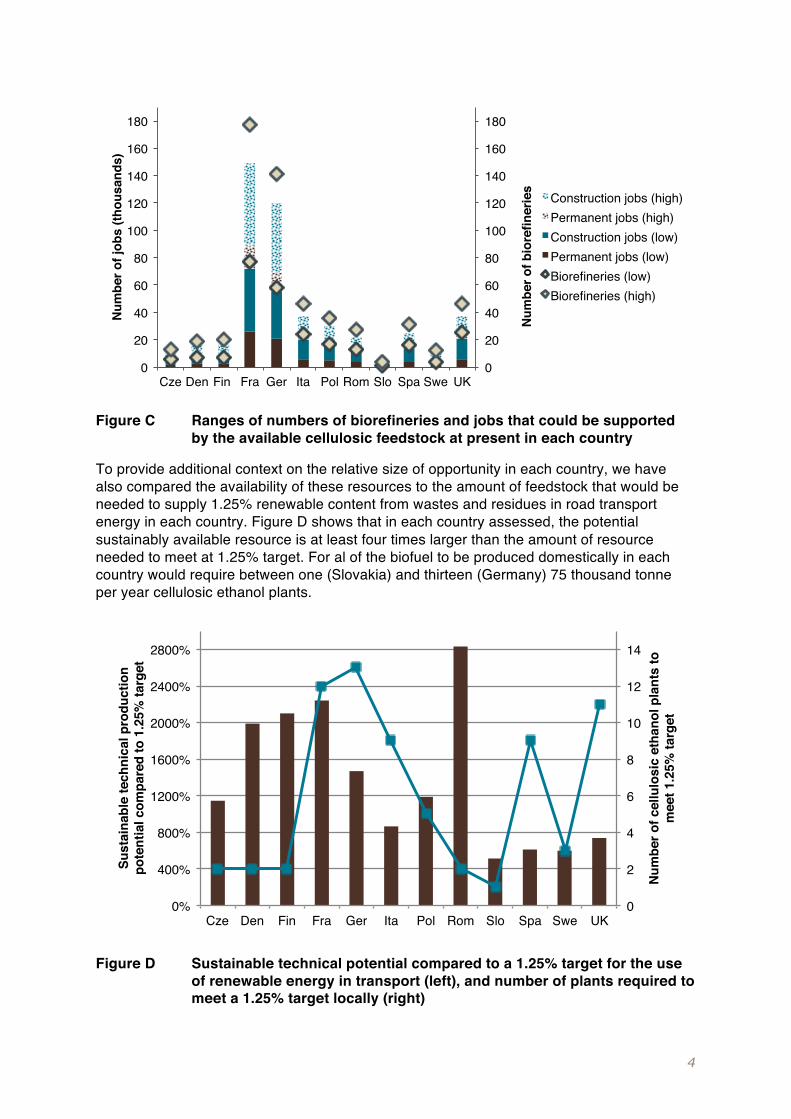
To provide additional context on the relative size of opportunity in each country, we have also compared the availability of these resources to the amount of feedstock that would be needed to supply 1.25% renewable content from wastes and residues in road transport energy in each country. Figure D shows that in each country assessed, the potential sustainably available resource is at least four times larger than the amount of resource needed to meet at 1.25% target. For al of the biofuel to be produced domestically in each country would require between one (Slovakia) and thirteen (Germany) 75 thousand tonne per year cellulosic ethanol plants.
Figure D Sustainable technical potential compared to a 1.25% target for the use of renewable energy in transport (left), and number of plants required to meet a 1.25% target locally (right)
0
20
40
60
80
100
120
140
160
180
0
20
40
60
80
100
120
140
160
180
Cze Den Fin Fra Ger Ita Pol Rom Slo Spa Swe UK
Num
ber o
f bio
refin
erie
s
Num
ber o
f job
s (th
ousa
nds)
Construction jobs (high)Permanent jobs (high)Construction jobs (low)Permanent jobs (low)Biorefineries (low)Biorefineries (high)
0
2
4
6
8
10
12
14
0%
400%
800%
1200%
1600%
2000%
2400%
2800%
Cze Den Fin Fra Ger Ita Pol Rom Slo Spa Swe UK
Num
ber o
f cel
lulo
sic
etha
nol p
lant
s to
m
eet 1
.25%
targ
et
Sust
aina
ble
tech
nica
l pro
duct
ion
pote
ntia
l com
pare
d to
1.2
5% ta
rget
5
Contents Objective ............................................................................................................................ 1 Summary of results ........................................................................................................... 2 Contents ............................................................................................................................. 5 Agricultural residue availability ....................................................................................... 6
Agricultural residue production ........................................................................................ 6 Residue retention for soil quality ...................................................................................... 7 Other uses for agricultural residues ................................................................................. 9 Availability of agricultural residues for biofuel ................................................................ 10
Forestry residue availability ........................................................................................... 12 Forestry residue production ........................................................................................... 12 Residue retention for soil quality .................................................................................... 15 Existing usage of forestry residues for heat and power ................................................. 16 Availability of forestry residues for biofuel ...................................................................... 17
Waste availability ............................................................................................................. 18 Production of biogenic wastes ....................................................................................... 18 Recycling and other uses of waste ................................................................................ 20 Data discrepancies ........................................................................................................ 21 Availability of waste for biofuel ....................................................................................... 22 Projection to 2020 and 2030 .......................................................................................... 23 Uncertainty in the estimation of waste availability .......................................................... 25
Overall availability of wastes and residues for biofuel ................................................ 26 Production potential and job creation ........................................................................... 29
Number of biofuel facilities ............................................................................................. 30 Jobs supported by biofuel production ............................................................................ 32
Conclusion ....................................................................................................................... 35 Literature cited ................................................................................................................. 36
6
Agricultural residue availability
Agricultural residue production
As in the on “Availability of cellulosic wastes and residues in the EU,” residue availabilities for the 12 crops with the highest production in the EU are assessed; these are: barley, maize, oats, olives, rapeseed, rice, rye, soybeans, sugar beet, sunflower seed, triticale, and wheat. The total production of agricultural residues is calculated based on the production of the main commodity crop multiplied by a residue ratio, or the ratio of residue to commodity crop. The same sources for the residue ratios in Searle and Malins (2013) are used here; this includes both field residues (such as wheat straw) and process residues (such as olive pits). Residue production is adjusted for moisture content and oven dry tonnes are presented here.
Production data for these 12 commodity crops is taken from FAOSTAT. Total production in each country studied is averaged over the most recent five years of available data (2009-2013).
As in Searle and Malins (2013), projections to 2020 and 2030 are made based on projections of total production of major categories of commodity crops in European Commission (2012). It is assumed that the residue ratio remains constant over time.
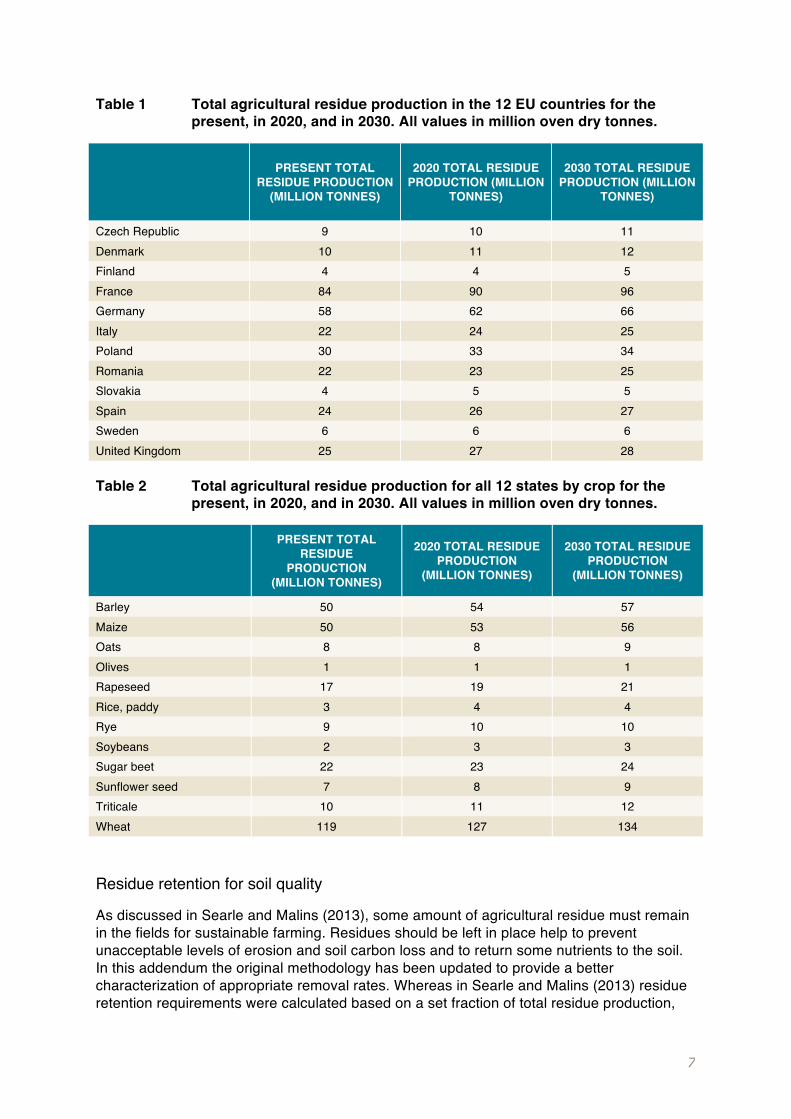
Table 1 presents total residue production in each country studied for the present, as well as projections to 2020 and 2030. Table 2 presents the same information organized by crop.
7
Table 1 Total agricultural residue production in the 12 EU countries for the present, in 2020, and in 2030. All values in million oven dry tonnes.
PRESENT TOTAL RESIDUE PRODUCTION
(MILLION TONNES)
2020 TOTAL RESIDUE PRODUCTION (MILLION
TONNES)
2030 TOTAL RESIDUE PRODUCTION (MILLION
TONNES)
Czech Republic 9 10 11 Denmark 10 11 12 Finland 4 4 5 France 84 90 96 Germany 58 62 66 Italy 22 24 25 Poland 30 33 34 Romania 22 23 25 Slovakia 4 5 5 Spain 24 26 27 Sweden 6 6 6 United Kingdom 25 27 28
Table 2 Total agricultural residue production for all 12 states by crop for the present, in 2020, and in 2030. All values in million oven dry tonnes.
PRESENT TOTAL RESIDUE
PRODUCTION (MILLION TONNES)
2020 TOTAL RESIDUE PRODUCTION
(MILLION TONNES)
2030 TOTAL RESIDUE PRODUCTION
(MILLION TONNES)
Barley 50 54 57 Maize 50 53 56 Oats 8 8 9 Olives 1 1 1 Rapeseed 17 19 21 Rice, paddy 3 4 4 Rye 9 10 10 Soybeans 2 3 3 Sugar beet 22 23 24 Sunflower seed 7 8 9 Triticale 10 11 12 Wheat 119 127 134
Residue retention for soil quality
As discussed in Searle and Malins (2013), some amount of agricultural residue must remain in the fields for sustainable farming. Residues should be left in place help to prevent unacceptable levels of erosion and soil carbon loss and to return some nutrients to the soil. In this addendum the original methodology has been updated to provide a better characterization of appropriate removal rates. Whereas in Searle and Malins (2013) residue retention requirements were calculated based on a set fraction of total residue production,
8
for the national estimates we estimate the acceptable rate of residue harvest as the amount of residue available in excess of a certain minimum threshold. This approach is more appropriate for two reasons: (a) harvesting machinery has a limited efficiency in collecting residue, and it is difficult to harvest very low concentrations of residue, and (b) erosion is influenced by the absolute amount of residue left on the soil surface, not the fraction of what was originally produced (USDOE, 2011; Parker, 2011; Lindstrom et al., 1981). For example, retaining half the residue in a field producing a total of 3 tonnes per hectare will not be as protective as retaining half the residue in another field producing 6 tonnes per hectare.
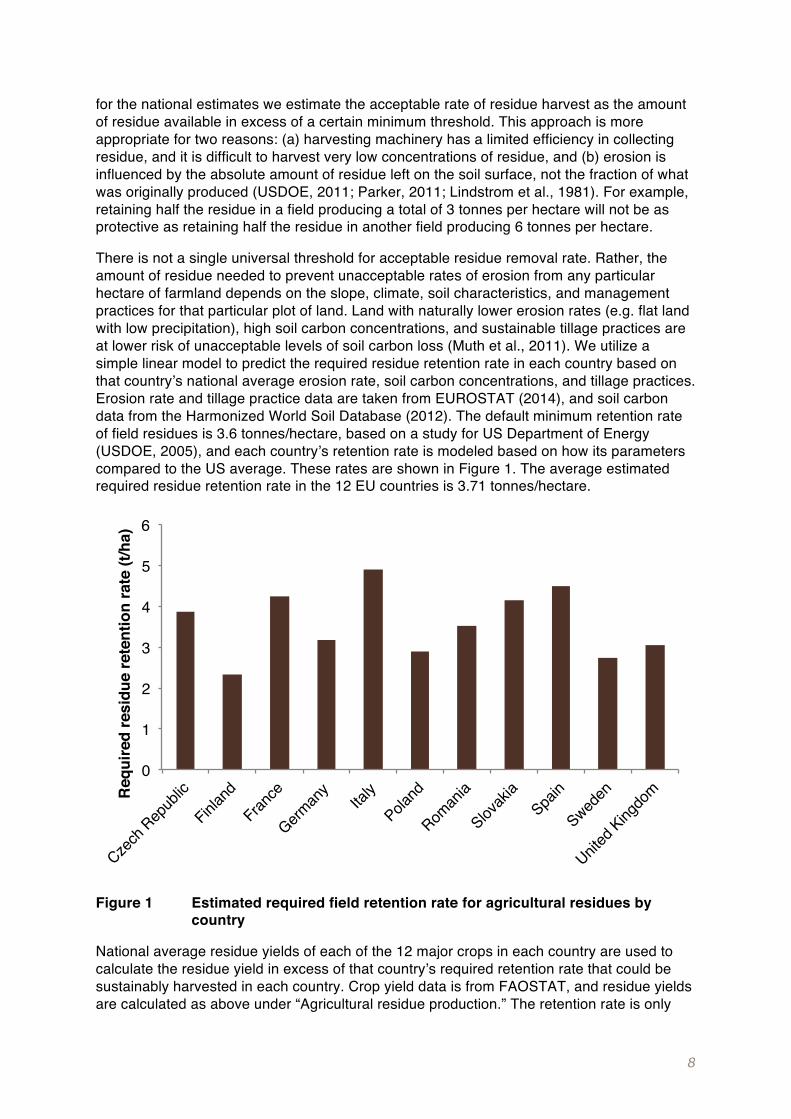
There is not a single universal threshold for acceptable residue removal rate. Rather, the amount of residue needed to prevent unacceptable rates of erosion from any particular hectare of farmland depends on the slope, climate, soil characteristics, and management practices for that particular plot of land. Land with naturally lower erosion rates (e.g. flat land with low precipitation), high soil carbon concentrations, and sustainable tillage practices are at lower risk of unacceptable levels of soil carbon loss (Muth et al., 2011). We utilize a simple linear model to predict the required residue retention rate in each country based on that country’s national average erosion rate, soil carbon concentrations, and tillage practices. Erosion rate and tillage practice data are taken from EUROSTAT (2014), and soil carbon data from the Harmonized World Soil Database (2012). The default minimum retention rate of field residues is 3.6 tonnes/hectare, based on a study for US Department of Energy (USDOE, 2005), and each country’s retention rate is modeled based on how its parameters compared to the US average. These rates are shown in Figure 1. The average estimated required residue retention rate in the 12 EU countries is 3.71 tonnes/hectare.
Figure 1 Estimated required field retention rate for agricultural residues by country
National average residue yields of each of the 12 major crops in each country are used to calculate the residue yield in excess of that country’s required retention rate that could be sustainably harvested in each country. Crop yield data is from FAOSTAT, and residue yields are calculated as above under “Agricultural residue production.” The retention rate is only
0
1
2
3
4
5
6
Czech
Repub
lic
Finland
France
German
yIta
lyPola
nd
Roman
ia
Slovak
iaSpa
in
Sweden
United
Kingdo
mReq
uire
d re
sidu
e re
tent
ion
rate
(t/h
a)
9
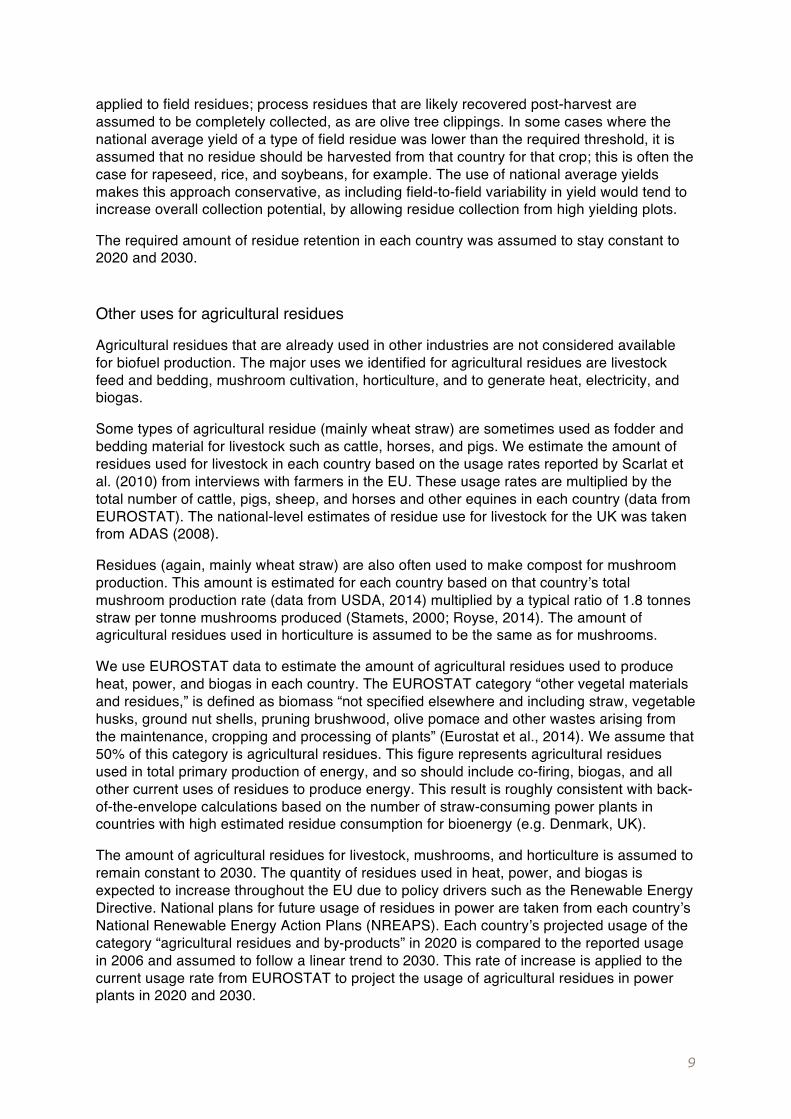
applied to field residues; process residues that are likely recovered post-harvest are assumed to be completely collected, as are olive tree clippings. In some cases where the national average yield of a type of field residue was lower than the required threshold, it is assumed that no residue should be harvested from that country for that crop; this is often the case for rapeseed, rice, and soybeans, for example. The use of national average yields makes this approach conservative, as including field-to-field variability in yield would tend to increase overall collection potential, by allowing residue collection from high yielding plots.
The required amount of residue retention in each country was assumed to stay constant to 2020 and 2030.
Other uses for agricultural residues
Agricultural residues that are already used in other industries are not considered available for biofuel production. The major uses we identified for agricultural residues are livestock feed and bedding, mushroom cultivation, horticulture, and to generate heat, electricity, and biogas.
Some types of agricultural residue (mainly wheat straw) are sometimes used as fodder and bedding material for livestock such as cattle, horses, and pigs. We estimate the amount of residues used for livestock in each country based on the usage rates reported by Scarlat et al. (2010) from interviews with farmers in the EU. These usage rates are multiplied by the total number of cattle, pigs, sheep, and horses and other equines in each country (data from EUROSTAT). The national-level estimates of residue use for livestock for the UK was taken from ADAS (2008).
Residues (again, mainly wheat straw) are also often used to make compost for mushroom production. This amount is estimated for each country based on that country’s total mushroom production rate (data from USDA, 2014) multiplied by a typical ratio of 1.8 tonnes straw per tonne mushrooms produced (Stamets, 2000; Royse, 2014). The amount of agricultural residues used in horticulture is assumed to be the same as for mushrooms.
We use EUROSTAT data to estimate the amount of agricultural residues used to produce heat, power, and biogas in each country. The EUROSTAT category “other vegetal materials and residues,” is defined as biomass “not specified elsewhere and including straw, vegetable husks, ground nut shells, pruning brushwood, olive pomace and other wastes arising from the maintenance, cropping and processing of plants” (Eurostat et al., 2014). We assume that 50% of this category is agricultural residues. This figure represents agricultural residues used in total primary production of energy, and so should include co-firing, biogas, and all other current uses of residues to produce energy. This result is roughly consistent with back-of-the-envelope calculations based on the number of straw-consuming power plants in countries with high estimated residue consumption for bioenergy (e.g. Denmark, UK).
The amount of agricultural residues for livestock, mushrooms, and horticulture is assumed to remain constant to 2030. The quantity of residues used in heat, power, and biogas is expected to increase throughout the EU due to policy drivers such as the Renewable Energy Directive. National plans for future usage of residues in power are taken from each country’s National Renewable Energy Action Plans (NREAPS). Each country’s projected usage of the category “agricultural residues and by-products” in 2020 is compared to the reported usage in 2006 and assumed to follow a linear trend to 2030. This rate of increase is applied to the current usage rate from EUROSTAT to project the usage of agricultural residues in power plants in 2020 and 2030.
10
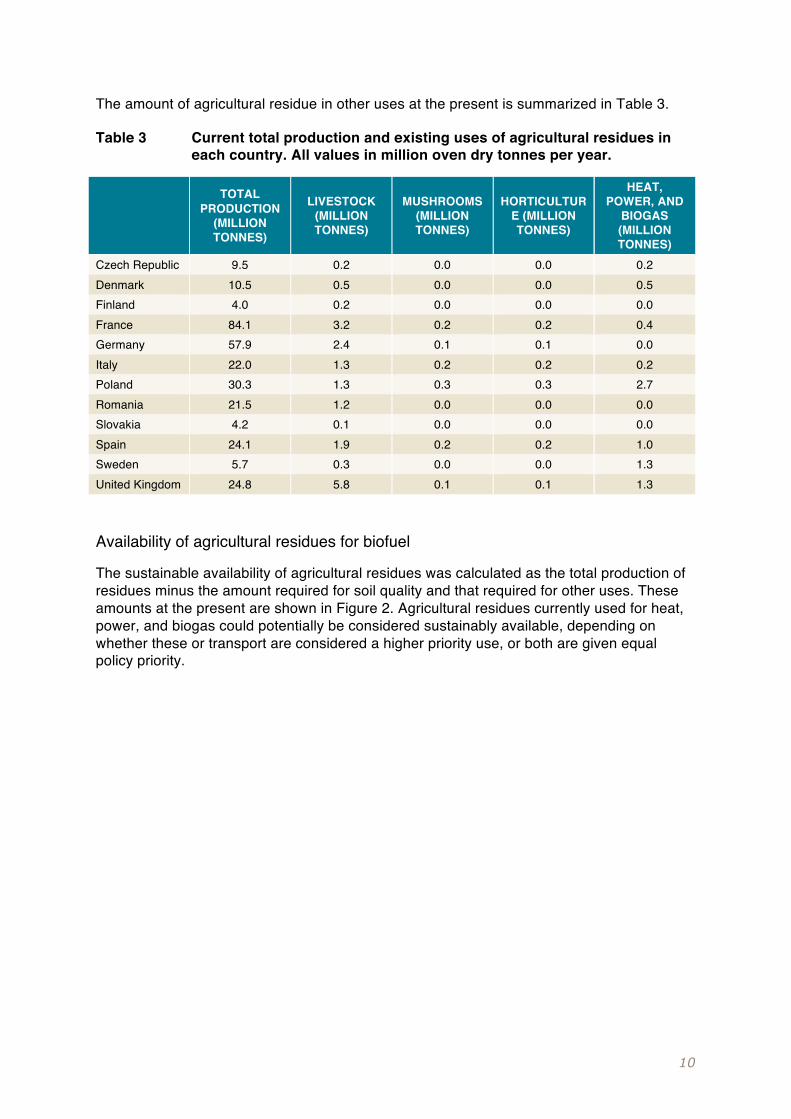
The amount of agricultural residue in other uses at the present is summarized in Table 3.
Table 3 Current total production and existing uses of agricultural residues in each country. All values in million oven dry tonnes per year.
TOTAL PRODUCTION
(MILLION TONNES)
LIVESTOCK (MILLION TONNES)
MUSHROOMS (MILLION TONNES)
HORTICULTURE (MILLION TONNES)
HEAT, POWER, AND
BIOGAS (MILLION TONNES)
Czech Republic 9.5 0.2 0.0 0.0 0.2 Denmark 10.5 0.5 0.0 0.0 0.5 Finland 4.0 0.2 0.0 0.0 0.0 France 84.1 3.2 0.2 0.2 0.4 Germany 57.9 2.4 0.1 0.1 0.0 Italy 22.0 1.3 0.2 0.2 0.2 Poland 30.3 1.3 0.3 0.3 2.7 Romania 21.5 1.2 0.0 0.0 0.0 Slovakia 4.2 0.1 0.0 0.0 0.0 Spain 24.1 1.9 0.2 0.2 1.0 Sweden 5.7 0.3 0.0 0.0 1.3 United Kingdom 24.8 5.8 0.1 0.1 1.3
Availability of agricultural residues for biofuel
The sustainable availability of agricultural residues was calculated as the total production of residues minus the amount required for soil quality and that required for other uses. These amounts at the present are shown in Figure 2. Agricultural residues currently used for heat, power, and biogas could potentially be considered sustainably available, depending on whether these or transport are considered a higher priority use, or both are given equal policy priority.
11
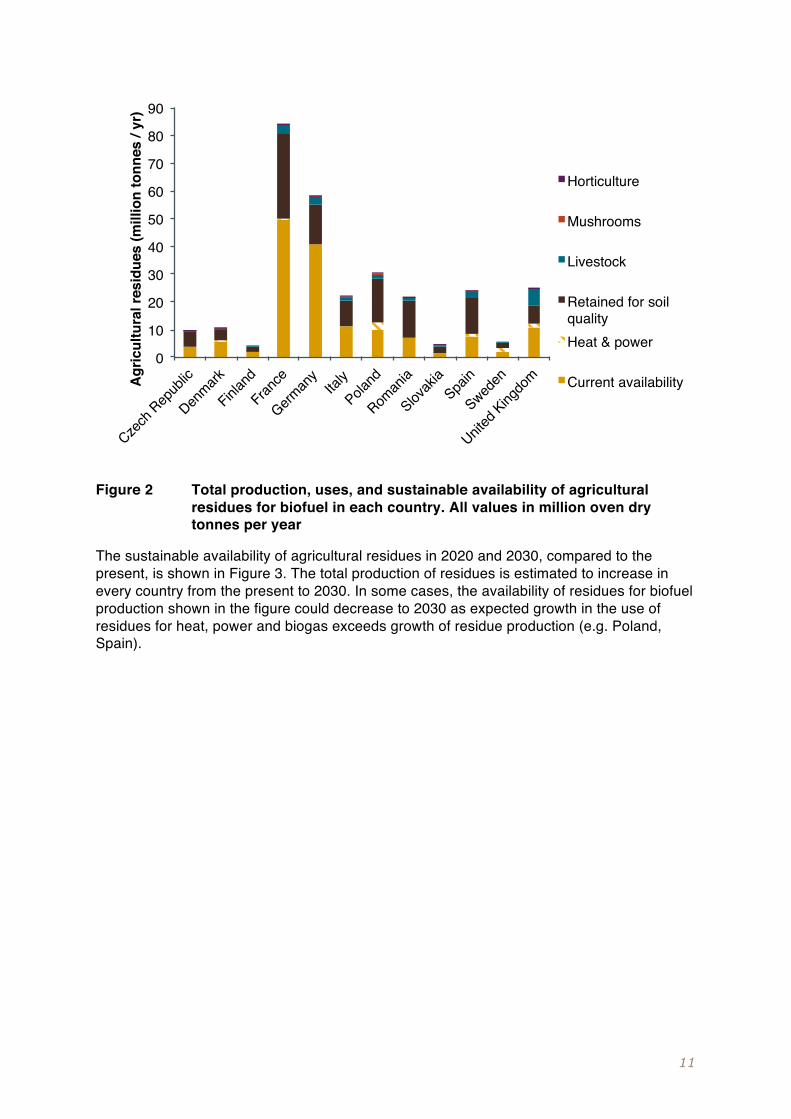
Figure 2 Total production, uses, and sustainable availability of agricultural residues for biofuel in each country. All values in million oven dry tonnes per year
The sustainable availability of agricultural residues in 2020 and 2030, compared to the present, is shown in Figure 3. The total production of residues is estimated to increase in every country from the present to 2030. In some cases, the availability of residues for biofuel production shown in the figure could decrease to 2030 as expected growth in the use of residues for heat, power and biogas exceeds growth of residue production (e.g. Poland, Spain).
0
10
20
30
40
50
60
70
80
90
Czech
Repub
lic
Denmark
Finland
France
German
yIta
lyPola
nd
Roman
ia
Slovak
iaSpa
in
Sweden
United
Kingdo
mAgr
icul
tura
l res
idue
s (m
illio
n to
nnes
/ yr
)
Horticulture
Mushrooms
Livestock
Retained for soil qualityHeat & power
Current availability
12
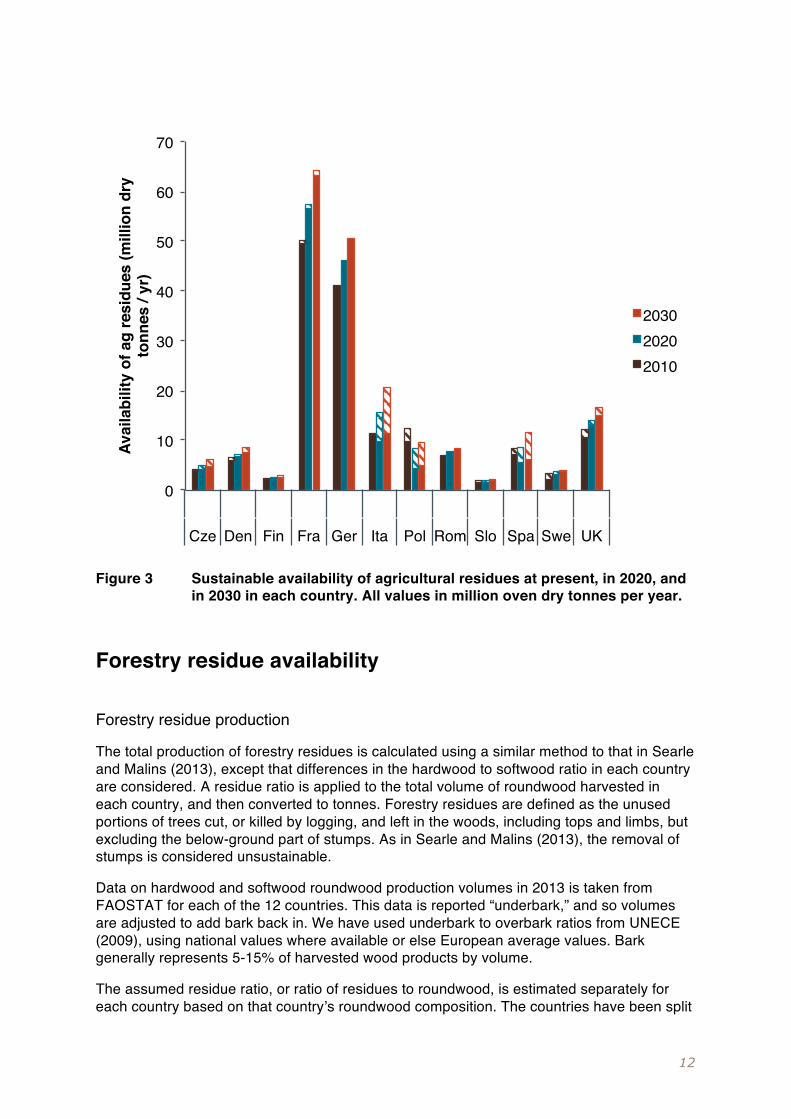
Figure 3 Sustainable availability of agricultural residues at present, in 2020, and in 2030 in each country. All values in million oven dry tonnes per year.
Forestry residue availability
Forestry residue production
The total production of forestry residues is calculated using a similar method to that in Searle and Malins (2013), except that differences in the hardwood to softwood ratio in each country are considered. A residue ratio is applied to the total volume of roundwood harvested in each country, and then converted to tonnes. Forestry residues are defined as the unused portions of trees cut, or killed by logging, and left in the woods, including tops and limbs, but excluding the below-ground part of stumps. As in Searle and Malins (2013), the removal of stumps is considered unsustainable.
Data on hardwood and softwood roundwood production volumes in 2013 is taken from FAOSTAT for each of the 12 countries. This data is reported “underbark,” and so volumes are adjusted to add bark back in. We have used underbark to overbark ratios from UNECE (2009), using national values where available or else European average values. Bark generally represents 5-15% of harvested wood products by volume.
The assumed residue ratio, or ratio of residues to roundwood, is estimated separately for each country based on that country’s roundwood composition. The countries have been split
0
10
20
30
40
50
60
70
Cze Den Fin Fra Ger Ita Pol Rom Slo Spa Swe UK
Avai
labi
lity
of a
g re
sidu
es (m
illio
n dr
y to
nnes
/ yr
)
203020202010
13
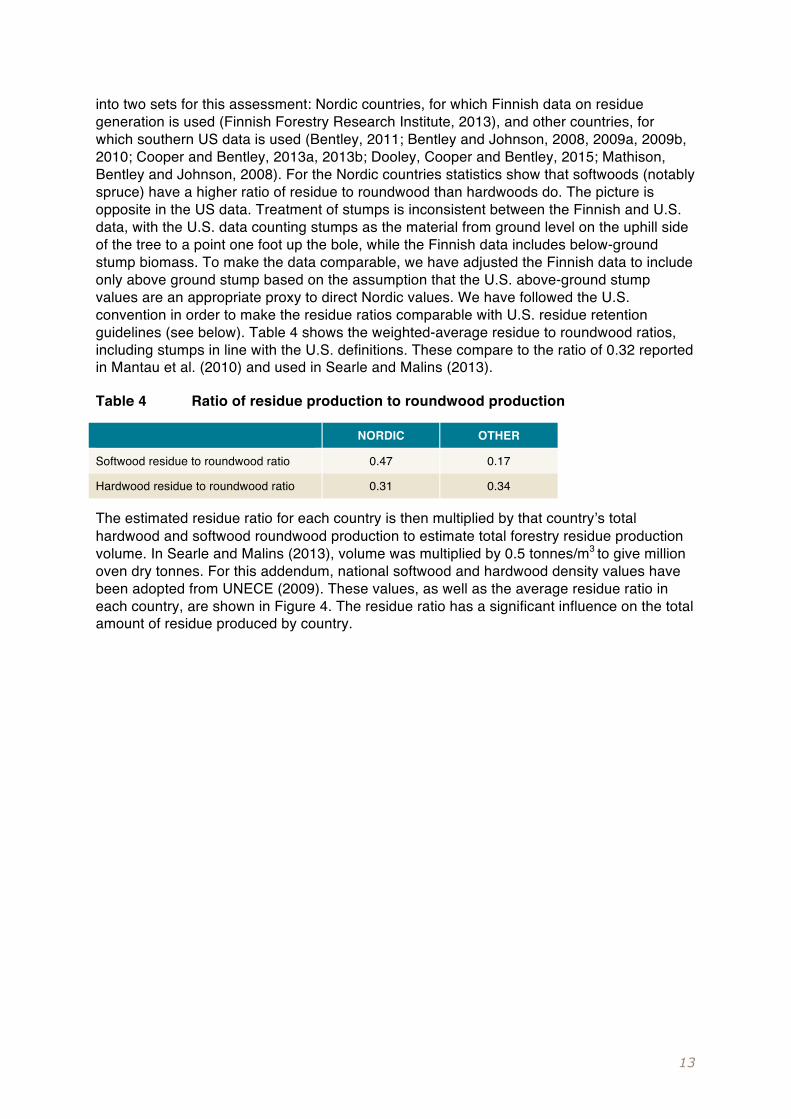
into two sets for this assessment: Nordic countries, for which Finnish data on residue generation is used (Finnish Forestry Research Institute, 2013), and other countries, for which southern US data is used (Bentley, 2011; Bentley and Johnson, 2008, 2009a, 2009b, 2010; Cooper and Bentley, 2013a, 2013b; Dooley, Cooper and Bentley, 2015; Mathison, Bentley and Johnson, 2008). For the Nordic countries statistics show that softwoods (notably spruce) have a higher ratio of residue to roundwood than hardwoods do. The picture is opposite in the US data. Treatment of stumps is inconsistent between the Finnish and U.S. data, with the U.S. data counting stumps as the material from ground level on the uphill side of the tree to a point one foot up the bole, while the Finnish data includes below-ground stump biomass. To make the data comparable, we have adjusted the Finnish data to include only above ground stump based on the assumption that the U.S. above-ground stump values are an appropriate proxy to direct Nordic values. We have followed the U.S. convention in order to make the residue ratios comparable with U.S. residue retention guidelines (see below). Table 4 shows the weighted-average residue to roundwood ratios, including stumps in line with the U.S. definitions. These compare to the ratio of 0.32 reported in Mantau et al. (2010) and used in Searle and Malins (2013).
Table 4 Ratio of residue production to roundwood production
NORDIC OTHER
Softwood residue to roundwood ratio 0.47 0.17
Hardwood residue to roundwood ratio 0.31 0.34
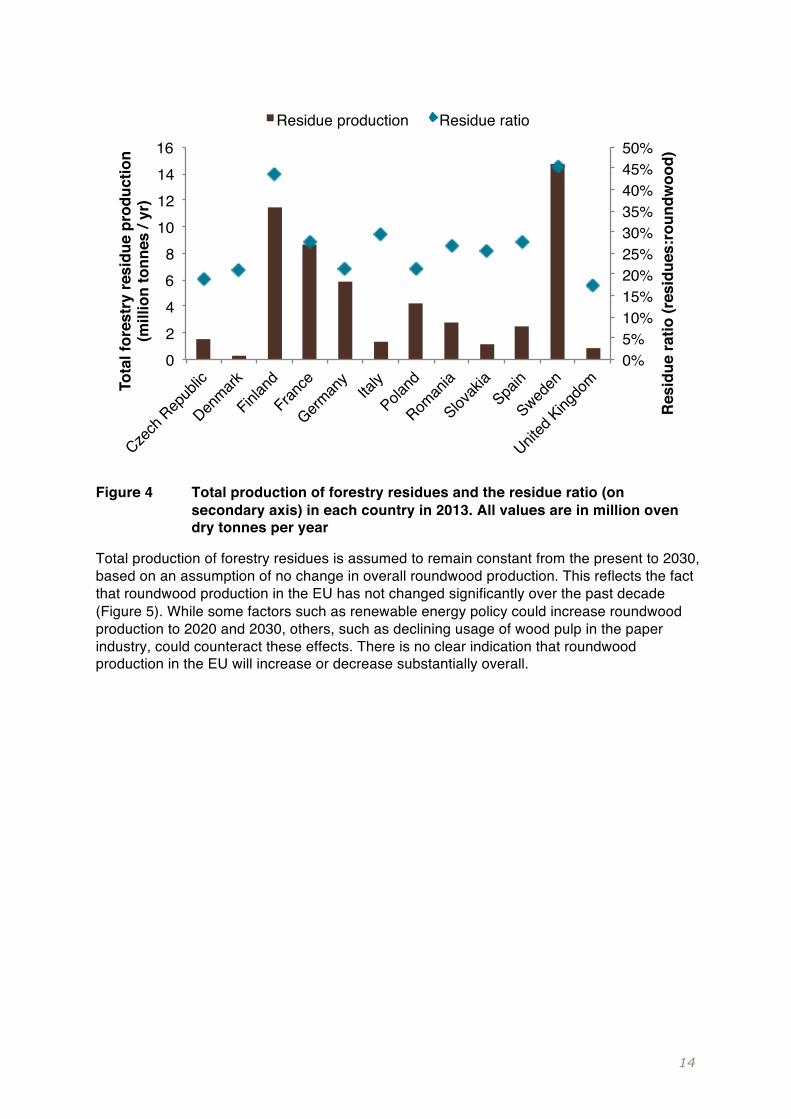
The estimated residue ratio for each country is then multiplied by that country’s total hardwood and softwood roundwood production to estimate total forestry residue production volume. In Searle and Malins (2013), volume was multiplied by 0.5 tonnes/m3 to give million oven dry tonnes. For this addendum, national softwood and hardwood density values have been adopted from UNECE (2009). These values, as well as the average residue ratio in each country, are shown in Figure 4. The residue ratio has a significant influence on the total amount of residue produced by country.
14
Figure 4 Total production of forestry residues and the residue ratio (on secondary axis) in each country in 2013. All values are in million oven dry tonnes per year
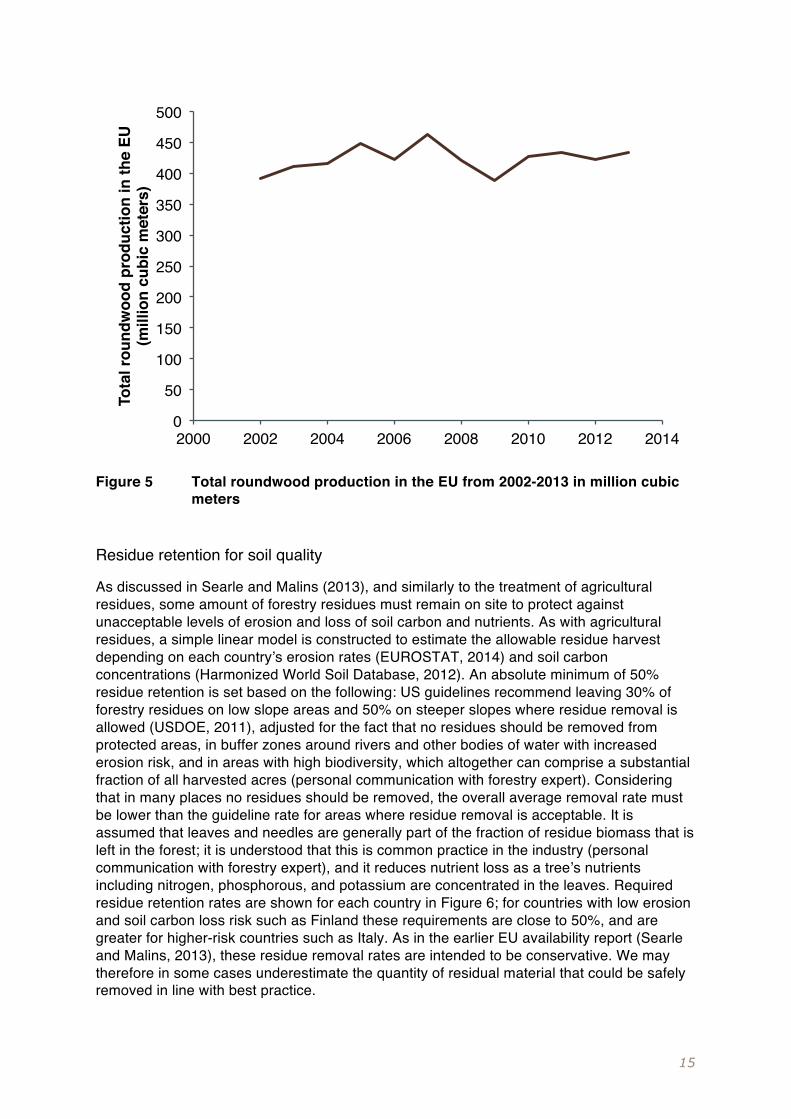
Total production of forestry residues is assumed to remain constant from the present to 2030, based on an assumption of no change in overall roundwood production. This reflects the fact that roundwood production in the EU has not changed significantly over the past decade (Figure 5). While some factors such as renewable energy policy could increase roundwood production to 2020 and 2030, others, such as declining usage of wood pulp in the paper industry, could counteract these effects. There is no clear indication that roundwood production in the EU will increase or decrease substantially overall.
0%5%10%15%20%25%30%35%40%45%50%
02468
10121416
Czech
Repub
lic
Denmark
Finland
France
German
yIta
lyPola
nd
Roman
ia
Slovak
iaSpa
in
Sweden
United
Kingdo
m
Res
idue
ratio
(res
idue
s:ro
undw
ood)
Tota
l for
estr
y re
sidu
e pr
oduc
tion
(mill
ion
tonn
es /
yr)
Residue production Residue ratio
15
Figure 5 Total roundwood production in the EU from 2002-2013 in million cubic meters
Residue retention for soil quality
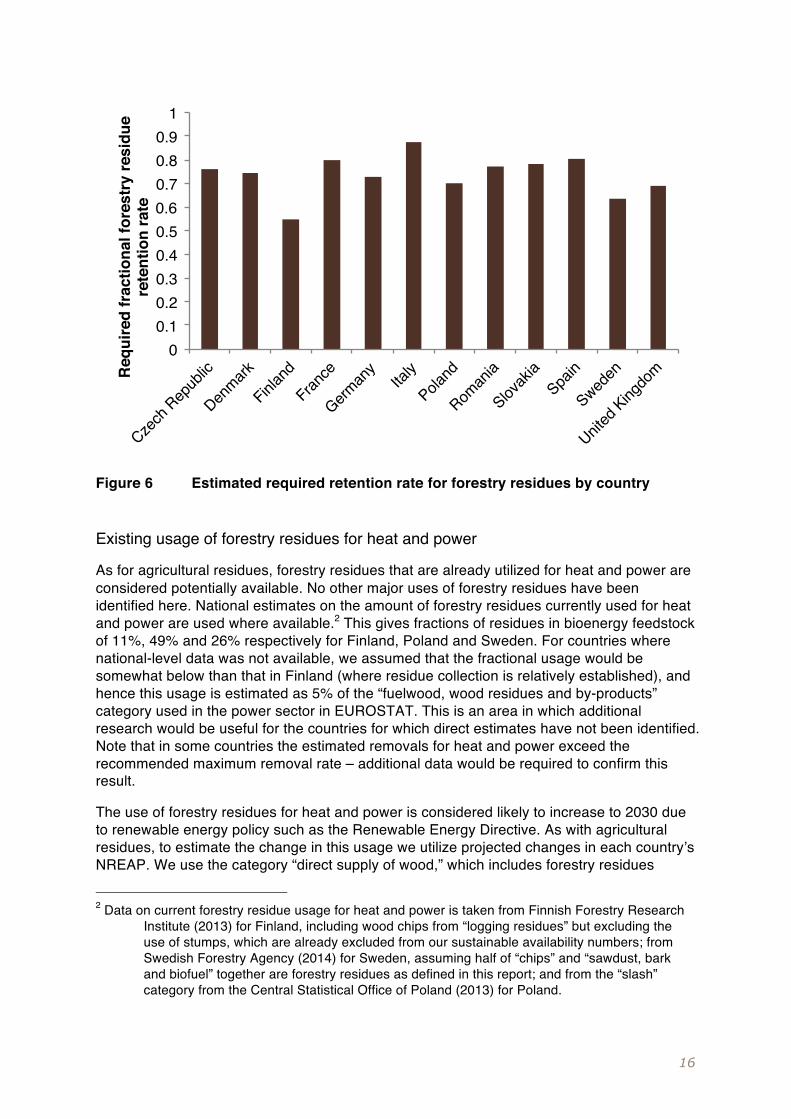
As discussed in Searle and Malins (2013), and similarly to the treatment of agricultural residues, some amount of forestry residues must remain on site to protect against unacceptable levels of erosion and loss of soil carbon and nutrients. As with agricultural residues, a simple linear model is constructed to estimate the allowable residue harvest depending on each country’s erosion rates (EUROSTAT, 2014) and soil carbon concentrations (Harmonized World Soil Database, 2012). An absolute minimum of 50% residue retention is set based on the following: US guidelines recommend leaving 30% of forestry residues on low slope areas and 50% on steeper slopes where residue removal is allowed (USDOE, 2011), adjusted for the fact that no residues should be removed from protected areas, in buffer zones around rivers and other bodies of water with increased erosion risk, and in areas with high biodiversity, which altogether can comprise a substantial fraction of all harvested acres (personal communication with forestry expert). Considering that in many places no residues should be removed, the overall average removal rate must be lower than the guideline rate for areas where residue removal is acceptable. It is assumed that leaves and needles are generally part of the fraction of residue biomass that is left in the forest; it is understood that this is common practice in the industry (personal communication with forestry expert), and it reduces nutrient loss as a tree’s nutrients including nitrogen, phosphorous, and potassium are concentrated in the leaves. Required residue retention rates are shown for each country in Figure 6; for countries with low erosion and soil carbon loss risk such as Finland these requirements are close to 50%, and are greater for higher-risk countries such as Italy. As in the earlier EU availability report (Searle and Malins, 2013), these residue removal rates are intended to be conservative. We may therefore in some cases underestimate the quantity of residual material that could be safely removed in line with best practice.
0
50
100
150
200
250
300
350
400
450
500
2000 2002 2004 2006 2008 2010 2012 2014
Tota
l rou
ndw
ood
prod
uctio
n in
the
EU
(mill
ion
cubi
c m
eter
s)
16
Figure 6 Estimated required retention rate for forestry residues by country
Existing usage of forestry residues for heat and power
As for agricultural residues, forestry residues that are already utilized for heat and power are considered potentially available. No other major uses of forestry residues have been identified here. National estimates on the amount of forestry residues currently used for heat and power are used where available.2 This gives fractions of residues in bioenergy feedstock of 11%, 49% and 26% respectively for Finland, Poland and Sweden. For countries where national-level data was not available, we assumed that the fractional usage would be somewhat below than that in Finland (where residue collection is relatively established), and hence this usage is estimated as 5% of the “fuelwood, wood residues and by-products” category used in the power sector in EUROSTAT. This is an area in which additional research would be useful for the countries for which direct estimates have not been identified. Note that in some countries the estimated removals for heat and power exceed the recommended maximum removal rate – additional data would be required to confirm this result.
The use of forestry residues for heat and power is considered likely to increase to 2030 due to renewable energy policy such as the Renewable Energy Directive. As with agricultural residues, to estimate the change in this usage we utilize projected changes in each country’s NREAP. We use the category “direct supply of wood,” which includes forestry residues
2 Data on current forestry residue usage for heat and power is taken from Finnish Forestry Research
Institute (2013) for Finland, including wood chips from “logging residues” but excluding the use of stumps, which are already excluded from our sustainable availability numbers; from Swedish Forestry Agency (2014) for Sweden, assuming half of “chips” and “sawdust, bark and biofuel” together are forestry residues as defined in this report; and from the “slash” category from the Central Statistical Office of Poland (2013) for Poland.
00.10.20.30.40.50.60.70.80.9
1
Czech
Repub
lic
Denmark
Finland
France
German
yIta
ly
Poland
Roman
ia
Slovak
iaSpa
in
Sweden
United
Kingdo
mReq
uire
d fr
actio
nal f
ores
try
resi
due
rete
ntio
n ra
te
17
produced on-site as well as total roundwood. The relative change in this category to 2020 is used to estimate the rate of change in forestry residue usage from the present to 2020 and 2030 and is applied to the current estimates of existing usage described above.
Availability of forestry residues for biofuel
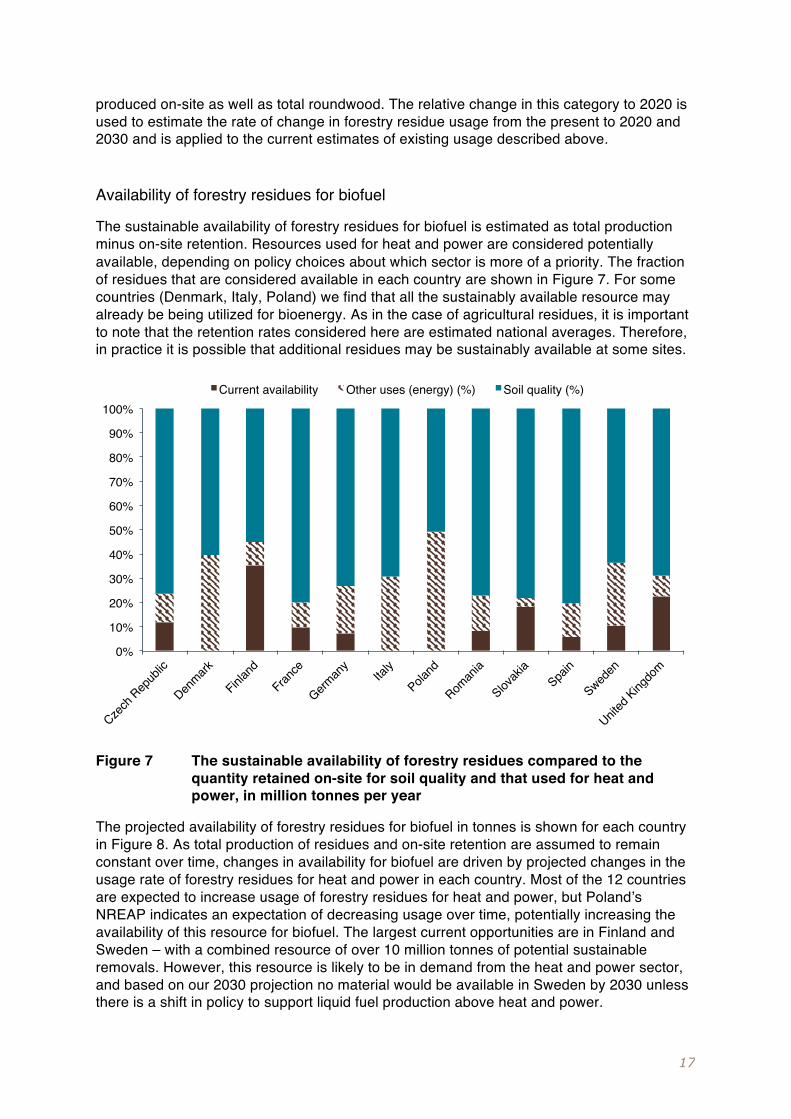
The sustainable availability of forestry residues for biofuel is estimated as total production minus on-site retention. Resources used for heat and power are considered potentially available, depending on policy choices about which sector is more of a priority. The fraction of residues that are considered available in each country are shown in Figure 7. For some countries (Denmark, Italy, Poland) we find that all the sustainably available resource may already be being utilized for bioenergy. As in the case of agricultural residues, it is important to note that the retention rates considered here are estimated national averages. Therefore, in practice it is possible that additional residues may be sustainably available at some sites.
Figure 7 The sustainable availability of forestry residues compared to the quantity retained on-site for soil quality and that used for heat and power, in million tonnes per year
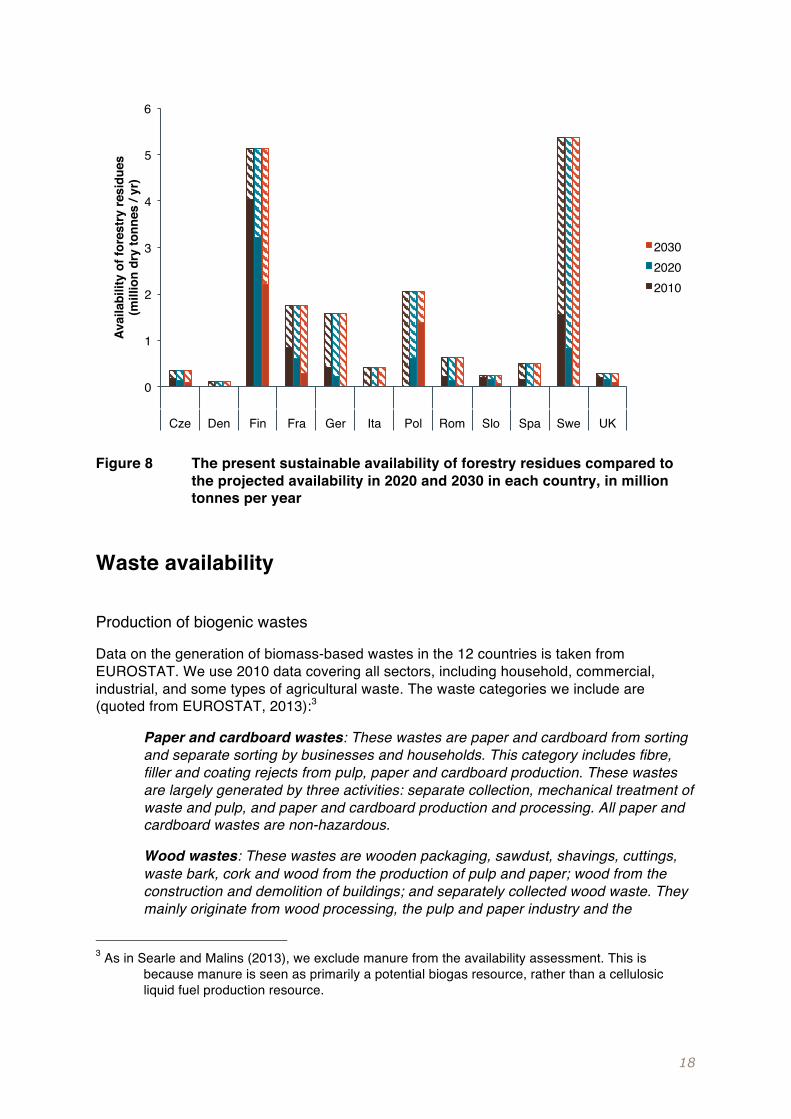
The projected availability of forestry residues for biofuel in tonnes is shown for each country in Figure 8. As total production of residues and on-site retention are assumed to remain constant over time, changes in availability for biofuel are driven by projected changes in the usage rate of forestry residues for heat and power in each country. Most of the 12 countries are expected to increase usage of forestry residues for heat and power, but Poland’s NREAP indicates an expectation of decreasing usage over time, potentially increasing the availability of this resource for biofuel. The largest current opportunities are in Finland and Sweden – with a combined resource of over 10 million tonnes of potential sustainable removals. However, this resource is likely to be in demand from the heat and power sector, and based on our 2030 projection no material would be available in Sweden by 2030 unless there is a shift in policy to support liquid fuel production above heat and power.
0%
10%
20%
30%
40%
50%
60%
70%
80%
90%
100%
Czech
Repub
lic
Denmark
Finland
France
German
yIta
lyPola
nd
Roman
ia
Slovak
iaSpa
in
Sweden
United
Kingdo
m
Current availability Other uses (energy) (%) Soil quality (%)
18
Figure 8 The present sustainable availability of forestry residues compared to the projected availability in 2020 and 2030 in each country, in million tonnes per year
Waste availability
Production of biogenic wastes
Data on the generation of biomass-based wastes in the 12 countries is taken from EUROSTAT. We use 2010 data covering all sectors, including household, commercial, industrial, and some types of agricultural waste. The waste categories we include are (quoted from EUROSTAT, 2013):3
Paper and cardboard wastes: These wastes are paper and cardboard from sorting and separate sorting by businesses and households. This category includes fibre, filler and coating rejects from pulp, paper and cardboard production. These wastes are largely generated by three activities: separate collection, mechanical treatment of waste and pulp, and paper and cardboard production and processing. All paper and cardboard wastes are non-hazardous.
Wood wastes: These wastes are wooden packaging, sawdust, shavings, cuttings, waste bark, cork and wood from the production of pulp and paper; wood from the construction and demolition of buildings; and separately collected wood waste. They mainly originate from wood processing, the pulp and paper industry and the
3 As in Searle and Malins (2013), we exclude manure from the availability assessment. This is
because manure is seen as primarily a potential biogas resource, rather than a cellulosic liquid fuel production resource.
0
1
2
3
4
5
6
Cze Den Fin Fra Ger Ita Pol Rom Slo Spa Swe UK
Avai
labi
lity
of fo
rest
ry re
sidu
es
(mill
ion
dry
tonn
es /
yr)
203020202010
19
demolition of buildings but can occur in all sectors in lower quantities due to wooden packaging. Wood wastes are hazardous when containing hazardous sub- stances like mercury or tar-based wood preservatives.
Animal and mixed food wastes: These wastes are animal and mixed wastes from food preparation and products, including sludges from washing and cleaning; separately collected biodegradable kitchen and canteen waste, and edible oils and fats. They originate from food preparation and production (agriculture and manufacture of food and food products) and from separate collection. Animal and mixed waste of food preparation and products are non-hazardous.
Vegetal wastes: These wastes are vegetal wastes from food preparation and products, including sludges from washing and cleaning, materials unsuitable for consumption and green wastes. They originate from food and beverage production, and from agriculture, horticulture and forestry. Vegetal wastes are non-hazardous.
Household and similar wastes: These wastes are mixed municipal waste, bulky waste, street-cleaning waste like packaging, kitchen waste, and household equipment except separately collected fractions. They originate mainly from households but can also be generated by all sectors in canteens and offices as consumption residues. Household and similar wastes are non-hazardous.
Sorting residues: These wastes are sorting residues from mechanical sorting processes for waste; combustible waste (refuse derived fuel); and non-composted fractions of biodegradable waste. They mainly originate from waste treatment and separate collection. Sorting residues from demolition activities are excluded. They are hazardous when containing heavy metals or organic pollutants.
Common sludges: These are waste water treatment sludges from municipal sewerage water and organic sludges from food preparation and processing. They mainly originate from households and industrial branches with organic waste water (mainly pulp and paper as well as food preparation and processing). They can also occur in waste water treatment plants or in the anaerobic treatment of waste. All common sludges are non-hazardous. Comparability can be problematic between countries using different statistical units as they will not assign the waste to the same economic sector.
These categories include but are broader than biomass-based waste in municipal solid waste (MSW). EUROSTAT classifies agricultural and forestry residues (as defined in this analysis) as “residues” and does not include these materials in the waste data (Eurostat, 2013). Thus these estimates should not overlap with the estimations of agricultural and forestry residues above. This dataset includes animal manure generated in the agricultural industry.
Household waste includes non-biomass materials such as plastics and metals. We use estimates from IPCC (2006) on the percentage of MSW that is from food, paper, cardboard, and wood across Europe and assume the composition of the household waste category is similar; this biomass-based fraction is 63%. We assume that sorting residues are 50% biomass-based, and that 100% of all other categories listed here are biomass-based and could potentially be used for biofuel production.
EUROSTAT reports sludges in dry matter content, and all other categories wet. These weights are corrected to oven dry tonnes using estimates of dry matter content taken from
20
IPCC: paper/cardboard (90%), food waste (40%), wood waste (85%), and garden or park waste (40%).
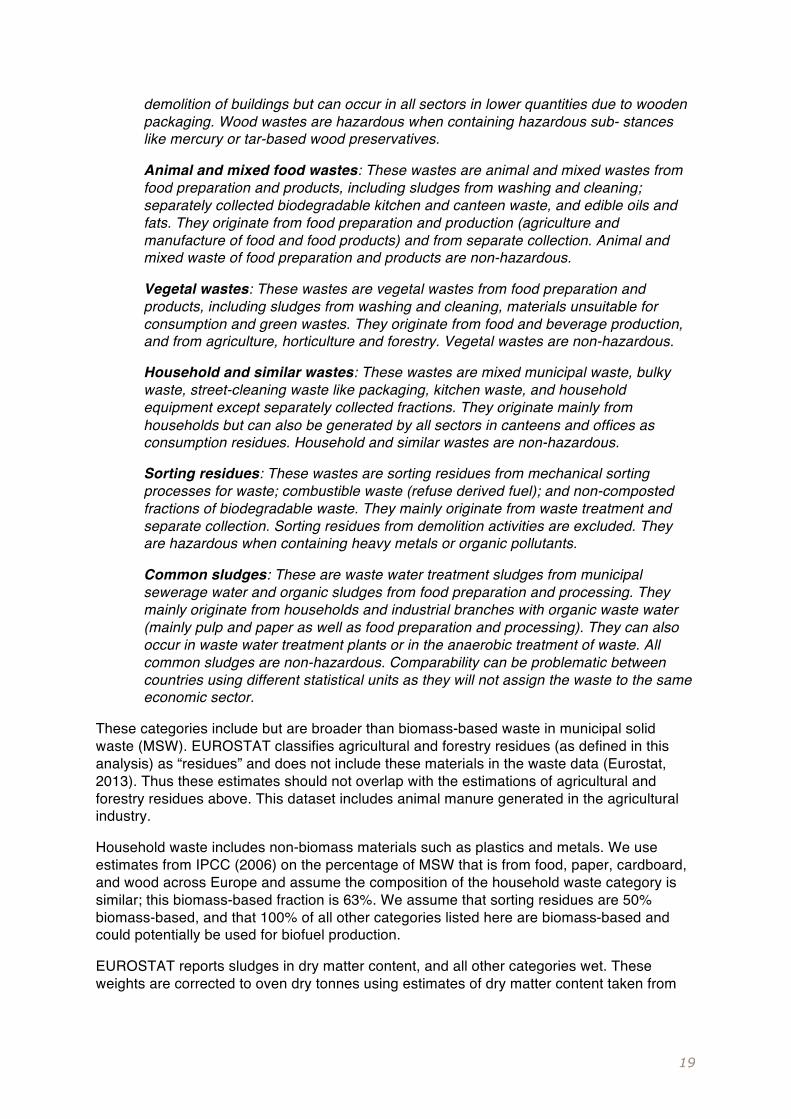
Estimated generation of biomass-based waste by category and by country is shown in Figure 9.
Figure 9 Generation of biogenic waste by category and country in 2010. Values in million dry tonnes per year.
Recycling and other uses of waste
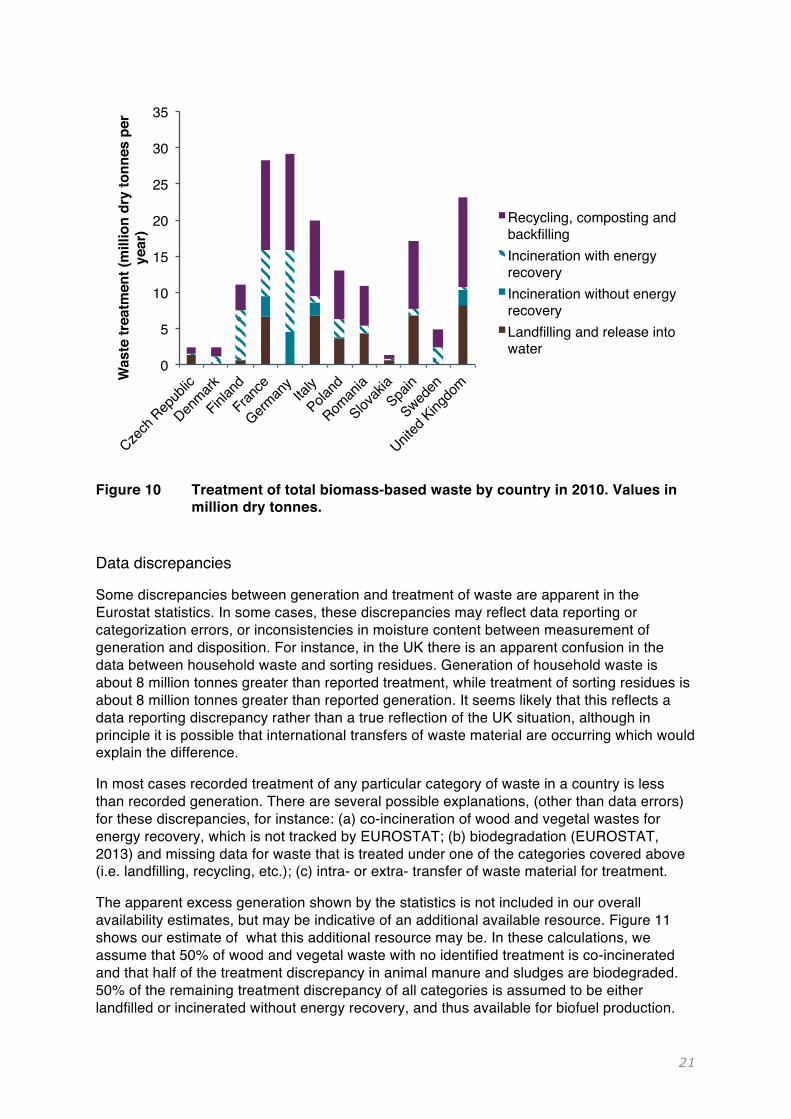
Eurostat not only provides data on waste generation but also on waste disposition, including landfill, incineration with and without energy recovery and other forms of recovery (including recycling). Waste that is recovered for any useful purpose except energy recovery is not counted as sustainably available in this analysis. This includes waste material used for recycling, composting, or backfilling (i.e. using waste as a material in landscaping or engineering). Waste that is disposed of in landfills, released into water bodies, or incinerated without energy recovery is considered available for biofuel production. Waste that is incinerated with energy recovery may potentially be considered sustainably available if use in biofuel for transport is prioritized over other energy uses. The disposition of the total biomass-based waste resource by treatment category in each country is shown in Figure 10.
0
5
10
15
20
25
30
35
40
Czech
Repub
lic
Denmark
Finland
France
German
yIta
lyPola
nd
Roman
ia
Slovak
iaSpa
in
Sweden
United
Kingdo
mBio
geni
c w
aste
gen
erat
ion
(mill
ion
dry
tonn
es)
Common sludgesSorting residuesHousehold and similar wastesVegetal wastesAnimal and mixed food wasteWood wastesPaper and cardboard wastes
21
Figure 10 Treatment of total biomass-based waste by country in 2010. Values in million dry tonnes.
Data discrepancies
Some discrepancies between generation and treatment of waste are apparent in the Eurostat statistics. In some cases, these discrepancies may reflect data reporting or categorization errors, or inconsistencies in moisture content between measurement of generation and disposition. For instance, in the UK there is an apparent confusion in the data between household waste and sorting residues. Generation of household waste is about 8 million tonnes greater than reported treatment, while treatment of sorting residues is about 8 million tonnes greater than reported generation. It seems likely that this reflects a data reporting discrepancy rather than a true reflection of the UK situation, although in principle it is possible that international transfers of waste material are occurring which would explain the difference.
In most cases recorded treatment of any particular category of waste in a country is less than recorded generation. There are several possible explanations, (other than data errors) for these discrepancies, for instance: (a) co-incineration of wood and vegetal wastes for energy recovery, which is not tracked by EUROSTAT; (b) biodegradation (EUROSTAT, 2013) and missing data for waste that is treated under one of the categories covered above (i.e. landfilling, recycling, etc.); (c) intra- or extra- transfer of waste material for treatment.
The apparent excess generation shown by the statistics is not included in our overall availability estimates, but may be indicative of an additional available resource. Figure 11 shows our estimate of what this additional resource may be. In these calculations, we assume that 50% of wood and vegetal waste with no identified treatment is co-incinerated and that half of the treatment discrepancy in animal manure and sludges are biodegraded. 50% of the remaining treatment discrepancy of all categories is assumed to be either landfilled or incinerated without energy recovery, and thus available for biofuel production.
0
5
10
15
20
25
30
35
Czech
Repub
lic
Denmark
Finland
France
German
yIta
lyPola
nd
Roman
ia
Slovak
iaSpa
in
Sweden
United
Kingdo
mWas
te tr
eatm
ent (
mill
ion
dry
tonn
es p
er
year
)
Recycling, composting and backfillingIncineration with energy recoveryIncineration without energy recoveryLandfilling and release into water
22
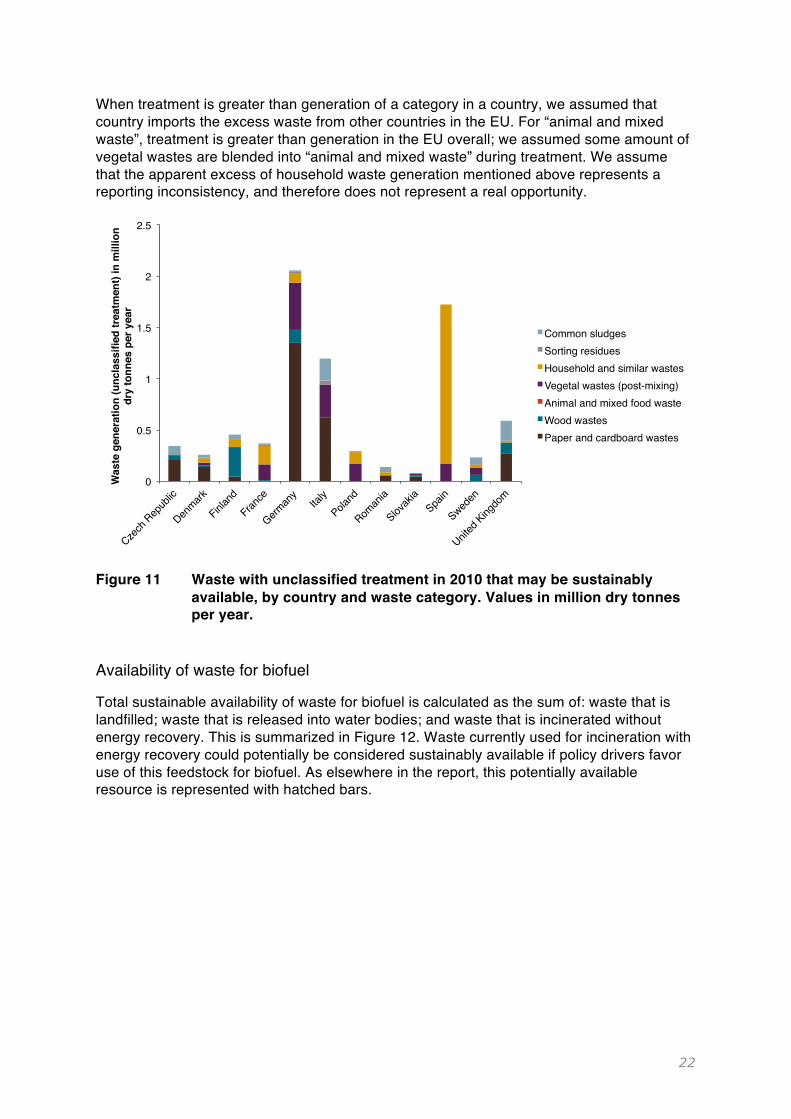
When treatment is greater than generation of a category in a country, we assumed that country imports the excess waste from other countries in the EU. For “animal and mixed waste”, treatment is greater than generation in the EU overall; we assumed some amount of vegetal wastes are blended into “animal and mixed waste” during treatment. We assume that the apparent excess of household waste generation mentioned above represents a reporting inconsistency, and therefore does not represent a real opportunity.
Figure 11 Waste with unclassified treatment in 2010 that may be sustainably available, by country and waste category. Values in million dry tonnes per year.
Availability of waste for biofuel
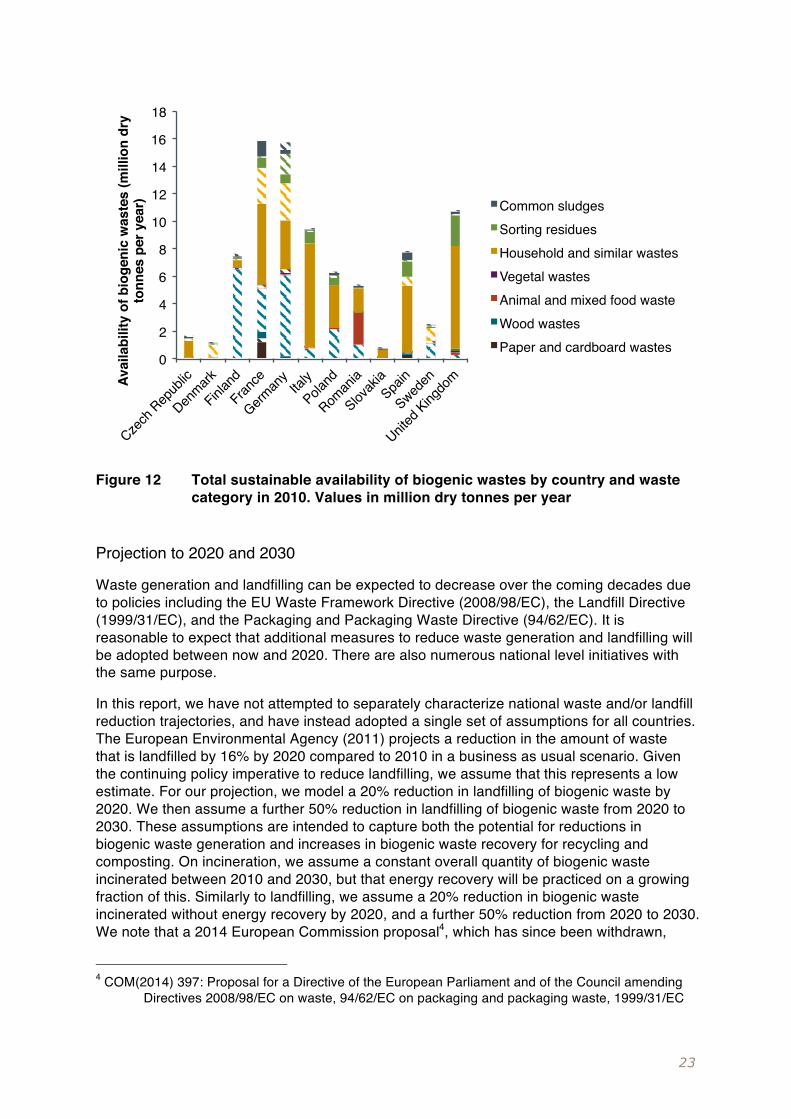
Total sustainable availability of waste for biofuel is calculated as the sum of: waste that is landfilled; waste that is released into water bodies; and waste that is incinerated without energy recovery. This is summarized in Figure 12. Waste currently used for incineration with energy recovery could potentially be considered sustainably available if policy drivers favor use of this feedstock for biofuel. As elsewhere in the report, this potentially available resource is represented with hatched bars.
0
0.5
1
1.5
2
2.5
Czech
Repub
lic
Denmark
Finland
France
German
yIta
lyPola
nd
Roman
ia
Slovak
iaSpa
in
Sweden
United
Kingdo
m
Was
te g
ener
atio
n (u
ncla
ssifi
ed tr
eatm
ent)
in m
illio
n dr
y to
nnes
per
yea
r
Common sludgesSorting residuesHousehold and similar wastesVegetal wastes (post-mixing)Animal and mixed food wasteWood wastesPaper and cardboard wastes
23
Figure 12 Total sustainable availability of biogenic wastes by country and waste category in 2010. Values in million dry tonnes per year
Projection to 2020 and 2030
Waste generation and landfilling can be expected to decrease over the coming decades due to policies including the EU Waste Framework Directive (2008/98/EC), the Landfill Directive (1999/31/EC), and the Packaging and Packaging Waste Directive (94/62/EC). It is reasonable to expect that additional measures to reduce waste generation and landfilling will be adopted between now and 2020. There are also numerous national level initiatives with the same purpose.
In this report, we have not attempted to separately characterize national waste and/or landfill reduction trajectories, and have instead adopted a single set of assumptions for all countries. The European Environmental Agency (2011) projects a reduction in the amount of waste that is landfilled by 16% by 2020 compared to 2010 in a business as usual scenario. Given the continuing policy imperative to reduce landfilling, we assume that this represents a low estimate. For our projection, we model a 20% reduction in landfilling of biogenic waste by 2020. We then assume a further 50% reduction in landfilling of biogenic waste from 2020 to 2030. These assumptions are intended to capture both the potential for reductions in biogenic waste generation and increases in biogenic waste recovery for recycling and composting. On incineration, we assume a constant overall quantity of biogenic waste incinerated between 2010 and 2030, but that energy recovery will be practiced on a growing fraction of this. Similarly to landfilling, we assume a 20% reduction in biogenic waste incinerated without energy recovery by 2020, and a further 50% reduction from 2020 to 2030. We note that a 2014 European Commission proposal4, which has since been withdrawn,
4 COM(2014) 397: Proposal for a Directive of the European Parliament and of the Council amending
Directives 2008/98/EC on waste, 94/62/EC on packaging and packaging waste, 1999/31/EC
0
2
4
6
8
10
12
14
16
18
Czech
Repub
lic
Denmark
Finland
France
German
yIta
lyPola
nd
Roman
ia
Slovak
iaSpa
in
Sweden
United
Kingdo
mAvai
labi
lity
of b
ioge
nic
was
tes
(mill
ion
dry
tonn
es p
er y
ear) Common sludges
Sorting residuesHousehold and similar wastesVegetal wastesAnimal and mixed food wasteWood wastesPaper and cardboard wastes
24
would have set European targets to eliminate landfilling of biodegradable waste by 2025. Even if targets of this sort were adopted in future, it would not necessarily mean that the opportunity for liquid biofuels from waste would be eliminated. Indeed, elimination of landfilling of biodegradable waste could well be predicated on a substantial increase in energy recovery, including energy recovery through conversion to liquid fuels.
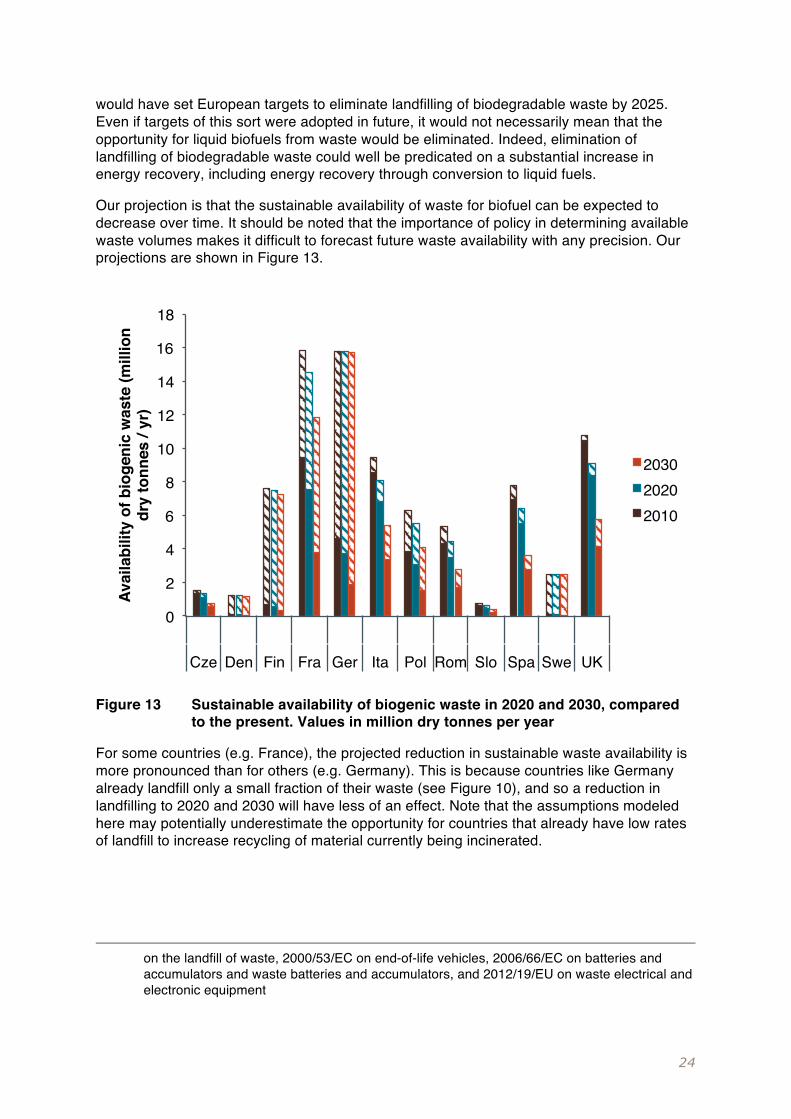
Our projection is that the sustainable availability of waste for biofuel can be expected to decrease over time. It should be noted that the importance of policy in determining available waste volumes makes it difficult to forecast future waste availability with any precision. Our projections are shown in Figure 13.
Figure 13 Sustainable availability of biogenic waste in 2020 and 2030, compared to the present. Values in million dry tonnes per year
For some countries (e.g. France), the projected reduction in sustainable waste availability is more pronounced than for others (e.g. Germany). This is because countries like Germany already landfill only a small fraction of their waste (see Figure 10), and so a reduction in landfilling to 2020 and 2030 will have less of an effect. Note that the assumptions modeled here may potentially underestimate the opportunity for countries that already have low rates of landfill to increase recycling of material currently being incinerated.
on the landfill of waste, 2000/53/EC on end-of-life vehicles, 2006/66/EC on batteries and accumulators and waste batteries and accumulators, and 2012/19/EU on waste electrical and electronic equipment
0
2
4
6
8
10
12
14
16
18
Cze Den Fin Fra Ger Ita Pol Rom Slo Spa Swe UK
Avai
labi
lity
of b
ioge
nic
was
te (m
illio
n dr
y to
nnes
/ yr
)
203020202010
25
Uncertainty in the estimation of waste availability
There are several sources of uncertainty in the above waste availability values. Firstly, there may be limitations to the Eurostat data. As noted above, some of the discrepancies between waste generation and treatment data could be indicative of data errors or inconsistent categorizations, rather than representing real quantities of material. We are aware that in some cases the data available from Eurostat contradicts other studies – for instance, ADEME (2014) report only 0.4 million tonnes of waste being incinerated without energy recovery in France in 2011, and state that, “The last fifteen years have seen improving standards for waste incineration plants with reductions in harmful emissions and the near disappearance of incineration without energy recovery [of household waste].” This contrasts with around 5 million tonnes of incineration without energy recovery of household waste reported by Eurostat for both 2010 and 2012, and used as the basis for the waste availability assessment here. Additional uncertainty is introduced in the estimation of the biogenic fraction of waste using IPCC default values. Forecasting future waste treatment is also difficult, with much greater uncertainty than future production of agricultural or forestry residues. Future availability will be dependent on policy development and progress in reducing waste generation and improving recycling rates. It will also depend heavily on political choices to prioritize between composting, anaerobic digestion, incineration with energy recovery and liquid biofuel production as recovery strategies for biogenic waste. Aggressive waste reduction policies could dramatically alter the opportunity for liquid biofuel production from waste in future years. The values in this report therefore can best be treated as indicative of the size of opportunity in each country, rather than as precise point estimates. Additional research using national-level data sources to complement Eurostat data would be valuable in confirming or revising the values presented herein.
26
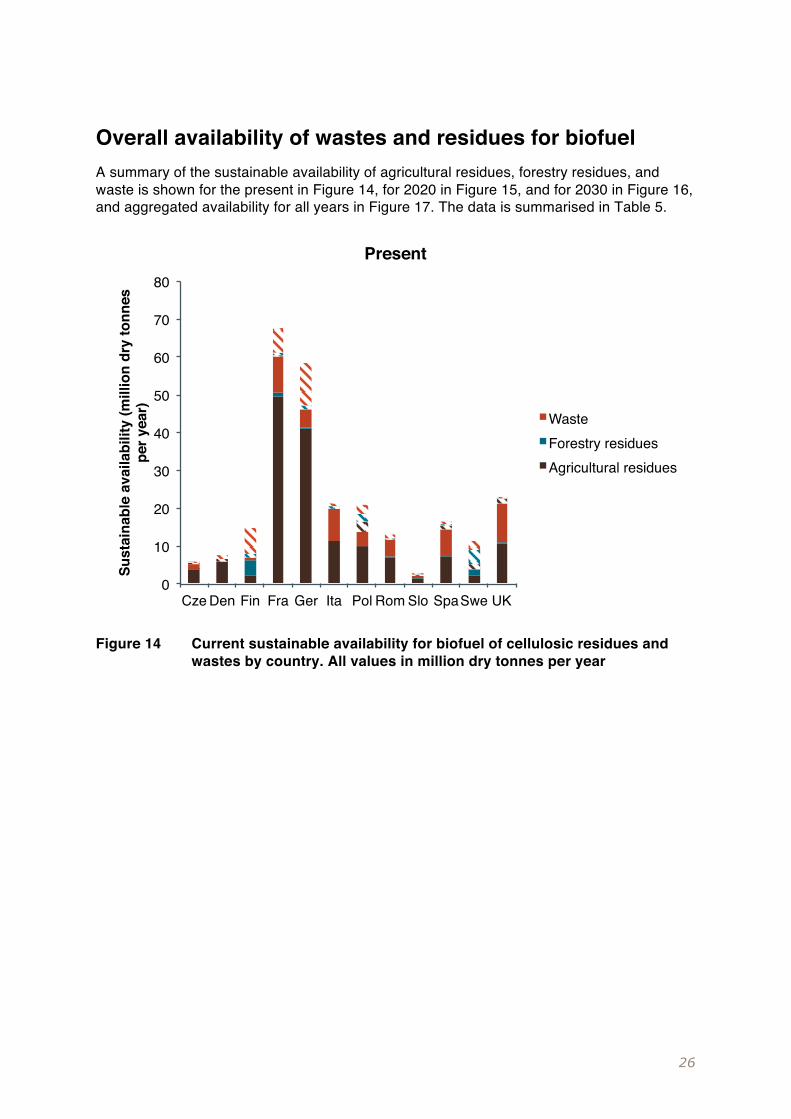
Overall availability of wastes and residues for biofuel A summary of the sustainable availability of agricultural residues, forestry residues, and waste is shown for the present in Figure 14, for 2020 in Figure 15, and for 2030 in Figure 16, and aggregated availability for all years in Figure 17. The data is summarised in Table 5.
Figure 14 Current sustainable availability for biofuel of cellulosic residues and wastes by country. All values in million dry tonnes per year
0
10
20
30
40
50
60
70
80
Cze Den Fin Fra Ger Ita Pol Rom Slo SpaSwe UK
Sust
aina
ble
avai
labi
lity
(mill
ion
dry
tonn
es
per y
ear)
Present
WasteForestry residuesAgricultural residues
27
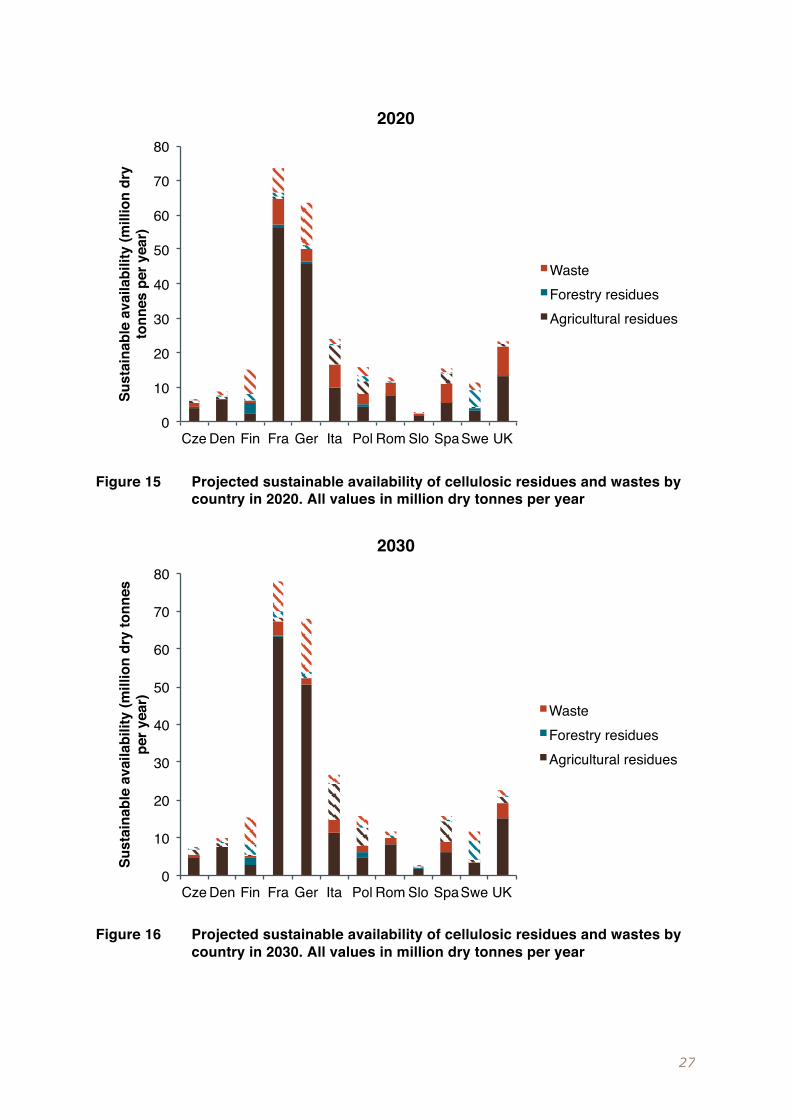
Figure 15 Projected sustainable availability of cellulosic residues and wastes by country in 2020. All values in million dry tonnes per year
Figure 16 Projected sustainable availability of cellulosic residues and wastes by country in 2030. All values in million dry tonnes per year
0
10
20
30
40
50
60
70
80
Cze Den Fin Fra Ger Ita Pol Rom Slo Spa Swe UK
Sust
aina
ble
avai
labi
lity
(mill
ion
dry
tonn
es p
er y
ear)
2020
WasteForestry residuesAgricultural residues
0
10
20
30
40
50
60
70
80
Cze Den Fin Fra Ger Ita Pol Rom Slo SpaSwe UK
Sust
aina
ble
avai
labi
lity
(mill
ion
dry
tonn
es
per y
ear)
2030
WasteForestry residuesAgricultural residues
28
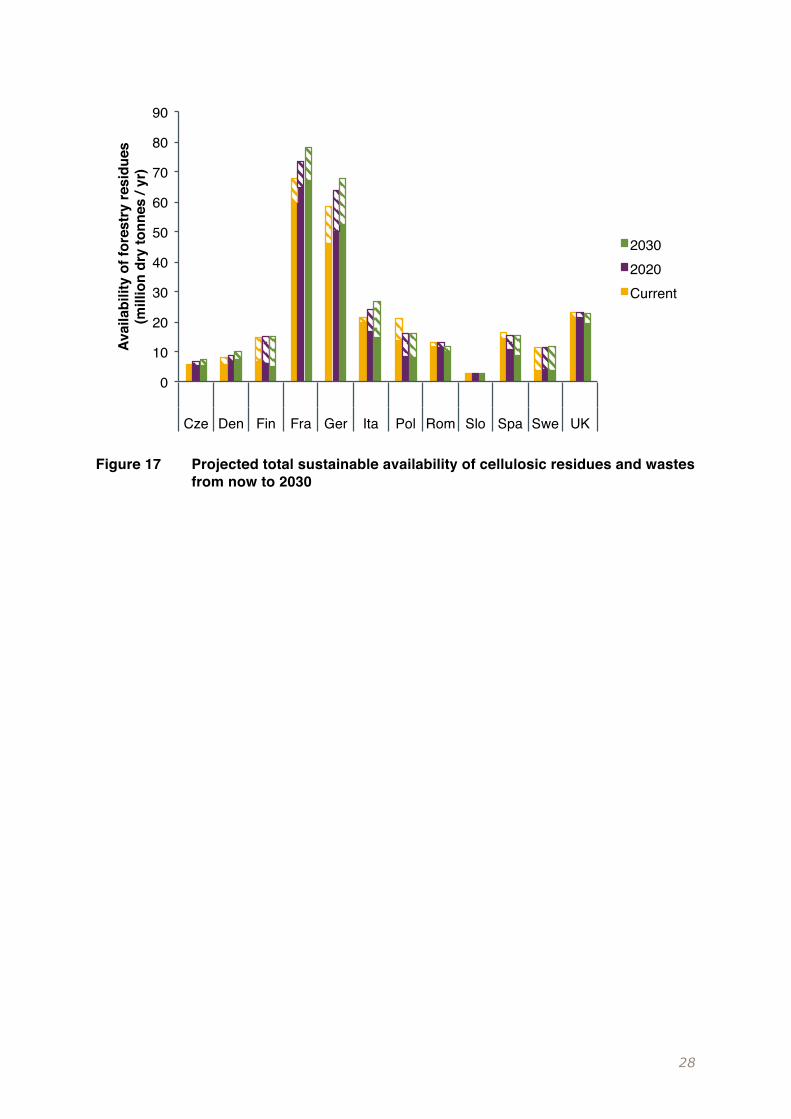
Figure 17 Projected total sustainable availability of cellulosic residues and wastes from now to 2030
0
10
20
30
40
50
60
70
80
90
Cze Den Fin Fra Ger Ita Pol Rom Slo Spa Swe UK
Avai
labi
lity
of fo
rest
ry re
sidu
es
(mill
ion
dry
tonn
es /
yr)
20302020Current
29
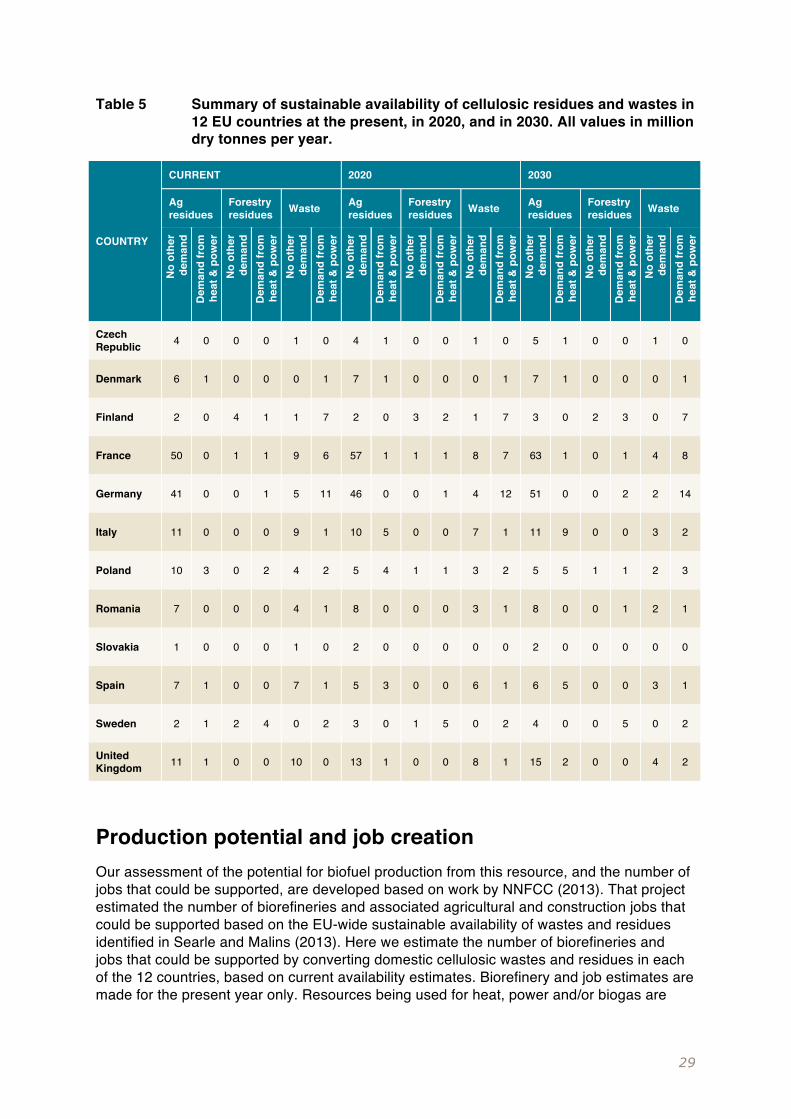
Table 5 Summary of sustainable availability of cellulosic residues and wastes in 12 EU countries at the present, in 2020, and in 2030. All values in million dry tonnes per year.
COUNTRY
CURRENT 2020 2030
Ag residues
Forestry residues Waste Ag
residues Forestry residues Waste Ag
residues Forestry residues Waste
No
othe
r de
man
d D
eman
d fr
om
heat
& p
ower
N
o ot
her
dem
and
Dem
and
from
he
at &
pow
er
No
othe
r de
man
d D
eman
d fr
om
heat
& p
ower
N
o ot
her
dem
and
Dem
and
from
he
at &
pow
er
No
othe
r de
man
d D
eman
d fr
om
heat
& p
ower
N
o ot
her
dem
and
Dem
and
from
he
at &
pow
er
No
othe
r de
man
d D
eman
d fr
om
heat
& p
ower
N
o ot
her
dem
and
Dem
and
from
he
at &
pow
er
No
othe
r de
man
d D
eman
d fr
om
heat
& p
ower
Czech Republic 4 0 0 0 1 0 4 1 0 0 1 0 5 1 0 0 1 0
Denmark 6 1 0 0 0 1 7 1 0 0 0 1 7 1 0 0 0 1
Finland 2 0 4 1 1 7 2 0 3 2 1 7 3 0 2 3 0 7
France 50 0 1 1 9 6 57 1 1 1 8 7 63 1 0 1 4 8
Germany 41 0 0 1 5 11 46 0 0 1 4 12 51 0 0 2 2 14
Italy 11 0 0 0 9 1 10 5 0 0 7 1 11 9 0 0 3 2
Poland 10 3 0 2 4 2 5 4 1 1 3 2 5 5 1 1 2 3
Romania 7 0 0 0 4 1 8 0 0 0 3 1 8 0 0 1 2 1
Slovakia 1 0 0 0 1 0 2 0 0 0 0 0 2 0 0 0 0 0
Spain 7 1 0 0 7 1 5 3 0 0 6 1 6 5 0 0 3 1
Sweden 2 1 2 4 0 2 3 0 1 5 0 2 4 0 0 5 0 2
United Kingdom 11 1 0 0 10 0 13 1 0 0 8 1 15 2 0 0 4 2
Production potential and job creation Our assessment of the potential for biofuel production from this resource, and the number of jobs that could be supported, are developed based on work by NNFCC (2013). That project estimated the number of biorefineries and associated agricultural and construction jobs that could be supported based on the EU-wide sustainable availability of wastes and residues identified in Searle and Malins (2013). Here we estimate the number of biorefineries and jobs that could be supported by converting domestic cellulosic wastes and residues in each of the 12 countries, based on current availability estimates. Biorefinery and job estimates are made for the present year only. Resources being used for heat, power and/or biogas are
30
treated as unavailable for the purpose of these calculations – if these resources were in future made available for liquid fuels, the potential could be greater.
Number of biofuel facilities
We assume that agricultural and forestry residues are used in either biochemical ethanol or thermochemical drop in (Fischer-Tropsch or fast pyrolysis) production facilities, and that waste material would be used in the production of thermochemical drop-in fuel. Several modifications have been made to the input assumptions in NNFCC’s 2013 analysis. First, assume biofuel plant sizes half those considered in the NNFCC report (75,000 tonnes biofuel production for biochemical ethanol and 150,000 tonnes for thermochemical drop-in fuel). This is based on typical sizes of cellulosic biofuel facilities currently existing or under construction in the U.S. (Solecki et al., 2013), and the size of the first commercial facilities built in Europe. Smaller facilities may not offer the same economies of scale, but they have advantages in terms of greater flexibility in handling feedstock supply, and lower start up costs. We have assumed that each of these half-size facilities would support 60% of the permanent and temporary jobs identified by NNFCC.
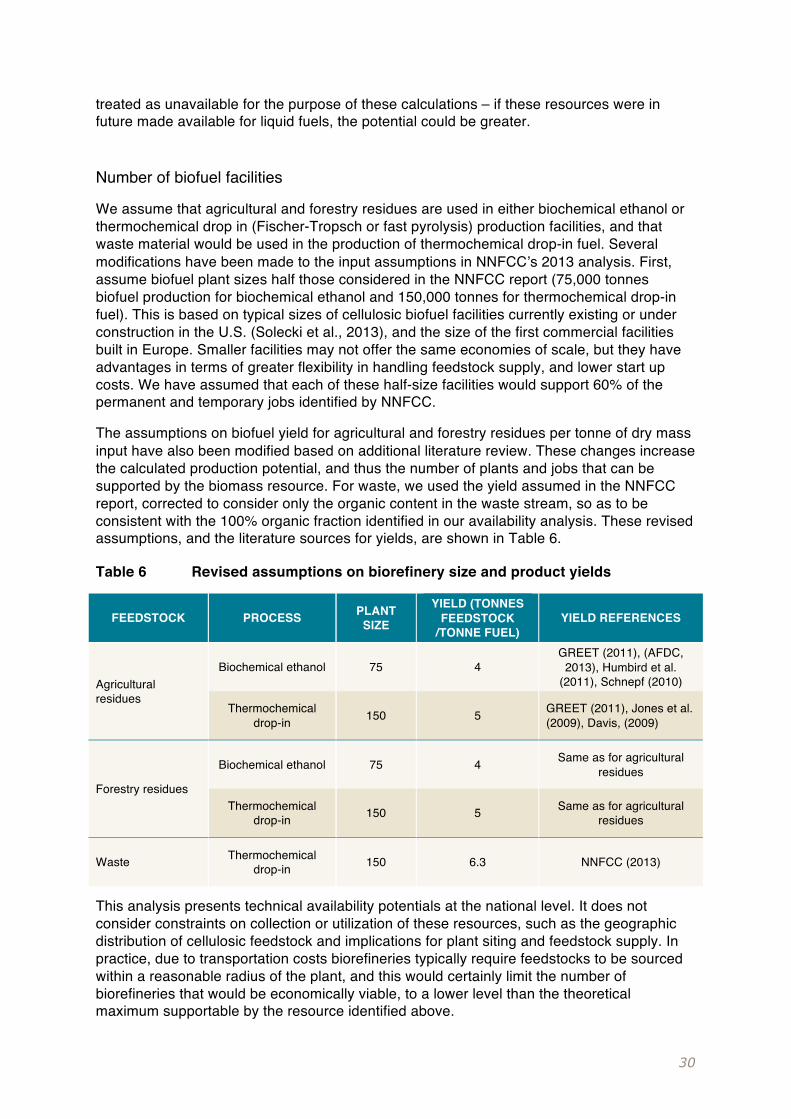
The assumptions on biofuel yield for agricultural and forestry residues per tonne of dry mass input have also been modified based on additional literature review. These changes increase the calculated production potential, and thus the number of plants and jobs that can be supported by the biomass resource. For waste, we used the yield assumed in the NNFCC report, corrected to consider only the organic content in the waste stream, so as to be consistent with the 100% organic fraction identified in our availability analysis. These revised assumptions, and the literature sources for yields, are shown in Table 6.
Table 6 Revised assumptions on biorefinery size and product yields
FEEDSTOCK PROCESS PLANT SIZE
YIELD (TONNES FEEDSTOCK
/TONNE FUEL) YIELD REFERENCES
Agricultural residues
Biochemical ethanol 75 4 GREET (2011), (AFDC,
2013), Humbird et al. (2011), Schnepf (2010)
Thermochemical drop-in 150 5 GREET (2011), Jones et al.
(2009), Davis, (2009)
Forestry residues
Biochemical ethanol 75 4 Same as for agricultural residues
Thermochemical drop-in 150 5 Same as for agricultural
residues
Waste Thermochemical drop-in 150 6.3 NNFCC (2013)
This analysis presents technical availability potentials at the national level. It does not consider constraints on collection or utilization of these resources, such as the geographic distribution of cellulosic feedstock and implications for plant siting and feedstock supply. In practice, due to transportation costs biorefineries typically require feedstocks to be sourced within a reasonable radius of the plant, and this would certainly limit the number of biorefineries that would be economically viable, to a lower level than the theoretical maximum supportable by the resource identified above.
31
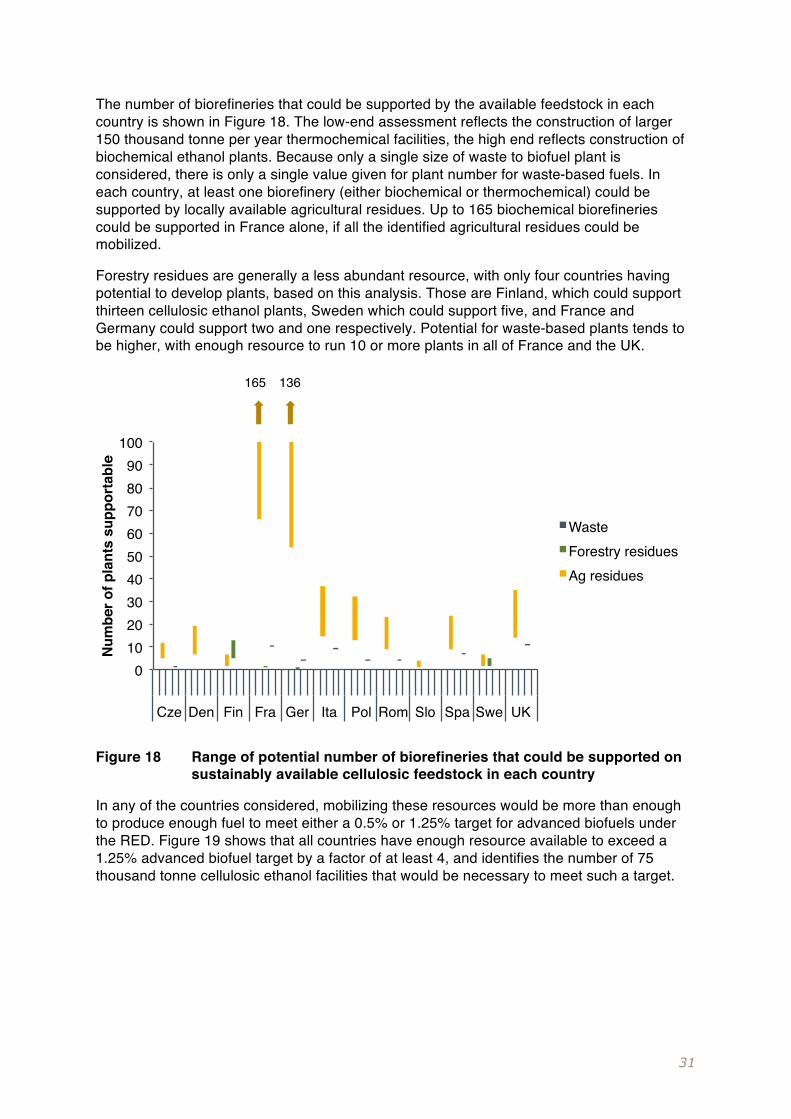
The number of biorefineries that could be supported by the available feedstock in each country is shown in Figure 18. The low-end assessment reflects the construction of larger 150 thousand tonne per year thermochemical facilities, the high end reflects construction of biochemical ethanol plants. Because only a single size of waste to biofuel plant is considered, there is only a single value given for plant number for waste-based fuels. In each country, at least one biorefinery (either biochemical or thermochemical) could be supported by locally available agricultural residues. Up to 165 biochemical biorefineries could be supported in France alone, if all the identified agricultural residues could be mobilized.
Forestry residues are generally a less abundant resource, with only four countries having potential to develop plants, based on this analysis. Those are Finland, which could support thirteen cellulosic ethanol plants, Sweden which could support five, and France and Germany could support two and one respectively. Potential for waste-based plants tends to be higher, with enough resource to run 10 or more plants in all of France and the UK.
Figure 18 Range of potential number of biorefineries that could be supported on sustainably available cellulosic feedstock in each country
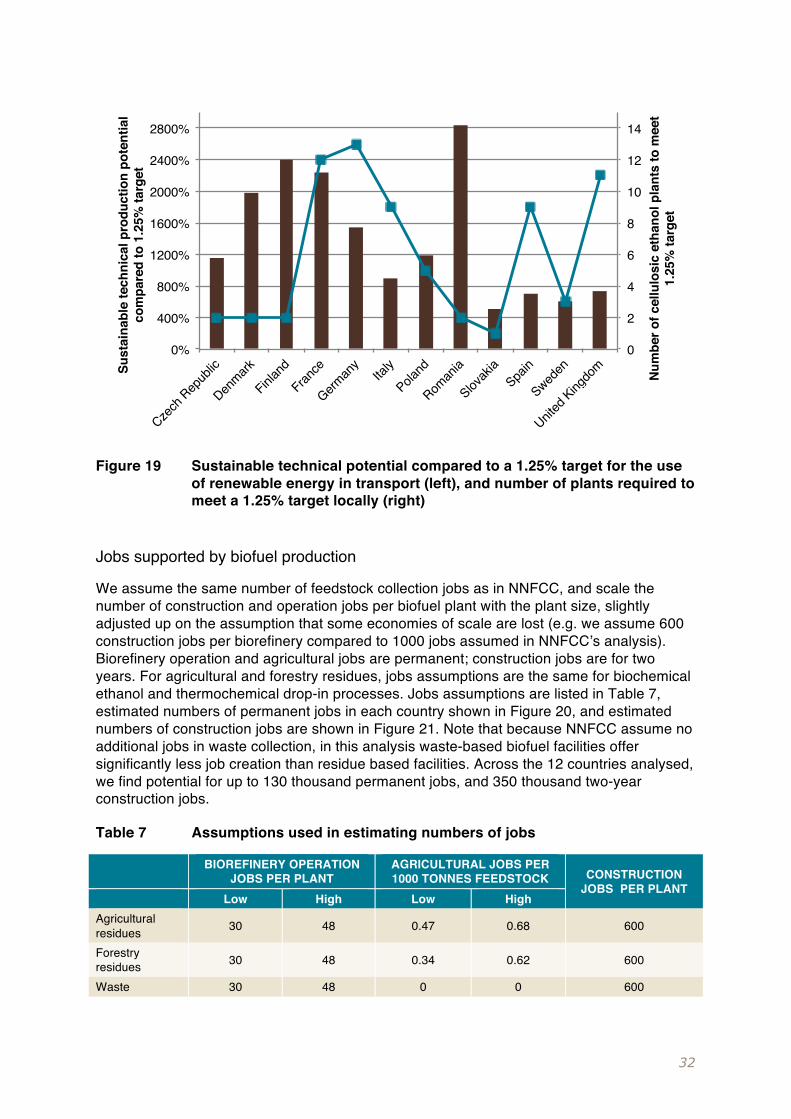
In any of the countries considered, mobilizing these resources would be more than enough to produce enough fuel to meet either a 0.5% or 1.25% target for advanced biofuels under the RED. Figure 19 shows that all countries have enough resource available to exceed a 1.25% advanced biofuel target by a factor of at least 4, and identifies the number of 75 thousand tonne cellulosic ethanol facilities that would be necessary to meet such a target.
0102030405060708090
100
Cze Den Fin Fra Ger Ita Pol Rom Slo Spa Swe UK
Num
ber o
f pla
nts
supp
orta
ble
WasteForestry residuesAg residues
165 136
32
Figure 19 Sustainable technical potential compared to a 1.25% target for the use of renewable energy in transport (left), and number of plants required to meet a 1.25% target locally (right)
Jobs supported by biofuel production
We assume the same number of feedstock collection jobs as in NNFCC, and scale the number of construction and operation jobs per biofuel plant with the plant size, slightly adjusted up on the assumption that some economies of scale are lost (e.g. we assume 600 construction jobs per biorefinery compared to 1000 jobs assumed in NNFCC’s analysis). Biorefinery operation and agricultural jobs are permanent; construction jobs are for two years. For agricultural and forestry residues, jobs assumptions are the same for biochemical ethanol and thermochemical drop-in processes. Jobs assumptions are listed in Table 7, estimated numbers of permanent jobs in each country shown in Figure 20, and estimated numbers of construction jobs are shown in Figure 21. Note that because NNFCC assume no additional jobs in waste collection, in this analysis waste-based biofuel facilities offer significantly less job creation than residue based facilities. Across the 12 countries analysed, we find potential for up to 130 thousand permanent jobs, and 350 thousand two-year construction jobs.
Table 7 Assumptions used in estimating numbers of jobs
BIOREFINERY OPERATION JOBS PER PLANT
AGRICULTURAL JOBS PER 1000 TONNES FEEDSTOCK CONSTRUCTION
JOBS PER PLANT Low High Low High Agricultural residues 30 48 0.47 0.68 600
Forestry residues 30 48 0.34 0.62 600
Waste 30 48 0 0 600
0
2
4
6
8
10
12
14
0%
400%
800%
1200%
1600%
2000%
2400%
2800%
Czech
Repub
lic
Denmark
Finland
France
German
yIta
ly
Poland
Roman
ia
Slovak
iaSpa
in
Sweden
United
Kingdo
m Num
ber o
f cel
lulo
sic
etha
nol p
lant
s to
mee
t 1.
25%
targ
et
Sust
aina
ble
tech
nica
l pro
duct
ion
pote
ntia
l co
mpa
red
to 1
.25%
targ
et
33
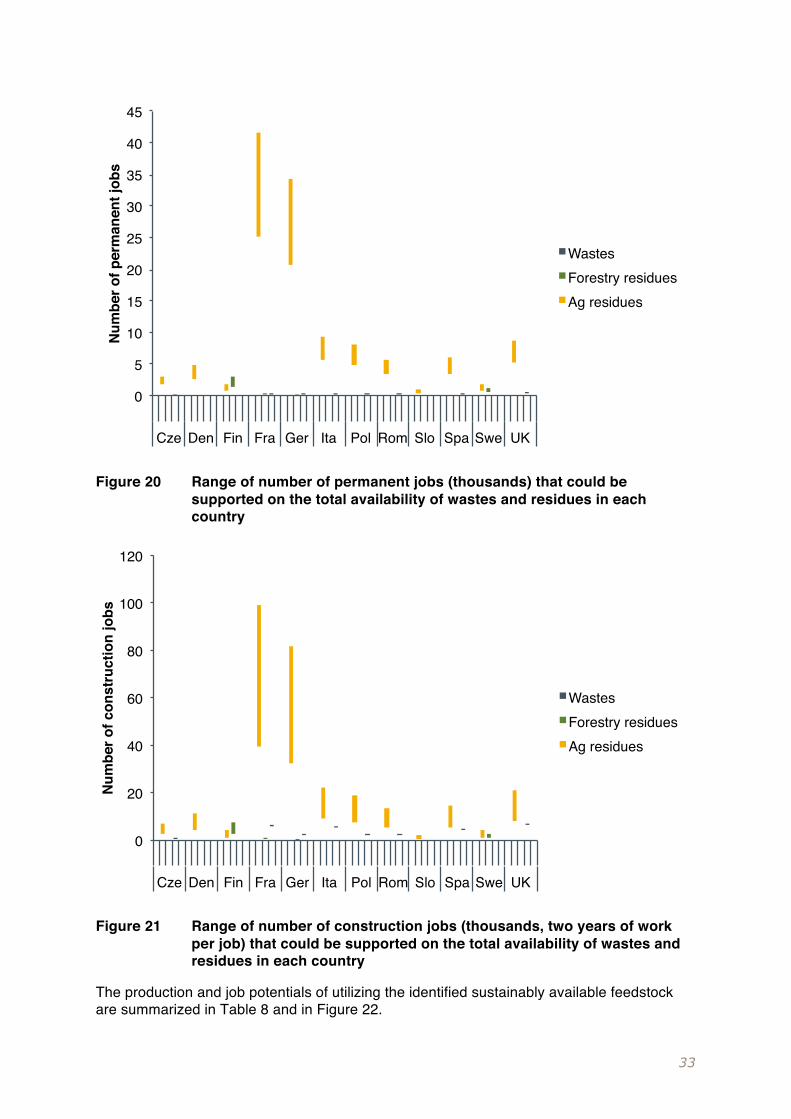
Figure 20 Range of number of permanent jobs (thousands) that could be supported on the total availability of wastes and residues in each country
Figure 21 Range of number of construction jobs (thousands, two years of work per job) that could be supported on the total availability of wastes and residues in each country
The production and job potentials of utilizing the identified sustainably available feedstock are summarized in Table 8 and in Figure 22.
0
5
10
15
20
25
30
35
40
45
Cze Den Fin Fra Ger Ita Pol Rom Slo Spa Swe UK
Num
ber o
f per
man
ent j
obs
WastesForestry residuesAg residues
0
20
40
60
80
100
120
Cze Den Fin Fra Ger Ita Pol Rom Slo Spa Swe UK
Num
ber o
f con
stru
ctio
n jo
bs
WastesForestry residuesAg residues
34
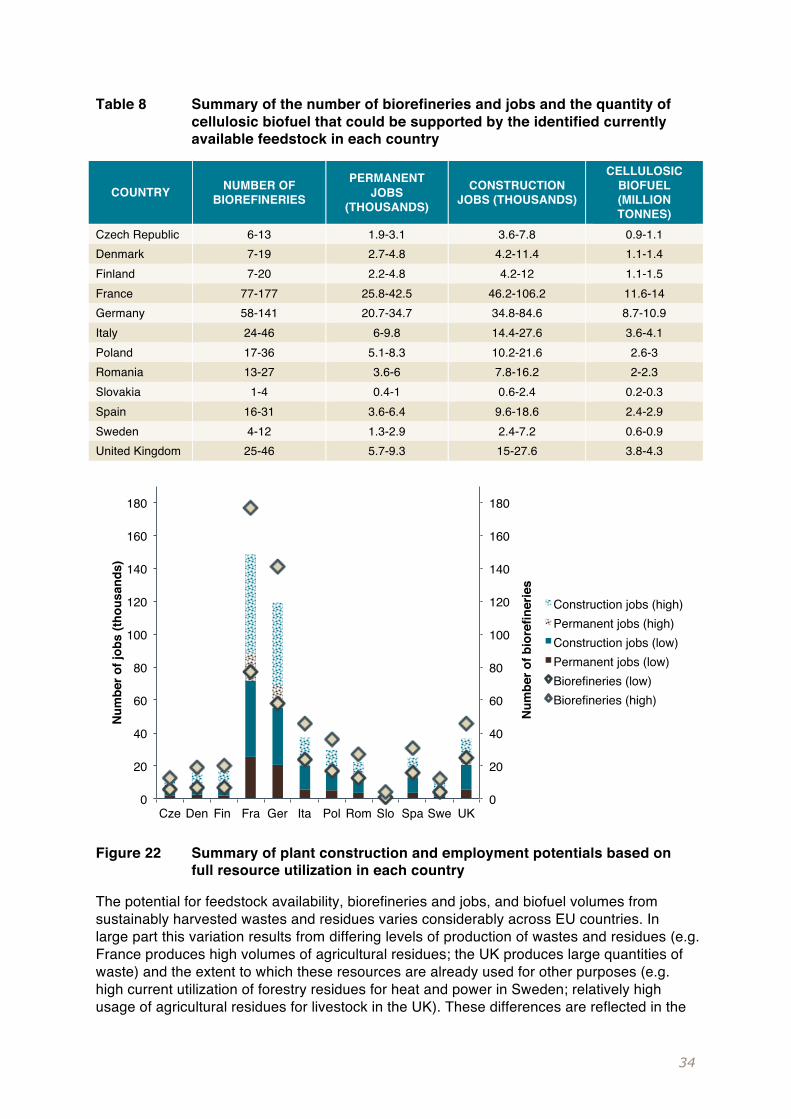
Table 8 Summary of the number of biorefineries and jobs and the quantity of cellulosic biofuel that could be supported by the identified currently available feedstock in each country
COUNTRY NUMBER OF BIOREFINERIES
PERMANENT JOBS
(THOUSANDS)
CONSTRUCTION JOBS (THOUSANDS)
CELLULOSIC BIOFUEL (MILLION TONNES)
Czech Republic 6-13 1.9-3.1 3.6-7.8 0.9-1.1 Denmark 7-19 2.7-4.8 4.2-11.4 1.1-1.4 Finland 7-20 2.2-4.8 4.2-12 1.1-1.5 France 77-177 25.8-42.5 46.2-106.2 11.6-14 Germany 58-141 20.7-34.7 34.8-84.6 8.7-10.9 Italy 24-46 6-9.8 14.4-27.6 3.6-4.1 Poland 17-36 5.1-8.3 10.2-21.6 2.6-3 Romania 13-27 3.6-6 7.8-16.2 2-2.3 Slovakia 1-4 0.4-1 0.6-2.4 0.2-0.3 Spain 16-31 3.6-6.4 9.6-18.6 2.4-2.9 Sweden 4-12 1.3-2.9 2.4-7.2 0.6-0.9 United Kingdom 25-46 5.7-9.3 15-27.6 3.8-4.3
Figure 22 Summary of plant construction and employment potentials based on full resource utilization in each country
The potential for feedstock availability, biorefineries and jobs, and biofuel volumes from sustainably harvested wastes and residues varies considerably across EU countries. In large part this variation results from differing levels of production of wastes and residues (e.g. France produces high volumes of agricultural residues; the UK produces large quantities of waste) and the extent to which these resources are already used for other purposes (e.g. high current utilization of forestry residues for heat and power in Sweden; relatively high usage of agricultural residues for livestock in the UK). These differences are reflected in the
0
20
40
60
80
100
120
140
160
180
0
20
40
60
80
100
120
140
160
180
Cze Den Fin Fra Ger Ita Pol Rom Slo Spa Swe UK
Num
ber o
f bio
refin
erie
s
Num
ber o
f job
s (th
ousa
nds)
Construction jobs (high)Permanent jobs (high)Construction jobs (low)Permanent jobs (low)Biorefineries (low)Biorefineries (high)
35
potential numbers of biorefineries, biofuel production volumes, and associated jobs that could be supported on the available resource.
As noted above, wastes and residues that are currently used for heat, power, and biogas may potentially be considered sustainably available if biofuel is prioritized over these other energy uses. This amount that is already utilized for energy is not reflected in the estimated number of biorefineries, jobs, and biofuel volumes in Table 8, and so these estimates could potentially be higher than shown if this additional resource is considered.
Conclusion The Wasted report concluded that:
Europe could cut the carbon-intensity of transport fuels, reduce spending on oil imports and boost the rural economy by developing sustainable advanced biofuels from wastes and residues… Commercializing this resource could also create hundreds of thousands of jobs, both in building and operating refineries and in collecting the resources to feed them.
In this addendum to the existing research for the Wasted project, we have shown that this is not only true of Europe as a whole, but is also true of the individual Member States we have examined. While the distribution of resources between forestry residues, agricultural residues and wastes varies between the countries, they all have the potential to support several cellulosic biofuel plants, create thousands of direct jobs and deliver significant environmental benefits while diverting money into the rural economy that is currently spent on oil imports.
36
Literature cited ADAS. (2008). Addressing the land use issues for non-food crops, in response to increasing fuel and energy generation opportunities. Hereford, UK: ADAS. 97pp.
ADEME (2014). Chiffres-clés Déchets, Edition 2014. Agence de l'environnement et de la maîtrise de l'énergie, Angers, France
Alternative Fuels Data Center (AFDC). (2013). “Ethanol Feedstocks.” Department of Energy. Accessed on November 14, 2014, from http://www.afdc.energy.gov/fuels/ethanol_feedstocks.html
Bentley, J. W. (2011). Georgia harvest and utilization study, 2009. Resource Bulletin-Southern Research Station, USDA Forest Service, (SRS-172).
Bentley, J. W., & Johnson, T. G. (2008). Alabama harvest and utilization study, 2008. Resource Bulletin-Southern Research Station, USDA Forest Service, (SRS-141).
Bentley, J. W., & Johnson, T. G. (2009a). Florida harvest and utilization study, 2008. Resource Bulletin-Southern Research Station, USDA Forest Service, (SRS-162).
Bentley, J. W., & Johnson, T. G. (2009b). Virginia harvest and utilization study, 2007. Resource Bulletin-Southern Research Station, USDA Forest Service, (SRS-163).
Bentley, J. W., & Johnson, T. G. (2010). North Carolina Harvest and Utilization Study, 2011. Resource Bulletin-Southern Research Station, USDA Forest Service, (SRS-167).
Central Statistical Office of Poland. (2013). “Forestry 2013.” Accessed on October 31, 2014, from http://stat.gov.pl/en/topics/agriculture-forestry/forestry/forestry-2013,1,4.html
Cooper, J. A., & Bentley, J. W. (2013a). Kentucky harvest and utilization study, 2007. Resource Bulletin-Southern Research Station, USDA Forest Service, (SRS-195).
Cooper, J. A., & Bentley, J. W. (2013b). East Oklahoma harvest and utilization study, 2008. Resource Bulletin-Southern Research Station, USDA Forest Service, (SRS-190).
Davis, R. (2009). “Techno-economic analysis of current technology for Fischer-Tropsch fuels production,” NREL Technical Memorandum. National Bioenergy Center. August 14, 2009.
Dooley, K. J. W., Cooper, J. A., Bentley, J. W. (2015). South Carolina Harvest and Utilization Study, 2011. Resource Bulletin-Southern Research Station, USDA Forest Service, (SRS-200).
European Commission (2012). Prospects for Agricultural Markets and Income in the EU 2012-2022. Brussels: European Commission Press. 118pp.
European Environmental Agency (EEA). (2011). Projections of Municipal Waste Management and Greenhouse Gases. Prepared by the European Topic Centre on Sustainable Consumption and Production. Accessed on October 31, 2014, from http://scp.eionet.europa.eu/publications/2011WP4
EUROSTAT. European Commission Statistics. Accessed on October 31, 2014, from http://epp.eurostat.ec.europa.eu/portal/page/portal/eurostat/home
EUROSTAT (2013). Manual on waste statistics: A handbook for data collection on waste generation and treatment. Luxembourg: Publications Office of the European Union. 144pp.
37
EUROSTAT, IEA, OECD, & UNECE. (2014). Renewables Annual Questionnaire 2013 and Historical Revisions. Accessed on October 31, 2014, from http://epp.eurostat.ec.europa.eu/portal/page/portal/energy/documents/RENEWABLES_instructions.pdf
FAOSTAT. Statistics of the Food and Agricultural Organization of the United Nations. Accessed on October 31, 2014, from http://faostat.fao.org
Finnish Forestry Research Institute. (2013). “Finish Statistical Yearbook of Forestry 2013.” Accessed on October 31, 2014, from http://www.metla.fi/julkaisut/metsatilastollinenvsk/index-en.htm
Greenhouse Gases, Regulated Emissions, and Energy Use in Transportation Model (GREET). (2011). Argonne National Laboratory. Available at: https://greet.es.anl.gov/
Harmonized World Soil Database (HSSD) (2012). Rome, Italy, and Laxenburg, Austria: FAO, IIASA, ISRIC, ISSCAS, JRC. Accessed on October 31, 2014, from http://webarchive.iiasa.ac.at/Research/LUC/External-World-soil-database/HTML/
Humbird, D., R. Davis, L. Tao, C. Kinchin, D. Hsu, A. Aden… D. Dudgeon. (2011). Process Design and Economics for Biochemical Conversion of Lignocellulosic Biomass to Ethanol: Dilute-Acid Pretreatment and Enzymatic Hydrolysis of Corn Stover. Golden, Colorado: National Renewable Energy Laboratory. 147pp.
Intergovernmental Panel on Climate Change (IPCC). (2006). Chapter 2: Waste Generation, Composition, and Management Data. 2006 IPCC Guidelines for National Greenhouse Gas Inventories. Accessed October 31, 2014, from http://www.ipcc-nggip.iges.or.jp/public/2006gl/pdf/5_Volume5/V5_2_Ch2_Waste_Data.pdf
Jones, S.B., C. Valkenburg, C.W. Walton, D.C. Elliot, J.E. Holladay, D.J. Stevens, C. Kinchin, S. Czernik. (2009). Production of Gasoline and Diesel from Biomass via Fast Pyrolysis, Hydrotreating and Hydrocracking: A Design Case. A report by the Pacific Northwest National Laboratory for the U.S. Department of Energy. Springfield, Virginia: National Technical Information Service. 76pp.
Lindstrom, M. J., S. C. Gupta, C. A. Onstad, R. F. Holt, and W. E. Larson. (1981). Crop Residue Removal and Tillage —Effects on Soil Erosion and Nutrient Loss In the Corn Belt. U.S. Department of Agriculture, Agriculture Information Bulletin No. 442.
Mantau, U. (2010). Real potential for changes in growth and use of EU forests: EUwood. Retrieved from http://ec.europa.eu/energy/renewables/studies/doc/bioenergy/ euwood_final_report.pdf
Mathison, R. M., Bentley, J. W., & Johnson, T. G. (2008). Eastern Texas harvest and utilization study (2008). Resource Bulletin-Southern Research Station, USDA Forest Service, (SRS-160).
Muth, D., D. McCorkle, J. Abodeely, J. Koch, R. Nelson, & K. Bryden. (2011). Developing an Integrated Model Framework for the Assessment of Sustainable Agricultural Residue Removal Limits for Bioenergy Systems. Proceedings of the ASME 2011 International Design Engineering Technical Conference & Computers and Information in Engineering Conference IDETC/CIE 2011, August 29-31, 2011, Washington, DC, USA.
NNFCC. (2013). Use of sustainably-sourced residue and waste streams for advanced biofuel production in the European Union: rural economic impacts and potential for job
38
creation. A Report for the European Climate Foundation. D. Turley, G. Evans, & L. Nattrass. York, UK: NNFCC. 52pp.
National Renewable Energy Action Plans (NREAPs). Available from the European Commission. Accessed October 31, 2014, from http://ec.europa.eu/energy/renewables/action_plan_en.htm
Parker, N. (2011). Modeling Future Biofuel Supply Chains using Spatially Explicit Infrastructure Optimization. PhD Dissertation submitted to University of California, Davis. 259pp.
Royse, D. (2014). The Mushroom Industry: Overview and Use of Biomass. Lecture in the New Markets for Bioenergy Crops Short Course at Penn State Extension. May 21, 2014, State College, PA.
Scarlat, N., Martinov, M., & Dallemand, J.F. (2010). Assessment of the availability of agricultural crop residues in the European Union: Potential and limitations for bioen- ergy use. Waste Management 30: 1889-1897.
Schnepf, R. (2010). Cellulosic Ethanol: Feedstock, Conversion Technologies, Economics, and Policy Options. Washington, DC: Congressional Research Service. 73pp.
Searle, S. and Malins, C. (2013). Availability of Cellulosic Residues and Wastes in the EU. Washington, DC, International Council on Clean Transportation.
Solecki, M., Scodel, A., & Epstein, B. (2013). “Advanced Biofuel Market Report 2013; Capacity through 2016.” San Francisco: Environmental Entrepreneurs (E2). 37pp.
Stamets, P. (2000). Growing Gourmet and Medicinal Mushrooms. New York, NY: 10 Speed Press. 614pp.
Swedish Forestry Agency. (2014). Swedish Statistical Yearbook of Forestry. Sweden: Swedish Forestry Agency. 362pp.
UN Economic Commission for Europe (UNECE) (2009). Forest product conversion factors for the UNECE region. Geneva Timber And Forest Discussion Paper 49. Timber Section, Geneva, Switzerland.
United States Department of Agriculture Economic Research Service (USDA ERS). (2014). Mushrooms: U.S. import-eligible countries; world production and exports. Spreadsheet. Accessed October 31, 2014, from http://www.ers.usda.gov/datafiles/Phytosanitary_Regulation/Individual_Commodity_Files/Vegetables/veg-mushroom.xls
United States Department of Energy (USDOE). (2005). U.S. Billion-ton Study. Washington, DC: USDOE.
United States Department of Energy (USDOE). (2011). U.S. Billion-ton Update: Biomass Supply for a Bioenergy and Bioproducts Industry. R.D. Perlack and B.J. Stokes (Leads), ORNL/TM-2011/224. Oak Ridge National Laboratory, Oak Ridge, TN. 227pp.
United States Forest Service (USFS). (2009). Timber Products Output Studies. Accessed on October 31, 2014, from http://www.fia.fs.fed.us/program-features/tpo/


![Radioactive elements in Bayer’s process bauxite residue and their … · [Bauxite Residue Technology Roadmap, 2000]. The use of waste bauxite residue was trialled in a test building](https://img.pdfslide.net/doc/110x75/602879d6aab73603de0ce827/radioactive-elements-in-bayeras-process-bauxite-residue-and-their-bauxite-residue.jpg)