Embed Size (px)
Citation preview
NATIONAL CENTER FOR EDUCATION STATISTICS
Working Paper Series
The Working Paper Series was created in order to preserve theinformation contained in these documents and to promote thesharing of valuable work experience and knowledge. However,these documents were prepared under different formats and didnot undergo vigorous NCES publication review and editing priorto their inclusion in the series.
U. S. Department of EducationOffice of Educational Research and Improvement

NATIONAL CENTER FOR EDUCATION STATISTICS
Working Paper Series
Development of a Prototype System forAccessing Linked NCES Data
Working Paper No. 98-15 October 1998
Contact: Steven KaufmanSurveys and Cooperative Systems Groupemail: [email protected]
U. S. Department of EducationOffice of Educational Research and Improvement

U.S. Department of EducationRichard W. RileySecretary
Office of Educational Research and ImprovementC. Kent McGuireAssistant Secretary
National Center for Education StatisticsPascal D. Forgione, Jr.Commissioner
The National Center for Education Statistics (NCES) is the primary federal entity for collecting, analyzing,and reporting data related to education in the United States and other nations. It fulfills a congressionalmandate to collect, collate, analyze, and report full and complete statistics on the condition of education inthe United States; conduct and publish reports and specialized analyses of the meaning and significance ofsuch statistics; assist state and local education agencies in improving their statistical systems; and reviewand report on education activities in foreign countries.
NCES activities are designed to address high priority education data needs; provide consistent, reliable,complete, and accurate indicators of education status and trends; and report timely, useful, and high qualitydata to the U.S. Department of Education, the Congress, the states, other education policymakers,practitioners, data users, and the general public.
We strive to make our products available in a variety of formats and in language that is appropriate to avariety of audiences. You, as our customer, are the best judge of our success in communicating informationeffectively. If you have any comments or suggestions about this or any other NCES product or report, wewould like to hear from you. Please direct your comments to:
National Center for Education StatisticsOffice of Educational Research and ImprovementU.S. Department of Education555 New Jersey Avenue, NWWashington, DC 20208
The NCES World Wide Web Home Page ishttp://nces.ed.gov
Suggested Citation
U.S. Department of Education. National Center for Education Statistics. Development of a Prototype Systemfor Accessing Linked NCES Data. Working Paper No. 98-15, by Sameena Salvucci, Stephen Wenck, andJames Tyson. Project Officer, Steven Kaufman. Washington, D.C.: 1998.
October 1998

iii
Foreword
Each year a large number of written documents are generated by NCES staff and individualscommissioned by NCES which provide preliminary analyses of survey results and addresstechnical, methodological, and evaluation issues. Even though they are not formally published,these documents reflect a tremendous amount of unique expertise, knowledge, and experience.
The Working Paper Series was created in order to preserve the information contained inthese documents and to promote the sharing of valuable work experience and knowledge. However, these documents were prepared under different formats and did not undergo vigorousNCES publication review and editing prior to their inclusion in the series. Consequently, weencourage users of the series to consult the individual authors for citations.
To receive information about submitting manuscripts or obtaining copies of the series,please contact Ruth R. Harris at (202) 219-1831 (e-mail: [email protected]) or U.S. Departmentof Education, Office of Educational Research and Improvement, National Center for EducationStatistics, 555 New Jersey Ave., N.W., Room 400, Washington, D.C. 20208-5654.
Marilyn McMillen Samuel S. PengChief Statistician DirectorStatistical Standards and Services Group Methodology, Training, and Customer
Service Program

This page intentionally left blank.

Development of a Prototype Systemfor
Accessing Linked NCES Data
Prepared by:
Sameena SalvucciStephen Wenck
James Tyson
Synectics for Management Decisions, Inc.
Prepared for:
U.S. Department of EducationOffice of Educational Research and Development
National Center for Education Statistics
October 1998

This page intentionally left blank.

vii
Table of Contents
1. INTRODUCTION ............................................................................................................................................. 1
2. RESEARCH TOWARD DEVELOPING A PROTOTYPE .......................................................................... 3
2.1. COMMERCIAL-OFF-THE-SHELF (COTS) PRODUCTS AND TECHNOLOGIES ......................................................... 32.2. SIMILAR ACTIVITIES BY OTHER GOVERNMENT ORGANIZATIONS....................................................................... 4
2.2.1. The National Agricultural Statistics Service (NASS) ............................................................................ 52.2.2. The Environmental Protection Agency (EPA) ...................................................................................... 52.2.3. The Bureau of Labor Statistics (BLS) ................................................................................................... 62.2.4. The Census Bureau ............................................................................................................................... 62.2.5. The National Science Foundation (NSF) .............................................................................................. 72.2.6. Statistics Canada .................................................................................................................................. 7
2.3. REVIEW OF INDUSTRY LITERATURE.................................................................................................................. 82.4. CONCLUSIONS ................................................................................................................................................. 8
3. NCES DATA LINKAGES ................................................................................................................................ 9
3.1. POTENTIAL LINKAGES ..................................................................................................................................... 93.2. RECENT SURVEY LINKING PROJECTS.............................................................................................................. 12
4. PROTOTYPE WAREHOUSE: METADATA AND THE DATA MODEL .............................................. 15
4.1. METADATA.................................................................................................................................................... 154.2. DATA MODEL................................................................................................................................................ 16
5. PROTOTYPE WAREHOUSE: IMPLEMENTATION............................................................................... 19
5.1. ORACLE WAREHOUSE................................................................................................................................. 215.2. COGNOS TOOLS............................................................................................................................................. 22
6. LESSONS LEARNED AND POSSIBLE NEXT STEPS.............................................................................. 24
7. REFERENCES ................................................................................................................................................ 25
APPENDIX A: SUMMARY OF INTERVIEWS ....................................................................................................29APPENDIX B: LONGITUDINAL EDITING AND IMPUTATION OF CCD DATA ........................................45APPENDIX C: SAMPLE COGNOS SCREEN SHOTS......................................................................................... 51

This page intentionally left blank.

1
1. Introduction
In the past 20 years, there has been a significant change in the way data are accessed andused. The procedural tools of the seventies have given way to graphical user interfaces (GUIs)which allow direct manipulation of data. This evolution has created an opportunity to placepowerful tools for information retrieval and manipulation in the hands of users.
NCES has been a catalyst in the development and innovative use of technology, includingthe addition of user tools with its survey data. It fueled advances such as the electronic code book(ECB), the data analysis system (DAS), and other data products including the Common Core ofData (CCD) and the Integrated Postsecondary Education System (IPEDS) CD-ROMs withgraphical user interfaces. These were not just technical advances; they provided a paradigm shiftfrom merely providing information to placing user-friendly tools along with the data directly inthe hands of users in order to improve the accessibility and usefulness of the information.
Recently, NCES began providing its survey data and tools through the Internet, a stepwhich has greatly expanded accessibility to these data. However, both NCES internal staff and itscustomers have a further need for the ability to directly access “linked” data from multiplesurveys, multiple components within a survey, and multiple time points, for methodological andanalytic purposes.
The purpose of this project is to advance NCES' capabilities to support the disseminationof linked data1. This enhanced capability acknowledges the critical role of providing access tolinked historical data in improving analytical capabilities, improving sampling and estimationtechniques, ensuring data quality, and improving customer service. An essential element of thisstudy is the development of a software prototype system to facilitate NCES data customers’access to linked historical data (i.e., a data warehouse).
The basic concept of an NCES data warehouse is to facilitate data management such thatspecific information is easily accessible to all users of NCES data.
The major expected benefits to NCES of such a data warehouse system are:
• Elimination of the need to re-create links every time a research purpose requires it, therebysubstantially reducing the effort involved in ad-hoc survey linkages;
• Wider dissemination and use of its survey data through more user friendly access tomultiple-linked data products;
1 "Data linking" and "linked data" refer to the concept of associating data from across various survey data setsthrough common or related elements. This may include linking heterogeneous data sets (such as via common dataelements), as well as linking homogeneous data sets (such as to aggregate results across different survey years), orboth.

2
• Establishment of “standards” for documentation of data and metadata related to futurereleases of NCES data.
The initial steps in the development of the prototype include research in the capabilitiesof available tools and techniques for building data warehouses, a review of prominent examplesof warehouse implementations in the federal agencies, and a review of types of historic andongoing NCES data linking activities.
This report has six main sections. Section 2 summarizes the findings of our research inthe area of data warehousing. Section 3 documents the range of potential linkages using historicalNCES survey data, briefly describes recently completed survey linking projects, and explains theselection of survey data to be used in the data warehouse prototype. Section 4 addresses theobjective of the prototype warehouse, explains metadata, and provides a description of the datamodel developed to represent multiple years of the Common Core of Data (CCD) district leveldata set. Section 5 describes the steps and tools used in the implementation of the data model intoa prototype warehouse. Section 6 provides a set of conclusions based on this study. Section 7includes a selected set of references.

3
2. Research Toward Developing a Prototype
This section summarizes the research findings for this project. The research spanned threebasic areas that relate to NCES’ interest in data warehouses:
• Identifying and comparing commercial off-the-shelf products and technologies;• Reviewing activities by other organizations with similar mission and scope; and• Reviewing white papers, articles and textbooks.
The activities and findings in each of the areas of primary research undertaken are summarizedbelow.
2.1. Commercial-off-the-shelf (COTS) products and technologies
Investigation of COTS products focused on 1) characterizing the broad range of vendorsand products that are positioned to support the general goals of this project, and 2) evaluatingselected products in somewhat closer detail towards the development of a data linking prototype.
The current market for COTS software products that support data warehousing is at astage of rapid growth. Many competing products from numerous vendors characterize the currentmarket. One Internet-based list of data warehousing products (maintained by Larry Greenfield,LGI Systems at http://pwp.starnetinc.com/larryg/index.html) recently identified 822 products in17 categories:
Product category No. of productsReport and Query 118OLAP / Multidimensional Databases 60Executive Information Systems 53Data Mining 100Document Retrieval 66Geographic Information Systems 29Decision Analysis 29Process Modeling 24Statistics 39Information Filtering 26Other End User Decision Support Tools 20Data Extraction, Cleaning, Loading 139Information Catalogs 14Databases for Data Warehousing 30Query and Load Accelerators 23Middleware 33Other Database Tools 19

4
The first two categories of products—that is, Report and Query tools, and OLAP tools—were determined to be the most appropriate types of tools to use to demonstrate the capabilitiesof linked survey data.
Report and query tools produce tabular reports with simple summations and aggregations,typically (but not necessarily) based on the contents of a relational database. Examples of popularproducts with this capability include Cognos Impromptu, Microsoft Access, Brio BrioQuery,Seagate Software Crystal Reports, and the SAS System.
On line analytical processing (OLAP) is a popularly used to describe an interactiveapproach to decision support2. OLAP query tools produce reports with more complex processingrequirements, and typically work against (star-schema3) relational databases and/ormultidimensional databases (such as Red Brick or Essbase). Examples of popular products withthis capability include Cognos PowerPlay, Brio BrioQuery, IQ Software IQ/Vision, SeagateSoftware Crystal Info., and the SAS System.
Note that there is not a clear line between the two categories of products (e.g., Cognos,Brio and SAS products fit in both). Generally, OLAP means more complex processing thanReport and Query. Just about EVERY product in either category runs under Windows and canconnect to a relational database management system (RDBMS) such as Oracle or SQL Server.
Selected vendors (Brio Technology, SAS Institute, Information Builders, Inc. andCognos) were chosen for on-site review of their product offerings. Vendors of softwarespecifically purported to support linking statistical data sets across time were also contacted. Forprototype purposes, Report and Query and On-Line Analytic Processing (OLAP) softwarepackages, Cognos’s Impromptu and PowerPlay, were chosen.
2.2. Similar activities by other government organizations
The activities of several Federal government agencies with missions similar to NCESwere reviewed, including the National Agriculture Statistics Service, the EnvironmentalProtection Agency, the Bureau of Labor Statistics, the Census Bureau, and the National ScienceFoundation.
General findings show that these agencies are taking or have taken an approach to linkingstatistical data similar to NCES' current approach, that is to plan and implement various datawarehousing technologies to support the efficient organization and dissemination of data andmetadata.
2 Decision support activities involve producing reports and views of aggregated data, such as cross tabulations andvarious statistical measures to support inferential decision making.3 Star Schema is a name that database designers have used to describe dimensional models because the diagram of this type ofmodel looks like a star, with one large central table and a set of smaller attendant tables displayed in a radial pattern around thecentral table.

5
2.2.1. The National Agricultural Statistics Service (NASS)
The National Agricultural Statistics Service (NASS) of the Department ofAgriculture has developed a relational database system under the direction ofMickey Yost. This relational database employs the star schema model. NASS haschosen to employ the Red Brick Warehouse management system. NASS hasselected Brio as their user interface software package. They are also looking intodeveloping a SAS CONNECT user interface.
In particular, the Department of Agriculture has successfully developed a systemthat links various survey data sets (including time series data) using amultidimensional or star-schema model. The Department of Agriculture staff whodeveloped this system emphasized the practical value of the star-schema datamodel as their starting point, particularly as the use of a common model allowsthem flexibility in the choice of COTS products that can support or work withtheir data.
By design, the NASS warehouse is not available on the web. Their warehousecontains restricted data and is only available on the NASS LAN. The warehousecurrently only supports the Brio OLAP tool. By design, users can print Briocrosstabs in a number of formats (ASCII, Excel, etc.), but cannot export raw data.
2.2.2. The Environmental Protection Agency (EPA)
EPA has developed an on-line (web based) relational database called Envirofacts.This database integrates data extracted monthly from five facility (site) based EPAprogram systems. Those program systems are: Superfund Data, Hazardous WasteData, Toxic Release Inventory, Water Discharge Permits, and an AerometricInformation Subsystem (AIRS). Envirofacts also contains a grant informationdatabase, three integrating databases, and mapping applications. The Envirofactsdatabase contains only data available under the Freedom of Information Act andtherefore full access is granted to all users.
Envirofacts has been created by extracting data from the mainframe computerversions of these data sources and placing it in an ORACLE Relational DatabaseManagement System. It is updated monthly. Envirofacts can be accessed by anysoftware package that can connect to an ORACLE database. Information in theEnvirofacts database can be freely accessed through the use of predetermined oruser-developed queries. While the complexity of user-developed queries isunlimited, queries that return a large volume of data may terminate prematurelydue to system limitations. The constraints established for the enviro user accountare:
• Each query is limited to 2.5 minutes of CPU time.• A single session can be 15 minutes in duration.

6
• A session may stay idle for 7.5 minutes, at which time it will beterminated.
Users are urged to develop queries that return small batches of data and terminatetheir session as soon as their queries have executed, so that others may be able toaccess the database.
The Envirofacts Query allows users to retrieve the environmental profile offacilities that match the query specifications. Queries are allowed on the followingcriteria: facility name, geography, or Standard Industrial Classification (SIC)Code. The profile of facilities includes information regarding toxic chemicalreleases, chemical permit compliance, hazardous waste handling processes,Superfund status, and air emission estimates for pollutants regulated under theClean Air Act. Query Mapper has been developed to map the results ofEnvirofacts queries.
2.2.3. The Bureau of Labor Statistics (BLS)
The Bureau of Labor Statistics (BLS), Department of Labor has developed a web-based data warehouse. The data are not linked across different surveys. Thesystem allows extraction of timeseries data for a specific database. The onlyoutput selection is raw ASCII data. Within each database one can select any oneor all of the timeseries shown and choose desired date ranges and output options.There are also a limited number of time series data for which BLS allows therequester to select a subset of the available variables to be output as ASCII data.The users would then transfer these ASCII data files into their choice of statisticalpackages (e.g., SAS, SPSS) for analysis.
2.2.4. The Census Bureau
The Census Bureau has developed the “Data Extraction System” (DES) as a web-based data warehouse. The Data Extraction System is a tool for extracting records(rows) and fields (columns) from very large, public-information, data files (forexample: survey and census records.) The system produces custom extracts inselectable data file formats which, when processed, can then be picked up at theCensus Bureau's FTP site. This system does not produce tabulations, it producesonly raw data which must then be processed by programming or statisticalanalysis software elsewhere. No confidential data are available via this service. Aswith the BLS system, data are not linked across databases, but rather allow forextraction of data from a particular data source. The DES requires that the userspecify the survey, the number of records, and the survey items and returns an e-mail to the user when the requested ASCII data are available for downloading.The users would then need to transfer the ASCII data file into their choice ofstatistical packages (e.g., SAS, SPSS) for analysis.

7
2.2.5. The National Science Foundation (NSF)
The National Science Foundation has designed WebCASPAR, a database systemto provide quick and convenient access to a wide range of statistical data focusingon U.S. universities and colleges and their science and engineering resources.WebCASPAR users can specify the statistical data of interest and either view thedata through their web browsers or transfer the data to their own computers asspreadsheets or other data files.
2.2.6. Statistics Canada
For years, Statistics Canada has created the E-STAT CD-ROM to disseminatetheir socio-economic databases to the national school community. This offering isnow available to that community through SchoolNet on the World Wide Web.
The data bases contained in E-STAT are:
• Census Profiles showing various characteristics across detailed geographicareas; and
• the CANadian Socio-economic Information Management (CANSIM) database containing over 200,000 time series of socio-economic data detailingnumerous subject matter areas at various levels of geography.
The databases are stored in a proprietary data base format. Users can get the datathey want in two primary ways: hypertext (HTML) navigation through subjectmatter areas, and by keyword searching.
Once the desired data has been specified, a request is uploaded to the WebServerand the data retrieval is executed. The user is then asked which of several formatsis desired (e.g. HTML, Comma-Separated Value, Ivation’s Beyond 20/20, etc.).On selection of the desired format, the server will then download the selected datain the selected format to the user’s workstation.
Users who want to view and manipulate tables in Beyond 20/20 format need tohave the Beyond 20/20 Data Browser. The Data Browser is available on the E-STAT WebServer in a file, which is ready for installation once downloaded.Clients can download the Browser once and subsequently use the Browser to“slice and dice”, make selections, create charts and maps based on any table that isdownloaded from the server thereafter.

8
2.3. Review of industry literature
More than 30 recent industry articles, white papers and texts on the subjects of linkingdata and data warehousing were identified and reviewed. Section 7 contains a partialbibliography.
A common theme of the literature was the importance and value of developingappropriate data models to represent the information that is to be linked or warehoused. Whilethere was some debate over the relative benefits of alternative technologies for implementingthese models, there was broad and strong consensus that the so-called dimensional or star-schema data model best represents data and metadata4 in forms useful to analysts.
It should be noted that the multidimensional or star-schema model is a conceptual model,and theoretically can be implemented through any of a variety of physical designs. For example,there is an ongoing debate over the relative merits of general-purpose relational databasemanagement systems (RDBMS) versus special-purpose "multidimensional database systems"(MDDSs) towards supporting star-schema warehouses. Such discussions are important fordeveloping an architecture to support production operations but, for purposes of this prototype, itwas determined that a standard RDBMS already supported at NCES would be adequate todemonstrate the feasibility and utility of linking NCES data sets through a star-schema model.
2.4. Conclusions
In the course of our research, we refined our understanding of the critical elements of theprototype, i.e., to identify an approach to linking data sets that is flexible and scaleable; that hasthe potential for integration with WWW-based services; and that is appropriate to NCES’operating environment and goals. The research also indicated that a primary step in creating theprototype should be the development of an appropriate “dimensional” data model.
General reasons for this conclusion include:
• The literature reviewed almost universally recommended the development of anappropriate data model as a starting point.
• Data warehousing and, specifically, data linking activities by other organizations aregenerally organized around a specific data model.
• The commercial products evaluated all support a dimensional data model.
4 Metadata is a general term for data about data.

9
3. NCES Data Linkages
This section documents a range of potential linkages using historical NCES survey data,briefly describes recently completed survey linking projects, and explains the selection of surveydata to be used in the data warehouse prototype.
3.1. Potential Linkages
As a first step toward selecting the subset of NCES survey data to use in the developmentof the prototype data linking system, a review of NCES data sets was conducted to determine therange of potential linkages. For purposes of this report, linkage will refer to three methods ofcombining statistical information, including the ability to:
• Match identical entities over time within the same survey.• Match identical entities across different surveys or survey components for a given point
in time.• Combine or compare statistics collected from different surveys, at some level of
aggregation greater than an individual respondent unit.
With the assistance of NCES, all such potential linkages between the major NCESuniverse and sample survey data files were identified. Figure 3.1 illustrates the extent of potentiallinkages between survey files across time and across each of five levels of data aggregation(state, district, school/institution, teacher, and student) in a matrix form.
Each cell in the matrix contains the names of the set of surveys that were conducted at aparticular level of aggregation in a particular year. For example, the information in the cell in thefirst row and first column indicates that the Common Core of Data (CCD) was collected at thestate level in 1986-87. The lines connecting two surveys within a cell in the matrix indicate theability to match identical entities across different surveys within a particular year and level ofaggregation. For example, the line connecting CCD and F-33 in the second row and first columnin the matrix indicates that the 1986-87 CCD and the 1986-87 F-33 (School District FinanceSurvey) are linkable at the district level.
The lines connecting the survey across cells in the matrix indicate the ability to matchidentical entities across different surveys/survey components within a particular year. Forexample, the line connecting CCD in the first row and first column to the CCD in the second rowand first column indicates the ability to match the school districts in the 1986-87 CCD with thecorresponding state in the 1986-87 CCD. This type of linkage provides the ability to comparestatistics at the state level from the CCD school district level file (aggregated to the state level) tothe CCD state level statistics. However, note that for sample survey data, even if the data werecollected at a particular level, the estimated statistics may not be valid at that level ofaggregation. For example, even though the 1987-88 Schools and Staffing Survey (SASS) has acomponent that collects data at the district level, the statistics are only valid when estimated atthe national level.

10
¬SASS
Figure 3.1--Potential NCES Survey Linkages
19861987
19871988
19901991
19911992
19921993
19931994
19941995
19951996
State
District
School/Institution
Teacher
Student
¬IPEDS
OPE
¬NPSAS
¬NPSAS
¬SASS
NAEP
NAEP
NAEP
NELS
NELS
19881989
IPEDS
OPERCG
RCG
¬NSOPF
PSS
¬NELS
¬NELS
¬NELS
19891990
PSS
¬Census-M
¬NAEP
¬IPEDS
OPE
¬NPSAS
¬NPSAS
SASS
SASS
SASS
¬NELS
¬NELS
¬NELS
NAEP
NAEP
NAEP
OPE
¬IPEDS
OPE
¬NPSAS
¬NPSAS
¬NELS
¬NELS
¬NELS
¬NAEP
¬BPS
SASS
SASS
¬B&B
¬IPEDS
¬BPS
OPE¬B&B
PSS
OPE
¬NAEP
¬NAEP
¬NAEP
NELS
NELS
NELS
¬IPEDS
¬NPSAS
¬NPSAS
¬IPEDS
¬OCR
¬OCR
RCG
¬NAEP
¬NAEP
¬BPS
OPE
RCG
SASS
¬NAEP
¬NAEP
¬NSOPF
¬BPS
¬SASS
¬IPEDS
NSOPF
NSOPF
PSS
¬CCD
¬CCD
¬CCD
¬F-33
¬CCD
¬CCD
¬CCD
¬F-33
¬CCD
¬CCD
¬CCD
¬F-33
¬CCD
¬CCD
¬CCD
¬F-33
¬CCD
¬CCD
¬CCD
¬F-33
¬CCD
¬CCD
¬CCD
¬F-33
¬CCD
¬CCD
¬CCD
¬F-33
¬CCD
¬CCD
¬CCD
¬F-33
¬CCD
¬CCD
¬CCD
¬F-33
¬CCD
¬CCD
¬CCD
¬F-33
OPE
IPEDS
OPE
NELS
¬OCR
¬OCR
¬OCR
¬OCRIPEDS

11
Although the matrix does not include lines connecting surveys across years, this isanother type of potential linkage. For example, the fact that CCD appears in all the cells in thefirst row of the matrix indicates that there is the ability to match CCD files across all those yearsat the state level.
Surveys that are not included in this matrix include surveys such as the Fast ResponseSurvey System (FRSS) and the Postsecondary Education Quick Information System (PEQIS).These surveys have changing scope over time and therefore do not lend themselves to this type ofanalysis.
A list of the full names of each of the survey abbreviations indicated in figure 3.1 areprovided below:
Abbreviation Survey Name
Universe Surveys:
CCD Common Core of DataIPEDS Integrated Postsecondary Education Data SystemPSS Private School SurveyF-33 School District Finance Survey5
Sample Surveys:
B&B Baccalaureate and BeyondBPS Beginning Postsecondary SurveyCensus-M School District Data Book (Census Mapping Project)OCR Office of Civil Rights SurveyOPE Office of Postsecondary Education SurveyNELS National Educational Longitudinal SurveyNAEP National Assessment of Educational ProgressNSOPF National Study of Postsecondary FacultyRCG Recent College Graduate SurveySASS Schools and Staffing Survey
5 These data are collected annually through the Bureau of Census’ F-33, Survey of Local Governments. Data arecollected from all districts in the census year (e.g., 1990) and in years ending in 2 and 7, and from a large sample inremaining years.

12
3.2. Recent survey linking projects
Based on the documentation of potential NCES data linkages, and the review of a rangeof projects that have required linking NCES data, it was decided that the prototype developmentprocess should take advantage of the results of previous linking efforts. In other words, the datasets and technical documentation produced in one of these linking efforts would be used as thedata/metadata for the prototype. The decision on which linking activity to use was based oninformation collected through interviews conducted with both NCES staff and its contractorstaff. The interviews included questions about the type of data sets that had been linked, thesoftware that was used to perform the linkage, and the current availability of both the linked dataand the corresponding documentation (including program code) on the linkage. Summaries of therange of data linking activities uncovered are provided in tables 3.1, 3.2 and 3.3. Table 3.1includes information on the linkages involving CCD data and table 3.2 includes information onthe linkages involving IPEDS data. Other linking projects are summarized in table 3.3. Moredetailed descriptions of the interview findings are provided in Appendix A.
The criteria used for reviewing these linking activities included the recency of the linkingactivity, the quality of the analysis performed (e.g., the results were adjudicated), and theexistence of both the linked data set and corresponding documentation. Based on these criteria, adecision was made to use a recently completed linking activity carried out by Don McLaughlin atthe American Institutes for Research (AIR) who used multiple years of district level CCD data.His analysis was done across regular school districts between the years 1986-87 and 1991-92.The linking activity included performing longitudinal editing and imputation of the data relatedto regular school districts in the CCD Public Education Agency Universe files for these years.See Appendix B for details of the steps taken to edit and impute the CCD data.

Table 2.1 -- Linking projects involving CCD
Surveys Linked Name Organization LinkedOn Variables Used Documentation Data Available?68-92 CCD & 68-84 OCR Mike Ross NCES District Civil Rights Indicators Not available No
86-87 CCD & 93-94 NAEP & SASS State Assessment Don Mclaughlin AIR District & State Enrollment & Special Ed. Report as Appendix No(Lee Hoffman, NCES) Programs
CCD & SASS (3 Waves) & FBI UCR & Climatic File & Jay Chambers AIR District & School Wages & FBI Crime Technical Report NoCollege Quality & City, County Data Book & Census by City and Climate "Patterns of Teacher Compensation"
CCD & SASS David Figlio Univ. of Oregon District Cost Not available No
CCD & NELS Bill Fowler NCES School Achievement & Expenses A Report & SAS programs No& SES (Control)
CCD & SASS / NSOPF & IPEDS Valerie Conley Synectics Faculty & Institution & Not available CCD Net Users Manual NoSchools & Districts & States
CCD & OCR & Census Bill Sonnenberg NCES District Not available Not available No
CCD Public School Universe & John Sietsema NCES District & Schools Not available Trends in School Demographics NoCCD Public Education Agency Universe
CCD & SASS & Census & F33 Frank Johnson NCES District & School Finance Documents in each program No
CCD& SASS & QED & IPEDS Steve Owens Census District & School Integrated Sampling Project Draft Report available Nofrom Jonaki Bose (NCES)
CCD& SASS & Census & USDA Beal Code Mike Podgursky Univ. of Missouri District & State Graduation & Cost of Living & Not available NoSalaries & Median Home Prices
CCD& SASS & IPEDS Bob McArthur Census State Finance Not available No
CCD & SASS Arnold Reznek Census Schools & Districts Not available Programs No
CCD & SASS Sameena Salvucci Synectics Schools, Districts, & States Enrollment, # of teachers, # of Administrative Records and Yesstudents,# of schools, # of LEAs Sample Survey Comparisons
CCD & SASS Fan Zhang Synectics Schools Enrollment, school level, full-time CCD Adjustment to the SASS: A Yesteachers, ethnic origin, etc. Comparison of Estimates
13

Table 2.2 -- Linking projects involving IPEDS
Surveys Linked Name Organization LinkedOn Variables Used Documentation Data Available?IPEDS & NSOPF Linda Zimbler NCES Representative of sample Yes
IPEDS & NPSAS & B and B Paula Knepper NCES Institution Enrollment Degrees Representative of sample Yes
IPEDS & NHES Kathryn Chandler NCES Adult Ed. District Early Childhood Discipline household Manual codebooks No
IPEDS & NPSAS Drew Malizio NCES District Attendance Costs No formal docs. No
IPEDS & NELS Sam Barbett NCES District Enrollment Finance Ad hoc programs No
IPEDS & RCG Peter Stowe NCES Unit Employment Ad hoc"not high quality" No
Table 2.3 -- Other linking projects
Surveys Linked Name Organization LinkedOn Variables Used Documentation Data Available?SDDB & SDAB Larry McDonald Census District Finance Not available No
NELS Dale Ballu University of District Private Schools, Not available NoMassachusetts County ID, Zipcode
SASS & QED Sameena Salvucci Synectics School, District # of students, Report Yes# of teachers
14

15
4. Prototype Warehouse: Metadata and the Data Model
This section introduces the specific objective of the prototype warehouse, explainsmetadata as it pertains to the prototype, and provides a description of the dimensional modeldeveloped to represent multiple years of the Common Core of Data (CCD) district level data set.
The objective of this prototype warehouse is to provide a highly interactive ad hocanalysis system with the ability to access data from multiple NCES surveys simultaneously.Users expect to view this data from different perspectives – enrollment by race/ethnicity by year,number of full-time equivalent teachers by urbanicity of school by region, etc. – and expect toswitch interactively among these perspectives. Users need to see information at different levels ofdetail, looking for insights with summary data (e.g. enrollment by race/ethnicity by year), then“drilling down” to increasing levels of detail (e.g. enrollment by race/ethnicity by school districtby year), in order to understand root causes and anomalies.
Since the prototype will only include universe data (i.e., CCD), as described earlier, theability to provide weighted data and correct standard errors was not an objective of this prototypewarehouse system.
4.1. Metadata
Metadata is data about data. There are two categories of metadata: technical andwarehouse-dependent. Technical metadata is the description of the data needed by various toolsto store, manipulate, or move data. These tools include relational databases, applicationdevelopment tools, and OLAP tools just to name a few. Warehouse-dependent metadata, on theother hand, is the description of the data needed by users to understand the context and meaningof the data. It is any information that makes the data more useable by the researchers.
Building data warehouses is resource-intensive, so it is important to make the results ofthese projects usable by researchers. Implementing full warehouse-dependent metadata producesthe significant benefit of making the information visible, understandable, and available. In short,it can be the difference between success and failure of a warehouse effort.
The warehouse-dependent metadata in the NCES prototype system is described in thenext section. Essentially all categorical variables were put into the dimension tables. The onlycategorical variables not put into dimension tables were the imputation flags and the CCDquestion items. The imputation flag information was added in later version of the prototype.However, the CCD question items were not added to the prototype due to a limitation of the toolwe chose. Cognos can give a general explanation of a variable for the whole warehouse, but ifthat information changes from year to year or from survey to survey, then Cognos currently cannot handle that information.

16
4.2. Data Model
A data model provides an abstract view of the data, including a description of what dataare actually to be stored in a database, and the relationships that exist among the data. Inparticular, the dimensional or star-schema data model is a logical design technique that seeks topresent the data in a standard, intuitive framework that allows for high-performance access in adata warehouse.
A star-schema model was developed for the selected longitudinal CCD LEA data. Seefigure 4.1. The star schema represents to the end user a simple and query-centric view of the databy partitioning the data and the warehouse-dependent metadata into two types of tables: facttables and dimension tables.
In the NCES prototype, fact tables represent the actual data from the multiple CCD datasets. The most useful facts in the fact tables are numeric and additive. Additivity is crucialbecause data warehouse application users almost never retrieve a single fact table record; rather,they fetch back hundreds and thousands of these records at a time, and the only useful thing to dowith so many records is to add them up and present the information in an aggregate form.Information in the dimensions is what describes the facts.
Dimension tables, by contrast, most often contain descriptive textual informationincluding the warehouse-dependent metadata. Dimension attributes are used as the source ofmost of the interesting constraints in data warehouse queries, and they are virtually always thesource of the row and column headers in the users answer set. The power of the warehousedatabase is proportional to the quality and depth of the dimension tables.
A fact table has columns of anonymous index keys, one for each dimension, that relateback to exactly one row in each of the dimension tables. The variables listed in the fact table infigure 4.1 labeled FK (for foreign key) are these keys. The unique combination of keys in the facttable acts as a cross-reference specifying the intersection of each dimension at that data point.Examples of the types of facts pulled from the CCD datasets are also listed in this table.
The creation of unique dimension table keys is very important. These keys have to beunique to identify each record in the dimension table, but they also have to be generic enough sothat as other surveys are added, a completely new key does not have to be added.
Because the single key in a dimension table is a row, metadata about that key can exist onthat row and be available for querying. In fact, the dimensional intersection specified by theunique combination of foreign keys in the fact table defines the data point by presenting themetadata and the data item together.
Essentially, all categorical variables were put into the dimension tables. The onlycategorical variable not included as a dimension was the information on the imputation flagsbecause of difficulty with the interpretation of the codes. The NCES dimension tables (figure4.1) include Time, Enrollment, Agency Type, Reporting Unit, Respondent, Locale, and Grade

17
Span. The Time dimension includes the description of the survey year and survey name (in thecase of the prototype this is just CCD LEA Universe but could be expanded to include othercomponents of CCD or other sample or universe surveys at NCES) and a longer surveydescription. The Enrollment dimension includes the descriptions corresponding to eachenrollment level code of the district. The Agency Type dimension includes the descriptioncorresponding to each agency type code in the CCD. The Metro Status dimension includes thedescription corresponding to each metro status code of the district. The Reporting Unitdimension provides each of the LEA names and corresponding address, city, county name, andMSA ID while the Respondent dimension includes each of the state education agencydescriptions. Finally, the Grade Span dimension includes the description corresponding to eachof the grade span codes for the district.

18
Figure 4.1
YEAR & SURVEY (FK)LEAID ID & YEAR (FK)
ENROLLMENT (FK)STATE (FK)
LOCACODE (FK)TYPECODE (FK)
GRADESPAN (FK)METSTATS (FK)
All Factsfor example:TOTSTUDTTOT_TCHR
ASIANBLACKWHITE
HISPANICBLACK
Dimensional Model for the NCES Warehouse PrototypeUsing 1986-1993 Longitudinal CCD LEA Data
YEAR & SURVEY
Survey Description
Fact Table
Time
Agency Type
TYPECODE
Agency Type Description
Metro Status
METSTATS
Metro Status Description
STATE
SEA Description
Respondent
Locale
LOCACODE
Locale Description
LEA ID & YEAR
LEA nameAddress
CityCounty name
MSA ID
ReportingUnit
Grade Span
GRADESPAN
Grade SpanDescription
Enrollment
ENROLLMENT
EnrollmentDescription

19
5. Prototype Warehouse: Implementation
This section describes the steps and tools used in the implementation of the data modelinto a prototype warehouse.
The approach on the implementation of the data-linking prototype was to use standardmethods and tools that facilitate end user access to linked or linkable NCES data. Concentratingon standard methods and tools ensures that the successful elements of the data-linking prototypecan readily be integrated or incorporated within broader NCES or Department of Educationplans, standards and technologies.
The prototype development process included the following steps:
1. Development of a flexible data model for the target data using an industry standard approach(i.e., the "dimensional" or "star schema" model). Dimensional modeling is a technique forvisualizing the data as a “cube” of three, four, or even five or more dimensions. This can beillustrated with a simple example using the CCD:
“States report data every year on district enrollment and locale type”
For the data warehouse design, special emphasis is added as follows:
“States report data every year on enrollment and locale type”
Most people find it easy to think of this as a cube of data, with labels on each of the edges ofthe cube. For the description above, the edges of the cube can be labeled as State, Time, andLocale Type. The points inside the cube are where the enrollment measurements for thatcombination of State, Time, and Locale Type are stored. This is the dimensional model. StarSchema is a name that database designers have used to describe dimensional models becausethe diagram of this type of model looks like a star, with one large central table and a set ofsmaller attendant tables displayed in a radial pattern around the central table. There is onelarge dominant table in the center of the schema. It is the only table in the schema withmultiple joins (relationships) connecting it to other tables. The other tables all have only asingle join attaching them to the central table.
2. Implementation of the data model using Oracle, a standard relational database managementsystem (RDBMS). A database management system consists of a collection of interrelateddata and a set of programs to access that data. The collection of data is usually referred to asthe database. A standard language for accessing relational databases is the standard querylanguage (SQL).
3. Population of the model with data and metadata from multiple years of the CCD SchoolDistrict Universe Survey.

20
4. Demonstration of the model’s utility with a commercial "front end" query tool called Cognos.
The conceptual model for the prototype system consists of components or processes that,taken together, meet the specific goals of the project. For each component or process, severalalternative commercial products or methods may be available. The benefit of the standards-basedapproach is that any other component or process that supports the same common standards mayreplace any or all of the components or processes. To illustrate this approach, the data linkingprototype can be viewed as consisting of components and processes as illustrated in Figure 5.1.
Figure 5.1
Analyst Workstation
SQL RDBMS Server(e.g., Oracle7) Network
Etc.
End User AnalysisEXCEL
End User Analysis
SAS
End User AnalysisBRIO
End User AnalysisCOGNOS
End User Analysis
NCES data sets
Transformationprocess
Warehouseimplemented
here
Star Schema Model(logical data
model)
(every possiblemeaningful linkprepared ahead
of time)
NCES DATA LINKING PROTOTYPE PROCESS
The following provides a description of each of these components and processes. Thesedescriptions are of necessity somewhat technical.
1. A work process extracts data from relevant sources (i.e., NCES survey data sets) and loads itinto a repository that is based on a standard “star-schema” or “dimensional” (the terms aresynonymous) data model. This process can be accomplished via a wide variety of tools,methods, and technologies.
2. The star-schema repository is implemented under a standard SQL accessible RDBMS. SQL
is a formal standard, controlled by ANSI (American National Standards Institute) and

21
endorsed via the National Institute for Standards and Technology (NIST) of the Departmentof Commerce as a FIPS (Federal Information Processing Standard). Examples of SQLRDBMS include Oracle7, Microsoft SQL Server, Sybase, Informix, and DB2. A star-schemarepository can be quickly and easily transferred from one SQL RDBMS to any other. Thereare no practical, standards-based alternatives to SQL RDBMS for database management.There are certain data management products that are optimized to support star-schema data“warehouses” (e.g., Red Brick, Essbase). These products purportedly offer betterperformance than standard SQL RDBMSs in support of analytical queries against a star-schema database. The use of such products was beyond the scope of this task. In any event,the star schema model is equally as portable to this class of product, so no flexibility wassacrificed.
3. Data that are implemented as a star-schema under a SQL RDBMS can be accessed via a
wide variety of end-user analytical tools (e.g. Cognos, Brio, SAS, Excel, etc.). These toolsgenerate SQL queries that are transmitted to the RDBMS over a network. The RDBMSexecutes the SQL, and returns the results (data) to the end-user tool. These tools use one (orboth) of two methods for communicating with the RDBMS. One method is through amature, reliable de jure standard technology known as ODBC (Open Data BaseConnectivity). ODBC allows any client tool that supports ODBC to communicate with anyRDBMS that supports ODBC. ODBC is currently supported by every leading RDBMSproduct (including all of those identified above), as well as by every leading vendor of datawarehousing analytical tools. (The second method is to use “native” data access drivers,i.e., to communicate directly with the RDBMS (using SQL), to avoid the processingoverhead of ODBC translations. “Native” data access generally offers better performancethan ODBC data access, however these differences are largely inconsequential for dataaccess for analytical purposes). The goal was to identify leading products that can bestillustrate the feasibility and benefits of linking survey data through a multidimensional orstar-schema data warehouse model.
In summary, the data linking prototype may be considered as consisting of a set ofcomponents, where each component can be replaced with any other of the many that support thesame basic technical standards. This mainstream standards-based approach was chosen so thatthe work products of this project will have the broadest utility and applicability toward largerNCES and Department of Education plans and goals.
5.1. ORACLE Warehouse
The first step in converting the SAS datasets into the ORACLE data warehouse was tocreate a crosswalk of the variable names and format types across all years of the CCD datasets.This crosswalk allowed us to change variable names and types so that for every year of data thesame information had the same variable name and same data type.
Related to this standardization process was the standardization of the record layout. Thevariables on the datasets were in different order, depending on year. An identical record layoutwas made for each year to reduce the burden necessary when reading the ASCII files intoORACLE.

22
The percent of students in each ethnic group (white, black, Asian, Hispanic, NativeAmerican) for each district had been calculated and added in the CCD data sets. Summing uppercents across districts would not make much sense, so these percents had to be backed out intoraw numbers. This process also had to be performed on the Percent of Children in Poverty. Thefront-end tool will allow for the calculation of all percents. For a warehouse, it is important thatall values be numerical.
The final step in SAS, prior to converting the datasets to ASCII, was to standardize somevalues in particular variables. For numeric variables such as the ethnicity variables, values of ’M’,’N’, or ’**’ have been converted to null. This is NCES’s way of indicating that data are Missing orN/A.
At this point data were converted from SAS data sets into ASCII files. These ASCII fileswere read into Oracle as a rectangular database. The rectangular database served as the startingpoint for the fact table. We then split off the dimension tables from the fact table in Oracle.
5.2. Cognos Tools
After a search of a number of commercial off-the-shelf vendors of OLAP tools, theCognos suite of tools was chosen. Cognos was selected for its quality product, as well as theirwillingness to provide unlimited technical support during the creation of a prototype warehouse.
The two main tools of the Cognos suite are PowerPlay and Impromptu. The main tool,PowerPlay, has two views - Explorer and Reporter. In PowerPlay, a three-dimensional view ofthe data, called a PowerCube, is generated from a subset of the data available on the warehouse.An MS-Access database was used to create a PowerCube with NCES data.
In PowerPlay Explorer, the three-dimensional view of the data, or PowerCube, can bemanipulated to display any of the included categorical data as rows, columns, layers (for 3 ormore dimensional tables), or filters. Any one of the continuous variables included in the 3-dimensional view are used as the data in the main body of the tables (cells). This tool allows theuser to drill up or down to any level of specificity pre-defined by the categorical data. PowerPlayis a very powerful exploratory data analysis tool. It allows for the quick calculation of the vieweddata as percents, raw numbers, or even as any of a number of graphs or charts. See Appendix Cfor sample screens showing PowerPlay Explorer output for a two-dimensional table, a three-dimensional table, and a pie chart.
PowerPlay Reporter opens with a blank screen and from there the user specifies the exactvariables wanted for rows, columns, layers, and filters. Here there are no restrictions on the typesof variables used for rows or columns or layers as there are in PowerPlay Explorer. With thistool, tables that took many runs to create for table production are quickly created on the fly by theresearcher with no programming at all. See Appendix C for sample screens showing PowerPlayReporter output for a two-dimensional and a three-dimensional table.

23
Impromptu, the other major Cognos tool, is a report writer tool. This tool allows access tothe entire warehouse of data. As it is linked directly to the warehouse, data access time is muchlonger than for either of the PowerPlay tools. The report tools available in Impromptu are muchmore limited than those available in PowerPlay. There is a simple one-way frequency, as well asa simple crosstab. The power of Impromptu lies in its ability to access the full warehouse. InPowerPlay the user is limited to a predefined set of variables. If a particular variable for ananalysis is missing from any of the PowerCubes, then the researcher needs to go back toImpromptu to conduct analysis with that tool.

24
6. Lessons Learned and Possible Next Steps
The most important part of the NCES prototype data warehouse is its scalability andportability. Any of a number of parts of the warehouse implementation can easily be built upon.The data model can be expanded to include other dimensions relevant to sample survey data,such as sample design, imputation, and weighting dimensions. Since ORACLE was used for thedatabase management system, any of a number of SQL-based relational database managementsystems can be substituted for ORACLE. The front-end tool, Cognos, can also be substitutedwith any other ODBC driven OLAP tool. The prototype shows the ability of a data warehouse toquickly deliver data in a number of user-specified formats.
A key to data warehouse flexibility is the use of a star schema model. The star schemamodel allows for any physical implementation and is flexible enough to handle operating systemand software changes. The data warehouse tools industry has progressed to the point where theyrealize that each individual tool is only a small part of the overall warehouse.
Possible next steps include expanding the data in the dimensional model to include otherNCES surveys including some sample surveys. This extension may require additional dimensiontables to reflect sampling dimensions. A metadata dictionary that grouped variables acrosssurveys into subject matter categories could also be added as a dimension into the datawarehouse. A more comprehensive warehouse should also be evaluated by the user communityfor input on user-friendliness of the access tools before final investments in data warehousesoftware are made.
25
7. References
Ballard, Chuck. Strategies to Make Your Data Warehouse a Success. TDWI Lesson From TheExperts. [On-line]. http://www.dw-institute.com/lessons/strateg.htm
Bernardi, John. Data Warehousing’s Hidden Cornerstone: Information Storage and Retrieval.TDWI Lesson From the Experts. [On-line]. http://www.dw-institute.com/lessons/infostor.htm
Bohn, Kathy (1997). Converting Data for Warehouses: Understanding the Complexities andResource Requirements Involved in a Quality Data Conversion. DBMS Online. [On-line].http://www.dbmsmag.com/9706d15.html
Carlson, Bob (1997, March 24). Secrets of Success. [On-line]. http://www.computerworld.com/search/AT-html/9703/970324SL12tekcol.html
Costa, Thierry. Three Issues in Data Warehousing. TDWI Lesson From The Experts. [On-line].http://www.dw-institute.com/lessons/3issues.htm
Greenfield, Larry (1997). The Data Warehousing Information Center Webpage. [On-line].http://pwp.starnetinc.com/larryg/index.html
The Data Warehousing Institute. Ten Mistakes to Avoid. [On-line]. http://www.dw-institute.com/papers/10mistks.htm
Department of Health and Human Services, Office of the Assistant Secretary for Planning andEvaluation (1997, June 19). Supporting State Efforts to Link Administrative Data Systems forthe Purpose of Studying the Effects of Welfare Reform on Other State and Federal PublicAssistance Programs (request for grant applications). The Federal Register, 62 (118), 33411-33417. [On-line] http://aspe.os.dhhs.gov/hsp/isp/frdata.htm
Demarest, Marc (1994). Improving Data Legibility in Decision Support Systems. [On-line].http://vista.hevanet.com/demarest/marc/schema.html, a version of this paper appeared in DBMSMagazine, 7 (5), 55, in May 1994.
Drost, Karen. Lessons Learned: Three-tiered Relational OLAP. TDWI Lesson From The Experts.[On-line]. http://www.dw-institute.com /lessons/3tier.htm
Edelstein, Herb (1997, April 21). Mining for Gold. [On-line]. http://techweb.cmp.com/iw/627/27olmin.htm
Elkholy, Marianne. Great Performance in Date Warehousing. TDWI Lesson From The Experts.[On-line]. http://www.dw-institute.com/lessons/grtperf.htm
Feldman, Steve. Experts Tell Why Data Re-engineering is Required for Data Warehousing.TDWI Lesson From The Experts. [On-line]. http://www.dw-institute.com/lessons.reeng.htm

26
Finkelstein, Robert. Understanding the Need for On-Line Analytical Servers.
Glassey-Edholm, Katherine. Keys to the Data Warehouse: The Role of query Tools in SuccessfulDate Warehouses. TDWI Lesson From The Experts. [On-line]. http://www.dw-institute.com/lessons/rolequer.htm
Hill, Neal. The Warehouse is Not the “Answer”. TDWI Lesson From The Experts. [On-line]http://www.dw-institute.com/lessons/not_answ.htm
Horrocks, Chris (1995). Data Warehouses: An Executive Information Perspective. [On-line].http://www.csc.com/about/tech_dw_arch.html
Houde, Lisa, & Saylor, Michael J. True Relational OLAP. TDWI Lesson From the Experts. [On-line]. http://www.dw-institute.com/lessons/rel_olap.htm
Imirie, Peggy. Your Data Warehouse: A Business Success or Science Project? TDWI LessonFrom The Experts. [On-line]. http://www.dw-institute.com/lessons/sciproj.htm
Kimball, Ralph (1996, August). Dangerous Preconceptions: Discovering the Liberating TruthsThat Can Lead to a Successful Data Warehouse Project. DBMS Online. [On-line].http://www.dbmsmag.com/9608d05.html
Kimball, Ralph (1996). The Data Warehouse Toolkit: Practical Techniques for BuildingDimensional Data Warehouses. John Wiley & Sons, Inc.
Kinikin, Erin. Tuning Techniques for Interactive Data Warehousing. TDWI Lesson From TheExperts. [On-line]. http://www.dw-institute.com/lessons/tuning.htm
McElreath, Jack (1995). Data Warehouses: An Architectural Perspective. [On-line].http://www.csc.com/about /tech_dw_arch.html
No author. (1996, February). Meta Group’s Karen Rubenstrunk: Standardizing Metadata. DBMSOnline DBMS Interview. [On-line]. http://www.dbmsmag.com/int9602.html
The OLAP Council (1995, January). OLAP and OLAP Server Definitions. [On-line].http://www.arborsoft.com/olap/terms.html
Porter, Patrick L., & Radcliff, Deborah (moderators) (1997, June). CIO Roundtable: DateWarehousing for Grown-ups. Software Magazine On-Line. [On-line]. http://www.sentrytech.com/sm067dw.htm
Raden, Neil (1996). Modeling the Data Warehouse. [On-line]. http://members.aol.com/nraden/iw0196_1.htm

27
Rist, Richard A. Is Data Warehousing Advancing Your Thinking? The Parallel Revolution.TDWI Lesson From The Experts. [On-line]. http://www.dw-institute.com/lessons/parallel.htm
Sachdeva, Satya (1995, December). Metadata: Guiding Users Through Disparate Data Layers.[On-line]. http://www.inquiry.com/publication…ec95/fe1205.ADT19951201FE 1205.html
Sokol, Marc. The Next Generation of Data Warehousing. TDWI Lesson From The Experts. [On-line]. http://www.dw-institute.com/lessons/nextgen.htm
Taplin, Caroline (1997, April). Abstract of Project: State Linked Data Meeting and Monograph.[On-line]. http://www.os.dhhs.gov/cgi-bin/waisgate?WAISdocID=55886 25542+3+0+0&WAISaction=retrieve
Yost, Mickey B. Using the Star Schema to Access the Historical Data of the NationalAgricultural Statistics Service. National Agricultural Statistics Service, U.S. Department ofAgriculture, Washington, DC
Welch, J.D. Business Requirements Analysis: The Missing Link of Data Warehousing. TDWILesson From The Experts. [On-line]. http://www.dw-institute.com/lessons/req anal.htm
Wood, Edward E. Jr. Middleware: The Foundation for Data Warehousing. TDWI Lesson FromThe Experts. [On-line]. http://www.dw-institute.com/lessons/middle wr.htm
Zimmer, Harry. Data Warehousing: Are You on a Path to Success or Failure? TDWI LessonFrom the Experts. [On-line]. http://www.dw-institute.com/lessons/rghtpath.htm

This page intentionally left blank.
APPENDIX A
SUMMARY OF INTERVIEWS

This page intentionally left blank.

31
Tim Newell, Sierra, (703) 522-8628, ext. 202
Has linked the CCD agency file to the Census F-33 file, but has only within years and not acrossyears. Said that Pinkerton has worked on linking IPEDS. Pinkerton took five IPEDS survey fileswithin a year and linked them. Pinkerton has also worked with linking SASS across years.Suggested contacting Marge Sterner (Pinkerton, 703-820-5571).
Tom Snyder, NCES, (202) 219-1689
He has linked multiple years with many different databases. Most of his linking was not at therecord level; he aggregates data within years and then compares across years. Said his linkingwork has been ad-hoc and that if he has any documentation it is in the form of program code.
Mentioned there is an IPEDS file with 15 years of linked data for Doctorates and the data may belocated at Pinkerton or NSF. He was not very hopeful because the person who created it has sinceretired. The biggest problem with this file was caused by schools changing their IDs.
Currently working on a school district universe database with 10 years of data. He is matchingthe Census F-33 file to CCC District data (nonfiscal). Encountering problems with the older fileshaving more mismatches. The documentation for this file is pretty far along and can be pickedup.
Also has a Lotus file which contains state level CCD enrollment by grade for 1965-92. Most ofthe merges are for one-time uses and he does not keep the data sets created. He does keep theprograms in case there is a need to recreate the data set.
Noted NSF has a fairly extensive linked data set for IPEDS called CASPER which contains mostof the major variables and it is on CD-ROM.
Reported that Nabeel Alsalam at NCES is working on linking NELS and IPEDS and that he alsohas done something with 10-15 years of CPS data, the results of which he has on CD-ROM.
Steve Owens, Governments Division, Census, (301) 457-1586
Working on the integrated sampling project. Has done some work linking SASS, CCD, andQED. Found linking SASS LEA and CCD district easy, but had some problems linking SASSand CCD at the school level because the school IDs were not matching (Comment: this could bebecause he is using the public SASS data which recoded and scrambled the school IDs). Hadproblems linking the 1987 SASS to CCD because the 1987 SASS uses APIN which is not a CCDID number. Thinks there must be a crosswalk for APIN to CCD ID somewhere but he that doesnot know where.
Had two small findings. (1) When he linked CCD and IPEDS discovered that some schools areon both files. This is not documented anywhere. This occurs because some higher education

32
institutions around the country are becoming more involved in helping to run school districts.This type of occurrence showed up most often in Colorado, Indiana, California, and Michigan.(2) Found there were some schools on both PSS and CCD. This may be caused by the use ofschool vouchers or public school districts contracting out work to private schools.
Has also done some linking of the 1990-91 SASS and the 1992-93 CCD.
Stated he does not have any products yet but that a draft report is available from Jonaki Bose(NCES).
Bill Freund, NCES, (202) 219-1373
Had a great deal of information on current and previous NCES data linking projects and manypeople to contact. Said IPEDS has been linked to all postsecondary surveys since IPEDS is theuniverse. Provided the following people to contact about the existence of this documentation andany linked files which may exist.
NPSAS: Drew Malizio, NCES, ext. 1448NSOPF: Linda Zimbler, NCES, ext. 1834B&B: Paula Knepper, NCES, ext. 1914Recent College Graduates: Peter Stowe, NCES, ext. 2099HS&B: Dennis Carroll, NCES, ext. 1774
Mentioned that Dennis Carroll knows the most about linking of all these surveys.Said that Sam Barbett linked IPEDS with the Office of Postsecondary Files (these files consist ofinstitutions eligible for student aid). Noted Census is doing some work (this is the integratedsampling scheme work) and that the F-33 (a Census file) and Census mapping files have beenlinked to the SDDB.
Arnold Reznek, Center for Economic Studies, Census, (301) 457-1856, [email protected]
The Center for Economic Studies has linked CCD across years from 1987-94 and has also linkedSASS back to CCD. The purpose of their project is to link SASS back to CCD. They are in theprocess of evaluating problems with linking the CCD data across years. They expect to have adraft report on this by June. What they are doing is very much a pilot. They do not have any datasets but they create data sets using SAS and then delete them when they are done because theyare so large. They have linked schools and LEAs (districts) over time.
When asked if they have anything the NCES project could use now he said that they do not; theyonly have the programs.
Some areas they have been exploring are having school IDs changed, and if there are any brokenlinks. They are trying to figure out what questions people may try to answer using linked data andwhat links are useful for analysis. Some of the questions under consideration are: has a school
33
changed its physical location or has a school site (location) had many different uses (what kindsof uses a facility has had over its life)? Suggested there should be an ID on the file whichidentifies the place, the physical location, of a school building.
They have also looked at measuring school quality using information from SASS and CCD. Theyhave also looked at what happens to the SASS sampled schools in the period between when theywere drawn for the sample and when they are surveyed. They are doing this by looking at theCCD data for the in-between years.
For software, they have purchased an SQL server only because this is what NCES uses. Addedthey are not database package experts.
Katherine Chandler, NCES, (202) 219-1767
For NHES they commonly link the survey files with a year. There is no longitudinal componentso linking files across years cannot be done and is meaningless. The files which have been linkedwithin years are:
1991: Adult Education and Early Childhood Participation have been linked wheninterview came out of the same household.
1993: School Readiness has been linked with School Safety, Discipline Parent, andDiscipline Youth. The Discipline Parent and the Discipline Youth files have also beenlinked.
1995: Repeat of 1991, Adult Education and Early Childhood were linked.
1996: Parental Involvement has been linked with Household Involvement. There are fourfiles which can be linked:
Parental InvolvementYouth InvolvementAdult Involvement (This can be linked with Household only)Household Involvement
The data have been analyzed by looking at the differences of parent and child perceptions,differences of civic and parent involvement with a child, and how adult education differs forthose people with and without kids.
There is documentation on the linking which has been done and it is in codebooks and manuals.It has been necessary to redefine and rename variables so they do not get overwritten on a linkeddata set.

34
It is possible to link on Zip code for the restricted file and some of this has been done by linkingto Census data (STF3B file). Also knows of linking the National Crime Victimization SurveySchool Crime Supplement with CCD and PSS school information.
Thought Data Analysis Systems (DASs) were not appropriate or useful for NHES.
Bill Fowler, NCES, (202) 219-1921
Has a data set which linked students from three waves of NELS. (Did not use dropouts, thestudent was in the same school for all three waves, and the student had complete reading andmath scores for all three waves.) to CCD school district that were not missing expenditures. Doeshave longitudinal weights on the file, these are the panel weights from NELS.
Said the files merged pretty well. Looking at achievement and expenditures, and is controllingfor socio-economic background, test scores, and school size. He will be reporting his findings toAERA.
There will be a forthcoming report on the findings. Working on this report with Jeff Owings. Hasthe SAS programs that he used to create the linked file, but does not have any documentation onresolving definitional differences. The data set created is restricted. Believes the data will lose itsusefulness if it is transformed into a public use file. Mentioned NELS is school and not districtrepresentative.
Said there are a lot of people interested in linking school data to finance data. They use this to tryand determine if money matters to students.
Identified Nakib Yasser (302-831-4227, [email protected]), an assistant professor at theUniversity of Delaware, who has linked SASS to CCD financial data.
Drew Malizio, NCES, (202) 219-1448
IPEDS is the universe file for NPSAS. Said the students are of interest (which are the NPSASdata). They do conduct longitudinal studies with NPSAS and they do have weights.Said when they encounter problems linking it is most often caused by institutional characteristicschanging. Noted IPEDS has locale codes so it is possible to match student Zip codes to localecodes and then to Census data, but they have not tried to do this.
The types of questions answered using this linked data include: the types of institutions peopleare attending, the race of students who are attending certain types of institutions, the percentageof students attending institutions requiring the ACT and/or the SAT.
They have no formal documentation. They have encountered some problems with linking thatdata because the way the sample was selected has changed. Questions on the survey have alsochanged because much survey work is done by phone now.

35
Sam Barbett, NCES, (202) 219-1592
Has done linking with IPEDS files across years. Most linking is add hoc and it is not formallydocumented. They link on unit ID which does not change. Helped Linda Zimbler (NCES) linksome IPEDS data to NSOPF. They do encounter some problems when schools merge, for whenschools disappear it is not always due to a closure, but to schools merging.
They have not linked to non-NCES data but that they are in the process of adding an ID to allowlinking to the financial files. There is a code on the IPEDS files which allows them to be linkedto the HEGIS surveys done in 1967-1985. HEGIS is the predecessor to IPEDS. Most of thedocumentation is add hoc and in programs.
Frank Johnson, NCES, (202) 219-1618
Has not done any linking of CCD across multiple years. Linking has been done within years andlinking has also been done to the Census F33 file. Within years the CCD school and LEAuniverse files can be linked. The first seven characters of the school ID are the same as the sevencharacter LEA ID. He said that the majority of the work he does is quality checking of whatCensus does.
As to longitudinal data, he said that they are universe files and that they assume they are universefiles even though they know that CCD does not contain or is missing some schools (e.g., schoolson military bases are not included in the CCD, and he does not think they get all of the BIAschools).
All of the documentation exists in the documentation package for each survey. They expand thesurveys, collecting information on more items, and they may take a previous survey item andbreak it out into several items.
An example of a problem they encounter is when a teacher is not picked up at the school levelbut shows up at the LEA level. This happens when the teacher is hired by the LEA and works atmultiple schools.
Believes it is appropriate to analyze CCD data linked both within and across years.
John Sietsema, NCES, (202) 219-1335
Said AIR has linked CCD across multiple years and the best contact at AIR is Don McLaughlin.Sietsema said that AIR did an analysis on all available CCD data on the CD-ROM. Thinks theyused the years 1986 to 1992. What AIR did was run quality and consistency checks on the data.They looked for records that were in one year and not in another. If they found a case where aschool was there one year, gone the next, and then back the next year, they tried to fill in for themissing year in the middle.

36
AIR was linking the data so they could write a report, “Trends in School District Demographics.”For this report AIR only used schools and districts that had data for each CCD year.
Suggested talking with Valerie Conley (formerly Synectics) because at Pinkerton she developed afile/program which enabled people to identify a record on CCD and then find its past history.
Said some of the problems people encounter for CCD were that some states changed local codewhen they were not supposed to. In CCD once a record is removed its ID should be removed andnot used again: if someone goes out of CCD and then comes back in, they need a new ID on re-entry.
Said the data do still exist, but thinks it may be better to start from scratch. When AIR did thisthey did it as they went along, so the documentation may not be very good.
Recommended when working with CCD to get very familiar with the data. Can check with him ifthere are any questions. Examples of questions that people overlook or misinterpret includedeleting a district record if its membership is zero. In such a case children could be assigned toanother school (a home school) or students sent to a vocational school in that district. There aresome districts which do not operate schools but pay tuition to other districts, so those studentsshow up in the other districts numbers.
Kerry Gruber, NCES, (202) 219-1461
Provided an overview of what SASS data have been linked to and what people have attempted tolink SASS data to. She said that Larry Picus (USC, 213-740-2175, Assistant Professor, NationalCenter for Finance and Productivity in USC’s Department of Education) linked the 1987-88SASS to CCD and then to the Census F-33 file. Picus linked SASS school to SASS district. Hethen linked this to CCD agency (district). And then finally he linked this to Census F-33 districtfinance data.
Said Mike Podgursky (University of Missouri, 314-882-4574, Chair of the Department ofEconomics) may also have linked SASS data as he is interested in labor market conditions forteachers. Thinks he may have some occupational data that he links with SASS.
Mike Podgursky, University of Missouri, (573) 882-4574
Has linked SASS with measures of costs of living from CCD. Has linked SASS with the USDABeal Code a 1-to-10 scale which describes how rural an area is. Has used the 1987-88 and the1993-94 SASS to judge the quality of teachers by categorizing the institutions they graduatedfrom using Barrons codes. There was an IPEDS institution code on this file. Has also linkedCensus data with SASS to compare teacher with non-teacher salaries in the area. Has usedmedian home price from Census to judge the quality of an area.

37
Questions he and other researchers were trying to answer were how teachers and nonteacherscompare. They try and find relative teacher pay compared to cost of living and other jobs in thearea.
NELS is used more than SASS because NELS has outcomes variables while SASS does not.SASS is an ideal file for linking (mapping), but it needs to have outcome measures put on it.
He has the data and has worked largely with the end product. Suggested contacting his otherresearchers to find out the specifics about the data and documentation.
Said state level achievement tests could be put on, or fringe benefit information, or possiblyspecific data on alternate jobs from BLS. Thinks SASS should be used to fill in the gaps for whatthe states fail to collect, and that SASS should focus on what drives teachers’ and administrators’decisions and asset allocation. He said that nowhere does anyone ever ask a school how manyteachers did not get their contracts renewed because they were bad teachers; did teachers turnover(leave or were fired) because they left for greener pastures or they were bad teachers.
Bill Sonnenberg. NCES, (202) 219-1580
Has linked CCD data with Census (F33 financial data) for the past 20 years. Has also done somework linking Census data with school data to determine Title I allocations. When linking thisdata used school district ID. Has not done any longitudinal analysis with this data and said themain problem people would have looking at this data over time is that no one has kept track ofchanges in school district IDs over time.
The main problem encountered in attempting to link data is that the IDs do not match. There isno documentation for his linking, all his linking was done Ad Hoc. The linking was done in SAS.He does not comment his programs and he needs to spend several hours looking at them to figureout why he wrote the code he did. He said that the only time the data was linked and documentedwas back in the 1970s for one study.
This linked data is used to analyze resources with other information such as teachers andinstructional expenditures or Title I poverty by school district. Mentioned that court cases areusing CVs more and more as a measure of disparity.
Dale Ballou, University of Massachusetts, (h) (860) 298-9964
Did not remember much of anything of the linking they have done, but did have some good ideasfor improving NCES surveys and some things that our analysis system should be able to do.
He said that in general NCES surveys need to have better geographic linking capabilities (e.g.,Zip code, area code). Has worked with follow-up surveys and that they have nongeographicinformation on teachers. There is no way to tell what labor market they left and what labormarket they went to.

38
Said in order to analyze labor market data you need to have strong geographic identifiers. Shouldmake sure that what is developed has strong geographic data linking capabilities.
Said it is very easy to find data to link in when the data are aggregated to the county and statelevels.
Peter Stowe, NCES, (202) 219-2099
Has not linked any NCES data in four to five years when he linked IPEDS with Recent CollegeGraduates (since been replaced by B&B). Did this on his own and it was not done to create anyfinal product. Said it was done Ad Hoc, was very low quality, and not designed for others to use.
Said what project will attempt to do is important for analysts. Offered some potential datasources and areas for links. Said would be beneficial to link NCES data with BLS data inparticular labor market outcomes. Over the past five to ten years people have turned more tolabor market outcomes. People are looking more at the education outcomes and how theytranslate into labor market outcomes. It used to be enough to state number of degrees earned,now want to know how and which degrees translate into jobs. Before surveys would report that Xpercent of the population received BAs now to know that X percent of the population with BAsgot what jobs.
Larry Picus, USC, (213) 740-2175
Back in 1990 linked the 1987-88 SASS to the Census F33 (Census of governments data). Said ittook them over a year to do and they had to hand check all of their links. Said that after thisexperience he would never try to do anything of this kind again. He had graduate students do theprogramming and that the quality of the file is about medium. He also said that the file may stillexist on their UNIX system. He was using these data to gauge how education resources areallocated and used.
Would like NCES and Census data in which a district can be easily matched from one file toanother. Would like a relational database which he could access (on-line) to create and downloadlinked data for analysis.
Yasser Nakib, University of Delaware, (302) 831-4227
Has a very small and specific high quality data set that he has not shared with anyone. He usedCCD as an intermediary to link NELS student level outcomes with data which states collect. Hehas done this for Florida. Basically NAEP, SASS, and NELS all have the NCES ID, while datafrom the states have a state ID. Used CCD which has both the NCES and state ID to link NELSwith the state data. Goes to the states to get the data.

39
Has no formal documentation on his programs which are all done in SPSS. Said it was hard atfirst but that now it is easy with practice. Would like to see a good connection establishedbetween NCES data and state data. Said states can produce much more detailed and usefulinformation than the federal government can ever collect.
Don McLaughlin, AIR, (415) 493-3550
Has linked CCD from 1986-87 to 1993-94 for what he classified as regular public school districtsonly (he did not use all of the CCD data). Said it is very easy to get a 95% to 99% link on ID.The file has been cleaned up to eliminate annoying anomalies and inconsistencies, such asstudent enrollments going from 100 to 1000 then back to 100.
On this linked CCD file he did a fair amount of longitudinal editing and imputation (some of thiswas done using PROC IMPUTE, a FORTRAN program he wrote). Said an ESSI contract hasbeen has proposed to develop a longitudinal CCD system, so one would only need to add the newdata and the run a program which would clean the data and make the file consistent. Said NCESwas waiting on awarding this until the prototype analysis system is done.
Has encountered the typical problems when working with the CCD data, including the closingsand mergers of districts. For the future, has concerns that CCD will not collect data on Charter orhome schools.
Said there is an appendix to a forthcoming report which describes his imputation procedures. If acopy is needed, it can be obtained from Lee Hoffman (NCES). Said the quality of the data ishigher than that of the CCD data. Also said he would be willing provide a copy of the data.Thinks it would take about $50,000 to complete the cleaning on this file.
Has also been experimenting with linking CCD, SASS, NAEP, and State Assessment data for 19states. The State Assessment data is collected by the states and is not standardized, a standardform is not used.
Don McLaughlin was contacted for a copy of his linked CCD data and the programs. Thereshould not be a problem with getting a copy of the data, but there may be some with gettingcopies of the programs. Said he did not want the programs reviewed by other people and judgedsaying what he did correctly and incorrectly. He said that in his programs there are sections ofcode he did not run and it is not apparent what code was run from looking at the programs.
Don McLaughlin asked for an e-mail request on materials. Said he has a proposal in with NCESto complete editing the data. NCES is aware that editing still needs to be completed on his databut that NCES would like us to look at his data. Likely will need to set up a billing vehicleespecially to use his data to develop the prototype.
40
Jay Chambers, AIR, (415) 493-3550 ext. 8111
Linked SASS teachers and administrators to SASS schools then to SASS LEAs then to CCDdistrict then to Census county level data (from the City County Data Book). Did this for the1987-88, 1990-91, and 1993-94 SASS surveys. He then when back and matched districts acrossyears for CCD. The only problem encountered was that some SASS teachers did not have anLEA ID, because of LEA nonresponse. He said that he had to have someone work on a crosswalkfor the three rounds of SASS to find consistent variables across all three years.
Said that when they did analysis on the file they did it within year and used the SASS teacherweight. When he analyzed the data across years he did not use any of the SASS data so it was notnecessary to use weights.
As for documentation he said that there will be a technical report released by the end of Aprilwhich will have a general description of what they did in an appendix.
Did their programming in SAS. The data still exist and a copy can be obtained if necessary.
Talked about a few other painful linkings they have done. Has a file which links each central cityin the US to its nearest district. They went through and computed the distances of every centralcity from each district in the US.
Found the distance of each district from one of the 280 or so weather stations in the US. They didthis so that they could put on climate information and see if there is a relationship betweenclimate and teacher salary. They also used data from the FBI uniform crime reports and matchedthe names of the city of the crime report to the name of the CCD school. This enabled them toattack crime data to the schools. What made the linkings so painful was that they almost had tomatch a lot of the city names by hand. The city names on the FBI data may not exactly match thecity names on the CCD data.
Valerie Conley, formerly Synectics
NSOPF has been linked to IPEDS by using the institution ID which is the first six digits of thenine digit faculty ID. They have also linked NSOPF faculty and institution data. Valerie also saidthat they have a cross walk file for NSOPF ID to IPEDS. She said that the NSOPF IPEDS linkeddata for 1992-93 is on CD-ROM, and possibly that the 1987-88 linked data may still be on themainframe.
Steve Wenck of Synectics did the link between NSOPF and IPEDS (when he was at Pinkerton)and that the code still exists.
Worked on a data product called CCD Net which was a prototype system to link CCD data bothwithin and across years from 1986 to 1992. This system can link from schools to districts tostates both within and across years. There is a users manual but that there is not documentationon the development of the executable.

41
Said that when they were doing these linkings that the main problem they had wereinconsistencies, not many so the matches and links worked very well. Said they developed rulesfor how to resolve inconsistencies but there is no documentation for this they just wrote the codeneeded to resolve the inconsistencies.
Mentioned that Speedy Express is also a data linking type of system (on NCES’s web site in“edi”).
Paula Knepper, NCES, (202) 219-1914
Has linked IPEDS with BPS, B&B, and NPSAS. Did this mostly to get institutionalcharacteristics onto student records. Has linked both within and across years. She said that themajority of the files she deals with are universe files so that there are no weighting issues; in thefew cases where there have been weighting issues she was able to use the weights from thestudent file (IPEDS).
The only major problem she encountered was institutions changing their ID’s across years. Shehas not encountered may problems caused by definitions changing across years. She said that shehas been lucky because most of her definitions have not change across years. She said that shehas no formal documentation most of it was done add hoc. She has linked her data usingFORTRAN, SPSS, SAS, COBOL, and Pascal. Some of her linked data does still exist and shesaid that some of it is good and some of it is not.
She said that the number of analyses she has done with the linked data are too numerous for herto list/remember. Most of the time she needs to link data one way to answer a question and thenlink data another way to answer another question. So there is not much continuity in the analysesthat she is doing on the linked data. Most recently she has linked B&B with IPEDS and NPSASwith IPEDS. She did these links to answer questions about graduate tuition and enrollment.
Mickey Yost, USDA National Agricultural Statistical Service (202) 720-3649
Mickey Yost, the NASS Data Warehouse Manager, said that USDA does over 800 surveys a yearcomprising over 10,000 survey items. USDA uses Red Brick for their data warehouse and thenthey use Brio and SAS as front end tools to go against it. He said that the way they have set uptheir system using Red Brick that it is impossible for users to make illogical queries. From mydiscussion with him it sound like USDA is doing exactly what NCES is moving towards doing.Mickey Yost invited us down to take a close look at what they are doing, I said that we may takehim up on it. He also said that when developing a system like this, one that allows querying ofsurvey data, it is important to know some of the ways that people will look at the data. He saidthat all of their data in SAS data sets. He added that an insignificant amount of their data is inLotus spreadsheets, but it is a tiny, tiny amount.

42
Fan Zhang, Synectics (703) 807-2306
Linked 1990-91 SASS Public School file with both the 1989-90 and 1990-91 CCD SchoolUniverse files at the school level. The linkage between the SASS and CCD files was through anidentification variable called “CCDIDSCH”. The purpose of the linkage was to adjust SASS stateestimates (in 40 states) of the number of teachers to be more consistent with the CCD estimateswhich were considered to be more accurate. SASS estimates were known to be at least 15%higher than CCD estimates of teachers in ten states because the school administrators did notreport schools in the same way in the 1990-91 SASS as in the 1990-91 CCD. For example, aschool with grades K-8 at one address might be two CCD schools - an elementary school withgrades K-6 and a middle school with grades 7 and 8 resulting in SASS reporting more gradesthan the same school had on the CCD.
A Statistical Analysis System (SAS) program was written to compare the CCD and SASSdatasets and to adjust and modify the 1990-91 SASS Public School data file. A copy of theprogram was included as Appendix B of the final report (F. Zhang, M. Saba, and B. Scanlon,CCD Adjustment to SASS, July 1994). Since the sampling frame for 1990-91 SASS was the1988-89 CCD, 155 schools in the 1990-91 SASS sample were not found in the 1990-91 CCD.When the adjustment criteria was applied to these schools, it was concluded that 29 of themneeded to be adjusted. It was necessary to then match these schools to the 1988-89 CCD toobtain the data necessary for the adjustment. There were a total of 300 schools in SASS that wereadjusted. Estimates were generated for five characteristics of schools based upon a set of rules:the number of full-time equivalent (FTE) teachers, total student enrollment, the number ofHispanic students (grades K-12), the number of students participating in extended day or before-or after-school day care, and the number of students who receive free or reduced price lunches.
Sameena Salvucci, Synectics (703) 807-2309
Selected estimates from the CCD School Universe, LEA Universe, and State Nonfiscal files werecompared across three years, 1988-89, 1989-90, and 1990-91 in order to measure the internalaccuracy of the CCD. The following counts were compared:
• Aggregated Student Counts: Comparisons were made for each state and the District ofColumbia and the U.S. Territories for each of the three years between the following pairs ofCCD surveys:
1. The School Universe and the Local Education Agency (LEA) Universe;2. The School Universe and the State Nonfiscal;3. The State Nonfiscal and the LEA Universe.
• Aggregated Full-time Equivalent (FTE) Teacher Counts: Comparisons were made for eachstate and the District of Columbia and the U.S. Territories for each of the three years betweenthe following pairs of CCD surveys:
1. The School Universe and the LEA Universe;

43
2. The School Universe and the State Nonfiscal.
Selected estimates from the 1990-91 CCD and 1990-91 SASS surveys were compared.Comparisons were made for each state and the District of Columbia and the U.S. Territories Thefollowing counts were compared:
• Aggregated/Estimated Student Counts: Comparisons were made between the following pairsof surveys:
1. The SASS School Survey and the CCD School Universe;2. The SASS Teacher Demand and Shortage (TDS) Survey and the CCD LEA Universe;3. The SASS School Survey and the CCD State Nonfiscal Survey
• Aggregated/Estimated Full-time Equivalent (FTE) Teacher Counts: Comparisons were madebetween the following pairs of surveys:
1. The SASS School Universe and the CCD School Universe;2. The SASS TDS Survey and the CCD LEA Universe;3. The SASS School Survey and the CCD State Nonfiscal Survey.
• Number of Schools: Comparisons were made between the SASS School Survey and the CCDSchool Universe survey.
• Number of LEAs: Comparisons were made between the SASS TDS Survey and LEAUniverse survey.
Statistical Analysis System (SAS) programs were written to compare estimates within CCD andbetween CCD and SASS. These self-documenting programs are still available at Synectics. Theprograms used to compare between CCD and SASS included adjustments for definitionaldifferences. The results of these comparisons are documented in detail in a final report (S.Salvucci, L. Thurgood, G. Carter, and R. Lerner, An Examination of the Quality of the CommonCore of Data, 1998).

This page intentionally left blank.

APPENDIX B
Longitudinal Editing and Imputation of CCD Data

This page intentionally left blank.

47
The specific editing and imputation steps taken by McLaughlin are described in this section.Chronologically, the 1986-87 through 1991-92 data were edited and imputed simultaneously, andthe 1992-93 and 199394 data were subsequently imputed using the values from the precedingyears. The editing and imputation was performed in the following 15 steps.
Step 1. Specify the records to be included. Identify school districts that change typefrom regular to non-regular and back, and set the type to be constant. Reported types of somedistricts in Maine, Massachusetts, California, Ohio, Virginia, and Vermont were changed insome years. (For one LEA on the Mississippi River whose state did not match its identificationcode, the variable STATE was changed.) Also, if any district has no students, no teachers, and noschools, and does not merge with any schools on the school file, in any year, delete it from thefile. This step determines the number of district records on each year’s file.
Step 2. YEARS. Create YEARS, a string with one character for each year: "Y" if thedistrict is on the district file and merges with at least one school on the school file in the year,"N" if the district is on the district file but merges with no schools on the school file in the year,and "M" if the district is not on the district file in the year.
Step 3. Number of schools. If the number of schools is missing for a district for a year,use the number from a preceding year with data. If the number is not available for any year, usethe number of records on the school file for the district. (If none, set the number of schools tozero.)
Step 4. Grade span. If high grade and low grade are missing for a year, use the previousor closest year if some year has data. Otherwise, impute from school file. If the school file gradespan is indeterminate, but there is a school, impute KG-to-12. Otherwise (if there is no school),impute as missing. Edit gradespan to remove cases in which low grade is higher than high grade-set them equal to whichever is not imputed, or if neither is, to the lower of the two.
Step 5. Number of teachers. Set spurious zeros for numbers of teachers (inMassachusetts and Michigan in 2 years) to missing. If number of teachers is missing in a districtfor a year, use the sum from the school file if there is a match. Otherwise, use a prior year’scount, or if no teacher counts are available for any year, impute a value equal to the product ofthe number of schools times the number of grades in the gradespan (i.e., one teacher per schoolper grade). If the gradespan is indeterminate, impute one teacher per school.
Step 6. Edit number of students. Replace zero or missing values for enrollment in adistrict, or values that differ from an adjacent year by both 40 and 40 percent, with positivevalues from the school file whenever available. Note that when single years were added to thefile later (i.e., 1992-93 and 1993-94), this step was repeated.
Step 7. Edit student/teacher ratio. Remove large or inconsistent student/teacher ratios(S/T). If for some year, a district’s S/T is greater than 50 or S/T is "inconsistent" with both of the2 adjacent years (by a factor of 2 or more), and the adjacent years are consistent with each other,then either set S to missing (to be imputed) or impute T directly. If S is consistent with adjacentyears but T is not (each by a 40 percent factor), impute T as the average of the two years it is
48
adjacent to. Otherwise set S to missing. One district, new in 1991-92, has number of teachersimputed from 1992-93, because its number of teachers in 1991-1992 created a student teacherratio greater than 700.
Step 8. Impute number of students. Run PROC IMPUTE to impute total students in the6 years. The imputation is BY two categories of number of schools (districts with fewer than 4schools and districts with 4 to 19 schools). No districts with more than 20 schools were missingtotal enrollment. The average number of schools and average number of teachers were used inPROC IMPUTE.
Step 9. Racial-ethnic percentages. This step imputes ethnic distributions. First, theSDDB (1990 Decennial Census, mapped onto school district boundaries) is used to obtainpercentages of each district’s child population in different ethnic groups. For 27 districts forwhich no ethnic data are available for any year on the CCD or for the SDDB, impute the averagefor districts in the same city, or if not available, from the same county. For districts with data insome years but not others, perform the edit check described below, then use PROC IMPUTE.(However, no ethnic data were available for 1986-87, and none were imputed. Ethnicdistributions for that year are not included in the report.)
Set inconsistent values to missing. These are values for districts that have values for at least 3different years, and at least one of the percents differs from the average of all years by both (a) atleast 25 percentage points and (b) at least 5 standard deviations. Also, for convenience, set thepercentages for districts with zero students to the national averages: 1.1, 6.1, 5.4, 2.2, 85.2, forAsian, black non-Hispanic, Hispanic, Native American, and white non-Hispanic, respectively.Run PROC IMPUTE with the 20 variables (four ethnic groups (excluding white non-Hispanics)for each year from 1987-88 through 1991-92). An additional run using all years’ data, but onlyimputing the last 2 years, was made to impute missing values for 1992-93 and 1993-94.
If the resulting sum of the minority percents is greater than 100 for any district, they arenormalized to 100. The white non-Hispanic percentage is set to 100 minus the sum of the otherpercentages in all districts.
Step 10. Locale code. For districts with schools with locale codes, the NCES standardprocedure for deriving district locale codes from school locale codes was used. That procedureassigns the most frequent school locale code in the district, setting ties to the more urban local,with the possible exception that for districts in which at least three-fourths of the schools havelocales spread among values of 1, 2, 3, or 4 (i.e., in metropolitan areas) but the most frequentsingle school locale is 5, 6, or 7 (i.e., large or small town or rural), the district locale would be setto the most frequent of the values 1, 2, 3, or 4. (That exception did not occur in these data.)
For districts with no locale code in any year, the most frequent locale code for districts in thesame county was used. If no data were available for the county, (a) the value 2 was imputed if themetro status code was 1; otherwise, if the number of schools was less than 5, the value 7 wasimputed. If the metro status code was 2 and there were 5 or more schools, the value 3 wasimputed; and if the metro status code was 3 and there were 5 or more schools, the value 6 wasimputed. These rules are based on minimizing the percent errors based on relations observed for

49
districts with data. Although the locale code was imputed separately by year, imputed values fora district were forced to be constant across years, equal either to the latest unimputed value or, ifthere were no unimputed values, to the modal value.
Step 11. Percent of school-aged children in poverty. (This variable was taken from theSDDB. It was therefore missing for all CCD districts not present in the SDDB.) The averagepercent poverty for districts in the same county was used to impute percent poverty. If there wereno districts in a county with data, the average value 17 percent was used.
Step 12. Counts of special education students. First, counts in all districts in stateswhich reported uniform zeroes in a year were set to missing, to be imputed. Second, if thenumber in a district exceeds the total number of students for a district, it was imputed to be equalto the total number of students.
Counts were then translated to fractions of total enrollment, and two variables were created-theaverage fractions for 1987-88 and 1988-89, and the average fractions for later years. Twoaverages were used because the values in the earlier years were not highly con-elated with thevalues in later years. PROC IMPUTE was run, with five special education percentages (one foreach year from 1987-88 through 1991-92), the two overall averages, and the percent ofenrollment that was black non-Hispanic, plus Native American, minus Asian. It was run withseparate hot deck distributions depending on whether there was a determined gradespan. Thesevariables were selected on the basis of regression model results. Imputed percentages weretranslated back into counts.
Step 13. Four types of high school completers. Data were only available for the yearsafter 1986-87, and the high school equivalence results were not available for 1991-92. First,values for 12th grade enrollment were imputed (and later dropped), in order to impute graduatesas a ratio to the preceding year’s 12th graders. Imputation of 12th grade enrollment occurred ifthe number of 12th graders was either missing, larger than the total enrollment, or less than halfof the total completers (the sum of four fields: regular diplomas, plus other diplomas, plus otherhigh school completers, plus high school equivalencies).
If the grade span was reasonable, the value of the total enrollment divided by the number ofgrades was used for 12th grade enrollment. Otherwise, if there was a 12th grade and the numberof completers was greater than zero, the grade 12 enrollment was set equal to the completers. If12th grade was not offered or the number of completers was zero, count of 12th graders wasimputed to be zero.
A small number of erroneous values for high grade in 1986-87 were set to 12. These were casesin which there were 12th graders enrolled and completers the next year but for which high gradewas less than 12. Counts of completers were transformed to ratios to preceding years’ 12thgraders,
PROC IMPUTE was run after the file was prepared. Variables included were average ethnicpercentages and percent in poverty, as well as the average over years of each of the fourcategories of completers. The latter averages, which normally would be no greater than 1, unless

50
there was substantial in-migration, were not allowed to exceed 2. Values of percentage of 12thgraders who earned regular diplomas that differed from the average (across years) by more than50 percentage points and value-, of other completion types that differed by more than 20percentage points from the average were set to missing. Hot deck distributions were selectedseparately for three sizes of 12th grade cohorts: <20, 20 to 99, and 100 or more. The results weretransformed back to counts, and three districts new in 1991-92 were separately imputed to haveno completers.
Step 14. All imputed counts on the file were rounded to integers.
Step 15. Impute Per-Pupil Revenues and Expenditures. In addition to variables on theCCD Nonfiscal survey file, two variables on the F-33 Census of Governments survey, totalrevenues and expenditures per pupil, were imputed for the four school years from 1989-90through 1992-3. For nearly every regular school district, data were present for at least one of thefour years. Districts with data in none of these, years (n = 90) were imputed as the average valueof per-pupil revenues and expenditures for districts reporting data in the specified year, bycategory. The categories for which separate mean values were computed in each of the four year,-, were large and small districts in rural and nonrural settings in each of the four standardgeographic regions. (The division of the south into two subregions used elsewhere in this reportwas not applied to this imputation.)
For all imputations, the first step was to compute mean values of per-pupil revenues andexpenditures for the 1 1,729 regular districts with F-33 data in all four of the school years (1 989-90 through 1992-93). The mean values for per-pupil revenues and expenditures were obtained foreach of four regions, separately for small and large rural and nonrural districts in each year (atotal of 129 numbers). Means were weighted by the F-33 estimate of enrollment in the year.
Next, for each pair of adjacent years, a linear regression function was estimated, using a singlepredictor (the same measure in the adjacent year), to predict. the deviation of a district’s per-pupil revenues or expenditures from the mean for that district’s region and size and localecategory. A total of 12 regressions were estimated (3 pairs of adjacent years, in each order, forrevenues and expenditures). The regressions were weighted by the F-33 estimate of enrollment inthe year being predicted. Then, for cases missing in a year, the value was imputed as the sum of(a) the mean value for the region by size by locale category for that year and (b) the estimateddeviation from the mean based on the regression.
The percentages of data that were imputed for this report range from 0.0 percent to 47.7 percent,as shown in table B2. Except for race and special education counts in the earlier years, none ofthese percentages were as great as 20 percent. Although these percentages primarily representmissing data, some imputed values are the result of setting unreasonable reported values tomissing. As a general rule, most imputed values were based on reported values for the samedistrict in different years, using the rules summarized above. It should be noted that thesepercentages pertain only to regular school districts, as used in this report. Between 1,000 and2,000 other entities are included in the Common Core of Data public school district release file.

APPENDIX C
SAMPLE COGNOS SCREEN SHOTS

This page intentionally left blank.


This page intentionally left blank.

Listing of NCES Working Papers to Date
Please contact Ruth R. Harris at (202) 219-1831 ([email protected])if you are interested in any of the following papers
Number Title Contact
94-01 (July) Schools and Staffing Survey (SASS) Papers Presentedat Meetings of the American Statistical Association
Dan Kasprzyk
94-02 (July) Generalized Variance Estimate for Schools andStaffing Survey (SASS)
Dan Kasprzyk
94-03 (July) 1991 Schools and Staffing Survey (SASS) ReinterviewResponse Variance Report
Dan Kasprzyk
94-04 (July) The Accuracy of Teachers’ Self-reports on theirPostsecondary Education: Teacher Transcript Study,Schools and Staffing Survey
Dan Kasprzyk
94-05 (July) Cost-of-Education Differentials Across the States William Fowler
94-06 (July) Six Papers on Teachers from the 1990-91 Schools andStaffing Survey and Other Related Surveys
Dan Kasprzyk
94-07 (Nov.) Data Comparability and Public Policy: New Interest inPublic Library Data Papers Presented at Meetings ofthe American Statistical Association
Carrol Kindel
95-01 (Jan.) Schools and Staffing Survey: 1994 Papers Presented atthe 1994 Meeting of the American StatisticalAssociation
Dan Kasprzyk
95-02 (Jan.) QED Estimates of the 1990-91 Schools and StaffingSurvey: Deriving and Comparing QED SchoolEstimates with CCD Estimates
Dan Kasprzyk
95-03 (Jan.) Schools and Staffing Survey: 1990-91 SASS Cross-Questionnaire Analysis
Dan Kasprzyk
95-04 (Jan.) National Education Longitudinal Study of 1988:Second Follow-up Questionnaire Content Areas andResearch Issues
Jeffrey Owings
95-05 (Jan.) National Education Longitudinal Study of 1988:Conducting Trend Analyses of NLS-72, HS&B, andNELS:88 Seniors
Jeffrey Owings

Listing of NCES Working Papers to Date--Continued
Number Title Contact
95-06 (Jan.) National Education Longitudinal Study of 1988:Conducting Cross-Cohort Comparisons Using HS&B,NAEP, and NELS:88 Academic Transcript Data
Jeffrey Owings
95-07 (Jan.) National Education Longitudinal Study of 1988:Conducting Trend Analyses HS&B and NELS:88Sophomore Cohort Dropouts
Jeffrey Owings
95-08 (Feb.) CCD Adjustment to the 1990-91 SASS: AComparison of Estimates
Dan Kasprzyk
95-09 (Feb.) The Results of the 1993 Teacher List Validation Study(TLVS)
Dan Kasprzyk
95-10 (Feb.) The Results of the 1991-92 Teacher Follow-up Survey(TFS) Reinterview and Extensive Reconciliation
Dan Kasprzyk
95-11 (Mar.) Measuring Instruction, Curriculum Content, andInstructional Resources: The Status of Recent Work
Sharon Bobbitt &John Ralph
95-12 (Mar.) Rural Education Data User’s Guide Samuel Peng
95-13 (Mar.) Assessing Students with Disabilities and LimitedEnglish Proficiency
James Houser
95-14 (Mar.) Empirical Evaluation of Social, Psychological, &Educational Construct Variables Used in NCESSurveys
Samuel Peng
95-15 (Apr.) Classroom Instructional Processes: A Review ofExisting Measurement Approaches and TheirApplicability for the Teacher Follow-up Survey
Sharon Bobbitt
95-16 (Apr.) Intersurvey Consistency in NCES Private SchoolSurveys
Steven Kaufman
95-17 (May) Estimates of Expenditures for Private K-12 Schools StephenBroughman
95-18 (Nov.) An Agenda for Research on Teachers and Schools:Revisiting NCES’ Schools and Staffing Survey
Dan Kasprzyk
96-01 (Jan.) Methodological Issues in the Study of Teachers’Careers: Critical Features of a Truly LongitudinalStudy
Dan Kasprzyk

Listing of NCES Working Papers to Date--Continued
Number Title Contact
96-02 (Feb.) Schools and Staffing Survey (SASS): 1995 Selectedpapers presented at the 1995 Meeting of the AmericanStatistical Association
Dan Kasprzyk
96-03 (Feb.) National Education Longitudinal Study of 1988(NELS:88) Research Framework and Issues
Jeffrey Owings
96-04 (Feb.) Census Mapping Project/School District Data Book Tai Phan
96-05 (Feb.) Cognitive Research on the Teacher Listing Form forthe Schools and Staffing Survey
Dan Kasprzyk
96-06 (Mar.) The Schools and Staffing Survey (SASS) for 1998-99:Design Recommendations to Inform Broad EducationPolicy
Dan Kasprzyk
96-07 (Mar.) Should SASS Measure Instructional Processes andTeacher Effectiveness?
Dan Kasprzyk
96-08 (Apr.) How Accurate are Teacher Judgments of Students’Academic Performance?
Jerry West
96-09 (Apr.) Making Data Relevant for Policy Discussions:Redesigning the School Administrator Questionnairefor the 1998-99 SASS
Dan Kasprzyk
96-10 (Apr.) 1998-99 Schools and Staffing Survey: Issues Relatedto Survey Depth
Dan Kasprzyk
96-11 (June) Towards an Organizational Database on America’sSchools: A Proposal for the Future of SASS, withcomments on School Reform, Governance, andFinance
Dan Kasprzyk
96-12 (June) Predictors of Retention, Transfer, and Attrition ofSpecial and General Education Teachers: Data fromthe 1989 Teacher Followup Survey
Dan Kasprzyk
96-13 (June) Estimation of Response Bias in the NHES:95 AdultEducation Survey
Steven Kaufman
96-14 (June) The 1995 National Household Education Survey:Reinterview Results for the Adult EducationComponent
Steven Kaufman

Listing of NCES Working Papers to Date--Continued
Number Title Contact
96-15 (June) Nested Structures: District-Level Data in the Schoolsand Staffing Survey
Dan Kasprzyk
96-16 (June) Strategies for Collecting Finance Data from PrivateSchools
StephenBroughman
96-17 (July) National Postsecondary Student Aid Study: 1996 FieldTest Methodology Report
Andrew G.Malizio
96-18 (Aug.) Assessment of Social Competence, AdaptiveBehaviors, and Approaches to Learning with YoungChildren
Jerry West
96-19 (Oct.) Assessment and Analysis of School-LevelExpenditures
William Fowler
96-20 (Oct.) 1991 National Household Education Survey(NHES:91) Questionnaires: Screener, EarlyChildhood Education, and Adult Education
Kathryn Chandler
96-21 (Oct.) 1993 National Household Education Survey(NHES:93) Questionnaires: Screener, SchoolReadiness, and School Safety and Discipline
Kathryn Chandler
96-22 (Oct.) 1995 National Household Education Survey(NHES:95) Questionnaires: Screener, EarlyChildhood Program Participation, and AdultEducation
Kathryn Chandler
96-23 (Oct.) Linking Student Data to SASS: Why, When, How Dan Kasprzyk
96-24 (Oct.) National Assessments of Teacher Quality Dan Kasprzyk
96-25 (Oct.) Measures of Inservice Professional Development:Suggested Items for the 1998-1999 Schools andStaffing Survey
Dan Kasprzyk
96-26 (Nov.) Improving the Coverage of Private Elementary-Secondary Schools
Steven Kaufman
96-27 (Nov.) Intersurvey Consistency in NCES Private SchoolSurveys for 1993-94
Steven Kaufman

Listing of NCES Working Papers to Date--Continued
Number Title Contact
96-28 (Nov.) Student Learning, Teaching Quality, and ProfessionalDevelopment: Theoretical Linkages, CurrentMeasurement, and Recommendations for Future DataCollection
Mary Rollefson
96-29 (Nov.) Undercoverage Bias in Estimates of Characteristics ofAdults and 0- to 2-Year-Olds in the 1995 NationalHousehold Education Survey (NHES:95)
Kathryn Chandler
96-30 (Dec.) Comparison of Estimates from the 1995 NationalHousehold Education Survey (NHES:95)
Kathryn Chandler
97-01 (Feb.) Selected Papers on Education Surveys: PapersPresented at the 1996 Meeting of the AmericanStatistical Association
Dan Kasprzyk
97-02 (Feb.) Telephone Coverage Bias and Recorded Interviews inthe 1993 National Household Education Survey(NHES:93)
Kathryn Chandler
97-03 (Feb.) 1991 and 1995 National Household Education SurveyQuestionnaires: NHES:91 Screener, NHES:91 AdultEducation, NHES:95 Basic Screener, and NHES:95Adult Education
Kathryn Chandler
97-04 (Feb.) Design, Data Collection, Monitoring, InterviewAdministration Time, and Data Editing in the 1993National Household Education Survey (NHES:93)
Kathryn Chandler
97-05 (Feb.) Unit and Item Response, Weighting, and ImputationProcedures in the 1993 National Household EducationSurvey (NHES:93)
Kathryn Chandler
97-06 (Feb.) Unit and Item Response, Weighting, and ImputationProcedures in the 1995 National Household EducationSurvey (NHES:95)
Kathryn Chandler
97-07 (Mar.) The Determinants of Per-Pupil Expenditures inPrivate Elementary and Secondary Schools: AnExploratory Analysis
StephenBroughman
97-08 (Mar.) Design, Data Collection, Interview Timing, and DataEditing in the 1995 National Household EducationSurvey
Kathryn Chandler
Listing of NCES Working Papers to Date--Continued
Number Title Contact
97-09 (Apr.) Status of Data on Crime and Violence in Schools:Final Report
Lee Hoffman
97-10 (Apr.) Report of Cognitive Research on the Public andPrivate School Teacher Questionnaires for the Schoolsand Staffing Survey 1993-94 School Year
Dan Kasprzyk
97-11 (Apr.) International Comparisons of Inservice ProfessionalDevelopment
Dan Kasprzyk
97-12 (Apr.) Measuring School Reform: Recommendations forFuture SASS Data Collection
Mary Rollefson
97-13 (Apr.) Improving Data Quality in NCES: Database-to-ReportProcess
Susan Ahmed
97-14 (Apr.) Optimal Choice of Periodicities for the Schools andStaffing Survey: Modeling and Analysis
Steven Kaufman
97-15 (May) Customer Service Survey: Common Core of DataCoordinators
Lee Hoffman
97-16 (May) International Education Expenditure ComparabilityStudy: Final Report, Volume I
Shelley Burns
97-17 (May) International Education Expenditure ComparabilityStudy: Final Report, Volume II, Quantitative Analysisof Expenditure Comparability
Shelley Burns
97-18 (June) Improving the Mail Return Rates of SASS Surveys: AReview of the Literature
Steven Kaufman
97-19 (June) National Household Education Survey of 1995: AdultEducation Course Coding Manual
Peter Stowe
97-20 (June) National Household Education Survey of 1995: AdultEducation Course Code Merge Files User’s Guide
Peter Stowe
97-21 (June) Statistics for Policymakers or Everything You Wantedto Know About Statistics But Thought You CouldNever Understand
Susan Ahmed
97-22 (July) Collection of Private School Finance Data:Development of a Questionnaire
StephenBroughman

Listing of NCES Working Papers to Date--Continued
Number Title Contact
97-23 (July) Further Cognitive Research on the Schools andStaffing Survey (SASS) Teacher Listing Form
Dan Kasprzyk
97-24 (Aug.) Formulating a Design for the ECLS: A Review ofLongitudinal Studies
Jerry West
97-25 (Aug.) 1996 National Household Education Survey(NHES:96) Questionnaires: Screener/Household andLibrary, Parent and Family Involvement in Educationand Civic Involvement, Youth Civic Involvement, andAdult Civic Involvement
Kathryn Chandler
97-26 (Oct.) Strategies for Improving Accuracy of PostsecondaryFaculty Lists
Linda Zimbler
97-27 (Oct.) Pilot Test of IPEDS Finance Survey Peter Stowe
97-28 (Oct.) Comparison of Estimates in the 1996 NationalHousehold Education Survey
Kathryn Chandler
97-29 (Oct.) Can State Assessment Data be Used to Reduce StateNAEP Sample Sizes?
Steven Gorman
97-30 (Oct.) ACT’s NAEP Redesign Project: Assessment Design isthe Key to Useful and Stable Assessment Results
Steven Gorman
97-31 (Oct.) NAEP Reconfigured: An Integrated Redesign of theNational Assessment of Educational Progress
Steven Gorman
97-32 (Oct.) Innovative Solutions to Intractable Large ScaleAssessment (Problem 2: Background Questionnaires)
Steven Gorman
97-33 (Oct.) Adult Literacy: An International Perspective Marilyn Binkley
97-34 (Oct.) Comparison of Estimates from the 1993 NationalHousehold Education Survey
Kathryn Chandler
97-35 (Oct.) Design, Data Collection, Interview AdministrationTime, and Data Editing in the 1996 NationalHousehold Education Survey
Kathryn Chandler
97-36 (Oct.) Measuring the Quality of Program Environments inHead Start and Other Early Childhood Programs: AReview and Recommendations for Future Research
Jerry West

Listing of NCES Working Papers to Date--Continued
Number Title Contact
97-37 (Nov.) Optimal Rating Procedures and Methodology forNAEP Open-ended Items
Steven Gorman
97-38 (Nov.) Reinterview Results for the Parent and YouthComponents of the 1996 National HouseholdEducation Survey
Kathryn Chandler
97-39 (Nov.) Undercoverage Bias in Estimates of Characteristics ofHouseholds and Adults in the 1996 NationalHousehold Education Survey
Kathryn Chandler
97-40 (Nov.) Unit and Item Response Rates, Weighting, andImputation Procedures in the 1996 NationalHousehold Education Survey
Kathryn Chandler
97-41 (Dec.) Selected Papers on the Schools and Staffing Survey:Papers Presented at the 1997 Meeting of the AmericanStatistical Association
Steve Kaufman
97-42(Jan. 1998)
Improving the Measurement of Staffing Resources atthe School Level: The Development ofRecommendations for NCES for the Schools andStaffing Survey (SASS)
Mary Rollefson
97-43 (Dec.) Measuring Inflation in Public School Costs William J. Fowler,Jr.
97-44 (Dec.) Development of a SASS 1993-94 School-LevelStudent Achievement Subfile: Using StateAssessments and State NAEP, Feasibility Study
Michael Ross
98-01 (Jan.) Collection of Public School Expenditure Data:Development of a Questionnaire
StephenBroughman
98-02 (Jan.) Response Variance in the 1993-94 Schools andStaffing Survey: A Reinterview Report
Steven Kaufman
98-03 (Feb.) Adult Education in the 1990s: A Report on the 1991National Household Education Survey
Peter Stowe
98-04 (Feb.) Geographic Variations in Public Schools’ Costs William J. Fowler,Jr.
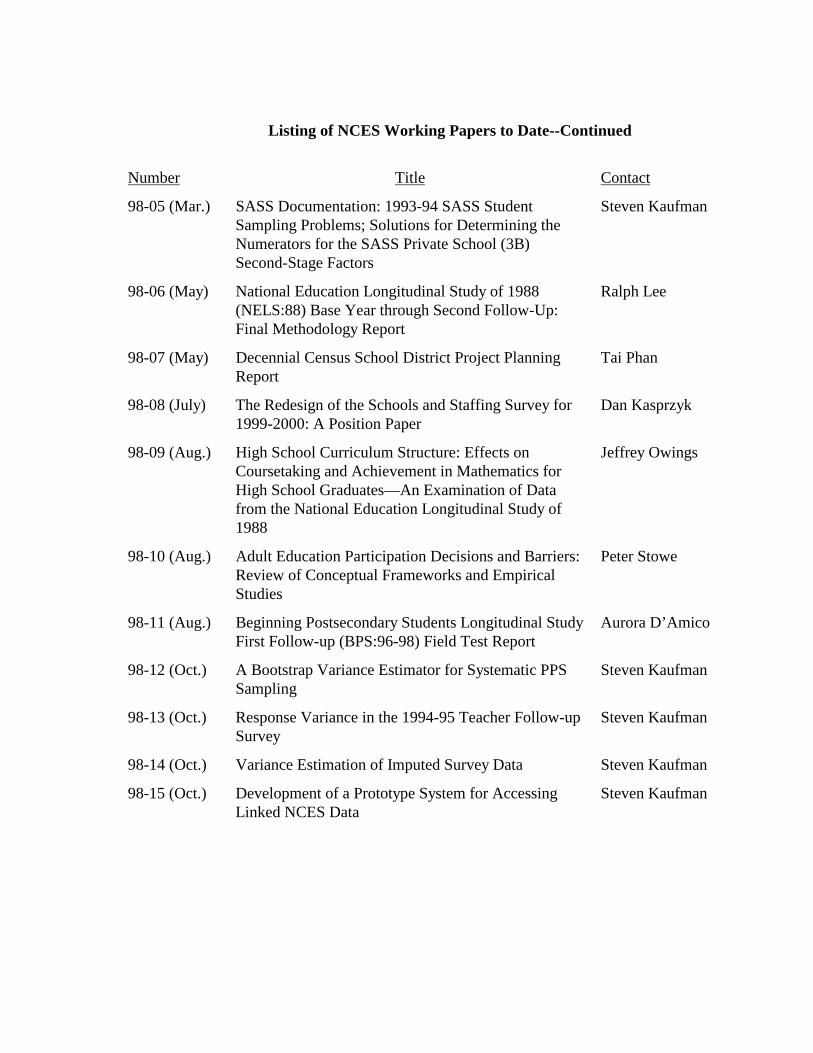
Listing of NCES Working Papers to Date--Continued
Number Title Contact
98-05 (Mar.) SASS Documentation: 1993-94 SASS StudentSampling Problems; Solutions for Determining theNumerators for the SASS Private School (3B)Second-Stage Factors
Steven Kaufman
98-06 (May) National Education Longitudinal Study of 1988(NELS:88) Base Year through Second Follow-Up:Final Methodology Report
Ralph Lee
98-07 (May) Decennial Census School District Project PlanningReport
Tai Phan
98-08 (July) The Redesign of the Schools and Staffing Survey for1999-2000: A Position Paper
Dan Kasprzyk
98-09 (Aug.) High School Curriculum Structure: Effects onCoursetaking and Achievement in Mathematics forHigh School Graduates—An Examination of Datafrom the National Education Longitudinal Study of1988
Jeffrey Owings
98-10 (Aug.) Adult Education Participation Decisions and Barriers:Review of Conceptual Frameworks and EmpiricalStudies
Peter Stowe
98-11 (Aug.) Beginning Postsecondary Students Longitudinal StudyFirst Follow-up (BPS:96-98) Field Test Report
Aurora D’Amico
98-12 (Oct.) A Bootstrap Variance Estimator for Systematic PPSSampling
Steven Kaufman
98-13 (Oct.) Response Variance in the 1994-95 Teacher Follow-upSurvey
Steven Kaufman
98-14 (Oct.) Variance Estimation of Imputed Survey Data Steven Kaufman
98-15 (Oct.) Development of a Prototype System for AccessingLinked NCES Data
Steven Kaufman