Embed Size (px)
Citation preview
National Clean
Development Strategy
2020-2050
M I N I ST R Y F O R I N N OV AT I O N
AN D T E C H N O LO G Y
I N N O V AT I O N AT W OR K
0
National Clean Development Strategy
Table of Contents
Foreword ................................................................................................................................................. 7
Executive Summary ................................................................................................................................ 8
1. Long-term Vision and Guiding Principles of the National Climate Strategy ................................... 18
2. Policy and Legal Context .................................................................................................................. 21
3. Process of Concept Development, Stakeholder Engagement and Public Consultation .................... 23
4. GHG Emissions, Policies, and Measures; Their Socioeconomic Impacts and Related Green Growth
Opportunities; and Adaptation to the Inevitable Effects of Climate Change ........................................ 24
4.1. Economy-wide trajectories for GHG emissions ........................................................... 24
4.1.1. Historical trends in GHG emissions and their current key sources ..................................... 24
4.1.2. Economy-wide decarbonization pathways until 2050 ........................................................ 26
4.1.3. Indicative milestones........................................................................................................... 35
4.2. Sector-specific pathways, policies, and measures ........................................................ 35
4.2.1. Energy ................................................................................................................................. 36
4.2.2. Industrial processes ............................................................................................................. 55
4.2.3. Agriculture .......................................................................................................................... 62
4.2.4. Land use, land use change and forestry (LULUCF) ........................................................... 68
4.2.5. Waste management ............................................................................................................. 73
4.3. Socioeconomic impacts ................................................................................................ 80
4.3.1. Avoided costs and added benefits ....................................................................................... 81
4.3.2. Job creation for the low-carbon transition .......................................................................... 83
4.3.3. Linkages with the UN Sustainable Development Goals ..................................................... 85
4.4. Adaptation policies and measures ................................................................................. 85
4.4.1. Adaptation-related climate policy planning ........................................................................ 86
4.4.2. Potential response measures and interventions ................................................................... 86
4.5. Cross cutting policies .................................................................................................... 88
4.5.1. Education and training ........................................................................................................ 88
4.5.2. Public participation, public access to information and social consciousness...................... 89
4.5.3. Full participation and cooperation of all levels of government and stakeholders ............... 90
4.5.4. Sustainable lifestyles and sustainable consumptions and production patterns.................... 91
5. Financing Climate Neutral Transition and its Economic Policy Instruments ................................... 91
5.1. Transforming economic policy for a climate neutral transition .................................... 92
5.1.1 Climate friendly budget planning ........................................................................................ 93
5.2. Financial and investment needs of climate neutrality ................................................... 94
1
5.3. The role of the financial sector in the green transition ................................................. 94
5.3.1. The need to develop domestic financial markets ................................................................ 94
5.3.2. Financing instruments in specific sectors ........................................................................... 95
5.3.3. Climate-neutral transition as a mean of attracting foreign investment ............................... 99
5.4. Possible sources and means of financing the green transition ...................................... 99
5.4.1. Guarantee institutions to promote green financing ........................................................... 100
6. Research, Development and Innovation ......................................................................................... 104
6.1. Innovative technologies and solutions ........................................................................ 104
6.1.1. Value chain maturity of critical energy technologies ....................................................... 104
6.1.2. Clean technologies and solutions in other sectors ............................................................. 110
6.2. Framework conditions for innovation ......................................................................... 114
6.3. Economic development opportunities of clean technology innovation ...................... 116
7. Governance of the Implementation, Monitoring and Revision ....................................................... 117
7.1. Governance of the implementation ............................................................................. 117
7.2.Monitoring and Monitoring, Reporting and Verification (MRV) ............................... 118
7.3. Revision ...................................................................................................................... 118
2
List of Figures
Figure 1 – Expected change of total annual net GHG emissions for the whole economy under
the three scenarios examined (CO2eq/year) ............................................................................... 9 Figure 2 – Sectoral distribution of net GHG emissions under the three scenarios examined
(CO2eq/year) ............................................................................................................................ 10 Figure 3 – Composition of final energy consumption by sector under the three scenarios
examined, 2016–2050 (PJ)....................................................................................................... 11 Figure 4 – Final energy consumption by fuel type under the three scenarios examined, 2016–
2050 (PJ) .................................................................................................................................. 12
Figure 5 – Real GDP developments under the three scenarios examined .............................. 16 Figure 6 – Carbon intensity of the Hungarian economy under the three scenario examined 16 Figure 7 – Changes in GHG emissions per capita and GDP per capita in Hungary................ 24
Figure 8 – Gross and net GHG emissions per capita of EU Member States in 2018 .............. 25 Figure 9 – Expected change of total annual net GHG emissions for the whole economy under
the three scenarios examined (CO2eq/year) ............................................................................. 28 Figure 10 – Sectoral distribution of net GHG emissions under the three scenarios examined
(CO2eq/year) ............................................................................................................................ 30
Figure 11 – Additional investment needs by sector in the LA and EA scenarios compared to
the BAU scenario ..................................................................................................................... 32 Figure 12 – Real GDP developments under the three scenarios examined ............................. 33 Figure 13 – Carbon intensity of the Hungarian economy under the three scenarios examined
.................................................................................................................................................. 33 Figure 14 – GHG emissions from energy consumption in the residential, service, and
agricultural sectors (kt CO2eq) and the change in GHG intensity (kg CO2eq/MJ), 1990–2018
.................................................................................................................................................. 37
Figure 15 – GHG emissions (kt CO2eq) from the electricity and district heating sector and
from the other energy industries, 1990–2018 .......................................................................... 37
Figure 16 – GHG emissions (kt CO2eq) and GHG intensity (kg CO2eq/MJ) from industrial
energy consumption, 1990–2018 ............................................................................................. 38 Figure 17 – GHG emissions from transport energy consumption (kt CO2eq) and GHG
intensity (kg CO2eq/MJ), 1990–2018 ...................................................................................... 39 Figure 18 – Composition of final energy consumption and the change in primary energy
consumption, 1990–2018 (PJ) ................................................................................................. 39 Figure 19 – GHG emissions in each scenario, 2016–2050 (million tons of CO2eq/year) ....... 41
Figure 20 – Composition of final energy consumption by sector in each scenario, 2016–2050
(PJ) ........................................................................................................................................... 42
Figure 21 – Final energy consumption fuel composition in each scenario, 2016–2050 (PJ) .. 43 Figure 22 – Fuel composition of primary energy use in each scenario, 2016–2050 (PJ) ........ 43 Figure 23 – Distribution of annualized additional costs by category compared to the BAU
scenario, HUF billion/year ....................................................................................................... 44 Figure 24 – Distribution of annualized additional costs of LA and EA scenarios compared to
the BAU scenario, HUF billion/year ....................................................................................... 45 Figure 25 – Difference in the net present value of the annual cumulated investment costs of
the EA and BAU scenarios in the electricity and district heating sector, HUF billion/year .... 46 Figure 26 – Difference between the net present value of the annual cumulated investment
costs of the EA and BAU scenarios in the transport sector, HUF billion/year ........................ 46
Figure 27 – Distribution of energy consumption of the household sector in the BAU and EA
scenarios ................................................................................................................................... 48
3
Figure 28 – Distribution of energy consumption in the service sector in the BAU and EA
scenarios ................................................................................................................................... 48 Figure 29 – Distribution of energy consumption in the industrial sector in the BAU and EA
scenario .................................................................................................................................... 49 Figure 30 – Distribution of energy consumption in the transport sector in the BAU and EA
scenarios ................................................................................................................................... 51 Figure 31 – Distribution of energy consumption in the transport sector according to different
modes of transport in the BAU and EA scenario ..................................................................... 52 Figure 32 – Composition of electricity consumption in the BAU and EA scenarios .............. 53 Figure 33 – Composition of installed electricity capacities in the BAU and EA scenarios .... 54
Figure 34 – Composition of electricity generation in the BAU and EA scenarios .................. 54 Figure 35 – GHG emissions from industrial processes and product use (million CO2eq/year),
2000-2018 ................................................................................................................................ 56
Figure 36 – GHG emissions from industrial processes and product use (million CO2eq/year)
by gas type, 2000-2018 ............................................................................................................ 57 Figure 37 – Expected change of GHG emissions from industrial processes and product use
between 2020 and 2050 under different................................................................................... 62 Figure 38 – Trend of agricultural GHG emissions by inventory category between 1990 and
2018.......................................................................................................................................... 63
Figure 39 – Quantitative change in the dominant sources of agricultural GHG emissions
between 1990 and 2018 ........................................................................................................... 64 Figure 40 – Expected change of GHG emissions in the agricultural sector between 2016 and
2050 in the event of the realization of the BAU and EA scenarios ......................................... 67 Figure 41 – Net CO2 and ‘non-CO2’ emissions of the LULUC sector between 2020 and 2040
.................................................................................................................................................. 69
Figure 42 – Estimated GHG emission and absorption trends in the LULUCF sector between
1985 and 2018 .......................................................................................................................... 70 Figure 43 – Expected change of forest cover and forest ecosystems by 2065 if the BAU
scenario is realized ................................................................................................................... 72 Figure 44 – GHG emissions from waste management relative to total emission in Hungary
(million tons CO2eq.capita/year) ............................................................................................. 74
Figure 45 – Forecast of GHG emissions from waste management according to the BAU and
EA scenarios ............................................................................................................................ 79
Figure 46 – Forecast of GHG emissions from waste management by subsector according to
the EA scenario ........................................................................................................................ 80
Figure 47 – Employment in the power generation sector according to different scenarios .... 84 Figure 48 – Indirect job creation in the EA and LA scenarios compared to the BAU scenario
.................................................................................................................................................. 85
4
List of Tables
Table 1 – Cost-benefit analysis for the periods 2020–2050 (additional costs and benefits
compared to the BAU scenario) ............................................................................................... 15 Table 2 – GHG emission trends without the LULUCF sector (million tons of CO2eq/year) .. 25
Table 3 – GHG reductions of sectors by 2050 compared to 1990 levels in the EA scenario
(%)............................................................................................................................................ 31 Table 4 – SWOT analysis of the Energy Sector ...................................................................... 36 Table 5 – SWOT analysis of industrial subsectors with high process emissions .................... 55 Table 6 – Distribution of GHG emissions from industrial processes and product use between
subsectors, 1990-2018 (CO2eq/year comparison) ................................................................... 58 Table 7 – SWOT analysis of the agricultural sector ................................................................ 62 Table 8 – SWOT analysis of the LULUCF sector ................................................................... 68
Table 9 – SWOT analysis of the waste sector ........................................................................ 73 Table 10 - Costs in the waste sector between 2030 and 2050 according to each scenario (HUF
billion) ...................................................................................................................................... 78 Table 11 – Cost-benefit analysis for the periods of 2020-2030 and 2020-2050 (Additional
cost and benefits compared to the BAU scenario) ................................................................... 83
Table 12 – Sectoral and specific green financing recommendations and interventions to
assess ........................................................................................................................................ 99 Table 13 – Technology readiness of low-carbon electricity value chains ............................. 106 Table 14 – Technology readiness of the CCUS value chain ................................................. 108
Table 15 – Technology readiness of the hydrogen value chain ............................................. 109 Table 16 – Technology readiness of the bioenergy value chain ............................................ 110
Table 17 - Summary of innovative technologies and solutions by sectors ........................... 114
Table 18 – Overview of Hungarian „green” RDI activities .. Hiba! A könyvjelző nem létezik.
5
Abbreviations
AFOLU agriculture, forestry and other land use
BAU Business-As-Usual
CAPEX captial expenditures
CBA cost-benefit analysis
CCUS carbon capture, utilization and storage
CNG compressed natural gas
CNG compressed natural gas
CO2eq CO2 equivalent
COP Conference of the Parties
COVID-19 SARS-CoV-2 pandemic/new type of coronavirus
CSP concentrated solar panel
DSR demand side response
EA Early Action climate neutrality scenario
EBRD European Bank for Reconstruction and Development
EEA European Environment Agency
EGD European Green Deal
EPR extended producer responsibility
ESCO Energy Services Companies
ESG Environmental, Social, and Governance aspects
ETS Emissions Trading System
EU European Union
EUA European Union Allowance
F-gases fluorocarbons
FDI Foreign Direct Investment
GDP gross domestic product
GEM Green Economy Model
GGGI Global Green Growth Institute
GHG greenhouse gas
GIS geographic information system
GW gigawatts
HIPA Hungarian Investment Promotion Agency
HMKE household-size small power plant
IEA International Energy Agency
IPCC Intergovernmental Panel on Climate Change
IPPU industrial processes and product use
IRENA International Renewable Energy Agency
KSH Central Statistical Office
LA Action climate neutrality scenario
LCOE levelized cost of energy
LED lighting technology
LiDAR Light Detection and Ranging
LNG liquefied natural gas
LPG Liquefied petroleum gas
LRF linear reduction factor
LULUCF land-use, land-use change and forestry
MEKH Hungarian Energy and Public Utility Regulatory Authority
METÁR system for the support of electricity produced from renewable energy sources
MIT Ministry for Innovation and Technology
MNB Central Bank of Hungary
MRV Monitoring, Reporting and Verification
MSR market stability reserve
NAS National Adaptation Strategy
NAT National Core Curriculum
NCCS-2 Second National Climate Change Strategy
NCDS National Clean Development Strategy
NÉBIH National Food Chain Safety Office
NECP National Energy and Climate Plan
6
NES National Energy Strategy
NFS National Forest Strategy
OPEX operating costs
OTKA Hungarian Scientific Research Fund
P2G power-to-gas
PEM polymer electrolyte membrane
PJ petajoules
PV photovoltaics
RDF refuse-drived fuel
RDI research, development and innovation
S3 Smart Specialization Strategy
SCC a szén társadalmi költségei (social cost of carbon)
SDG Sustainable Development Goal
SMEs small and medium-sized enterprises
SOFC solid oxide fuel cell
SUP Directive Single-Used Plastics Directive
SWOT analysis an analysis of strengths, weaknesses, opportunities and threats
TKP Thematic Excellence Program
TRL Technology Readiness Leve
UHV ultra-high voltage
UN United Nations
UN United Nations
UNEP United Nations Environment Programme
UNFCCC United Nations Framework Convention on Climate Change
V4 Visegrad Four Group
7
Foreword
In the Carpathian Basin in Hungary, we are experiencing the negative impacts of climate
change—the most significant environmental, economic, and social problem of our time. The
world we leave to our children and grandchildren solely depends on us. Therefore, instead of
empty words, it is time to act. Hungary and the Hungarian government are committed to
leading the way and choosing the path of action.
In January 2020, we set definite strategic targets in the field of climate change and
environmental protection. We adopted the first Climate Change Action Plan that contains
concrete measures for achieving the medium- and long-term goals of the Second National
Climate Change Strategy. The National Energy and Climate Plan for the period up to 2030
and the new National Energy Strategy both contain clear objectives for the medium term. In
the above documents, we pledge to make 90% of our electricity generation carbon-free by
2030. Besides reducing greenhouse gas emissions, we are also committed to strengthening
energy security, reinforcing climate protection, and expanding economic development.
Specific interventions of the Climate and Nature Protection Action Plan, adopted in 2020,
also support environmental protection targets. The Climate Protection Act, also adopted last
year, sets the goal to achieve climate neutrality by 2050. Finally, the National Clean
Development Strategy, presented herewith outlines the pathways toward climate neutrality
and confirms that the Hungarian government is taking concrete actions to combat climate
change. With this background, Hungary is clearly choosing a clean future that follows the
path of climate protection, energy sovereignty, and green economic development.
In the field of climate protection, Hungary pursues a reasonable and responsible policy.
Climate neutrality must be achieved in a way that ensures the security of supply, a just
transition, and economic development. The government insists that primarily the biggest
polluters need to pay the cost of the transition and that increased utility costs for families
must be avoided. Achieving the transition will not be an easy task. The following 30 years
toward climate neutrality will be challenging since we are trying to reach a goal with some
uncertainty along the way. What this transition means to our everyday lives is not yet fully
clear, but we must stay on track with our common climate goal lighting the way.
Our country starts off from a favorable position on the journey toward climate neutrality.
Hungary’s performance is outstanding compared to other European and global emission
levels. Since 2000, Hungary is one of the few countries that have managed to increase its
GDP while reducing CO2 emissions and energy consumption. The Hungarian economy has,
in fact, been able to produce a unit of GDP with 24% less greenhouse gas emissions when
compared to 2010 levels. The National Clean Development Strategy serves as a torch on the
road toward a cleaner future, economic development, and improved social welfare.
Prof. Dr. László Palkovics Minister for Innovation and Technology
8
Executive Summary
Our country has expressed efforts to support achieving climate neutrality by 2050 with the
adoption of Act no. XLIV of 2020 on Climate Protection. The National Clean Development
Strategy (NCDS or Strategy) outlines a 30-year vision of socioeconomic and technological
development pathways. Hungary’s long-term Strategy will help reach climate neutrality
targets while focusing on the well-being of the Hungarian people and ensuring the protection
of natural assets and economic development.
Hungary starts this endeavor from a strong position, being among the few countries since
1990 where the gross domestic product (GDP) has increased while CO2 emissions decreased,
by 33%. This confirms that climate protection, economic growth, and energy security are not
necessarily conflicting objectives. By this, the long-term vision contributes to the United
Nations (UN) Sustainable Development Goals (SDGs) by i) “Providing affordable, reliable,
sustainable and modern energy for everyone,” ii) “Creating sustainable consumption and
production patterns,” and iii) “Fighting climate change and its impacts with urgent response
measures.”
The NCDS was based on a wide stakeholder consultation process.
To outline the long-term trajectory, an integrated modeling approach was used to explore the
specificities of the sectors as well as the system-wide and cross-sectoral dynamics of the
decarbonization process. The development of projections was helped by applying two
models:
1) The Green Economy Model (GEM) is an intersectoral model that uses system dynamics
as its foundation. This methodology supports the estimation of the macroeconomic
outcomes of decarbonization, including the economic evaluation of several social and
environmental externalities in addition to changes in the labor market.
2) The HU-TIMES model was used iteratively with the GEM to simulate the energy sector
and to outline the emission routes of the energy and industrial sectors. TIMES is a
bottom-up, partial equilibrium optimization model used to
analyze the different pathways of energy flow within the energy subsectors.
Three main scenarios for greenhouse gas (GHG) emissions up to 2050 have been developed
and analyzed:
1) Business-as-usual (BAU) scenario: The emission trajectory of the BAU scenario follows
current trends, assuming that all existing sectoral policy strategies and measures remain in
effect, and that there will be no new interventions.
2) Late action (LA) climate neutrality scenario: This scenario aims to reduce emissions in
the energy sector at a delayed and slower pace until 2045, and then with an increased effort
until 2050. This allows the lower cost levels of low and zero emission technologies to be
exploited. The scenario assumes that, in line with the targets set in the climate act, the final
energy consumption could reach a maximum of 785 petajoules (PJ) in 2030, with the share of
renewable energy increasing to at least 21%. After 2030, non-waste sectors will be on the
lowest cost trajectory toward climate neutrality until 2050, which will result in accelerated
emission reductions by 2050, due to the postponement of investments pending on a decrease
in technology costs.
3) Early action (EA) climate neutrality scenario: the EA approach envisages achieving
climate neutrality by 2050 while considering the short- and medium-term benefits of job
9
creation and a reduction of environmental externalities, the economic potential of the first
mover, improved productivity, and higher GDP growth. The EA scenario assumes that
Hungary's final energy consumption in 2030 will be a maximum of 734 PJ, and that
renewable energy penetration will reach 27%. The emission reduction trajectories for
industry; land-use, land-use change and forestry (LULUCF); waste management; and
agriculture are the same as in the LA scenario. Between 2030 and 2050, emissions will
follow a linear trajectory to reach net zero emissions.
In both the LA and EA scenarios, carbon capture, utilization, and storage (CCUS)
technologies will become commercially viable in the energy and industrial sectors after
2030.
According to the modeling results, GHG emissions in the BAU scenario will decrease to only
56 million tons of CO2 equivalent (CO2eq)/year, from 2019 levels. Therefore, a
considerably stronger effort will be needed to achieve the 2050 climate neutrality target1
than the policies and measures currently in effect.
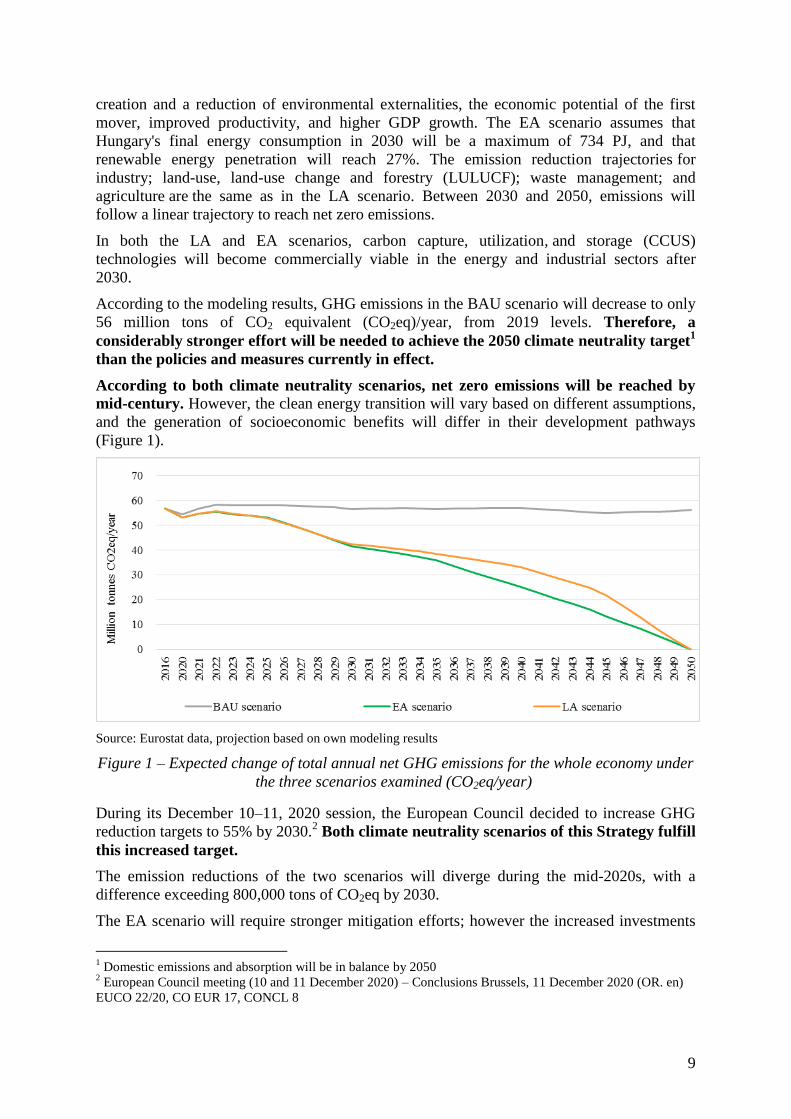
According to both climate neutrality scenarios, net zero emissions will be reached by
mid-century. However, the clean energy transition will vary based on different assumptions,
and the generation of socioeconomic benefits will differ in their development pathways
(Figure 1).
Source: Eurostat data, projection based on own modeling results
Figure 1 – Expected change of total annual net GHG emissions for the whole economy under
the three scenarios examined (CO2eq/year)
During its December 10–11, 2020 session, the European Council decided to increase GHG
reduction targets to 55% by 2030.2 Both climate neutrality scenarios of this Strategy fulfill
this increased target.
The emission reductions of the two scenarios will diverge during the mid-2020s, with a
difference exceeding 800,000 tons of CO2eq by 2030.
The EA scenario will require stronger mitigation efforts; however the increased investments
1 Domestic emissions and absorption will be in balance by 2050
2 European Council meeting (10 and 11 December 2020) – Conclusions Brussels, 11 December 2020 (OR. en)
EUCO 22/20, CO EUR 17, CONCL 8
10
will boost country’s economic growth. The end-user demand will increase including the
demand for traveling and buying household appliances.
The EA scenario follows a more gradual emission reduction pathway since the
investments serving the energy transition and decarbonization are carried out sooner.
Furthermore, the EA scenario is characterized by an accelerated larger-scale “clean”
electrification and decarbonization of the electricity system.
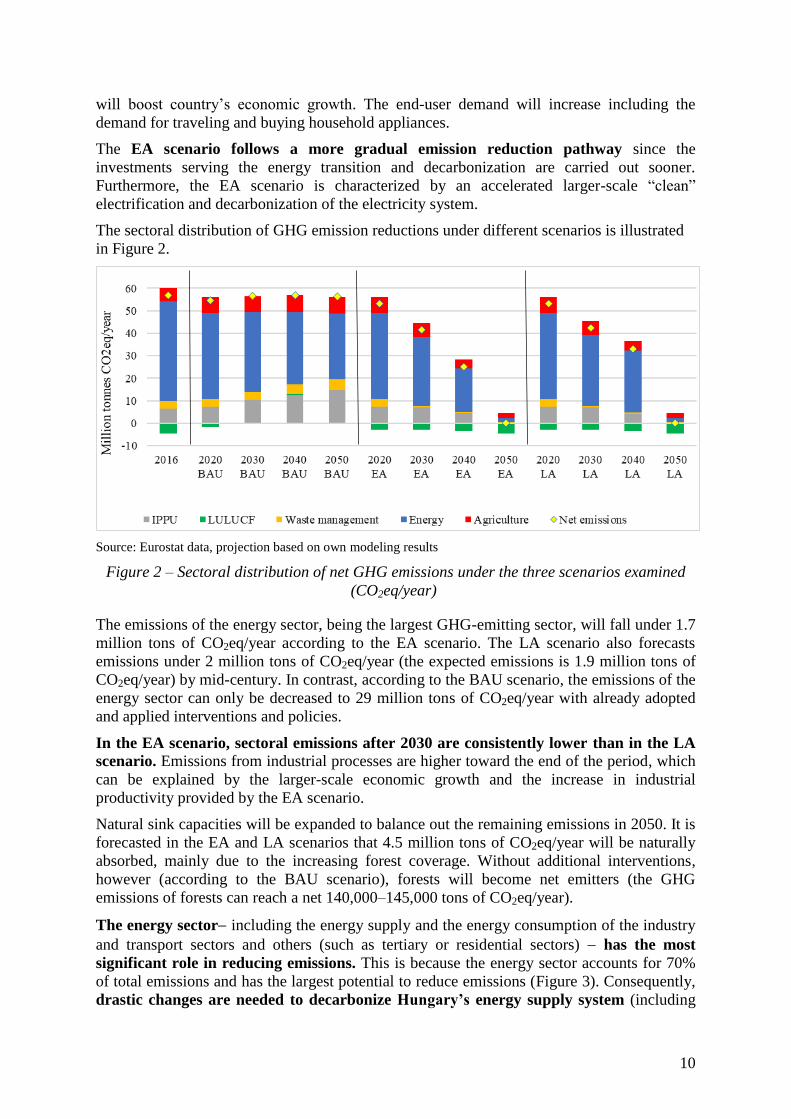
The sectoral distribution of GHG emission reductions under different scenarios is illustrated
in Figure 2.
Source: Eurostat data, projection based on own modeling results
Figure 2 – Sectoral distribution of net GHG emissions under the three scenarios examined
(CO2eq/year)
The emissions of the energy sector, being the largest GHG-emitting sector, will fall under 1.7
million tons of CO2eq/year according to the EA scenario. The LA scenario also forecasts
emissions under 2 million tons of CO2eq/year (the expected emissions is 1.9 million tons of
CO2eq/year) by mid-century. In contrast, according to the BAU scenario, the emissions of the
energy sector can only be decreased to 29 million tons of CO2eq/year with already adopted
and applied interventions and policies.
In the EA scenario, sectoral emissions after 2030 are consistently lower than in the LA
scenario. Emissions from industrial processes are higher toward the end of the period, which
can be explained by the larger-scale economic growth and the increase in industrial
productivity provided by the EA scenario.
Natural sink capacities will be expanded to balance out the remaining emissions in 2050. It is
forecasted in the EA and LA scenarios that 4.5 million tons of CO2eq/year will be naturally
absorbed, mainly due to the increasing forest coverage. Without additional interventions,
however (according to the BAU scenario), forests will become net emitters (the GHG
emissions of forests can reach a net 140,000–145,000 tons of CO2eq/year).
The energy sector including the energy supply and the energy consumption of the industry
and transport sectors and others (such as tertiary or residential sectors) has the most
significant role in reducing emissions. This is because the energy sector accounts for 70%
of total emissions and has the largest potential to reduce emissions (Figure 3). Consequently,
drastic changes are needed to decarbonize Hungary’s energy supply system (including
11
energy generation capacities) and to enable the end-user side to reduce energy
consumption and utilize clean energy technologies.
Under the BAU scenario, the final energy consumption between 2016 and 2050 can be
reduced from 733 PJ to 662 PJ. However, this would not be enough to reach climate
neutrality by 2050. The final energy consumption is forecasted to be 538 PJ and 484 PJ
by 2050 according to the EA and LA scenarios, respectively. In the former case, the
higher energy consumption is explained by the larger-scale economic growth indicated by the
EA scenario.
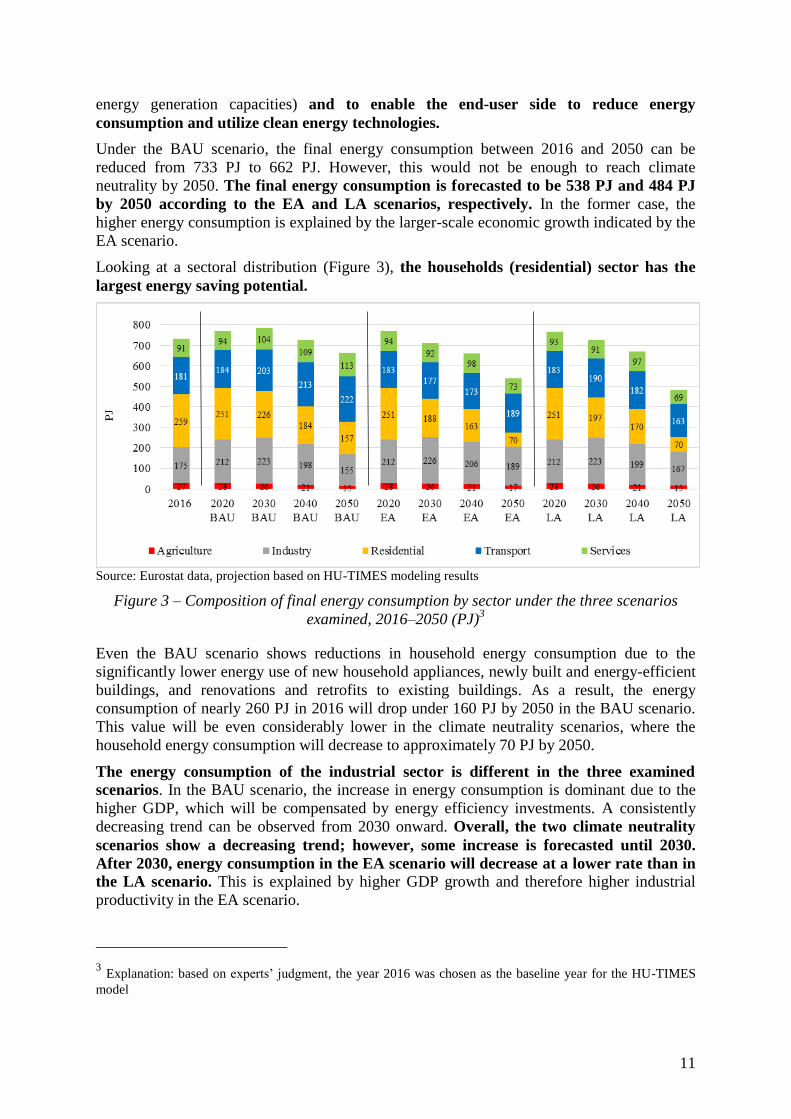
Looking at a sectoral distribution (Figure 3), the households (residential) sector has the
largest energy saving potential.
Source: Eurostat data, projection based on HU-TIMES modeling results
Figure 3 – Composition of final energy consumption by sector under the three scenarios
examined, 2016–2050 (PJ)3
Even the BAU scenario shows reductions in household energy consumption due to the
significantly lower energy use of new household appliances, newly built and energy-efficient
buildings, and renovations and retrofits to existing buildings. As a result, the energy
consumption of nearly 260 PJ in 2016 will drop under 160 PJ by 2050 in the BAU scenario.
This value will be even considerably lower in the climate neutrality scenarios, where the
household energy consumption will decrease to approximately 70 PJ by 2050.
The energy consumption of the industrial sector is different in the three examined
scenarios. In the BAU scenario, the increase in energy consumption is dominant due to the
higher GDP, which will be compensated by energy efficiency investments. A consistently
decreasing trend can be observed from 2030 onward. Overall, the two climate neutrality
scenarios show a decreasing trend; however, some increase is forecasted until 2030.
After 2030, energy consumption in the EA scenario will decrease at a lower rate than in
the LA scenario. This is explained by higher GDP growth and therefore higher industrial
productivity in the EA scenario.
3 Explanation: based on experts’ judgment, the year 2016 was chosen as the baseline year for the HU-TIMES
model
12
The service and transport sectors follow similar trajectories in the climate neutrality
scenarios. In the BAU scenario, the energy consumption of both sectors slightly increases.
The two climate neutrality scenarios show a 10–20% reduction compared to the current
levels, due to energy efficiency investments and the use of more efficient fuels.
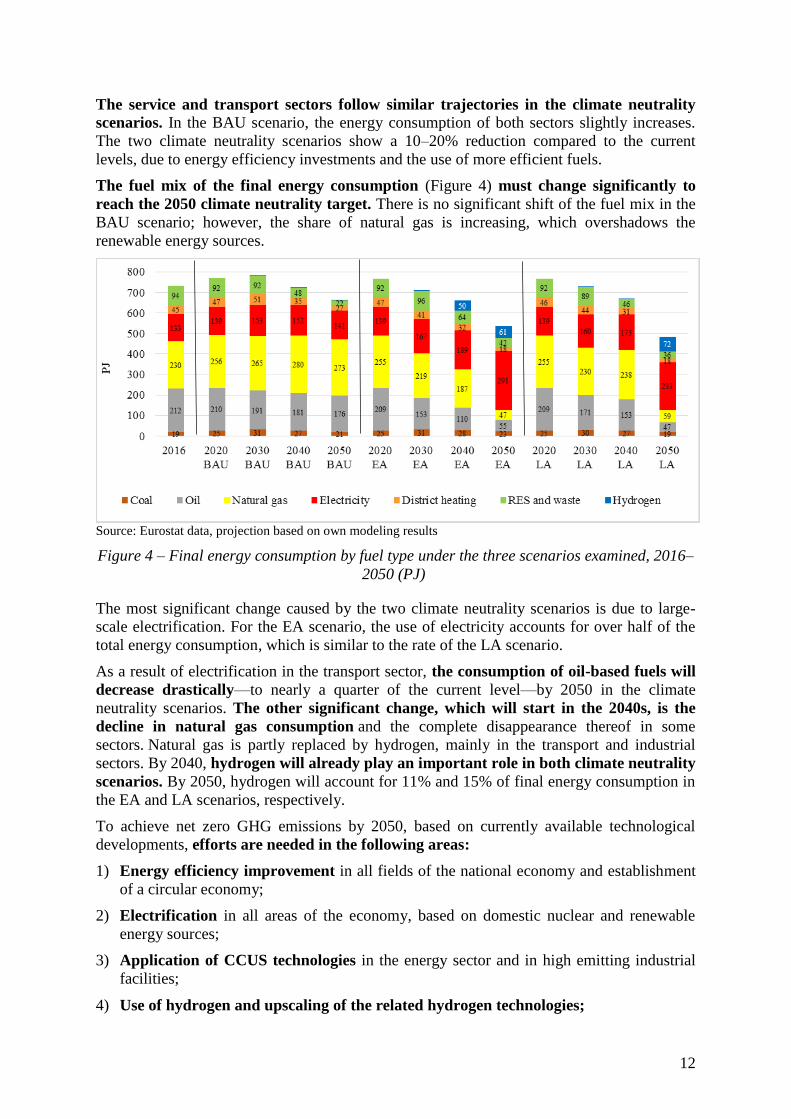
The fuel mix of the final energy consumption (Figure 4) must change significantly to
reach the 2050 climate neutrality target. There is no significant shift of the fuel mix in the
BAU scenario; however, the share of natural gas is increasing, which overshadows the
renewable energy sources.
Source: Eurostat data, projection based on own modeling results
Figure 4 – Final energy consumption by fuel type under the three scenarios examined, 2016–
2050 (PJ)
The most significant change caused by the two climate neutrality scenarios is due to large-
scale electrification. For the EA scenario, the use of electricity accounts for over half of the
total energy consumption, which is similar to the rate of the LA scenario.
As a result of electrification in the transport sector, the consumption of oil-based fuels will
decrease drastically—to nearly a quarter of the current level—by 2050 in the climate
neutrality scenarios. The other significant change, which will start in the 2040s, is the
decline in natural gas consumption and the complete disappearance thereof in some
sectors. Natural gas is partly replaced by hydrogen, mainly in the transport and industrial
sectors. By 2040, hydrogen will already play an important role in both climate neutrality
scenarios. By 2050, hydrogen will account for 11% and 15% of final energy consumption in
the EA and LA scenarios, respectively.
To achieve net zero GHG emissions by 2050, based on currently available technological
developments, efforts are needed in the following areas:
1) Energy efficiency improvement in all fields of the national economy and establishment
of a circular economy;
2) Electrification in all areas of the economy, based on domestic nuclear and renewable
energy sources;
3) Application of CCUS technologies in the energy sector and in high emitting industrial
facilities;
4) Use of hydrogen and upscaling of the related hydrogen technologies;
13
5) Sustainable utilization of bioenergy (within limits);
6) Sustainable, modern, and innovative agriculture;
7) Increase in natural sink capacities, mainly through the absorption of CO2 by forests
and maintaining forests as the most potential natural sinks as well as rethinking
economic and financial incentives for forestry; and
8) Research, development, and innovation as well as corresponding education and
training programs.
Main directions for interventions:
Support is needed for residential energy saving.
Acceleration and expansion of energy efficiency investments are necessary, especially in the
residential and commercial sectors.
Significant investments will be needed to electrify the economy, especially in the transport,
residential, and commercial sectors. One of the main conditions for the electrification of the
economy is the modernization and climate-friendly transformation of the energy sector.
Further investment will be necessary in the development of CCUS technology, as well as in
the increasing the utilization of renewable energy sources and energy storage systems.
Given carbon phase-out efforts, new investment in fossil fuel-based technologies and
industries runs the risk of rapidly depreciating assets (i.e. stranded assets).
Besides more efficient industrial processes and product use (IPPU), CCUS technologies
and alternatives to replace fossil energy sources (as raw material feedstocks) are needed in
the future. These alternatives can be carbon-free or low-carbon hydrogen and its derivatives
as well as alternative biological raw materials. Furthermore, raising public awareness to
shape consumption patterns and promoting the transition to a circular economy will have a
significant positive impact on industrial emissions.
Besides the electrification of the transport sector, expanding the application of second-
generation (or advanced) biofuels and hydrogen, as well as the more efficient usage of fuels
and the gradual decrease in using liquefied petroleum gas (LPG) on the market, will
contribute to decarbonizing and modernizing the sector.
In the agricultural sector, a reduction in fertilizer use; a more efficient use of organic
fertilizers; and a wider application of precision farming, automatization, and digitalization
will be needed. Moreover, investments targeting feeding, irrigation, and energy efficiency are
key requirements. The LULUCF sector will require significant investments to enhance net
CO2 capture (sink capacities) after 2030. This will be especially needed for measures that
improve forest adaptation, reduce logging in the medium term, and increase afforestation
efforts in the long term. For sustainable forestry, the maintenance of stocks with the most
optimal CO2 equilibrium and business model (regarding area and age structure) needs to be
emphasized. Furthermore, interventions should support maintaining and developing forests
while protecting their natural levels despite climate change impacts.
The waste sector will require significant investments to drastically reduce landfilling.
Reducing landfills, diverging waste flows, and improving waste treatment methods account
for around 90% of the emission reductions of the sector. Further investments will be needed
to reduce the amount of industrial waste, to improve municipal waste treatment, and to
14
prevent waste in the first place. To reduce emissions in waste management, additional
investments are necessary in other sectors (e.g., in the transport sector because of waste
transport, or in the energy sector because of nonrecyclable waste combustion).
Research, development, and innovation will be one of the main pillars of achieving our
energy and climate goals. Through the research development and further improvement of
new technologies and processes, as well as their market introduction, a degree of cost
reduction can be achieved to greatly help the spread of clean technologies.
The education and (re)training of professionals capable of developing and/or applying new
technologies and processes is also crucial to reach climate neutrality.
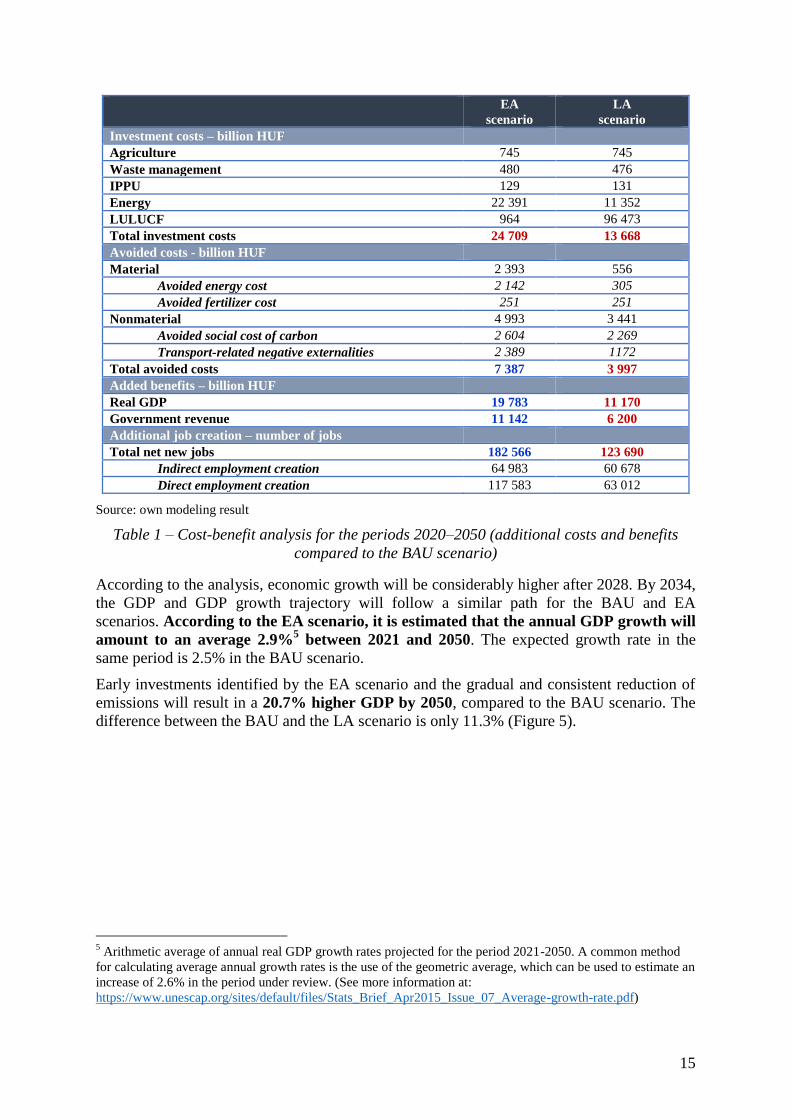
Cost-benefit analysis
In order to achieve climate neutrality by 2050, significant investments will be required in the
upcoming decades. However the possible benefits of decarbonizing the national economy
in the medium and long term will exceed these costs (Table 1).
According to the EA scenario, the investment costs will be HUF 24.7 billion4 higher
compared to the BAU scenario. Conversely, the additional cost according to the LA
scenario is HUF 13.7 billion. The difference between the two scenarios originates in the
energy sector. The additional annual investment need accounts for 4.8% of the GDP in the
EA scenario.
Based on the analysis, the full decarbonization of the Hungarian economy will also
generate significant avoided costs and added economic benefits. Assessing the period up
to 2050, the value of avoided costs and added benefits are observed to exceed the investment
costs. Moreover, these avoided costs and additional benefits will continue to occur well after
2050; however, this is not discussed in this document. Considering avoided costs and
added benefits, the EA scenario is the most cost-effective scenario.
Investing in the green transition brings macroeconomic benefits that lead to significant boost
in economic growth and create additional green jobs compared to the BAU scenario.
Based on the EA scenario, the cumulated surplus GDP amounts to approximately HUF 19.8
billion—but only HUF 11.2 billion based on the LA scenario (Table 1, Figure 5). The
government revenues are forecasted to increase by HUF 11.1 billion cumulatively in the
EA scenario (while the LA scenario shows a growth of HUF 6.2 billion).
4 1 EUR = 350 HUF
15
EA
scenario
LA
scenario
Investment costs – billion HUF
Agriculture 745 745
Waste management 480 476
IPPU 129 131
Energy 22 391 11 352
LULUCF 964 96 473
Total investment costs 24 709 13 668
Avoided costs - billion HUF
Material 2 393 556
Avoided energy cost 2 142 305
Avoided fertilizer cost 251 251
Nonmaterial 4 993 3 441
Avoided social cost of carbon 2 604 2 269
Transport-related negative externalities 2 389 1172
Total avoided costs 7 387 3 997
Added benefits – billion HUF
Real GDP 19 783 11 170
Government revenue 11 142 6 200
Additional job creation – number of jobs
Total net new jobs 182 566 123 690
Indirect employment creation 64 983 60 678
Direct employment creation 117 583 63 012
Source: own modeling result
Table 1 – Cost-benefit analysis for the periods 2020–2050 (additional costs and benefits
compared to the BAU scenario)
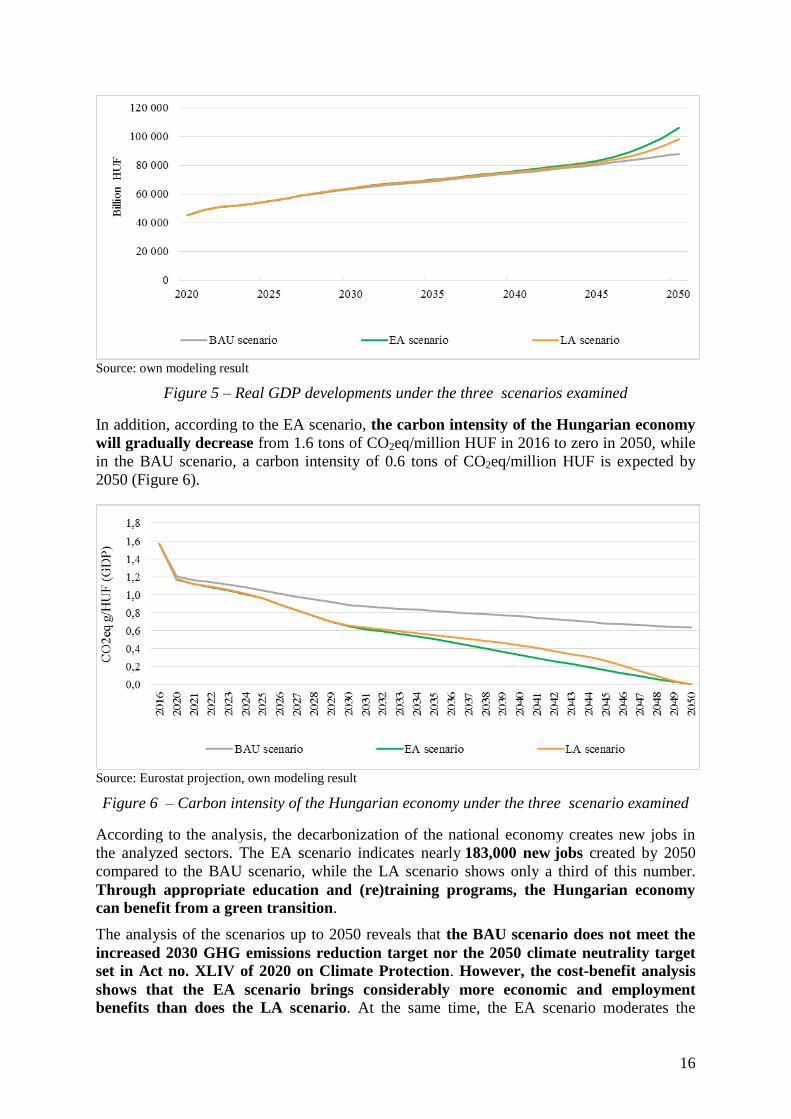
According to the analysis, economic growth will be considerably higher after 2028. By 2034,
the GDP and GDP growth trajectory will follow a similar path for the BAU and EA
scenarios. According to the EA scenario, it is estimated that the annual GDP growth will
amount to an average 2.9%5 between 2021 and 2050. The expected growth rate in the
same period is 2.5% in the BAU scenario.
Early investments identified by the EA scenario and the gradual and consistent reduction of
emissions will result in a 20.7% higher GDP by 2050, compared to the BAU scenario. The
difference between the BAU and the LA scenario is only 11.3% (Figure 5).
5 Arithmetic average of annual real GDP growth rates projected for the period 2021-2050. A common method
for calculating average annual growth rates is the use of the geometric average, which can be used to estimate an
increase of 2.6% in the period under review. (See more information at:
https://www.unescap.org/sites/default/files/Stats_Brief_Apr2015_Issue_07_Average-growth-rate.pdf)
16
Source: own modeling result
Figure 5 – Real GDP developments under the three scenarios examined
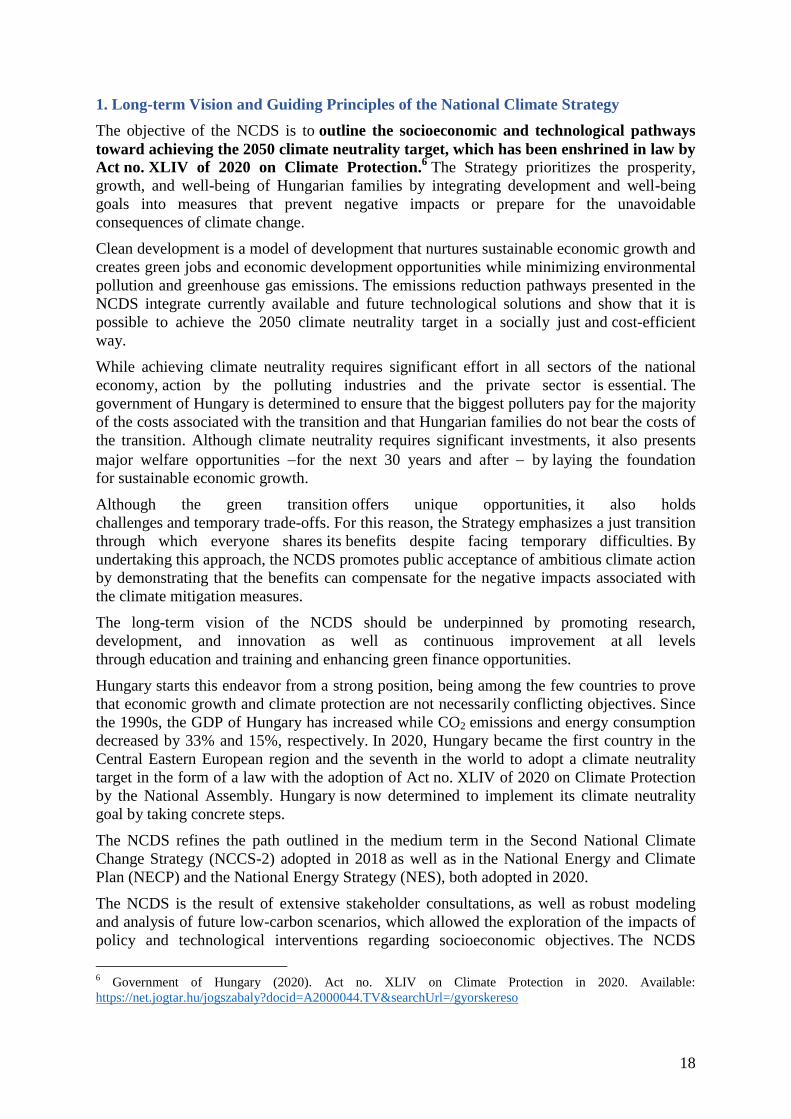
In addition, according to the EA scenario, the carbon intensity of the Hungarian economy
will gradually decrease from 1.6 tons of CO2eq/million HUF in 2016 to zero in 2050, while
in the BAU scenario, a carbon intensity of 0.6 tons of CO2eq/million HUF is expected by
2050 (Figure 6).
Source: Eurostat projection, own modeling result
Figure 6 – Carbon intensity of the Hungarian economy under the three scenario examined
According to the analysis, the decarbonization of the national economy creates new jobs in
the analyzed sectors. The EA scenario indicates nearly 183,000 new jobs created by 2050
compared to the BAU scenario, while the LA scenario shows only a third of this number.
Through appropriate education and (re)training programs, the Hungarian economy
can benefit from a green transition.
The analysis of the scenarios up to 2050 reveals that the BAU scenario does not meet the
increased 2030 GHG emissions reduction target nor the 2050 climate neutrality target
set in Act no. XLIV of 2020 on Climate Protection. However, the cost-benefit analysis
shows that the EA scenario brings considerably more economic and employment
benefits than does the LA scenario. At the same time, the EA scenario moderates the

17
uncertainty of the technological transition, which is strongly present in the LA scenario.
Furthermore, accelerating the energy transition and the early implementation of investments
can incentivize a recovery from the economic crisis caused by the COVID-19 pandemic.
Therefore, in subchapter 4.2, which presents sector-specific results, the focus will be on
a comparison between the BAU and EA scenarios.
18
1. Long-term Vision and Guiding Principles of the National Climate Strategy
The objective of the NCDS is to outline the socioeconomic and technological pathways
toward achieving the 2050 climate neutrality target, which has been enshrined in law by
Act no. XLIV of 2020 on Climate Protection.6 The Strategy prioritizes the prosperity,
growth, and well-being of Hungarian families by integrating development and well-being
goals into measures that prevent negative impacts or prepare for the unavoidable
consequences of climate change.
Clean development is a model of development that nurtures sustainable economic growth and
creates green jobs and economic development opportunities while minimizing environmental
pollution and greenhouse gas emissions. The emissions reduction pathways presented in the
NCDS integrate currently available and future technological solutions and show that it is
possible to achieve the 2050 climate neutrality target in a socially just and cost-efficient
way.
While achieving climate neutrality requires significant effort in all sectors of the national
economy, action by the polluting industries and the private sector is essential. The
government of Hungary is determined to ensure that the biggest polluters pay for the majority
of the costs associated with the transition and that Hungarian families do not bear the costs of
the transition. Although climate neutrality requires significant investments, it also presents
major welfare opportunities for the next 30 years and after by laying the foundation
for sustainable economic growth.
Although the green transition offers unique opportunities, it also holds
challenges and temporary trade-offs. For this reason, the Strategy emphasizes a just transition
through which everyone shares its benefits despite facing temporary difficulties. By
undertaking this approach, the NCDS promotes public acceptance of ambitious climate action
by demonstrating that the benefits can compensate for the negative impacts associated with
the climate mitigation measures.
The long-term vision of the NCDS should be underpinned by promoting research,
development, and innovation as well as continuous improvement at all levels
through education and training and enhancing green finance opportunities.
Hungary starts this endeavor from a strong position, being among the few countries to prove
that economic growth and climate protection are not necessarily conflicting objectives. Since
the 1990s, the GDP of Hungary has increased while CO2 emissions and energy consumption
decreased by 33% and 15%, respectively. In 2020, Hungary became the first country in the
Central Eastern European region and the seventh in the world to adopt a climate neutrality
target in the form of a law with the adoption of Act no. XLIV of 2020 on Climate Protection
by the National Assembly. Hungary is now determined to implement its climate neutrality
goal by taking concrete steps.
The NCDS refines the path outlined in the medium term in the Second National Climate
Change Strategy (NCCS-2) adopted in 2018 as well as in the National Energy and Climate
Plan (NECP) and the National Energy Strategy (NES), both adopted in 2020.
The NCDS is the result of extensive stakeholder consultations, as well as robust modeling
and analysis of future low-carbon scenarios, which allowed the exploration of the impacts of
policy and technological interventions regarding socioeconomic objectives. The NCDS
6 Government of Hungary (2020). Act no. XLIV on Climate Protection in 2020. Available:
https://net.jogtar.hu/jogszabaly?docid=A2000044.TV&searchUrl=/gyorskereso
19
provides a forward-looking vision of the transformation that is needed to meet the 2050 goal
and reduce the risk of stranded assets while avoiding carbon-intensive lock-ins in
infrastructure.
Hungary is pursuing the following long-term goals by 2050 in all key sectors:
Energy: a decarbonized clean, smart, and affordable energy sector for the
Hungarian people and businesses that is decentralized, efficient, secure,
interconnected, sovereign, and builds upon renewable and nuclear energy. The energy
sector will store and utilize any remaining carbon emissions as well as weather-
dependently produced energy. The decarbonization of the energy system will provide
green jobs and help people financially by making them “prosumers.”
Transport: a more sustainable, greener, safer, and better-connected transport
system supported by high-tech infrastructure and built on the right balance between
public and private transport while recognizing the right to choose one’s travel method.
It will incentivize low-carbon transport modes and provide cleaner air, less noise
pollution, and safer living spaces.
Industry and businesses: a climate-friendly, innovative, and knowledge-based
industry and circular economy where Hungarian high-tech and green small and
medium-sized enterprises (SMEs) have a leading role. Undertaking the transition
based on this Strategy will make Hungarian SMEs and industry the biggest winners of
the green transition, further contributing to clean economic development and the well-
being of Hungarian people.
Agriculture: a healthy, productive, climate-resilient, and high-quality agriculture
sector that ensures food security for all Hungarians and an efficient market
environment that can produce items for export. In the beginning of the 2030s, a digital
era will gain ground in zero-pollution, circular, and waste-free agriculture based on
the toolset of Agriculture 5.0 (robotics, drone-based remote sensing, and
automatization; industrial production of protein, carbohydrates, and bioactive
material; molecular farming; functional soil and manure; functional food and feed
production; and bioherbicides and biopesticides).
LULUCF: healthy and climate-resilient forests and grasslands. Similar to
agriculture, geographic information systems, digitalization, and automatization tools
of farming will gain ground. The afforestation programs will utilize more resilient
variants of local native tree species. Natural sink capacities that are essential
to achieve climate neutrality by 2050 will be maintained and expanded.
Waste: a clean country with minimum or nearly zero waste. Being the smallest
GHG-emitting sector and in line with the European Union (EU) circular economy
targets, waste should be treated as raw material and must be reduced, reused, and
recycled to the fullest extent.
Financing: a financial sector that is in harmony with sustainability and aligned
with the climate neutrality goals as well as a climate-friendly budgetary policy
that supports green economic growth. The flow of public and private funds is
consistent with the financial needs of national green and climate protection
investments.
To maximize benefits during the transition and translate the vision and values of Hungarians,
the following guiding principles lead policy-making in the respective areas:
20
Contextuality: National policies and measures shall be aligned with Hungary’s
commitments under international and EU laws.
Unity: The proposed measures shall be valid in the context of the whole Carpathian
Basin, since it forms an integrated ecosystem.
Comprehensiveness: Actions shall equally fulfill the challenges ahead of the national
environment, society, and economy. Interventions that prevent the negative impacts of
climate change are equally important as measures that foster behavior change.
Utilization of zero-carbon energy sources: A climate-neutral Hungarian
economy shall be built on the utilization of renewable energy sources as well as
on nuclear capacities. The 2050 climate neutrality target cannot be reached without
the utilization of nuclear energy, thus both sources need to be considered.
The “polluter pays” principle, environmental responsibility,
and social fairness: The costs of the green transition should be primarily borne by
the highest-emitting companies. Therefore, proposed measures should be based on
proportional and reasonable logic.
Cost-efficiency: Commitments shall be met at the lowest possible net cost to
Hungarian taxpayers, consumers, and businesses.
Maximizing benefits: The social and economic benefits for Hungary from the green
transition shall be maximized.
Sovereignty and security of supply: Only those actions and policy options that
respect Hungary’s sovereign decision-making power, energy independence, and
security of supply shall be considered.
Application of research, development, and innovation and the development of
the related education training background: Promoting technologies and low-
carbon solutions that innovatively facilitate the green transition is of key importance
to meet the climate targets. Therefore, it is essential to improve skills and knowledge
related to the development, production, installation, and application of new solutions.
Sustainability: Only those technologies and low-carbon solutions that are
ecologically and socially sustainable will be promoted.
Sustainable land use: Maintaining biologically active areas will be emphasized
while utilizing land use measures under the NCDS.
21
2. Policy and Legal Context
In 2015, under the historic Paris Agreement, all nations agreed to actively participate in
combating climate change. Article 4 of the Paris Agreement clearly states that the long-term
goal of the collective efforts is “to achieve a balance between anthropogenic emissions by
sources and removals by sinks of greenhouse gases in the second half of this century, on the
basis of equity, and in the context of sustainable development and efforts to
eradicate poverty.” This balance (i.e., climate neutrality) - based on the Special Report7 by
the Intergovernmental Panel on Climate Change (IPCC) - is to be achieved globally by 2050,
to avoid the worst effects of climate change.
According to the United Nations Environment Programme’s (UNEP) Emissions Gap Report
20198, global GHG emissions continue to rise. Over the last 10 years, GHG emissions have
risen at a rate of 1.5% per year, and in 2018, GHGs achieved record highs. Based on the
report, there is no sign of GHG emissions peaking in the next few years, and every year of
postponed peaking means that deeper and faster cuts will be required. According to the
Emissions Gap Report 2019, by 2030, global emissions would need to be 25% and 55%
lower than in 2018 to put the world on the least-cost pathway to limit global warming to
below 2˚C and 1.5°C, respectively. This could only be tackled effectively if all countries do
their fair share based on their common but differentiated responsibilities and respective
capabilities considering national circumstances as stated by the United Nations Framework
Convention on Climate Change (UNFCCC).
Hungary is leading by example, although it is only responsible for approximately 0.15% of
global GHG emissions. Hungary has adopted ambitious commitments under the first and
second commitment periods of the Kyoto Protocol, which have been significantly
overachieved. According to the 2020 National Inventory Report9, compared to the Kyoto
base year (average of 1985–87) and to the internationally used base year of 1990, Hungarian
GHG emissions in 2018 were lower by 43% and 33%, respectively. Hungary was the first
country within the EU whose parliament unanimously voted to ratify the Paris Agreement. In
December 2019, Hungary voted in favor of the EU 2050 climate neutrality target, and the
Hungarian parliament adopted Act no. XLIV of 2020 on Climate Protection, which
contains the legally binding obligation for the country to achieve climate neutrality by 2050.
This complies with the international benchmark and the necessary targets proposed by the
scientific community.
It should be noted that climate change is not the only environmental and social challenge that
the world and Hungary are facing and which requires concerted global action. To address the
most important problems under one comprehensive framework, the United Nations General
Assembly adopted the 2030 Agenda for Sustainable Development10
in 2015.
7 IPCC (2018). Global Warming of 1.5°C. An IPCC Special Report on the impacts of global warming of
1.5°C above pre-industrial levels and related global greenhouse gas emission pathways, in the context
of strengthening the global response to the threat of climate change, sustainable development, and efforts to
eradicate poverty.
Available at: https://www.ipcc.ch/site/assets/uploads/sites/2/2019/06/SR15_Full_Report_High_Res.pdf 8 UN Environment Programme (2019). Emissions Gap Report 2019. Available
at: https://wedocs.unep.org/bitstream/handle/20.500.11822/30797/EGR2019.pdf?sequence=1&isAllowed=y 9 National Meteorological Servies (2020). National Emission Inventory Report 1985-2018. Available
at: https://unfccc.int/documents/226419 10
UN General Assembly (2015). Transforming our world: the 2030 Agenda for Sustainable Development. 25
September 2015. Available at:
https://www.un.org/en/development/desa/population/migration/generalassembly/docs/globalcompact/A_RES_7
0_1_E.pdf
22
As a Member State of the EU since 2004, EU policies and legal environment are greatly
relevant in the Hungarian context. The EU has started an exemplary transition process with
the adoption of the common 2050 climate neutrality goal and the initiation of the European
Green Deal (EGD). The current EU-level environmental and climate protection regulations
in force and the ongoing elaboration and implementation of the EGD fundamentally
influence the opportunities and policy decisions of Hungary. Consequently, during the
elaboration and implementation of the NCDS, this legal context played an influential role and
is referred to in this text; however, a detailed description of it is outside the scope of this
Strategy. To present the policy and legal context of the NCDS, Annex 2 lists the most
relevant international EU-level and national documents. If the necessary innovations, energy
efficiency measures, human resources, and industrial and renewable capacities are realized in
Hungary and the EU before other regions, it will ensure a first mover advantage. The same
applies to Hungary in comparison with other EU Member States.
The Hungarian government strongly believes that enhanced regional cooperation will be key
to achieve and maintain climate neutrality. As a member of the Visegrad Four Group (V4) -
alongside Czechia, Poland, and Slovakia Hungary is planning to reinforce its climate and
environmentally related efforts within the group to determine effective and mutually
beneficial local and regional policies and measures.
23
3. Process of Concept Development, Stakeholder Engagement and Public Consultation
The NCDS was based on a wide stakeholder consultation process involving professional
and civil society groups and organizations. The responsible entity for the elaboration of
the long-term Strategy was the Ministry for Innovation and Technology (MIT), which deeply
involved the relevant ministries and other governmental and nongovernmental actors in the
process of developing this document. The most important consultation forum within the
government was the Interministerial Working Group on Climate Change. The government
reached out broadly and inclusively to public and key stakeholders. MIT carried out an online
public consultation November 18–25, 2019, which consisted of a survey on the government
website targeting all Hungarians. More than 200,000 answers were received, and the
proposals contributed to the NCDS. A detailed summary of the public consultation outcomes
was shared on the government website.
The Hungarian government adopted a draft version of the present long-term concept in
January 2020, which was available on the websites of the government and the European
Commission. Based on this draft, MIT continued and broadened the discussion on the NCDS
throughout 2020 by organizing the so-called “Climate Breakfasts”. Through this online event
series, stakeholders from the private sector, financial institutions, and civil society groups
including youth organizations provided contributions on the national climate neutrality target
and associated challenges, opportunities, and needs. The detailed written proposals of the
stakeholders have been incorporated into the final version of the Strategy.
MIT also involved the Global Green Growth Institute (GGGI) as an independent international
strategic advisor in the process and utilized GGGI’s broad experience in formulating country-
level clean and green growth strategies. Under the framework of this cooperation, three
consultation workshops have been organized to validate the modeling results and
discuss sectoral policies and priorities. A comprehensive list of the consultations carried
out can be found in Annex 3, whereas a description of the stakeholder engagement and public
involvement in the future revisions of the NCDS can be found in Chapter 7.
Stakeholder consultations
(Annex 7 contains the main suggestions for the strategic environmental assessment of the NCDS based on the
Government Regulation 2/2005 (I. 11.))
The elaboration of economy-wide and sectoral decarbonization pathways was partly based on different
stakeholder inputs:
i) Consultations with the representatives of the private sector and civil society groups were carried out within
the framework of the „Climate Breakfasts”. This online event-series made it possible for sectoral actors to
share their views and best practices. The inputs provided were taken into account during the modelling of
low carbon development scenarios of the NCDS.
ii) Under the development of the NCDS, three consultative workshops were organized where different areas of
expertise and the academia had the opportunity to share their views of the modelling as well as to validate
the low-carbon scenarios.
24
4. GHG Emissions, Policies, and Measures; Their Socioeconomic Impacts and Related
Green Growth Opportunities; and Adaptation to the Inevitable Effects of Climate
Change
4.1. Economy-wide trajectories for GHG emissions
4.1.1. Historical trends in GHG emissions and their current key sources
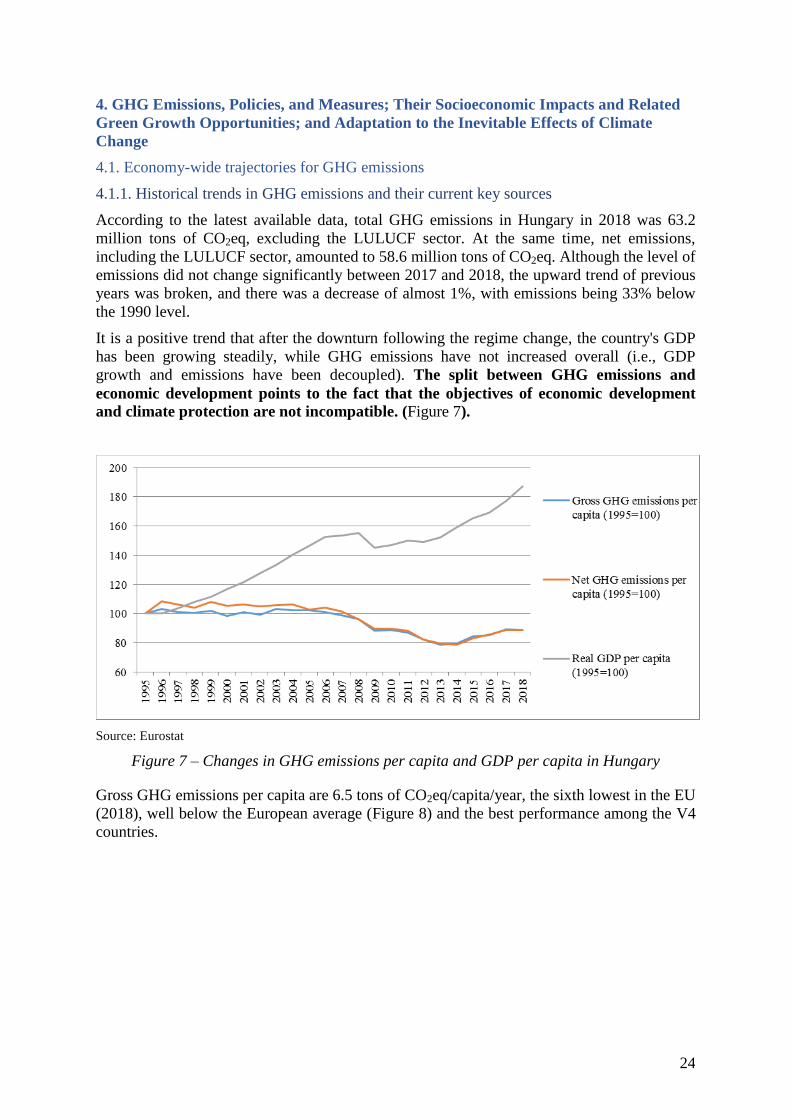
According to the latest available data, total GHG emissions in Hungary in 2018 was 63.2
million tons of CO2eq, excluding the LULUCF sector. At the same time, net emissions,
including the LULUCF sector, amounted to 58.6 million tons of CO2eq. Although the level of
emissions did not change significantly between 2017 and 2018, the upward trend of previous
years was broken, and there was a decrease of almost 1%, with emissions being 33% below
the 1990 level.
It is a positive trend that after the downturn following the regime change, the country's GDP
has been growing steadily, while GHG emissions have not increased overall (i.e., GDP
growth and emissions have been decoupled). The split between GHG emissions and
economic development points to the fact that the objectives of economic development
and climate protection are not incompatible. (Figure 7).
Source: Eurostat
Figure 7 – Changes in GHG emissions per capita and GDP per capita in Hungary
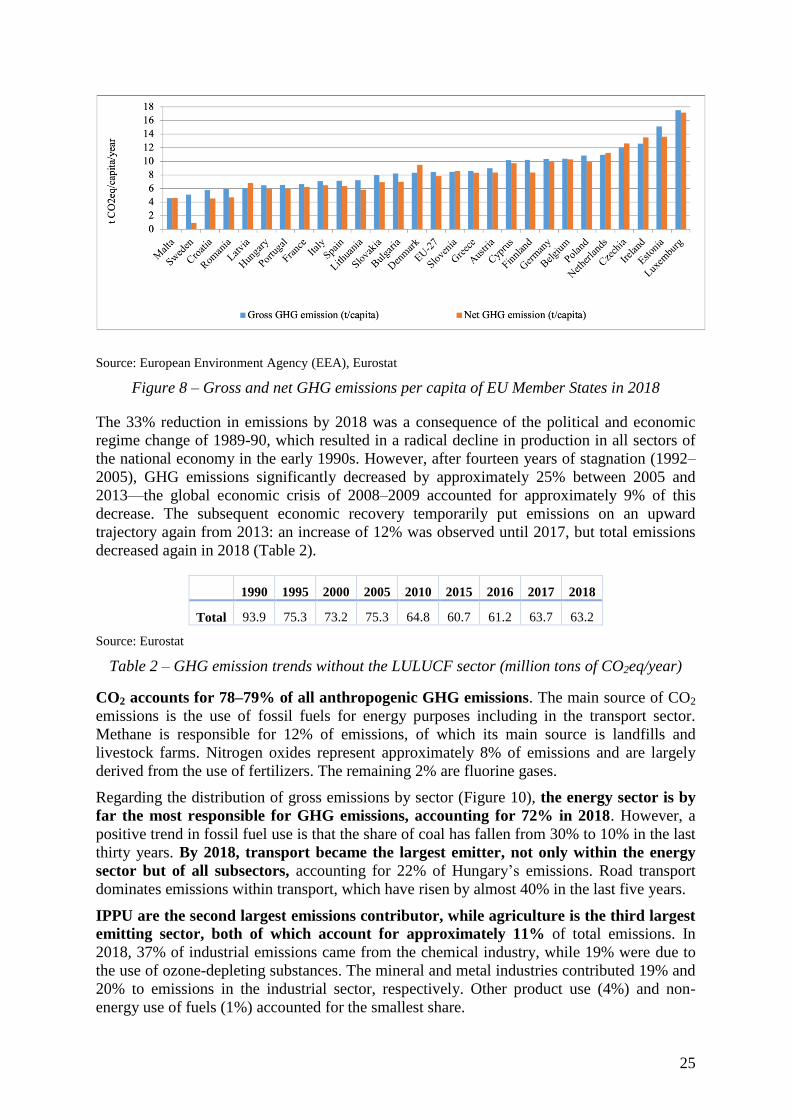
Gross GHG emissions per capita are 6.5 tons of CO2eq/capita/year, the sixth lowest in the EU
(2018), well below the European average (Figure 8) and the best performance among the V4
countries.
25
Source: European Environment Agency (EEA), Eurostat
Figure 8 – Gross and net GHG emissions per capita of EU Member States in 2018
The 33% reduction in emissions by 2018 was a consequence of the political and economic
regime change of 1989-90, which resulted in a radical decline in production in all sectors of
the national economy in the early 1990s. However, after fourteen years of stagnation (1992–
2005), GHG emissions significantly decreased by approximately 25% between 2005 and
2013—the global economic crisis of 2008–2009 accounted for approximately 9% of this
decrease. The subsequent economic recovery temporarily put emissions on an upward
trajectory again from 2013: an increase of 12% was observed until 2017, but total emissions
decreased again in 2018 (Table 2).
1990 1995 2000 2005 2010 2015 2016 2017 2018
Total 93.9 75.3 73.2 75.3 64.8 60.7 61.2 63.7 63.2
Source: Eurostat
Table 2 – GHG emission trends without the LULUCF sector (million tons of CO2eq/year)
CO2 accounts for 78–79% of all anthropogenic GHG emissions. The main source of CO2
emissions is the use of fossil fuels for energy purposes including in the transport sector.
Methane is responsible for 12% of emissions, of which its main source is landfills and
livestock farms. Nitrogen oxides represent approximately 8% of emissions and are largely
derived from the use of fertilizers. The remaining 2% are fluorine gases.
Regarding the distribution of gross emissions by sector (Figure 10), the energy sector is by
far the most responsible for GHG emissions, accounting for 72% in 2018. However, a
positive trend in fossil fuel use is that the share of coal has fallen from 30% to 10% in the last
thirty years. By 2018, transport became the largest emitter, not only within the energy
sector but of all subsectors, accounting for 22% of Hungary’s emissions. Road transport
dominates emissions within transport, which have risen by almost 40% in the last five years.
IPPU are the second largest emissions contributor, while agriculture is the third largest
emitting sector, both of which account for approximately 11% of total emissions. In
2018, 37% of industrial emissions came from the chemical industry, while 19% were due to
the use of ozone-depleting substances. The mineral and metal industries contributed 19% and
20% to emissions in the industrial sector, respectively. Other product use (4%) and non-
energy use of fuels (1%) accounted for the smallest share.
26
The share of agriculture in total emissions has not changed significantly in the last 30
years (10–11%). The waste sector accounted for the smallest share of emissions (5%),
but overall, this sector alone has increased GHG emissions since 1985 by a total of 7%.
The LULUCF sector varies greatly from year to year, mainly due to natural processes.
Between 1990 and 2018, the sector removed an average of 3.8 million tons of CO2eq per year
from the atmosphere. In 2018, this amounted to 4.7 million tons, which is about 7% of the
gross emissions. This was largely due to forests’ sequestration.
4.1.2. Economy-wide decarbonization pathways until 2050
Achieving climate neutrality by 2050 will require significant investment in all sectors of
the economy in the coming decades. However, the medium- and long-term benefits of
decarbonizing the national economy outweigh these costs. Investing in low-carbon
technologies and infrastructure will not only contribute to the 2050 climate neutrality goal but
also to other national development goals, including environmental sustainability, security of
energy supply, and the health and well-being of the Hungarian people.
The lessons of the crisis caused by the COVID-19 pandemic clearly illustrate that it is more
economically advantageous to develop prevention strategies than to do costly repairs for the
damage caused retrospectively. Early action to reduce GHG emissions is far more beneficial
than bearing the material consequences of climate change later.
The identification of different pathways to climate neutrality in 2050 is based on
comprehensive integrated modeling across the economy. A wide range of stakeholders have
been involved in the modeling and conceptualization process, including experts from
ministries and background institutions, as well as representatives of the private sector,
covering all sectors. The consultations carried out are presented in Annex 3.
To outline the long-term trajectory, an integrated modeling approach was used to explore the
specificities of the sectors and the system-wide and cross-sectoral dynamics of the
decarbonization process:
The GEM is an intersectoral model that uses Systems Thinking and System
Dynamics as its foundations. This integrated model - which considers the
interlinkages existing between populations, economic activity, and environmental
outcomes - has been customized for Hungary for the assessment of various economy-
wide emission reduction pathways. Therefore, it supports the estimation
of the macroeconomic outcomes of decarbonization, including the economic
valuation of several social and environmental externalities, in addition to job gains
and losses.
The HU-TIMES model was used iteratively with the GEM to model the energy
sector and to outline the emission routes of the energy and industrial sectors. TIMES
is a bottom-up, partial equilibrium optimization model used to
analyze the different pathways of energy flow within the energy subsectors
(i.e., transformation, industry, commercial and residential, agriculture, and transport
sectors) by taking into consideration the assumptions for exogenous demand for all
these subsectors, the current and future available technologies, and the economic
environment (e.g., GDP, population, emissions trading system (ETS), and fuel
prices). Besides the energy flow, the HU-TIMES model can provide technology and
sector-specific information about GHG emissions and the associated
additional costs needed to achieve the goals defined in different alternative scenarios.
27
Further details on modeling, including all assumptions for the design of sectoral and
economy-wide emission pathways, are provided in Annex 6.
Each economic sector has different emission reduction potential, depending on the
availability and associated costs of low and zero and net negative emission technologies.
Given the differences in the structural and technological development of each sector, it is
virtually impossible to achieve absolute zero emissions in all sectors. Therefore, a system-
wide, integrated, and cross-sectoral approach has been used in the design of emission routes.
The modeling not only estimated the costs needed to reach the climate neutrality target by
2050 but also explored the macroeconomic impacts of decarbonization pathways, including
the effects on GDP growth, employment, and government revenues. In addition, the analysis
considered important benefits of emission reductions, such as resource and material savings,
reduction of negative transport externalities, positive health effects, and increased
productivity.
Three scenarios for GHG emissions up to 2050 have been developed:
a) BAU: The emission trajectory of the scenario follows current trends. The scenario does
not include energy efficiency, renewable energy, or GHG emission reduction targets for
2030 and 2050, respectively, and therefore does not include the targets set in the NECP
and the new NES. Current trends have been considered in all sectors, without further
efforts to reduce emissions.
b) LA climate neutrality scenario: This scenario aims to achieve net climate neutrality by
2050 by reducing emissions in the energy sector at a slower pace by 2045 and then with
an increased effort until 2050. This allows the lower cost levels of low and zero emission
technologies to be exploited. The scenario assumes that, in line with the targets set in the
climate act, final energy consumption could reach a maximum of 785 PJ in 2030, with the
share of renewable energy increasing to at least 21%. After 2030, non-waste sectors will
be on the lowest cost trajectory toward climate neutrality, which will result in accelerated
emission reductions by the end of the period, due to the postponement of investments
pending on a decrease in technology costs. In the case of waste management, the model
assumes a higher level of ambition by 2030 to meet the EU targets for reducing landfill
use (circular economy).
c) EA climate neutrality scenario: the EA approach envisages achieving climate neutrality
by 2050, while considering the short- and medium-term benefits of job creation and the
reduction of environmental externalities, the economic potential of the first mover,
improved productivity, and higher GDP growth. The scenario assumes that Hungary's
final energy consumption in 2030 will be a maximum of 734 PJ, and that renewable
energy penetration will reach 27%. The emission reduction trajectories for industry,
LULUCF, waste management, and agriculture are the same as in the LA scenario.
Between 2030 and 2050, emissions will follow a linear trajectory to reach net zero
emissions. In both the LA and EA scenarios, CCUS technologies will become
commercially viable in the energy and industrial sectors after 2030.
For all three scenarios, the same demographic trends were identified, while GDP values were
estimated endogenously by the GEM model.
The projection of GHG emissions under the three scenarios examined is illustrated in Figure
9.
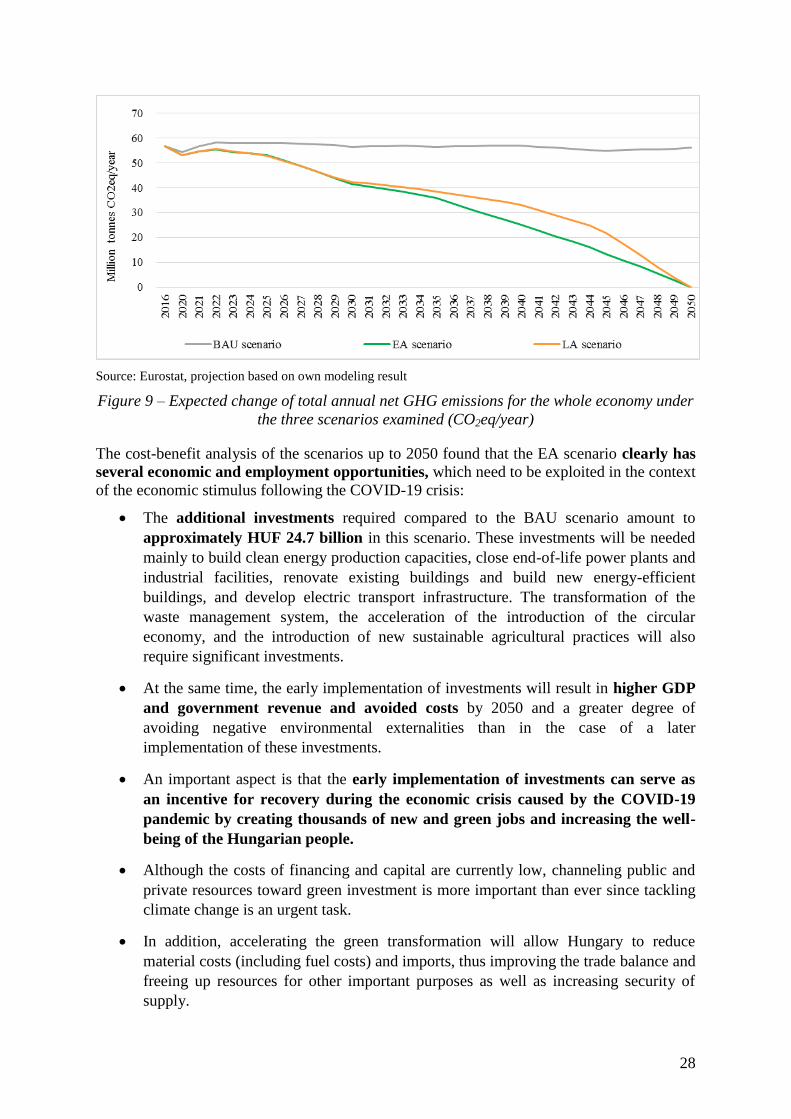
28
Source: Eurostat, projection based on own modeling result
Figure 9 – Expected change of total annual net GHG emissions for the whole economy under
the three scenarios examined (CO2eq/year)
The cost-benefit analysis of the scenarios up to 2050 found that the EA scenario clearly has
several economic and employment opportunities, which need to be exploited in the context
of the economic stimulus following the COVID-19 crisis:
The additional investments required compared to the BAU scenario amount to
approximately HUF 24.7 billion in this scenario. These investments will be needed
mainly to build clean energy production capacities, close end-of-life power plants and
industrial facilities, renovate existing buildings and build new energy-efficient
buildings, and develop electric transport infrastructure. The transformation of the
waste management system, the acceleration of the introduction of the circular
economy, and the introduction of new sustainable agricultural practices will also
require significant investments.
At the same time, the early implementation of investments will result in higher GDP
and government revenue and avoided costs by 2050 and a greater degree of
avoiding negative environmental externalities than in the case of a later
implementation of these investments.
An important aspect is that the early implementation of investments can serve as
an incentive for recovery during the economic crisis caused by the COVID-19
pandemic by creating thousands of new and green jobs and increasing the well-
being of the Hungarian people.
Although the costs of financing and capital are currently low, channeling public and
private resources toward green investment is more important than ever since tackling
climate change is an urgent task.
In addition, accelerating the green transformation will allow Hungary to reduce
material costs (including fuel costs) and imports, thus improving the trade balance and
freeing up resources for other important purposes as well as increasing security of
supply.
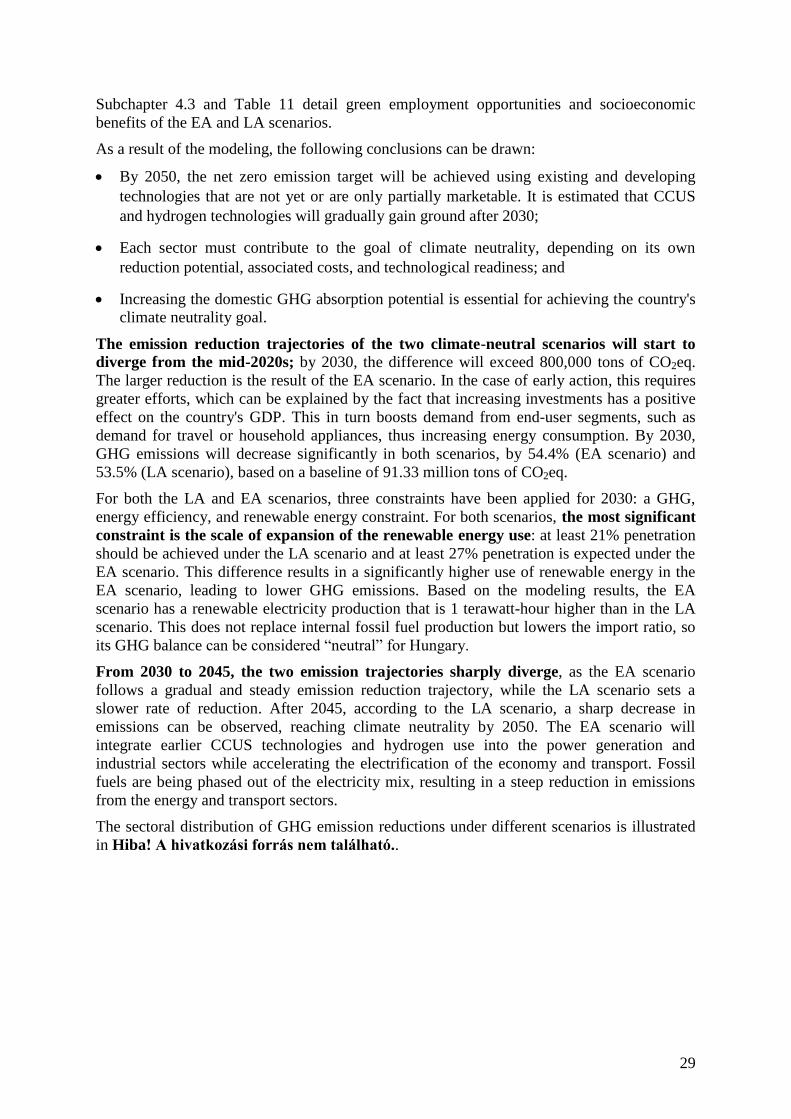
29
Subchapter 4.3 and Table 11 detail green employment opportunities and socioeconomic
benefits of the EA and LA scenarios.
As a result of the modeling, the following conclusions can be drawn:
By 2050, the net zero emission target will be achieved using existing and developing
technologies that are not yet or are only partially marketable. It is estimated that CCUS
and hydrogen technologies will gradually gain ground after 2030;
Each sector must contribute to the goal of climate neutrality, depending on its own
reduction potential, associated costs, and technological readiness; and
Increasing the domestic GHG absorption potential is essential for achieving the country's
climate neutrality goal.
The emission reduction trajectories of the two climate-neutral scenarios will start to
diverge from the mid-2020s; by 2030, the difference will exceed 800,000 tons of CO2eq.
The larger reduction is the result of the EA scenario. In the case of early action, this requires
greater efforts, which can be explained by the fact that increasing investments has a positive
effect on the country's GDP. This in turn boosts demand from end-user segments, such as
demand for travel or household appliances, thus increasing energy consumption. By 2030,
GHG emissions will decrease significantly in both scenarios, by 54.4% (EA scenario) and
53.5% (LA scenario), based on a baseline of 91.33 million tons of CO2eq.
For both the LA and EA scenarios, three constraints have been applied for 2030: a GHG,
energy efficiency, and renewable energy constraint. For both scenarios, the most significant
constraint is the scale of expansion of the renewable energy use: at least 21% penetration
should be achieved under the LA scenario and at least 27% penetration is expected under the
EA scenario. This difference results in a significantly higher use of renewable energy in the
EA scenario, leading to lower GHG emissions. Based on the modeling results, the EA
scenario has a renewable electricity production that is 1 terawatt-hour higher than in the LA
scenario. This does not replace internal fossil fuel production but lowers the import ratio, so
its GHG balance can be considered “neutral” for Hungary.
From 2030 to 2045, the two emission trajectories sharply diverge, as the EA scenario
follows a gradual and steady emission reduction trajectory, while the LA scenario sets a
slower rate of reduction. After 2045, according to the LA scenario, a sharp decrease in
emissions can be observed, reaching climate neutrality by 2050. The EA scenario will
integrate earlier CCUS technologies and hydrogen use into the power generation and
industrial sectors while accelerating the electrification of the economy and transport. Fossil
fuels are being phased out of the electricity mix, resulting in a steep reduction in emissions
from the energy and transport sectors.
The sectoral distribution of GHG emission reductions under different scenarios is illustrated
in Hiba! A hivatkozási forrás nem található..
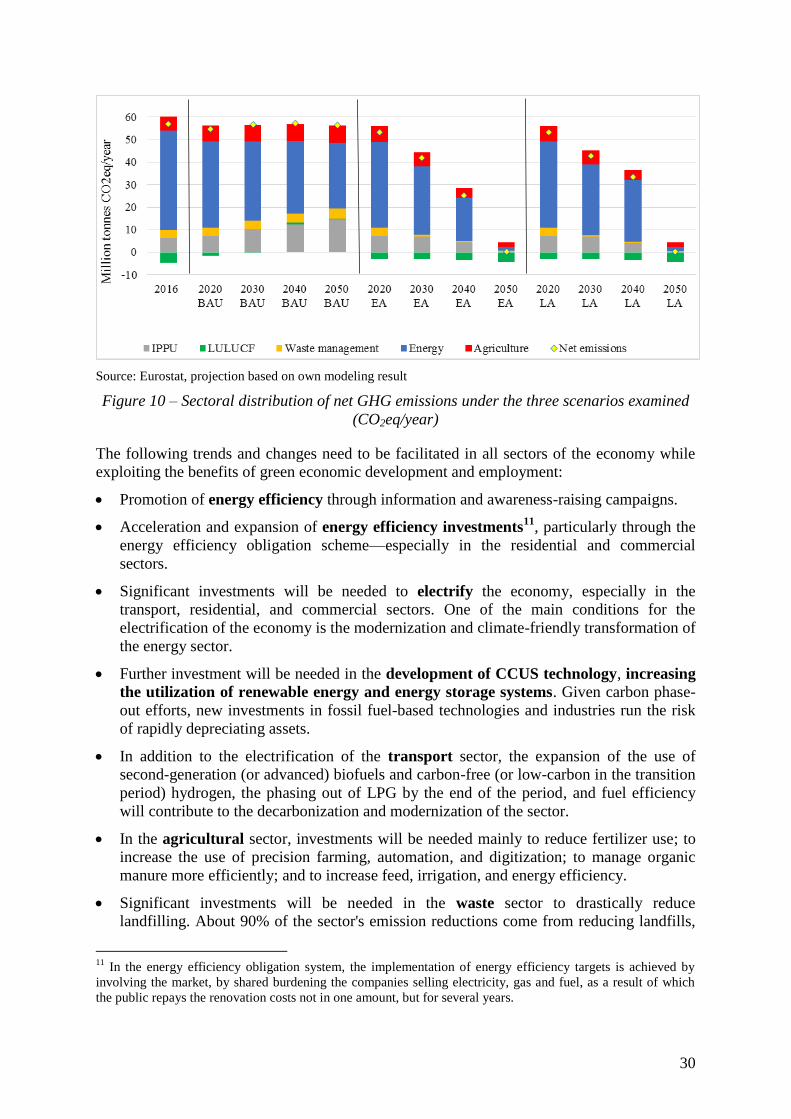
30
Source: Eurostat, projection based on own modeling result
Figure 10 – Sectoral distribution of net GHG emissions under the three scenarios examined
(CO2eq/year)
The following trends and changes need to be facilitated in all sectors of the economy while
exploiting the benefits of green economic development and employment:
Promotion of energy efficiency through information and awareness-raising campaigns.
Acceleration and expansion of energy efficiency investments11
, particularly through the
energy efficiency obligation scheme—especially in the residential and commercial
sectors.
Significant investments will be needed to electrify the economy, especially in the
transport, residential, and commercial sectors. One of the main conditions for the
electrification of the economy is the modernization and climate-friendly transformation of
the energy sector.
Further investment will be needed in the development of CCUS technology, increasing
the utilization of renewable energy and energy storage systems. Given carbon phase-
out efforts, new investments in fossil fuel-based technologies and industries run the risk
of rapidly depreciating assets.
In addition to the electrification of the transport sector, the expansion of the use of
second-generation (or advanced) biofuels and carbon-free (or low-carbon in the transition
period) hydrogen, the phasing out of LPG by the end of the period, and fuel efficiency
will contribute to the decarbonization and modernization of the sector.
In the agricultural sector, investments will be needed mainly to reduce fertilizer use; to
increase the use of precision farming, automation, and digitization; to manage organic
manure more efficiently; and to increase feed, irrigation, and energy efficiency.
Significant investments will be needed in the waste sector to drastically reduce
landfilling. About 90% of the sector's emission reductions come from reducing landfills,
11
In the energy efficiency obligation system, the implementation of energy efficiency targets is achieved by
involving the market, by shared burdening the companies selling electricity, gas and fuel, as a result of which
the public repays the renovation costs not in one amount, but for several years.
31
diverting waste streams, and improving treatment methods. Further investments will be
needed to reduce the amount of industrial waste, improve municipal waste management,
and prevent waste generation. Given the nature of waste management activities, reducing
the sector's emissions will also require investments in other sectors (e.g., in the transport
sector due to waste collection).
In the IPPU sector, the development of production/manufacturing processes, greater
material efficiency, the introduction of a circular economy, alternative raw materials, and
new and efficient tools are needed to nearly eliminate emissions.
There is also a strong need for investment in the LULUCF sector to maintain and
increase post-2030 CO2 sequestration; in particular, measures to improve the adaptive
capacity of forests, reduce logging in the medium term, and increase afforestation in the
long term. In line with the requirements of sustainable forest management, emphasis
should be placed on maintaining stock structures and management models with the best
possible CO2 balance (in terms of spatial and age structure), and active interventions
should help forest stocks to survive, preserve, and develop their natural level despite the
effects of climate change.
Research, development, and innovation will be a priority to achieving the energy and
climate goals. Through the continued development of new technologies and processes, as
well as their market introduction, a degree of cost reduction can be achieved to greatly
help the spread of clean technologies.
The education and training of professionals capable of developing and/or applying new
technologies and processes is also key.
Sector Reduction vs. 1990 (%)
Energy -98%
Industry (IPPU) -98%
Agriculture -79%
LULUCF -71%12
Waste -87%
Total -100%
Source: own modeling calculation
Table 3 – GHG reductions of sectors by 2050 compared to 1990 levels in the EA scenario
(%)
Achieving climate neutrality by 2050 will require significant additional investment in all
emitting sectors (Figure 11).
12
Increase in net absorption
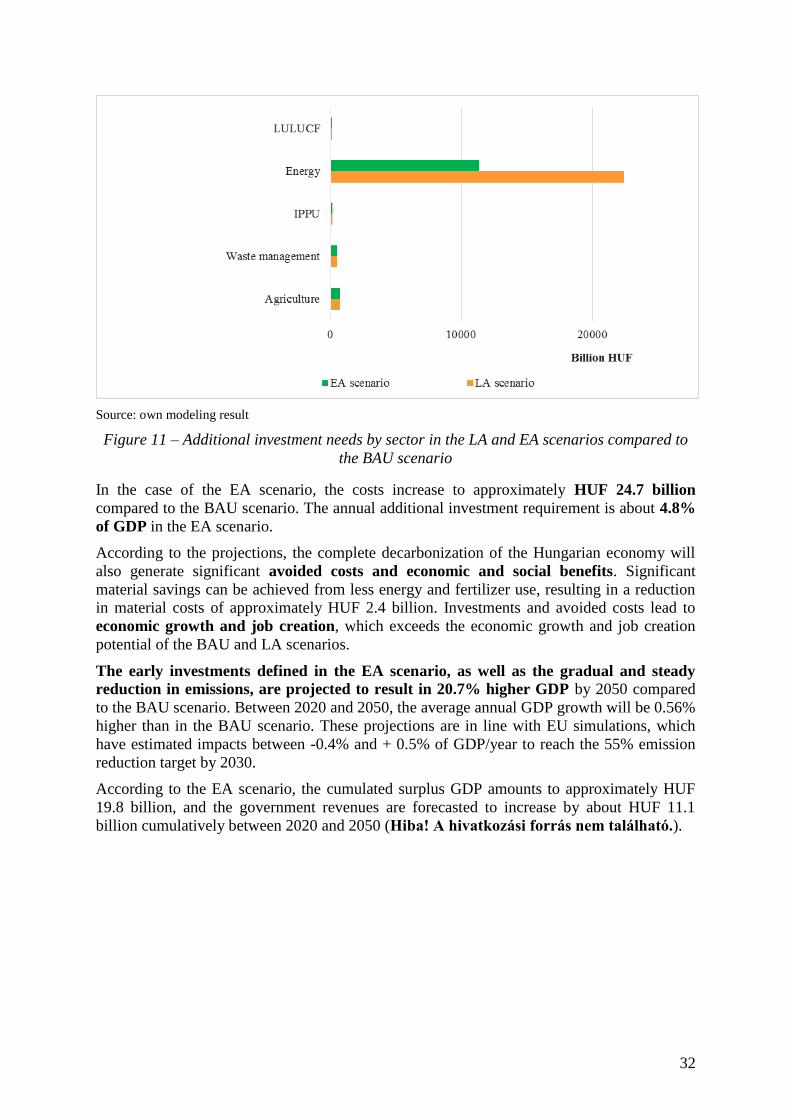
32
Source: own modeling result
Figure 11 – Additional investment needs by sector in the LA and EA scenarios compared to
the BAU scenario
In the case of the EA scenario, the costs increase to approximately HUF 24.7 billion
compared to the BAU scenario. The annual additional investment requirement is about 4.8%
of GDP in the EA scenario.
According to the projections, the complete decarbonization of the Hungarian economy will
also generate significant avoided costs and economic and social benefits. Significant
material savings can be achieved from less energy and fertilizer use, resulting in a reduction
in material costs of approximately HUF 2.4 billion. Investments and avoided costs lead to
economic growth and job creation, which exceeds the economic growth and job creation
potential of the BAU and LA scenarios.
The early investments defined in the EA scenario, as well as the gradual and steady
reduction in emissions, are projected to result in 20.7% higher GDP by 2050 compared
to the BAU scenario. Between 2020 and 2050, the average annual GDP growth will be 0.56%
higher than in the BAU scenario. These projections are in line with EU simulations, which
have estimated impacts between -0.4% and + 0.5% of GDP/year to reach the 55% emission
reduction target by 2030.
According to the EA scenario, the cumulated surplus GDP amounts to approximately HUF
19.8 billion, and the government revenues are forecasted to increase by about HUF 11.1
billion cumulatively between 2020 and 2050 (Hiba! A hivatkozási forrás nem található.).
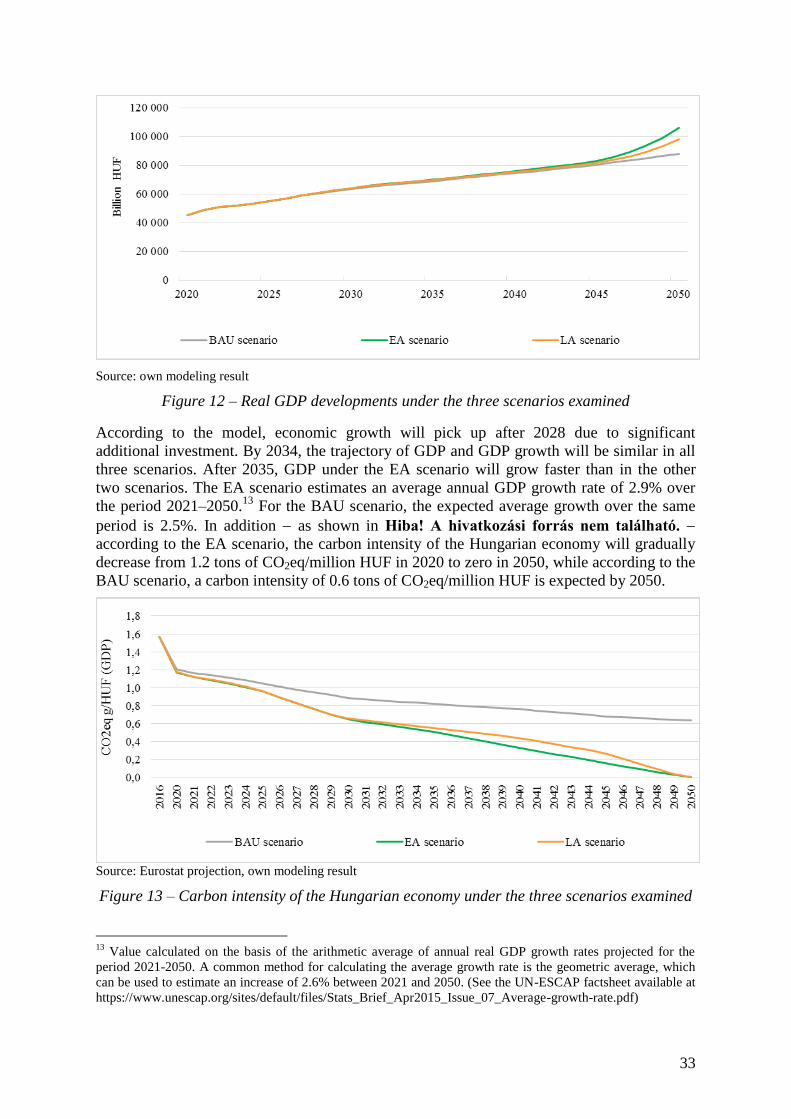
33
Source: own modeling result
Figure 12 – Real GDP developments under the three scenarios examined
According to the model, economic growth will pick up after 2028 due to significant
additional investment. By 2034, the trajectory of GDP and GDP growth will be similar in all
three scenarios. After 2035, GDP under the EA scenario will grow faster than in the other
two scenarios. The EA scenario estimates an average annual GDP growth rate of 2.9% over
the period 2021–2050.13
For the BAU scenario, the expected average growth over the same
period is 2.5%. In addition as shown in Hiba! A hivatkozási forrás nem található.
according to the EA scenario, the carbon intensity of the Hungarian economy will gradually
decrease from 1.2 tons of CO2eq/million HUF in 2020 to zero in 2050, while according to the
BAU scenario, a carbon intensity of 0.6 tons of CO2eq/million HUF is expected by 2050.
Source: Eurostat projection, own modeling result
Figure 13 – Carbon intensity of the Hungarian economy under the three scenarios examined
13
Value calculated on the basis of the arithmetic average of annual real GDP growth rates projected for the
period 2021-2050. A common method for calculating the average growth rate is the geometric average, which
can be used to estimate an increase of 2.6% between 2021 and 2050. (See the UN-ESCAP factsheet available at
https://www.unescap.org/sites/default/files/Stats_Brief_Apr2015_Issue_07_Average-growth-rate.pdf)
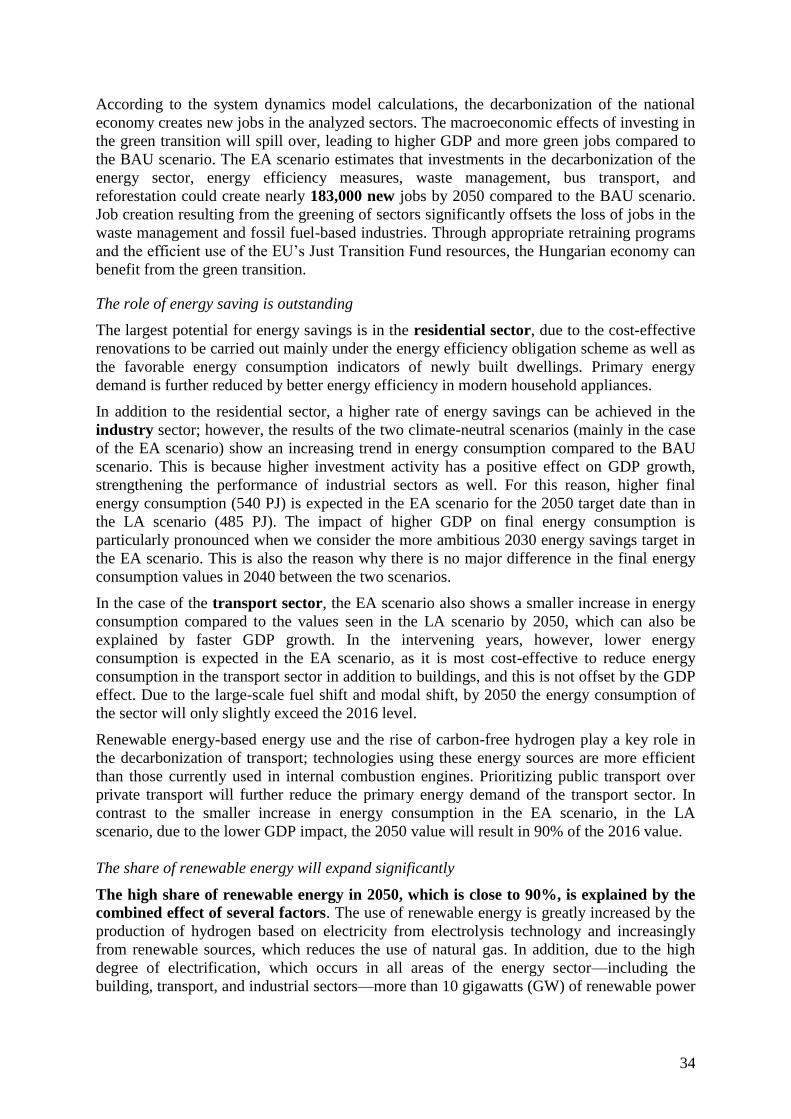
34
According to the system dynamics model calculations, the decarbonization of the national
economy creates new jobs in the analyzed sectors. The macroeconomic effects of investing in
the green transition will spill over, leading to higher GDP and more green jobs compared to
the BAU scenario. The EA scenario estimates that investments in the decarbonization of the
energy sector, energy efficiency measures, waste management, bus transport, and
reforestation could create nearly 183,000 new jobs by 2050 compared to the BAU scenario.
Job creation resulting from the greening of sectors significantly offsets the loss of jobs in the
waste management and fossil fuel-based industries. Through appropriate retraining programs
and the efficient use of the EU’s Just Transition Fund resources, the Hungarian economy can
benefit from the green transition.
The role of energy saving is outstanding
The largest potential for energy savings is in the residential sector, due to the cost-effective
renovations to be carried out mainly under the energy efficiency obligation scheme as well as
the favorable energy consumption indicators of newly built dwellings. Primary energy
demand is further reduced by better energy efficiency in modern household appliances.
In addition to the residential sector, a higher rate of energy savings can be achieved in the
industry sector; however, the results of the two climate-neutral scenarios (mainly in the case
of the EA scenario) show an increasing trend in energy consumption compared to the BAU
scenario. This is because higher investment activity has a positive effect on GDP growth,
strengthening the performance of industrial sectors as well. For this reason, higher final
energy consumption (540 PJ) is expected in the EA scenario for the 2050 target date than in
the LA scenario (485 PJ). The impact of higher GDP on final energy consumption is
particularly pronounced when we consider the more ambitious 2030 energy savings target in
the EA scenario. This is also the reason why there is no major difference in the final energy
consumption values in 2040 between the two scenarios.
In the case of the transport sector, the EA scenario also shows a smaller increase in energy
consumption compared to the values seen in the LA scenario by 2050, which can also be
explained by faster GDP growth. In the intervening years, however, lower energy
consumption is expected in the EA scenario, as it is most cost-effective to reduce energy
consumption in the transport sector in addition to buildings, and this is not offset by the GDP
effect. Due to the large-scale fuel shift and modal shift, by 2050 the energy consumption of
the sector will only slightly exceed the 2016 level.
Renewable energy-based energy use and the rise of carbon-free hydrogen play a key role in
the decarbonization of transport; technologies using these energy sources are more efficient
than those currently used in internal combustion engines. Prioritizing public transport over
private transport will further reduce the primary energy demand of the transport sector. In
contrast to the smaller increase in energy consumption in the EA scenario, in the LA
scenario, due to the lower GDP impact, the 2050 value will result in 90% of the 2016 value.
The share of renewable energy will expand significantly
The high share of renewable energy in 2050, which is close to 90%, is explained by the
combined effect of several factors. The use of renewable energy is greatly increased by the
production of hydrogen based on electricity from electrolysis technology and increasingly
from renewable sources, which reduces the use of natural gas. In addition, due to the high
degree of electrification, which occurs in all areas of the energy sector—including the
building, transport, and industrial sectors—more than 10 gigawatts (GW) of renewable power
35
plant capacity are needed, which requires a similar amount of energy storage (battery)
capacity for smooth operation.
Moreover, the high uptake of biomass-based electricity generation with CCUS technology
will further increase the share of renewable energy. In addition to climate-friendly (carbon-
free) electricity generation, the use of this technology is also needed because it has the only
additional removal capacity. While based on the current methodology, biomass accounts for
zero CO2 emissions, with CCUS technology, we can expect negative emissions.
An increase in the use of renewable energy will greatly contribute to a large decrease in
energy imports, thus contributing to an increase in energy security. This affects all areas of
the energy sector: the electricity sector, oil consumption, and the reduction of natural gas
import demand through the reduction of natural gas consumption. Most renewables will come
from solar power, biomass, and biofuels.
4.1.3. Indicative milestones
To reach the 2050 net zero GHG emissions target, indicative milestones can be set for the EA
and LA scenarios, based on the modeling results, showing the stages to be reached by 2030
and 2040. These milestones also provide an indication of the extent to which net zero
emissions in 2050 are energy efficiency indicators and the proportion of renewable energy
that can be achieved in an optimal, cost-effective way relative to gross final energy
consumption.
As shown in Figure 9, there is an accelerating net GHG emission reduction trajectory for the
LA scenario, in which case the 35.9% GHG emission reduction in 2018 will increase to 54%
by 2030 and 64% by 2040. In contrast, in the EA scenario, a more balanced, linear GHG
emission reduction trajectory has been identified, in which case the rate of reduction in 2040
will already reach net 73%.
In the case of the EA scenario, the share of renewable energy in gross final energy
consumption also shows a more balanced increase. The renewable rate of 13.3% in 2017 will
double by 2030 and then remain at the 2040 level (25.1%). In contrast, in the LA scenario for
2017 and 2030, growth is less than 8 percentage points.
Compared to the final energy consumption of 775 PJ in 2017, there is an indicative energy
efficiency target of 5.3% by 2030, almost 15% by 2040, and more than 30% by 2050 for the
EA scenario. In contrast, in the LA scenario, there will be an increase of 1.2% by 2030, then
14.5% by 2040, and 37.4% of energy saving demand by 2050 to achieve climate neutrality.
4.2. Sector-specific pathways, policies, and measures
The cost-benefit analysis of the scenarios up to 2050 (Subsection 4.3) reveals that the BAU
scenario does not meet the increased 2030 GHG emission reduction target or the 2050
climate neutrality target set in Act no. XLIV of 2020 on Climate Protection. Based on the
cost-benefit analysis performed, the net benefit of the EA scenario exceeds the LA scenario;
therefore, this subsection focuses only on the comparison of the BAU and EA scenarios.
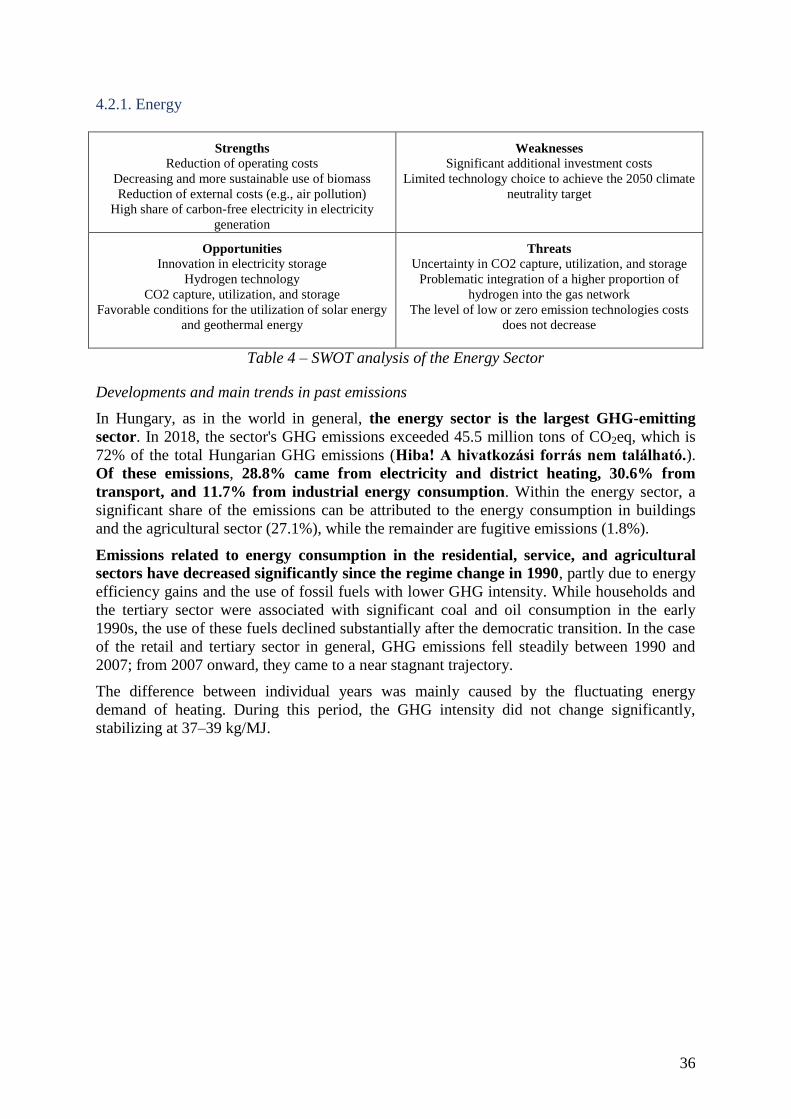
36
4.2.1. Energy
Strengths
Reduction of operating costs
Decreasing and more sustainable use of biomass
Reduction of external costs (e.g., air pollution)
High share of carbon-free electricity in electricity
generation
Weaknesses
Significant additional investment costs
Limited technology choice to achieve the 2050 climate
neutrality target
Opportunities
Innovation in electricity storage
Hydrogen technology
CO2 capture, utilization, and storage
Favorable conditions for the utilization of solar energy
and geothermal energy
Threats
Uncertainty in CO2 capture, utilization, and storage
Problematic integration of a higher proportion of
hydrogen into the gas network
The level of low or zero emission technologies costs
does not decrease
Table 4 – SWOT analysis of the Energy Sector
Developments and main trends in past emissions
In Hungary, as in the world in general, the energy sector is the largest GHG-emitting
sector. In 2018, the sector's GHG emissions exceeded 45.5 million tons of CO2eq, which is
72% of the total Hungarian GHG emissions (Hiba! A hivatkozási forrás nem található.).
Of these emissions, 28.8% came from electricity and district heating, 30.6% from
transport, and 11.7% from industrial energy consumption. Within the energy sector, a
significant share of the emissions can be attributed to the energy consumption in buildings
and the agricultural sector (27.1%), while the remainder are fugitive emissions (1.8%).
Emissions related to energy consumption in the residential, service, and agricultural
sectors have decreased significantly since the regime change in 1990, partly due to energy
efficiency gains and the use of fossil fuels with lower GHG intensity. While households and
the tertiary sector were associated with significant coal and oil consumption in the early
1990s, the use of these fuels declined substantially after the democratic transition. In the case
of the retail and tertiary sector in general, GHG emissions fell steadily between 1990 and
2007; from 2007 onward, they came to a near stagnant trajectory.
The difference between individual years was mainly caused by the fluctuating energy
demand of heating. During this period, the GHG intensity did not change significantly,
stabilizing at 37–39 kg/MJ.
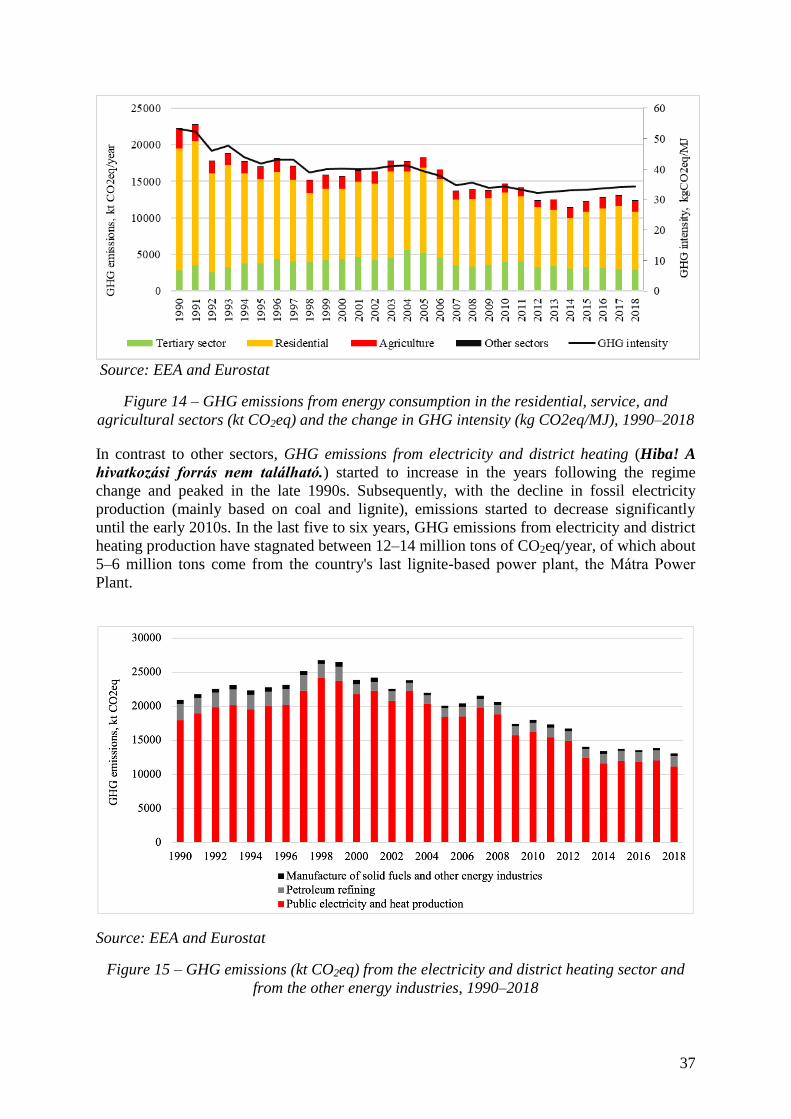
37
Source: EEA and Eurostat
Figure 14 – GHG emissions from energy consumption in the residential, service, and
agricultural sectors (kt CO2eq) and the change in GHG intensity (kg CO2eq/MJ), 1990–2018
In contrast to other sectors, GHG emissions from electricity and district heating (Hiba! A
hivatkozási forrás nem található.) started to increase in the years following the regime
change and peaked in the late 1990s. Subsequently, with the decline in fossil electricity
production (mainly based on coal and lignite), emissions started to decrease significantly
until the early 2010s. In the last five to six years, GHG emissions from electricity and district
heating production have stagnated between 12–14 million tons of CO2eq/year, of which about
5–6 million tons come from the country's last lignite-based power plant, the Mátra Power
Plant.
Source: EEA and Eurostat
Figure 15 – GHG emissions (kt CO2eq) from the electricity and district heating sector and
from the other energy industries, 1990–2018
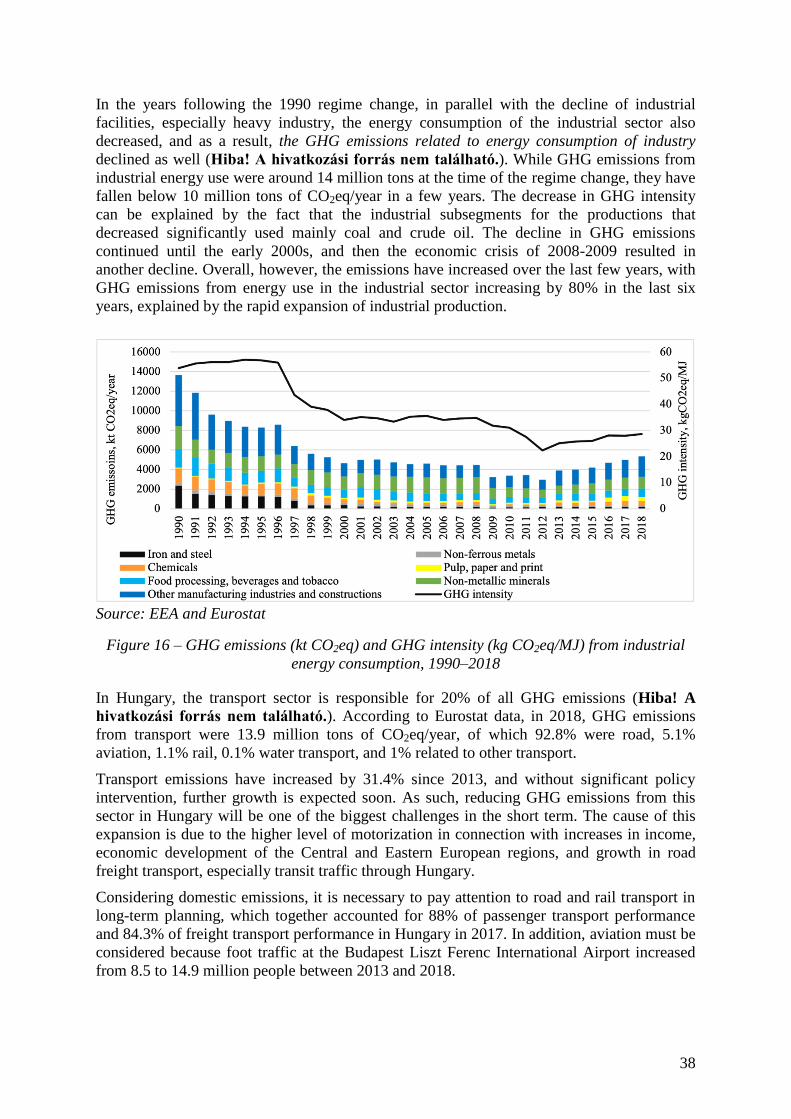
38
In the years following the 1990 regime change, in parallel with the decline of industrial
facilities, especially heavy industry, the energy consumption of the industrial sector also
decreased, and as a result, the GHG emissions related to energy consumption of industry
declined as well (Hiba! A hivatkozási forrás nem található.). While GHG emissions from
industrial energy use were around 14 million tons at the time of the regime change, they have
fallen below 10 million tons of CO2eq/year in a few years. The decrease in GHG intensity
can be explained by the fact that the industrial subsegments for the productions that
decreased significantly used mainly coal and crude oil. The decline in GHG emissions
continued until the early 2000s, and then the economic crisis of 2008-2009 resulted in
another decline. Overall, however, the emissions have increased over the last few years, with
GHG emissions from energy use in the industrial sector increasing by 80% in the last six
years, explained by the rapid expansion of industrial production.
Source: EEA and Eurostat
Figure 16 – GHG emissions (kt CO2eq) and GHG intensity (kg CO2eq/MJ) from industrial
energy consumption, 1990–2018
In Hungary, the transport sector is responsible for 20% of all GHG emissions (Hiba! A
hivatkozási forrás nem található.). According to Eurostat data, in 2018, GHG emissions
from transport were 13.9 million tons of CO2eq/year, of which 92.8% were road, 5.1%
aviation, 1.1% rail, 0.1% water transport, and 1% related to other transport.
Transport emissions have increased by 31.4% since 2013, and without significant policy
intervention, further growth is expected soon. As such, reducing GHG emissions from this
sector in Hungary will be one of the biggest challenges in the short term. The cause of this
expansion is due to the higher level of motorization in connection with increases in income,
economic development of the Central and Eastern European regions, and growth in road
freight transport, especially transit traffic through Hungary.
Considering domestic emissions, it is necessary to pay attention to road and rail transport in
long-term planning, which together accounted for 88% of passenger transport performance
and 84.3% of freight transport performance in Hungary in 2017. In addition, aviation must be
considered because foot traffic at the Budapest Liszt Ferenc International Airport increased
from 8.5 to 14.9 million people between 2013 and 2018.
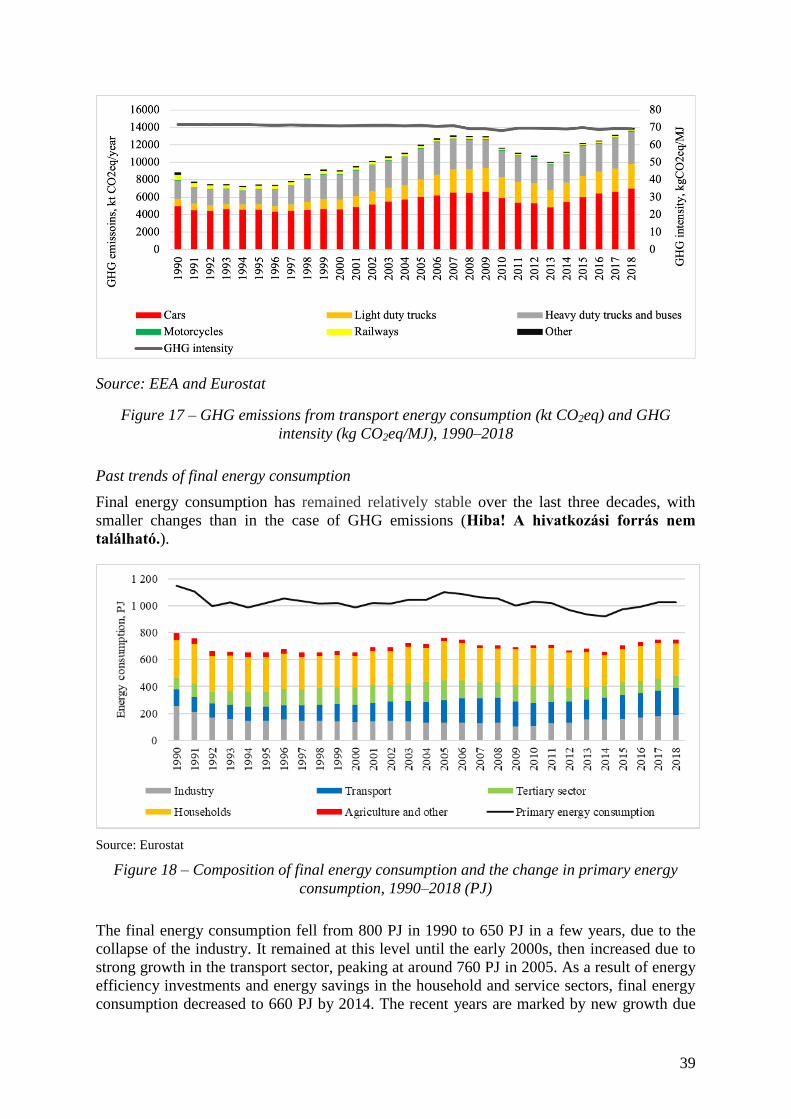
39
Source: EEA and Eurostat
Figure 17 – GHG emissions from transport energy consumption (kt CO2eq) and GHG
intensity (kg CO2eq/MJ), 1990–2018
Past trends of final energy consumption
Final energy consumption has remained relatively stable over the last three decades, with
smaller changes than in the case of GHG emissions (Hiba! A hivatkozási forrás nem
található.).
Source: Eurostat
Figure 18 – Composition of final energy consumption and the change in primary energy
consumption, 1990–2018 (PJ)
The final energy consumption fell from 800 PJ in 1990 to 650 PJ in a few years, due to the
collapse of the industry. It remained at this level until the early 2000s, then increased due to
strong growth in the transport sector, peaking at around 760 PJ in 2005. As a result of energy
efficiency investments and energy savings in the household and service sectors, final energy
consumption decreased to 660 PJ by 2014. The recent years are marked by new growth due
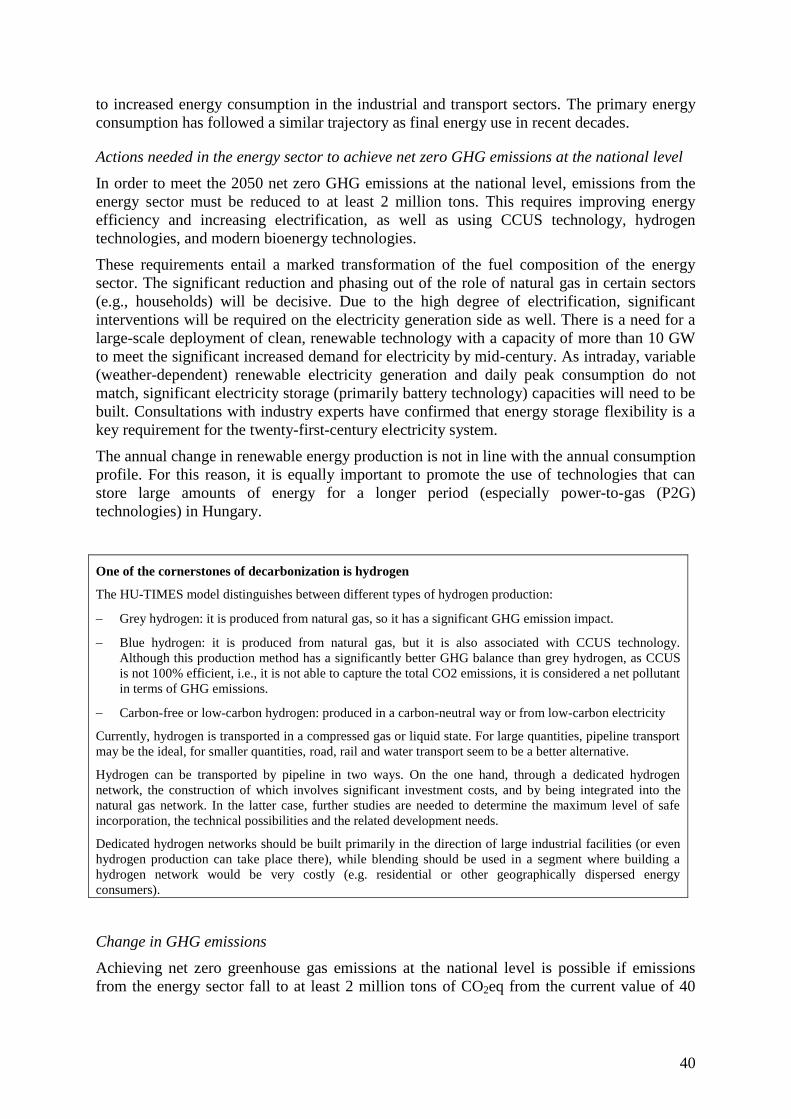
40
to increased energy consumption in the industrial and transport sectors. The primary energy
consumption has followed a similar trajectory as final energy use in recent decades.
Actions needed in the energy sector to achieve net zero GHG emissions at the national level
In order to meet the 2050 net zero GHG emissions at the national level, emissions from the
energy sector must be reduced to at least 2 million tons. This requires improving energy
efficiency and increasing electrification, as well as using CCUS technology, hydrogen
technologies, and modern bioenergy technologies.
These requirements entail a marked transformation of the fuel composition of the energy
sector. The significant reduction and phasing out of the role of natural gas in certain sectors
(e.g., households) will be decisive. Due to the high degree of electrification, significant
interventions will be required on the electricity generation side as well. There is a need for a
large-scale deployment of clean, renewable technology with a capacity of more than 10 GW
to meet the significant increased demand for electricity by mid-century. As intraday, variable
(weather-dependent) renewable electricity generation and daily peak consumption do not
match, significant electricity storage (primarily battery technology) capacities will need to be
built. Consultations with industry experts have confirmed that energy storage flexibility is a
key requirement for the twenty-first-century electricity system.
The annual change in renewable energy production is not in line with the annual consumption
profile. For this reason, it is equally important to promote the use of technologies that can
store large amounts of energy for a longer period (especially power-to-gas (P2G)
technologies) in Hungary.
One of the cornerstones of decarbonization is hydrogen
The HU-TIMES model distinguishes between different types of hydrogen production:
Grey hydrogen: it is produced from natural gas, so it has a significant GHG emission impact.
Blue hydrogen: it is produced from natural gas, but it is also associated with CCUS technology.
Although this production method has a significantly better GHG balance than grey hydrogen, as CCUS
is not 100% efficient, i.e., it is not able to capture the total CO2 emissions, it is considered a net pollutant
in terms of GHG emissions.
Carbon-free or low-carbon hydrogen: produced in a carbon-neutral way or from low-carbon electricity
Currently, hydrogen is transported in a compressed gas or liquid state. For large quantities, pipeline transport
may be the ideal, for smaller quantities, road, rail and water transport seem to be a better alternative.
Hydrogen can be transported by pipeline in two ways. On the one hand, through a dedicated hydrogen
network, the construction of which involves significant investment costs, and by being integrated into the
natural gas network. In the latter case, further studies are needed to determine the maximum level of safe
incorporation, the technical possibilities and the related development needs.
Dedicated hydrogen networks should be built primarily in the direction of large industrial facilities (or even
hydrogen production can take place there), while blending should be used in a segment where building a
hydrogen network would be very costly (e.g. residential or other geographically dispersed energy
consumers).
Change in GHG emissions
Achieving net zero greenhouse gas emissions at the national level is possible if emissions
from the energy sector fall to at least 2 million tons of CO2eq from the current value of 40
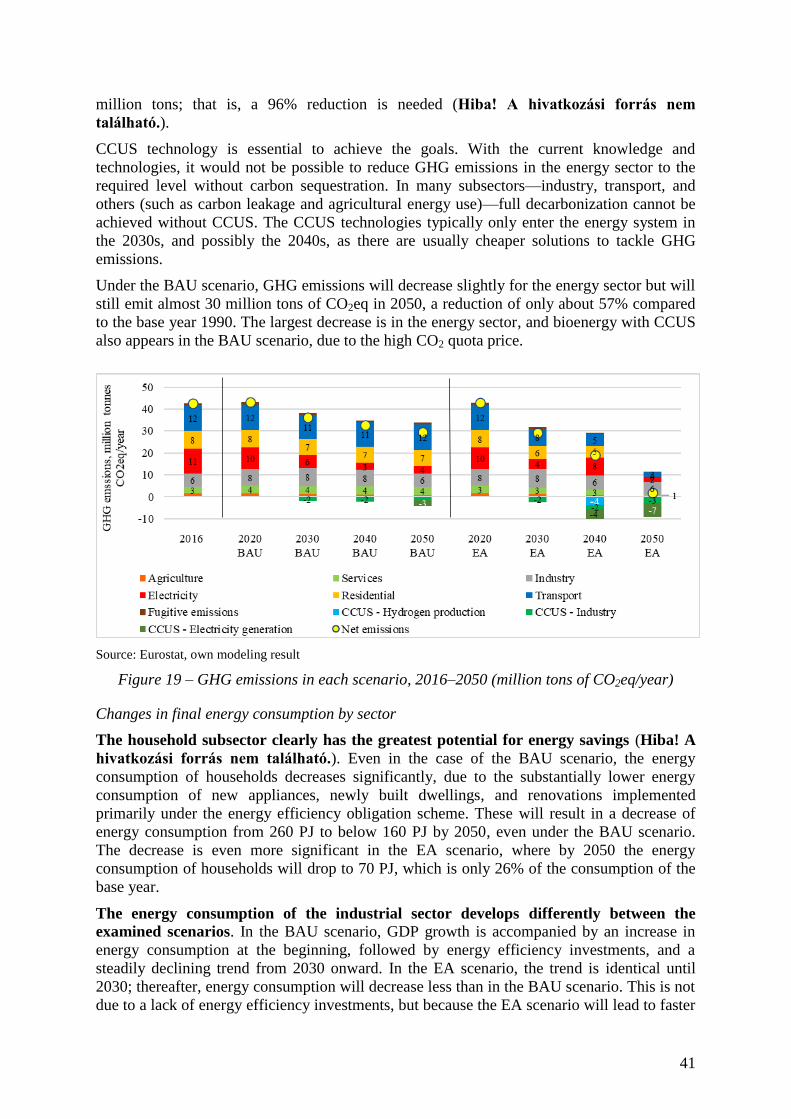
41
million tons; that is, a 96% reduction is needed (Hiba! A hivatkozási forrás nem
található.).
CCUS technology is essential to achieve the goals. With the current knowledge and
technologies, it would not be possible to reduce GHG emissions in the energy sector to the
required level without carbon sequestration. In many subsectors—industry, transport, and
others (such as carbon leakage and agricultural energy use)—full decarbonization cannot be
achieved without CCUS. The CCUS technologies typically only enter the energy system in
the 2030s, and possibly the 2040s, as there are usually cheaper solutions to tackle GHG
emissions.
Under the BAU scenario, GHG emissions will decrease slightly for the energy sector but will
still emit almost 30 million tons of CO2eq in 2050, a reduction of only about 57% compared
to the base year 1990. The largest decrease is in the energy sector, and bioenergy with CCUS
also appears in the BAU scenario, due to the high CO2 quota price.
Source: Eurostat, own modeling result
Figure 19 – GHG emissions in each scenario, 2016–2050 (million tons of CO2eq/year)
Changes in final energy consumption by sector
The household subsector clearly has the greatest potential for energy savings (Hiba! A
hivatkozási forrás nem található.). Even in the case of the BAU scenario, the energy
consumption of households decreases significantly, due to the substantially lower energy
consumption of new appliances, newly built dwellings, and renovations implemented
primarily under the energy efficiency obligation scheme. These will result in a decrease of
energy consumption from 260 PJ to below 160 PJ by 2050, even under the BAU scenario.
The decrease is even more significant in the EA scenario, where by 2050 the energy
consumption of households will drop to 70 PJ, which is only 26% of the consumption of the
base year.
The energy consumption of the industrial sector develops differently between the
examined scenarios. In the BAU scenario, GDP growth is accompanied by an increase in
energy consumption at the beginning, followed by energy efficiency investments, and a
steadily declining trend from 2030 onward. In the EA scenario, the trend is identical until
2030; thereafter, energy consumption will decrease less than in the BAU scenario. This is not
due to a lack of energy efficiency investments, but because the EA scenario will lead to faster
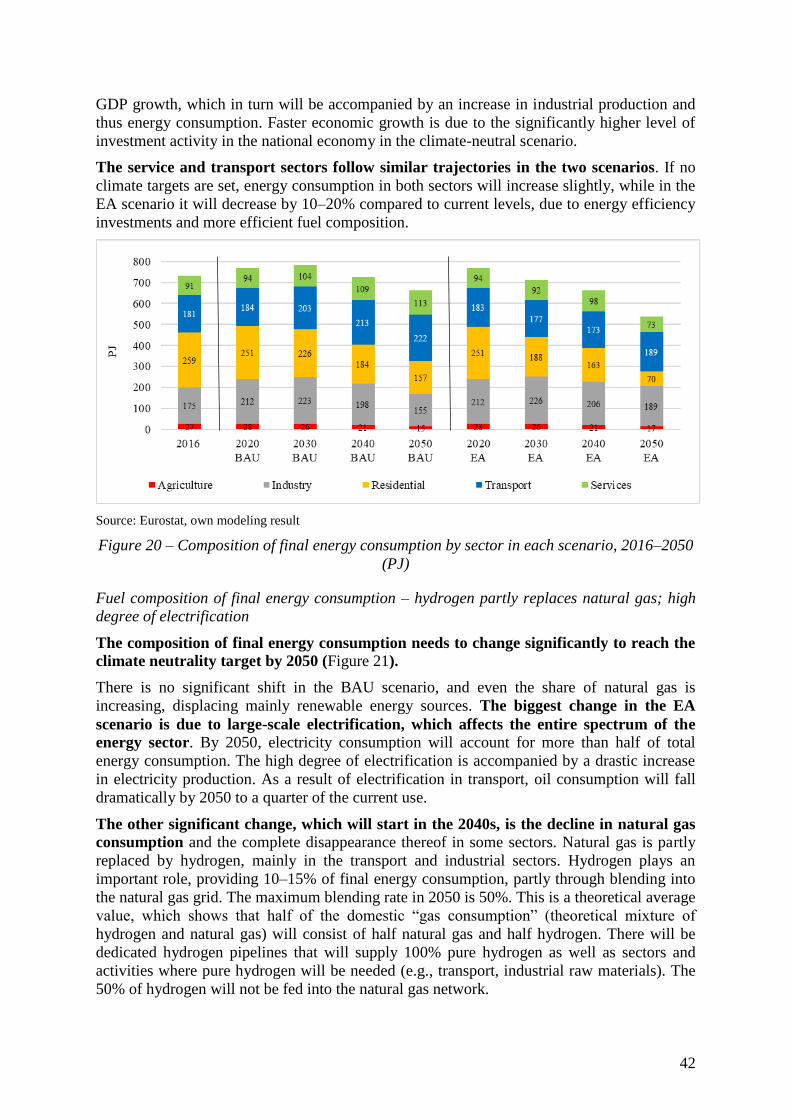
42
GDP growth, which in turn will be accompanied by an increase in industrial production and
thus energy consumption. Faster economic growth is due to the significantly higher level of
investment activity in the national economy in the climate-neutral scenario.
The service and transport sectors follow similar trajectories in the two scenarios. If no
climate targets are set, energy consumption in both sectors will increase slightly, while in the
EA scenario it will decrease by 10–20% compared to current levels, due to energy efficiency
investments and more efficient fuel composition.
Source: Eurostat, own modeling result
Figure 20 – Composition of final energy consumption by sector in each scenario, 2016–2050
(PJ)
Fuel composition of final energy consumption – hydrogen partly replaces natural gas; high
degree of electrification
The composition of final energy consumption needs to change significantly to reach the
climate neutrality target by 2050 (Figure 21).
There is no significant shift in the BAU scenario, and even the share of natural gas is
increasing, displacing mainly renewable energy sources. The biggest change in the EA
scenario is due to large-scale electrification, which affects the entire spectrum of the
energy sector. By 2050, electricity consumption will account for more than half of total
energy consumption. The high degree of electrification is accompanied by a drastic increase
in electricity production. As a result of electrification in transport, oil consumption will fall
dramatically by 2050 to a quarter of the current use.
The other significant change, which will start in the 2040s, is the decline in natural gas
consumption and the complete disappearance thereof in some sectors. Natural gas is partly
replaced by hydrogen, mainly in the transport and industrial sectors. Hydrogen plays an
important role, providing 10–15% of final energy consumption, partly through blending into
the natural gas grid. The maximum blending rate in 2050 is 50%. This is a theoretical average
value, which shows that half of the domestic “gas consumption” (theoretical mixture of
hydrogen and natural gas) will consist of half natural gas and half hydrogen. There will be
dedicated hydrogen pipelines that will supply 100% pure hydrogen as well as sectors and
activities where pure hydrogen will be needed (e.g., transport, industrial raw materials). The
50% of hydrogen will not be fed into the natural gas network.
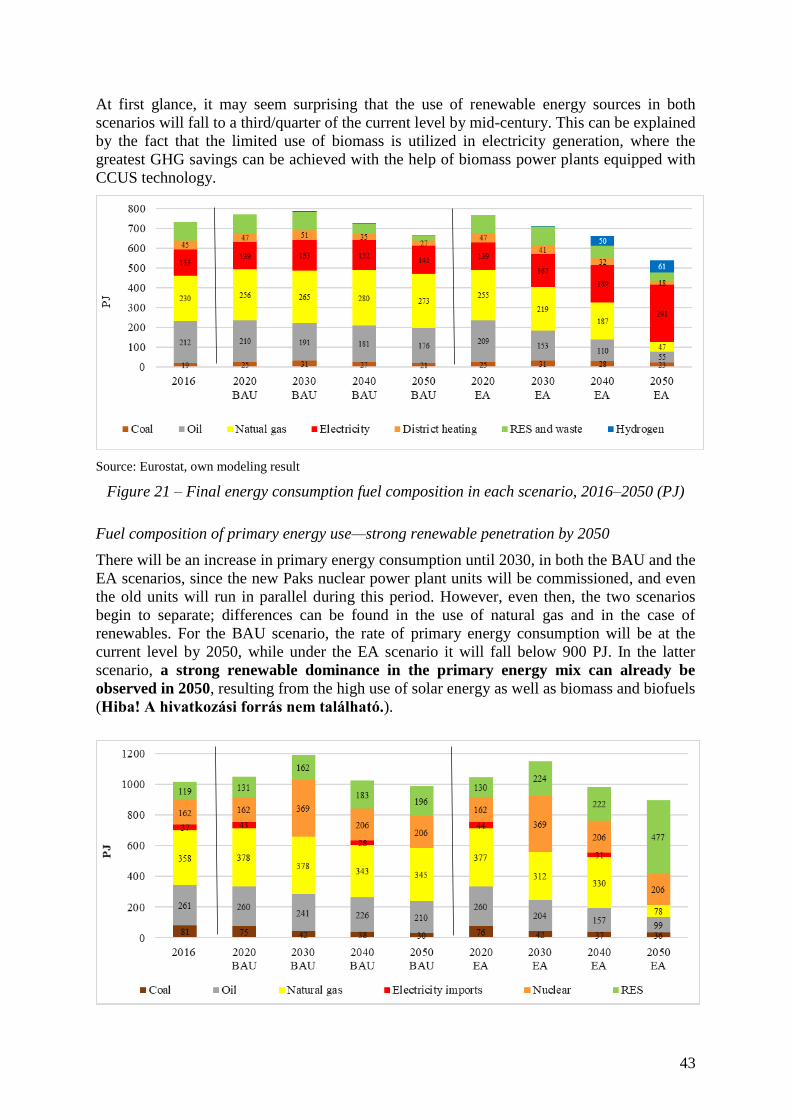
43
At first glance, it may seem surprising that the use of renewable energy sources in both
scenarios will fall to a third/quarter of the current level by mid-century. This can be explained
by the fact that the limited use of biomass is utilized in electricity generation, where the
greatest GHG savings can be achieved with the help of biomass power plants equipped with
CCUS technology.
Source: Eurostat, own modeling result
Figure 21 – Final energy consumption fuel composition in each scenario, 2016–2050 (PJ)
Fuel composition of primary energy use—strong renewable penetration by 2050
There will be an increase in primary energy consumption until 2030, in both the BAU and the
EA scenarios, since the new Paks nuclear power plant units will be commissioned, and even
the old units will run in parallel during this period. However, even then, the two scenarios
begin to separate; differences can be found in the use of natural gas and in the case of
renewables. For the BAU scenario, the rate of primary energy consumption will be at the
current level by 2050, while under the EA scenario it will fall below 900 PJ. In the latter
scenario, a strong renewable dominance in the primary energy mix can already be
observed in 2050, resulting from the high use of solar energy as well as biomass and biofuels
(Hiba! A hivatkozási forrás nem található.).
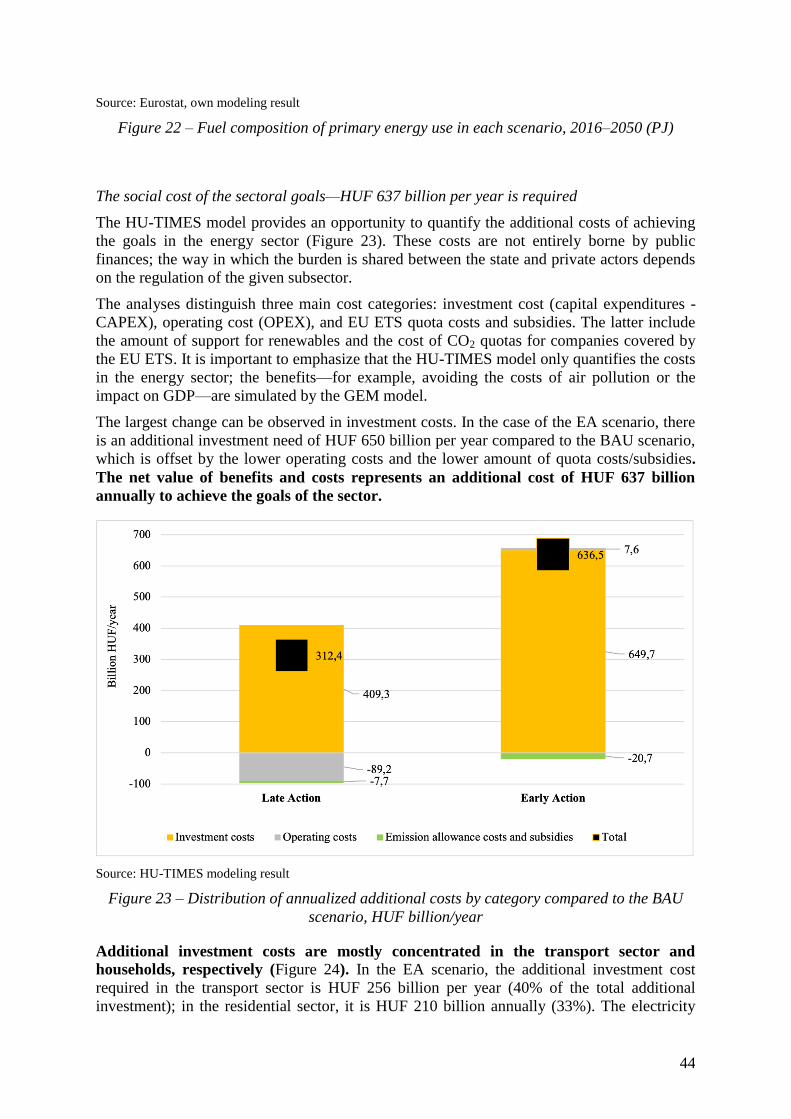
44
Source: Eurostat, own modeling result
Figure 22 – Fuel composition of primary energy use in each scenario, 2016–2050 (PJ)
The social cost of the sectoral goals—HUF 637 billion per year is required
The HU-TIMES model provides an opportunity to quantify the additional costs of achieving
the goals in the energy sector (Figure 23). These costs are not entirely borne by public
finances; the way in which the burden is shared between the state and private actors depends
on the regulation of the given subsector.
The analyses distinguish three main cost categories: investment cost (capital expenditures -
CAPEX), operating cost (OPEX), and EU ETS quota costs and subsidies. The latter include
the amount of support for renewables and the cost of CO2 quotas for companies covered by
the EU ETS. It is important to emphasize that the HU-TIMES model only quantifies the costs
in the energy sector; the benefits—for example, avoiding the costs of air pollution or the
impact on GDP—are simulated by the GEM model.
The largest change can be observed in investment costs. In the case of the EA scenario, there
is an additional investment need of HUF 650 billion per year compared to the BAU scenario,
which is offset by the lower operating costs and the lower amount of quota costs/subsidies.
The net value of benefits and costs represents an additional cost of HUF 637 billion
annually to achieve the goals of the sector.
Source: HU-TIMES modeling result
Figure 23 – Distribution of annualized additional costs by category compared to the BAU
scenario, HUF billion/year
Additional investment costs are mostly concentrated in the transport sector and
households, respectively (Figure 24). In the EA scenario, the additional investment cost
required in the transport sector is HUF 256 billion per year (40% of the total additional
investment); in the residential sector, it is HUF 210 billion annually (33%). The electricity
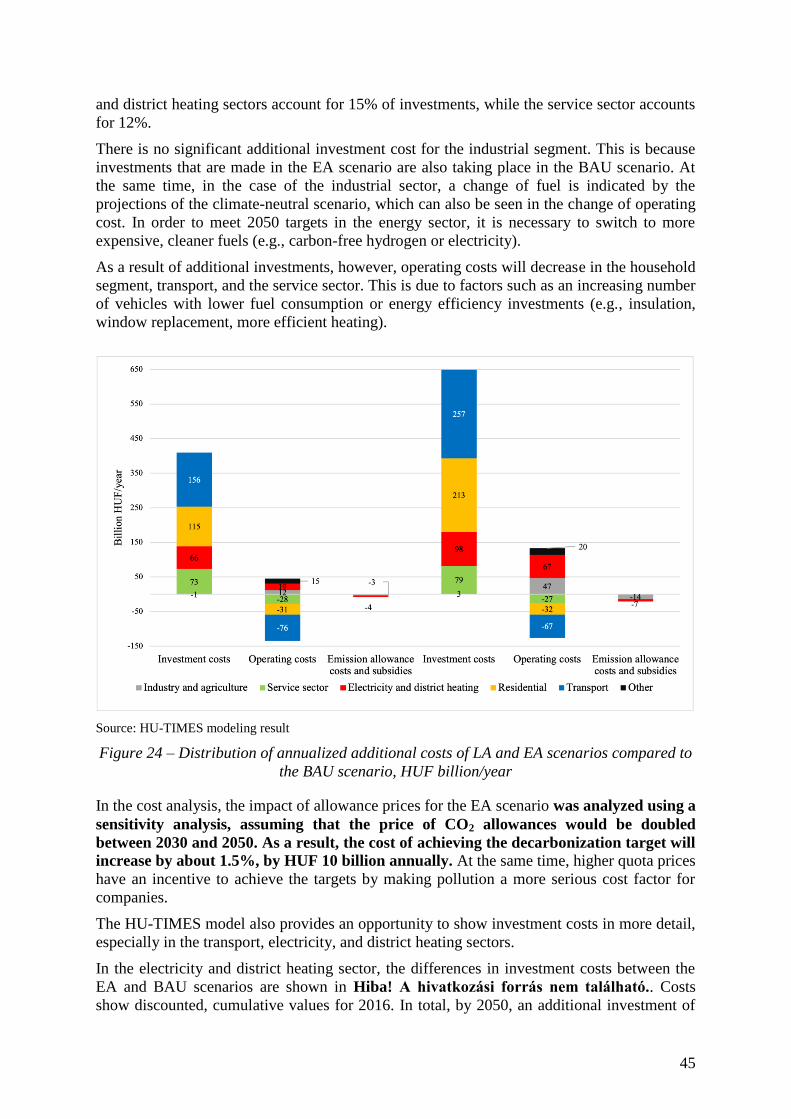
45
and district heating sectors account for 15% of investments, while the service sector accounts
for 12%.
There is no significant additional investment cost for the industrial segment. This is because
investments that are made in the EA scenario are also taking place in the BAU scenario. At
the same time, in the case of the industrial sector, a change of fuel is indicated by the
projections of the climate-neutral scenario, which can also be seen in the change of operating
cost. In order to meet 2050 targets in the energy sector, it is necessary to switch to more
expensive, cleaner fuels (e.g., carbon-free hydrogen or electricity).
As a result of additional investments, however, operating costs will decrease in the household
segment, transport, and the service sector. This is due to factors such as an increasing number
of vehicles with lower fuel consumption or energy efficiency investments (e.g., insulation,
window replacement, more efficient heating).
Source: HU-TIMES modeling result
Figure 24 – Distribution of annualized additional costs of LA and EA scenarios compared to
the BAU scenario, HUF billion/year
In the cost analysis, the impact of allowance prices for the EA scenario was analyzed using a
sensitivity analysis, assuming that the price of CO2 allowances would be doubled
between 2030 and 2050. As a result, the cost of achieving the decarbonization target will
increase by about 1.5%, by HUF 10 billion annually. At the same time, higher quota prices
have an incentive to achieve the targets by making pollution a more serious cost factor for
companies.
The HU-TIMES model also provides an opportunity to show investment costs in more detail,
especially in the transport, electricity, and district heating sectors.
In the electricity and district heating sector, the differences in investment costs between the
EA and BAU scenarios are shown in Hiba! A hivatkozási forrás nem található.. Costs
show discounted, cumulative values for 2016. In total, by 2050, an additional investment of
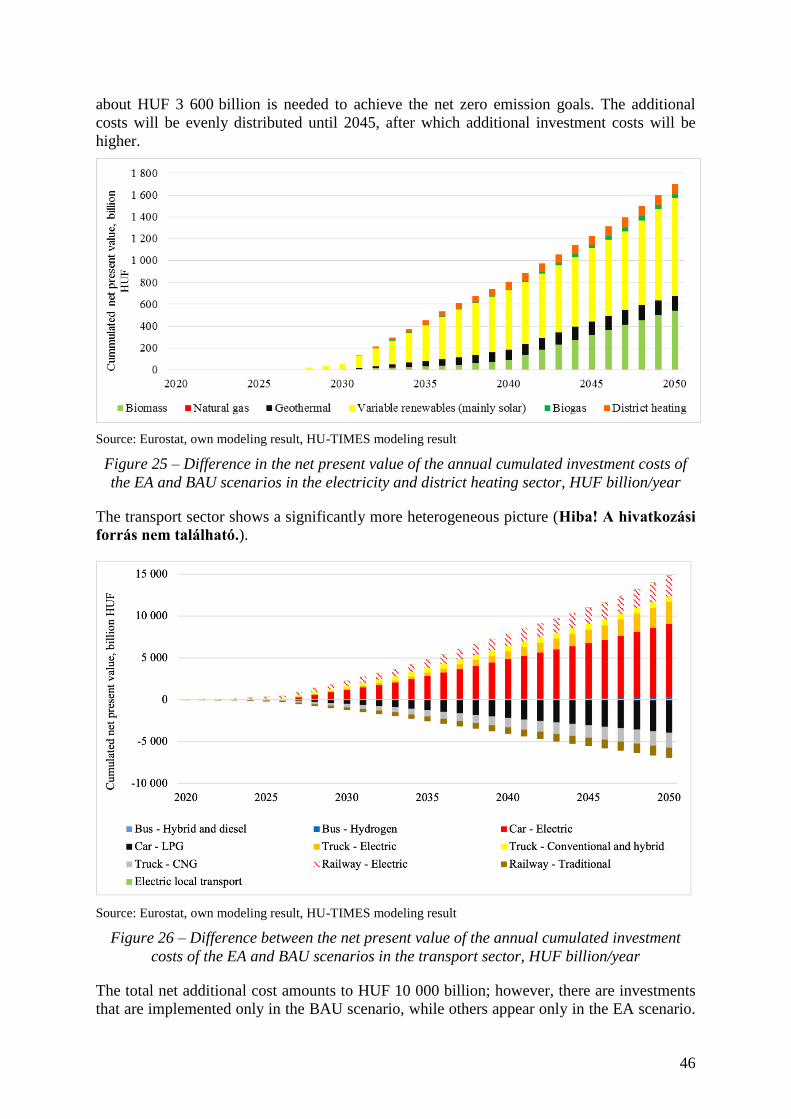
46
about HUF 3 600 billion is needed to achieve the net zero emission goals. The additional
costs will be evenly distributed until 2045, after which additional investment costs will be
higher.
Source: Eurostat, own modeling result, HU-TIMES modeling result
Figure 25 – Difference in the net present value of the annual cumulated investment costs of
the EA and BAU scenarios in the electricity and district heating sector, HUF billion/year
The transport sector shows a significantly more heterogeneous picture (Hiba! A hivatkozási
forrás nem található.).
Source: Eurostat, own modeling result, HU-TIMES modeling result
Figure 26 – Difference between the net present value of the annual cumulated investment
costs of the EA and BAU scenarios in the transport sector, HUF billion/year
The total net additional cost amounts to HUF 10 000 billion; however, there are investments
that are implemented only in the BAU scenario, while others appear only in the EA scenario.
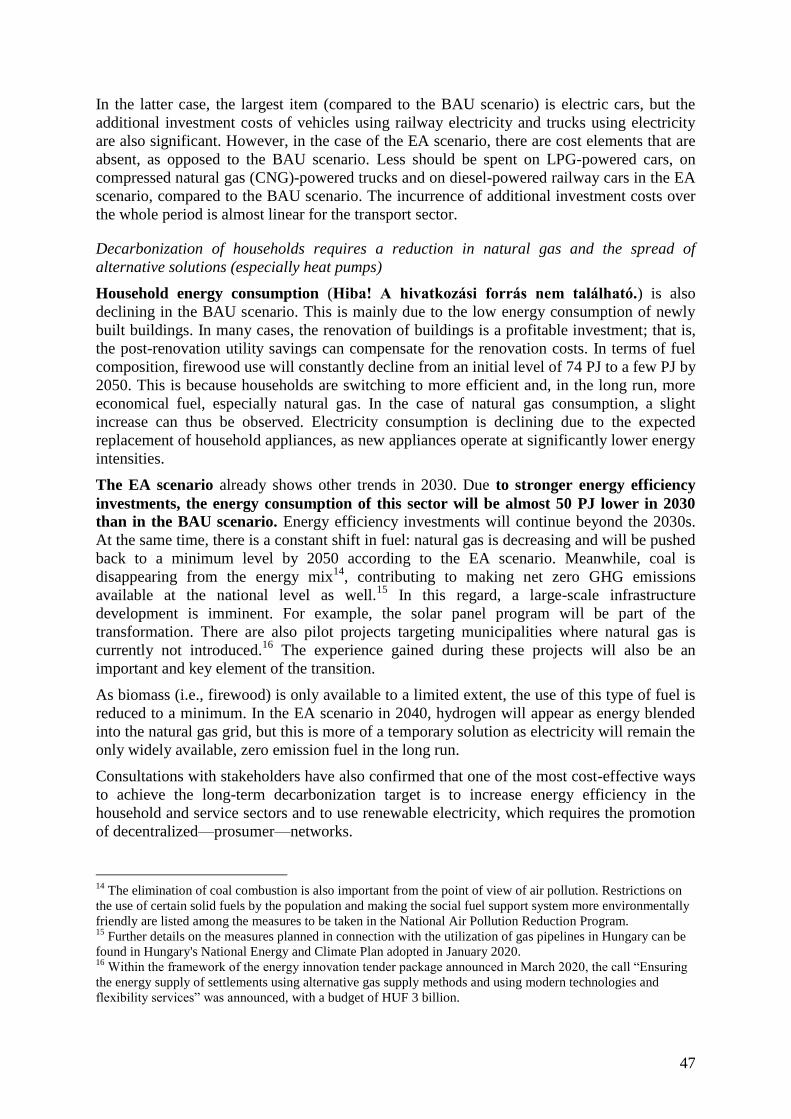
47
In the latter case, the largest item (compared to the BAU scenario) is electric cars, but the
additional investment costs of vehicles using railway electricity and trucks using electricity
are also significant. However, in the case of the EA scenario, there are cost elements that are
absent, as opposed to the BAU scenario. Less should be spent on LPG-powered cars, on
compressed natural gas (CNG)-powered trucks and on diesel-powered railway cars in the EA
scenario, compared to the BAU scenario. The incurrence of additional investment costs over
the whole period is almost linear for the transport sector.
Decarbonization of households requires a reduction in natural gas and the spread of
alternative solutions (especially heat pumps)
Household energy consumption (Hiba! A hivatkozási forrás nem található.) is also
declining in the BAU scenario. This is mainly due to the low energy consumption of newly
built buildings. In many cases, the renovation of buildings is a profitable investment; that is,
the post-renovation utility savings can compensate for the renovation costs. In terms of fuel
composition, firewood use will constantly decline from an initial level of 74 PJ to a few PJ by
2050. This is because households are switching to more efficient and, in the long run, more
economical fuel, especially natural gas. In the case of natural gas consumption, a slight
increase can thus be observed. Electricity consumption is declining due to the expected
replacement of household appliances, as new appliances operate at significantly lower energy
intensities.
The EA scenario already shows other trends in 2030. Due to stronger energy efficiency
investments, the energy consumption of this sector will be almost 50 PJ lower in 2030
than in the BAU scenario. Energy efficiency investments will continue beyond the 2030s.
At the same time, there is a constant shift in fuel: natural gas is decreasing and will be pushed
back to a minimum level by 2050 according to the EA scenario. Meanwhile, coal is
disappearing from the energy mix14
, contributing to making net zero GHG emissions
available at the national level as well.15
In this regard, a large-scale infrastructure
development is imminent. For example, the solar panel program will be part of the
transformation. There are also pilot projects targeting municipalities where natural gas is
currently not introduced.16
The experience gained during these projects will also be an
important and key element of the transition.
As biomass (i.e., firewood) is only available to a limited extent, the use of this type of fuel is
reduced to a minimum. In the EA scenario in 2040, hydrogen will appear as energy blended
into the natural gas grid, but this is more of a temporary solution as electricity will remain the
only widely available, zero emission fuel in the long run.
Consultations with stakeholders have also confirmed that one of the most cost-effective ways
to achieve the long-term decarbonization target is to increase energy efficiency in the
household and service sectors and to use renewable electricity, which requires the promotion
of decentralized—prosumer—networks.
14
The elimination of coal combustion is also important from the point of view of air pollution. Restrictions on
the use of certain solid fuels by the population and making the social fuel support system more environmentally
friendly are listed among the measures to be taken in the National Air Pollution Reduction Program. 15
Further details on the measures planned in connection with the utilization of gas pipelines in Hungary can be
found in Hungary's National Energy and Climate Plan adopted in January 2020. 16
Within the framework of the energy innovation tender package announced in March 2020, the call “Ensuring
the energy supply of settlements using alternative gas supply methods and using modern technologies and
flexibility services” was announced, with a budget of HUF 3 billion.
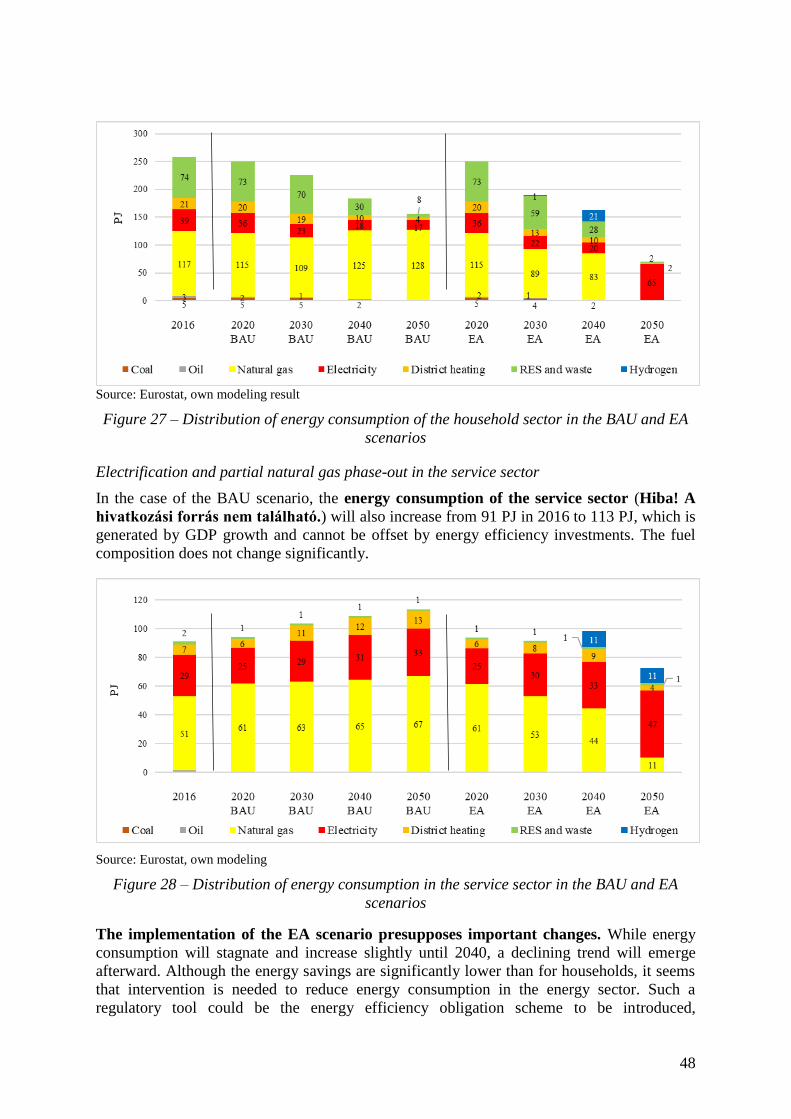
48
Source: Eurostat, own modeling result
Figure 27 – Distribution of energy consumption of the household sector in the BAU and EA
scenarios
Electrification and partial natural gas phase-out in the service sector
In the case of the BAU scenario, the energy consumption of the service sector (Hiba! A
hivatkozási forrás nem található.) will also increase from 91 PJ in 2016 to 113 PJ, which is
generated by GDP growth and cannot be offset by energy efficiency investments. The fuel
composition does not change significantly.
Source: Eurostat, own modeling
Figure 28 – Distribution of energy consumption in the service sector in the BAU and EA
scenarios
The implementation of the EA scenario presupposes important changes. While energy
consumption will stagnate and increase slightly until 2040, a declining trend will emerge
afterward. Although the energy savings are significantly lower than for households, it seems
that intervention is needed to reduce energy consumption in the energy sector. Such a
regulatory tool could be the energy efficiency obligation scheme to be introduced,
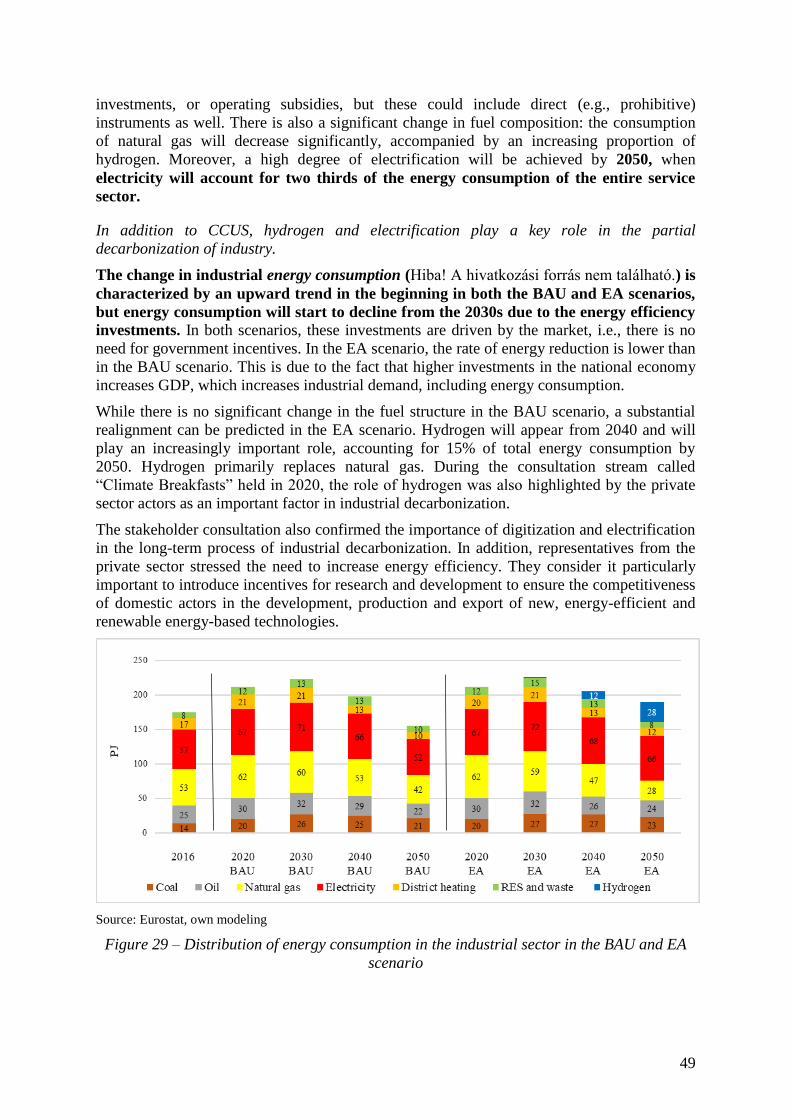
49
investments, or operating subsidies, but these could include direct (e.g., prohibitive)
instruments as well. There is also a significant change in fuel composition: the consumption
of natural gas will decrease significantly, accompanied by an increasing proportion of
hydrogen. Moreover, a high degree of electrification will be achieved by 2050, when
electricity will account for two thirds of the energy consumption of the entire service
sector.
In addition to CCUS, hydrogen and electrification play a key role in the partial
decarbonization of industry.
The change in industrial energy consumption (Hiba! A hivatkozási forrás nem található.) is
characterized by an upward trend in the beginning in both the BAU and EA scenarios,
but energy consumption will start to decline from the 2030s due to the energy efficiency
investments. In both scenarios, these investments are driven by the market, i.e., there is no
need for government incentives. In the EA scenario, the rate of energy reduction is lower than
in the BAU scenario. This is due to the fact that higher investments in the national economy
increases GDP, which increases industrial demand, including energy consumption.
While there is no significant change in the fuel structure in the BAU scenario, a substantial
realignment can be predicted in the EA scenario. Hydrogen will appear from 2040 and will
play an increasingly important role, accounting for 15% of total energy consumption by
2050. Hydrogen primarily replaces natural gas. During the consultation stream called
“Climate Breakfasts” held in 2020, the role of hydrogen was also highlighted by the private
sector actors as an important factor in industrial decarbonization.
The stakeholder consultation also confirmed the importance of digitization and electrification
in the long-term process of industrial decarbonization. In addition, representatives from the
private sector stressed the need to increase energy efficiency. They consider it particularly
important to introduce incentives for research and development to ensure the competitiveness
of domestic actors in the development, production and export of new, energy-efficient and
renewable energy-based technologies.
Source: Eurostat, own modeling
Figure 29 – Distribution of energy consumption in the industrial sector in the BAU and EA
scenario
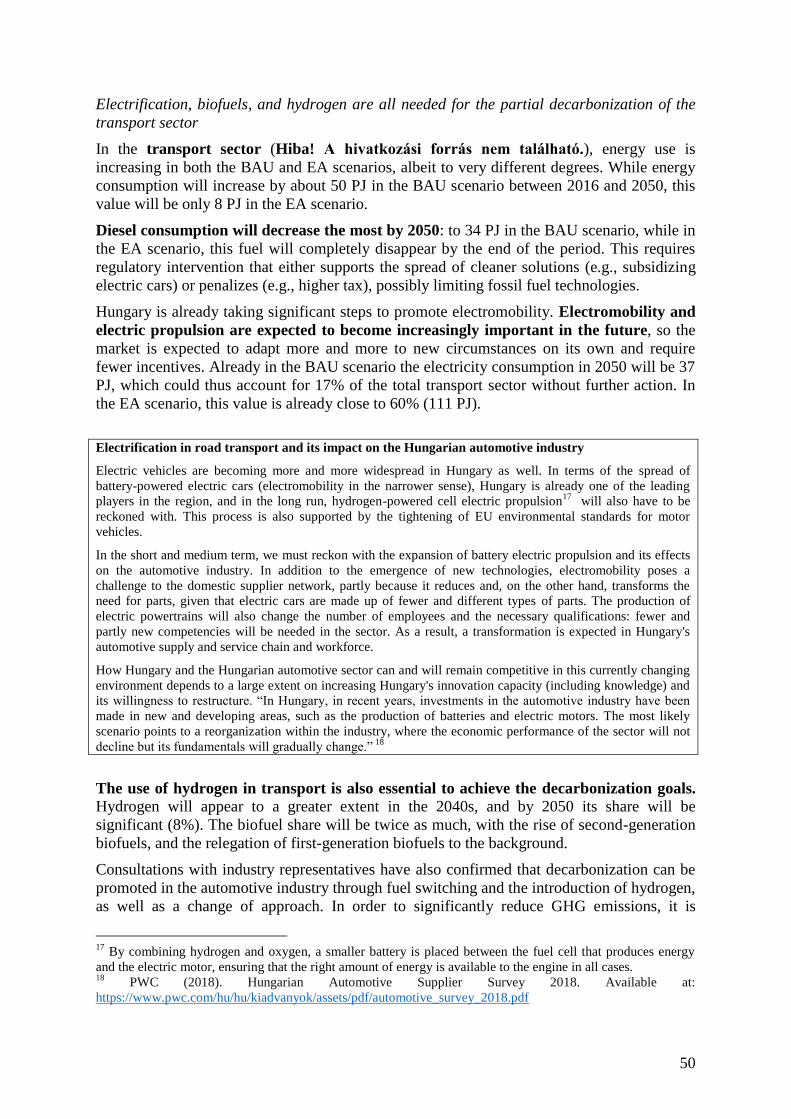
50
Electrification, biofuels, and hydrogen are all needed for the partial decarbonization of the
transport sector
In the transport sector (Hiba! A hivatkozási forrás nem található.), energy use is
increasing in both the BAU and EA scenarios, albeit to very different degrees. While energy
consumption will increase by about 50 PJ in the BAU scenario between 2016 and 2050, this
value will be only 8 PJ in the EA scenario.
Diesel consumption will decrease the most by 2050: to 34 PJ in the BAU scenario, while in
the EA scenario, this fuel will completely disappear by the end of the period. This requires
regulatory intervention that either supports the spread of cleaner solutions (e.g., subsidizing
electric cars) or penalizes (e.g., higher tax), possibly limiting fossil fuel technologies.
Hungary is already taking significant steps to promote electromobility. Electromobility and
electric propulsion are expected to become increasingly important in the future, so the
market is expected to adapt more and more to new circumstances on its own and require
fewer incentives. Already in the BAU scenario the electricity consumption in 2050 will be 37
PJ, which could thus account for 17% of the total transport sector without further action. In
the EA scenario, this value is already close to 60% (111 PJ).
Electrification in road transport and its impact on the Hungarian automotive industry
Electric vehicles are becoming more and more widespread in Hungary as well. In terms of the spread of
battery-powered electric cars (electromobility in the narrower sense), Hungary is already one of the leading
players in the region, and in the long run, hydrogen-powered cell electric propulsion17
will also have to be
reckoned with. This process is also supported by the tightening of EU environmental standards for motor
vehicles.
In the short and medium term, we must reckon with the expansion of battery electric propulsion and its effects
on the automotive industry. In addition to the emergence of new technologies, electromobility poses a
challenge to the domestic supplier network, partly because it reduces and, on the other hand, transforms the
need for parts, given that electric cars are made up of fewer and different types of parts. The production of
electric powertrains will also change the number of employees and the necessary qualifications: fewer and
partly new competencies will be needed in the sector. As a result, a transformation is expected in Hungary's
automotive supply and service chain and workforce.
How Hungary and the Hungarian automotive sector can and will remain competitive in this currently changing
environment depends to a large extent on increasing Hungary's innovation capacity (including knowledge) and
its willingness to restructure. “In Hungary, in recent years, investments in the automotive industry have been
made in new and developing areas, such as the production of batteries and electric motors. The most likely
scenario points to a reorganization within the industry, where the economic performance of the sector will not
decline but its fundamentals will gradually change.” 18
The use of hydrogen in transport is also essential to achieve the decarbonization goals.
Hydrogen will appear to a greater extent in the 2040s, and by 2050 its share will be
significant (8%). The biofuel share will be twice as much, with the rise of second-generation
biofuels, and the relegation of first-generation biofuels to the background.
Consultations with industry representatives have also confirmed that decarbonization can be
promoted in the automotive industry through fuel switching and the introduction of hydrogen,
as well as a change of approach. In order to significantly reduce GHG emissions, it is
17
By combining hydrogen and oxygen, a smaller battery is placed between the fuel cell that produces energy
and the electric motor, ensuring that the right amount of energy is available to the engine in all cases. 18
PWC (2018). Hungarian Automotive Supplier Survey 2018. Available at:
https://www.pwc.com/hu/hu/kiadvanyok/assets/pdf/automotive_survey_2018.pdf
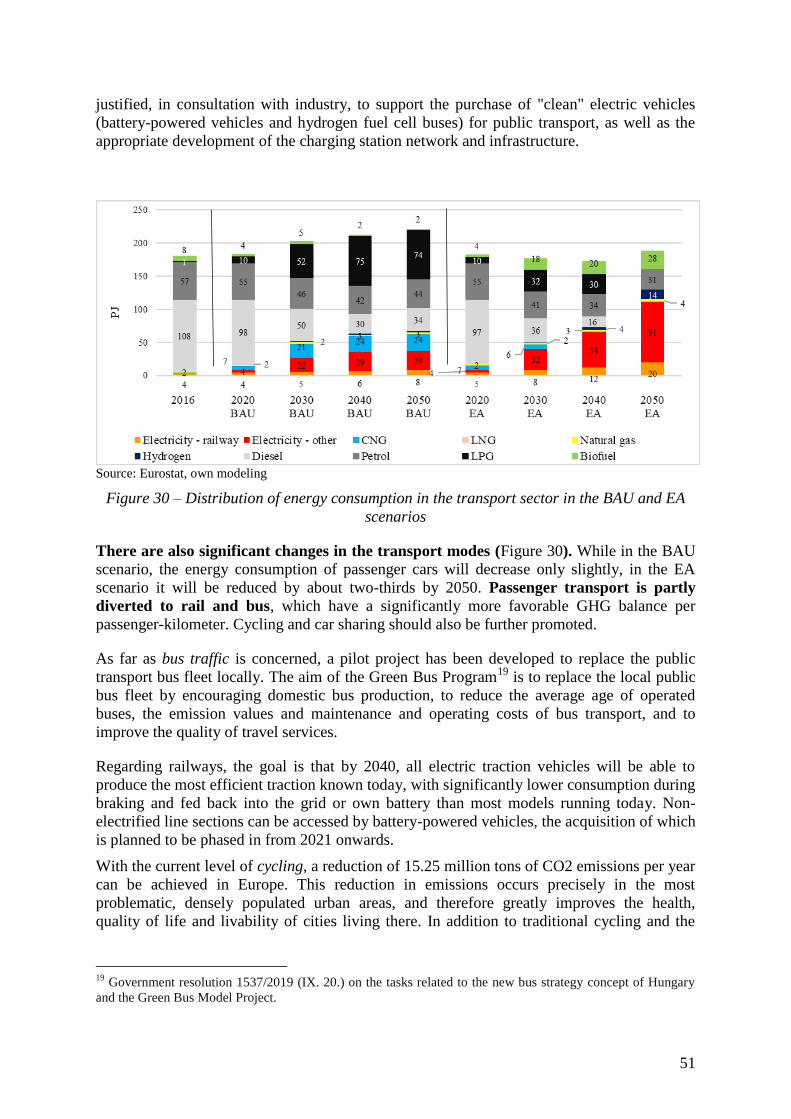
51
justified, in consultation with industry, to support the purchase of "clean" electric vehicles
(battery-powered vehicles and hydrogen fuel cell buses) for public transport, as well as the
appropriate development of the charging station network and infrastructure.
Source: Eurostat, own modeling
Figure 30 – Distribution of energy consumption in the transport sector in the BAU and EA
scenarios
There are also significant changes in the transport modes (Figure 30). While in the BAU
scenario, the energy consumption of passenger cars will decrease only slightly, in the EA
scenario it will be reduced by about two-thirds by 2050. Passenger transport is partly
diverted to rail and bus, which have a significantly more favorable GHG balance per
passenger-kilometer. Cycling and car sharing should also be further promoted.
As far as bus traffic is concerned, a pilot project has been developed to replace the public
transport bus fleet locally. The aim of the Green Bus Program19
is to replace the local public
bus fleet by encouraging domestic bus production, to reduce the average age of operated
buses, the emission values and maintenance and operating costs of bus transport, and to
improve the quality of travel services.
Regarding railways, the goal is that by 2040, all electric traction vehicles will be able to
produce the most efficient traction known today, with significantly lower consumption during
braking and fed back into the grid or own battery than most models running today. Non-
electrified line sections can be accessed by battery-powered vehicles, the acquisition of which
is planned to be phased in from 2021 onwards.
With the current level of cycling, a reduction of 15.25 million tons of CO2 emissions per year
can be achieved in Europe. This reduction in emissions occurs precisely in the most
problematic, densely populated urban areas, and therefore greatly improves the health,
quality of life and livability of cities living there. In addition to traditional cycling and the
19
Government resolution 1537/2019 (IX. 20.) on the tasks related to the new bus strategy concept of Hungary
and the Green Bus Model Project.

52
necessary infrastructure, electric bicycles and scooters can play a greater role in urban
transport and its decarbonization in the long term.
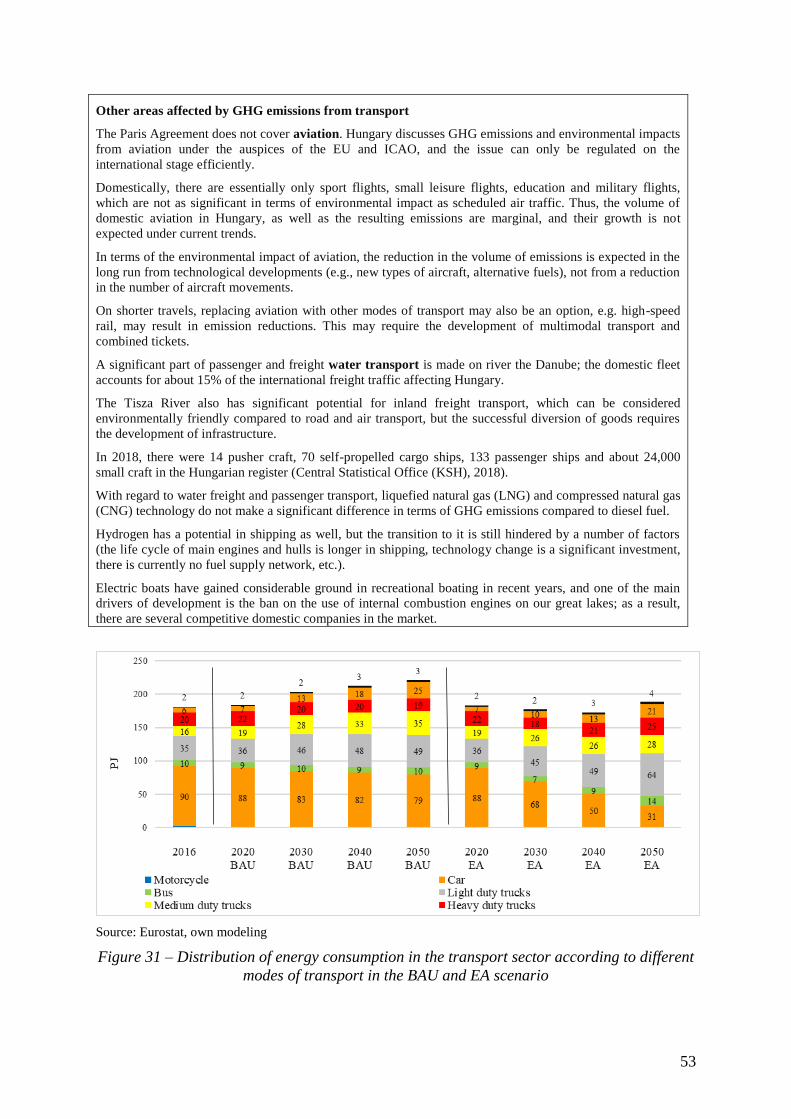
53
Other areas affected by GHG emissions from transport
The Paris Agreement does not cover aviation. Hungary discusses GHG emissions and environmental impacts
from aviation under the auspices of the EU and ICAO, and the issue can only be regulated on the
international stage efficiently.
Domestically, there are essentially only sport flights, small leisure flights, education and military flights,
which are not as significant in terms of environmental impact as scheduled air traffic. Thus, the volume of
domestic aviation in Hungary, as well as the resulting emissions are marginal, and their growth is not
expected under current trends.
In terms of the environmental impact of aviation, the reduction in the volume of emissions is expected in the
long run from technological developments (e.g., new types of aircraft, alternative fuels), not from a reduction
in the number of aircraft movements.
On shorter travels, replacing aviation with other modes of transport may also be an option, e.g. high-speed
rail, may result in emission reductions. This may require the development of multimodal transport and
combined tickets.
A significant part of passenger and freight water transport is made on river the Danube; the domestic fleet
accounts for about 15% of the international freight traffic affecting Hungary.
The Tisza River also has significant potential for inland freight transport, which can be considered
environmentally friendly compared to road and air transport, but the successful diversion of goods requires
the development of infrastructure.
In 2018, there were 14 pusher craft, 70 self-propelled cargo ships, 133 passenger ships and about 24,000
small craft in the Hungarian register (Central Statistical Office (KSH), 2018).
With regard to water freight and passenger transport, liquefied natural gas (LNG) and compressed natural gas
(CNG) technology do not make a significant difference in terms of GHG emissions compared to diesel fuel.
Hydrogen has a potential in shipping as well, but the transition to it is still hindered by a number of factors
(the life cycle of main engines and hulls is longer in shipping, technology change is a significant investment,
there is currently no fuel supply network, etc.).
Electric boats have gained considerable ground in recreational boating in recent years, and one of the main
drivers of development is the ban on the use of internal combustion engines on our great lakes; as a result,
there are several competitive domestic companies in the market.
Source: Eurostat, own modeling
Figure 31 – Distribution of energy consumption in the transport sector according to different
modes of transport in the BAU and EA scenario
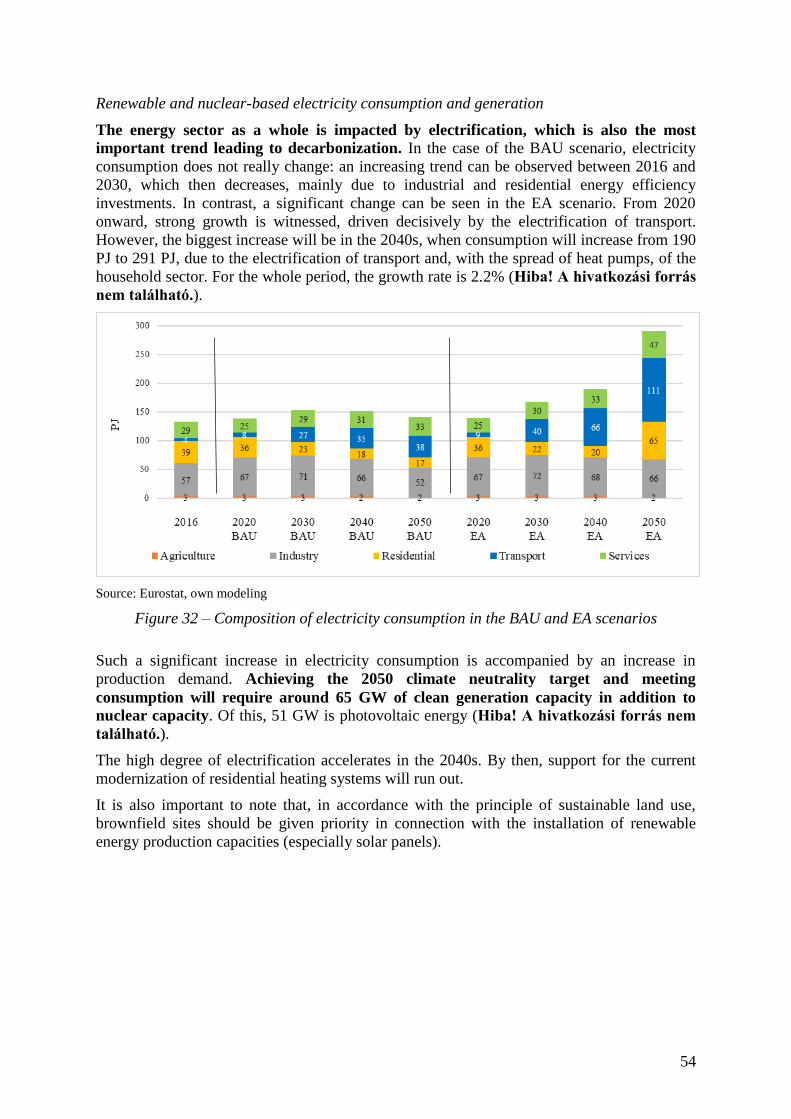
54
Renewable and nuclear-based electricity consumption and generation
The energy sector as a whole is impacted by electrification, which is also the most
important trend leading to decarbonization. In the case of the BAU scenario, electricity
consumption does not really change: an increasing trend can be observed between 2016 and
2030, which then decreases, mainly due to industrial and residential energy efficiency
investments. In contrast, a significant change can be seen in the EA scenario. From 2020
onward, strong growth is witnessed, driven decisively by the electrification of transport.
However, the biggest increase will be in the 2040s, when consumption will increase from 190
PJ to 291 PJ, due to the electrification of transport and, with the spread of heat pumps, of the
household sector. For the whole period, the growth rate is 2.2% (Hiba! A hivatkozási forrás
nem található.).
Source: Eurostat, own modeling
Figure 32 – Composition of electricity consumption in the BAU and EA scenarios
Such a significant increase in electricity consumption is accompanied by an increase in
production demand. Achieving the 2050 climate neutrality target and meeting
consumption will require around 65 GW of clean generation capacity in addition to
nuclear capacity. Of this, 51 GW is photovoltaic energy (Hiba! A hivatkozási forrás nem
található.).
The high degree of electrification accelerates in the 2040s. By then, support for the current
modernization of residential heating systems will run out.
It is also important to note that, in accordance with the principle of sustainable land use,
brownfield sites should be given priority in connection with the installation of renewable
energy production capacities (especially solar panels).
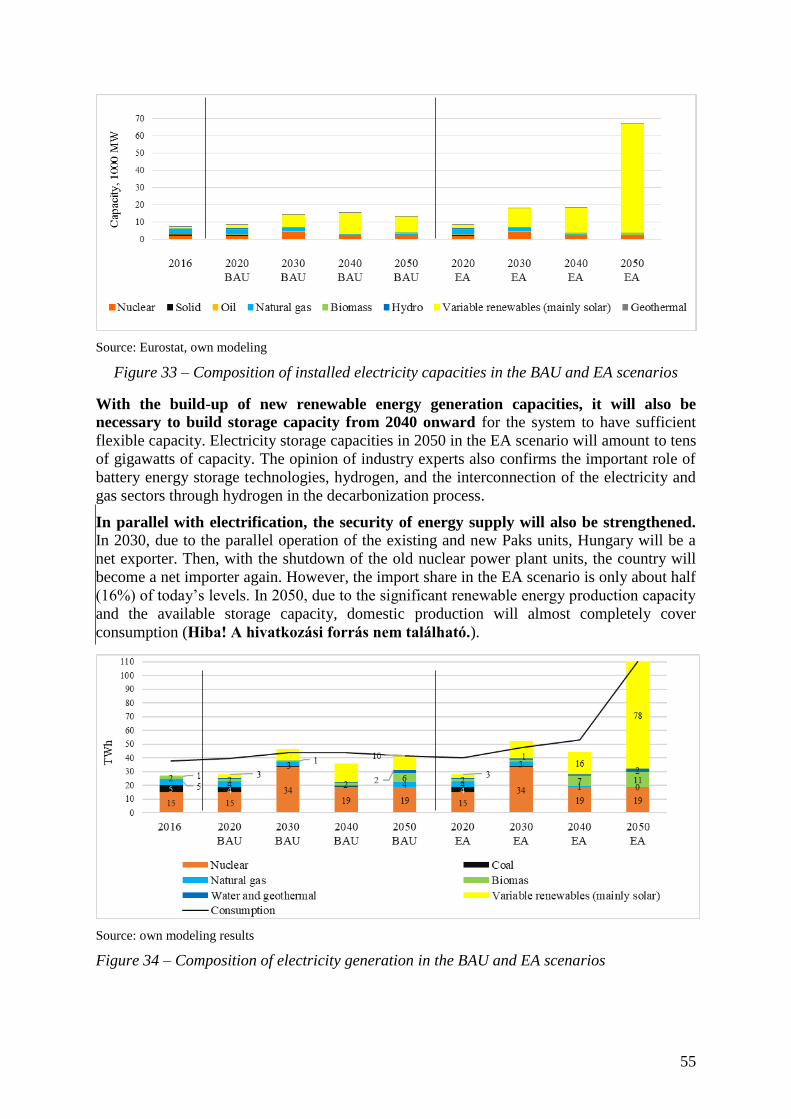
55
Source: Eurostat, own modeling
Figure 33 – Composition of installed electricity capacities in the BAU and EA scenarios
With the build-up of new renewable energy generation capacities, it will also be
necessary to build storage capacity from 2040 onward for the system to have sufficient
flexible capacity. Electricity storage capacities in 2050 in the EA scenario will amount to tens
of gigawatts of capacity. The opinion of industry experts also confirms the important role of
battery energy storage technologies, hydrogen, and the interconnection of the electricity and
gas sectors through hydrogen in the decarbonization process.
In parallel with electrification, the security of energy supply will also be strengthened.
In 2030, due to the parallel operation of the existing and new Paks units, Hungary will be a
net exporter. Then, with the shutdown of the old nuclear power plant units, the country will
become a net importer again. However, the import share in the EA scenario is only about half
(16%) of today’s levels. In 2050, due to the significant renewable energy production capacity
and the available storage capacity, domestic production will almost completely cover
consumption (Hiba! A hivatkozási forrás nem található.).
Source: own modeling results
Figure 34 – Composition of electricity generation in the BAU and EA scenarios
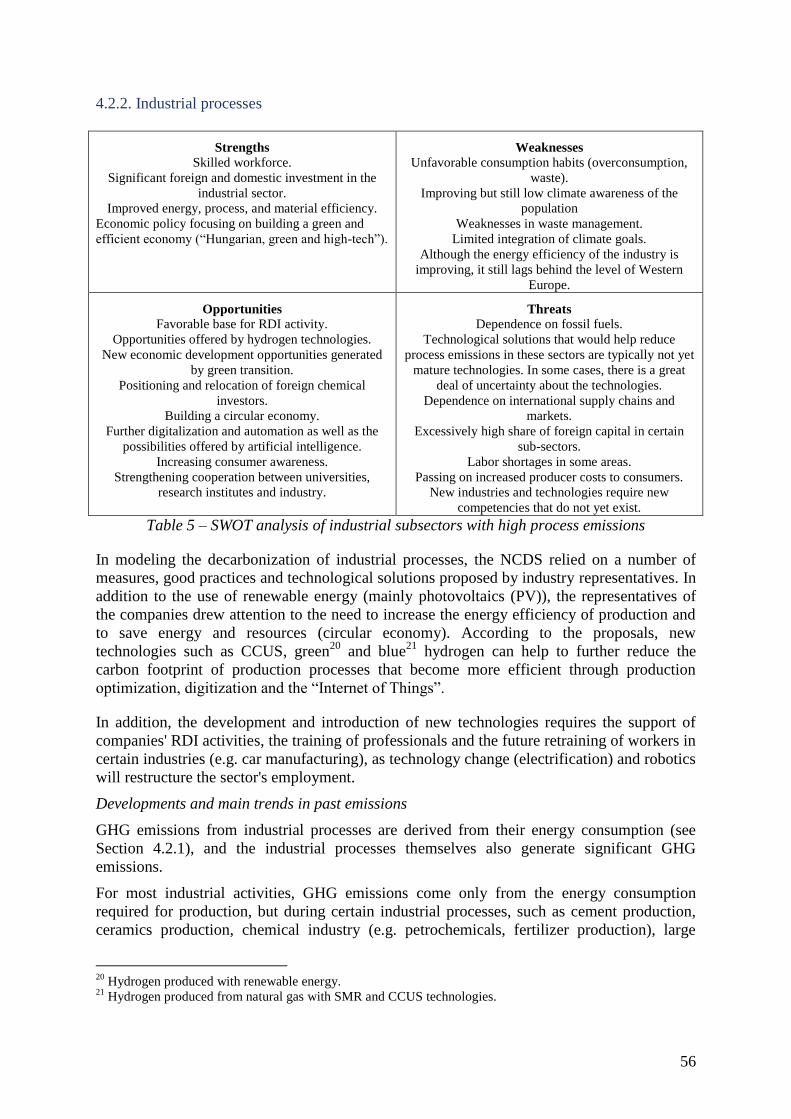
56
4.2.2. Industrial processes
Strengths
Skilled workforce.
Significant foreign and domestic investment in the
industrial sector.
Improved energy, process, and material efficiency.
Economic policy focusing on building a green and
efficient economy (“Hungarian, green and high-tech”).
Weaknesses
Unfavorable consumption habits (overconsumption,
waste).
Improving but still low climate awareness of the
population
Weaknesses in waste management.
Limited integration of climate goals.
Although the energy efficiency of the industry is
improving, it still lags behind the level of Western
Europe.
Opportunities
Favorable base for RDI activity.
Opportunities offered by hydrogen technologies.
New economic development opportunities generated
by green transition.
Positioning and relocation of foreign chemical
investors.
Building a circular economy.
Further digitalization and automation as well as the
possibilities offered by artificial intelligence.
Increasing consumer awareness.
Strengthening cooperation between universities,
research institutes and industry.
Threats
Dependence on fossil fuels.
Technological solutions that would help reduce
process emissions in these sectors are typically not yet
mature technologies. In some cases, there is a great
deal of uncertainty about the technologies.
Dependence on international supply chains and
markets.
Excessively high share of foreign capital in certain
sub-sectors.
Labor shortages in some areas.
Passing on increased producer costs to consumers.
New industries and technologies require new
competencies that do not yet exist.
Table 5 – SWOT analysis of industrial subsectors with high process emissions
In modeling the decarbonization of industrial processes, the NCDS relied on a number of
measures, good practices and technological solutions proposed by industry representatives. In
addition to the use of renewable energy (mainly photovoltaics (PV)), the representatives of
the companies drew attention to the need to increase the energy efficiency of production and
to save energy and resources (circular economy). According to the proposals, new
technologies such as CCUS, green20
and blue21
hydrogen can help to further reduce the
carbon footprint of production processes that become more efficient through production
optimization, digitization and the “Internet of Things”.
In addition, the development and introduction of new technologies requires the support of
companies' RDI activities, the training of professionals and the future retraining of workers in
certain industries (e.g. car manufacturing), as technology change (electrification) and robotics
will restructure the sector's employment.
Developments and main trends in past emissions
GHG emissions from industrial processes are derived from their energy consumption (see
Section 4.2.1), and the industrial processes themselves also generate significant GHG
emissions.
For most industrial activities, GHG emissions come only from the energy consumption
required for production, but during certain industrial processes, such as cement production,
ceramics production, chemical industry (e.g. petrochemicals, fertilizer production), large
20
Hydrogen produced with renewable energy. 21
Hydrogen produced from natural gas with SMR and CCUS technologies.
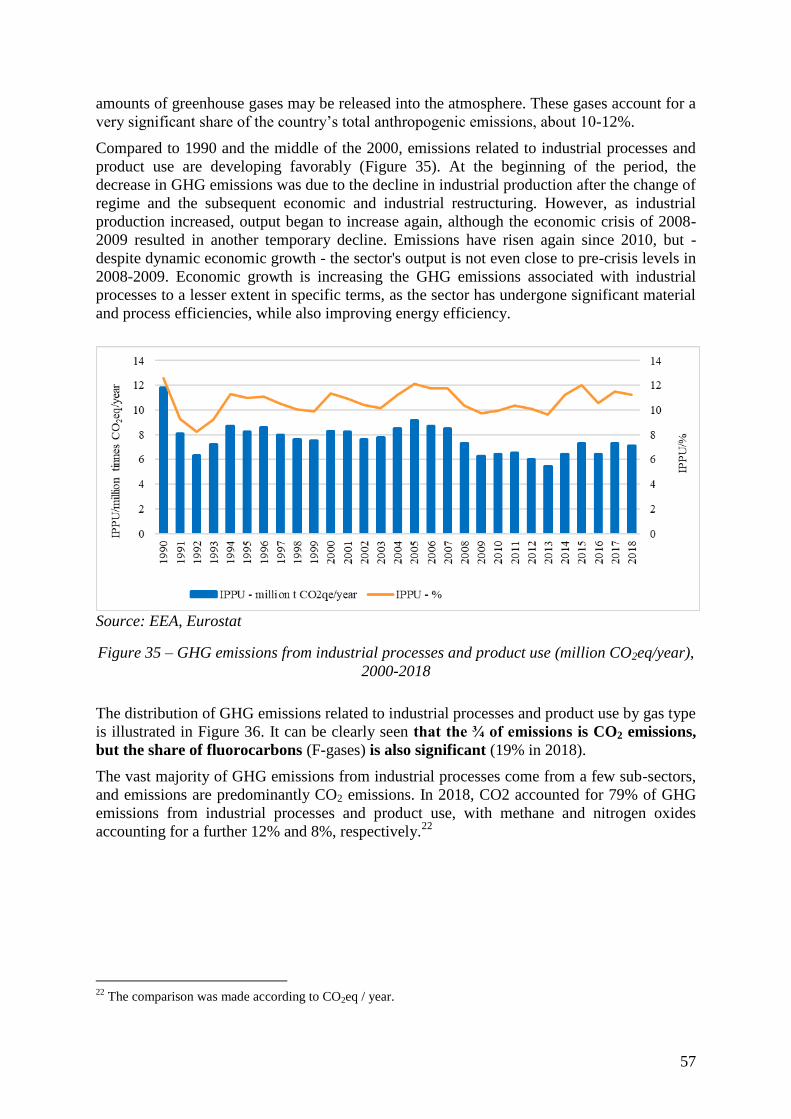
57
amounts of greenhouse gases may be released into the atmosphere. These gases account for a
very significant share of the country’s total anthropogenic emissions, about 10-12%.
Compared to 1990 and the middle of the 2000, emissions related to industrial processes and
product use are developing favorably (Figure 35). At the beginning of the period, the
decrease in GHG emissions was due to the decline in industrial production after the change of
regime and the subsequent economic and industrial restructuring. However, as industrial
production increased, output began to increase again, although the economic crisis of 2008-
2009 resulted in another temporary decline. Emissions have risen again since 2010, but -
despite dynamic economic growth - the sector's output is not even close to pre-crisis levels in
2008-2009. Economic growth is increasing the GHG emissions associated with industrial
processes to a lesser extent in specific terms, as the sector has undergone significant material
and process efficiencies, while also improving energy efficiency.
Source: EEA, Eurostat
Figure 35 – GHG emissions from industrial processes and product use (million CO2eq/year),
2000-2018
The distribution of GHG emissions related to industrial processes and product use by gas type
is illustrated in Figure 36. It can be clearly seen that the ¾ of emissions is CO2 emissions,
but the share of fluorocarbons (F-gases) is also significant (19% in 2018).
The vast majority of GHG emissions from industrial processes come from a few sub-sectors,
and emissions are predominantly CO2 emissions. In 2018, CO2 accounted for 79% of GHG
emissions from industrial processes and product use, with methane and nitrogen oxides
accounting for a further 12% and 8%, respectively.22
22
The comparison was made according to CO2eq / year.
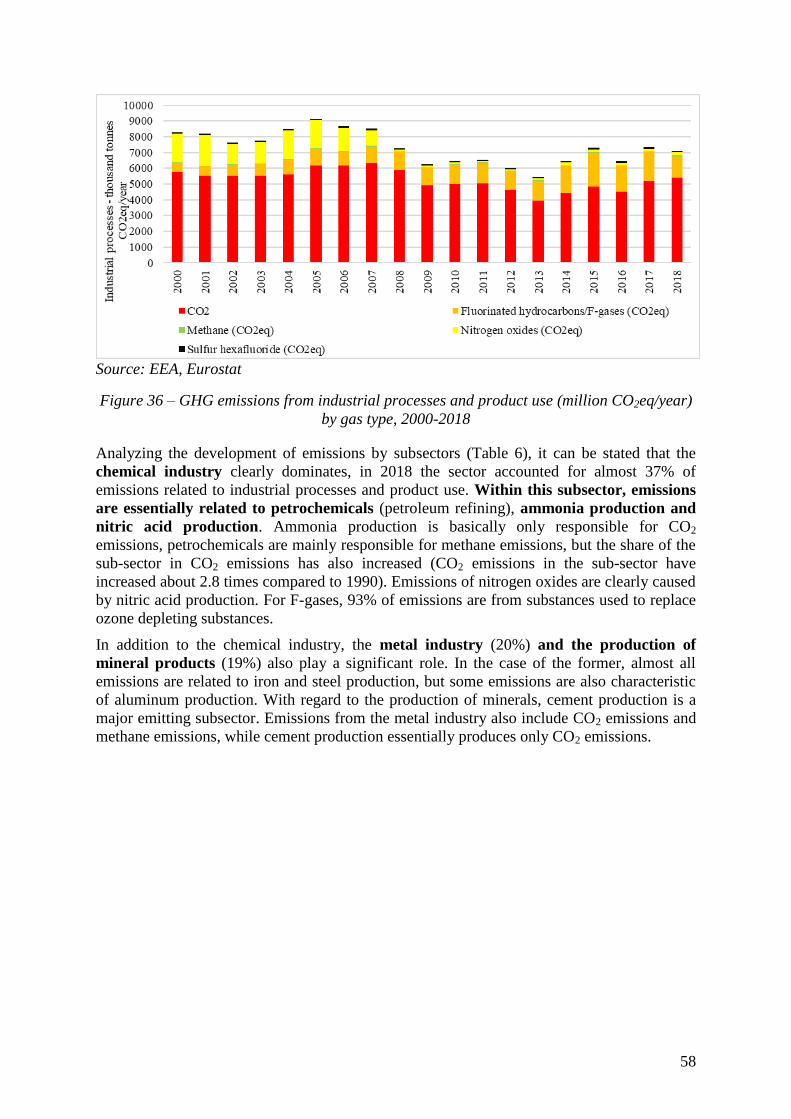
58
Source: EEA, Eurostat
Figure 36 – GHG emissions from industrial processes and product use (million CO2eq/year)
by gas type, 2000-2018
Analyzing the development of emissions by subsectors (Table 6), it can be stated that the
chemical industry clearly dominates, in 2018 the sector accounted for almost 37% of
emissions related to industrial processes and product use. Within this subsector, emissions
are essentially related to petrochemicals (petroleum refining), ammonia production and
nitric acid production. Ammonia production is basically only responsible for CO2
emissions, petrochemicals are mainly responsible for methane emissions, but the share of the
sub-sector in CO2 emissions has also increased (CO2 emissions in the sub-sector have
increased about 2.8 times compared to 1990). Emissions of nitrogen oxides are clearly caused
by nitric acid production. For F-gases, 93% of emissions are from substances used to replace
ozone depleting substances.
In addition to the chemical industry, the metal industry (20%) and the production of
mineral products (19%) also play a significant role. In the case of the former, almost all
emissions are related to iron and steel production, but some emissions are also characteristic
of aluminum production. With regard to the production of minerals, cement production is a
major emitting subsector. Emissions from the metal industry also include CO2 emissions and
methane emissions, while cement production essentially produces only CO2 emissions.
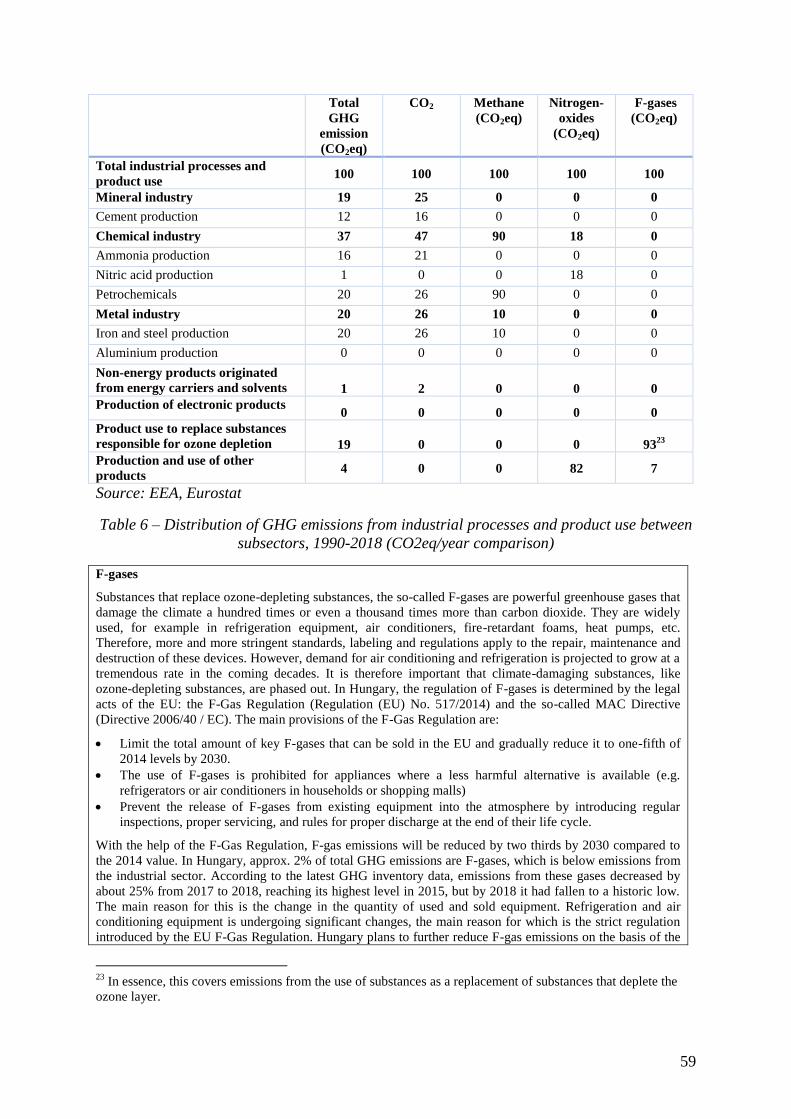
59
Total
GHG
emission
(CO2eq)
CO2 Methane
(CO2eq)
Nitrogen-
oxides
(CO2eq)
F-gases
(CO2eq)
Total industrial processes and
product use 100 100 100 100 100
Mineral industry 19 25 0 0 0
Cement production 12 16 0 0 0
Chemical industry 37 47 90 18 0
Ammonia production 16 21 0 0 0
Nitric acid production 1 0 0 18 0
Petrochemicals 20 26 90 0 0
Metal industry 20 26 10 0 0
Iron and steel production 20 26 10 0 0
Aluminium production 0 0 0 0 0
Non-energy products originated
from energy carriers and solvents 1 2 0 0 0
Production of electronic products 0 0 0 0 0
Product use to replace substances
responsible for ozone depletion 19 0 0 0 9323
Production and use of other
products 4 0 0 82 7
Source: EEA, Eurostat
Table 6 – Distribution of GHG emissions from industrial processes and product use between
subsectors, 1990-2018 (CO2eq/year comparison)
F-gases
Substances that replace ozone-depleting substances, the so-called F-gases are powerful greenhouse gases that
damage the climate a hundred times or even a thousand times more than carbon dioxide. They are widely
used, for example in refrigeration equipment, air conditioners, fire-retardant foams, heat pumps, etc.
Therefore, more and more stringent standards, labeling and regulations apply to the repair, maintenance and
destruction of these devices. However, demand for air conditioning and refrigeration is projected to grow at a
tremendous rate in the coming decades. It is therefore important that climate-damaging substances, like
ozone-depleting substances, are phased out. In Hungary, the regulation of F-gases is determined by the legal
acts of the EU: the F-Gas Regulation (Regulation (EU) No. 517/2014) and the so-called MAC Directive
(Directive 2006/40 / EC). The main provisions of the F-Gas Regulation are:
Limit the total amount of key F-gases that can be sold in the EU and gradually reduce it to one-fifth of
2014 levels by 2030.
The use of F-gases is prohibited for appliances where a less harmful alternative is available (e.g.
refrigerators or air conditioners in households or shopping malls)
Prevent the release of F-gases from existing equipment into the atmosphere by introducing regular
inspections, proper servicing, and rules for proper discharge at the end of their life cycle.
With the help of the F-Gas Regulation, F-gas emissions will be reduced by two thirds by 2030 compared to
the 2014 value. In Hungary, approx. 2% of total GHG emissions are F-gases, which is below emissions from
the industrial sector. According to the latest GHG inventory data, emissions from these gases decreased by
about 25% from 2017 to 2018, reaching its highest level in 2015, but by 2018 it had fallen to a historic low.
The main reason for this is the change in the quantity of used and sold equipment. Refrigeration and air
conditioning equipment is undergoing significant changes, the main reason for which is the strict regulation
introduced by the EU F-Gas Regulation. Hungary plans to further reduce F-gas emissions on the basis of the
23
In essence, this covers emissions from the use of substances as a replacement of substances that deplete the
ozone layer.
60
legislative framework of the EU.
Steps to be taken in the field of industrial processes to achieve net zero GHG emissions at the
national level
In order to meet the net zero GHG emissions of 2050 at the national level, emissions related
to industrial processes must be reduced to at least 200-250 thousand tons of CO2eq/year by
2050.
Achieving the decarbonization goal in industry cannot be based on curbing production,
instead efficiency investments and technological developments are needed. In order to
effectively reduce process emissions, dramatic changes are needed in the future in those
industrial sub-sectors that account for a significant share of GHG emissions, namely
petrochemicals, iron and steel, ammonia and cement.
Emissions of nitrogen oxides (mainly N2O) from industrial processes can be reduced
relatively quickly as early as 2030, although further reductions thereafter are limited. It will
be possible to accelerate the reduction of CO2 emissions in the longer term.
In the industrial sector, in addition to the development of production/manufacturing processes
and the increase of material efficiency, the use of CCUS technologies and alternative raw
materials for the replacement of fossil-based energy sources used as certain raw materials
may also be necessary in the future. Moreover, changing consumption patterns, and even
more so the transition to a circular economy, will have a significant positive impact on
reducing industrial emissions. The need to realize all of this is particularly shown by the fact
that industrial production (chemical industry) and construction (and thus the demand for
cement and iron and steel) will continue to expand, so without further interventions,
emissions would increase two to three times by the middle of the century.
Innovative technologies for decarbonization of industrial processes: hydrogen and CCUS
In the future, carbon-free hydrogen and its derivatives, as well as CCUS technologies, may also play a key
role in reducing emissions from industrial processes that are difficult to decarbonize.
With regard to hydrogen use, iron and steel production could be one of the potential area of applications. Iron
is produced by a fire metallurgical process from iron ores, in which oxygen is removed from the iron ore by
reduction with coke. This causes significant carbon emissions. However, reduction with carbon-free or low-
carbon hydrogen may offer an alternative to decarbonized production. Hydrogen and its derivatives can also
be used as a basis for decarbonizing chemical processes and petroleum refining. The production of fuels and
chemical products is largely fossil-based, primarily hydrocarbon-based. Fossil hydrocarbons used as
feedstock could be replaced in the future with synthetic hydrocarbons, which could be produced from CO2
and carbon-free hydrogen removed from the atmosphere or other processes. Carbon-free hydrogen can also
be considered for the production of ammonia, so that the use of ammonia and the use of other ammonia-
based chemical products can also be made carbon-free.
Due to its high energy density, hydrogen can also be a viable solution for extremely heat-intensive industrial
processes such as steam cracking (chemical/refining), iron and steel production (where coke also provides
process heat) and clinker production (cement industry). In the cement industry, another process, the so-called
calcination also involves significant CO2 emissions, which occur when limestone (which consists of 90%
calcium carbonate (CaCO3)) is heated and decomposes to calcium oxide (CaO) and CO2. In practice, this
emission could be reduced by CCUS technology. (CCUS can, of course, also offer a solution for reducing
emissions from thermal energy-intensive processes.)
In accordance with the above, the following factors need to be taken into account:
Economic development and climate protection should be coordinated.
61
In addition to identifying industries with high process emissions, it is strongly
recommended to identify those industries related to sustainability that have the
potential to help strengthen the country's long-term competitiveness.
Reducing GHG emissions in industry to a minimum, close to zero, requires further
modernization of production and process efficiency in certain sub-sectors. Digitization
and automation are spreading further in the industry. In some cases, there may be a
complete change in production technology in some areas, all on a market basis.
There is additional potential for material efficiency. The GHG reduction potential in this
respect can be identified mainly in the construction industry and in the chemical industry.
CCUS technology will not only play a role in energy production, but also in making
industrial processes more climate-friendly. Unfortunately, this technology does not yet
offer a cost-effective alternative. (Further details on the technology can be found in
Section 6.1.1.)
The replacement of fossil fuels (as raw materials) with alternative, “clean” raw materials
will take place in the medium to long term. Hydrogen and its derivatives (e.g. synthetic
methane, synthetic ammonia) as well as biomass-based fuels may offer an alternative to
carbon-free materials in the future. (For more details on the technologies, see Sections
4.2.1 and 6.1.1, respectively.)
By reducing the amount of primary raw material consumption, significant emission
reductions can be realized, which can be achieved primarily by implementing a circular
economy. Building a circular economy is inconceivable without an industrial symbiosis
approach based on the ability of the waste generated by one industry to be used as a raw
material by other industries; and the importance of promoting waste prevention, recycling
and other treatment efforts, and the collection and energy recovery of landfill gas from
landfills and wastewater treatment plants. With the spread of recycling, the production of
many industrial products such as steel, glass and plastics becomes more resource
efficient. Banning single-use plastics generates additional positive effects. (See also
section 4.2.5 on waste management.)
The demand for raw materials and thus process emissions can be further reduced through
effective attitude formation by changing consumption patterns. In this context, it should
be noted that in the future, it would be important to make data on the carbon footprint of
products and services available and transparent, so that conscious consumers can make
informed choices.
A significant part of the technologies with the greatest potential for emission reductions
are not yet considered mature enough. Moreover, many solutions are still in the early
stages of development. Therefore, further Research, development and innovation
(RDI) activities are needed to move forward. In this context, consideration should be
given to redesigning the RDI incentive and tendering system to take greater account of
the need to improve the resource efficiency of industrial processes for climate purposes.
It should be recognized and awareness should be raised that companies will only be able
to meet the tightening standards and societal expectations and new competitive conditions
created by the decarbonization transition if they themselves play an active and
responsible role in the transition, they develop and innovate. The role of the state is to
facilitate this ̶ primarily, but not exclusively - by creating the right incentives and
predictable framework conditions. (For information on innovation opportunities, see
Chapter 6. For possible sources of funding for innovation, see Chapters 5 and 6.)
62
Last but not least, there is a need to fully integrate climate change as a precondition into
industrial development policies.
Emissions from energy use by industry are described in subsection 4.2.1.
Expected trends of the EU emission trading system (EU ETS)
The EU ETS is a key tool among EU policies to combat climate change to reduce greenhouse gas emissions
in a cost-effective way. It is the world’s first and largest carbon trading market. The EU ETS operates in all
EU Member States, as well as in Iceland, Liechtenstein and Norway. It covers more than 11,000 installations
(power plants and industrial plants) and controls about 40% of greenhouse gas emissions for all countries
covered.24
The future of the EU ETS depends to a large extent on market integrity and a shared level of ambition, but
the following trends are expected to shape the period ahead:25
Proposal for an EU climate law and raising the EU's 2030 level of ambition: If the EU commits itself to a
higher level of ambition, the ETS is expected to be strengthened within existing scope of installations.
Strengthening and fine-tuning the EU ETS and then extending its scope to other sectors not currently covered
could lead to consistency in carbon pricing. The revision of the EU ETS due to the higher EU climate target
for 2030 means a revision of the carbon cap by increasing the linear reduction factor (LRF).
EU ETS and energy system integration: a strengthened EU ETS has a key role to play in gradually
facilitating energy system integration and encouraging uptake of least cost emission reduction technologies
and solutions.
2021 review of the market stability reserve (MSR): The planned review of the functioning of the MSR in
2021, which will ensure that the market balance is maintained, will be accompanied by a review of the EU
ETS as a whole.
Use of auctioning revenues: Under the EU ETS Directive, Member States are required to devote at least half
of the revenues from the sale of EU ETS general-purpose allowances and all of the resources from the sale of
aviation allowances to climate and energy investments. In addition, during the revision of the EU ETS
Directive adopted in 2018, the Modernization Fund was established to support energy and energy efficiency
investments in 10 low-income Member States (such as Hungary). These countries continued to receive a
support mechanism under Article 10c of the EU ETS Directive to modernize their energy systems. It is also
important to mention the Innovation Fund, which supports the first large-scale demonstration projects of
some innovative technologies.
The EU ETS and the global carbon market: In the long run, the EU-ETS is expected to be linked to the
carbon markets of other countries and regions in order to prevent carbon leakage and cost-effectively reduce
global CO2 emissions (where available). As a first step, in 2020, the interconnection with the Swiss ETS
system became operational.
Decarbonization pathways of industrial processes
Under the BAU scenario, due to increasing production and without additional measures GHG
emissions will double by 2050, exceeding 14 million tons of CO2eq/year. According to the
EA scenario, industrial processes will become slightly less carbon free in the medium
term than the economy as a whole, but a significant further reduction can be achieved
by 2050. Emissions reduction, material, process and energy efficiency measures and
technologies (including, inter alia, digitization and automation, alternative "clean" raw
materials) and even more so the transition to a circular economy will significantly reduce
emissions to about 215 thousand tons of CO2eq/year levels (Figure 37)
24
For more information, visit https://ec.europa.eu/clima/policies/ets_en 25
EFET (19 June, 2020), Future role of the EU ETS in achieving Europe’s decarbonization targets; Available at:
https://efet.org/Files/Documents/Emissions%20and%20RES/Emissions%20trading/2020/EFET_discussion%20
paper_future%20role%20of%20the%20EU%20ETS_final.pdf
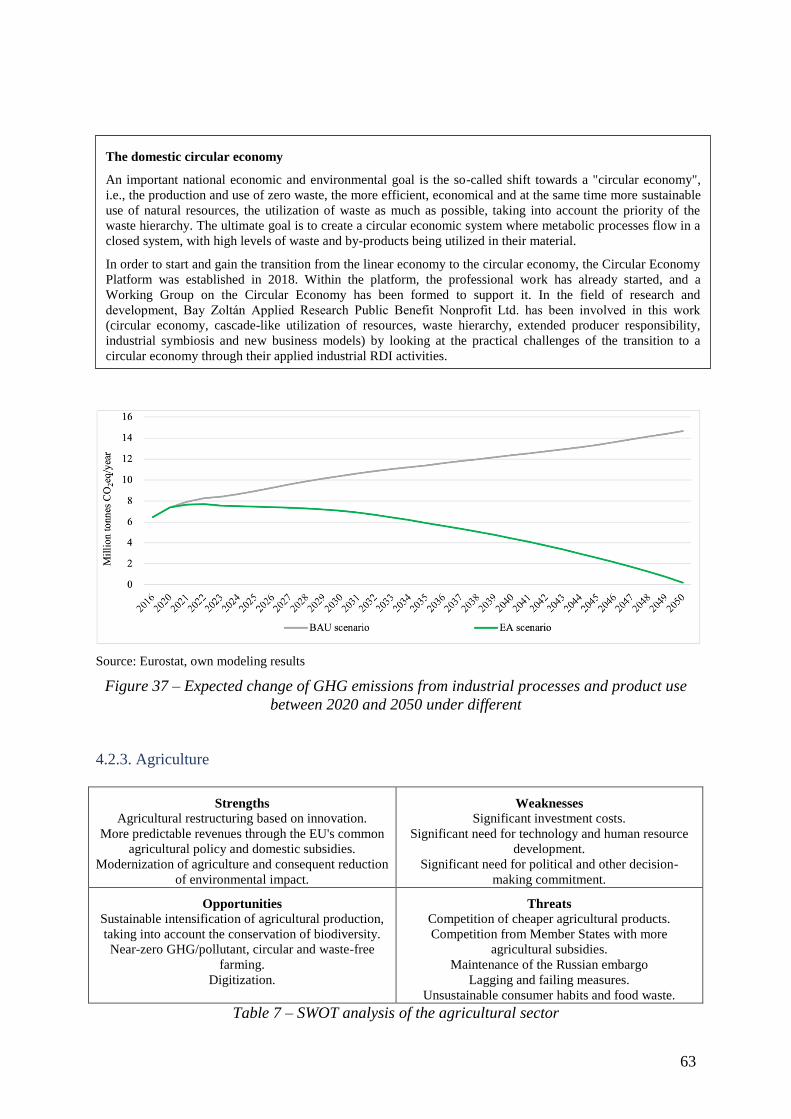
63
Source: Eurostat, own modeling results
Figure 37 – Expected change of GHG emissions from industrial processes and product use
between 2020 and 2050 under different
4.2.3. Agriculture
Strengths
Agricultural restructuring based on innovation.
More predictable revenues through the EU's common
agricultural policy and domestic subsidies.
Modernization of agriculture and consequent reduction
of environmental impact.
Weaknesses
Significant investment costs.
Significant need for technology and human resource
development.
Significant need for political and other decision-
making commitment.
Opportunities
Sustainable intensification of agricultural production,
taking into account the conservation of biodiversity.
Near-zero GHG/pollutant, circular and waste-free
farming.
Digitization.
Threats
Competition of cheaper agricultural products.
Competition from Member States with more
agricultural subsidies.
Maintenance of the Russian embargo
Lagging and failing measures.
Unsustainable consumer habits and food waste.
Table 7 – SWOT analysis of the agricultural sector
The domestic circular economy
An important national economic and environmental goal is the so-called shift towards a "circular economy",
i.e., the production and use of zero waste, the more efficient, economical and at the same time more sustainable
use of natural resources, the utilization of waste as much as possible, taking into account the priority of the
waste hierarchy. The ultimate goal is to create a circular economic system where metabolic processes flow in a
closed system, with high levels of waste and by-products being utilized in their material.
In order to start and gain the transition from the linear economy to the circular economy, the Circular Economy
Platform was established in 2018. Within the platform, the professional work has already started, and a
Working Group on the Circular Economy has been formed to support it. In the field of research and
development, Bay Zoltán Applied Research Public Benefit Nonprofit Ltd. has been involved in this work
(circular economy, cascade-like utilization of resources, waste hierarchy, extended producer responsibility,
industrial symbiosis and new business models) by looking at the practical challenges of the transition to a
circular economy through their applied industrial RDI activities.
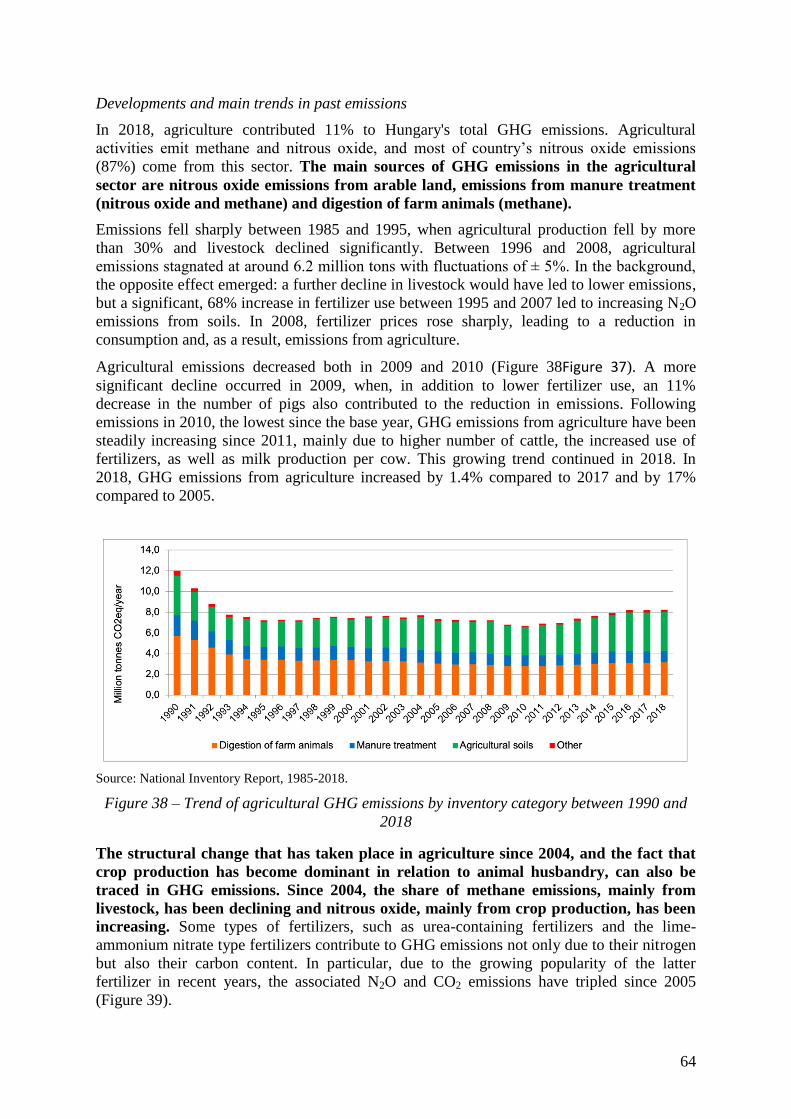
64
Developments and main trends in past emissions
In 2018, agriculture contributed 11% to Hungary's total GHG emissions. Agricultural
activities emit methane and nitrous oxide, and most of country’s nitrous oxide emissions
(87%) come from this sector. The main sources of GHG emissions in the agricultural
sector are nitrous oxide emissions from arable land, emissions from manure treatment
(nitrous oxide and methane) and digestion of farm animals (methane).
Emissions fell sharply between 1985 and 1995, when agricultural production fell by more
than 30% and livestock declined significantly. Between 1996 and 2008, agricultural
emissions stagnated at around 6.2 million tons with fluctuations of ± 5%. In the background,
the opposite effect emerged: a further decline in livestock would have led to lower emissions,
but a significant, 68% increase in fertilizer use between 1995 and 2007 led to increasing N2O
emissions from soils. In 2008, fertilizer prices rose sharply, leading to a reduction in
consumption and, as a result, emissions from agriculture.
Agricultural emissions decreased both in 2009 and 2010 (Figure 38Figure 37). A more
significant decline occurred in 2009, when, in addition to lower fertilizer use, an 11%
decrease in the number of pigs also contributed to the reduction in emissions. Following
emissions in 2010, the lowest since the base year, GHG emissions from agriculture have been
steadily increasing since 2011, mainly due to higher number of cattle, the increased use of
fertilizers, as well as milk production per cow. This growing trend continued in 2018. In
2018, GHG emissions from agriculture increased by 1.4% compared to 2017 and by 17%
compared to 2005.
Source: National Inventory Report, 1985-2018.
Figure 38 – Trend of agricultural GHG emissions by inventory category between 1990 and
2018
The structural change that has taken place in agriculture since 2004, and the fact that
crop production has become dominant in relation to animal husbandry, can also be
traced in GHG emissions. Since 2004, the share of methane emissions, mainly from
livestock, has been declining and nitrous oxide, mainly from crop production, has been
increasing. Some types of fertilizers, such as urea-containing fertilizers and the lime-
ammonium nitrate type fertilizers contribute to GHG emissions not only due to their nitrogen
but also their carbon content. In particular, due to the growing popularity of the latter
fertilizer in recent years, the associated N2O and CO2 emissions have tripled since 2005
(Figure 39).
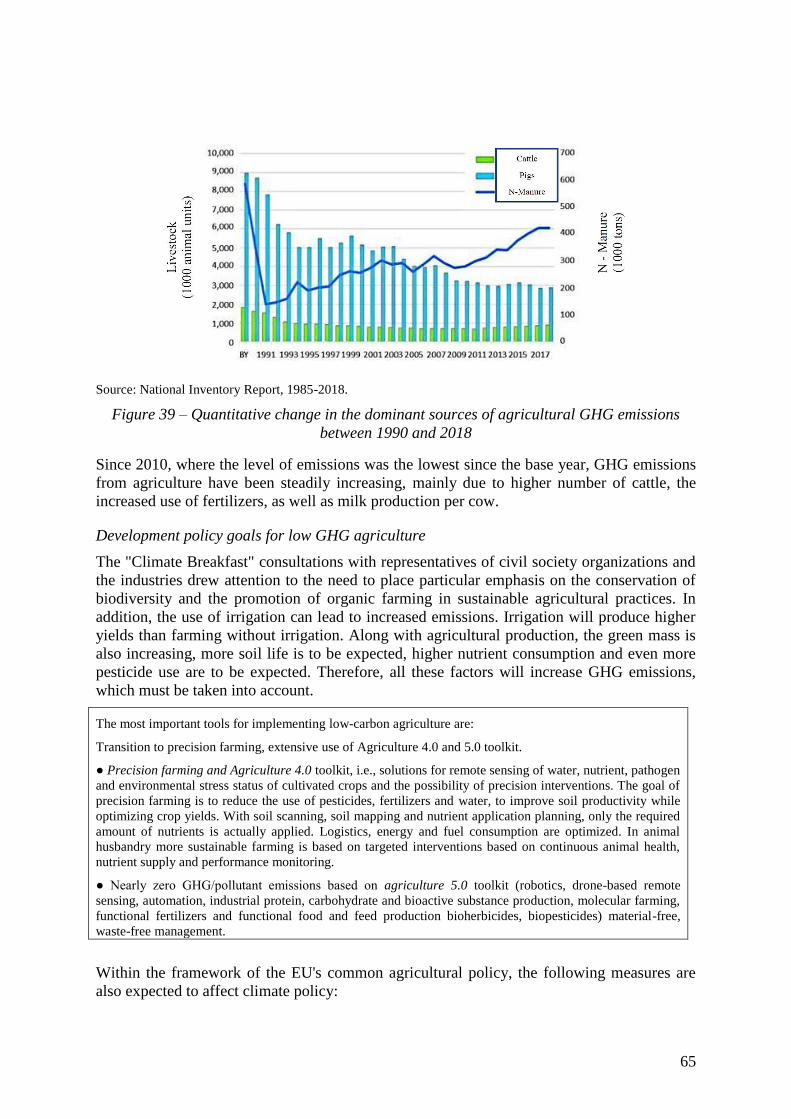
65
Source: National Inventory Report, 1985-2018.
Figure 39 – Quantitative change in the dominant sources of agricultural GHG emissions
between 1990 and 2018
Since 2010, where the level of emissions was the lowest since the base year, GHG emissions
from agriculture have been steadily increasing, mainly due to higher number of cattle, the
increased use of fertilizers, as well as milk production per cow.
Development policy goals for low GHG agriculture
The "Climate Breakfast" consultations with representatives of civil society organizations and
the industries drew attention to the need to place particular emphasis on the conservation of
biodiversity and the promotion of organic farming in sustainable agricultural practices. In
addition, the use of irrigation can lead to increased emissions. Irrigation will produce higher
yields than farming without irrigation. Along with agricultural production, the green mass is
also increasing, more soil life is to be expected, higher nutrient consumption and even more
pesticide use are to be expected. Therefore, all these factors will increase GHG emissions,
which must be taken into account.
The most important tools for implementing low-carbon agriculture are:
Transition to precision farming, extensive use of Agriculture 4.0 and 5.0 toolkit.
● Precision farming and Agriculture 4.0 toolkit, i.e., solutions for remote sensing of water, nutrient, pathogen
and environmental stress status of cultivated crops and the possibility of precision interventions. The goal of
precision farming is to reduce the use of pesticides, fertilizers and water, to improve soil productivity while
optimizing crop yields. With soil scanning, soil mapping and nutrient application planning, only the required
amount of nutrients is actually applied. Logistics, energy and fuel consumption are optimized. In animal
husbandry more sustainable farming is based on targeted interventions based on continuous animal health,
nutrient supply and performance monitoring.
● Nearly zero GHG/pollutant emissions based on agriculture 5.0 toolkit (robotics, drone-based remote
sensing, automation, industrial protein, carbohydrate and bioactive substance production, molecular farming,
functional fertilizers and functional food and feed production bioherbicides, biopesticides) material-free,
waste-free management.
Within the framework of the EU's common agricultural policy, the following measures are
also expected to affect climate policy:
66
- reducing GHG emissions from agriculture through measures to increase yields;
- a 32% reduction in ammonia emissions from agriculture by 2030;
- enhancing carbon sequestration (by increasing soil organic carbon stocks and
biomass);
- improving the gross nutrient balance of the agricultural area;
- the circular use of plant by-products in soil management and biomass-based
agriculture;
- launching pilot plants to demonstrate innovations in the biomass-based economy;
- increasing the size and proportion of areas covered by agri-environmental programs
out of all agricultural areas;
- production of renewable energy of agricultural origin through the rational use of by-
products;
- encouraging climate protection investments and agrotechnical solutions through
producer cooperation.
Long-term course of action
By 2050, the goal is to fully integrate climate change into agricultural policies and practices
as a precondition, taking into account decarbonization requirements and actual changes in
climatic conditions.
GHG emission reduction roadmap to 2050
The purpose of the forecast of GHG emissions from agriculture is to show how different
policy scenarios influence the development of anthropogenic emissions. The calculations are
based on the latest National Inventory Report of 2018. The endpoint of the forecast is 2050,
but it also includes information on intermediate dates.
The following pollutant sources have been calculated for the estimation of GHG emissions
from agricultural sources: methane from digestion, methane from manure treatment, direct
nitrous oxide from manure treatment, indirect nitrous oxide from manure treatment, direct
nitrous oxide from land use, direct nitrous oxide from land use, land use methane from rice
cultivation, CO2 from liming, CO2 from urea-based fertilizers and CO2 from other carbon
fertilizers.
The model predicts manure use based on agricultural areas as well as policy measures that
determine the use of inorganic or organic fertilizers and the amount of manure used (e.g.,
using precision agricultural techniques). The model also predicts livestock trends and
agricultural waste management practices (e.g., manure collection and use).
For livestock, methane emissions are calculated based on the tier 1 methodology of the
national inventory report. Total methane emissions from livestock can be estimated by
summing methane emissions from manure treatment and methane emissions from enteric
fermentation. In the latter, methane emissions are caused by digestive processes and gases
emitted by animals. In the former case, emissions from manure treatment can be calculated
by multiplying the number of animals (e.g. pigs) by the manure production factor and the
methane emission factors used. Historical time series were used by the model to ensure
consistency between simulation results and reference emissions, and to account for changes
in animal husbandry practices (e.g., feeding).
Two scenarios have been developed for the model, based on assumptions about the
macroeconomic environment, food consumption, demographic change and the
implementation of policy measures. (Figure 40)
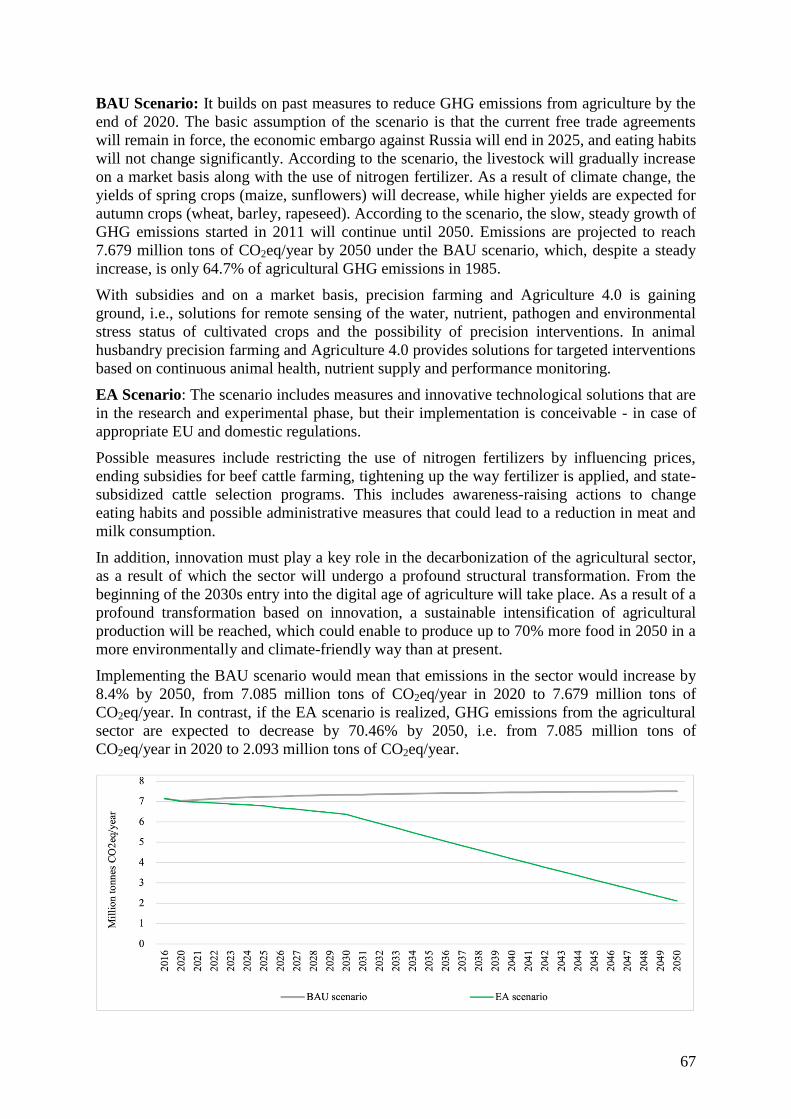
67
BAU Scenario: It builds on past measures to reduce GHG emissions from agriculture by the
end of 2020. The basic assumption of the scenario is that the current free trade agreements
will remain in force, the economic embargo against Russia will end in 2025, and eating habits
will not change significantly. According to the scenario, the livestock will gradually increase
on a market basis along with the use of nitrogen fertilizer. As a result of climate change, the
yields of spring crops (maize, sunflowers) will decrease, while higher yields are expected for
autumn crops (wheat, barley, rapeseed). According to the scenario, the slow, steady growth of
GHG emissions started in 2011 will continue until 2050. Emissions are projected to reach
7.679 million tons of CO2eq/year by 2050 under the BAU scenario, which, despite a steady
increase, is only 64.7% of agricultural GHG emissions in 1985.
With subsidies and on a market basis, precision farming and Agriculture 4.0 is gaining
ground, i.e., solutions for remote sensing of the water, nutrient, pathogen and environmental
stress status of cultivated crops and the possibility of precision interventions. In animal
husbandry precision farming and Agriculture 4.0 provides solutions for targeted interventions
based on continuous animal health, nutrient supply and performance monitoring.
EA Scenario: The scenario includes measures and innovative technological solutions that are
in the research and experimental phase, but their implementation is conceivable - in case of
appropriate EU and domestic regulations.
Possible measures include restricting the use of nitrogen fertilizers by influencing prices,
ending subsidies for beef cattle farming, tightening up the way fertilizer is applied, and state-
subsidized cattle selection programs. This includes awareness-raising actions to change
eating habits and possible administrative measures that could lead to a reduction in meat and
milk consumption.
In addition, innovation must play a key role in the decarbonization of the agricultural sector,
as a result of which the sector will undergo a profound structural transformation. From the
beginning of the 2030s entry into the digital age of agriculture will take place. As a result of a
profound transformation based on innovation, a sustainable intensification of agricultural
production will be reached, which could enable to produce up to 70% more food in 2050 in a
more environmentally and climate-friendly way than at present.
Implementing the BAU scenario would mean that emissions in the sector would increase by
8.4% by 2050, from 7.085 million tons of CO2eq/year in 2020 to 7.679 million tons of
CO2eq/year. In contrast, if the EA scenario is realized, GHG emissions from the agricultural
sector are expected to decrease by 70.46% by 2050, i.e. from 7.085 million tons of
CO2eq/year in 2020 to 2.093 million tons of CO2eq/year.
68
Source: Eurostat, own modelling
Figure 40 – Expected change of GHG emissions in the agricultural sector between 2016 and
2050 in the event of the realization of the BAU and EA scenarios
Under the EA scenario, the greatest GHG emission reduction potential arises from a
substantial structural transformation; By 2050, at least 30% of the protein, carbohydrate,
fat and bioactive needs of food and compound feed production will be produced in closed-
system industrial fermenters, with extraction of bred yeast and unicellular algae from
biomass, with a net climate-neutral balance, using renewable energy. This will allow the
livestock sector to increase or partially replace the production of protein, fat and carbohydrate
feedstocks with climate-neutral technologies.
Further significant reductions in GHG emissions can be predicted from soil emissions,
with the use of nitrogen fertilizer application through precision farming (continuous nitrogen
(N) intake adapted to real plant nutrient supply) and innovations to date (development of
functional N-fertilizers not available for soil micro-organisms that can only be used by higher
plants, combining urea and other carbon fertilizers with biologically treated, continuously
tested and composted sewage sludge and composted sludge remaining after biogasification).
The composition of sewage sludge is not constant and therefore the risk is high due to
contaminants that remain in sewage sludge or sewage sludge compost (heavy metals, drug
residues, pesticides, etc.) during biological treatment, therefore continuous testing is
recommended. In particular, zinc can become dangerously enriched and, from there, can
easily enter the crops grown through the soil and thus to higher levels of the food chain.
However, emissions could fall by 90% from 3.639 million tons of CO2eq/year in 2020 to
0.364 million tons of CO2eq/year by 2050.
According to experts, the use of organic manure is mainly needed on arable land for nutrient
replenishment. Proper organic matter management is an important condition for competitive
and environmentally conscious agricultural production, so it is crucial how producers manage
by-products, e.g. using straw and manure. The effects of the energy utilization of agricultural
raw materials (biomass) directly and indirectly affect all nearly 180,000 Hungarian farmers
with regard to the nutrient replenishment of soils. If no adequate nutrient supply provided to
the soil, the biological activity and biota of the soil is not maintained and the humus levels are
not increased, the soil will not be able to regenerate and, as a result, yields will fall drastically
in the long run.
In addition to serving the needs of other sectors, agriculture must also fulfill its own greening
goals and tasks. The EU’s Farm to Fork strategy (which, together with the Biodiversity
Strategy, serves the objectives of the new EGD) also expects farmers to significantly reduce
their use of fertilizers: they must reduce the amount of fertilizer used by 20% by 2030, so the
demand for manure is expected to increase within the sector as well.
The application of organic fertilizers and the management of organic manure must therefore
be part of precision farming, precisely adapted to current crop needs, both in time and
quantity. And this need must be reflected in stricter regulation of organic manure
management and support policy. If the measures proposed above are taken and successfully
implemented, current emissions of 1.121 million tons CO2eq/year from fertilizer treatment
could be reduced by 82% to 0.200 million tons CO2eq /year by 2050 using plant-specific and
functional composite fertilizers.
Within the agricultural sector, the smallest emission reductions are expected in the
livestock sector, where emissions from digestion will decrease from 2.093 million tons
CO2eq/year in 2020 to 1.429 million tons CO2eq/year by 2050. Although this represents
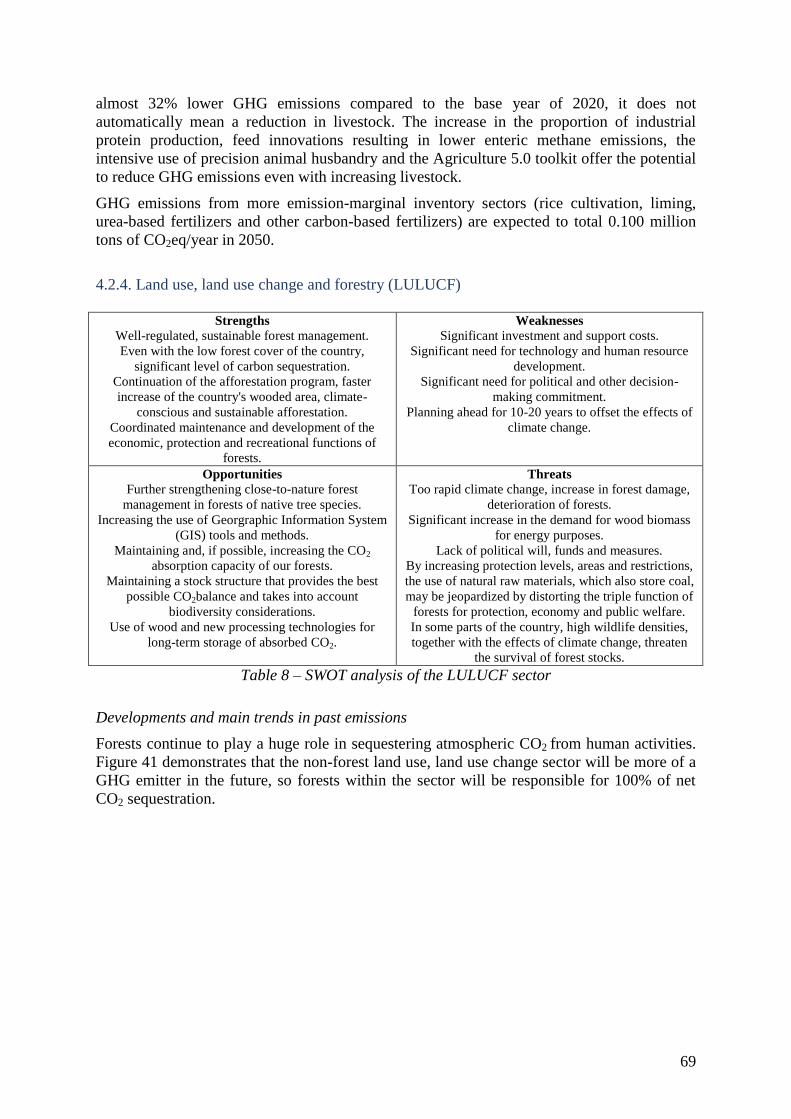
69
almost 32% lower GHG emissions compared to the base year of 2020, it does not
automatically mean a reduction in livestock. The increase in the proportion of industrial
protein production, feed innovations resulting in lower enteric methane emissions, the
intensive use of precision animal husbandry and the Agriculture 5.0 toolkit offer the potential
to reduce GHG emissions even with increasing livestock.
GHG emissions from more emission-marginal inventory sectors (rice cultivation, liming,
urea-based fertilizers and other carbon-based fertilizers) are expected to total 0.100 million
tons of CO2eq/year in 2050.
4.2.4. Land use, land use change and forestry (LULUCF)
Strengths
Well-regulated, sustainable forest management.
Even with the low forest cover of the country,
significant level of carbon sequestration.
Continuation of the afforestation program, faster
increase of the country's wooded area, climate-
conscious and sustainable afforestation.
Coordinated maintenance and development of the
economic, protection and recreational functions of
forests.
Weaknesses
Significant investment and support costs.
Significant need for technology and human resource
development.
Significant need for political and other decision-
making commitment.
Planning ahead for 10-20 years to offset the effects of
climate change.
Opportunities
Further strengthening close-to-nature forest
management in forests of native tree species.
Increasing the use of Georgraphic Information System
(GIS) tools and methods.
Maintaining and, if possible, increasing the CO2
absorption capacity of our forests.
Maintaining a stock structure that provides the best
possible CO2balance and takes into account
biodiversity considerations.
Use of wood and new processing technologies for
long-term storage of absorbed CO2.
Threats
Too rapid climate change, increase in forest damage,
deterioration of forests.
Significant increase in the demand for wood biomass
for energy purposes.
Lack of political will, funds and measures.
By increasing protection levels, areas and restrictions,
the use of natural raw materials, which also store coal,
may be jeopardized by distorting the triple function of
forests for protection, economy and public welfare.
In some parts of the country, high wildlife densities,
together with the effects of climate change, threaten
the survival of forest stocks.
Table 8 – SWOT analysis of the LULUCF sector
Developments and main trends in past emissions
Forests continue to play a huge role in sequestering atmospheric CO2 from human activities.
Figure 41 demonstrates that the non-forest land use, land use change sector will be more of a
GHG emitter in the future, so forests within the sector will be responsible for 100% of net
CO2 sequestration.
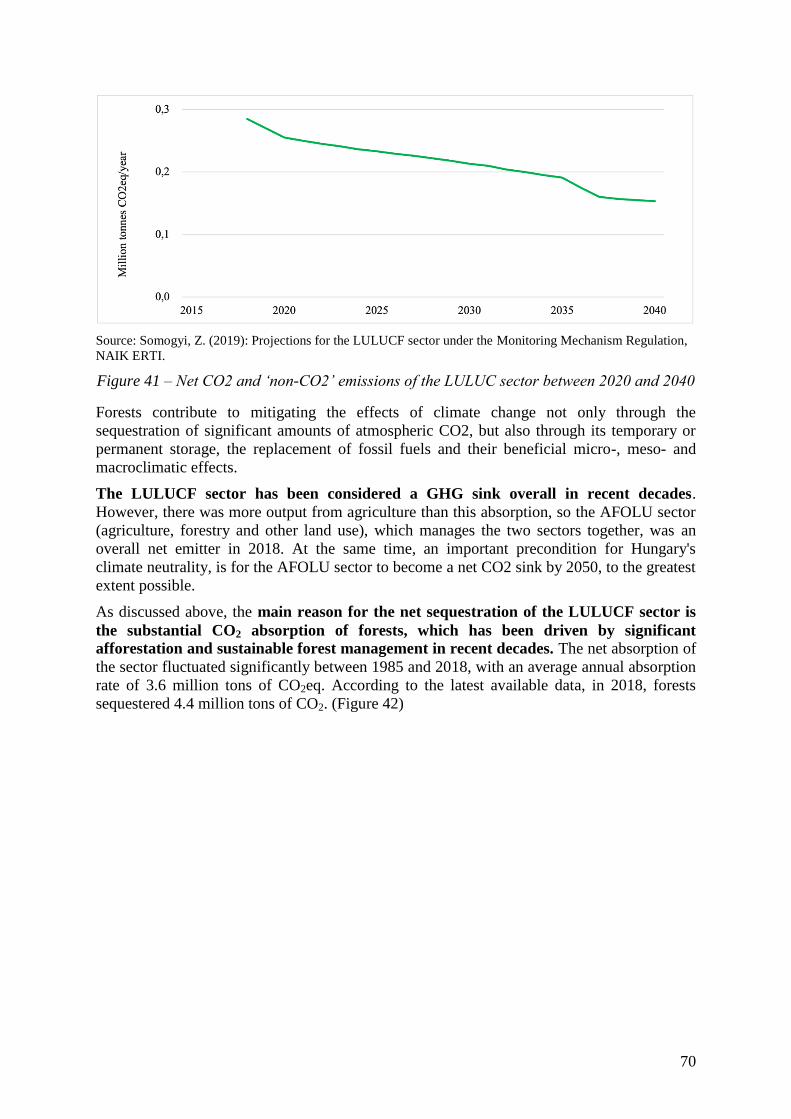
70
Source: Somogyi, Z. (2019): Projections for the LULUCF sector under the Monitoring Mechanism Regulation,
NAIK ERTI.
Figure 41 – Net CO2 and ‘non-CO2’ emissions of the LULUC sector between 2020 and 2040
Forests contribute to mitigating the effects of climate change not only through the
sequestration of significant amounts of atmospheric CO2, but also through its temporary or
permanent storage, the replacement of fossil fuels and their beneficial micro-, meso- and
macroclimatic effects.
The LULUCF sector has been considered a GHG sink overall in recent decades.
However, there was more output from agriculture than this absorption, so the AFOLU sector
(agriculture, forestry and other land use), which manages the two sectors together, was an
overall net emitter in 2018. At the same time, an important precondition for Hungary's
climate neutrality, is for the AFOLU sector to become a net CO2 sink by 2050, to the greatest
extent possible.
As discussed above, the main reason for the net sequestration of the LULUCF sector is
the substantial CO2 absorption of forests, which has been driven by significant
afforestation and sustainable forest management in recent decades. The net absorption of
the sector fluctuated significantly between 1985 and 2018, with an average annual absorption
rate of 3.6 million tons of CO2eq. According to the latest available data, in 2018, forests
sequestered 4.4 million tons of CO2. (Figure 42)
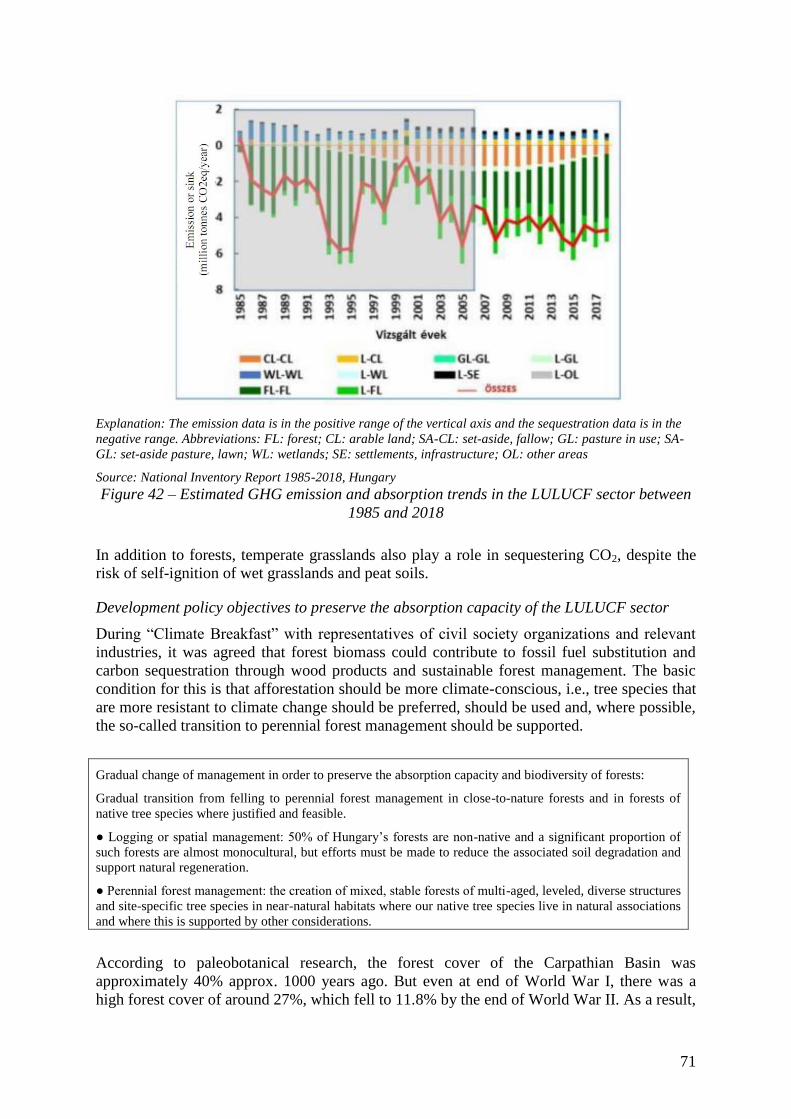
71
Explanation: The emission data is in the positive range of the vertical axis and the sequestration data is in the
negative range. Abbreviations: FL: forest; CL: arable land; SA-CL: set-aside, fallow; GL: pasture in use; SA-
GL: set-aside pasture, lawn; WL: wetlands; SE: settlements, infrastructure; OL: other areas
Source: National Inventory Report 1985-2018, Hungary
Figure 42 – Estimated GHG emission and absorption trends in the LULUCF sector between
1985 and 2018
In addition to forests, temperate grasslands also play a role in sequestering CO2, despite the
risk of self-ignition of wet grasslands and peat soils.
Development policy objectives to preserve the absorption capacity of the LULUCF sector
During “Climate Breakfast” with representatives of civil society organizations and relevant
industries, it was agreed that forest biomass could contribute to fossil fuel substitution and
carbon sequestration through wood products and sustainable forest management. The basic
condition for this is that afforestation should be more climate-conscious, i.e., tree species that
are more resistant to climate change should be preferred, should be used and, where possible,
the so-called transition to perennial forest management should be supported.
Gradual change of management in order to preserve the absorption capacity and biodiversity of forests:
Gradual transition from felling to perennial forest management in close-to-nature forests and in forests of
native tree species where justified and feasible.
● Logging or spatial management: 50% of Hungary’s forests are non-native and a significant proportion of
such forests are almost monocultural, but efforts must be made to reduce the associated soil degradation and
support natural regeneration.
● Perennial forest management: the creation of mixed, stable forests of multi-aged, leveled, diverse structures
and site-specific tree species in near-natural habitats where our native tree species live in natural associations
and where this is supported by other considerations.
According to paleobotanical research, the forest cover of the Carpathian Basin was
approximately 40% approx. 1000 years ago. But even at end of World War I, there was a
high forest cover of around 27%, which fell to 11.8% by the end of World War II. As a result,

72
Hungary has become the fourth poorest country in Europe in terms of forests and trees. Since
then, the forest cover rate has improved significantly and currently it is above 20%. The 20%
forest cover means that our forests occupy approximately 1.9-2.0 million hectares of
Hungary's 9.3 million hectares territory.
However, the National Reforestation Program and the National Forest Strategy (NFS)
set the goal of further increasing forest areas, as a result of which Hungary will reach
27% of forest cover level again by 2050. This will require afforestation of an additional
350,000-400,000 hectares, without counting in the legally non-forest wooded areas, while
obviously continuing to manage the existing forests in a sustainable way, taking greater
account of climate policy and biodiversity conservation objectives.
Links with agricultural and rural development policies
Among the forestry policies of the Hungarian Rural Development Program, there are a
number of measures that help forests to adapt to climate change and increase their
carbon sequestration capacity. It is important to stress that adaptation measures are crucial
for the conservation of forest carbon stocks. The expected drier and warmer climate in many
forest areas can lead to reduced growth, deterioration of tree health, multiplication of pests,
and, in unfavorable cases, extinction processes, which should be prevented if possible. The
measures related to climate change in the 2014-2020 rural development period should
therefore be maintained in the 2021-2027 period, and their expansion is even planned.
The current Forest Act prioritizes the increase of forest areas that are more resistant to
the effects of climate change, including continuous forest cover, and, in the case of
native tree species, the establishment of mixed tree stocks close to nature. In order to
increase the wooded area of the country, a national afforestation program has been
announced, which will also mobilize the population to increase the wooded area. In addition
to the tree planting programs, the unit prices of the afforestation measure of the rural
development program, the period and the amount of income replacement support were
significantly increased.
Other relevant measures:
- increased protection of forests, prevention of forest destruction, forest fires, mitigation
of adverse effects;
- the development of professional forest management, which provides high-quality
wood raw material and the wood industry capable of processing wood as much as
possible, the replacement of raw materials and products produced with higher energy
consumption and high GHG emissions;
- full integration of climate change as a precondition into forestry policy.
Long-term course of action
By 2050, climate change as a boundary condition must be fully integrated into forestry
policies and practices, taking into account decarbonization requirements and actual climate
change.
GHG emission reduction roadmap to 2050
The GEM model predicts emissions from forest areas, non-cultivated areas (fallow),
agricultural and residential areas. Emissions from soil are calculated as the sum of emissions
from each of the four land use categories.
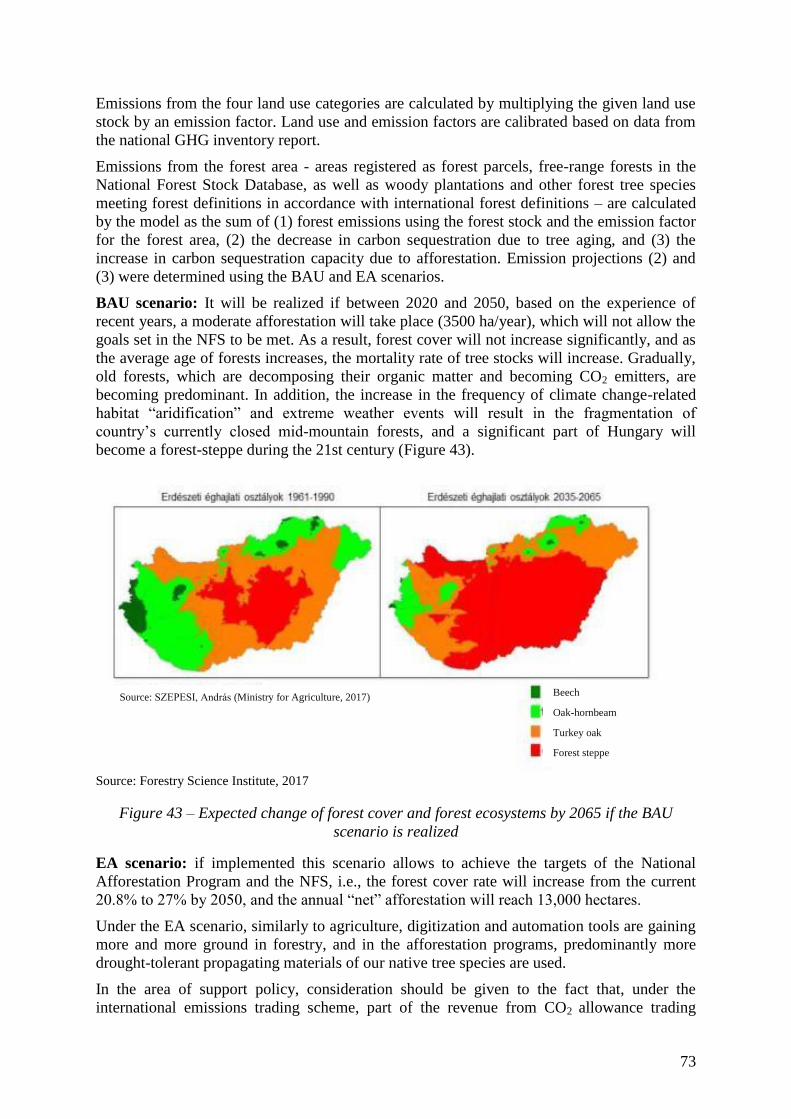
73
Emissions from the four land use categories are calculated by multiplying the given land use
stock by an emission factor. Land use and emission factors are calibrated based on data from
the national GHG inventory report.
Emissions from the forest area - areas registered as forest parcels, free-range forests in the
National Forest Stock Database, as well as woody plantations and other forest tree species
meeting forest definitions in accordance with international forest definitions – are calculated
by the model as the sum of (1) forest emissions using the forest stock and the emission factor
for the forest area, (2) the decrease in carbon sequestration due to tree aging, and (3) the
increase in carbon sequestration capacity due to afforestation. Emission projections (2) and
(3) were determined using the BAU and EA scenarios.
BAU scenario: It will be realized if between 2020 and 2050, based on the experience of
recent years, a moderate afforestation will take place (3500 ha/year), which will not allow the
goals set in the NFS to be met. As a result, forest cover will not increase significantly, and as
the average age of forests increases, the mortality rate of tree stocks will increase. Gradually,
old forests, which are decomposing their organic matter and becoming CO2 emitters, are
becoming predominant. In addition, the increase in the frequency of climate change-related
habitat “aridification” and extreme weather events will result in the fragmentation of
country’s currently closed mid-mountain forests, and a significant part of Hungary will
become a forest-steppe during the 21st century (Figure 43).
Source: Forestry Science Institute, 2017
Figure 43 – Expected change of forest cover and forest ecosystems by 2065 if the BAU
scenario is realized
EA scenario: if implemented this scenario allows to achieve the targets of the National
Afforestation Program and the NFS, i.e., the forest cover rate will increase from the current
20.8% to 27% by 2050, and the annual “net” afforestation will reach 13,000 hectares.
Under the EA scenario, similarly to agriculture, digitization and automation tools are gaining
more and more ground in forestry, and in the afforestation programs, predominantly more
drought-tolerant propagating materials of our native tree species are used.
In the area of support policy, consideration should be given to the fact that, under the
international emissions trading scheme, part of the revenue from CO2 allowance trading
Beech
Oak-hornbeam
Turkey oak
Forest steppe
Source: SZEPESI, András (Ministry for Agriculture, 2017)
74
should be used for natural carbon sequestration, afforestation, long-term forest maintenance
and the development emissions-optimal stock structure, that is climate resilient. Achieving
these goals goes beyond the utilization restrictions still expected of forest owners, so the loss
of expected economic benefits must be compensated. Spending part of the revenues from EU
ETS in the forestry sector would be a significant source of increasing Hungary's forest cover.
4.2.5. Waste management
Strengths
Progress towards a green economy.
Job creation potential.
Encouraging investment.
Strengthening the innovation linkages between
producers and waste managers.
Weaknesses
Current recovery capacity is low in regional
comparison.
The management capacities required to meet the
Circular Economy objectives are not fully available.
Landfilling is widespread as it is still the cheapest
solution.
Quality of public service varies by region
Opportunities
Strengthening cooperation between manufacturers,
waste managers, research centers and universities in
the field of research and development.
Development of domestic utilization capacities.
Significant absorption capacity of agriculture for
compost.
Development of new consumption habits,
continuous awareness-raising of the population.
Greater involvement of manufacturers in funding
due to extended producer responsibility.
Advantage of local/nearby capacities due to the
collapse of the secondary raw materials sector
market
Threats
Passing on increased producer costs to consumers. -
low solvency.
Without rapid action, recovery capacities could
move to neighboring countries.
There is no qualitative development of previously
built capacities.
Lack of funding for investments.
The market for secondary raw materials is shrinking
as a result of the economic crisis.
Table 9 – SWOT analysis of the waste sector
GHG emission trends
Since Hungary's accession to the EU, significant progress has been made in the field of waste
management, which led to GHG reductions in the sector. The previous uncontrolled, approx.
2,200 “landfills” operating or already abandoned without proper insulation and depot gas
treatment were closed by 2009, and their recultivation took place by 2015. Based on 2018
data, 75 "B3"26
landfill operating permits comply with all current EU regulations, and
technological equipment has been installed for the collection and treatment of approximately
40% methane-containing landfill gas, which serve energy recovery and/or flaring of methane
in the landfill gas.
In Hungary, GHG emissions from waste-related activities and waste management accounted
for 5.9% of total GHG emissions in 2018, with emissions from the sector showing a declining
trend over the last 10 years (Figure 44). The main reason for this is the declining rate of
methane-producing landfilling, while the amount of waste per capita stagnates with a small
variance (1%).
26
Mixed landfill for non-hazardous waste (with significant organic and inorganic content)
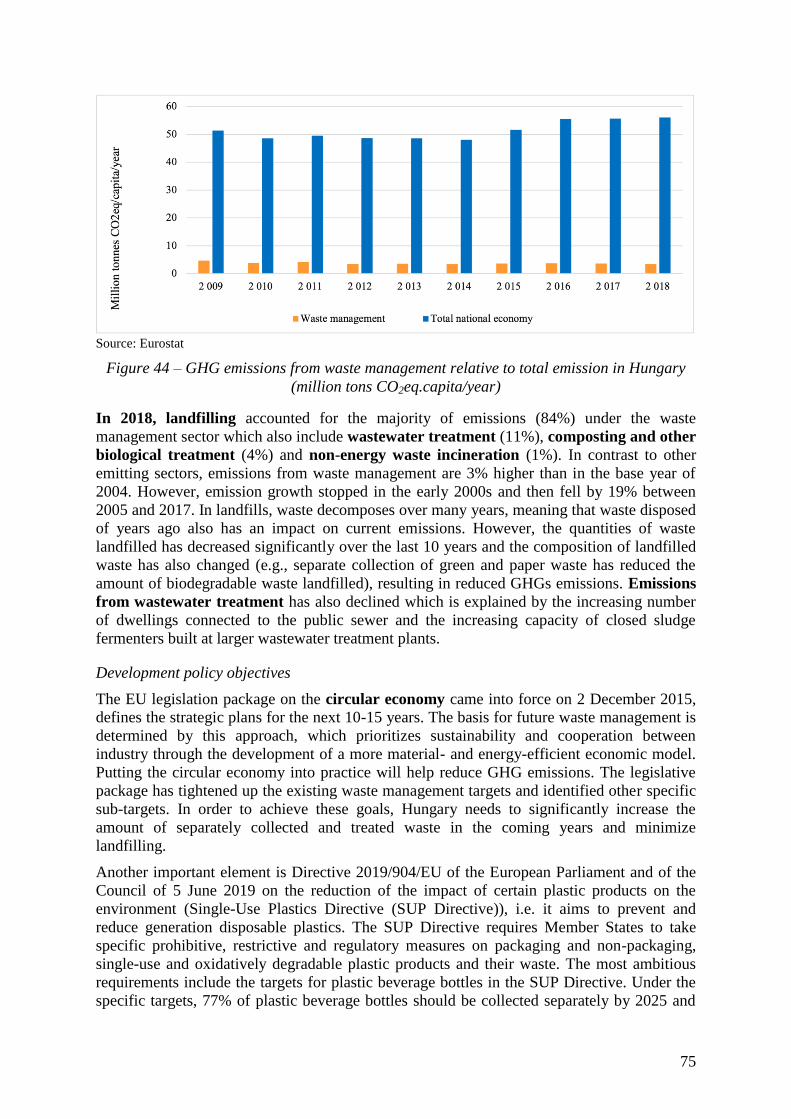
75
Source: Eurostat
Figure 44 – GHG emissions from waste management relative to total emission in Hungary
(million tons CO2eq.capita/year)
In 2018, landfilling accounted for the majority of emissions (84%) under the waste
management sector which also include wastewater treatment (11%), composting and other
biological treatment (4%) and non-energy waste incineration (1%). In contrast to other
emitting sectors, emissions from waste management are 3% higher than in the base year of
2004. However, emission growth stopped in the early 2000s and then fell by 19% between
2005 and 2017. In landfills, waste decomposes over many years, meaning that waste disposed
of years ago also has an impact on current emissions. However, the quantities of waste
landfilled has decreased significantly over the last 10 years and the composition of landfilled
waste has also changed (e.g., separate collection of green and paper waste has reduced the
amount of biodegradable waste landfilled), resulting in reduced GHGs emissions. Emissions
from wastewater treatment has also declined which is explained by the increasing number
of dwellings connected to the public sewer and the increasing capacity of closed sludge
fermenters built at larger wastewater treatment plants.
Development policy objectives
The EU legislation package on the circular economy came into force on 2 December 2015,
defines the strategic plans for the next 10-15 years. The basis for future waste management is
determined by this approach, which prioritizes sustainability and cooperation between
industry through the development of a more material- and energy-efficient economic model.
Putting the circular economy into practice will help reduce GHG emissions. The legislative
package has tightened up the existing waste management targets and identified other specific
sub-targets. In order to achieve these goals, Hungary needs to significantly increase the
amount of separately collected and treated waste in the coming years and minimize
landfilling.
Another important element is Directive 2019/904/EU of the European Parliament and of the
Council of 5 June 2019 on the reduction of the impact of certain plastic products on the
environment (Single-Use Plastics Directive (SUP Directive)), i.e. it aims to prevent and
reduce generation disposable plastics. The SUP Directive requires Member States to take
specific prohibitive, restrictive and regulatory measures on packaging and non-packaging,
single-use and oxidatively degradable plastic products and their waste. The most ambitious
requirements include the targets for plastic beverage bottles in the SUP Directive. Under the
specific targets, 77% of plastic beverage bottles should be collected separately by 2025 and
76
90% by 2029, with the ultimate goal of making the recycling process more efficient. Another
ambitious requirement is that, by 2025, the beverage bottles should be made from 25%
secondary raw materials made from waste, and plastic beverage bottles should be made from
30% secondary raw materials by 2030. To achieve this, the SUP Directive proposes the
introduction of a redemption fee (deposit fee) system or setting a separate collection target
under the extended producer responsibility scheme.
Currently, 84% of the sector's GHG emissions come from landfills. According to the
"circular economy" package, by 2035 a maximum of 10% of municipal waste generated can
be landfilled (with a derogation of 25%), which means that, as a result of material flow
calculations, only slag/residual waste from burning or energy generation can be disposed of
in the future. This results in huge GHG savings, as the amount of slag/residue generated
during energy recovery does not need to be included in the amount of landfilled municipal
waste.
Another high-impact provision in the legislation-package is that it introduces additional
obligations for the period 2025-2035 (a derogation of up to 5 years may be requested under
certain conditions):
a) By 2025, the amount of recycled municipal waste and waste prepared for re-use
should be increased to a minimum of 55% by weight (with a derogation of 50%);
b) By 2030, the amount of recycled municipal waste and waste prepared for re-use
should be increased to a minimum of 60% by weight (with a derogation of 55%);
c) By 2035, the amount of recycled municipal waste and waste prepared for re-use
should be increased to a minimum of 65% by weight (with a derogation of 60%).
In order to prohibit and restrict the sales of single-use plastics in the framework of the
transition to a circular economy, Hungary was among the first to adopt an act on the
transposition of the SUP Directive (Act XCI of 2020) containing enabling provision for
government decree-level regulation. The technical notification of the government decree is in
progress, it can be promulgated after its completion and it will take effect from 1 July 2021.
One of the biggest challenges in designing the National Waste Management Strategy
currently under development and the new National Waste Management Plan, is that the
transformation of the future waste composition is very difficult to plan, as producers and
distributors are now radically transforming the packaging and other parameters of their
products, from a technology and material use perspective.
The proportion of biodegradable waste (including a significant part of the fine fraction) in the
current composition of municipal waste exceeds 30%. The treatment of that portion of the
waste stream is determinant to achieve the recovery targets of the circular economy and for
the sector's GHG emissions. Compliance with the separate collection obligation for biowaste
must be ensured by 31 December 2023.
During the stakeholder consultation held under the preparation of this Strategy, industry and
professional organizations affirmed their commitment to prioritize the reuse and recovery of
material, the reduction of biowaste and organizing the treatment of the small remaining
waste. This is supported by sector guides to good practice developed in collaboration with
industry in the framework of the National Food Chain Safety Agency's National Food Waste
Prevention Program called “Without leftovers”.
In the field of food retail, several chain stores operating in Hungary are already launching
their own waste management programs.
77
There is also strong interest in the development of biogas plants. According to the provisions
of the Circular Economy Directive package, energy recovery or fuel production do not
contribute to the achievement of recovery targets, but it is expected to be clarified whether
the utilization of fermented residues at the end of the anaerobic process as soil improvers can
be accounted for. This can practically mean that if 20-30 units of the 100 units of material
entering the energy recovery are utilized as slag or biogas residues, then the 20-30 units can
be taken into account in the fulfillment of the circular economy targets.
From the point of view of GHG emissions, aerobic composting of biodegradable waste is
more advantageous compared to anaerobic treatment, because in case of improper sludge
treatment, significant CO2 and methane are still released from the residue. This is
technologically manageable but will definitely require special attention in the future.
For the above reasons, the sector's GHG emissions will basically be determined by the
following two main aspects:
The level of treatment and recovery of biodegradable, compostable waste (compost)
must be increased. Closed technology anaerobic treatment technologies (biogas27
,
fermentation) do not sufficiently serve the goals of the circular strategy. Although
energy recovery can play an important role and create synergies with EU energy and
climate policy, it can only be accepted if it follows the principle of the EU waste
hierarchy.
Expanding either recyclable packaging or selective collection to residential homes
will generate multiple collection and transportation needs compared to the current
one, which will increase transportation-related GHG emissions.
GHG emission reductions roadmap to 2050
In the first phase of the modeling four different scenario versions were developed based on
the policy goals, collection and treatment rates and technology, assuming that Hungary
complies with the EU, i.e., makes the necessary investments in the next 10 years. A version
selected on the basis of cost-effectiveness considerations and to meet the requirements of the
Directive has been integrated into the GEM model to achieve climate policy targets, i.e., a
lower-cost GHG emission reduction pathway. For the quantitative variants preceding the
GEM model, the highest possible home composting prevalence was assumed (based on
international, already realized rates) in terms of cost-effectiveness, that does not entail
transport and operating costs. The production of Refuse Derived Fuel (RDF) does not serve
the purposes of the circular economy and is expected to decrease in terms of energy and cost
savings.
Among the main sectors within waste management (municipal, agricultural, industrial), focus
was given to municipal waste on one hand due to the impact on GHG and on the other hand
the challenges of the circular economy directive, since the role of the state is decisive here.
Quantitative forecasting of industrial waste follows the industrial performance of the GEM
model, with treatment modality rates shifting toward full recovery by 2050. In this sector, the
responsibility also lies at the EU level with waste producers. The amount of agricultural
waste also varies in proportion to the agricultural performance of the GEM model; similar to
industrial waste, the agriculture sector will be tasked with maximizing material recovery by
2050.
27
Rheinischen Friedrich-Wilhelms-Universitat Phd. dissertation: Nguyen Thanh Phong: Greenhouse Gas
Emissions from Composting and Anaerobic Digestion Plants (2012)
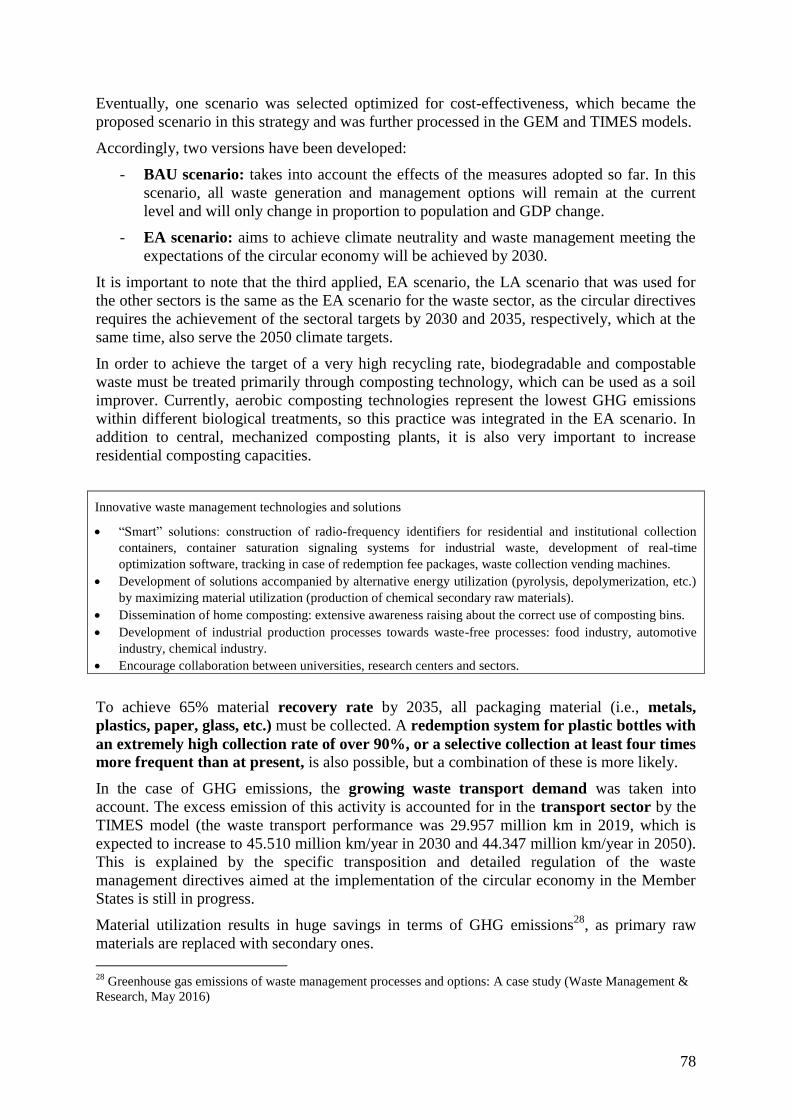
78
Eventually, one scenario was selected optimized for cost-effectiveness, which became the
proposed scenario in this strategy and was further processed in the GEM and TIMES models.
Accordingly, two versions have been developed:
- BAU scenario: takes into account the effects of the measures adopted so far. In this
scenario, all waste generation and management options will remain at the current
level and will only change in proportion to population and GDP change.
- EA scenario: aims to achieve climate neutrality and waste management meeting the
expectations of the circular economy will be achieved by 2030.
It is important to note that the third applied, EA scenario, the LA scenario that was used for
the other sectors is the same as the EA scenario for the waste sector, as the circular directives
requires the achievement of the sectoral targets by 2030 and 2035, respectively, which at the
same time, also serve the 2050 climate targets.
In order to achieve the target of a very high recycling rate, biodegradable and compostable
waste must be treated primarily through composting technology, which can be used as a soil
improver. Currently, aerobic composting technologies represent the lowest GHG emissions
within different biological treatments, so this practice was integrated in the EA scenario. In
addition to central, mechanized composting plants, it is also very important to increase
residential composting capacities.
Innovative waste management technologies and solutions
“Smart” solutions: construction of radio-frequency identifiers for residential and institutional collection
containers, container saturation signaling systems for industrial waste, development of real-time
optimization software, tracking in case of redemption fee packages, waste collection vending machines.
Development of solutions accompanied by alternative energy utilization (pyrolysis, depolymerization, etc.)
by maximizing material utilization (production of chemical secondary raw materials).
Dissemination of home composting: extensive awareness raising about the correct use of composting bins.
Development of industrial production processes towards waste-free processes: food industry, automotive
industry, chemical industry.
Encourage collaboration between universities, research centers and sectors.
To achieve 65% material recovery rate by 2035, all packaging material (i.e., metals,
plastics, paper, glass, etc.) must be collected. A redemption system for plastic bottles with
an extremely high collection rate of over 90%, or a selective collection at least four times
more frequent than at present, is also possible, but a combination of these is more likely.
In the case of GHG emissions, the growing waste transport demand was taken into
account. The excess emission of this activity is accounted for in the transport sector by the
TIMES model (the waste transport performance was 29.957 million km in 2019, which is
expected to increase to 45.510 million km/year in 2030 and 44.347 million km/year in 2050).
This is explained by the specific transposition and detailed regulation of the waste
management directives aimed at the implementation of the circular economy in the Member
States is still in progress.
Material utilization results in huge savings in terms of GHG emissions28
, as primary raw
materials are replaced with secondary ones.
28
Greenhouse gas emissions of waste management processes and options: A case study (Waste Management &
Research, May 2016)
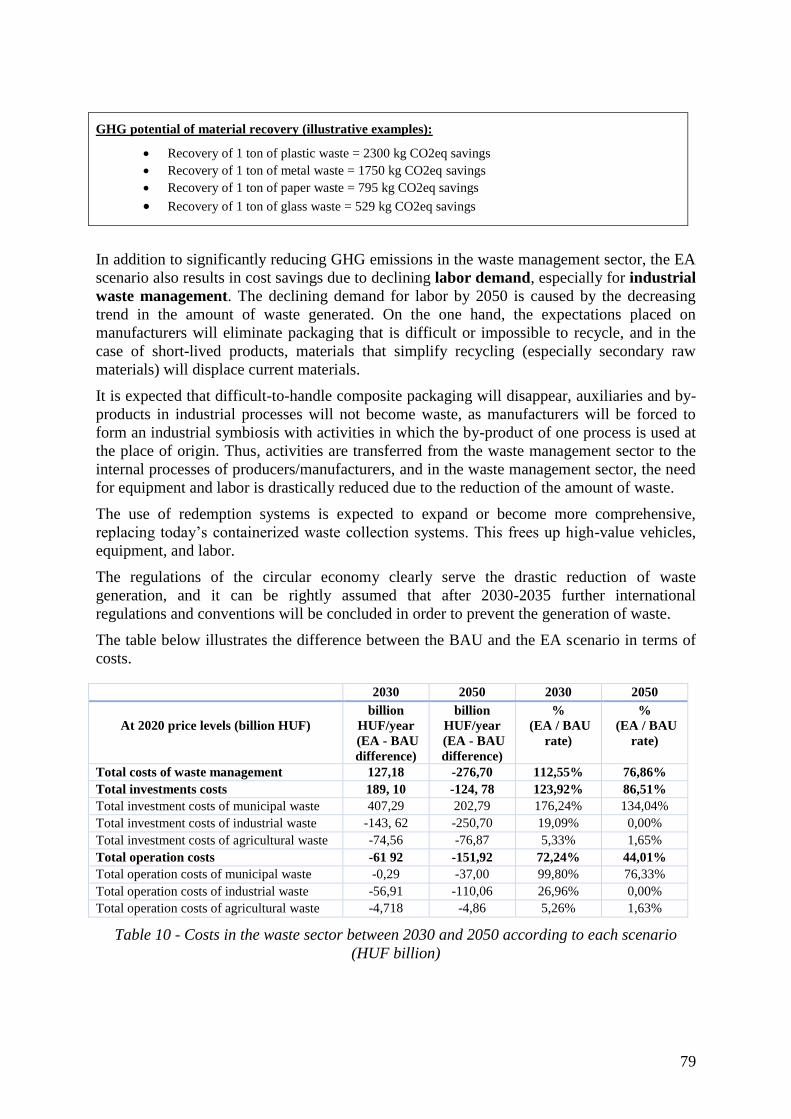
79
GHG potential of material recovery (illustrative examples):
Recovery of 1 ton of plastic waste = 2300 kg CO2eq savings
Recovery of 1 ton of metal waste = 1750 kg CO2eq savings
Recovery of 1 ton of paper waste = 795 kg CO2eq savings
Recovery of 1 ton of glass waste = 529 kg CO2eq savings
In addition to significantly reducing GHG emissions in the waste management sector, the EA
scenario also results in cost savings due to declining labor demand, especially for industrial
waste management. The declining demand for labor by 2050 is caused by the decreasing
trend in the amount of waste generated. On the one hand, the expectations placed on
manufacturers will eliminate packaging that is difficult or impossible to recycle, and in the
case of short-lived products, materials that simplify recycling (especially secondary raw
materials) will displace current materials.
It is expected that difficult-to-handle composite packaging will disappear, auxiliaries and by-
products in industrial processes will not become waste, as manufacturers will be forced to
form an industrial symbiosis with activities in which the by-product of one process is used at
the place of origin. Thus, activities are transferred from the waste management sector to the
internal processes of producers/manufacturers, and in the waste management sector, the need
for equipment and labor is drastically reduced due to the reduction of the amount of waste.
The use of redemption systems is expected to expand or become more comprehensive,
replacing today’s containerized waste collection systems. This frees up high-value vehicles,
equipment, and labor.
The regulations of the circular economy clearly serve the drastic reduction of waste
generation, and it can be rightly assumed that after 2030-2035 further international
regulations and conventions will be concluded in order to prevent the generation of waste.
The table below illustrates the difference between the BAU and the EA scenario in terms of
costs.
2030 2050 2030 2050
At 2020 price levels (billion HUF)
billion
HUF/year
(EA - BAU
difference)
billion
HUF/year
(EA - BAU
difference)
%
(EA / BAU
rate)
%
(EA / BAU
rate)
Total costs of waste management 127,18 -276,70 112,55% 76,86%
Total investments costs 189, 10 -124, 78 123,92% 86,51%
Total investment costs of municipal waste 407,29 202,79 176,24% 134,04%
Total investment costs of industrial waste -143, 62 -250,70 19,09% 0,00%
Total investment costs of agricultural waste -74,56 -76,87 5,33% 1,65%
Total operation costs -61 92 -151,92 72,24% 44,01%
Total operation costs of municipal waste -0,29 -37,00 99,80% 76,33%
Total operation costs of industrial waste -56,91 -110,06 26,96% 0,00%
Total operation costs of agricultural waste -4,718 -4,86 5,26% 1,63%
Table 10 - Costs in the waste sector between 2030 and 2050 according to each scenario
(HUF billion)
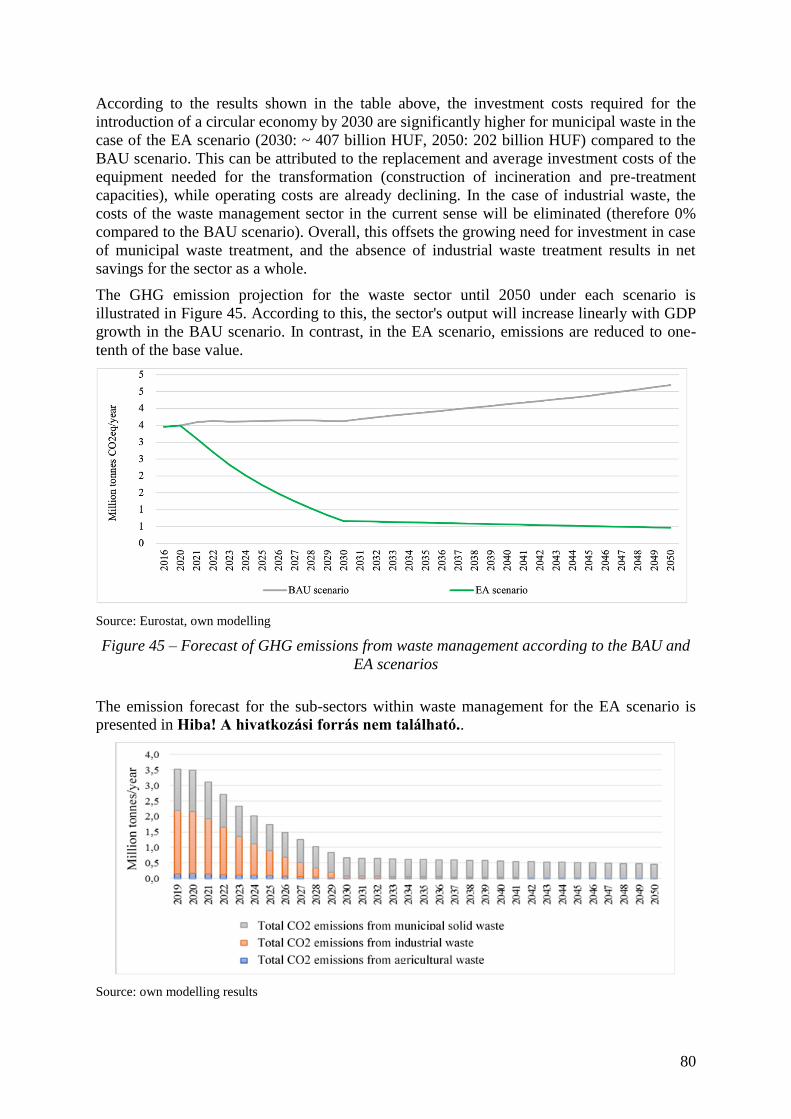
80
According to the results shown in the table above, the investment costs required for the
introduction of a circular economy by 2030 are significantly higher for municipal waste in the
case of the EA scenario (2030: ~ 407 billion HUF, 2050: 202 billion HUF) compared to the
BAU scenario. This can be attributed to the replacement and average investment costs of the
equipment needed for the transformation (construction of incineration and pre-treatment
capacities), while operating costs are already declining. In the case of industrial waste, the
costs of the waste management sector in the current sense will be eliminated (therefore 0%
compared to the BAU scenario). Overall, this offsets the growing need for investment in case
of municipal waste treatment, and the absence of industrial waste treatment results in net
savings for the sector as a whole.
The GHG emission projection for the waste sector until 2050 under each scenario is
illustrated in Figure 45. According to this, the sector's output will increase linearly with GDP
growth in the BAU scenario. In contrast, in the EA scenario, emissions are reduced to one-
tenth of the base value.
Source: Eurostat, own modelling
Figure 45 – Forecast of GHG emissions from waste management according to the BAU and
EA scenarios
The emission forecast for the sub-sectors within waste management for the EA scenario is
presented in Hiba! A hivatkozási forrás nem található..
Source: own modelling results
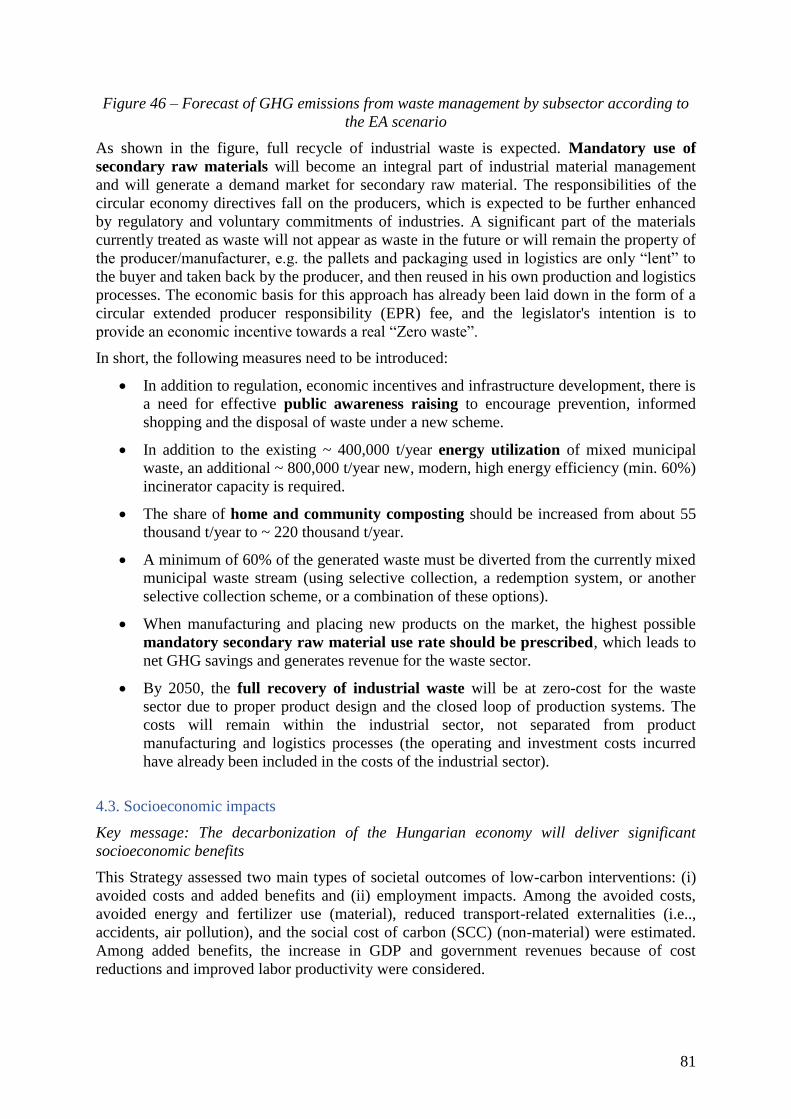
81
Figure 46 – Forecast of GHG emissions from waste management by subsector according to
the EA scenario
As shown in the figure, full recycle of industrial waste is expected. Mandatory use of
secondary raw materials will become an integral part of industrial material management
and will generate a demand market for secondary raw material. The responsibilities of the
circular economy directives fall on the producers, which is expected to be further enhanced
by regulatory and voluntary commitments of industries. A significant part of the materials
currently treated as waste will not appear as waste in the future or will remain the property of
the producer/manufacturer, e.g. the pallets and packaging used in logistics are only “lent” to
the buyer and taken back by the producer, and then reused in his own production and logistics
processes. The economic basis for this approach has already been laid down in the form of a
circular extended producer responsibility (EPR) fee, and the legislator's intention is to
provide an economic incentive towards a real “Zero waste”.
In short, the following measures need to be introduced:
In addition to regulation, economic incentives and infrastructure development, there is
a need for effective public awareness raising to encourage prevention, informed
shopping and the disposal of waste under a new scheme.
In addition to the existing ~ 400,000 t/year energy utilization of mixed municipal
waste, an additional ~ 800,000 t/year new, modern, high energy efficiency (min. 60%)
incinerator capacity is required.
The share of home and community composting should be increased from about 55
thousand t/year to ~ 220 thousand t/year.
A minimum of 60% of the generated waste must be diverted from the currently mixed
municipal waste stream (using selective collection, a redemption system, or another
selective collection scheme, or a combination of these options).
When manufacturing and placing new products on the market, the highest possible
mandatory secondary raw material use rate should be prescribed, which leads to
net GHG savings and generates revenue for the waste sector.
By 2050, the full recovery of industrial waste will be at zero-cost for the waste
sector due to proper product design and the closed loop of production systems. The
costs will remain within the industrial sector, not separated from product
manufacturing and logistics processes (the operating and investment costs incurred
have already been included in the costs of the industrial sector).
4.3. Socioeconomic impacts
Key message: The decarbonization of the Hungarian economy will deliver significant
socioeconomic benefits
This Strategy assessed two main types of societal outcomes of low-carbon interventions: (i)
avoided costs and added benefits and (ii) employment impacts. Among the avoided costs,
avoided energy and fertilizer use (material), reduced transport-related externalities (i.e..,
accidents, air pollution), and the social cost of carbon (SCC) (non-material) were estimated.
Among added benefits, the increase in GDP and government revenues because of cost
reductions and improved labor productivity were considered.
82
The economic viability of investments aimed at reducing GHG emissions has been analyzed for decades. The
approach used, in most instances, has been a conventional Cost-Benefit Analysis (CBA). This takes (i) the
implementation costs of projects and policies (i.e., the investment required, as well as the operation and
maintenance cost) and (ii) the direct benefits generated by the same projects or policies. Moreover, CBAs are
normally applied to a single project or investment and consider benefits only available for investors. These
benefits are usually limited to those expressed in monetary units. Standard project-based CBAs do not assess the
tangible/material and intangible, non-material benefits (or costs) of a given investment to society, regardless of
if they are monetized or not. Nevertheless, investments in low carbon development are designed to tackle a
societal issue such as climate change that affects many economic actors simultaneously. Investments in energy
efficiency for instance, reduce energy consumption and curb emissions, while at the same time, the co-benefit of
avoided energy use, reduced air pollution and health costs emerge. Therefore, to carry out a comprehensive
assessment of climate mitigation interventions and socio-economic value of such investments in a coherent way,
societal impacts need to be estimated. This type of extended CBA, i.e., assessing societal impacts, has become a
common practice the last years in analyzing the costs and benefits of low carbon development scenarios.
4.3.1. Avoided costs and added benefits
All avoided costs and added benefits (Table 11) account for nearly half of the total
investments required between 2020 and 2030 according to the EA scenario.
This indicates that in the next 10 years, more than half of the investments required will
be repaid via avoided costs. When we consider added benefits as well (i.e., higher GDP and
its impact on government revenues), 90% of the total investments required will be paid
back according to the EA scenario over the same period. When the long-term horizon up to
2050 is considered, the values of avoided costs and added benefits outweigh the investment
costs. This is because a longer time frame will better capture the benefits of investments over
their lifetime (i.e., the same investment reaches higher avoided costs and added benefits in
the longer term).
During the period between 2030 and 2050, a higher investment need is expected, which is
explained by a larger-scale emission reduction effort necessary to reach the 2050 climate
neutrality target. The cost to reduce each ton of emission is increasing as the full
decarbonization approaches. Therefore, under the EA scenario, the total avoided costs
account for two thirds of the total investment costs by 2050. Furthermore, the sum of
avoided costs and added benefits by 2050 will be higher than the investment costs.
It should be highlighted that the avoided costs and added benefits are expected to occur well
beyond 2050. This is because the investments made between 2040 and 2050 have a lifetime
that stretches beyond 2050, reaching even 2060 and 2070. The benefits emerging after 2050
were not captured in the present modeling exercises.
Concerning avoided costs, the EA scenario shows roughly equal reductions in energy costs,
the SCC29
, and transport-related externalities.30
It is estimated that the SCC in 2020
represents about 1% of GDP. With the full decarbonization of the economy by 2050, the SCC
will decline to zero. While being an intangible indicator—since it is not directly linked with
public and private expenses—it may indicate that Hungary and many Member States of the
29
The Social Cost of Carbon (SCC) is a widely used proxy indictor to express the economic impacts of climate
change. It indicates the marginal cost that is caused by each extra emitted ton of GHG. 30
Transport-related externalities include the costs of accidents as well as the costs from caused noise and air
pollution.
83
EU will move effectively toward decarbonization, and that the cost of climate change will
decline when compared to the BAU scenario.
Transport-related externalities—including the cost of respiratory diseases due to air pollution,
cost of noise pollution, cost of accidents, and value of time lost due to congestion—reach
approximately 2% of GDP in 2020. According to the forecasts, in the case of the carbon
neutrality scenarios—especially under the EA scenario—the number of vehicles will be
higher. This trend will increase the demand for transport and energy consumption.
Nevertheless, the shift to low-carbon vehicles will reduce the incidence of transport-related
externalities on GDP by 0.2%–0.3% in the coming three decades.
Concerning added benefits, due to higher investment efforts, lower energy costs, and
increased productivity, GDP is forecasted to be 21% higher under the EA scenario, compared
to the BAU scenario by 2050.
Many factors impact productivity31
in the model, such as the applied technology, energy
costs, air and water quality, and infrastructure (e.g., roads). Low-carbon development reduces
energy costs and emissions, which directly impacts productivity and the increase of GDP.
Additional increases of GDP induce new investments and create new jobs, thus it further
incentivizes economic development.
When compared to the BAU scenario, the GDP growth rate is similar until 2025 but grows
faster from 2026 to 2050. This is due to net savings generated by investments, energy
efficiency, and a fuel switch. The annual growth rate of GDP will be 0.11 percentage points
higher in the EA than under the BAU scenario. In addition, GDP is forecasted to grow more
markedly toward 2050.
ntForecasts show that the average annual growth rate between 2030 and 2050 is 0.61
percentage points higher in the EA scenario than in the BAU scenario. In 2050, the growth
rate of GDP—partly driven by green investments—in the EA scenario is 7.03%, which is
significantly higher compared to the BAU scenario at 1.79%.
Government revenues follow a similar trend to GDP. Since government revenues are
calculated from the growth rate percentage of GDP, higher GDP growth results in higher
government revenues. By 2050, the additional government revenues generated by
decarbonization measures will account for 47% of the investments required in the EA
scenario. This means that the expected growth in tax revenues will cover nearly half of the
investments required; therefore, state stimulation at this scale will not bring additional costs
for the government.
Table 11 - besides representing the demonstrable costs and benefits of the EA and LA
scenarios over the 2020–2030 and 2020–2050 periods, compared to the BAU scenario - also
provides information on investment cost trends and labor market impacts.
31
The methodology of how the GEM model calculated productivity is discussed in Annex 4.
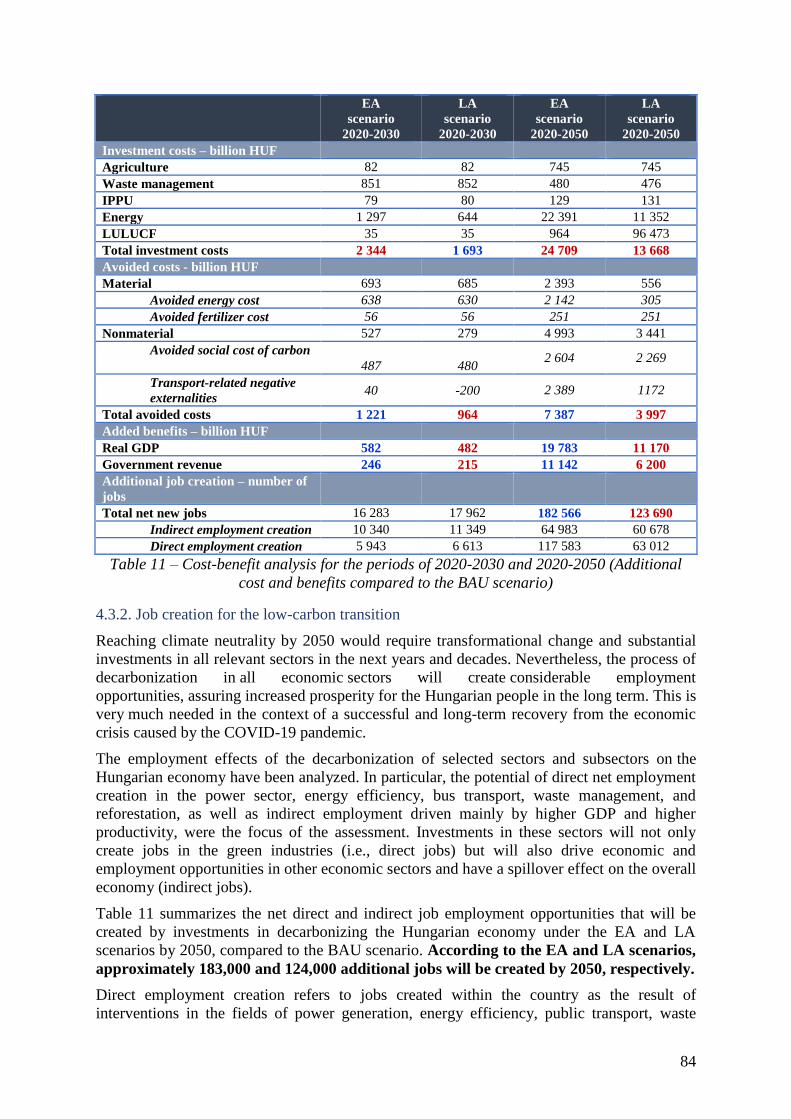
84
EA
scenario
2020-2030
LA
scenario
2020-2030
EA
scenario
2020-2050
LA
scenario
2020-2050
Investment costs – billion HUF
Agriculture 82 82 745 745
Waste management 851 852 480 476
IPPU 79 80 129 131
Energy 1 297 644 22 391 11 352
LULUCF 35 35 964 96 473
Total investment costs 2 344 1 693 24 709 13 668
Avoided costs - billion HUF
Material 693 685 2 393 556
Avoided energy cost 638 630 2 142 305
Avoided fertilizer cost 56 56 251 251
Nonmaterial 527 279 4 993 3 441
Avoided social cost of carbon
487 480 2 604 2 269
Transport-related negative
externalities 40 -200 2 389 1172
Total avoided costs 1 221 964 7 387 3 997
Added benefits – billion HUF
Real GDP 582 482 19 783 11 170
Government revenue 246 215 11 142 6 200
Additional job creation – number of
jobs
Total net new jobs 16 283 17 962 182 566 123 690
Indirect employment creation 10 340 11 349 64 983 60 678
Direct employment creation 5 943 6 613 117 583 63 012
Table 11 – Cost-benefit analysis for the periods of 2020-2030 and 2020-2050 (Additional
cost and benefits compared to the BAU scenario)
4.3.2. Job creation for the low-carbon transition
Reaching climate neutrality by 2050 would require transformational change and substantial
investments in all relevant sectors in the next years and decades. Nevertheless, the process of
decarbonization in all economic sectors will create considerable employment
opportunities, assuring increased prosperity for the Hungarian people in the long term. This is
very much needed in the context of a successful and long-term recovery from the economic
crisis caused by the COVID-19 pandemic.
The employment effects of the decarbonization of selected sectors and subsectors on the
Hungarian economy have been analyzed. In particular, the potential of direct net employment
creation in the power sector, energy efficiency, bus transport, waste management, and
reforestation, as well as indirect employment driven mainly by higher GDP and higher
productivity, were the focus of the assessment. Investments in these sectors will not only
create jobs in the green industries (i.e., direct jobs) but will also drive economic and
employment opportunities in other economic sectors and have a spillover effect on the overall
economy (indirect jobs).
Table 11 summarizes the net direct and indirect job employment opportunities that will be
created by investments in decarbonizing the Hungarian economy under the EA and LA
scenarios by 2050, compared to the BAU scenario. According to the EA and LA scenarios,
approximately 183,000 and 124,000 additional jobs will be created by 2050, respectively.
Direct employment creation refers to jobs created within the country as the result of
interventions in the fields of power generation, energy efficiency, public transport, waste
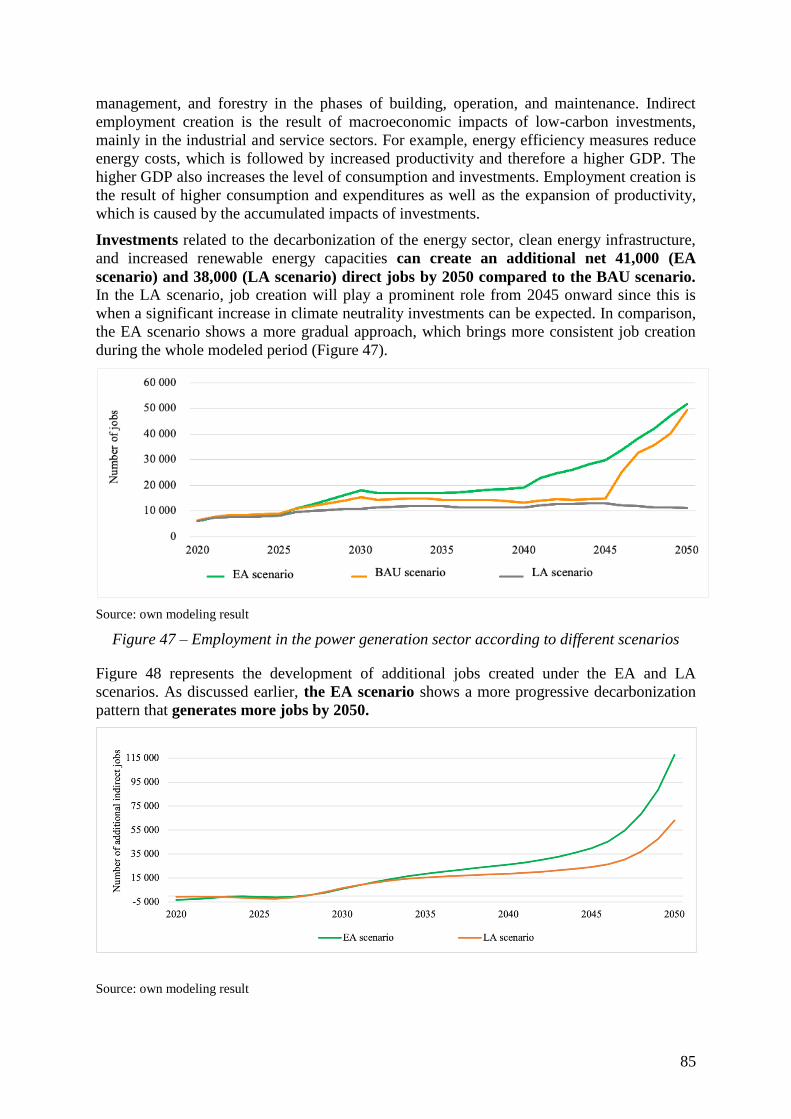
85
management, and forestry in the phases of building, operation, and maintenance. Indirect
employment creation is the result of macroeconomic impacts of low-carbon investments,
mainly in the industrial and service sectors. For example, energy efficiency measures reduce
energy costs, which is followed by increased productivity and therefore a higher GDP. The
higher GDP also increases the level of consumption and investments. Employment creation is
the result of higher consumption and expenditures as well as the expansion of productivity,
which is caused by the accumulated impacts of investments.
Investments related to the decarbonization of the energy sector, clean energy infrastructure,
and increased renewable energy capacities can create an additional net 41,000 (EA
scenario) and 38,000 (LA scenario) direct jobs by 2050 compared to the BAU scenario. In the LA scenario, job creation will play a prominent role from 2045 onward since this is
when a significant increase in climate neutrality investments can be expected. In comparison,
the EA scenario shows a more gradual approach, which brings more consistent job creation
during the whole modeled period (Figure 47).
Source: own modeling result
Figure 47 – Employment in the power generation sector according to different scenarios
Figure 48 represents the development of additional jobs created under the EA and LA
scenarios. As discussed earlier, the EA scenario shows a more progressive decarbonization
pattern that generates more jobs by 2050.
Source: own modeling result
86
Figure 48 – Indirect job creation in the EA and LA scenarios compared to the BAU scenario
A well-managed consideration and planning of employment shifts is needed to ensure a
socially just transition. The creation of green and direct jobs is at the heart of the
socioeconomic benefits from the decarbonization of the Hungarian economy. Creating new,
green, and well-paying jobs is of utmost importance in regions affected by the coal phase-out,
which would contribute to the financial growth of families. Measures such as (re)training
programs, enhanced university and education curricula, as well as supporting and improving
green innovations and entrepreneurship by making it easier to create green businesses—with
incubation services—will ensure a just transition.
A well-managed approach to the transition to a decarbonized economy is necessary to avoid
or minimize any adverse impacts to workers, communities, and businesses in regions that will
be most affected by the transition. Engaging with the affected stakeholders and introducing
policies for social protection, retraining, and reskilling are important enabling factors of a
smooth and fair transition assuring prosperity for all Hungarians.
4.3.3. Linkages with the UN Sustainable Development Goals
Reducing GHG emissions generates a variety of co-benefits which can be identified by their
contributions to the UN SDGs. First, the implementation of low-carbon investments (SDG13)
leads to employment creation (SDG8) and the generation of new skills and knowledge
(SDG4). In the case of the energy sector, these investments improve the expansion of clean
and affordable energy (SDG7). Investments in energy and waste management also improve
the creating of domestic value chains (SDG9). The result of low carbon investments is
reduced energy use, waste creation and the increase of natural sink capacities which represent
progress towards responsible production and consumption (SDG12) as well as towards
sustainable cities and communities (SDG11). This also strengthens health outcomes (SDG3)
via the reduction of air and water pollution (SDG6), by increased physical activity and better
nutrition from interventions in the agriculture sector (SDG2).
4.4. Adaptation policies and measures
Adaptation to the unavoidable impacts of climate change is as important as emission
reduction efforts for Hungary. Long-term adaptation priorities should be laid out jointly
with the mitigation planning in order to fully seize the opportunities of the synergies between
the two areas.32
This joint planning is also important because the necessary investments for
adaptation determine development. Furthermore, adaptation activities contribute to important
socio-economic goals and can bring added mitigation benefits. This applies vice versa since
mitigation measures can have added adaptation benefits as well. This aspect has been taken
into account during the preparation of the NCDS. In addition, those mitigation policy
recommendations that are contradictory i with adaptation objectives should only be
considered as a last resort.
32
A good example for this is the revision of requirements related to the planning of renewable energy facilities
in the power sector that foster mitigation taking weather conditions impacted by climate change into account
that risk critical infrastructures.
87
4.4.1. Adaptation-related climate policy planning
The EU Adaptation Strategy33
set three main goals for its member states:
to support member state-level interventions, especially the preparation of national and
municipal climate strategies;
to strengthen the information database of decision-making, and
to integrate the adaptation goals in the most affected sectors.
Hungary, fulfilling these requirements, accepted the National Adaptation Strategy (NAS) in
2018 with 6 specific goals that guide adaptation policy planning:
1) the protection of natural resources;
2) the adaptation of vulnerable regions;
3) the adaptation of vulnerable sectors;
4) the adaptation of policies areas with national strategic importance;
5) the adaptation of society; and
6) the strenghtening of activities that target related research, development and innovation.
The NAS outlines the concrete directions at short-, mid- and long-term for those Hungarian
sectors that are mostly affected by climate change impacts. The implementation of the NAS
is supported by actions plans that cover periods for 3 years each.
In January 2020, the Hungarian Government adopted the Report on the scientific assessment
of the possible effects of climate change on the Carpathian Basin34
. This also summarizes the
most important challenges in the field of adaptation based on the most recent scientific
literature available.
4.4.2. Potential response measures and interventions
In the case of water management, the problems related to water scarcity and water surplus
need to be addressed, as well as flood defenses and the prevention of floods and flashfloods
caused by torrential rain. In order to moderate the severity of water scarcity, it is essential to
keep the natural precipitation in place at all areas (farmers, population, settlements). In
regularly flooded areas, it may be necessary to review land use and to plan flood control and
land use integratedly. An important tool for adaptation is the storage of natural precipitation
in the ground, as well as the expansion of water-saving irrigation methods.
Climate change-related damage to agriculture is strongly linked to water management
because an increase in the tendency to drought may pose the greatest risk to agriculture in the
future. Hence, it is particularly important to develop land use - and a system of incentives for
change - that will help reduce extreme weather impacts and ensure that soil fertility is
maintained in the long term. Dissemination of natural water replenishment and conservation-
friendly irrigation systems is key. Adaptive soil management, water management and the
cultivation of plants suitable for the landscape can be used to prevent soil isolation and soil
acidification.
33
EU Commission (2013). Communication from the Commission to the European Parliament, the Council, the
European Economic and Social Committee and the Committee of the Regions: An EU Strategy on Adaptation to
Climate Change Brussels, 16.4.2013 COM (2013) 216 final. Available at: https://eur-lex.europa.eu/legal-
content/EN/TXT/PDF/?uri=CELEX:52013DC0216&from=EN 34
MIT (2020). Report on the scientific assessment of the possible effects of climate change on the Carpathian
Basin. Available at: shorturl.at/dpzEM
88
Forests also play a prominent role in carbon sequestration and adaptation. It is therefore
important to increase forested areas, depending on the conditions of production that change as
a result of climate change, by using mainly native tree species that meet the changing
conditions of production.
Preserving natural and close to natural ecosystems and restoring degraded ecosystems will
help adapt to the effects of climate change. This requires the mapping of ecosystem services
and the coordinated development of elements of “green infrastructure”.
In order to prevent the harmful effects of climate change on human health, it is necessary
to prepare both the institutional system and its employees, as well as the population, for the
intensifying effects of climate change and the possibilities of protection. It is necessary to
compile action plans at the institutional and municipal level as well, and to create the
possibility of cooling in institutions taking care of vulnerable groups (eg hospitals, social
institutions). It is important to control the prevalence of animal carriers and to monitor
infection data. Preparing for climate change emergencies and rapid public health responses is
of key importance.
Municipalities have a wide range of options for preventing and managing the climate
impacts that affect them. It is recommended to continue and further encourage the
development of adaptation strategies with a focus on adaptation at the settlement and
community level, which has started in recent years, together with the related local awareness-
raising activities. It is essential that adaptation and sustainability aspects are consistently
integrated and reflected in agglomeration, settlement development and town planning.
Furthermore, in the construction sector, adaptation and sustainability aspects need to be
consistently incorporated and presented in the strategic and planning documents as well as
construction and land-use rules have to reviewed, tightened and enforced taking climate
change into account. A detailed review of the design and construction conditions of the
municipal green space system, as well as the system of rules concerning elimination and
felling, is also essential. Registering, planned expansion and quality development of green
spaces to improve adaptability and strengthen absorption capacities locally is a key task. The
safe collection, retention and utilization of precipitation requires the climate-safe removal or
conversion of municipal stormwater management systems. Investigation of the storm damage
vulnerability of the municipal building stock and damage risk analysis can also help to
prepare for and develop effective, innovative responses.
The adaptation of the transport sector can be interpreted from the infrastructure and from its
users’ perspective. An important task is to prepare the transport infrastructure for extreme
weather events (heat waves, storms, extreme precipitation), by developing related action
plans and specific interventions (e.g. the use of more heat-resistant pavements). During
transport developments, alternative, environmentally friendly, sustainable (eg fixed-track)
modes of transport are preferred.
In addition to being one of the largest emitters, the energy sector is also a affected in
adaptation. In the future, in line with changing weather elements and trends, it is necessary to
consistently integrate the consideration of climate risks into power plant and energy (gas,
electricity and district heating) infrastructure planning. The development of a climate risk
assessment methodology that takes into account the actual chains of impact is key to the
“climate security” of the energy production and distribution network. The reserves of
weather-dependent renewable energy sources and their sustainable utilization possibilities
need to be reviewed in view of the expected climate change, revealing domestic potentials
(e.g. the use of geothermal energy as a weather-independent renewable energy source).
89
Besides avoiding preventing and preparing for disasters, it is also an important task to
mitigate the already occured damages. A key goal is to develop defense and forecasting
systems together with neighboring countries, and to coordinate action. Preparing for the
potential municipal consequences arising from climate risks is also a task at the level of local
governments in the field of food safety, flood risk and drinking water protection as well as
critical infrastructure protection and industrial safety. At the municipal level, a further task is
to assess the areas sensitive to surface movements, to review the existing landfills, slurry and
sludge reservoirs and tailings ponds, as well as the areas potentially designated for landfill.
In the tourism sector, the two main trends are to strengthen and disseminate adaptation
knowledge bases and to encourage local responses. Within the framework of the former
pillar, the central methodology development can take place in order to develop destination
risk analyzes and vulnerability studies. The elaboration of related destination-level practice-
oriented climate risk assessment and the development of guidelines, aids, manuals, related
training, event organization and curriculum development in support of strategic planning in
the field of tourism also support these trends. In the field of tourism, the climate-conscious
approach is gaining more ground due to the climate awareness of the actors of the sector
regarding the effects and consequences of climate change. Another important group of
concrete local responses in attraction development is product diversification, the promotion
of indoor products in the host area and the promotion of domestic tourism as well as the
application of energy and water saving investments and product development adapted to
climate effects in general.
4.5. Cross cutting policies
The entire system of public organizations, the society and all sectors of the economy must
play their part in the fight against climate change. Sectors that play a key role in reducing
GHG emissions and increasing GHG sequestration (Chapter 4), as well as enabling funding
(Chapter 5) and supporting RDI (Chapter 6), are discussed in separate parts of this strategy.
However, it is also necessary to talk about those cross-cutting areas that cannot be clearly
classified into the examined sectors, which significantly facilitate the effective transition to
climate neutrality. These are areas that can have a positive impact on processes in all emitting
and absorbing sectors. The Preamble to the Paris Agreement also highlights cross-cutting
issues that are crucial for the effective implementation. These are:
education and training,
public access to information, social consciousness,
full participation and cooperation of all levels of government and stakeholders,
sustainable lifestyles and sustainable consumption and production patterns.
4.5.1. Education and training
Article 12 of the Paris Agreement prescribes that "The Parties shall cooperate, as appropriate,
in promoting measures to support education and training on climate change, recognizing the
importance of these steps in enhancing actions set out in this Agreement." The Paris
Agreement reaffirms the key role of education and training. As discussed in the NCCS-2, it is
of particular importance to shape attitudes through education in which sustainability issues
are presented in an integrated way, not in isolation. Knowledge that draws attention and
teaches consciousness about sustainable development needs to be incorporated into curricula.
90
With a commitment to the environment, the professionals of the future need to implement
ideas that take the impact of their activities on the environment into account.
In primary and secondary education, the National Core Curriculum (NAT)35
already
reflects these important aspects. Between the first and eighth grade, the main topics include
“preserving the order of nature for sustainability”. Among the learning outcomes, the aspects
of sustainability appear in a specifically practice-oriented way.36
The NAT also sets
additional sustainability requirements for more senior years.37
There is also a non-
governmental organization in Hungary to promote the above goals. 38
The same approach is needed in higher education, where it is necessary to transfer
comprehensive and special knowledge related to sustainability and climate change,
adapted to the needs and aspects of each specialization. In these areas of higher education
(e.g. medical training, disaster management, economics, engineering, law training, etc.)
understanding climate change and global environmental issues is particularly important,
especially for the effective climate-neutral transition and preparedness for the unavoidable
impacts. The (re)training of professionals competent to develop and/or apply new
technologies and processes is key to achieving climate neutrality goals. Therefore, the
identification of relevant areas of higher education and other vocational training and the
appropriate transformation of training is a key policy objective. Last but not least, support for
research relevant to the fight against climate change in post-graduate and doctoral programs
should be promoted.
4.5.2. Public participation, public access to information and social consciousness
In addition to education and training, there is also a need to increase the general
awareness of the society. Article 12 of the Paris Agreement prescribes that “The Parties
shall cooperate, as appropriate, in supporting measures to promote [...] public awareness of
climate change, public participation and public access to information, recognizing the
importance of these steps with respect to enhancing the actions set out in the Agreement. "
Therefore, in addition to the Preamble, the Agreement confirms the key role of these areas in
a separate operational provision as well.
Hungary is a party to the Aarhus Convention39
, which also legally guarantees the “right of the
public to have access to information, to participate in decision-making and to access justice in
35
Government of Hungary (2020). 5/2020. (I. 31.) Government Act modifying Act 110/2012. (VI. 4.) on issuing
and implementing the National Core Curriculum. Available at:
https://magyarkozlony.hu/dokumentumok/3288b6548a740b9c8daf918a399a0bed1985db0f/megtekintes 36
E.g. sets an example in toy purchasing habits of elements that can be used to take environmental
considerations into account, and also draws the attention of its peers to these; in the selection of packaging used
on a daily basis, it justifies the application of the principles that promote environmental considerations and
draws the attention of its peers to them, etc. 37
E.g. it interprets the local and biosphere consequences of global climate change on wildlife based on research
data and forecasts; analyzes the causes and consequences of air, water and soil pollution, industrial and natural
disasters, the impact of human activities on habitat change on the basis of examples, explains the endangerment
of certain species, etc. 38
The aim of the Hungarian Environmental Education Association is to develop environmental education, to
support learning sustainability, and to help the work of those involved in environmental education and to
represent their interests. Available at: http://www.mkne.hu/index.php 39
EU Commission (2001). Law LXXXI. (2001) promulgating the Convention on Access to Information, Public
Participation in Decision-Making and Access to Justice in Environmental Matters, adopted in Aarhus on 25 June
1998. Available at: https://net.jogtar.hu/jogszabaly?docid=a0100081.tv
91
environmental matters”.40
This has a special role in the climate-neutral economic and social
transition in all aspects. First and foremost, society needs to be informed about the most up-
to-date scientifically based information available on possible global and local environmental
problems, challenges and solutions. The collection and wide distribution of these data,
tailored to the needs of the target audience, should be facilitated by the state. Only a well-
informed society can be expected to make conscious decisions and take environmental
considerations into account than before. This process will also strengthen social support for
action on climate change by providing rational and publicly sound arguments in support of,
inter alia, the proposals set out in this strategy.
NCCS-2 deals with the main directions of action on climate awareness and partnership
in a separate chapter. These include horizontal integration, the implementation of NCCS-2
in public administration and partnerships with the media and churches as well as complex
campaigns for climate awareness and network building with the involvement of
governmental, economic, civil, scientific and church actors. These, as well as the activities
described in Chapter 7 of the NCDS, all contribute to the complex process of information
transfer and sharing. In addition to the above, the tasks to be performed separately by the
state in order to achieve the above goals are:
Preparing or supporting the preparation of reports and other awareness-raising documents
on climate change or other environmental issues and making them as widely available as
possible to the public,
Providing "one-stop-shop" information services for green economic transition programs
or other measures initiated by the Government or other state bodies, involving the public
and a wide range economic actor,
Initiating, continuing and promoting information campaigns, events, dedicated days on
environmental issues that can reach the general public as well as establishing restrictive
regulations on information intended for public disclosure that is unsustainable or
otherwise harmful to the environment,
Establishing and maintaining partnerships, in particular with non-state actors and other
non-governmental organizations, as well as churches, in order to communicate
information more effectively,
Priority support for local information sharing and awareness raising initiatives,
Using most communication channels, including state-of-the-art forms of communication,
capable of conveying short, creative, easy-to-understand messages, involving highly
publicly recognized, credible actors who can easily reach large masses.
4.5.3. Full participation and cooperation of all levels of government and stakeholders
The climate-neutral transition requires the active participation and constructive cooperation
of all actors. For the vast majority of the Hungarian society, climate change is a significant
issue. A good example of this is that more than two hundred thousand people completed the
questionnaire related the NCDS published by the Government in November 2019.41
A
40
Article 1 of the Aarhus Convention 41
For more information, visit: https://2015-2019.kormany.hu/hu/innovacios-es-technologiai-
miniszterium/energiaugyekert-es-klimapolitikaert-felelos-allamtitkar/hirek/a-kormany-klimapolitikajat-
92
recently published study showed that the Hungarian society is particularly concerned about
the security consequences of climate change.42
This concern should be translated into positive
action, in which the state has a key initiating and organizing role. The forums in Chapter 7,
organized by the current government, provide a permanent platform for consultation between
a wide variety of groups.
4.5.4. Sustainable lifestyles and sustainable consumptions and production patterns
From the climate-neutral transition perspective, there are huge reserves in the production or
other business policy decisions made by individual members of the society and economic
actors. With the current energy-intensive and often wasteful way of life and production, a
climate-neutral operation is not, or it is much more difficult and costly to achieve and
maintain. Mass demand for consciously sustainable products and services is driving supply in
this direction. Vice versa, a “green” favorable supply creates demand for more
environmentally sustainable products and services. Therefore, supporting and promoting both
is a priority.
Changing current lifestyles in a more favorable direction, and only developing
behaviors that seek to meet our needs, is the biggest contribution to the fight against
climate change that individuals can make. The greenest energy is the unused energy. At
the same time, a supportive regulatory environment that promotes and provides incentives for
more sustainable lifestyles and production is essential for well-informed decisions by
individuals and economic actors.
5. Financing Climate Neutral Transition and its Economic Policy Instruments
Vision: "The flow of financial resources is in line with the financing needs of domestic green
and climate action investments."43
Adequate financing of the climate-neutral transition is critical in tackling global climate
change. This is confirmed by Article 2 (1) (c) of the Paris Agreement, which states that one
of the main objectives of the Agreement is to make “finance flows consistent with a pathway
towards low greenhouse gas emissions and climate-resilient development.” Based on the EA
scenario, which generates several benefits in the long run, the climate neutral transformation
of the Hungarian national economy would require about HUF 23.8 billion, which assumes the
involvement of resources equivalent to 4.8% of GDP per year by 2050. In order to make this
amount available from public and private sources, this long-term concept proposes
appropriate funding instruments and mechanisms.
Some of the presented proposals have been included in this chapter of the Strategy after
consultation with representatives of the financial market and other financial organizations44
.
Investments aimed at reducing CO2 emissions are capital-intensive, so it is justified to
tamogatjak-a-valaszadok-es-az-ev-vegeig-kidolgozza-a-tarca-a-klimasemlegesseg-2050-es-eleresehez-
szukseges-strategiat 42
Etl, Alex. (2020). The perception of security in Hungary, Institute for Strategic and Defense Studies
ISDS Analyses 2020/3. Available at: https://svkk.uni-nke.hu/document/svkk-uni-nke-hu-
1506332684763/ISDS_Analyses_2020_3_The%20perception%20of%20security%20in%20Hungary_(Alex%20
Etl)%20(1).pdf 43
UNFCCC (2016). Pursuant to Article 2 (1) (c) of the Paris Agreement. Available at: https://eur-
lex.europa.eu/legal-content/EN/TXT/HTML/?uri=CELEX:22016A1019(01)&from=EN 44
“Climate breakfast” consultation with representatives of the financial sector: 16 June 2020.
93
increase the bankability of investments with loans and state subsidies (e.g. repayable
subsidies, interest rate subsidies, loan guarantees). The financial conditions for a climate-
neutral transition must be created jointly by the private and public sectors, as investment
depends not only on banks' willingness to finance, but also on a stable, transparent and
predictable political and economic environment.
Several proposals have addressed the importance and role of green bond issuance as an
effective tool for dedicated fundraising. Mainstreaming environmental, social, and
governance (ESG) principles, promoting a green mortgage market, applying the EU
sustainable investment taxonomy, energy efficiency requirements and green bonds all
have a positive impact on the development of green projects and interventions. The Strategy
took into account the proposals for the establishment of a state green guarantee institution,
which would strengthen the market balance by reducing the competitive advantage of
unsustainable investments. Stakeholders also support the spread of Energy Services
Companies (ESCO)-type bank financing in the context of municipalities and companies.
The detailed development and follow-up of these proposals is the responsibility of the Green
Finance Working Group comprising of key public, banking and other financial market actors,
presented in Chapter 7.
5.1. Transforming economic policy for a climate neutral transition
In addition to the development of the domestic capital market and the financial sector in
general, the climate-neutral transition requires a governmental economic policy that promotes
low-carbon growth. Each of the individual economic and regulatory functions of the state can
contribute to this, with sustainability in mind, as follows.
Through the “greening” of its allocation function, the state ensures the full use of resources
among private and social goods by enforcing environmental and sustainability considerations
in the process. This means preventing social and environmental harm caused by market
failures through fiscal policy in such a way that a healthy environment, energy and resource
efficiency become an important part of social goods, i.e. the process of allocating resources is
also influenced by green criteria.
The aim of “greening” the redistribution function is to motivate income redistribution not
only to alleviate income inequalities but also to reduce negative environmental impacts. The
reform of the taxation system and public transfers should be done in a way that supports
environmentally sustainable consumption and technological innovation, while over-
consumption and environmentally harmful activities are sanctioned by additional taxes.
The “green” stabilization function aims to smooth out fluctuations in employment, inflation
and GDP in order to promote clean and green economic development. Through this function,
the state can direct labor force towards green and clean jobs, support domestic companies
developing high value-added, innovative clean technologies and services, i.e. respond to the
economic challenges arising from phasing out carbon and the green transition, while using
the inherent economic potential of the process.
By “greening” the regulatory function of the state, it shapes fiscal policy and the regulation
of the money, capital and insurance markets in such a way that climate protection and
environmental sustainability are given a prominent role, among other fiscal aspects.
In addition, climate-friendly fiscal and economic policies have the overall task of creating a
growth-friendly environment that supports the development and innovation of clean
technologies and generates social, environmental and economic benefits. It is also important
94
that this supportive environment also helps to take advantage of new business and foreign
trade opportunities arising from technological developments in order to create high-quality,
sustainable jobs and increase the competitiveness of companies.
5.1.1 Climate friendly budget planning
Climate-friendly, green fiscal policy is an essential tool for achieving environmental and
climate goals.45
Green budgeting aims to align the country’s expenditures and revenues with
climate and other environmental goals. This requires designing both the revenue and
expenditure side from a different perspective. On the revenue side, the taxation system is a
crucial budgetary tool for “correcting” the prices of activities that generate negative
externalities, such as CO2 emissions and pollution. An important aspect is that green budget
planning builds on the country’s existing public finance management framework and thus
aligns with the strengths and constraints of existing fiscal processes.
Effective green budgeting consists of four mutually reinforcing key components46
:
1) Strong strategic framework: the Government aligns the objectives of environmental and
climate strategies with decisions on tax policy (e.g., green taxation), state aid (phase out of
fossil fuel subsidies) and public spending (e.g., green public procurement).
2) Tools for justification and coherence of green budget measures/decisions: Green
budget tools provide evidence of how certain budget measures/decisions affect environmental
and climate goals. These tools can be:
a) Green budget labeling47
: classification of budgetary measures according to their
environmental and/or climate impact.
b) Environmental impact assessment: carry out environmental impact assessments for
new budgetary measures.
c) Ecosystems valuation and pricing of environmental externalities, such as the price of
greenhouse gas emissions, through taxes and emissions trading schemes.
d) Green review of expenditure: taking into account the impact of expenditure on
environmental and climate objectives.
e) Green performance requirements: aligning budgetary performance requirements
targets with environmental and climate objectives.
3) Green reporting for accountability and transparency: The Government submits a green
budget report accompanying the annual budget to the Parliament, which provides a
comprehensive picture of how the budget is aligned with the green objectives in the given
budget year.
4) Governance and implementation of green budgeting: The implementation of green
budgeting is based on strong political leadership, clearly defined roles and responsibilities
within the government, a well-designed sequence of implementation, appropriate internal
systems, and continuous improvement of the skills and expertise of government officials.
45
OECD (2020). Paris Collaborative on Green Budgeting. 20 October 2020. Available at:
https://www.oecd.org/environment/green-budgeting/ 46
OECD (2020). OECD Green Budgeting Framework. Available at: https://www.oecd.org/environment/green-
budgeting/OECD-Green-Budgeting-Framework-Highlights.pdf 47
In accordance with the Taxonomy Regulation 2020/852.
95
5.2. Financial and investment needs of climate neutrality
As revealed in Chapter 4, achieving a climate-neutral transition by 2050 will require a total of
approximately HUF 24.7 billion in additional investment in all emitting sectors compared to
the BAU scenario, which will require the mobilization of resources equivalent to 4.8% of
GDP per year until the target date. It is important to note, however, that mobilizing this huge
amount should not only burden Hungary's national budget, but also - as discussed in this
subchapter - give priority to the involvement of financial and capital markets, EU funds and
blended financing of public and private funds. This is because market-based and blended
financing allows limited taxpayer resources to be used for leverage to mobilize 10 or even 20
times of the amount being invested.
The costs of investments to be made over the period up to 2050 are distributed between the
sectors as follows:
- Decarbonization of the energy sector, including the energy efficiency modernization
of buildings, improvement of electricity infrastructure, increase the efficiency in the
service sector and electrification of the transport sector: HUF 22.4 billion
- Investments related to the reduction of emissions from agriculture, including animal
husbandry, crop production and soil cultivation: HUF 745 billion
- Development of the waste management sector and promotion of the circular
economy: HUF 480 billion
- Modernization of industrial production processes, increase of production efficiency:
HUF 129 billion
- Increasing the CO2 sequestration capacity of the LULUCF sector: HUF 964 billion.
Table 11 also provides information on how investment costs will change over the period of
2020-2030.
5.3. The role of the financial sector in the green transition
In the double grip of the health and financial crisis caused by the COVID-19 pandemic, the
transition to a green economy opens up new types of investment opportunities, but also
imposes financing needs comparable to the post-World War II reconstruction48
. The role and
importance of the financial sector is shown by the fact that it would not be impossible to
finance this investment need from public funds only, given the budgetary constraints of
national economies. Thus, it is absolutely necessary for the private sector, and especially
financial institutions, to channel more capital towards green developments and investments
than at present.
5.3.1. The need to develop domestic financial markets49
Based on international experience, there is a huge potential for mobilizing capital markets,
especially because the typically longer maturity of capital market instruments fits well with
48
Claudia Kemfert, Dorothea Schäfer, Willi Semmler. (2020). Great Green Transition and Finance.
Intereconomics. Available at: https://www.intereconomics.eu/contents/year/2020/number/3/article/great-green-
transition-and-finance.html 49
Laura Jókuthy, Nóra Szarvas and Gábor Gyura. (2020). Recommendations of the Central Bank of Hungary
for the National Clean Development Strategy. July 2020. Budapest.
96
the typically longer payback period of green investments. That is why the NCDS’s funding
pillar consists of a strong capital market package as follows:
a) Development of a National Sustainable Capital Market Strategy: Within the framework of
the European Union Structural Reform Support Service and with the participation of the
European Bank for Reconstruction and Development (EBRD) and the Central Bank of
Hungary (CBH), investment service providers, investors and other market participants,
ministries and all other relevant stakeholders a project promoting the “greening” of the
domestic capital market was launched in Hungary. The aim of the comprehensive initiative is
to enable the capital market to finance investments in environmental sustainability to a
greater extent than at present, and for "green" companies to have access to more favorable
capital or bond-type resources.
b) Green bonds: In June 2020, the Hungarian government issued first green government
securities worth EUR 1.5 billion in the European market and then JPY 20 billion in the
Japanese market, raising dedicated funds for government investments related to Hungary's
climate and environmental goals. The aim is to support the start-up of domestic corporate,
bank or even municipal green bond issuances – in accordance with Act CXCIV of 2011 on
the economic stability of Hungary - and the strengthening of venture capital to finance
climate-friendly innovations, accompanied by various regulatory incentives.
c) Green investment and venture capital funds, “greening” of fund portfolios: At present,
investment funds and funds with domestic sustainability themes can essentially only buy
foreign green assets into their portfolios, and thus retail green investments also flow abroad.
The emergence of domestic green bonds and the development of the ESG rating of listed
companies could change this situation in such a way that it also contributes to the
development of investment funds. It is a positive trend that domestic fund managers have
moved towards ESG-based portfolio management practices50
. Strengthening venture capital
is also a goal to finance climate-friendly innovations.
d) Sustainable Stock Exchange: The Budapest Stock Exchange joined the Association of
Sustainable Stock Exchanges in 2019 and is committed to encourage stock market issuers
towards sustainability. If the climate and other environmental performance data of large
domestic listed companies become more transparent, then the green assessment of companies
will also become possible, thus further helping the desired green capital flow. The
Sustainable Exchange Initiative, in collaboration with investors, regulators and companies,
can improve sustainability and ESG considerations for investments.
5.3.2. Financing instruments in specific sectors
a) Support for energy efficiency modernization of residential buildings
Promoting the energy efficiency renovation of residential buildings is a national
economic interest, given that this type of investment has not only one of the greatest GHG
saving potential (see Chapter 4.), but is also capable of creating large number of jobs on a
50
Central Bank of Hungary (2020). The central bank welcomes BAMOSZ's initiative on ESG investment funds.
October 13, 2020, Available at: https://www.mnb.hu/sajtoszoba/sajtokozlemenyek/2020-evi-
sajtokozlemenyek/a-jegybank-udvozli-a-bamosz-kezdemenyezeset-az-esg-befektetesi-alapokrol
97
lasting basis. In addition, they provide significant health benefits.51
Building on the
experience of previous energy efficiency loan schemes, the aim is to develop a
comprehensive state support system (repayable grants, interest rate subsidies and loan
guarantees) based on the competitive and flexible framework of commercial banks.
Therefore, a joint “package” of several measures is needed to ensure adequate funding
sources as follows: (1) CBH announced a capital requirement discount for green housing
loans, thus increasing banks' interest in such loans52
; (2) this measure should be
complemented by a comprehensive support structure mobilizing private resources (such as
repayable, non-repayable grants and interest rate subsidies) for renovation loans, and (3) the
introduction of a loan guarantee scheme to reduce credit risks.
b) Launch of the green mortgage bond market
Green mortgage bonds are a targeted source of funding for banks to finance the
construction and purchase of energy-efficient properties through loans, thus contributing to
the energy modernization of the building stock. In the case of green mortgage bonds, the
issuer undertakes to have at least the same amount of green mortgage loan in the loan
portfolio as the collateral for the mortgage bonds during the term of the bond. This may
encourage lenders to prefer such mortgages, which may even lead up to more favorable
interest rates. To date, banks in five European countries (Germany, Norway, Sweden,
Denmark and Poland) have issued green mortgage bonds.
c) Support for other energy efficiency investments, introduction of the energy efficiency
obligation scheme
Hungary will ensure the cost-effective implementation of the goals undertaken in the field of
energy savings and energy efficiency by introducing an energy efficiency obligation
scheme. The scheme will include a number of measures to encourage energy efficiency
renovation. The obligors are service providers engaged in the retail sale of gas, electricity and
motor fuels, commercial enterprises, universal service providers of gas and electricity. Under
the scheme, obligors implement interventions that result in energy savings for end users. This
can be done in a number of ways: through investments in energy efficiency or through
contributions.
For the period from 1 January 2021 to 31 December 2030, each year, new savings of 0.8% of
annual final energy consumption must be achieved over the average of the last three years
preceding 1 January 2019.
d) Support for renewable energy production
On 1 January 2017, the system for the support of electricity produced from renewable
energy sources (METÁR) came into force. In the METÁR system, support for new
investments can currently only be applied for in the form of a green premium-type
entitlement awarded within the framework of a tender procedure. In the tenders, the
producers compete on the basis of their bids for the subsidized price, for a subsidy amounting
51
Diana Ürge-Vorsatz, Radhika Khosla, Rob Bernhardt, Yi Chieh Chan, David Vérez, Shan Hu, Luisa F.
Cabeza. (2020). Advances Toward a Net-Zero Global Building Sector. 2020 45:1, 227-269. Available at:
https://doi.org/10.1146/annurev-environ-012420- 045843
52 Central Bank of Hungary (2019). The central bank introduces a capital requirement discount program for
green housing purposes. 16 Dec 2019. Available at: https://www.mnb.hu/sajtoszoba/sajtokozlemenyek/2019-
evi-sajtokozlemenyek/lakascelu-zold-tokekovetelmeny-kedvezmeny-programot-vezet-be-az-mnb
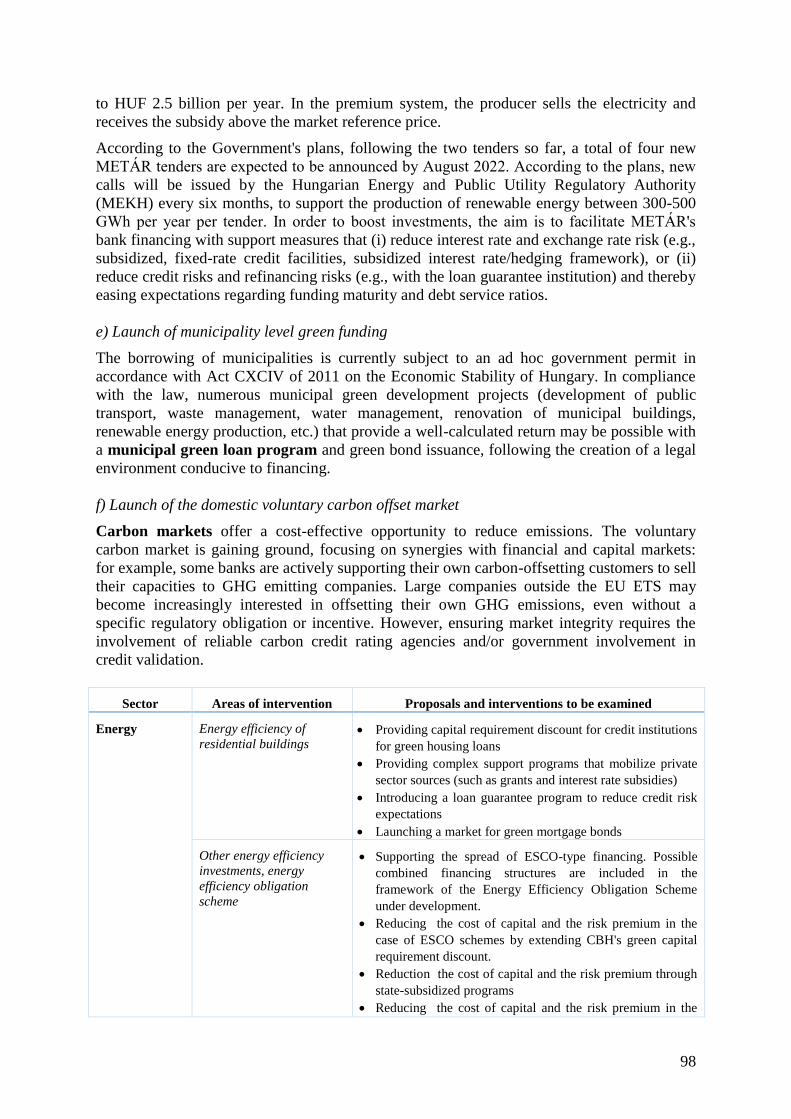
98
to HUF 2.5 billion per year. In the premium system, the producer sells the electricity and
receives the subsidy above the market reference price.
According to the Government's plans, following the two tenders so far, a total of four new
METÁR tenders are expected to be announced by August 2022. According to the plans, new
calls will be issued by the Hungarian Energy and Public Utility Regulatory Authority
(MEKH) every six months, to support the production of renewable energy between 300-500
GWh per year per tender. In order to boost investments, the aim is to facilitate METÁR's
bank financing with support measures that (i) reduce interest rate and exchange rate risk (e.g.,
subsidized, fixed-rate credit facilities, subsidized interest rate/hedging framework), or (ii)
reduce credit risks and refinancing risks (e.g., with the loan guarantee institution) and thereby
easing expectations regarding funding maturity and debt service ratios.
e) Launch of municipality level green funding
The borrowing of municipalities is currently subject to an ad hoc government permit in
accordance with Act CXCIV of 2011 on the Economic Stability of Hungary. In compliance
with the law, numerous municipal green development projects (development of public
transport, waste management, water management, renovation of municipal buildings,
renewable energy production, etc.) that provide a well-calculated return may be possible with
a municipal green loan program and green bond issuance, following the creation of a legal
environment conducive to financing.
f) Launch of the domestic voluntary carbon offset market
Carbon markets offer a cost-effective opportunity to reduce emissions. The voluntary
carbon market is gaining ground, focusing on synergies with financial and capital markets:
for example, some banks are actively supporting their own carbon-offsetting customers to sell
their capacities to GHG emitting companies. Large companies outside the EU ETS may
become increasingly interested in offsetting their own GHG emissions, even without a
specific regulatory obligation or incentive. However, ensuring market integrity requires the
involvement of reliable carbon credit rating agencies and/or government involvement in
credit validation.
Sector Areas of intervention Proposals and interventions to be examined
Energy Energy efficiency of
residential buildings Providing capital requirement discount for credit institutions
for green housing loans
Providing complex support programs that mobilize private
sector sources (such as grants and interest rate subsidies)
Introducing a loan guarantee program to reduce credit risk
expectations
Launching a market for green mortgage bonds
Other energy efficiency
investments, energy
efficiency obligation
scheme
Supporting the spread of ESCO-type financing. Possible
combined financing structures are included in the
framework of the Energy Efficiency Obligation Scheme
under development.
Reducing the cost of capital and the risk premium in the
case of ESCO schemes by extending CBH's green capital
requirement discount.
Reduction the cost of capital and the risk premium through
state-subsidized programs
Reducing the cost of capital and the risk premium in the
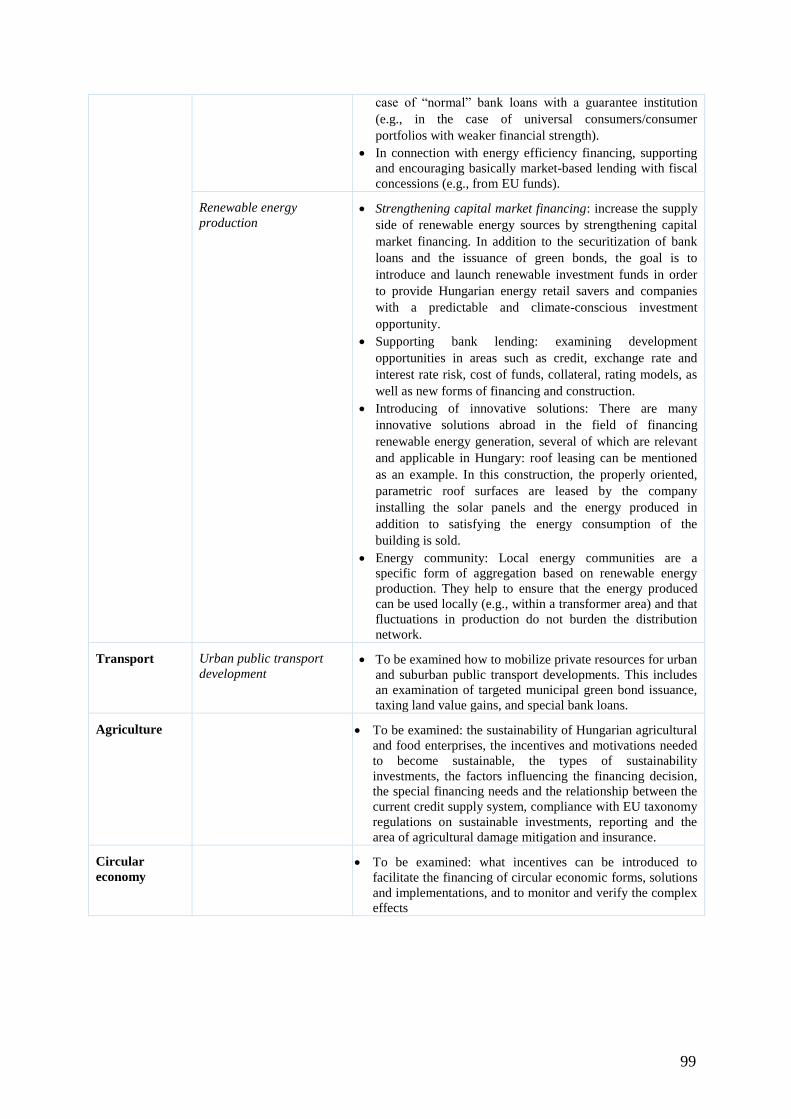
99
case of “normal” bank loans with a guarantee institution
(e.g., in the case of universal consumers/consumer
portfolios with weaker financial strength).
In connection with energy efficiency financing, supporting
and encouraging basically market-based lending with fiscal
concessions (e.g., from EU funds).
Renewable energy
production Strengthening capital market financing: increase the supply
side of renewable energy sources by strengthening capital
market financing. In addition to the securitization of bank
loans and the issuance of green bonds, the goal is to
introduce and launch renewable investment funds in order
to provide Hungarian energy retail savers and companies
with a predictable and climate-conscious investment
opportunity.
Supporting bank lending: examining development
opportunities in areas such as credit, exchange rate and
interest rate risk, cost of funds, collateral, rating models, as
well as new forms of financing and construction.
Introducing of innovative solutions: There are many
innovative solutions abroad in the field of financing
renewable energy generation, several of which are relevant
and applicable in Hungary: roof leasing can be mentioned
as an example. In this construction, the properly oriented,
parametric roof surfaces are leased by the company
installing the solar panels and the energy produced in
addition to satisfying the energy consumption of the
building is sold.
Energy community: Local energy communities are a
specific form of aggregation based on renewable energy
production. They help to ensure that the energy produced
can be used locally (e.g., within a transformer area) and that
fluctuations in production do not burden the distribution
network.
Transport Urban public transport
development To be examined how to mobilize private resources for urban
and suburban public transport developments. This includes
an examination of targeted municipal green bond issuance,
taxing land value gains, and special bank loans.
Agriculture To be examined: the sustainability of Hungarian agricultural
and food enterprises, the incentives and motivations needed
to become sustainable, the types of sustainability
investments, the factors influencing the financing decision,
the special financing needs and the relationship between the
current credit supply system, compliance with EU taxonomy
regulations on sustainable investments, reporting and the
area of agricultural damage mitigation and insurance.
Circular
economy
To be examined: what incentives can be introduced to
facilitate the financing of circular economic forms, solutions
and implementations, and to monitor and verify the complex
effects
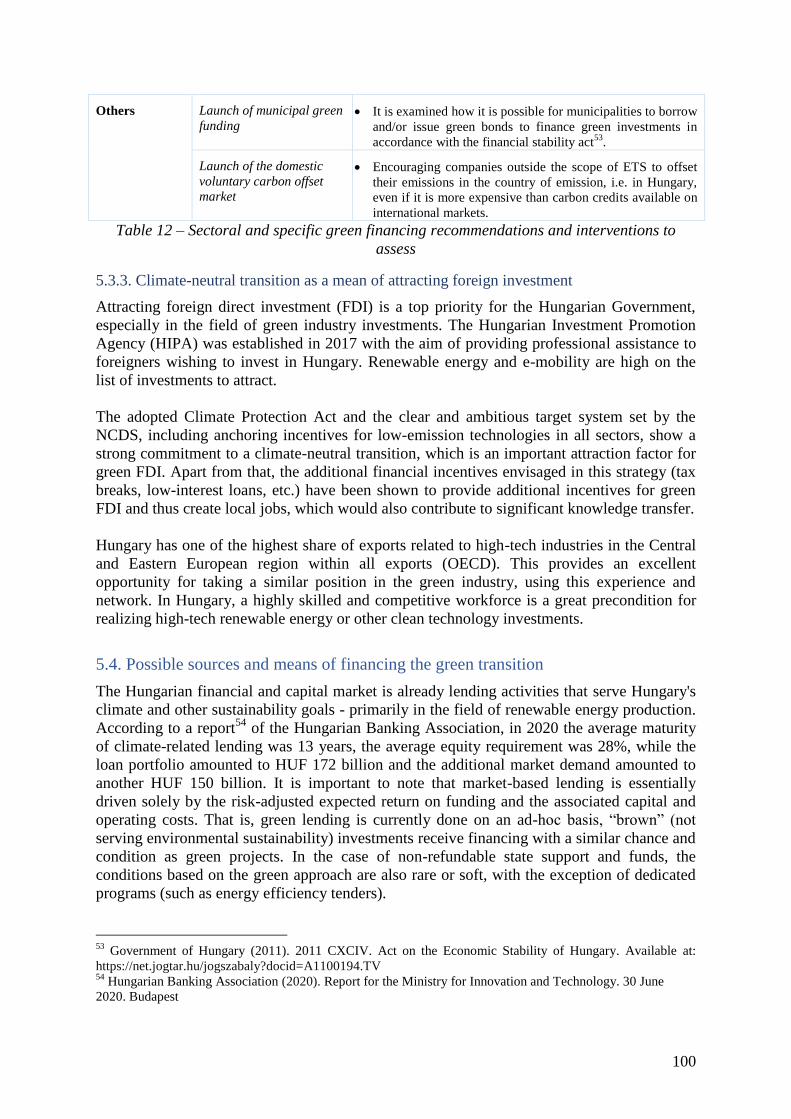
100
Others Launch of municipal green
funding It is examined how it is possible for municipalities to borrow
and/or issue green bonds to finance green investments in
accordance with the financial stability act53
.
Launch of the domestic
voluntary carbon offset
market
Encouraging companies outside the scope of ETS to offset
their emissions in the country of emission, i.e. in Hungary,
even if it is more expensive than carbon credits available on
international markets.
Table 12 – Sectoral and specific green financing recommendations and interventions to
assess
5.3.3. Climate-neutral transition as a mean of attracting foreign investment
Attracting foreign direct investment (FDI) is a top priority for the Hungarian Government,
especially in the field of green industry investments. The Hungarian Investment Promotion
Agency (HIPA) was established in 2017 with the aim of providing professional assistance to
foreigners wishing to invest in Hungary. Renewable energy and e-mobility are high on the
list of investments to attract.
The adopted Climate Protection Act and the clear and ambitious target system set by the
NCDS, including anchoring incentives for low-emission technologies in all sectors, show a
strong commitment to a climate-neutral transition, which is an important attraction factor for
green FDI. Apart from that, the additional financial incentives envisaged in this strategy (tax
breaks, low-interest loans, etc.) have been shown to provide additional incentives for green
FDI and thus create local jobs, which would also contribute to significant knowledge transfer.
Hungary has one of the highest share of exports related to high-tech industries in the Central
and Eastern European region within all exports (OECD). This provides an excellent
opportunity for taking a similar position in the green industry, using this experience and
network. In Hungary, a highly skilled and competitive workforce is a great precondition for
realizing high-tech renewable energy or other clean technology investments.
5.4. Possible sources and means of financing the green transition
The Hungarian financial and capital market is already lending activities that serve Hungary's
climate and other sustainability goals - primarily in the field of renewable energy production.
According to a report54
of the Hungarian Banking Association, in 2020 the average maturity
of climate-related lending was 13 years, the average equity requirement was 28%, while the
loan portfolio amounted to HUF 172 billion and the additional market demand amounted to
another HUF 150 billion. It is important to note that market-based lending is essentially
driven solely by the risk-adjusted expected return on funding and the associated capital and
operating costs. That is, green lending is currently done on an ad-hoc basis, “brown” (not
serving environmental sustainability) investments receive financing with a similar chance and
condition as green projects. In the case of non-refundable state support and funds, the
conditions based on the green approach are also rare or soft, with the exception of dedicated
programs (such as energy efficiency tenders).
53
Government of Hungary (2011). 2011 CXCIV. Act on the Economic Stability of Hungary. Available at:
https://net.jogtar.hu/jogszabaly?docid=A1100194.TV 54
Hungarian Banking Association (2020). Report for the Ministry for Innovation and Technology. 30 June
2020. Budapest
101
The long-term success of decarbonisation may depend on the ability to channel capital
towards green projects through appropriate measures. It must therefore be ensured that
investments for environmental sustainability and environmentally sustainable economic
activities consistently face a more favorable financing environment than “non-green” and
especially “brown” investments and activities. This desirable state can be achieved by
combining monetary and fiscal policy instruments:
a) in its own regulatory competence, the CBH “directs” the financial sector in the green
direction by calibrating prudential regulation, with recommendations and warnings, without
endangering its main tasks specified in the Central Bank Act;
(b) the government encourages green financing of banks and capital market participants, as
well as other market participants (companies, households, etc.), through various fiscal
measures; and with the optimal combination of incentives and penalties, it influences the
realization of the necessary investments in the transition on the demand side.
It is also important to emphasize that the financial, capital and insurance markets have orders
of magnitude more resources available than national budgets or EU funds for green purposes.
5.4.1. Guarantee institutions to promote green financing55
Positive externalities resulting from building retrofitting are most often not taken into account
by financial market participants, i.e. without state incentives, fewer socially optimal
investments are made. The supply side can be ensured by a state guarantee or an interest rate
subsidy to a level that can establish a proper market equilibrium. The establishment of a
dedicated green guarantee institution will ensure a targeted, conscious expansion of green
funding. The basic multiplier effect of the guarantee is also present here: a unit of guaranteed
amount allows for a loan of 10 or even 20 times, which can be used to multiply the growth
rate of green investments.
The importance of the guarantee institution continues to grow during the downturn caused by
the COVID-19 pandemic; due to its countercyclical operation it is excellent for green
economic stimulus, counterbalancing banks' risk-averse strategies and financing green
investments of under-collateralised customers.
As the introduction of an energy efficiency obligation scheme is an important tool in the
NCDS (in which ESCO-based financing can be a key), the relationship between ESCOs and
the guarantee institution is as follows:
Prospective public utility obligors of the obligation system are typically more
creditworthy, have cheaper access to funding than their end-users, but at the same time
operate with strained liquidity, so the planned cash flow is very important for them. As a
result, end-user segments where payment delays and non-deliveries occur are not target
markets for them. By preferring the “best” customers, energy efficiency investments are
not realized in Hungary to the extent what the market potential would actually allow.
The portfolio guarantee, which can also be applied to the ESCO scheme, provides an
effective solution to this problem. Based on the default rate of the utilities' customers, the
extent of the guarantee required by the guarantee institution for the entire portfolio can be
calculated. For example, at a default rate of 5%, a portfolio loss guarantee calibrated on
55
Laura Jókuthy, Nóra Szarvas and Gábor Gyura. (2020). Recommendations of the Central Bank of Hungary
for the National Clean Development Strategy. July 2020. Budapest.
102
the basis of expected loss has a twenty-fold multiplier effect, while an energy efficiency
investment in an ESCO scheme could be implemented for customers who would not
otherwise have been selected by the obligor without a guarantee incentive. In addition to
the general public, the end-user clientele also includes, for example, state-owned
companies, educational institutions, local governments and hospitals.
The portfolio-type guarantee can be used for loans financing the modernization of non-
residential real estate, as well as for household-sized solar collector and PV investments,
as well as for financing small-scale solar power plants, which are subject to individual,
lengthy assessment by banks. Bank financing expertise is usually concentrated in project
lending, however the financing needs of these clients do not reach the entry threshold for
project lending.
The following advantages justify the consideration of setting up a Green Guarantee
Institution:
concentrates green industry expertise within one organization;
supports the building of the historical experience of financiers (this could be helped
by the creation of "green" pilot projects in all industries with the support of the
guarantee institution);
provides free technical and green advice on the investments to be made;
provides guarantees not only for loans but even green bonds (by reducing the risk
premium, the pricing of the funds covered by the green bond can be improved, which
indirectly improves the return on the financed investments);
It also encourages equity placements (such as support for green venture capital funds)
5.4.2 Available European Union funds
In the EU budget period 2021-2027, Hungary is expected to receive a total of ~ EUR 42
billion (approximately HUF 14 -15 thousand billion) of EU funding from the 2021-2027
multi-annual financial framework and the Next Generation EU framework, which
includes non-refundable and refundable forms of support, but does not include a mandatory
minimum national co-financing. Of this, the relevant budget for the implementation of this
Strategy is EUR 30.88 billion in the following composition (excluding Common Agriculture
Policy support):
- Cohesion Fund support: EUR 21.73 billion,
- Non-repayable part of the Recovery Fund: EUR 7.17 billion,
- Just Transition Fund: EUR 0.25 billion,
- Estimated national share of EU direct programs: EUR 1.73 billion.
Of this, the minimum amount to be used for climate goals under EU regulations is expected
to be EUR 8.2 billion. Together with the mandatory minimum national co-financing, HUF
2.9 billion is available to finance climate investments by 2030.
Part of the above is the newly established Just Transition Mechanism, which aims to
support the economic transformation of regions’ sectors that are affected by climate policy
developments. Although negotiations are still ongoing, Hungary will receive a grant of EUR
103
294 million from the Just Transition Fund, which may be complemented by loans from
Pillars 2 and 3 of the Just Transition Mechanism.
The framework available to Hungary presented above does not include the subsidies available
under the Common Agricultural Policy, so the climate-related interventions to be
implemented in the field of agriculture do not burden the HUF 4.1 billion envelope.
The framework, on the other hand, includes sources available from directly EU-managed
programs, on the assumption that Hungary will be able to increase the amount of national
support it has received over the period 2014-2020. Programs under direct EU management
will be available to finance energy and climate protection projects with increased funding for
the period 2021-2027, such as Horizon Europe (RDI), the Connecting Europe Facility
(energy infrastructure), LIFE (environment, climate policy), Digital Europe (digitalization),
InvestEU (efficient transport infrastructure, green energy and innovation) and the Innovation
Fund (innovative carbon-free technologies, CCUS, innovative renewable energy production,
energy storage).
In the third trading period of the EU Emissions Trading Scheme (2013-2020), a certain
proportion of the revenues from the sale of allowances (50% of European Union Allowance
(EUA) III unit sales, 100% of EUAA aviation unit sales) will be used in the appropriations
managed by the Green Economy Financing Scheme. Between 2021 and 2030, assuming an
average CO2 price of EUR 25 per ton, a quota revenue of approximately HUF 910
billion56
can be planned. Of this, HUF 726 billion will be available according to the general
rules of quota revenues57
, i.e. 50% (HUF 363 billion) will be used for green economy
development purposes.
The part of the quota revenues for the development of the green economy is
supplemented by the resources of the Modernization Fund58
in the amount of HUF 184
billion: Hungary will be entitled to these in excess of the amounts used according to the
general rules of current quota revenues. The Modernization Fund, which has been in place
since 2021, aims to modernize energy systems and increase energy efficiency. At least
70% of the available financial resources must be used to support investments that meet the
priority list of the Modernization Fund. For the remaining 30% of the funds, other projects
related to the modernization of the energy system may be supported. For projects on the
priority list, the aid intensity may not exceed 100%, otherwise up to 70%. The priority list
that can be revised in 2024 includes the following elements:
production and use of electricity from renewable sources;
improving energy efficiency in all sectors;
energy storage;
modernization of energy networks, including district heating lines and electricity
networks;
expanding connections between Member States;
56
The estimation of revenues is subject to considerable uncertainty, as the price of allowances is traded on the
stock exchange and is also affected by the functioning of the market stability reserve, the need for free allocation
and certain political factors (e.g., Brexit). Therefore, the figure can only be considered as an indicative estimate. 57
Directive 2003/87 / EC of the European Parliament and of the Council of 13 October 2003 establishing a
scheme for greenhouse gas emission allowance trading within the Community and amending Council Directive
96/61 / EC (Article 10 (3)) 58
Financing mechanism under Article 10d of Directive 2003/87 / EC of the European Parliament and of the
Council.
104
supporting just transition (human aspect).
The domestic application of derogation 10c between 2021 and 2030 is intended to replace
electricity generation with high greenhouse gas emissions with natural gas or sustainable
technologies. The aid intensity may not exceed 70%. The winning projects will be selected
through a call for proposals.
In total, between 2021 and 2030, the amount of EU funds available to Hungary to finance
the green transition and the achievement of climate goals may exceed HUF 3 500 billion.
105
6. Research, Development and Innovation
Achieving climate neutrality requires a long-term reduction in GHG emissions and an
increase in sink capacities at a rate which is currently not possible with existing technologies,
or achievable at excessive costs, or only feasible with radical lifestyle changes that are
disproportionate to the pursued goal. According to the International Energy Agency (IEA),
nearly 45% of the emission reductions will be carried out by technologies that are currently in
the development phase (characterized by the first four stages of the TRL scale59
including
basic and applied research phases). For that matter, RDI are crucial to achieving our energy
and climate goals. Furthermore, the reduction in cost induced by RDI will significantly
promote the expansion of new technologies.
6.1. Innovative technologies and solutions
In the future, the multiplication of mitigation and adaptation technologies will need to be
promoted since only one technology or alternative fuel will not be enough to decarbonize our
economy and adapt to the negative impacts of climate change. Therefore, the successful
outcome depends on the availability of technologies and alternative fuels as well as on the
right combination of the possible solutions.
6.1.1. Value chain maturity of critical energy technologies
According to the IEA, the full decarbonization depends primarily on the value chain maturity
of electrification, hydrogen (and its derivatives), bioenergy as well as of CCUS technologies
that ensure the capture, storage and utilization of CO2. Therefore, the scaling up of currently
available clean technologies as well as the emergence of new technologies and their market
application should be supported.
Independent modelling results point out that achieving net zero emissions will bring along
extensive electrification. According to the IEA, in order to reach global climate neutrality by
2050, electricity production should be increased about 2.5 times by mid-century. This
demand should be covered by clean, carbon free (renewable and nuclear) sources. Based on
the EA scenario, electricity production in Hungary will be around 3 times of the current level
by 2050.
Achieving climate neutrality requires a radical change in the methods of energy supply,
transformation and consumption. Furthermore, the integration of energy capacities is a key
task which demands a smarter, more resilient and flexible electricity network that can adopt
to necessary weather-dependent capacities.
It is essential to extend renewable energy sources as well as nuclear capacities to achieve the
climate neutrality target. In the field of nuclear power, further efforts need to be made to
reach the necessary levels.
Renewable energy generation fundamentally depends on the availability of renewable energy
sources and the readiness of the electricity network. In Hungary, solar energy is the most
potential source for renewable energy generation. In the field of photovoltaic technology,
alongside other variable / weather-dependent renewable technologies, there has been a
59
The maturity of technologies under development is characterized by Technology Readiness Levels (TRL).
This method was developed by NASA originally identifying levels from 1-9. The IEA extended this scale to 11
levels that includes the most mature technologies in the list. Levels 1-4 characterize technologies in the
preliminary phases of research and development (basic and applied research), while Levels 5-8 identify system
models or prototype demonstration in a relevant operational environment. Level 9-10 stand for proved solutions
and technologies ready for commercial deployment. Level 11 corresponds to the most mature technologies.
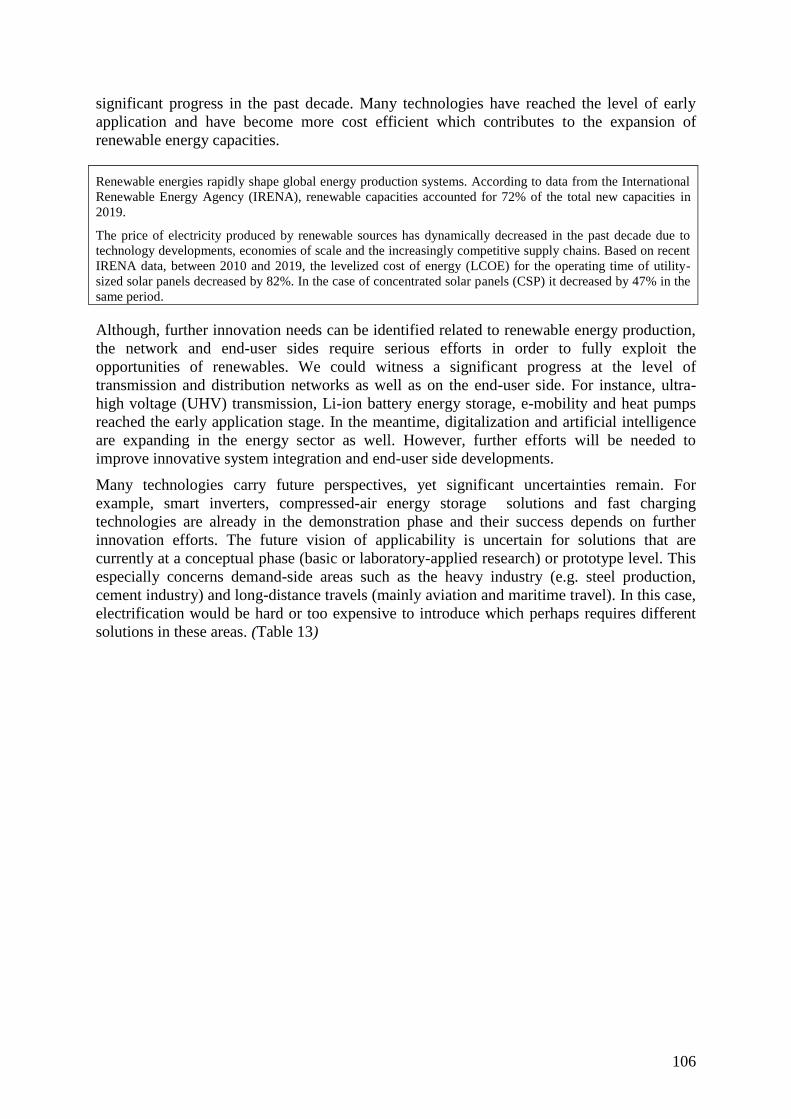
106
significant progress in the past decade. Many technologies have reached the level of early
application and have become more cost efficient which contributes to the expansion of
renewable energy capacities.
Renewable energies rapidly shape global energy production systems. According to data from the International
Renewable Energy Agency (IRENA), renewable capacities accounted for 72% of the total new capacities in
2019.
The price of electricity produced by renewable sources has dynamically decreased in the past decade due to
technology developments, economies of scale and the increasingly competitive supply chains. Based on recent
IRENA data, between 2010 and 2019, the levelized cost of energy (LCOE) for the operating time of utility-
sized solar panels decreased by 82%. In the case of concentrated solar panels (CSP) it decreased by 47% in the
same period.
Although, further innovation needs can be identified related to renewable energy production,
the network and end-user sides require serious efforts in order to fully exploit the
opportunities of renewables. We could witness a significant progress at the level of
transmission and distribution networks as well as on the end-user side. For instance, ultra-
high voltage (UHV) transmission, Li-ion battery energy storage, e-mobility and heat pumps
reached the early application stage. In the meantime, digitalization and artificial intelligence
are expanding in the energy sector as well. However, further efforts will be needed to
improve innovative system integration and end-user side developments.
Many technologies carry future perspectives, yet significant uncertainties remain. For
example, smart inverters, compressed-air energy storage solutions and fast charging
technologies are already in the demonstration phase and their success depends on further
innovation efforts. The future vision of applicability is uncertain for solutions that are
currently at a conceptual phase (basic or laboratory-applied research) or prototype level. This
especially concerns demand-side areas such as the heavy industry (e.g. steel production,
cement industry) and long-distance travels (mainly aviation and maritime travel). In this case,
electrification would be hard or too expensive to introduce which perhaps requires different
solutions in these areas. (Table 13)
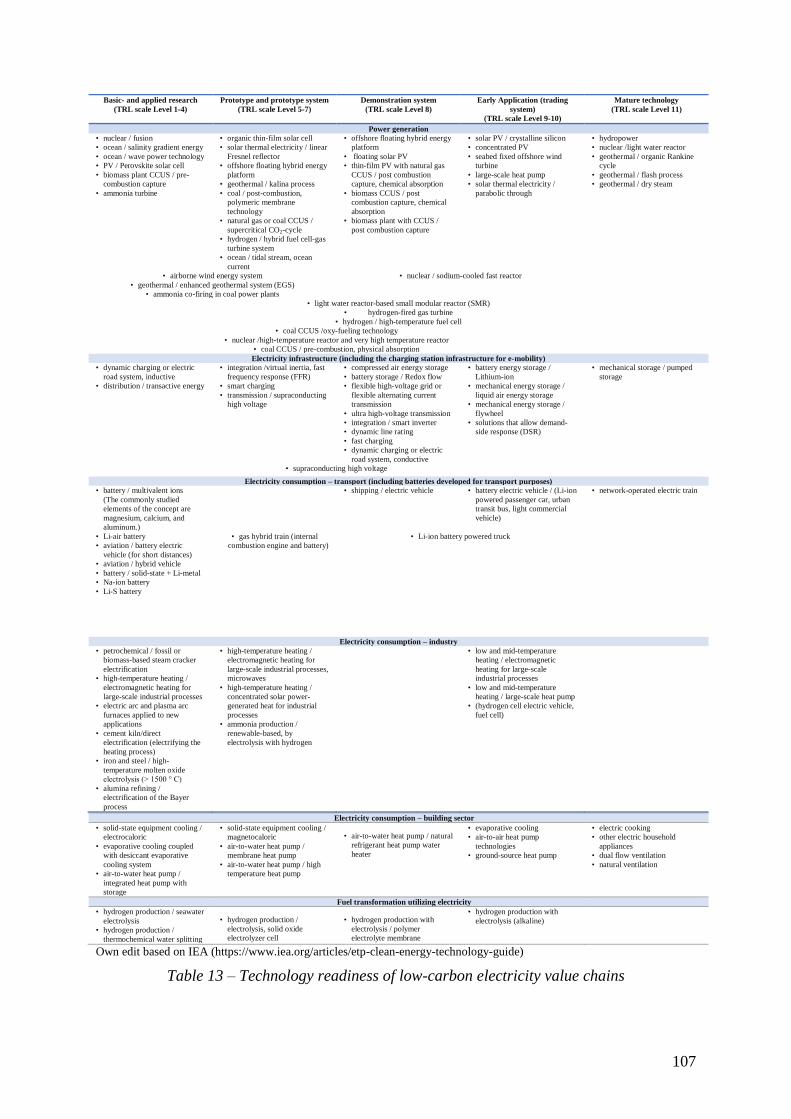
107
Basic- and applied research
(TRL scale Level 1-4)
Prototype and prototype system
(TRL scale Level 5-7)
Demonstration system
(TRL scale Level 8)
Early Application (trading
system)
(TRL scale Level 9-10)
Mature technology
(TRL scale Level 11)
Power generation
• nuclear / fusion
• ocean / salinity gradient energy
• ocean / wave power technology
• PV / Perovskite solar cell
• biomass plant CCUS / pre-
combustion capture
• ammonia turbine
• organic thin-film solar cell
• solar thermal electricity / linear
Fresnel reflector
• offshore floating hybrid energy
platform
• geothermal / kalina process
• coal / post-combustion,
polymeric membrane
technology
• natural gas or coal CCUS /
supercritical CO2-cycle
• hydrogen / hybrid fuel cell-gas
turbine system
• ocean / tidal stream, ocean
current
• offshore floating hybrid energy
platform
• floating solar PV
• thin-film PV with natural gas
CCUS / post combustion
capture, chemical absorption
• biomass CCUS / post
combustion capture, chemical
absorption
• biomass plant with CCUS /
post combustion capture
• solar PV / crystalline silicon
• concentrated PV
• seabed fixed offshore wind
turbine
• large-scale heat pump
• solar thermal electricity /
parabolic through
• hydropower
• nuclear /light water reactor
• geothermal / organic Rankine
cycle
• geothermal / flash process
• geothermal / dry steam
• airborne wind energy system
• geothermal / enhanced geothermal system (EGS)
• ammonia co-firing in coal power plants
• nuclear / sodium-cooled fast reactor
• light water reactor-based small modular reactor (SMR)
• hydrogen-fired gas turbine
• hydrogen / high-temperature fuel cell
• coal CCUS /oxy-fueling technology
• nuclear /high-temperature reactor and very high temperature reactor
• coal CCUS / pre-combustion, physical absorption
Electricity infrastructure (including the charging station infrastructure for e-mobility)
• dynamic charging or electric
road system, inductive
• distribution / transactive energy
• integration /virtual inertia, fast
frequency response (FFR)
• smart charging
• transmission / supraconducting
high voltage
• compressed air energy storage
• battery storage / Redox flow
• flexible high-voltage grid or
flexible alternating current
transmission
• ultra high-voltage transmission
• integration / smart inverter
• dynamic line rating
• fast charging
• dynamic charging or electric
road system, conductive
• battery energy storage /
Lithium-ion
• mechanical energy storage /
liquid air energy storage
• mechanical energy storage /
flywheel
• solutions that allow demand-
side response (DSR)
• mechanical storage / pumped
storage
• supraconducting high voltage
Electricity consumption – transport (including batteries developed for transport purposes)
• battery / multivalent ions
(The commonly studied
elements of the concept are
magnesium, calcium, and
aluminum.)
• shipping / electric vehicle • battery electric vehicle / (Li-ion
powered passenger car, urban
transit bus, light commercial
vehicle)
• network-operated electric train
• Li-air battery
• aviation / battery electric
vehicle (for short distances)
• aviation / hybrid vehicle
• battery / solid-state + Li-metal
• Na-ion battery
• Li-S battery
• gas hybrid train (internal
combustion engine and battery)
• Li-ion battery powered truck
Electricity consumption – industry
• petrochemical / fossil or
biomass-based steam cracker
electrification
• high-temperature heating /
electromagnetic heating for
large-scale industrial processes
• electric arc and plasma arc
furnaces applied to new
applications
• cement kiln/direct
electrification (electrifying the
heating process)
• iron and steel / high-
temperature molten oxide
electrolysis (> 1500 ° C)
• alumina refining /
electrification of the Bayer
process
• high-temperature heating /
electromagnetic heating for
large-scale industrial processes,
microwaves
• high-temperature heating /
concentrated solar power-
generated heat for industrial
processes
• ammonia production /
renewable-based, by
electrolysis with hydrogen
• low and mid-temperature
heating / electromagnetic
heating for large-scale
industrial processes
• low and mid-temperature
heating / large-scale heat pump
• (hydrogen cell electric vehicle,
fuel cell)
Electricity consumption – building sector
• solid-state equipment cooling /
electrocaloric
• evaporative cooling coupled
with desiccant evaporative
cooling system
• air-to-water heat pump /
integrated heat pump with
storage
• solid-state equipment cooling /
magnetocaloric
• air-to-water heat pump /
membrane heat pump
• air-to-water heat pump / high
temperature heat pump
• air-to-water heat pump / natural
refrigerant heat pump water
heater
• evaporative cooling
• air-to-air heat pump
technologies
• ground-source heat pump
• electric cooking
• other electric household
appliances
• dual flow ventilation
• natural ventilation
Fuel transformation utilizing electricity
• hydrogen production / seawater
electrolysis
• hydrogen production /
thermochemical water splitting
• hydrogen production /
electrolysis, solid oxide
electrolyzer cell
• hydrogen production with
electrolysis / polymer
electrolyte membrane
• hydrogen production with
electrolysis (alkaline)
Own edit based on IEA (https://www.iea.org/articles/etp-clean-energy-technology-guide)
Table 13 – Technology readiness of low-carbon electricity value chains
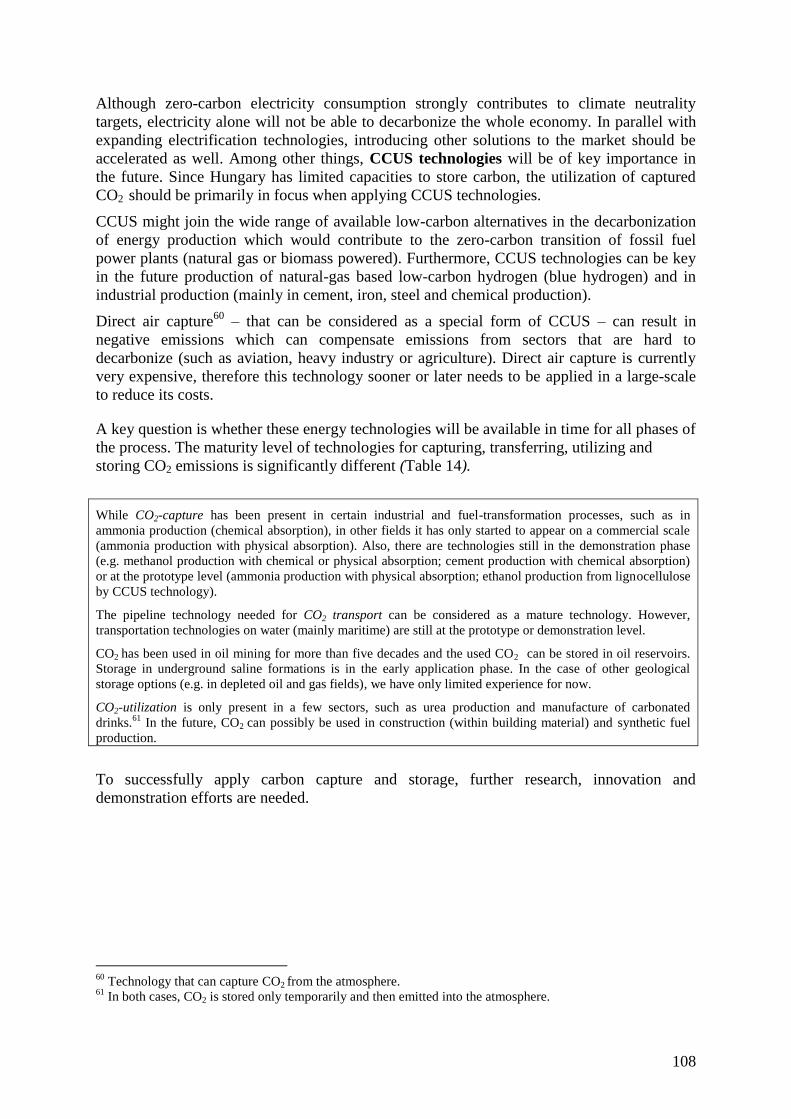
108
Although zero-carbon electricity consumption strongly contributes to climate neutrality
targets, electricity alone will not be able to decarbonize the whole economy. In parallel with
expanding electrification technologies, introducing other solutions to the market should be
accelerated as well. Among other things, CCUS technologies will be of key importance in
the future. Since Hungary has limited capacities to store carbon, the utilization of captured
CO2 should be primarily in focus when applying CCUS technologies.
CCUS might join the wide range of available low-carbon alternatives in the decarbonization
of energy production which would contribute to the zero-carbon transition of fossil fuel
power plants (natural gas or biomass powered). Furthermore, CCUS technologies can be key
in the future production of natural-gas based low-carbon hydrogen (blue hydrogen) and in
industrial production (mainly in cement, iron, steel and chemical production).
Direct air capture60
– that can be considered as a special form of CCUS – can result in
negative emissions which can compensate emissions from sectors that are hard to
decarbonize (such as aviation, heavy industry or agriculture). Direct air capture is currently
very expensive, therefore this technology sooner or later needs to be applied in a large-scale
to reduce its costs.
A key question is whether these energy technologies will be available in time for all phases of
the process. The maturity level of technologies for capturing, transferring, utilizing and
storing CO2 emissions is significantly different (Table 14).
While CO2-capture has been present in certain industrial and fuel-transformation processes, such as in
ammonia production (chemical absorption), in other fields it has only started to appear on a commercial scale
(ammonia production with physical absorption). Also, there are technologies still in the demonstration phase
(e.g. methanol production with chemical or physical absorption; cement production with chemical absorption)
or at the prototype level (ammonia production with physical absorption; ethanol production from lignocellulose
by CCUS technology).
The pipeline technology needed for CO2 transport can be considered as a mature technology. However,
transportation technologies on water (mainly maritime) are still at the prototype or demonstration level.
CO2 has been used in oil mining for more than five decades and the used CO2 can be stored in oil reservoirs.
Storage in underground saline formations is in the early application phase. In the case of other geological
storage options (e.g. in depleted oil and gas fields), we have only limited experience for now.
CO2-utilization is only present in a few sectors, such as urea production and manufacture of carbonated
drinks.61
In the future, CO2 can possibly be used in construction (within building material) and synthetic fuel
production.
To successfully apply carbon capture and storage, further research, innovation and
demonstration efforts are needed.
60
Technology that can capture CO2 from the atmosphere. 61
In both cases, CO2 is stored only temporarily and then emitted into the atmosphere.
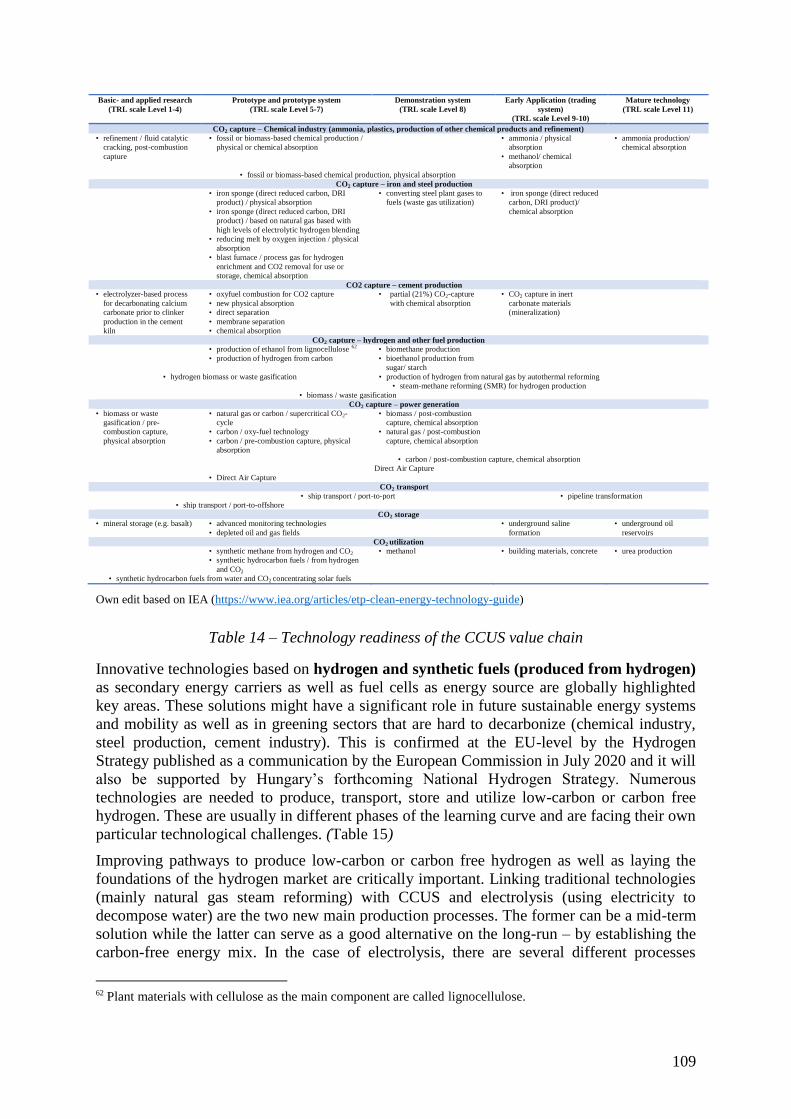
109
Basic- and applied research
(TRL scale Level 1-4)
Prototype and prototype system
(TRL scale Level 5-7)
Demonstration system
(TRL scale Level 8)
Early Application (trading
system)
(TRL scale Level 9-10)
Mature technology
(TRL scale Level 11)
CO2 capture – Chemical industry (ammonia, plastics, production of other chemical products and refinement)
• refinement / fluid catalytic
cracking, post-combustion
capture
• fossil or biomass-based chemical production /
physical or chemical absorption
• ammonia / physical
absorption
• methanol/ chemical
absorption
• ammonia production/
chemical absorption
• fossil or biomass-based chemical production, physical absorption
CO2 capture – iron and steel production
• iron sponge (direct reduced carbon, DRI
product) / physical absorption
• iron sponge (direct reduced carbon, DRI
product) / based on natural gas based with
high levels of electrolytic hydrogen blending
• reducing melt by oxygen injection / physical
absorption
• blast furnace / process gas for hydrogen
enrichment and CO2 removal for use or
storage, chemical absorption
• converting steel plant gases to
fuels (waste gas utilization)
• iron sponge (direct reduced
carbon, DRI product)/
chemical absorption
CO2 capture – cement production
• electrolyzer-based process
for decarbonating calcium
carbonate prior to clinker
production in the cement
kiln
• oxyfuel combustion for CO2 capture
• new physical absorption
• direct separation
• membrane separation
• chemical absorption
• partial (21%) CO2-capture
with chemical absorption
• CO2 capture in inert
carbonate materials
(mineralization)
CO2 capture – hydrogen and other fuel production
• production of ethanol from lignocellulose 62
• production of hydrogen from carbon
• biomethane production
• bioethanol production from
sugar/ starch
• hydrogen biomass or waste gasification • production of hydrogen from natural gas by autothermal reforming
• steam-methane reforming (SMR) for hydrogen production
• biomass / waste gasification
CO2 capture – power generation
• biomass or waste
gasification / pre-
combustion capture,
physical absorption
• natural gas or carbon / supercritical CO2-
cycle
• carbon / oxy-fuel technology
• carbon / pre-combustion capture, physical
absorption
• biomass / post-combustion
capture, chemical absorption
• natural gas / post-combustion
capture, chemical absorption
• carbon / post-combustion capture, chemical absorption
Direct Air Capture
• Direct Air Capture
CO2 transport
• ship transport / port-to-port • pipeline transformation
• ship transport / port-to-offshore
CO2 storage
• mineral storage (e.g. basalt) • advanced monitoring technologies
• depleted oil and gas fields
• underground saline
formation
• underground oil
reservoirs
CO2 utilization
• synthetic methane from hydrogen and CO2
• synthetic hydrocarbon fuels / from hydrogen
and CO2
• methanol • building materials, concrete • urea production
• synthetic hydrocarbon fuels from water and CO2 concentrating solar fuels
Own edit based on IEA (https://www.iea.org/articles/etp-clean-energy-technology-guide)
Table 14 – Technology readiness of the CCUS value chain
Innovative technologies based on hydrogen and synthetic fuels (produced from hydrogen)
as secondary energy carriers as well as fuel cells as energy source are globally highlighted
key areas. These solutions might have a significant role in future sustainable energy systems
and mobility as well as in greening sectors that are hard to decarbonize (chemical industry,
steel production, cement industry). This is confirmed at the EU-level by the Hydrogen
Strategy published as a communication by the European Commission in July 2020 and it will
also be supported by Hungary’s forthcoming National Hydrogen Strategy. Numerous
technologies are needed to produce, transport, store and utilize low-carbon or carbon free
hydrogen. These are usually in different phases of the learning curve and are facing their own
particular technological challenges. (Table 15)
Improving pathways to produce low-carbon or carbon free hydrogen as well as laying the
foundations of the hydrogen market are critically important. Linking traditional technologies
(mainly natural gas steam reforming) with CCUS and electrolysis (using electricity to
decompose water) are the two new main production processes. The former can be a mid-term
solution while the latter can serve as a good alternative on the long-run – by establishing the
carbon-free energy mix. In the case of electrolysis, there are several different processes
62 Plant materials with cellulose as the main component are called lignocellulose.
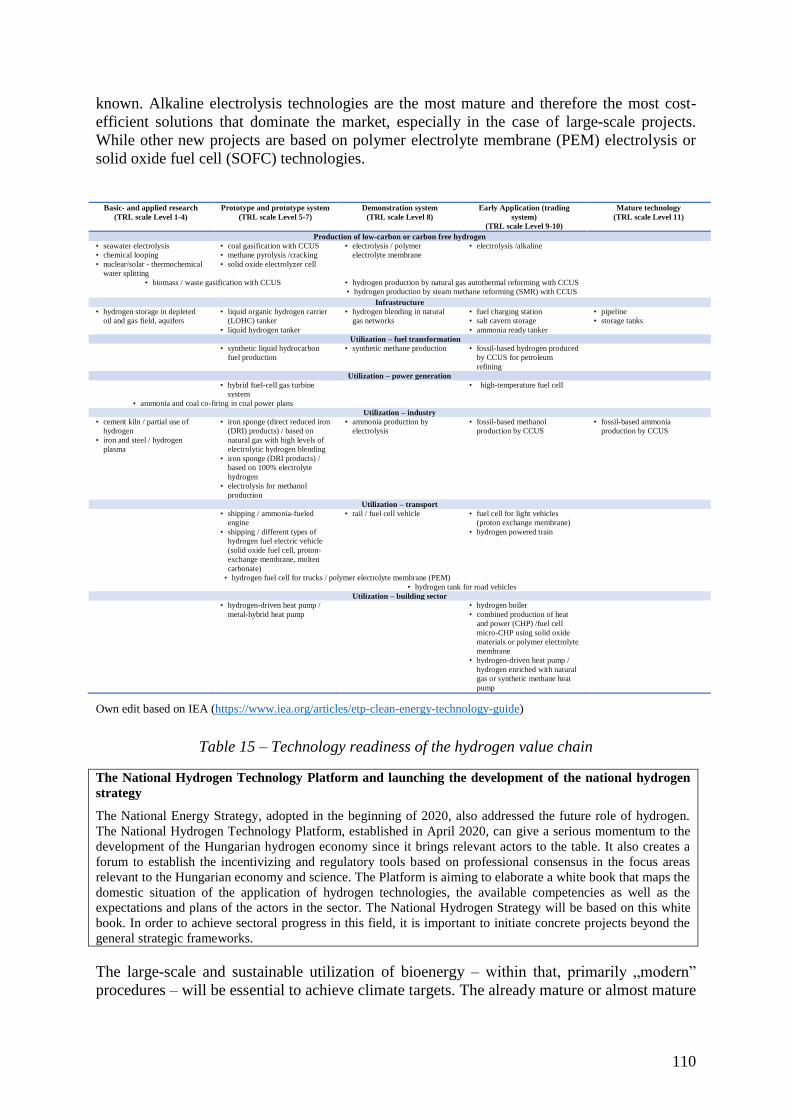
110
known. Alkaline electrolysis technologies are the most mature and therefore the most cost-
efficient solutions that dominate the market, especially in the case of large-scale projects.
While other new projects are based on polymer electrolyte membrane (PEM) electrolysis or
solid oxide fuel cell (SOFC) technologies.
Basic- and applied research
(TRL scale Level 1-4)
Prototype and prototype system
(TRL scale Level 5-7)
Demonstration system
(TRL scale Level 8)
Early Application (trading
system)
(TRL scale Level 9-10)
Mature technology
(TRL scale Level 11)
Production of low-carbon or carbon free hydrogen
• seawater electrolysis
• chemical looping
• nuclear/solar - thermochemical
water splitting
• coal gasification with CCUS
• methane pyrolysis /cracking
• solid oxide electrolyzer cell
• electrolysis / polymer
electrolyte membrane
• electrolysis /alkaline
• biomass / waste gasification with CCUS • hydrogen production by natural gas autothermal reforming with CCUS
• hydrogen production by steam methane reforming (SMR) with CCUS
• • • •
Infrastructure
• hydrogen storage in depleted
oil and gas field, aquifers
• liquid organic hydrogen carrier
(LOHC) tanker
• liquid hydrogen tanker
• hydrogen blending in natural
gas networks
• fuel charging station
• salt cavern storage
• ammonia ready tanker
• pipeline
• storage tanks
Utilization – fuel transformation
• synthetic liquid hydrocarbon
fuel production
• synthetic methane production • fossil-based hydrogen produced
by CCUS for petroleum
refining
Utilization – power generation
• hybrid fuel-cell gas turbine
system
• high-temperature fuel cell
• ammonia and coal co-firing in coal power plans
Utilization – industry
• cement kiln / partial use of
hydrogen
• iron and steel / hydrogen
plasma
• iron sponge (direct reduced iron
(DRI) products) / based on
natural gas with high levels of
electrolytic hydrogen blending
• iron sponge (DRI products) /
based on 100% electrolyte
hydrogen
• electrolysis for methanol
production
• ammonia production by
electrolysis
• fossil-based methanol
production by CCUS
• fossil-based ammonia
production by CCUS
Utilization – transport
• shipping / ammonia-fueled
engine
• shipping / different types of
hydrogen fuel electric vehicle
(solid oxide fuel cell, proton-
exchange membrane, molten
carbonate)
• rail / fuel cell vehicle • fuel cell for light vehicles
(proton exchange membrane)
• hydrogen powered train
• hydrogen fuel cell for trucks / polymer electrolyte membrane (PEM)
• hydrogen tank for road vehicles
Utilization – building sector
• hydrogen-driven heat pump /
metal-hybrid heat pump
• hydrogen boiler
• combined production of heat
and power (CHP) /fuel cell
micro-CHP using solid oxide
materials or polymer electrolyte
membrane
• hydrogen-driven heat pump /
hydrogen enriched with natural
gas or synthetic methane heat
pump
Own edit based on IEA (https://www.iea.org/articles/etp-clean-energy-technology-guide)
Table 15 – Technology readiness of the hydrogen value chain
The National Hydrogen Technology Platform and launching the development of the national hydrogen
strategy
The National Energy Strategy, adopted in the beginning of 2020, also addressed the future role of hydrogen.
The National Hydrogen Technology Platform, established in April 2020, can give a serious momentum to the
development of the Hungarian hydrogen economy since it brings relevant actors to the table. It also creates a
forum to establish the incentivizing and regulatory tools based on professional consensus in the focus areas
relevant to the Hungarian economy and science. The Platform is aiming to elaborate a white book that maps the
domestic situation of the application of hydrogen technologies, the available competencies as well as the
expectations and plans of the actors in the sector. The National Hydrogen Strategy will be based on this white
book. In order to achieve sectoral progress in this field, it is important to initiate concrete projects beyond the
general strategic frameworks.
The large-scale and sustainable utilization of bioenergy – within that, primarily „modern”
procedures – will be essential to achieve climate targets. The already mature or almost mature
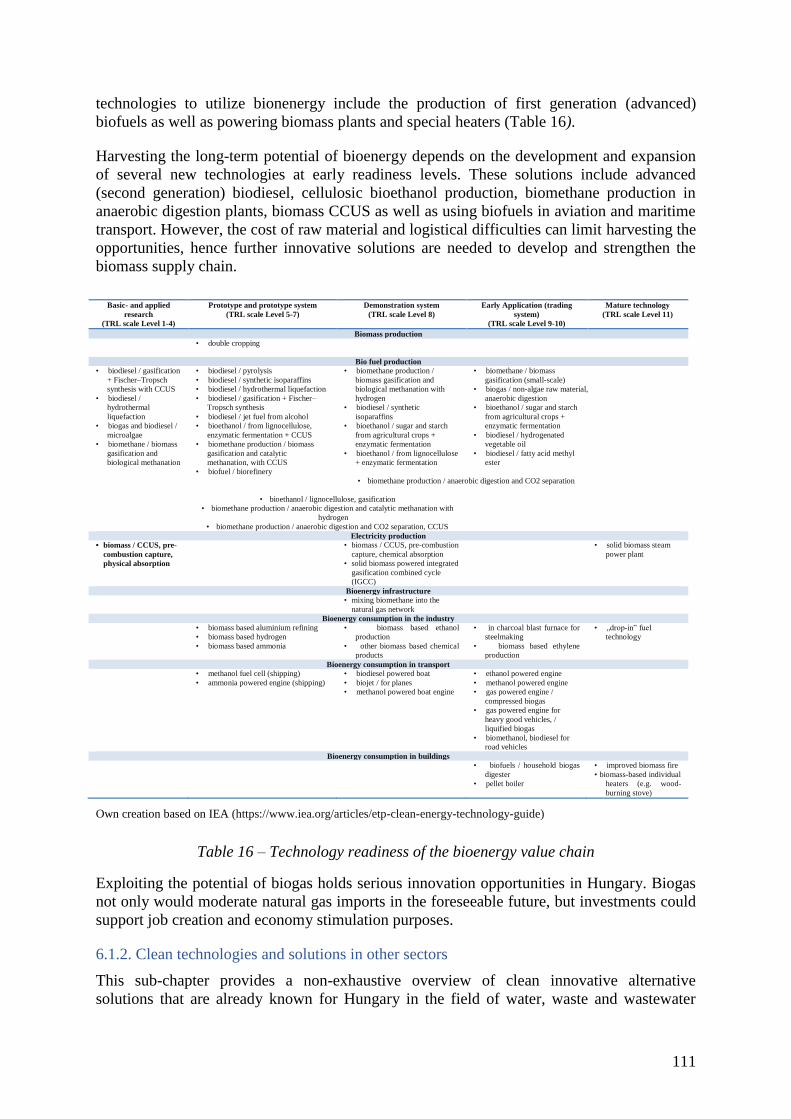
111
technologies to utilize bionenergy include the production of first generation (advanced)
biofuels as well as powering biomass plants and special heaters (Table 16).
Harvesting the long-term potential of bioenergy depends on the development and expansion
of several new technologies at early readiness levels. These solutions include advanced
(second generation) biodiesel, cellulosic bioethanol production, biomethane production in
anaerobic digestion plants, biomass CCUS as well as using biofuels in aviation and maritime
transport. However, the cost of raw material and logistical difficulties can limit harvesting the
opportunities, hence further innovative solutions are needed to develop and strengthen the
biomass supply chain.
Basic- and applied
research (TRL scale Level 1-4)
Prototype and prototype system (TRL scale Level 5-7)
Demonstration system (TRL scale Level 8)
Early Application (trading
system) (TRL scale Level 9-10)
Mature technology (TRL scale Level 11)
Biomass production • double cropping
Bio fuel production
• biodiesel / gasification
+ Fischer–Tropsch
synthesis with CCUS • biodiesel /
hydrothermal
liquefaction • biogas and biodiesel /
microalgae • biomethane / biomass
gasification and
biological methanation
• biodiesel / pyrolysis • biodiesel / synthetic isoparaffins • biodiesel / hydrothermal liquefaction • biodiesel / gasification + Fischer–
Tropsch synthesis • biodiesel / jet fuel from alcohol • bioethanol / from lignocellulose,
enzymatic fermentation + CCUS • biomethane production / biomass
gasification and catalytic
methanation, with CCUS • biofuel / biorefinery
• biomethane production /
biomass gasification and
biological methanation with
hydrogen • biodiesel / synthetic
isoparaffins • bioethanol / sugar and starch
from agricultural crops +
enzymatic fermentation • bioethanol / from lignocellulose
+ enzymatic fermentation
• biomethane / biomass
gasification (small-scale) • biogas / non-algae raw material,
anaerobic digestion • bioethanol / sugar and starch
from agricultural crops +
enzymatic fermentation • biodiesel / hydrogenated
vegetable oil • biodiesel / fatty acid methyl
ester
• biomethane production / anaerobic digestion and CO2 separation
• bioethanol / lignocellulose, gasification • biomethane production / anaerobic digestion and catalytic methanation with
hydrogen • biomethane production / anaerobic digestion and CO2 separation, CCUS
Electricity production • biomass / CCUS, pre-
combustion capture,
physical absorption • biomass / CCUS, pre-combustion
capture, chemical absorption • solid biomass powered integrated
gasification combined cycle
(IGCC)
• solid biomass steam
power plant
Bioenergy infrastructure • mixing biomethane into the
natural gas network Bioenergy consumption in the industry
• biomass based aluminium refining • biomass based hydrogen • biomass based ammonia
• biomass based ethanol
production • other biomass based chemical
products
• in charcoal blast furnace for
steelmaking • biomass based ethylene
production
• „drop-in” fuel
technology
Bioenergy consumption in transport • methanol fuel cell (shipping)
• ammonia powered engine (shipping) • biodiesel powered boat • biojet / for planes • methanol powered boat engine
• ethanol powered engine • methanol powered engine • gas powered engine /
compressed biogas • gas powered engine for
heavy good vehicles, /
liquified biogas • biomethanol, biodiesel for
road vehicles
Bioenergy consumption in buildings • biofuels / household biogas
digester • pellet boiler
• improved biomass fire • biomass-based individual
heaters (e.g. wood-
burning stove)
Own creation based on IEA (https://www.iea.org/articles/etp-clean-energy-technology-guide)
Table 16 – Technology readiness of the bioenergy value chain
Exploiting the potential of biogas holds serious innovation opportunities in Hungary. Biogas
not only would moderate natural gas imports in the foreseeable future, but investments could
support job creation and economy stimulation purposes.
6.1.2. Clean technologies and solutions in other sectors
This sub-chapter provides a non-exhaustive overview of clean innovative alternative
solutions that are already known for Hungary in the field of water, waste and wastewater
112
management, transport, industry, building sector as well as agriculture and forestry (Table
17).
In the past decades, technological development has successfully contributed to the efficient
handling water management issues. This is mainly due to information-, bio- and
nanotechnologies, different up-to-date monitoring systems as well as the water-related
application of different methodologies and modelling options that support planning and
decision-making. Nevertheless, it is reasonable to exploit the opportunities given by
technological developments such as to reduce consumption in water-extensive industries and
the number of pollutants of the discharged waters. Furthermore, water management aspects
have to be especially taken into account for the electrolysis-based hydrogen production.
The wide-spread application of available clean and innovative waste management
technologies (e.g. digitalization, membrane technology, artificial intelligence,
nanotechnology, plasma technology and modern material technology) as well as establishing
and operating environmental management systems is a significant progress. These solutions
can expand and make waste management options more efficient in the case of waste
recovery, disposal and prevention.
There are available innovative wastewater treatment solutions for recycling nutrients into
the natural cycle as well as for the disposal of sewage sludge on agricultural lands and energy
utilization. Exploiting and further improving these technologies are of key importance.
There is a significant potential in reducing emissions in transport, however ceasing further
opportunities requires more intensive RDI efforts. Making transport more climate-friendly is
supported mainly by cleaner fuel consumption (electricity, first generation biofuels, low-
carbon or carbon free hydrogen), but there is further potential in advanced vehicle
manufacturing as well (material technology, improving production processes). Moreover, the
optimization of fuel consumption efficiency, a more coordinated transport management as
well as digitalization and autonomous technologies also hold opportunities.
Using clean technologies, energy carriers and raw materials in the industry contributes to the
reduction of emissions in the sector and increase energy-, material- and other resource
efficiency. In addition to greening and decarbonizing energy consumption, there are many
other ways to improve sustainability. Such innovations include the use of lightweight and
long-lasting materials, the use of CCUS technology, the use of alternative raw materials,
digitalization and automation, robotics, and the improvement of additive manufacturing and
process efficiency.
Today, the building sector still consumes a significant amount of resources, especially with
regard to material and energy consumption. However, with new technologies, significant
savings can be achieved in the future. More eco-friendly building and insulation materials as
well as new architectural solutions can reduce the sector's material requirements and energy
consumption. Clean energy efficiency technologies (solar panels, heat pumps), smart
solutions for more efficient energy use as well as modern lighting and ventilation
technologies offer a solution for clean and efficient energy use in the sector. In the longer
term, there is also great potential for household energy storage solutions.
Agriculture and forestry must also play a serious role in tackling climate challenges.
Agriculture – by its nature – needs a multi-dimensional approach since the sector:
1) must be able to fulfill the increasing demand for food;
2) must reduce its own carbon footprint,
113
3) and it must improve its resilience against extreme weather.
Possible innovative measures to reduce emissions and improve adaptation to climate change
in agriculture include e.g. improving the sink capacity of the soil, integrated plant
management and innovative use of agricultural waste. The rise of precision technologies,
biotechnology, robotics, drone-based remote sensing or even the expansion of the innovative
food industry, that helps transforming consumption patterns, can also contribute to making
the sector more sustainable.
Applying innovative „clean” technologies in the agricultural sector
Energy efficiency measures and a larger-scale use of renewable energy will make a major contribution to
reducing the sector's emissions.
Improving agricultural machinery and equipment as well as greater energy efficiency of agricultural
buildings can reduce fuel consumption and the emissions of pollutants.
The capture and storage of carbon in the soil can be enhanced, inter alia, by cultivation technologies that
convert atmospheric CO2 into carbon-based compounds in the soil.
The use of nitrogen fertilizers involves significant emissions of nitrous oxide (N2O), a strong greenhouse
gas. Various techniques promise to reduce these emissions but further innovation is needed to increase
their efficiency. For example, nitrification inhibitors that can retain nitrogen in the soil for a longer period
of time in a form that can be used by plants; microbes that allow plants to capture nitrogen63
and the
production of synthetic fertilizers from renewable energy sources are already known technologies64
. N2O
emissions can also be reduced by rationalizing the use of nitrogen fertilizers which can be supported by the
so-called precision agriculture that applies advanced digitalization technologies (sensors, data
transmission, data analysis) allowing fertilizers to get into the soil in the right time and quantity.
Determining the need for irrigation water as accurately as possible is an increasingly common demand
from the crop production sectors, therefore precision irrigation that brings significant savings is the way
forward.
By remote sensing to yield mapping, it is possible to determine where it is worth applying pesticides or
manure. Based on the obtained information, more seeds can be applied to good quality soil patches and
less to worse-quality areas.
With the combination of GPS guides and automatic steering, tractors take the smallest possible distance
which saves fuel and reduces emissions alongside fuel consumption.
The efficiency of horticultural greenhouses can be improved with integrated and intelligent systems.
Precision feeding promotes efficient animal husbandry. Computer-controlled devices with automatic
feeders can even allow animals to be fed according to their individual appetite and condition, based on a
feeding curve.
Emissions from animal husbandry (mainly cattle farming) are also significant. Emissions can be reduced
through innovative technologies such as innovative feed composition, which, among other things, improve
the digestion of cattle.
Anaerobic fermenters can reduce emissions from manure treatment by capturing methane and converting it
into renewable energy.
Food loss and waste must be reduced. In this regard, while consumption patterns need to be transformed,
the opportunities offered by digitalization technologies, that can connect supply chain actors more
effectively, have to be better exploited. Based on surveys of the „Without leftover” program of the
National Food Chain Safety Office (NÉBIH), there was a 4% decrease in household food waste between
2016-2019. A public awareness raising campaign within the frameworks of the project that included a
63
This could replace the use of fertilizers in case of certain plants. 64
WRI (2020). 6 Ways the US Can Curb Climate Change and Grow More Food. Richard Waite and Alex
Rudee. August 20, 2020. Available at: https://www.wri.org/blog/2020/08/us-agriculture-emissions-food
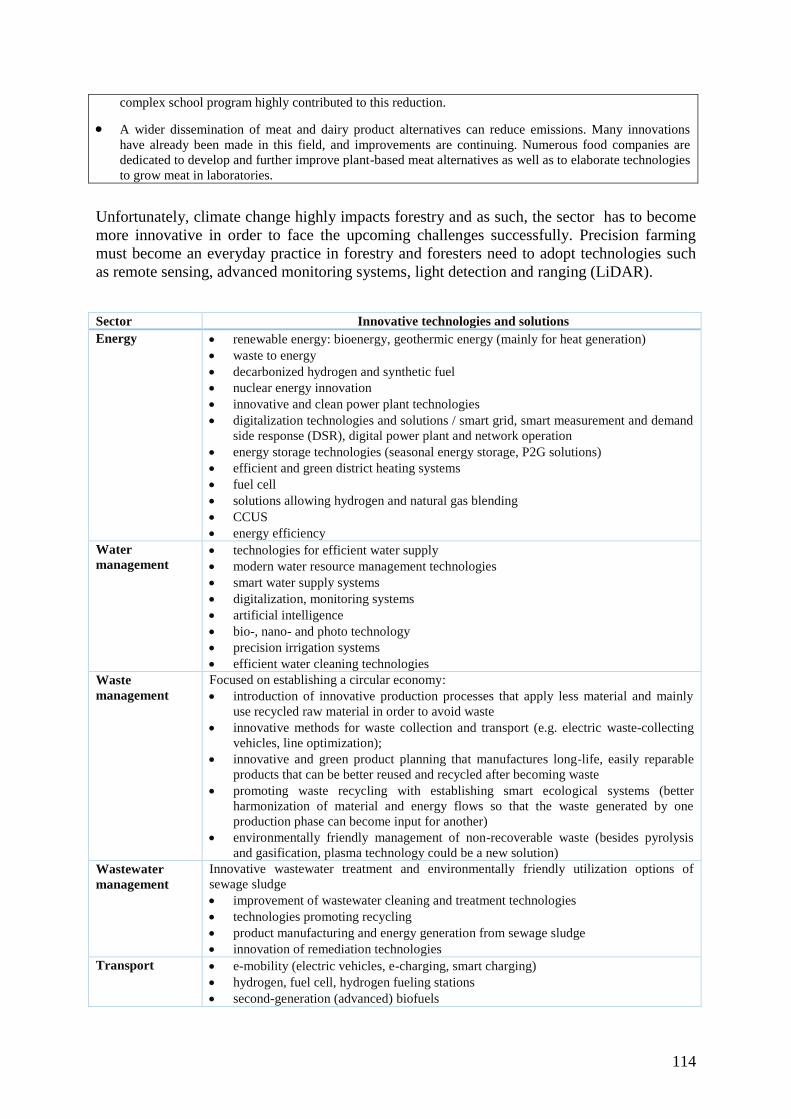
114
complex school program highly contributed to this reduction.
A wider dissemination of meat and dairy product alternatives can reduce emissions. Many innovations
have already been made in this field, and improvements are continuing. Numerous food companies are
dedicated to develop and further improve plant-based meat alternatives as well as to elaborate technologies
to grow meat in laboratories.
Unfortunately, climate change highly impacts forestry and as such, the sector has to become
more innovative in order to face the upcoming challenges successfully. Precision farming
must become an everyday practice in forestry and foresters need to adopt technologies such
as remote sensing, advanced monitoring systems, light detection and ranging (LiDAR).
Sector Innovative technologies and solutions
Energy renewable energy: bioenergy, geothermic energy (mainly for heat generation)
waste to energy
decarbonized hydrogen and synthetic fuel
nuclear energy innovation
innovative and clean power plant technologies
digitalization technologies and solutions / smart grid, smart measurement and demand
side response (DSR), digital power plant and network operation
energy storage technologies (seasonal energy storage, P2G solutions)
efficient and green district heating systems
fuel cell
solutions allowing hydrogen and natural gas blending
CCUS
energy efficiency
Water
management technologies for efficient water supply
modern water resource management technologies
smart water supply systems
digitalization, monitoring systems
artificial intelligence
bio-, nano- and photo technology
precision irrigation systems
efficient water cleaning technologies
Waste
management
Focused on establishing a circular economy:
introduction of innovative production processes that apply less material and mainly
use recycled raw material in order to avoid waste
innovative methods for waste collection and transport (e.g. electric waste-collecting
vehicles, line optimization);
innovative and green product planning that manufactures long-life, easily reparable
products that can be better reused and recycled after becoming waste
promoting waste recycling with establishing smart ecological systems (better
harmonization of material and energy flows so that the waste generated by one
production phase can become input for another)
environmentally friendly management of non-recoverable waste (besides pyrolysis
and gasification, plasma technology could be a new solution)
Wastewater
management
Innovative wastewater treatment and environmentally friendly utilization options of
sewage sludge
improvement of wastewater cleaning and treatment technologies
technologies promoting recycling
product manufacturing and energy generation from sewage sludge
innovation of remediation technologies
Transport e-mobility (electric vehicles, e-charging, smart charging)
hydrogen, fuel cell, hydrogen fueling stations
second-generation (advanced) biofuels
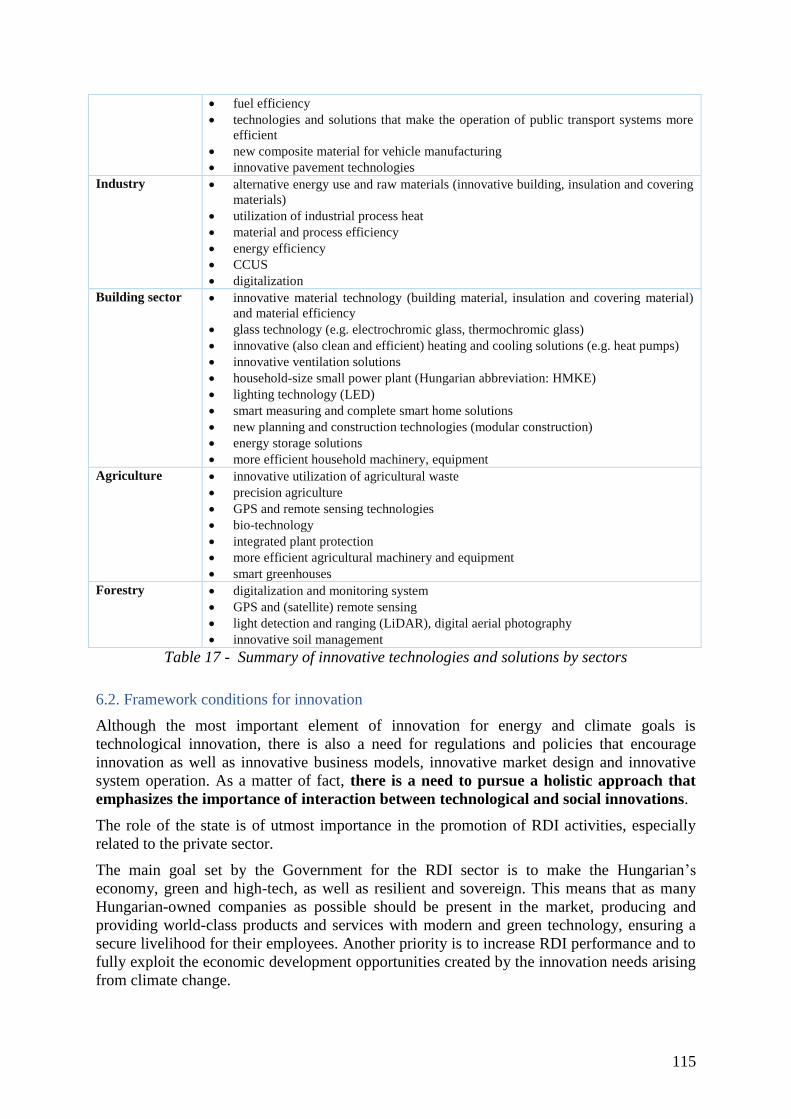
115
fuel efficiency
technologies and solutions that make the operation of public transport systems more
efficient
new composite material for vehicle manufacturing
innovative pavement technologies
Industry alternative energy use and raw materials (innovative building, insulation and covering
materials)
utilization of industrial process heat
material and process efficiency
energy efficiency
CCUS
digitalization
Building sector innovative material technology (building material, insulation and covering material)
and material efficiency
glass technology (e.g. electrochromic glass, thermochromic glass)
innovative (also clean and efficient) heating and cooling solutions (e.g. heat pumps)
innovative ventilation solutions
household-size small power plant (Hungarian abbreviation: HMKE)
lighting technology (LED)
smart measuring and complete smart home solutions
new planning and construction technologies (modular construction)
energy storage solutions
more efficient household machinery, equipment
Agriculture innovative utilization of agricultural waste
precision agriculture
GPS and remote sensing technologies
bio-technology
integrated plant protection
more efficient agricultural machinery and equipment
smart greenhouses
Forestry digitalization and monitoring system
GPS and (satellite) remote sensing
light detection and ranging (LiDAR), digital aerial photography
innovative soil management
Table 17 - Summary of innovative technologies and solutions by sectors
6.2. Framework conditions for innovation
Although the most important element of innovation for energy and climate goals is
technological innovation, there is also a need for regulations and policies that encourage
innovation as well as innovative business models, innovative market design and innovative
system operation. As a matter of fact, there is a need to pursue a holistic approach that
emphasizes the importance of interaction between technological and social innovations.
The role of the state is of utmost importance in the promotion of RDI activities, especially
related to the private sector.
The main goal set by the Government for the RDI sector is to make the Hungarian’s
economy, green and high-tech, as well as resilient and sovereign. This means that as many
Hungarian-owned companies as possible should be present in the market, producing and
providing world-class products and services with modern and green technology, ensuring a
secure livelihood for their employees. Another priority is to increase RDI performance and to
fully exploit the economic development opportunities created by the innovation needs arising
from climate change.
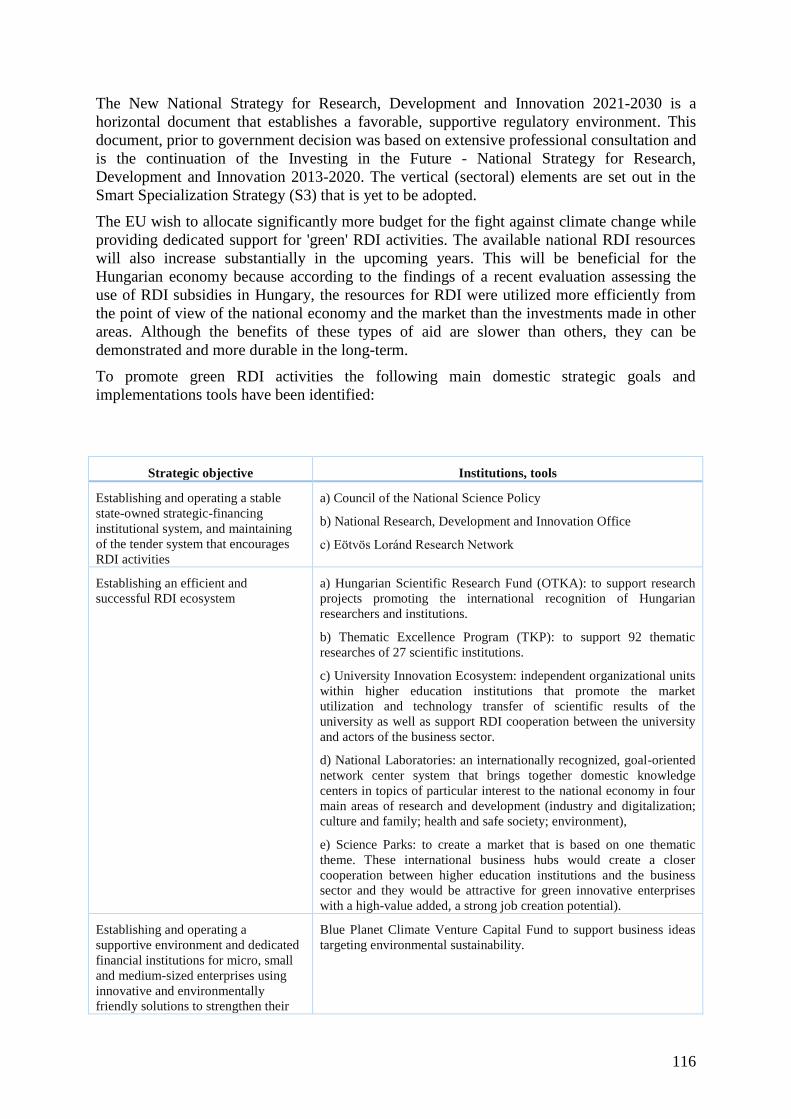
116
The New National Strategy for Research, Development and Innovation 2021-2030 is a
horizontal document that establishes a favorable, supportive regulatory environment. This
document, prior to government decision was based on extensive professional consultation and
is the continuation of the Investing in the Future - National Strategy for Research,
Development and Innovation 2013-2020. The vertical (sectoral) elements are set out in the
Smart Specialization Strategy (S3) that is yet to be adopted.
The EU wish to allocate significantly more budget for the fight against climate change while
providing dedicated support for 'green' RDI activities. The available national RDI resources
will also increase substantially in the upcoming years. This will be beneficial for the
Hungarian economy because according to the findings of a recent evaluation assessing the
use of RDI subsidies in Hungary, the resources for RDI were utilized more efficiently from
the point of view of the national economy and the market than the investments made in other
areas. Although the benefits of these types of aid are slower than others, they can be
demonstrated and more durable in the long-term.
To promote green RDI activities the following main domestic strategic goals and
implementations tools have been identified:
Strategic objective Institutions, tools
Establishing and operating a stable
state-owned strategic-financing
institutional system, and maintaining
of the tender system that encourages
RDI activities
a) Council of the National Science Policy
b) National Research, Development and Innovation Office
c) Eötvös Loránd Research Network
Establishing an efficient and
successful RDI ecosystem
a) Hungarian Scientific Research Fund (OTKA): to support research
projects promoting the international recognition of Hungarian
researchers and institutions.
b) Thematic Excellence Program (TKP): to support 92 thematic
researches of 27 scientific institutions.
c) University Innovation Ecosystem: independent organizational units
within higher education institutions that promote the market
utilization and technology transfer of scientific results of the
university as well as support RDI cooperation between the university
and actors of the business sector.
d) National Laboratories: an internationally recognized, goal-oriented
network center system that brings together domestic knowledge
centers in topics of particular interest to the national economy in four
main areas of research and development (industry and digitalization;
culture and family; health and safe society; environment),
e) Science Parks: to create a market that is based on one thematic
theme. These international business hubs would create a closer
cooperation between higher education institutions and the business
sector and they would be attractive for green innovative enterprises
with a high-value added, a strong job creation potential).
Establishing and operating a
supportive environment and dedicated
financial institutions for micro, small
and medium-sized enterprises using
innovative and environmentally
friendly solutions to strengthen their
Blue Planet Climate Venture Capital Fund to support business ideas
targeting environmental sustainability.
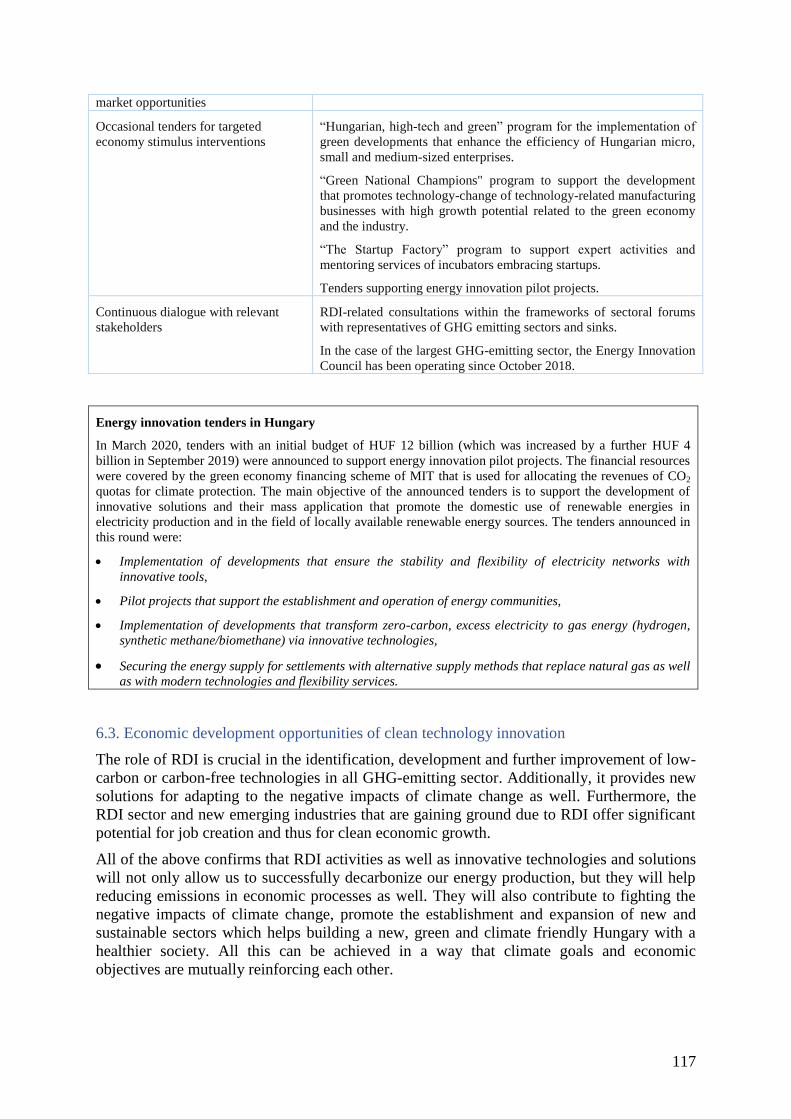
117
market opportunities
Occasional tenders for targeted
economy stimulus interventions
“Hungarian, high-tech and green” program for the implementation of
green developments that enhance the efficiency of Hungarian micro,
small and medium-sized enterprises.
“Green National Champions" program to support the development
that promotes technology-change of technology-related manufacturing
businesses with high growth potential related to the green economy
and the industry.
“The Startup Factory” program to support expert activities and
mentoring services of incubators embracing startups.
Tenders supporting energy innovation pilot projects.
Continuous dialogue with relevant
stakeholders
RDI-related consultations within the frameworks of sectoral forums
with representatives of GHG emitting sectors and sinks.
In the case of the largest GHG-emitting sector, the Energy Innovation
Council has been operating since October 2018.
Energy innovation tenders in Hungary
In March 2020, tenders with an initial budget of HUF 12 billion (which was increased by a further HUF 4
billion in September 2019) were announced to support energy innovation pilot projects. The financial resources
were covered by the green economy financing scheme of MIT that is used for allocating the revenues of CO2
quotas for climate protection. The main objective of the announced tenders is to support the development of
innovative solutions and their mass application that promote the domestic use of renewable energies in
electricity production and in the field of locally available renewable energy sources. The tenders announced in
this round were:
Implementation of developments that ensure the stability and flexibility of electricity networks with
innovative tools,
Pilot projects that support the establishment and operation of energy communities,
Implementation of developments that transform zero-carbon, excess electricity to gas energy (hydrogen,
synthetic methane/biomethane) via innovative technologies,
Securing the energy supply for settlements with alternative supply methods that replace natural gas as well
as with modern technologies and flexibility services.
6.3. Economic development opportunities of clean technology innovation
The role of RDI is crucial in the identification, development and further improvement of low-
carbon or carbon-free technologies in all GHG-emitting sector. Additionally, it provides new
solutions for adapting to the negative impacts of climate change as well. Furthermore, the
RDI sector and new emerging industries that are gaining ground due to RDI offer significant
potential for job creation and thus for clean economic growth.
All of the above confirms that RDI activities as well as innovative technologies and solutions
will not only allow us to successfully decarbonize our energy production, but they will help
reducing emissions in economic processes as well. They will also contribute to fighting the
negative impacts of climate change, promote the establishment and expansion of new and
sustainable sectors which helps building a new, green and climate friendly Hungary with a
healthier society. All this can be achieved in a way that climate goals and economic
objectives are mutually reinforcing each other.
118
7. Governance of the Implementation, Monitoring and Revision
7.1. Governance of the implementation
The adoption and publication of the NCDS is not the end, but rather the beginning of the
process that should ensure that Hungary is on the right path to achieve the long-term goal of
becoming climate neutral by 2050. Nevertheless, the NCDS will form part of an already
existing diverse international, EU-level and national strategic environment (see Annex 2) that
sets the frameworks and targets of climate action for Hungary. It is important to take into
account the main goals of the NCDS when updating the NECP, the National Climate Change
Action Plans and all relevant sectoral strategies.
Climate change is a highly complex phenomenon with cross-cutting impacts, therefore it
requires the involvement of the widest and most diverse circle of
stakeholders. Informative, coordinational and harmonizing functions within the public
administration ensure the alignment of different policy areas, avoiding redundant work and
appointing people in charge of specific tasks. They will also strengthen the cooperation
among these appointees as well as promote reporting about challenges and achievements. To
undertake this role, the executive- and expert-level Interministrial Committee on Climate
Change had been established, which is led by the Deputy State Secretary for climate policy.
For the successful implementation, all relevant and up-to-date scientific and policy related
information needs to be gathered. This knowledge- and information gathering function is
carried out by an independent scientific institution’s periodical National Climate Change
Assessment Reports, following the example of the IPCC and other climate-related data-
gathering.
The continuous and structured dialogue with non-central governmental
stakeholders could foster joint action as well as promote informing the public regularly and
taking their inputs into consideration:
a. Specific conciliation forums in every GHG emitting and sink sectors as well as in
cross-cutting areas consist of governmental and non-governmental stakeholders,
b. Green Financial Working Group that is dealing with the financial aspects of the
implementation,
c. County-level Climate Platforms,
d. And such government-operated online platforms that ensure the access to up-to-date
information and provide a possibility for anyone to share their feedback.
The main tools of the implementation of the NCDS are documents that prescribe
concrete actions and programs to achieve short- and medium-term goals harmonized with
long-term objectives, these are mainly
the 3-year-period Climate Change Action Plans created for the implementation of the
current National Climate Change Strategy,
and the National Energy and Climate Plans for 10-year periods.
119
Furthermore individual policy strategies (for example the strategy aiming to establish the
hydrogen economy) or other relevant documents are also implementation tools for the long-
term goals of the NCDS.
7.2.Monitoring and Monitoring, Reporting and Verification (MRV)
In the process of achieving climate neutrality the impacts of implemented policy measures
become known as well as several intended and unintended changes occur which need to be
monitored and reacted to. During the implementation of the NCDS, the covered areas need
to be monitored in order to provide the most appropriate social, economic and
environmental response measures.
First and foremost, the successful implementation of the NCDS requires the close monitoring
and evaluation of GHG emissions, ensuring an appropriate measurement as well as the
continuous improvement of the monitoring system. Monitoring GHG emissions is carried out
according to the strict measures identified by the Conference of the Parties (COP) to the
UNFCCC and the EU, following the detailed methodology guidelines of the IPCC. The
comprehensive National GHG Inventory Report, in line with international and EU
regulations, is published annually on the website of the UNFCCC and the European
Commission. The most important tools for monitoring and evaluating GHG emissions are the
reports submitted to the UNFCCC and to the European Commission.
For future adjustments, it is important to monitor the implementation of the NCDS and the
impact of its interventions, alongside GHG emissions. Instead of introducing new monitoring
processes, relying on existing methods should be encouraged such as the ones used for the
NECP.
7.3. Revision
The NCDS should be considered as a „living” document, therefore its implementation needs
to be monitored, reviewed from regularly – mainly based on international and EU policy
changes – and adjusted if necessary. The schedule of the revision should follow the revision
cycle of the Paris Agreement and the EU while taking into account:
the reports submitted to the UN and European Commission and their independent
expert evaluation,
the most recent available scientific results and policy information,
the results of stakeholder consultations,
the opinion of the Scientific Advisory Board on Climate Change and the findings of
the National Climate Change Assessment Reports,
and the practical experiences of the NCDS implementation.