Embed Size (px)
Citation preview
Waste and Waste Characterization
Proceeding of the National Conference on 'Geotechnical and Geoenvironmental
Aspects of Wastes and Their Utilization in Infrastructure Projects' held at
Guru Nanak Dev Engineering College Ludhiana, India, 15-16 February, 2013
Dr. J. N. JhaDepartment of Civil Engineering, Guru Nanak Dev Engineering College, Ludhiana
Dr. Harvinder SinghDepartment of Civil Engineering, Guru Nanak Dev Engineering College, Ludhiana
Prof. K. S. Gill Department of Civil Engineering, Guru Nanak Dev Engineering College, Ludhiana
National Conference on
Aspects of Wastes and Their Utilization in Infrastructure Projects
(GGWUIP-2013)
15th & 16th February 2013
Editor
J.N.JhaHarvinder Singh
K.S.Gill
Organised by
Department of Civil EngineeringGuru Nanak Dev Engineering College
Ludhiana
In Association with
Indian Geotechnical Society-Ludhiana ChapterTesting and Consultancy Cell, GNDEC Ludhiana
Geotechnical and Geoenvironmental
First Impression : 2013
Guru Nanak Dev Engineering College, Ludhiana.
National Conference on Geotechnical and Geoenvironmental Aspects of Wastes and Their Utilization in Infrastructure Projects
© Eagle Eye Publications
ISBN: 978-81-923777-8-0
No part of this publication may be reproduced or transmitted in any form by any
means, electronic or mechanical, including photocopy, recording, or any information storage
and retrieval system, without permission in writing from the copyright owners.
DISCLAIMER
The authors are solely responsible for the contents of the papers compiled in this
volume. The publishers or editors do not take any responsibility for the same in any manner.
Errors, if any, are purely unintentional and readers are requested to communicate such errors
to the editors or publisher to avoid discrepancies in future.
Typeset,Printed and EAGLE EYE PUBLICATIONSHead Office425A, Raut Industrial Estate, 2nd Floor, Mogul Lane,Opp. New Udyog Mandir, Mahim West, Mumbai- 16.Works37/A, Gautam Nagar, Bhubaneswar-14, Odisha.Hand Fone : +91 9778909809mail: [email protected]/[email protected]
Published by:
PREFACE
India with over 1 billion population is rapidly emerging as superpower and set the target of
becoming a developed nation by the year 2020 thereby, the immediate major focus is on the infrastructure
development. As a result, lot of industrialization and urbanization is taking place all around the country.
Due to rapid urban and industrial development, large quantities of wastes are being generated and disposal
of these wastes in landfill is not a sustainable solution in the long term due to limited availability of land
space. Many urban centres in India are already facing problems of finding adequate land for disposal of
waste for the next 25 to 50 years. Many of the geo-environmental challenges caused by the improper waste
disposal practice in developing countries like India resulted in producing huge quantities of green house
gas emissions. The resulting effect on climate change can be felt world over. Therefore the waste
management has now become a matter of great concern in India and other developing nations. The most
suitable long term sustainable solution is to reduce the quantity of waste being produced and eventually
become a 'zero waste' society. Waste reduction can be achieved through adoption of efficient and clean
technologies which produce the same quantities of usable products with much smaller quantities of waste
and also by recycling or through re-use of waste material generated. Some example of recycling and re-use
of waste material are conversion of organic waste into compost, use of fly ash as pozzolonic material, use of
slag in construction of sub base courses of roads, use of waste material in geotechnical and other
infrastructure development.
Under this backdrop, Civil Engineering Department of Guru Nanak Dev Engineering College,
Ludhiana (An autonomous college under UGC act) in association with Indian Geotechnical Society:
Ludhiana Chapter and Testing and Consultancy Cell, Guru Nanak Dev Engineering College Ludhiana is
organizing a two day (February 15-16, 2013) National Conference on “Geotechnical and Geo-
environmental aspects of Wastes and their Utilization in Infrastructure Projects”. The conference is
focusing on the advances being taking place in geotechnical and Geo- environmental aspects of wastes so
that it can meet the requirement for their utilization in infrastructure development. The sub-themes of the
conference have divided accordingly and have great relevance for waste utilization in infrastructure
projects. About 15 speakers from academia and industries have agreed to deliver expert lecture during the
conference. In addition 75 papers have been selected out of 163 abstracts received from different part of the
country.
We are particularly thankful to the Department of Science and Technology (DST), GOI; Council
of Scientific and Industrial Research (CSIR), GOI; and Technical Education for Quality Improvement
Programme (TEQIP-II), a world bank sponsored Project of MHRD, GOI for associating themselves with
this conference. We also appreciate and extend hearty thanks to TATA TISCON, main sponsor of the
conference and HEICO, AIMIL Ltd., and AKSS Consultants and Engineers, co-sponsor to this conference
for their liberal financial assistance. We have also received financial support from several other
organizations, agencies and individuals, our salutation are to them for supporting this event. We also hope
that the participants will return to their destination fully satisfied with the deliberations of the conference.
We do hope that this conference will rejuvenate the Civil Engineering Department to conduct many more
such events in future.
Feb’2013Ludhiana
Jagadanand Jha Harvinder Singh
Kulbir Singh Gill
Collaborating Institutions
Indian Geotechnical Society: Ludhiana Chapter.
Testing & Consultancy Cell, GNDEC Ludhiana.
Sponsoring Organisations
Department of Science & Technology, New Delhi.
Council of Scientific and Industrial Research, New Delhi.
TEQIP-II
TATA TISCON
HEICO, New Delhi.
AIMIL, New Delhi.
MRH Associates, Ludhiana.
AKSS Consultants, Bathinda.
Future Fibres and Filaments, Ludhiana.
Kalsi Construction and Engineers, Ludhiana.
Ceigal India Ltd, Chandigarh.
Deepak builders Pvt Ltd, Ludhiana.
J K Infcon Pvt Ltd, Ludhiana.
Gupta Enterprises, Ludhiana.
Gandwana Engineers, Nagpur.
Virindra Buidcon Pvt Ltd, Chandigarh.
Royal Builders Pvt Ltd, Mall Road, Ludhiana.
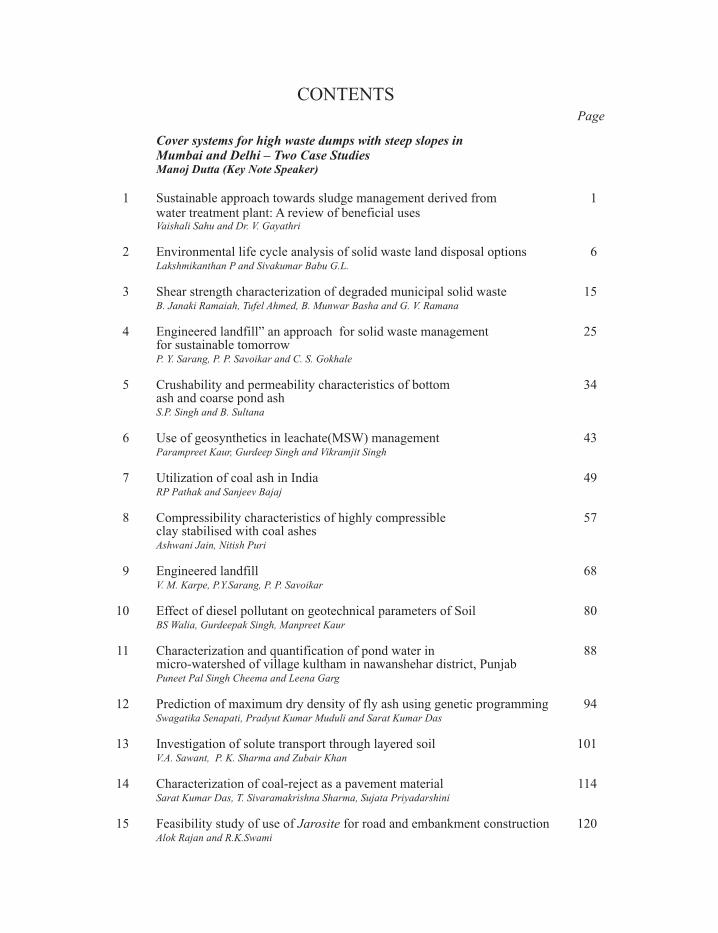
CONTENTS
Cover systems for high waste dumps with steep slopes in Mumbai and Delhi – Two Case StudiesManoj Dutta (Key Note Speaker)
1 Sustainable approach towards sludge management derived from 1water treatment plant: A review of beneficial usesVaishali Sahu and Dr. V. Gayathri
2 Environmental life cycle analysis of solid waste land disposal options 6 Lakshmikanthan P and Sivakumar Babu G.L.
3 Shear strength characterization of degraded municipal solid waste 15B. Janaki Ramaiah, Tufel Ahmed, B. Munwar Basha and G. V. Ramana
4 Engineered landfill” an approach for solid waste management 25for sustainable tomorrow
5 Crushability and permeability characteristics of bottom 34ash and coarse pond ashS.P. Singh and B. Sultana
6 Use of geosynthetics in leachate(MSW) management 43Parampreet Kaur, Gurdeep Singh and Vikramjit Singh
7 Utilization of coal ash in India 49RP Pathak and Sanjeev Bajaj
8 Compressibility characteristics of highly compressible 57clay stabilised with coal ashesAshwani Jain, Nitish Puri
9 Engineered landfill 68V. M. Karpe, P.Y.Sarang, P. P. Savoikar
10 Effect of diesel pollutant on geotechnical parameters of Soil 80BS Walia, Gurdeepak Singh, Manpreet Kaur
11 Characterization and quantification of pond water in 88micro-watershed of village kultham in nawanshehar district, Punjab Puneet Pal Singh Cheema and Leena Garg
12 Prediction of maximum dry density of fly ash using genetic programming 94Swagatika Senapati, Pradyut Kumar Muduli and Sarat Kumar Das
13 Investigation of solute transport through layered soil 101V.A. Sawant, P. K. Sharma and Zubair Khan
14 Characterization of coal-reject as a pavement material 114Sarat Kumar Das, T. Sivaramakrishna Sharma, Sujata Priyadarshini
15 Feasibility study of use of Jarosite for road and embankment construction 120Alok Rajan and R.K.Swami
P. Y. Sarang, P. P. Savoikar and C. S. Gokhale
Page
waste on unconfined compressive strength properties of soilArchana M. R, Gundappa K and Vijay Devar
17 Calibration of soil constitutive model parameters 139Shovan Roy and Dipika Devi
18 Study of self compacting concrete using marble powder and coal ash 145KS Bedi and Ranjodh Singh
19 Study on development of new highway construction materials: 153using recyclable waste: An overviewSachin Dass and Parveen Jangra
20 Appropriate use of waste materials in infrastructure projects 161
K.S.Gupta, Mahadev P Anawkar and Sameeuddin Sheikh
21 Utilization of medical packing plastic waste in geotechnical applications 170Kiranmaye Dasai and Madhav Madhira
22 Improvement of soil swelling potential using fly ash and rice husk Ash 178Aditya Kumar Anupam, Praveen Kumar and Ransinchung R.N.
23 Use of fly ash for modification of clayey subgrade 184P. Padhy, M. Panda and U. Chattaraj
24 Strength behavior of subgrade soil stabilized using fly ash aggregates 191M. Muthukumar, Deepak Meetal, Shivam Gupta
25 Use of extracted aggregate of CDW as base material of flexible pavements 196Rajiv Goel and Ashutosh Trivedi
26 Laboratory investigations of rice husk ash – cement mix 206K S Gill, J N Jha, A K Choudary and Raju Bansal
27 Seismic retrofitting of structure by conventional method 214Th. Kiranbala Devi, N. Monika Chanu, T. Bishworjit Singh, S. Satyakumar Singh
28 Bearing capacity of Footing on Reinforced sand: Numerical Approach 221Manpreet Singh, Prashant Garg
29 Energy scenario and our responsibility towards a 227sustainable world - An overviewAjay Goyal
30 Geotechnical characterization of dredged material as an engineered material 235M. Y. Shah and B A Mir
31 Comparision of stabilization of soil by adding additives 246Mahabir Dixit, Purabi Sen and Mukesh
16 Utilization effect of granite power and building demolition 123
CONTENTS
Page
Key Note
COVER SYSTEMS FOR HIGH WASTE DUMPS WITH STEEP SLOPES IN MUMBAI AND
DELHI – TWO CASE STUDIES
Manoj Datta Director, PEC University of Technology, Chandigarh - 160012
Abstract: Two case studies of high waste dumps in Mumbai and Delhi are described in this paper. Old waste dumps of municipal solid waste (MSW) are often in the shape of high mounds with steep side slopes. Control measures to minimize formation of leachate and to capture landfill gas from such waste dumps require cover systems with geomembranes on top and along the side slopes. The stability of such cover systems along the side slopes is influenced by the shearing resistance between different layers of the cover system. This paper examines the influence of various parameters such as soil thickness, height of slope, berm spacing, tensile strength of reinforcement, surface characteristics of geomembrane and interfacial shearing resistance on the factor of safety for various side slope inclinations. The study reveals that one can achieve optimum slope inclination by adopting low thickness of soil layers, berms at regular intervals, high strength reinforcement and textured geomembranes. The use of paver blocks is also discussed.
Keywords: landfills, slope stability, interface shear
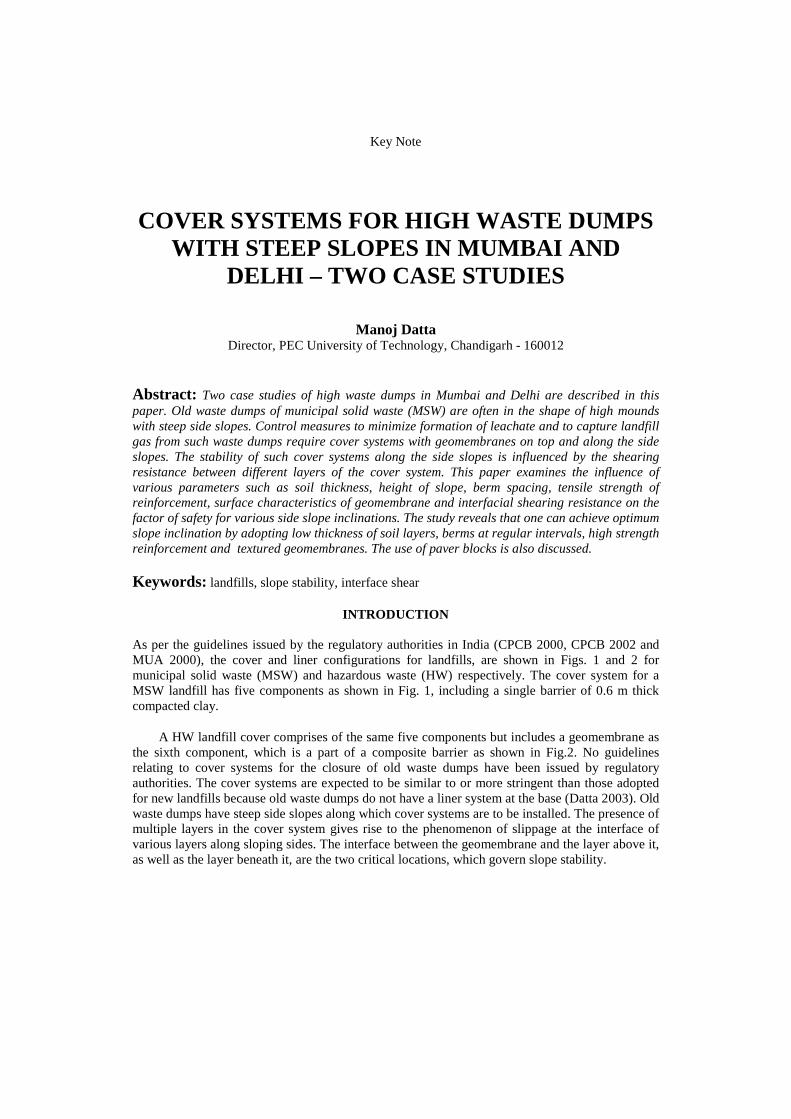
INTRODUCTION As per the guidelines issued by the regulatory authorities in India (CPCB 2000, CPCB 2002 and MUA 2000), the cover and liner configurations for landfills, are shown in Figs. 1 and 2 for municipal solid waste (MSW) and hazardous waste (HW) respectively. The cover system for a MSW landfill has five components as shown in Fig. 1, including a single barrier of 0.6 m thick compacted clay.
A HW landfill cover comprises of the same five components but includes a geomembrane as the sixth component, which is a part of a composite barrier as shown in Fig.2. No guidelines relating to cover systems for the closure of old waste dumps have been issued by regulatory authorities. The cover systems are expected to be similar to or more stringent than those adopted for new landfills because old waste dumps do not have a liner system at the base (Datta 2003). Old waste dumps have steep side slopes along which cover systems are to be installed. The presence of multiple layers in the cover system gives rise to the phenomenon of slippage at the interface of various layers along sloping sides. The interface between the geomembrane and the layer above it, as well as the layer beneath it, are the two critical locations, which govern slope stability.
Key Note
Fig 1. Components of MSW landfill.
C.C.L-compacted clay layer, D.L-drainage layer, G.C- gas collection layer, S.S.-sub soil, G.M – geomembrane, V.G- vegetation,T.S.-top soil, L.C-leachate collection layer
Fig 2. Components of HW landfill. One case study is presented which highlights the need to take great care in arriving at safe slopes for covers of waste dumps. The factors affecting the stability of cover systems along the slope are discussed.
• Closure of an old waste MSW dump in Mumbai
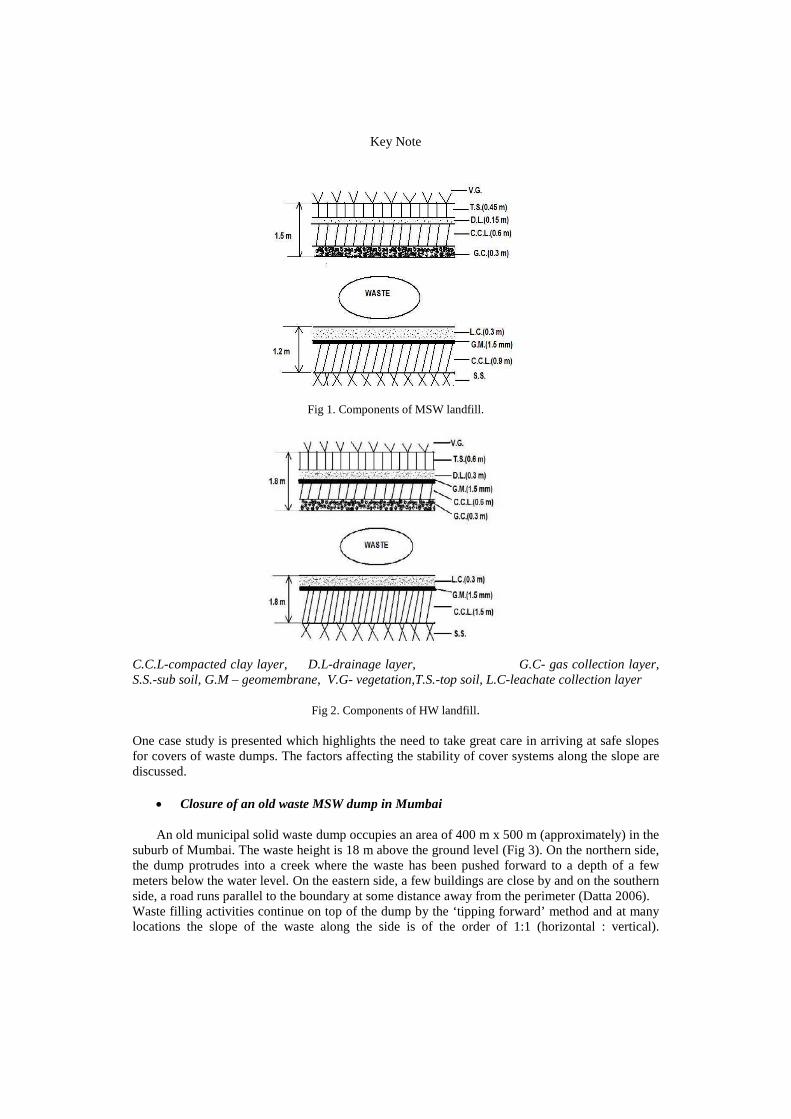
An old municipal solid waste dump occupies an area of 400 m x 500 m (approximately) in the suburb of Mumbai. The waste height is 18 m above the ground level (Fig 3). On the northern side, the dump protrudes into a creek where the waste has been pushed forward to a depth of a few meters below the water level. On the eastern side, a few buildings are close by and on the southern side, a road runs parallel to the boundary at some distance away from the perimeter (Datta 2006). Waste filling activities continue on top of the dump by the ‘tipping forward’ method and at many locations the slope of the waste along the side is of the order of 1:1 (horizontal : vertical).
Key Note
Fig 3: Landfill with re-profiled slope and cover
Fig 4: Position of existing toe and re-profiled slope
Uncontrolled gaseous emissions and foul odor emanate from the top of the waste dump. The base of the dump slopes towards the creek and dark colored leachate flows along the base into the creek. Site investigations reveal that the waste dump is underlain by clay followed by bedrock (Fig. 3). From a long-term perspective, after closure, the waste dump must be stable, give an aesthetically pleasing appearance and have no harmful impact on the adjacent environment. This implies that the sides of the dump must be made stable such that the factor of safety against slope instability is of the order of 1.5 (as against 1.0 at present). It should be provided with a cover capable of supporting vegetative growth. The harmful impact of the leachate on the aquatic life in the creek is to be minimized by reducing the infiltration and by collecting and treating the leachate. Further, the problem of foul odor and the green house gas emissions is to be minimized by collecting and flaring or utilizing the landfill gas. Provision of an impermeable cover system along with a gas collection system is considered to be a suitable control measure to reduce the harmful impact on the environment. A cover system similar to that used for HW landfills (Fig. 2) is proposed as presence of geomembrane above the compacted clay prevents loss of landfill gas and facilitates efficient collection of gas. Such a cover system is to be checked for stability along the side slopes. A simple method for stabilization of the steep side slopes is to re-profile and re-grade them to a
Clay
South
Clay
Bedrock
(a) North South Section with Re-profiled slope
West East
Bedrock (b) East West Section with Re-profiled Slope
22m
22m
6m
Vegetation Local Top Soil
Drainage Layer
1. 5 mm HDPE Clay
Gas Collection Layer
Creek
North
(c) Inside Existing Toe
Cover System Existing Slope
Proposed Slope
Fence
Toe For Toe Drain, Leachate Pipe, Road & Green Belt
(a) Beyond Existing Toe
Existing Slope
Toe
(b) At Existing Toe
Existing Slope Toe
25m
25m
25m
4
1
Filling
Excavate
Excavate
4
1
4
1
Existing
Re-profiled
Key Note
gentle slope. Such gentle slopes have adequate safety against interfacial sliding of components of the cover material over the waste. Re-profiling involves filling or excavating and re-locating the waste as shown in Figs. 3 and 4, resulting in an increase in the height of waste to about 22 m. Fig. 4 shows how availability of space adjacent to the toe influences the adoption of this solution. Wherever space is available beyond the toe of the landfill, the slope can be re-graded to a gentler profile by filling waste or soil (Fig. 4(a)). Such a situation is valid for the southern side of the landfill. At other locations, the toe has to stay at its existing location or move inwards due to shortage of space as shown in Figs. 4(b) and 4(c). The process of excavation and re-location of waste would produce additional foul odor. This would cause discomfort to the residents of the buildings on the eastern side. Hence on the eastern side, use of special bio-sprays to control the odor is proposed.
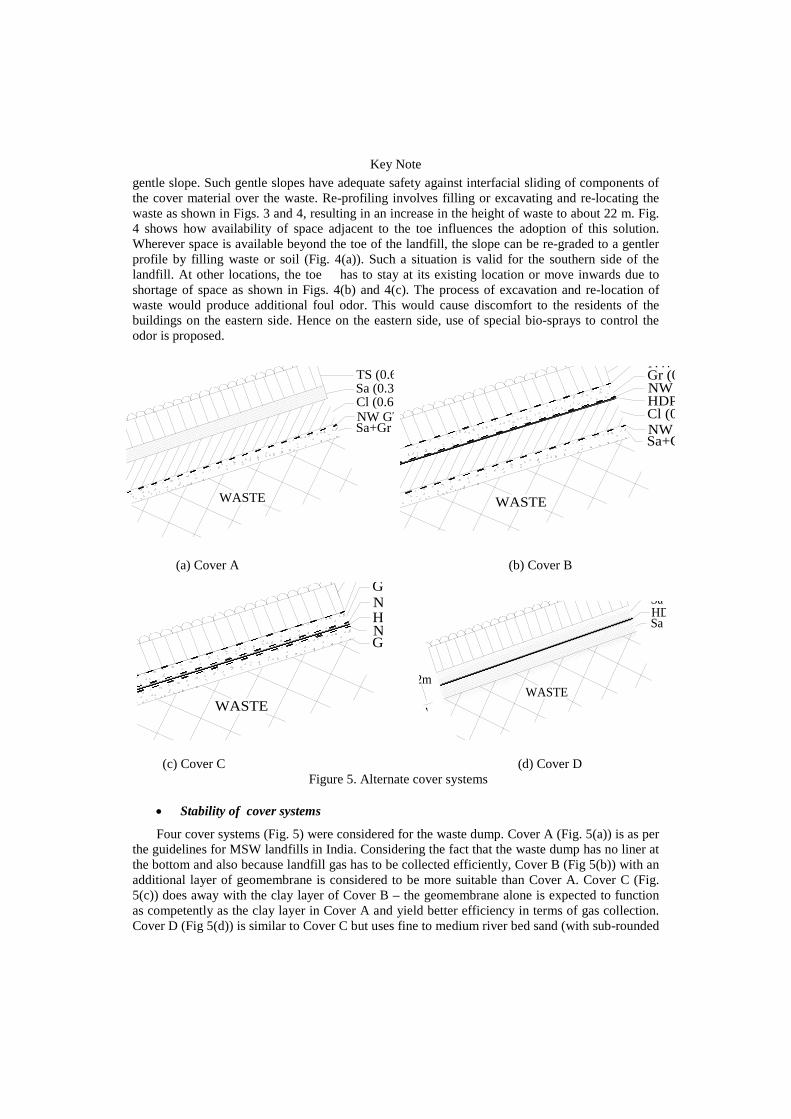
(a) Cover A (b) Cover B
(c) Cover C (d) Cover D Figure 5. Alternate cover systems
• Stability of cover systems
Four cover systems (Fig. 5) were considered for the waste dump. Cover A (Fig. 5(a)) is as per the guidelines for MSW landfills in India. Considering the fact that the waste dump has no liner at the bottom and also because landfill gas has to be collected efficiently, Cover B (Fig 5(b)) with an additional layer of geomembrane is considered to be more suitable than Cover A. Cover C (Fig. 5(c)) does away with the clay layer of Cover B – the geomembrane alone is expected to function as competently as the clay layer in Cover A and yield better efficiency in terms of gas collection. Cover D (Fig 5(d)) is similar to Cover C but uses fine to medium river bed sand (with sub-rounded
WASTE
Sa+Gr (0.3m)NW GTXCl (0.6m)Sa (0.3m)TS (0.6m)
1.8m
Sa (0.3m)HDPE GMSa (0.3m)TS (0.6m)
1.2mWASTE
1.8m
WASTE
Sa+Gr (0.3m)NW GTXCl (0.6m)
NW GTX
TS (0.6m)NW GTXGr (0.3m)
HDPE GM
NW GTXHDPE GMNW GTXGr (0.3m)NW GTX
1.2m
Gr (0.3m)
TS (0.6m)
WASTE
Key Note
to rounded particles) as the drainage layer above the geomembrane as well as the gas collection layer below the geomembrane instead of gravel and does away with the protective geotextile layers used in Cover C.
An attempt was made to arrive at the steepest slopes for covers B, C and D with adequate factor of safety so that maximum volume of waste could be accommodated in the waste dump and relocation of waste was minimized. Stability analysis was performed for failure parallel to outer slope along the weakest interface in the cover system (Qian et al. 2002, Koerner and Daniel 1997).
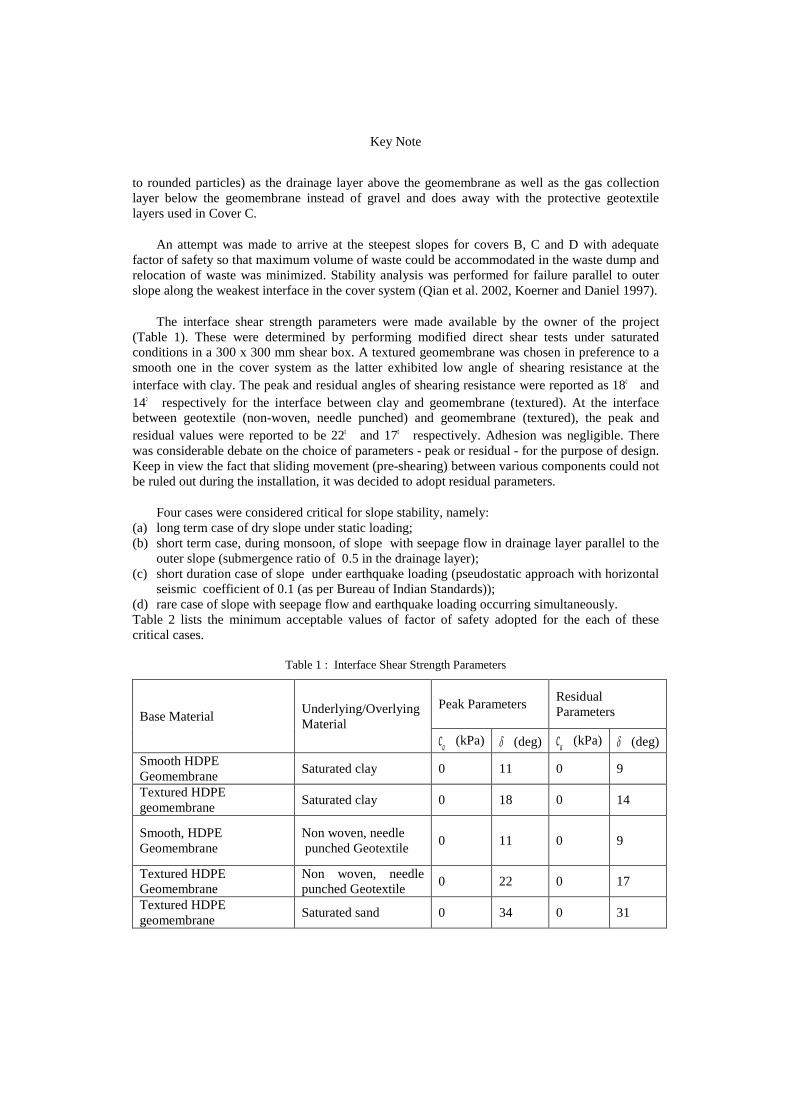
The interface shear strength parameters were made available by the owner of the project (Table 1). These were determined by performing modified direct shear tests under saturated conditions in a 300 x 300 mm shear box. A textured geomembrane was chosen in preference to a smooth one in the cover system as the latter exhibited low angle of shearing resistance at the interface with clay. The peak and residual angles of shearing resistance were reported as 18° and 14° respectively for the interface between clay and geomembrane (textured). At the interface between geotextile (non-woven, needle punched) and geomembrane (textured), the peak and residual values were reported to be 22° and 17° respectively. Adhesion was negligible. There was considerable debate on the choice of parameters - peak or residual - for the purpose of design. Keep in view the fact that sliding movement (pre-shearing) between various components could not be ruled out during the installation, it was decided to adopt residual parameters.
Four cases were considered critical for slope stability, namely: (a) long term case of dry slope under static loading; (b) short term case, during monsoon, of slope with seepage flow in drainage layer parallel to the
outer slope (submergence ratio of 0.5 in the drainage layer); (c) short duration case of slope under earthquake loading (pseudostatic approach with horizontal
seismic coefficient of 0.1 (as per Bureau of Indian Standards)); (d) rare case of slope with seepage flow and earthquake loading occurring simultaneously. Table 2 lists the minimum acceptable values of factor of safety adopted for the each of these critical cases.
Table 1 : Interface Shear Strength Parameters
Base Material Underlying/Overlying Material
Peak Parameters Residual Parameters
ac (kPa) δ (deg) ac (kPa) δ (deg) Smooth HDPE Geomembrane Saturated clay 0 11 0 9
Textured HDPE geomembrane Saturated clay 0 18 0 14
Smooth, HDPE Geomembrane
Non woven, needle punched Geotextile 0 11 0 9
Textured HDPE Geomembrane
Non woven, needle punched Geotextile 0 22 0 17
Textured HDPE geomembrane Saturated sand 0 34 0 31
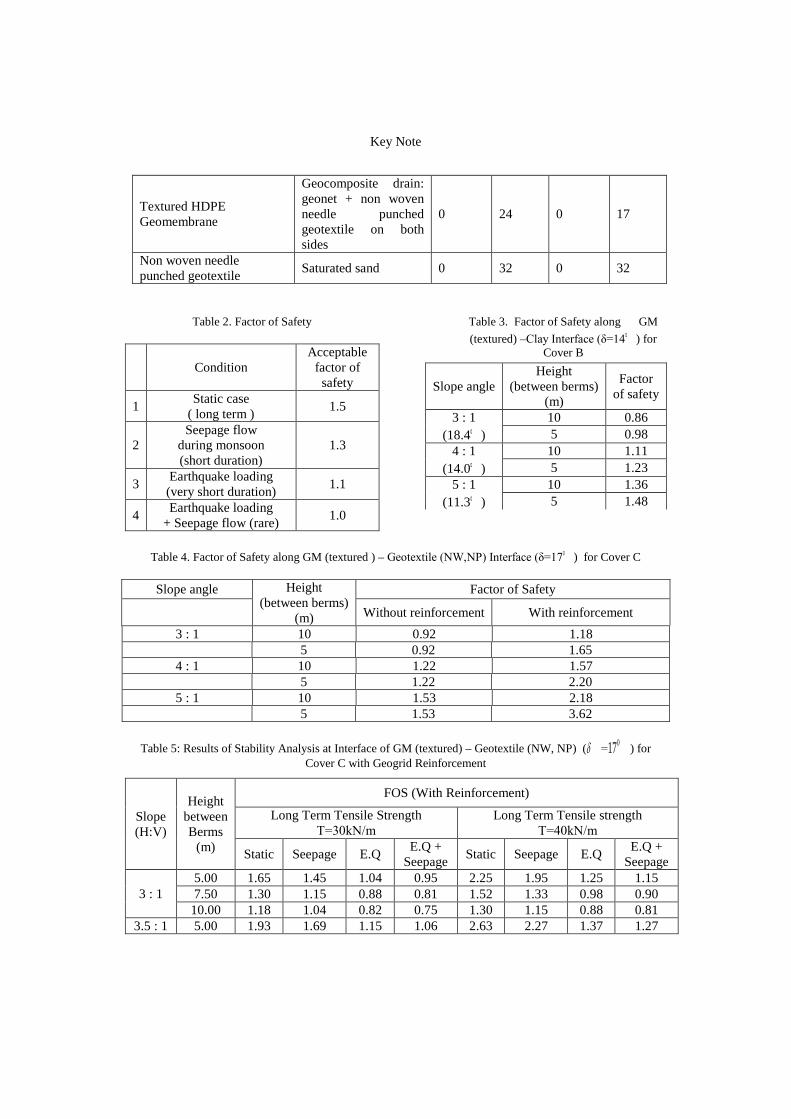
Key Note
Textured HDPE Geomembrane
Geocomposite drain: geonet + non woven needle punched geotextile on both sides
0 24 0 17
Non woven needle punched geotextile Saturated sand 0 32 0 32
Table 2. Factor of Safety
Condition Acceptable
factor of safety
1 Static case ( long term ) 1.5
2 Seepage flow
during monsoon (short duration)
1.3
3 Earthquake loading (very short duration) 1.1
4 Earthquake loading + Seepage flow (rare) 1.0
Table 3. Factor of Safety along GM (textured) –Clay Interface (δ=14° ) for
Cover B
Table 4. Factor of Safety along GM (textured ) – Geotextile (NW,NP) Interface (δ=17° ) for Cover C
Slope angle Height (between berms)
(m)
Factor of Safety
Without reinforcement With reinforcement 3 : 1 10 0.92 1.18
5 0.92 1.65 4 : 1 10 1.22 1.57
5 1.22 2.20 5 : 1 10 1.53 2.18
5 1.53 3.62
Table 5: Results of Stability Analysis at Interface of GM (textured) – Geotextile (NW, NP) (δ = 017 ) for Cover C with Geogrid Reinforcement
Slope (H:V)
Height between Berms
(m)
FOS (With Reinforcement)
Long Term Tensile Strength T=30kN/m
Long Term Tensile strength T=40kN/m
Static Seepage E.Q E.Q + Seepage Static Seepage E.Q E.Q +
Seepage
3 : 1 5.00 1.65 1.45 1.04 0.95 2.25 1.95 1.25 1.15 7.50 1.30 1.15 0.88 0.81 1.52 1.33 0.98 0.90
10.00 1.18 1.04 0.82 0.75 1.30 1.15 0.88 0.81 3.5 : 1 5.00 1.93 1.69 1.15 1.06 2.63 2.27 1.37 1.27
Slope angle Height
(between berms) (m)
Factor of safety
3 : 1 (18.4° )
10 0.86 5 0.98
4 : 1 (14.0° )
10 1.11 5 1.23
5 : 1 (11.3° )
10 1.36 5 1.48
Key Note
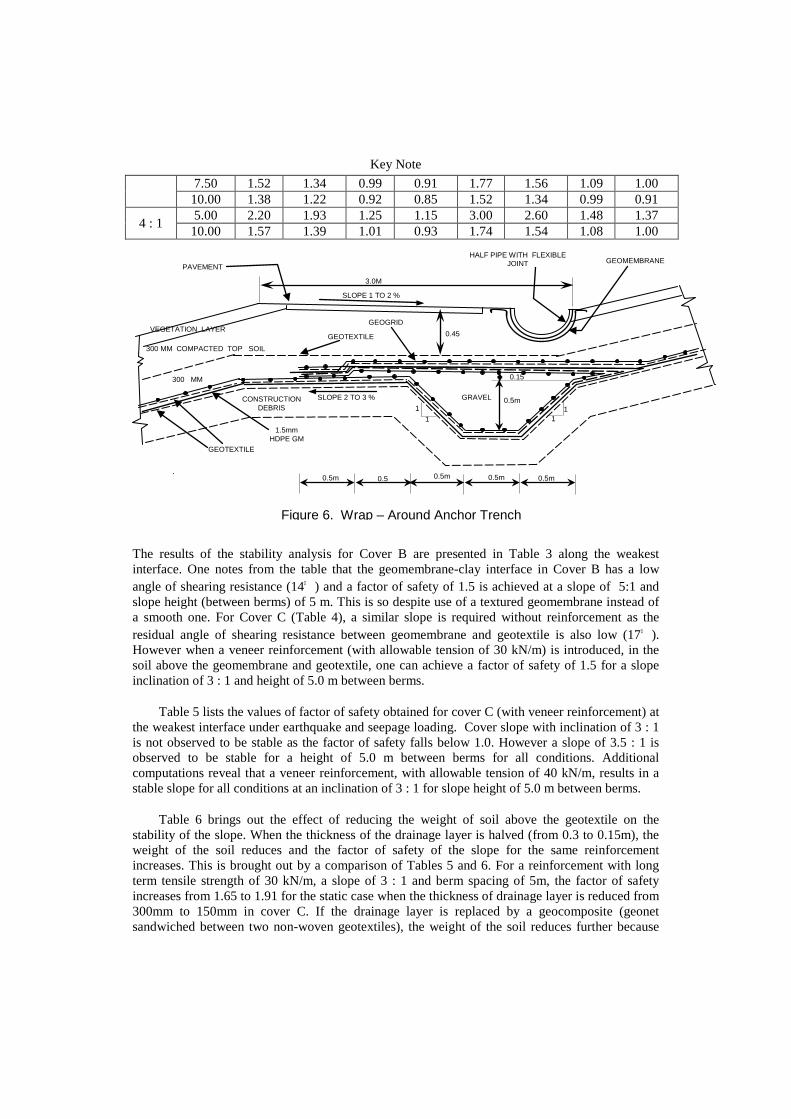
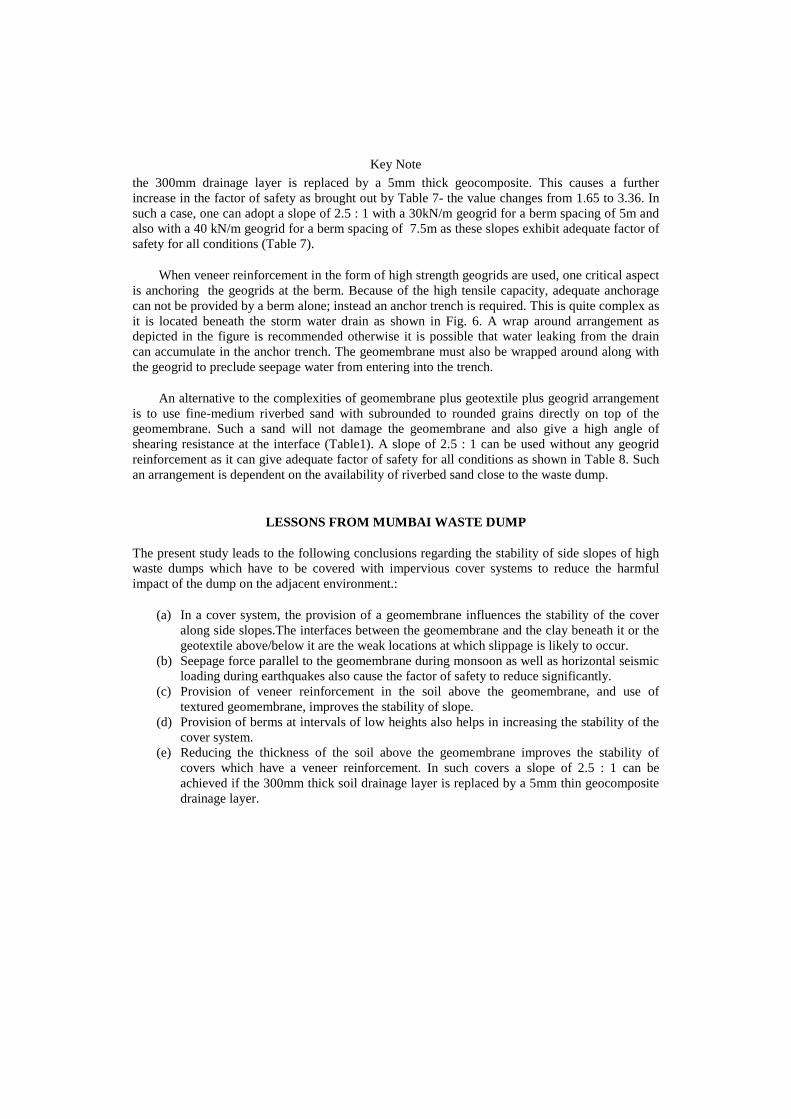
Figure 6. Wrap – Around Anchor Trench Arrangement
0.5m 0.5m
0.5m 0.5m 0.5m
0.5m
0.15m
VEGETATION LAYER
300 MM COMPACTED TOP SOIL
300 MM GRAVEL
GRAVEL
GEOTEXTILE
GEOTEXTILE
CONSTRUCTION DEBRIS
1.5mm HDPE GM
GEOGRID 0.45m
SLOPE 2 TO 3 %
SLOPE 1 TO 2 %
PAVEMENT
1 1
1 1
GEOMEMBRANE HALF PIPE WITH FLEXIBLE
JOINT
3.0M
7.50 1.52 1.34 0.99 0.91 1.77 1.56 1.09 1.00 10.00 1.38 1.22 0.92 0.85 1.52 1.34 0.99 0.91
4 : 1 5.00 2.20 1.93 1.25 1.15 3.00 2.60 1.48 1.37 10.00 1.57 1.39 1.01 0.93 1.74 1.54 1.08 1.00
The results of the stability analysis for Cover B are presented in Table 3 along the weakest interface. One notes from the table that the geomembrane-clay interface in Cover B has a low angle of shearing resistance (14° ) and a factor of safety of 1.5 is achieved at a slope of 5:1 and slope height (between berms) of 5 m. This is so despite use of a textured geomembrane instead of a smooth one. For Cover C (Table 4), a similar slope is required without reinforcement as the residual angle of shearing resistance between geomembrane and geotextile is also low (17° ). However when a veneer reinforcement (with allowable tension of 30 kN/m) is introduced, in the soil above the geomembrane and geotextile, one can achieve a factor of safety of 1.5 for a slope inclination of 3 : 1 and height of 5.0 m between berms.
Table 5 lists the values of factor of safety obtained for cover C (with veneer reinforcement) at the weakest interface under earthquake and seepage loading. Cover slope with inclination of 3 : 1 is not observed to be stable as the factor of safety falls below 1.0. However a slope of 3.5 : 1 is observed to be stable for a height of 5.0 m between berms for all conditions. Additional computations reveal that a veneer reinforcement, with allowable tension of 40 kN/m, results in a stable slope for all conditions at an inclination of 3 : 1 for slope height of 5.0 m between berms.
Table 6 brings out the effect of reducing the weight of soil above the geotextile on the stability of the slope. When the thickness of the drainage layer is halved (from 0.3 to 0.15m), the weight of the soil reduces and the factor of safety of the slope for the same reinforcement increases. This is brought out by a comparison of Tables 5 and 6. For a reinforcement with long term tensile strength of 30 kN/m, a slope of 3 : 1 and berm spacing of 5m, the factor of safety increases from 1.65 to 1.91 for the static case when the thickness of drainage layer is reduced from 300mm to 150mm in cover C. If the drainage layer is replaced by a geocomposite (geonet sandwiched between two non-woven geotextiles), the weight of the soil reduces further because
Key Note
the 300mm drainage layer is replaced by a 5mm thick geocomposite. This causes a further increase in the factor of safety as brought out by Table 7- the value changes from 1.65 to 3.36. In such a case, one can adopt a slope of 2.5 : 1 with a 30kN/m geogrid for a berm spacing of 5m and also with a 40 kN/m geogrid for a berm spacing of 7.5m as these slopes exhibit adequate factor of safety for all conditions (Table 7).
When veneer reinforcement in the form of high strength geogrids are used, one critical aspect is anchoring the geogrids at the berm. Because of the high tensile capacity, adequate anchorage can not be provided by a berm alone; instead an anchor trench is required. This is quite complex as it is located beneath the storm water drain as shown in Fig. 6. A wrap around arrangement as depicted in the figure is recommended otherwise it is possible that water leaking from the drain can accumulate in the anchor trench. The geomembrane must also be wrapped around along with the geogrid to preclude seepage water from entering into the trench.
An alternative to the complexities of geomembrane plus geotextile plus geogrid arrangement is to use fine-medium riverbed sand with subrounded to rounded grains directly on top of the geomembrane. Such a sand will not damage the geomembrane and also give a high angle of shearing resistance at the interface (Table1). A slope of 2.5 : 1 can be used without any geogrid reinforcement as it can give adequate factor of safety for all conditions as shown in Table 8. Such an arrangement is dependent on the availability of riverbed sand close to the waste dump.
LESSONS FROM MUMBAI WASTE DUMP
The present study leads to the following conclusions regarding the stability of side slopes of high waste dumps which have to be covered with impervious cover systems to reduce the harmful impact of the dump on the adjacent environment.:
(a) In a cover system, the provision of a geomembrane influences the stability of the cover along side slopes.The interfaces between the geomembrane and the clay beneath it or the geotextile above/below it are the weak locations at which slippage is likely to occur.
(b) Seepage force parallel to the geomembrane during monsoon as well as horizontal seismic loading during earthquakes also cause the factor of safety to reduce significantly.
(c) Provision of veneer reinforcement in the soil above the geomembrane, and use of textured geomembrane, improves the stability of slope.
(d) Provision of berms at intervals of low heights also helps in increasing the stability of the cover system.
(e) Reducing the thickness of the soil above the geomembrane improves the stability of covers which have a veneer reinforcement. In such covers a slope of 2.5 : 1 can be achieved if the 300mm thick soil drainage layer is replaced by a 5mm thin geocomposite drainage layer.
Key Note
Table 6: Results of Stability Analysis at Interface of GM (textured) – Geotextile (NW, NP) (δ = 017 ) with Geogrid Reinforcement for Cover C after reduction of Drainage Layer thickness from 300mm to 150mm
Slope (H:V)
Height between
Berm (m)
FOS With Reinforcement
Long Term Tensile strength T=30kN/m
Long Term Tensile strength T=40kN/m
Dry Seepage E.Q E.Q + Seepage Dry Seepage E.Q E.Q +
Seepage
2 : 1 5.00 1.27 1.09 0.85 0.76 1.99 1.66 1.15 1.02 7.50 0.94 0.81 0.68 0.61 1.14 0.97 0.79 0.70
10.00 0.83 0.72 0.62 0.55 0.94 0.81 0.68 0.61
2.5 : 1 5.00 1.59 1.36 1.00 0.90 2.49 2.07 1.32 1.19 7.50 1.17 1.01 0.81 0.73 1.42 1.22 0.93 0.84
10.00 1.03 0.89 0.74 0.66 1.17 1.01 0.81 0.73
3 : 1 5.00 1.91 1.63 1.14 1.03 2.99 2.49 1.46 1.33 7.50 1.40 1.21 0.93 0.84 1.71 1.46 1.06 0.96
10.00 1.24 1.07 0.85 0.77 1.40 1.21 0.93 0.84
3.5:1 5.00 2.23 1.90 1.25 1.14 3.49 2.90 1.58 1.45 7.50 1.64 1.41 1.04 0.94 1.99 1.71 1.17 1.06
10.00 1.45 1.25 0.95 0.86 1.64 1.41 1.04 0.94
4 : 1 5.00 2.55 2.17 1.35 1.24 3.98 3.32 1.69 1.55 7.50 1.87 1.62 1.13 1.03 2.27 1.95 1.27 1.16
10.00 1.65 1.43 1.05 0.95 1.87 1.62 1.13 1.03
Table 7: Results of Stability Analysis at Interface of GM (textured) – Geotextile (NW, NP) (δ = 017 ) with Geogrid Reinforcement for Cover C after replacing Drainage Layer by Geocomposite Drain (5mm)
Slope (H:V)
Height between
Berm (m)
FOS With Reinforcement
Long Term Tensile strength T=30kN/m
Long Term Tensile strength T=40kN/m
Dry Seepage E.Q E.Q + Seepage Dry Seepage E.Q E.Q +
Seepage
2 : 1 5.00 2.24 1.63 1.23 1.01 19.64 6.53 2.51 1.98 7.50 1.19 0.93 0.81 0.68 1.73 1.31 1.05 0.87
10.00 0.96 0.77 0.69 0.58 1.19 0.93 0.81 0.68
2.5 : 1 5.00 2.80 2.04 1.40 1.17 24.47 8.15 2.61 2.13 7.50 1.48 1.17 0.96 0.81 2.16 1.63 1.21 1.02
10.00 1.20 0.96 0.83 0.70 1.48 1.17 0.96 0.81
3 : 1 5.00 3.36 2.45 1.55 1.31 29.55 9.80 2.68 2.25 7.50 1.78 1.40 1.09 0.93 2.59 1.96 1.36 1.15
10.00 1.44 1.15 0.95 0.81 1.78 1.40 1.09 0.93
3.5:1 5.00 3.92 2.86 1.67 1.43 34.56 11.45 2.73 2.34 7.50 2.08 1.63 1.20 1.03 3.02 2.29 1.48 1.27
10.00 1.68 1.34 1.05 0.91 2.08 1.63 1.20 1.03
4 : 1 5.00 4.47 3.26 1.77 1.54 39.11 13.03 2.76 2.41 7.50 2.37 1.86 1.30 1.13 3.45 2.61 1.58 1.37
10.00 1.92 1.54 1.15 1.00 2.37 1.86 1.30 1.13
Key Note
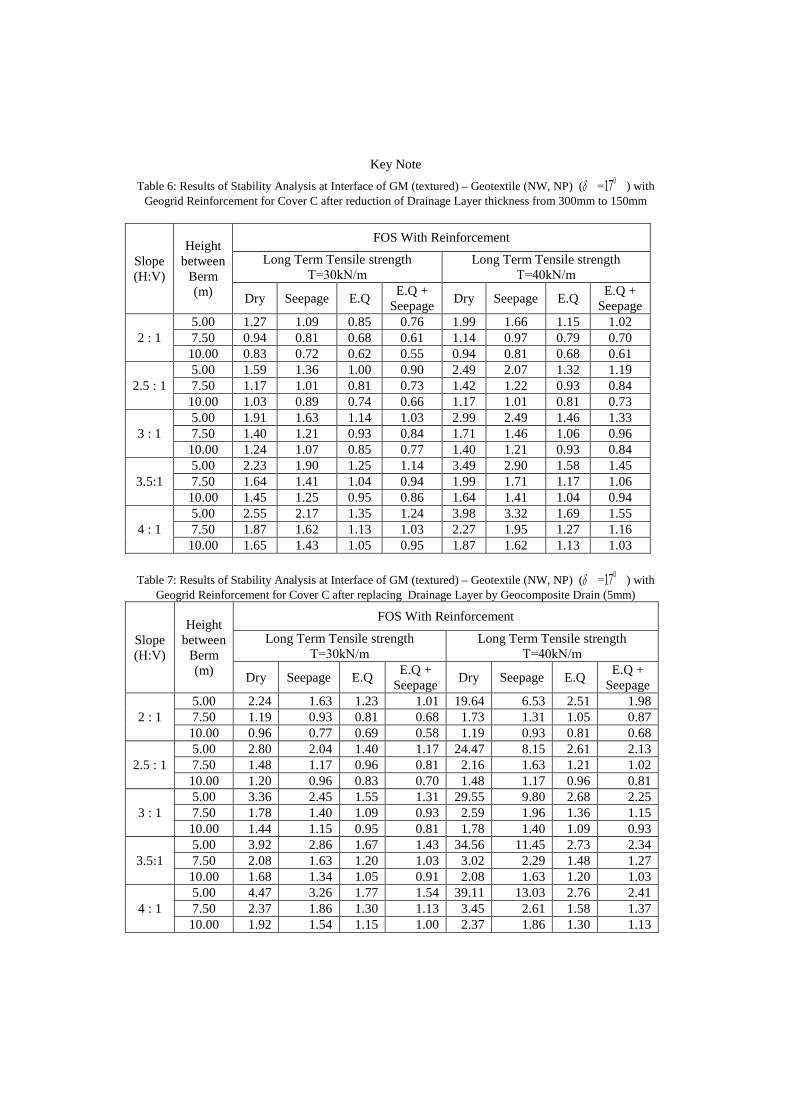
Table 8 : Results of Stability Analysis at Interface of GM (textured) – Sand (δ = 31) for Cover D
Slope (H:V) Dry Seepage E.Q. E.Q. + Seepage
2 : 1 1.20 1.04 0.95 0.84 2.5 : 1 1.50 1.30 1.15 1.00 3 : 1 1.81 1.58 1.33 1.19
(f) Anchorage of veneer reinforcement at each berm is a critical design feature. A wrap-around anchor trench is suggested with special provision to keep seepage water out of the trench by wrapping the geomembrane along with the geogrid around the trench.
(g) If fine to medium riverbed sand is available in nearby areas it can be used advantageously in cover design by doing away with the the geogrid reinforcement as well as the geotextile which is protecting the geomembrane. This is so because the sub-rounded to rounded particles of fine to medium riverbed sand are not likely to damage the geomembrane at low normal stresses encountered in cover systems. Further, the sand offers the advantage of a much higher residual angle of interface shear along the textured geomembrane to sand interface in comparison to that between geomembrane and non-woven geotextile interface. By using such sand one can achieve a slope of 2.5 : 1 for the cover without the need for any veneer reinforcement as well as any geotextile protective layers.
• Closure of MSW Waste Dump in Delhi
A portion of a waste dump at Delhi is undergoing closure to perform studies for estimating
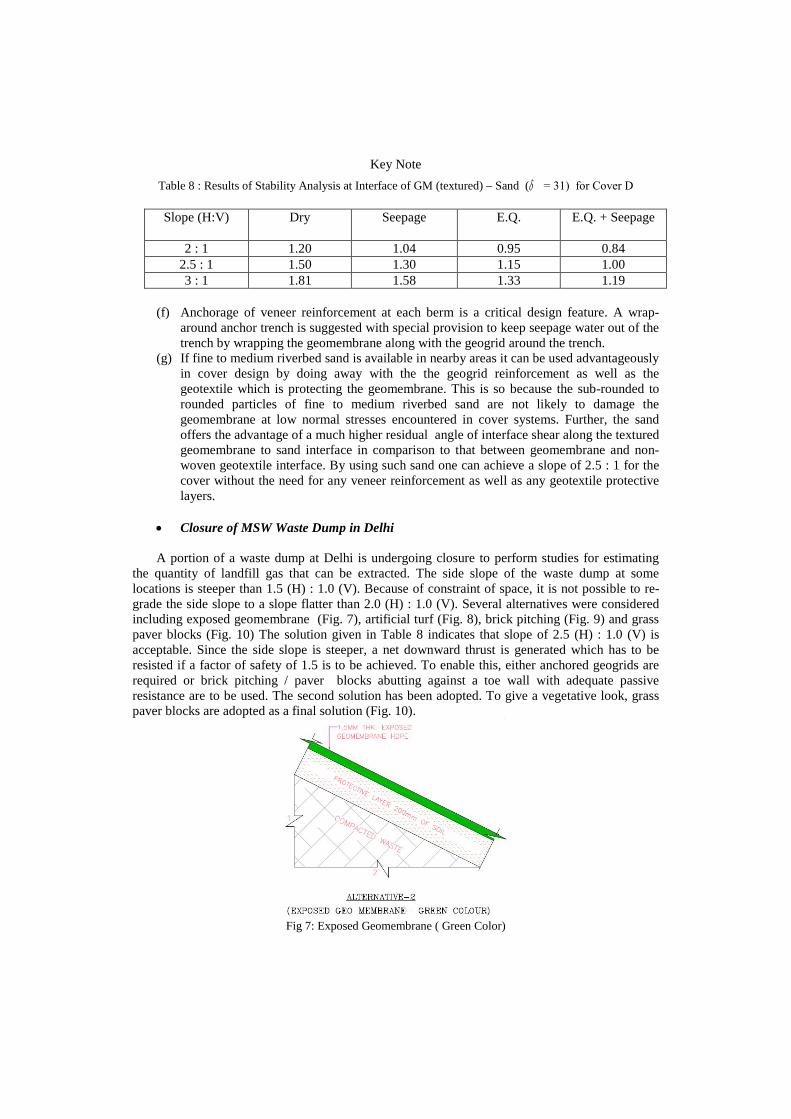
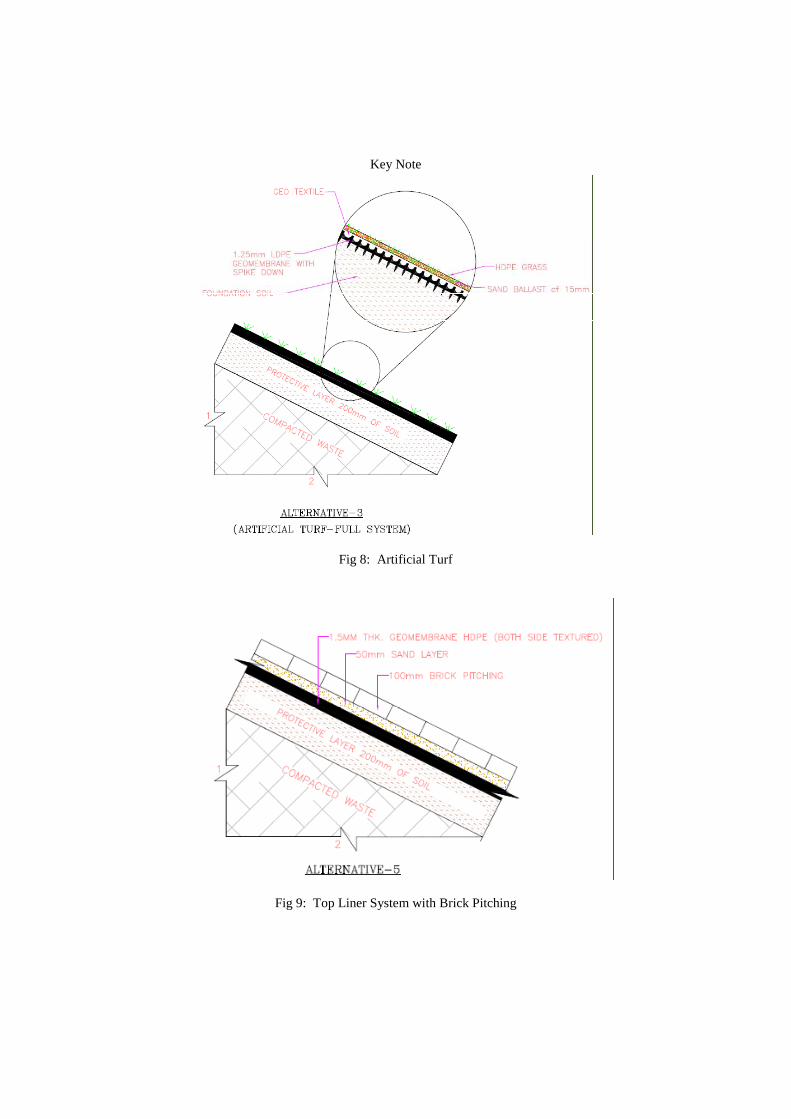
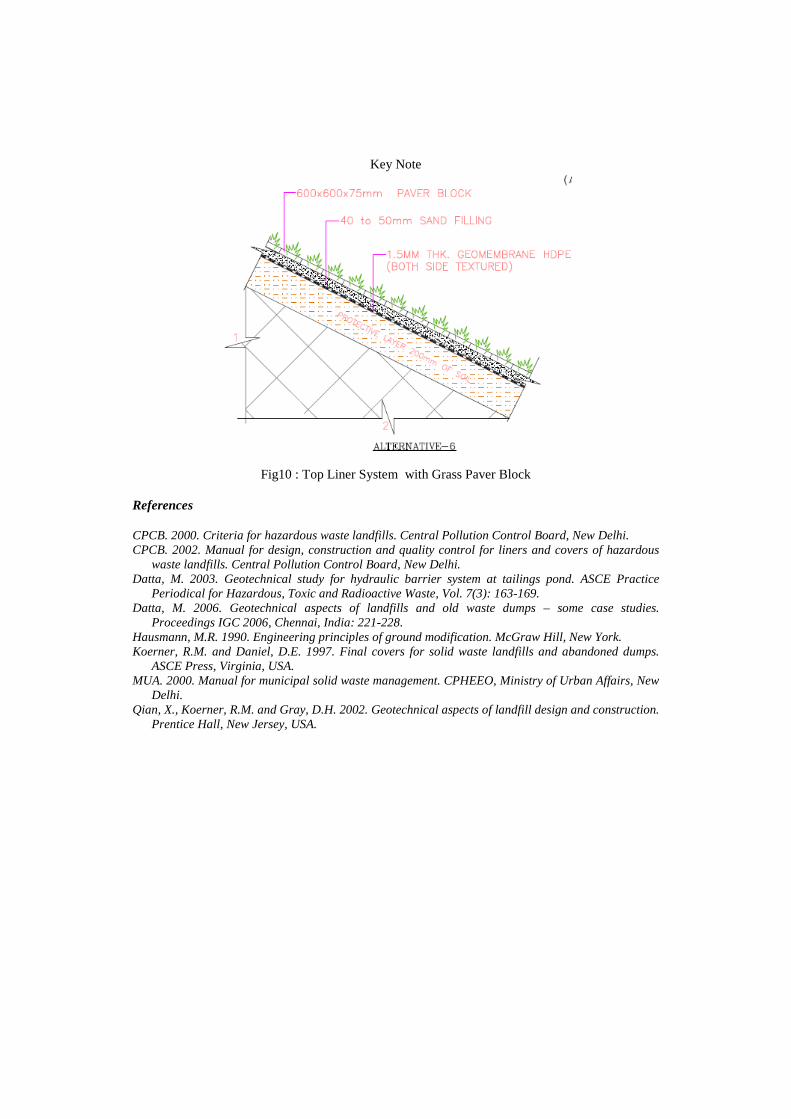
the quantity of landfill gas that can be extracted. The side slope of the waste dump at some locations is steeper than 1.5 (H) : 1.0 (V). Because of constraint of space, it is not possible to re-grade the side slope to a slope flatter than 2.0 (H) : 1.0 (V). Several alternatives were considered including exposed geomembrane (Fig. 7), artificial turf (Fig. 8), brick pitching (Fig. 9) and grass paver blocks (Fig. 10) The solution given in Table 8 indicates that slope of 2.5 (H) : 1.0 (V) is acceptable. Since the side slope is steeper, a net downward thrust is generated which has to be resisted if a factor of safety of 1.5 is to be achieved. To enable this, either anchored geogrids are required or brick pitching / paver blocks abutting against a toe wall with adequate passive resistance are to be used. The second solution has been adopted. To give a vegetative look, grass paver blocks are adopted as a final solution (Fig. 10).
Fig 7: Exposed Geomembrane ( Green Color)
Key Note
Fig 8: Artificial Turf
Fig 9: Top Liner System with Brick Pitching
Key Note
Fig10 : Top Liner System with Grass Paver Block
References CPCB. 2000. Criteria for hazardous waste landfills. Central Pollution Control Board, New Delhi. CPCB. 2002. Manual for design, construction and quality control for liners and covers of hazardous
waste landfills. Central Pollution Control Board, New Delhi. Datta, M. 2003. Geotechnical study for hydraulic barrier system at tailings pond. ASCE Practice
Periodical for Hazardous, Toxic and Radioactive Waste, Vol. 7(3): 163-169. Datta, M. 2006. Geotechnical aspects of landfills and old waste dumps – some case studies.
Proceedings IGC 2006, Chennai, India: 221-228. Hausmann, M.R. 1990. Engineering principles of ground modification. McGraw Hill, New York. Koerner, R.M. and Daniel, D.E. 1997. Final covers for solid waste landfills and abandoned dumps.
ASCE Press, Virginia, USA. MUA. 2000. Manual for municipal solid waste management. CPHEEO, Ministry of Urban Affairs, New
Delhi. Qian, X., Koerner, R.M. and Gray, D.H. 2002. Geotechnical aspects of landfill design and construction.
Prentice Hall, New Jersey, USA.
1
SUSTAINABLE APPROACH TOWARDS SLUDGE MANAGEMENT DERIVED FROM
WATER TREATMENT PLANT: A REVIEW OF BENEFICIAL USES
Vaishali Sahu and V. Gayathri Department of Civil Engineering, ITM University, Gurgaon, Haryana
Abstract: Till date, virtually all known drinking water treatment plants generate an enormous amount of residual sludge. To manage this rapidly increasing waste stream in an economic and environmentally sustainable manner remains a significant environmental issue. Perhaps, the realization of this fact has led to series of concerted efforts aimed at beneficial re-uses in an effort to close the loop between efficient water treatment and sustainable sludge management. This paper therefore presents a comprehensive review of available literature on attempts at beneficial reuses of water treatment plant sludge, in an effort to provide a compendium of recent and past developments, and update our current state of knowledge. The broad categories of uses in which waterworks sludges can be reused in Civil Engineering application are identified and examined by various researchers are presented in this paper. It is evident from the literatures that the bulk quantity of residues can be utilized in short period of time in Civil Engineering applications. Obvious advantages of such reuse options are highlighted and knowledge gaps identified. Future issues that will assist in the development of sustainable water treatment plant sludge management options with a multi-prong approach are equally discussed.
Keywords: Disposal, reuse, water treatment plant sludge
INTRODUCTION
The creation of non decaying waste materials, combined with a growing consumer population has resulted in a waste disposal crisis leading to environmental problems like surface/ground water pollution, land pollution etc and the economic problem like cost of handling, transport and disposal of sludge. India also faces this crisis to a large extent. One solution to this crisis lies in recycling waste into useful products to replace the natural products wherever possible which will reduce the economic and environmental problem of waste disposal and also reduce the depletion of natural resources. Large quantities of drinking water treatment plant sludge are produced in India and across globe and disposed-off by landfilling. Space limitations on existing landfill sites and problem of waste stabilization have prompted investigations into alternative reuse techniques and disposal routes for sludge. The best practical way of recycling these wastes is to use in civil engineering constructions since bulk quantities of materials are used in a short time in civil engineering constructions.
For now, water treatment plants sludge (referred to as sludge hereafter) remains an inescapable by product of water treatment processes. Such sludges typically contain mineral and humic matters removed and precipitated from the raw water, together with the residues of any treatment chemicals used as coagulant (commonly aluminum or iron salts), softening agents
2
(calcium hydroxide) and coagulant aids (mostly organic polymers). In the practical context, alum sludge and ferric sludge refer respectively to the sludge generated when aluminum or iron salt is used as the coagulant. Water softening sludge is produced when water is treated to remove hardness. Several million tons of sludges are produced every year and this may increase in subsequent years, raising considerable concerns over their disposal and associated costs.
Water treatment plants that employ the conventional processes of coagulation, flocculation and sedimentation produce large quantities of sludge. Often, the volume of generated sludge can be as high as 2% of the total volume of water treated (Qasim et al., 2000). The cost of treating and disposing the sludge can be a significant part of the operating cost of a water treatment plant. Options for the management of water treatment sludge have to be economically feasible and environmentally sound. Reuse of water treatment sludge has been receiving considerable attention recently. This is mainly due to the fact that this type of material, with the exception of alum, ferric and lime sludge, does not contain pollutants that would pose threat to humans or to the environment (Florida Department of Environmental Protection, 2006).
In this paper, an attempt has been made to find out the reuse potential of sludge which itself is an end product causing problems of disposal. In view of the anticipated disposal problem of sludge and associated environmental concerns, recycling of sludge into useful materials is gaining due consideration as an alternative disposal option. It is actually sludge reprocessing to value-added products that holds the future key to sustainable management. Thus, the primary focus of this review is the value addition of sludge in civil engineering applications comprising recovery of different components and development of commercial products.
SLUDGE DISPOSAL METHODS
The costs of handling the huge quantities of sludge can account for a significant part of the overall operating costs of water treatment plants and they are likely to increase due to increasingly stringent regulations. While considerable development has been made in sludge treatment, options available for its disposal are continually being dwarfed by the increasingly stringent environmental regulations. Prior to 1946, waterworks sludges were discharged to the nearest drainage course or water body and promptly forgotten, in line with the theory of “out of sight, out of mind” (Donald, 1968). Therefore, it is only a matter of time before the waterworks sludge issue becomes worrisome. As noted by Heil and Barbarick (1989), Elliot et al., (1990) and Viraraghavan and Ionescu (2002), the limited land available for waterworks sludge disposal and the possible environmental liabilities that may arise if disposed off in sanitary landfill sites, altogether makes it a considerable worry for water purification authorities.
• Characteristics
To reuse the sludge the major concern lies in its characteristics. Typically, sludge can be classified into coagulant, natural, groundwater or softening, and manganese sludge, but coagulant sludge constitutes the vast majority of water treatment plants residues and are mostly referred to in this review. Coagulant sludges are commonly aluminum or iron based salts. They occur mostly in particulate or gelatinous form, consisting of varying concentrations of microorganisms, organic and suspended matter, coagulant products and chemical elements.
3
CATEGORIES FOR REUSE
This review focuses on the reuse potential of sludge in civil engineering application as bulk quantity of material can be utilized in short period of time. Various reuse options were identified globally and are discussed here. Use of sludge as building material: Sludges have been preliminarily studied and used as building and construction materials. However, despite the obvious advantages and increasing researches into the incorporation of waterworks sludges in building and construction materials, they are yet to be fully accepted in the industry. Some of the efforts made so far at incorporating them into the industry are highlighted below:
• Brick making
The sludge is substituted into the brick at different levels to determine the optimum percentage of incorporation. A 100% success was reported for trials on bricks made from waterworks sludge at a ratio of 80:20 (Goldbold et al, 2003). It was however noted that such sludge bricks are more feasible with ferric sludge than with aluminum sludge, due to their iron and organic matter content, but this has not been particularly emphasized in other studies that were reported. In fact, Horth et al. (1994) reported that although up to 5 or 10% addition of ferric sludge to clay in brick making produced good result, the brick quality is affected with a reduction in mechanical strength and frost resistance if a higher proportion of the sludge is used. Even at lower percentages (1, 1.04 and 5%) of sludge incorporation by mass, there was still a reduction in brick mechanical properties with a higher water absorption probably due to the lime content of the sludge used (Carvalho and Antas, 2005). In a review of sludge bricks, Goldbold et al. (2003) reported that waterworks sludge especially ferric sludge provided some energy savings in brick making by acting as a fluxing agent, thereby reducing the firing temperature used in the kiln and in addition it provided some raw material savings in the use of water and clay resulting in reduced shrinkage and improved colour of the final product. It was however noted that using a high proportion of alum based waterworks sludge could lead to a decrease in tensile strength with increased sludge addition. Anderson et al. (2003) successfully incorporated a blended mixture of an iron based waterworks sludge and sewage sludge incineration ash into a brick mix-design on a 5% dry weight basis. Little difference was observed in the performance of the experimental brick and the control, showing that the introduction of the waterworks sludge into the overall brick mix had little impact on the fired properties of the product. In addition, no discharge levels in excess of specific limits were produced and the trial product exhibited lower levels of proscribed emission levels than the standard product.
• Cementitious material
Generally, recycling of sludge in the cement industry can be a practical alternative as reported by Pan et al. (2004), in that the waterworks sludge is virtually nonhazardous, and the chemical composition of the inorganic sludge is similar to the clay used in cement production. In their report, fresh waterworks sludge was successfully incorporated in the making of Portland cement through the sintering process. It was reported that the addition of the waterworks sludge in the cement clinker increased the compressive strength of the concrete and benefited the clinker burnability, without any detrimental effect on the long-term strength property. Setting times and soundness test results were equally satisfactory. In addition, Carvalho and Antas (2005) in a review of studies on sludge incorporation into cement noted the following: (1) during drying at 105oC, sludge suffered agglomeration and had to be grind before use; (2) sludge dewatered or heated at 105oC prevents the setting and hardening of paste and mortar; (3) thermally treated
4
sludge decreases the compressive strength of mortar, but promotes the increase of consistency; (4) compressive strength decreased with an increase in sludge content and treatment temperature and (5) sludge treated at 700oC induced the formation of lime and calcium aluminates, which might have caused the observed decrease of initial setting time. It was therefore concluded that sludge incorporation into mortar cement could only be feasible at temperatures above 450oC, with an increase of the initial setting time but a decrease of the mechanical strength. In addition, there seems to be a lack of result of extensive research into the compressive strength of such “sludge cement” for it to gain practical acceptance, indicating an area of further research. As noted by Joo-Hwa et al. (1991) in a review of the properties of cement made from sludge, the compressive strength of sludge cement was found to decrease as the replacement amount of sludge ash was increased. Godbold et al. (2003) further remarked that in order to determine the full commercial viability of such sludge cement, the quantity of the raw product available and the transportation economics were of equal importance. In particular, it was noted that their suitability for recycling is dependent on the quantities likely to be available and source location in relation to potential manufacturing plant.
• Geotechnical and Geoenvironmetal works
Although still in the preliminary stage and yet to be widely studied and reported, the possibility of using sludge as geotechnical works material (e.g. waste containment barriers, soil modelling, structural fills) and incorporation into construction materials (bituminous mixtures, subbase material for road construction) and as landfill liner have been reported (Ronald and Donald, 1977; Raghu, et al 1987; Carvalho and Antas, 2005). This is particularly based on preliminary characterization test results on the geotechnical and geo-environmental characteristics of waterworks sludge which shows some promise as a suitable geotechnical and construction material. Carvalho and Antas (2005) reviewed the feasibility of sludge incorporation as a filler material in bituminous mixtures for use in general pavement works. It was recommended that sludge should be thermally treated to at least a temperature of 450oC to volatize all the organic components. Such thermally dried sludge suffered agglomeration and needed to be grind before use. However, the dried and grind sludge had heterogenic granulometria which was incompatible with fillers granulometria range. Therefore, the need to eliminate organics in the sludge may lead to incompatibility between the sludge and traditional filler material. Consequently, an optimum temperature that would maximise sludge organic removal and minimize incompatibility with traditional fillers is desirable. However, such thermal treatment may present some environmental problems, as there are concerns over malodorous emissions during the thermal drying. Obviously, such odorous emissions may limit large-scale industrial application of the process. Ronald and Donald (1977) also investigated the feasibility of sludge incorporation into a stabilized subbase material used in road construction. Results show that up to 0.5 to 3% sludge incorporation produced a corresponding 150 to 113% increase in the optimum seven day unconfined compressive strength result respectively, as compared to the control mix. However, a gradual strength decrease was observed at higher levels of incorporation and this was adduced to the possibility of a significant increase in the proportion of fine materials in the mix because of increased sludge addition. This may have reduced the interparticle friction of larger aggregates, causing a loss of strength. Raghu et al. (1987) also evaluated the feasibility of using waterworks sludge as a liner for sanitary landfills. Water was leached through the samples and chemical analyses show that the concentration of heavy metals and organic matter were too low to create any pollution problems.
CONCLUDING REMARKS
5
Generation of water treatment plant sludge remains inevitable for now, and its disposal is emerging as a significant element in water resources planning and management. Socioeconomic and environmental constraints have continuously limited the applicability of currently used disposal methods, creating an acute need for other sustainable sludge end-uses. While current sludge disposal methods may still suffice for the time being, the need for environmental sustainability and fiscal responsibility coupled with population increases will continually provide the drive towards beneficial reuse. Such reuse of the sludge should have a “multi-pronged” approach, offering both economic and environmental sustainability.
• Disposal in landfills is eliminating due to various legislations for materials to be landfilled and increased costs of landfill disposals and space constraint.
• Thermal treatment of sludge may present some environmental problems like harmful emissions and economic burden of large capital cost. Hence utilization of sludge without sintering should be appreciated.
• Bricks with sludge were technically and economically feasible with more specific characteristics.
• The “sludge cement” needs more detailed research and the involvement of the stakeholders as well as industries to gain the full scale application.
• Sludge reuse in geotechnical and geoenvironmental application is a promising solution to the bulk quantity of sludge without having negative impact on the environment.
Reference
Anderson, M., Biggs, A. and Winters, C (2003); Use of two blended water industry byproduct wastes as a composite substitute for traditional raw materials used in clay brick manufacture; In: Proceedings of the International symposium on recycling and reuse of waste materials, Dundee, Scotland, UK.
Carvalho, M. and Antas, A. (2005); Drinking water sludge as a resource; In: Proceedings of IWA specialised conference on management of residues emanating from water and wastewater treatment, Johannesburg, South Africa.
Donald, P.P. (1968); Selection and disposal methods for water treatment plant wastes; J. Am. Wat. Works Assoc. 60(6), 674-680.
Elliot, H.A., Dempsey, B.A. and Maille, P.J. (1990); Content and fractionation of heavy metals in water treatment sludges; J. Environ. Qual.; 19(2), 330-334
Goldbold, P., Lewin, K., Graham, A. and Barker, P. (2003); The potential reuse of water utility products as secondary commercial materials. In: WRC technical report series. No UC 6081, project contract no.12420-0
Heil, D. M. and Barbarick, K.A. (1989); Water treatment sludge influence on the growth of sorghum-sudangrass; J. Environ. Qual.; 18(3), 292-298
Horth, H., Gendebien, A., Agg, R. and Cartwright, N. (1994); Treatment and disposal of waterworks sludge in selected European countries; In: Foundation for water research technical reports No.FR 0428.
Joo-Hwa, T. and Kuan-Yeow, S. (1991); Properties of Cement made from sludge; J. Environ. Eng. 117(2), 236-246
Pan, J. R., Huang, C. and Lin, S. (2004); Reuse of fresh water sludge in cement making; Wat. Sci. & Tech. 50(9), 183-188
Qasim, S., Motley, E. and Zhu, G. 2000; Water Works Engineering; Prentice Hall of India: India. Raghu, D., Hsieh, H., Neilan, T.,Yih, C. (1987); Water treatment plant sludge as landfill liner; In:
Proceedings of specialty conference on Geotechnical practice for waste disposal, USA. Viraraghavan, T. and Ionescu, M. (2002); Land application of phosphorus-laden sludge: A feasibility
analysis; J. Environ. Management; 64:171-177
6
ENVIRONMENTAL LIFE CYCLE ANALYSIS OF SOLID WASTE LAND DISPOSAL OPTIONS
Lakshmikanthan P* and Sivakumar Babu G.L. ** *Centre for Sustainable Technologies, Indian Institute of Science (IISc), Bangalore, Karnataka 560012. **Department of Civil Engineering, Indian Institute of Science (IISc), Bangalore, Karnataka 560012.
INTRODUCTION
Landfills are common land disposal methods employed in most of the developing countries across the world. The waste disposal methods such as open dumps, landfill without and with gas recovery systems and bioreactor landfills are assessed using Life cycle analysis (LCA) method. These scenarios were applied to the municipality of Bangalore (Karnataka, India). Bangalore produces about 3600 tons per day (tpd) of municipal solid wastes (MSW). A major constituent (72%) of this is organic waste (Chanakya et al 2010). All the wastes are taken to the landfills situated on the outskirts of Bangalore. LCA serves as decision making tool in selection of the most sustainable, economic and environment friendly land disposal options. The analysis is done in terms of the material flow, energy flow and impacts of open dumping and land filling on the environment. A sustainable, economic and reliable method has to be adapted for clean disposal of the municipal solid waste (MSW). In this study four land disposal options are considered which are analysed using the LCA method. The four scenarios considered for the study are given below.
Scenario 1: Open dumps Scenario 2: Landfill system without gas recovery Scenario 3: Landfill system with gas recovery Scenario 4: Bioreactor Landfill system
The best option in terms of minimal environmental consequences is selected by comparing the impacts caused by each disposal method.
LIFE CYCLE ASSESSMENT
Life cycle assessment (LCA) is a tool to quantify environmental burdens associated with products or activities throughout their life cycle, or “from cradle to grave” (Finnveden 1999, Denison 1996 and Kasai 1999). LCA as a tool was applied to industrial products initially and developed rapidly during the 1990s. LCA studied the overall environmental burdens generated by products, processes or activities during their entire life cycle, which include extraction and processing of raw materials, manufacturing, production and maintenance, packaging, transportation and distribution and recycling( ISO 1997). LCA has been used extensively to evaluate solid waste management systems as well as for comparison of different scenarios for integrated waste management systems (Moberg et al 2005, Mendes et al 2004). The methodological framework used in this study is the LCA as defined by ISO standards (International Standard Organization, ISO 14040:14043). The general categories of environmental impacts considered include resource use, human health and ecological groups. There are four phases for LCA, which include:
1. Goal definition and scoping 2. Inventory analysis
7
3. Assessment of potential environmental impacts 4. Interpretation or improvement analysis.
Four scenarios are applied to the Bangalore’s urban municipal solid waste land disposal systems. The waste disposal methods open dumps, landfill without and with gas recovery systems and bioreactor landfills are assessed using Life cycle analysis (LCA). This study compares and analyses the various land disposal methods.
The present study deals with the development of life cycle inventory (LCI) methods to describe and quantify the estimates of the environmental performance of open solid waste dumps, engineered landfills and bio reactor landfills. An inventory of energy requirements and selected environmental emissions is performed by analysing the materials and energy flow in and out of the systems considered. Though the focus is mainly on environmental consequences and energy use, other impact categories such as acidification, eutrophication, photochemical ozone creation potential (POCP) and human and ecotoxicological impacts are also considered. The filling and the post closure phases are taken into account in the landfill system. The negative environmental consequences from the landfill can be more significantly studied and analysed using the LCA tool. The various inputs such as municipal solid waste (MSW), cover layers including geomembranes and geotextiles, energy (fuel), raw materials like soil and vegetation cover and water are considered. The impacts are assessed in terms of the pollution to ground, gas emission to the atmosphere (mainly CH4 and NO2) and the impact on the human population.
GOAL DEFINITION AND SCOPING
The present LCA study is performed by carrying out an inventory of the inputs and outputs related to land filling methods in Bangalore. In this study the MSW, the raw materials needed for cover systems, energy in terms of fuel required for transporting the MSW from source to the landfill site and moisture required are considered as inputs to the system. The outputs are emissions to the air and water and the energy that can be recovered from the land disposal systems. Four scenarios are being considered and the boundaries of each system are defined. The LCA boundaries were limited to the landfill sites situated in Bangalore. The calculations were done based on the present population of Bangalore (census 2011) and the waste generation rate of 0.6kg/capita/day (Chanakya et al 2009). The amount of MSW generated per capita is estimated to increase at a rate of 1–1.33% annually (Pappu et al., 2007, Shekdar, 1999 and Bhide and Shekdar, 1998). The considered scenario consists of three main steps: collection, transport and land filling of MSW. Therefore the emissions due to transportation of vehicles and energy required for transportation are also considered in the analysis.
• Scenario 1: Open dumps
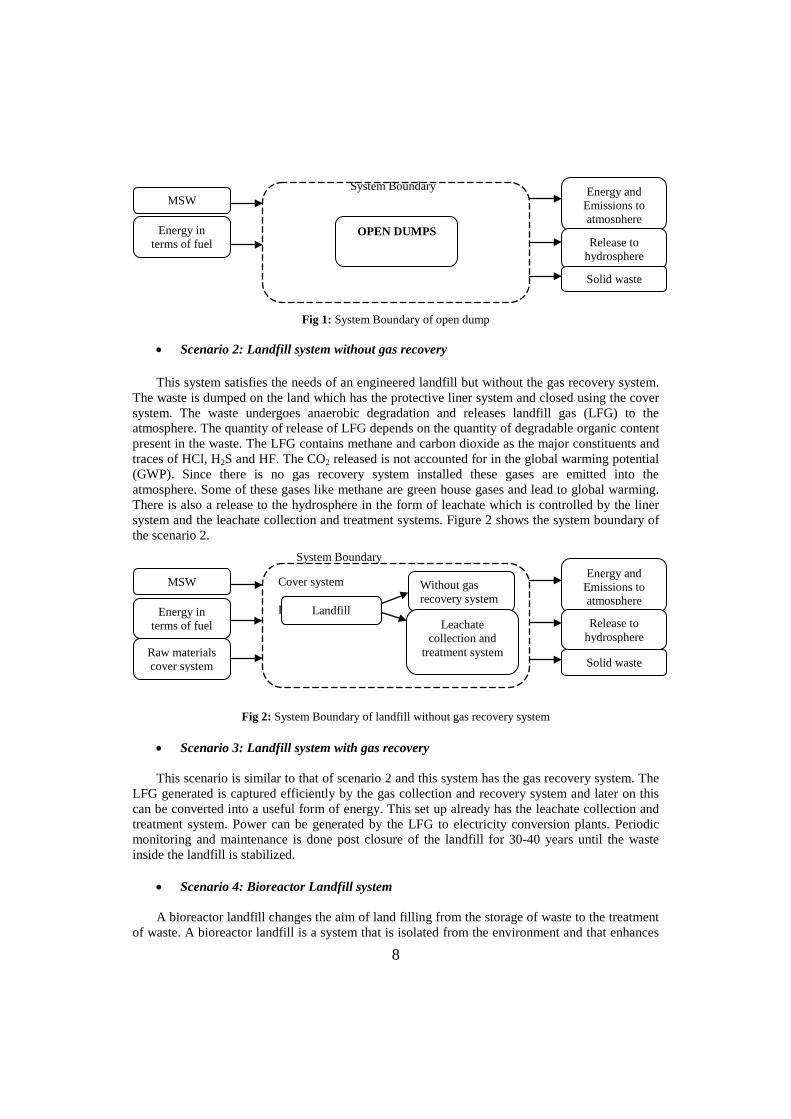
The open dumps are places which do not have any liner systems installed and the area is temporarily or permanently used as waste disposal sites. The open dumps pose serious threat to the environment compared to the scientifically engineered landfill systems.
The environmental consequences are very high as the leachate may pollute the soil and ground water and the emissions could pollute the air. The boundary in this case is the area of the dump site. Compaction and leveling are seldom done at the site. Figure 1 shows the system boundary.
8
Fig 1: System Boundary of open dump
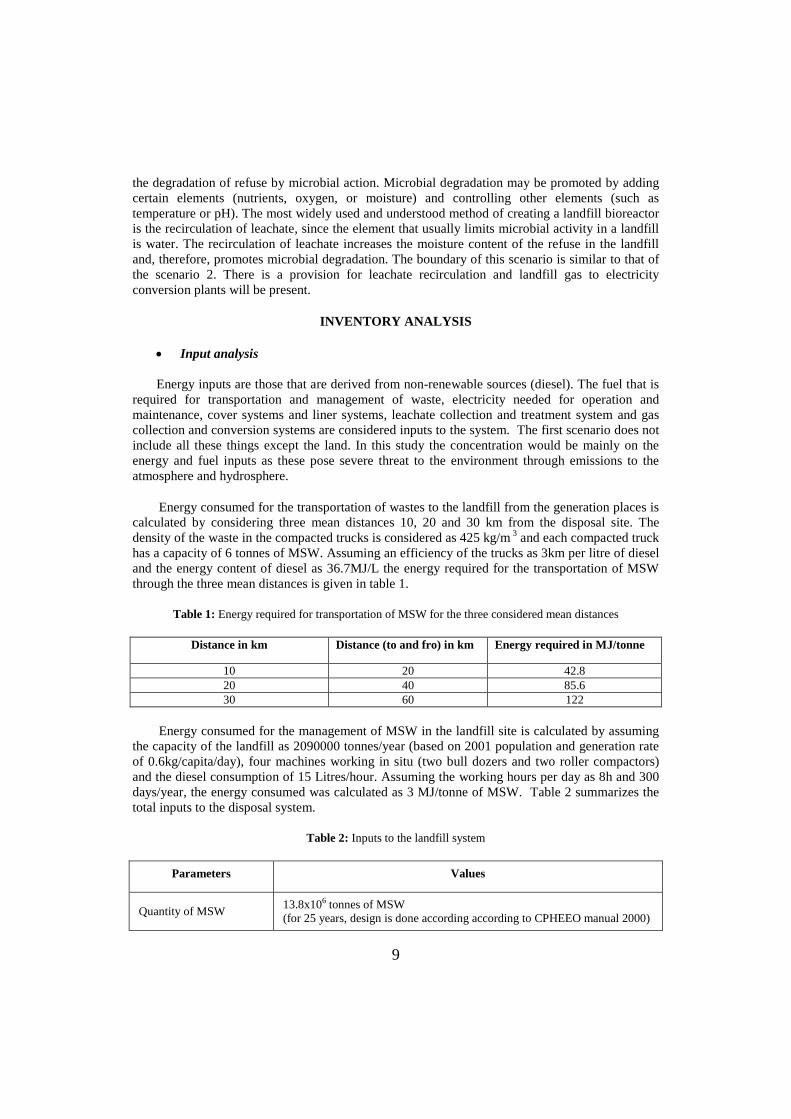
• Scenario 2: Landfill system without gas recovery
This system satisfies the needs of an engineered landfill but without the gas recovery system. The waste is dumped on the land which has the protective liner system and closed using the cover system. The waste undergoes anaerobic degradation and releases landfill gas (LFG) to the atmosphere. The quantity of release of LFG depends on the quantity of degradable organic content present in the waste. The LFG contains methane and carbon dioxide as the major constituents and traces of HCl, H2S and HF. The CO2 released is not accounted for in the global warming potential (GWP). Since there is no gas recovery system installed these gases are emitted into the atmosphere. Some of these gases like methane are green house gases and lead to global warming. There is also a release to the hydrosphere in the form of leachate which is controlled by the liner system and the leachate collection and treatment systems. Figure 2 shows the system boundary of the scenario 2.
Fig 2: System Boundary of landfill without gas recovery system
• Scenario 3: Landfill system with gas recovery
This scenario is similar to that of scenario 2 and this system has the gas recovery system. The LFG generated is captured efficiently by the gas collection and recovery system and later on this can be converted into a useful form of energy. This set up already has the leachate collection and treatment system. Power can be generated by the LFG to electricity conversion plants. Periodic monitoring and maintenance is done post closure of the landfill for 30-40 years until the waste inside the landfill is stabilized.
• Scenario 4: Bioreactor Landfill system
A bioreactor landfill changes the aim of land filling from the storage of waste to the treatment of waste. A bioreactor landfill is a system that is isolated from the environment and that enhances
OPEN DUMPS
System Boundary MSW
Energy in terms of fuel
Energy and Emissions to atmosphere
Release to hydrosphere
Solid waste
Cover system Liner system Landfill
System Boundary
MSW
Energy in terms of fuel
Energy and Emissions to atmosphere
Release to hydrosphere
Solid waste Raw materials cover system
Without gas recovery system
Leachate collection and
treatment system
9
the degradation of refuse by microbial action. Microbial degradation may be promoted by adding certain elements (nutrients, oxygen, or moisture) and controlling other elements (such as temperature or pH). The most widely used and understood method of creating a landfill bioreactor is the recirculation of leachate, since the element that usually limits microbial activity in a landfill is water. The recirculation of leachate increases the moisture content of the refuse in the landfill and, therefore, promotes microbial degradation. The boundary of this scenario is similar to that of the scenario 2. There is a provision for leachate recirculation and landfill gas to electricity conversion plants will be present.
INVENTORY ANALYSIS
• Input analysis
Energy inputs are those that are derived from non-renewable sources (diesel). The fuel that is required for transportation and management of waste, electricity needed for operation and maintenance, cover systems and liner systems, leachate collection and treatment system and gas collection and conversion systems are considered inputs to the system. The first scenario does not include all these things except the land. In this study the concentration would be mainly on the energy and fuel inputs as these pose severe threat to the environment through emissions to the atmosphere and hydrosphere.
Energy consumed for the transportation of wastes to the landfill from the generation places is calculated by considering three mean distances 10, 20 and 30 km from the disposal site. The density of the waste in the compacted trucks is considered as 425 kg/m 3 and each compacted truck has a capacity of 6 tonnes of MSW. Assuming an efficiency of the trucks as 3km per litre of diesel and the energy content of diesel as 36.7MJ/L the energy required for the transportation of MSW through the three mean distances is given in table 1.
Table 1: Energy required for transportation of MSW for the three considered mean distances
Distance in km Distance (to and fro) in km Energy required in MJ/tonne
10 20 42.8 20 40 85.6 30 60 122
Energy consumed for the management of MSW in the landfill site is calculated by assuming the capacity of the landfill as 2090000 tonnes/year (based on 2001 population and generation rate of 0.6kg/capita/day), four machines working in situ (two bull dozers and two roller compactors) and the diesel consumption of 15 Litres/hour. Assuming the working hours per day as 8h and 300 days/year, the energy consumed was calculated as 3 MJ/tonne of MSW. Table 2 summarizes the total inputs to the disposal system.
Table 2: Inputs to the landfill system
Parameters Values
Quantity of MSW 13.8x10⁶ tonnes of MSW (for 25 years, design is done according according to CPHEEO manual 2000)
10
Volume of daily cover 0.1% of Volume of waste (1.909x10⁶ tonnes of MSW) (for 25 years, design is done according according to CPHEEO manual 2000)
Volume of cover system 0.08% of Volume of waste (1.5x10⁶ tonnes) (for 25 years, design is done according to CPHEEO manual 2000)
Total average rainfall in Bangalore
931 mm/year (based on 100 year data, Indian Meteorological Department)
Energy in terms of fuel 125 MJ/Tonne of MSW(3 litres of Diesel/Tonne of MSW)
• Output analysis
The outputs of the landfill system are in the form of landfill gas that is generated by the decomposition of MSW, the leachate generated and finally the left over inert waste that can be used as compost. Also the emissions from the trucks and bulldozers that are used for transportation and management of MWS are considered as outputs from the system. The quantity of landfill gas that would be generated after 15 years by assuming the values given in table 3 (assuming only 40% of the total waste generated is land filled and around 90% of degradable organic content) was calculated as 4.49x10¹² Litres from 13.8x10⁶ tonnes of MSW and 815000 Litres of biogas per tonne of MSW using the Buswell & Mueller equation. According to this relation, the methane fraction from degradation of glucose is given by
C6H12O6 → 3 CH4 + 3CO2
This equation is considered in order to calculate the maximum theoretical emissions from the waste. It was assumed that the landfill gas contained 50% methane and 50% carbon-di-oxide. Therefore the quantity of methane produced was calculated as 453 Litres (29700 grams) of methane per tonne of MSW. The quantity of landfill gas generated over the design period of 25 years was calculated as 4.49x10¹² Litres. For the landfill systems with gas recovery system, there is energy savings associated with the conversion of the LFG to electrical energy.
Road transport emits mainly CO2, NOx, CO and NMVOCs; however it is also a small source of N2O, CH4 and NH3. Emissions of CO2 are directly related to the amount of fuel used. The kilometre travelled-based CO, HC, NOx and PM2.5 Emission Factors of emission control technology Euro 0 Light Duty Diesel Trucks (LDDTs) are 11.95, 1.75, 2.36 and 0.62 g/km, respectively (Kebin et al 2010). The kilometre travelled-based Emission Factors of CO, HC, NOx and PM2.5 of Euro I Heavy Duty Diesel Trucks (HDDTs) are 4.52±2.56, 0.68±0.19, 6.32±1.58 and 0.58±0.34 g/km. The emissions calculated based on the above mentioned values for the transportation and the management of MSW is given Table 3.
Table 3: Diesel consumption for transportation and management of MSW
Transportation Management
Parameters Emissions in g/L of
diesel
Emissions g per tonne of MSW
Emissions in g/L of
diesel
Emissions g per tonne of
MSW
Distance(to and fro) in km 20 40 60
11
Diesel Consumption (Litres/tonne of MSW) 1.2 2.3 3.3 0.5
CO2 26631 3195.6 6124.9 8787.9 26631 1331.5
CO 11.95 14.34 27.485 39.435 4.52 9.04
HC 1.75 2.1 4.025 5.775 0.68 1.36
NOx 2.36 2.832 5.428 7.788 6.28 12.56
PM2.5 0.62 0.744 1.426 2.046 0.58 1.16
1= www.ec.gc.ca
The total outputs include methane and the carbon dioxide that are released from the landfill and the gases that are emitted by the vehicles. The landfill system with and without recovery of landfill gas are given in table 4. The efficiency of the gas collection system is assumed as 80%. The transportation distance considered here is the maximum distances of 60km. Emissions for management of waste in the open dumps are considered nil as there are no management activities undertaken.
Table 4: Emissions from the landfill system with and without gas recovery system
Emissions from the system
Open dumps Landfill Bioreactor landfill
in g With Gas Recovery in g
Without Gas Recovery in g
in g
CH4 268950 53790 215160 53790
CO2 289721.4 78555.9 347505 78555.9
CO 48.47 48.47 48.47 48.47
HC 7.135 7.135 7.135 7.135
NOx 20.338 20.338 20.338 20.338
PM2.5 3.206 3.206 3.206 3.206
The landfill leachate that is generated is released into the underlying soil and later into the groundwater. Assuming 80% precipitation in 4 months (monsoon period), peak leachate quantity (thumb rule basis) is around 200 m3/day (CPHEEO 2000). The first scenario does not have the protective liner system and leachate collection system and therefore it is let off directly to the surrounding environment. The other cases have liner system and leachate collection system and therefore the leachate is collected and treated.
IMPACT ASSESSMENT
According to the life cycle characteristics of waste treatment/disposal, its environmental impacts are classified into five kinds: energy depletion potential (EDP), global warming potential (GWP), acidification potential (AP), eutrophication potential (EP), and photochemical oxidant potential (POCP). The characterization factors of the green house gases that are considered for calculation
12
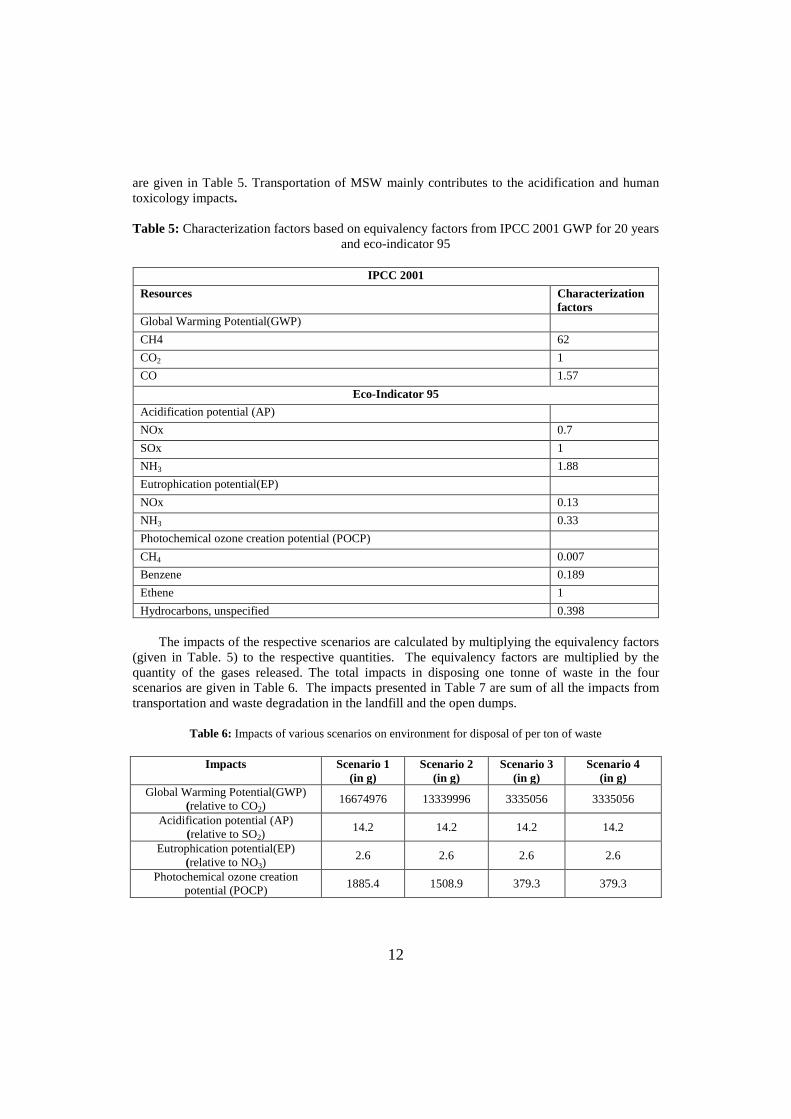
are given in Table 5. Transportation of MSW mainly contributes to the acidification and human toxicology impacts. Table 5: Characterization factors based on equivalency factors from IPCC 2001 GWP for 20 years
and eco-indicator 95
IPCC 2001 Resources Characterization
factors Global Warming Potential(GWP) CH4 62 CO2 1 CO 1.57
Eco-Indicator 95 Acidification potential (AP) NOx 0.7 SOx 1 NH3 1.88 Eutrophication potential(EP) NOx 0.13 NH3 0.33 Photochemical ozone creation potential (POCP) CH4 0.007 Benzene 0.189 Ethene 1 Hydrocarbons, unspecified 0.398
The impacts of the respective scenarios are calculated by multiplying the equivalency factors (given in Table. 5) to the respective quantities. The equivalency factors are multiplied by the quantity of the gases released. The total impacts in disposing one tonne of waste in the four scenarios are given in Table 6. The impacts presented in Table 7 are sum of all the impacts from transportation and waste degradation in the landfill and the open dumps.
Table 6: Impacts of various scenarios on environment for disposal of per ton of waste
Impacts
Scenario 1 (in g)
Scenario 2 (in g)
Scenario 3 (in g)
Scenario 4 (in g)
Global Warming Potential(GWP) (relative to CO2)
16674976 13339996 3335056 3335056
Acidification potential (AP) (relative to SO2)
14.2 14.2 14.2 14.2
Eutrophication potential(EP) (relative to NO3)
2.6 2.6 2.6 2.6
Photochemical ozone creation potential (POCP) 1885.4 1508.9 379.3 379.3
13
Scenario 1 projects the maximum environmental consequences. This reason for this is the absence of the liner system, gas recovery system and the leachate collection and treatment system. The GWP and POCP are maximum in this case and therefore can severely affect the environment. Therefore this is the least considered option in terms of environmental consequences. Among the landfill systems the Scenario 4 (bioreactor landfill) emerges to be the best option. The global warming potential and Photochemical ozone creation potential (POCP) are the minimum in the bio reactor. Though the engineered landfill system is similar to the bioreactor, the various advantages of bioreactor landfills put it ahead of scenario 3. The advantages of bioreactor landfills described by Warith, M. 2002 are given below.
(a) Enhancement in the LFG generation rates (b) Reduce environmental impacts (c) Production of end product that does not need landfilling (d) Overall reduction of landfilling cost (e) Reduction of leachate treatment capital and operating cost (f) Reduction in post-closure care, maintenance and risk
RESULTS AND DISCUSSION
It is evident from table 7 that the scenario 1 is the least favoured land disposal option that can be considered as the Global Warming Potential (GWP) and Photochemical ozone creation potential (POCP) are considerably higher compared to the other methods. The landfill leachate generated in scenario 1 is not subjected to any treatment and is disposed off to the environment. This can increase the acidification potential and the eutrophication potential. The Acidification potential (AP) and Eutrophication potential (EP) are same in all the scenarios. Scenario 2 is better than scenario 1 but all the methane that is generated is let out to the atmosphere. Assuming 10% methane oxidation in soil cover, the GWP is 1333999.6 g CO2-eq which is very high compared to scenarios 3 and 4. Scenarios 3 and 4 are similar except for the waste stabilization period that ranges from 5-10 years for bioreactor landfills to a few decades for engineered landfills. All the gases and leachate generated are collected using the gas recovery system and the leachate collection system. The GWP and POCP impacts due to scenario 1 are around 5 times and 4 times the impacts caused due to scenario 4.
CONCLUSIONS
The scenarios can be put in a descending order scenario 1 > scenario 2 > scenario 3 > scenario 4 according to their impacts on environment. The bioreactor landfill option proves to be the better option among the four scenarios. It is also sustainable and economically viable as it has a short stabilization period as compared to the engineered landfills. It can process waste at a faster rate and also produce energy in the form of landfill gas. The bioreactor can also generate revenue in the form of LFG that can be used. Therefore the bioreactor option is the most favored land disposal option over the other options that can be considered for Bangalore city. The other MSW treatment options like composting, refused derived fuel and incineration require further research. The bioreactor landfill can be favored over incineration methods. Further the several combinations of treatment and disposal methods can be studied and the most sustainable methods can be preferred. Concepts of integrated solid waste management are growing which can also be analyzed using LCA. This study helps in the selection of the most suited waste disposal method. It highlights the importance of LCA methods and applications. The study also reveals the
14
significance of bioreactor landfills that can be used in place of the scientifically engineered landfills.
References
Bhide, A. D., & Shekdar, A. B. (1998). Solid waste management in Indian urban centers. International Solid Waste Assoociation Times (ISWA), 1, 26-28.
Central Public Health, & Environmental Engineering Organisation (India). (2000). Manual on municipal solid waste management. Central Public Health and Environmental Engineering Orgnisation, Ministry of Urban Development, Govt. of India.
Chanakya., H.,N., Shwetmala and Ramachandra, T. V. (2010): Small-scale decentralized and sustainable municipal solid waste management potential for Bangalore anchored around total recycle and biomethanation plants. National Conference on Urban, Industrial and Hospital Waste Management 2010., Ahmedabad Management Association.
Chanakya, H.N., (2009): Towards a sustainable waste management system for Bangalore. 1st International Conference on Solid Waste Management (IconSWM), Kolkata.
Denison, R. A., (1996). Environmental life cycle comparisons of recycling, landfilling and incineration : A review of recent studies. Annual Review of Energy and the Environment, 21 : 191 - 237.
Finnveden, G., (1999). Methodological aspects of life cycle assessment of integrated solid waste management systems .Resources, Conservation and Recycling, 26 : 173- 187.
IPCC Guidelines for National Greenhouse Gas Inventories: Reference Manual. Revised 1996. ISO, (1997). Environmental management—life cycle assessment—principles and framework. Geneva,
Switzerland: International Organisation for Standardisation. Kasai, J., (1999). Life cycle assessment, evaluation method for sustainable development. J SAE Review,
20:387 - 393. Kebin, H. E,. Zhiliang Yao, and Yingzhi Zhang. (2010). Characteristics of vehicle emissions in China
based on portable emission measurement system. 19th Annual International Emission Inventory Conference “Emissions Inventories-Informing Emerging Issues”, San Antonio, Texas.
Mendes, R. M., Aramaki, T., Hanaki, K. (2004). Comparison of the environmental impact of incineration and landfilling in Sao Paulo City as determined by LCA, Resource. Conservation and Recycling, 41:47-63.
Moberg, A., Finnveden, G., and Johansson, J., Lind, P. (2005). Life cycle assessment of energy from solid waste-part 2: landfilling compared to other treatment methods. Journal of Cleaner Production, 13(3):231-240.
Pappu, A., Saxena, M., & Asolekar, S. R. (2007). Solid wastes generation in India and their recycling potential in building materials. Building and Environment, 42(6), 2311-2320.
Shekdar, A., V. (1999). Municipal solid waste management, the Indian perspective. Journal of Indian Association for Environmental Management, 26(2), 100-108.
Warith, M. (2002). Bioreactor landfills: experimental and field results. Waste management, 22(1), 7-17.
15
SHEAR STRENGTH CHARACTERIZATION OF DEGRADED MUNICIPAL SOLID WASTE
B. Janaki Ramaiah*, Tufel Ahmed**, B. Munwar Basha* and G. V. Ramana* *Department of Civil Engineering, Indian Institute of Technology Delhi, New Delhi, India **Sanitary Landfill Division, Municipal Corporation of Delhi, Yamuna Bazar, Delhi, India
INTRODUCTION Dr. Boutwell, in his “2002 Aleksandar Vesic Memorial Lecture,” at North Carolina says (Boutwell 2002): “You may not need a fireman during your whole life You (hopefully) may not need a policeman often during your life You need the garbage man once a week”
The above, well thought statement, emphasizes the current need of the nations, both developed and developing, for MSW collection and disposal in an environmental friendly manner.
India, the second most populous country (17.1% of world’s population with 2.4% of global landmass), also being the second fastest growing economy in the world, is undergoing rapid urbanization. The rapid urbanization has resulted in the enormous generation of municipal solid waste (MSW) in the country. Despite rapid economic growth, urban solid waste management has remained one of the most neglected areas of environmental management in India as well as in other developing nations. Figure 1a depicts the rising quantities of MSW and Figure 1b, the cumulative land requirement for disposal of MSW in India. Diversion of land for waste disposal would be physically impossible since areas with the largest concentration of MSW would also be the areas with serious scarcity of vacant land.
Even if the treatment methods like incineration and composting are adopted for handling of MSW, the final residues of these methods have to be disposed along with inerts in the landfill. For instance, in Delhi, the current generation rate of MSW is 7500 to 8000 tones per day. Only 7% of total waste generated is treated by composting and rest is disposed in landfills (DPCC, 2010). About 33% of the waste received by Waste to energy plant at Okhla is being disposed as bottom ash and fly ash at Okhla sanitary landfill (Okhla phase-I). Over 16 large landfills covering up to 180 hectares (1.8 sq. km) have already been packed since 1975. The area covered by these landfills is at least 1 percent of Delhi’s total area (Kumar & Alappat, 2003).
To combat for the disposal of exponentially increasing MSW generation in the country, there is a great necessity of landfills in urban communities. In contrast, there is an immense scarcity of suitable land, for constructing the new engineered repositories from view of socio-economic-hydrogeological-environmental factors like high capital intensive (cost of land particularly in urban areas), public protest (NIMBY notion), rainfall, depth to ground water table, presence of water bodies nearby, places of religious importance, hospitals, airports; seismicity etc. Hence, to meet the demand, most of the existing landfills are being explored beyond the initial proposed capacity (megafills) by taking to higher grades within the footprint area designated initially. Therefore the slope stability of MSW, liners and covers is to be addressed with great care as
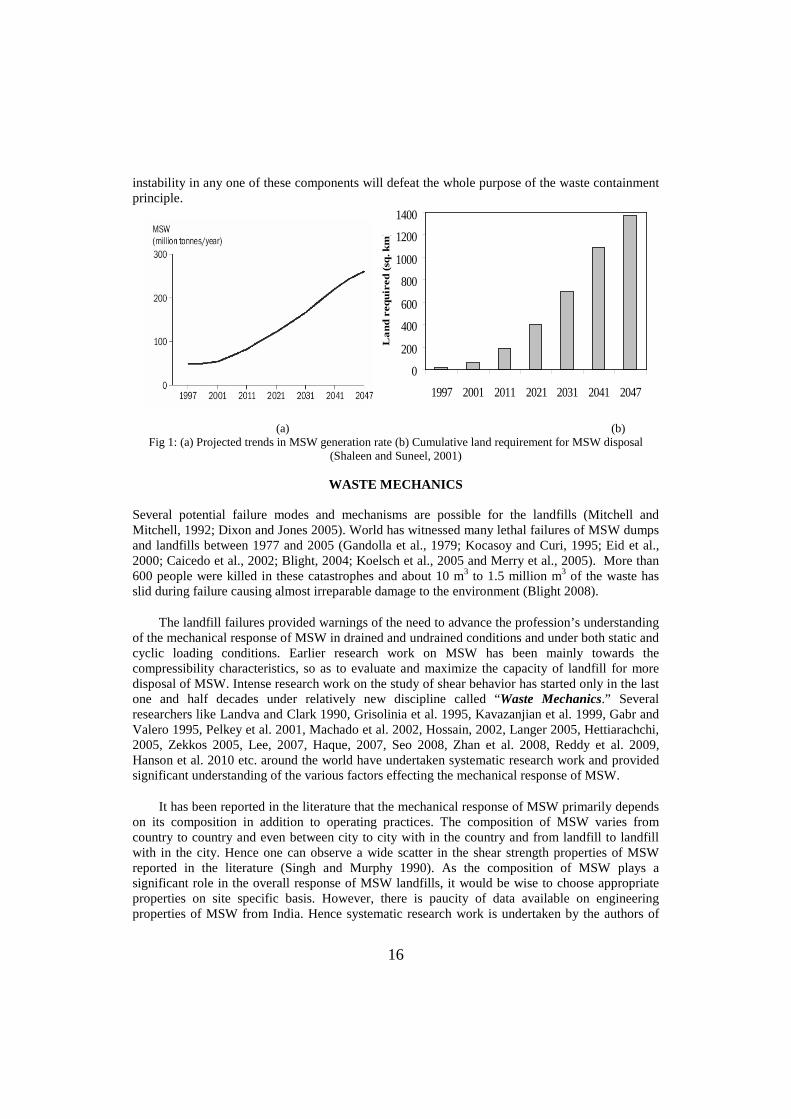
16
instability in any one of these components will defeat the whole purpose of the waste containment principle.
(a) (b)
Fig 1: (a) Projected trends in MSW generation rate (b) Cumulative land requirement for MSW disposal (Shaleen and Suneel, 2001)
WASTE MECHANICS
Several potential failure modes and mechanisms are possible for the landfills (Mitchell and Mitchell, 1992; Dixon and Jones 2005). World has witnessed many lethal failures of MSW dumps and landfills between 1977 and 2005 (Gandolla et al., 1979; Kocasoy and Curi, 1995; Eid et al., 2000; Caicedo et al., 2002; Blight, 2004; Koelsch et al., 2005 and Merry et al., 2005). More than 600 people were killed in these catastrophes and about 10 m3 to 1.5 million m3 of the waste has slid during failure causing almost irreparable damage to the environment (Blight 2008).
The landfill failures provided warnings of the need to advance the profession’s understanding of the mechanical response of MSW in drained and undrained conditions and under both static and cyclic loading conditions. Earlier research work on MSW has been mainly towards the compressibility characteristics, so as to evaluate and maximize the capacity of landfill for more disposal of MSW. Intense research work on the study of shear behavior has started only in the last one and half decades under relatively new discipline called “Waste Mechanics.” Several researchers like Landva and Clark 1990, Grisolinia et al. 1995, Kavazanjian et al. 1999, Gabr and Valero 1995, Pelkey et al. 2001, Machado et al. 2002, Hossain, 2002, Langer 2005, Hettiarachchi, 2005, Zekkos 2005, Lee, 2007, Haque, 2007, Seo 2008, Zhan et al. 2008, Reddy et al. 2009, Hanson et al. 2010 etc. around the world have undertaken systematic research work and provided significant understanding of the various factors effecting the mechanical response of MSW.
It has been reported in the literature that the mechanical response of MSW primarily depends on its composition in addition to operating practices. The composition of MSW varies from country to country and even between city to city with in the country and from landfill to landfill with in the city. Hence one can observe a wide scatter in the shear strength properties of MSW reported in the literature (Singh and Murphy 1990). As the composition of MSW plays a significant role in the overall response of MSW landfills, it would be wise to choose appropriate properties on site specific basis. However, there is paucity of data available on engineering properties of MSW from India. Hence systematic research work is undertaken by the authors of
0
200
400
600
800
1000
1200
1400
1997 2001 2011 2021 2031 2041 2047L
and
requ
ired
(sq.
km
)
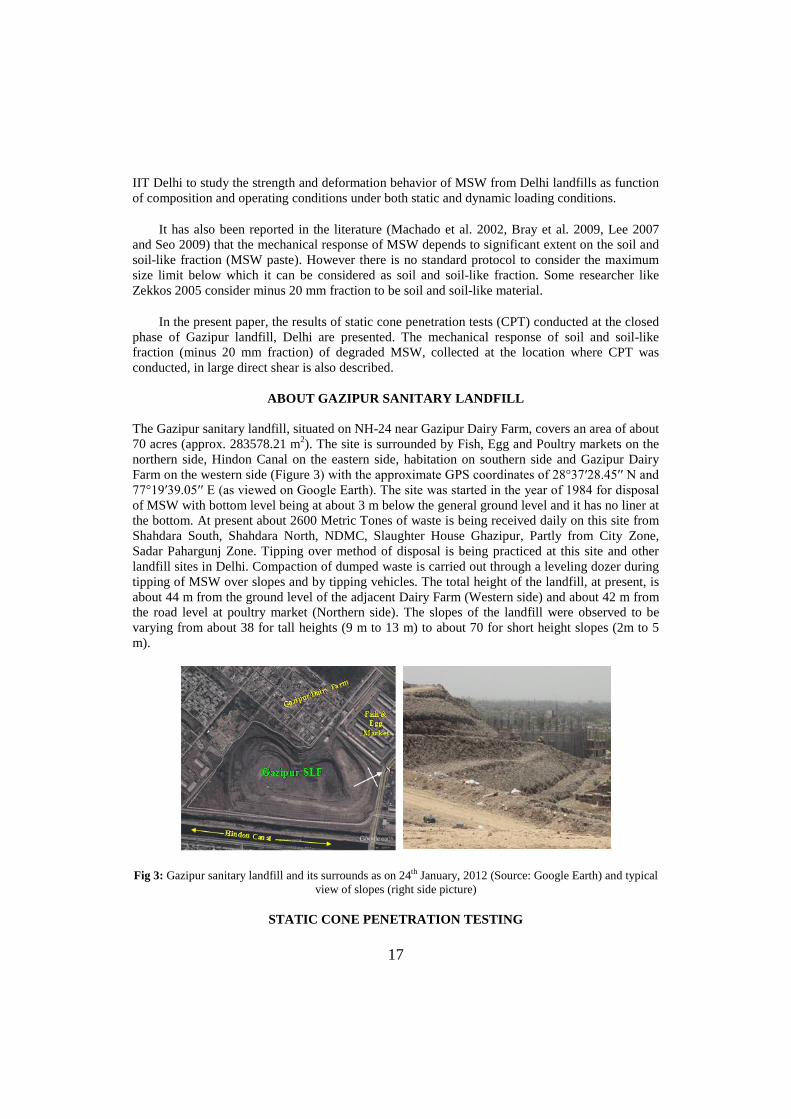
17
IIT Delhi to study the strength and deformation behavior of MSW from Delhi landfills as function of composition and operating conditions under both static and dynamic loading conditions.
It has also been reported in the literature (Machado et al. 2002, Bray et al. 2009, Lee 2007 and Seo 2009) that the mechanical response of MSW depends to significant extent on the soil and soil-like fraction (MSW paste). However there is no standard protocol to consider the maximum size limit below which it can be considered as soil and soil-like fraction. Some researcher like Zekkos 2005 consider minus 20 mm fraction to be soil and soil-like material.
In the present paper, the results of static cone penetration tests (CPT) conducted at the closed phase of Gazipur landfill, Delhi are presented. The mechanical response of soil and soil-like fraction (minus 20 mm fraction) of degraded MSW, collected at the location where CPT was conducted, in large direct shear is also described.
ABOUT GAZIPUR SANITARY LANDFILL The Gazipur sanitary landfill, situated on NH-24 near Gazipur Dairy Farm, covers an area of about 70 acres (approx. 283578.21 m2). The site is surrounded by Fish, Egg and Poultry markets on the northern side, Hindon Canal on the eastern side, habitation on southern side and Gazipur Dairy Farm on the western side (Figure 3) with the approximate GPS coordinates of 28°37′28.45′′ N and 77°19′39.05′′ E (as viewed on Google Earth). The site was started in the year of 1984 for disposal of MSW with bottom level being at about 3 m below the general ground level and it has no liner at the bottom. At present about 2600 Metric Tones of waste is being received daily on this site from Shahdara South, Shahdara North, NDMC, Slaughter House Ghazipur, Partly from City Zone, Sadar Pahargunj Zone. Tipping over method of disposal is being practiced at this site and other landfill sites in Delhi. Compaction of dumped waste is carried out through a leveling dozer during tipping of MSW over slopes and by tipping vehicles. The total height of the landfill, at present, is about 44 m from the ground level of the adjacent Dairy Farm (Western side) and about 42 m from the road level at poultry market (Northern side). The slopes of the landfill were observed to be varying from about 38 for tall heights (9 m to 13 m) to about 70 for short height slopes (2m to 5 m).
Fig 3: Gazipur sanitary landfill and its surrounds as on 24th January, 2012 (Source: Google Earth) and typical view of slopes (right side picture)
STATIC CONE PENETRATION TESTING
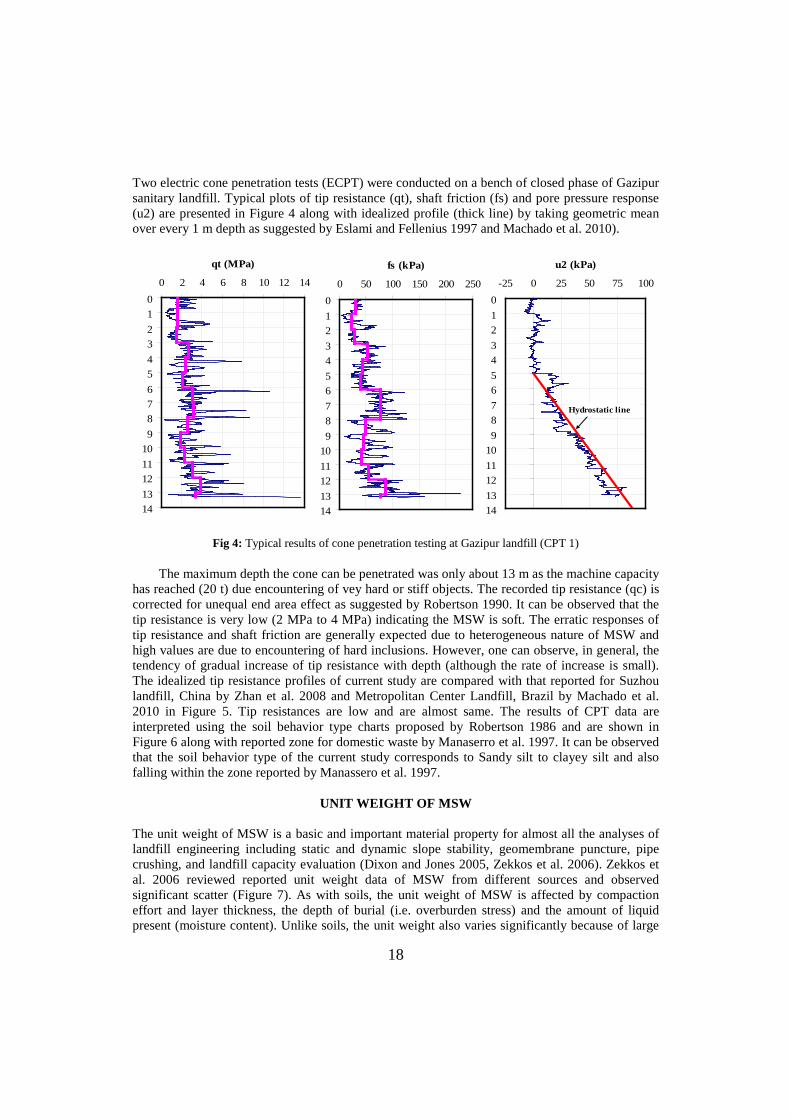
18
Two electric cone penetration tests (ECPT) were conducted on a bench of closed phase of Gazipur sanitary landfill. Typical plots of tip resistance (qt), shaft friction (fs) and pore pressure response (u2) are presented in Figure 4 along with idealized profile (thick line) by taking geometric mean over every 1 m depth as suggested by Eslami and Fellenius 1997 and Machado et al. 2010).
Fig 4: Typical results of cone penetration testing at Gazipur landfill (CPT 1)
The maximum depth the cone can be penetrated was only about 13 m as the machine capacity has reached (20 t) due encountering of vey hard or stiff objects. The recorded tip resistance (qc) is corrected for unequal end area effect as suggested by Robertson 1990. It can be observed that the tip resistance is very low (2 MPa to 4 MPa) indicating the MSW is soft. The erratic responses of tip resistance and shaft friction are generally expected due to heterogeneous nature of MSW and high values are due to encountering of hard inclusions. However, one can observe, in general, the tendency of gradual increase of tip resistance with depth (although the rate of increase is small). The idealized tip resistance profiles of current study are compared with that reported for Suzhou landfill, China by Zhan et al. 2008 and Metropolitan Center Landfill, Brazil by Machado et al. 2010 in Figure 5. Tip resistances are low and are almost same. The results of CPT data are interpreted using the soil behavior type charts proposed by Robertson 1986 and are shown in Figure 6 along with reported zone for domestic waste by Manaserro et al. 1997. It can be observed that the soil behavior type of the current study corresponds to Sandy silt to clayey silt and also falling within the zone reported by Manassero et al. 1997.
UNIT WEIGHT OF MSW The unit weight of MSW is a basic and important material property for almost all the analyses of landfill engineering including static and dynamic slope stability, geomembrane puncture, pipe crushing, and landfill capacity evaluation (Dixon and Jones 2005, Zekkos et al. 2006). Zekkos et al. 2006 reviewed reported unit weight data of MSW from different sources and observed significant scatter (Figure 7). As with soils, the unit weight of MSW is affected by compaction effort and layer thickness, the depth of burial (i.e. overburden stress) and the amount of liquid present (moisture content). Unlike soils, the unit weight also varies significantly because of large
0123456789
1011121314
0 2 4 6 8 10 12 14
qt (MPa)
0123456789
1011121314
0 50 100 150 200 250
fs (kPa)
0123456789
1011121314
-25 0 25 50 75 100
u2 (kPa)
Hydrostatic line
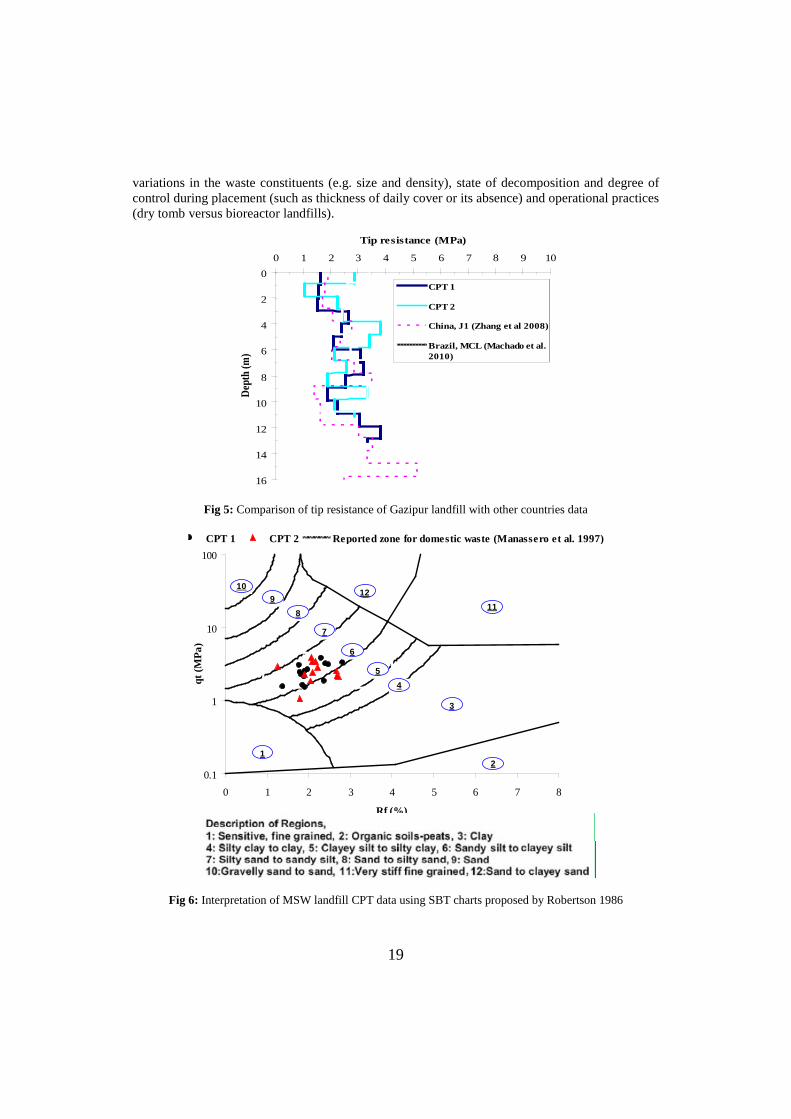
19
variations in the waste constituents (e.g. size and density), state of decomposition and degree of control during placement (such as thickness of daily cover or its absence) and operational practices (dry tomb versus bioreactor landfills).
Fig 5: Comparison of tip resistance of Gazipur landfill with other countries data
Fig 6: Interpretation of MSW landfill CPT data using SBT charts proposed by Robertson 1986
0
2
4
6
8
10
12
14
16
0 1 2 3 4 5 6 7 8 9 10
Tip resistance (MPa)De
pth
(m)
CPT 1
CPT 2
China, J1 (Zhang et al 2008)
Brazil, MCL (Machado et al.2010)
0.1
1
10
100
0 1 2 3 4 5 6 7 8
Rf (%)
qt (M
Pa)
CPT 1 CPT 2 Reported zone for domestic waste (Manassero et al. 1997)
8
7
54
6
109
3
21
1211
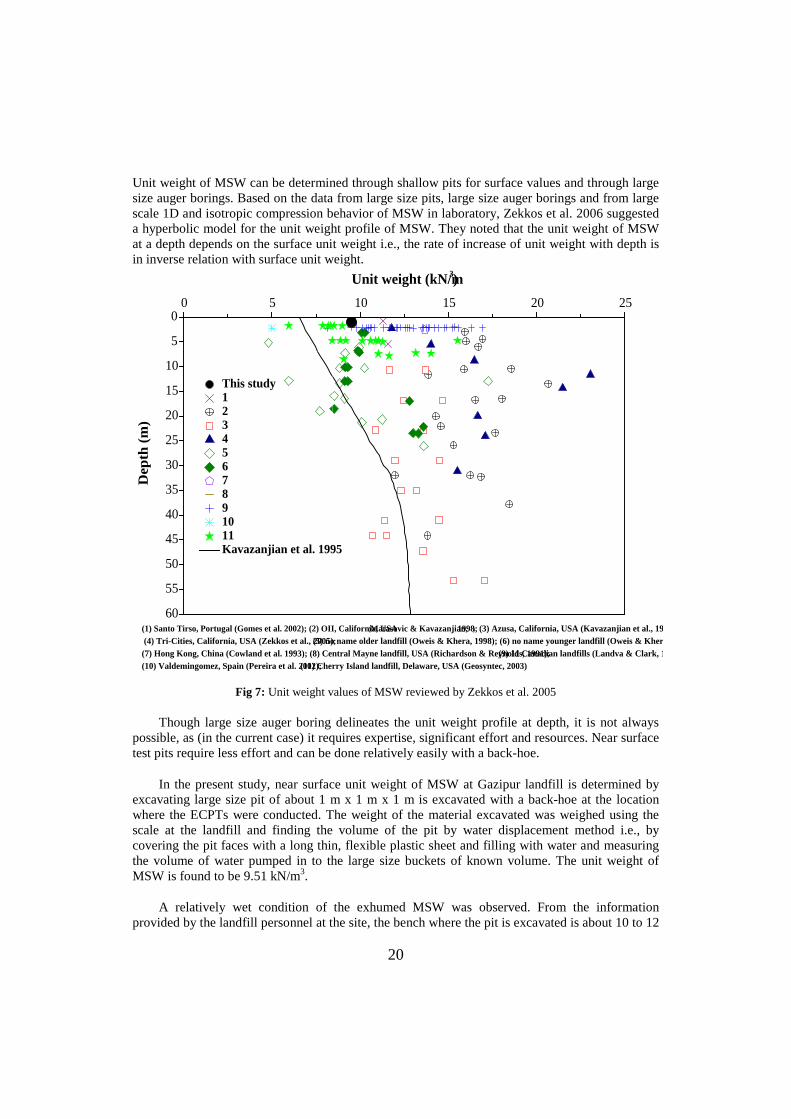
20
Unit weight of MSW can be determined through shallow pits for surface values and through large size auger borings. Based on the data from large size pits, large size auger borings and from large scale 1D and isotropic compression behavior of MSW in laboratory, Zekkos et al. 2006 suggested a hyperbolic model for the unit weight profile of MSW. They noted that the unit weight of MSW at a depth depends on the surface unit weight i.e., the rate of increase of unit weight with depth is in inverse relation with surface unit weight.
Fig 7: Unit weight values of MSW reviewed by Zekkos et al. 2005
Though large size auger boring delineates the unit weight profile at depth, it is not always possible, as (in the current case) it requires expertise, significant effort and resources. Near surface test pits require less effort and can be done relatively easily with a back-hoe.
In the present study, near surface unit weight of MSW at Gazipur landfill is determined by excavating large size pit of about 1 m x 1 m x 1 m is excavated with a back-hoe at the location where the ECPTs were conducted. The weight of the material excavated was weighed using the scale at the landfill and finding the volume of the pit by water displacement method i.e., by covering the pit faces with a long thin, flexible plastic sheet and filling with water and measuring the volume of water pumped in to the large size buckets of known volume. The unit weight of MSW is found to be 9.51 kN/m3.
A relatively wet condition of the exhumed MSW was observed. From the information provided by the landfill personnel at the site, the bench where the pit is excavated is about 10 to 12
0 5 10 15 20 250
5
10
15
20
25
30
35
40
45
50
55
60
This study 1 2 3 4 5 6 7 8 9 10 11 Kavazanjian et al. 1995
Dep
th (m
)
Unit weight (kN/m3)
(1) Santo Tirso, Portugal (Gomes et al. 2002); (2) OII, California, USA (Matasovic & Kavazanjian, 1998); (3) Azusa, California, USA (Kavazanjian et al., 1996); (4) Tri-Cities, California, USA (Zekkos et al., 2005); (5) no name older landfill (Oweis & Khera, 1998); (6) no name younger landfill (Oweis & Khera, 1998); (7) Hong Kong, China (Cowland et al. 1993); (8) Central Mayne landfill, USA (Richardson & Reynolds, 1991); (9) 11 Canadian landfills (Landva & Clark, 1986); (10) Valdemingomez, Spain (Pereira et al. 2002); (11) Cherry Island landfill, Delaware, USA (Geosyntec, 2003)
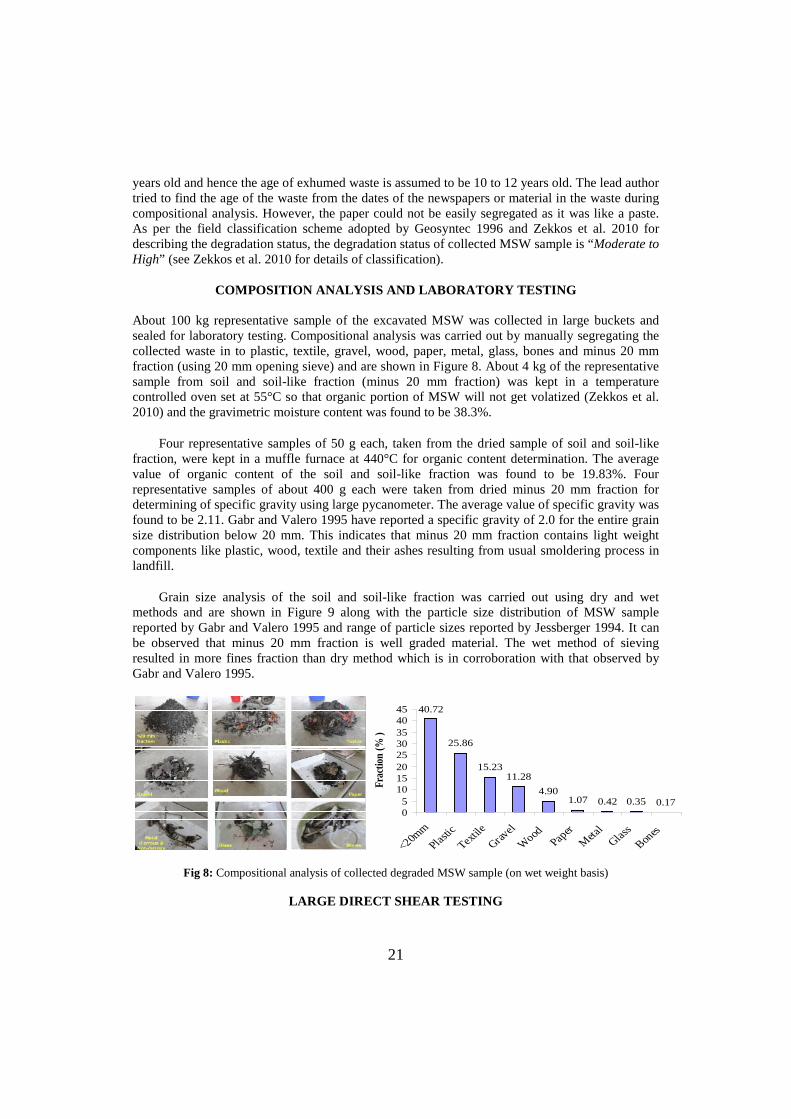
21
years old and hence the age of exhumed waste is assumed to be 10 to 12 years old. The lead author tried to find the age of the waste from the dates of the newspapers or material in the waste during compositional analysis. However, the paper could not be easily segregated as it was like a paste. As per the field classification scheme adopted by Geosyntec 1996 and Zekkos et al. 2010 for describing the degradation status, the degradation status of collected MSW sample is “Moderate to High” (see Zekkos et al. 2010 for details of classification).
COMPOSITION ANALYSIS AND LABORATORY TESTING About 100 kg representative sample of the excavated MSW was collected in large buckets and sealed for laboratory testing. Compositional analysis was carried out by manually segregating the collected waste in to plastic, textile, gravel, wood, paper, metal, glass, bones and minus 20 mm fraction (using 20 mm opening sieve) and are shown in Figure 8. About 4 kg of the representative sample from soil and soil-like fraction (minus 20 mm fraction) was kept in a temperature controlled oven set at 55°C so that organic portion of MSW will not get volatized (Zekkos et al. 2010) and the gravimetric moisture content was found to be 38.3%.
Four representative samples of 50 g each, taken from the dried sample of soil and soil-like fraction, were kept in a muffle furnace at 440°C for organic content determination. The average value of organic content of the soil and soil-like fraction was found to be 19.83%. Four representative samples of about 400 g each were taken from dried minus 20 mm fraction for determining of specific gravity using large pycanometer. The average value of specific gravity was found to be 2.11. Gabr and Valero 1995 have reported a specific gravity of 2.0 for the entire grain size distribution below 20 mm. This indicates that minus 20 mm fraction contains light weight components like plastic, wood, textile and their ashes resulting from usual smoldering process in landfill.
Grain size analysis of the soil and soil-like fraction was carried out using dry and wet methods and are shown in Figure 9 along with the particle size distribution of MSW sample reported by Gabr and Valero 1995 and range of particle sizes reported by Jessberger 1994. It can be observed that minus 20 mm fraction is well graded material. The wet method of sieving resulted in more fines fraction than dry method which is in corroboration with that observed by Gabr and Valero 1995.
Fig 8: Compositional analysis of collected degraded MSW sample (on wet weight basis)
LARGE DIRECT SHEAR TESTING
40.72
25.86
15.2311.28
4.901.07 0.42 0.35 0.17
05
1015202530354045
<20mm
Plastic
Textile
Gravel
WoodPaper
Metal
Glass
Bones
Frac
tion
(% )
40.72
25.86
15.2311.28
4.901.07 0.42 0.35 0.17
05
1015202530354045
<20mm
Plastic
Textile
Gravel
WoodPaper
Metal
Glass
Bones
Frac
tion
(% )
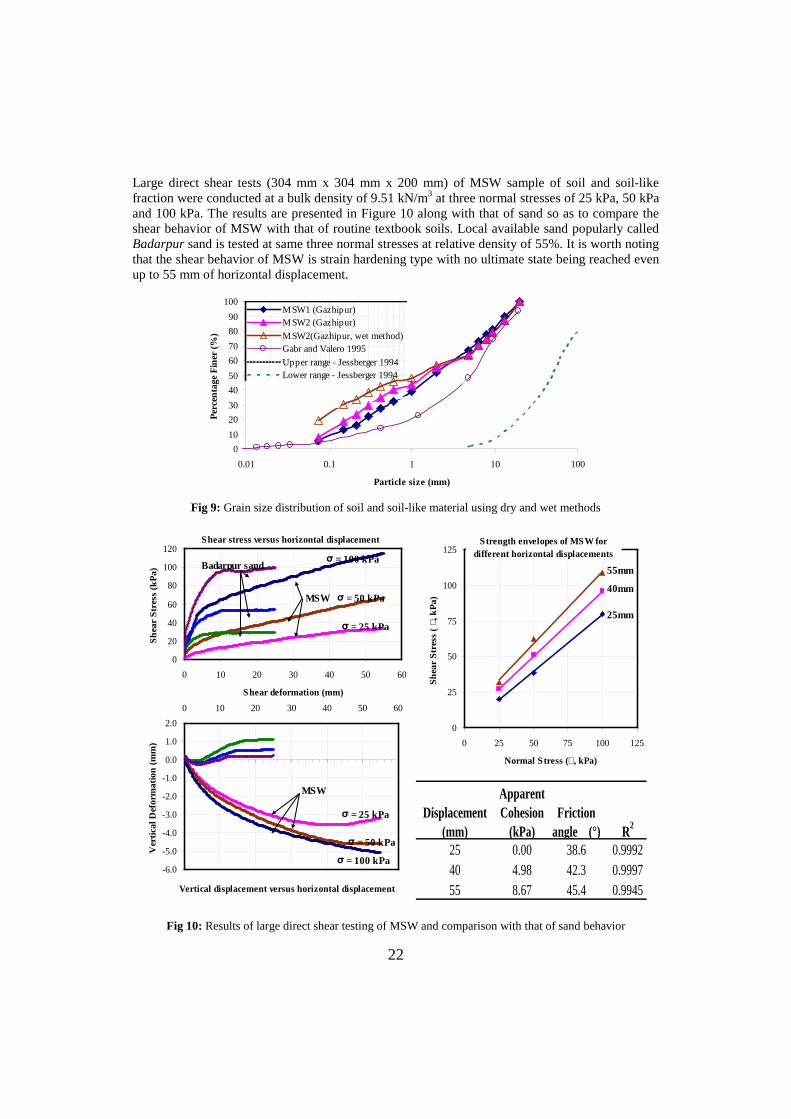
22
Large direct shear tests (304 mm x 304 mm x 200 mm) of MSW sample of soil and soil-like fraction were conducted at a bulk density of 9.51 kN/m3 at three normal stresses of 25 kPa, 50 kPa and 100 kPa. The results are presented in Figure 10 along with that of sand so as to compare the shear behavior of MSW with that of routine textbook soils. Local available sand popularly called Badarpur sand is tested at same three normal stresses at relative density of 55%. It is worth noting that the shear behavior of MSW is strain hardening type with no ultimate state being reached even up to 55 mm of horizontal displacement.
Fig 9: Grain size distribution of soil and soil-like material using dry and wet methods
Fig 10: Results of large direct shear testing of MSW and comparison with that of sand behavior
0102030405060708090
100
0.01 0.1 1 10 100
Particle size (mm)
Perc
enta
ge F
iner
(%)
MSW1 (Gazhipur)MSW2 (Gazhipur)MSW2(Gazhipur, wet method)Gabr and Valero 1995Upper range - Jessberger 1994Lower range - Jessberger 1994
0
20
40
60
80
100
120
0 10 20 30 40 50 60
Shear deformation (mm)
Shea
r St
ress
(kPa
)
σ = 25 kPa
σ = 50 kPa
σ = 100 kPaBadarpur sand
MSW
Shear stress versus horizontal displacement
-6.0
-5.0
-4.0
-3.0
-2.0
-1.0
0.0
1.0
2.00 10 20 30 40 50 60
Ver
tical
Def
orm
atio
n (m
m)
σ = 25 kPa
σ = 50 kPa
σ = 100 kPa
MSW
Vertical displacement versus horizontal displacement
0
25
50
75
100
125
0 25 50 75 100 125
Normal Stress (s, kPa)
Shea
r St
ress
(s ,
kPa
)
25mm
40mm
55mm
Strength envelopes of MSW for different horizontal displacements
Displacement (mm)
Apparent Cohesion
(kPa)Friction
angle (°) R2
25 0.00 38.6 0.999240 4.98 42.3 0.999755 8.67 45.4 0.9945
23
It has been a routing practice in geotechnical engineering to develop the strength parameters of strain hardening type materials based on permissible deformation criteria (serviceability criteria). The results of shear parameters developed for different horizontal displacements are in Figure 10. It can be observed that the apparent cohesion starts mobilizing as the shear displacement is increasing as the reinforcing materials like soft plastic, textile etc., present in MSW develop tension and contributing to shear strength of MSW just like behavior of fiber reinforced soils (Gray and Ohashi 1983).
The results presented here are to be considered as preliminary results only. Systematic study of the various parameters like density, moisture content, size effect, stress state effects on the strength and stiffness behavior of MSW are in progress and will be disseminated as and when completed through various publications. Interested readers are encouraged to refer to them.
ACKNOWLEDGEMENTS
The financial support by Geosciences/Seismology Division, Ministry of Earth Sciences through research scheme (MoES/P.O.(Seismo)/1(88)/2010) is greatly acknowledged. The support from Municipal Corporation of Delhi during this research work is greatly appreciated. The generous support from Keller Ground Engineering India Pvt Ltd. for cone penetration tests at Gazhipur landfill is greatly appreciated. Mr. Aswini Kumar Verma, former master’s student of IIT Delhi, has assisted the research team during field investigations. References Blight, G.E. (2004) A flow failure in a municipal solid waste landfill – the failure at Bulbul, South
Africa. In: The Skempton Conference: Advances in Geotechnical Engineering, 2, pp. 777–788. Thomas Telford, London, UK.
Blight, G. (2008). Slope failures in municipal solid waste dumps and landfills: a review. Waste Management & Research, 26, 448-463.
Boutwell, G.P. (2002). Slides happen - landfill stability analysis. The 2002 Aleksandra Vesic memorial lecture, North Carolina section ASCE, Wrightsville Beach, NC, October 3, 2002 (http://geosynthetica.net/tech_docs/KoernerSympGordonBoutwell.pdf , accessed on 20thOctober 2009).
Caicedo, B., Giraldo, E. and Yamin, L. (2002). The landslide of Dona Juana landfill in Bogota. A case study. In: de Mello, L.G. & Almeida, M. (eds.): Environmental Geotechnics (4th ICEG), vol. 1, pp. 171–175. Balkema, Lisse, The Netherlands.
Dixon, N. and Jones, D.R.V. (2005). Engineering properties of municipal solid waste. Geotext. Geomemb. 23, 205-233.
DPCC (2010). Municipal Solid Waste Management in Delhi, Delhi Pollution Control Committee (DPCC), (http://dpcc.delhigovt.nic.in/waste-msw.html) accessed on 6th September, 2010.
Eid, H.T., Stark, T.D., Evans, W. D. and Sherry, P. E. (2000). Municipal solid waste slope failure-I: Waste and foundation soil properties. J. Geotech. Geoenviron. Eng., 126, 397-407.
Gabr, M.A., and Valero, S.N. (1995). Geotechnical properties of municipal solid waste. Geotech. Test. J., 18, 241–254.
Gandolla, M., Grabner, E. and Leoni, R. (1979) Stabilitätsprobleme bei nicht verdichteten Deponien am Beispiel Sarajevo (Jugoslawien) (Stability problems with an uncompacted waste deposit). ISWA Journal, 28/29, 5–11.
Geosyntec. (1996). Waste mass field investigation, Operating Industries Inc. landfill, Monterey Park, California. Rep. No. SWP-2, Geosyntec Consultants, Huntington Beach, Calif.
Gray, D. H., and Ohashi, H. (1983). Mechanics of fiber reinforcement in sand. J. Geotech. Geoenviron. Eng., 109, 335-353.
24
Kavazanjian, E., Jr., Matasovic, N., Bonaparte, R. and Schmertmann, G.R. (1995). Evaluation of MSW properties for seismic analysis. Geoenvironment 2000, ASCE Geotechnical Special Publication # 46, 2, 126-141.
Kocasoy, G. and Curi, K. (1995). The Ümraniye-Hekimbashi open dump accident. Waste Management & Research, 13, 305–314.
Koelsch, F., Fricke, K., Mahler, C. and Damanhuri, E. (2005). Stability of landfills – the Bandung dumpsite disaster. In Proc. Sardinia 2005, Tenth International Waste Management and Landfill Symposium, Cagliari, Italy, 21-29.
Kumar, D. and Alappat, B.J. (2003). Monitoring Leachate Composition at a Municipal Landfill Site in New Delhi, India. Int. J. of Environment and Pollution, 19, 454-465.
Landva, A. and Clark, J.I. (1990). Geotechnics of waste fills. Geotechnics of Waste Fills—Theory and Practice, (Landva, A. and Knowles, G.D. eds.), pp. 86–106, ASTM STP 1070, Philadelphia.
Merry, S.M., Kavazanjian, E.Jr. and Fritz, W.U. (2005). Reconnaissance of the July 10, 2000, Payatas landfill failure. J. Performance of Constructed Facilities, 19, 100-107.
Mitchell, R.A. and Mitchell, J.K. (1992). Stability Evaluation of Waste Landfill. Stability and Performance of Slope and Embankments-II, ASCE Geotechnical Special Publication # 31, pp. 915-930.
Pelkey, S.A., Valsangkar, A.J. and Landva, A. (2001). Shear displacement dependent strength of municipal solid waste and its major constituents. ASTM Geotech. Test. J.,381-390.
Robertson, P.K., Campanella, R.G., Gillespie, D., Grieg, J., (1986). Use of piezometer cone data. In: Clemence, S. (Ed.), Proc. ASCE, In-Situ’86 Specialty Conference, Blacksburg, June 23–25. Geotechnical Special Publication # 6, 1263–1280.
Roberston, P.K. (1990). Soil classification using cone penetration test. Canadian Geotechnical J., 27,151-158.
Shallen, S. and Sunnel, P. (2001). Solid waste management in India: Status and future directions. TERI Information Monitor on Environmental Science, 6, 1-4.
Zhan, T.L.T., Chen, Y.M. and Ling, W.A. (2008). Shear strength characterization of municipal solid waste at the Suzhou landfill, China. J. Eng. Geology, 97, 97-111.
Zekkos, D., Bray, J.D., Kavazanjian Jr., E., Matasovic, N., Rathje, E.M., Riemer, M.F. and Stokoe, K .H. (2006). Unit weight of municipal solid-waste. J. Geotech. Geoenviron.Eng., 132, 1250–1261.
Zekkos, D., Kavazanjian, E.Jr., Bray, J.D., Matasovic, N. and Riemer, M.F. (2010). Physical Characterization of Municipal Solid Waste for Geotechnical Purposes, J. Geotech. Geoenviron.Eng., 136, 1231-1241.
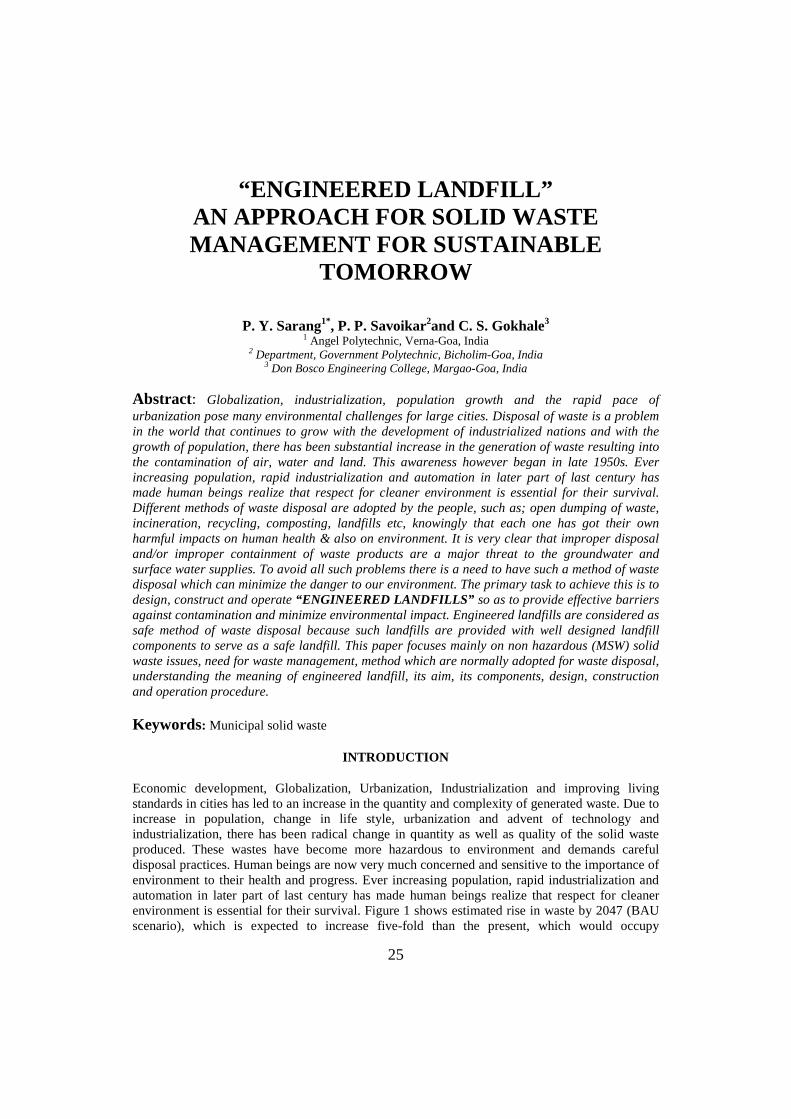
25
“ENGINEERED LANDFILL” AN APPROACH FOR SOLID WASTE MANAGEMENT FOR SUSTAINABLE
TOMORROW
P. Y. Sarang1*, P. P. Savoikar2and C. S. Gokhale3 1 Angel Polytechnic, Verna-Goa, India
2 Department, Government Polytechnic, Bicholim-Goa, India 3 Don Bosco Engineering College, Margao-Goa, India
Abstract: Globalization, industrialization, population growth and the rapid pace of urbanization pose many environmental challenges for large cities. Disposal of waste is a problem in the world that continues to grow with the development of industrialized nations and with the growth of population, there has been substantial increase in the generation of waste resulting into the contamination of air, water and land. This awareness however began in late 1950s. Ever increasing population, rapid industrialization and automation in later part of last century has made human beings realize that respect for cleaner environment is essential for their survival. Different methods of waste disposal are adopted by the people, such as; open dumping of waste, incineration, recycling, composting, landfills etc, knowingly that each one has got their own harmful impacts on human health & also on environment. It is very clear that improper disposal and/or improper containment of waste products are a major threat to the groundwater and surface water supplies. To avoid all such problems there is a need to have such a method of waste disposal which can minimize the danger to our environment. The primary task to achieve this is to design, construct and operate “ENGINEERED LANDFILLS” so as to provide effective barriers against contamination and minimize environmental impact. Engineered landfills are considered as safe method of waste disposal because such landfills are provided with well designed landfill components to serve as a safe landfill. This paper focuses mainly on non hazardous (MSW) solid waste issues, need for waste management, method which are normally adopted for waste disposal, understanding the meaning of engineered landfill, its aim, its components, design, construction and operation procedure.
Keywords: Municipal solid waste
INTRODUCTION
Economic development, Globalization, Urbanization, Industrialization and improving living standards in cities has led to an increase in the quantity and complexity of generated waste. Due to increase in population, change in life style, urbanization and advent of technology and industrialization, there has been radical change in quantity as well as quality of the solid waste produced. These wastes have become more hazardous to environment and demands careful disposal practices. Human beings are now very much concerned and sensitive to the importance of environment to their health and progress. Ever increasing population, rapid industrialization and automation in later part of last century has made human beings realize that respect for cleaner environment is essential for their survival. Figure 1 shows estimated rise in waste by 2047 (BAU scenario), which is expected to increase five-fold than the present, which would occupy
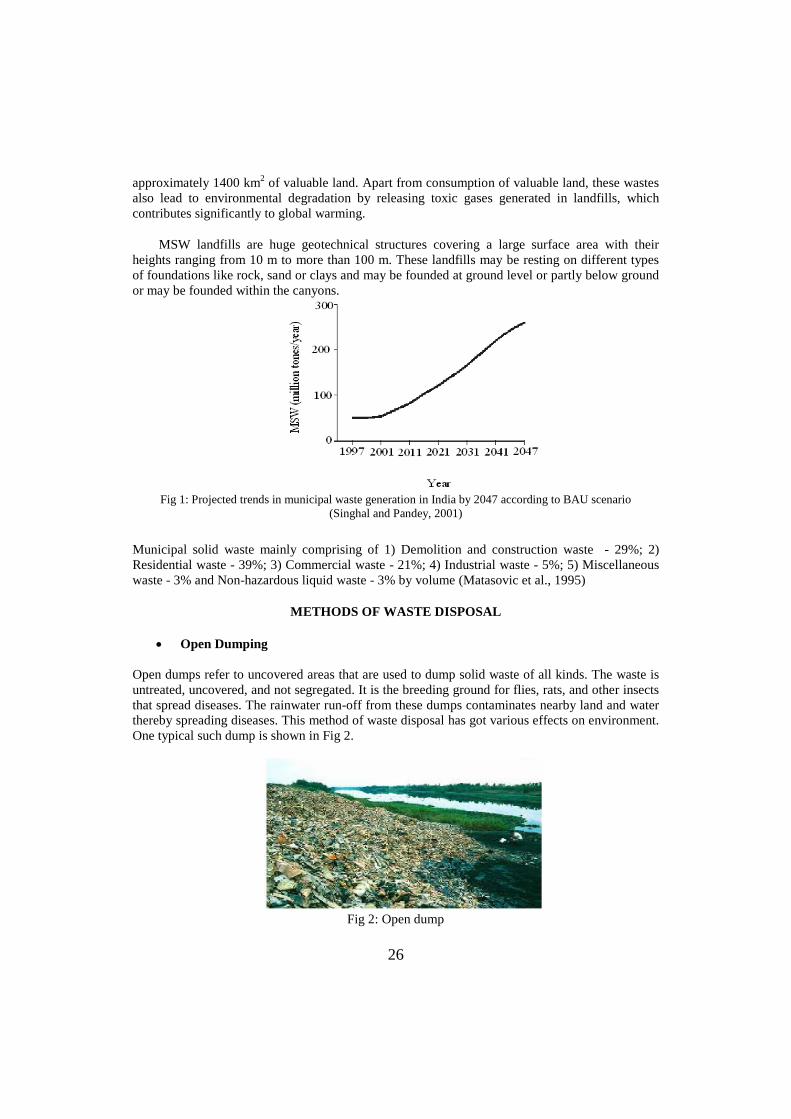
26
approximately 1400 km2 of valuable land. Apart from consumption of valuable land, these wastes also lead to environmental degradation by releasing toxic gases generated in landfills, which contributes significantly to global warming.
MSW landfills are huge geotechnical structures covering a large surface area with their heights ranging from 10 m to more than 100 m. These landfills may be resting on different types of foundations like rock, sand or clays and may be founded at ground level or partly below ground or may be founded within the canyons.
Fig 1: Projected trends in municipal waste generation in India by 2047 according to BAU scenario
(Singhal and Pandey, 2001)
Municipal solid waste mainly comprising of 1) Demolition and construction waste - 29%; 2) Residential waste - 39%; 3) Commercial waste - 21%; 4) Industrial waste - 5%; 5) Miscellaneous waste - 3% and Non-hazardous liquid waste - 3% by volume (Matasovic et al., 1995)
METHODS OF WASTE DISPOSAL
• Open Dumping
Open dumps refer to uncovered areas that are used to dump solid waste of all kinds. The waste is untreated, uncovered, and not segregated. It is the breeding ground for flies, rats, and other insects that spread diseases. The rainwater run-off from these dumps contaminates nearby land and water thereby spreading diseases. This method of waste disposal has got various effects on environment. One typical such dump is shown in Fig 2.
Fig 2: Open dump
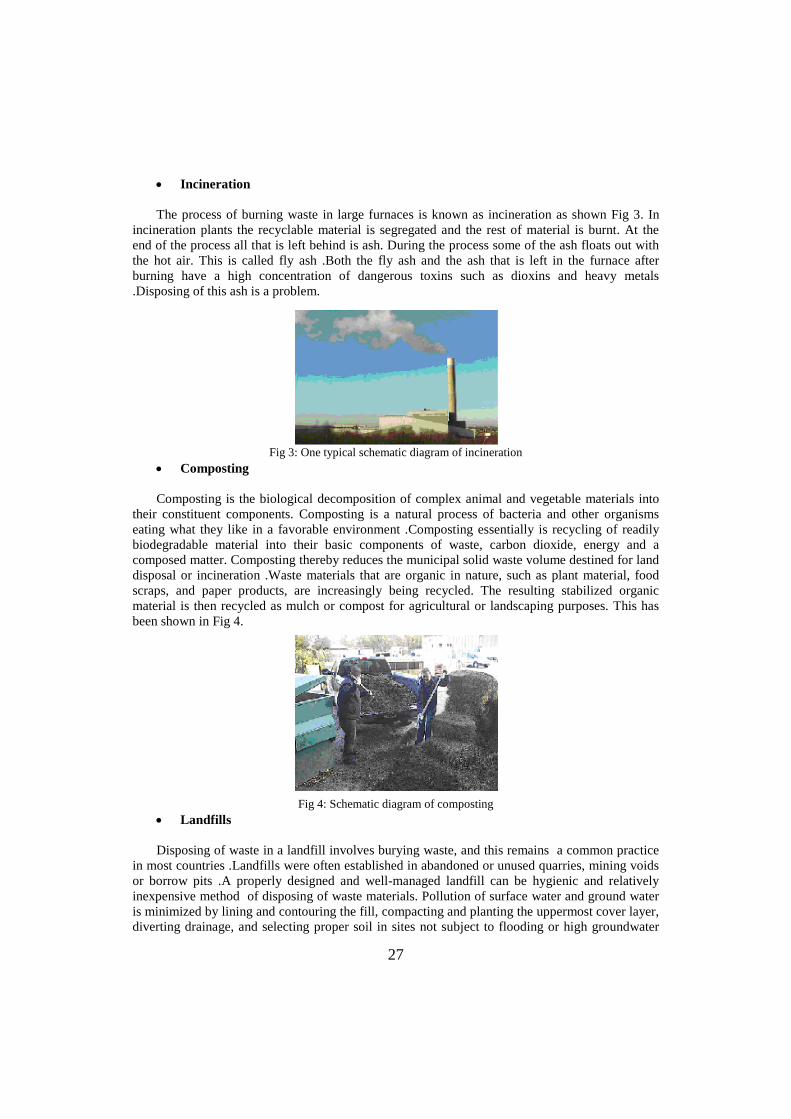
27
• Incineration
The process of burning waste in large furnaces is known as incineration as shown Fig 3. In incineration plants the recyclable material is segregated and the rest of material is burnt. At the end of the process all that is left behind is ash. During the process some of the ash floats out with the hot air. This is called fly ash .Both the fly ash and the ash that is left in the furnace after burning have a high concentration of dangerous toxins such as dioxins and heavy metals .Disposing of this ash is a problem.
Fig 3: One typical schematic diagram of incineration • Composting
Composting is the biological decomposition of complex animal and vegetable materials into their constituent components. Composting is a natural process of bacteria and other organisms eating what they like in a favorable environment .Composting essentially is recycling of readily biodegradable material into their basic components of waste, carbon dioxide, energy and a composed matter. Composting thereby reduces the municipal solid waste volume destined for land disposal or incineration .Waste materials that are organic in nature, such as plant material, food scraps, and paper products, are increasingly being recycled. The resulting stabilized organic material is then recycled as mulch or compost for agricultural or landscaping purposes. This has been shown in Fig 4.
Fig 4: Schematic diagram of composting • Landfills
Disposing of waste in a landfill involves burying waste, and this remains a common practice in most countries .Landfills were often established in abandoned or unused quarries, mining voids or borrow pits .A properly designed and well-managed landfill can be hygienic and relatively inexpensive method of disposing of waste materials. Pollution of surface water and ground water is minimized by lining and contouring the fill, compacting and planting the uppermost cover layer, diverting drainage, and selecting proper soil in sites not subject to flooding or high groundwater
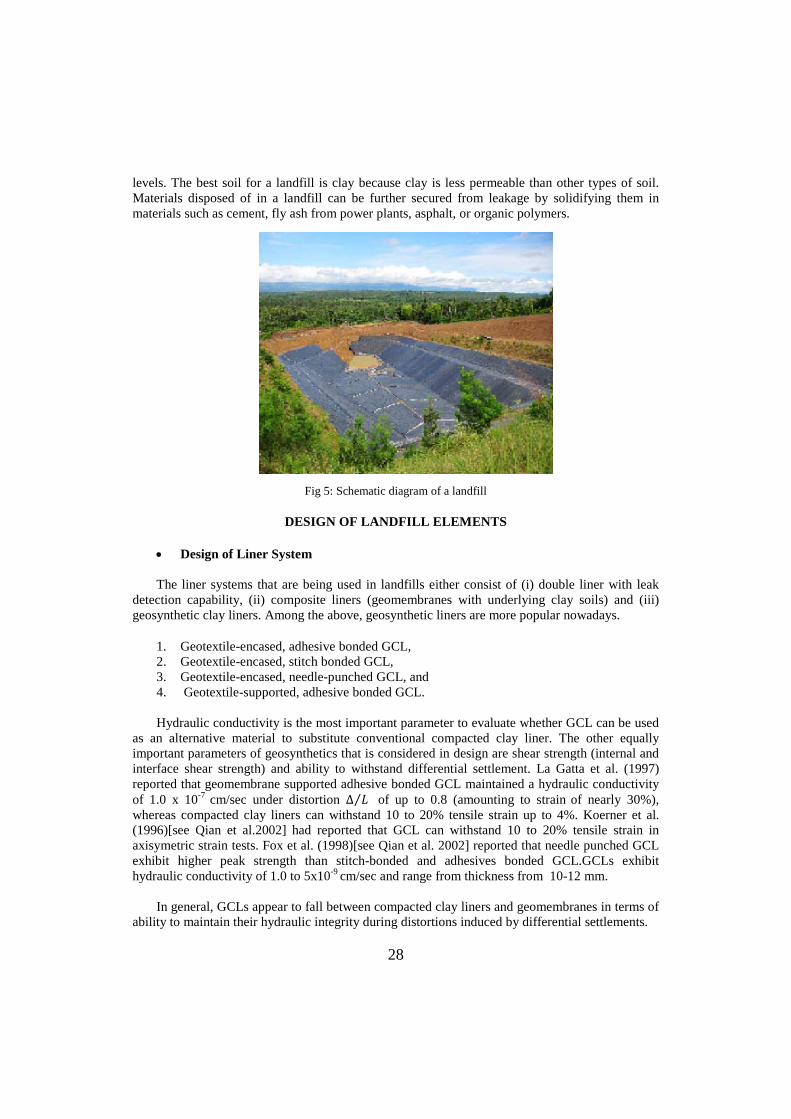
28
levels. The best soil for a landfill is clay because clay is less permeable than other types of soil. Materials disposed of in a landfill can be further secured from leakage by solidifying them in materials such as cement, fly ash from power plants, asphalt, or organic polymers.
Fig 5: Schematic diagram of a landfill
DESIGN OF LANDFILL ELEMENTS
• Design of Liner System
The liner systems that are being used in landfills either consist of (i) double liner with leak detection capability, (ii) composite liners (geomembranes with underlying clay soils) and (iii) geosynthetic clay liners. Among the above, geosynthetic liners are more popular nowadays.
1. Geotextile-encased, adhesive bonded GCL, 2. Geotextile-encased, stitch bonded GCL, 3. Geotextile-encased, needle-punched GCL, and 4. Geotextile-supported, adhesive bonded GCL.
Hydraulic conductivity is the most important parameter to evaluate whether GCL can be used
as an alternative material to substitute conventional compacted clay liner. The other equally important parameters of geosynthetics that is considered in design are shear strength (internal and interface shear strength) and ability to withstand differential settlement. La Gatta et al. (1997) reported that geomembrane supported adhesive bonded GCL maintained a hydraulic conductivity of 1.0 x 10⁻⁷ cm/sec under distortion ∆ 𝐿𝐿⁄ of up to 0.8 (amounting to strain of nearly 30%), whereas compacted clay liners can withstand 10 to 20% tensile strain up to 4%. Koerner et al. (1996)[see Qian et al.2002] had reported that GCL can withstand 10 to 20% tensile strain in axisymetric strain tests. Fox et al. (1998)[see Qian et al. 2002] reported that needle punched GCL exhibit higher peak strength than stitch-bonded and adhesives bonded GCL.GCLs exhibit hydraulic conductivity of 1.0 to 5x10⁻⁹ cm/sec and range from thickness from 10-12 mm.
In general, GCLs appear to fall between compacted clay liners and geomembranes in terms of
ability to maintain their hydraulic integrity during distortions induced by differential settlements.
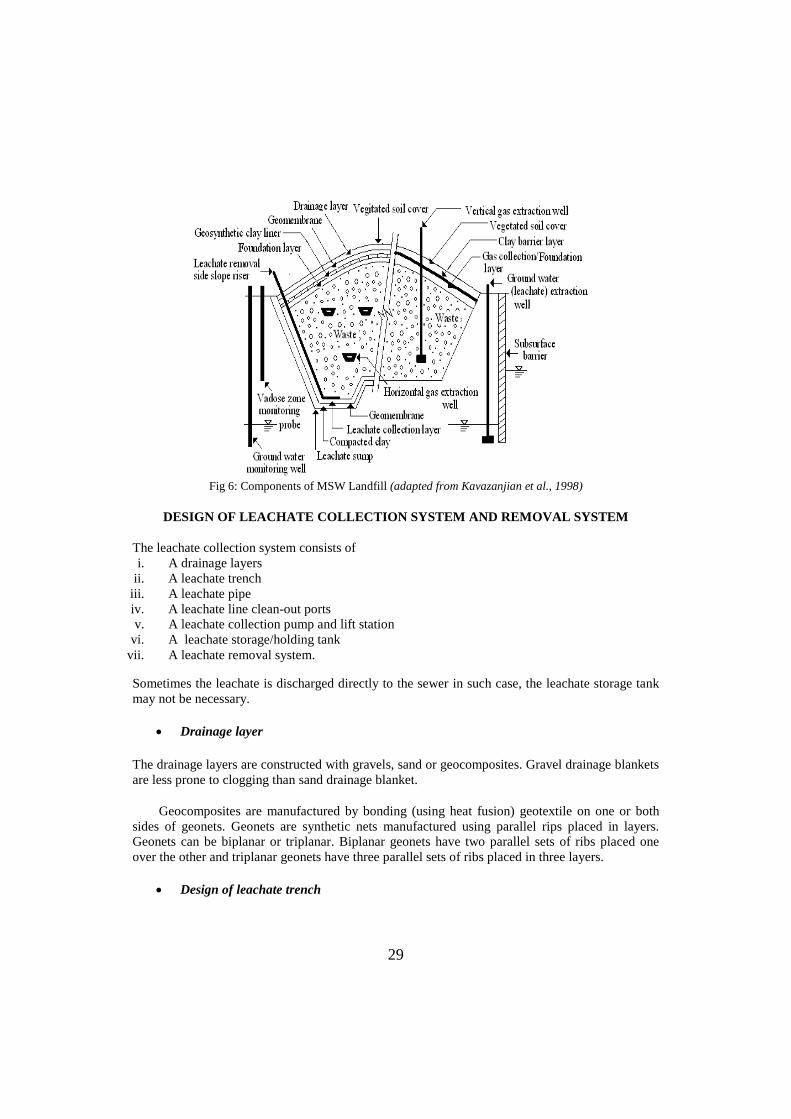
29
Fig 6: Components of MSW Landfill (adapted from Kavazanjian et al., 1998)
DESIGN OF LEACHATE COLLECTION SYSTEM AND REMOVAL SYSTEM
The leachate collection system consists of i. A drainage layers
ii. A leachate trench iii. A leachate pipe iv. A leachate line clean-out ports v. A leachate collection pump and lift station
vi. A leachate storage/holding tank vii. A leachate removal system.
Sometimes the leachate is discharged directly to the sewer in such case, the leachate storage tank may not be necessary.
• Drainage layer
The drainage layers are constructed with gravels, sand or geocomposites. Gravel drainage blankets are less prone to clogging than sand drainage blanket.
Geocomposites are manufactured by bonding (using heat fusion) geotextile on one or both sides of geonets. Geonets are synthetic nets manufactured using parallel rips placed in layers. Geonets can be biplanar or triplanar. Biplanar geonets have two parallel sets of ribs placed one over the other and triplanar geonets have three parallel sets of ribs placed in three layers.
• Design of leachate trench
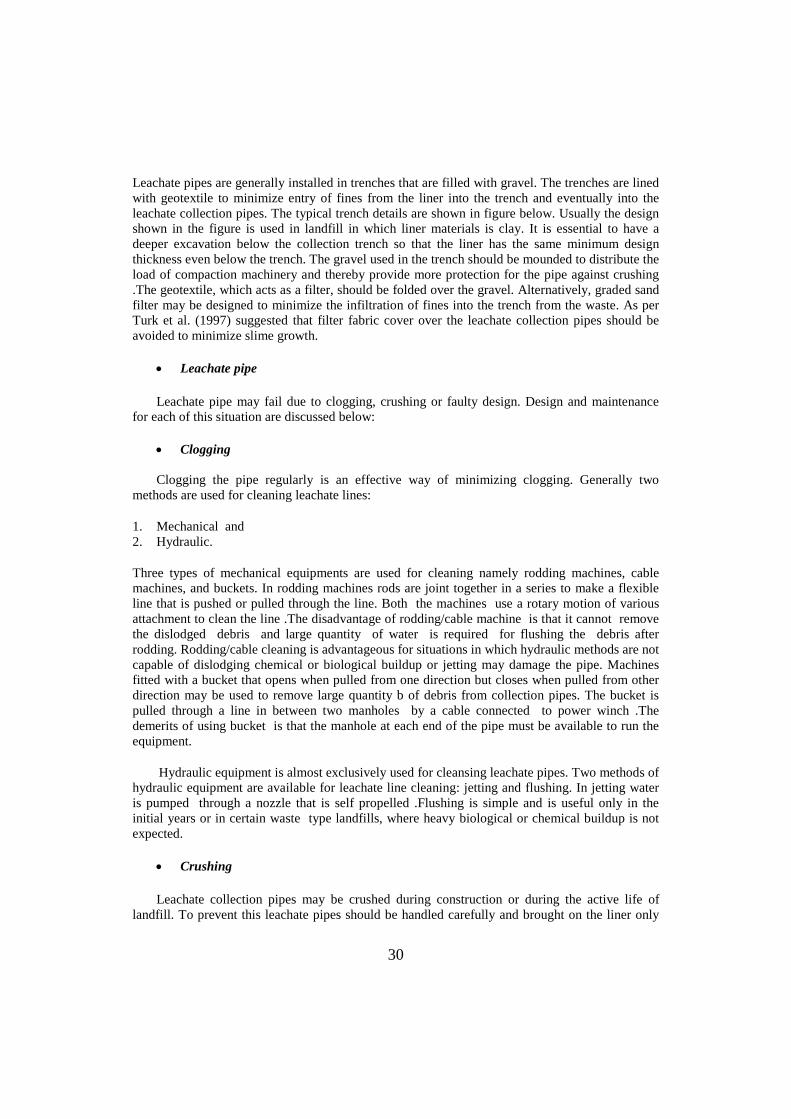
30
Leachate pipes are generally installed in trenches that are filled with gravel. The trenches are lined with geotextile to minimize entry of fines from the liner into the trench and eventually into the leachate collection pipes. The typical trench details are shown in figure below. Usually the design shown in the figure is used in landfill in which liner materials is clay. It is essential to have a deeper excavation below the collection trench so that the liner has the same minimum design thickness even below the trench. The gravel used in the trench should be mounded to distribute the load of compaction machinery and thereby provide more protection for the pipe against crushing .The geotextile, which acts as a filter, should be folded over the gravel. Alternatively, graded sand filter may be designed to minimize the infiltration of fines into the trench from the waste. As per Turk et al. (1997) suggested that filter fabric cover over the leachate collection pipes should be avoided to minimize slime growth.
• Leachate pipe
Leachate pipe may fail due to clogging, crushing or faulty design. Design and maintenance for each of this situation are discussed below:
• Clogging
Clogging the pipe regularly is an effective way of minimizing clogging. Generally two methods are used for cleaning leachate lines:
1. Mechanical and 2. Hydraulic.
Three types of mechanical equipments are used for cleaning namely rodding machines, cable machines, and buckets. In rodding machines rods are joint together in a series to make a flexible line that is pushed or pulled through the line. Both the machines use a rotary motion of various attachment to clean the line .The disadvantage of rodding/cable machine is that it cannot remove the dislodged debris and large quantity of water is required for flushing the debris after rodding. Rodding/cable cleaning is advantageous for situations in which hydraulic methods are not capable of dislodging chemical or biological buildup or jetting may damage the pipe. Machines fitted with a bucket that opens when pulled from one direction but closes when pulled from other direction may be used to remove large quantity b of debris from collection pipes. The bucket is pulled through a line in between two manholes by a cable connected to power winch .The demerits of using bucket is that the manhole at each end of the pipe must be available to run the equipment.
Hydraulic equipment is almost exclusively used for cleansing leachate pipes. Two methods of hydraulic equipment are available for leachate line cleaning: jetting and flushing. In jetting water is pumped through a nozzle that is self propelled .Flushing is simple and is useful only in the initial years or in certain waste type landfills, where heavy biological or chemical buildup is not expected.
• Crushing
Leachate collection pipes may be crushed during construction or during the active life of landfill. To prevent this leachate pipes should be handled carefully and brought on the liner only
31
when the trench is ready. A pipe can be installed in either a positive or negative projection mode. Usually two types of pipes are used namely PVC and HDPE
• Faulty Design
The bends in the leachate line should be smooth .Cleaning equipment cannot negotiate the sharp bends .Criss-crossing of leachate lines should be avoided. A smoother 450 or lesser bend should be used to facilitate cleaning activities. A minimum number of manholes should be used in a landfill
• Leachate line clean out port
The clean-out pipe must be well guarded at the exit point. A shallow concrete manhole must be constructed to provide additional safety to run over. Usually pipe is laid along the side slope. If it is laid near the vertical slope, a smooth bend should be used to connect it to leachate line.
• Leachate collection pumps and lifts station
The pump capacity must be calculated for proper functioning. In choosing a pump, both section and delivery head must be considered. It should be noted that the density of leachate is somewhat higher then water. Usually automatic submersible pumps are used in lift stations. Positioning of the starting and hut off switches should be such that the pumps are used in lift stations. Positioning of the starting and shut off switches should be such that the pump can run while, frequent start and stop may damage the pump. The shutter switch must be located at least 15 cm below the leachate line entry invert.
• Leachate holding tank
The leachate tank should have enough volume to hold the leachate for the period of 1 to 3 days during the pick leachate production season. Both double wall and single wall leachate holding tank may be used. The holding volume depends on frequency of pumping out and maximum allowable discharge rate to a treatment plant. Arrangement should be made to monitor the inside of encasement .The monitoring well will detect tank leakage at early date. This type of encasement is not needed for double wall tank. Both metallic and non-metallic tanks may be used. The inside of the tank must be coated with suitable material so that leakage does not damage the tank. Tank should be installed properly and should be anchored with the base concrete if the water table is expected to rise above the base level of the tank. The tank trench should be backfilled with gravel or crushed stones (3 to 15 mm size).A manhole is constructed above the tank that houses the pump. The pipe exiting the manhole should be encased in another pipe of larger diameter to provide secondary cont5ainment. Some tankers are equipped with a pump so that the pump in the manhole is not needed. The Capability of the tanker should be checked to find out whether a pump is necessary. A concrete loading pad should be constructed away from the tank. The pad should be sloped towards a slump connected to the tank so that any spill during loading will go back to the tank.
• Leachate removal system
Leachate may be removed either by gravity flow or by using a side slope riser. In the gravity flow type the header pipe connects all the leachate from the landfill, exits through the side. The number
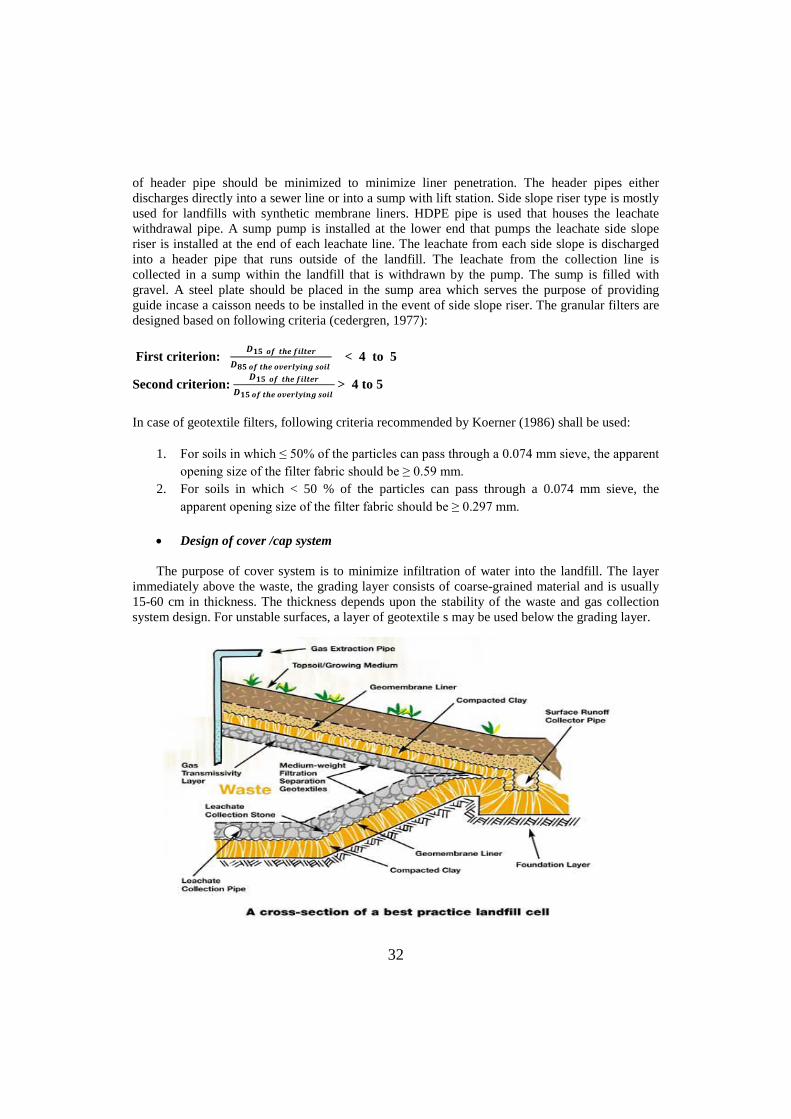
32
of header pipe should be minimized to minimize liner penetration. The header pipes either discharges directly into a sewer line or into a sump with lift station. Side slope riser type is mostly used for landfills with synthetic membrane liners. HDPE pipe is used that houses the leachate withdrawal pipe. A sump pump is installed at the lower end that pumps the leachate side slope riser is installed at the end of each leachate line. The leachate from each side slope is discharged into a header pipe that runs outside of the landfill. The leachate from the collection line is collected in a sump within the landfill that is withdrawn by the pump. The sump is filled with gravel. A steel plate should be placed in the sump area which serves the purpose of providing guide incase a caisson needs to be installed in the event of side slope riser. The granular filters are designed based on following criteria (cedergren, 1977):
First criterion: 𝑫𝑫𝟏𝟏𝟏𝟏 𝒐𝒐𝒐𝒐 𝒕𝒕𝒕𝒕𝒕𝒕 𝒐𝒐𝒇𝒇𝒇𝒇𝒕𝒕𝒕𝒕𝒇𝒇
𝑫𝑫𝟖𝟖𝟏𝟏 𝒐𝒐𝒐𝒐 𝒕𝒕𝒕𝒕𝒕𝒕 𝒐𝒐𝒐𝒐𝒕𝒕𝒇𝒇𝒇𝒇𝒐𝒐𝒇𝒇𝒐𝒐𝒐𝒐 𝒔𝒔𝒐𝒐𝒇𝒇𝒇𝒇 < 4 to 5
Second criterion: 𝑫𝑫𝟏𝟏𝟏𝟏 𝒐𝒐𝒐𝒐 𝒕𝒕𝒕𝒕𝒕𝒕 𝒐𝒐𝒇𝒇𝒇𝒇𝒕𝒕𝒕𝒕𝒇𝒇
𝑫𝑫𝟏𝟏𝟏𝟏 𝒐𝒐𝒐𝒐 𝒕𝒕𝒕𝒕𝒕𝒕 𝒐𝒐𝒐𝒐𝒕𝒕𝒇𝒇𝒇𝒇𝒐𝒐𝒇𝒇𝒐𝒐𝒐𝒐 𝒔𝒔𝒐𝒐𝒇𝒇𝒇𝒇 > 4 to 5
In case of geotextile filters, following criteria recommended by Koerner (1986) shall be used:
1. For soils in which ≤ 50% of the particles can pass through a 0.074 mm sieve, the apparent opening size of the filter fabric should be ≥ 0.59 mm.
2. For soils in which < 50 % of the particles can pass through a 0.074 mm sieve, the apparent opening size of the filter fabric should be ≥ 0.297 mm.
• Design of cover /cap system
The purpose of cover system is to minimize infiltration of water into the landfill. The layer immediately above the waste, the grading layer consists of coarse-grained material and is usually 15-60 cm in thickness. The thickness depends upon the stability of the waste and gas collection system design. For unstable surfaces, a layer of geotextile s may be used below the grading layer.
33
The second layer, the barrier layer provides barrier for water infiltration consists of clay layer or synthetic membrane and must be designed carefully. A 60 cm thick layer for clay and 30 cm thick layer for bentonite is usually adopted .If synthetic layer is used ,a thickness of 1.5 to 2mm is sufficient. The protective layer protects the barrier layer from freeze-thaw and desiccation cracks and provides medium for root growth and its thickness varies from 30 to 105 cm depending upon geographic location. Finally 10 to 15 cm layer of organic soil is spread for facilitating growth of vegetation. This layer helps in reducing soil erosion, increasing structural stability and reducing infiltration by evapo-transpiration.
CONCLUSION
Globalization, industrialization, population growth and the rapid pace of urbanization pose many environmental challenges for large cities. Disposal of waste is a problem which increases with increase in population & is solved by using various methods like open dumping, incineration, composting and landfills having various adverse impact on environment and also on living beings. Solid waste management (SWM) is a vital, ongoing and large public service system, which needs to be efficiently provided to the community to maintain aesthetic and public health standards. Solid waste contains Biodegradable and non-degradable materials and because of unwanted biological reaction with biodegradable waste the foul smell generates and which also promotes the breeding of insects ,rodents and pathogens that can cause and transmit the diseases. Furthermore, open burning of MSW adversely affects the environment by emitting pollutants in the atmosphere. Thus Municipal agencies will have to plan and execute sustainable waste management programme. There has to be a systematic effort in the improvement in various factors like financial provisions, appropriate technology, operations management, human resource development, public participation and awareness, and policy and legal framework for an integrated SWM system. To achieve Cleanliness, which is next to Godliness, it is necessary to design and operate an efficient SWM system. Public co-operation is essential for successful operation of such a system. A suitable approach in municipal solid waste (MSW) management should be an integrated approach that could deliver both environmental and economic sustainability. Landfills are part of an integrated system for the management of MSW. When carefully designed and well managed within the context of the local infrastructure and available resources, landfills can provide safe and cost-effective disposal of waste.
References
Bagchi Amalendu (2004) Design of Landfills and Integrated Solid Waste Management, Third Edition, John Wiley & Sons, Inc, Hoboken Publications, New Jersey.
Gulhati S. & Datta M., Geotechnical Engineering, Tata Mc Graw Hill Publications, New Delhi. Gupta C.S.(17-20 December 2007)Proceeding of all India professional development programme on
Municipal solid waste management, ESCI campus, Hyderabad. Koerner Robert M. (1990) Designing with Geosynthetics, Second Edition, Prentice Hall, Englewood
Cliffs Publications, New Jersey. Sivakumar Babu G.L. Soil Reinforcement and Geosynthetics, Universities Press Publications. Varma C.V.J., Venkatappa Rao, Waste Containment with Geosynthetics, committee for International
Geosynthetic Society (India). Venkatramaiah C.(1995) Geotechnical Engineering, Second Edition, New Age International(P)
Limited, Publications, New Delhi. Venkatappa Rao G., Sasidhar R. S., (2009) Solid waste Management and Engineered Landfills, Sai
Masters Geoenvironmental Services Pvt. Ltd.(SAGES) Publications, Hyderabad-Andhra Pradesh.
34
CRUSHABILITY AND PERMEABILITY CHARACTERISTICS OF BOTTOM ASH AND
COARSE POND ASH
S. P. Singh and B. Sultana Department of Civil Engineering, National Institute of Technology, Rourkela-769008, Odisha, India
Abstract: This paper reports the crushability and permeability properties of bottom ash and coarse pond ash. These materials were collected from NTPC, Kaniha, Odisha. Samples were subjected to compactive energies varying from 149kJ/m3 to 4278 kJ/m3.The effects of energy on grain size distribution, minimum and maximum void ratios were determined. The permeability properties of samples, subjected to different compactive energies were determined at their minimum and maximum void ratios. It is found that both the coarse pond ash and bottom ash possess higher crushability compared to natural sand. However, the grain size distribution and permeability properties of these materials are somewhat similar to that of sand even after being subjected to the above mentioned compactive energies and they satisfies the filter criteria used for drainage system.
INTRODUCTION
Coal-based thermal power plants are the major source of power generation in India. The coal reserve of India is about 200 billion tonnes and its annual production reaches 250 million tonnes approximately. In India, unlike in most of the developed countries, ash content in the coal used for power generation is about 30 to 40%. The ash generation has increased to about 131 million tonne during 2010-11and shall continue to grow. The finer ash particles are carried away by the flue gas to the electrostatic precipitators and are referred as fly ash, whereas the heavier ash particles fall to the bottom of the boiler and are called as bottom ash. The fly ash and bottom ash are mixed with water and formed slurry and transported to large lagoon called ash pond. Deposits of ash pond called pond ash. At present around 265 km2 of area is covered by ash ponds and by 2015 it would require 1,000 km2 for its disposal. The scarcity of land most often forces the power plants to raise the dykes to increase the ponding capacity. Further it is observed that the failure of ash pond, which results in major damage to the environment, is mainly due to ineffective functioning of filters. Every earth fill dam or embankment contains filters and drainage elements for preventing erosion of soil due to the force of seeping water. The purpose of filter in the case of ash dyke is to protect the fly ash against being carried away with seepage and at the same time it should have adequate permeability to take out the seepage water in order to keep the fly ash in a dry condition avoiding liquefaction due to any disturbance. Huge amount of good filter material is required for the construction of filters. Natural river sand is used as the conventional filter material. However, the non-availability of required graded sand in and around construction site and in all seasons possesses problems to the construction of ash dykes. Non-availability of good sand during monsoon also affects the sustained and pre-planned construction of ash dykes in monsoon season. Coarse pond ash and bottom ash which are the waste products of thermal power plant and non-plastic in nature and available abundantly in thermal power plants may replace the conventional sand as a filtering material. This will help in ash utilisation in a small way. However, a detailed investigation on the geotechnical properties particularly, the crushability and permeability
35
properties of these materials are to be studied for efficient functioning of these materials as a drainage system.
LITERATURE REVIEW Limited work has been reported in the literature on the suitability of either coarse pond ash or bottom ash as a filter material in ash pond dykes. However, many failures of the ash ponds have been reported in past. The main reason for these failures is due to inadequate drainage system. Terzaghi (1920) established two rational grain size criteria, d15f/d85b <5, and d15f/d15b> 5 for earthen dams. The first criterion prevents largest base material grains from being carried into pores of the filter materials. Washout of smaller grains can then be prevented by means of internal formation of filter. Second criterion ensures water to easily drain. Dobry and Alvarez (1967) studied seismic failures of some tailings dams in Chile and found that the reason being inadequate drainage. Jayapalan (1981) reviewed failures of 16 tailings dams and ash dykes, which were caused due to the instability of dams constructed using the upstream method due to excessive pore pressures and absence of adequate internal drainage. This made them susceptible to liquefaction and flow failures. S. R. Gandhi, Gima V. Mathew (1996) conducted tests on amount of penetration, amount of bypassing and amount of clogging of fly ash through different size sand filter.Gandhi (2005) described the design and maintenance of ash pond for fly ash disposal. Various method of raising the dyke was explained in their work including the advantage and disadvantage. It was suggested that the ash dyke should be superved regularly and necessary remedial measures should be taken. This is based on the observation and experience at different pond sites. Kumar, J. and Naresh, D.N (2012) conducted a case study on the use of bottom ash as filter in lieu of sand as internal drainage for exiting the hydraulic gradient. In addition to this, the bottom ash meeting the filter criteria has enabled availability of alternate filter material, thus sustained the pre-planned construction activity even during monsoon. This also helped in ash utilization in a small way.
MATERIALS USED Bottom ash and coarse pond ash samples used in this study was collected from hopper and ash pond of NTPC, Kaniha, Odisha respectively. These samples were dried at the temperature of 105-1100 C. The physical properties were determined and are presented in Table-1.
Table1 Physical properties of coarse pond ash and bottom ash
Physical parameter Pond Ash Bottom Ash Colour Light grey Grey colour with unburned coal
Shape Rounded/ sub rounded Rounded/ sub rounded
Mean diameter, D50 0.3 mm 0.28 mm Uniformity coefficient, Cu 3.33 3.52
Coefficient of curvature, Cc 1.2 1.028
Specific gravity, G 2.18 2.12 Plasticity index, Ip Non-plastic Non-plastic Loss on ignition 0.347 4.0265
TEST PROGRAMME AND METHODOLOGY
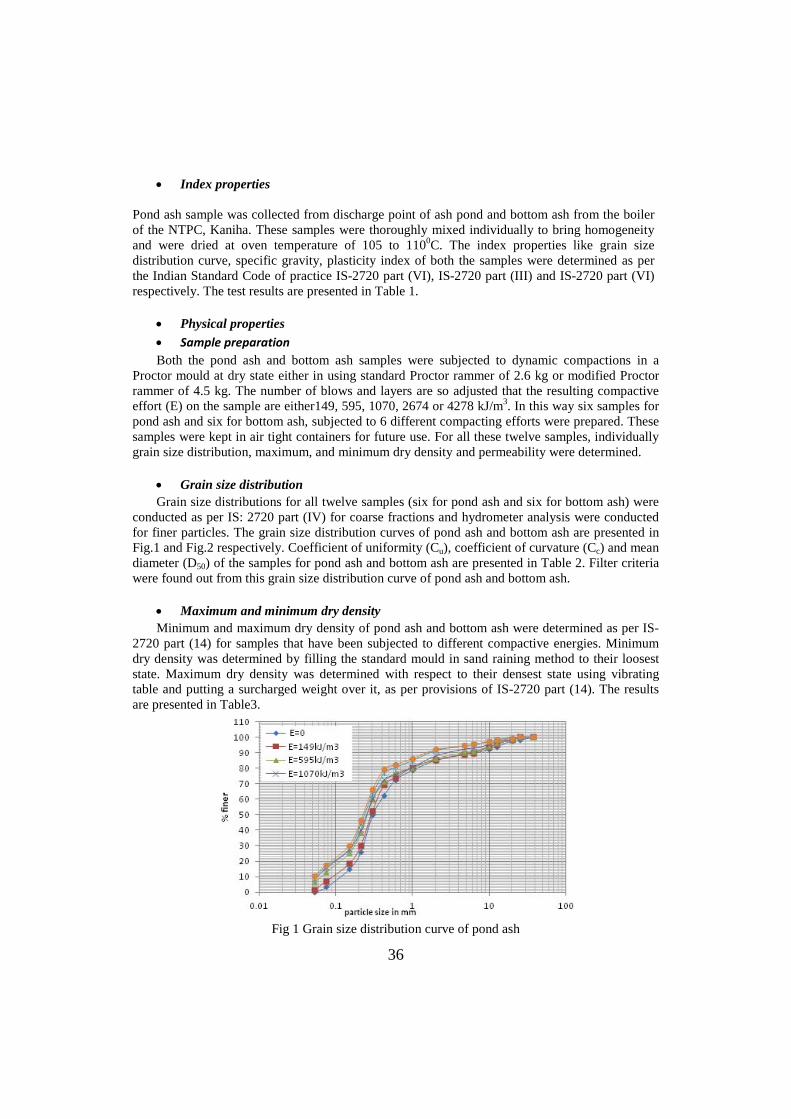
36
• Index properties
Pond ash sample was collected from discharge point of ash pond and bottom ash from the boiler of the NTPC, Kaniha. These samples were thoroughly mixed individually to bring homogeneity and were dried at oven temperature of 105 to 1100C. The index properties like grain size distribution curve, specific gravity, plasticity index of both the samples were determined as per the Indian Standard Code of practice IS-2720 part (VI), IS-2720 part (III) and IS-2720 part (VI) respectively. The test results are presented in Table 1.
• Physical properties • Sample preparation Both the pond ash and bottom ash samples were subjected to dynamic compactions in a
Proctor mould at dry state either in using standard Proctor rammer of 2.6 kg or modified Proctor rammer of 4.5 kg. The number of blows and layers are so adjusted that the resulting compactive effort (E) on the sample are either149, 595, 1070, 2674 or 4278 kJ/m3. In this way six samples for pond ash and six for bottom ash, subjected to 6 different compacting efforts were prepared. These samples were kept in air tight containers for future use. For all these twelve samples, individually grain size distribution, maximum, and minimum dry density and permeability were determined.
• Grain size distribution Grain size distributions for all twelve samples (six for pond ash and six for bottom ash) were
conducted as per IS: 2720 part (IV) for coarse fractions and hydrometer analysis were conducted for finer particles. The grain size distribution curves of pond ash and bottom ash are presented in Fig.1 and Fig.2 respectively. Coefficient of uniformity (Cu), coefficient of curvature (Cc) and mean diameter (D50) of the samples for pond ash and bottom ash are presented in Table 2. Filter criteria were found out from this grain size distribution curve of pond ash and bottom ash.
• Maximum and minimum dry density Minimum and maximum dry density of pond ash and bottom ash were determined as per IS-
2720 part (14) for samples that have been subjected to different compactive energies. Minimum dry density was determined by filling the standard mould in sand raining method to their loosest state. Maximum dry density was determined with respect to their densest state using vibrating table and putting a surcharged weight over it, as per provisions of IS-2720 part (14). The results are presented in Table3.
Fig 1 Grain size distribution curve of pond ash
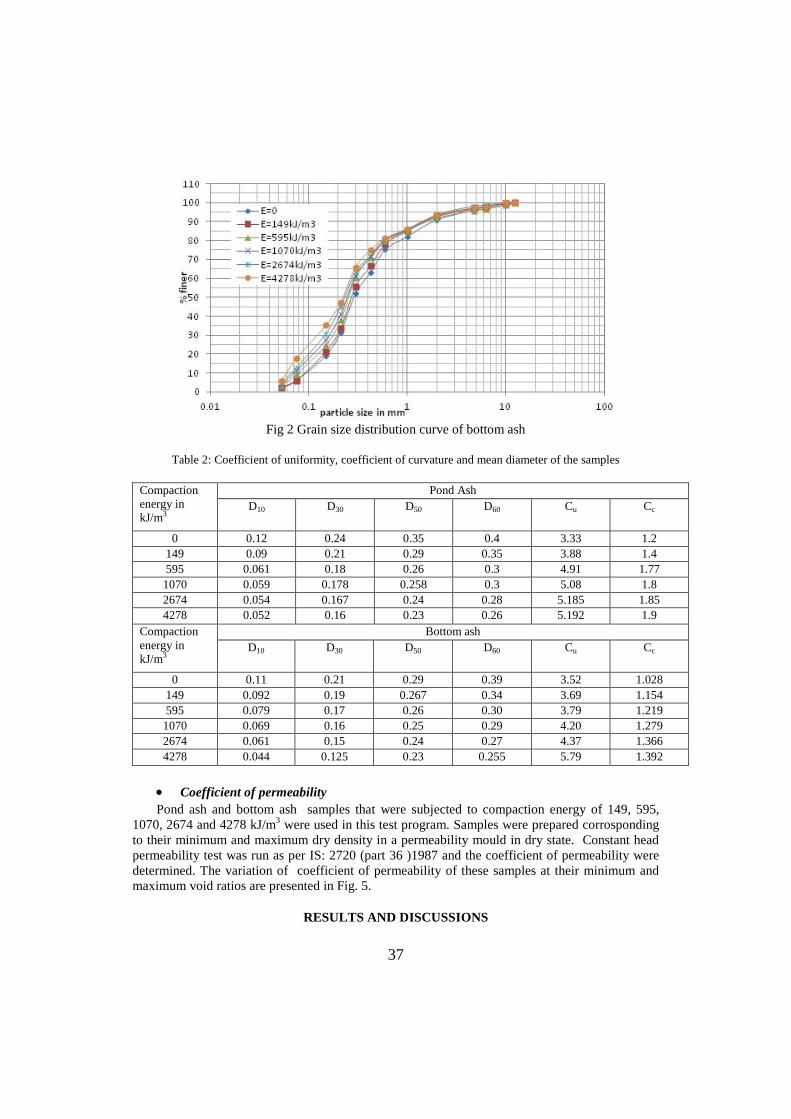
37
Fig 2 Grain size distribution curve of bottom ash
Table 2: Coefficient of uniformity, coefficient of curvature and mean diameter of the samples
Compaction energy in kJ/m3
Pond Ash D10 D30 D50 D60 Cu Cc
0 0.12 0.24 0.35 0.4 3.33 1.2 149 0.09 0.21 0.29 0.35 3.88 1.4 595 0.061 0.18 0.26 0.3 4.91 1.77 1070 0.059 0.178 0.258 0.3 5.08 1.8 2674 0.054 0.167 0.24 0.28 5.185 1.85 4278 0.052 0.16 0.23 0.26 5.192 1.9
Compaction energy in kJ/m3
Bottom ash D10 D30 D50 D60 Cu Cc
0 0.11 0.21 0.29 0.39 3.52 1.028 149 0.092 0.19 0.267 0.34 3.69 1.154 595 0.079 0.17 0.26 0.30 3.79 1.219 1070 0.069 0.16 0.25 0.29 4.20 1.279 2674 0.061 0.15 0.24 0.27 4.37 1.366 4278 0.044 0.125 0.23 0.255 5.79 1.392
• Coefficient of permeability Pond ash and bottom ash samples that were subjected to compaction energy of 149, 595,
1070, 2674 and 4278 kJ/m3 were used in this test program. Samples were prepared corrosponding to their minimum and maximum dry density in a permeability mould in dry state. Constant head permeability test was run as per IS: 2720 (part 36 )1987 and the coefficient of permeability were determined. The variation of coefficient of permeability of these samples at their minimum and maximum void ratios are presented in Fig. 5.
RESULTS AND DISCUSSIONS
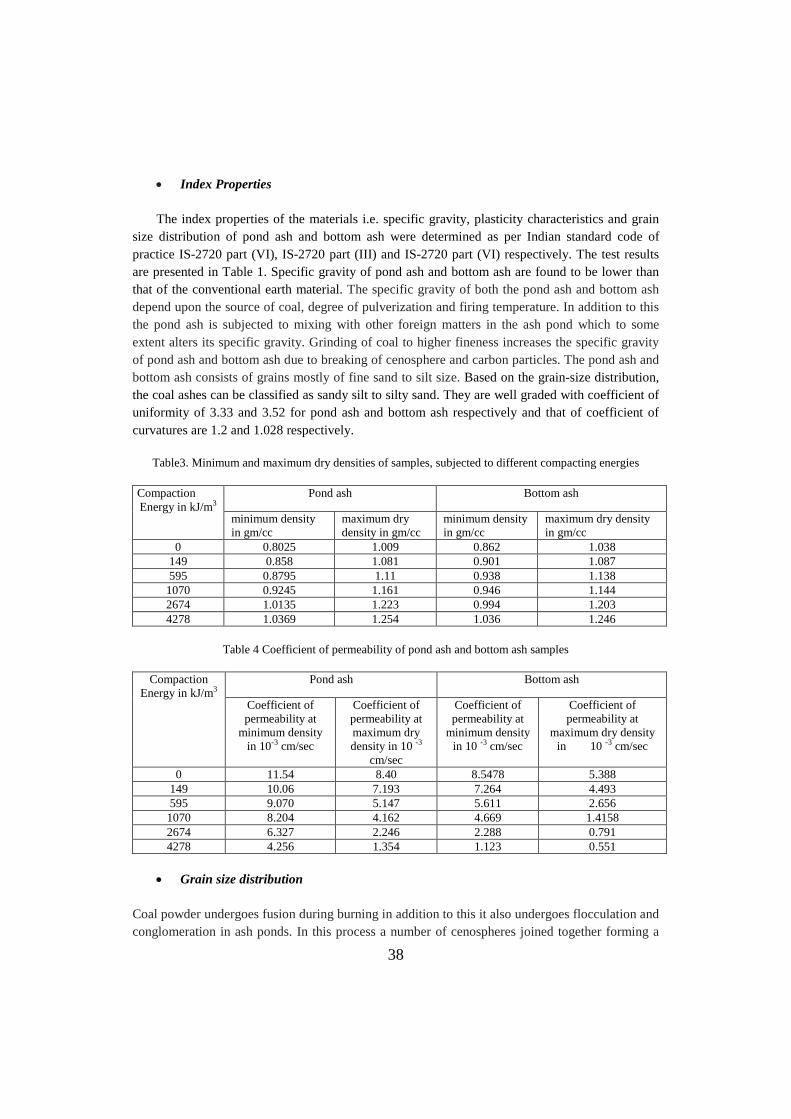
38
• Index Properties
The index properties of the materials i.e. specific gravity, plasticity characteristics and grain size distribution of pond ash and bottom ash were determined as per Indian standard code of practice IS-2720 part (VI), IS-2720 part (III) and IS-2720 part (VI) respectively. The test results are presented in Table 1. Specific gravity of pond ash and bottom ash are found to be lower than that of the conventional earth material. The specific gravity of both the pond ash and bottom ash depend upon the source of coal, degree of pulverization and firing temperature. In addition to this the pond ash is subjected to mixing with other foreign matters in the ash pond which to some extent alters its specific gravity. Grinding of coal to higher fineness increases the specific gravity of pond ash and bottom ash due to breaking of cenosphere and carbon particles. The pond ash and bottom ash consists of grains mostly of fine sand to silt size. Based on the grain-size distribution, the coal ashes can be classified as sandy silt to silty sand. They are well graded with coefficient of uniformity of 3.33 and 3.52 for pond ash and bottom ash respectively and that of coefficient of curvatures are 1.2 and 1.028 respectively.
Table3. Minimum and maximum dry densities of samples, subjected to different compacting energies
Compaction Energy in kJ/m3
Pond ash Bottom ash
minimum density in gm/cc
maximum dry density in gm/cc
minimum density in gm/cc
maximum dry density in gm/cc
0 0.8025 1.009 0.862 1.038 149 0.858 1.081 0.901 1.087 595 0.8795 1.11 0.938 1.138
1070 0.9245 1.161 0.946 1.144 2674 1.0135 1.223 0.994 1.203 4278 1.0369 1.254 1.036 1.246
Table 4 Coefficient of permeability of pond ash and bottom ash samples
Compaction Energy in kJ/m3
Pond ash Bottom ash
Coefficient of permeability at
minimum density in 10-3 cm/sec
Coefficient of permeability at maximum dry density in 10 -3
cm/sec
Coefficient of permeability at
minimum density in 10 -3 cm/sec
Coefficient of permeability at
maximum dry density in 10 -3 cm/sec
0 11.54 8.40 8.5478 5.388 149 10.06 7.193 7.264 4.493 595 9.070 5.147 5.611 2.656
1070 8.204 4.162 4.669 1.4158 2674 6.327 2.246 2.288 0.791 4278 4.256 1.354 1.123 0.551
• Grain size distribution
Coal powder undergoes fusion during burning in addition to this it also undergoes flocculation and conglomeration in ash ponds. In this process a number of cenospheres joined together forming a
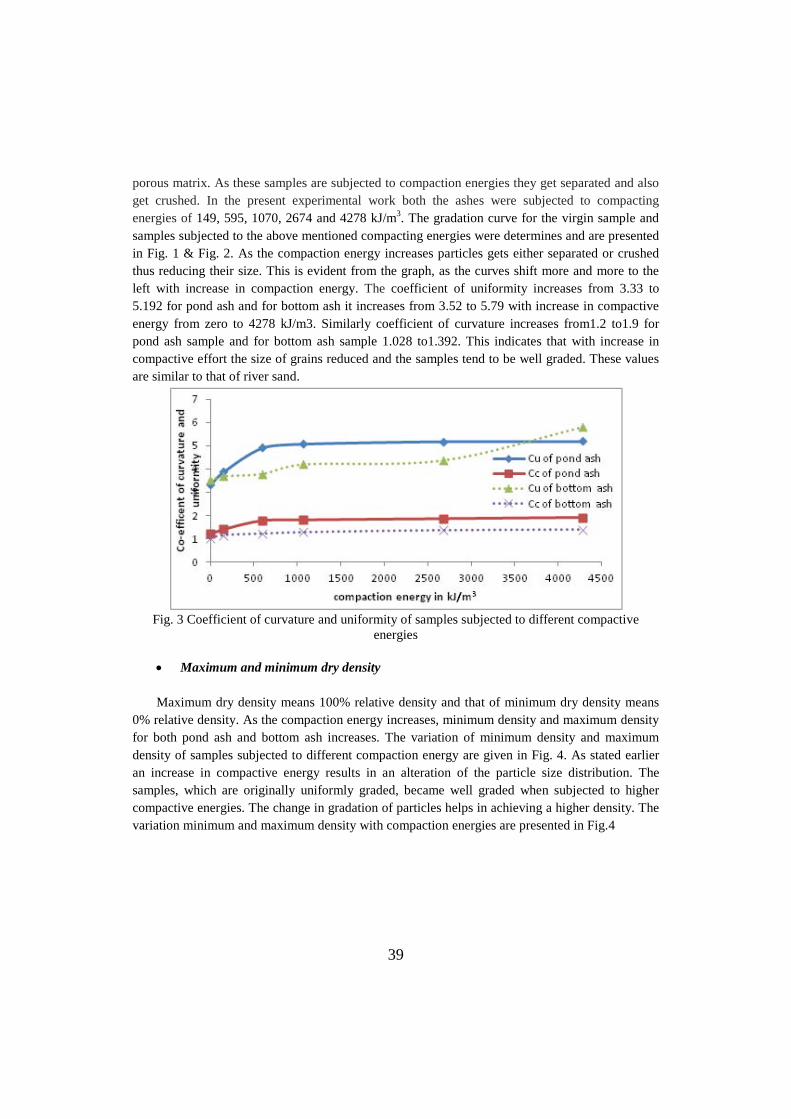
39
porous matrix. As these samples are subjected to compaction energies they get separated and also get crushed. In the present experimental work both the ashes were subjected to compacting energies of 149, 595, 1070, 2674 and 4278 kJ/m3. The gradation curve for the virgin sample and samples subjected to the above mentioned compacting energies were determines and are presented in Fig. 1 & Fig. 2. As the compaction energy increases particles gets either separated or crushed thus reducing their size. This is evident from the graph, as the curves shift more and more to the left with increase in compaction energy. The coefficient of uniformity increases from 3.33 to 5.192 for pond ash and for bottom ash it increases from 3.52 to 5.79 with increase in compactive energy from zero to 4278 kJ/m3. Similarly coefficient of curvature increases from1.2 to1.9 for pond ash sample and for bottom ash sample 1.028 to1.392. This indicates that with increase in compactive effort the size of grains reduced and the samples tend to be well graded. These values are similar to that of river sand.
Fig. 3 Coefficient of curvature and uniformity of samples subjected to different compactive
energies
• Maximum and minimum dry density
Maximum dry density means 100% relative density and that of minimum dry density means 0% relative density. As the compaction energy increases, minimum density and maximum density for both pond ash and bottom ash increases. The variation of minimum density and maximum density of samples subjected to different compaction energy are given in Fig. 4. As stated earlier an increase in compactive energy results in an alteration of the particle size distribution. The samples, which are originally uniformly graded, became well graded when subjected to higher compactive energies. The change in gradation of particles helps in achieving a higher density. The variation minimum and maximum density with compaction energies are presented in Fig.4
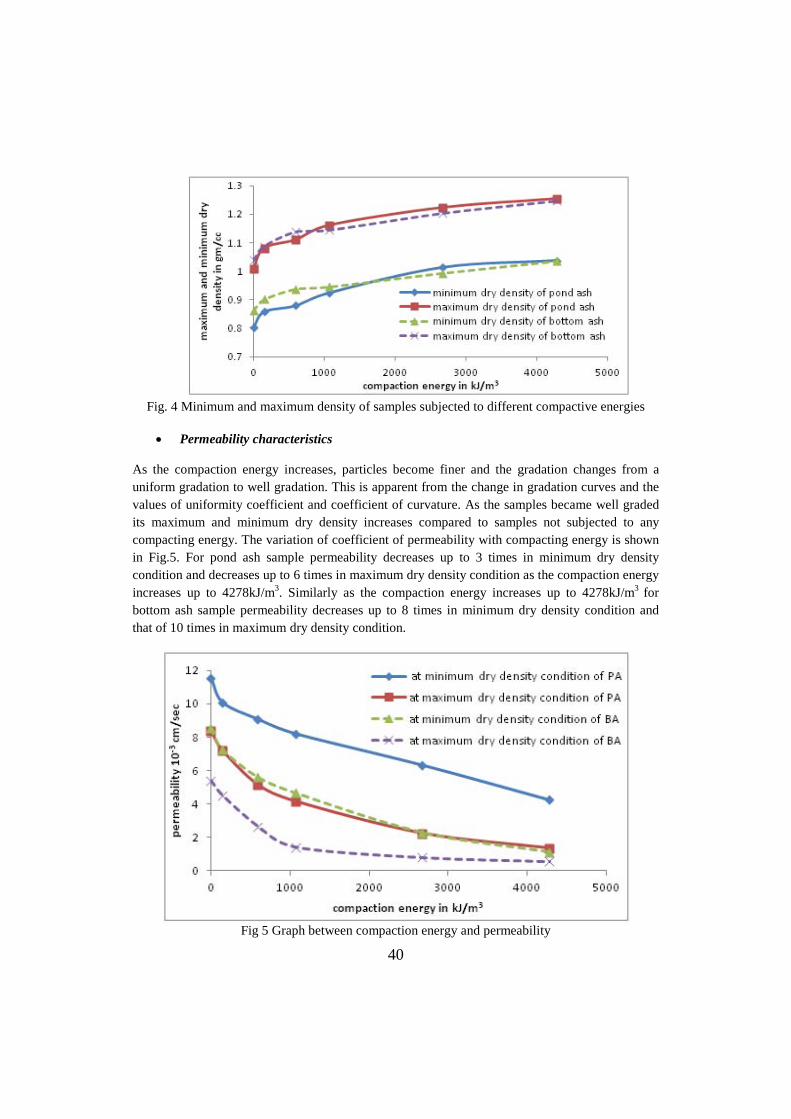
40
Fig. 4 Minimum and maximum density of samples subjected to different compactive energies
• Permeability characteristics
As the compaction energy increases, particles become finer and the gradation changes from a uniform gradation to well gradation. This is apparent from the change in gradation curves and the values of uniformity coefficient and coefficient of curvature. As the samples became well graded its maximum and minimum dry density increases compared to samples not subjected to any compacting energy. The variation of coefficient of permeability with compacting energy is shown in Fig.5. For pond ash sample permeability decreases up to 3 times in minimum dry density condition and decreases up to 6 times in maximum dry density condition as the compaction energy increases up to 4278kJ/m3. Similarly as the compaction energy increases up to 4278kJ/m3 for bottom ash sample permeability decreases up to 8 times in minimum dry density condition and that of 10 times in maximum dry density condition.
Fig 5 Graph between compaction energy and permeability
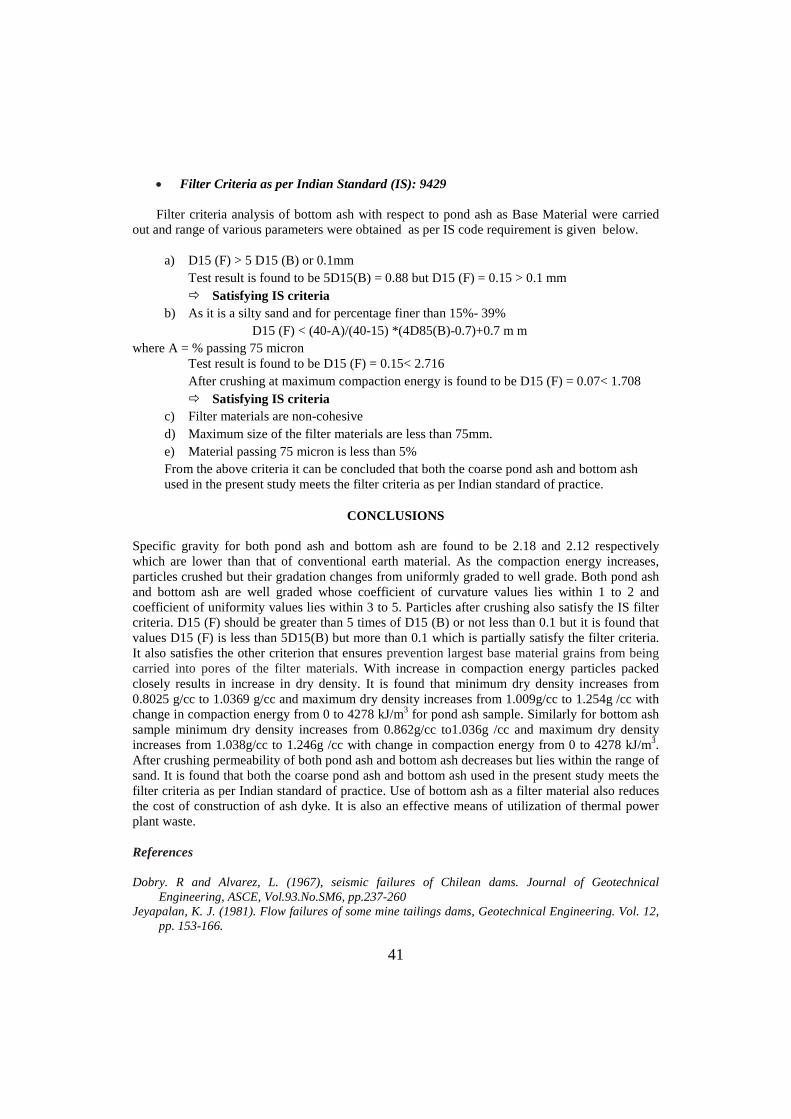
41
• Filter Criteria as per Indian Standard (IS): 9429
Filter criteria analysis of bottom ash with respect to pond ash as Base Material were carried out and range of various parameters were obtained as per IS code requirement is given below.
a) D15 (F) > 5 D15 (B) or 0.1mm Test result is found to be 5D15(B) = 0.88 but D15 (F) = 0.15 > 0.1 mm Satisfying IS criteria
b) As it is a silty sand and for percentage finer than 15%- 39% D15 (F) < (40-A)/(40-15) *(4D85(B)-0.7)+0.7 m m
where A = % passing 75 micron Test result is found to be D15 (F) = 0.15< 2.716 After crushing at maximum compaction energy is found to be D15 (F) = 0.07< 1.708 Satisfying IS criteria
c) Filter materials are non-cohesive d) Maximum size of the filter materials are less than 75mm. e) Material passing 75 micron is less than 5% From the above criteria it can be concluded that both the coarse pond ash and bottom ash used in the present study meets the filter criteria as per Indian standard of practice.
CONCLUSIONS
Specific gravity for both pond ash and bottom ash are found to be 2.18 and 2.12 respectively which are lower than that of conventional earth material. As the compaction energy increases, particles crushed but their gradation changes from uniformly graded to well grade. Both pond ash and bottom ash are well graded whose coefficient of curvature values lies within 1 to 2 and coefficient of uniformity values lies within 3 to 5. Particles after crushing also satisfy the IS filter criteria. D15 (F) should be greater than 5 times of D15 (B) or not less than 0.1 but it is found that values D15 (F) is less than 5D15(B) but more than 0.1 which is partially satisfy the filter criteria. It also satisfies the other criterion that ensures prevention largest base material grains from being carried into pores of the filter materials. With increase in compaction energy particles packed closely results in increase in dry density. It is found that minimum dry density increases from 0.8025 g/cc to 1.0369 g/cc and maximum dry density increases from 1.009g/cc to 1.254g /cc with change in compaction energy from 0 to 4278 kJ/m3 for pond ash sample. Similarly for bottom ash sample minimum dry density increases from 0.862g/cc to1.036g /cc and maximum dry density increases from 1.038g/cc to 1.246g /cc with change in compaction energy from 0 to 4278 kJ/m3. After crushing permeability of both pond ash and bottom ash decreases but lies within the range of sand. It is found that both the coarse pond ash and bottom ash used in the present study meets the filter criteria as per Indian standard of practice. Use of bottom ash as a filter material also reduces the cost of construction of ash dyke. It is also an effective means of utilization of thermal power plant waste. References Dobry. R and Alvarez, L. (1967), seismic failures of Chilean dams. Journal of Geotechnical
Engineering, ASCE, Vol.93.No.SM6, pp.237-260 Jeyapalan, K. J. (1981). Flow failures of some mine tailings dams, Geotechnical Engineering. Vol. 12,
pp. 153-166.

42
Gandhi, S.R., and Gima V. Mathew, (1996) “Granular Filter for Ash Dykes”, Proceedings of Indian Geotechnical Conference held at Madras during December 11-14, 1996. pp.532-535.
Gandhi, S.R., Raju, V.S., and Vimal Kumar, (1997) “Densification of Deposited Ash Slurry”, Proceedings of 13th International Conference on Solid Waste Management, Philadelphia.
Gandhi S. R.,(2005) “Design And Maintenance Of Ash Pond For Fly Ash Disposal”. Indian Geotechnical Conference, Warangal.
Pedro J Amaya, Andrew J Amaya, (2007)” The use of Bottom Ash in the Design of Dams” World of coal ash (WOCA), Northen Kentucky, USA
Indian Standard (IS): 9429 – Drainage System for earth and Rockfill Dams –Code of Practice. Kumar, J. and Naresh, D.N (2012)“Use of Bottom ash in lieu of sand as filter in ash dyke
embankment” GeoCongress 2012,ASCE .
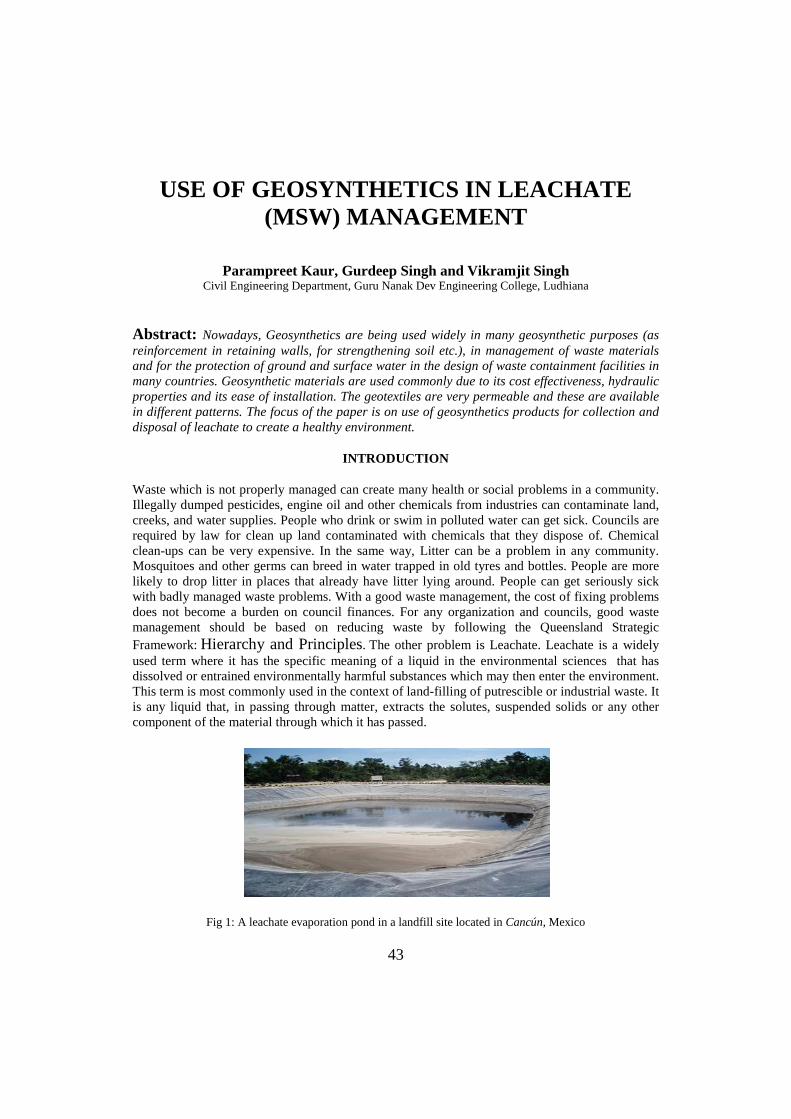
43
USE OF GEOSYNTHETICS IN LEACHATE (MSW) MANAGEMENT
Parampreet Kaur, Gurdeep Singh and Vikramjit Singh Civil Engineering Department, Guru Nanak Dev Engineering College, Ludhiana
Abstract: Nowadays, Geosynthetics are being used widely in many geosynthetic purposes (as reinforcement in retaining walls, for strengthening soil etc.), in management of waste materials and for the protection of ground and surface water in the design of waste containment facilities in many countries. Geosynthetic materials are used commonly due to its cost effectiveness, hydraulic properties and its ease of installation. The geotextiles are very permeable and these are available in different patterns. The focus of the paper is on use of geosynthetics products for collection and disposal of leachate to create a healthy environment.
INTRODUCTION
Waste which is not properly managed can create many health or social problems in a community. Illegally dumped pesticides, engine oil and other chemicals from industries can contaminate land, creeks, and water supplies. People who drink or swim in polluted water can get sick. Councils are required by law for clean up land contaminated with chemicals that they dispose of. Chemical clean-ups can be very expensive. In the same way, Litter can be a problem in any community. Mosquitoes and other germs can breed in water trapped in old tyres and bottles. People are more likely to drop litter in places that already have litter lying around. People can get seriously sick with badly managed waste problems. With a good waste management, the cost of fixing problems does not become a burden on council finances. For any organization and councils, good waste management should be based on reducing waste by following the Queensland Strategic Framework: Hierarchy and Principles. The other problem is Leachate. Leachate is a widely used term where it has the specific meaning of a liquid in the environmental sciences that has dissolved or entrained environmentally harmful substances which may then enter the environment. This term is most commonly used in the context of land-filling of putrescible or industrial waste. It is any liquid that, in passing through matter, extracts the solutes, suspended solids or any other component of the material through which it has passed.
Fig 1: A leachate evaporation pond in a landfill site located in Cancún, Mexico
44
LANDFILL LEACHATE’S COMPOSITION
When water percolates through the waste with bacteria and fungi , leachate promotes and assists the process of decomposition. These processes creates an anoxic environment in turn release by-products of decomposition and rapidly use up any available oxygen. In actively decomposing waste the temperature rises and the pH falls fastly and at neutral pH many metal ions which are relatively insoluble can become dissolved in the developing leachate. The volume of leachate is increased with the water which is released with decomposition processes. The materials that are not themselves prone to decomposition such as fire ash, cement based building materials and gypsum based materials changing the chemical composition also reacts with leachate. The sites having large volumes of building waste, especially those containing gypsum plaster, large volumes of hydrogen sulfide can be generated by the reaction of leachate with gypsum which may be released in the leachate and may also form a large component of the landfill gas.
In a landfill which receives a mixture of different ( municipal, commercial, and mixed industrial) waste, but excludes significant amounts of concentrated specific chemical waste, that landfill leachate may be characterized as a water-based solution of four groups of contaminants; dissolved organic matter (alcohols, acids, aldehydes, short chain sugars etc.), inorganic macro components (common cations and anions including sulfate, chloride, iron, aluminium, zinc and ammonia), heavy metals (Pb, Ni, Cu, Hg), and xenobiotic organic compounds such as halogenated organics, (PCBs, dioxins, etc.). The physical appearance of leachate is a strongly odoured black, yellow or orange coloured cloudy liquid when it emerges from a typical landfill site. That’s smell is acidic and offensive and may be very pervasive due to hydrogen, nitrogen and sulfur rich organic species such as mercaptans.
GEOSYNTHETICS
Geosynthetic systems are an accepted and well-established component of the landfill industry now a day (since at least early 1980’s). Containment systems used for landfills typically include both geosynthetics and components of earthen material, (e.g. compacted clays for liners, granular media for drainage layers, and various soils for protective and vegetative layers). The state of the art in waste containment facilities, on the use of geosynthetics previous to this period has been documented in this field by various important sources, which have set the path for the growth of geosynthetics (e.g. Giroud & Cazzuffi 1989; Koerner 1990; Cancelli & Cazzuffi 1994; Gourc 1994; Rowe et al. 1995; Manassero et al. 1998; Rowe 1998; Bouazza et al. 2002, Junqueira et al. 2006).
Geosynthetics and related products have found wide application in the design and construction of landfill facilities. This application has been triggered that geosynthetics can offer in relation to more traditional materials. As industrialization of nations occurred, many containment facilities were constructed to retain many types of raw materials and/or waste products. Most of these containment facilities were not designed and almost none were lined to prevent leakage of wastes into the soil and damage the surrounding environment. The focus at this time is anticipated to be on mechanical and biological waste treatment, either in ground or prior to deposition, including the increased use of leachate recirculation and bioreactor technology, as the owners, regulators, and engineers become more familiar with these concepts and their benefits with respect to decreasing long term costs and liabilities. While reducing waste and reuse efforts may diminish the per capita quantity of waste generated in industrialized nations, there is no doubt that landfills will remain an important method of waste disposal in future due to their simplicity
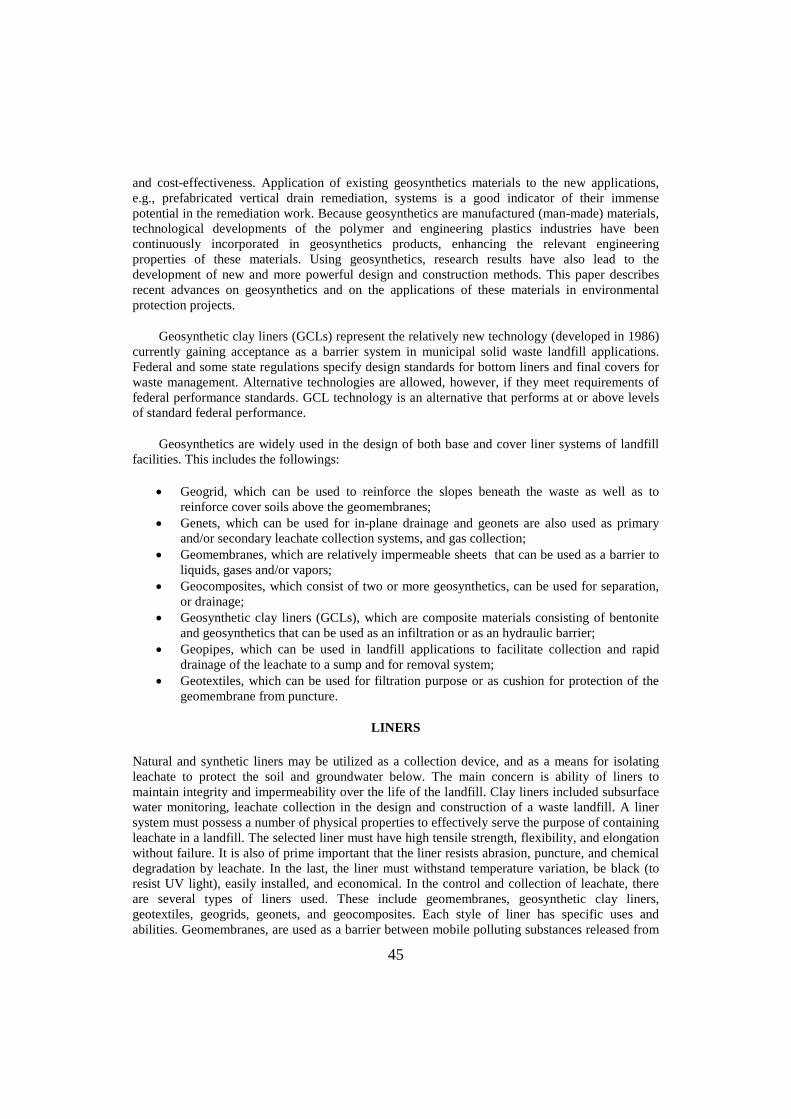
45
and cost-effectiveness. Application of existing geosynthetics materials to the new applications, e.g., prefabricated vertical drain remediation, systems is a good indicator of their immense potential in the remediation work. Because geosynthetics are manufactured (man-made) materials, technological developments of the polymer and engineering plastics industries have been continuously incorporated in geosynthetics products, enhancing the relevant engineering properties of these materials. Using geosynthetics, research results have also lead to the development of new and more powerful design and construction methods. This paper describes recent advances on geosynthetics and on the applications of these materials in environmental protection projects.
Geosynthetic clay liners (GCLs) represent the relatively new technology (developed in 1986) currently gaining acceptance as a barrier system in municipal solid waste landfill applications. Federal and some state regulations specify design standards for bottom liners and final covers for waste management. Alternative technologies are allowed, however, if they meet requirements of federal performance standards. GCL technology is an alternative that performs at or above levels of standard federal performance.
Geosynthetics are widely used in the design of both base and cover liner systems of landfill facilities. This includes the followings:
• Geogrid, which can be used to reinforce the slopes beneath the waste as well as to reinforce cover soils above the geomembranes;
• Genets, which can be used for in-plane drainage and geonets are also used as primary and/or secondary leachate collection systems, and gas collection;
• Geomembranes, which are relatively impermeable sheets that can be used as a barrier to liquids, gases and/or vapors;
• Geocomposites, which consist of two or more geosynthetics, can be used for separation, or drainage;
• Geosynthetic clay liners (GCLs), which are composite materials consisting of bentonite and geosynthetics that can be used as an infiltration or as an hydraulic barrier;
• Geopipes, which can be used in landfill applications to facilitate collection and rapid drainage of the leachate to a sump and for removal system;
• Geotextiles, which can be used for filtration purpose or as cushion for protection of the geomembrane from puncture.
LINERS
Natural and synthetic liners may be utilized as a collection device, and as a means for isolating leachate to protect the soil and groundwater below. The main concern is ability of liners to maintain integrity and impermeability over the life of the landfill. Clay liners included subsurface water monitoring, leachate collection in the design and construction of a waste landfill. A liner system must possess a number of physical properties to effectively serve the purpose of containing leachate in a landfill. The selected liner must have high tensile strength, flexibility, and elongation without failure. It is also of prime important that the liner resists abrasion, puncture, and chemical degradation by leachate. In the last, the liner must withstand temperature variation, be black (to resist UV light), easily installed, and economical. In the control and collection of leachate, there are several types of liners used. These include geomembranes, geosynthetic clay liners, geotextiles, geogrids, geonets, and geocomposites. Each style of liner has specific uses and abilities. Geomembranes, are used as a barrier between mobile polluting substances released from
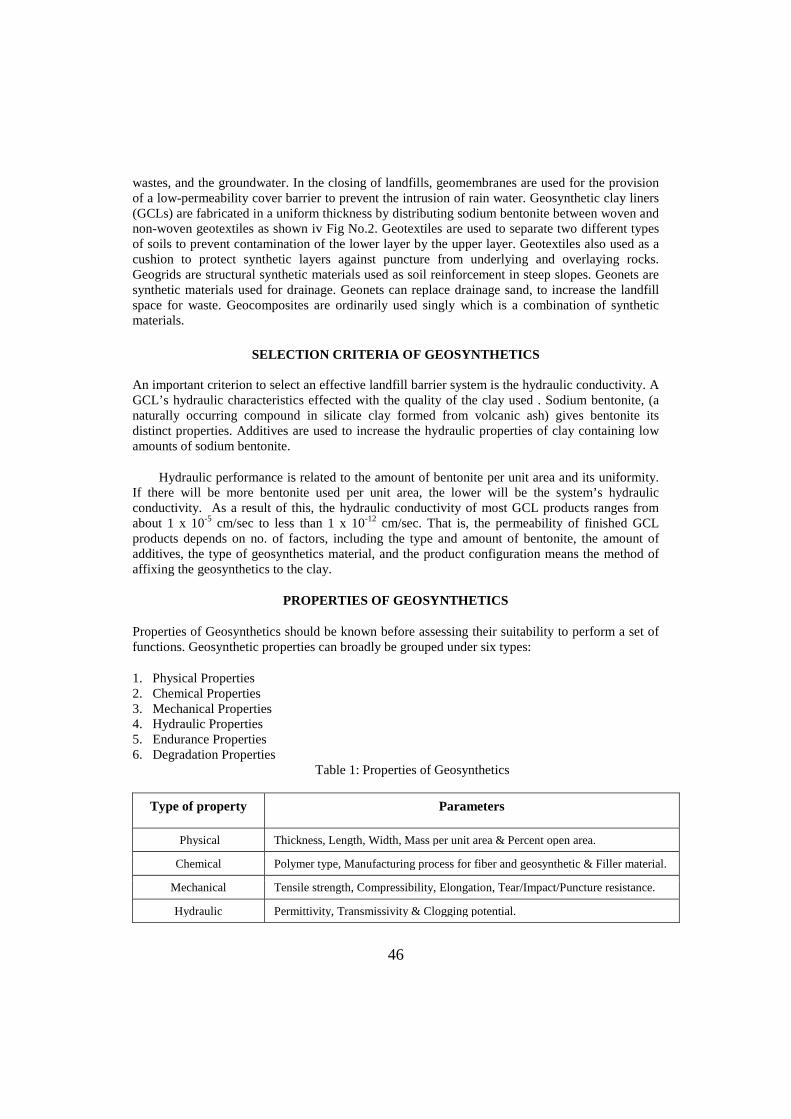
46
wastes, and the groundwater. In the closing of landfills, geomembranes are used for the provision of a low-permeability cover barrier to prevent the intrusion of rain water. Geosynthetic clay liners (GCLs) are fabricated in a uniform thickness by distributing sodium bentonite between woven and non-woven geotextiles as shown iv Fig No.2. Geotextiles are used to separate two different types of soils to prevent contamination of the lower layer by the upper layer. Geotextiles also used as a cushion to protect synthetic layers against puncture from underlying and overlaying rocks. Geogrids are structural synthetic materials used as soil reinforcement in steep slopes. Geonets are synthetic materials used for drainage. Geonets can replace drainage sand, to increase the landfill space for waste. Geocomposites are ordinarily used singly which is a combination of synthetic materials.
SELECTION CRITERIA OF GEOSYNTHETICS An important criterion to select an effective landfill barrier system is the hydraulic conductivity. A GCL’s hydraulic characteristics effected with the quality of the clay used . Sodium bentonite, (a naturally occurring compound in silicate clay formed from volcanic ash) gives bentonite its distinct properties. Additives are used to increase the hydraulic properties of clay containing low amounts of sodium bentonite.
Hydraulic performance is related to the amount of bentonite per unit area and its uniformity. If there will be more bentonite used per unit area, the lower will be the system’s hydraulic conductivity. As a result of this, the hydraulic conductivity of most GCL products ranges from about 1 x 10⁻⁵ cm/sec to less than 1 x 10-12 cm/sec. That is, the permeability of finished GCL products depends on no. of factors, including the type and amount of bentonite, the amount of additives, the type of geosynthetics material, and the product configuration means the method of affixing the geosynthetics to the clay.
PROPERTIES OF GEOSYNTHETICS
Properties of Geosynthetics should be known before assessing their suitability to perform a set of functions. Geosynthetic properties can broadly be grouped under six types:
1. Physical Properties 2. Chemical Properties 3. Mechanical Properties 4. Hydraulic Properties 5. Endurance Properties 6. Degradation Properties
Table 1: Properties of Geosynthetics
Type of property Parameters
Physical Thickness, Length, Width, Mass per unit area & Percent open area.
Chemical Polymer type, Manufacturing process for fiber and geosynthetic & Filler material.
Mechanical Tensile strength, Compressibility, Elongation, Tear/Impact/Puncture resistance.
Hydraulic Permittivity, Transmissivity & Clogging potential.
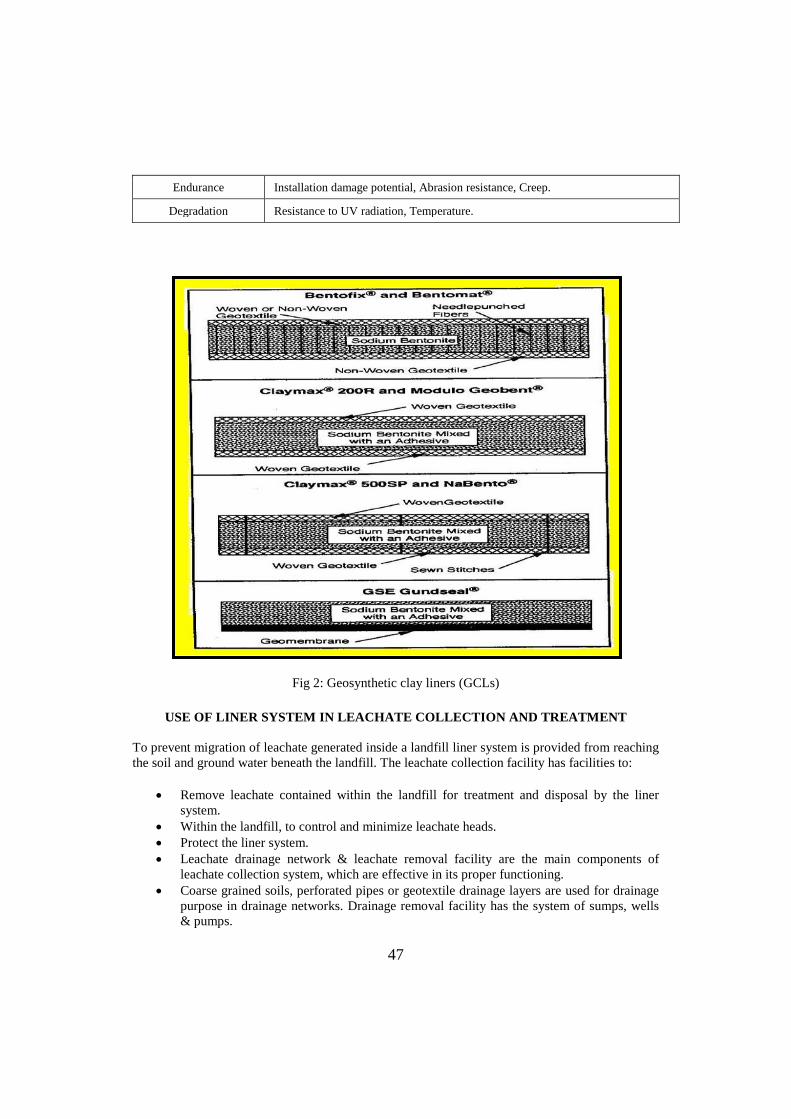
47
Endurance Installation damage potential, Abrasion resistance, Creep.
Degradation Resistance to UV radiation, Temperature.
Fig 2: Geosynthetic clay liners (GCLs)
USE OF LINER SYSTEM IN LEACHATE COLLECTION AND TREATMENT To prevent migration of leachate generated inside a landfill liner system is provided from reaching the soil and ground water beneath the landfill. The leachate collection facility has facilities to:
• Remove leachate contained within the landfill for treatment and disposal by the liner system.
• Within the landfill, to control and minimize leachate heads. • Protect the liner system. • Leachate drainage network & leachate removal facility are the main components of
leachate collection system, which are effective in its proper functioning. • Coarse grained soils, perforated pipes or geotextile drainage layers are used for drainage
purpose in drainage networks. Drainage removal facility has the system of sumps, wells & pumps.
48
For all MSW landfills, it is recommended that the following single composite liner system be adopted as the minimum requirement:
A layer of 30 cm thickness made of granular soil having permeability(K) greater than 10-2 cm/sec should be used for drainage of leachate.
A 20 cm to 30 cm thick silty soil layer is used for protection. A geomembrane of thickness ≥ 1.5 mm. A 1 m thick compacted clay barrier of having permeability (K) of less than 10-7 cm/sec.
For leachate collection system, the design steps are:
Drainage layer slopes of 2% should be finalized for the layout of pipe network & sumps. Based on the estimated leachate quantity & maximum permissible leachate head, pipe
diameter, spacing and size of sumps and pumps is estimated. For leachate removal, wells/side slopes risers are designed. Holding tank is designed with proper specifications.
CONCLUDING REMARKS
The paper has highlighted the problems regarding leachate, its disposal and controlling measures with design considerations for the MSW landfills. These guidelines will be helpful in promoting MSW management with proper effectiveness & efficiency. while insuring the protection of Public health & environment protection will be fully ensured by following the above guidelines which will be proved to be boon in reduction of overall cost of planning, design, operations & maintenance of landfill facilities. References ASTM; (1994); ASTM Standards and Other Specifications and Test Methods. Daniel, D.E; and Gilbert. R.B; (1994); (Geosynthetic Clay Liners for Waste Containment and Pollution
Prevention); Austin, Texas: University of Texas at Austin. February. Dutta, Rakesh Kumar; Gayathri, V; (2011); (Landfill Planning and Design Considerations);
Proceeding of Staff Development Programme,GNDEC,Ldh; 1; 61-71. Ennio M. Palmeira, etal; (Advances in Geosynthetics Materials and Applications for Soil
Reinforcement and Environmental Protection Works). (Geosynthetic Clay Liners Used in Municipal Solid Waste Landfills); EPA530-F-97-002. geosynthetic clay liners; J. Geotech. Eng.; January: 82-85. Henry, J; Heinke, G; (1996); Environmental Science and Engineering, Prentice Hall; ISBN 0-13-
120650-8. Koerner, R.M; and D. Narejo; (1995); (Bearing capacity of hydrated on the Quality Assurance of
Landfill Liner Systems); ASTM, 1916 Race Street, Philadelphia, PA. April. Kraus, J.F; C.H. Benson; (2001); (Solid Waste and Emergency Response); Risk Reduction Engineering
Laboratory; Cincinnati, OH; 5306W. Shan, H.Y; D.E. Daniel; (1991); (Results of Laboratory Tests on a Geotextile/Bentonite Liner
Material); Proceedings, Geosynthetics 1991; Industrial Fabrics Association International, St. Paul, MN; vol. 2, pp. 517-535.
Singh A; Chandra S; Kumar Gupta S; Chauhan LK; Kumar Rath S; (2007);(Mutagenicity of leachates from industrial solid wastes using Salmonella reverse mutation assay); Ecotoxicol Environ Saf. Feb; 66(2):210-6.
U.S. EPA; (1995); (Effect of Freeze/Thaw on the Hydraulic Conductivity of Barrier Materials); Laboratory and Field Evaluation; EPA600-R-95-118.
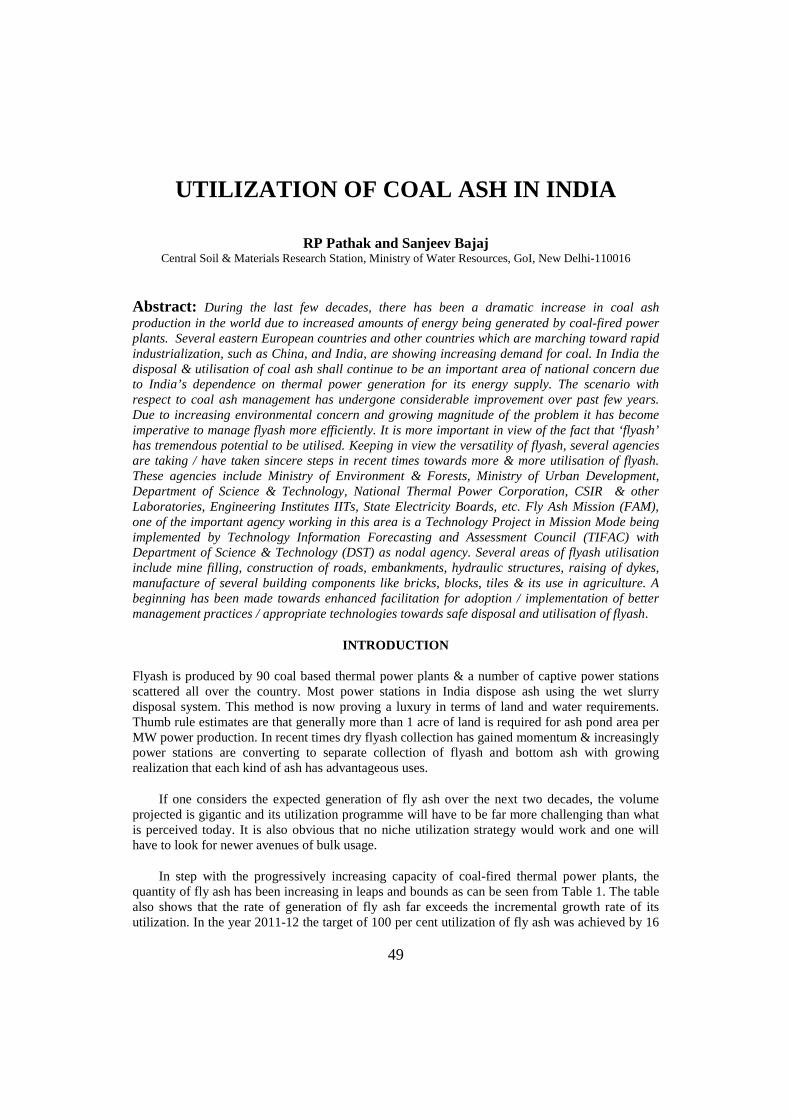
49
UTILIZATION OF COAL ASH IN INDIA
RP Pathak and Sanjeev Bajaj Central Soil & Materials Research Station, Ministry of Water Resources, GoI, New Delhi-110016
Abstract: During the last few decades, there has been a dramatic increase in coal ash production in the world due to increased amounts of energy being generated by coal-fired power plants. Several eastern European countries and other countries which are marching toward rapid industrialization, such as China, and India, are showing increasing demand for coal. In India the disposal & utilisation of coal ash shall continue to be an important area of national concern due to India’s dependence on thermal power generation for its energy supply. The scenario with respect to coal ash management has undergone considerable improvement over past few years. Due to increasing environmental concern and growing magnitude of the problem it has become imperative to manage flyash more efficiently. It is more important in view of the fact that ‘flyash’ has tremendous potential to be utilised. Keeping in view the versatility of flyash, several agencies are taking / have taken sincere steps in recent times towards more & more utilisation of flyash. These agencies include Ministry of Environment & Forests, Ministry of Urban Development, Department of Science & Technology, National Thermal Power Corporation, CSIR & other Laboratories, Engineering Institutes IITs, State Electricity Boards, etc. Fly Ash Mission (FAM), one of the important agency working in this area is a Technology Project in Mission Mode being implemented by Technology Information Forecasting and Assessment Council (TIFAC) with Department of Science & Technology (DST) as nodal agency. Several areas of flyash utilisation include mine filling, construction of roads, embankments, hydraulic structures, raising of dykes, manufacture of several building components like bricks, blocks, tiles & its use in agriculture. A beginning has been made towards enhanced facilitation for adoption / implementation of better management practices / appropriate technologies towards safe disposal and utilisation of flyash.
INTRODUCTION
Flyash is produced by 90 coal based thermal power plants & a number of captive power stations scattered all over the country. Most power stations in India dispose ash using the wet slurry disposal system. This method is now proving a luxury in terms of land and water requirements. Thumb rule estimates are that generally more than 1 acre of land is required for ash pond area per MW power production. In recent times dry flyash collection has gained momentum & increasingly power stations are converting to separate collection of flyash and bottom ash with growing realization that each kind of ash has advantageous uses.
If one considers the expected generation of fly ash over the next two decades, the volume projected is gigantic and its utilization programme will have to be far more challenging than what is perceived today. It is also obvious that no niche utilization strategy would work and one will have to look for newer avenues of bulk usage.
In step with the progressively increasing capacity of coal-fired thermal power plants, the quantity of fly ash has been increasing in leaps and bounds as can be seen from Table 1. The table also shows that the rate of generation of fly ash far exceeds the incremental growth rate of its utilization. In the year 2011-12 the target of 100 per cent utilization of fly ash was achieved by 16
50
thermal power plants and 19 thermal power plants have achieved between 75 – 100%. If one considers the expected generation of fly ash over the next two decades, the volume projected is gigantic and its utilization programme will have to be far more challenging than what is perceived today.
Table-1 Flyash generation and utilization in India
Year Generation Mt. Utilization Mt. % Generation
1993-94 40.0 1.2 3.0 2004-05 112.0 42.0 38.0 2006-07 130.0 60.0 46.0 2011-12 170.0 92.0 54.0 2031-32 600.0 - Not yet planned
PHYSICO-CHEMICAL CHARACTERISTICS OF THE INDIAN FLY ASHES
• Chemical composition
Fly ash as a material is siliceous or aluminous with pozzolanic properties. Chemical composition of Indian flyash is given in table-2. X Ray Diffraction analysis (Fig.1) of flyash shows crystalline minerals like quartz, mullite, feldspar, tridymite and traces of un-burnt carbon. It is refractory and alkaline in nature, having fineness in the range of 3000-6000 sq.cm/gm.
The Indian low-lime fly ashes are characterized by relatively higher concentration of SiO2 and Al2O3 and lower contents of Fe2O3. This implies higher fusion temperature for these fly ashes and, consequently, the chances of lower glass formation, if the ash is not subjected to relatively high temperature. While in the low-calcium fly ashes the silica content is almost double of the alumina content, in the high-calcium fly ashes the content of these two oxides is by and large comparable or close to each other. The iron oxide context in the high-lime fly ash is significantly higher than in the low-lime variety.
Table 2: Chemical Composition of Indian Fly Ash Constituent Percentage Range (%) Silica (SiO2) 49-67 Alumina (Al2O3) 16-29 Iron Oxide (Fe2O3) 4-10 Calcium Oxide (CaO) 1-4 Magnesium Oxide (MgO) 0.2-2 Sulphur (SO3) 0.1-2 Loss of Ignition 0.5-3.0
FLYASH UTILIZATION
Following increasing awareness and concerted efforts of various government and non-government agencies over last 15 years, safe disposal & effective utilization trends are gaining momentum in the country. There is greater acceptance of flyash products & applications. This is so because the agencies involved (research institutes, academia, thermal power station, industry etc.) have been
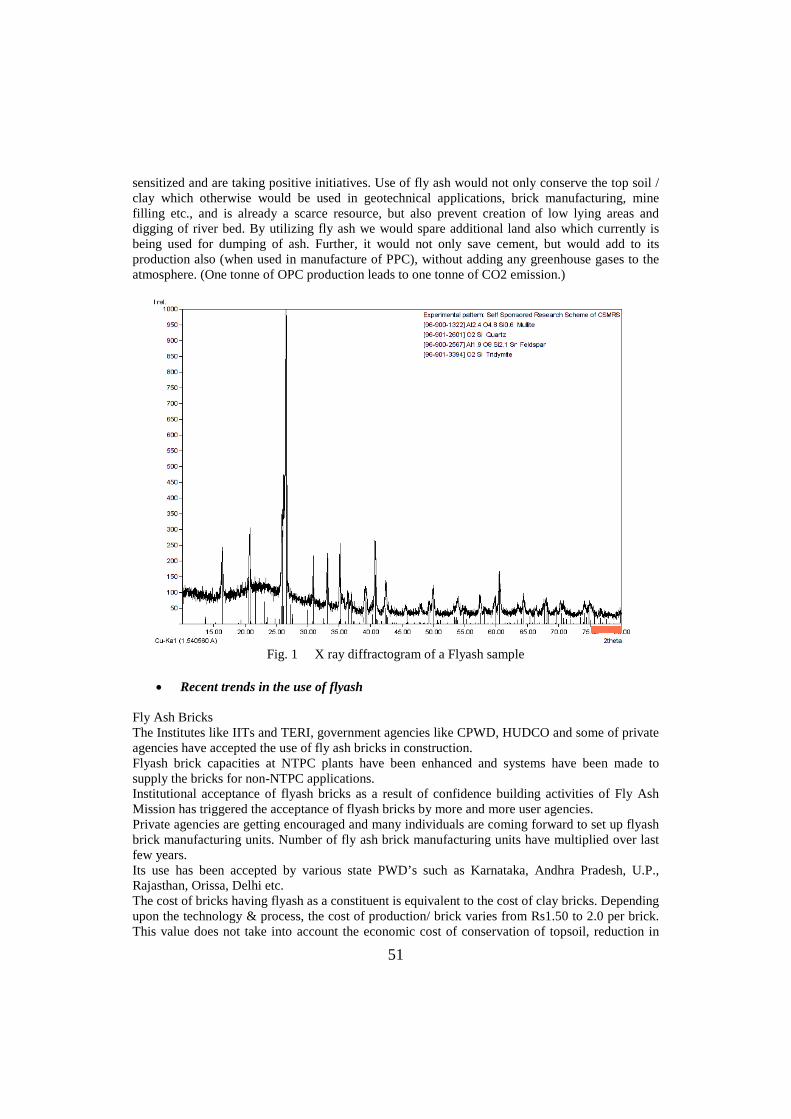
51
sensitized and are taking positive initiatives. Use of fly ash would not only conserve the top soil / clay which otherwise would be used in geotechnical applications, brick manufacturing, mine filling etc., and is already a scarce resource, but also prevent creation of low lying areas and digging of river bed. By utilizing fly ash we would spare additional land also which currently is being used for dumping of ash. Further, it would not only save cement, but would add to its production also (when used in manufacture of PPC), without adding any greenhouse gases to the atmosphere. (One tonne of OPC production leads to one tonne of CO2 emission.)
Fig. 1 X ray diffractogram of a Flyash sample
• Recent trends in the use of flyash
Fly Ash Bricks The Institutes like IITs and TERI, government agencies like CPWD, HUDCO and some of private agencies have accepted the use of fly ash bricks in construction. Flyash brick capacities at NTPC plants have been enhanced and systems have been made to supply the bricks for non-NTPC applications. Institutional acceptance of flyash bricks as a result of confidence building activities of Fly Ash Mission has triggered the acceptance of flyash bricks by more and more user agencies. Private agencies are getting encouraged and many individuals are coming forward to set up flyash brick manufacturing units. Number of fly ash brick manufacturing units have multiplied over last few years. Its use has been accepted by various state PWD’s such as Karnataka, Andhra Pradesh, U.P., Rajasthan, Orissa, Delhi etc. The cost of bricks having flyash as a constituent is equivalent to the cost of clay bricks. Depending upon the technology & process, the cost of production/ brick varies from Rs1.50 to 2.0 per brick. This value does not take into account the economic cost of conservation of topsoil, reduction in
52
pollution & expenditure in waste management measures. These are additional benefits, which are very important especially in the current situation of environment degradation. Fly Ash Cement/ Fly Ash as a part replacement of cement Use of flyash as a part replacement of cement in mortar and concrete has started with IIT-Delhi taking the lead. CPWD has agreed to seriously reconsider permitting the use of flyash cement in its construction. Manufacture and use of flyash cellular concrete has started at Chennai, Hyderabad & Delhi. Cement Manufacturer’s Association (CMA) and Association of Ready Mix Concrete (RMC) are also taking initiatives to enhance the use of flyash in cement and RMC. Use of flyash in mortar, concrete, cellular concrete etc. results in saving of around 20-30% cement. Flyash is emerging as a part-replacement to cement - it has been found that lower w/c ratio can facilitate high quantity of cement replacement. This shall lead to enormous cost saving in building construction. Roller Compacted concrete provides scope for nearly 60-70% substitution of cement by flyash in dam construction which is being separately dealt in the following paragraph. Hydro Power Sector Construction of two dams using Roller Compacted Concrete (RCC) Technology at Ghatghar near Nashik (Maharashtra) has been completed using high doses of flyash (replacing 60-70% cement). Construction of dams using RCC technology with high doses of fly ash is a standard practice worldwide. Use of fly ash in Hydraulic Structures provides a number of other benefits in addition to saving of cement. These are: Reduction of heat of hydration and thus faster construction rates. Reduction of heat of hydration, reduces/eliminates requirement of cooling / chilling plants. Reduction in heat of hydration allows construction over longer durations. It provides higher durability against attacks of sulphates etc. It avoids leaching of lime and provides more impermeability. The longer duration of construction periods reduce the number of seasons/years of construction for the hydraulic structures. Thus construction capital equipment gets freed much faster and infrastructure generated becomes available for utilisation in less number of years. Road Embankments Use of flyash in the construction of road embankments has been successfully demonstratedin the country. It is gaining acceptance. The Ministry of Surface Transport and CPWD have in principle accepted this use of flyash and have cleared/ executed a few projects. Flyash specification are being incorporated in forthcoming projects also. Design guidelines and specifications for flyash use in embankment construction have been approved by IRC. Use of fly ash in road embankment leads to saving of large volumes of top soil and equal consumption of flyash. The best example is the Nizammudin bridge in Delhi, approach road embankment in which use of 150, 000 tonne of fly ash led to 10% saving (Rs. 1.5 crore) in total project cost. It is estimated that use of bottom ash in sub base, soil-bottom ash mix in base course and lime flyash soil in base course give savings of around 50%, 40% and 10% respectively over use of conventional materials for the respective constructions. This estimate does not account for the environmental cost savings. Ash Pond Dykes Ash dykes are being increasingly constructed with flyash which shall lead to reduction in demand of land for flyash disposal and demand of top soil to raise the dykes.
53
Case studies have revealed that raising of ash dyke (using pond ash) is the most cost effective disposal method. The method of disposing pond ash to a different location to create capacity or construction of new pond are about 10 times costlier than ash dyke raising of existing pond.
• Structural Fill/ Reclamation of Low Lying Areas
Use of flyash as a structural fill material for reclaiming low lying areas has also started getting acceptance by the users. Large numbers of low lying areas are being reclaimed by flyash across the country; it saves scarce top soil and reduces demand on land for ash ponds. Structural fills of fly ash can be used as a normal reclaimed low lying area.
• Stowing Material for Mine Fill
Use of flyash as a mine fill material has been demonstrated by NTPC & MOEF at two sites. Two projects have been initiated by FAM. Heavy expenditure is incurred by mining authorities in transporting sand from more than 40-50 km. Use of fly ash will result in tremendous cost savings in transportation of sand and relatively economical disposal of fly ash.
• Agro-forestry Applications
Use of flyash in agricultural applications has been well demonstrated and has been accepted by a large number of farmers. This use is picking up in Karnataka, Tamil Nadu, West Bengal and Madhya Pradesh and for wasteland reclamation in Uttar Pradesh. Use of fly ash in agriculture results in 15-20% higher yields therefore the prospect of greater profit for farmers. It can be used as a soil conditioner for clayey or sandy soil and also for saline soils.
• Other fly ash based products
Flyash can be used in manufacturing of several products like extender/ pigment in emulsion paint formulations, wood substitute in combination with organic fibre, light weight aggregate, tiles etc. These products are competitive to conventional material and provide several indirect benefits like waste recycling, reduced pollution, conservation of soil etc.
IMPEDIMENTS
Awareness campaign has started among the flyash producers and users regarding the useful properties of fly ash and its proper collection/ handling systems and for the need to handle and transport fly ash in environment friendly manner. Utilization and safe disposal of flyash has gained momentum in the recent times, but considering the magnitude of the problem and the vast potential it has for use in various applications, pace of the progress is less than desired. Some of the issues that need to be addressed to achieve exponential growth in flyash utilization are as follows:
The most fundamental reason for any new material or technology taking long time to popularize has been the ‘mental block’ and the same is true in case of flyash utilization also. Any new material should be judged on the basis of its own merit and its advantages vis-à-vis the conventional material rather than having high inertia to change.
54
Another major factor has been ‘lack of awareness’ regarding the material and its properties. In spite of a lot of research and developmental activities going on in the country for last 30 years and a lot of successful examples of fly ash utilization are available in India and abroad; the user agencies are not aware of its vast potential.
The easy availability of ash at power stations has been a major complaint by entrepreneurs. Due to security & logistic constraints power plants are unable to streamline quick & easy delivery of ash. Use of ash / its application area depends on its properties and physical form. In order to enhance ash utilisation it is important that ash is available in segregated form (bottom ash, pond ash, flyash of different fields). The concept of ‘packaging’ ash is yet to come in the fly ash industry. Consequently, the small consumer cannot use ash since it is not available except for bulk users wherein it is transported by trucks etc. Quality control of flyash itself & its final products is an important aspect which needs to be addressed to ensure that lapse in quality control aspects may not lead to disregard of flyash as an excellent material. Many of the relevant BIS standards are underthe process of formulation for use of flyash, upgradation of old standards needs to be taken up. Also, broad guidelines or code of practice need to be drawn up to ensure use of flyash.
FACILITATION
Use of flyash has gained momentum during the past few years. There is growing realization of the fact that indiscriminate dumping/ disposal of ash would lead to environmental & health hazards and land scarcity. Consequently several stakeholder agencies have contributed towards promoting safe disposal & utilisation of flyash in the country. These could be broadly categorized into following spheres of activity:
• R&D / Technology Development: Basic R&D work regarding utilisation of fly ash is going on in almost all research laboratories which include CSIR laboratories, IITs, Universities, research centres of industrial groups etc.
• Technology Demonstration and Facilitation: The agencies working towards technology demonstration, standardisation, policy initiatives, etc. mainly include Fly Ash Mission (FAM), Building Materials & Technology Promotion Council (BMTPC), Housing & Urban Development Corporation (HUDCO), Power Stations (NTPC, SEB’s & Captive), Bureau of Indian Standards (BIS), various Government Ministries (MOEF, MOST, MOP, MOUD, etc.) and state governments etc.
• Large Scale Utilisation: These are mainly user agencies. Some of these are various PWDs (Delhi, Karnataka, Rajasthan, etc.), Delhi Development Authority (DDA), Delhi Metro Rail Corporation (DMRC), private builders, etc.
Fly Ash Mission is a Technology Project in Mission Mode (TPMM) of the Govt. of India focused on promoting safe disposal and gainful utilization of flyash. Fly Ash Mission is a joint activity of MOP, MOEF, DST, academia and industry. Fly Ash Mission has played a major role in networking, sensitizing and developing enthusiasm among several agencies. Technical as well as policy issues have also been rejuvenated. Government initiatives in this direction are listed below: Notification issued by Ministry of Environment & Forests (Sept. 1999) calling for use of fly ash in building material manufacturing & construction activity within 50 km radius of coal or lignite based TPS. CPWD has issued orders to all the zones to have at least one construction using flyash bricks/ blocks, etc.
55
States like Orissa, Tamilnadu, Karnataka have announced fiscal and policy incentives for fly ash based products. For example, the Govt. of Orissa has banned use of topsoil for brick manufacturing within 70 kms radius of a Thermal Power Station and all new fly ash based units will come under category of ‘priority’ industries. It has formed a high powered committee with Fly Ash Mission, Delhi as a member, for the utilization and safe disposal of fly ash. Rajasthan PWD has included flyash bricks in its list of materials. Import of machinery for flyash based product manufacturing is exempted from custom duty. Emerging trends of flyash utilisation (as discussed above) are indicators of the general change in public perception & attitude towards fly ash. After nearly 3-4 decades of research efforts, flyash is now being considered as a resource material and for inclusion in standards for additional applications by Bureau of Indian Standards. The Standardization initiatives by BIS have focused on use of flyash in road embankments (IRC) and have brought in various revisions in the applicable codes:
• Revision of IS 3812 – the code is proposed to be brought out in 5 parts (i) for use as pozzolana and admixture in cement, mortar & concrete (under issuance), (ii) fly ash in lime pozzolana mixture applications, (iii) sintered applications, (iv) geotechnical and (v) agricultural application.
• Updating of IS: 456 – code of practice for plain and reinforced concrete has been updated with use of flyash.
• Minimum and maximum percentages of flyash in PPC have been revised to 15% and 35% respectively etc.
Apart from standardization, FAM has worked towards ‘confidence building’ efforts through the technology demonstration projects in various thrust areas. It has networked with producers, user agencies, and entrepreneurs etc. towards facilitation of availability of flyash & its products, creating awareness regarding advantages of fly ash as a material, providing technical & facilitating support to industry as well as researchers.
Fly Ash Mission is now a hub of national expertise on flyash. Information / data relating to fly ash availability, sourcing of technology, network of expertise is within the ambit. FAM has contributed towards creating greater awareness & networking between R&D, academia & industry. A national spread of project sites has been planned to reach to a larger spectrum of technologists, engineers, users, entrepreneurs. Flyash has made an entry into academics. It has become a part of curriculum at several institutions.
CONCLUSION
Since India will continue to depend on high ash content coal for more than 70% of its power supply, it is only natural that flyash generation will continue. Its optimal utilization is important for India since indiscriminate dumping of flyash is hazardous .The material has got properties akin to soil and tremendous potential for utilization. Lessons have to be learnt from countries like Belgium, Germany, Netherlands, etc. – which have high utilization levels. Important factors contributing to high utilization levels in these countries are strict environment legislations and individual commitments to use waste/ by-products. Fly Ash Mission has taken the lead towards standardization, availability/ sourcing of ash / ash products and information dissemination towards confidence building for large scale utilization of flyash. However, looking at the magnitude of the problem and the sensitive issue of environment it
56
involves, many more and stronger institutional mechanisms are required at national and state levels.
References
Basu, P.C. and Saraswati, S. (2006), “High Volume Fly Ash Concrete with Indian Ingredients”, The Indian Concrete Journal, March, 37–48.
Basu, P.C. and Saraswati, S. (2006), “Are Existing IS Codes Suitable for Engineering of HVFAC?”, The Indian Concrete Journal, August, 17– 1.
Chandra, S. (2002), “Properties of Concrete with Mineral and Chemical Admixtures”, Structure and Performance of Cements, J. Bensted, and P. Barnes ed, Spon Press, London, 140–186.
Chatterjee, A.K. (2008), “Enhancing the Potential of Industrial use of the Indian Fly Ashes Through Mechano-Chemical Activation – Prospects and Problems”, International Conference on Mechano-Chemistry and Mechanical Alloys, National Metallurgical Laboratory, Jamshedpur, India.
Das, S.K. and Yudhbir (2003), “Chemistry and Mineralogy of Some Indian Fly Ashes”, The Indian Concrete Journal, September, 1491 – 1494.
Dattatreya, J.K., Neelamegam, M. and Rajamane, N.P. (2006), A Comparison of Effects of Ultrafine Fly Ash and Silica Fume in Concrete”, The Indian Concrete Journal, February, 44–50.
Davidovits, J. (1988), “Soft Mineralogy and Geopolymers”, Proceeding of Geopolymer 88 International Conference, the Universite de Technologie, Compiegne, France.
Davidovits, J. (1994), “High-Alkali Cements for 21st Century Concretes”, Proceedings of V. Mohan Malhotra Symposium on Concrete Technology – Past, Present and Future, . P. Kumar Mehta ed, ACI SP–144, 383–397.
Desai, J.P. (2004),“Construction of HVFA Concrete Pavements in India: Four Case Studies”, The Indian Concrete Journal, November, 67–71.
Duxson, P. and Provis, J.C. (2008), “Designing Precursors for Geopolymer Cements”, J. Am. Ceram. Soc. 91 (12), 3864–3869
Fournier, B., Lu, D., Charland, J.P, and Li, J. (2004), “Evaluation of Indian Fly Ashes for Use in HVFA Concrete, Part 1: Characterization”, The Indian Concrete Journal, November, 22-30.
Jones, T.R. (2002), “Metakaolin as a Pozzolanic Addition to Concrete”, Structure and Performance of Cements, J. Bensted and P. Barnes ed, Spon Press, London, 372– 399.
Mullick, A.K. (2005), “Use of Fly Ash in Structural Concrete: Part 1 – Why ?”, The Indian Concrete Journal, May, 13–22.
V Kumar, C N Jha, P Sharma, `Flyash – A Fortune for the Construction Industry’, Build India 99, New Delhi.
V Kumar, M Mathur, C N Jha, G Goswami,(1999)`Characterisation of flyash – a multifacet resource material’, Conference on flyash characterisation & geotechnical applications, Bangalore.
V Kumar & P Sharma,(1999) `Flyash Management in Iron & Steel Industry’,Conference on Environmental& Waste Management, Jamshedpur.
V Kumar, Preeti Sharma, Mukesh Mathur(1999), ‘Fly Ash Disposal: Mission beyond 2000 A. D., , Fly Ash disposal and deposition: beyond 2000 A.D. Narosa Publishing House.
Nataraj, M.C., Jayaram, M.A. and Ravikumar, C.N.(2006),“Group-indexing Fly Ashes through Radial Basis Function Network”, The Indian Concrete Journal, July, 39 – 45.
Rangan, B .V.(2007),“Low Calcium Fly Ash Based Geopolymere Concrete”,Chapter 26,Concrete Construction Engineering Hand book, E.C.Nawy ed, CRC Press, NY
Taylor, H.F.W..(1990), “Cement Chemistry”, Academic Press, London, 312. Withers, G. (2008), “Utilizing Fly Ash Particles to Produce Low-Cost Metal Matrix Composites”,
Ash at Work, 1, 50 – 54. Zacchariassen, W.J. (1932), “The Atomic Arrangement in Glass”, J. Am. Ceram. Soc., 54, 3841 –
3951.
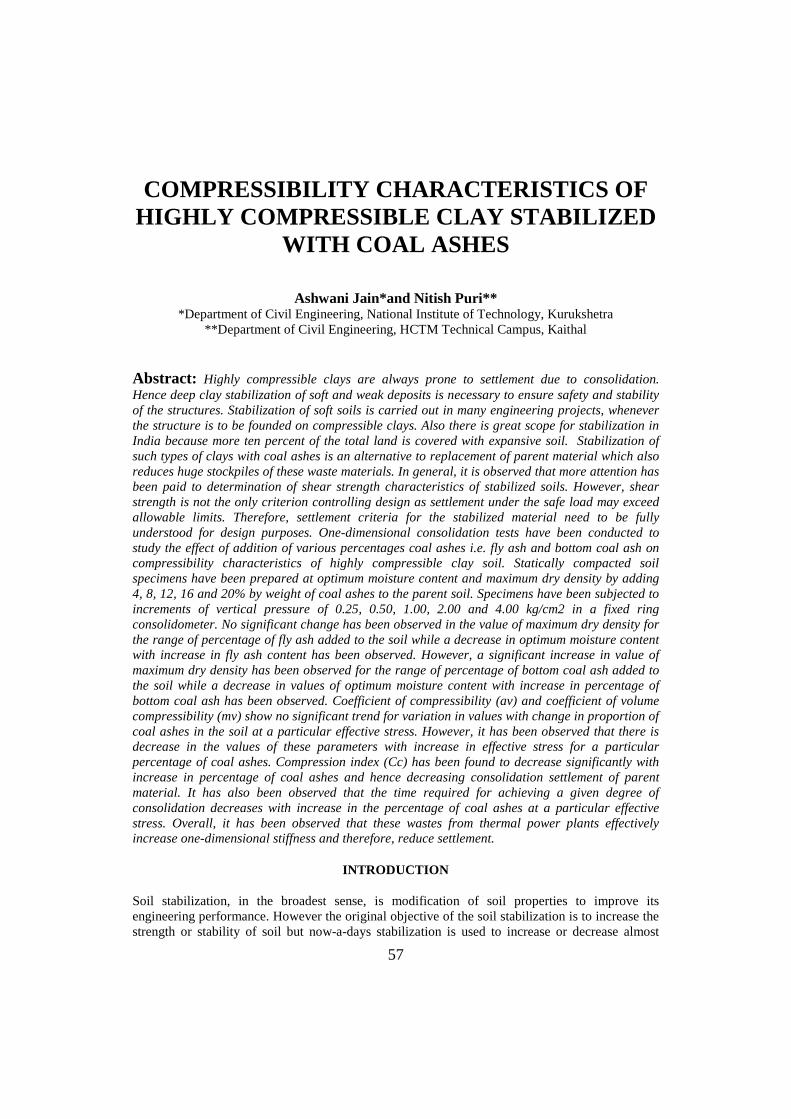
57
COMPRESSIBILITY CHARACTERISTICS OF HIGHLY COMPRESSIBLE CLAY STABILIZED
WITH COAL ASHES
Ashwani Jain*and Nitish Puri** *Department of Civil Engineering, National Institute of Technology, Kurukshetra
**Department of Civil Engineering, HCTM Technical Campus, Kaithal
Abstract: Highly compressible clays are always prone to settlement due to consolidation. Hence deep clay stabilization of soft and weak deposits is necessary to ensure safety and stability of the structures. Stabilization of soft soils is carried out in many engineering projects, whenever the structure is to be founded on compressible clays. Also there is great scope for stabilization in India because more ten percent of the total land is covered with expansive soil. Stabilization of such types of clays with coal ashes is an alternative to replacement of parent material which also reduces huge stockpiles of these waste materials. In general, it is observed that more attention has been paid to determination of shear strength characteristics of stabilized soils. However, shear strength is not the only criterion controlling design as settlement under the safe load may exceed allowable limits. Therefore, settlement criteria for the stabilized material need to be fully understood for design purposes. One-dimensional consolidation tests have been conducted to study the effect of addition of various percentages coal ashes i.e. fly ash and bottom coal ash on compressibility characteristics of highly compressible clay soil. Statically compacted soil specimens have been prepared at optimum moisture content and maximum dry density by adding 4, 8, 12, 16 and 20% by weight of coal ashes to the parent soil. Specimens have been subjected to increments of vertical pressure of 0.25, 0.50, 1.00, 2.00 and 4.00 kg/cm2 in a fixed ring consolidometer. No significant change has been observed in the value of maximum dry density for the range of percentage of fly ash added to the soil while a decrease in optimum moisture content with increase in fly ash content has been observed. However, a significant increase in value of maximum dry density has been observed for the range of percentage of bottom coal ash added to the soil while a decrease in values of optimum moisture content with increase in percentage of bottom coal ash has been observed. Coefficient of compressibility (av) and coefficient of volume compressibility (mv) show no significant trend for variation in values with change in proportion of coal ashes in the soil at a particular effective stress. However, it has been observed that there is decrease in the values of these parameters with increase in effective stress for a particular percentage of coal ashes. Compression index (Cc) has been found to decrease significantly with increase in percentage of coal ashes and hence decreasing consolidation settlement of parent material. It has also been observed that the time required for achieving a given degree of consolidation decreases with increase in the percentage of coal ashes at a particular effective stress. Overall, it has been observed that these wastes from thermal power plants effectively increase one-dimensional stiffness and therefore, reduce settlement.
INTRODUCTION
Soil stabilization, in the broadest sense, is modification of soil properties to improve its engineering performance. However the original objective of the soil stabilization is to increase the strength or stability of soil but now-a-days stabilization is used to increase or decrease almost
58
every engineering property. Also there is great scope for stabilization in India because more ten percent of the total land is covered with expansive soil [9]. Over the last few years, the use of thermal power plant wastes has increased as stabilizing materials for naturally occurring fine-grained soils. These waste products pose a serious environmental problem if not disposed of properly [1]. Their use serves two purposes; firstly the disposal of waste material and secondly, use as construction material.
The purpose of present study is to see the effect of coal ashes (Fly Ash and Bottom Coal Ash) in improving consolidation characteristics of clayey soils. A better understanding of these characteristics will enhance the usage of these materials in geotechnical engineering works in places where they are abundant and thereby making clays suitable for foundation purposes. The study also focuses at reduction of huge stockpile these coal ashes and their potential impact on the environment.
NEED OF PRESENT STUDY
Good serviceability by any structure can only be expected when its foundation satisfies the following three basic criteria; namely a) Location and depth criterion; b) Shear failure or bearing capacity criterion and c) Settlement criterion.
Magnitude and rate of settlement for foundations due to structural loads must be predicted before construction. If the settlement is excessive, meaning more than what is permissible for the structure, it may cause structural damage or malfunctioning, especially when the rate of such settlement is rapid.
Hence, proper investigation of soil profile beneath the proposed structure as well as proper designing of structures on the basis of settlement criterion in such type of soils is a must. That is why, geotechnical engineers are frequently asked to do the investigation on differential settlement problems [10]. In general, it is observed that more attention has been paid to determination of shear strength characteristics of stabilized soils. However, shear strength is not the only criterion controlling design as settlement under safe load may exceed allowable limits. In the present work, compressibility characteristics have been studied for locally available highly compressible clay treated with different percentages of rice husk by conducting a series of one dimensional consolidation tests.
MATERIALS
• Highly compressible clay
Clay used in the experiments was collected from Samani, Traffic Police Post, GT Road, District Kurukshetra, Haryana. The soil is classified as highly compressible clay, CH, as per IS: 1498 (1970) [5].
• Fly Ash & Bottom Coal Ash
It was collected from the first hopper at Panipat Thermal Power Plant, Village Assan, Jind Road, Panipat. Fly ash is classified as ML as per IS: 1498 (1970) [5]. The index properties of the flyash and coal ash used in the study are reported in Table 1.
Table 1: Index properties of materials
59
• Sample preparation
The whole process of sampling can be divided into three parts:
• Composition of specimens Specimens of parent clay and clay treated with 4, 8, 12, 16 and 20% by weight of coal ashes
passing 425 micron IS sieve were prepared at maximum dry density and optimum moisture content as per IS: 2720 (Part 7) (1974) [6].
• Mixing Oven dry soil was dry mixed with various percentages of coal ash. Sufficient quantity of
water was then added to bring the moisture content to the desired level. The mixture was then manually mixed thoroughly with a spatula. All the specimens were kept in polythene bags for maturing for one week.
• Static compaction Cylindrical specimens were compacted by static compaction in 10 cm diameter consolidation
ring to the required height of 2.5 cm. The inner surface of the ring was smeared with mobile oil to help minimize friction between inner surface of the ring and the soil sample during consolidation process. The wet homogenous mixture was placed inside the specimen ring using spoon and leveled. Then extension collar was attached to it and both the exposed sides of the sample were covered with filter papers. After that porous stone and pressure pad were inserted into the extension collar and the whole assembly was statically compacted in loading frame to the desired density. The sample was kept under static load for not less than 20 minutes in order to account for any subsequent increase in height of sample due to swelling [12].
RESULTS AND DISCUSSIONS
A series of one-dimensional consolidation tests were conducted to determine the compressibility characteristics of untreated clay and clay stabilized with coal ashes to evaluate its effect in reducing compressibility of the soil. These characteristics have been illustrated by establishing the relationships between void ratio and effective stress [2][3][4][7][8]. In order to determine rate and magnitude of consolidation, coefficient of compressibility, coefficient of volume compressibility,
Index Properties Materials
Parent Clay Fly Ash Bottom Coal Ash
Grain Size Distribution
Data
Gravel (%) 0 0 8.92 Sand (%) 6.75 7.5 81.03
Clay + Silt (%) 93.25 92.5 10.05%
Specific Gravity 2.48 2.09 2.57 Liquid Limit 54
NP NP Plastic Limit 25 Plasticity Index 29 Is Classification CH ML SM
OMC (%) 23.5 - - MDD (g/cc) 1.56 - -
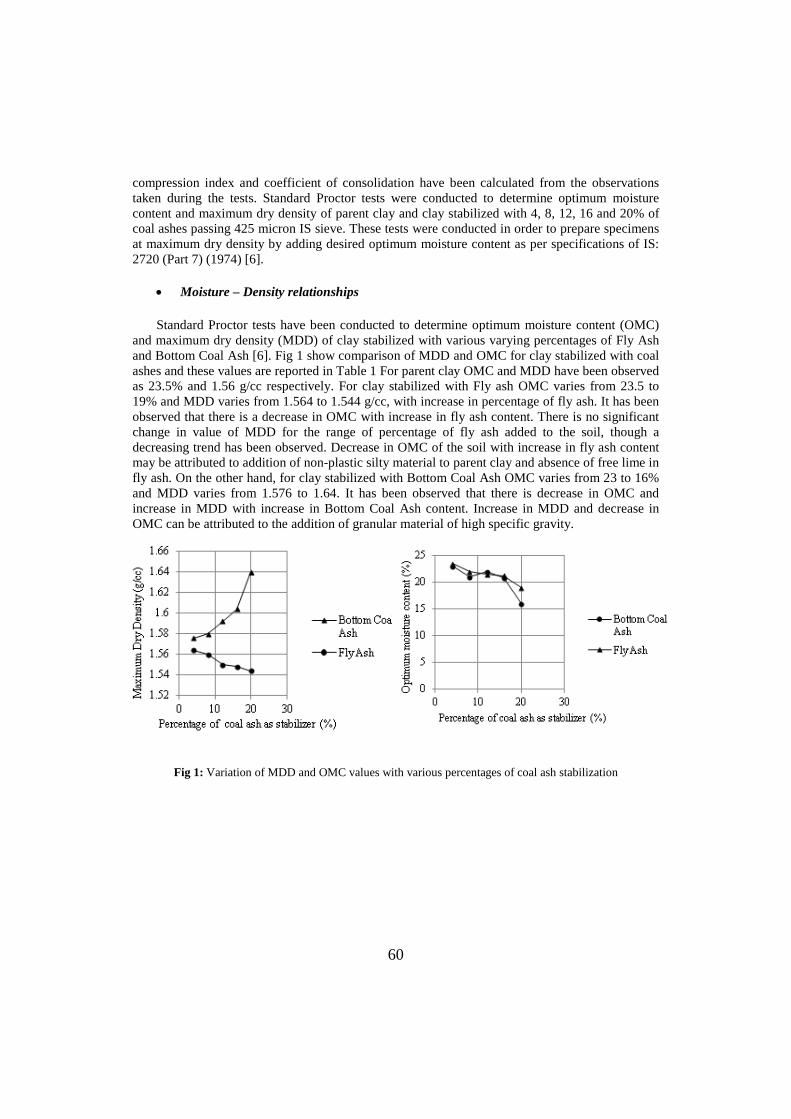
60
compression index and coefficient of consolidation have been calculated from the observations taken during the tests. Standard Proctor tests were conducted to determine optimum moisture content and maximum dry density of parent clay and clay stabilized with 4, 8, 12, 16 and 20% of coal ashes passing 425 micron IS sieve. These tests were conducted in order to prepare specimens at maximum dry density by adding desired optimum moisture content as per specifications of IS: 2720 (Part 7) (1974) [6].
• Moisture – Density relationships
Standard Proctor tests have been conducted to determine optimum moisture content (OMC) and maximum dry density (MDD) of clay stabilized with various varying percentages of Fly Ash and Bottom Coal Ash [6]. Fig 1 show comparison of MDD and OMC for clay stabilized with coal ashes and these values are reported in Table 1 For parent clay OMC and MDD have been observed as 23.5% and 1.56 g/cc respectively. For clay stabilized with Fly ash OMC varies from 23.5 to 19% and MDD varies from 1.564 to 1.544 g/cc, with increase in percentage of fly ash. It has been observed that there is a decrease in OMC with increase in fly ash content. There is no significant change in value of MDD for the range of percentage of fly ash added to the soil, though a decreasing trend has been observed. Decrease in OMC of the soil with increase in fly ash content may be attributed to addition of non-plastic silty material to parent clay and absence of free lime in fly ash. On the other hand, for clay stabilized with Bottom Coal Ash OMC varies from 23 to 16% and MDD varies from 1.576 to 1.64. It has been observed that there is decrease in OMC and increase in MDD with increase in Bottom Coal Ash content. Increase in MDD and decrease in OMC can be attributed to the addition of granular material of high specific gravity.
Fig 1: Variation of MDD and OMC values with various percentages of coal ash stabilization
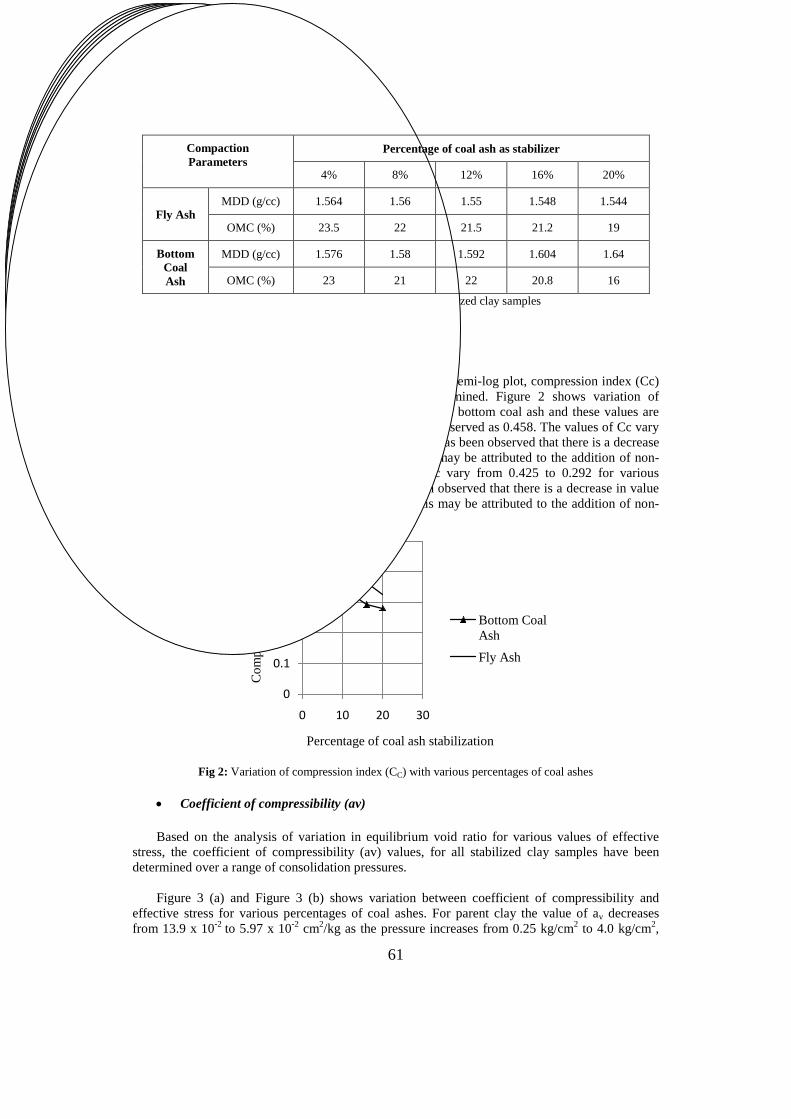
61
Table 5.1 Compaction parameters of stabilized clay samples
• Compression Index
Based on the analysis of pressure-void ratio curves on semi-log plot, compression index (Cc) values, for all stabilized clay samples have been determined. Figure 2 shows variation of compression index with various percentages of fly ash and bottom coal ash and these values are reported in Table 5.2. The value of Cc for parent clay is observed as 0.458. The values of Cc vary from 0.441 to 0.326 for various percentages of fly ash. It has been observed that there is a decrease in value of Cc with an increase in fly ash content. This may be attributed to the addition of non-plastic silty material to parent clay. The values of Cc vary from 0.425 to 0.292 for various percentages of bottom coal ash stabilization. It has been observed that there is a decrease in value of Cc with an increase in bottom coal ash content. This may be attributed to the addition of non-plastic granular material to parent clay.
Fig 2: Variation of compression index (CC) with various percentages of coal ashes
• Coefficient of compressibility (av)
Based on the analysis of variation in equilibrium void ratio for various values of effective stress, the coefficient of compressibility (av) values, for all stabilized clay samples have been determined over a range of consolidation pressures.
Figure 3 (a) and Figure 3 (b) shows variation between coefficient of compressibility and effective stress for various percentages of coal ashes. For parent clay the value of av decreases from 13.9 x 10⁻² to 5.97 x 10⁻² cm2/kg as the pressure increases from 0.25 kg/cm2 to 4.0 kg/cm2,
0
0.1
0.2
0.3
0.4
0.5
0 10 20 30
Com
pres
sion
Inde
x (C
C)
Percentage of coal ash stabilization
Bottom Coal Ash
Fly Ash
Compaction Parameters
Percentage of coal ash as stabilizer
4% 8% 12% 16% 20%
Fly Ash MDD (g/cc) 1.564 1.56 1.55 1.548 1.544
OMC (%) 23.5 22 21.5 21.2 19
Bottom Coal Ash
MDD (g/cc) 1.576 1.58 1.592 1.604 1.64
OMC (%) 23 21 22 20.8 16
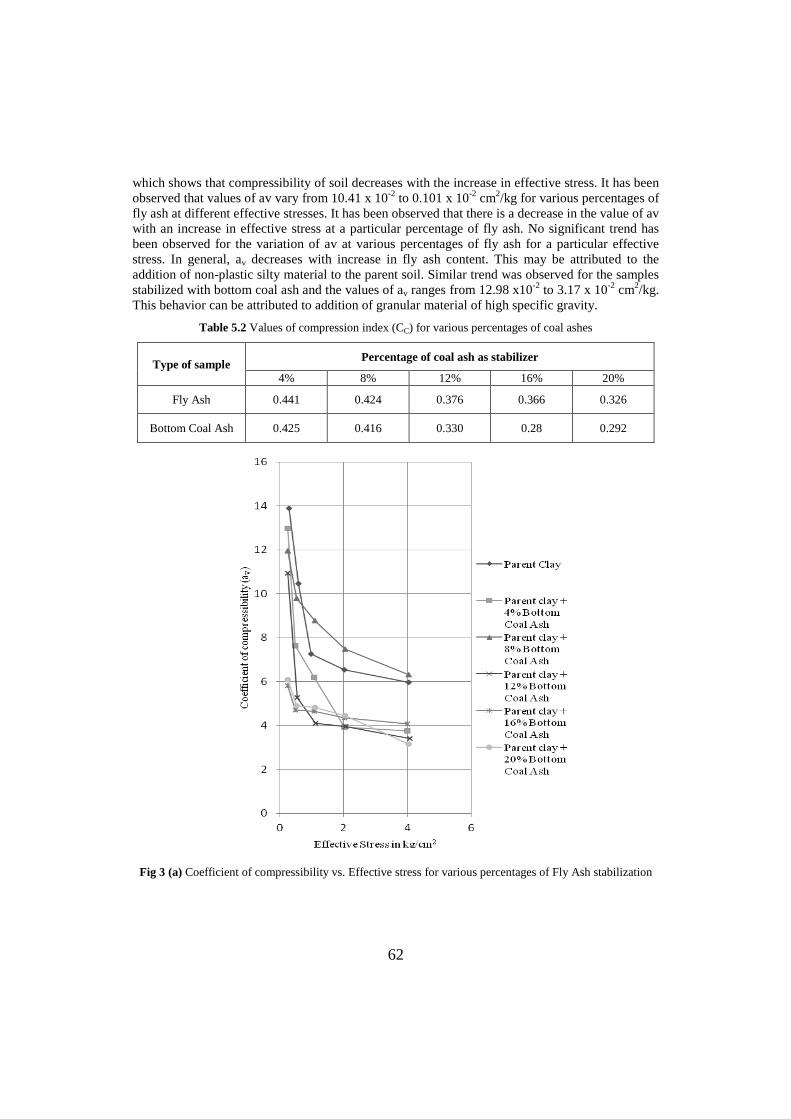
62
which shows that compressibility of soil decreases with the increase in effective stress. It has been observed that values of av vary from 10.41 x 10⁻² to 0.101 x 10⁻² cm2/kg for various percentages of fly ash at different effective stresses. It has been observed that there is a decrease in the value of av with an increase in effective stress at a particular percentage of fly ash. No significant trend has been observed for the variation of av at various percentages of fly ash for a particular effective stress. In general, av decreases with increase in fly ash content. This may be attributed to the addition of non-plastic silty material to the parent soil. Similar trend was observed for the samples stabilized with bottom coal ash and the values of av ranges from 12.98 x10⁻² to 3.17 x 10⁻² cm2/kg. This behavior can be attributed to addition of granular material of high specific gravity.
Table 5.2 Values of compression index (CC) for various percentages of coal ashes
Type of sample Percentage of coal ash as stabilizer
4% 8% 12% 16% 20%
Fly Ash 0.441 0.424 0.376 0.366 0.326
Bottom Coal Ash 0.425 0.416 0.330 0.28 0.292
Fig 3 (a) Coefficient of compressibility vs. Effective stress for various percentages of Fly Ash stabilization
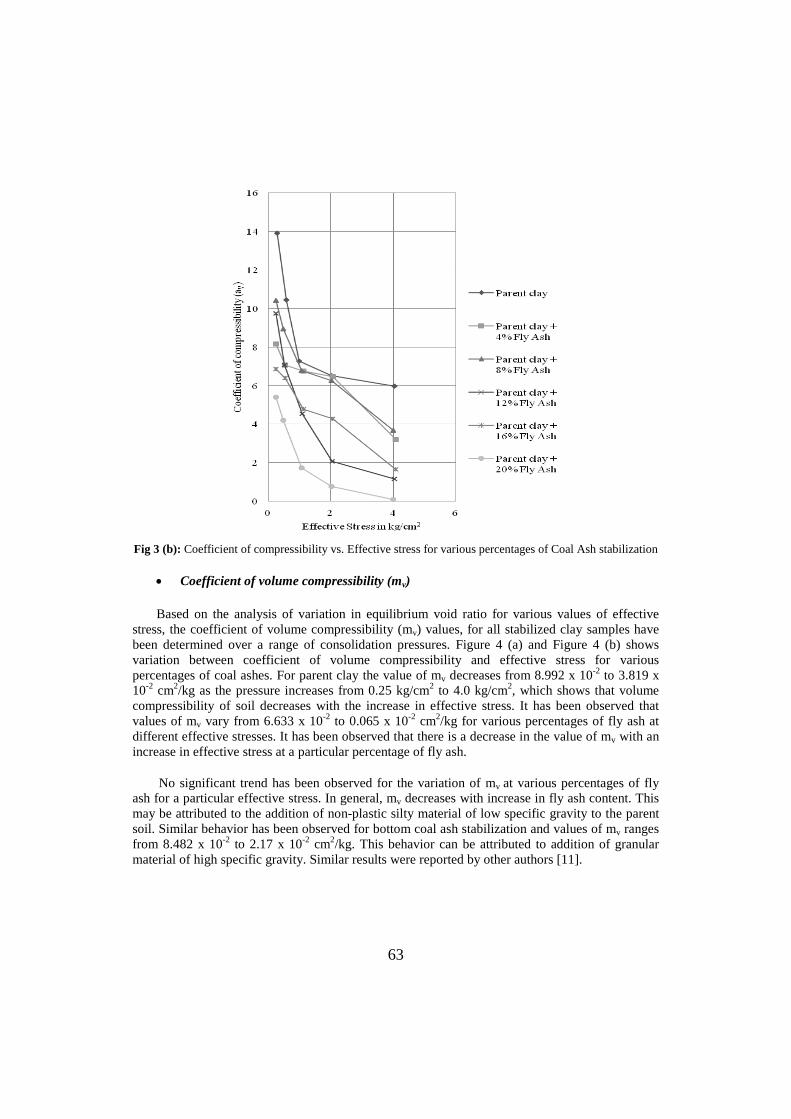
63
Fig 3 (b): Coefficient of compressibility vs. Effective stress for various percentages of Coal Ash stabilization
• Coefficient of volume compressibility (mv)
Based on the analysis of variation in equilibrium void ratio for various values of effective stress, the coefficient of volume compressibility (mv) values, for all stabilized clay samples have been determined over a range of consolidation pressures. Figure 4 (a) and Figure 4 (b) shows variation between coefficient of volume compressibility and effective stress for various percentages of coal ashes. For parent clay the value of mv decreases from 8.992 x 10⁻² to 3.819 x 10⁻² cm2/kg as the pressure increases from 0.25 kg/cm2 to 4.0 kg/cm2, which shows that volume compressibility of soil decreases with the increase in effective stress. It has been observed that values of mv vary from 6.633 x 10⁻² to 0.065 x 10⁻² cm2/kg for various percentages of fly ash at different effective stresses. It has been observed that there is a decrease in the value of mv with an increase in effective stress at a particular percentage of fly ash.
No significant trend has been observed for the variation of mv at various percentages of fly ash for a particular effective stress. In general, mv decreases with increase in fly ash content. This may be attributed to the addition of non-plastic silty material of low specific gravity to the parent soil. Similar behavior has been observed for bottom coal ash stabilization and values of mv ranges from 8.482 x 10⁻² to 2.17 x 10⁻² cm2/kg. This behavior can be attributed to addition of granular material of high specific gravity. Similar results were reported by other authors [11].
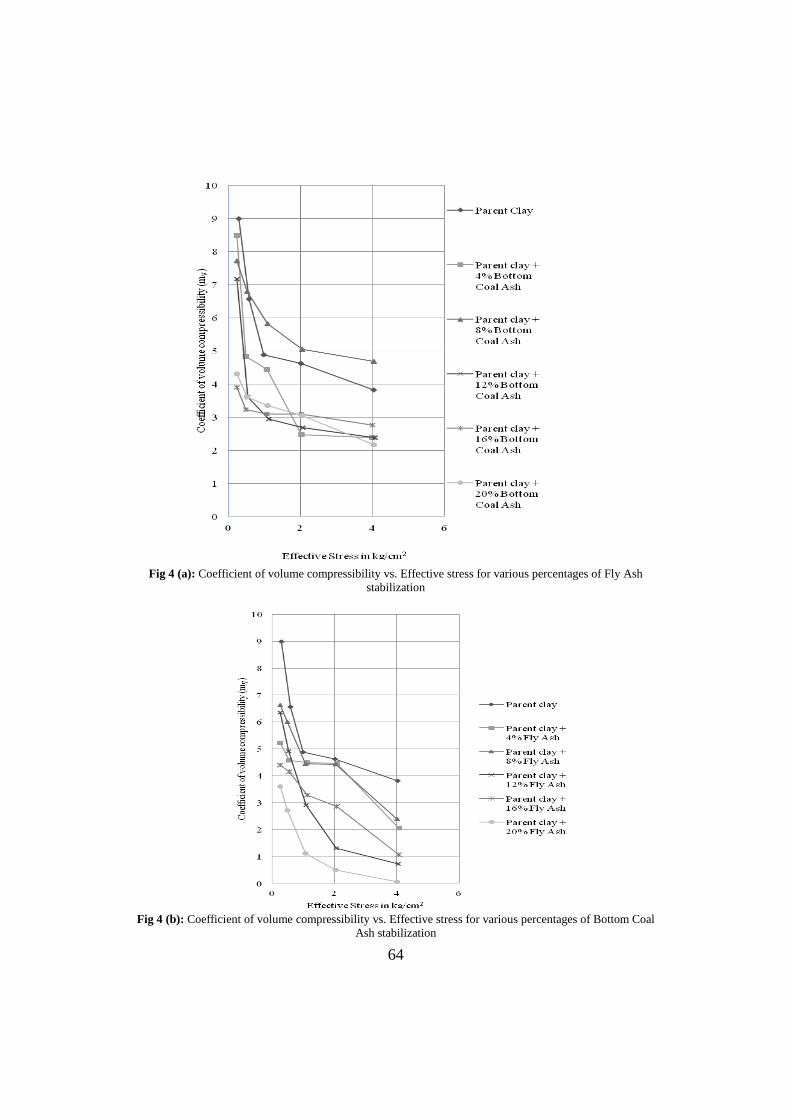
64
Fig 4 (a): Coefficient of volume compressibility vs. Effective stress for various percentages of Fly Ash stabilization
Fig 4 (b): Coefficient of volume compressibility vs. Effective stress for various percentages of Bottom Coal
Ash stabilization
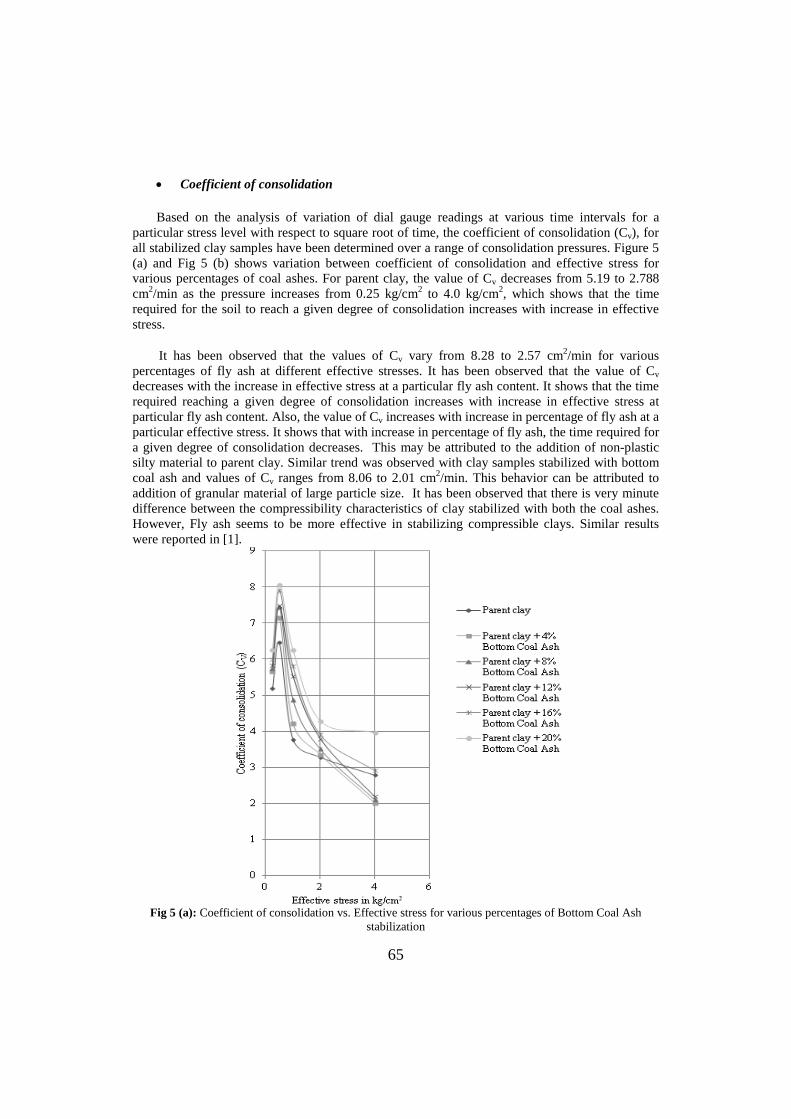
65
• Coefficient of consolidation
Based on the analysis of variation of dial gauge readings at various time intervals for a particular stress level with respect to square root of time, the coefficient of consolidation (Cv), for all stabilized clay samples have been determined over a range of consolidation pressures. Figure 5 (a) and Fig 5 (b) shows variation between coefficient of consolidation and effective stress for various percentages of coal ashes. For parent clay, the value of Cv decreases from 5.19 to 2.788 cm2/min as the pressure increases from 0.25 kg/cm2 to 4.0 kg/cm2, which shows that the time required for the soil to reach a given degree of consolidation increases with increase in effective stress.
It has been observed that the values of Cv vary from 8.28 to 2.57 cm2/min for various percentages of fly ash at different effective stresses. It has been observed that the value of Cv decreases with the increase in effective stress at a particular fly ash content. It shows that the time required reaching a given degree of consolidation increases with increase in effective stress at particular fly ash content. Also, the value of Cv increases with increase in percentage of fly ash at a particular effective stress. It shows that with increase in percentage of fly ash, the time required for a given degree of consolidation decreases. This may be attributed to the addition of non-plastic silty material to parent clay. Similar trend was observed with clay samples stabilized with bottom coal ash and values of Cv ranges from 8.06 to 2.01 cm2/min. This behavior can be attributed to addition of granular material of large particle size. It has been observed that there is very minute difference between the compressibility characteristics of clay stabilized with both the coal ashes. However, Fly ash seems to be more effective in stabilizing compressible clays. Similar results were reported in [1].
Fig 5 (a): Coefficient of consolidation vs. Effective stress for various percentages of Bottom Coal Ash
stabilization
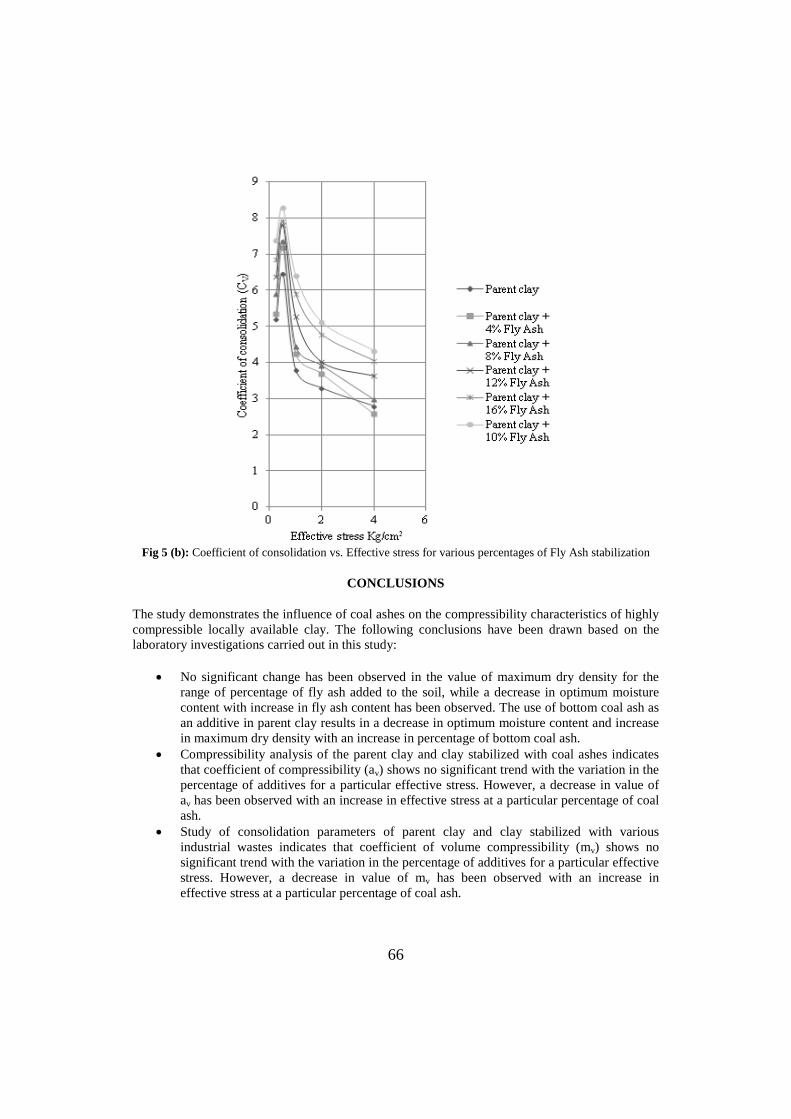
66
Fig 5 (b): Coefficient of consolidation vs. Effective stress for various percentages of Fly Ash stabilization
CONCLUSIONS
The study demonstrates the influence of coal ashes on the compressibility characteristics of highly compressible locally available clay. The following conclusions have been drawn based on the laboratory investigations carried out in this study:
• No significant change has been observed in the value of maximum dry density for the range of percentage of fly ash added to the soil, while a decrease in optimum moisture content with increase in fly ash content has been observed. The use of bottom coal ash as an additive in parent clay results in a decrease in optimum moisture content and increase in maximum dry density with an increase in percentage of bottom coal ash.
• Compressibility analysis of the parent clay and clay stabilized with coal ashes indicates that coefficient of compressibility (av) shows no significant trend with the variation in the percentage of additives for a particular effective stress. However, a decrease in value of av has been observed with an increase in effective stress at a particular percentage of coal ash.
• Study of consolidation parameters of parent clay and clay stabilized with various industrial wastes indicates that coefficient of volume compressibility (mv) shows no significant trend with the variation in the percentage of additives for a particular effective stress. However, a decrease in value of mv has been observed with an increase in effective stress at a particular percentage of coal ash.
67
• The use of coal ashes as additives lowers the slope of virgin compression curves, thereby reducing the values of Cc. It has been observed that coal ashes are helpful in reducing compression index and hence decreasing the consolidation settlement of the parent soil.
• Further, it has been observed that the time required for achieving a given degree of consolidation decreases with increase in the percentage of coal ashes at a particular effective stress.
• The study shows that treatment of soil with coal ashes is an effective method of stabilization of problematic soils. To summarize, use of coal ashes is a beneficial proposition which is economical and environment friendly as well. Results of this study can be used in designing foundations on compacted stabilized clay beds [11]. The optimal percentage of stabilizer for a particular project can be worked out keeping in view the other criterion for design, i.e. the shear strength criterion.
References
Ali, Mir Sohail and Koranne, Shubhada Sunil (2011), “Performance Analysis of Expansive Soil Treated with Stone Dust and Fly Ash”, Electronic Journal of Geotechnical Engineering (EJGE), Vol.16.
ASTM: STP 126 (1952),”Symposium on Consolidation Testing of Soils”, 54th Annual Meeting, American Society for Testing and Materials.
ASTM: STP 892 (1986), “Consolidation of Soils: Testing and Evaluation”, American Society for Testing and Materials.
ASTM: D2435/D2435–11 (2011), “Standard Test Methods for One-Dimensional Consolidation Properties of Soil Using Incremental Loading”, American Society for Testing and Materials.
IS: 1498 (1970), ”Indian Standard Methods of Test for Soils: Classification and Identification of Soil for General Engineering Purposes”, Bureau of Indian Standards.
IS: 2720 (Part 7) (1974), “Indian Standard Methods of Test for Soils: Determination of Moisture Content-Dry Density Relation using Light Compaction”, Bureau of Indian Standards.
IS: 2720 (Part 15) (1986), “Indian Standard Methods of Test for Soils: Determination of Consolidation Properties”, Bureau of Indian Standards.
IS: 8009 (Part 1) (1976), “Indian Standard Code of practice for calculation of settlements of foundations, Shallow foundations subjected to symmetrical static vertical loads”, Bureau of Indian Standards.
John, D.N. and Debora, J.M. (1992), “Expansive Soils - Problems and Practice in Foundation and Pavement Engineering”, John Wiley & Sons. Inc., New York.
Ranjan, Gopal and Rao, A.S.R. (2000), “Basic and Applied Soil Mechanics”, New Age International (P) Ltd., New Delhi.
Rao, D. Koteswara, Raju, G.V.R. Prasada and Kumar, K. Ashok (2011), “Consolidation Characteristics of Treated Marine Clay for Foundation Soil Beds”, International Journal of Engineering Science and Technology (IJEST), Vol. 2, No.3, 788-796.
Singh, Alam and Chowdhary, G.R. (1994), “Soil Engineering in Theory and Practice”, Geotechnical Testing and Instrumentation, Vol. 2, CBS Publishers and Distributors, Delhi.
68
ENGINEERED LANDFILL
V. M. Karpe1, P.Y.Sarang 2and P. P. Savoikar 3 1 Government Polytechnic, Bicholim-Goa, India
2 Angel Polytechnic, Verna-Goa, India 3 Civil Engineering Department, Government Polytechnic, Bicholim-Goa, India
4 Don Bosco Engineering College, Margao-Goa, India
Abstract: Population growth and the rapid pace of urbanization in India directly results into mass production of solid waste and pose many environmental challenges for large cities. Various methods of waste disposal like open dumping, incineration, composting and landfills have various adverse impact on environment and also on living beings. Solid waste management (SWM) is a vital, ongoing and large public service system, which needs to be efficiently provided to the community to maintain aesthetic and public health standards. Solid waste contains Biodegradable and non-degradable materials and because of unwanted biological reaction with biodegradable waste the foul smell generates and which also promotes the breeding of insects ,rodents and pathogens that can cause and transmit the diseases. Furthermore, open burning of MSW adversely affects the environment by emitting pollutants in the atmosphere. Thus Municipal agencies will have to plan and execute sustainable waste management programme. There has to be a systematic effort in the improvement in various factors like financial provisions, appropriate technology, operations management, human resource development, public participation and awareness, and policy and legal framework for an integrated SWM system. To achieve “socially and environmentally sound solid waste management”, it is essential to put forward a new paradigm for solid waste management (SWM) that involves source separation, recovery of waste, legitimization of the informal system, partial privatization and public participation. The primary task to achieve this is to design, construct and operate “ENGINEERED LANDFILLS” so as to provide effective barriers against contamination and minimize adverse environmental impact. Engineered landfills are geotechnical structures covering wide area and height ranging from 10 m to more than 150 m. With land becoming scarce especially in urban and industrial areas, there is tendency to design higher and higher landfills to accommodate more and more waste in the same area. To achieve Cleanliness, which is next to Godliness, it is necessary to design and operate an efficient SWM system. Landfills are part of an integrated system for the management of MSW. When carefully designed and well managed within the context of the local infrastructure and available resources, landfills can provide safe and cost-effective disposal of waste .
Key words: Solid waste disposal, solid waste management, engineered landfill.
INTRODUCTION
Globalization, urbanization and industrialization are some of the words which make everyone feel glad that they have made the world smaller by bringing down the barriers, both technically and commercially. Population growth and the rapid pace of urbanization pose many environmental challenges for large cities. Disposal of waste is a problem in the world that continues to grow with the development of industrialized nations and with the growth of population, there has been substantial increase in the generation of waste resulting into the contamination of air, water and land. Human beings are now very much concerned and sensitive to the importance of environment
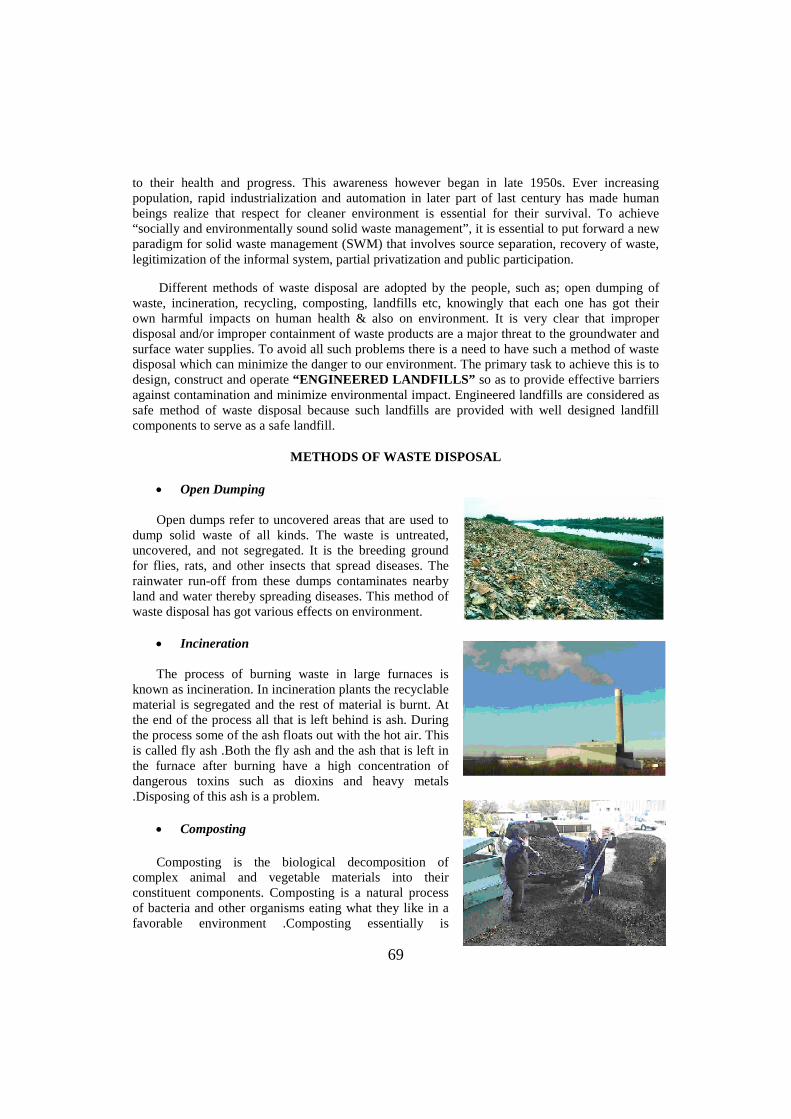
69
to their health and progress. This awareness however began in late 1950s. Ever increasing population, rapid industrialization and automation in later part of last century has made human beings realize that respect for cleaner environment is essential for their survival. To achieve “socially and environmentally sound solid waste management”, it is essential to put forward a new paradigm for solid waste management (SWM) that involves source separation, recovery of waste, legitimization of the informal system, partial privatization and public participation.
Different methods of waste disposal are adopted by the people, such as; open dumping of waste, incineration, recycling, composting, landfills etc, knowingly that each one has got their own harmful impacts on human health & also on environment. It is very clear that improper disposal and/or improper containment of waste products are a major threat to the groundwater and surface water supplies. To avoid all such problems there is a need to have such a method of waste disposal which can minimize the danger to our environment. The primary task to achieve this is to design, construct and operate “ENGINEERED LANDFILLS” so as to provide effective barriers against contamination and minimize environmental impact. Engineered landfills are considered as safe method of waste disposal because such landfills are provided with well designed landfill components to serve as a safe landfill.
METHODS OF WASTE DISPOSAL
• Open Dumping
Open dumps refer to uncovered areas that are used to dump solid waste of all kinds. The waste is untreated, uncovered, and not segregated. It is the breeding ground for flies, rats, and other insects that spread diseases. The rainwater run-off from these dumps contaminates nearby land and water thereby spreading diseases. This method of waste disposal has got various effects on environment.
• Incineration
The process of burning waste in large furnaces is known as incineration. In incineration plants the recyclable material is segregated and the rest of material is burnt. At the end of the process all that is left behind is ash. During the process some of the ash floats out with the hot air. This is called fly ash .Both the fly ash and the ash that is left in the furnace after burning have a high concentration of dangerous toxins such as dioxins and heavy metals .Disposing of this ash is a problem.
• Composting
Composting is the biological decomposition of complex animal and vegetable materials into their constituent components. Composting is a natural process of bacteria and other organisms eating what they like in a favorable environment .Composting essentially is
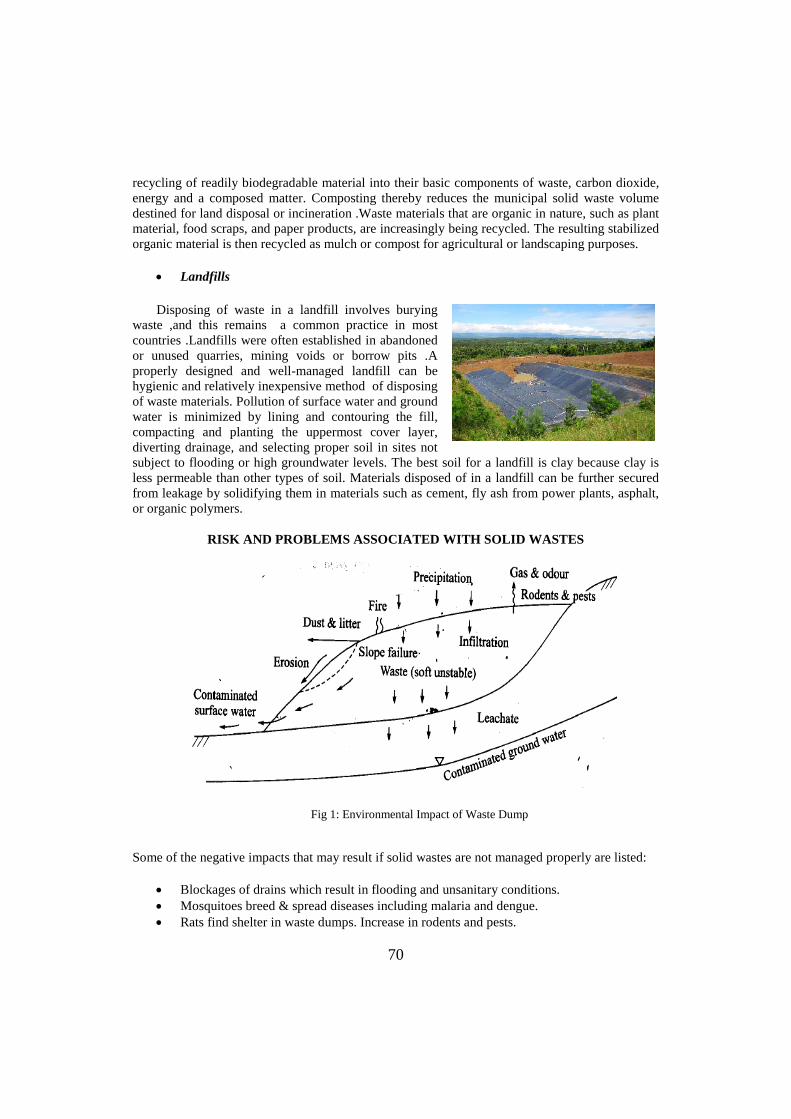
70
recycling of readily biodegradable material into their basic components of waste, carbon dioxide, energy and a composed matter. Composting thereby reduces the municipal solid waste volume destined for land disposal or incineration .Waste materials that are organic in nature, such as plant material, food scraps, and paper products, are increasingly being recycled. The resulting stabilized organic material is then recycled as mulch or compost for agricultural or landscaping purposes.
• Landfills
Disposing of waste in a landfill involves burying waste ,and this remains a common practice in most countries .Landfills were often established in abandoned or unused quarries, mining voids or borrow pits .A properly designed and well-managed landfill can be hygienic and relatively inexpensive method of disposing of waste materials. Pollution of surface water and ground water is minimized by lining and contouring the fill, compacting and planting the uppermost cover layer, diverting drainage, and selecting proper soil in sites not subject to flooding or high groundwater levels. The best soil for a landfill is clay because clay is less permeable than other types of soil. Materials disposed of in a landfill can be further secured from leakage by solidifying them in materials such as cement, fly ash from power plants, asphalt, or organic polymers.
RISK AND PROBLEMS ASSOCIATED WITH SOLID WASTES
Fig 1: Environmental Impact of Waste Dump
Some of the negative impacts that may result if solid wastes are not managed properly are listed:
• Blockages of drains which result in flooding and unsanitary conditions. • Mosquitoes breed & spread diseases including malaria and dengue. • Rats find shelter in waste dumps. Increase in rodents and pests.
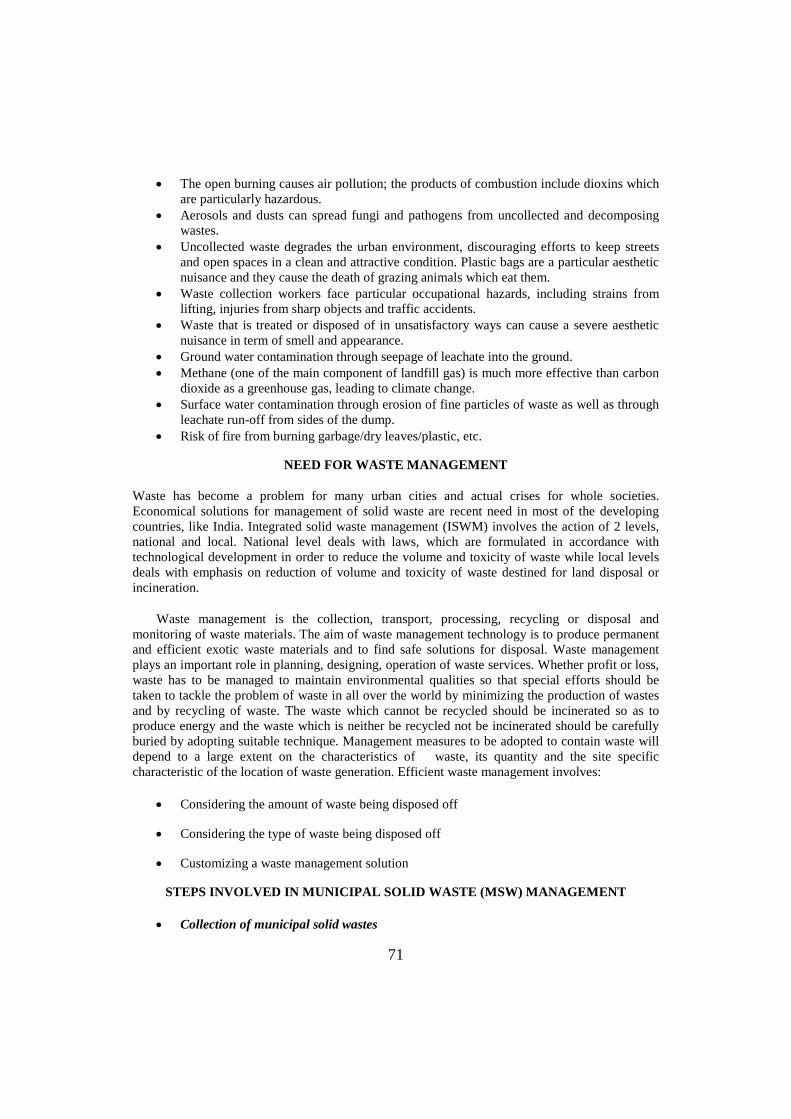
71
• The open burning causes air pollution; the products of combustion include dioxins which are particularly hazardous.
• Aerosols and dusts can spread fungi and pathogens from uncollected and decomposing wastes.
• Uncollected waste degrades the urban environment, discouraging efforts to keep streets and open spaces in a clean and attractive condition. Plastic bags are a particular aesthetic nuisance and they cause the death of grazing animals which eat them.
• Waste collection workers face particular occupational hazards, including strains from lifting, injuries from sharp objects and traffic accidents.
• Waste that is treated or disposed of in unsatisfactory ways can cause a severe aesthetic nuisance in term of smell and appearance.
• Ground water contamination through seepage of leachate into the ground. • Methane (one of the main component of landfill gas) is much more effective than carbon
dioxide as a greenhouse gas, leading to climate change. • Surface water contamination through erosion of fine particles of waste as well as through
leachate run-off from sides of the dump. • Risk of fire from burning garbage/dry leaves/plastic, etc.
NEED FOR WASTE MANAGEMENT
Waste has become a problem for many urban cities and actual crises for whole societies. Economical solutions for management of solid waste are recent need in most of the developing countries, like India. Integrated solid waste management (ISWM) involves the action of 2 levels, national and local. National level deals with laws, which are formulated in accordance with technological development in order to reduce the volume and toxicity of waste while local levels deals with emphasis on reduction of volume and toxicity of waste destined for land disposal or incineration.
Waste management is the collection, transport, processing, recycling or disposal and monitoring of waste materials. The aim of waste management technology is to produce permanent and efficient exotic waste materials and to find safe solutions for disposal. Waste management plays an important role in planning, designing, operation of waste services. Whether profit or loss, waste has to be managed to maintain environmental qualities so that special efforts should be taken to tackle the problem of waste in all over the world by minimizing the production of wastes and by recycling of waste. The waste which cannot be recycled should be incinerated so as to produce energy and the waste which is neither be recycled not be incinerated should be carefully buried by adopting suitable technique. Management measures to be adopted to contain waste will depend to a large extent on the characteristics of waste, its quantity and the site specific characteristic of the location of waste generation. Efficient waste management involves:
• Considering the amount of waste being disposed off
• Considering the type of waste being disposed off
• Customizing a waste management solution
STEPS INVOLVED IN MUNICIPAL SOLID WASTE (MSW) MANAGEMENT
• Collection of municipal solid wastes
72
Organizing house-to-house collection of municipal solid wastes through any of the methods, like community bin collection (central bin), house–to-collection, and collection on regular pre-informed timings and scheduling by using musical bells of the vehicle. Collected waste from residential and other areas shall be transferred to community bin by hand-driven carts or other small vehicles.
• Sorting and Segregation
The term ‘sorting’ indicates separation and storage of individual constituents of waste material.
Stages of sorting • At the source/ household level • At the community bin (municipal bin) • At the transfer station or centralized sorting facility • At waste processing site (pre-sorting and post –sorting) • At the landfill site
Sorting can be carried out manually or through semi-mechanized /fully mechanized systems
• Unloading of waste • Size reduction of waste through shredders and crushers • Size separation of waste using screening devices • Density separation (air classification) of waste • Magnetic separation of waste • Compaction of waste through balers/crushers • Reloading of waste In order to encourage the citizens, municipal authority shall organize awareness programmes
for segregation of wastes and shall promote recycling or reuse of segregated materials.
• Storage of Municipal Solid Wastes
A storage facility shall be so placed that it is accessible to users ,shall be designed that wastes stored are not exposed to open atmosphere and shall be aesthetically acceptable Storage facilities or ‘bins’ shall have ‘easy to operate’ design for handling, transfer and transportation of waste. Bins for storage of bio-degradable wastes shall be painted green, those for storage of recyclable wastes shall be painted white and those for storage of other wastes shall be painted black.
• Processing of Municipal Solid Wastes The biodegradable wastes shall be processed by composting, vermin-composting, anaerobic digestion or any other appropriate biological processing for stabilization of wastes. Mixed wastes containing recoverable resources shall follow the route of recycling. Incineration with or without energy recovery can also be used for processing wastes in specific cases.
• Disposal of municipal solid wastes
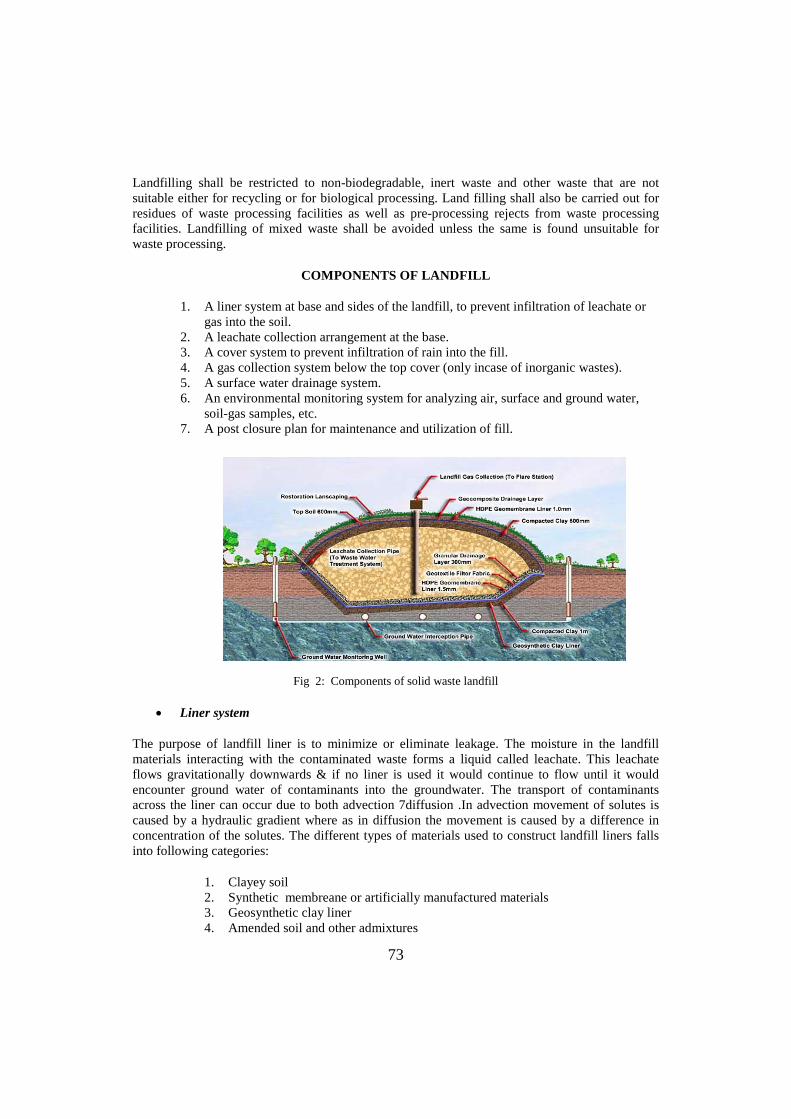
73
Landfilling shall be restricted to non-biodegradable, inert waste and other waste that are not suitable either for recycling or for biological processing. Land filling shall also be carried out for residues of waste processing facilities as well as pre-processing rejects from waste processing facilities. Landfilling of mixed waste shall be avoided unless the same is found unsuitable for waste processing.
COMPONENTS OF LANDFILL
1. A liner system at base and sides of the landfill, to prevent infiltration of leachate or gas into the soil.
2. A leachate collection arrangement at the base. 3. A cover system to prevent infiltration of rain into the fill. 4. A gas collection system below the top cover (only incase of inorganic wastes). 5. A surface water drainage system. 6. An environmental monitoring system for analyzing air, surface and ground water,
soil-gas samples, etc. 7. A post closure plan for maintenance and utilization of fill.
Fig 2: Components of solid waste landfill
• Liner system
The purpose of landfill liner is to minimize or eliminate leakage. The moisture in the landfill materials interacting with the contaminated waste forms a liquid called leachate. This leachate flows gravitationally downwards & if no liner is used it would continue to flow until it would encounter ground water of contaminants into the groundwater. The transport of contaminants across the liner can occur due to both advection 7diffusion .In advection movement of solutes is caused by a hydraulic gradient where as in diffusion the movement is caused by a difference in concentration of the solutes. The different types of materials used to construct landfill liners falls into following categories:
1. Clayey soil 2. Synthetic membreane or artificially manufactured materials 3. Geosynthetic clay liner 4. Amended soil and other admixtures
74
5. Composite liners
The very best clayey soil is widely used for lining non hazardous waste landfills but there is possibility that desiccation cracks may develop because of compacted clayey soil liner since they are subjected to period of drying usually immediately after construction.
In synthetic membrane several polymers that are combined with different additives to form a thermoplastic widely known as geosynthetic membrane is used. Certain grass species may germinate & penetrate through synthetic membrane to prevent such damage, use of herbicide prior to synthetic membrane installation is recommended.
Geosynthetic clay liner are manufactured by sandwiching a uniform layer of dry bentonite between two textiles or attached to a synthetic membrane with an adhesive. When geosynthetic clay liners come in contact with water, it swells forming a continuous layer of bentonite 12-25 mm in thickness. When low permeability clay is not available locally, insitu soils may be mixed with medium to high plasticity imported clay or commercial clays such as bentonite to achieve the required low hydraulic conductivity. Soil bentonite admixtures are commonly used as low permeability amended soil liners.
Geomembrane are continuous membrane type liner/barrier composed of materials of low permeability to control fluid migration. The synthetic component in membranes can be HDPE, PVC, LDPE, EPDM or others. They act as barriers for flow of water or any other fluid. The geo-membrane, in case it is HDPE (High density polyethylene), must be 1.50 mm to 2.50mm. The geomembrane must have direct and uniform contact with the underlying compacted soil component. The compacted clay liner beneath the geomembrane must be 60cm thick with a permeability coefficient of 1 x10⁻⁷ cm/s or less.
A composite liner is a geomembrane underlain by a compacted clay liner or GCL. The leakage through composite liners takes place through defects in geomembrane & permeation of water vapour through geomembrane.To minimize leakage the geomembrane must be placed in good contact with the underlying clay liner or GCL.
Selection of liner materials depends upon the type of waste and landfill operation. The liner should be thick enough to provide low permeability.
• Leachate collection system
Leachate is water that gets badly contaminated by contacting wastes. It seeps to the bottom of the landfill & is collected by the system of pipes. The leachate is analyzed by conventional analytical techniques (toxicity characteristics leaching procedure (TCLP) sampling, mass spectroscopy, and gas chromatography analysis) and if all the listed priority pollutants are less than the stipulated official’s limits of the agencies such as EPA, the waste mass is considered as non-hazardous.A leachate collection system should be located above the liner system. The leachate collection system should be capable of maintaining a leachate head of less than 30cm.
The bottom of the landfill is sloped, pipes laid along the bottom capture contaminated water & leachate as they accumulate. The pumped leachate is treated at a waste water treatment plant, the solids removed from leachate during this step are returned to the landfill. If leachate collection pipes clog up & leachate remains in landfill which results in increasing liquid pressure which becomes the main force driving waste out of the bottom of the landfill when the bottom liners fail.
75
• Cover System
A cover provided over the landfill to keep water out. The cover system consists of barrier and drainage layers. A soil layer is also provided which protects the underlying layers against intrusion, damage and effects of rain/frost.The cover system serves following purposes:
1. Prevention of infiltration of rainwater into the waste, 2. Prevention of leakage of methane and such gases into atmosphere from top of the waste, 3. Lateral drainage of surface water, and 4. Prevention of surface water erosion on the top of the cover by supporting vegetative
growth.
• A gas collection system and retrieval system
Although gas generated within a few waste type landfills may be negligible .Most waste type is expected to generate a significant quantity of gas. The quantity of gas generated depends on waste volume and time. If a gas is expected to be generated from the landfill then proper arrangements should be made for extraction &subsequent treatment. When organic material decomposes the gas generation will take place .Such type of gases mainly generate due to presence of putricible matter or household waste. The landfill gas mainly consists of methane and carbon dioxide. The pollutant in the gas will carry over to the surrounding causing environmental pollution. The retrieval system consists of gas wells and gas collection pipes. The generated gas will be sucked with the pressure through the wells .the generated methane is reused for generating electrical energy for the functioning of various system in the landfill area.
• Surface drainage system
The trickling water with pollutants, which will get generated from the waste body, will be collected in the drainage system provided in the basal lining system. In order to prevent any clogging the surface drainage system is provided with good permeability characteristics .the trickling filter generated from the respective organic ,inorganic and inert waste ,is diverted through the drainage collection pipes and is transported to the treatment plant through organic/inorganic buffer pool.
• Environmental monitoring system
There are essentially two purposes in monitoring a landfill: 1. To find out whether a landfill is performing as designed and, 2. To ensure that the landfill meets all the regulatory standards.
Ground water monitoring, Gas monitoring, Leachate monitoring and Landfill air are usually monitored in a landfill:
• Ground water monitoring
Ground water contamination can be detected using ground water monitoring wells. Monitoring at regular frequencies is needed to judge the change in quality of the ground water .A well should be developed until the water is clear. Materials for well casing depends upon the chemical parameters monitored.PVC pipes can be used to monitor inorganic constituents and for
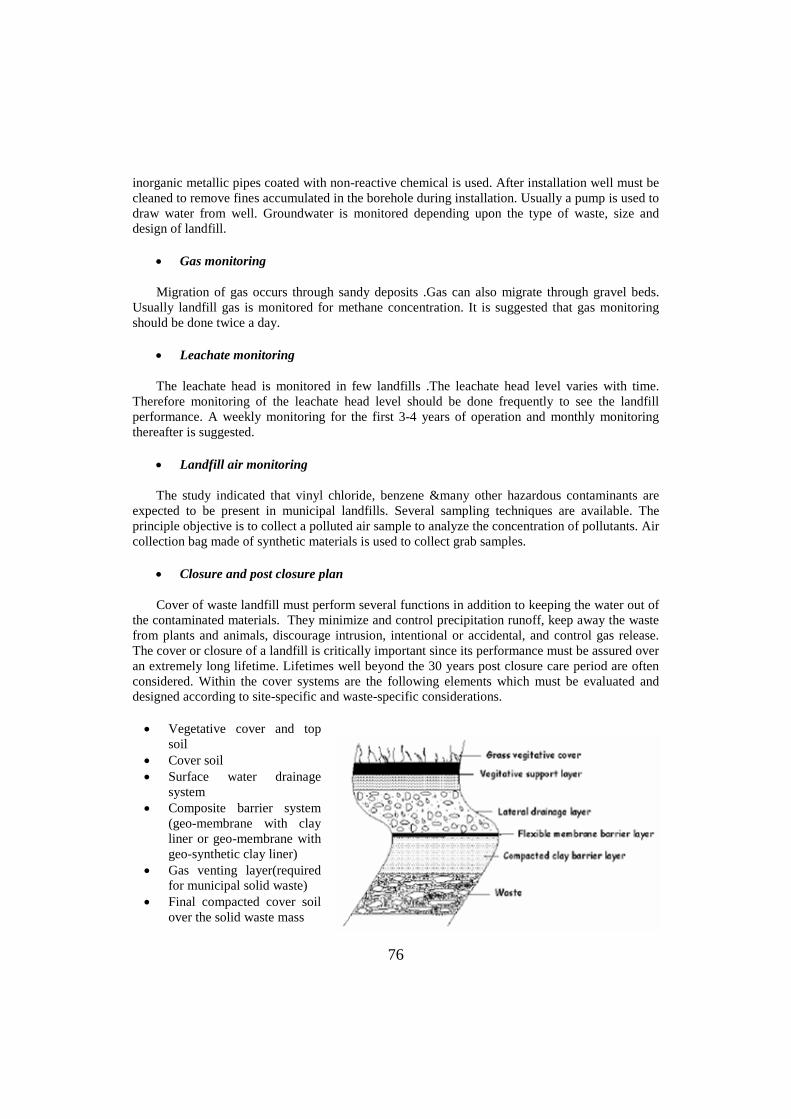
76
inorganic metallic pipes coated with non-reactive chemical is used. After installation well must be cleaned to remove fines accumulated in the borehole during installation. Usually a pump is used to draw water from well. Groundwater is monitored depending upon the type of waste, size and design of landfill.
• Gas monitoring
Migration of gas occurs through sandy deposits .Gas can also migrate through gravel beds. Usually landfill gas is monitored for methane concentration. It is suggested that gas monitoring should be done twice a day.
• Leachate monitoring
The leachate head is monitored in few landfills .The leachate head level varies with time. Therefore monitoring of the leachate head level should be done frequently to see the landfill performance. A weekly monitoring for the first 3-4 years of operation and monthly monitoring thereafter is suggested.
• Landfill air monitoring
The study indicated that vinyl chloride, benzene &many other hazardous contaminants are expected to be present in municipal landfills. Several sampling techniques are available. The principle objective is to collect a polluted air sample to analyze the concentration of pollutants. Air collection bag made of synthetic materials is used to collect grab samples.
• Closure and post closure plan
Cover of waste landfill must perform several functions in addition to keeping the water out of the contaminated materials. They minimize and control precipitation runoff, keep away the waste from plants and animals, discourage intrusion, intentional or accidental, and control gas release. The cover or closure of a landfill is critically important since its performance must be assured over an extremely long lifetime. Lifetimes well beyond the 30 years post closure care period are often considered. Within the cover systems are the following elements which must be evaluated and designed according to site-specific and waste-specific considerations.
• Vegetative cover and top soil
• Cover soil • Surface water drainage
system • Composite barrier system
(geo-membrane with clay liner or geo-membrane with geo-synthetic clay liner)
• Gas venting layer(required for municipal solid waste)
• Final compacted cover soil over the solid waste mass
77
Closure of a landfill occurs on the completion of the last phase of the landfill and placement of the cover over it. The active life of the landfill is now over and one cannot place any more solid waste in the landfill. The landfill cannot be just abandoned at this stage but post-closure activities have to be initiated some of which must continue for the design life of the facility. These include:
1. Establishment of self perpetuating vegetation, local grasses and shrubs, on the landfill cover.
2. Operating and maintaining the leachate and gas treatment facilities. 3. Undertaking regular maintenance of settlement experienced by the cover in the form of
filling and repairing of all depressions ,gullies etc, and 4. Environmental monitoring
• Final cover systems
The closure standards for municipal solid waste landfills require owner /operators to install a final cover system to minimize infiltration of liquids and soil erosion .The permeability of the final cover must be less than the underlying liner system, but not greater than 1.0 x 10⁻⁵ cm/sec, where liquids infiltrate through the overlying cover system but are contained by a more permeable underlying liner system. This causes the landfill to fill up with water increasing the hydraulic head on the liner system that can lead to the contaminated liquid (leachate) escaping and contaminating ground water supplies.
• Closure plans
Every municipal solid waste landfill is required to prepare a written closure plan that describes the steps necessary to close the unit in accordance with the closure requirements. This plan must include:
• A description of the final cover design and its installation methods and procedures. • An estimate of the largest area of the landfill requiring a final cover. • An estimate of the maximum inventory of waste on site during the landfill’s active life. • A schedule for completing all required closure activities.
Once a municipal solid waste landfill has received its final shipment of waste, it must begin closure operation within 30 days. A municipal solid waste landfill, however, may delay closure for up to one year if additional capacity remains. Any further delays after one year require approval from the state director. After beginning, all closure activities must be completed within 180 days (with the exception of an extension from the state director).
Post-closure care activities consists of monitoring and maintaining the waste containment systems and monitoring groundwater to ensure that waste is not escaping and polluting the surrounding environment. The required post-closure care period is 30 years from site closure, but this can be shortened or extended by the director of an approval state program as necessary to ensure protection of human health and the environment. Specific post-closure care requirements consist of maintaining the integrity and effectiveness of the:
Final cover system Leachate collection system Groundwater monitoring system
78
Methane gas monitoring system
CONCLUSION
Disposal of waste is a problem which increases with increase in population & is solved by using various methods like open dumping, incineration, composting and landfills having various adverse impact on environment and also on living beings. Solid waste management (SWM) is a vital, ongoing and large public service system, which needs to be efficiently provided to the community to maintain aesthetic and public health standards. Solid waste contains Biodegradable and non-degradable materials and because of unwanted biological reaction with biodegradable waste the foul smell generates and which also promotes the breeding of insects ,rodents and pathogens that can cause and transmit the diseases. Furthermore, open burning of MSW adversely affects the environment by emitting pollutants in the atmosphere. Thus Municipal agencies will have to plan and execute sustainable waste management programme. Landfills are part of an integrated system for the management of MSW. When carefully designed and well managed within the context of the local infrastructure and available resources, landfills can provide safe and cost-effective disposal of waste .It can be concluded that engineered landfills can prove themselves as the safe method of waste disposal compared to other methods. Because each components of this landfill is provided to perform valuable function which acts like effective barriers against contamination and minimizes health and environmental impacts. Geosynthetic materials when provided as a liner in landfill helps in sealing, protection, drainage, erosion control, reinforcement, filtration, etc.Leachate control, protection of surrounding environment of landfill site is effectively achieved through segregation and isolation of potentially polluting waste from the surrounding strata of surface water and ground water. This is achieved by providing appropriate sealing layers at the base, sides and top of the landfill. A leachate collection arrangement at the base helps in collecting leachate formed with in landfill. A cover system helps to prevent infiltration of rain into the landfill. A gas collection system below the top cover is used for collecting gas produced within landfillAn environmental monitoring system for analyzing air, insurface and ground water, soil gas samples, etc. thus these components can take care of all the defects associated with other methods of waste disposal. Thus properly studied, designed, planned and constructed engineered landfill can be used as the safest method for waste disposal. With increasing environmental concerns, the integrated MSW management system has a potential to maximize the useable waste materials as well as produce energy as a by-product by setting processing plant at landfill site.Hence “Engineered Landfill” is the best solution to sustain clean environment and healthy life.
References Bagchi Amalendu (2004) Design of Landfills and Integrated Solid Waste Management, Third Edition,
John Wiley & Sons, Inc, Hoboken Publications, New Jersey. Gulhati S. & Datta M., Geotechnical Engineering , Tata Mc Graw Hill Publications, New Delhi. Gupta C.S.(17-20 December 2007)Proceeding of all India professional development programme on
Municipal solid waste management, ESCI campus, Hyderabad. Kasmalkar B.J.(1983) Foundation Engineering, First Edition, P.B. Kulkarni Publication, Pune. Koerner Robert M. (1990) Designing with Geosynthetics, Second Edition, Prentice Hall, Englewood
Cliffs Publications, New Jersey. Lambe W. T., Whitman (1979), Soil Mechanics, SI Version, John Wiley & Sons, Inc. Publications, New
york. Punmia.B.c.(2005) Soil Mechanics and Foundations, Edition XVI, Laxmi Publications, New Delhi. Purushothama Raj P. Geotechnical Engineering, Tata Mc Graw- Hill Publications. Sivakumar Babu G.L. Soil Reinforcement and Geosynthetics, Universities Press Publications.

79
Varma C.V.J., Venkatappa Rao, Waste Containment with Geosynthetics, committee for International Geosynthetic Society (India).
Venkatramaiah C.(1995) Geotechnical Engineering, Second Edition, New Age International(P) Limited, Publications , New Delhi.
Venkatappa Rao G.,Sasidhar R.S., (2009) Solid waste Management and Engineered Landfills ,Sai Masters Geoenvironmental Services Pvt.Ltd.(SAGES) Publications, Hyderabad-Andhra Pradesh.
http://ec.europa.eu/environment/international_issues/presentations/heisch.pdf http://urbanindia.nic.in/publicinfo/swm/annex17.pdf http://www.energyjustice.net/lfg www.kerala.gov.in/tudp/ProInfMem.pdf http://www.swlf.ait.ac.th/Slide%20Show/construction.pdf
80
EFFECT OF DIESEL POLLUTANT ON GEOTECHNICAL PARAMETERS OS SOIL
B. S. Walia*, Gurdeepak Singh*and Manpreet Kaur** *Civil Engineering Department, Guru Nanak Dev Engineering College, Ludhiana
**Quest Group of Institutes, Mohali
Abstract: Humans are, unintentionally or intentionally contaminating soils from different sources. The contaminated soils are not only a challenge for the environmentalists but also for the geotechnical engineers. The surface and subsurface environment is becoming increasingly contaminated because of disposal of chemicals and waste materials produced as a result of rapid industrialization and various other human activities. All types of pollution have direct and indirect effect on soil/sub-soil. The effects of contamination on physic-chemical properties only have attracted the marginal attention of geo- technical fraternity. Amongst the contaminants, the hydrocarbons are a major source of soil pollution; petrol and diesel being the chief contributors. A vast majority of the population use these two commodities. The usage area and consumption pattern varies from deserts to high altitude. Amongst diesel and petrol, the consumption of diesel is higher. Therefore, diesel was selected as the pollutant and its effect on engineering properties soil (IS classification: (CL-ML) was studied. Index and engineering properties of virgin (uncontaminated) soil with different concentration of diesel (at 4%, 8%, and 12% of the dry weight of the soil) spiked were determined for comparison. Here, the diesel contaminated soil samples exhibit drastic changes in their geotechnical parameters. Noteworthy among such deleterious changes are: decrease in maximum dry density, unconfined compressive strength (UCS), and increase in liquid limit and plastic limit.
Key Words: contaminated soil, diesel, pollutants, waste material, liquid limit.
INTRODUCTION
Contamination of land has arisen from kinds of human activity and is essentially a legacy of our recent industrial history. Sources of contamination include the deposition of waste products; industrial operations’ spills and leakages, airborne contaminated dust and repeated raising and leveling of land as one industrial use supersedes another. Contaminants may be solid, liquid or gaseous and can adversely affect susceptible targets such as human, rivers, soil, sub-soil, buildings and the environment.
Hydrocarbon contamination is the most obvious concern of the industrial age. There are multiple causes for the same. The pendulum swings from oil exploration, production, processing and transportation from one end to refining, storage (surface and subsurface) transportation and distribution the other end. Petroleum contamination may also occur on right of way of the road due to leakage of diesel products from leaking oil tankers, spills due to vehicular accidents, buried pipelines, acquired properties such as rail yards an abandoned oil storage sites. The resulting environmental degradation is colossal. Not only the agricultural properties of the soil have been destroyed, the performance of soil as a construction material or as supporting material of engineering structures has been greatly affected. This problem is more alarming in developing nations where technologies of waste
81
disposal are not fully appreciated and applied. It is common phenomenon these days that due pressure on land and due to change in land use pattern, land is being reclaimed at prohibitive cost to rehabilitate people. Prohibitive cost of such technologies is one of the factors, which influence its poor application. The detrimental effect of contaminants on properties of soil has also received attention but less than it deserves. Research has shown that leakage of hydrocarbon into sub soil directly affects the use and stability of supported structure. The unintended modification of soil properties due to interaction with contaminants can lead to various geotechnical problems (excessive settlements, loss of shear strength etc.) A sound understanding of fundamental principles of geotechnical engineering is needed to predict the behavior and performance of soil as a constructive material or as a supporting medium of engineering structures. To arrive at logical results the effect of contaminants on soil properties has got to be analyzed and studied before recommendations can be made for its employment as a constructive material/ supportive medium for structures.
The increased environmental degradation due to contamination of soil by various pollutants has forced the “geotechnical engineer” to lay more stress on this hither-to unexplored filed. The geotechnical fraternity has not yet given serious attention to this problem. Loss of shear strength, compressibility are some of the problems which confront a geotechnical engineer with it comes to dealing with low lying art as drained by effluents or when contaminated soil is being used as landfill to reclaim to reclaim a site. With changing patterns of land use and the consequent pressure on land, it has become imperative that sound engineering advice is offered when it comes to dealing with contaminated land. By knowing the properties of such soil, applications, whether it is for structural use of as a supporting material/ medium can be decided upon economically. In India the scope of study in this filed is very large. Whereas in Europe and America great strides have been made in this field, in India a concerted effort has to be made so that technologies can be developed to reclaim contaminated sites for their intended use. Judgment can only be based upon facts, which have withstood the test of time. Contaminated soil not only affects the engineering properties of soil but also the crop pattern of agriculture.
NEED OF STUDY
Hydrocarbon contaminants from oil exploration, transportation, production and processing affect the safety of civil engineering structures. The hydrocarbon contamination will not just affect the quality of the soil but will also alter the physical properties of oil-contaminated soil. This will lead to geotechnical problems related to construction or foundation structure on this oil-contaminated site. Most associated impacts of oil contaminant are excessive settlement of tanks and breakage of pipeline. Soil-contaminants interactions are complex, and may be better understood if the various factors are isolated and considered independently. Long term leakage of hydrocarbons, either as macro-seepage or micro-seepage can bring about alterations of soils and sediments, which can take many forms, including
(i) Microbiological anomalies and the formation of ‘paraffin dirt’; (ii) Mineralogical changes, such as, formation of calcite, pyrite, uranium, elemental sulphur
and certain magnetic iron oxides and sulphides; (iii) Clay mineral alteration; (iv) Changes in soil engineering properties (v) Electro-chemical changes
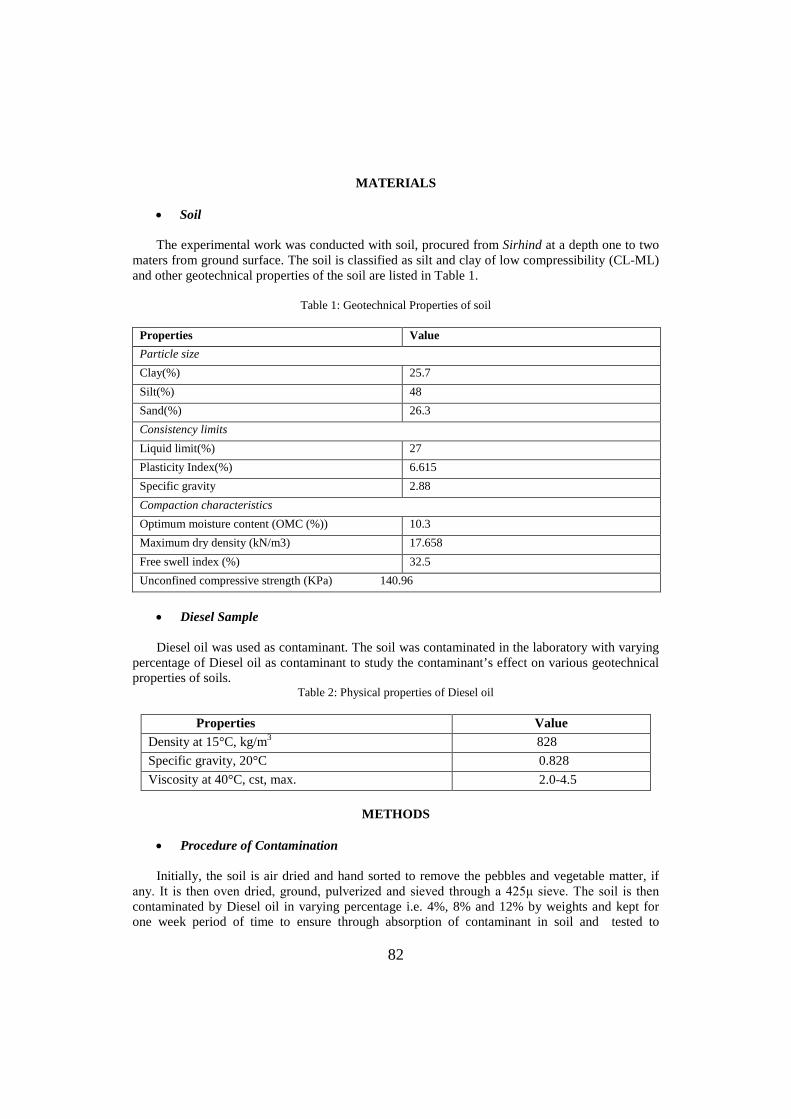
82
MATERIALS
• Soil
The experimental work was conducted with soil, procured from Sirhind at a depth one to two maters from ground surface. The soil is classified as silt and clay of low compressibility (CL-ML) and other geotechnical properties of the soil are listed in Table 1.
Table 1: Geotechnical Properties of soil
Properties Value Particle size Clay(%) 25.7 Silt(%) 48 Sand(%) 26.3 Consistency limits Liquid limit(%) 27 Plasticity Index(%) 6.615 Specific gravity 2.88 Compaction characteristics Optimum moisture content (OMC (%)) 10.3 Maximum dry density (kN/m3) 17.658 Free swell index (%) 32.5 Unconfined compressive strength (KPa) 140.96
• Diesel Sample
Diesel oil was used as contaminant. The soil was contaminated in the laboratory with varying percentage of Diesel oil as contaminant to study the contaminant’s effect on various geotechnical properties of soils.
Table 2: Physical properties of Diesel oil
Properties
Value Density at 15°C, kg/m3 828 Specific gravity, 20°C 0.828 Viscosity at 40°C, cst, max. 2.0-4.5
METHODS
• Procedure of Contamination
Initially, the soil is air dried and hand sorted to remove the pebbles and vegetable matter, if
any. It is then oven dried, ground, pulverized and sieved through a 425μ sieve. The soil is then contaminated by Diesel oil in varying percentage i.e. 4%, 8% and 12% by weights and kept for one week period of time to ensure through absorption of contaminant in soil and tested to
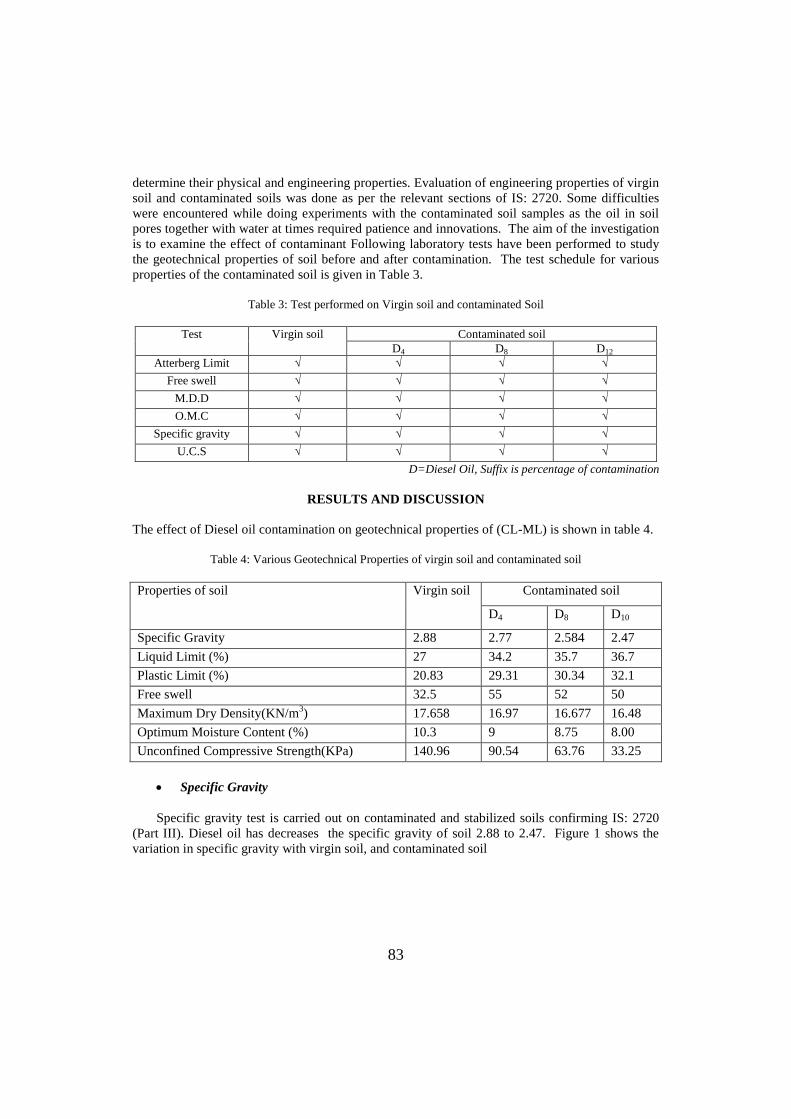
83
determine their physical and engineering properties. Evaluation of engineering properties of virgin soil and contaminated soils was done as per the relevant sections of IS: 2720. Some difficulties were encountered while doing experiments with the contaminated soil samples as the oil in soil pores together with water at times required patience and innovations. The aim of the investigation is to examine the effect of contaminant Following laboratory tests have been performed to study the geotechnical properties of soil before and after contamination. The test schedule for various properties of the contaminated soil is given in Table 3.
Table 3: Test performed on Virgin soil and contaminated Soil
Test Virgin soil Contaminated soil D4 D8 D12
Atterberg Limit √ √ √ √ Free swell √ √ √ √
M.D.D √ √ √ √ O.M.C √ √ √ √
Specific gravity √ √ √ √ U.C.S √ √ √ √
D=Diesel Oil, Suffix is percentage of contamination
RESULTS AND DISCUSSION
The effect of Diesel oil contamination on geotechnical properties of (CL-ML) is shown in table 4.
Table 4: Various Geotechnical Properties of virgin soil and contaminated soil
Properties of soil Virgin soil Contaminated soil
D4 D8 D10
Specific Gravity 2.88 2.77 2.584 2.47 Liquid Limit (%) 27 34.2 35.7 36.7 Plastic Limit (%) 20.83 29.31 30.34 32.1 Free swell 32.5 55 52 50 Maximum Dry Density(KN/m3) 17.658 16.97 16.677 16.48 Optimum Moisture Content (%) 10.3 9 8.75 8.00 Unconfined Compressive Strength(KPa) 140.96 90.54 63.76 33.25
• Specific Gravity
Specific gravity test is carried out on contaminated and stabilized soils confirming IS: 2720 (Part III). Diesel oil has decreases the specific gravity of soil 2.88 to 2.47. Figure 1 shows the variation in specific gravity with virgin soil, and contaminated soil
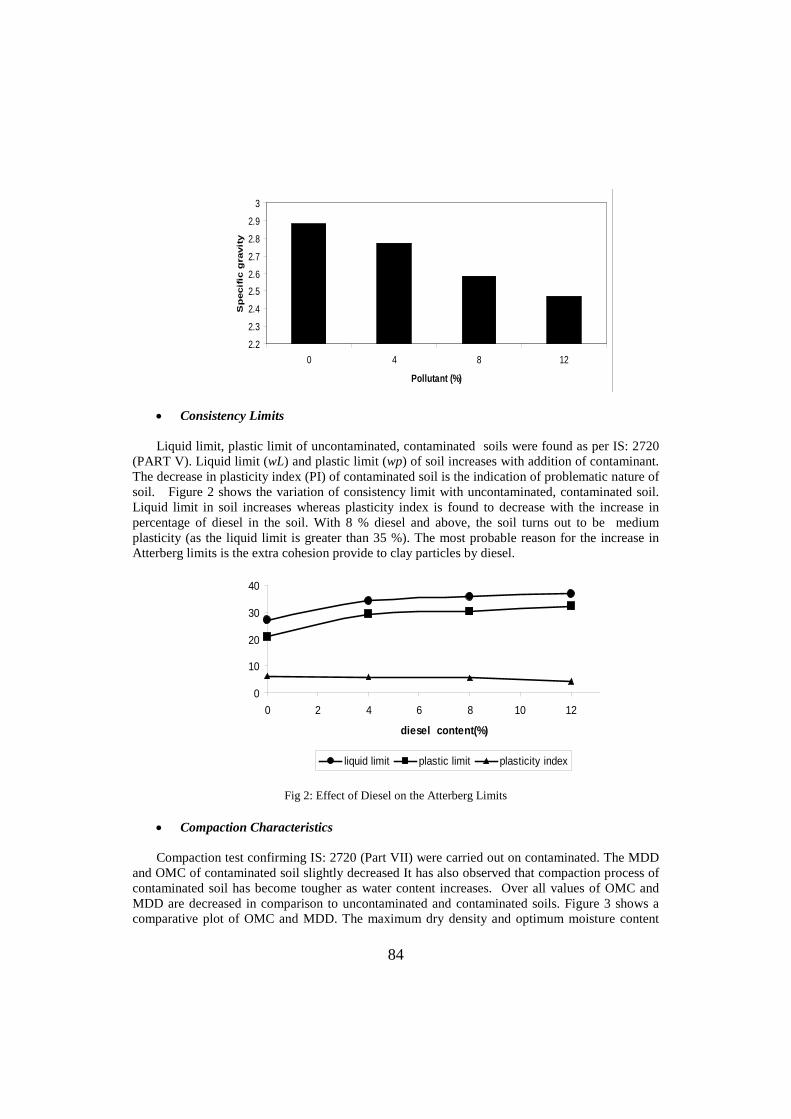
84
Fig 1: Specific gravity variation of soil-diesel sample
• Consistency Limits
Liquid limit, plastic limit of uncontaminated, contaminated soils were found as per IS: 2720 (PART V). Liquid limit (wL) and plastic limit (wp) of soil increases with addition of contaminant. The decrease in plasticity index (PI) of contaminated soil is the indication of problematic nature of soil. Figure 2 shows the variation of consistency limit with uncontaminated, contaminated soil. Liquid limit in soil increases whereas plasticity index is found to decrease with the increase in percentage of diesel in the soil. With 8 % diesel and above, the soil turns out to be medium plasticity (as the liquid limit is greater than 35 %). The most probable reason for the increase in Atterberg limits is the extra cohesion provide to clay particles by diesel.
Fig 2: Effect of Diesel on the Atterberg Limits
• Compaction Characteristics
Compaction test confirming IS: 2720 (Part VII) were carried out on contaminated. The MDD and OMC of contaminated soil slightly decreased It has also observed that compaction process of contaminated soil has become tougher as water content increases. Over all values of OMC and MDD are decreased in comparison to uncontaminated and contaminated soils. Figure 3 shows a comparative plot of OMC and MDD. The maximum dry density and optimum moisture content
Specific gravity veriation soil-diesel
2.2
2.3
2.4
2.52.6
2.7
2.8
2.9
3
0 4 8 12
Pollutant (%)
Sp
ecif
ic g
ravi
ty
Effect of diesel on Atterberg limits
0
10
20
30
40
0 2 4 6 8 10 12 14
diesel content(%)
liquid limit plastic limit plasticity index
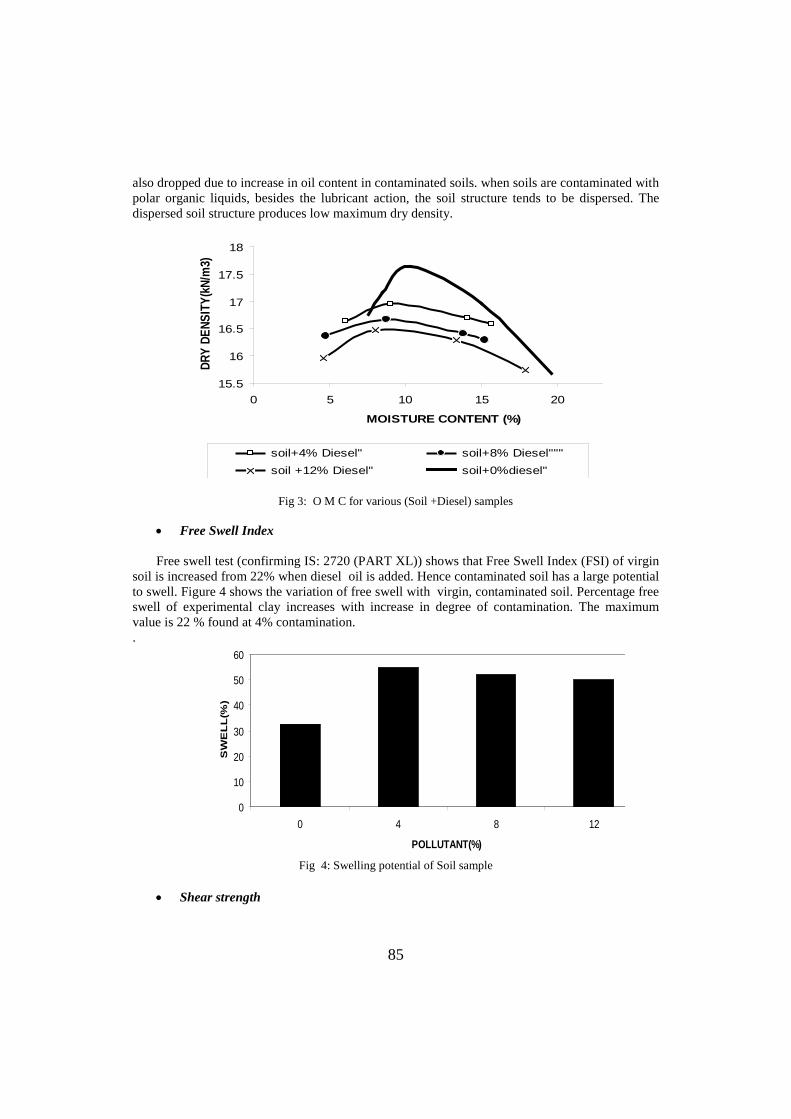
85
also dropped due to increase in oil content in contaminated soils. when soils are contaminated with polar organic liquids, besides the lubricant action, the soil structure tends to be dispersed. The dispersed soil structure produces low maximum dry density.
Fig 3: O M C for various (Soil +Diesel) samples
• Free Swell Index
Free swell test (confirming IS: 2720 (PART XL)) shows that Free Swell Index (FSI) of virgin soil is increased from 22% when diesel oil is added. Hence contaminated soil has a large potential to swell. Figure 4 shows the variation of free swell with virgin, contaminated soil. Percentage free swell of experimental clay increases with increase in degree of contamination. The maximum value is 22 % found at 4% contamination. .
Fig 4: Swelling potential of Soil sample
• Shear strength
OPTIMUM MOISTURE CONTENT
15.5
16
16.5
17
17.5
18
0 5 10 15 20 25
MOISTURE CONTENT (%)
DRY
DENS
ITY(
kN/m
3)
soil+4% Diesel" soil+8% Diesel""" soil +12% Diesel" soil+0%diesel"
SWELL VARIATION
0
10
20
30
40
50
60
0 4 8 12
POLLUTANT(%)
SW
EL
L(%
)
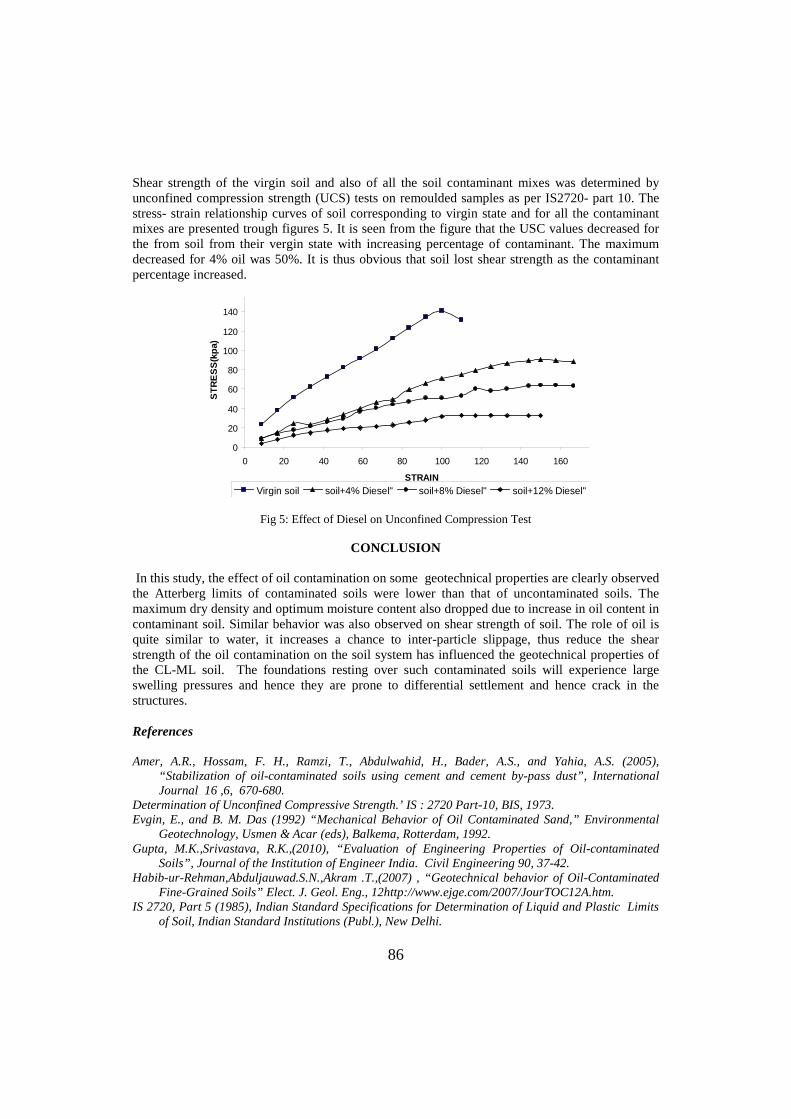
86
Shear strength of the virgin soil and also of all the soil contaminant mixes was determined by unconfined compression strength (UCS) tests on remoulded samples as per IS2720- part 10. The stress- strain relationship curves of soil corresponding to virgin state and for all the contaminant mixes are presented trough figures 5. It is seen from the figure that the USC values decreased for the from soil from their vergin state with increasing percentage of contaminant. The maximum decreased for 4% oil was 50%. It is thus obvious that soil lost shear strength as the contaminant percentage increased.
Fig 5: Effect of Diesel on Unconfined Compression Test
CONCLUSION In this study, the effect of oil contamination on some geotechnical properties are clearly observed the Atterberg limits of contaminated soils were lower than that of uncontaminated soils. The maximum dry density and optimum moisture content also dropped due to increase in oil content in contaminant soil. Similar behavior was also observed on shear strength of soil. The role of oil is quite similar to water, it increases a chance to inter-particle slippage, thus reduce the shear strength of the oil contamination on the soil system has influenced the geotechnical properties of the CL-ML soil. The foundations resting over such contaminated soils will experience large swelling pressures and hence they are prone to differential settlement and hence crack in the structures. References Amer, A.R., Hossam, F. H., Ramzi, T., Abdulwahid, H., Bader, A.S., and Yahia, A.S. (2005),
“Stabilization of oil-contaminated soils using cement and cement by-pass dust”, International Journal 16 ,6, 670-680.
Determination of Unconfined Compressive Strength.’ IS : 2720 Part-10, BIS, 1973. Evgin, E., and B. M. Das (1992) “Mechanical Behavior of Oil Contaminated Sand,” Environmental
Geotechnology, Usmen & Acar (eds), Balkema, Rotterdam, 1992. Gupta, M.K.,Srivastava, R.K.,(2010), “Evaluation of Engineering Properties of Oil-contaminated
Soils”, Journal of the Institution of Engineer India. Civil Engineering 90, 37-42. Habib-ur-Rehman,Abduljauwad.S.N.,Akram .T.,(2007) , “Geotechnical behavior of Oil-Contaminated
Fine-Grained Soils” Elect. J. Geol. Eng., 12http://www.ejge.com/2007/JourTOC12A.htm. IS 2720, Part 5 (1985), Indian Standard Specifications for Determination of Liquid and Plastic Limits
of Soil, Indian Standard Institutions (Publ.), New Delhi.
Effect of diesel on Unconfined compression test
0
20
40
60
80
100
120
140
160
0 20 40 60 80 100 120 140 160 180
STRAIN
STR
ES
S(k
pa)
Virgin soil soil+4% Diesel" soil+8% Diesel" soil+12% Diesel"
87
IS 2720, Part 7 (1980), Indian Standard Specifications for Determination of water content, dry density relation using light compaction of Soil, Indian Standard Institutions (Publ.), NewDelhi.
IS 2720, Part 10 (1991), Indian Standard Specifications for Determination of Unconfined Compressive Strength of Soil, Indian Standard Institutions, (Publ.) New Delhi.
IS 1498 (1970), Classification and Identification of Soils, Indian Standard Institutions (Publ.), New Delhi.
Nicholson, P. G. and Tsugawa, P. R. (1996), “Stabilization of Diesel Contaminated Soil With Lime and Fly Ash Admixtures”, Proceeding of International Symposium on Environmental Geotechnology, Envo. Pub. Inc., Bethlehem, 1, 805–816.
Puri, V.K., B.M. Das, E.C. Cook and E.C. Shin, (1994).”Geotechnical Properties of Crude Oil- Contaminated Sand”. ASTM Special Technical Publication, 1221, 75-88.
Rahman, Z.A., U. Hamzah and N. Ahmad, 2010.”Geotechnical characteristics of oil-contaminated granitic and metasedimentary soils”. Asian J. Applied Sciences, 3: 237-249.
Shah,S.J., Shroff, A. V.,Patel, J.V.,Tiwari,K.C.and Ramakrishan,D.(2003), “Stabilization of fuel oil contaminated soil—A Case Study”, Geotechnical and Geological Engineering, 21,, 415–427.
Sridhran, A. and Sivapulliah, “P. V.”: Engineering behaviour of soils contaminated with different pollutants”. In: Environmental Geotechnical, Balkema Press, Rotterdam, 1987.
Rao, S.M.,Reddy,P.M.,”Collapse Behaviour of a Laboratory Contaminated Soil” Indian Geotechnical Congress 1995, Bangalore,December 1995, 1, Bangalore.
Tuncan, A., Tuncan, M. and Koyuncu, H. (2000), “Use of petroleum contaminated drilling wastes as sub-base material for road construction”, Waste Management and Research, 18, 489-505.
Yaji, R. K. (1995).”Effect of contamination by some chemicals on engineering behaviour of Shedhi soil”, Indian Geotechnical Congress 1995, 1, Bangalore,1995,.241.
Young, R. N. and Warith, M. A. (1989), “Leaching effect of organic solution on geotechnical properties of three clay soils”, Proc. of 2nd Symposium on Environmental Geotechnology,
88
CHARACTERIZATION AND QUANTIFICATION OF POND WATER IN
MICRO-WATERSHED OF VILLAGE KULTHAM IN
NAWANSHEHAR DISTRICT, PUNJAB
Puneet Pal Singh Cheema and Leena Garg Department of Civil Engineering, Guru Nanak Dev Engineering College, Ludhiana, Punjab India
Abstract: Quality of water is deteriorating at the fast rate in the villages. In the present study, the characterization and quantification of wastewater in micro-watershed of a large village namely Kultham in Nawanshehar district having population more than 2000 in the Doaba region of Punjab was carried out. The wastewater samples from the inlet point of pond were collected and tested six times during the period of February to July 2012 for the following parameters (pH, BOD5, COD, Nitrates, Ammonical Nitrogen, Organic Nitrogen, Total Dissolved Solids, Total Suspended Solids, Total Coliform, E Coli, Alkalinity, Heavy Metals and Total Phosphorus). Therefore, this study which has been proposed for rural watersheds has the potential to become a stepping stone for the integrated water resources management in rural areas by planning effective treatment, management and utilization of the pond water.
Keywords: pond water, wastewater generation, catchment area, characteristics, GPS.
INTRODUCTION The wastewater generated from various household and other activities in rural areas overflows into open surface drains and is ultimately disposed of into village ponds thereby contaminating it. Disposal of wastewater in rural areas in village ponds is a major public health problem. Stagnant wastewater smells bad and also acts as a breeding place for flies and mosquitoes and can cause serious health problems and diseases. Proper disposal as well as reuse of wastewater helps in combating diseases and water scarcity. Government of Punjab is highly concerned about cleaning of village ponds.
• Characterization of wastewater
Wastewater is mainly comprised of water (99.9%) together with relatively small concentrations of suspended and dissolved organic and inorganic solids. Pathogenic micro-organisms that include bacteria, viruses, protozoa found in soil, decaying vegetation, sewer overflows and animal wastes are also found in abundance in wastewater. The Escherichia coli (E coli) bacterium is widely used indicator of faecal pollution levels in wastewater. Some of the important constituents of domestic wastewater can be summarized in following sections.
1. Solids in wastewater form sediments and can eventually clog drains, streams and rivers. Grease particles form scum and are aesthetically undesirable.
89
2. The nutrients N and P cause eutrophication of water bodies, with lakes and slow moving waters affected to a greater degree than faster flowing waters. In the former the algae that are fertilized by the nutrients, settle as sediment when they decay. Nutrients come from sewer overflows, animal waste, fertilizers, domestic detergents etc. Rainfall is a significant contributor of nitrogen.
3. Biodegradable organics debris such as decomposition food and garden waste, organic material in sewage contribute to oxygen depletion in storm water. Biochemical oxygen demand (BOD) and Chemical oxygen demand (COD) are measures of oxygen used when these materials react with biological and chemical substances present in water. Natural water bodies like ponds are often contaminated with organic and variety of toxic metals like Cd, Fe, Cr, Ni, Mn, Pb etc. generated by municipal effluents. Thus it is necessary to maintain quality of water in ponds within permissible limits.
The importance of the work also lies in the fact that domestic wastewater form the major source of water entering the village ponds and its characterization will aid in establishing the quality of the wastewater entering the pond during non-rainfall days.
• Quantification of wastewater
The catchment area helps in determining the area which is contributing wastewater to the village pond. As in most other Indian states, Punjab follows the norm of 70 liters per capita per day (lpcd) for rural water supply specified by Rajiv Gandhi National Drinking Water Mission (RGNDWM). The flow of sanitary sewage alone in the absence of storms in dry season is known as dry weather flow (DWF).
Quantity= Per capita sewage contributed per day x Population
Usually 80% of the water supply may be expected to reach the sewers.
MATERIALS AND METHODS For characterization of wastewater samples from ponds, following instruments were used: B.O.D Trak for the determination of BOD5 of wastewater sample, pH meter, desiccator and hot air oven for solids, spectrophotometer (visible range) for nitrates, COD, total phosphorus, portable incubator for coliforms, kjeldahl nitrogen apparatus. All the methods are adapted from “Standard Methods for the examination of water and wastewater (2005)”. Heavy metals were tested on Plasma Atomic Emission Spectrophotometer (ICAP-AES) in Natural Resource Management Laboratory in Punjab Agricultural University (PAU) Ludhiana. Among the various techniques of elemental analysis, atomic emission spectroscopy, employing Inductively Coupled Atomic Plasma (ICAP) as a source of energy has proved the most useful for determination of major, minor and trace elements.
For quantification of wastewater GPS was used for demarcation of catchment area of village pond. Waypoints were marked for inlet point of pond, boundary point of pond catchment, end point of pond. Data was then downloaded using Expert GPS software and then marked in Google Earth to obtain the GPS maps of catchment area of pond. AutoCAD 2009 version was used to demarcate the catchment area of pond on village maps to determine how much area is contributing wastewater to the village pond.
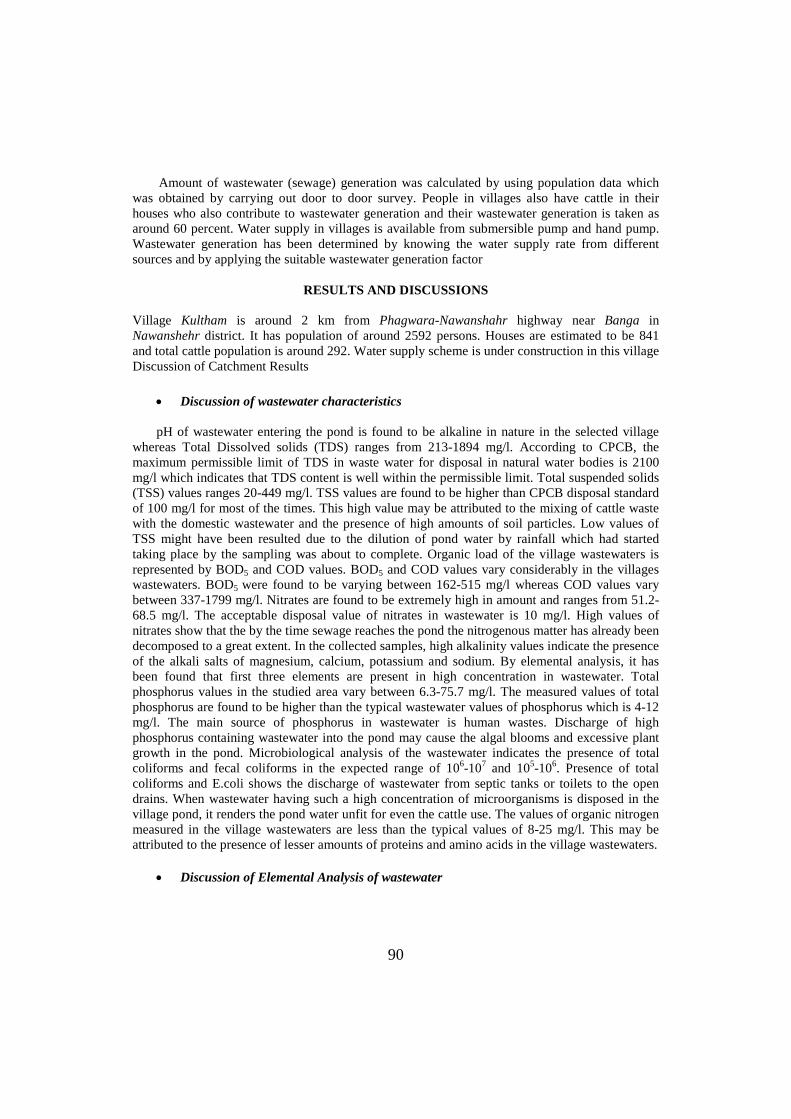
90
Amount of wastewater (sewage) generation was calculated by using population data which was obtained by carrying out door to door survey. People in villages also have cattle in their houses who also contribute to wastewater generation and their wastewater generation is taken as around 60 percent. Water supply in villages is available from submersible pump and hand pump. Wastewater generation has been determined by knowing the water supply rate from different sources and by applying the suitable wastewater generation factor
RESULTS AND DISCUSSIONS Village Kultham is around 2 km from Phagwara-Nawanshahr highway near Banga in Nawanshehr district. It has population of around 2592 persons. Houses are estimated to be 841 and total cattle population is around 292. Water supply scheme is under construction in this village Discussion of Catchment Results
• Discussion of wastewater characteristics
pH of wastewater entering the pond is found to be alkaline in nature in the selected village whereas Total Dissolved solids (TDS) ranges from 213-1894 mg/l. According to CPCB, the maximum permissible limit of TDS in waste water for disposal in natural water bodies is 2100 mg/l which indicates that TDS content is well within the permissible limit. Total suspended solids (TSS) values ranges 20-449 mg/l. TSS values are found to be higher than CPCB disposal standard of 100 mg/l for most of the times. This high value may be attributed to the mixing of cattle waste with the domestic wastewater and the presence of high amounts of soil particles. Low values of TSS might have been resulted due to the dilution of pond water by rainfall which had started taking place by the sampling was about to complete. Organic load of the village wastewaters is represented by BOD5 and COD values. BOD5 and COD values vary considerably in the villages wastewaters. BOD5 were found to be varying between 162-515 mg/l whereas COD values vary between 337-1799 mg/l. Nitrates are found to be extremely high in amount and ranges from 51.2-68.5 mg/l. The acceptable disposal value of nitrates in wastewater is 10 mg/l. High values of nitrates show that the by the time sewage reaches the pond the nitrogenous matter has already been decomposed to a great extent. In the collected samples, high alkalinity values indicate the presence of the alkali salts of magnesium, calcium, potassium and sodium. By elemental analysis, it has been found that first three elements are present in high concentration in wastewater. Total phosphorus values in the studied area vary between 6.3-75.7 mg/l. The measured values of total phosphorus are found to be higher than the typical wastewater values of phosphorus which is 4-12 mg/l. The main source of phosphorus in wastewater is human wastes. Discharge of high phosphorus containing wastewater into the pond may cause the algal blooms and excessive plant growth in the pond. Microbiological analysis of the wastewater indicates the presence of total coliforms and fecal coliforms in the expected range of 106-107 and 105-106. Presence of total coliforms and E.coli shows the discharge of wastewater from septic tanks or toilets to the open drains. When wastewater having such a high concentration of microorganisms is disposed in the village pond, it renders the pond water unfit for even the cattle use. The values of organic nitrogen measured in the village wastewaters are less than the typical values of 8-25 mg/l. This may be attributed to the presence of lesser amounts of proteins and amino acids in the village wastewaters.
• Discussion of Elemental Analysis of wastewater
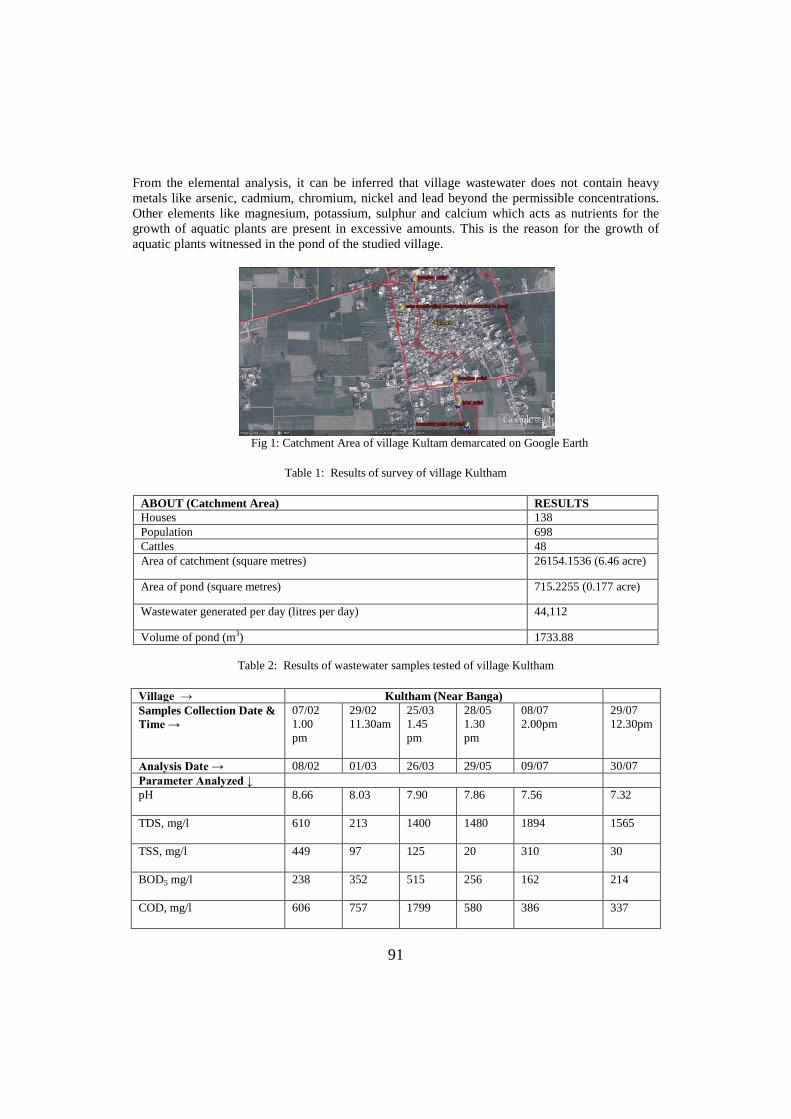
91
From the elemental analysis, it can be inferred that village wastewater does not contain heavy metals like arsenic, cadmium, chromium, nickel and lead beyond the permissible concentrations. Other elements like magnesium, potassium, sulphur and calcium which acts as nutrients for the growth of aquatic plants are present in excessive amounts. This is the reason for the growth of aquatic plants witnessed in the pond of the studied village.
Fig 1: Catchment Area of village Kultam demarcated on Google Earth
Table 1: Results of survey of village Kultham
ABOUT (Catchment Area) RESULTS Houses 138 Population 698 Cattles 48 Area of catchment (square metres) 26154.1536 (6.46 acre)
Area of pond (square metres) 715.2255 (0.177 acre)
Wastewater generated per day (litres per day) 44,112
Volume of pond (m3) 1733.88
Table 2: Results of wastewater samples tested of village Kultham
Village → Kultham (Near Banga) Samples Collection Date & Time →
07/02 1.00 pm
29/02 11.30am
25/03 1.45 pm
28/05 1.30 pm
08/07 2.00pm
29/07 12.30pm
Analysis Date → 08/02 01/03 26/03 29/05 09/07 30/07 Parameter Analyzed ↓ pH 8.66
8.03 7.90 7.86 7.56 7.32
TDS, mg/l 610
213 1400 1480 1894 1565
TSS, mg/l 449
97 125 20 310 30
BOD5 mg/l 238
352 515 256 162 214
COD, mg/l 606
757 1799 580 386 337
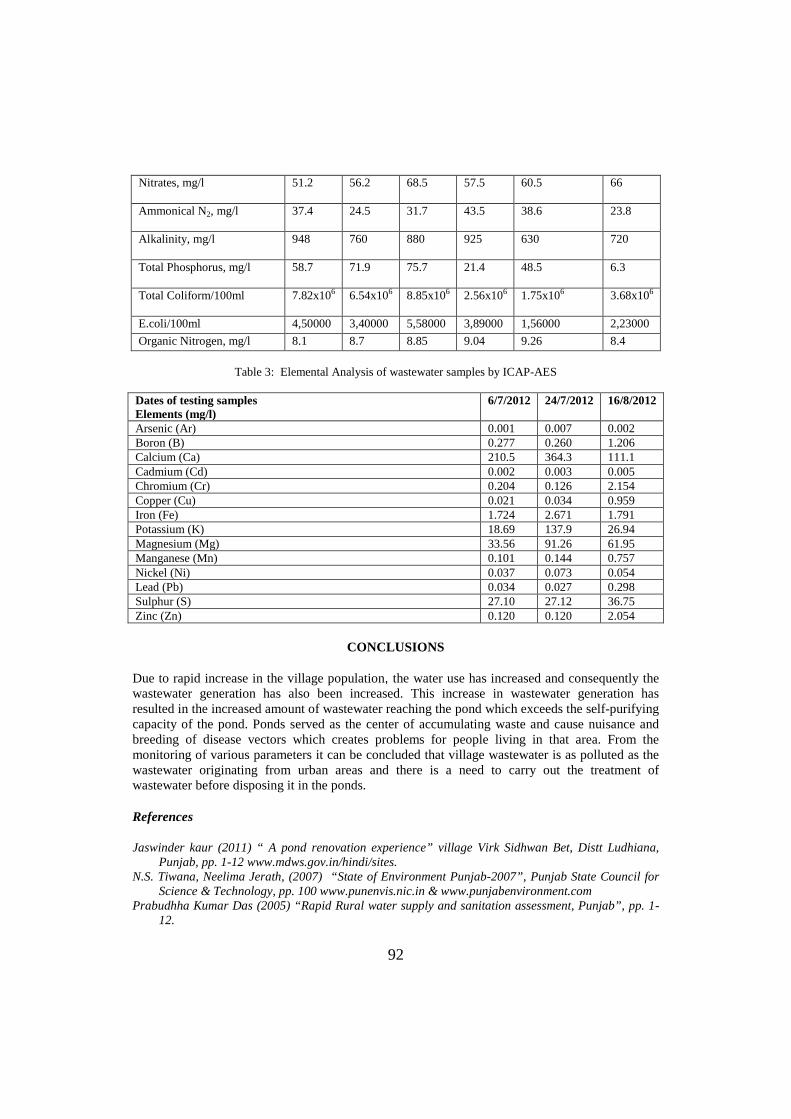
92
Nitrates, mg/l 51.2
56.2 68.5 57.5 60.5 66
Ammonical N2, mg/l 37.4
24.5 31.7 43.5 38.6 23.8
Alkalinity, mg/l 948
760 880 925 630 720
Total Phosphorus, mg/l 58.7
71.9 75.7 21.4 48.5 6.3
Total Coliform/100ml 7.82x10⁶
6.54x10⁶
8.85x10⁶
2.56x10⁶
1.75x10⁶
3.68x10⁶
E.coli/100ml 4,50000 3,40000 5,58000 3,89000 1,56000 2,23000 Organic Nitrogen, mg/l 8.1 8.7 8.85 9.04 9.26 8.4
Table 3: Elemental Analysis of wastewater samples by ICAP-AES
Dates of testing samples Elements (mg/l)
6/7/2012 24/7/2012 16/8/2012
Arsenic (Ar) 0.001 0.007 0.002 Boron (B) 0.277 0.260 1.206 Calcium (Ca) 210.5 364.3 111.1 Cadmium (Cd) 0.002 0.003 0.005 Chromium (Cr) 0.204 0.126 2.154 Copper (Cu) 0.021 0.034 0.959 Iron (Fe) 1.724 2.671 1.791 Potassium (K) 18.69 137.9 26.94 Magnesium (Mg) 33.56 91.26 61.95 Manganese (Mn) 0.101 0.144 0.757 Nickel (Ni) 0.037 0.073 0.054 Lead (Pb) 0.034 0.027 0.298 Sulphur (S) 27.10 27.12 36.75 Zinc (Zn) 0.120 0.120 2.054
CONCLUSIONS
Due to rapid increase in the village population, the water use has increased and consequently the wastewater generation has also been increased. This increase in wastewater generation has resulted in the increased amount of wastewater reaching the pond which exceeds the self-purifying capacity of the pond. Ponds served as the center of accumulating waste and cause nuisance and breeding of disease vectors which creates problems for people living in that area. From the monitoring of various parameters it can be concluded that village wastewater is as polluted as the wastewater originating from urban areas and there is a need to carry out the treatment of wastewater before disposing it in the ponds.
References
Jaswinder kaur (2011) “ A pond renovation experience” village Virk Sidhwan Bet, Distt Ludhiana, Punjab, pp. 1-12 www.mdws.gov.in/hindi/sites.
N.S. Tiwana, Neelima Jerath, (2007) “State of Environment Punjab-2007”, Punjab State Council for Science & Technology, pp. 100 www.punenvis.nic.in & www.punjabenvironment.com
Prabudhha Kumar Das (2005) “Rapid Rural water supply and sanitation assessment, Punjab”, pp. 1-12.

93
Shipra Saxena (2009) “Kharoudi Village in Punjab model of cleanliness can this model meet the total sanitation challenge in India?” M & E Consultant Department of Drinking Water Supply, Ministry of Rural Development Government of India, pp.1-15.
Standard Methods for the examination of water and wastewater (2005) book, pp. 4:107-4:110, 4:127-4:133.
Chawla JK, Khepar SD, et al. (2001) “Quality status and optimum utilization of village pond water - a case study”. Indian Journal of Environment Health. Vol 43 (3), pp. 114-122.
D. Vouk, D. Malus (2006) University of Zagreb, Faculty of Civil Engineering, Kaciceva 26, 10000 Zagreb, Croatia, “Problems with Wastewater in Small Rural Areas in Croatia”. Mapping of S&T needs – inventorization and documentation of location specific problems requiring Scientific/Technical interventions in Punjab”, pp-6.
94
PREDICTION OF MAXIMUM DRY DENSITY OF FLY ASH USING GENETIC
PROGRAMMING
Swagatika Senapati, Pradyut Kumar Muduli and Sarat Kumar Das Civil Engineering Department, National Institute of Technology Rourkela, Odisha,
Abstract: Sustainable development of energy and infrastructure lies in effective bulk utilization of fly ash in landfill and embankment. Fly ash is a highly heterogeneous material with variable properties. In this paper, a genetic programming (GP) based model equation has been presented to predict the maximum dry density of fly ash using its chemical and physical properties. The developed model is compared with available ANN model and based on different statistical criteria like correlation coefficient, coefficient of efficiency, maximum absolute error, average absolute error and root mean square error, GP model is found to more efficient. The compact model equation presented in this paper may help professional and policy planner particularly in the preliminary stage of an infrastructure project using fly ash.
INTRODUCTION
The quantity of fly ash produced worldwide is huge and keeps increasing from year to year with increase in thermal power plants. Four countries, namely, China, India, Poland, and the United States, alone produce more than 270 million tons of fly ash every year with less than half of this is used. In India the generation of fly ash is around 130 MT with 46% is in utilization by 2006-2007 and expected to increase by 170 MT by 2011-12 (Chatterjee 2011). The unused fly ash occupies vast tract of valuable land as ash pond. Occasional failure of this ash pond pollutes, land and water. This has severe impacts on the environment and there is need for proper disposal of fly ash and maximum utilization of fly ash. The use of structural fill of fly ash is only 5.1% compared to 16.1% use of fly ash in concrete in United states, but in Japan about 41% of fly ash is used in the construction of landfills (Porbaha et al. 2000), in India the use in construction industry is 40% compared to 15% in compacted fill and embankments. The bulk utilization of fly ash lies in its use as fill and embankment material.
The fly ash is a highly heterogeneous material with variable properties. The physical and chemical properties of ash are dependent on source of coal, method and degree of coal preparation, cleaning and pulverization, type and operation of power generation unit, ash collection, handling and storage methods, etc. Variability of material properties arising from different plants, same plant over period of time due to different coal supply, methods of operation of plant and fluctuation in power generation indicates the complex nature of the fly ash. The engineering properties of fly ash have been found to depend upon its chemical and mineralogical properties (Das and Yudhbir 2005). The density of fly ash is less than that of normal soil, resulting in reduction of self weight of structure. Due to this low density, it is also advantageous to have fly ash embankment over weak soil sub-grade, which is primarily due to low specific gravity (G) of fly ash.
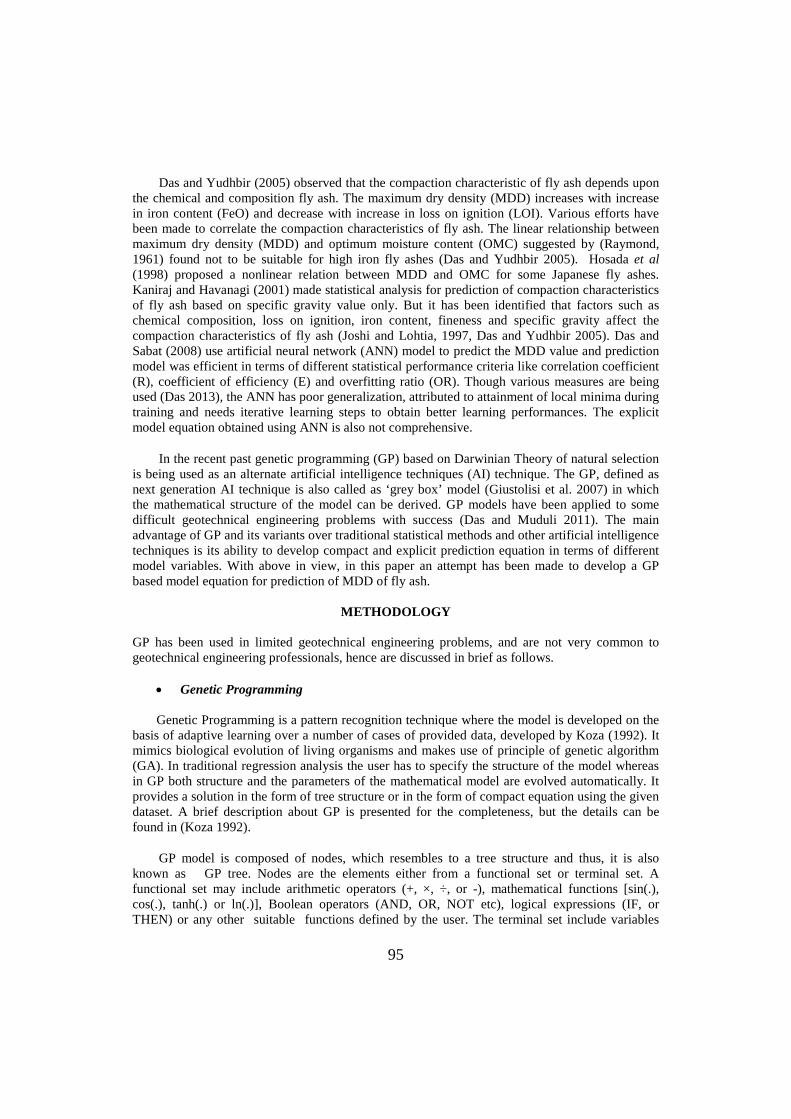
95
Das and Yudhbir (2005) observed that the compaction characteristic of fly ash depends upon the chemical and composition fly ash. The maximum dry density (MDD) increases with increase in iron content (FeO) and decrease with increase in loss on ignition (LOI). Various efforts have been made to correlate the compaction characteristics of fly ash. The linear relationship between maximum dry density (MDD) and optimum moisture content (OMC) suggested by (Raymond, 1961) found not to be suitable for high iron fly ashes (Das and Yudhbir 2005). Hosada et al (1998) proposed a nonlinear relation between MDD and OMC for some Japanese fly ashes. Kaniraj and Havanagi (2001) made statistical analysis for prediction of compaction characteristics of fly ash based on specific gravity value only. But it has been identified that factors such as chemical composition, loss on ignition, iron content, fineness and specific gravity affect the compaction characteristics of fly ash (Joshi and Lohtia, 1997, Das and Yudhbir 2005). Das and Sabat (2008) use artificial neural network (ANN) model to predict the MDD value and prediction model was efficient in terms of different statistical performance criteria like correlation coefficient (R), coefficient of efficiency (E) and overfitting ratio (OR). Though various measures are being used (Das 2013), the ANN has poor generalization, attributed to attainment of local minima during training and needs iterative learning steps to obtain better learning performances. The explicit model equation obtained using ANN is also not comprehensive.
In the recent past genetic programming (GP) based on Darwinian Theory of natural selection is being used as an alternate artificial intelligence techniques (AI) technique. The GP, defined as next generation AI technique is also called as ‘grey box’ model (Giustolisi et al. 2007) in which the mathematical structure of the model can be derived. GP models have been applied to some difficult geotechnical engineering problems with success (Das and Muduli 2011). The main advantage of GP and its variants over traditional statistical methods and other artificial intelligence techniques is its ability to develop compact and explicit prediction equation in terms of different model variables. With above in view, in this paper an attempt has been made to develop a GP based model equation for prediction of MDD of fly ash.
METHODOLOGY GP has been used in limited geotechnical engineering problems, and are not very common to geotechnical engineering professionals, hence are discussed in brief as follows.
• Genetic Programming
Genetic Programming is a pattern recognition technique where the model is developed on the basis of adaptive learning over a number of cases of provided data, developed by Koza (1992). It mimics biological evolution of living organisms and makes use of principle of genetic algorithm (GA). In traditional regression analysis the user has to specify the structure of the model whereas in GP both structure and the parameters of the mathematical model are evolved automatically. It provides a solution in the form of tree structure or in the form of compact equation using the given dataset. A brief description about GP is presented for the completeness, but the details can be found in (Koza 1992).
GP model is composed of nodes, which resembles to a tree structure and thus, it is also known as GP tree. Nodes are the elements either from a functional set or terminal set. A functional set may include arithmetic operators (+, ×, ÷, or -), mathematical functions [sin(.), cos(.), tanh(.) or ln(.)], Boolean operators (AND, OR, NOT etc), logical expressions (IF, or THEN) or any other suitable functions defined by the user. The terminal set include variables
96
(like x1, x2, x3, etc) or constants (like 3, 5, 6, 9 etc) or both. The functions and terminals are randomly chosen to form a GP tree with a root node and the branches extending from each function nodes to end in terminal nodes as shown in Figure 1.
Fig 1: A typical GP tree representing function: tan (6.5 x2/x1) Initially a set of GP trees, as per user defined population size, are randomly generated using various functions and terminals assigned by the user. The fitness criterion is calculated by the objective function and it determines the quality of the each individual in the population competing with rest. At each generation a new population is created by selecting individuals as per the merit of their fitness from the initial population and then, implementing various evolutionary mechanisms like reproduction, crossover and mutation to the functions and terminals of the selected GP trees. The new population then replaces the existing population. This process is iterated until the termination criterion, which can be either a threshold fitness value or maximum number of generations, is satisfied. The best GP model, based on its fitness value that appeared in any generation, is selected as the result of genetic programming. The present GP model is developed as per Gondami and Alavi (2012) and implemented using Matlab.
RESULTS AND DISCUSSION The data from various sources available in literature as compiled in Das and Sabat (2008) is taken with chemical composition like Fe2O3 (FeO), LOI, and physical properties like G, optimum moisture content (OMC) and MDD. The total numbers of data points considered are 40 out of which 25 are taken for training and 15 are taken for testing. The maximum, minimum, average and standard deviation for the data used are shown in Table 1 and it can be seen that it covers a wide range values. Here, in the MGGP approach normalization or scaling of the data is not
6.5
x2
X x1
/
tan
Root node
Link Function nodes
Terminal nodes
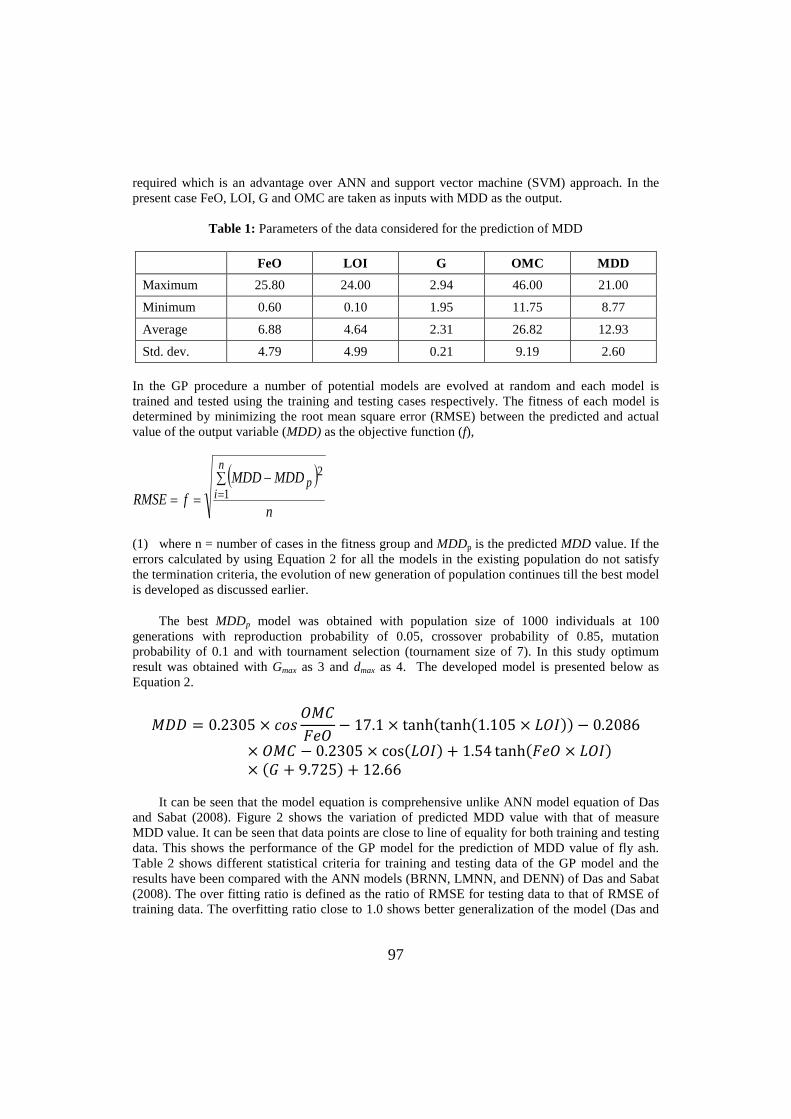
97
required which is an advantage over ANN and support vector machine (SVM) approach. In the present case FeO, LOI, G and OMC are taken as inputs with MDD as the output.
Table 1: Parameters of the data considered for the prediction of MDD
FeO LOI G OMC MDD Maximum 25.80 24.00 2.94 46.00 21.00
Minimum 0.60 0.10 1.95 11.75 8.77
Average 6.88 4.64 2.31 26.82 12.93
Std. dev. 4.79 4.99 0.21 9.19 2.60 In the GP procedure a number of potential models are evolved at random and each model is trained and tested using the training and testing cases respectively. The fitness of each model is determined by minimizing the root mean square error (RMSE) between the predicted and actual value of the output variable (MDD) as the objective function (f),
( )n
MDDMDDfRMSE
n
ip∑ −
== =1
2
(1) where n = number of cases in the fitness group and MDDp is the predicted MDD value. If the errors calculated by using Equation 2 for all the models in the existing population do not satisfy the termination criteria, the evolution of new generation of population continues till the best model is developed as discussed earlier.
The best MDDp model was obtained with population size of 1000 individuals at 100 generations with reproduction probability of 0.05, crossover probability of 0.85, mutation probability of 0.1 and with tournament selection (tournament size of 7). In this study optimum result was obtained with Gmax as 3 and dmax as 4. The developed model is presented below as Equation 2.
𝑀𝑀𝑀𝑀𝑀𝑀 = 0.2305 × 𝑐𝑐𝑐𝑐𝑐𝑐𝑂𝑂𝑀𝑀𝑂𝑂𝐹𝐹𝐹𝐹𝑂𝑂
− 17.1 × tanh(tanh(1.105 × 𝐿𝐿𝑂𝑂𝐿𝐿)) − 0.2086× 𝑂𝑂𝑀𝑀𝑂𝑂 − 0.2305 × cos(𝐿𝐿𝑂𝑂𝐿𝐿) + 1.54 tanh(𝐹𝐹𝐹𝐹𝑂𝑂 × 𝐿𝐿𝑂𝑂𝐿𝐿)× (𝐺𝐺 + 9.725) + 12.66
It can be seen that the model equation is comprehensive unlike ANN model equation of Das and Sabat (2008). Figure 2 shows the variation of predicted MDD value with that of measure MDD value. It can be seen that data points are close to line of equality for both training and testing data. This shows the performance of the GP model for the prediction of MDD value of fly ash. Table 2 shows different statistical criteria for training and testing data of the GP model and the results have been compared with the ANN models (BRNN, LMNN, and DENN) of Das and Sabat (2008). The over fitting ratio is defined as the ratio of RMSE for testing data to that of RMSE of training data. The overfitting ratio close to 1.0 shows better generalization of the model (Das and
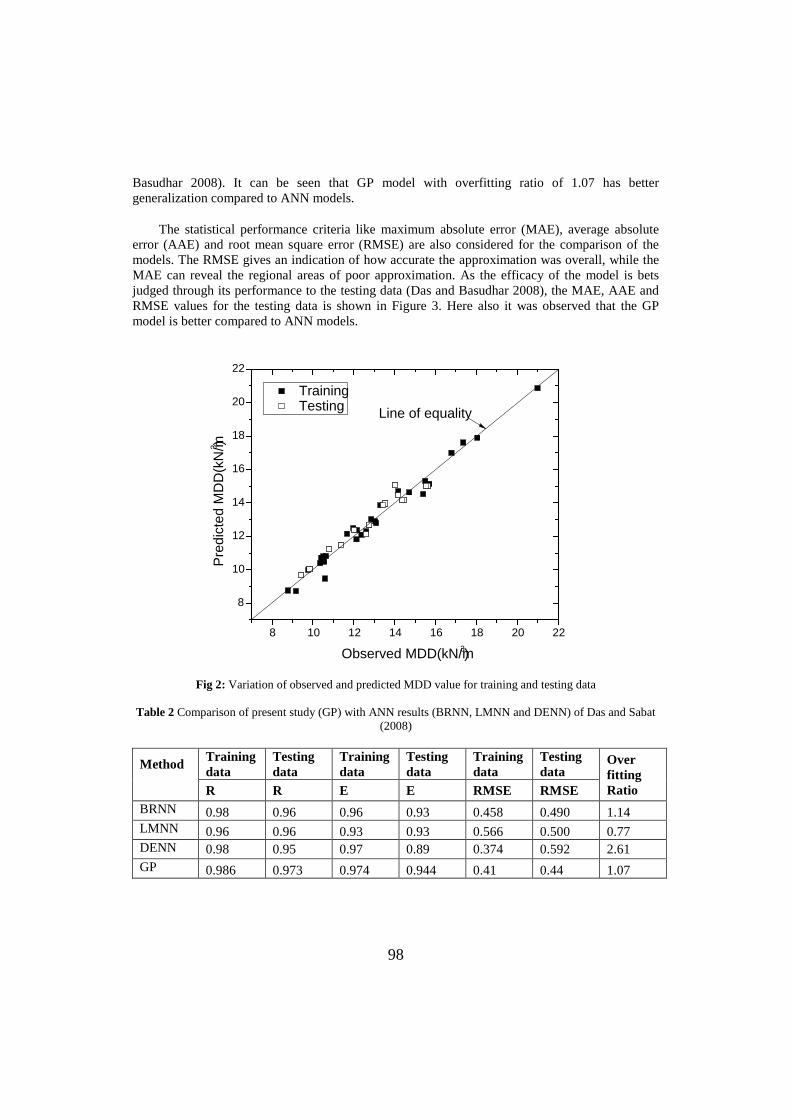
98
Basudhar 2008). It can be seen that GP model with overfitting ratio of 1.07 has better generalization compared to ANN models.
The statistical performance criteria like maximum absolute error (MAE), average absolute error (AAE) and root mean square error (RMSE) are also considered for the comparison of the models. The RMSE gives an indication of how accurate the approximation was overall, while the MAE can reveal the regional areas of poor approximation. As the efficacy of the model is bets judged through its performance to the testing data (Das and Basudhar 2008), the MAE, AAE and RMSE values for the testing data is shown in Figure 3. Here also it was observed that the GP model is better compared to ANN models.
8 10 12 14 16 18 20 22
8
10
12
14
16
18
20
22
Training Testing
Pre
dict
ed M
DD
(kN
/m3 )
Observed MDD(kN/m3)
Line of equality
Fig 2: Variation of observed and predicted MDD value for training and testing data
Table 2 Comparison of present study (GP) with ANN results (BRNN, LMNN and DENN) of Das and Sabat
(2008)
Method Training data
Testing data
Training data
Testing data
Training data
Testing data
Over fitting Ratio R R E E RMSE RMSE
BRNN 0.98 0.96 0.96 0.93 0.458 0.490 1.14 LMNN 0.96 0.96 0.93 0.93 0.566 0.500 0.77 DENN 0.98 0.95 0.97 0.89 0.374 0.592 2.61 GP 0.986 0.973 0.974 0.944 0.41 0.44 1.07
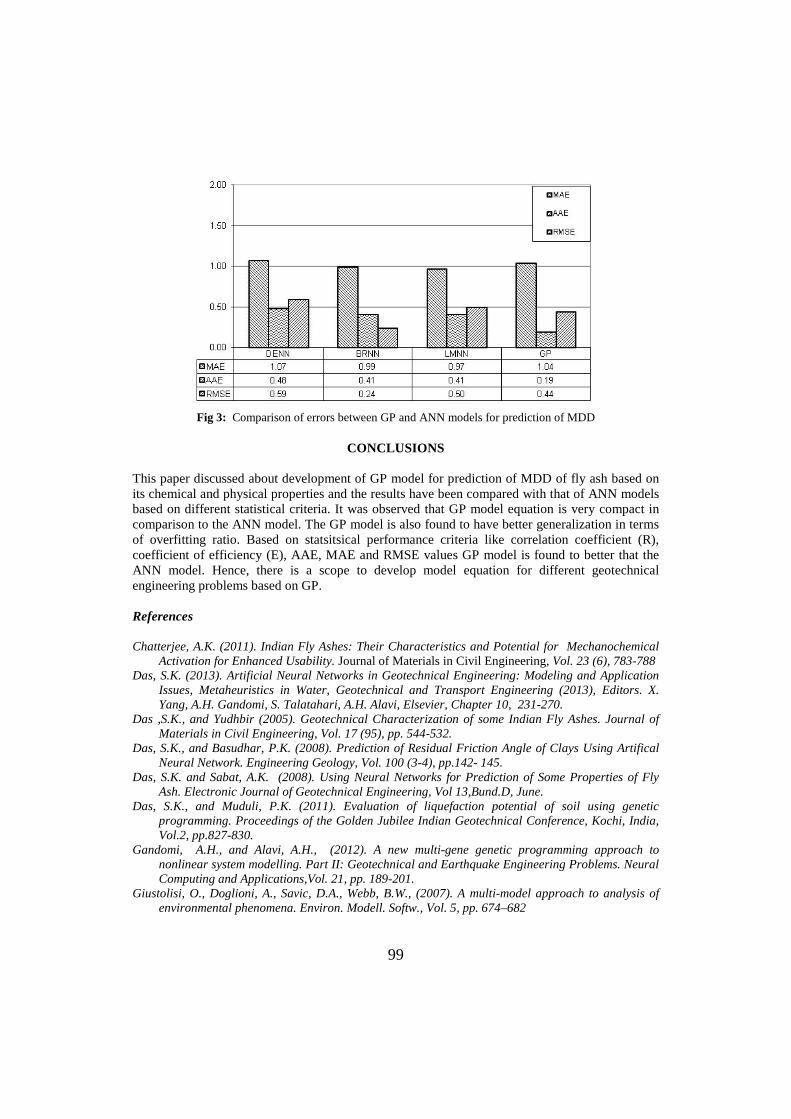
99
Fig 3: Comparison of errors between GP and ANN models for prediction of MDD
CONCLUSIONS This paper discussed about development of GP model for prediction of MDD of fly ash based on its chemical and physical properties and the results have been compared with that of ANN models based on different statistical criteria. It was observed that GP model equation is very compact in comparison to the ANN model. The GP model is also found to have better generalization in terms of overfitting ratio. Based on statsitsical performance criteria like correlation coefficient (R), coefficient of efficiency (E), AAE, MAE and RMSE values GP model is found to better that the ANN model. Hence, there is a scope to develop model equation for different geotechnical engineering problems based on GP. References Chatterjee, A.K. (2011). Indian Fly Ashes: Their Characteristics and Potential for Mechanochemical
Activation for Enhanced Usability. Journal of Materials in Civil Engineering, Vol. 23 (6), 783-788 Das, S.K. (2013). Artificial Neural Networks in Geotechnical Engineering: Modeling and Application
Issues, Metaheuristics in Water, Geotechnical and Transport Engineering (2013), Editors. X. Yang, A.H. Gandomi, S. Talatahari, A.H. Alavi, Elsevier, Chapter 10, 231-270.
Das ,S.K., and Yudhbir (2005). Geotechnical Characterization of some Indian Fly Ashes. Journal of Materials in Civil Engineering, Vol. 17 (95), pp. 544-532.
Das, S.K., and Basudhar, P.K. (2008). Prediction of Residual Friction Angle of Clays Using Artifical Neural Network. Engineering Geology, Vol. 100 (3-4), pp.142- 145.
Das, S.K. and Sabat, A.K. (2008). Using Neural Networks for Prediction of Some Properties of Fly Ash. Electronic Journal of Geotechnical Engineering, Vol 13,Bund.D, June.
Das, S.K., and Muduli, P.K. (2011). Evaluation of liquefaction potential of soil using genetic programming. Proceedings of the Golden Jubilee Indian Geotechnical Conference, Kochi, India, Vol.2, pp.827-830.
Gandomi, A.H., and Alavi, A.H., (2012). A new multi-gene genetic programming approach to nonlinear system modelling. Part II: Geotechnical and Earthquake Engineering Problems. Neural Computing and Applications,Vol. 21, pp. 189-201.
Giustolisi, O., Doglioni, A., Savic, D.A., Webb, B.W., (2007). A multi-model approach to analysis of environmental phenomena. Environ. Modell. Softw., Vol. 5, pp. 674–682

100
Hosada, N., Shinozaki, S., and Nagataki, S. (1998). Mechanical, physical, and chemical properties of coal ash in Japan. Proc., Int. Conf. on Fly Ash Disposal and Utilisation, Central Board of Irrigation and Power, New Delhi, II, VIII46–VIII54.
Joshi, R.C., and Lohtia, R.P. (1997). Fly Ash in Concrete Production, Properties and Uses. Gordon and Breach Science Publishers.
Kanriraj, S.R., and Havanagi, V.G. (2001). Correlation analysis of laboratory compaction of fly ashes. Practice periodicals of Hazardous, Toxic and Radio active Waste Management, ASCE,Vol. 5 (1), pp. 25-32.
Koza, J.R. (1992). Genetic programming: on the programming of computers by natural selection. The MIT Press, Cambridge, Mass.
MathWork Inc., Matlab User’s Manual, Version 6.5. The MathWorks Inc, Natick, 2005. Porbaha , A., Pradhan, T.B.S., and Yamane,N. (2000). Time effect on shear strength and permeability
of fly ash. Journal of Energy Engineering,Vol .126 (1), pp.15-31. Raymond, S. (1961). Pulverized Fuel Ash as Embankment Material. Proc. Inst. of Civil Engineers.
6538, pp. 515-536.
101
INVESTIGATION OF SOLUTE TRANSPORT THROUGH LAYERED SOIL
V.A. Sawant*, P. K. Sharma*, and Zubair Khan**
* Department of Civil Engineering, Indian Institute of Technology Roorkee, Roorkee-247667 ** Department of Civil Engineering, Krishna Institute of Technology Ghaziabad 201206
Abstract: Contaminant transport in porous media is very interesting and motivated by concern over the presence of a wide variety of chemical and substances in the subsurface environment. In this study, solute transport through saturated multilayer soils was studied in laboratory through soil column experiment. Chloride used as conservative and fluoride is used as reactive chemical through soil column experiment. Implicit finite difference numerical technique is used to get the numerical solution of advective dispersive transport equation for multi layered soil. Soil-water and physical properties were measured for each soil layer, respectively. During experiment pulse type boundary is used and results showed that the order in which the soil layers were stratified in a water-saturated profile did not influence the effluent solute concentration distribution. In addition to this, we also studied the effect of column Peclet number, retardation factor and first-order degradation coefficient on breakthrough curves for solute transport in three layered soil.
INTRODUCTION
It is seen that the flow and transport of contaminant in the subsurface groundwater is an important issue in the disposal of reactive chemicals. These reactive chemicals from disposal site will be transported by the flowing groundwater which has been recognizes as a serious hazard to human health. The quality of subsurface water may be affected by waste-disposal practices and industrial discharges. Leaching of natural chemical deposits increases the concentration of chlorides, chromium, iron and other inorganic chemicals in subsurface water (Charbeneau, 2000). These waters contain high concentrations of nutrients, metals, pesticides, micro-organisms and other organic chemicals. It is observed that most of the groundwater contaminants are reactive in nature and they infiltrate through the vadoze zone and reaches the water-table continues to migrate in the direction of groundwater flow. Therefore it is very essential to understand the transport process of contaminants through subsurface porous media. However, for understanding the transport process of contaminants through subsurface porous media, several mathematical models have developed. Lapidus and Amundson (1952) considered equilibrium and kinetic adsorption process in a semi-infinite column. Brenner (1962) considered the case of nonreactive solute transport in a finite soil column with boundary conditions which allowed the solute to move by advection and dispersion across the soil surface. Selim and Mansell (1976) predicted experimental and calculated results for solute transport in water-saturated and unsaturated multilayered soils, where each soil layer possessed specific soil water and solute sorption characteristics. Several solute adsorption models were considered for each layer. The results showed that for a water-saturated multilayered column regardless of soil water and solute characteristics, the order of soil layering did not influence the effluent concentration distribution. For unsaturated multilayered profiles, the results showed that the use of average water content for each soil layer provided identical effluent concentration distributions to those obtained where actual water content distributions were used.
102
Van Genuchten and Wierenga (1976) developed the mobile immobile (MIM) model which is a practical and physically based approach to describe anomalous solute transport behavior in heterogeneous soil. Selim et al. (1977) used the finite difference method to solve the convective-dispcrsive equation (CDE) for solute transport in two-layered soils under steady-state flow conditions. Transport experiments were also conducted to study the movement of Mg, Ca, and H ions in water-saturated two-layered soils (Sharkey clay and acid-washed sand) under steady-state flow. Jury and Utermann (1992) developed a travel function to resolve the problem of solute transport through layered soil, representing the travel time to any depth in the depth in the soil as the sum of travel times through the individual layers. They used wide columns to avoid artificially reducing the lateral mixing time. There are several options for coupling the solute concentrations at the interface between layers. Leij and vanGenuchten (1995) derived solution for the advection dispersion equation (ADE) describing solute transport during steady one-dimensional flow in a porous medium made up of two homogeneous layers whose interface was perpendicular to the flow direction. The solution was obtained with Laplace transforms and the binomial theorem. The conditions at the interface presume that both the solute concentration and the solute flux are continuous. The interface condition for which the current solutions were derived implies that the ordering of the layers wil l affect the break-through curve at the outlet of the medium. Zhou and Selim (2001) simulated breakthrough results of reactive solutes in layered soil with emphasis on nonlinear reactivity with the soil matrix. A physical and chemical property of each soil layer was assumed to differ significantly from one another. Linear and nonlinear equilibrium type, Langmuir-type retention, and nth-order and second-order kinetic adsorption processes were considered as the governing retention mechanisms. The BTCs are similar regardless of the layering arrangement or sequence. This finding is consistent for all reversible and irreversible solute-retention mechanisms considered. Naik et al. (2008) used a reliable method of obtaining breakthrough curves of ions in soils using transport equation. They obtained the breakthrough curves of sodium in the presence of sulphate ions in different soils and found that effective diffusion coefficient alone cannot account the entire attenuation or retardation factors. As the retardation of ions increases, the difference between theoretical and experimental curves increases. Liu and Si (2008) developed analytical modeling of one-dimensional diffusion in layered systems with a position-dependent diffusion coefficient within each layer. The orthogonal expansion technique was used to solve a one-dimensional multi-layer diffusion equation in which the diffusion coefficient is expressed as a segmented linear function of positions in the porous media
In present study, an attempt is made to investigate the behavior of concentration profile for
solute transport through saturated multilayer soils through soil column experiment in the laboratory. Chloride and fluoride chemicals are used as solute tracer through soil column experiment. Implicit finite difference numerical technique is used to get the numerical solution of advective dispersive transport equation for multi layered soil. Also, study the effect of column peclet number, retardation factor and first-order degradation coefficient on breakthrough curves for solute transport in three layered soil.
SOIL COLUMN EXPERIMENT
The experimental set-up consists of a column, made up of acrylic pipe with size of 6 mm thickness, 10 cm diameter and 60 cm long. The cross-sectional area of pipe is 78.50 cm2. A systematic sketch of experimental set-up of soil column is shown in Figure1. The soil column is filled in three layers. In layered soils, the soil consists of equal lengths and height of each layer is kept 20 cm.
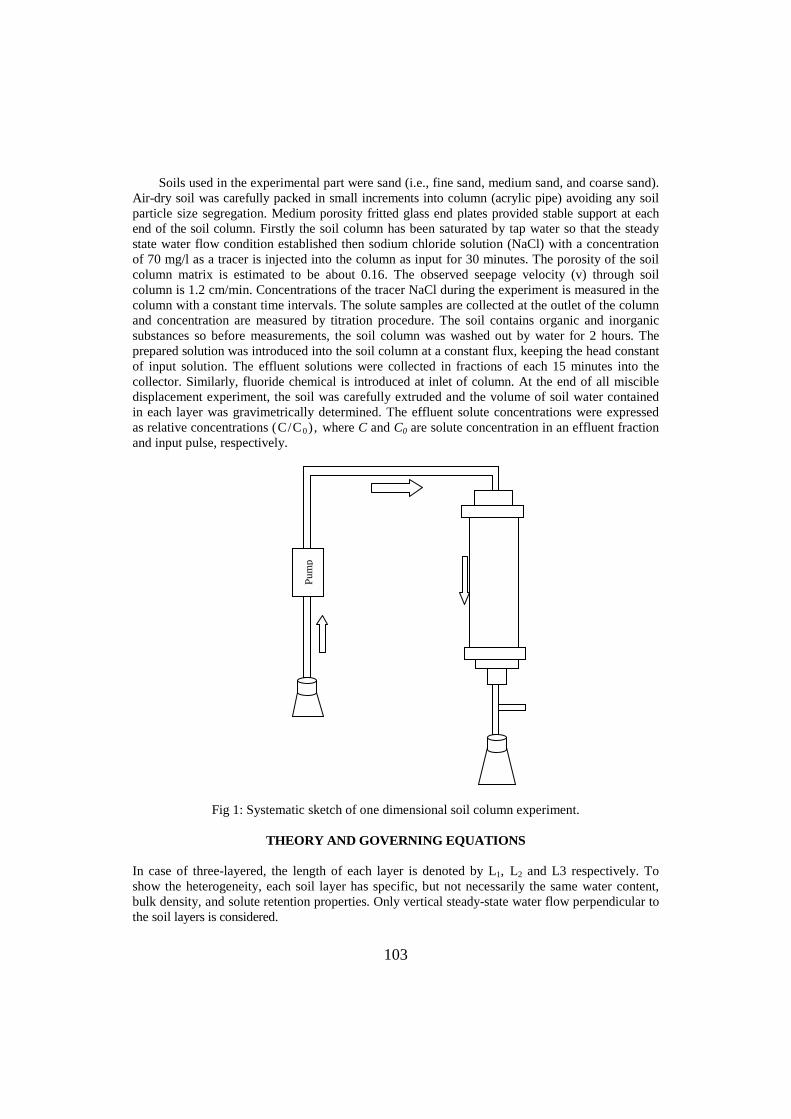
103
Pum
p
Soils used in the experimental part were sand (i.e., fine sand, medium sand, and coarse sand). Air-dry soil was carefully packed in small increments into column (acrylic pipe) avoiding any soil particle size segregation. Medium porosity fritted glass end plates provided stable support at each end of the soil column. Firstly the soil column has been saturated by tap water so that the steady state water flow condition established then sodium chloride solution (NaCl) with a concentration of 70 mg/l as a tracer is injected into the column as input for 30 minutes. The porosity of the soil column matrix is estimated to be about 0.16. The observed seepage velocity (v) through soil column is 1.2 cm/min. Concentrations of the tracer NaCl during the experiment is measured in the column with a constant time intervals. The solute samples are collected at the outlet of the column and concentration are measured by titration procedure. The soil contains organic and inorganic substances so before measurements, the soil column was washed out by water for 2 hours. The prepared solution was introduced into the soil column at a constant flux, keeping the head constant of input solution. The effluent solutions were collected in fractions of each 15 minutes into the collector. Similarly, fluoride chemical is introduced at inlet of column. At the end of all miscible displacement experiment, the soil was carefully extruded and the volume of soil water contained in each layer was gravimetrically determined. The effluent solute concentrations were expressed as relative concentrations (C/C0), where C and C0 are solute concentration in an effluent fraction and input pulse, respectively.
Fig 1: Systematic sketch of one dimensional soil column experiment.
THEORY AND GOVERNING EQUATIONS
In case of three-layered, the length of each layer is denoted by L1, L2 and L3 respectively. To show the heterogeneity, each soil layer has specific, but not necessarily the same water content, bulk density, and solute retention properties. Only vertical steady-state water flow perpendicular to the soil layers is considered.
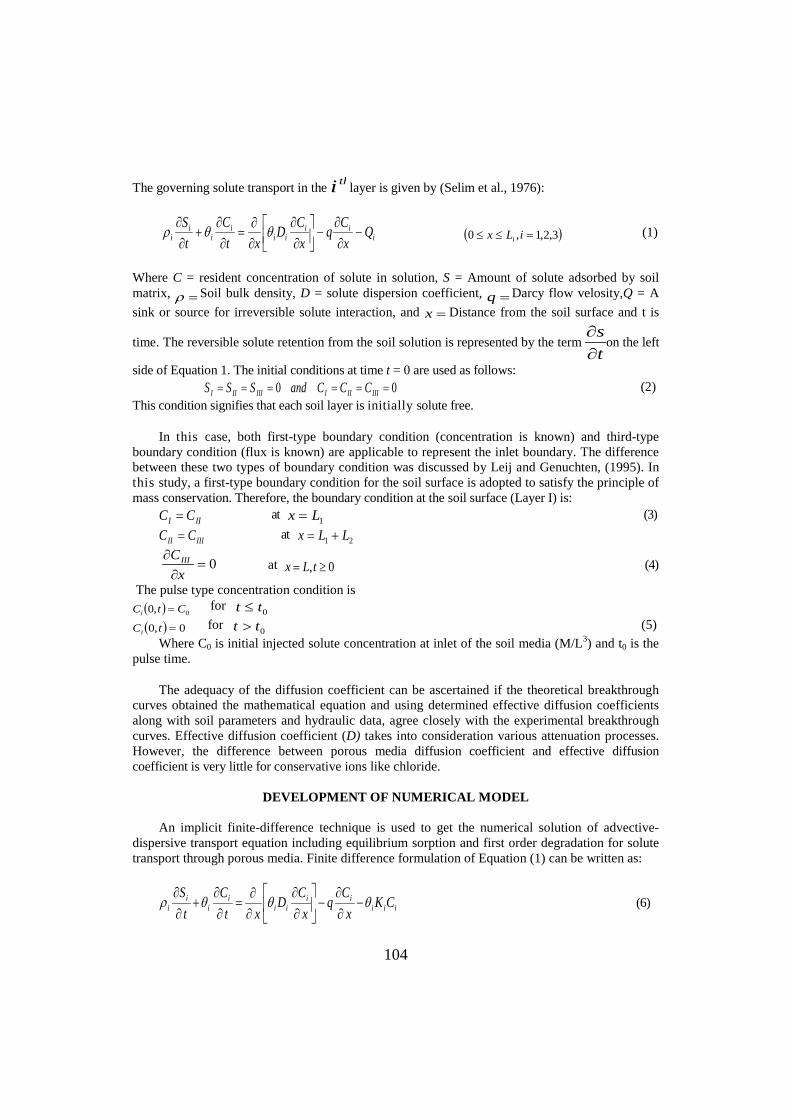
104
The governing solute transport in the thi layer is given by (Selim et al., 1976):
iii
iii
ii
i Qx
Cqx
CDxt
Ct
S−
∂∂
−
∂∂
∂∂
=∂∂
+∂∂
θθρ
( )3,2,1,0 =≤≤ iLx i (1)
Where C = resident concentration of solute in solution, S = Amount of solute adsorbed by soil matrix, =ρ Soil bulk density, D = solute dispersion coefficient, =q Darcy flow velosity,Q = A sink or source for irreversible solute interaction, and =x Distance from the soil surface and t is
time. The reversible solute retention from the soil solution is represented by the term ts∂∂
on the left
side of Equation 1. The initial conditions at time t = 0 are used as follows: 00 ====== IIIIIIIIIIII CCCandSSS (2)
This condition signifies that each soil layer is initially solute free.
In this case, both first-type boundary condition (concentration is known) and third-type boundary condition (flux is known) are applicable to represent the inlet boundary. The difference between these two types of boundary condition was discussed by Leij and Genuchten, (1995). In this study, a first-type boundary condition for the soil surface is adopted to satisfy the principle of mass conservation. Therefore, the boundary condition at the soil surface (Layer I) is:
III CC = at 1Lx = (3)
IIIII CC = at 21 LLx +=
0=
∂∂
xCIII at 0, ≥= tLx (4)
The pulse type concentration condition is ( ) 0,0 CtCi = for 0tt ≤
( ) 0,0 =tCi for 0tt > (5)
Where C0 is initial injected solute concentration at inlet of the soil media (M/L3) and t0 is the pulse time.
The adequacy of the diffusion coefficient can be ascertained if the theoretical breakthrough curves obtained the mathematical equation and using determined effective diffusion coefficients along with soil parameters and hydraulic data, agree closely with the experimental breakthrough curves. Effective diffusion coefficient (D) takes into consideration various attenuation processes. However, the difference between porous media diffusion coefficient and effective diffusion coefficient is very little for conservative ions like chloride.
DEVELOPMENT OF NUMERICAL MODEL
An implicit finite-difference technique is used to get the numerical solution of advective-
dispersive transport equation including equilibrium sorption and first order degradation for solute transport through porous media. Finite difference formulation of Equation (1) can be written as:
iiiii
iii
ii
i CKx
Cqx
CDxt
Ct
Sθθθρ −
∂∂
−
∂∂
∂∂
=∂∂
+∂∂
(6)
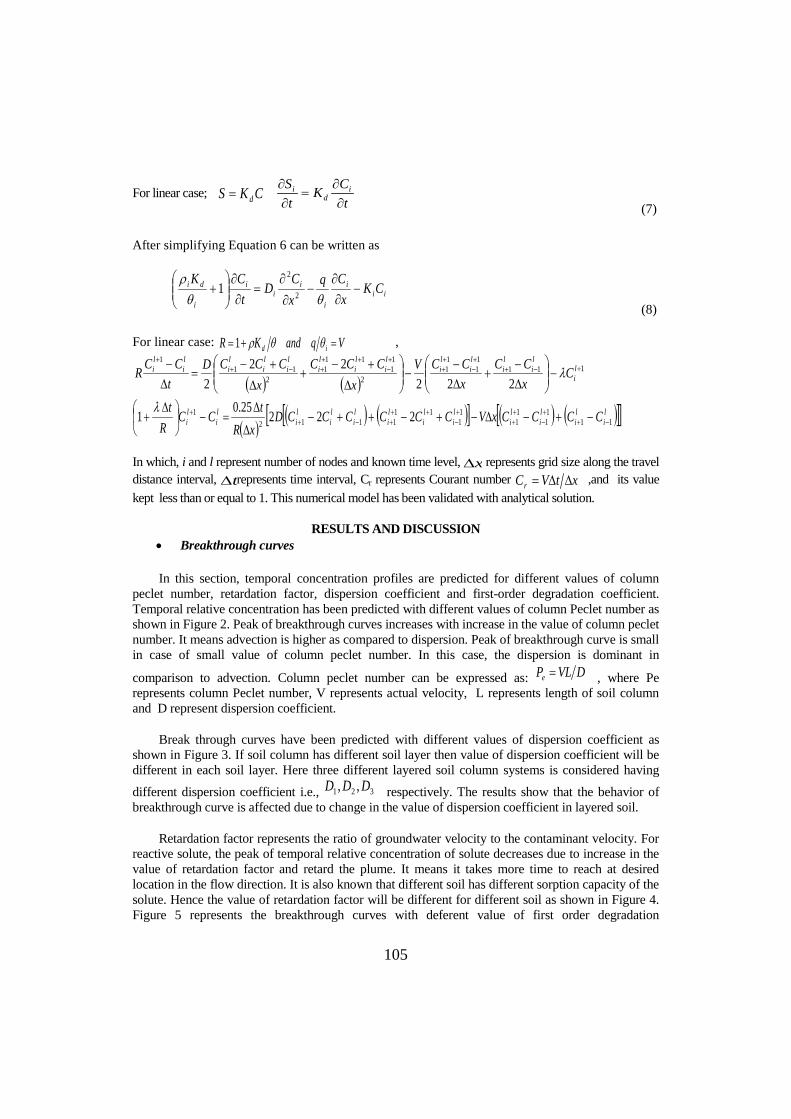
105
For linear case; CKS d= tCK
tS i
di
∂∂
=∂∂
(7)
After simplifying Equation 6 can be written as
ii
i
i
ii
i
i
di CKx
CqxC
Dt
CK−
∂∂
−∂∂
=∂∂
+
θθρ
2
2
1 (8)
For linear case: VqandKR id =+= θθρ1 ,
( ) ( )111
11
11
2
11
111
211
1
22222
2+−+
+−
++
+−
+++−+
+
−
∆−
+∆−
−
∆+−
+∆
+−=
∆− l
i
li
li
li
li
li
li
li
li
li
li
li
li C
xCC
xCCV
xCCC
xCCCD
tCCR λ
( )( ) ( )[ ] ( ) ( )[ ][ ]l
ili
li
li
li
li
li
li
li
li
li
li CCCCxVCCCCCCD
xRt
CCR
t11
11
11
11
111112
1 22225.0
1 −++−
++
+−
+++−+
+ −+−∆−+−++−∆
∆=−
∆+λ
In which, i and l represent number of nodes and known time level, x∆ represents grid size along the travel distance interval, t∆ represents time interval, Cr represents Courant number xtVCr ∆∆= ,and its value kept less than or equal to 1. This numerical model has been validated with analytical solution.
RESULTS AND DISCUSSION
• Breakthrough curves
In this section, temporal concentration profiles are predicted for different values of column peclet number, retardation factor, dispersion coefficient and first-order degradation coefficient. Temporal relative concentration has been predicted with different values of column Peclet number as shown in Figure 2. Peak of breakthrough curves increases with increase in the value of column peclet number. It means advection is higher as compared to dispersion. Peak of breakthrough curve is small in case of small value of column peclet number. In this case, the dispersion is dominant in
comparison to advection. Column peclet number can be expressed as: DVLPe = , where Pe represents column Peclet number, V represents actual velocity, L represents length of soil column and D represent dispersion coefficient.
Break through curves have been predicted with different values of dispersion coefficient as shown in Figure 3. If soil column has different soil layer then value of dispersion coefficient will be different in each soil layer. Here three different layered soil column systems is considered having
different dispersion coefficient i.e., 321 ,, DDD respectively. The results show that the behavior of breakthrough curve is affected due to change in the value of dispersion coefficient in layered soil.
Retardation factor represents the ratio of groundwater velocity to the contaminant velocity. For reactive solute, the peak of temporal relative concentration of solute decreases due to increase in the value of retardation factor and retard the plume. It means it takes more time to reach at desired location in the flow direction. It is also known that different soil has different sorption capacity of the solute. Hence the value of retardation factor will be different for different soil as shown in Figure 4. Figure 5 represents the breakthrough curves with deferent value of first order degradation
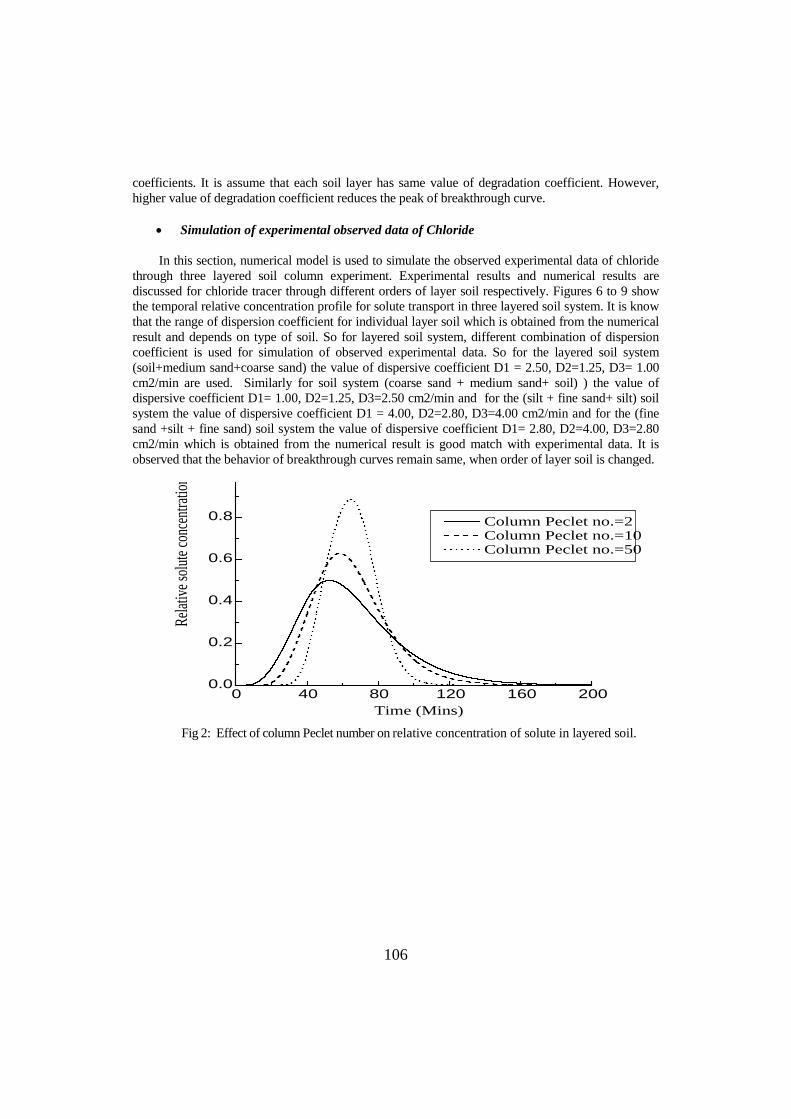
106
coefficients. It is assume that each soil layer has same value of degradation coefficient. However, higher value of degradation coefficient reduces the peak of breakthrough curve.
• Simulation of experimental observed data of Chloride
In this section, numerical model is used to simulate the observed experimental data of chloride through three layered soil column experiment. Experimental results and numerical results are discussed for chloride tracer through different orders of layer soil respectively. Figures 6 to 9 show the temporal relative concentration profile for solute transport in three layered soil system. It is know that the range of dispersion coefficient for individual layer soil which is obtained from the numerical result and depends on type of soil. So for layered soil system, different combination of dispersion coefficient is used for simulation of observed experimental data. So for the layered soil system (soil+medium sand+coarse sand) the value of dispersive coefficient D1 = 2.50, D2=1.25, D3= 1.00 cm2/min are used. Similarly for soil system (coarse sand + medium sand+ soil) ) the value of dispersive coefficient D1= 1.00, D2=1.25, D3=2.50 cm2/min and for the (silt + fine sand+ silt) soil system the value of dispersive coefficient D1 = 4.00, D2=2.80, D3=4.00 cm2/min and for the (fine sand +silt + fine sand) soil system the value of dispersive coefficient D1= 2.80, D2=4.00, D3=2.80 cm2/min which is obtained from the numerical result is good match with experimental data. It is observed that the behavior of breakthrough curves remain same, when order of layer soil is changed.
0 40 80 120 160 2000.0
0.2
0.4
0.6
0.8
1.0
Relat
ive so
lute c
oncen
tratio
n
Time (Mins)
Column Peclet no.=2 Column Peclet no.=10 Column Peclet no.=50
Fig 2: Effect of column Peclet number on relative concentration of solute in layered soil.
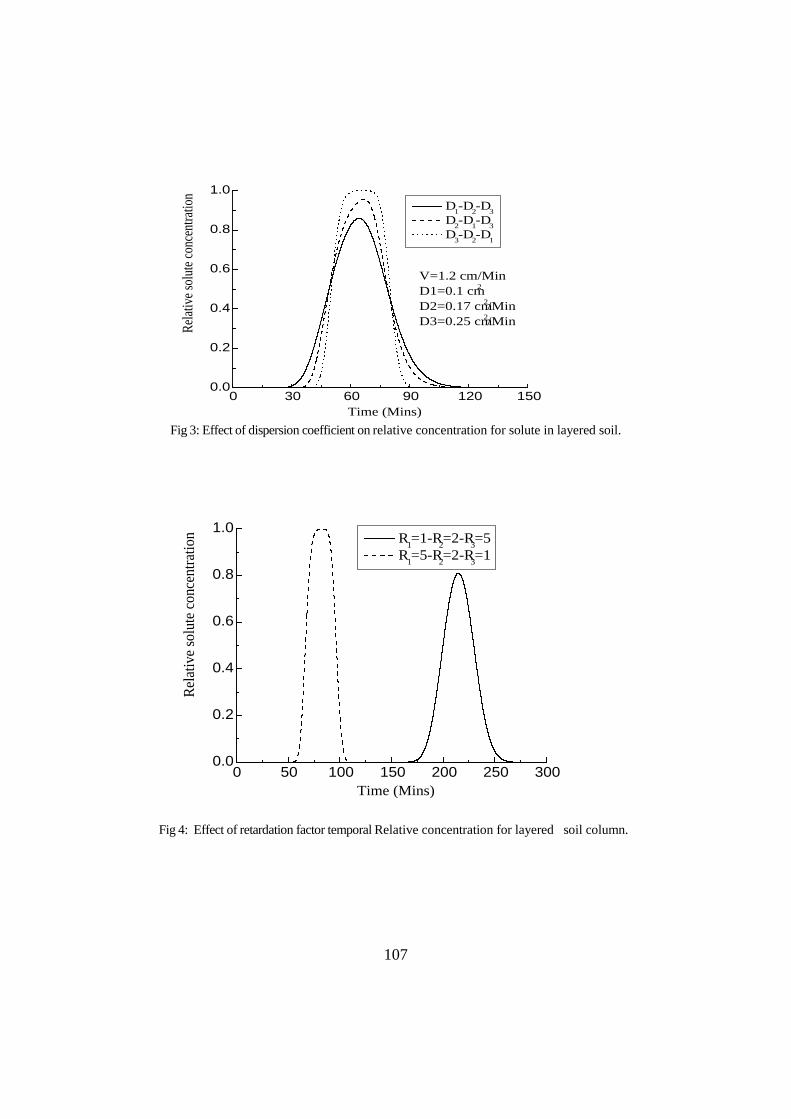
107
0 30 60 90 120 1500.0
0.2
0.4
0.6
0.8
1.0
V=1.2 cm/MinD1=0.1 cm2
D2=0.17 cm2/MinD3=0.25 cm2/MinRe
lative
solut
e con
centr
ation
Time (Mins)
D1-D2-D3 D2-D1-D3 D3-D2-D1
Fig 3: Effect of dispersion coefficient on relative concentration for solute in layered soil.
0 50 100 150 200 250 3000.0
0.2
0.4
0.6
0.8
1.0
Rela
tive s
olut
e con
cent
ratio
n
Time (Mins)
R1=1-R2=2-R3=5 R1=5-R2=2-R3=1
Fig 4: Effect of retardation factor temporal Relative concentration for layered soil column.
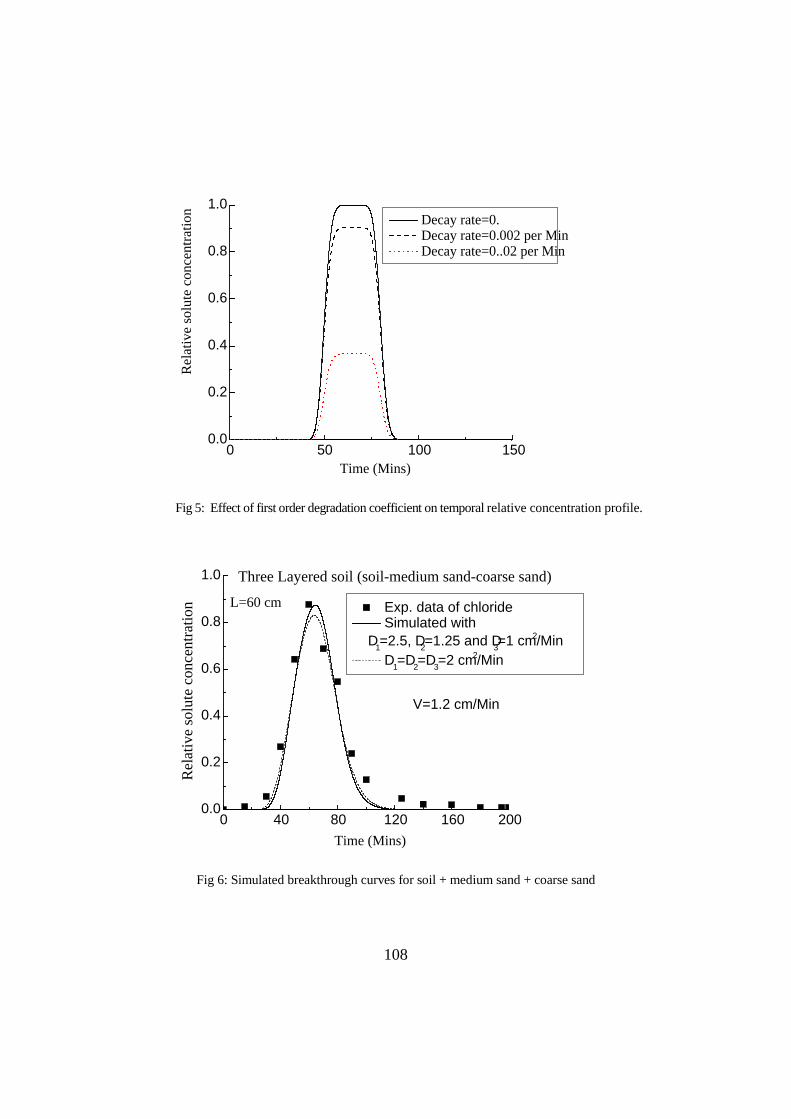
108
0 50 100 1500.0
0.2
0.4
0.6
0.8
1.0R
elat
ive
solu
te c
once
ntra
tion
Time (Mins)
Decay rate=0. Decay rate=0.002 per Min Decay rate=0..02 per Min
Fig 5: Effect of first order degradation coefficient on temporal relative concentration profile.
0 40 80 120 160 2000.0
0.2
0.4
0.6
0.8
1.0
L=60 cm
Three Layered soil (soil-medium sand-coarse sand)
V=1.2 cm/Min
Rel
ativ
e so
lute
con
cent
ratio
n
Time (Mins)
Exp. data of chloride Simulated with
D1=2.5, D2=1.25 and D3=1 cm2/Min D1=D2=D3=2 cm2/Min
Fig 6: Simulated breakthrough curves for soil + medium sand + coarse sand
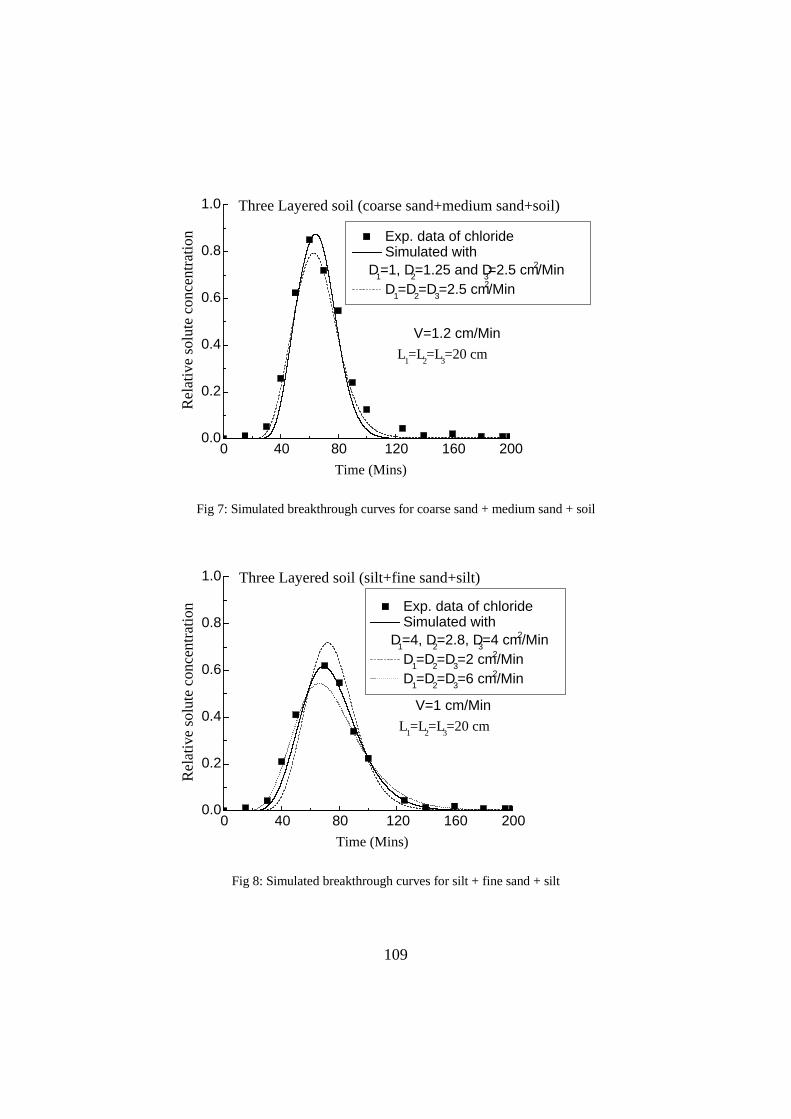
109
0 40 80 120 160 2000.0
0.2
0.4
0.6
0.8
1.0
L1=L2=L3=20 cm
Three Layered soil (coarse sand+medium sand+soil)
V=1.2 cm/Min
Rel
ativ
e so
lute
con
cent
ratio
n
Time (Mins)
Exp. data of chloride Simulated with
D1=1, D2=1.25 and D3=2.5 cm2/Min D1=D2=D3=2.5 cm2/Min
Fig 7: Simulated breakthrough curves for coarse sand + medium sand + soil
0 40 80 120 160 2000.0
0.2
0.4
0.6
0.8
1.0
L1=L2=L3=20 cm
Three Layered soil (silt+fine sand+silt)
V=1 cm/Min
Rel
ativ
e so
lute
con
cent
ratio
n
Time (Mins)
Exp. data of chloride Simulated with
D1=4, D2=2.8, D3=4 cm2/Min D1=D2=D3=2 cm2/Min D1=D2=D3=6 cm2/Min
Fig 8: Simulated breakthrough curves for silt + fine sand + silt
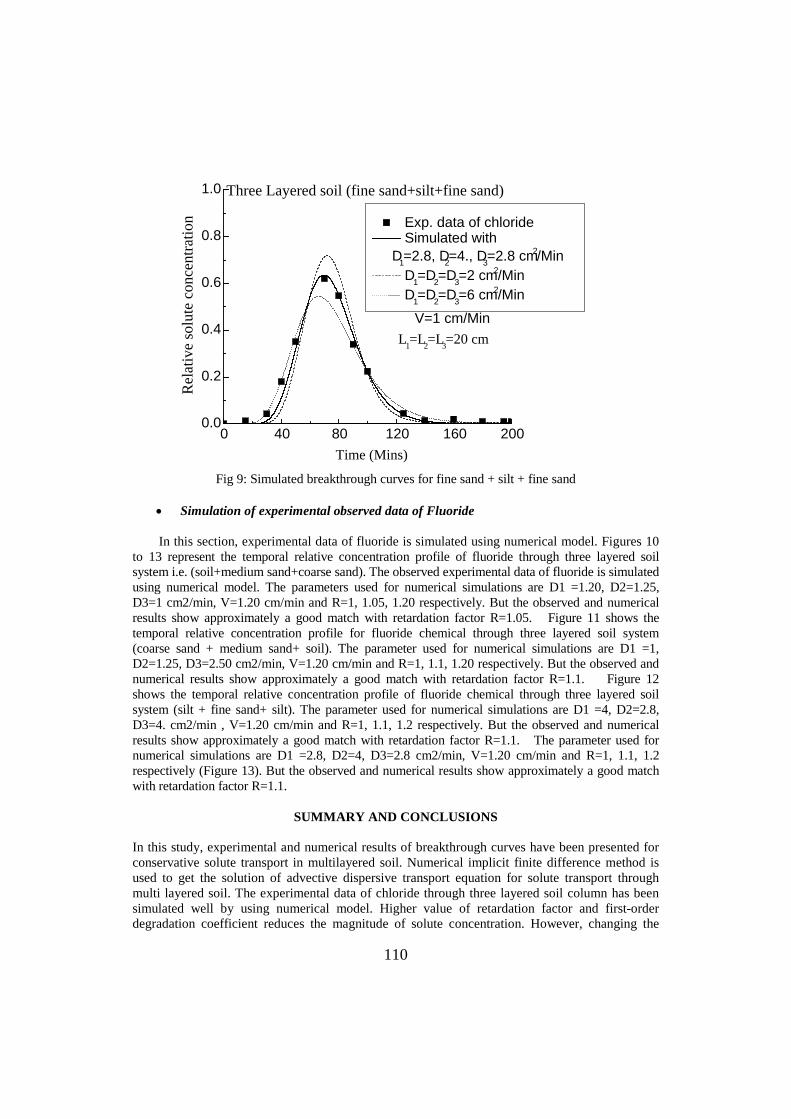
110
0 40 80 120 160 2000.0
0.2
0.4
0.6
0.8
1.0
L1=L2=L3=20 cm
Three Layered soil (fine sand+silt+fine sand)
V=1 cm/Min
Rel
ativ
e so
lute
con
cent
ratio
n
Time (Mins)
Exp. data of chloride Simulated with
D1=2.8, D2=4., D3=2.8 cm2/Min D1=D2=D3=2 cm2/Min D1=D2=D3=6 cm2/Min
Fig 9: Simulated breakthrough curves for fine sand + silt + fine sand
• Simulation of experimental observed data of Fluoride
In this section, experimental data of fluoride is simulated using numerical model. Figures 10 to 13 represent the temporal relative concentration profile of fluoride through three layered soil system i.e. (soil+medium sand+coarse sand). The observed experimental data of fluoride is simulated using numerical model. The parameters used for numerical simulations are D1 =1.20, D2=1.25, D3=1 cm2/min, V=1.20 cm/min and R=1, 1.05, 1.20 respectively. But the observed and numerical results show approximately a good match with retardation factor R=1.05. Figure 11 shows the temporal relative concentration profile for fluoride chemical through three layered soil system (coarse sand + medium sand+ soil). The parameter used for numerical simulations are D1 =1, D2=1.25, D3=2.50 cm2/min, V=1.20 cm/min and R=1, 1.1, 1.20 respectively. But the observed and numerical results show approximately a good match with retardation factor R=1.1. Figure 12 shows the temporal relative concentration profile of fluoride chemical through three layered soil system (silt + fine sand+ silt). The parameter used for numerical simulations are D1 =4, D2=2.8, D3=4. cm2/min , V=1.20 cm/min and R=1, 1.1, 1.2 respectively. But the observed and numerical results show approximately a good match with retardation factor R=1.1. The parameter used for numerical simulations are D1 =2.8, D2=4, D3=2.8 cm2/min, V=1.20 cm/min and R=1, 1.1, 1.2 respectively (Figure 13). But the observed and numerical results show approximately a good match with retardation factor R=1.1.
SUMMARY AND CONCLUSIONS
In this study, experimental and numerical results of breakthrough curves have been presented for conservative solute transport in multilayered soil. Numerical implicit finite difference method is used to get the solution of advective dispersive transport equation for solute transport through multi layered soil. The experimental data of chloride through three layered soil column has been simulated well by using numerical model. Higher value of retardation factor and first-order degradation coefficient reduces the magnitude of solute concentration. However, changing the
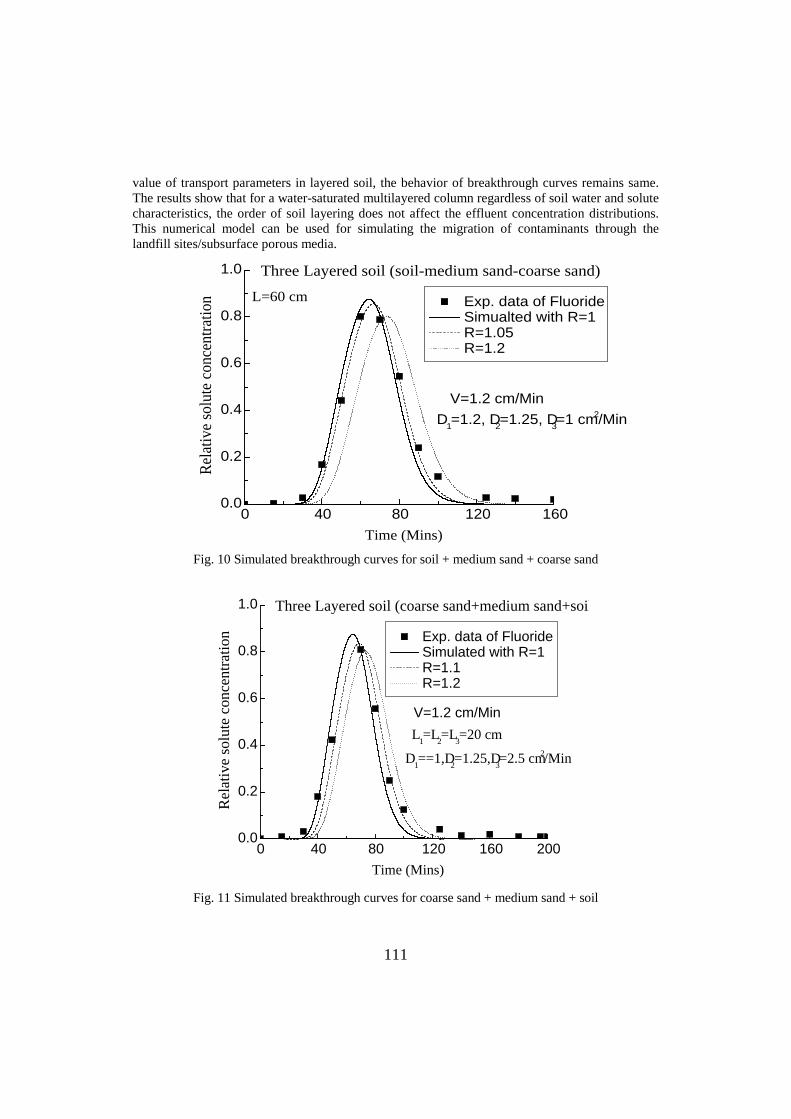
111
value of transport parameters in layered soil, the behavior of breakthrough curves remains same. The results show that for a water-saturated multilayered column regardless of soil water and solute characteristics, the order of soil layering does not affect the effluent concentration distributions. This numerical model can be used for simulating the migration of contaminants through the landfill sites/subsurface porous media.
0 40 80 120 1600.0
0.2
0.4
0.6
0.8
1.0
D1=1.2, D2=1.25, D3=1 cm2/Min
L=60 cm
Three Layered soil (soil-medium sand-coarse sand)
V=1.2 cm/Min
Rela
tive s
olut
e con
cent
ratio
n
Time (Mins)
Exp. data of Fluoride Simualted with R=1 R=1.05 R=1.2
Fig. 10 Simulated breakthrough curves for soil + medium sand + coarse sand
0 40 80 120 160 2000.0
0.2
0.4
0.6
0.8
1.0
D1==1,D2=1.25,D3=2.5 cm2/Min
L1=L2=L3=20 cm
Three Layered soil (coarse sand+medium sand+soil)
V=1.2 cm/Min
Rel
ativ
e so
lute
con
cent
ratio
n
Time (Mins)
Exp. data of Fluoride Simulated with R=1 R=1.1 R=1.2
Fig. 11 Simulated breakthrough curves for coarse sand + medium sand + soil
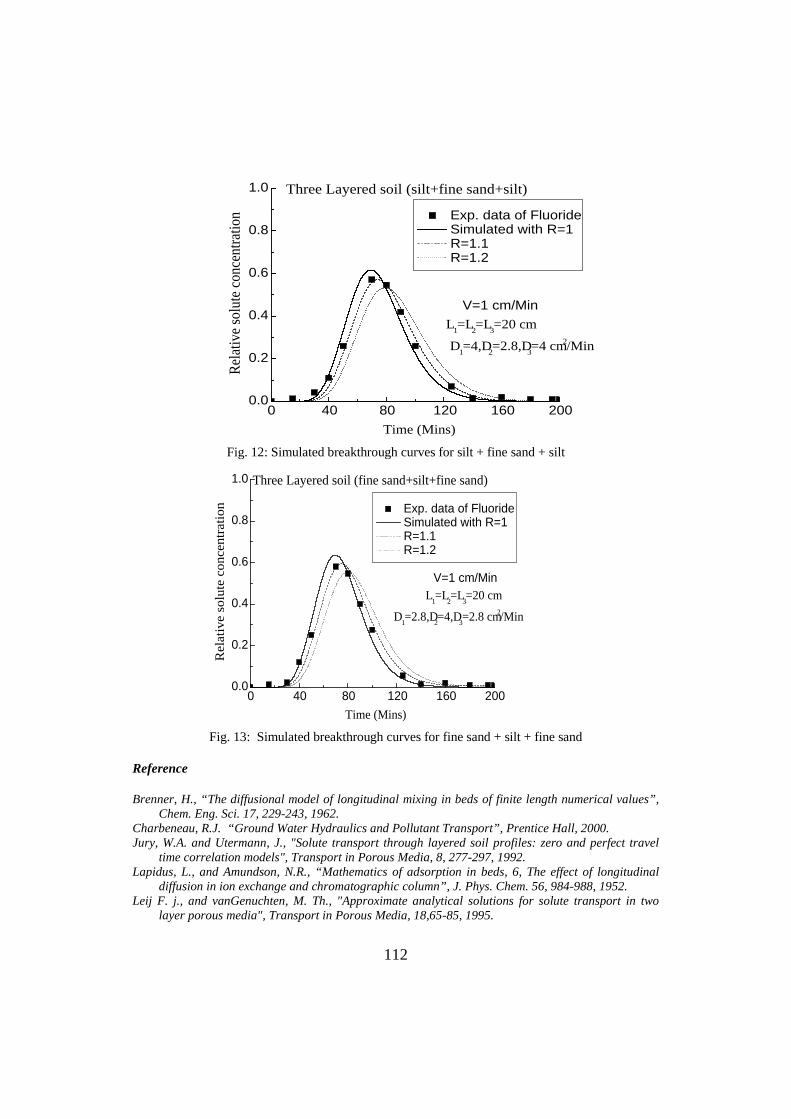
112
0 40 80 120 160 2000.0
0.2
0.4
0.6
0.8
1.0
D1=4,D2=2.8,D3=4 cm2/Min
L1=L2=L3=20 cm
Three Layered soil (silt+fine sand+silt)
V=1 cm/Min
Relat
ive s
olut
e con
cent
ratio
n
Time (Mins)
Exp. data of Fluoride Simulated with R=1 R=1.1 R=1.2
Fig. 12: Simulated breakthrough curves for silt + fine sand + silt
0 40 80 120 160 2000.0
0.2
0.4
0.6
0.8
1.0
D1=2.8,D2=4,D3=2.8 cm2/Min
L1=L2=L3=20 cm
Three Layered soil (fine sand+silt+fine sand)
V=1 cm/Min
Rel
ativ
e so
lute
con
cent
ratio
n
Time (Mins)
Exp. data of Fluoride Simulated with R=1 R=1.1 R=1.2
Fig. 13: Simulated breakthrough curves for fine sand + silt + fine sand
Reference
Brenner, H., “The diffusional model of longitudinal mixing in beds of finite length numerical values”, Chem. Eng. Sci. 17, 229-243, 1962.
Charbeneau, R.J. “Ground Water Hydraulics and Pollutant Transport”, Prentice Hall, 2000. Jury, W.A. and Utermann, J., "Solute transport through layered soil profiles: zero and perfect travel
time correlation models", Transport in Porous Media, 8, 277-297, 1992. Lapidus, L., and Amundson, N.R., “Mathematics of adsorption in beds, 6, The effect of longitudinal
diffusion in ion exchange and chromatographic column”, J. Phys. Chem. 56, 984-988, 1952. Leij F. j., and vanGenuchten, M. Th., "Approximate analytical solutions for solute transport in two
layer porous media", Transport in Porous Media, 18,65-85, 1995.
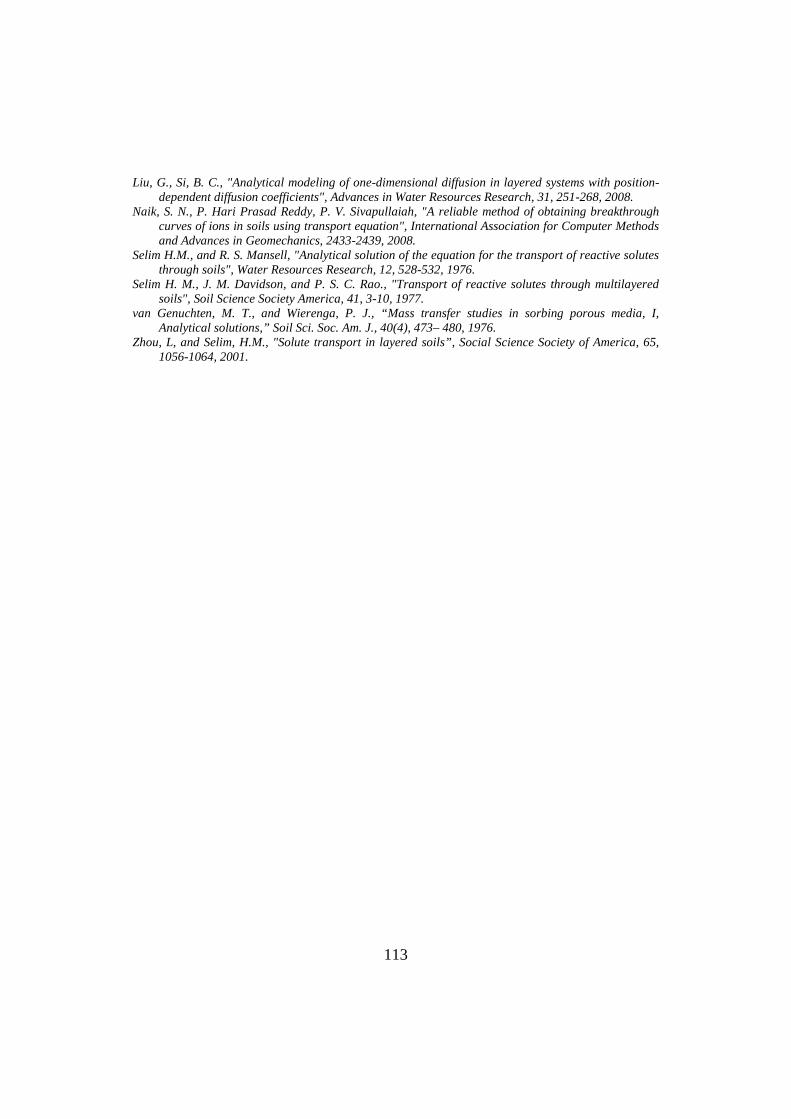
113
Liu, G., Si, B. C., "Analytical modeling of one-dimensional diffusion in layered systems with position-dependent diffusion coefficients", Advances in Water Resources Research, 31, 251-268, 2008.
Naik, S. N., P. Hari Prasad Reddy, P. V. Sivapullaiah, "A reliable method of obtaining breakthrough curves of ions in soils using transport equation", International Association for Computer Methods and Advances in Geomechanics, 2433-2439, 2008.
Selim H.M., and R. S. Mansell, "Analytical solution of the equation for the transport of reactive solutes through soils", Water Resources Research, 12, 528-532, 1976.
Selim H. M., J. M. Davidson, and P. S. C. Rao., "Transport of reactive solutes through multilayered soils", Soil Science Society America, 41, 3-10, 1977.
van Genuchten, M. T., and Wierenga, P. J., “Mass transfer studies in sorbing porous media, I, Analytical solutions,” Soil Sci. Soc. Am. J., 40(4), 473– 480, 1976.
Zhou, L, and Selim, H.M., "Solute transport in layered soils”, Social Science Society of America, 65, 1056-1064, 2001.
114
CHARACTERIZATION OF COAL-REJECT AS A PAVEMENT MATERIAL
Sarat Kumar Das*, T Sivaramakrishna Sharma* and Sujata Priyadarshini**
* National Institute of Technology Rourkela, Rourkela, Odisha, India ** VSS University of Technology Burla, Odisha, India
Abstract: Coal-reject is the waste resulting from the separation of genuine coal from a jumble of other mined out materials. After extraction of the valuable coal the coal- rejects are generally dumped or stored in site close to coal wash yard. Construction of highways, major part of infrastructure development has resulted in using vast tract of natural resources. This paper discusses characterization of coal-reject as a pavement material based on laboratory finding. The geotechnical properties such as grain size distribution, specific gravity, compaction characteristics, shear strength and California bearing ratio (CBR) of coal-reject and coal-reject stabilized using Portland cement is presented.
INTRODUCTION
Construction of embankment has become an integral part of major road works in construction of National highways, expressways and other connectivity. Presence of expansive soils, shortage of borrow area soil creates lots of hindrance to such projects. From environmental consideration vast use of top soil in available area is also matter of concern as its takes thousands of years to form the natural top soil. Now, there is great concern regarding use of alternate/waste material in place of natural top soil. In this regard various attempts have been made to utilize industrial wastes like fly ash, slag and red mud as a construction material.
Coal-reject is the waste resulting from the separation of genuine coal from a jumble of other mined out materials. Major composition of the coal-reject includes quartz (55.6%), feldspar/clay (35.4%) and mica (3.3%) with other minor constituents as iron oxide, titanium oxide, magnesia, lime, potash and soda (Okagbue and Ezeajugh 1991). However, geotechnical characterization of coal – reject is very limited.
Okagbue and Ochulor (2007) investigated the effectiveness of cement stabilized Nigerian coal-reject for various construction purposes. The results showed that the engineering properties of Nigerian coal-reject are improved significantly by the addition of Portland cement, with a reduction in shrinkage as well as an increase in strength and bearing capacity. Okagbue et al. (2011) used fused limestone and clay to stabilize coal-reject. However, to the best knowledge of the authors geotechnical characterization of coal-reject is not available. Hence, an attempt has been made to characterize coal-reject as a pavement material.
RESULTS AND DISCUSSION
The coal-reject in the present study was collected from Raigarh, Chhattisgarh, India. Various geotechnical laboratory experiments were conducted as per relevant Indian standards. The results of the above experiments are presented as follows. The specific gravity (G) of the coal-reject is found to be low value of 2.13 in comparison to specific gravity of soil as 2.65-2.70. Okagbue and
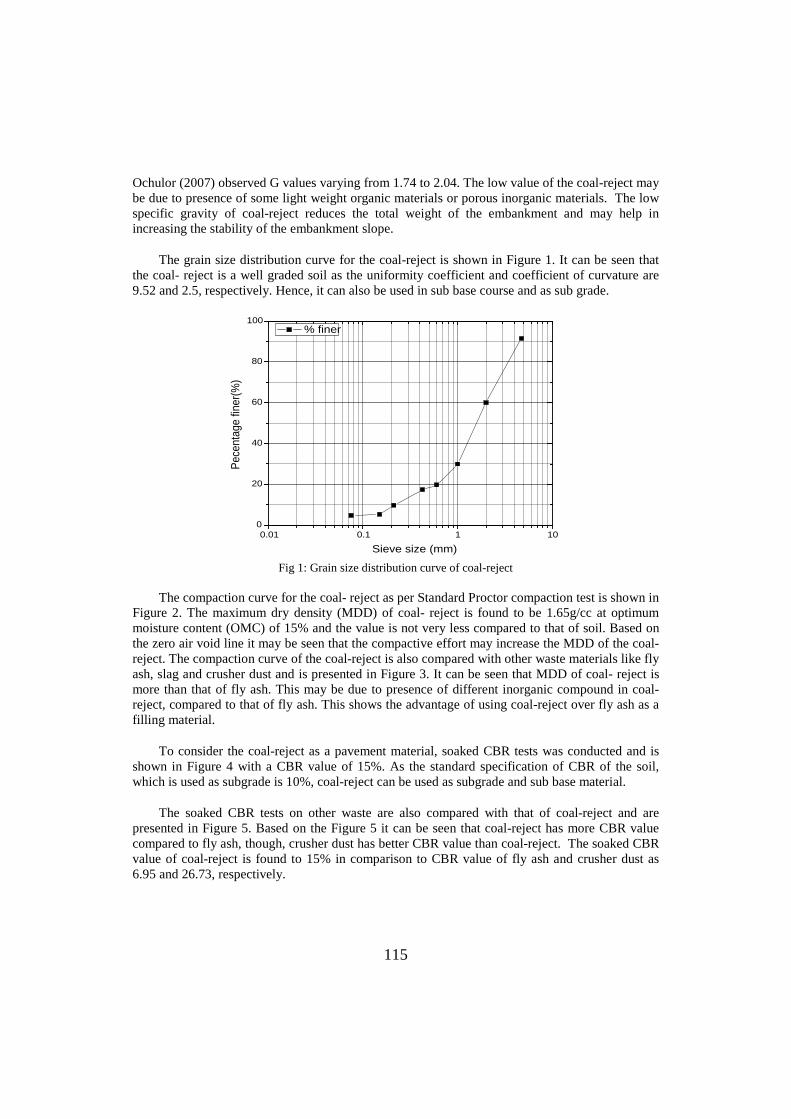
115
Ochulor (2007) observed G values varying from 1.74 to 2.04. The low value of the coal-reject may be due to presence of some light weight organic materials or porous inorganic materials. The low specific gravity of coal-reject reduces the total weight of the embankment and may help in increasing the stability of the embankment slope.
The grain size distribution curve for the coal-reject is shown in Figure 1. It can be seen that the coal- reject is a well graded soil as the uniformity coefficient and coefficient of curvature are 9.52 and 2.5, respectively. Hence, it can also be used in sub base course and as sub grade.
Fig 1: Grain size distribution curve of coal-reject
The compaction curve for the coal- reject as per Standard Proctor compaction test is shown in
Figure 2. The maximum dry density (MDD) of coal- reject is found to be 1.65g/cc at optimum moisture content (OMC) of 15% and the value is not very less compared to that of soil. Based on the zero air void line it may be seen that the compactive effort may increase the MDD of the coal-reject. The compaction curve of the coal-reject is also compared with other waste materials like fly ash, slag and crusher dust and is presented in Figure 3. It can be seen that MDD of coal- reject is more than that of fly ash. This may be due to presence of different inorganic compound in coal-reject, compared to that of fly ash. This shows the advantage of using coal-reject over fly ash as a filling material.
To consider the coal-reject as a pavement material, soaked CBR tests was conducted and is shown in Figure 4 with a CBR value of 15%. As the standard specification of CBR of the soil, which is used as subgrade is 10%, coal-reject can be used as subgrade and sub base material.
The soaked CBR tests on other waste are also compared with that of coal-reject and are presented in Figure 5. Based on the Figure 5 it can be seen that coal-reject has more CBR value compared to fly ash, though, crusher dust has better CBR value than coal-reject. The soaked CBR value of coal-reject is found to 15% in comparison to CBR value of fly ash and crusher dust as 6.95 and 26.73, respectively.
0.01 0.1 1 100
20
40
60
80
100
Pece
ntag
e fin
er(%
)
Sieve size (mm)
% finer
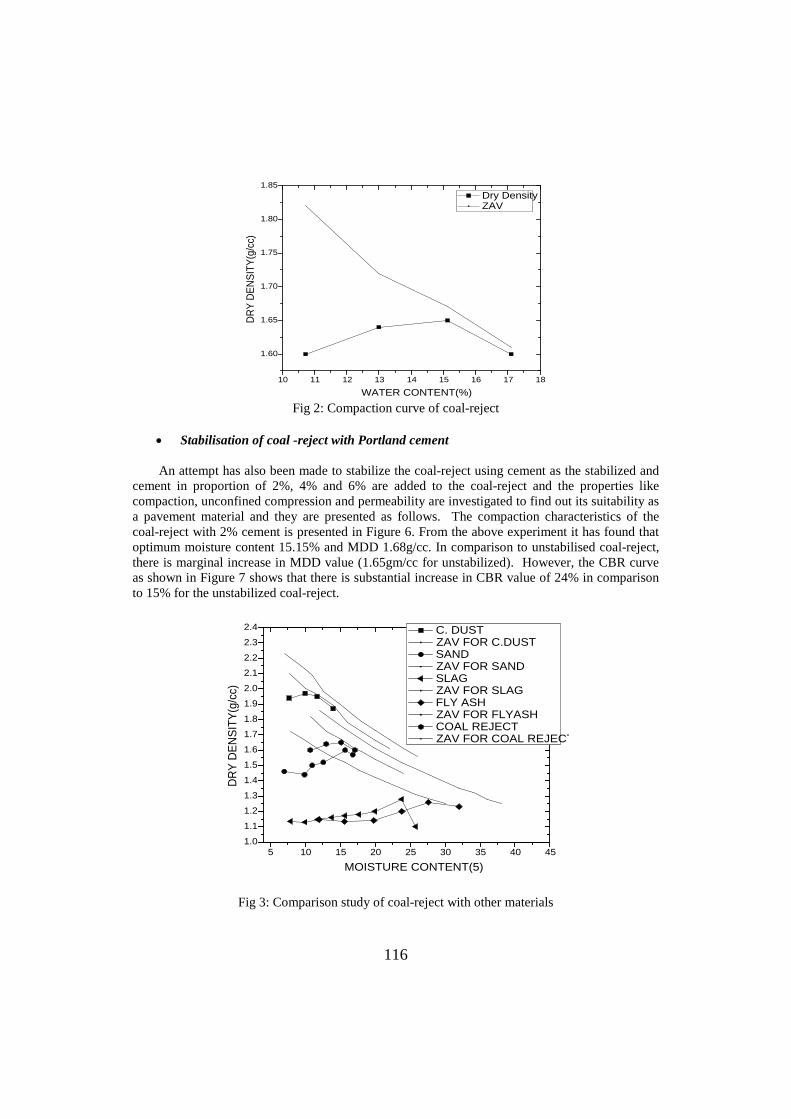
116
Fig 2: Compaction curve of coal-reject
• Stabilisation of coal -reject with Portland cement
An attempt has also been made to stabilize the coal-reject using cement as the stabilized and cement in proportion of 2%, 4% and 6% are added to the coal-reject and the properties like compaction, unconfined compression and permeability are investigated to find out its suitability as a pavement material and they are presented as follows. The compaction characteristics of the coal-reject with 2% cement is presented in Figure 6. From the above experiment it has found that optimum moisture content 15.15% and MDD 1.68g/cc. In comparison to unstabilised coal-reject, there is marginal increase in MDD value (1.65gm/cc for unstabilized). However, the CBR curve as shown in Figure 7 shows that there is substantial increase in CBR value of 24% in comparison to 15% for the unstabilized coal-reject.
Fig 3: Comparison study of coal-reject with other materials
10 11 12 13 14 15 16 17 18
1.60
1.65
1.70
1.75
1.80
1.85
DRY
DENS
ITY(
g/cc
)
WATER CONTENT(%)
Dry Density ZAV
5 10 15 20 25 30 35 40 451.0
1.1
1.2
1.3
1.4
1.5
1.6
1.7
1.8
1.9
2.0
2.1
2.2
2.3
2.4
DRY
DENS
ITY(
g/cc
)
MOISTURE CONTENT(5)
C. DUST ZAV FOR C.DUST SAND ZAV FOR SAND SLAG ZAV FOR SLAG FLY ASH ZAV FOR FLYASH COAL REJECT ZAV FOR COAL REJECT
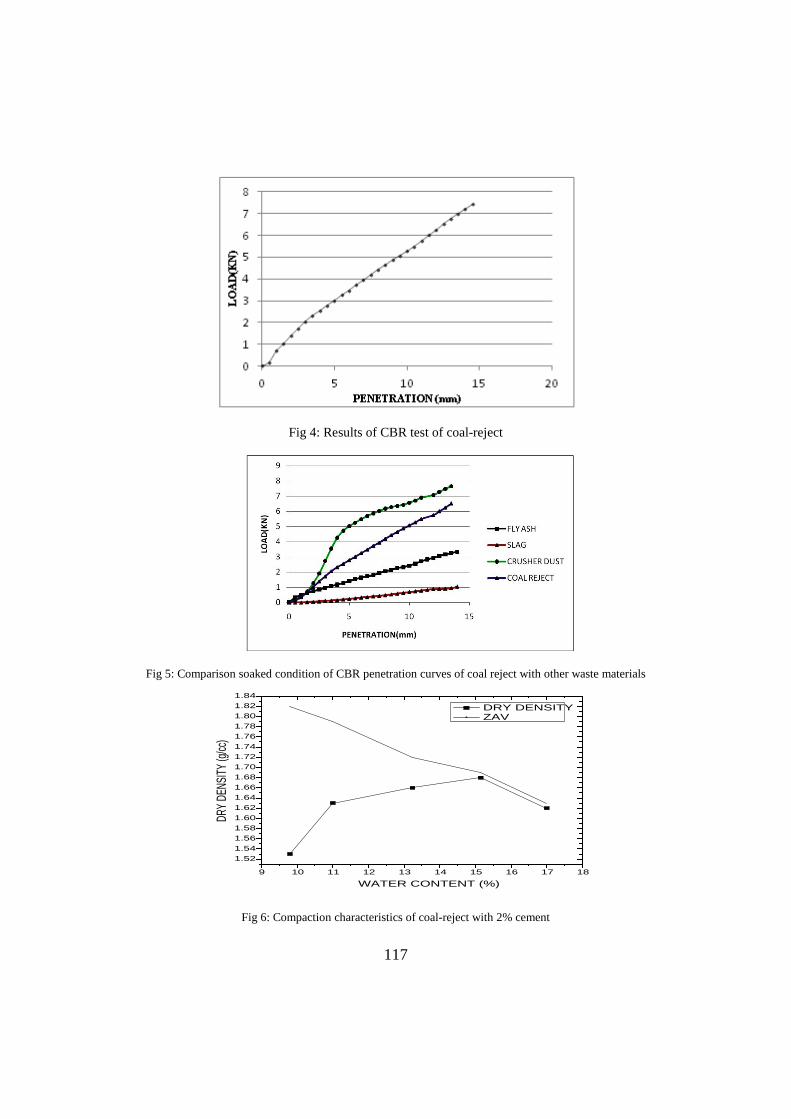
117
Fig 4: Results of CBR test of coal-reject
Fig 5: Comparison soaked condition of CBR penetration curves of coal reject with other waste materials
Fig 6: Compaction characteristics of coal-reject with 2% cement
9 10 11 12 13 14 15 16 17 18
1.521.541.561.581.601.621.641.661.681.701.721.741.761.781.801.821.84
DRY D
ENSIT
Y (g/c
c)
WATER CONTENT (%)
DRY DENSITY ZAV
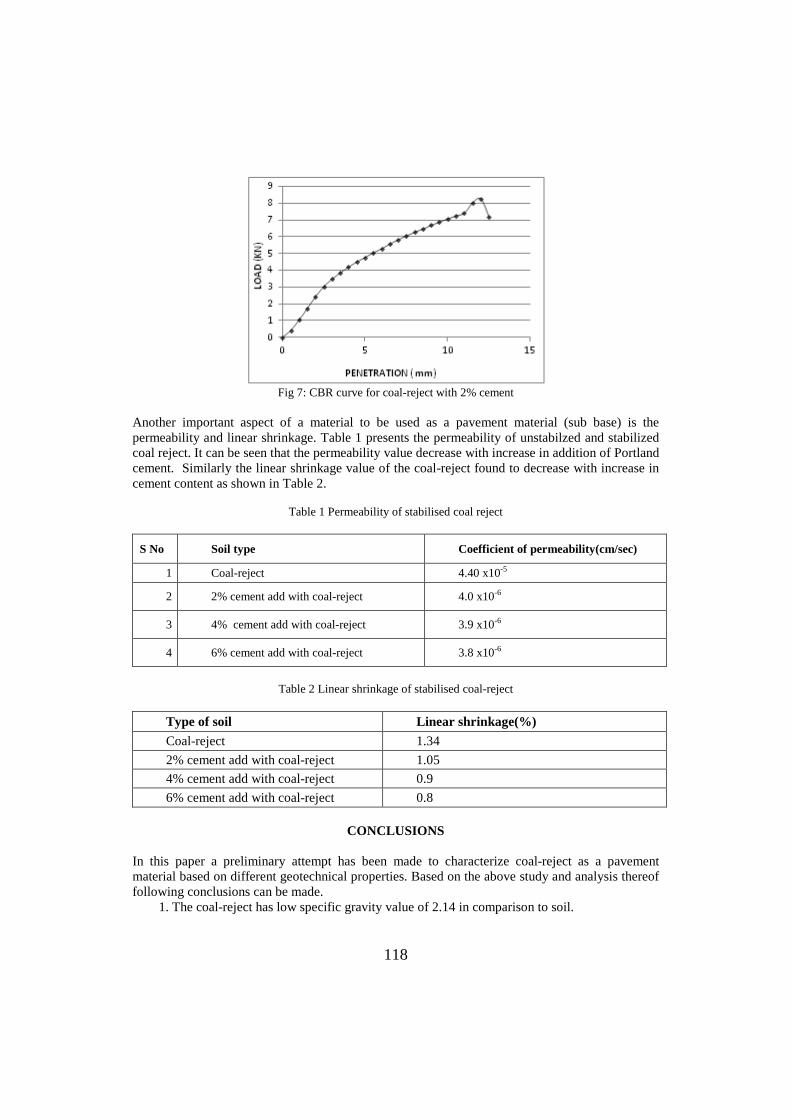
118
Fig 7: CBR curve for coal-reject with 2% cement
Another important aspect of a material to be used as a pavement material (sub base) is the permeability and linear shrinkage. Table 1 presents the permeability of unstabilzed and stabilized coal reject. It can be seen that the permeability value decrease with increase in addition of Portland cement. Similarly the linear shrinkage value of the coal-reject found to decrease with increase in cement content as shown in Table 2.
Table 1 Permeability of stabilised coal reject
S No Soil type Coefficient of permeability(cm/sec)
1 Coal-reject 4.40 x10⁻⁵
2 2% cement add with coal-reject 4.0 x10⁻⁶
3 4% cement add with coal-reject 3.9 x10⁻⁶
4 6% cement add with coal-reject 3.8 x10⁻⁶
Table 2 Linear shrinkage of stabilised coal-reject
Type of soil Linear shrinkage(%) Coal-reject 1.34 2% cement add with coal-reject 1.05 4% cement add with coal-reject 0.9 6% cement add with coal-reject 0.8
CONCLUSIONS
In this paper a preliminary attempt has been made to characterize coal-reject as a pavement material based on different geotechnical properties. Based on the above study and analysis thereof following conclusions can be made.
1. The coal-reject has low specific gravity value of 2.14 in comparison to soil.
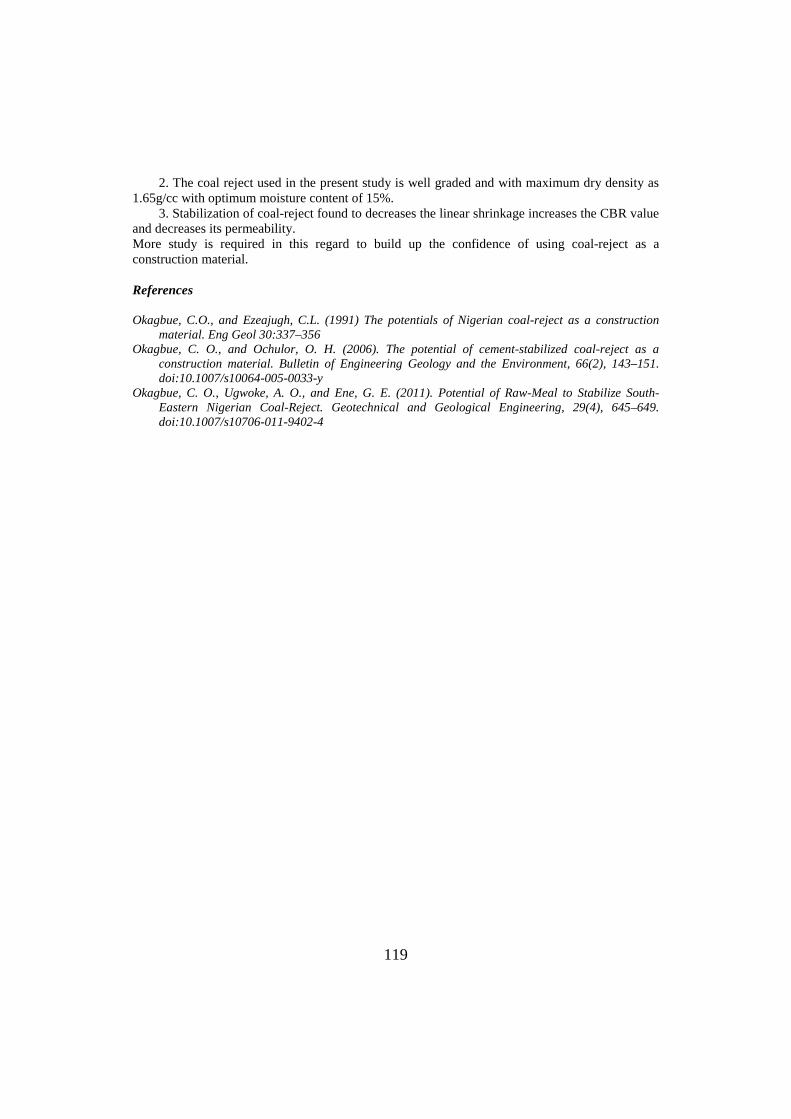
119
2. The coal reject used in the present study is well graded and with maximum dry density as 1.65g/cc with optimum moisture content of 15%.
3. Stabilization of coal-reject found to decreases the linear shrinkage increases the CBR value and decreases its permeability. More study is required in this regard to build up the confidence of using coal-reject as a construction material.
References
Okagbue, C.O., and Ezeajugh, C.L. (1991) The potentials of Nigerian coal-reject as a construction
material. Eng Geol 30:337–356 Okagbue, C. O., and Ochulor, O. H. (2006). The potential of cement-stabilized coal-reject as a
construction material. Bulletin of Engineering Geology and the Environment, 66(2), 143–151. doi:10.1007/s10064-005-0033-y
Okagbue, C. O., Ugwoke, A. O., and Ene, G. E. (2011). Potential of Raw-Meal to Stabilize South-Eastern Nigerian Coal-Reject. Geotechnical and Geological Engineering, 29(4), 645–649. doi:10.1007/s10706-011-9402-4
120
FEASIBILITY STUDY OF USE OF JAROSITE FOR ROAD AND EMBANKMENT
CONSTRUCTION
Alok Ranjan and R. K. Swami Central Road Research Institute, New Delhi-110025 (India).
Abstract: Tailoring the waste materials to suit the engineering requirements is one of the attractive features of modern technology. In this way we save one of our precious resources-soil. Jarosite is a waste material which comes out as a result of hydrometallurgical process of zinc extraction. Chemically it is a complex salt of Iron and Aluminium. In the present study, two different types of jarosite have been selected and have been mixed with local red soil. The idea is to get a well graded material which satisfies the geotechnical requirements of a material for road sub-base or for embankment construction. The two jarosite samples have been compared and their mix with soil has been studied.
INTRODUCTION
Jarosite is formed when zinc ore is roasted and leached with acid. It is a complex sulphate salt of Iron or Aluminium. It is a extremely fine grained material as all material passes through 75 micron sieve. It forms a colloidal solution when dissolved in water. A red soil from a nearby area (Debari, Rajasthan) has been selected to be mixed to Jarosite to get the desired properties. The idea is to choose two complementary materials which satisfy the technical specifications for the materials laid down by MORTH to be used in sub-base or embankment construction. Further, two different jarosite samples have been chosen for this study. An effort has been made to generalize the study to handle other waste materials.
MATERIALS USED
• Jarosite
This jarosite samples were procured from Chanderia and Udaipur, Rajasthan. The sample from Chanderia was identified as a non-swelling material having a Liquid Limit value of 51% and non-plastic in nature. The detailed properties of this sample are given in Table-1.
Table-1: Properties of Jarosite sample from Chanderia
Geotechnical Properties Values
MDD & OMC (Modified) 1.51 /cc, 28.0% CBR Value 4-9 % Sp.gravity 1.88-2.55 Shear strength (CU) C=0, Ø=20 degrees pH Value 4.7
121
Whereas, the Jarosite sample from Udaipur was found to be alkaline in nature ( pH value=8.7) and having a Liquid Limit value of 55%. The geotechnical properties of this sample are listed in the Table 2.
Table-2: Properties of Jarosite sample from Udaipur
Geotechnical Properties Values
MDD & OMC (Modified) 1.34, 35.0% CBR Value 27-58 Sp.gravity 2.44-2.78 Shear strength (CU) C=0.4 kPa, Ø=19 degrees pH value 8.7
• Red soil
The red soil sample was taken from Debari, Rajastan. It was found to be neutral and non-swelling in nature. The geotechnical properties of this soil sample are listed in Table 3.
Table-3: Properties of Red soil sample
Geotechnical Properties Values MDD & OMC Values (Modified) 2.09, 7.1% Atterberg’s Limits LL=25.8%, PL=12.4%, PI=13 CBR Value 2-5% Grain size distribution Gravel sized=(42-56)%, Silt sized=11%
Sand sized= (16-30)%, Clay sized=17% Shear properties (CU) C=0, Ø=18.5 degrees UCS strength (kPa) 600
• Geotechnical Properties of the Soil Mixes
In order to investigate their suitability, various mixes of Jarosite and soils were prepared. The mixes were tested in terms of their CBR, Density and PI. The able 4 gives the variation of properties of soil and Jarosite mixes from Udaipur.
Table-4: Geotechnical properties of Soil Mix
Geotechnical Properties Soil: Jarosite (25:75) Soil:Jarosite (50:50) Soil:Jarosite (75:25) MDD & OMC (Modified) 1.53, 25.7% 1.71, 16.9% 1.89, 14.2% CBR 30 20 8 LL & PI 53, 17 47, NP 33, 17 pH Value 6.0 6.0 6.5
The properties of the mixes are governed by the dominant constituent. The pH is reduced from the alkaline range to the neutral in case of Jarosite sample from Udaipur, thereby decreasing its strength. In the case of mixes with Jarosite from Chanderia, there is increase in pH from low to higher value with percentage of soil dominating the mix. Hence, there is increase in strength with reduced solubility of alumina. From the observations with both type of Jarosites, it can be easily
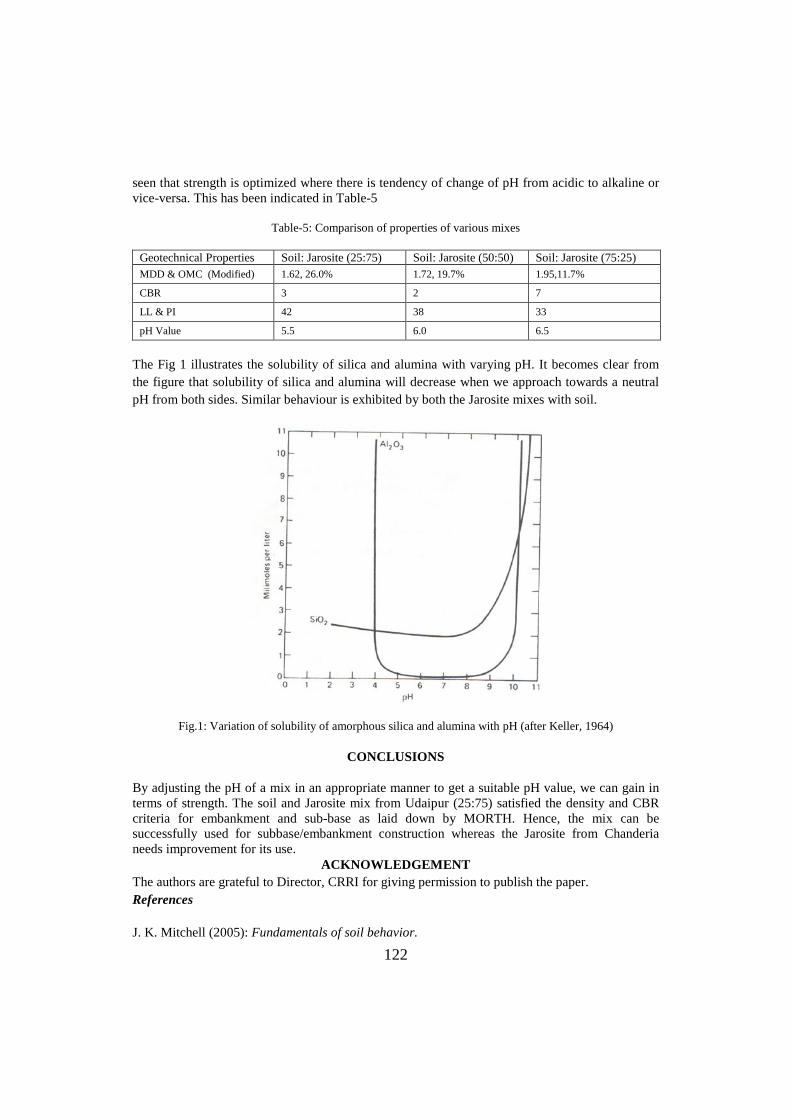
122
seen that strength is optimized where there is tendency of change of pH from acidic to alkaline or vice-versa. This has been indicated in Table-5
Table-5: Comparison of properties of various mixes
Geotechnical Properties Soil: Jarosite (25:75) Soil: Jarosite (50:50) Soil: Jarosite (75:25) MDD & OMC (Modified) 1.62, 26.0% 1.72, 19.7% 1.95,11.7%
CBR 3 2 7
LL & PI 42 38 33
pH Value 5.5 6.0 6.5
The Fig 1 illustrates the solubility of silica and alumina with varying pH. It becomes clear from the figure that solubility of silica and alumina will decrease when we approach towards a neutral pH from both sides. Similar behaviour is exhibited by both the Jarosite mixes with soil.
Fig.1: Variation of solubility of amorphous silica and alumina with pH (after Keller, 1964)
CONCLUSIONS
By adjusting the pH of a mix in an appropriate manner to get a suitable pH value, we can gain in terms of strength. The soil and Jarosite mix from Udaipur (25:75) satisfied the density and CBR criteria for embankment and sub-base as laid down by MORTH. Hence, the mix can be successfully used for subbase/embankment construction whereas the Jarosite from Chanderia needs improvement for its use.
ACKNOWLEDGEMENT The authors are grateful to Director, CRRI for giving permission to publish the paper. References J. K. Mitchell (2005): Fundamentals of soil behavior.
123
UTILIZATION EFFECT OF GRANITE POWER AND BUILDING DEMOLITION WASTE ON UNCONFINED COMPRESSIVE STRENGTH
PROPERTIES OF SOIL
Vijay Devar*, Gundappa K**and Archana M.R*** * Department of Civil Engineering, K.L.E.Society’s College of Engineering and Technology, Belgaum
** TTIC, Bangalore *** Department of Civil Engineering, R V College of Engineering and Technology, Bangalore, India
Abstract: A pavement can either be flexible or rigid and its performance depends upon the subgrade soil on which it rests. The thickness of a pavement and its component parts depends on basic characteristics of the subgrade soil, which should be determined before the design is made. Knowledge of the technique for the improvement of the soil properties such as strength and stability is very much helpful in constructing pavements on poor soil by stabilizing them. Various studies have shown that the properties of stabilizer have significant effect in improving the properties of soil. This study is intended to investigate the effect of granite powder on the properties of soil. One of the major waste generating industries is the granite quarry and production industry. The amount of granite waste production annually is substantial being in the rage of 7.0 to 7.5 million tones. The granite waste generated worldwide during quarrying operations in the form of rock fragments are being dumped either in nearby empty pits, roads, riverbeds, agricultural fields or landfills leading to wide spreading environmental pollution. The investigations were carried out on soil-granite powder mixes with trial percentages of granite powder content viz., 0, 10, 20, 30, 40 and 50 percent to determine optimum granite powder content as stabilizer. Next part of investigation includes the effect of demolition waste on the soil-granite powder mixtures. Construction and Demolition Waste included debris of concrete as a major portion with small quantities of plaster, bricks, metal, wood, plastics etc. It is estimated that the construction industry in India generates about 10-12 million tons of waste annually. There is a huge demand of aggregates in the housing and road sectors but there is significant gap in demand and supply, which can be reduced by substitution of recycled construction and demolition waste to standard specifications. For the present study, gradation for the demolition waste has been adopted for screening as per MoRTH fourth revision. The effect of demolition waste on soil-granite powder mixtures were investigated for compaction, California Bearing Ratio and unconfined compression test. These tests were again repeated with varying demolition waste content (20, 30 and 40 percent) for the soil samples with 10 percent granite powder (which yielded optimum compaction test results). Optimum test results were obtained for 10 percent demolition waste for the soil samples with 40 percent granite powder (which yielded highest CBR value).
INTRODUCTION
Soil is the unaggregated or uncemented deposits of minerals and/or organic particle or fragments covering large portion of the Earth’s Crust. It includes widely different material like gravel, sand,
124
silt and clay and the range in the particle sizes in a soil may extend from grains only a function of a micron (10-3mm) in diameter up to large size particles.
Locally available soils often do not satisfy fully the engineering properties a requirement for their use in road embankment’s and sub grade. It is therefore becomes necessary either to bring suitable soils from far off barrow areas or to stabilize locally available soils so as to improve their engineering properties and make them suitable. In the present study, soil sample is collected at a depth of 1 to 1.5 meters, which is the actual sub grade level for the pavement. Granite powder is used as a stabilizing agent initially, to improve the engineering properties like Grain size analysis, Atterburg limits, compaction test, California bearing ratio test and unconfined compression test of soil-granite powder mixes. For these tests granite powder of varying proportions 10, 20, 30, 40, and 50% (by weight of soil) is adopted to obtain optimum granite powder content. Further, by keeping optimum granite powder content to constant varying percentages of 10, 20, 30, 40 and 50 % of building demolition waste is added and its effect on the properties of the soil is studied.
LABORATORY INVESTIGATIONS
In the present paper, the effect of granite powder and demolition waste on Atterburg limits, compaction test parameters, CBR value and unconfined compression test of soil have been given. The results from various laboratory tests are reproduced in following section.
Basic test results
• Soil
The soil collected from the R.V. College of Engineering campus, Bangalore, Karnataka was pulverized with wooden mallet to break lumps and then air dried. The physical properties of soil collected are as presented in Table 1. The gradation curve of soil is shown in Figure 1
Table 1: Physical properties of soil
Serial number
Property Result
1 Particle size distribution
a) Gravel b) Sand c) Silt + Clay
10.1% 80.6% 9.7%
2 Liquid limit 42.1 % 3 Plastic limit 20.6 % 4 Plasticity index 21.5 5 HRB classification of soil A-2-5 6 IS classification of soil CL 7 Shrinkage limit 9.24%
8 Compaction test
OMC MDD
15% 1.79 gm/cc
9 CBR 3.5 %
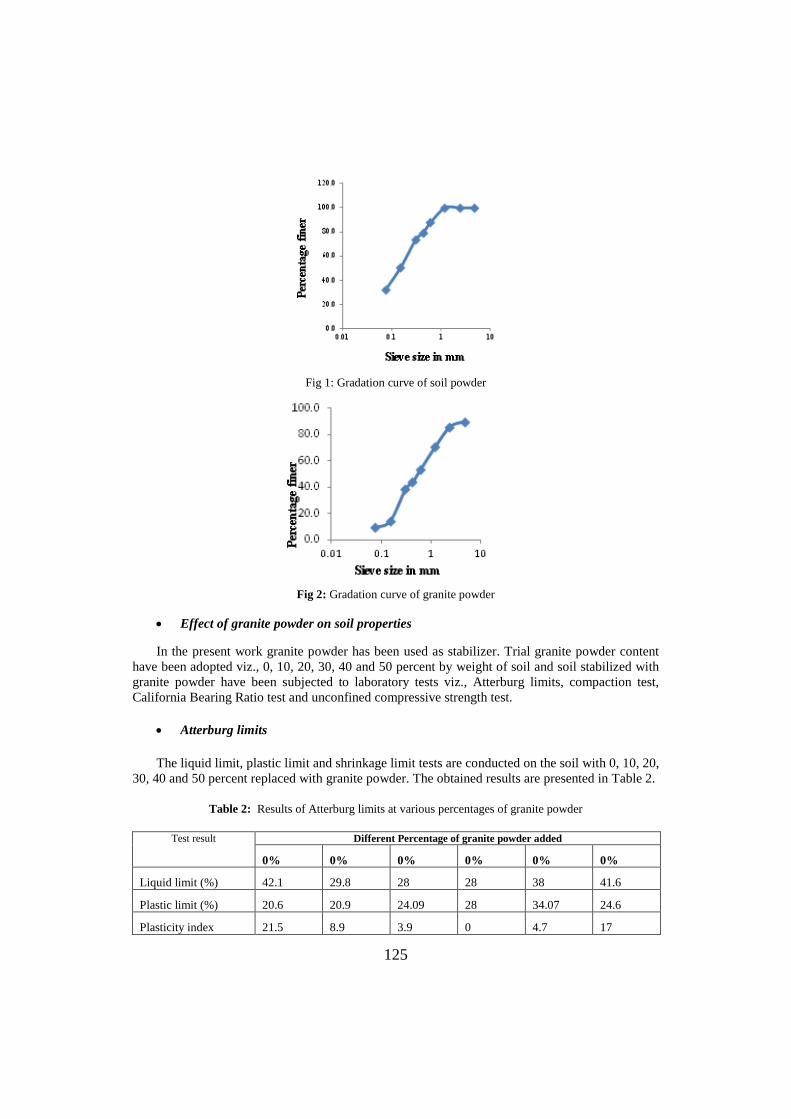
125
Fig 1: Gradation curve of soil powder
Fig 2: Gradation curve of granite powder
• Effect of granite powder on soil properties
In the present work granite powder has been used as stabilizer. Trial granite powder content have been adopted viz., 0, 10, 20, 30, 40 and 50 percent by weight of soil and soil stabilized with granite powder have been subjected to laboratory tests viz., Atterburg limits, compaction test, California Bearing Ratio test and unconfined compressive strength test.
• Atterburg limits
The liquid limit, plastic limit and shrinkage limit tests are conducted on the soil with 0, 10, 20, 30, 40 and 50 percent replaced with granite powder. The obtained results are presented in Table 2.
Table 2: Results of Atterburg limits at various percentages of granite powder
Test result Different Percentage of granite powder added
0% 0% 0% 0% 0% 0%
Liquid limit (%) 42.1 29.8 28 28 38 41.6
Plastic limit (%) 20.6 20.9 24.09 28 34.07 24.6
Plasticity index 21.5 8.9 3.9 0 4.7 17
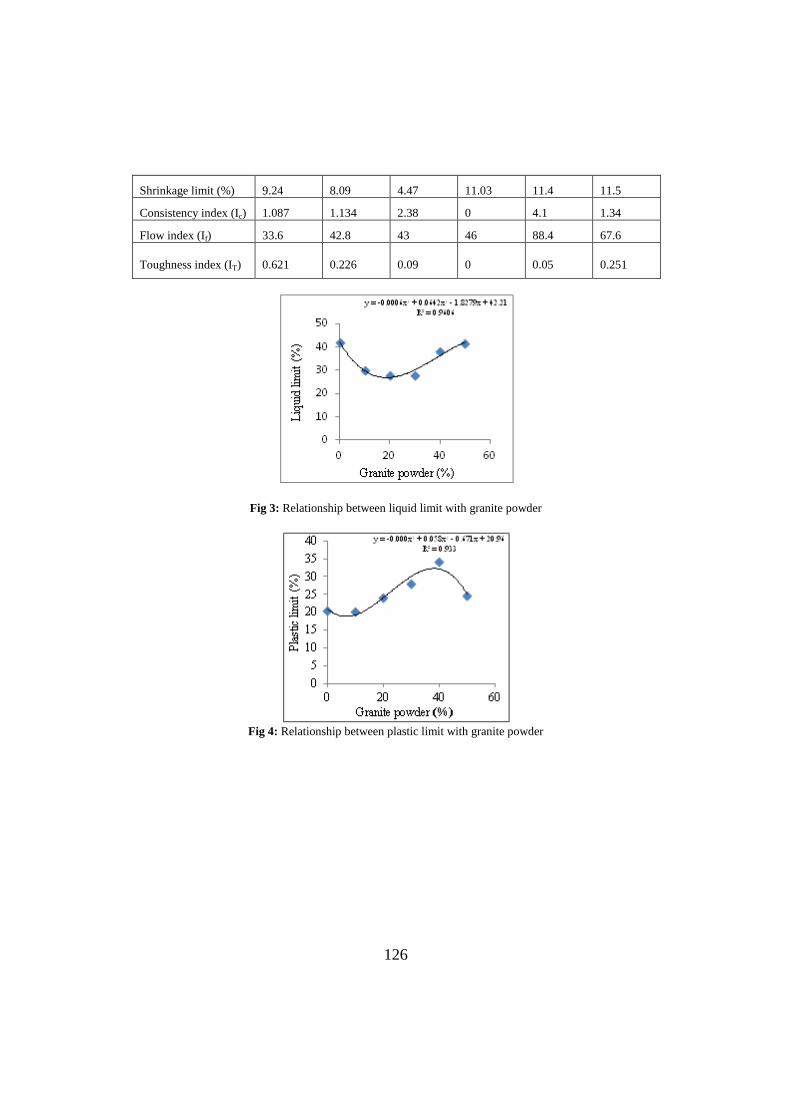
126
Shrinkage limit (%) 9.24 8.09 4.47 11.03 11.4 11.5
Consistency index (Ic) 1.087 1.134 2.38 0 4.1 1.34
Flow index (If) 33.6 42.8 43 46 88.4 67.6
Toughness index (IT) 0.621 0.226 0.09 0 0.05 0.251
Fig 3: Relationship between liquid limit with granite powder
Fig 4: Relationship between plastic limit with granite powder
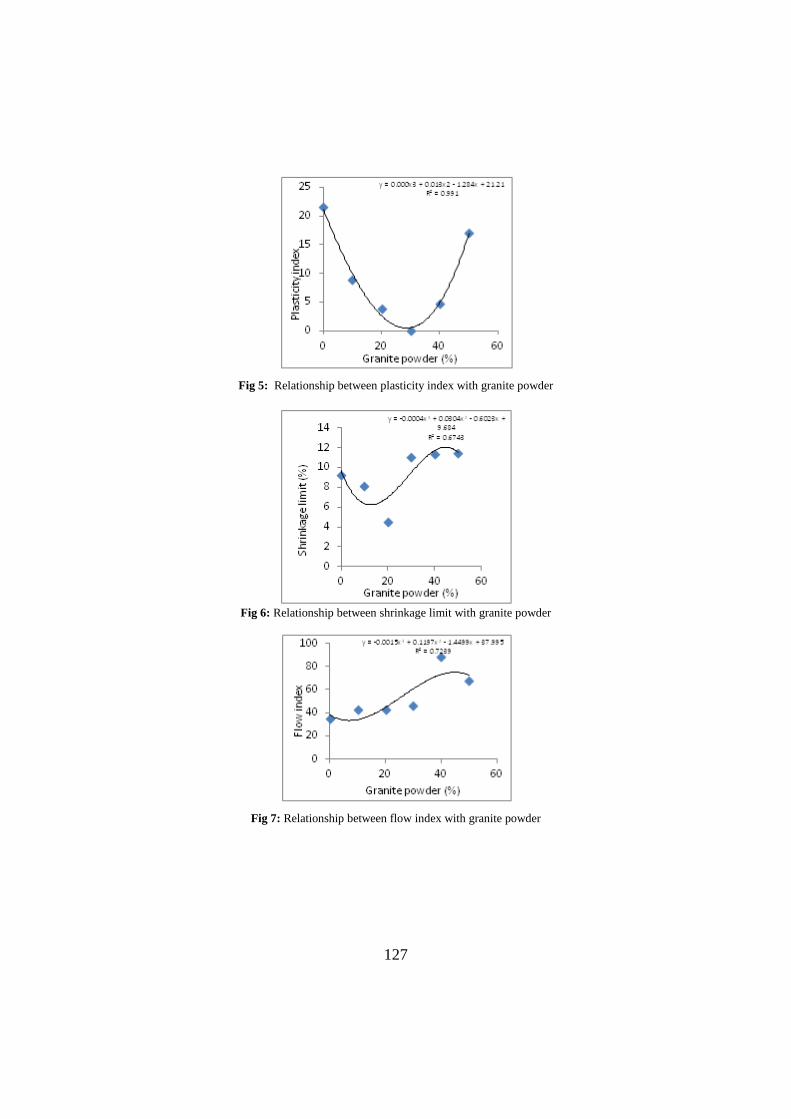
127
Fig 5: Relationship between plasticity index with granite powder
Fig 6: Relationship between shrinkage limit with granite powder
Fig 7: Relationship between flow index with granite powder
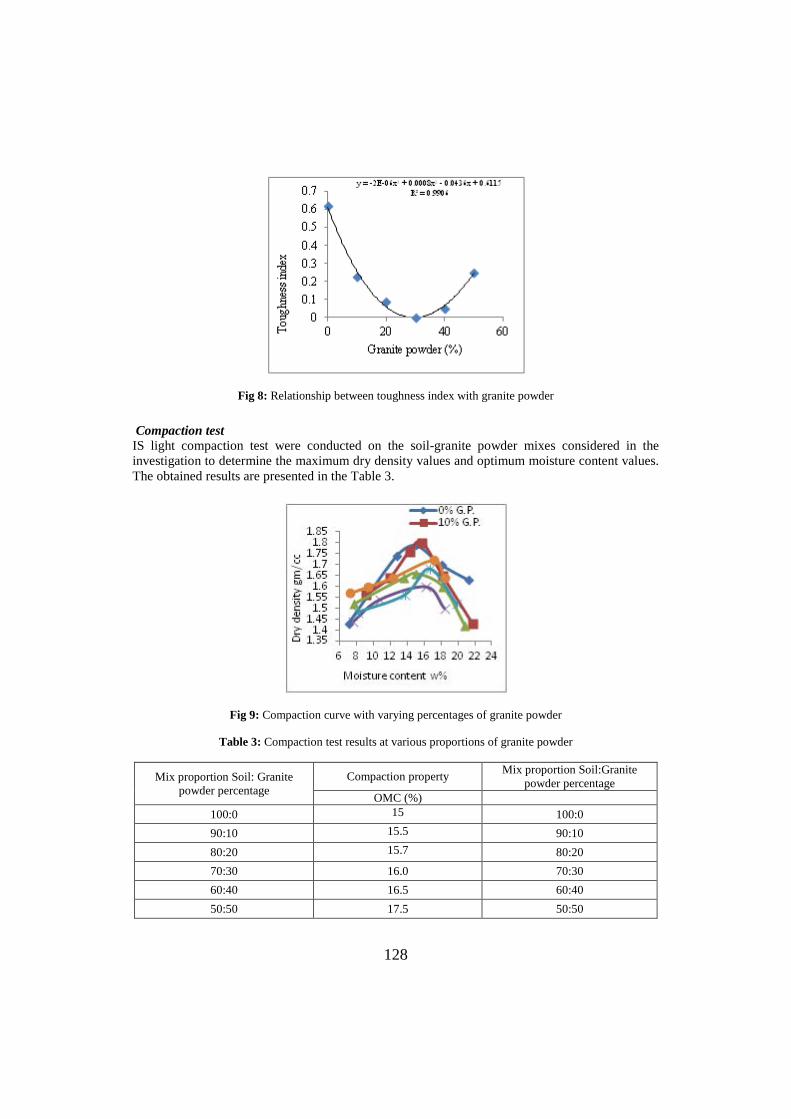
128
Fig 8: Relationship between toughness index with granite powder
Compaction test IS light compaction test were conducted on the soil-granite powder mixes considered in the investigation to determine the maximum dry density values and optimum moisture content values. The obtained results are presented in the Table 3.
Fig 9: Compaction curve with varying percentages of granite powder
Table 3: Compaction test results at various proportions of granite powder
Mix proportion Soil: Granite powder percentage
Compaction property Mix proportion Soil:Granite powder percentage
OMC (%) 100:0 15 100:0 90:10 15.5 90:10 80:20 15.7 80:20 70:30 16.0 70:30 60:40 16.5 60:40 50:50 17.5 50:50
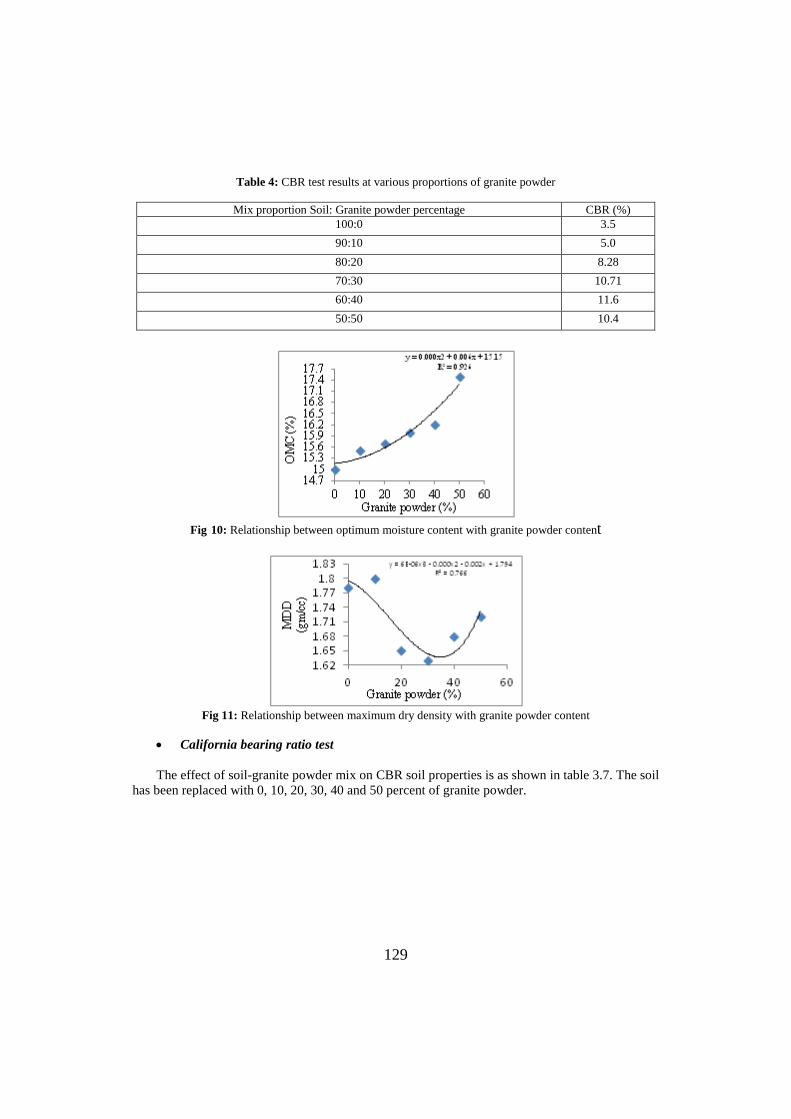
129
Table 4: CBR test results at various proportions of granite powder
Mix proportion Soil: Granite powder percentage CBR (%) 100:0 3.5 90:10 5.0 80:20 8.28 70:30 10.71 60:40 11.6 50:50 10.4
Fig 10: Relationship between optimum moisture content with granite powder content
Fig 11: Relationship between maximum dry density with granite powder content
• California bearing ratio test
The effect of soil-granite powder mix on CBR soil properties is as shown in table 3.7. The soil has been replaced with 0, 10, 20, 30, 40 and 50 percent of granite powder.
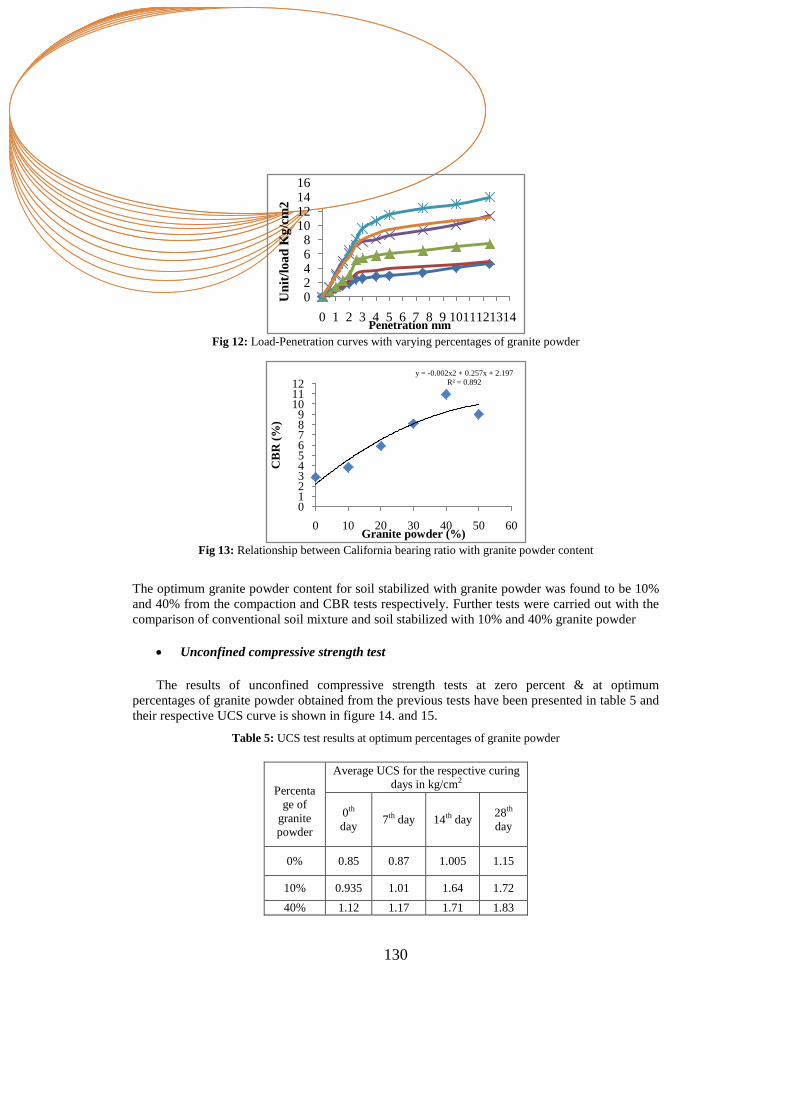
130
Fig 12: Load-Penetration curves with varying percentages of granite powder
Fig 13: Relationship between California bearing ratio with granite powder content
The optimum granite powder content for soil stabilized with granite powder was found to be 10% and 40% from the compaction and CBR tests respectively. Further tests were carried out with the comparison of conventional soil mixture and soil stabilized with 10% and 40% granite powder
• Unconfined compressive strength test
The results of unconfined compressive strength tests at zero percent & at optimum percentages of granite powder obtained from the previous tests have been presented in table 5 and their respective UCS curve is shown in figure 14. and 15.
Table 5: UCS test results at optimum percentages of granite powder
02468
10121416
0 1 2 3 4 5 6 7 8 9 1011121314
Uni
t/loa
d K
g/cm
2
Penetration mm
y = -0.002x2 + 0.257x + 2.197R² = 0.892
0123456789
101112
0 10 20 30 40 50 60
CB
R (%
)
Granite powder (%)
Percenta
ge of granite powder
Average UCS for the respective curing days in kg/cm2
0th day 7th day 14th day 28th
day
0% 0.85 0.87 1.005 1.15
10% 0.935 1.01 1.64 1.72 40% 1.12 1.17 1.71 1.83
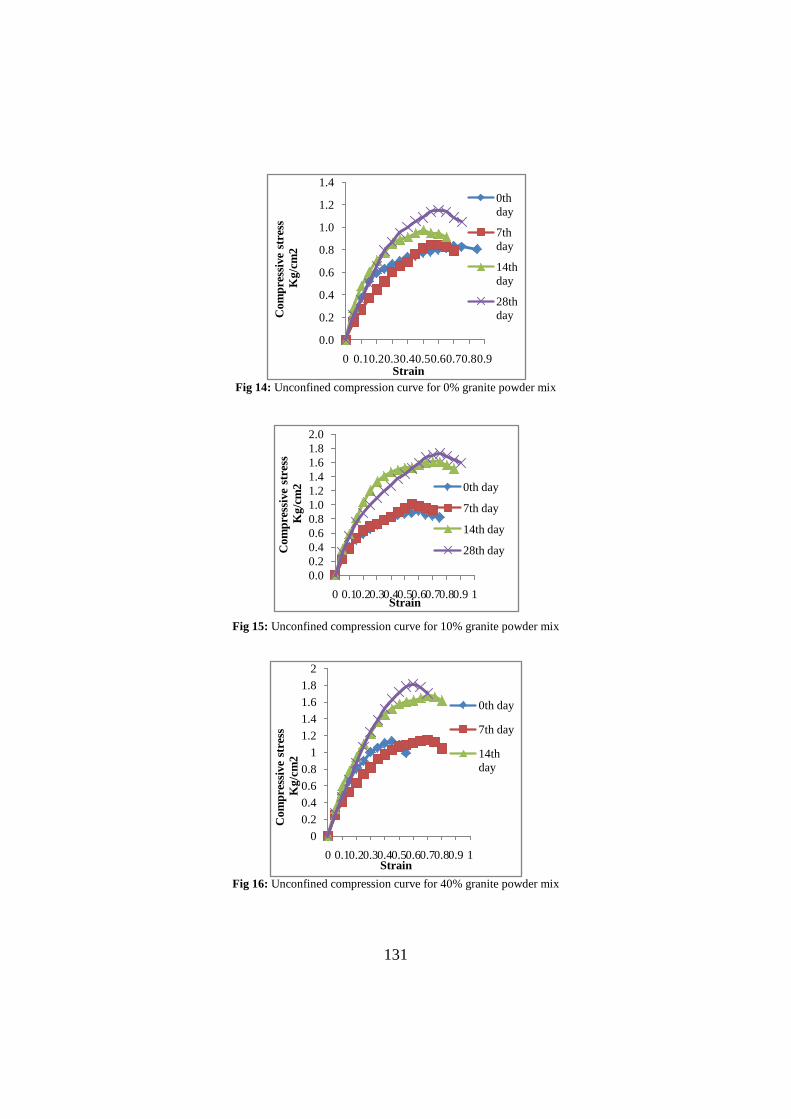
131
Fig 14: Unconfined compression curve for 0% granite powder mix
Fig 15: Unconfined compression curve for 10% granite powder mix
Fig 16: Unconfined compression curve for 40% granite powder mix
0.0
0.2
0.4
0.6
0.8
1.0
1.2
1.4
0 0.10.20.30.40.50.60.70.80.9
Com
pres
sive
str
ess
Kg/
cm2
Strain
0th day
7th day
14th day
28th day
0.00.20.40.60.81.01.21.41.61.82.0
0 0.10.20.30.40.50.60.70.80.9 1
Com
pres
sive
str
ess
Kg/
cm2
Strain
0th day
7th day
14th day
28th day
00.20.40.60.8
11.21.41.61.8
2
0 0.10.20.30.40.50.60.70.80.9 1
Com
pres
sive
str
ess
Kg/
cm2
Strain
0th day
7th day
14th day
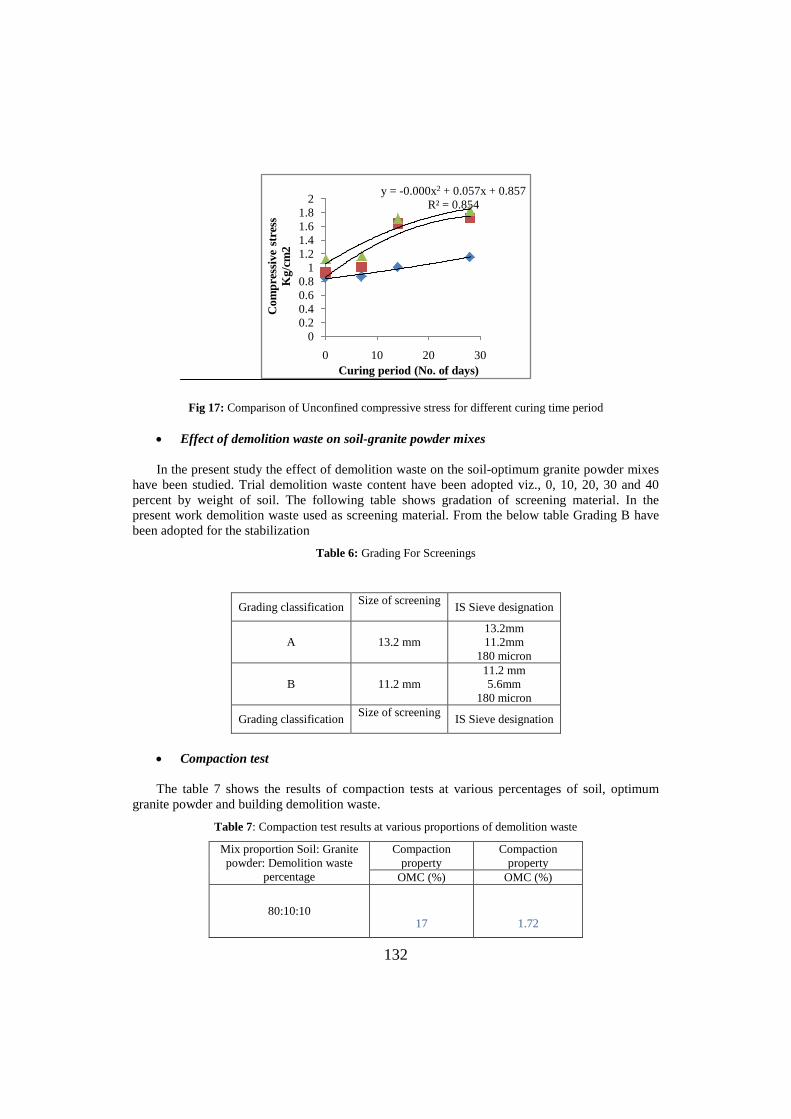
132
Fig 17: Comparison of Unconfined compressive stress for different curing time period
• Effect of demolition waste on soil-granite powder mixes
In the present study the effect of demolition waste on the soil-optimum granite powder mixes have been studied. Trial demolition waste content have been adopted viz., 0, 10, 20, 30 and 40 percent by weight of soil. The following table shows gradation of screening material. In the present work demolition waste used as screening material. From the below table Grading B have been adopted for the stabilization
Table 6: Grading For Screenings
• Compaction test
The table 7 shows the results of compaction tests at various percentages of soil, optimum granite powder and building demolition waste.
Table 7: Compaction test results at various proportions of demolition waste
Mix proportion Soil: Granite powder: Demolition waste
percentage
Compaction property
Compaction property
OMC (%) OMC (%)
80:10:10 17 1.72
y = -0.000x2 + 0.057x + 0.857R² = 0.854
00.20.40.60.8
11.21.41.61.8
2
0 10 20 30
Com
pres
sive
str
ess
Kg/
cm2
Curing period (No. of days)
Grading classification Size of screening IS Sieve designation
A 13.2 mm 13.2mm 11.2mm
180 micron
B 11.2 mm 11.2 mm 5.6mm
180 micron
Grading classification Size of screening IS Sieve designation
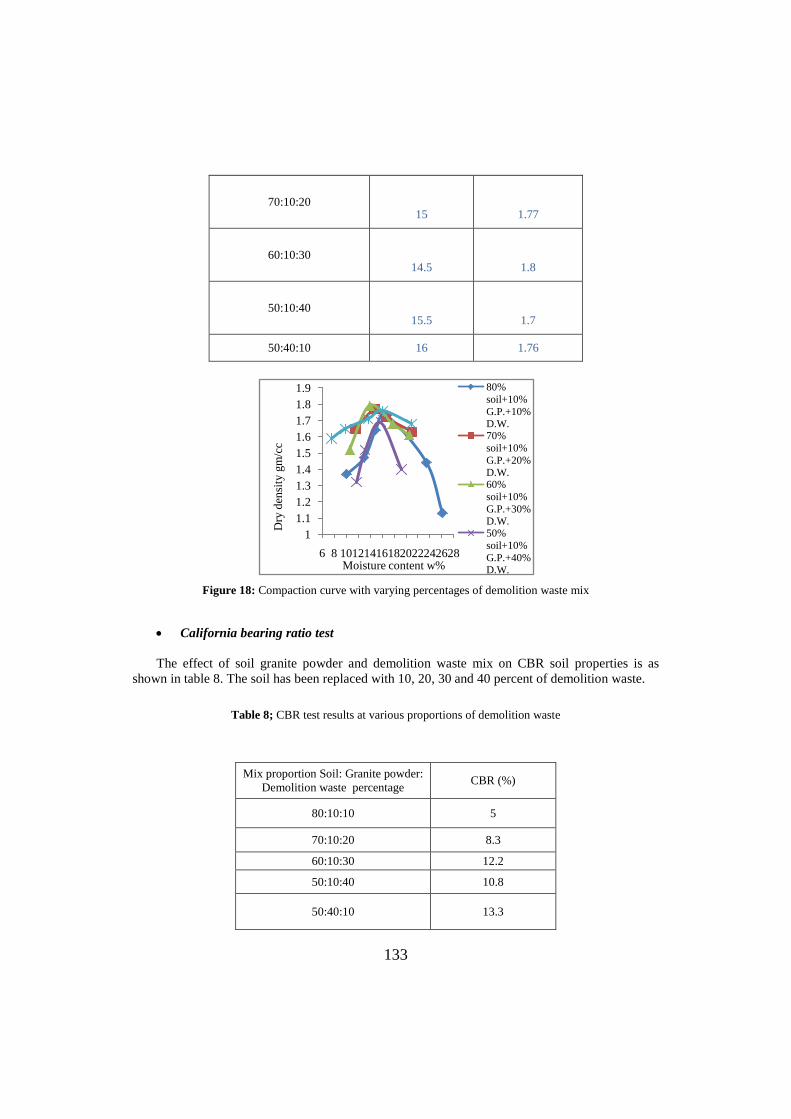
133
70:10:20 15 1.77
60:10:30 14.5 1.8
50:10:40 15.5 1.7
50:40:10 16 1.76
Figure 18: Compaction curve with varying percentages of demolition waste mix
• California bearing ratio test
The effect of soil granite powder and demolition waste mix on CBR soil properties is as shown in table 8. The soil has been replaced with 10, 20, 30 and 40 percent of demolition waste.
Table 8; CBR test results at various proportions of demolition waste
11.11.21.31.41.51.61.71.81.9
6 8 10121416182022242628
Dry
den
sity
gm
/cc
Moisture content w%
80% soil+10% G.P.+10% D.W.70% soil+10% G.P.+20% D.W.60% soil+10% G.P.+30% D.W.50% soil+10% G.P.+40% D.W.
Mix proportion Soil: Granite powder: Demolition waste percentage CBR (%)
80:10:10 5
70:10:20 8.3
60:10:30 12.2
50:10:40 10.8
50:40:10 13.3
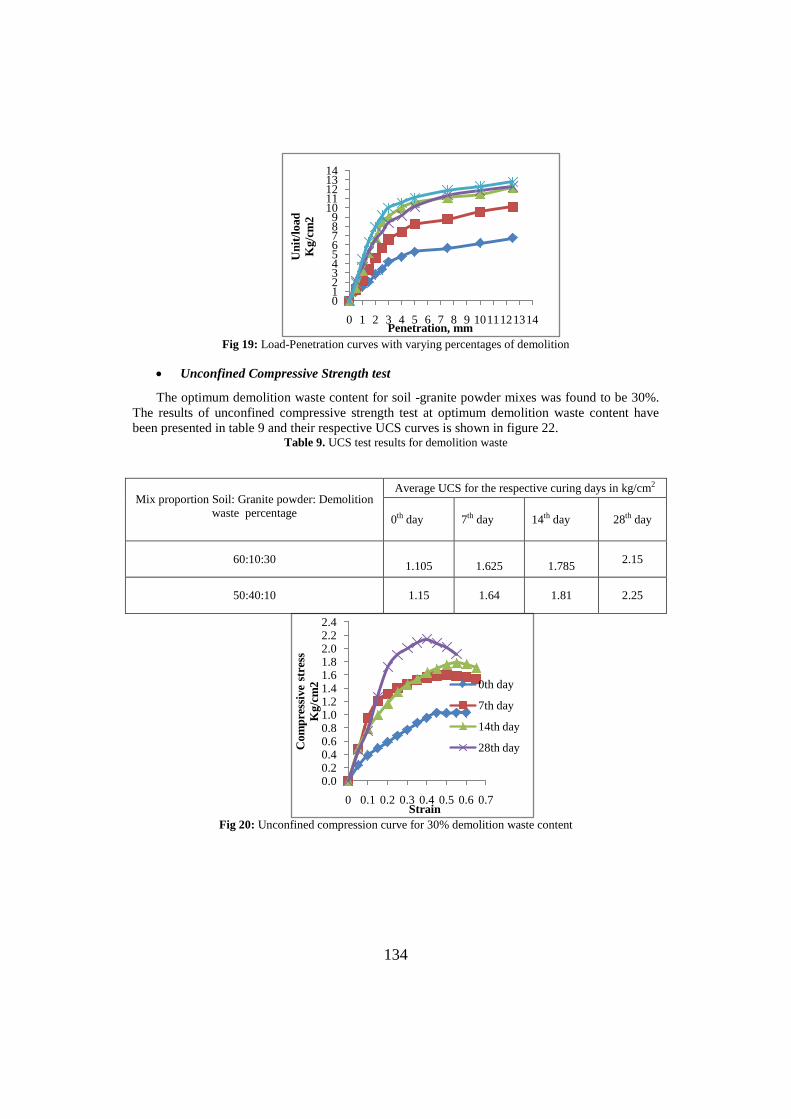
134
Fig 19: Load-Penetration curves with varying percentages of demolition
• Unconfined Compressive Strength test
The optimum demolition waste content for soil -granite powder mixes was found to be 30%. The results of unconfined compressive strength test at optimum demolition waste content have been presented in table 9 and their respective UCS curves is shown in figure 22.
Table 9. UCS test results for demolition waste
Fig 20: Unconfined compression curve for 30% demolition waste content
0.00.20.40.60.81.01.21.41.61.82.02.22.4
0 0.1 0.2 0.3 0.4 0.5 0.6 0.7
Com
pres
sive
str
ess
Kg/
cm2
Strain
0th day
7th day
14th day
28th day
Mix proportion Soil: Granite powder: Demolition
waste percentage
Average UCS for the respective curing days in kg/cm2
0th day 7th day 14th day 28th day
60:10:30
1.105
1.625
1.785 2.15
50:40:10 1.15 1.64 1.81 2.25
0123456789
1011121314
0 1 2 3 4 5 6 7 8 9 1011121314
Uni
t/loa
dK
g/cm
2
Penetration, mm
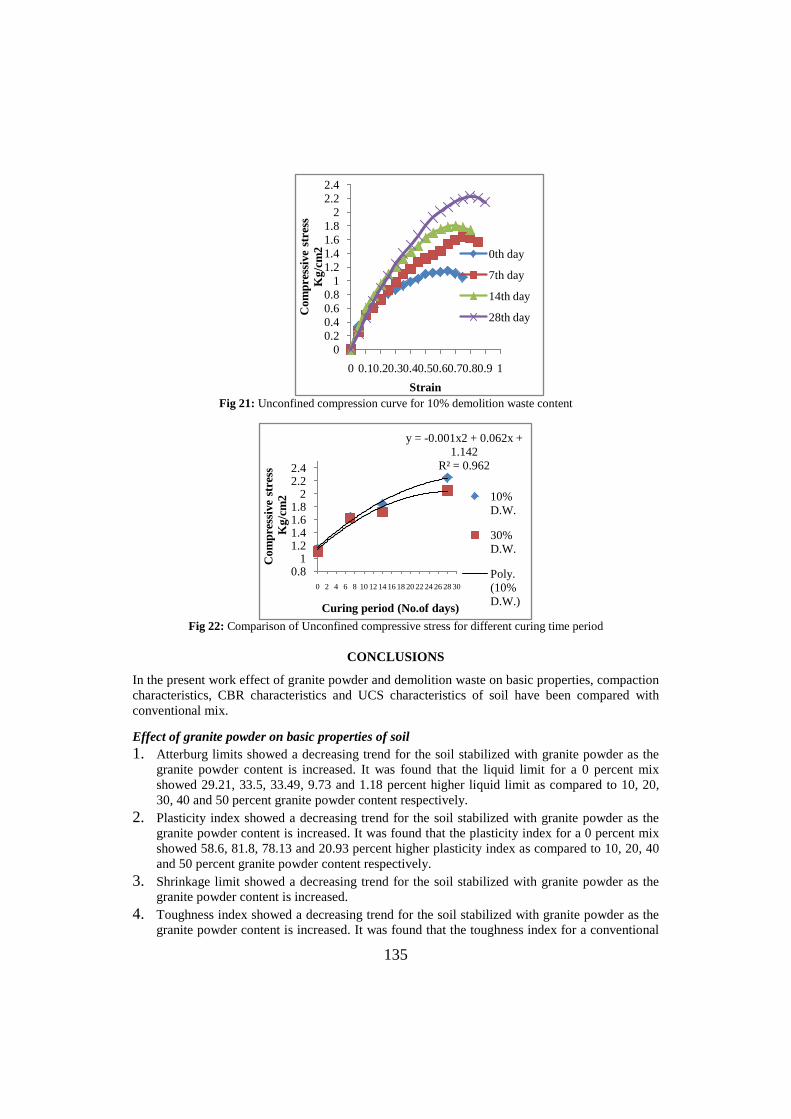
135
Fig 21: Unconfined compression curve for 10% demolition waste content
Fig 22: Comparison of Unconfined compressive stress for different curing time period
CONCLUSIONS
In the present work effect of granite powder and demolition waste on basic properties, compaction characteristics, CBR characteristics and UCS characteristics of soil have been compared with conventional mix.
Effect of granite powder on basic properties of soil 1. Atterburg limits showed a decreasing trend for the soil stabilized with granite powder as the
granite powder content is increased. It was found that the liquid limit for a 0 percent mix showed 29.21, 33.5, 33.49, 9.73 and 1.18 percent higher liquid limit as compared to 10, 20, 30, 40 and 50 percent granite powder content respectively.
2. Plasticity index showed a decreasing trend for the soil stabilized with granite powder as the granite powder content is increased. It was found that the plasticity index for a 0 percent mix showed 58.6, 81.8, 78.13 and 20.93 percent higher plasticity index as compared to 10, 20, 40 and 50 percent granite powder content respectively.
3. Shrinkage limit showed a decreasing trend for the soil stabilized with granite powder as the granite powder content is increased.
4. Toughness index showed a decreasing trend for the soil stabilized with granite powder as the granite powder content is increased. It was found that the toughness index for a conventional
00.20.40.60.8
11.21.41.61.8
22.22.4
0 0.10.20.30.40.50.60.70.80.9 1
Com
pres
sive
str
ess
Kg/
cm2
Strain
0th day
7th day
14th day
28th day
y = -0.001x2 + 0.062x + 1.142
R² = 0.962
0.81
1.21.41.61.8
22.22.4
0 2 4 6 8 10 12 14 16 18 20 22 24 26 28 30
Com
pres
sive
str
ess
Kg/
cm2
Curing period (No.of days)
10% D.W.
30% D.W.
Poly. (10% D.W.)
136
mix showed 63.89, 98.56, 92.01 and 59.90 percent higher toughness index as compared to 10, 20, 40 and 50 percent granite powder content respectively.
Effect of granite powder on compaction characteristics of soil 1. Optimum moisture content value showed a increasing trend for the soil stabilized with granite
powder as the granite powder content is increased. It was found that the optimum moisture content value for a 0 percent mix showed 3.22, 4.45, 6.25, 9.09 and 14.28 percent lower optimum moisture content value as compared to 10, 20, 30, 40 and 50 percent granite powder content respectively.
2. Maximum dry density value showed a decreasing trend for the soil stabilized with granite powder as the granite powder content is increased. It was found that the maximum dry density value for a 0 percent mix showed 2.73 percent lower maximum dry density value as compared to 10 percent granite powder content.
Effect of granite powder on CBR characteristics of soil 1. California bearing ratio at 2.5mm penetration value showed an increasing trend for the soil
stabilized with granite powder as the granite powder content is increased. It was found that the California bearing ratio value for a 0 percent mix showed 30, 57.73, 67.32, 69.82 and 66.34 percent lower California bearing ratio value as compared to 10, 20, 30, 40 and 50 percent granite powder content respectively.
2. The optimum granite powder content was decided based on optimum compaction characteristics and optimum California bearing ratio characteristics. It was decided 10 and 40 percent granite powder as the optimum granite powder content based on compaction and CBR tests.
Effect of granite powder on UCS characteristics of soil Unconfined compressive strength value showed a increasing trend with respect to curing period for the soil stabilized with granite powder. The UCS specimens have been prepared for 0, 10 and 40 percent granite powder. The variation of unconfined compressive strength with respect to curing period is explained below. 1. It was found that for a 0 percent granite powder mix at 0th day curing period showed 24.10
and 9.09 percent lower unconfined compressive strength value as compared to 10 and 40 percent granite powder content respectively.
2. It was found that for a 0 percent granite powder mix at 7th day curing period showed 25.64 and 13.86 percent lower unconfined compressive strength value as compared to 10 and 40 percent granite powder content respectively.
3. It was found that for a 0 percent granite powder mix at 14th day curing period showed 41.22 and 38.72 percent lower unconfined compressive strength value as compared to 10 and 40 percent granite powder content respectively.
4. It was found that for a 0 percent granite powder mix at 28th day curing period showed 37.16 and 33.14 percent lower unconfined compressive strength value as compared to 10 and 40 percent granite powder content respectively.
Effect of granite powder and demolition waste on compaction characteristics of soil The optimum granite powder content for soil stabilized with granite powder was found to be 10% and 40% based on compaction test and CBR test respectively. So the effect of demolition waste on soil-optimum granite powder mixes will be discussed.
137
1. Optimum moisture content value showed a decreasing trend for the soil stabilized with optimum granite powder and demolition waste as the demolition waste content is increased. It was found that the optimum moisture content value for the 0 percent mix showed 11.76, 0 and 3.22 percent lower optimum moisture content value as compared to 10, 20 and 40 percent demolition waste with 10 percent granite powder content and 3.33 percent higher optimum moisture content value as compared to 30 percent demolition waste with 10 percent granite powder content respectively.
2. Maximum dry density value showed a increasing trend for the soil stabilized with optimum granite powder and demolition waste as the demolition waste content is increased. It was found that the maximum dry density value for the 0 percent mix showed 3.37, 0.56 and 4.5 percent higher maximum dry density value as compared to 10, 20 and 40 percent demolition waste with 10 percent granite powder content and 1.11 percent lower maximum dry density value as compared to 30 percent demolition waste with 10 percent granite powder content respectively.
Effect of granite powder and demolition waste on CBR characteristics of soil 1. California bearing ratio at 2.5mm penetration value showed a increasing trend for the soil
stabilized with optimum granite powder and demolition waste as the demolition waste content is increased. It was found that the California bearing ratio value for a conventional mix showed 30, 57.83, 72.86 and 69.82 percent lower California bearing ratio value as compared to 10, 20, 30 and 40 percent demolition waste with 10 percent granite powder content and 73.68 percent lower California bearing ratio value as compared to 10 percent demolition waste with 40 percent granite powder content respectively.
2. The optimum demolition waste content was decided based on optimum compaction characteristics and optimum California bearing ratio characteristics. It was decided that 30 and 10 percent demolition waste as the optimum demolition waste content based on compaction and CBR tests.
Effect of granite powder and demolition waste on UCS characteristics of soil Unconfined compressive strength value showed a increasing trend with respect to curing period for the soil stabilized with optimum granite powder and optimum demolition waste. The UCS specimens have been prepared for 30 percent demolition waste with 10 percent granite powder and 10 percent demolition waste with 40 percent granite powder. The variation of unconfined compressive strength with respect to curing period is explained below. 1. It was found that for a 0 percent granite powder mix at 0th day curing period showed 23.05
and 26.08 percent lower unconfined compressive strength value as compared to 30 percent demolition waste with 10 percent granite powder content and 10 percent demolition waste with 40 percent granite powder content respectively.
2. It was found that for a 0 percent granite powder mix at 7th day curing period showed 46.46 and 46.95 percent lower unconfined compressive strength value as compared to 30 percent demolition waste with 10 percent granite powder content and 10 percent demolition waste with 40 percent granite powder content respectively.
3. It was found that for a 0 percent granite powder mix at 14th day curing period showed 43.97 and 44.75 percent lower unconfined compressive strength value as compared to 30 percent demolition waste with 10 percent granite powder content and 10 percent demolition waste with 40 percent granite powder content respectively.
4. It was found that for a 0 percent granite powder mix at 28th day curing period showed 46.51 and 48.88 percent lower unconfined compressive strength value as compared to 30 percent
138
demolition waste with 10 percent granite powder content and 10 percent demolition waste with 40 percent granite powder content respectively.
References
AmitGoel and Animesh Das, “Emerging road materials and innovative applications”, National conference on materials and their applications in civil engineering, pp.1-2, August–2004, Hamirpur-India.
Madhavan, P., “Report on granite industry in kuppam”, Department of mines and geology, Government of Andhra Pradesh, pp.2-3, 2005.
A report of the committee to evolve road map on management of wastes in India, Ministry of environment and forests, New Delhi, pp.31-32, March-2010.
Ogunipe and Aribisala, “Recycled materials used in highway construction for sustainable development”, Journal of applied sciences, Volume-2, pp.393-395, 2007.
Gopala Raju, and Venkaiah Chowdary, “Utilization of building waste in road construction”, Indian Journal of Science and Technology, Volume-3, No. 8, pp.894-896, August-2010.
Chi Sun Poon, and Dixon Chan, “Feasible use of recycled concrete aggregates and crushed clay brick as unbound road sub-base”, Construction and Building Materials, Volume-20, pp.578–585, 2006.
Mymrin, V. and Correa, S.M., “New construction material from concrete production and demolition wastes and lime production waste”, Construction and Building Materials, Volume-21, pp.578–582, 2007.
XUAN Dongxing, LJM Houben, AAA Molenaar, and SHUI Zhonghe, “Cement Treated Recycled Demolition Waste as a Road Base Material”, Journal of Wuhan University of Technology - Materials Science Edition, Volume-25, No. 4, pp.696-699, 2010.
Arulrajah, J., Piratheepan and Aatheesan, T., “Geotechnical properties of recycled crushed brick in pavement applications”, Journal of Materials in Civil Engineering, Volume-23, pp.1444-1446, October-2011.
Herrador Rosario, Perez Pablo, Garach Laura, and Ordonez Javier, “The use of recycled construction and demolition waste aggregate for road course surfacing”, Journal of Transportation Engineering, Volume-23, pp.1943-1945, July – 2011.
139
CALIBRATION OF SOIL CONSTITUTIVE MODEL PARAMETERS
Shovan Roy1 and Dipika Devi2 1M.Tech student, Department of Civil Engineering, North Eastern Regional Institute of Science and
Technology (Deemed University), Itanagar, Arunachal Pradesh - 791109, India 2Assistant Professor, Department of Civil Engineering, North Eastern Regional Institute of Science and
Technology (Deemed University), Itanagar, Arunachal Pradesh - 791109, India
Key words: Finite element method, Modified Cam Clay
INTRODUCTION
The finite element method is the most widely used and versatile method for analyzing boundary value problems in geotechnical engineering. Application of FEM allows the use of complex constitutive models for describing the soil behavior for analysis and geotechnical design of structures for which soil – structure interaction is important (e.g. retaining structures, dams, bridges, special foundations etc.).
Various constitutive models have been formulated in recent years, which inhibit some advantages and disadvantages depending on their application. There are three basic criteria which can be used to evaluate a constitutive model theoretical (Chen, 1985), experimental, and numerical and computational evaluation. The theoretical evaluation of a model is to ascertain its consistency with the theoretical requirements of continuity, stability and uniqueness. The experimental evaluation of the model is to establish its suitability to fit experimental data from a variety of available test and the ease with which the material parameters from standard test data can be determined. The final criterion is numerical and computational evaluation of the models, which ascertains the facility with which the model can be implemented in computer calculations. Sien Ti et al. (2009) reported that the criterion for the soil model evaluation should always be a balance between the requirements from the continuum mechanics aspect, the requirements of realistic representation of soil behaviour from the laboratory testing aspect, and the simplicity in computational application.
It can be mentioned here that more complex is the constitutive model, more difficult to estimate the defining model parameters. For geotechnical engineering applications, the relevant soil data is usually obtained from basic field and laboratory tests. To determine the model parameters for most of the complex constitutive models of soil, triaxial tests with imposed stress path is required, which is not easily done by ordinary geotechnical laboratories. Hence there is often insufficient data to accurately select all parameters of many of the complex soil models. As a result, some parameters have to be ‘estimated’. Therefore, it is necessary to calibrate the model parameters before their use in numerical calculation for structural design. This is generally done through numerical modeling of the same experimental tests giving the required model parameters (Popa and Batali, 2010). In this paper we have calibrated the model parameters for Modified Cam-Clay model, which is a non linear elasto-plastic model and also mostly used in analyzing soil behavior. The parameters for this model are calculated from the laboratory tests for some soils in Itanagar of Arunachal Pradesh.
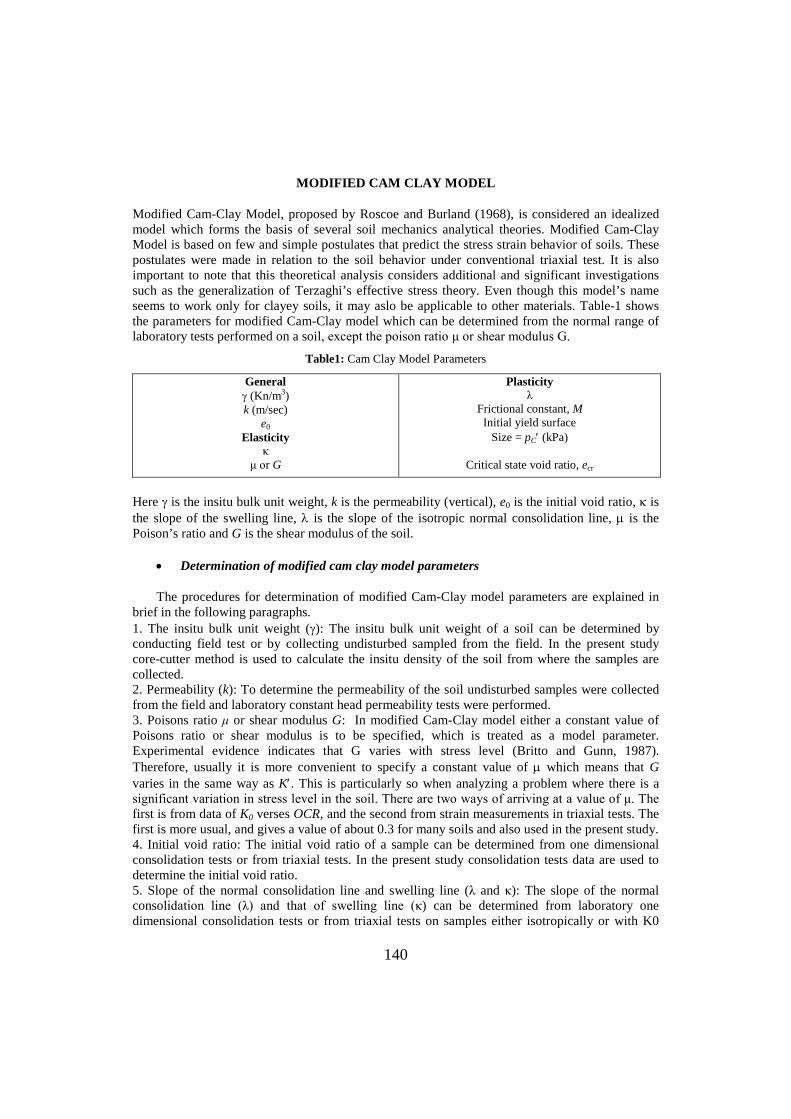
140
MODIFIED CAM CLAY MODEL
Modified Cam-Clay Model, proposed by Roscoe and Burland (1968), is considered an idealized model which forms the basis of several soil mechanics analytical theories. Modified Cam-Clay Model is based on few and simple postulates that predict the stress strain behavior of soils. These postulates were made in relation to the soil behavior under conventional triaxial test. It is also important to note that this theoretical analysis considers additional and significant investigations such as the generalization of Terzaghi’s effective stress theory. Even though this model’s name seems to work only for clayey soils, it may aslo be applicable to other materials. Table-1 shows the parameters for modified Cam-Clay model which can be determined from the normal range of laboratory tests performed on a soil, except the poison ratio μ or shear modulus G.
Table1: Cam Clay Model Parameters
General γ (Kn/m3)
k (m/sec) e0
Elasticity κ
μ or G
Plasticity λ
Frictional constant, M Initial yield surface
Size = pC′ (kPa)
Critical state void ratio, ecr
Here γ is the insitu bulk unit weight, k is the permeability (vertical), e0 is the initial void ratio, κ is the slope of the swelling line, λ is the slope of the isotropic normal consolidation line, µ is the Poison’s ratio and G is the shear modulus of the soil.
• Determination of modified cam clay model parameters
The procedures for determination of modified Cam-Clay model parameters are explained in brief in the following paragraphs. 1. The insitu bulk unit weight (γ): The insitu bulk unit weight of a soil can be determined by conducting field test or by collecting undisturbed sampled from the field. In the present study core-cutter method is used to calculate the insitu density of the soil from where the samples are collected. 2. Permeability (k): To determine the permeability of the soil undisturbed samples were collected from the field and laboratory constant head permeability tests were performed. 3. Poisons ratio μ or shear modulus G: In modified Cam-Clay model either a constant value of Poisons ratio or shear modulus is to be specified, which is treated as a model parameter. Experimental evidence indicates that G varies with stress level (Britto and Gunn, 1987). Therefore, usually it is more convenient to specify a constant value of µ which means that G varies in the same way as K′. This is particularly so when analyzing a problem where there is a significant variation in stress level in the soil. There are two ways of arriving at a value of μ. The first is from data of K0 verses OCR, and the second from strain measurements in triaxial tests. The first is more usual, and gives a value of about 0.3 for many soils and also used in the present study. 4. Initial void ratio: The initial void ratio of a sample can be determined from one dimensional consolidation tests or from triaxial tests. In the present study consolidation tests data are used to determine the initial void ratio. 5. Slope of the normal consolidation line and swelling line (λ and κ): The slope of the normal consolidation line (λ) and that of swelling line (κ) can be determined from laboratory one dimensional consolidation tests or from triaxial tests on samples either isotropically or with K0
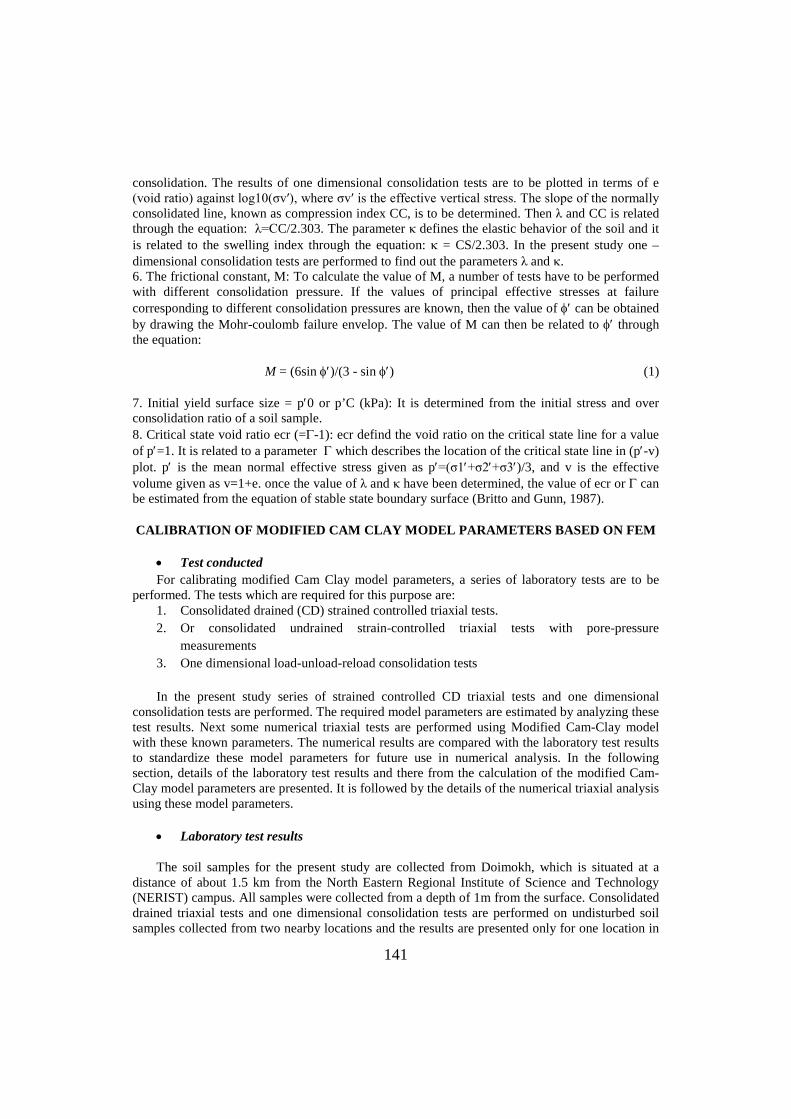
141
consolidation. The results of one dimensional consolidation tests are to be plotted in terms of e (void ratio) against log10(σv′), where σv′ is the effective vertical stress. The slope of the normally consolidated line, known as compression index CC, is to be determined. Then λ and CC is related through the equation: λ=CC/2.303. The parameter κ defines the elastic behavior of the soil and it is related to the swelling index through the equation: κ = CS/2.303. In the present study one –dimensional consolidation tests are performed to find out the parameters λ and κ. 6. The frictional constant, M: To calculate the value of M, a number of tests have to be performed with different consolidation pressure. If the values of principal effective stresses at failure corresponding to different consolidation pressures are known, then the value of φ′ can be obtained by drawing the Mohr-coulomb failure envelop. The value of M can then be related to φ′ through the equation:
M = (6sin φ′)/(3 - sin φ′) (1)
7. Initial yield surface size = p′0 or p’C (kPa): It is determined from the initial stress and over consolidation ratio of a soil sample. 8. Critical state void ratio ecr (=Γ-1): ecr defind the void ratio on the critical state line for a value of p′=1. It is related to a parameter Γ which describes the location of the critical state line in (p′-v) plot. p′ is the mean normal effective stress given as p′=(σ1′+σ2′+σ3′)/3, and v is the effective volume given as v=1+e. once the value of λ and κ have been determined, the value of ecr or Γ can be estimated from the equation of stable state boundary surface (Britto and Gunn, 1987).
CALIBRATION OF MODIFIED CAM CLAY MODEL PARAMETERS BASED ON FEM
• Test conducted For calibrating modified Cam Clay model parameters, a series of laboratory tests are to be
performed. The tests which are required for this purpose are: 1. Consolidated drained (CD) strained controlled triaxial tests. 2. Or consolidated undrained strain-controlled triaxial tests with pore-pressure
measurements 3. One dimensional load-unload-reload consolidation tests
In the present study series of strained controlled CD triaxial tests and one dimensional consolidation tests are performed. The required model parameters are estimated by analyzing these test results. Next some numerical triaxial tests are performed using Modified Cam-Clay model with these known parameters. The numerical results are compared with the laboratory test results to standardize these model parameters for future use in numerical analysis. In the following section, details of the laboratory test results and there from the calculation of the modified Cam-Clay model parameters are presented. It is followed by the details of the numerical triaxial analysis using these model parameters.
• Laboratory test results
The soil samples for the present study are collected from Doimokh, which is situated at a distance of about 1.5 km from the North Eastern Regional Institute of Science and Technology (NERIST) campus. All samples were collected from a depth of 1m from the surface. Consolidated drained triaxial tests and one dimensional consolidation tests are performed on undisturbed soil samples collected from two nearby locations and the results are presented only for one location in
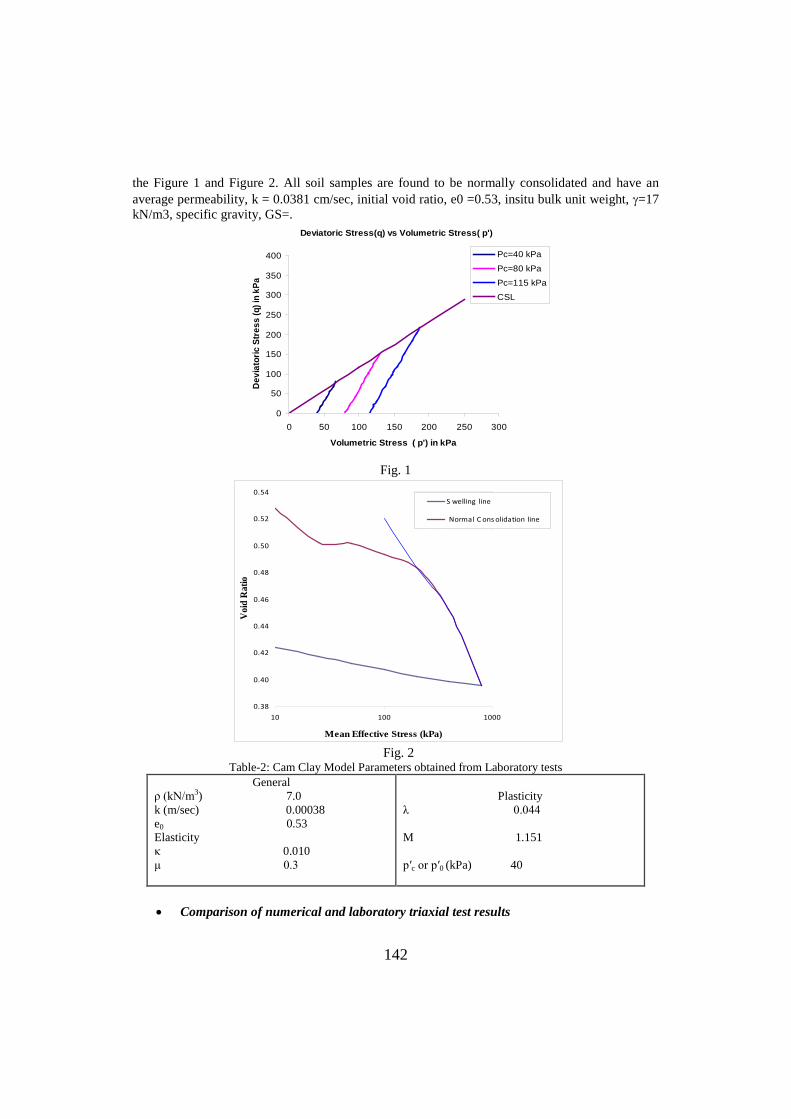
142
the Figure 1 and Figure 2. All soil samples are found to be normally consolidated and have an average permeability, k = 0.0381 cm/sec, initial void ratio, e0 =0.53, insitu bulk unit weight, γ=17 kN/m3, specific gravity, GS=.
Fig. 1
Fig. 2
Table-2: Cam Clay Model Parameters obtained from Laboratory tests General
ρ (kN/m3) 7.0
k (m/sec) 0.00038 e0 0.53 Elasticity κ 0.010 μ 0.3
Plasticity
λ 0.044
M 1.151
p′c or p′0 (kPa) 40
• Comparison of numerical and laboratory triaxial test results
Deviatoric Stress(q) vs Volumetric Stress( p')
0
50
100
150
200
250
300
350
400
0 50 100 150 200 250 300
Volumetric Stress ( p') in kPa
Dev
iato
ric S
tres
s (q
) in
kPa
Pc=40 kPa
Pc=80 kPa
Pc=115 kPa
CSL
0.38
0.40
0.42
0.44
0.46
0.48
0.50
0.52
0.54
10 100 1000
Mean Effective Stress (kPa)
Voi
d R
atio
S welling line
Normal C ons olidation line
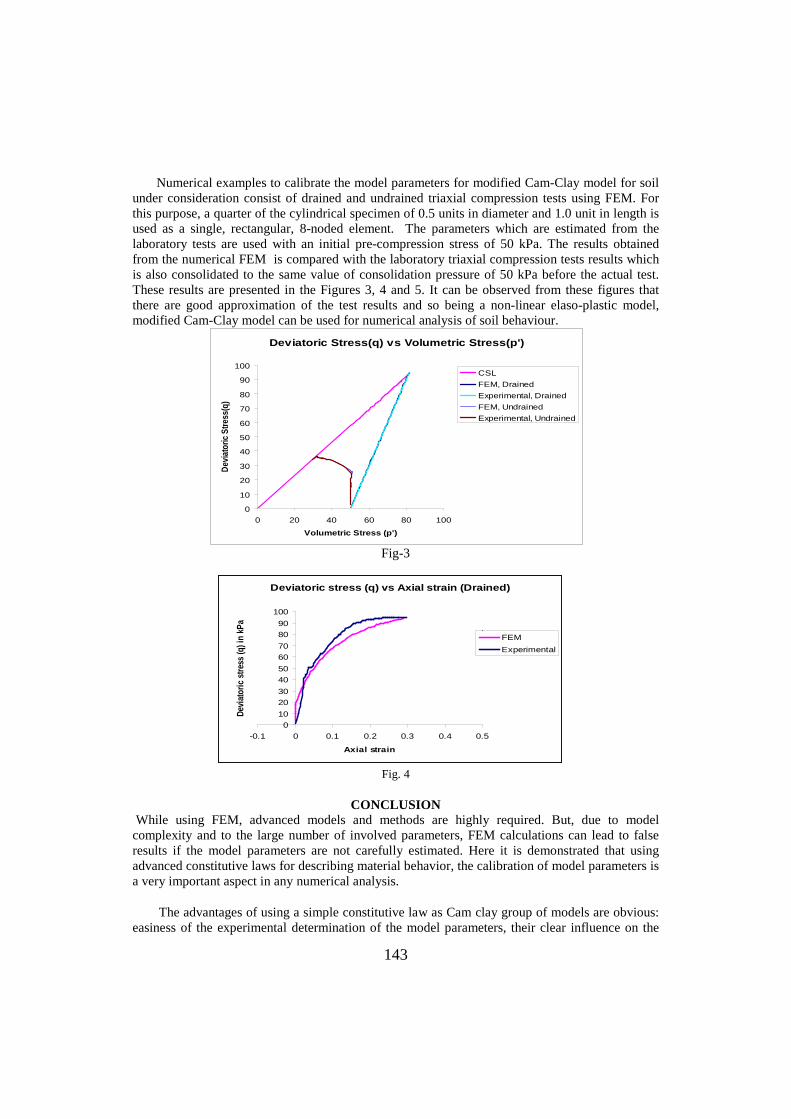
143
Numerical examples to calibrate the model parameters for modified Cam-Clay model for soil under consideration consist of drained and undrained triaxial compression tests using FEM. For this purpose, a quarter of the cylindrical specimen of 0.5 units in diameter and 1.0 unit in length is used as a single, rectangular, 8-noded element. The parameters which are estimated from the laboratory tests are used with an initial pre-compression stress of 50 kPa. The results obtained from the numerical FEM is compared with the laboratory triaxial compression tests results which is also consolidated to the same value of consolidation pressure of 50 kPa before the actual test. These results are presented in the Figures 3, 4 and 5. It can be observed from these figures that there are good approximation of the test results and so being a non-linear elaso-plastic model, modified Cam-Clay model can be used for numerical analysis of soil behaviour.
Fig-3
Fig. 4
CONCLUSION While using FEM, advanced models and methods are highly required. But, due to model complexity and to the large number of involved parameters, FEM calculations can lead to false results if the model parameters are not carefully estimated. Here it is demonstrated that using advanced constitutive laws for describing material behavior, the calibration of model parameters is a very important aspect in any numerical analysis.
The advantages of using a simple constitutive law as Cam clay group of models are obvious: easiness of the experimental determination of the model parameters, their clear influence on the
Deviatoric Stress(q) vs Volumetric Stress(p')
0
10
20
30
40
50
60
70
80
90
100
0 20 40 60 80 100
Volumetric Stress (p')
Devia
toric
Stre
ss(q
)
CSLFEM, DrainedExperimental, DrainedFEM, UndrainedExperimental, Undrained
Deviatoric stress (q) vs Axial strain (Drained)
0102030405060708090
100
-0.1 0 0.1 0.2 0.3 0.4 0.5
Axial strain
Devia
toric
stre
ss (q
) in
kPa
FEMExperimental
144
soil behavior. In this paper the modified Cam-Clay model parameters for a soil near Itanagar of Arunachal Pradesh is determined and the effectiveness of the modified Cam-Clay model to predict the behaviour of soil in triaxial tests is demonstrated.
References
Britto A.M.and Gunn M.J.; (1987); Critical State Soil Mechanics via Finite Element; Chap. 5; p:161-183; ELLIS HORWOOD LIMITED:Chichester,England.
Gallipoli D., Gens A., Sharma R., Vaunat J.; (2003). “An elasto-plastic model for unsaturated soil incorporating the effects of suction and degree of saturation on mechanical behaviour”; Geotechnique; Vol. 53; No. 1; p: 123-135.
Georgiadis K., Potts D. M., Zdravkovic L. ; (2004). “Modeling the shear strength of soils in the general stress space”; Computers and Geotechnics; Vol. 31; P: 357-364.
Helwany Sam; (2007); Applied Soil Mechanics with Abaqus application; Chap. 5; JOHN WILEY & SONS, INC.: Hoboken, New Jersey.
J.P. Carter, C.S. Desai, D.M. Potts, H.F. Schweiger and S.W. Sloan; computing and computer modelling in geotechnical engineering
McDowell G. R. , Hau K. W. ; (2003). ”A simple non-associated threesurface kinematic hardening model”; Geotechnique; Vol. 53; No. 4; P: 433-437.
Popa Horatiu, Batali loretta; (2010); Using Finite Element Method in geotechnical design. Soil constitutive laws and calibration of the parameters. Retaining wall case study;WSEAS TRANSACTIONS on APPLIED and THEORETICAL MECHANICS; Volume number 5.
Potts David M., Zdravkovic Lidija ; (1999). ”Finite element analysis in geotechnical engineering, Theory”;Thomas Telford.
Simon J. Wheeler, Anu Naatanen, Minna Karstunen, Matti Lojander; (2003). ”An anisotropic elastoplastic model for soft clays”; Canadian Geotechnical Journal; Vol. 40; P: 403-418.
Sun D. A., Mastuoka H., Yao Y. P., Ishii H.; (2004). ”An anisotropic hardening elastoplastic model for clays and sands and its application to FE analysis”; Computers and Geotechnics; Vol. 31; P: 37-46.
Tamagnini R.;(2004). ”An extended cam-Clay model for unsaturated soils with hydraulic hysteresis”; Geotechnique, Vol. 54; No. 3; P: 223-228.
Yin Jean-Hua, Zhu Jun-Gao, and Graham James; (2002). ”A new elastic viscoplastic model for time-dependent behaviour of normally and overconsolidated clays: theory and verification”; Canadian Geotechnical Journal; Vol. 39; P: 157-173.
145
STUDY OF SELF COMPACTING CONCRETE USING MARBLE POWDER AND COAL ASH
Kanwarjeet Singh Bedi and Ranjodh singh
Department of Civil Engineering, Guru Nanak Dev Engineering College, Ludhiana Department of Civil Engineering, GCET, Anandpur sahib
Abstract: The amount of different types of waste material like Marble Dust (MD) and Coal Ash(CA) is increasing day by day, while on the other hand quantities of natural resources like fine aggregate is decreasing at an alarming rate. Most common use of MD and CA is filling of landfills, which is causing serious environmental problems. Therefore, the utilization of the waste MD and CA in self-compacting concrete (SCC), as filler material and fine aggregate replacement has been attempted in this study. Self Compacting Concrete (SCC) has gained a wide use for placement in congested reinforcement concrete structures where casting conditions are difficult and in high rise buildings where pump ability properties are required. For such applications the fresh concrete must possess high fluidity and good cohesiveness. The use of fine materials like CA and MP can ensure the required concrete properties. Both MD and CA are used directly from factories and thermal plants, without attempting any additional process which would be another advantage. In the experimental investigation fine aggregate has been replaced in different proportions of 25%, 50%, 75% and 100%. Their use as a partial or full replacement of fine aggregate in SCC can make the concrete construction more sustainable and environment friendly as well as economical. Non destructive testing methods like Ultrasonic Pulse Velocity and Rebound hammer have been used to assess the quality of concrete.
INTRODUCTION
In the last few years, many important studies about SCC have been made. The most important difference between SCC and ordinary concrete is the existence of filler material in the SCC mixture. Lot of research has been done about the effects of filler materials on the properties of SCC. SCC is highly sensitive to changes in material properties and proportions and, therefore, requires increased quality control. Further, the consequences of deviations in workability are more significant for SCC [6]. Studies show that finer and better-graded limestone dust significantly increases the deformability of the paste. Limestone and dolomite fines are the most frequently used to increase the content of fine particles in self compacting concretes among non pozzolanic fillers [8]. Compared to plain concrete with the same W/C ratio and cement type, concrete with high limestone filler content with suitable particle size distribution possesses generally improved strength characteristics. Durability is a major concern for concrete structures exposed to aggressive environments. Many environmental phenomena are known to significantly influence the durability of reinforced concrete structures. Both MP and CA are produced in huge quantities in India and are dumped mainly as landfills causing major environmental problems. Many quarries are being closed because of the environmental protection rules put into practice. Hence, these waste material as filler material needs to be investigated for construction material. This study was aimed to investigate the effect of MP and CA as fine aggregate replacement on the fresh and hardened properties of SCC. Fresh concrete tests such as slump-flow, V-funnel, L-box [7] and hardened concrete tests such as compressive strength, ultrasonic pulse velocity and rebound
146
hammer were done to study the various properties. Concrete structures can be evaluated rapidly by NDT methods for quality control during construction of new structure and also periodical evaluation at later stage to assess the deterioration of the structures to measure the changes occurring with time in the properties of the concrete [1]. For quality control, results of NDT methods like UPV and RH can be more reliable than usual procedure of sample testing by cubes or cylinders which is basically done in a controlled manner and may not give a true value of the quality of the concrete rather than giving the compressive strength which is only a single factor of quality control [2,14]. Hence, UPV and RH testing methods can play an important role for assessing the quality control of new structure and predicting the deterioration of the structure with time.
• Material Aspects of Self Compacting Concrete
Self-consolidating concrete is designed to meet specific applications requiring high deformability, high flow ability and high passing ability. The rheological properties and robustness of SCC vary in a wide range. It is more susceptible to changes than ordinary concrete because of a combination of detailed requirements, more complex mix design and inherent low yield stress and viscosity [18]. Variations in properties (and robustness) are attributed therefore to the specific effects of the ingredients on the rheological properties of the mixture, effects of the physical properties (i.e. size and specific density) of the aggregate and the mixing history. Aggregates, cement, water and HRWR are the principal materials of SCC where as SCM, VMA and other chemicals can be used as the optional materials [17]. The brief illustration of component materials of SCC is given below.
• Coarse Aggregate
Coarse aggregates significantly influence the performance of SCC by affecting the flowing ability, segregation resistance, and strength of concrete. The nominal maximum size for SCC can be 20 or 25 mm. However, the smaller size is preferable to produce higher strength and to reduce segregation in fresh SCC. Round aggregates are better than angular aggregates for flowing ability of SCC while rough and angular aggregates are conducive to high strength and strong interfacial bond due to rough surface texture and interlocking characteristic [7]. The gradation of coarse aggregates affects the flow properties and segregation resistance of SCC. The well-graded coarse aggregates contribute to produce the optimum mixture with least particle interference and thus enhance the flowing ability and reduce the tendency of segregation in fresh concrete [17]. They also improve the hardened properties and durability of concrete due to dense particle packing.
• Fine aggregate
Fine aggregates increase the flowing ability and segregation resistance when used at a suitable amount. In addition, they modify the strength of concrete when used in varying proportion with cement and coarse aggregates. Particle shape, surface texture, surface area and void content affect the mixing water requirement and compressive strength of concrete .The fine aggregates for SCC should be sharp, angular, chemically inert, sound, low absorbent and free from deleterious substances to attain high strength and good durability [7]. Well-graded fine aggregates increase the flow of mortar and hence may improve the flowing ability of SCC. Furthermore, the well-graded fine aggregates contribute to improve the packing density and thus the hardened properties and durability of concrete. A fineness modulus in the range of 2.5 to 3.2 is generally recommended for SCC [18].
147
• Cement
SCC often has higher cementitious materials content than conventionally placed concrete in order to achieve adequate flow ability. The potential negative consequences of high cementitious materials content include higher cost, higher heat of hydration, and increased susceptibility to shrinkage.Portland cement is most widely used to produce various types of concrete. The cement used for SCC should have sound flow and setting properties. It should enhance the fluidity of concrete and should be compatible with the chemical admixtures such as HRWR and VMA. The cement should possess carefully controlled fineness, and should produce low or moderate heat of hydration to control the volume changes in concrete.
• Marble Powder
Marble is a non-foliated metamorphic rock composed of recrystallized carbonate minerals, most commonly calcite or dolomite. Geologists use the term "marble" to refer to metamorphosed limestone; however stonemasons use the term more broadly to encompass unmetamorphosed limestone. Marble is commonly used for sculpture and as a building material. It is a waste material obtained from cutting and grinding of marble plates.
• Coal Ash
Coal ash has been used successfully in SCC, which generally improves workability and delays strength development.The coal ash produced from the burning of pulverized coal in a coal-fired boiler is a fine-grained, powdery particulate material that is carried off in the flue gas and usually collected from the flue gas by means of electrostatic precipitators, bag houses, or mechanical collection devices such as cyclones. In general, there are three types of coal-fired boiler furnaces used in the electric utility industry. They are referred to as dry-bottom boilers, wet-bottom boilers, and cyclone furnaces. The most common type of coal burning furnace is the dry-bottom furnace. When pulverized coal is combusted in a dry-ash, dry-bottom boiler, about 80 percent of all the ash leaves the furnace as fly ash, entrained in the flue gas. When pulverized coal is combusted in a wet-bottom (or slag-tap) furnace, as much as 50 percent of the ash is retained in the furnace, with the other 50 percent being entrained in the flue gas. In a cyclone furnace, where crushed coal is used as a fuel, 70 to 80 percent of the ash is retained as boiler slag and only 20 to 30 percent leaves the furnace as dry ash in the flue gas.
• Viscosity modifying admixture
VMA improves the viscosity and cohesion of fresh concrete and thus reduces the bleeding, surface settlement and aggregate sedimentation resulting in a more stable and uniform mix [19]. The mechanism of viscosity enhancement depends on the type of objectives of study.
• Super Plasticizer
Super plasticizer deflocculates the cement particles and frees the trapped water by their dispersing action, and hence enhances the flowing ability of SCC. In dispersing action, the inter-particle friction and thus the flow resistance are also decreased, and therefore the flowing ability of concrete is improved. High-range water reducers can either increase the strength by lowering the
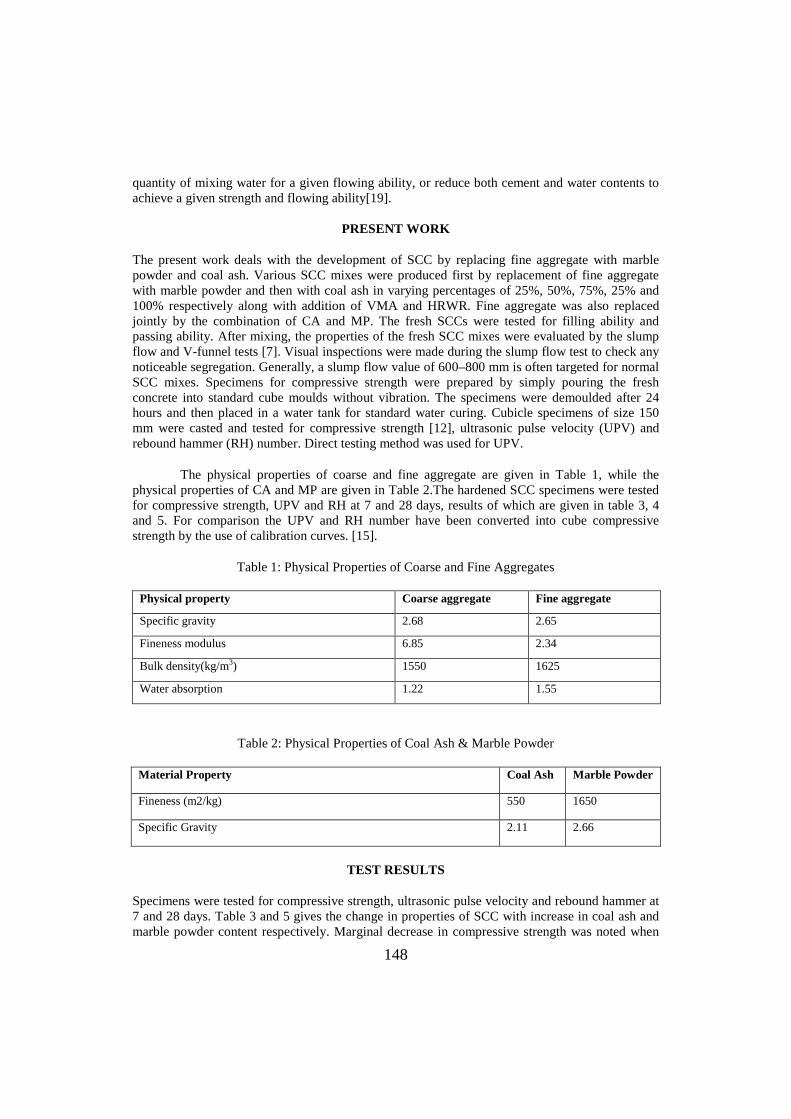
148
quantity of mixing water for a given flowing ability, or reduce both cement and water contents to achieve a given strength and flowing ability[19].
PRESENT WORK
The present work deals with the development of SCC by replacing fine aggregate with marble powder and coal ash. Various SCC mixes were produced first by replacement of fine aggregate with marble powder and then with coal ash in varying percentages of 25%, 50%, 75%, 25% and 100% respectively along with addition of VMA and HRWR. Fine aggregate was also replaced jointly by the combination of CA and MP. The fresh SCCs were tested for filling ability and passing ability. After mixing, the properties of the fresh SCC mixes were evaluated by the slump flow and V-funnel tests [7]. Visual inspections were made during the slump flow test to check any noticeable segregation. Generally, a slump flow value of 600–800 mm is often targeted for normal SCC mixes. Specimens for compressive strength were prepared by simply pouring the fresh concrete into standard cube moulds without vibration. The specimens were demoulded after 24 hours and then placed in a water tank for standard water curing. Cubicle specimens of size 150 mm were casted and tested for compressive strength [12], ultrasonic pulse velocity (UPV) and rebound hammer (RH) number. Direct testing method was used for UPV.
The physical properties of coarse and fine aggregate are given in Table 1, while the physical properties of CA and MP are given in Table 2.The hardened SCC specimens were tested for compressive strength, UPV and RH at 7 and 28 days, results of which are given in table 3, 4 and 5. For comparison the UPV and RH number have been converted into cube compressive strength by the use of calibration curves. [15].
Table 1: Physical Properties of Coarse and Fine Aggregates
Physical property Coarse aggregate Fine aggregate
Specific gravity 2.68 2.65
Fineness modulus 6.85 2.34
Bulk density(kg/m3) 1550 1625
Water absorption 1.22 1.55
Table 2: Physical Properties of Coal Ash & Marble Powder
Material Property Coal Ash Marble Powder
Fineness (m2/kg) 550 1650
Specific Gravity 2.11 2.66
TEST RESULTS
Specimens were tested for compressive strength, ultrasonic pulse velocity and rebound hammer at 7 and 28 days. Table 3 and 5 gives the change in properties of SCC with increase in coal ash and marble powder content respectively. Marginal decrease in compressive strength was noted when
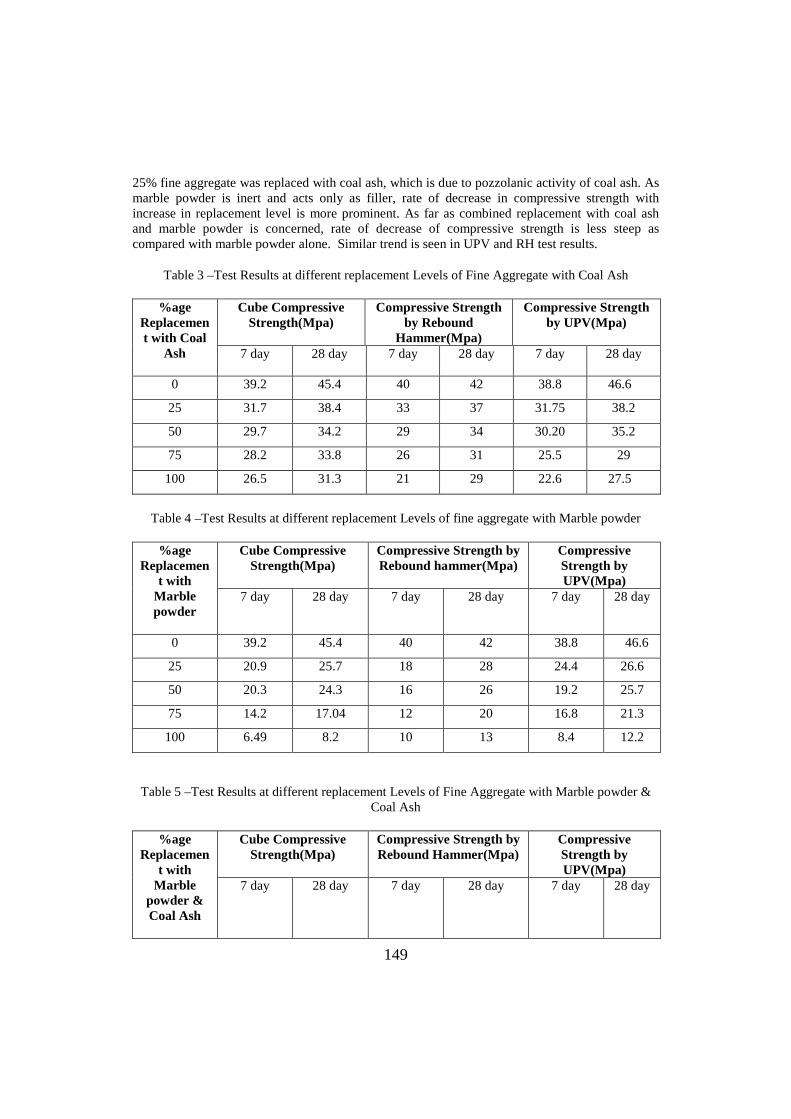
149
25% fine aggregate was replaced with coal ash, which is due to pozzolanic activity of coal ash. As marble powder is inert and acts only as filler, rate of decrease in compressive strength with increase in replacement level is more prominent. As far as combined replacement with coal ash and marble powder is concerned, rate of decrease of compressive strength is less steep as compared with marble powder alone. Similar trend is seen in UPV and RH test results.
Table 3 –Test Results at different replacement Levels of Fine Aggregate with Coal Ash
%age Replacement with Coal
Ash
Cube Compressive Strength(Mpa)
Compressive Strength by Rebound
Hammer(Mpa)
Compressive Strength by UPV(Mpa)
7 day 28 day 7 day 28 day 7 day 28 day
0 39.2 45.4 40 42 38.8 46.6
25 31.7 38.4 33 37 31.75 38.2
50 29.7 34.2 29 34 30.20 35.2
75 28.2 33.8 26 31 25.5 29
100 26.5 31.3 21 29 22.6 27.5
Table 4 –Test Results at different replacement Levels of fine aggregate with Marble powder
%age Replacemen
t with Marble powder
Cube Compressive Strength(Mpa)
Compressive Strength by Rebound hammer(Mpa)
Compressive Strength by UPV(Mpa)
7 day 28 day 7 day 28 day 7 day 28 day
0 39.2 45.4 40 42 38.8 46.6
25 20.9 25.7 18 28 24.4 26.6
50 20.3 24.3 16 26 19.2 25.7
75 14.2 17.04 12 20 16.8 21.3
100 6.49 8.2 10 13 8.4 12.2
Table 5 –Test Results at different replacement Levels of Fine Aggregate with Marble powder & Coal Ash
%age Replacemen
t with Marble
powder & Coal Ash
Cube Compressive Strength(Mpa)
Compressive Strength by Rebound Hammer(Mpa)
Compressive Strength by UPV(Mpa)
7 day 28 day 7 day 28 day 7 day 28 day
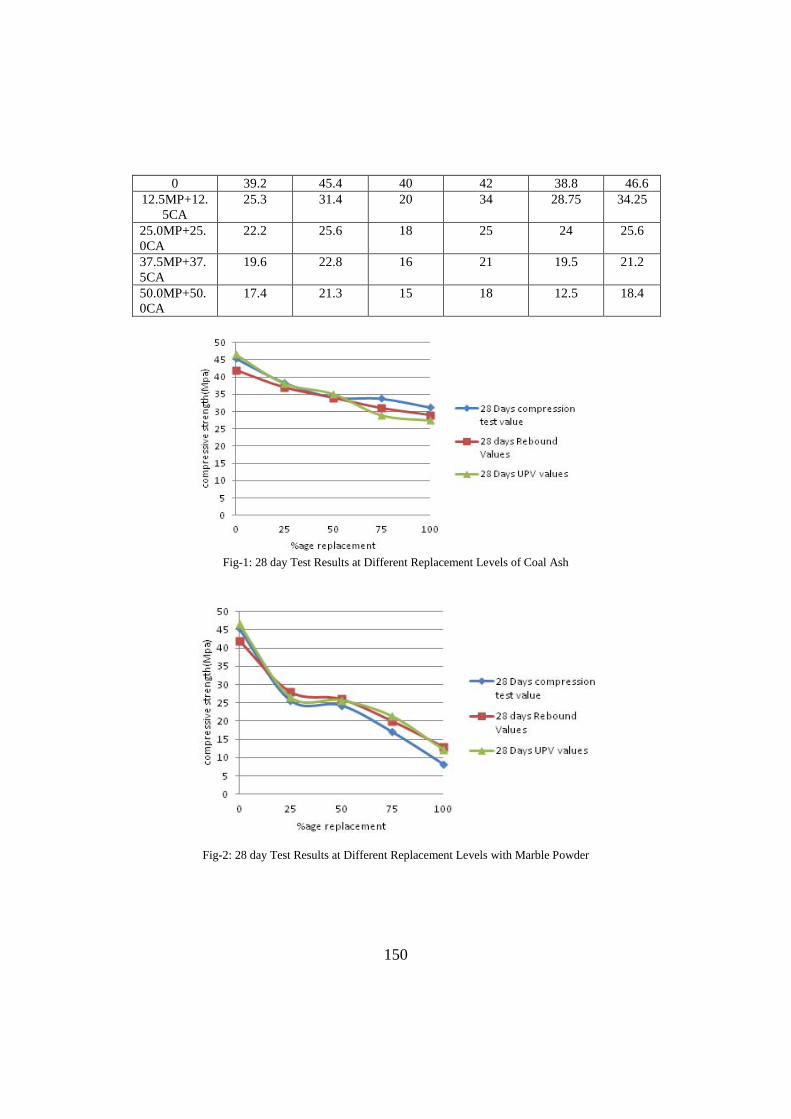
150
0 39.2 45.4 40 42 38.8 46.6 12.5MP+12.
5CA 25.3 31.4 20 34 28.75 34.25
25.0MP+25.0CA
22.2 25.6 18 25 24 25.6
37.5MP+37.5CA
19.6 22.8 16 21 19.5 21.2
50.0MP+50.0CA
17.4 21.3 15 18 12.5 18.4
Fig-1: 28 day Test Results at Different Replacement Levels of Coal Ash
Fig-2: 28 day Test Results at Different Replacement Levels with Marble Powder
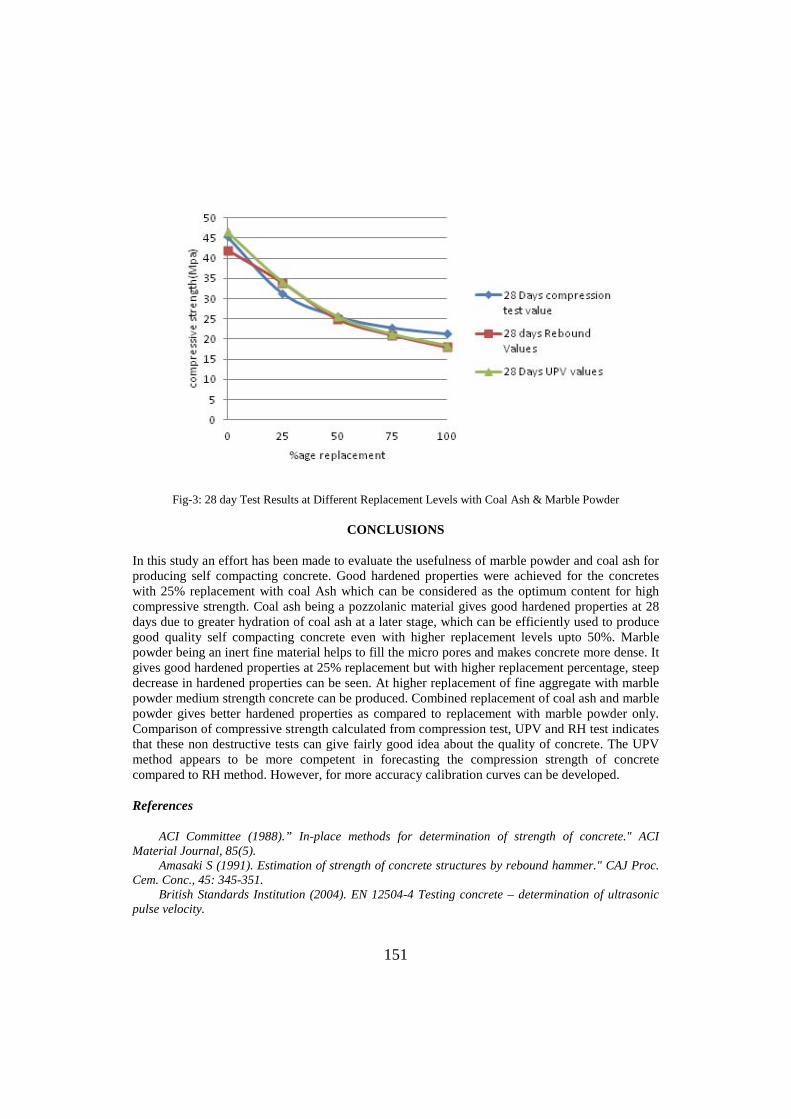
151
Fig-3: 28 day Test Results at Different Replacement Levels with Coal Ash & Marble Powder
CONCLUSIONS
In this study an effort has been made to evaluate the usefulness of marble powder and coal ash for producing self compacting concrete. Good hardened properties were achieved for the concretes with 25% replacement with coal Ash which can be considered as the optimum content for high compressive strength. Coal ash being a pozzolanic material gives good hardened properties at 28 days due to greater hydration of coal ash at a later stage, which can be efficiently used to produce good quality self compacting concrete even with higher replacement levels upto 50%. Marble powder being an inert fine material helps to fill the micro pores and makes concrete more dense. It gives good hardened properties at 25% replacement but with higher replacement percentage, steep decrease in hardened properties can be seen. At higher replacement of fine aggregate with marble powder medium strength concrete can be produced. Combined replacement of coal ash and marble powder gives better hardened properties as compared to replacement with marble powder only. Comparison of compressive strength calculated from compression test, UPV and RH test indicates that these non destructive tests can give fairly good idea about the quality of concrete. The UPV method appears to be more competent in forecasting the compression strength of concrete compared to RH method. However, for more accuracy calibration curves can be developed.
References
ACI Committee (1988).” In-place methods for determination of strength of concrete." ACI Material Journal, 85(5).
Amasaki S (1991). Estimation of strength of concrete structures by rebound hammer." CAJ Proc. Cem. Conc., 45: 345-351.
British Standards Institution (2004). EN 12504-4 Testing concrete – determination of ultrasonic pulse velocity.
152
Chai, H.W (1998)”Design and testing of self compacting concrete “PhD Thesis Department of Civil and Environmental Engineering ,University College, London.
Domone PL. “A review of the hardened mechanical properties of self compacting concrete. Cement Concrete Composites” 2007;29(1):1–12.
Domone PL. “Self-compacting concrete: an analysis of 11 years of case studies. Cement Concrete Composites” 2006; 28(2):197–208.
7EFNARC: Specification and Guidelines for Self-Compacting Concrete. Farnham, February 2002.
8. Ilker Bekir Topcu , Turhan Bilir , Tayfun Uygunog “Effect of waste marble dust content as filler on properties of self-compacting concrete” Construction and Building Materials 23 (2009), 1947-53.
9. Felekoglu B, Tosun K, Baradan B, Altun A, Uyulgan B. “The effect of fly ash and limestone fillers on the viscosity and compressive strength of self-compacting repair mortars”. Construction and Building Material 2006;36 (9):1719–26.9.
10. Hayakawa, M., Matsuoka, Y., and Shindoh, T. (1993) “Development & application of super workable concrete.” RILEM International Workshop on Concretes: Workability and Mixing.
11. IS: 456-2000(2000)”Code of practice plain and reinforced concrete” Bureau of Indian Standards, New Delhi.
12. IS:516-1959(reaffirmed 1999) “Methods of tests of concrete” Bureau of Indian Standards, New Delhi
13. IS:383-1970(reaffirmed1997):”Specifications of coarse and fine aggregates from natural sources of concrete “Bureau of Indian Standards, New Delhi.
14. Malhotra, V. M. “Testing Hardened Concrete: Non-destructive Methods. American Concrete Institute”, Monograph No. 9, 1976.
15. Mahdi Shariati, Nor Hafizah Ramli-Sulong, Mohammad Mehdi Arabnejad K. H., Payam Shafigh and Hamid Sinaei(2011) “Assessing the strength of reinforced concrete structures through Ultrasonic Pulse Velocity and Schmidt Rebound Hammer tests “ Scientific Research and Essays Vol. 6(1), pp. 213-220, 4 January, 2011
16. Neville,A.M,”Properties of concrete”,Longman Publishers,pp-300 17. Okamura,H.andOuchi,M.,(2003).“Self-compacting concrete”, Journal of Advance concrete
Technology, Vol. 1, No. 1, April, pp. 5-15. 18. Okamura, H. and Ozawa, K., (1995). “Mix design for self-compacting concrete”,
Concrete Library of JSCE, 25, pp. 107-120. 19. Ramchandran ,V.S and Malhotra(1981)” Superplasticizer in concrete admixtures handbook”
park ridge, N.J.Noyes Publication,pp211-268 21. Uno, Y. (1999). “State-of-the art report on concrete products made of SCC,” Proceedings of
the International Workshop on Self-Compacting Concrete, 262- 291. 22. Unal O, Topcu IB, Uygunoglu T. “Use of marble dust in self compacting concrete”. In:
Proceedings of V symposium MERSEM0 2006 on marble and natural stone. Afyon, Turkey; 2006. p. 413–20.
153
STUDY ON DEVELOPMENT OF NEW
HIGHWAY CONSTRUCTION MATERIALS USING RECYCLABLE WASTE:
AN OVERVIEW
Sachin Dass and Parveen Jangra Department of CIVIL Engineering, DCRUST, Murthal, Sonipat, India-131039
Abstract: Presently in India, about 960 million tonnes of solid waste is being generated annually as by-products during industrial, mining, municipal, agricultural and other processes. To safeguard the environment, efforts are being made for recycling different wastes and utilize them in value added applications. This paper summarizes current research on those waste materials that have shown promise as a substitute for conventional materials It primarily focuses on new and innovative highway industry uses for waste materials and by products, rather than on more commonly followed practices in the world but not so common in India. The paper concludes by comparing various types of materials and by tabulating the re resources for self evaluation by the readers.
INTRODUCTION
As the world population grows, so do the amount and type of waste being generated. Many of the wastes produced today will remain in the environment for hundreds, perhaps thousands, of years. The creation of non-decaying waste materials, combined with a growing consumer population, has resulted in a waste disposal crisis. One solution to this crisis lies in recycling waste into useful products.
Research into new and innovative uses of waste materials is continually advancing. Many highway agencies, private organizations, and individuals have completed or are in the process of completing a wide variety of studies and research projects concerning the feasibility, environmental suitability, and performance of using recycled products in highway construction. These studies try to match society's need for safe and economic disposal of waste materials with the highway industry's need for better and more cost-effective construction materials. Various types of waste materials available and their schematic utilization are given in following sections:
• Plastics
In India about 20% of solid municipal wastes are plastic. Non-degradable plastics accumulate at the rate of 25 million tonnes per year. According to an estimate more than 100 million tonnes of plastic is produced every year all over the world. In India use of plastic is 3 kg per person per year.
154
Current research on the use of recycled plastics in highway construction is wide and varied. The use of virgin polyethylene as an additive to asphaltic concrete is not new; however, two new processes also use recycled plastic as an asphalt cement additive: NOVOPHALTR and PolyphaltR. These latter two processes both use recycled low-density polyethylene resin which is generally obtained from plastic trash and sandwich bags. The recycled plastic is made into pellets and added to asphalt cement at a rate of 4 to 7 percent by weight of binder (0.25 percent to 0.50 percent by weight of total mix).
Many international universities around the globe like Michigan State University are looking into the use of recycled plastic in portland cement concrete. In the study, recycled high-density polyethylene (HDPE) was used to replace from 20 to 40 percent of fine aggregate by volume (7.5 to 15 percent by total volume) in a lightweight concrete mix. Compressive strengths were reduced when either level of HDPE was used. Overall flexural strengths remained fairly constant and the impact resistance of the concrete, which can be related to flexural toughness, increased.
Many agencies and private companies have been experimenting with the use of recycled plastic for items such as guardrail posts and block-outs, delineator posts, fence posts, noise barriers, sign posts, and snow poles.
• Glass
Glass, another important constituent, makes up about 7 percent (approximately 12 million tones) of the total weight of Indian municipal solid waste discarded annually. Approximately 20 percent of this glass is being recycled, primarily for cullet in glass manufacturing. The ability to use glass in highway construction depends on the types of collection methods used, costs, and public factors. In general, the large quantities of waste glass needed for such application are found only in major metropolitan areas.
Many agencies have experimented with glass in highway construction. Much current research in this area focuses on the use of glass as an aggregate in asphalt pavements. There research included laboratory testing as well as field testing and experimentation.
Several highway agencies routinely allow glass to be used as a substitute for aggregate in asphaltic concrete pavements. For example, New Jersey Department of Transportation (NJDOT) specifications allow the substitution of up to 10 percent glass (by weight) for aggregate in asphalt base courses. In 1992, the department placed two sections of asphalt surface courses of about 0.5 kilometers (0.3 miles) each containing 10 percent glass. One of the sections contained an anti-strip additive; the other did not. Results to date indicate that both of these sections are performing as well as conventional pavement.
The Clean Washington Center of Seattle, Wash, had conducted laboratory tests on glass cullet for compaction, durability, gradation, permeability, shear strength, specific gravity, thermal conductivity, and workability as a construction aggregate. The center has subsequently developed recommendations for the approximate percentages of glass to be used for different applications. In addition, several agencies are routinely using recycled glass in the manufacture of glass beads for traffic control devices.
• Municipal waste combustion ash
155
Globally the estimated quantity of wastes generation was 12 billion tonnes in the year 2002 of which 11 billion tonnes were industrial wastes and 1.6 billion tonnes were municipal solid wastes (MSW). About 19 billion tonnes of solid wastes are expected to be generated annually by the year 2025. By the year 2047, MSW generation in India, is expected to reach 300 MT and land requirement for disposal of this waste would be 169.6 km as against which only 20.2 km were occupied in 1997 for management of 48 MT. Controlled combustion of municipal solid waste produces two types of ash: fly ash and bottom ash. Most MWC ash (80 to 99 percent) is bottom ash, which typically meets the environmental standards for the toxicity characteristic leaching procedure (TCLP). Fly ash, however, usually contains a high percentage of heavy metals (e.g., lead and cadmium), and the leachate may not meet some environmental standards.
Concern over the environmental acceptability of MWC ash has severely curtailed the initiation of research on the beneficial uses of MWC ash. The Environmental Protection Agency (EPA) estimates that less than 10 percent of the MWC ash produced in the United States is being used in a limited number of beneficial projects.
Several studies have focused on using incinerator residue as a partial aggregate substitute in an asphaltic concrete base course. Results showed that this use resulted in performance equal to that obtained from conventional asphalt pavements.
Recent research involved the use of combined MWC ash as an aggregate in stabilized and unstabilized bases and sub-bases. Results indicated that cement-treated MWC ash can produce increased density and compressive strengths over conventional soil cement.
• Scrap Tyres
With the phenomenal increase in number of automobiles in India during recent years the demand of tyres as original equipment and as replacement has also increased from 22,846 thousand tyres in the year 1990-91 to 31,213 thousand tyres in the year 1994-95. As every tyre is destined to go to waste stream for disposal/recycling/reclamation, despite its passage through retreading process, the number of used tyres being discarded is going to increase significantly. Timely action regarding recycling of used tyres is necessary in view to solve the problem of disposal of used tyres keeping in view the increasing cost of raw material, resource constraints and environmental problems including fire and health hazards associated with the stockpiles of the used tyres.
The problem has drawn attention of planners, environmentalists, consumers and industry in the developed countries in Western Europe, USA, Japan, Australia etc. where billions of used tyres are stock piled. These stockpiles are also direct loss of energy and resources in addition to fire & health hazard and other environmental issues. Considerable research on crumb-rubber-modified asphalt has been conducted since the 1991 passage of the Intermodal Surface Transportation Efficiency Act. This research has addressed both performance and environmental issues; additional research is examining the use of scrap tire rubber in other highway-related applications.
The Carson City, Nev, company that is marketing a noise wall that contains recycled rubber tires and recycled plastics is also researching the use of rubber tires in lightweight fill, subgrade insulation, and channel slope protection as well as an additive to portland cement concrete pavement.
156
The North Carolina Department of Transportation recently conducted a laboratory study on the use of ground scrap tires in portland cement concrete. After the scrap tires were processed to remove loose steel and fibers, they were finely ground.
A 1992 project in Richmond, Maine, assessed the effectiveness of using tire chips as an insulating layer in order to limit frost penetration beneath a gravel-surfaced road that experienced severe deterioration during spring thawing. Thermocouples, resistivity gauges, groundwater monitoring wells, and a weather station were installed to monitor the penetration by up to 40 percent.
A company in Pittsburgh, has developed a process that can convert scrap tires into a form that can be used as poles or stakes. The process, which requires only that the tires be split and flattened, rolls the tires in a spiral fashion to form a nearly solid "log" of reinforced rubber material.
• Roofing Shingle Waste
It is estimated that between 8 million and 12 million tonnes of roofing shingles are manufactured each year in the United States. Since approximately 65 percent of these shingles is used for re-roofing, between 5 million and 8 million tonnes of old waste shingles is produced annually. In addition, between 400,000 and 900,000 tonne of waste are produced annually from the manufacture of roofing shingles. Brock J.D. (1990) and many other researchers have focused on the use of roofing shingle waste as an asphalt pavement material.
Minnesota has conducted several projects on the use of roofing shingles in HMA pavements. Findings from a study on their use in dense-graded mixes indicated that the addition of roofing shingle waste can result in a reduction in optimum neat binder content, enhance the ability to density under compaction, and increase the plastic strain component in permanent deformation measurements. Cold tensile strengths were also reduced, but the impact on the corresponding strains was dependent on the type of shingle waste and the grade of asphalt cement. This finding could indicate that HMA's potential for thermal cracking could be reduced by adding roofing shingle wastes.
Minnesota also studied the use of roofing shingle waste in stone matrix asphalt mixes. The research showed that adding 10 percent of manufactured roofing shingle waste to the mix resulted in a 25- to 40-percent reduction in the required neat binder content.
The Minnesota Department of Transportation completed a project in 1991 that used from 5 to 7 percent asphalt shingles by weight of mix. The shingles were ground to a uniform consistency resembling coffee grounds and were added to a drum mix plant as if they were recycled asphalt pavement. No construction problems were noted; further, there have been no problems reported regarding pavement performance.
NJDOT experimented with an asphalt cold-patch material made from old roofing material. The resulting patch material showed only minor signs of distress after 22 months of service. In comparison, conventional cold-patch material generally lasts only three to six months.
• Coal Combustion Byproducts
157
There are 720 coal-fired power plants in 45 states. When coal is burned in these power plants, two types of ash are produced--coal fly ash and bottom ash. Coal fly ash is the very fine ash carried in the flue gas; bottom ash (or slag) is the larger, heavier particles that fall to the bottom of the hopper after combustion. The physical and chemical characteristics of these ashes vary depending on the type of coal burned. An additional byproduct of the coal combustion process is produced from coal containing sulfur. When this coal is burned, sulfur dioxide is produced; scrubbers are used to limit the amount of sulfur dioxide released into the atmosphere. The resulting waste of this process is flue gas desulfurization (FGD) waste. An estimated 18 million t of this waste is produced annually in the United States; 136 million t of it is currently stockpiled.
• Coal Fly Ash
The combustion of powdered coal in thermal power plants produces fly ash. The high temperature of burning coal turns the clay minerals present in the coal powder into fused fine-particles mainly comprising aluminium silicate. Fly ash produced thus possesses both ceramic and pozzolanic properties. When pulverised coal is burnt to generate heat, the residue contains 80 per cent fly ash and 20 per cent bottom ash.
The World Bank has cautioned India that by 2015, disposal of coal ash would require 1000 square kilometres or one square metre of land per person. Since coal currently accounts for 70 per cent of power production in the country, the Bank has highlighted the need for new and innovative methods for reducing impacts on the environment. The primary components of coal fly ash are silicon dioxide, aluminum oxide, iron oxide, and calcium oxide.
Extensive research has been conducted on the use of coal fly ash as a highway construction material. Though most of this research has looked at its use as a mineral admixture to portland cement concrete, research has also been conducted on a variety of other uses, including in soil stabilization, roller-compacted concrete, and road base stabilization.
In 1988, a study was undertaken to evaluate the use of "ponded fly ash" as a component in a stabilized aggregate base course. Ponded fly ash is the fly ash portion of coal ash waste previously sluiced into a disposal pond. Laboratory investigations determined that the optimum mix was a composite of 84-percent dense-graded aggregate, 11-percent ponded fly ash, and 5-percent hydrated lime. A 230-m- (755-ft-) long, 20-cm- (8-in-) thick test section was constructed and overlaid with an asphalt base, binder, and surface course. After three years of service, the experimental section is outperforming the conventional section; the amount of rutting is significantly lower in the experimental section than in the control section. Aside from minor reflective cracking associated with base shrinkage base, the experimental section has performed excellently.
• Bottom Ash
Bottom ash has a similar chemical makeup to fly ash but has a much coarser gradation. A recent study on its use as a sub-base material showed that it had sufficient engineering properties to perform adequately. Bottom ash has also been marketed as an aggregate for lightweight concrete; coal boiler slag has been used as an abrasive in pavement deicing products and as a sandblasting abrasive.
• Combined Ash
158
When fly ash and bottom ash are placed in landfills, they are generally combined. Consequently, most current research has focused on the use of combined ash. The physical properties of combined ash -- including gradation, specific gravity, and loss on ignition -- can vary considerably depending on the type of plant and source of coal. Chemical properties, however, are similar to those found in typical fly ash.
Researchers at Clemson University recently completed a study on the use of combined coal ash as a partial fine aggregate replacement in asphalt concrete mixes. The study examined the effects of the ash on indirect tensile strengths and tensile strength ratios of asphalt concrete mixes. Conclusions from a limited number of samples indicated that the addition of coal ash at 6 and 8 percent by weight of aggregate decreased the 24-hour tensile strengths of Marshall specimens compared to the control mix. A number of agencies are also conducting research into the use of combined ash as an embankment material.
• Flue Gas Desulfurization Waste
Research on the use of FGD waste has focused on its use in stabilized road bases and as an embankment material. Recent research by the Texas Transportation Institute addressed the use of cement-stabilized FGD waste in road base construction. The research consisted of placing two 91.4 m (300 ft) experimental sections containing FGD waste stabilized with 7 percent by dry weight of high early strength, high sulfate-resistant portland cement. To date, no distress related to the FGD waste in either pavement section has been identified. It was also found that the strength of the cement-stabilized FGD increased when mixed with coal bottom ash.
Additionally, surface water and soil leachate were analyzed for both sections; the material constituents were compared with EPA drinking water standards and TCLP concentrations. The results showed that none of the EPA heavy metal concentrations were exceeded. However, the drinking water standards were exceeded for sulfates; TCLP standards do not contain values for sulfate levels.
In 1992, Ohio State University researched the use of FGD waste as an embankment material for a garbage truck ramp. After one year of service, there is no evidence of physical deterioration resulting from the FGD waste embankment. Tests of the leachate showed no heavy metal concentrations above drinking water standards.
The Table 1 very clearly denotes the resources, advantages and disadvantages of various types of waste materials which can be used as pavement material. The readers can very easily do a self evaluation of the different type of material discussed in the paper and can arrive at a suitable conclusion:
Table 1: Comparison of various waste materials
S No.
Material Name Source Advantage Disadvantage
1 Plastics Municipal Garbage Non biodegradable , blocks sewage
Poisonous gases produced when burnt
2 Glass Glass industry Glass-fiber reinforcement, bulk fill
Poisonous gases produced when burnt
3 Municipal Waste Combustion Ash
Municipal waste Lack of dumping yards Difficult to carry and creates pollution if not treated
159
4 Scrap Tyres Automobile industry Rubber modified bitumen, aggregate
Poisonous gases released when burnt
5 Roofing Shingle Waste
Construction industry Non biodegradable , blocks sewage
Due to lack of dumping place creates environmental degradation
6 Coal Combustion byproducts
Thermal power station Bulk fill, filler in bituminous mix, artificial aggregates
Causes Pollution if left unattended
7 Coal Fly Ash Thermal power station Bulk fill, filler in bituminous mix, artificial aggregates
Causes Pollution if left unattended
8 Nonferrous slag Mineral processing industry
Bulk-fill, aggregates in bituminous mix
Creates land as well as water pollution
9 China clay Bricks and tile industry
Bulk-fill, aggregates in bituminous mix
Causes Pollution if left unattended
10 Cement kiln dust Cement industry Stabilization of base, binder in bituminous mix
Causes Pollution if left unattended
CONCLUDING REMARKS
Looking at the above table even a novice will also be in a position to judge and forecast that how these different so called waste and useless materials can create havoc if not treated properly or taken care off. The other side of the coin is that if the policy makers make it a mandatory, that a well planned waste utilization project will only be given a nod for the public construction or road development, the society will be able to meet both its end in terms of lower project cost as well as save itself from the disaster of waste management. A step in the same direction is also taken up by a famous paper manufacturing company in north India by the name of BILT. They use the spent up hot gasses which are given up by their manufacturing process to supply hot water to the whole plant (both for industrial and domestic purpose) and city of Yamunanagar.
The problems associated with the environmentally safe and efficient disposal of waste continue to grow. In many areas, existing landfills are beginning to fill up, and a "not-in-my-backyard" philosophy has made the establishment of new landfills very difficult. The cost of disposal continues to increase while the types of wastes accepted at municipal solid waste landfills is becoming more and more restricted. One answer to all of these problems lies in the ability of society to develop beneficial uses for these waste products. The highway construction industry can effectively use large quantities of diverse materials. The use of waste byproducts in lieu of virgin materials for instance, would relieve some of the burden associated with disposal and may provide an inexpensive and advantageous construction product. Current research on the beneficial use of waste byproducts as highway construction materials has identified several promising uses for these materials. Much of this research has been conducted primarily in the laboratory. The next step will be to put these ideas into action by initiating a systematic program to determine the viability and long-term performance of these materials in actual highway construction projects.
References
Ahmed I., “Use of Waste Materials in Highway Construction”, Report No. FHWA/IN/JHRP-91/3, 1991.
160
“Availability of Mining Wastes and Their Potential for Use as a Highway Material”, Executive Summary, Publication No. FHWA-RD-78-28, Federal Highway Administration, Washington D.C., September 1977.
“Characterization of Municipal Solid Waste in the United States”, 1992 Update, Executive Summary. Report No. EPA/530-S-92-019, Environmental Protection Agency, Washington, D.C., 1992.
Collins R.J. and Ciesielski S.K., “Recycling and Use of Waste Materials and Byproducts in Highway Construction”, Volumes 1 & 2, 1993.
“Engineering and Environmental Aspects of Recycled Materials for Highway Construction”, Volume I: Final Report. FHWA Contract No. DTFH61-92-C-00060, Federal Highway Administration, Washington D.C., 1993.
J.D. Brock. "From Roofing Shingles to Roads," Technical Paper T-20, 1990. "Fly ash sets standard for recycled material use", Roads & Bridges, November 1992, pp. 50-56. "Recycled plastic finds home in asphalt binder", Roads & Bridges, March 1993, pp. 41-47. "Shingle Scrap in Asphalt Concrete", unpublished report, Study No. 9PR1010, Minnesota Department
of Transportation, 1991. "Use of Waste Materials in Highway Construction," American Association of State Highway and
Transportation Officials, Subcommittee on Construction, Quality Construction Task Force unpublished report, August 1993.
161
APPROPRIATE USE OF WASTE MATERIALS IN INFRASTRUCTURE PROJECTS
K. G. Guptha, Mahadev P. Anawkar and Sameeuddin Sheikh Civil Engineering Department, Goa College of Engineering, Goa
Abstract: India has witnessed a tremendous change in the phase of construction especially in building materials sector. Traditional materials like stones, bricks etc., have started disappearing from the construction sites due to the reasons well known. These materials are being replaced by concrete blocks, fly ash bricks and others. Today, waste materials generated from industries are causing serious hazards towards the environment. Disposal of these materials has become a major concern otherwise these materials occupy huge fertile land for storage. Materials like fly ash, slag, mining rejects etc. have been identified as potential sources for use in infrastructure projects and building materials like concrete blocks, bricks etc. Therefore attempts are being made to use some of these materials in construction industry with advantage over conventional materials and thus supporting sustainable development. In the present study, emphasis has been given to produce building material using waste products of industries such as slag, fly ash etc. having properties better than that of conventional materials, with simpler manufacturing procedure, assured supply and providing an efficient method of reusing slag which otherwise would occupy large spaces and interfere with the environment. This involves the analysis of materials, their proportioning and studies as per requirements of IS as a building material to replace traditional materials in infrastructure projects as an environment friendly, cost effective alternative building material. Technology has been transferred and being practiced.
Keywords: Char waste, Slag, Waste, Environment friendly, Traditional material, Cost effective.
INTRODUCTION
Building industry is one of the largest consumers of resources whether it is material, capital, or energy. Increasing cost of building materials such as clay bricks and laterite stones making it difficult for the construction industry to economies the construction. In addition to this there is pressure from environmentalists for reducing the consumption of virgin materials. Hence, concept of green buildings is being introduced in the construction industry. It is said that, nature takes about 100 years to form 1 cm thick layer of soil. The sources of precious clay which are being used for manufacturing of conventional clay bricks are limited. Thus, in order to minimize the exploitation of virgin materials, secondary materials are often considered to be sensible alternatives.
At the same time, problem of disposing of waste material such as Slag, fly ash, mining rejects etc. produced by different industries is becoming a major concern since they occupy huge fertile lands and create environmental hazards. As of this date, it is estimated that, more than 100 million tones of mineral wastes have been generated in mining and deposited on the earth's surface by mining industries. Also, about 20 million tones of wastes such as slag, dust and sludge from steel making industries is generated every year. It is known that, much of cultivated land and hilly areas have been occupied by these wastes, and the cost for waste management is very high, so the
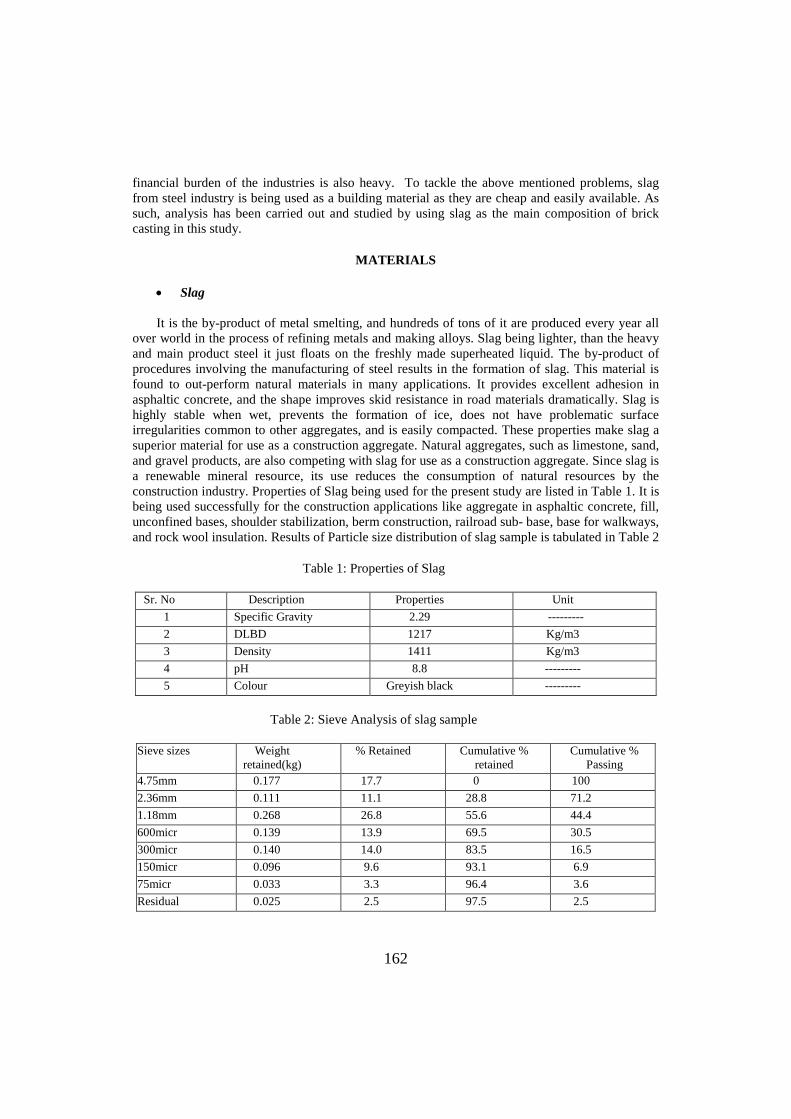
162
financial burden of the industries is also heavy. To tackle the above mentioned problems, slag from steel industry is being used as a building material as they are cheap and easily available. As such, analysis has been carried out and studied by using slag as the main composition of brick casting in this study.
MATERIALS
• Slag
It is the by-product of metal smelting, and hundreds of tons of it are produced every year all over world in the process of refining metals and making alloys. Slag being lighter, than the heavy and main product steel it just floats on the freshly made superheated liquid. The by-product of procedures involving the manufacturing of steel results in the formation of slag. This material is found to out-perform natural materials in many applications. It provides excellent adhesion in asphaltic concrete, and the shape improves skid resistance in road materials dramatically. Slag is highly stable when wet, prevents the formation of ice, does not have problematic surface irregularities common to other aggregates, and is easily compacted. These properties make slag a superior material for use as a construction aggregate. Natural aggregates, such as limestone, sand, and gravel products, are also competing with slag for use as a construction aggregate. Since slag is a renewable mineral resource, its use reduces the consumption of natural resources by the construction industry. Properties of Slag being used for the present study are listed in Table 1. It is being used successfully for the construction applications like aggregate in asphaltic concrete, fill, unconfined bases, shoulder stabilization, berm construction, railroad sub- base, base for walkways, and rock wool insulation. Results of Particle size distribution of slag sample is tabulated in Table 2
Table 1: Properties of Slag
Sr. No Description Properties Unit 1 Specific Gravity 2.29 --------- 2 DLBD 1217 Kg/m3 3 Density 1411 Kg/m3 4 pH 8.8 --------- 5 Colour Greyish black ---------
Table 2: Sieve Analysis of slag sample
Sieve sizes Weight retained(kg)
% Retained Cumulative % retained
Cumulative % Passing
4.75mm 0.177 17.7 0 100 2.36mm 0.111 11.1 28.8 71.2 1.18mm 0.268 26.8 55.6 44.4 600micr 0.139 13.9 69.5 30.5 300micr 0.140 14.0 83.5 16.5 150micr 0.096 9.6 93.1 6.9 75micr 0.033 3.3 96.4 3.6 Residual 0.025 2.5 97.5 2.5
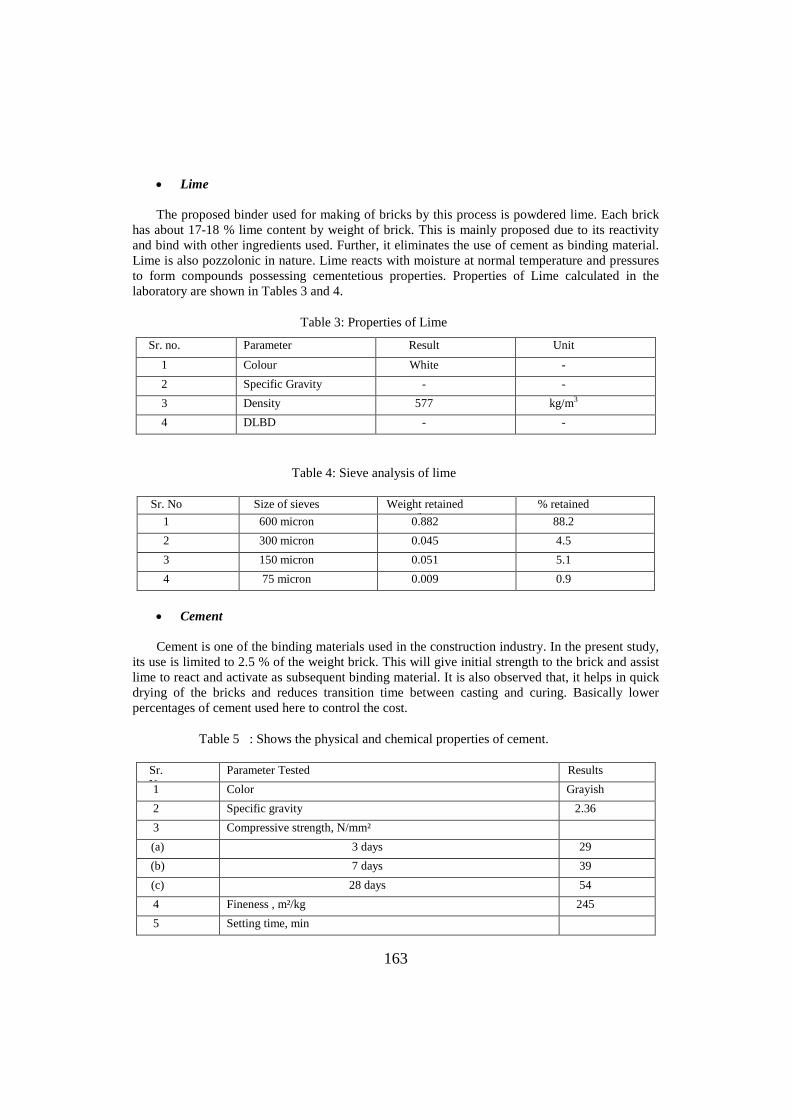
163
• Lime
The proposed binder used for making of bricks by this process is powdered lime. Each brick has about 17-18 % lime content by weight of brick. This is mainly proposed due to its reactivity and bind with other ingredients used. Further, it eliminates the use of cement as binding material. Lime is also pozzolonic in nature. Lime reacts with moisture at normal temperature and pressures to form compounds possessing cementetious properties. Properties of Lime calculated in the laboratory are shown in Tables 3 and 4.
Table 3: Properties of Lime
Sr. no. Parameter Result Unit
1 Colour White - 2 Specific Gravity - - 3 Density 577 kg/m3 4 DLBD - -
Table 4: Sieve analysis of lime
Sr. No Size of sieves Weight retained (kg)
% retained 1 600 micron 0.882 88.2 2 300 micron 0.045 4.5 3 150 micron 0.051 5.1 4 75 micron 0.009 0.9
• Cement
Cement is one of the binding materials used in the construction industry. In the present study, its use is limited to 2.5 % of the weight brick. This will give initial strength to the brick and assist lime to react and activate as subsequent binding material. It is also observed that, it helps in quick drying of the bricks and reduces transition time between casting and curing. Basically lower percentages of cement used here to control the cost.
Table 5 : Shows the physical and chemical properties of cement.
Sr. No
Parameter Tested Results 1 Color Grayish 2 Specific gravity 2.36 3 Compressive strength, N/mm²
(a) 3 days 29 (b) 7 days 39 (c) 28 days 54 4 Fineness , m²/kg 245 5 Setting time, min
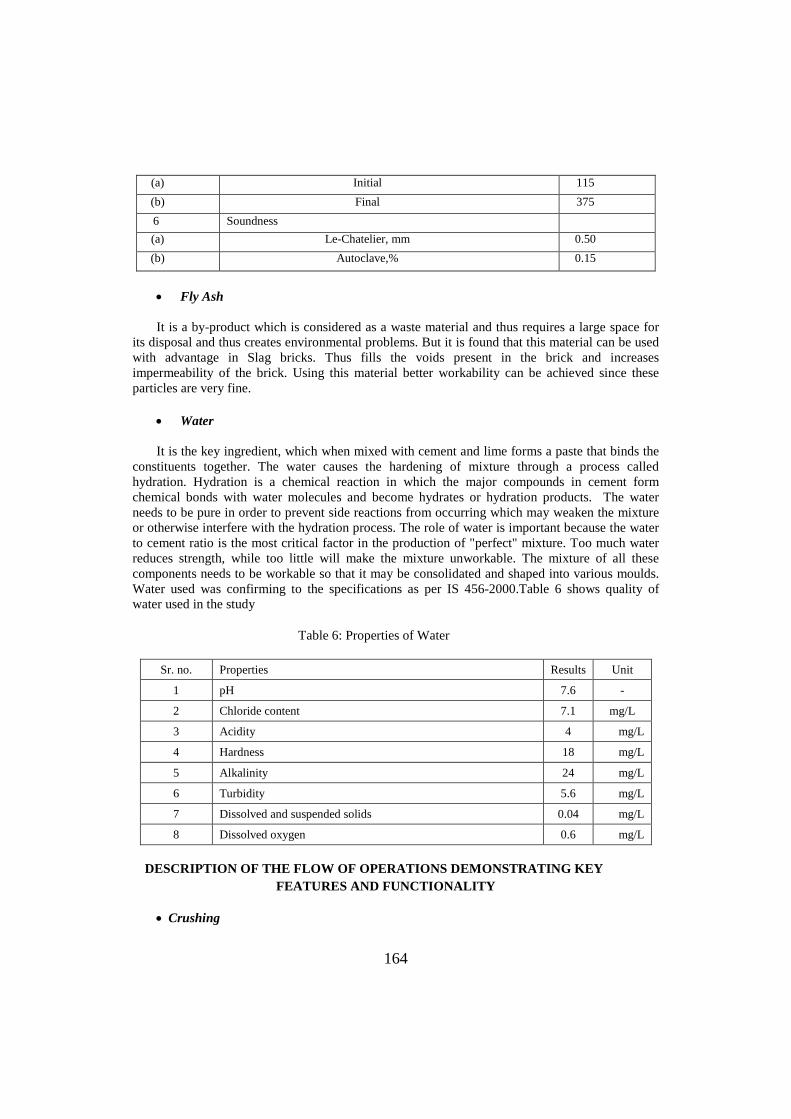
164
(a) Initial 115 (b) Final 375 6 Soundness
(a) Le-Chatelier, mm 0.50 (b) Autoclave,% 0.15
• Fly Ash
It is a by-product which is considered as a waste material and thus requires a large space for its disposal and thus creates environmental problems. But it is found that this material can be used with advantage in Slag bricks. Thus fills the voids present in the brick and increases impermeability of the brick. Using this material better workability can be achieved since these particles are very fine.
• Water
It is the key ingredient, which when mixed with cement and lime forms a paste that binds the constituents together. The water causes the hardening of mixture through a process called hydration. Hydration is a chemical reaction in which the major compounds in cement form chemical bonds with water molecules and become hydrates or hydration products. The water needs to be pure in order to prevent side reactions from occurring which may weaken the mixture or otherwise interfere with the hydration process. The role of water is important because the water to cement ratio is the most critical factor in the production of "perfect" mixture. Too much water reduces strength, while too little will make the mixture unworkable. The mixture of all these components needs to be workable so that it may be consolidated and shaped into various moulds. Water used was confirming to the specifications as per IS 456-2000.Table 6 shows quality of water used in the study
Table 6: Properties of Water
Sr. no. Properties Results Unit
1 pH 7.6 -
2 Chloride content 7.1 mg/L
3 Acidity 4 mg/L
4 Hardness 18 mg/L
5 Alkalinity 24 mg/L
6 Turbidity 5.6 mg/L
7 Dissolved and suspended solids 0.04 mg/L
8 Dissolved oxygen 0.6 mg/L
DESCRIPTION OF THE FLOW OF OPERATIONS DEMONSTRATING KEY FEATURES AND FUNCTIONALITY
• Crushing
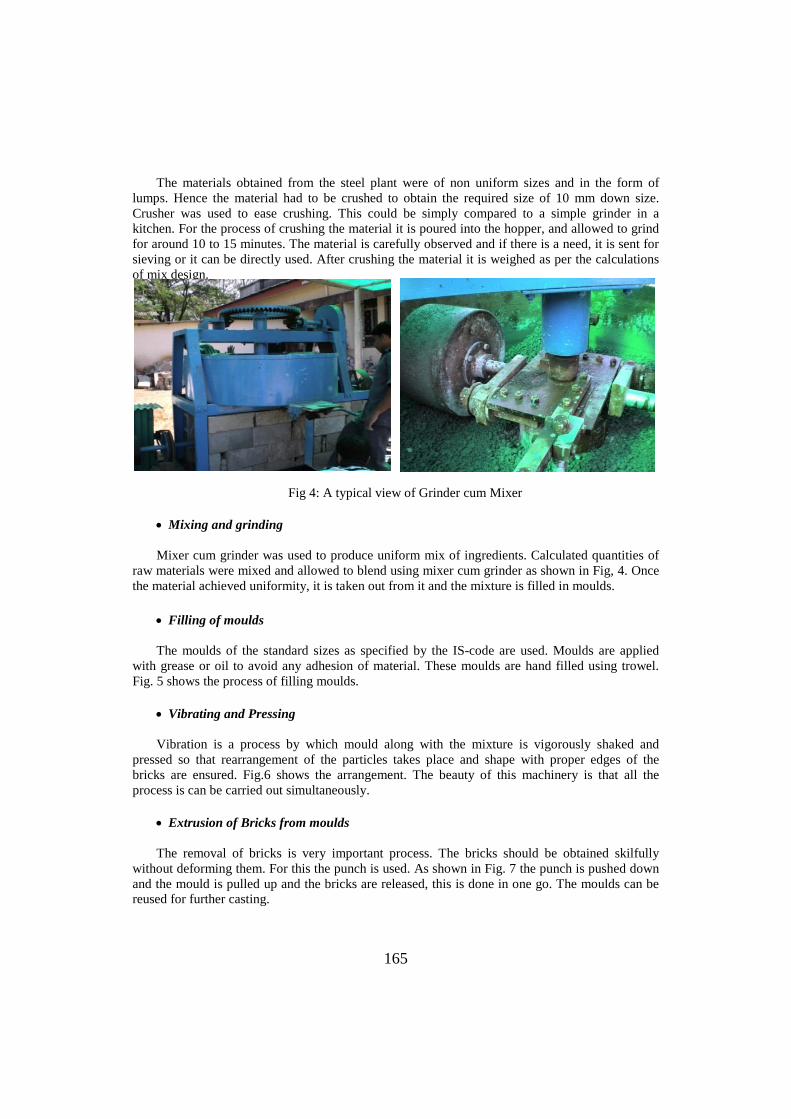
165
The materials obtained from the steel plant were of non uniform sizes and in the form of lumps. Hence the material had to be crushed to obtain the required size of 10 mm down size. Crusher was used to ease crushing. This could be simply compared to a simple grinder in a kitchen. For the process of crushing the material it is poured into the hopper, and allowed to grind for around 10 to 15 minutes. The material is carefully observed and if there is a need, it is sent for sieving or it can be directly used. After crushing the material it is weighed as per the calculations of mix design.
Fig 4: A typical view of Grinder cum Mixer
• Mixing and grinding
Mixer cum grinder was used to produce uniform mix of ingredients. Calculated quantities of raw materials were mixed and allowed to blend using mixer cum grinder as shown in Fig, 4. Once the material achieved uniformity, it is taken out from it and the mixture is filled in moulds.
• Filling of moulds
The moulds of the standard sizes as specified by the IS-code are used. Moulds are applied with grease or oil to avoid any adhesion of material. These moulds are hand filled using trowel. Fig. 5 shows the process of filling moulds.
• Vibrating and Pressing
Vibration is a process by which mould along with the mixture is vigorously shaked and pressed so that rearrangement of the particles takes place and shape with proper edges of the bricks are ensured. Fig.6 shows the arrangement. The beauty of this machinery is that all the process is can be carried out simultaneously.
• Extrusion of Bricks from moulds
The removal of bricks is very important process. The bricks should be obtained skilfully without deforming them. For this the punch is used. As shown in Fig. 7 the punch is pushed down and the mould is pulled up and the bricks are released, this is done in one go. The moulds can be reused for further casting.
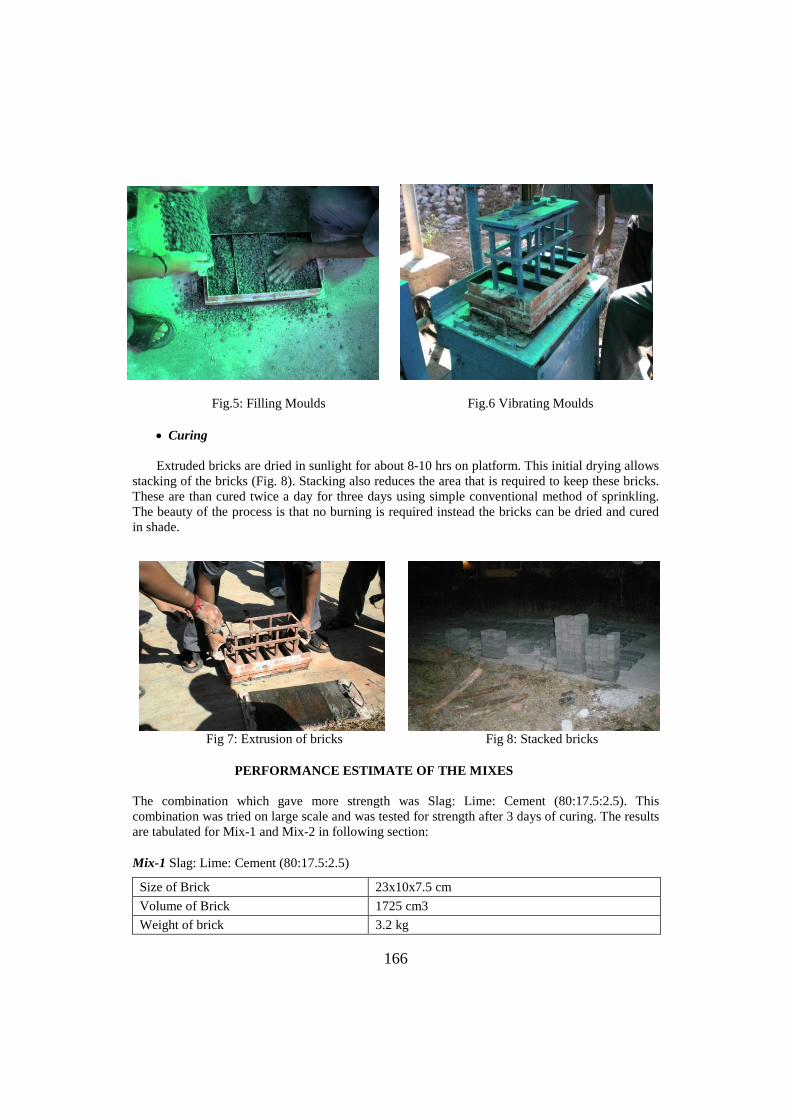
166
Fig.5: Filling Moulds Fig.6 Vibrating Moulds • Curing
Extruded bricks are dried in sunlight for about 8-10 hrs on platform. This initial drying allows stacking of the bricks (Fig. 8). Stacking also reduces the area that is required to keep these bricks. These are than cured twice a day for three days using simple conventional method of sprinkling. The beauty of the process is that no burning is required instead the bricks can be dried and cured in shade.
Fig 7: Extrusion of bricks Fig 8: Stacked bricks
PERFORMANCE ESTIMATE OF THE MIXES
The combination which gave more strength was Slag: Lime: Cement (80:17.5:2.5). This combination was tried on large scale and was tested for strength after 3 days of curing. The results are tabulated for Mix-1 and Mix-2 in following section:
Mix-1 Slag: Lime: Cement (80:17.5:2.5)
Size of Brick 23x10x7.5 cm Volume of Brick 1725 cm3 Weight of brick 3.2 kg
167
Mix-2 Slag: Lime: Fly ash (60:15:25)
RATE ANALYSIS
Cost of bricks manufactured using the waste was compared and summary of the cost analysis is given in table 7.
Table 7: Details of Cost per Brick (In Rupees)
Sr. no. Description Cement Based Fly ash Based Item Cost in rupees Cost in rupees 1 Labour 0.6 0.6 2 Lime 0.6 0.6 3 Salary(Supervisor) 0.1 0.1 4 Power and Water 0.1 0.1 5 Maintenance 0.1 0.1 6 Annual Expenses 0.1 0.1 7 Contractor if any 0.2 0.2 8 Hidden charges 0.2 0.2 9 Any raw material addition if any 0.1 0.1
10 Cement 0.6 0.0 11 TOTAL 2.6 2.1
RESULTS
The various tests conducted on the bricks as per the relevant Indian code and results are tabulated for comparison in Table 8.
Table 8: Comparison of test results
Sr. no. Test Unit Cement based Fly ash based 1 Compressive Strength Kg/cm2 65 70
2 Average Weight of the bricks. Kg 3.2 3.22
Density 1855 kg/m3 Strength 65 kg/cm2
Size of Brick 23x10x7.5 cm Volume of Brick 1725 cm3 Weight of brick 3.2 kg Density 1855 kg/m3 Strength 70 kg/cm2
168
3 Average dimensions of the bricks. mm 23x10x7.5 23x10x7.5
4 Efflorescence Mild/moderate/severe mild Nil or Mild
5 Water absorption % <10 <10
6 Metallic sound - yes yes
7 Drop from 1m height Broken/not broken not broken broken
CONCLUSIONS
• A simple and efficient method of reusing slag which generates revenue, otherwise it occupies large spaces and interfere with environment.
• Process is economical due to the readily available raw material and assured quality which doesn’t involve the process of burning.
• Process gives assured supply even during monsoons without compromising quality. • The method of manufacture is simpler and has less work than conventional burnt clay
bricks. • It has been observed from the test that the difference between the three days and seven
days strength gained particularly with 2.5% cement is very less, so three days curing is preferred.
• 2.5 % cement is found to be more economical. However use of flyash is commercially viable .Additional cement will lead to the increase in curing period for enhanced strength with increase in cost further.
• The ability of the bricks to dry fast makes it easier for stacking of the bricks and curing. Thus the space required reduces.
AUTHOR REMARKS
Technology was transferred to Ultratech bricks to manufacture bricks using Slag, fly ash and lime as stated in this paper. The commercial venture has been established at Kundaim industrial estate Goa. Slag from neighbouring steel industries is being used. Size beyond 10mm interferes with smoothness and aesthetics of the bricks. Excessive lime usage may result in to marginal delayed settings. Successfully 1, 00,000 bricks are being manufactured and sold to builders per month. Similar bricks made out of fly ash and cement normally known as FALGY bricks. These bricks have problem with binding while plastering. However due to roughness of the surface of Slag bricks this problem is eliminated.
References
IS 1077-1992 Indian Standard: Common burnt clay building bricks specifications. BIS, New Delhi, 1992 (Fifth Revision).
R B Hajela, et al. Fly ash utilization-a perspective in brick production. A Tiwari. Quality Brick for Ahmedabad district through partial fly ash sand Replacement. Civil
Engineering and Construction Review, August 1996. K P Kacker, et al. ‘Use of Delhi fly ash for making clay bonded lighter bricks. Proceedings of national
workshop on utilization of fly ash, CBRI, Roorkee, 1988.

169
Is 3495 (Part1 and 2): 1992. ‘Indian Standard: Methods of tests of Burnt Clay Bricks. BIS, New Delhi, 1992 (Third Revision).
R Coffman, N Agnew, G Austin and E Doehn. Adobe Mineralogy Characterization of Adobes from around the world. The sixth International Conference on the Earthen Architecture, Las Cruce, N M, October 1990, pp 14-19.
A J Bryan, soil/cement as walling material. Some measures of durability building an environment-23, 1998.
G F Middleton. Earth wall construction. Fourth Edition, CSTRO division of building construction and engineering Australia 1992.
N A Davy. History of Building Materials. Phoenix house, London 1961. H A Tylor. Science and Materials. Wenn Nostrand Reinvold, Wokingham, 1978.
170
UTILIZATION OF MEDICAL PACKING PLASTIC WASTE IN
GEOTECHNICAL APPLICATIONS
Kiranmaye Dasari* and Madhav Madhira** *Vasavi College of Engineering & **JNTU, Hyderabad
Abstract: Waste medical capsule plastic packing, which otherwise is a matter of environmental concern, is used as a reinforcing material and its effect on dry density, California Bearing Ratio (CBR) and permeability of three soil types viz., sand, moorum and expansive, with different percentages of randomly distributed reinforcing elements in the form of waste medical packing polythene strips are studied. The different percentages of reinforcement considered are 1, 2, 4 and 7 and the sizes of the strips being 7 mm by 7 mm, 20 mm by 7 mm and 35 mm by 7 mm. The investigation revealed improved CBR values to an extent of 7 times, in case of sandy soils reinforced with medical waste strips compared to the improvements with similar mixes with moorum and expansive soil. Medical waste reinforced sandy soils exhibited no improvement in permeability while those with moorum and expansive soil samples showed slight improvement. The 7 mm by 7 mm and 20 mm by 7 mm sizes were effective in improving CBR values as compared to 35 mm by 7 mm size. Keywords: randomly distributed, medical waste, strip reinforcement, CBR, permeability
INTRODUCTION
Soil reinforcement is a major part of geotechnical practice. In recent times engineers have been investigating and proposing alternative reinforcing material ranging from steel, aluminum, fiber glass, polyester, polyamides and other synthetics in the form of meshes, sheets and strips. Modern society is generating huge qualities of solid waste which is a matter of growing environmental concern. With rapid industrialization, ever increasing rate of urbanization and enormous increase in population, management of solid waste has become an important and critical task. There has been enormous pressure on the construction industry to suggest suitable alternatives for natural resource which are consumed in construction. Research is being carried continuously to mitigate the solid waste disposal problem.
The use of soil reinforcement to improve strength and stability and to mitigate total and differential settlements of soil structures and foundations has become common practice in geotechnical engineering. Earth structures such as highway and airport pavements, embankments, landfills, foundation, earth slopes and retaining walls are built with soil reinforcement for improved safety against sliding or bearing failure and to improve the settlement response.
Reinforcement in soils can be introduced as discrete strips or planar elements or as randomly distributed fibers or strips, the latter being more effective than the former. One of the main
171
advantages of Randomly Distributed Fibers (RDF) is strength isotropy, homogeneity and the absence of potential planes of weakness that can develop parallel to the orientation of reinforcement. The function of soil reinforcement is for the development of bond between the soil and the reinforcement at the interface which restricts the movement of soil particles. This bond may be due to friction, adhesion or interlocking.
Addition of fibres to soil improves the latter’s overall engineering performance. Among the notable properties that improve are greater extensibility, smaller loss of post peak strength and absence of planes of weakness. Randomly distributed fibre reinforced soil is a composite material whose engineering behaviour is similar to that with traditional reinforced earth but resembles stabilization by admixtures such as cement, lime, etc. In the present investigation waste medical packing plastic strips with different aspect ratios are used as reinforcing material. These strips have adequate tensile strength and retain the same strength for a long span of time. The present investigation has been carried out to examine if such strips can effectively be used as in soils to improve subgrade strength for pavements.
LITERATURE REVIEW
The function of the soil reinforcement is based on the concept of development of tensile force as a result of bond resistance on the soil-reinforcement interface which restricts the movement of soil particles. This bond may be due to friction, adhesion, or interlocking. Hoare (1979) from the results of a series of laboratory CBR tests on soil reinforced with small amount of randomly distributed fibre that the presence of fibres increases the soil resistance to penetration. Typical assumptions of the distribution of randomly oriented fibers include: the fibers are deposited in a mass independent of each other; the fibers have an equal probability of occurrence in any portion of the composite mass; and the fibers have an equal probability of making all possible angles with any arbitrarily chosen fixed axis (Maher, 1990). Besson and Khire (1994) used cut pieces of HDPE waste milk bottles and shown that there is an increase in strength, CBR value and secant module of sand. Tingle et al. (2002) reported that geo-fibre stabilization of medium dense sand improves the CBR by about 6 times over that for unstabilized sand. The improvement can be attributed to the confinement of sand particles by discrete fibers. When geo-fibres are mixed into the sand, the fibers develop friction at interface points with the particles that resist rearrangement of particles under loading. Gosavi et al. (2003) from CBR test results on black cotton soil reinforced with jute fibre reported that the CBR value of jute fibre reinforced black cotton increased by 28 and 45 percentages due to addition of 2 percent fibre with aspect ratios of 25 and 50 respectively.
NEED OF THE INVESTIGATION
The pharmaceutical industry uses polythene/plastic strips to cover medicines, which upon disposal aggravate the problem of solid waste. Innovative construction technologies involving partial/full replacement of natural resources with relevant solid waste in construction is a step in mitigating afore mentioned problem. Hence, in the present investigation medical packing polythene strips is tried as an alternative for reinforcement of soils. Usage of such plastic waste will surely reduce the problem of solid waste disposal, albeit to a lesser extent. To meet the objectives of the present investigation, dry density, CBR and permeability coefficient values for sandy, moorum and expansive soils reinforced with different percentages of waste medical packing plastic strips in the form of discrete fibres are studied.
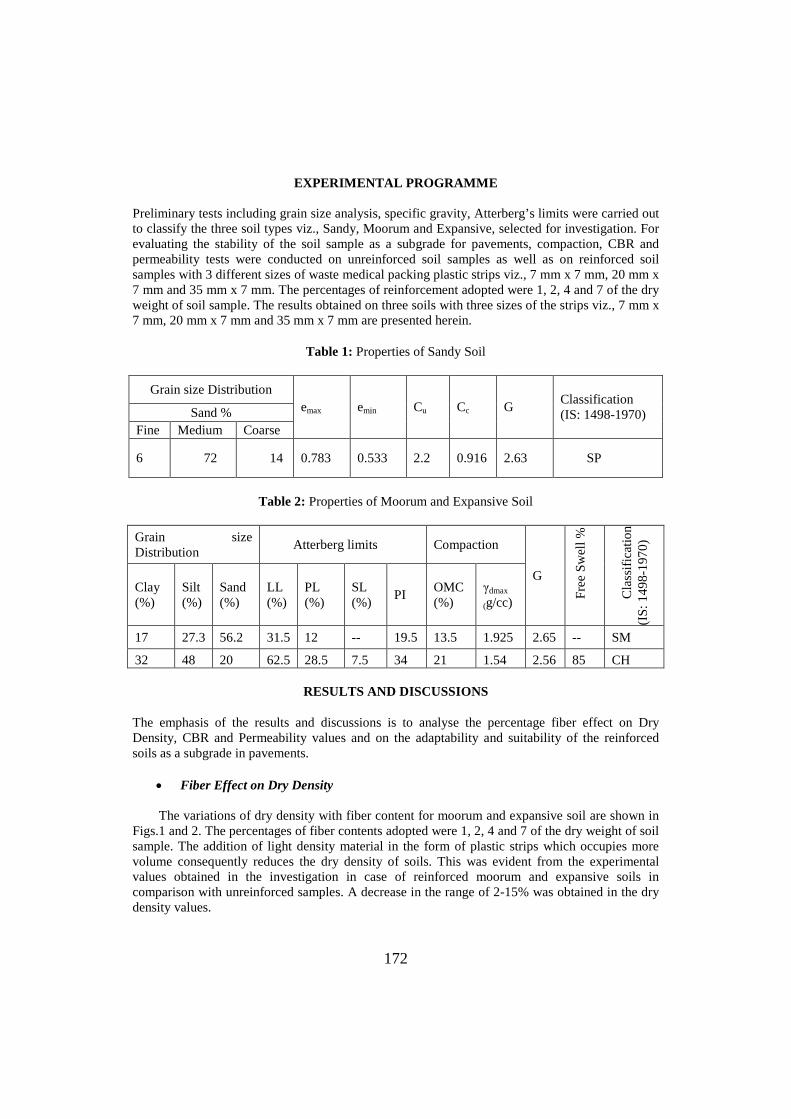
172
EXPERIMENTAL PROGRAMME
Preliminary tests including grain size analysis, specific gravity, Atterberg’s limits were carried out to classify the three soil types viz., Sandy, Moorum and Expansive, selected for investigation. For evaluating the stability of the soil sample as a subgrade for pavements, compaction, CBR and permeability tests were conducted on unreinforced soil samples as well as on reinforced soil samples with 3 different sizes of waste medical packing plastic strips viz., 7 mm x 7 mm, 20 mm x 7 mm and 35 mm x 7 mm. The percentages of reinforcement adopted were 1, 2, 4 and 7 of the dry weight of soil sample. The results obtained on three soils with three sizes of the strips viz., 7 mm x 7 mm, 20 mm x 7 mm and 35 mm x 7 mm are presented herein.
Table 1: Properties of Sandy Soil
Grain size Distribution emax emin Cu Cc G Classification
(IS: 1498-1970) Sand % Fine Medium Coarse
6 72 14 0.783 0.533 2.2 0.916 2.63 SP
Table 2: Properties of Moorum and Expansive Soil
Grain size Distribution Atterberg limits Compaction
G Fr
ee S
wel
l %
Cla
ssifi
catio
n (I
S: 1
498-
1970
)
Clay (%)
Silt (%)
Sand (%)
LL (%)
PL (%)
SL (%)
PI OMC (%)
γdmax
(g/cc)
17 27.3 56.2 31.5 12 -- 19.5 13.5 1.925 2.65 -- SM
32 48 20 62.5 28.5 7.5 34 21 1.54 2.56 85 CH
RESULTS AND DISCUSSIONS
The emphasis of the results and discussions is to analyse the percentage fiber effect on Dry Density, CBR and Permeability values and on the adaptability and suitability of the reinforced soils as a subgrade in pavements.
• Fiber Effect on Dry Density
The variations of dry density with fiber content for moorum and expansive soil are shown in Figs.1 and 2. The percentages of fiber contents adopted were 1, 2, 4 and 7 of the dry weight of soil sample. The addition of light density material in the form of plastic strips which occupies more volume consequently reduces the dry density of soils. This was evident from the experimental values obtained in the investigation in case of reinforced moorum and expansive soils in comparison with unreinforced samples. A decrease in the range of 2-15% was obtained in the dry density values.
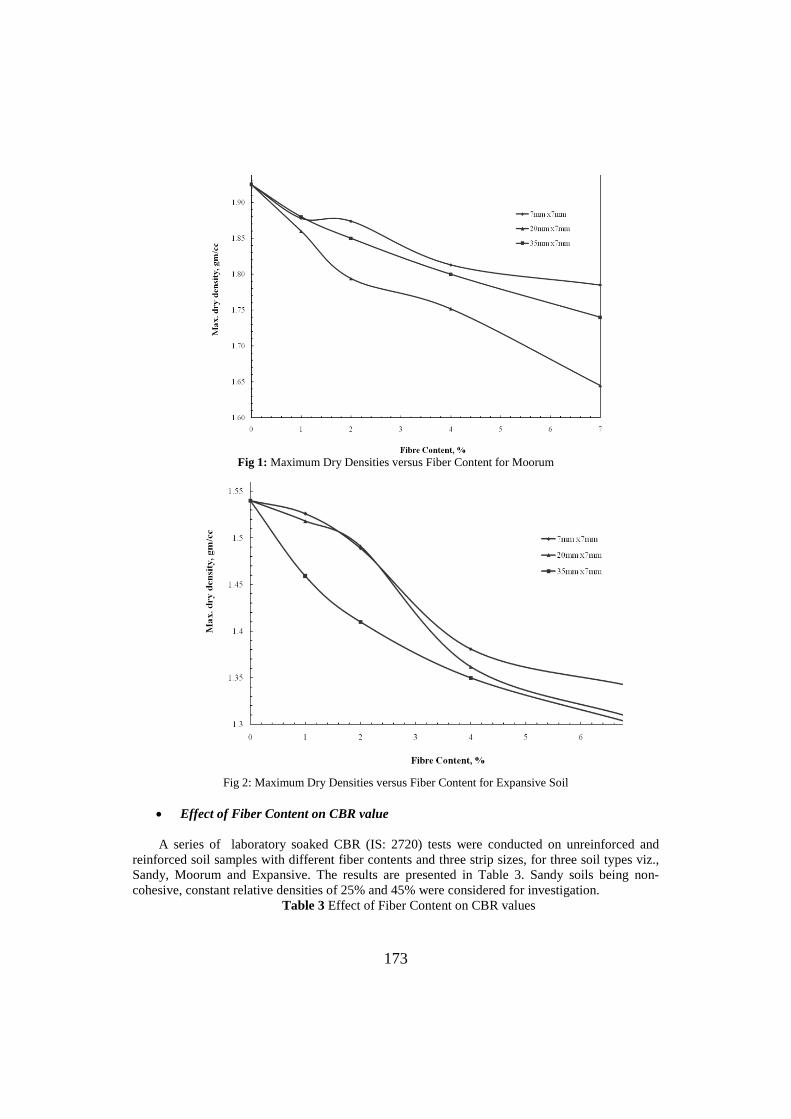
173
Fig 1: Maximum Dry Densities versus Fiber Content for Moorum
Fig 2: Maximum Dry Densities versus Fiber Content for Expansive Soil
• Effect of Fiber Content on CBR value
A series of laboratory soaked CBR (IS: 2720) tests were conducted on unreinforced and reinforced soil samples with different fiber contents and three strip sizes, for three soil types viz., Sandy, Moorum and Expansive. The results are presented in Table 3. Sandy soils being non-cohesive, constant relative densities of 25% and 45% were considered for investigation.
Table 3 Effect of Fiber Content on CBR values
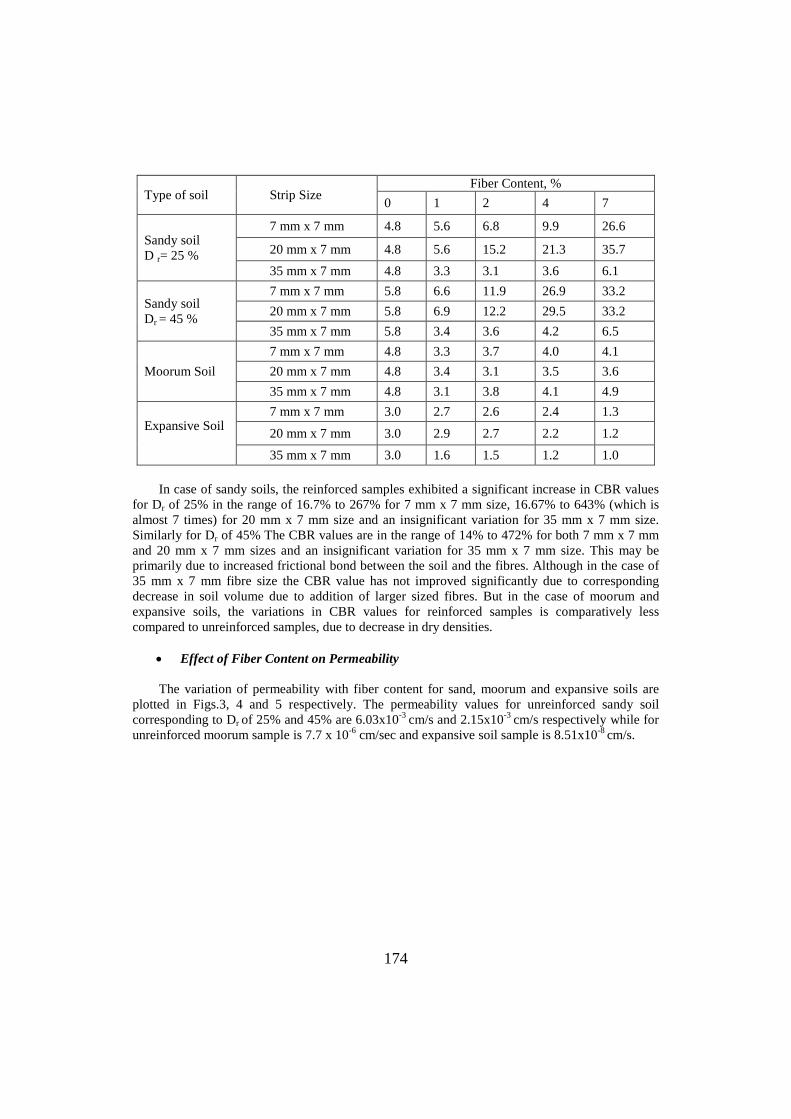
174
Type of soil Strip Size Fiber Content, %
0 1 2 4 7
Sandy soil D r= 25 %
7 mm x 7 mm 4.8 5.6 6.8 9.9 26.6
20 mm x 7 mm 4.8 5.6 15.2 21.3 35.7 35 mm x 7 mm 4.8 3.3 3.1 3.6 6.1
Sandy soil Dr = 45 %
7 mm x 7 mm 5.8 6.6 11.9 26.9 33.2 20 mm x 7 mm 5.8 6.9 12.2 29.5 33.2 35 mm x 7 mm 5.8 3.4 3.6 4.2 6.5
Moorum Soil 7 mm x 7 mm 4.8 3.3 3.7 4.0 4.1 20 mm x 7 mm 4.8 3.4 3.1 3.5 3.6 35 mm x 7 mm 4.8 3.1 3.8 4.1 4.9
Expansive Soil
7 mm x 7 mm 3.0 2.7 2.6 2.4 1.3
20 mm x 7 mm 3.0 2.9 2.7 2.2 1.2 35 mm x 7 mm 3.0 1.6 1.5 1.2 1.0
In case of sandy soils, the reinforced samples exhibited a significant increase in CBR values for Dr of 25% in the range of 16.7% to 267% for 7 mm x 7 mm size, 16.67% to 643% (which is almost 7 times) for 20 mm x 7 mm size and an insignificant variation for 35 mm x 7 mm size. Similarly for Dr of 45% The CBR values are in the range of 14% to 472% for both 7 mm x 7 mm and 20 mm x 7 mm sizes and an insignificant variation for 35 mm x 7 mm size. This may be primarily due to increased frictional bond between the soil and the fibres. Although in the case of 35 mm x 7 mm fibre size the CBR value has not improved significantly due to corresponding decrease in soil volume due to addition of larger sized fibres. But in the case of moorum and expansive soils, the variations in CBR values for reinforced samples is comparatively less compared to unreinforced samples, due to decrease in dry densities.
• Effect of Fiber Content on Permeability The variation of permeability with fiber content for sand, moorum and expansive soils are
plotted in Figs.3, 4 and 5 respectively. The permeability values for unreinforced sandy soil corresponding to Dr of 25% and 45% are 6.03x10⁻³ cm/s and 2.15x10⁻³ cm/s respectively while for unreinforced moorum sample is 7.7 x 10⁻⁶ cm/sec and expansive soil sample is 8.51x10⁻⁸ cm/s.
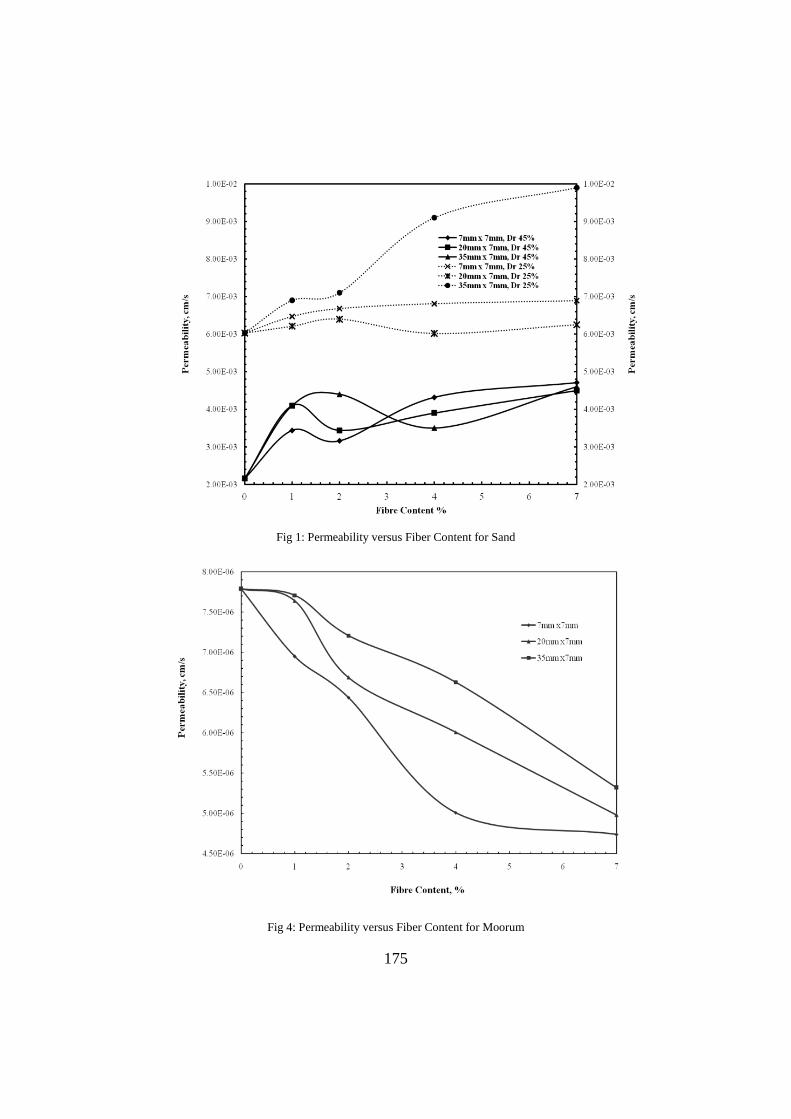
175
Fig 1: Permeability versus Fiber Content for Sand
Fig 4: Permeability versus Fiber Content for Moorum
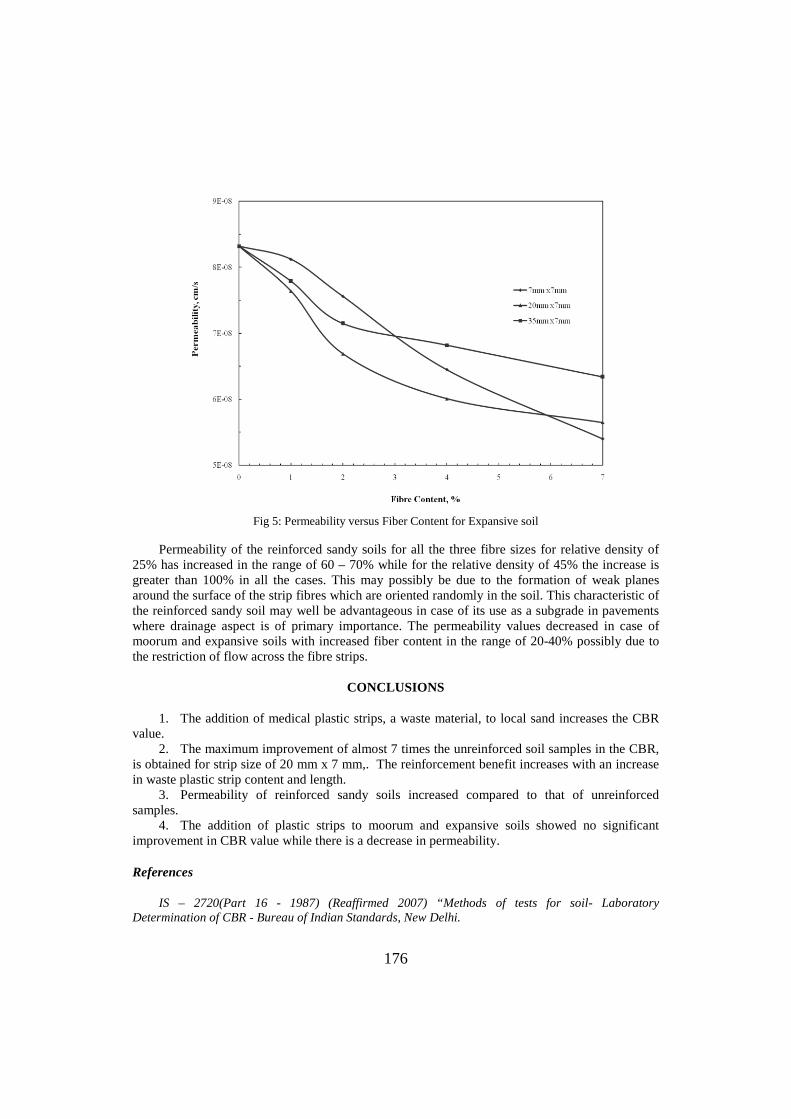
176
Fig 5: Permeability versus Fiber Content for Expansive soil
Permeability of the reinforced sandy soils for all the three fibre sizes for relative density of
25% has increased in the range of 60 – 70% while for the relative density of 45% the increase is greater than 100% in all the cases. This may possibly be due to the formation of weak planes around the surface of the strip fibres which are oriented randomly in the soil. This characteristic of the reinforced sandy soil may well be advantageous in case of its use as a subgrade in pavements where drainage aspect is of primary importance. The permeability values decreased in case of moorum and expansive soils with increased fiber content in the range of 20-40% possibly due to the restriction of flow across the fibre strips.
CONCLUSIONS
1. The addition of medical plastic strips, a waste material, to local sand increases the CBR value.
2. The maximum improvement of almost 7 times the unreinforced soil samples in the CBR, is obtained for strip size of 20 mm x 7 mm,. The reinforcement benefit increases with an increase in waste plastic strip content and length.
3. Permeability of reinforced sandy soils increased compared to that of unreinforced samples.
4. The addition of plastic strips to moorum and expansive soils showed no significant improvement in CBR value while there is a decrease in permeability.
References
IS – 2720(Part 16 - 1987) (Reaffirmed 2007) “Methods of tests for soil- Laboratory Determination of CBR - Bureau of Indian Standards, New Delhi.
177
Arvind Kumar, Singh D.P. & Varun Bajaj, (2008). “Strengthening of soil by randomly distributed
fibre inclusions”, Journal of Indian Highways, (6), 21-26. Benson, C.H. & Khire, M.U. (1994) “Reinforcing sand with strips of high-density polyethylene”.
Journal of Geotechnical Engineering, 121(4), 838-855. Gosavi, K.A.Patil, S.Mittal & S.Saran (2005). “Improvement of properties of Black cotton soil
subgrade through synthetic Reinforcement”, (84), IE (I), Journal cv,. 257-26. Gopal Ranjan & Charan, H.D. (1998). “Randomly Distributed Fibers Reinforced soil – The state
of art”. Journal of the Institution of Engineers. (79), 91-100. Hoare, D.J. (1979). “Laboratory Study of Granular Soil Reinforced with Randomly Oriented
Discrete Fibers”, Proceedings of International Conference on the Use of Fabrics in Geotechnics, (1), 47- 52.
Venkatappa Rao, G. and Dutta, R.K. (2004) “Sand Plastic Mixtures in Ground Improvement”. Int. Conf. on Geosynthetics and Geoenvirosnmental Engineering 121(4), 838-855.
178
IMPROVEMENT OF SOIL SWELLING POTENTIAL USING FLY ASH AND
RICE HUSK ASH
Aditya Kumar Anupam, Praveen Kumar and Ransinchung R.N. Transportation Engineering Group, Indian Institute of Technology Roorkee, Uttarakhand, India
Abstract: Free swell index (FSI) test is commonly used for identifying expansive clays and to predict the swelling potential. Free swell of soil helps to identify the potential of a soil to swell which might need further detailed investigation regarding swelling and swelling pressures under different field conditions. The expansion ratio (ER) is also used to qualitatively identify the potential expansiveness of the soil. This swelling test is conducted during California bearing ratio (CBR) test. The objective of this study is to propose the method to control the swelling behavior of the expansive soil. For this an extensive laboratory program was conducted to control swell potential of clayey soil by different waste materials as fly ash (FA) and rice husk ash (RHA).
INTRODUCTION Expansive soils are spread throughout India in about 51.8 million hectares of the land area. Indian clayey soils can be problematic for direct utilization of subgrade construction. Clayey soil applies to soils that have the tendency to swell when their moisture content is increased. They have been found to cause detrimental damage to structures founded on them because of their innate potential to react to the changes in moisture regime. Soils containing the clay mineral montmorillonite generally exhibit these properties.
Nominal research has been done in India to determine the availability of feasible waste materials and the suitability of these materials for Indian roads. Yet the use of wastes would benefit the road sector by providing it with a cheap source of material and, in some cases, road construction companies may be able to charge a fee for suitably using waste materials that would otherwise require expensive treatment for disposal.
The aim of this study is to use the waste material fly ash (FA) and rice husk ash (RHA) to improve the swelling potential of soil subgrade material. For this the swelling characteristic, namely expansion ratio (ER), of expansive soil was measured during the CBR test. The ER is used to qualitatively identify the potential expansiveness of the soil (IS: 2720 (Part 16)–1987). Free swell index (FSI) test was also conducted to predict the swelling potential of the admixed soils (IS: 2720 (Part XL)–1977). The most important reason for using subgrade soil with FA and RHA is economy and waste utilization. Additionally, these materials may continue to increase its strength for a long time due to pozzolanic reactivity. Also this type of treatment has environmental benefits such as the reduction in water, air, and waste lands pollution. Although FA in India is a commercial product, it is known as a no-cost, industrial byproduct. RHA is also an industrial waste which is available in abundant.
PAST STUDIES ON SOIL EXPANSIVENESS
179
Several laboratory methods have been developed to determine the swelling of soil as it undergoes moisture content changes. These include FSI, ER (during CBR test), expansion index potential volume change (PVC), and coefficient of linear extensibility (COLE). The free swell is determined by comparing the initial volume with the final volume. Bentonite swells between 1200 to 2000%. Soils having free swell values greater than 100% are considered potential problems, whereas soils with free swell values below 50% probably do not exhibit appreciable volume changes. Potential volume change of expansive soils in the western U.S. has been linked to clay content and plasticity index (Holtz and Gibbs, 1956). Mohan and Goel (1959) classified the degree of expansiveness of soil based on FSI as shown in Table 1.
Table 1: Degree of expansion based on free swell index
Liquid limit (%)
Plasticity index (%) Free swell index (%)
Degree of expansion
Degree of severity
70–90 >32 >200 Very high Severe 50–70 23–32 100–200 High Critical 35–50 12–23 50–100 Medium Marginal 20–35 <12 <50 Low Non critical
Source: Mohan and Goel (1959)
Williams and Donaldson (1980) classified the degree of expansiveness considering plasticity index which is given by Eq. (1) and is presented in Table 2. PIws = PI of soil passing 425 μm sieve × (mass of soil passing 425 μm sieve/mass of whole sample) (1)
Table2: Degree of expansiveness based on plasticity index of whole sample
PI Degree of expansiveness >32 Very high
24–32 High 12–24 Medium <12 Low
Source: Williams and Donaldson (1980)
Franzmeier and Ross (1968) observed that soils having equal amounts of kaolinite and montmorillonite behaved like montmorillonitic soils whereas soils with appreciable amounts of montmorillonite had wide ranges in swelling potentials. Swell potential of montmorillonitic soils in southern Ontario are correlated with clay content and specific surface area (SSA) where SSA explained more of the variability in shrink swell potential than did clay content (Ross, 1978). Harishkumar, K. and Muthukkumaran, K. (2010) investigated the swelling properties of bentonite by swelling pressure and FSI. The result estimated FSI as 399% and the maximum swell pressure after 6 day was 23kN/m2. They controled the swell of bentonite by using combination of different techniques like stabilized stone column and Geotextiles/Geomemberane.
METHODOLOGY Clay of medium compressibility (A-7-6) soil is used for this study. The ER of the selected soil was measured during the CBR test (Anupam, A. K. et al. 2012), when prepared CBR mould along with surcharge weight was immersed in a tank of water allowing free access of water to the top and bottom of the specimen for 96 hours. The tripod for the expansion measuring device was mounted
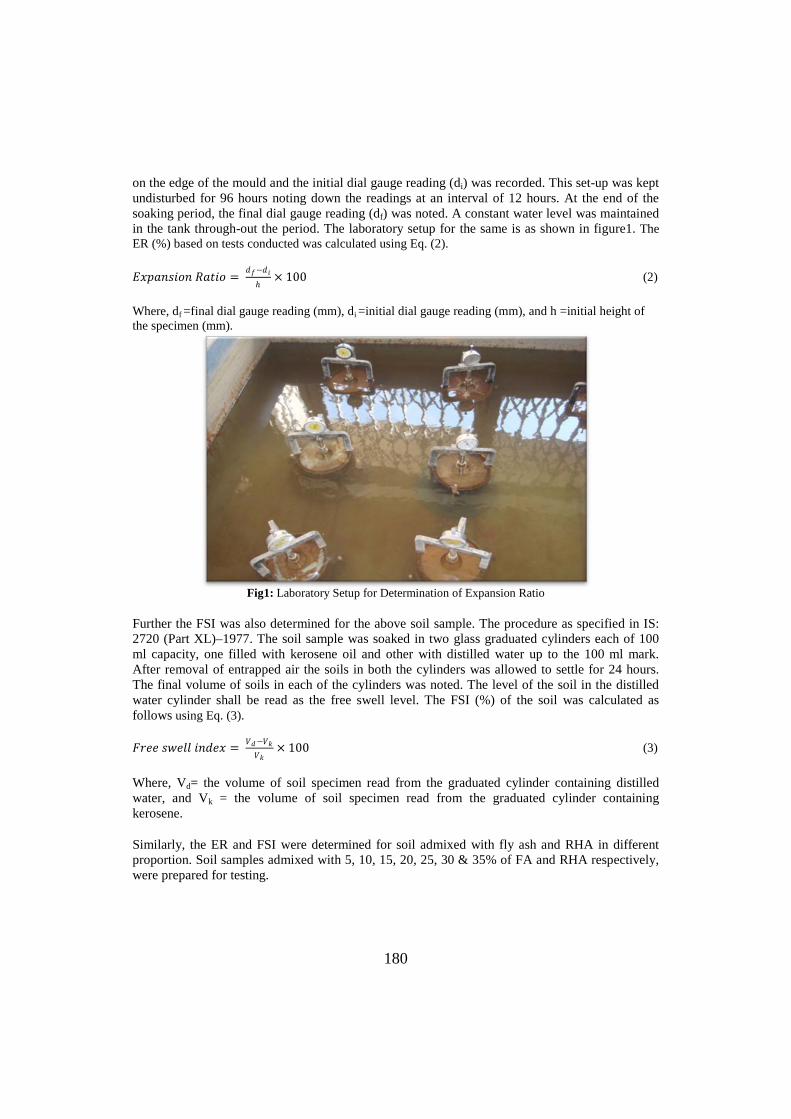
180
on the edge of the mould and the initial dial gauge reading (di) was recorded. This set-up was kept undisturbed for 96 hours noting down the readings at an interval of 12 hours. At the end of the soaking period, the final dial gauge reading (df) was noted. A constant water level was maintained in the tank through-out the period. The laboratory setup for the same is as shown in figure1. The ER (%) based on tests conducted was calculated using Eq. (2). 𝐸𝐸𝐸𝐸𝐸𝐸𝐸𝐸𝐸𝐸𝐸𝐸𝐸𝐸𝐸𝐸𝐸𝐸 𝑅𝑅𝐸𝐸𝑅𝑅𝐸𝐸𝐸𝐸 = 𝑑𝑑𝑓𝑓−𝑑𝑑𝐸𝐸
ℎ× 100 (2)
Where, df =final dial gauge reading (mm), di =initial dial gauge reading (mm), and h =initial height of the specimen (mm).
Fig1: Laboratory Setup for Determination of Expansion Ratio
Further the FSI was also determined for the above soil sample. The procedure as specified in IS: 2720 (Part XL)–1977. The soil sample was soaked in two glass graduated cylinders each of 100 ml capacity, one filled with kerosene oil and other with distilled water up to the 100 ml mark. After removal of entrapped air the soils in both the cylinders was allowed to settle for 24 hours. The final volume of soils in each of the cylinders was noted. The level of the soil in the distilled water cylinder shall be read as the free swell level. The FSI (%) of the soil was calculated as follows using Eq. (3). 𝐹𝐹𝐹𝐹𝐹𝐹𝐹𝐹 𝐸𝐸𝑠𝑠𝐹𝐹𝑠𝑠𝑠𝑠 𝐸𝐸𝐸𝐸𝑑𝑑𝐹𝐹𝐸𝐸 = 𝑉𝑉𝑑𝑑−𝑉𝑉𝑘𝑘
𝑉𝑉𝑘𝑘× 100 (3)
Where, Vd= the volume of soil specimen read from the graduated cylinder containing distilled water, and Vk = the volume of soil specimen read from the graduated cylinder containing kerosene.
Similarly, the ER and FSI were determined for soil admixed with fly ash and RHA in different proportion. Soil samples admixed with 5, 10, 15, 20, 25, 30 & 35% of FA and RHA respectively, were prepared for testing.
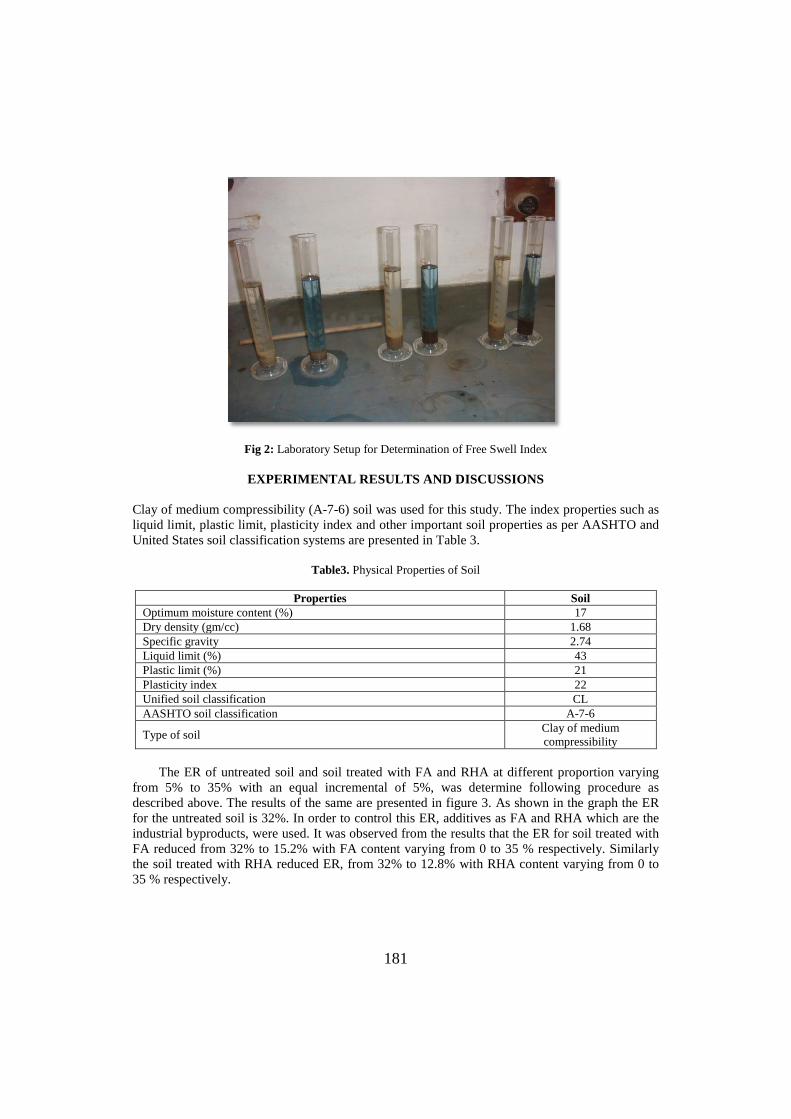
181
Fig 2: Laboratory Setup for Determination of Free Swell Index
EXPERIMENTAL RESULTS AND DISCUSSIONS Clay of medium compressibility (A-7-6) soil was used for this study. The index properties such as liquid limit, plastic limit, plasticity index and other important soil properties as per AASHTO and United States soil classification systems are presented in Table 3.
Table3. Physical Properties of Soil
Properties Soil Optimum moisture content (%) 17 Dry density (gm/cc) 1.68 Specific gravity 2.74 Liquid limit (%) 43 Plastic limit (%) 21 Plasticity index 22 Unified soil classification CL AASHTO soil classification A-7-6
Type of soil Clay of medium compressibility
The ER of untreated soil and soil treated with FA and RHA at different proportion varying
from 5% to 35% with an equal incremental of 5%, was determine following procedure as described above. The results of the same are presented in figure 3. As shown in the graph the ER for the untreated soil is 32%. In order to control this ER, additives as FA and RHA which are the industrial byproducts, were used. It was observed from the results that the ER for soil treated with FA reduced from 32% to 15.2% with FA content varying from 0 to 35 % respectively. Similarly the soil treated with RHA reduced ER, from 32% to 12.8% with RHA content varying from 0 to 35 % respectively.
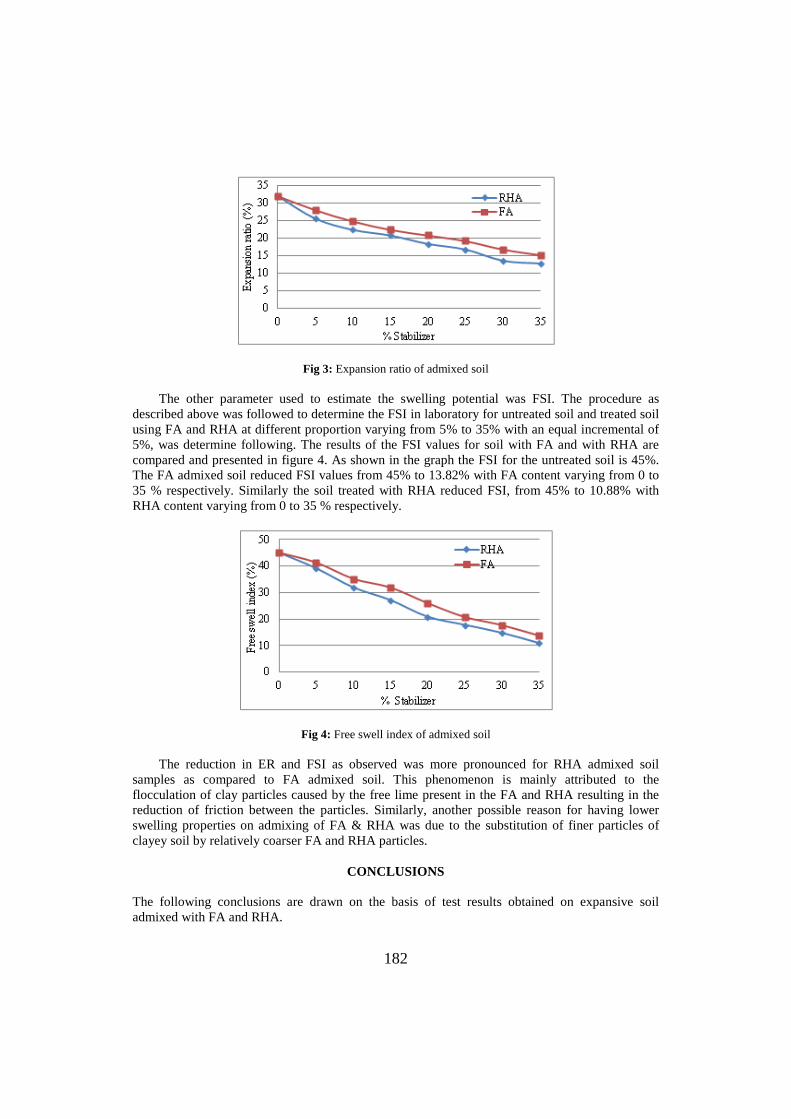
182
Fig 3: Expansion ratio of admixed soil
The other parameter used to estimate the swelling potential was FSI. The procedure as described above was followed to determine the FSI in laboratory for untreated soil and treated soil using FA and RHA at different proportion varying from 5% to 35% with an equal incremental of 5%, was determine following. The results of the FSI values for soil with FA and with RHA are compared and presented in figure 4. As shown in the graph the FSI for the untreated soil is 45%. The FA admixed soil reduced FSI values from 45% to 13.82% with FA content varying from 0 to 35 % respectively. Similarly the soil treated with RHA reduced FSI, from 45% to 10.88% with RHA content varying from 0 to 35 % respectively.
Fig 4: Free swell index of admixed soil
The reduction in ER and FSI as observed was more pronounced for RHA admixed soil samples as compared to FA admixed soil. This phenomenon is mainly attributed to the flocculation of clay particles caused by the free lime present in the FA and RHA resulting in the reduction of friction between the particles. Similarly, another possible reason for having lower swelling properties on admixing of FA & RHA was due to the substitution of finer particles of clayey soil by relatively coarser FA and RHA particles.
CONCLUSIONS The following conclusions are drawn on the basis of test results obtained on expansive soil admixed with FA and RHA.
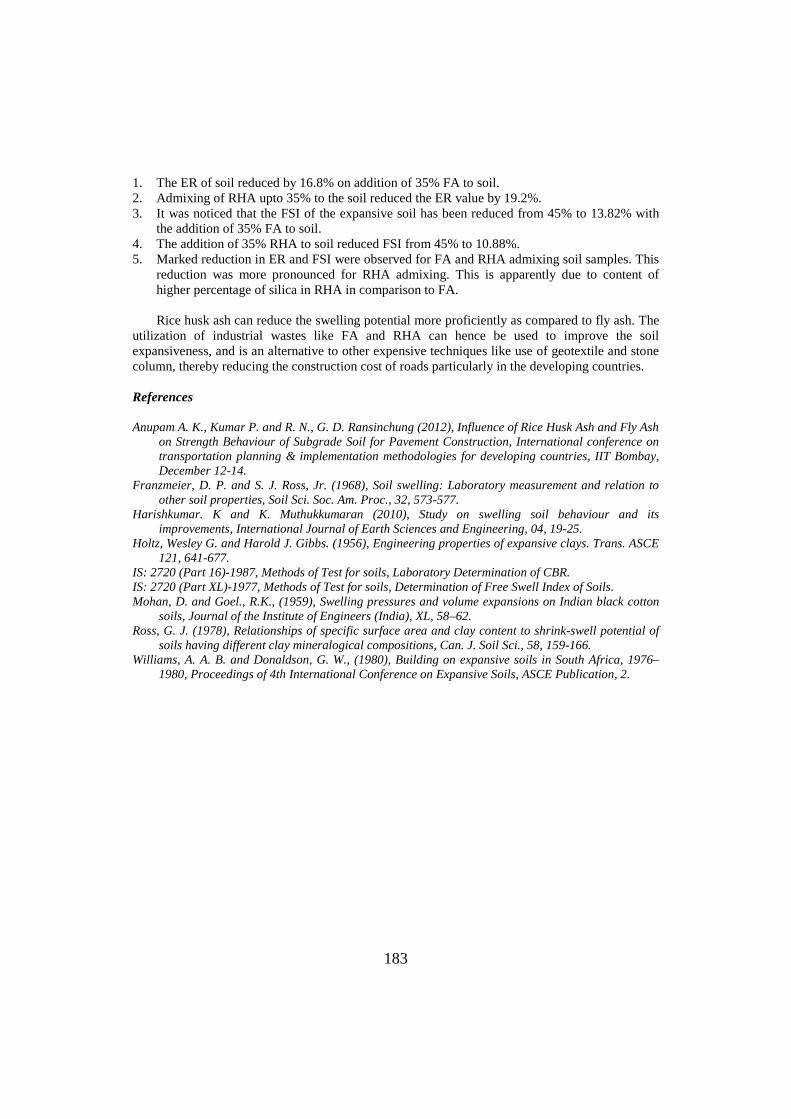
183
1. The ER of soil reduced by 16.8% on addition of 35% FA to soil. 2. Admixing of RHA upto 35% to the soil reduced the ER value by 19.2%. 3. It was noticed that the FSI of the expansive soil has been reduced from 45% to 13.82% with
the addition of 35% FA to soil. 4. The addition of 35% RHA to soil reduced FSI from 45% to 10.88%. 5. Marked reduction in ER and FSI were observed for FA and RHA admixing soil samples. This
reduction was more pronounced for RHA admixing. This is apparently due to content of higher percentage of silica in RHA in comparison to FA. Rice husk ash can reduce the swelling potential more proficiently as compared to fly ash. The
utilization of industrial wastes like FA and RHA can hence be used to improve the soil expansiveness, and is an alternative to other expensive techniques like use of geotextile and stone column, thereby reducing the construction cost of roads particularly in the developing countries. References
Anupam A. K., Kumar P. and R. N., G. D. Ransinchung (2012), Influence of Rice Husk Ash and Fly Ash
on Strength Behaviour of Subgrade Soil for Pavement Construction, International conference on transportation planning & implementation methodologies for developing countries, IIT Bombay, December 12-14.
Franzmeier, D. P. and S. J. Ross, Jr. (1968), Soil swelling: Laboratory measurement and relation to other soil properties, Soil Sci. Soc. Am. Proc., 32, 573-577.
Harishkumar. K and K. Muthukkumaran (2010), Study on swelling soil behaviour and its improvements, International Journal of Earth Sciences and Engineering, 04, 19-25.
Holtz, Wesley G. and Harold J. Gibbs. (1956), Engineering properties of expansive clays. Trans. ASCE 121, 641-677.
IS: 2720 (Part 16)-1987, Methods of Test for soils, Laboratory Determination of CBR. IS: 2720 (Part XL)-1977, Methods of Test for soils, Determination of Free Swell Index of Soils. Mohan, D. and Goel., R.K., (1959), Swelling pressures and volume expansions on Indian black cotton
soils, Journal of the Institute of Engineers (India), XL, 58–62. Ross, G. J. (1978), Relationships of specific surface area and clay content to shrink-swell potential of
soils having different clay mineralogical compositions, Can. J. Soil Sci., 58, 159-166. Williams, A. A. B. and Donaldson, G. W., (1980), Building on expansive soils in South Africa, 1976–
1980, Proceedings of 4th International Conference on Expansive Soils, ASCE Publication, 2.
184
USE OF FLY ASH FOR MODIFICATION OF CLAYEY SUBGRADE
P. Padhy, M. Panda and U. Chattaraj Department of Civil Engineering, National Institute of Technology, Rourkela, India
Abstract: The production of fly ash in India is likely to be more than 175 million tons by the year 2012. As the need of power is increasing with a very fast rate for development purpose, the production of fly ash is increasing rapidly while generating electrical energy by thermal power plant. Though due to lot of efforts by State and Central Government the utilization of fly ash has gone beyond 50%, still a lot has to be done for full utilization of this precious wealth from the waste. In our country, only a small percentage is used for the construction of technical projects while the rest is stockpiled causing serious problems. Because of its large availability and its low cost, further possibility of its usage should be investigated. Soil stabilization has become the major issue in construction engineering and the researches regarding the effectiveness of using industrial wastes as a stabilizer are rapidly increasing. This paper briefly describes the suitability of fly ash to be used for modification of expansive soil such as clay for subgrade in paving applications.
INTRODUCTION Fly ash is a major producer of carbon dioxide and thereby decreasing green house gas emissions. One ton of Portland cement production discharges 0.87 ton of Carbon dioxide to the environment. Utilization of fly ash minimizes the Carbon dioxide emission problem to the extent of its proportion in cement. However the basic fundamental principle of sustainable development is to reduce, reuse and recycle. Much attention has been focused in recent years on conserving natural resources and energy. Numerous waste products and/or byproducts from various industrial and commercial processes, normally deposited in landfills, have been proposed for use as alternate construction materials.
Fly ash is a siliceous, or siliceous and aluminous, material which in itself possesses little or no cementitious value but available in finely divided form which in the presence of moisture, chemically react with calcium hydroxide at ordinary temperatures to form compounds possessing cementitious properties. It is a valuable resource / raw material for a number of high volume and high value added applications primarily because of its pozzolanic characteristics.
FLY ASH UTILIZATION: INDIAN SCENARIO The Government of India launched the ‘Fly Ash Mission’, under the TIFAC Mode in1994 towards promoting safe disposal and utilization of Fly Ash in the country. In addition, there are several other agencies (Government, Private, Public sector, NGOs) which have been working towards management of Fly Ash disposal & utilization. These include Ministry of Environment & Forests (MoEF), Ministry of Urban Development, Department of Science & Technology (DST), National Thermal Power Corporation (NTPC), CSIR Laboratories, Engineering Institutes, IITs, State Electricity Boards etc. Ministry of Environment and Forests (MoEF) issued a notification on 14th September1999 (amended in 2003), which made the use of Ash mandatory within a radius of
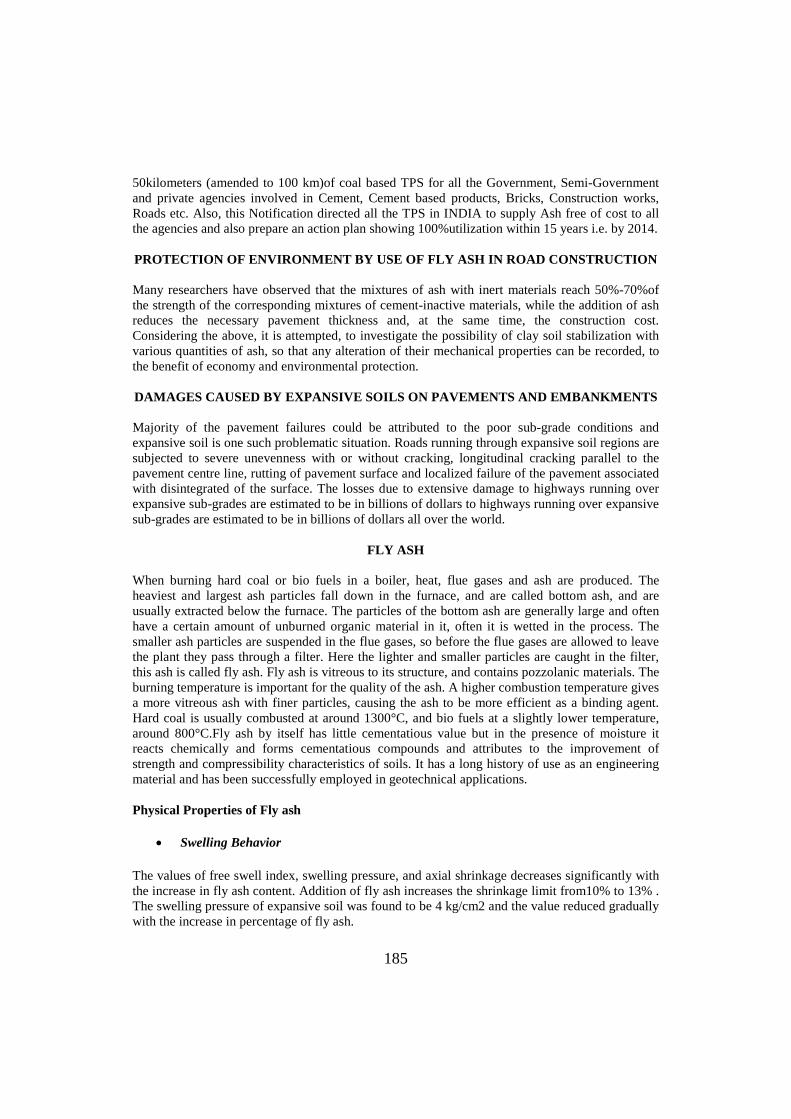
185
50kilometers (amended to 100 km)of coal based TPS for all the Government, Semi-Government and private agencies involved in Cement, Cement based products, Bricks, Construction works, Roads etc. Also, this Notification directed all the TPS in INDIA to supply Ash free of cost to all the agencies and also prepare an action plan showing 100%utilization within 15 years i.e. by 2014. PROTECTION OF ENVIRONMENT BY USE OF FLY ASH IN ROAD CONSTRUCTION Many researchers have observed that the mixtures of ash with inert materials reach 50%-70%of the strength of the corresponding mixtures of cement-inactive materials, while the addition of ash reduces the necessary pavement thickness and, at the same time, the construction cost. Considering the above, it is attempted, to investigate the possibility of clay soil stabilization with various quantities of ash, so that any alteration of their mechanical properties can be recorded, to the benefit of economy and environmental protection. DAMAGES CAUSED BY EXPANSIVE SOILS ON PAVEMENTS AND EMBANKMENTS Majority of the pavement failures could be attributed to the poor sub-grade conditions and expansive soil is one such problematic situation. Roads running through expansive soil regions are subjected to severe unevenness with or without cracking, longitudinal cracking parallel to the pavement centre line, rutting of pavement surface and localized failure of the pavement associated with disintegrated of the surface. The losses due to extensive damage to highways running over expansive sub-grades are estimated to be in billions of dollars to highways running over expansive sub-grades are estimated to be in billions of dollars all over the world.
FLY ASH When burning hard coal or bio fuels in a boiler, heat, flue gases and ash are produced. The heaviest and largest ash particles fall down in the furnace, and are called bottom ash, and are usually extracted below the furnace. The particles of the bottom ash are generally large and often have a certain amount of unburned organic material in it, often it is wetted in the process. The smaller ash particles are suspended in the flue gases, so before the flue gases are allowed to leave the plant they pass through a filter. Here the lighter and smaller particles are caught in the filter, this ash is called fly ash. Fly ash is vitreous to its structure, and contains pozzolanic materials. The burning temperature is important for the quality of the ash. A higher combustion temperature gives a more vitreous ash with finer particles, causing the ash to be more efficient as a binding agent. Hard coal is usually combusted at around 1300°C, and bio fuels at a slightly lower temperature, around 800°C.Fly ash by itself has little cementatious value but in the presence of moisture it reacts chemically and forms cementatious compounds and attributes to the improvement of strength and compressibility characteristics of soils. It has a long history of use as an engineering material and has been successfully employed in geotechnical applications. Physical Properties of Fly ash
• Swelling Behavior
The values of free swell index, swelling pressure, and axial shrinkage decreases significantly with the increase in fly ash content. Addition of fly ash increases the shrinkage limit from10% to 13% . The swelling pressure of expansive soil was found to be 4 kg/cm2 and the value reduced gradually with the increase in percentage of fly ash.
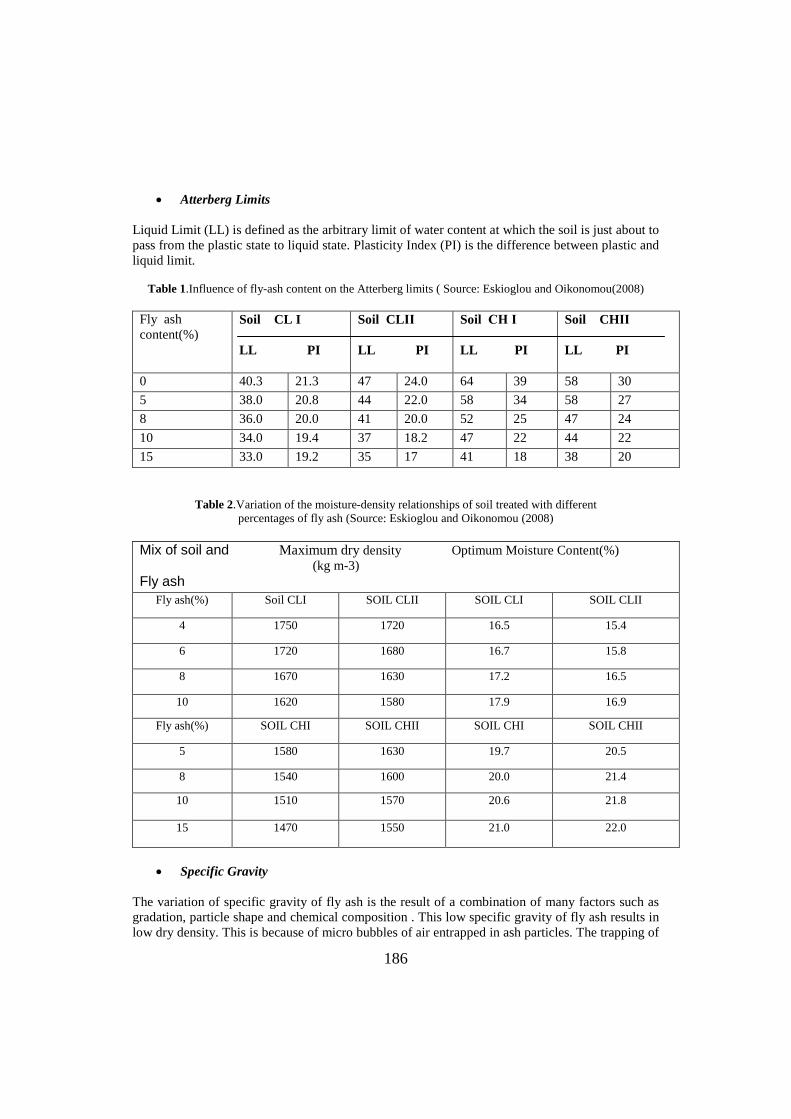
186
• Atterberg Limits
Liquid Limit (LL) is defined as the arbitrary limit of water content at which the soil is just about to pass from the plastic state to liquid state. Plasticity Index (PI) is the difference between plastic and liquid limit.
Table 1.Influence of fly-ash content on the Atterberg limits ( Source: Eskioglou and Oikonomou(2008)
Fly ash content(%)
Soil CL I LL PI
Soil CLΙΙ LL PI
Soil CH Ι LL PI
Soil CHΙΙ LL PI
0 40.3 21.3 47 24.0 64 39 58 30 5 38.0 20.8 44 22.0 58 34 58 27 8 36.0 20.0 41 20.0 52 25 47 24 10 34.0 19.4 37 18.2 47 22 44 22 15 33.0 19.2 35 17 41 18 38 20
Table 2.Variation of the moisture-density relationships of soil treated with different percentages of fly ash (Source: Eskioglou and Oikonomou (2008)
Mix of soil and Maximum dry density Optimum Moisture Content(%) (kg m-3) Fly ash
Fly ash(%) Soil CLI SOIL CLII SOIL CLI SOIL CLII
4 1750 1720 16.5 15.4
6 1720 1680 16.7 15.8
8 1670 1630 17.2 16.5
10 1620 1580 17.9 16.9
Fly ash(%) SOIL CHI SOIL CHII SOIL CHI SOIL CHII
5 1580 1630 19.7 20.5
8 1540 1600 20.0 21.4
10 1510 1570 20.6 21.8
15 1470 1550 21.0 22.0
• Specific Gravity
The variation of specific gravity of fly ash is the result of a combination of many factors such as gradation, particle shape and chemical composition . This low specific gravity of fly ash results in low dry density. This is because of micro bubbles of air entrapped in ash particles. The trapping of
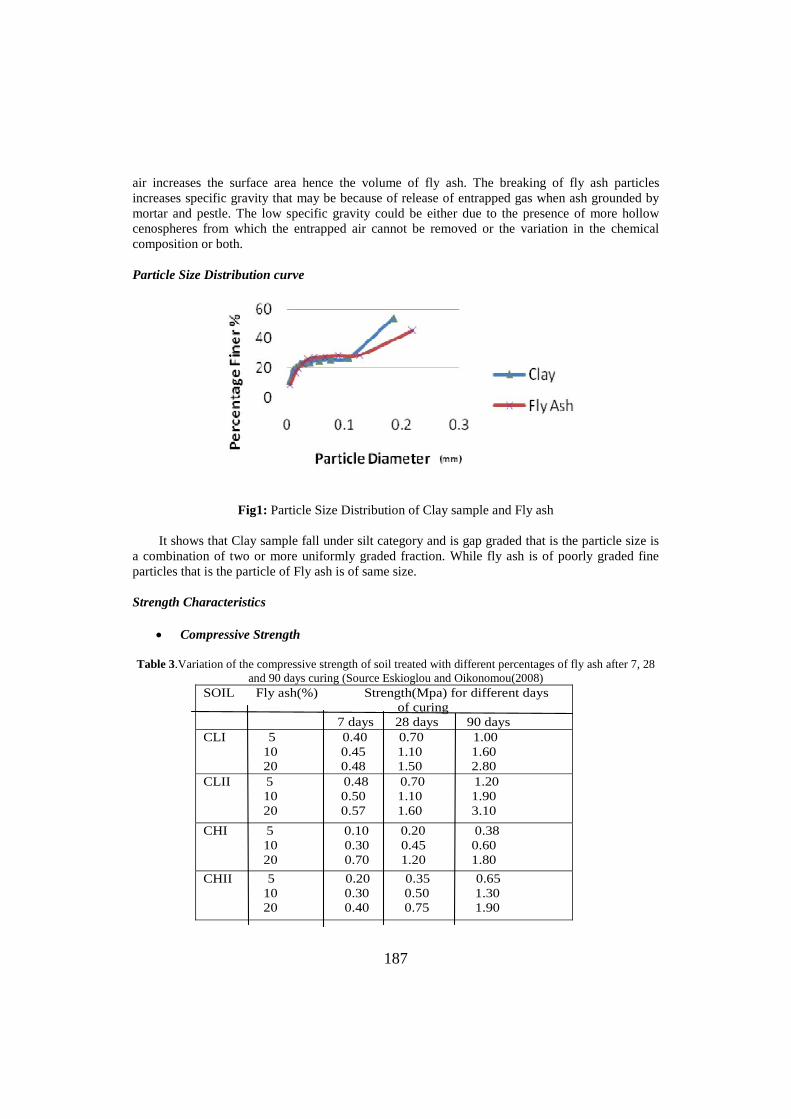
187
air increases the surface area hence the volume of fly ash. The breaking of fly ash particles increases specific gravity that may be because of release of entrapped gas when ash grounded by mortar and pestle. The low specific gravity could be either due to the presence of more hollow cenospheres from which the entrapped air cannot be removed or the variation in the chemical composition or both. Particle Size Distribution curve
Fig1: Particle Size Distribution of Clay sample and Fly ash
It shows that Clay sample fall under silt category and is gap graded that is the particle size is a combination of two or more uniformly graded fraction. While fly ash is of poorly graded fine particles that is the particle of Fly ash is of same size. Strength Characteristics
• Compressive Strength
Table 3.Variation of the compressive strength of soil treated with different percentages of fly ash after 7, 28 and 90 days curing (Source Eskioglou and Oikonomou(2008)
SOIL Fly ash(%) Strength(Mpa) for different days of curing 7 days 28 days 90 days CLI 5 0.40 0.70 1.00 10 0.45 1.10 1.60 20 0.48 1.50 2.80 CLII 5 0.48 0.70 1.20 10 0.50 1.10 1.90 20 0.57 1.60 3.10 CHI 5 0.10 0.20 0.38 10 0.30 0.45 0.60 20 0.70 1.20 1.80 CHII 5 0.20 0.35 0.65 10 0.30 0.50 1.30 20 0.40 0.75 1.90
188
• CBR Test
Fig2: Variation of CBR with different percentage of fly ash (Source: Bose2012)
• Unconfined Compressive Strength Test
Fig3: Unconfined Compressive strength with different percentage of fly ash (Source: Sen et al., (2011)
• Stress Strain Characteristics
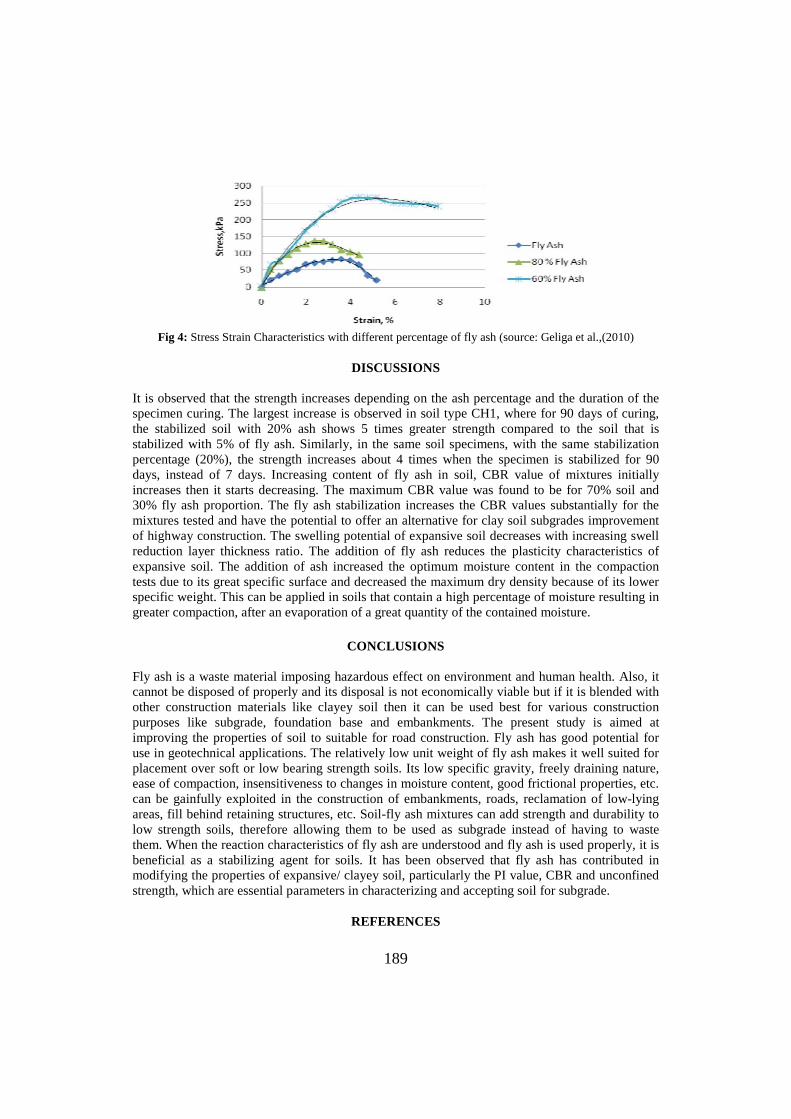
189
Fig 4: Stress Strain Characteristics with different percentage of fly ash (source: Geliga et al.,(2010)
DISCUSSIONS It is observed that the strength increases depending on the ash percentage and the duration of the specimen curing. The largest increase is observed in soil type CH1, where for 90 days of curing, the stabilized soil with 20% ash shows 5 times greater strength compared to the soil that is stabilized with 5% of fly ash. Similarly, in the same soil specimens, with the same stabilization percentage (20%), the strength increases about 4 times when the specimen is stabilized for 90 days, instead of 7 days. Increasing content of fly ash in soil, CBR value of mixtures initially increases then it starts decreasing. The maximum CBR value was found to be for 70% soil and 30% fly ash proportion. The fly ash stabilization increases the CBR values substantially for the mixtures tested and have the potential to offer an alternative for clay soil subgrades improvement of highway construction. The swelling potential of expansive soil decreases with increasing swell reduction layer thickness ratio. The addition of fly ash reduces the plasticity characteristics of expansive soil. The addition of ash increased the optimum moisture content in the compaction tests due to its great specific surface and decreased the maximum dry density because of its lower specific weight. This can be applied in soils that contain a high percentage of moisture resulting in greater compaction, after an evaporation of a great quantity of the contained moisture.
CONCLUSIONS Fly ash is a waste material imposing hazardous effect on environment and human health. Also, it cannot be disposed of properly and its disposal is not economically viable but if it is blended with other construction materials like clayey soil then it can be used best for various construction purposes like subgrade, foundation base and embankments. The present study is aimed at improving the properties of soil to suitable for road construction. Fly ash has good potential for use in geotechnical applications. The relatively low unit weight of fly ash makes it well suited for placement over soft or low bearing strength soils. Its low specific gravity, freely draining nature, ease of compaction, insensitiveness to changes in moisture content, good frictional properties, etc. can be gainfully exploited in the construction of embankments, roads, reclamation of low-lying areas, fill behind retaining structures, etc. Soil-fly ash mixtures can add strength and durability to low strength soils, therefore allowing them to be used as subgrade instead of having to waste them. When the reaction characteristics of fly ash are understood and fly ash is used properly, it is beneficial as a stabilizing agent for soils. It has been observed that fly ash has contributed in modifying the properties of expansive/ clayey soil, particularly the PI value, CBR and unconfined strength, which are essential parameters in characterizing and accepting soil for subgrade.
REFERENCES

190
Bose B.; (2012); Geo-engineering properties of expansive soil stabilized with fly ash; EJGE;17; 1339-
1353 Brooks R. M.;(2009); Soil Stabilization With Flyash And Rice Husk Ash; International Journal of
Research and Reviews in Applied Sciences; 01; 209-217 Eskioglou P.; Oikonomou N. ;(2008); Protection of environment by the use of fly ash in road
construction; Global NEST; 10; 108-113 Fauzi A.; Nazmi W.M.;Fauzi U J.; (2010);Subgrades Stabilization of Kuantan Clay Using Fly ash and
Bottom ash; Geotropika Pattanaik S. C.; Sabat A. K.;(2010);A study of Nalco fly ash on compressive strength for effective use in
high volume mass concrete for a sustainable development Sen P.; Mukesh ; Dixit M. ;(2011);Evaluation of Strength Characteristics of Clayey Soil by Adding Soil
Stabilizing Additives; IJEE; 04; 1060-1063 Sharma R.K.; (2012); Subgrade characteristics of locally available soil mixed with fly ash and
randomly distributed fibers; ICEES Thomas Z.G.; (2002); Engineering Properties of Soil-Fly Ash Subgrade Mixtures Rao D K.; Ganja P; Jagarlamudi V; (2011); A Laboratory Study On The Utilization Of Gbfs And Fly
Ash To Stabilize The Expansive Soil For Subgrade Embankments; IJEST; 03 ; 8086-8098 Geliga E A.; Ismail D S A; (2010); Geotechnical Properties of Fly Ash and its Application on Soft Soil Stabilization; UJCE; 01; 01-06
191
STRENGTH BEHAVIOR OF SUBGRADE SOIL STABILIZED USING FLY ASH AGGREGATES
M. Muthukumar*, Deepak Mittal** and Shivam Gupta** *Assistant Professor (SG), SMBS, VIT University, Vellore, Tamil Nadu, India.
**B.Tech students, SMBS, VIT University, Vellore, Tamil Nadu, India.
Abstract: This paper presents the behavior of subgrade soil stabilized with varying percentage of fly ash aggregates. Disposal of fly ash, in environmental friendly way receives high attention now-a-days. In the present study fly ash is used in the form of aggregates to stabilize soil and to improve the subgrade strength. It is found that the CBR of stabilized soil increase with increase in the percentage of fly ash aggregates.
INTRODUCTION Stabilization of subgrade is practiced in road construction to improve the strength of the subgrade. Thickness of highway pavements depends on the strength of the subgrade soil; thereby reducing the thickness of pavement reduces the cost of construction. Therefore it becomes necessary to improve the strength of the subgrade soil to bring about economy in construction of pavement. Several stabilization techniques are in practice to modify the properties of subgrade soil. Most popular among these are mechanical stabilization and stabilization using additives such as lime, fly ash and chemicals (Kumar, 1996; Sridharan et al. 1996; Sharma, 1998; Cocka, 2001; Al Rawas et al. 2005; Phanikumar et al. 2001). Fly ash which is an industrial waste, generated far in excess than its utilization (Sridharan et al. 1996). This brought the problem of safe disposal or in utilization as an alternative to conventional materials in the construction of fills, embankments, pavement base and sub base course layers and manufacturing blended cement as well as in making concrete (Baykal and Doven, 2000). Use of fly ash proved to be effective in road construction (Behera and Mishra, 2012), but the disadvantage is due to leaching of trace elements from fly ash and causes ground water contamination (Kanugo and Mohapatra, 2000). To overcome this problem, attempt is made to use fly ash in the form of aggregates to improve the strength of the subgrade soil. This paper presents the effectiveness of the fly ash aggregates in improving the subgrade strength. California bearing ratio test (CBR) was performed on the soil specimens blended with fly ash aggregates in varying proportions.
EXPERIMENTAL INVESTIGATION
• Materials
Soil used for the test was collected from a depth of 1.5m in Vellore, Tamil Nadu, India. The index properties of the soil are determined. The soil is classified as clay with low plasticity (CL) according to USC system. Class C fly ash was used for preparing fly ash aggregates. Silica (SiO2) and alumina (Al2O3) are the main constituents which comprises about more than 75% of the total weight. Table 1 show the index properties performed on soil and fly ash.
• Preparation of fly ash aggregates
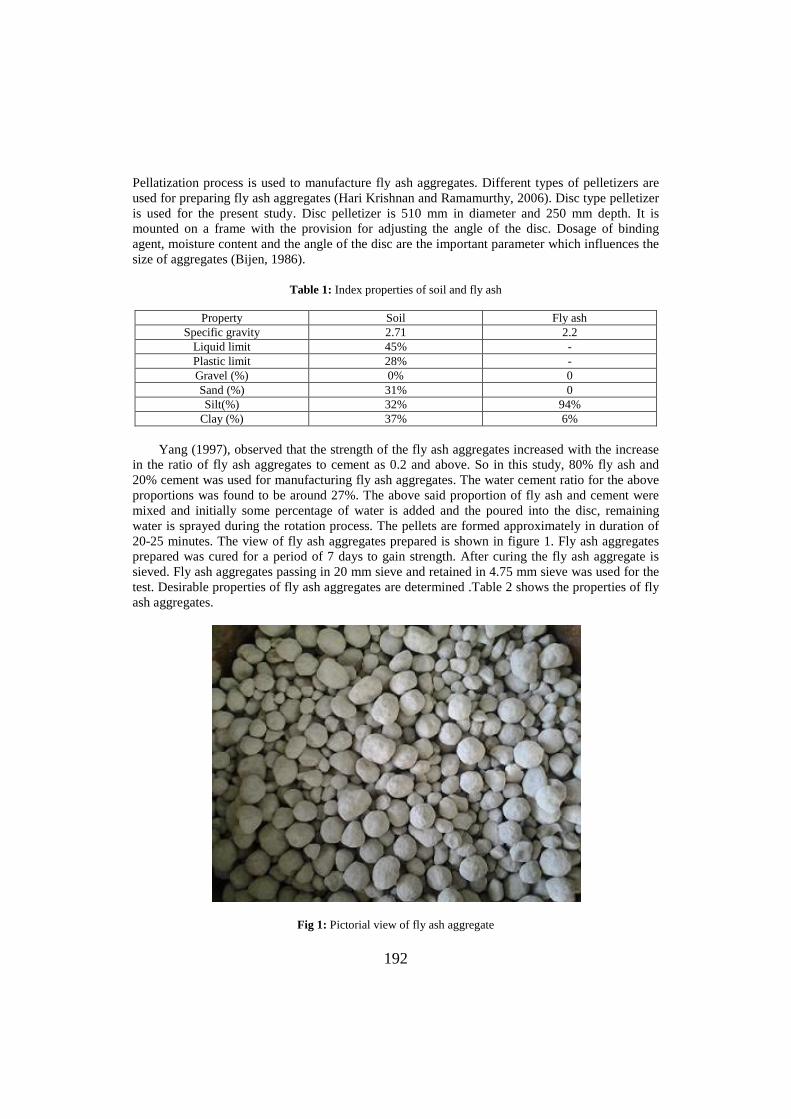
192
Pellatization process is used to manufacture fly ash aggregates. Different types of pelletizers are used for preparing fly ash aggregates (Hari Krishnan and Ramamurthy, 2006). Disc type pelletizer is used for the present study. Disc pelletizer is 510 mm in diameter and 250 mm depth. It is mounted on a frame with the provision for adjusting the angle of the disc. Dosage of binding agent, moisture content and the angle of the disc are the important parameter which influences the size of aggregates (Bijen, 1986).
Table 1: Index properties of soil and fly ash
Property Soil Fly ash Specific gravity 2.71 2.2
Liquid limit 45% - Plastic limit 28% - Gravel (%) 0% 0 Sand (%) 31% 0 Silt(%) 32% 94%
Clay (%) 37% 6%
Yang (1997), observed that the strength of the fly ash aggregates increased with the increase in the ratio of fly ash aggregates to cement as 0.2 and above. So in this study, 80% fly ash and 20% cement was used for manufacturing fly ash aggregates. The water cement ratio for the above proportions was found to be around 27%. The above said proportion of fly ash and cement were mixed and initially some percentage of water is added and the poured into the disc, remaining water is sprayed during the rotation process. The pellets are formed approximately in duration of 20-25 minutes. The view of fly ash aggregates prepared is shown in figure 1. Fly ash aggregates prepared was cured for a period of 7 days to gain strength. After curing the fly ash aggregate is sieved. Fly ash aggregates passing in 20 mm sieve and retained in 4.75 mm sieve was used for the test. Desirable properties of fly ash aggregates are determined .Table 2 shows the properties of fly ash aggregates.
Fig 1: Pictorial view of fly ash aggregate
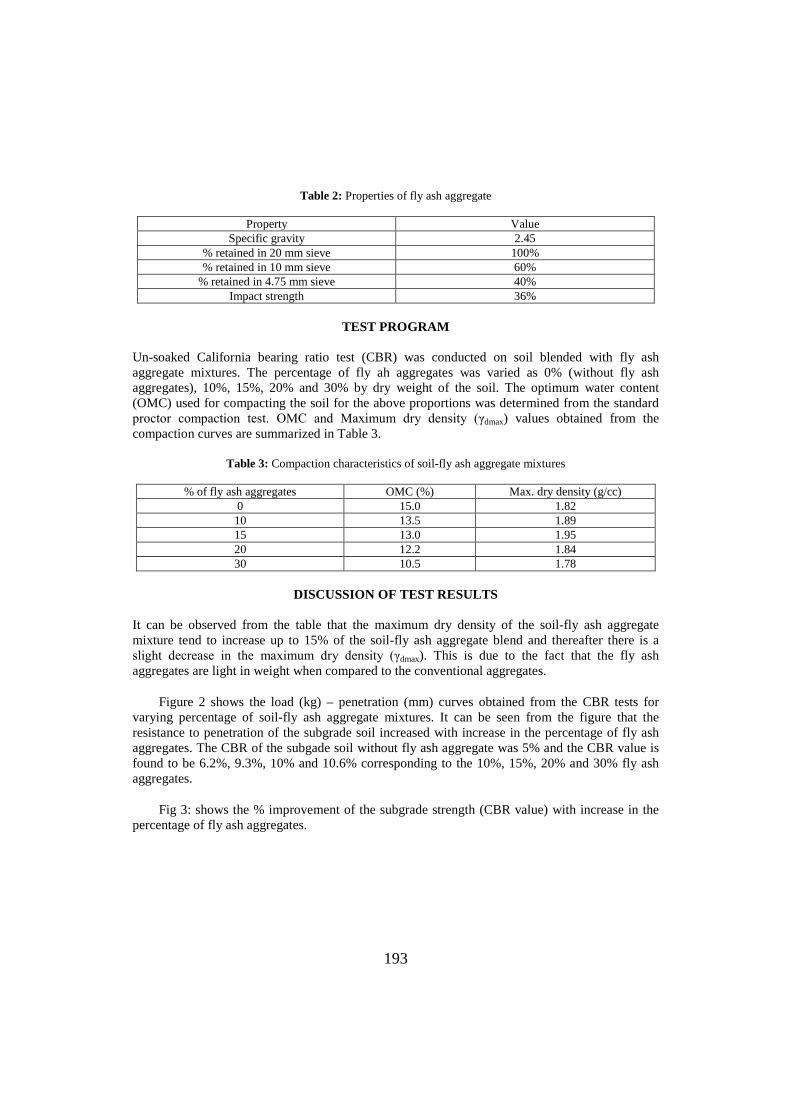
193
Table 2: Properties of fly ash aggregate
Property Value
Specific gravity 2.45 % retained in 20 mm sieve 100% % retained in 10 mm sieve 60%
% retained in 4.75 mm sieve 40% Impact strength 36%
TEST PROGRAM
Un-soaked California bearing ratio test (CBR) was conducted on soil blended with fly ash aggregate mixtures. The percentage of fly ah aggregates was varied as 0% (without fly ash aggregates), 10%, 15%, 20% and 30% by dry weight of the soil. The optimum water content (OMC) used for compacting the soil for the above proportions was determined from the standard proctor compaction test. OMC and Maximum dry density (γdmax) values obtained from the compaction curves are summarized in Table 3.
Table 3: Compaction characteristics of soil-fly ash aggregate mixtures
% of fly ash aggregates OMC (%) Max. dry density (g/cc) 0 15.0 1.82 10 13.5 1.89 15 13.0 1.95 20 12.2 1.84 30 10.5 1.78
DISCUSSION OF TEST RESULTS
It can be observed from the table that the maximum dry density of the soil-fly ash aggregate mixture tend to increase up to 15% of the soil-fly ash aggregate blend and thereafter there is a slight decrease in the maximum dry density (γdmax). This is due to the fact that the fly ash aggregates are light in weight when compared to the conventional aggregates.
Figure 2 shows the load (kg) – penetration (mm) curves obtained from the CBR tests for varying percentage of soil-fly ash aggregate mixtures. It can be seen from the figure that the resistance to penetration of the subgrade soil increased with increase in the percentage of fly ash aggregates. The CBR of the subgade soil without fly ash aggregate was 5% and the CBR value is found to be 6.2%, 9.3%, 10% and 10.6% corresponding to the 10%, 15%, 20% and 30% fly ash aggregates.
Fig 3: shows the % improvement of the subgrade strength (CBR value) with increase in the percentage of fly ash aggregates.
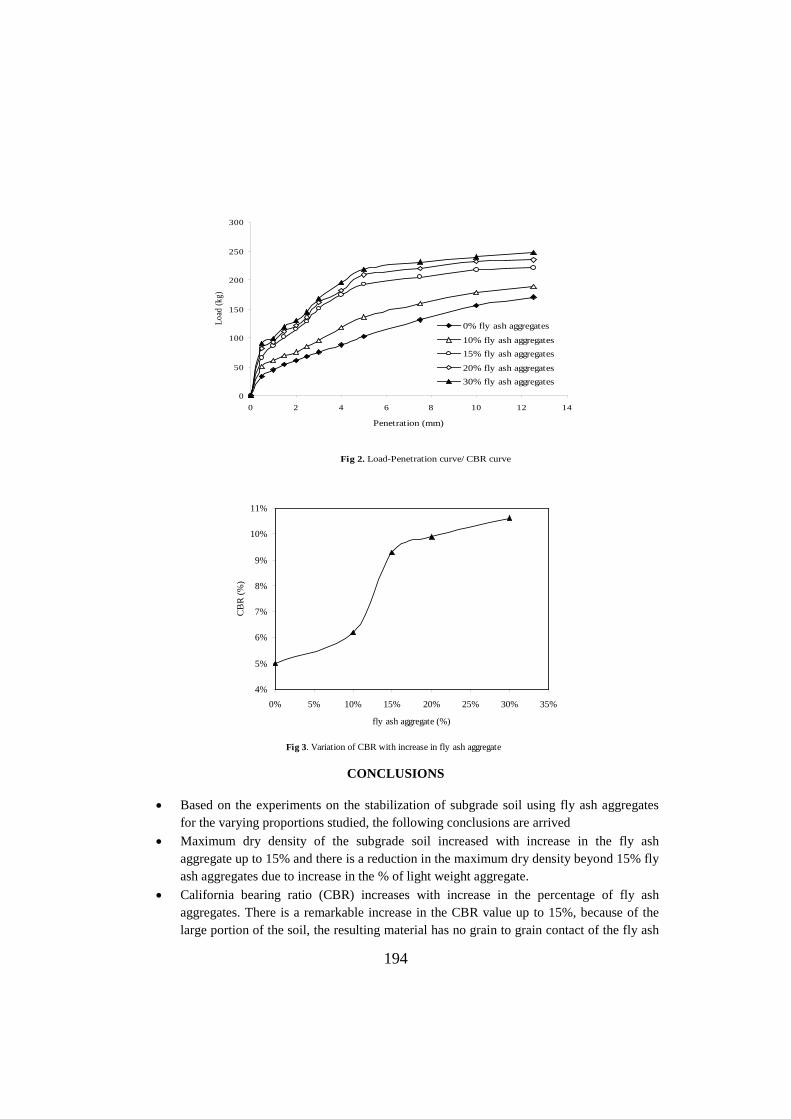
194
CONCLUSIONS
• Based on the experiments on the stabilization of subgrade soil using fly ash aggregates
for the varying proportions studied, the following conclusions are arrived • Maximum dry density of the subgrade soil increased with increase in the fly ash
aggregate up to 15% and there is a reduction in the maximum dry density beyond 15% fly ash aggregates due to increase in the % of light weight aggregate.
• California bearing ratio (CBR) increases with increase in the percentage of fly ash aggregates. There is a remarkable increase in the CBR value up to 15%, because of the large portion of the soil, the resulting material has no grain to grain contact of the fly ash
Fig 2. Load-Penetration curve/ CBR curve
0
50
100
150
200
250
300
0 2 4 6 8 10 12 14
Penetration (mm)
Load
(kg)
0% fly ash aggregates
10% fly ash aggregates15% fly ash aggregates
20% fly ash aggregates30% fly ash aggregates
Fig 3. Variation of CBR with increase in fly ash aggregate
4%
5%
6%
7%
8%
9%
10%
11%
0% 5% 10% 15% 20% 25% 30% 35%
fly ash aggregate (%)
CB
R (%
)
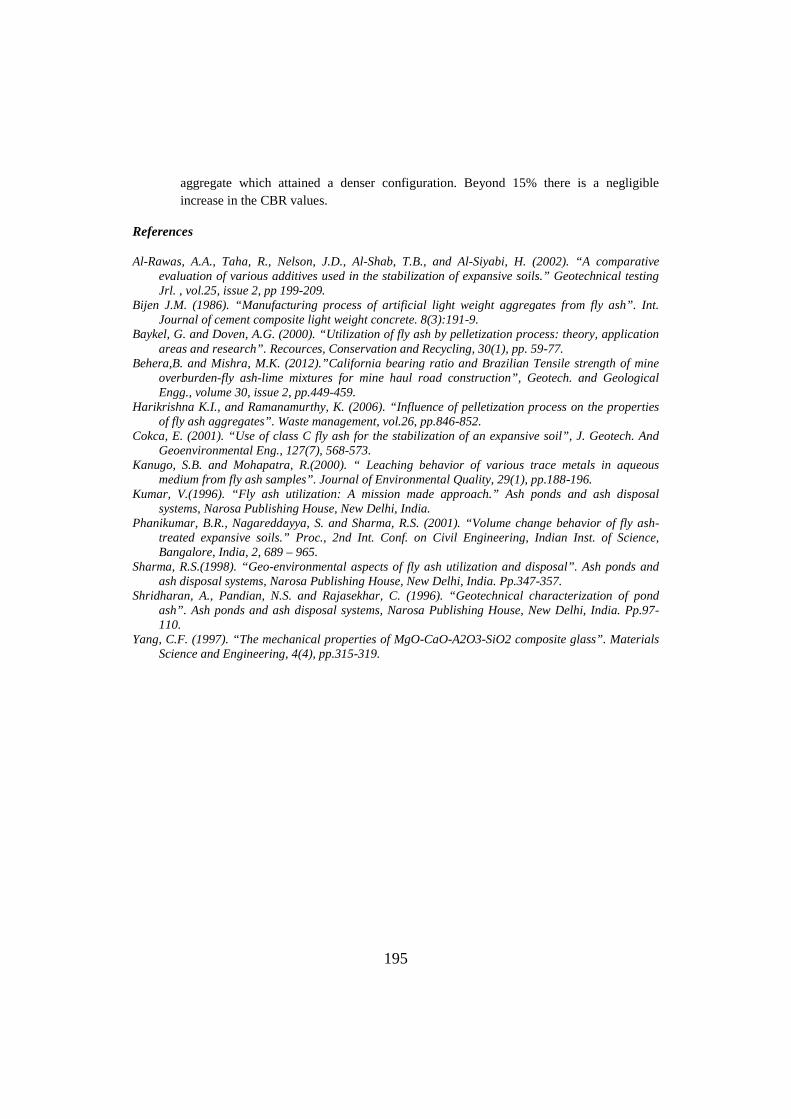
195
aggregate which attained a denser configuration. Beyond 15% there is a negligible increase in the CBR values.
References Al-Rawas, A.A., Taha, R., Nelson, J.D., Al-Shab, T.B., and Al-Siyabi, H. (2002). “A comparative
evaluation of various additives used in the stabilization of expansive soils.” Geotechnical testing Jrl. , vol.25, issue 2, pp 199-209.
Bijen J.M. (1986). “Manufacturing process of artificial light weight aggregates from fly ash”. Int. Journal of cement composite light weight concrete. 8(3):191-9.
Baykel, G. and Doven, A.G. (2000). “Utilization of fly ash by pelletization process: theory, application areas and research”. Recources, Conservation and Recycling, 30(1), pp. 59-77.
Behera,B. and Mishra, M.K. (2012).”California bearing ratio and Brazilian Tensile strength of mine overburden-fly ash-lime mixtures for mine haul road construction”, Geotech. and Geological Engg., volume 30, issue 2, pp.449-459.
Harikrishna K.I., and Ramanamurthy, K. (2006). “Influence of pelletization process on the properties of fly ash aggregates”. Waste management, vol.26, pp.846-852.
Cokca, E. (2001). “Use of class C fly ash for the stabilization of an expansive soil”, J. Geotech. And Geoenvironmental Eng., 127(7), 568-573.
Kanugo, S.B. and Mohapatra, R.(2000). “ Leaching behavior of various trace metals in aqueous medium from fly ash samples”. Journal of Environmental Quality, 29(1), pp.188-196.
Kumar, V.(1996). “Fly ash utilization: A mission made approach.” Ash ponds and ash disposal systems, Narosa Publishing House, New Delhi, India.
Phanikumar, B.R., Nagareddayya, S. and Sharma, R.S. (2001). “Volume change behavior of fly ash- treated expansive soils.” Proc., 2nd Int. Conf. on Civil Engineering, Indian Inst. of Science, Bangalore, India, 2, 689 – 965.
Sharma, R.S.(1998). “Geo-environmental aspects of fly ash utilization and disposal”. Ash ponds and ash disposal systems, Narosa Publishing House, New Delhi, India. Pp.347-357.
Shridharan, A., Pandian, N.S. and Rajasekhar, C. (1996). “Geotechnical characterization of pond ash”. Ash ponds and ash disposal systems, Narosa Publishing House, New Delhi, India. Pp.97-110.
Yang, C.F. (1997). “The mechanical properties of MgO-CaO-A2O3-SiO2 composite glass”. Materials Science and Engineering, 4(4), pp.315-319.
196
SUITABILITY OF CDW AGGREGATES AS SUB-BASE LAYER OF FLEXIBLE
PAVEMENTS
Rajiv Goel1 and Ashutosh Trivedi2 1Dy.CE (IRSE) Indian Railway,
2Department of Civil Engineering, Delhi Technological University, Delhi.
Abstract: The use of recycled CDW (construction and demolition waste) aggregates in road construction is popular in European countries but is not so widespread in India due to lack of standard specifications, scientific testing and field trials on such a material. To overcome this problem the authors have taken up the characterization of recycled aggregates extracted out of construction and demolition waste (CDW). This paper presents the results of laboratory investigations on aggregates extracted out of construction and demolition waste (CDW). The tests are carried out to explore its potential uses in base course and sub base course of flexible pavement construction in India. The physical properties of CDW aggregates were investigated and were compared with physical properties of fresh aggregates. Particle size index and grading, Specific gravity, moisture-density relationship, water absorption, Los angles abrasion value, aggregate crushing value and CBR value were calculated by laboratory testing and the same were compared with the values required for the fresh aggregates. Few field trials were made for evaluation of performance of CDW. It is quite possible to successfully use recycled CDW aggregate as sub base and base course of flexible pavements. It is also a great possibility to fill the gap between supply and demand of aggregates by the use of secondary aggregates extracted out of construction and demolition waste. The code making agencies (BIS, IRC) must frame standards to encourage use of recycled aggregates comparable to the traditional aggregates.
INTRODUCTION
All the old cities of India are having numerous low rise masonry and concrete structure buildings which have out lived their design life, as the average age of these buildings is normally estimated to be 60-100 years. The demolition of these old low rise buildings from central area of old cities of India is picking up to provide the valuable land for high rise construction. Demolition waste so generated consists of concrete, bricks, mortars, wood, plastic, stone, steel & glass etc. Major portion of this consists of wreckage of brick-mortar-concrete mix debris. This mix is an inert material and on proper gradation and crushing we can use this in place of fresh aggregates. This solves the problem of disposal of waste and replaces the fresh aggregates and hence it is environment friendly.
• Estimates of construction waste
Contractor executes construction project on a labor contract basis or on with material turnkey basis. Small housing projects, executed by owners, are predominantly executed on labor contract basis, whereas all large projects are being executed on with material turnkey basis. Strict supervision is required to control waste generation during construction process. In normal
197
construction projects typically waste generation ranges among 5% to 7%. In larger projects, where execution is on turnkey basis or through team of professional, material wastage is 3% to 5%.
According to Ministry of Environment Forest (MoEF) report of the committee to evolve road map on management of wastes in India construction waste comprises of concrete, plaster, bricks, metal, wood, plastics etc. It is estimated that the construction industry in India generates about 10-12 million tons of waste annually. There is a huge demand of aggregates in the housing and road sectors but there is significant gap in demand and supply, which can be reduced by recycling construction and demolition waste to certain specifications. While some of the items like bricks, tiles, wood, metal etc. are re-used and recycled, concrete and masonry, constituting about 50% of the Construction Waste is not currently recycled in India. The fine dust like material (fines) from Construction Waste is presently not being used and thus wasted.
According to Technology Information, Forecasting and Assessment Council, the total quantum of waste from construction industry is estimated to be 12 to 14.7 million tons per annum. In Delhi results of TIFAC, estimation after survey of C&D waste generation have shown that quantity of C&D waste varies from 3000 ton per day to 500 ton per day. Quantities of different constituents of waste that arise from Construction Industry in India are estimated as follows:
Table. 1(a) Quantity of different constituents of waste that arise from Construction Industry in India (Others
include plastics, paints etc)
Constituent Quantity Generated in Million Tons p.a. (Range)
Soil, Sand & Gravel 4.20 to 5.14 Bricks & Masonry 3.60 to 4.40
Concrete 2.40 to 3.67 Metals 0.60 to 0.73
Bitumen 0.25 to 0.30 Wood 0.25 to 0.30 Others 0.10 to 0.15
Table-1(b) Composition of selected samples of CDW
Item % of total C&D waste % of total C&D waste Sample I II
Sand & Gravel 36% 38% Bituminous concrete 2% 0%
Metals 1% 1% Masonry/ Bricks 31% 32%
Concrete 26% 26% Wood 2% 0% Others 1% 0%
According to Central Pollution Control Board (CPCB) has estimated current quantum of solid
waste generation in India to the tune of 48 million tons per annum of which waste from Construction Industry accounts for 25%. Management of such high quantum of waste puts enormous pressure on solid waste management system. The pie chart shows the percentage of construction waste on sites according to the data’s of Technology Information, Forecasting and Assessment Council.
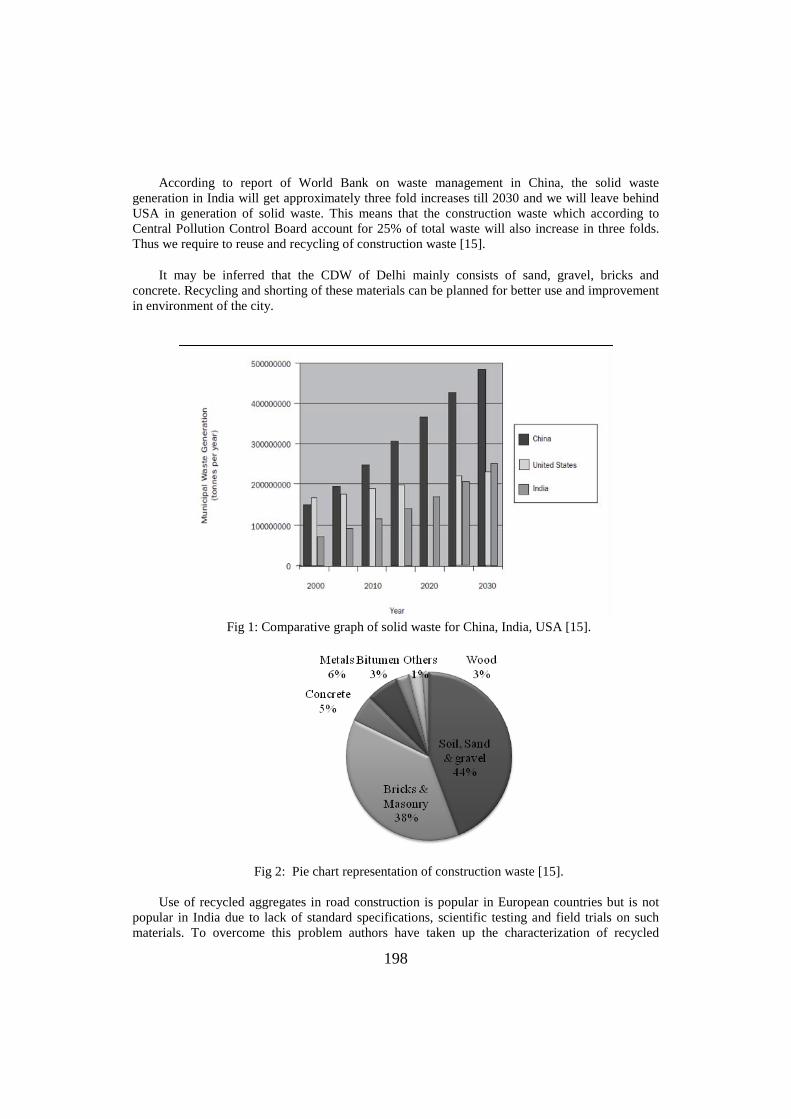
198
According to report of World Bank on waste management in China, the solid waste generation in India will get approximately three fold increases till 2030 and we will leave behind USA in generation of solid waste. This means that the construction waste which according to Central Pollution Control Board account for 25% of total waste will also increase in three folds. Thus we require to reuse and recycling of construction waste [15].
It may be inferred that the CDW of Delhi mainly consists of sand, gravel, bricks and concrete. Recycling and shorting of these materials can be planned for better use and improvement in environment of the city.
Fig 1: Comparative graph of solid waste for China, India, USA [15].
Fig 2: Pie chart representation of construction waste [15]. Use of recycled aggregates in road construction is popular in European countries but is not
popular in India due to lack of standard specifications, scientific testing and field trials on such materials. To overcome this problem authors have taken up the characterization of recycled
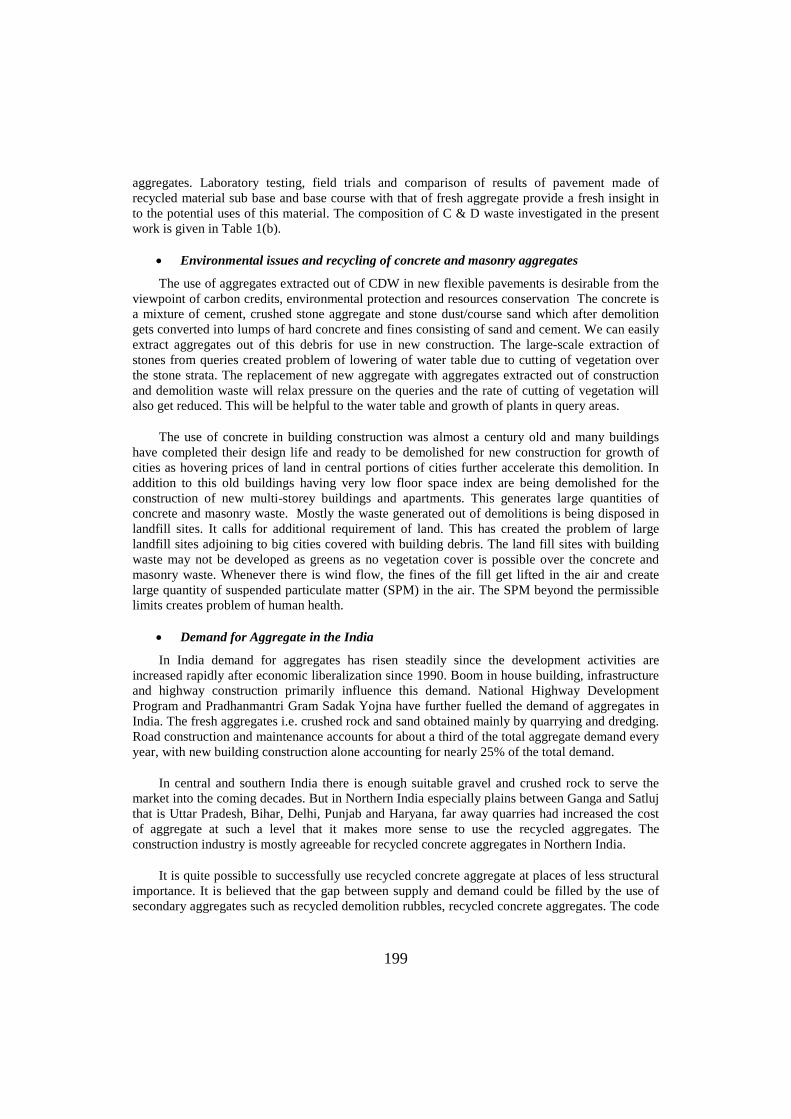
199
aggregates. Laboratory testing, field trials and comparison of results of pavement made of recycled material sub base and base course with that of fresh aggregate provide a fresh insight in to the potential uses of this material. The composition of C & D waste investigated in the present work is given in Table 1(b).
• Environmental issues and recycling of concrete and masonry aggregates
The use of aggregates extracted out of CDW in new flexible pavements is desirable from the viewpoint of carbon credits, environmental protection and resources conservation The concrete is a mixture of cement, crushed stone aggregate and stone dust/course sand which after demolition gets converted into lumps of hard concrete and fines consisting of sand and cement. We can easily extract aggregates out of this debris for use in new construction. The large-scale extraction of stones from queries created problem of lowering of water table due to cutting of vegetation over the stone strata. The replacement of new aggregate with aggregates extracted out of construction and demolition waste will relax pressure on the queries and the rate of cutting of vegetation will also get reduced. This will be helpful to the water table and growth of plants in query areas.
The use of concrete in building construction was almost a century old and many buildings have completed their design life and ready to be demolished for new construction for growth of cities as hovering prices of land in central portions of cities further accelerate this demolition. In addition to this old buildings having very low floor space index are being demolished for the construction of new multi-storey buildings and apartments. This generates large quantities of concrete and masonry waste. Mostly the waste generated out of demolitions is being disposed in landfill sites. It calls for additional requirement of land. This has created the problem of large landfill sites adjoining to big cities covered with building debris. The land fill sites with building waste may not be developed as greens as no vegetation cover is possible over the concrete and masonry waste. Whenever there is wind flow, the fines of the fill get lifted in the air and create large quantity of suspended particulate matter (SPM) in the air. The SPM beyond the permissible limits creates problem of human health.
• Demand for Aggregate in the India
In India demand for aggregates has risen steadily since the development activities are increased rapidly after economic liberalization since 1990. Boom in house building, infrastructure and highway construction primarily influence this demand. National Highway Development Program and Pradhanmantri Gram Sadak Yojna have further fuelled the demand of aggregates in India. The fresh aggregates i.e. crushed rock and sand obtained mainly by quarrying and dredging. Road construction and maintenance accounts for about a third of the total aggregate demand every year, with new building construction alone accounting for nearly 25% of the total demand.
In central and southern India there is enough suitable gravel and crushed rock to serve the market into the coming decades. But in Northern India especially plains between Ganga and Satluj that is Uttar Pradesh, Bihar, Delhi, Punjab and Haryana, far away quarries had increased the cost of aggregate at such a level that it makes more sense to use the recycled aggregates. The construction industry is mostly agreeable for recycled concrete aggregates in Northern India.
It is quite possible to successfully use recycled concrete aggregate at places of less structural importance. It is believed that the gap between supply and demand could be filled by the use of secondary aggregates such as recycled demolition rubbles, recycled concrete aggregates. The code
200
agencies (BSI, IRC) must frame standards to encourage use of recycled aggregates comparable to the traditional aggregates.
CHARACTERIZATION OF AGGREGATES EXTRACTED OUT OF CDW
• Experimental program
In order to evaluate the physical and mechanical properties that affect the behavior of CDW aggregate the following tests were performed. The CDW aggregate has been collected from two demolition sites i.e. Ganga and Yamuna multistory towers in Vaishali, Ghaziabad. U.P. Experimental investigations for physical properties, particle size distribution, compaction, relative density, strength and deformation characteristic and California bearing ratio (CBR) has been carried out to characterize CDW aggregate [1-16].
The test for Specific gravity was carried out using density bottle method. The moisture-density relationship of the CDW aggregate was carried out using sand replacement method. The particle index [8] of the CDW aggregate was investigated to look at the combined effects of particle size and gradation. The Procter compaction tests were performed to calculate the optimum moisture content and maximum dry density of pavement. Aggregate abrasion value was tested in Los angles particle abrasion test to find out the strength and toughness characteristics of the CDW aggregate. CBR Value test were performed to evaluate the strength of material for its suitability for base course of pavement.
• Test for specific gravity of aggregates
Tests for specific gravity is performed as per “IS 2720: Part III: Sec 2: 1980 Test for soils - Part III: determination of specific gravity - section 2: Fine, medium and coarse grained soils”
Two sets of test samples of Crushed Concrete Aggregates were prepared to find out specific gravity. Each set consists of three samples and designated as CDWA-A and CDWA-B. CDWA-A consists of three samples of course particles of size more than 11.2 mm and CDWA -B consists of Fine grain particles of size less than 11.2 mm. Fine particles were used as screening and binder of the sub base and base course. We had tested CDW aggregates and found the specific gravity as shown in the following table.
Table-2 - Results of specific gravity test of CDW aggregates of Particle size > 11.2 mm
Test No. Specific gravity of particle size > 11.2 mm CDW-A
Specific gravity of particle size < 11.2 mm CDW-B
1 2.71 2.71 2 2.65 2.65 3 2.70 2.70
• Procter compaction test for determination of maximum density of compacted sub base
Compaction characteristics of construction and demolition waste have been found by standard proctor test as per IS2720: part-7 to evaluate compacted maximum dry density and optimum moisture content.
Table 3: Result of Procter compaction Test
201
Test No. Bulk density in Procter test
Water content of base course
Dry Unit wt of base/sub base course
Maximum Dry density
kN/m3 % kN/m3 kN/m3 1 22.3 8.50 20.5
21.3
2 22.8 10.00 20.7 3 23.9 12.00 21.3 4 24.0 14.03 21.0 5 24.1 15.75 20.8 6 24.1 16.80 20.6
• Tests for density-moisture content of compacted base course
The specific gravity of crushed rock aggregates is in the range of about 2.55–2.75 and will produce the sub base and base course of flexible pavements of densities usually in the range of about 20.50 –21.50 kN/m3. Densities of base course and sub base course were calculated by sand replacement method. Three samples were collected and density and moisture content were calculated as shown in the following table. Water Content of The sample has been tested as per “IS 2720: Part 2: 1973 Methods of test for soils: Part 2 Determination of water content”
• Test for particle size distribution and grading of CDW aggregates
Test for particle size distribution and grading of CDW aggregates has been performed as per IS 2720: Part 4: 1985 methods of test for soils - part 4: grain size analysis. The grading requirement was fulfilled in the trial case and the grading obtained is as under. Particles of size more than 11.2 mm were used as coarse aggregates and particles of size less than 11.2 mm were used as screening and binder while making the water bound macadam base sub base and base course.
Table 4: Results of Density-moisture content of pavement
Test No. Bulk density of sub base/base course
Water content of base course
Dry Unit wt of base/sub base course
kN/m3 % kN/m3 1 2.23 9.50 2.04 2 2.19 11.00 1.97 3 2.16 12.50 1.92
• Determination of relative density
Relative density has been calculated for determining the compaction achieved in the road pavements.
Table-5: Relative Density of Compacted Samples
Test No. Field density Found from Sand replacement method Relative density
1 2.037 95.50 2 1.991 93.32
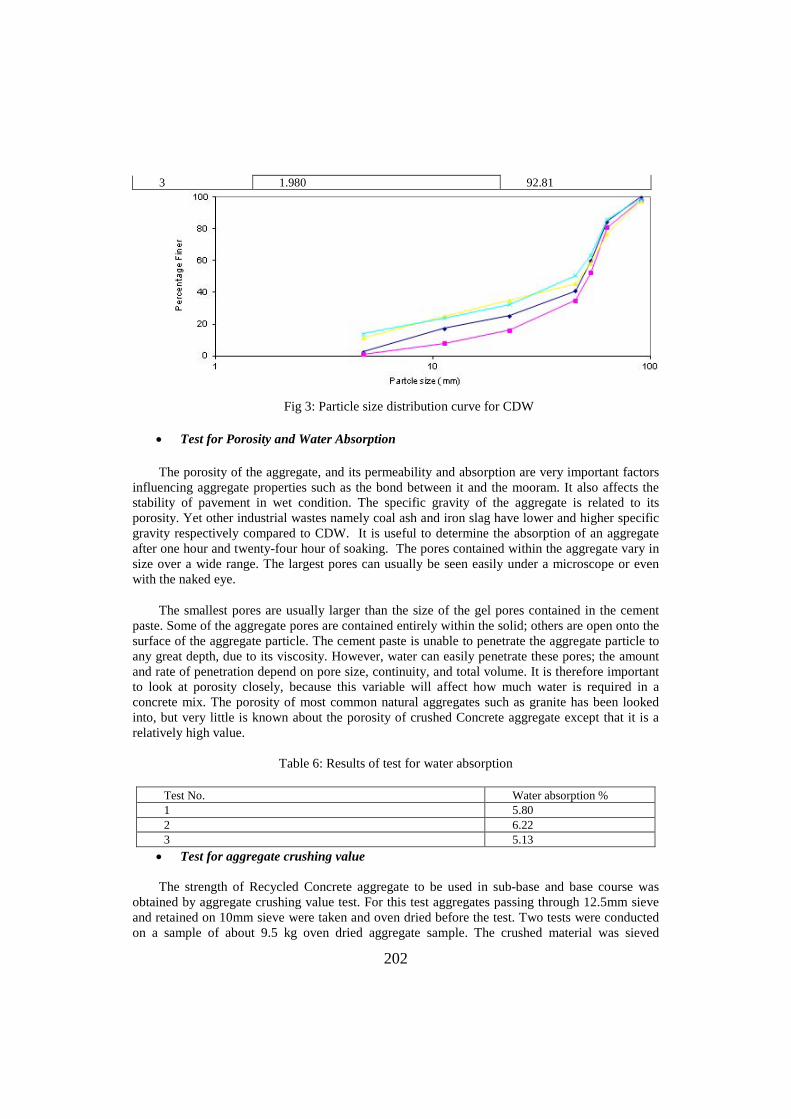
202
3 1.980 92.81
Fig 3: Particle size distribution curve for CDW
• Test for Porosity and Water Absorption
The porosity of the aggregate, and its permeability and absorption are very important factors influencing aggregate properties such as the bond between it and the mooram. It also affects the stability of pavement in wet condition. The specific gravity of the aggregate is related to its porosity. Yet other industrial wastes namely coal ash and iron slag have lower and higher specific gravity respectively compared to CDW. It is useful to determine the absorption of an aggregate after one hour and twenty-four hour of soaking. The pores contained within the aggregate vary in size over a wide range. The largest pores can usually be seen easily under a microscope or even with the naked eye.
The smallest pores are usually larger than the size of the gel pores contained in the cement paste. Some of the aggregate pores are contained entirely within the solid; others are open onto the surface of the aggregate particle. The cement paste is unable to penetrate the aggregate particle to any great depth, due to its viscosity. However, water can easily penetrate these pores; the amount and rate of penetration depend on pore size, continuity, and total volume. It is therefore important to look at porosity closely, because this variable will affect how much water is required in a concrete mix. The porosity of most common natural aggregates such as granite has been looked into, but very little is known about the porosity of crushed Concrete aggregate except that it is a relatively high value.
Table 6: Results of test for water absorption
Test No. Water absorption % 1 5.80 2 6.22 3 5.13
• Test for aggregate crushing value
The strength of Recycled Concrete aggregate to be used in sub-base and base course was obtained by aggregate crushing value test. For this test aggregates passing through 12.5mm sieve and retained on 10mm sieve were taken and oven dried before the test. Two tests were conducted on a sample of about 9.5 kg oven dried aggregate sample. The crushed material was sieved
203
through the 2.36mm sieve and aggregate crushing value was calculated as given in the table. The aggregate crushing value of the Recycled concrete aggregate is higher than the crushed stone aggregates as there is mortar adhered around the particles which get crushed easily during the testing.
Table 7: Results of test for aggregate crushing value
Test No. Aggregate crushing value % 1 29.45 2 23.49 3 27.69
• Los Angles Abrasion value test
The abrasion losses measured by Los Angeles abrasion tests on the coarse fraction were 32.9% for RCA A and 43.6% for RCA B. Visual inspection of RCA in this study revealed that the surface of the aggregate is rough, and the RCA contained approximately 70 to 90% normal aggregate. The normal aggregate contained a mixture of both sand stone aggregates and gravel. About 10-30% of the aggregates was pebbles/small particles of mortar and is comparatively week in strength. The aggregates retained on 11.2 mm sieve were taken for aggregate abrasion value test. After the test the aggregates were sieved through 1.7 mm sieve and Los angle abrasion value was calculated after 1000 revolution with 12 number cast iron balls of 390-445 gm each.
Table 8: Results of Test for Los angles Abrasion Value
Test No. Los Angles Abrasion Value % 1 43.00 2 39.20 3 47.00
• Comparison of test results with the standards fixed by IS Codes/ IRC Codes
The comparison of various test results indicates that the specific gravity of Crushed stone aggregates in well within the values required for good hard surface of WBM. The density of compacted pavement achieved is also in the range of density of crushed stone water bound macadam and wet mix macadam. Los angles value of CDW aggregates is slightly higher than the crushed stone because the aggregates of CDW were having mortar adhered with them and it was not fully removed from surface. When the aggregates taken for aggregates crushing value the aggregates are comparatively clean and hence the result found is less than maximum permissible. The water absorption of CDW aggregates was significantly higher than that of crushed stone aggregates as the mortar in between the CDW aggregate absorbed more water and hence we got the higher value.
From the above table it is clear that the Grading of recycled concrete aggregates is finer than the grading of crushed stone course aggregates used in the water bound macadam. But it is courser than the aggregate grading required in water mix macadam. Hence the recycled concrete aggregate is a good alternative material for the road construction.
• Field Trials
204
With the co-operation of the developers, the authors have successfully used about 20000 cubic meter of CDW as sub base and base course of flexible pavement roads. The material was procured from old buildings being demolished in the Vaishali, Ghaziabad and the material has been used in construction of roads in newly developing integrated township named Crossings Republik Ghaziabad. It was also used as base for raft foundations in lieu of PCC. The material has been used as two layers of base course of 150 mm and 100 mm thickness in the flexible pavement construction for 44 lane km roads. In one of the road the entire crust was made of recycled concrete and only top surface of BM and HDBC were laid with new aggregates. The road has medium to light transportation utility. It has successfully passed five years of seasonal rains and drought cycles.
Table 9: Comparison of the standards fixed by IS Codes/IRC Codes
Property of Aggregates Standard value for Crushed stone Water Bound Macadam
Standard value for Wet Mix Macadam
Value obtained for CDW aggregates
Specific Gravity 2.65-2.75 2.55-2.7 2.69 Density of Compacted Pavement 18.50-19.50 kN/cum 18.00-19.00 kN/cum 18.80 kN/cum
Los Angles Abrasion Value 40% max 40% max 43.07% Aggregate Crushing Value 30% max 30% max 26.88% Water Absorption 2% 2% 5.72%
Table 10: Comparison of grading with WBM and WMM
IS Sieve designation Average Grading of CDW
Grading of crushed stone aggregate for WBM Grading of WMM
90 98.599 100 - 63 81.983 90-100 - 53 58.426 25-60 100 45 43.049 0-15 95-100 22.4 27.18 0-5 60-80 11.2 18.558 0 40-60 4.75 7.2507 - 25-40 Pan 0 - 0-25
CONCLUSIONS
Recycling of CDW is fast becoming a popular concept all over the world. Use of this recycled aggregate in sub base and base course material in road construction will enhance the demand of such aggregates and recycling will takeoff in India as being done in developed countries. The use of CDW aggregates is recommended to be made enforced to the agencies involved in road constructions since it meets the requirements of the material acceptable to the road base and sub-base.
The limiting factors on expanding the reuse and recycling of construction and demolition waste are the need for predictable and consistent performance from the final product. The study presented in this paper proved that good quality sub base and base course material can be successfully produced using recycled aggregates that have been produced from demolition and construction waste.
205
Based on the tests performed and field application of CDW aggregates as base and sub-base materials for flexible pavement system, the following conclusions can be drawn: CDW aggregates can be used as base and sub-base materials, in place of crushed stone aggregate. The compatibility of CDW aggregates is the same as that of crushed stone and gravel aggregate. The strength and compatibility of recycled CDW aggregates is equal to the conventional WBM or WMM and hence give same strength characteristics as that of WBM or WMM (98% - 99.5%). Aggregate crushing value and abrasion values of recycled CDW aggregate are often higher than that of values required by MORTH specification for of stone aggregates. Hence special treatment is required to prevent the water percolation in pavement. The water absorption of recycled aggregates is significantly higher than that crushed stone aggregates. The surface deformation pattern of the trial road stretch was regularly monitored at the interval of Three months for two years. The road stretch with stood the regular traffic consisting of truck loads of heavy construction materials, earth moving machinery, and work force. There were nearly 200 loaded trucks carrying 40 ton load each every day as major building construction is going on. It is recommended to clarify the code provision for CDW supporting the aberration values, water absorption and pre treatment for CDW to be used as a highway material.
ACKNOWLEDGEMENT
The present study is the part of research program undertaken by the first author in the Department the Civil Engineering, Faculty of Technology, University of Delhi. The first author thankfully acknowledges the due support of various co-workers in supporting this work.
References
IS 1498: 1970 Classification and identification of soils for general engineering purposes. IS 2720: Part 2: 1973 Methods of test for soils: Part 2 Determination of water content. IS 2720: Part 3: Sec 1: 1980 Methods of test for soils: Part 3 Determination of specific gravity Section
1 fine grained soils. IS 2720: Part 1: 1983 Methods of test for soils - Part 1: Preparation of dry soil samples for various
tests. IS 2720: Part III: Sec 2: 1980 Test for soils - Part III: Determination of specific gravity - section 2:
Fine, medium and coarse grained soils. IS 2720: Part 4: 1985 Methods of test for soils - Part 4: Grain size analysis. IS 2720: Part 9: 1992 Methods of test for soils: Part 9 Determination of dry density- moisture content
relation by constant weight of soil method. IS 2720: Part 14: 1983 Methods of test for soils - Part 14: Determination of density index (Relative
Density) of cohesion less soils. IS 2720: Part VII: 1980 Methods of test for soils - Part VII: Determination of water content-dry density
relation using light compaction. IS 2720: Part 8: 1983 Methods of test for soils - Part 8: Determination of water content-dry density
relation using heavy compaction. IS 2720: Part 16: 1987 Methods of test for soil - Part 16: Laboratory determination of CBR IS 2720: Part 17: 1986 Methods of test for soils - Part 17: Laboratory determination of permeability. IS2386: Part-IV: 1963, 1997 Methods for tests of aggregates for concrete – Mechanical properties. Brickner, Robort, 1997 Overview of C&D debris recycling plants, C&D debris recycling. http://www.tifac.org.in/index.php?Option=com_content&view=article&id=710&Itemid=205
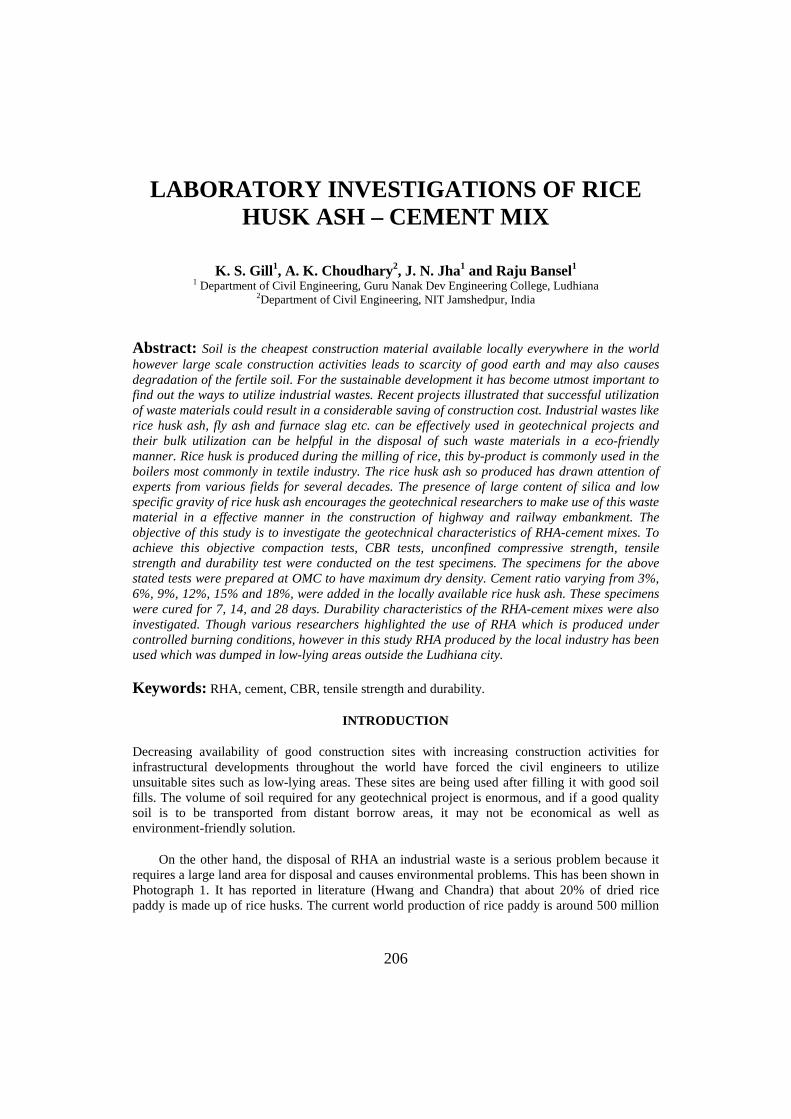
206
LABORATORY INVESTIGATIONS OF RICE HUSK ASH – CEMENT MIX
K. S. Gill1, A. K. Choudhary2, J. N. Jha1 and Raju Bansel1 1 Department of Civil Engineering, Guru Nanak Dev Engineering College, Ludhiana
2Department of Civil Engineering, NIT Jamshedpur, India
Abstract: Soil is the cheapest construction material available locally everywhere in the world however large scale construction activities leads to scarcity of good earth and may also causes degradation of the fertile soil. For the sustainable development it has become utmost important to find out the ways to utilize industrial wastes. Recent projects illustrated that successful utilization of waste materials could result in a considerable saving of construction cost. Industrial wastes like rice husk ash, fly ash and furnace slag etc. can be effectively used in geotechnical projects and their bulk utilization can be helpful in the disposal of such waste materials in a eco-friendly manner. Rice husk is produced during the milling of rice, this by-product is commonly used in the boilers most commonly in textile industry. The rice husk ash so produced has drawn attention of experts from various fields for several decades. The presence of large content of silica and low specific gravity of rice husk ash encourages the geotechnical researchers to make use of this waste material in a effective manner in the construction of highway and railway embankment. The objective of this study is to investigate the geotechnical characteristics of RHA-cement mixes. To achieve this objective compaction tests, CBR tests, unconfined compressive strength, tensile strength and durability test were conducted on the test specimens. The specimens for the above stated tests were prepared at OMC to have maximum dry density. Cement ratio varying from 3%, 6%, 9%, 12%, 15% and 18%, were added in the locally available rice husk ash. These specimens were cured for 7, 14, and 28 days. Durability characteristics of the RHA-cement mixes were also investigated. Though various researchers highlighted the use of RHA which is produced under controlled burning conditions, however in this study RHA produced by the local industry has been used which was dumped in low-lying areas outside the Ludhiana city.
Keywords: RHA, cement, CBR, tensile strength and durability.
INTRODUCTION
Decreasing availability of good construction sites with increasing construction activities for infrastructural developments throughout the world have forced the civil engineers to utilize unsuitable sites such as low-lying areas. These sites are being used after filling it with good soil fills. The volume of soil required for any geotechnical project is enormous, and if a good quality soil is to be transported from distant borrow areas, it may not be economical as well as environment-friendly solution.
On the other hand, the disposal of RHA an industrial waste is a serious problem because it requires a large land area for disposal and causes environmental problems. This has been shown in Photograph 1. It has reported in literature (Hwang and Chandra) that about 20% of dried rice paddy is made up of rice husks. The current world production of rice paddy is around 500 million
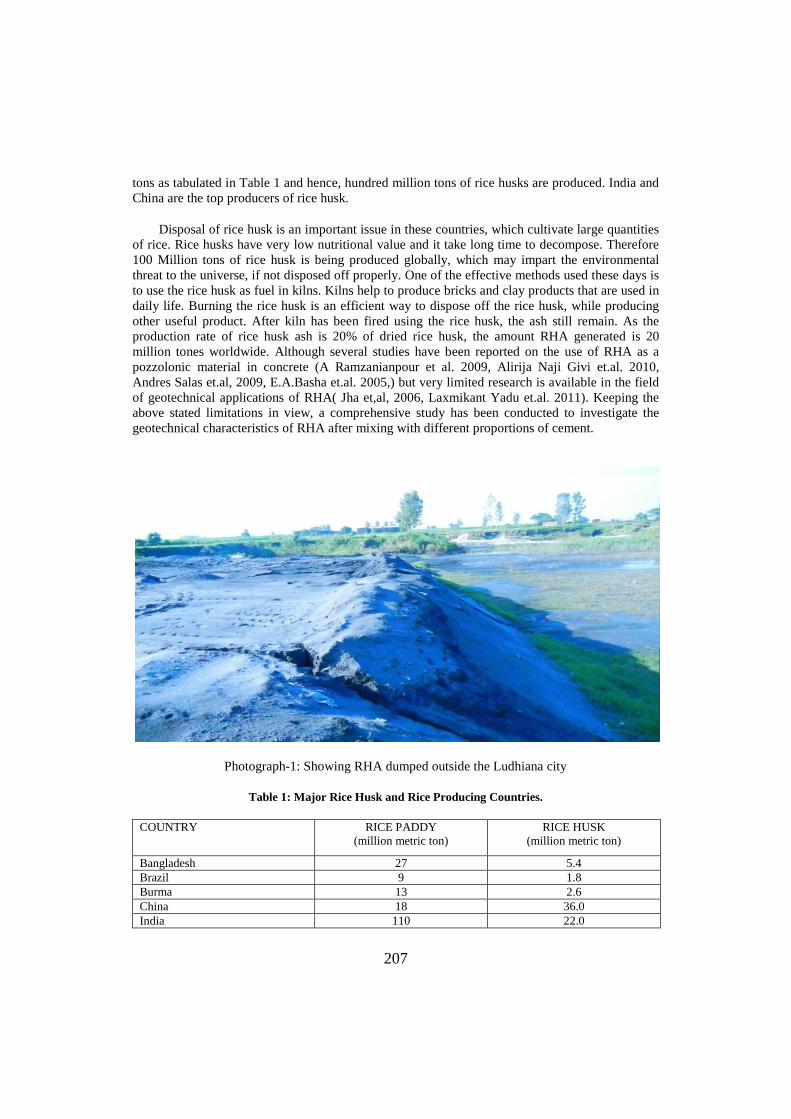
207
tons as tabulated in Table 1 and hence, hundred million tons of rice husks are produced. India and China are the top producers of rice husk.
Disposal of rice husk is an important issue in these countries, which cultivate large quantities of rice. Rice husks have very low nutritional value and it take long time to decompose. Therefore 100 Million tons of rice husk is being produced globally, which may impart the environmental threat to the universe, if not disposed off properly. One of the effective methods used these days is to use the rice husk as fuel in kilns. Kilns help to produce bricks and clay products that are used in daily life. Burning the rice husk is an efficient way to dispose off the rice husk, while producing other useful product. After kiln has been fired using the rice husk, the ash still remain. As the production rate of rice husk ash is 20% of dried rice husk, the amount RHA generated is 20 million tones worldwide. Although several studies have been reported on the use of RHA as a pozzolonic material in concrete (A Ramzanianpour et al. 2009, Alirija Naji Givi et.al. 2010, Andres Salas et.al, 2009, E.A.Basha et.al. 2005,) but very limited research is available in the field of geotechnical applications of RHA( Jha et,al, 2006, Laxmikant Yadu et.al. 2011). Keeping the above stated limitations in view, a comprehensive study has been conducted to investigate the geotechnical characteristics of RHA after mixing with different proportions of cement.
Photograph-1: Showing RHA dumped outside the Ludhiana city
Table 1: Major Rice Husk and Rice Producing Countries.
COUNTRY RICE PADDY (million metric ton)
RICE HUSK (million metric ton)
Bangladesh 27 5.4 Brazil 9 1.8 Burma 13 2.6 China 18 36.0 India 110 22.0
208
Indonesia 45 9.0 Japan 13 2.6 Korea 9 1.8 Philippines 9 1.8 Taiwan 14 2.8 Thailand 20 4 US 7 1.4 Vietnam 18 3.6 Other 26 5.2 Total 500 100
LABORATORY TESTING
The experimental work deals with the detail of experimental program during the course of this investigation. An experimental program was planned to study the effect of rice husk ash and cement with different proportions and all the laboratory tests were conducted as per the relevant Indian standard code of practice. Following materials were used in the experimental investigations.
• Rice Husk Ash
The rice husk ash (RHA) used in this investigation was collected from M/s Vardhman spinning mill located at Ludhiana-Chandigarh road sector 32. The Chemical analysis of this RHA was got conducted from the laboratory of Punjab University Chandigarh and the composition has been depicted below in the Table -2. The physical properties are shown in Table-3.
Table 2: Chemical Properties of RHA.
S.No. Component %age in RHA 1 Silica (SiO2) 91.58 2 Alumina (Al2O3 ) 1.95 3 Iron Oxide (Fe2O3 ) 0.48 4 Lime (CaO) 0.78 5 Magnesia Oxide (MgO) 0.58 6 Potassium (K2O) 2.92 7 Others oxides 1.71
Table 3: Physical Properties of RHA
Sr. No Properties Values
1 Specific Gravity 1.987 2 Grain Size Analysis
a) Gravel Size Fraction (%) b) Sand Size Fraction (%) c) Silt & Clay Size Fraction (%)
0.00 53.4 46.6
3 Maximum Dry Density (kN/m3) 9.26
4 Optimum moisture content (%) 53.8
5 Unsoaked CBR (%) 6.7
209
• Cement
Ambuja Brand OPC 53 grade, purchased from local market is used throughout the study. The physical properties are as given below.
1. Fineness: - Specific surface are 278 m2/Kg. 2. Soundness: - When tested by “Le- Chatelier” method untreated cement expansion is
2.08 mm. 3. Setting time: - Initial setting time and final setting time are 95 and 227 minutes
respectively. 4. Compressive strength: - a) 3 days: 43.1 MPa.
b) 7 days: 54.9 MPa. c) 28 days: 57.9 MPa
• Water
Tap water was used throughout the study.
• Processing of RHA
The RHA collected from the mill was sieved from 2.36 mm sieve and then oven dried at 1050C for 24 hours.
• Mix Proportions
The following mix proportions were used throughout the study
Table 4: Mix Proportion
Sr. No. Name of Proportion RHA : CEMENT 1 RHA: Cement 100:00 2 RHA: Cement 97:03 3 RHA: Cement 94:06 4 RHA: Cement 91:09 5 RHA: Cement 88:12 6 RHA: Cement 85:15 7 RHA: Cement 82:18
METHODOLOGY
Following tests were conducted as per the Indian codal provisions.
1. Tensile strength test 2. California bearing ratio (CBR) test. 3. Durability test.
The indirect tensile test or split cylinder test involved the application a compressive load on a cylindrical specimen in a vertical diametric plane to measure the strength. The required equipments are unconfined compression machine with proving ring capacity 5 kN and accuracy 1N.
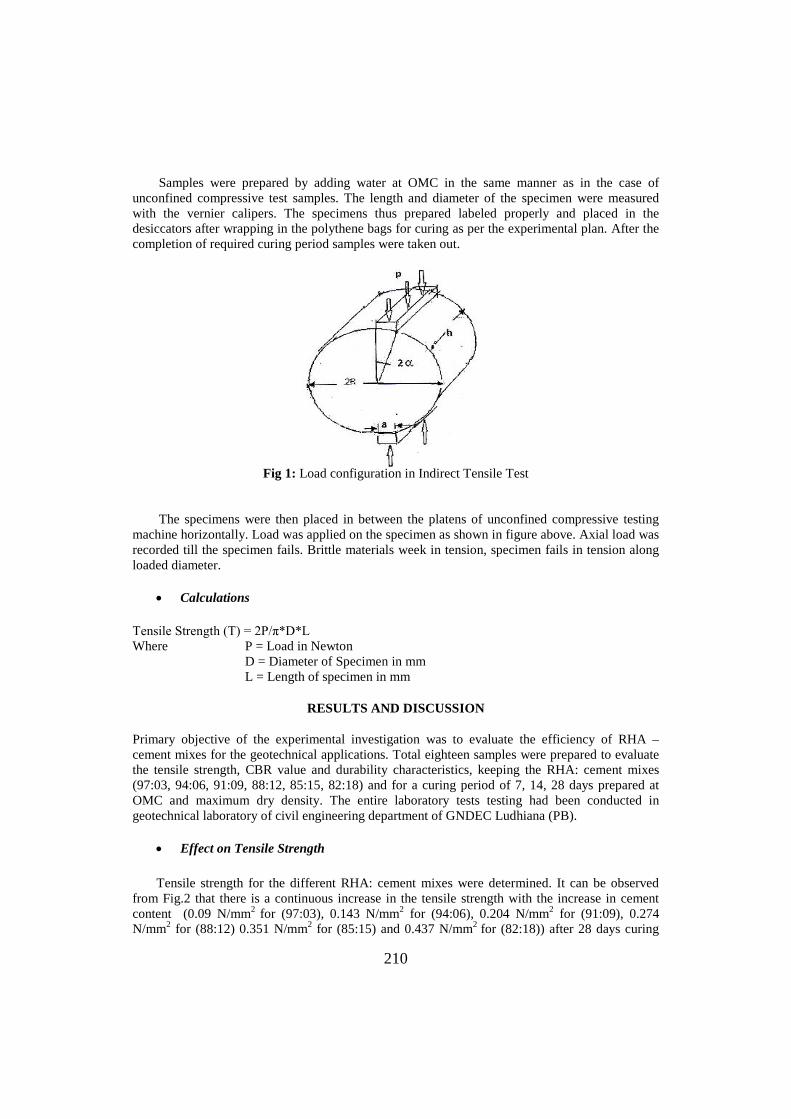
210
Samples were prepared by adding water at OMC in the same manner as in the case of unconfined compressive test samples. The length and diameter of the specimen were measured with the vernier calipers. The specimens thus prepared labeled properly and placed in the desiccators after wrapping in the polythene bags for curing as per the experimental plan. After the completion of required curing period samples were taken out.
Fig 1: Load configuration in Indirect Tensile Test
The specimens were then placed in between the platens of unconfined compressive testing machine horizontally. Load was applied on the specimen as shown in figure above. Axial load was recorded till the specimen fails. Brittle materials week in tension, specimen fails in tension along loaded diameter.
• Calculations
Tensile Strength (T) = 2P/π*D*L Where P = Load in Newton
D = Diameter of Specimen in mm L = Length of specimen in mm
RESULTS AND DISCUSSION
Primary objective of the experimental investigation was to evaluate the efficiency of RHA – cement mixes for the geotechnical applications. Total eighteen samples were prepared to evaluate the tensile strength, CBR value and durability characteristics, keeping the RHA: cement mixes (97:03, 94:06, 91:09, 88:12, 85:15, 82:18) and for a curing period of 7, 14, 28 days prepared at OMC and maximum dry density. The entire laboratory tests testing had been conducted in geotechnical laboratory of civil engineering department of GNDEC Ludhiana (PB).
• Effect on Tensile Strength
Tensile strength for the different RHA: cement mixes were determined. It can be observed from Fig.2 that there is a continuous increase in the tensile strength with the increase in cement content (0.09 N/mm2 for (97:03), 0.143 N/mm2 for (94:06), 0.204 N/mm2 for (91:09), 0.274 N/mm2 for (88:12) 0.351 N/mm2 for (85:15) and 0.437 N/mm2 for (82:18)) after 28 days curing
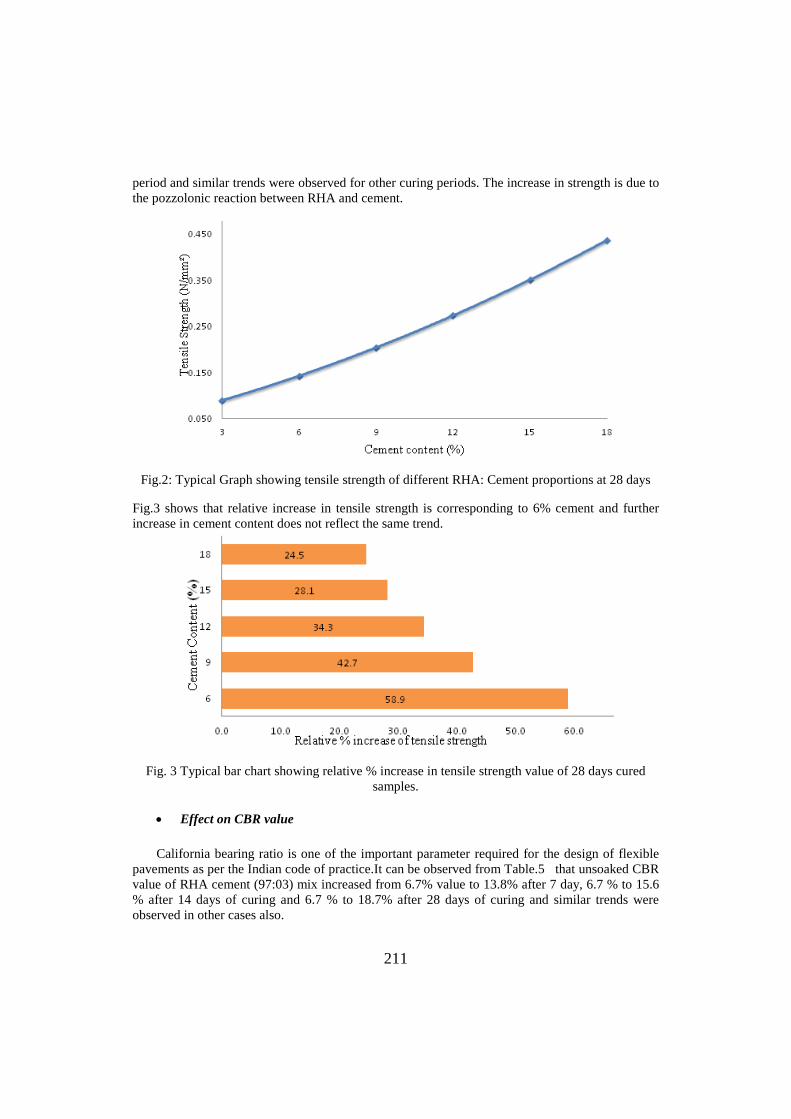
211
period and similar trends were observed for other curing periods. The increase in strength is due to the pozzolonic reaction between RHA and cement.
Fig.2: Typical Graph showing tensile strength of different RHA: Cement proportions at 28 days
Fig.3 shows that relative increase in tensile strength is corresponding to 6% cement and further increase in cement content does not reflect the same trend.
Fig. 3 Typical bar chart showing relative % increase in tensile strength value of 28 days cured samples.
• Effect on CBR value
California bearing ratio is one of the important parameter required for the design of flexible pavements as per the Indian code of practice.It can be observed from Table.5 that unsoaked CBR value of RHA cement (97:03) mix increased from 6.7% value to 13.8% after 7 day, 6.7 % to 15.6 % after 14 days of curing and 6.7 % to 18.7% after 28 days of curing and similar trends were observed in other cases also.
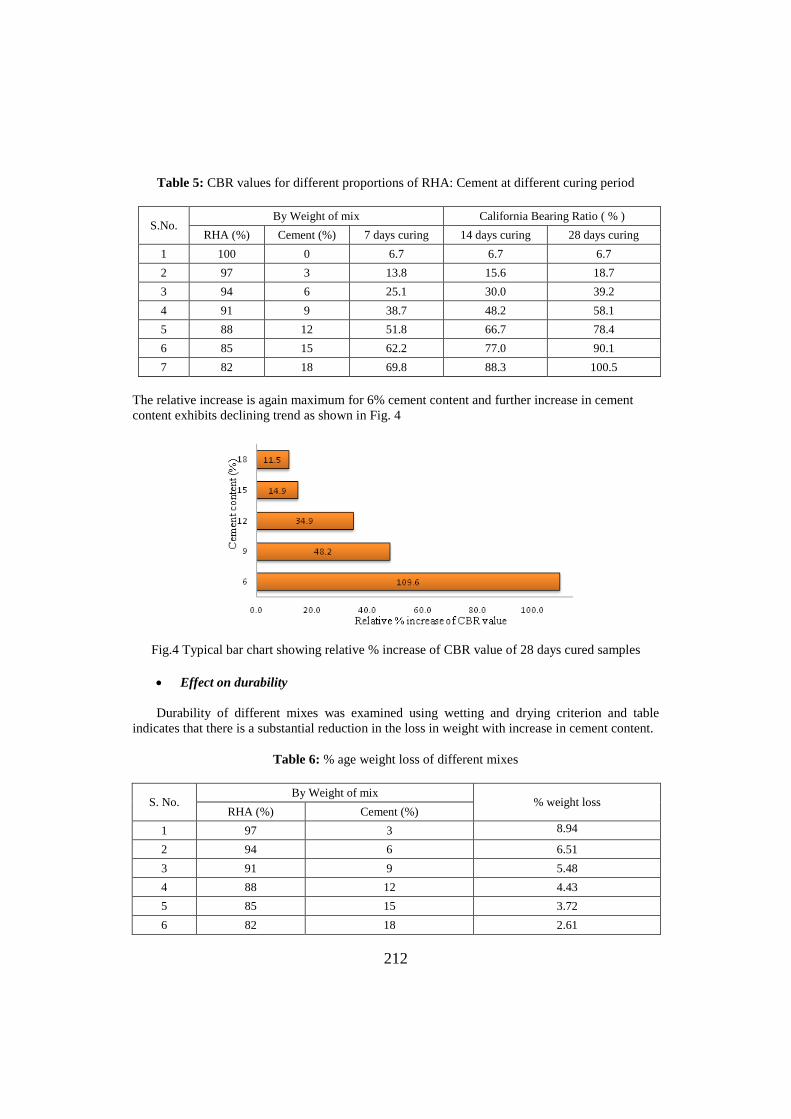
212
Table 5: CBR values for different proportions of RHA: Cement at different curing period
S.No. By Weight of mix California Bearing Ratio ( % )
RHA (%) Cement (%) 7 days curing 14 days curing 28 days curing 1 100 0 6.7 6.7 6.7 2 97 3 13.8 15.6 18.7 3 94 6 25.1 30.0 39.2 4 91 9 38.7 48.2 58.1 5 88 12 51.8 66.7 78.4 6 85 15 62.2 77.0 90.1 7 82 18 69.8 88.3 100.5
The relative increase is again maximum for 6% cement content and further increase in cement content exhibits declining trend as shown in Fig. 4
Fig.4 Typical bar chart showing relative % increase of CBR value of 28 days cured samples
• Effect on durability
Durability of different mixes was examined using wetting and drying criterion and table indicates that there is a substantial reduction in the loss in weight with increase in cement content.
Table 6: % age weight loss of different mixes
S. No. By Weight of mix
% weight loss RHA (%) Cement (%)
1 97 3 8.94 2 94 6 6.51
3 91 9 5.48 4 88 12 4.43 5 85 15 3.72 6 82 18 2.61
213
CONCLUSIONS
On the basis of investigations conducted, the following conclusions are made.
1. Tensile strength for different mixes exhibits significant increase and the maximum relative increase was observed for a mix having 6% cement after 28 days curing period
2. Similar trends has been observed in the unsoaked CBR values for various cases and the maximum relative increase was observed at 6% cement content
3. Durability test shows that the loss of weight after 12 cycles of wet and drying was between 2.61% for 18% cement (28 days curing) and 8.94% for 3% cement (28 days curing) which is well within permissible limits.
References
A A Ramzanianpour, M. Mahdi Khan & Gh. Ahmadiban (2009) “The effect of rice husk ash on Mechanical properties and durability of sustainable concrete”.
Alirija Naji Givi, Soraya Abdul Rashid, Farah Nora A Aziz, Mohamad Amran Mohd. Salleh (2010) "Contribution of rice husk ash to the Properties of Mortar & Concrete”: A review
Andres Salas, Silvio Delvasto, Ruby Mejia De Gutierrez & David Lange (2009) " Comparison of two processes for treating rice husk ash for use in high performance concrete”
E.A.Basha, R.Hashim, H.B. Mahmud & A.S.Muntohar (2005) “Stabilization of residual soil with rice husk ash and cement. Original research article construction & Building Material , Volume -19, Issue-6
J.N. Jha & K.S.Gill (2006) “Effect of rice husk ash on lime stabilization". Laxmikant Yadu, Rajesh Kumar Tripathi & Dharamveer Singh (2011) “ Comparison of fly ash and rice
husk ash stabilized black cotton soil”.
214
SEISMIC RETROFITTING OF STRUCTURE BY CONVENTIONAL METHOD
Th. Kiranbala Devi*, N. Monika Chanu**, T. Bishworjit Singh** and S. Satyakumar Singh**
* Faculty of the Manipur Institute of Technology, Manipur University, India ** B.E. Civil Engineering Final year student, Manipur Institute of Technology, M.U. India
Abstract: The need of seismic retrofitting of building arises for the hazard mitigation of the society. The necessity of retrofitting of earthquake vulnerable buildings may be done due to one or more reasons such as buildings that have been designed according to older seismic codes; buildings of great value or importance like hospitals, monuments, and buildings which is essentially to be used just after the earthquake. Retrofitting of existing structures with insufficient seismic resistance accounts for a major portion of hazard mitigation. Thus, it is of critical importance that the structures that need seismic retrofitting are identified correctly before selecting an effective retrofitting method. At the stage of selecting the retrofitting method, the current status of the existing structure and its performance are known, and the performance required for the structure after retrofitting and the conditions for retrofitting works are given. For giving an effective retrofitting work selection of a proper retrofitting method is needed and selection of these various effective methods should be considered with respect to the required performance improvements, the viability of the execution of retrofitting work, the impact of the retrofitting work on the surrounding environment, the ease of maintenance after retrofitting, economy and other factors. The conventional retrofitting method consisting of strengthening of structural walls and bracing, column jacketing, beam jacketing, addition of column members to remedy vertical irregularities etc. are prominent effective strengthening method of structures.
INTRODUCTION
Most of the existing buildings which do not fulfill the current seismic requirements may suffer extensive damage or even collapse if shaken by a severe ground motion. Seismic retrofitting of structures has become remarkable issue to be solved. The numerous collapses of multistoried buildings in the Bhuj earthquake of 2001 have clearly shown the seismic vulnerability of a large building stock in our country. Hence, a large number of buildings is provided additional strength, stiffness and ductility to ensure acceptable performance in the future earthquake. In Bhuj city, more than 3000 lost their lives, the main hospital was crushed and 90% of the buildings were destroyed. Where and how are we going in our journey to make the structures we build more resistant to earthquakes? To classify vulnerable buildings and to carry out a rational retrofitting project, proper analysis is needed, which takes into account the post elastic response of the building.
• Seismic evaluation of existing buildings
The parameters governing retrofit evaluation are: 1. Estimation of the structural vulnerability of a building under Seismic loading 2. Earthquake intensity
215
3. Structural configuration and components 4. Structural condition 5. Geological condition 6. Foundation capability 7. Non-structural components 8. Socio-economic factors that govern the use and importance of the building
Assessment of an existing structure is much more difficult task than evaluation of a design on paper. Firstly, the construction of the structure is never exactly as per designer’s specifications and a number of deflects and uncertainties crop up during the construction. Secondly, the quality of the material deteriorates with time and the assessment of an existing structures becomes a time dependant problem. The problem of the assessment involves not only the current status of the structure but also extrapolation in the life of the structure with or without repairs. There are three sources of deficiencies in structures:
1. Defects arising from the original design, such as under estimation of loads as per old standards/practices, inadequate section/reinforcement, inadequate reinforcement anchorage and detailing.
2. Defects arising from original construction, such as under strength concrete, poor compaction, poor construction joints, improper placing of reinforcement and honey combing.
3. Deterioration since the completion of the construction due to reinforcement corrosion, alkali-aggregate reaction, etc.
In Indian conditions, it is generally a combination of all the three deficiencies and the retrofitting of the structure has to be taken care of all the three. Accordingly to the Vulnerability Atlas of the country, more than 80% houses are non-engineered construction, which are mainly load bearing buildings. Evaluation of an existing building is a difficult task, involving considerable cost and efforts and requires skills in different disciplines of structural engineering including materials. Seismic retrofitting of buildings is still a new activity for most structural engineers. The retrofitting of a building requires an appreciation for the technical, economic and social aspects of the issue in hand. Older buildings, which were designed by old codes that are now known to provide inadequate safety, are likely to be vulnerable to severe damage or collapse under strong seismic excitation. The recent earthquakes in U.S.A(Northridge 1994), Japan (Kobe 1995, Turkey (Goleuk-Izmit 1999) and Taiwan (Chi-chi 1999), India (Bhuj 2001), Haiti 2010, Chile 2010, India (Sikkim 2011) revealed the fact that an earthquake does not necessarily have to be the “big one” to cause wide spread destruction, especially among older buildings. Past earthquakes have also demonstrated that these older buildings would have survived, in most cases with a reasonable upgrading.
RETROFIT
Seismic retrofit becomes necessary if it is shown that, through a seismic performance evaluation, the building does not meet minimum requirements up to the current building code and may suffer severe damage or even collapse during a seismic event. Changes in Construction technologies and innovation in retrofit technologies present added challenge to engineers in selecting a technically, economically and socially acceptable solution. Conventional upgrading techniques usually include the addition and or strengthening of existing walls, frames and foundations.
216
• Steps for Retrofitting
Before undertaking any retrofit, it is imperative to carry out the following procedures 1. Data collection or information gathering of structures from architectural and structural
drawings 2. Performance characteristics of similar type of buildings on past earthquakes
• Data collection
a) Building Data • Architectural, structural and construction drawings • Vulnerability parameter: number of stories, year of construction and total floor area • Specifications, soil reports and design calculations • Seismicity of the site
b) Construction data • Identification of gravity load resisting system • Identification of lateral load resisting system • Maintenance, addition, alteration or modification in structures • Field surveys of the structure’s existing condition c). Structural data • Materials • Structural concept: vertical and horizontal irregularities, torsional eccentricity, pounding, short column and others • Detailing concept: ductile detailings, special confinement reinforcement • Foundations • Non-structural elements
If damages are not available, careful field measurements (backed by chipping of members to locate reinforcement) and other non-destructive tests such as rebound hammer, ultrasonic pulse velocity measurement, rebar locator survey, etc. to determine the condition of the existing structure are essential.
As there is no specific code for seismic retrofitting of structures currently in India, the
designer will attempt to upgrade the structure for adequate performance under the seismic loads per present-day provisions of seismic codes. However, cost becomes a governing criterion many times and it would be advisable that in low seismic zones, seismic retrofitting be taken up whenever non-seismic rehabilitation and repairs are planned. There are usually three classes of retrofit:
Class A retrofit: It is that level of retrofit which exceeds even the requirements for new buildings. It may be prudent to use such superior retrofit levels for structures which must perform with practically zero damage during earthquake such as emergency shelters, hospitals and other essential facility buildings. Class B retrofit: The structure is retrofitted to the same standard as that applicable for new construction. This should ordinarily be aimed at regular structures but this is not always possible due to governing economic considerations or other practical constraints.
217
Class C retrofit: In this class, the structure is retrofitted to a less than code-specified standard for new construction. This is not the most desirable situation, but it is better doing nothing. In general, most retrofits fall in the class C category.
• Strengthening or retrofitting Vs Reconstruction
Replacement of damaged buildings or existing unsafe buildings by reconstruction is generally avoided due to a number of reasons, the main ones among them being:
1). Higher cost than that of strengthening or retrofitting 2) Preservation of historical architecture and 3) Maintaining functional social and cultural environment In most instances, however, the relative cost of retrofitting to reconstruction cost determines the decision.
CONVENTIONAL METHOD OF RETROFITTING
Selection of appropriate retrofitting method is an important step in retrofitting work. Once the decision is made, seismic retrofitting can be performed through several methods with various objectives such as increasing the load, deformation and energy dissipation capacity of the structure. In conventional retrofitting methods, new structural elements are added to the system, thereby, enlarging the existing members. In conventional retrofitting techniques of frame structures, the main challenge is to enhance ductility and induce a desired ductile behaviour with a preferred, predetermined pattern of plastic hinge formation. In most cases, enhancement of ductility also results in enhancement of strength. The main elements of lateral force-resisting frames are columns, beams and the joint. Jacketing is a conventional method for strengthening column.
• Columns
Jacketing of column consists of adding concrete with transverse and longitudinal reinforcement around existing columns. It improves axial and shear strength, thereby, increasing lateral load capacity of the building. When using steel jacketing, it is assumed that the column is adequate for gravity loads and requires only seismic enhancement.
This intension is to provide additional ductility to the column and not increase overall flexural
strength of the concrete. The steel jacketing is effective in providing passive confinement. The behaviour of the steel jacket is analogous to that of continuous hoop reinforcement. For rectangular columns, the behaviour of an oval jacket, which provide a continuous confining action similar to that of a circular column, would be superior. The space between the jacket and the column is filled with concrete. Rectangular column so retrofitted have also performed exceptionally well in flexure and shear. Steel jacket have proved to be very satisfactory in inhibiting splice failure, providing flexural ductility and enhancing shear strength. The major advantage of steel jacketing is that there is no significant increase in the size of the column.
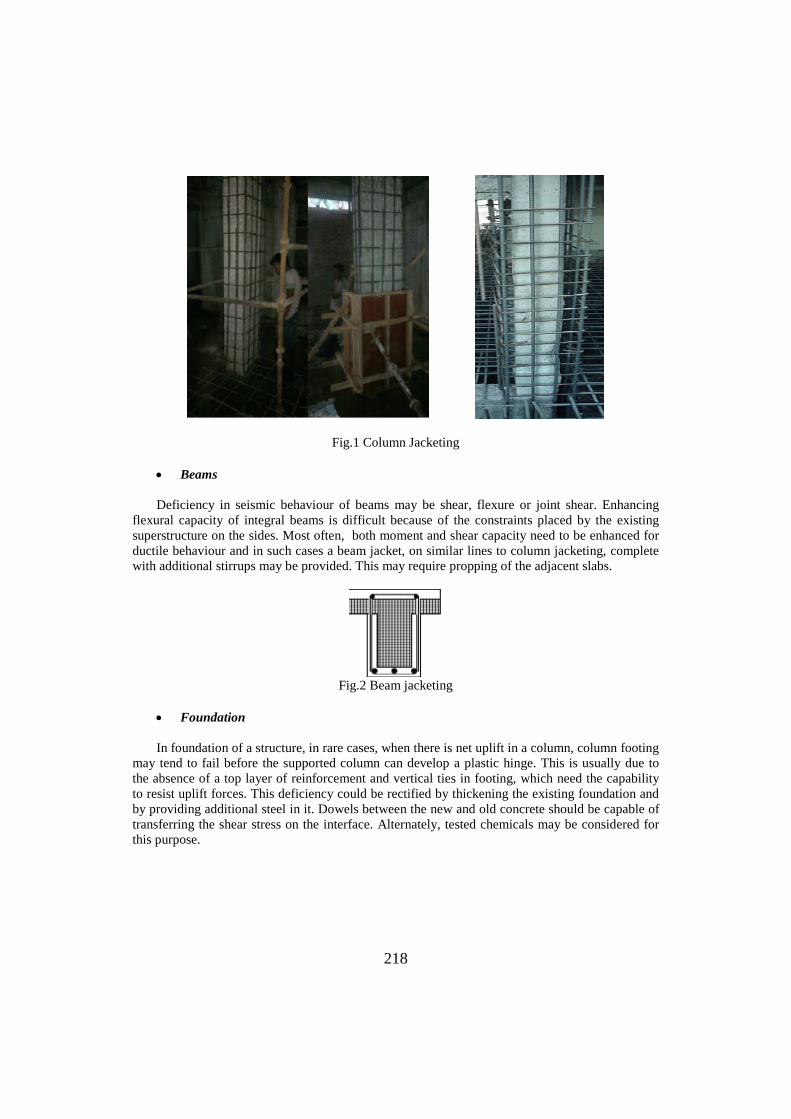
218
Fig.1 Column Jacketing
• Beams
Deficiency in seismic behaviour of beams may be shear, flexure or joint shear. Enhancing flexural capacity of integral beams is difficult because of the constraints placed by the existing superstructure on the sides. Most often, both moment and shear capacity need to be enhanced for ductile behaviour and in such cases a beam jacket, on similar lines to column jacketing, complete with additional stirrups may be provided. This may require propping of the adjacent slabs.
Fig.2 Beam jacketing
• Foundation
In foundation of a structure, in rare cases, when there is net uplift in a column, column footing may tend to fail before the supported column can develop a plastic hinge. This is usually due to the absence of a top layer of reinforcement and vertical ties in footing, which need the capability to resist uplift forces. This deficiency could be rectified by thickening the existing foundation and by providing additional steel in it. Dowels between the new and old concrete should be capable of transferring the shear stress on the interface. Alternately, tested chemicals may be considered for this purpose.
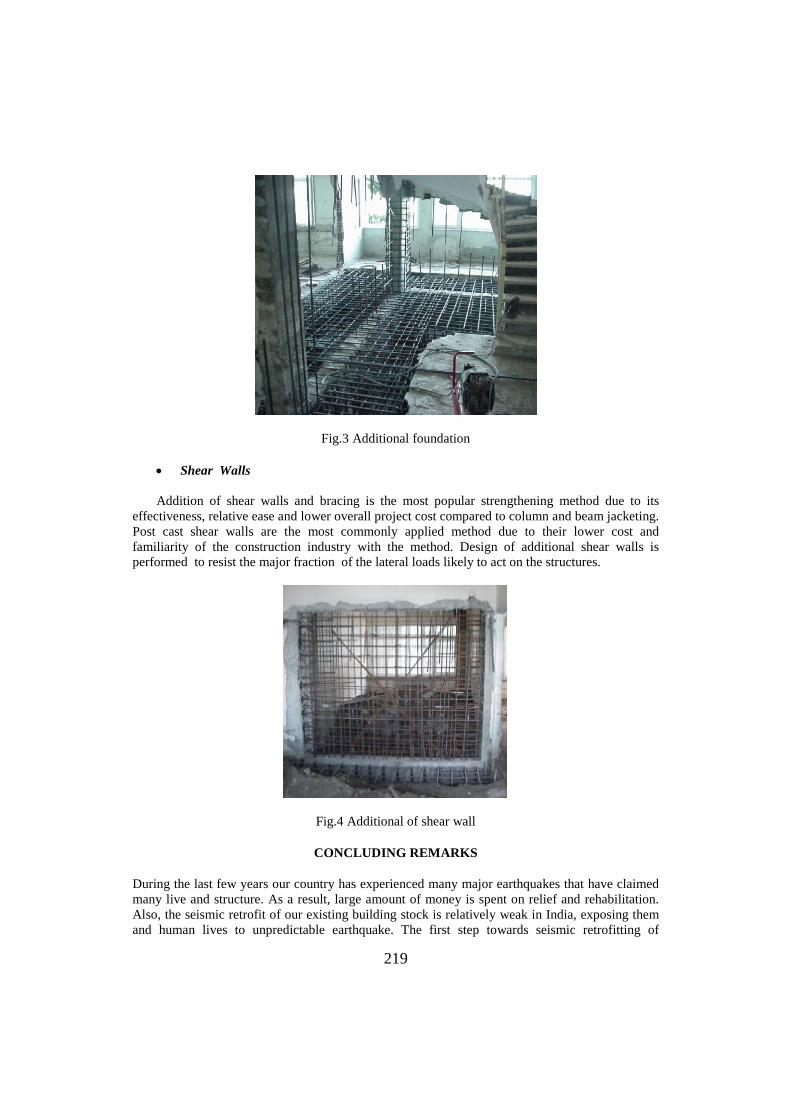
219
Fig.3 Additional foundation
• Shear Walls
Addition of shear walls and bracing is the most popular strengthening method due to its effectiveness, relative ease and lower overall project cost compared to column and beam jacketing. Post cast shear walls are the most commonly applied method due to their lower cost and familiarity of the construction industry with the method. Design of additional shear walls is performed to resist the major fraction of the lateral loads likely to act on the structures.
Fig.4 Additional of shear wall
CONCLUDING REMARKS
During the last few years our country has experienced many major earthquakes that have claimed many live and structure. As a result, large amount of money is spent on relief and rehabilitation. Also, the seismic retrofit of our existing building stock is relatively weak in India, exposing them and human lives to unpredictable earthquake. The first step towards seismic retrofitting of
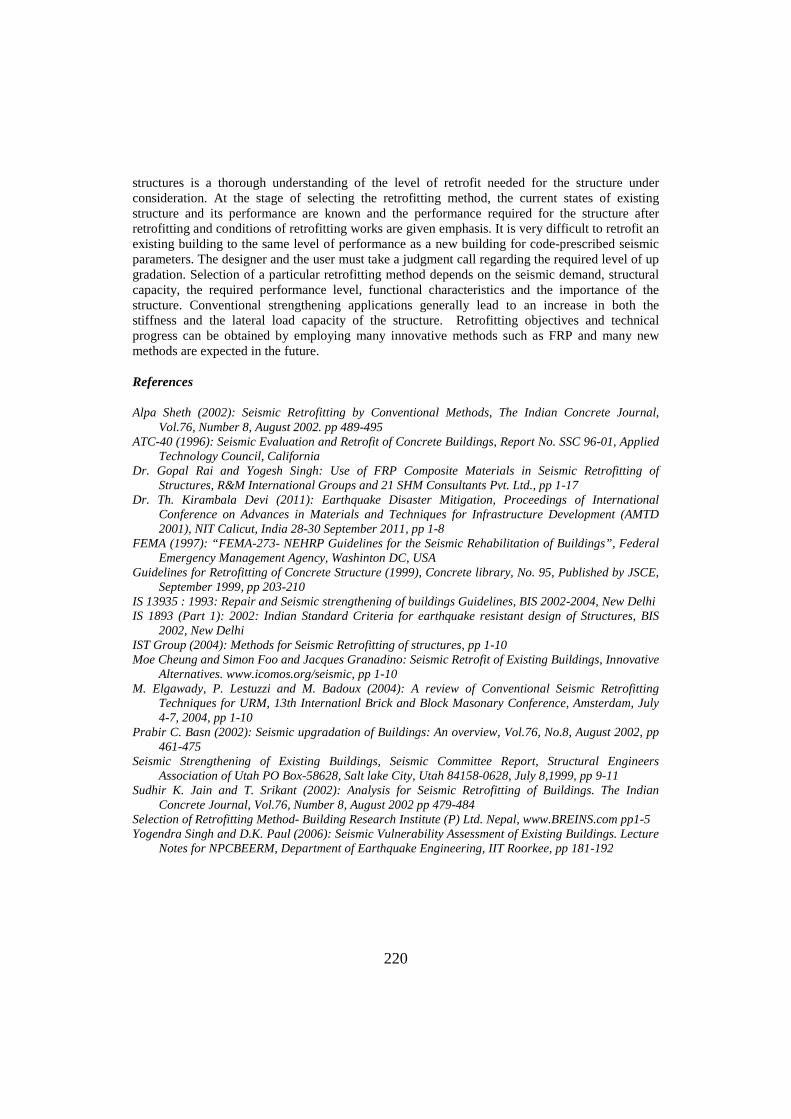
220
structures is a thorough understanding of the level of retrofit needed for the structure under consideration. At the stage of selecting the retrofitting method, the current states of existing structure and its performance are known and the performance required for the structure after retrofitting and conditions of retrofitting works are given emphasis. It is very difficult to retrofit an existing building to the same level of performance as a new building for code-prescribed seismic parameters. The designer and the user must take a judgment call regarding the required level of up gradation. Selection of a particular retrofitting method depends on the seismic demand, structural capacity, the required performance level, functional characteristics and the importance of the structure. Conventional strengthening applications generally lead to an increase in both the stiffness and the lateral load capacity of the structure. Retrofitting objectives and technical progress can be obtained by employing many innovative methods such as FRP and many new methods are expected in the future. References
Alpa Sheth (2002): Seismic Retrofitting by Conventional Methods, The Indian Concrete Journal, Vol.76, Number 8, August 2002. pp 489-495
ATC-40 (1996): Seismic Evaluation and Retrofit of Concrete Buildings, Report No. SSC 96-01, Applied Technology Council, California
Dr. Gopal Rai and Yogesh Singh: Use of FRP Composite Materials in Seismic Retrofitting of Structures, R&M International Groups and 21 SHM Consultants Pvt. Ltd., pp 1-17
Dr. Th. Kirambala Devi (2011): Earthquake Disaster Mitigation, Proceedings of International Conference on Advances in Materials and Techniques for Infrastructure Development (AMTD 2001), NIT Calicut, India 28-30 September 2011, pp 1-8
FEMA (1997): “FEMA-273- NEHRP Guidelines for the Seismic Rehabilitation of Buildings”, Federal Emergency Management Agency, Washinton DC, USA
Guidelines for Retrofitting of Concrete Structure (1999), Concrete library, No. 95, Published by JSCE, September 1999, pp 203-210
IS 13935 : 1993: Repair and Seismic strengthening of buildings Guidelines, BIS 2002-2004, New Delhi IS 1893 (Part 1): 2002: Indian Standard Criteria for earthquake resistant design of Structures, BIS
2002, New Delhi IST Group (2004): Methods for Seismic Retrofitting of structures, pp 1-10 Moe Cheung and Simon Foo and Jacques Granadino: Seismic Retrofit of Existing Buildings, Innovative
Alternatives. www.icomos.org/seismic, pp 1-10 M. Elgawady, P. Lestuzzi and M. Badoux (2004): A review of Conventional Seismic Retrofitting
Techniques for URM, 13th Internationl Brick and Block Masonary Conference, Amsterdam, July 4-7, 2004, pp 1-10
Prabir C. Basn (2002): Seismic upgradation of Buildings: An overview, Vol.76, No.8, August 2002, pp 461-475
Seismic Strengthening of Existing Buildings, Seismic Committee Report, Structural Engineers Association of Utah PO Box-58628, Salt lake City, Utah 84158-0628, July 8,1999, pp 9-11
Sudhir K. Jain and T. Srikant (2002): Analysis for Seismic Retrofitting of Buildings. The Indian Concrete Journal, Vol.76, Number 8, August 2002 pp 479-484
Selection of Retrofitting Method- Building Research Institute (P) Ltd. Nepal, www.BREINS.com pp1-5 Yogendra Singh and D.K. Paul (2006): Seismic Vulnerability Assessment of Existing Buildings. Lecture
Notes for NPCBEERM, Department of Earthquake Engineering, IIT Roorkee, pp 181-192
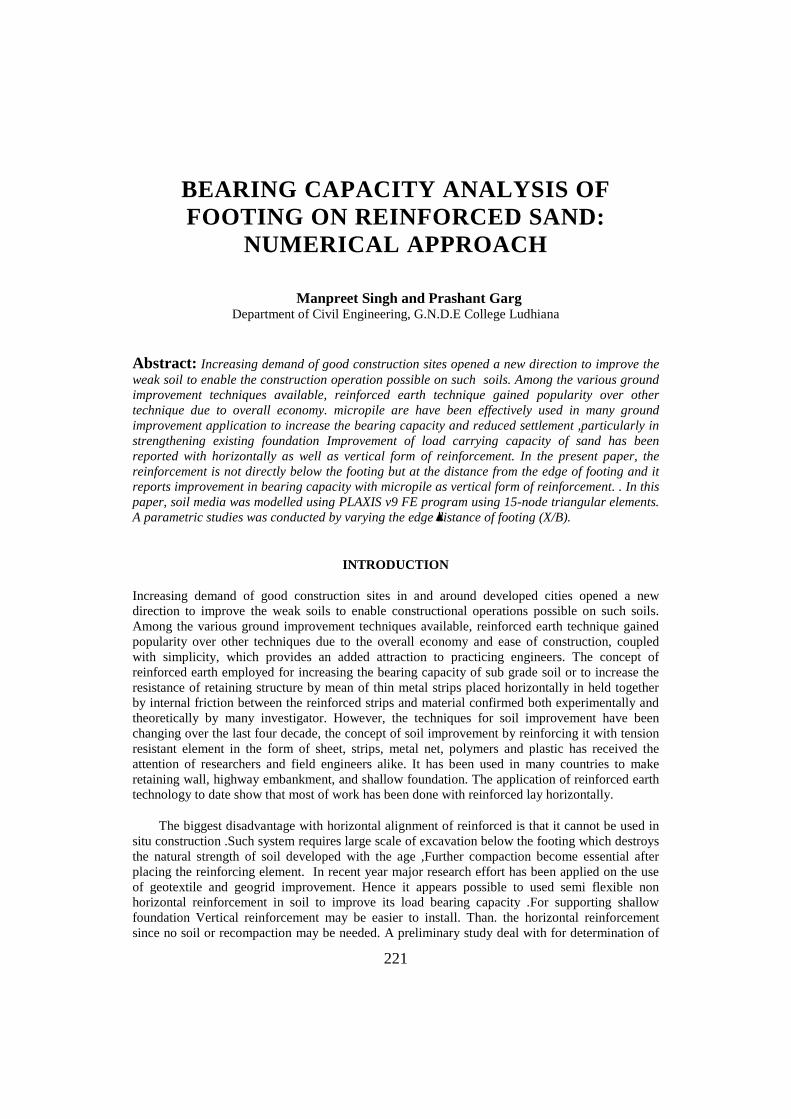
221
BEARING CAPACITY ANALYSIS OF FOOTING ON REINFORCED SAND:
NUMERICAL APPROACH
Manpreet Singh and Prashant Garg Department of Civil Engineering, G.N.D.E College Ludhiana
Abstract: Increasing demand of good construction sites opened a new direction to improve the weak soil to enable the construction operation possible on such soils. Among the various ground improvement techniques available, reinforced earth technique gained popularity over other technique due to overall economy. micropile are have been effectively used in many ground improvement application to increase the bearing capacity and reduced settlement ,particularly in strengthening existing foundation Improvement of load carrying capacity of sand has been reported with horizontally as well as vertical form of reinforcement. In the present paper, the reinforcement is not directly below the footing but at the distance from the edge of footing and it reports improvement in bearing capacity with micropile as vertical form of reinforcement. . In this paper, soil media was modelled using PLAXIS v9 FE program using 15-node triangular elements. A parametric studies was conducted by varying the edge distance of footing (X/B).
INTRODUCTION
Increasing demand of good construction sites in and around developed cities opened a new direction to improve the weak soils to enable constructional operations possible on such soils. Among the various ground improvement techniques available, reinforced earth technique gained popularity over other techniques due to the overall economy and ease of construction, coupled with simplicity, which provides an added attraction to practicing engineers. The concept of reinforced earth employed for increasing the bearing capacity of sub grade soil or to increase the resistance of retaining structure by mean of thin metal strips placed horizontally in held together by internal friction between the reinforced strips and material confirmed both experimentally and theoretically by many investigator. However, the techniques for soil improvement have been changing over the last four decade, the concept of soil improvement by reinforcing it with tension resistant element in the form of sheet, strips, metal net, polymers and plastic has received the attention of researchers and field engineers alike. It has been used in many countries to make retaining wall, highway embankment, and shallow foundation. The application of reinforced earth technology to date show that most of work has been done with reinforced lay horizontally.
The biggest disadvantage with horizontal alignment of reinforced is that it cannot be used in situ construction .Such system requires large scale of excavation below the footing which destroys the natural strength of soil developed with the age ,Further compaction become essential after placing the reinforcing element. In recent year major research effort has been applied on the use of geotextile and geogrid improvement. Hence it appears possible to used semi flexible non horizontal reinforcement in soil to improve its load bearing capacity .For supporting shallow foundation Vertical reinforcement may be easier to install. Than. the horizontal reinforcement since no soil or recompaction may be needed. A preliminary study deal with for determination of
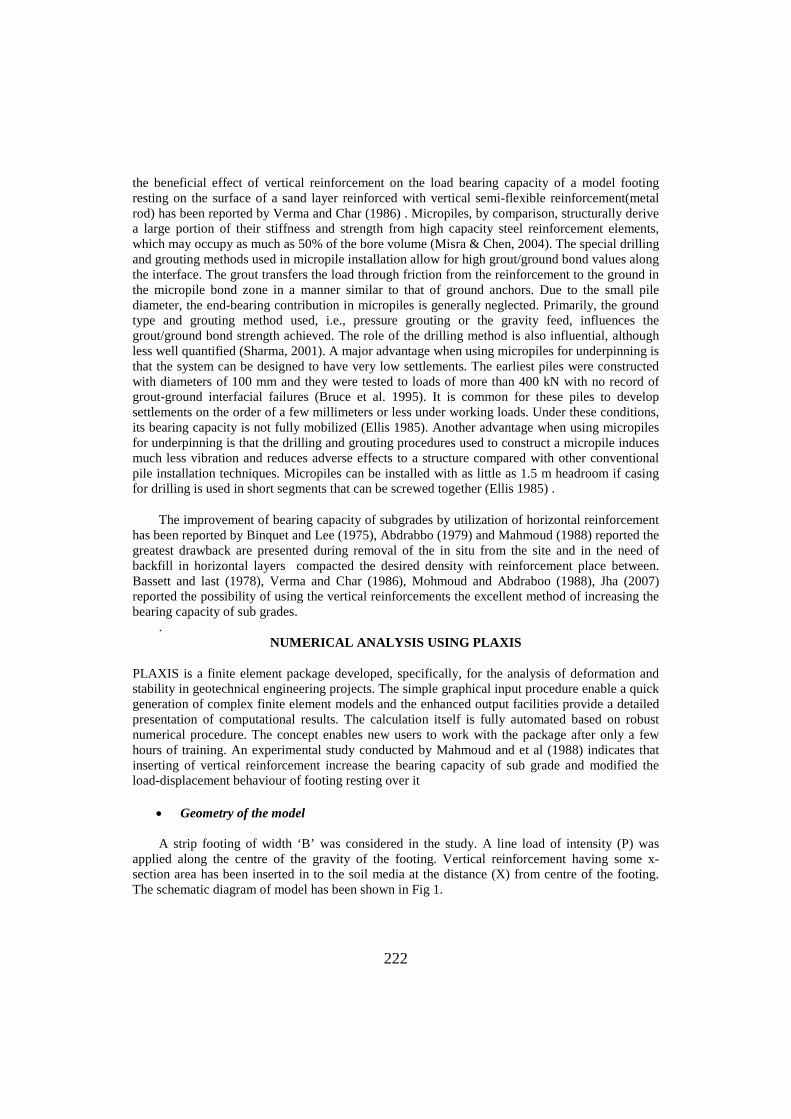
222
the beneficial effect of vertical reinforcement on the load bearing capacity of a model footing resting on the surface of a sand layer reinforced with vertical semi-flexible reinforcement(metal rod) has been reported by Verma and Char (1986) . Micropiles, by comparison, structurally derive a large portion of their stiffness and strength from high capacity steel reinforcement elements, which may occupy as much as 50% of the bore volume (Misra & Chen, 2004). The special drilling and grouting methods used in micropile installation allow for high grout/ground bond values along the interface. The grout transfers the load through friction from the reinforcement to the ground in the micropile bond zone in a manner similar to that of ground anchors. Due to the small pile diameter, the end-bearing contribution in micropiles is generally neglected. Primarily, the ground type and grouting method used, i.e., pressure grouting or the gravity feed, influences the grout/ground bond strength achieved. The role of the drilling method is also influential, although less well quantified (Sharma, 2001). A major advantage when using micropiles for underpinning is that the system can be designed to have very low settlements. The earliest piles were constructed with diameters of 100 mm and they were tested to loads of more than 400 kN with no record of grout-ground interfacial failures (Bruce et al. 1995). It is common for these piles to develop settlements on the order of a few millimeters or less under working loads. Under these conditions, its bearing capacity is not fully mobilized (Ellis 1985). Another advantage when using micropiles for underpinning is that the drilling and grouting procedures used to construct a micropile induces much less vibration and reduces adverse effects to a structure compared with other conventional pile installation techniques. Micropiles can be installed with as little as 1.5 m headroom if casing for drilling is used in short segments that can be screwed together (Ellis 1985) .
The improvement of bearing capacity of subgrades by utilization of horizontal reinforcement has been reported by Binquet and Lee (1975), Abdrabbo (1979) and Mahmoud (1988) reported the greatest drawback are presented during removal of the in situ from the site and in the need of backfill in horizontal layers compacted the desired density with reinforcement place between. Bassett and last (1978), Verma and Char (1986), Mohmoud and Abdraboo (1988), Jha (2007) reported the possibility of using the vertical reinforcements the excellent method of increasing the bearing capacity of sub grades.
. NUMERICAL ANALYSIS USING PLAXIS
PLAXIS is a finite element package developed, specifically, for the analysis of deformation and stability in geotechnical engineering projects. The simple graphical input procedure enable a quick generation of complex finite element models and the enhanced output facilities provide a detailed presentation of computational results. The calculation itself is fully automated based on robust numerical procedure. The concept enables new users to work with the package after only a few hours of training. An experimental study conducted by Mahmoud and et al (1988) indicates that inserting of vertical reinforcement increase the bearing capacity of sub grade and modified the load-displacement behaviour of footing resting over it
• Geometry of the model
A strip footing of width ‘B’ was considered in the study. A line load of intensity (P) was applied along the centre of the gravity of the footing. Vertical reinforcement having some x-section area has been inserted in to the soil media at the distance (X) from centre of the footing. The schematic diagram of model has been shown in Fig 1.
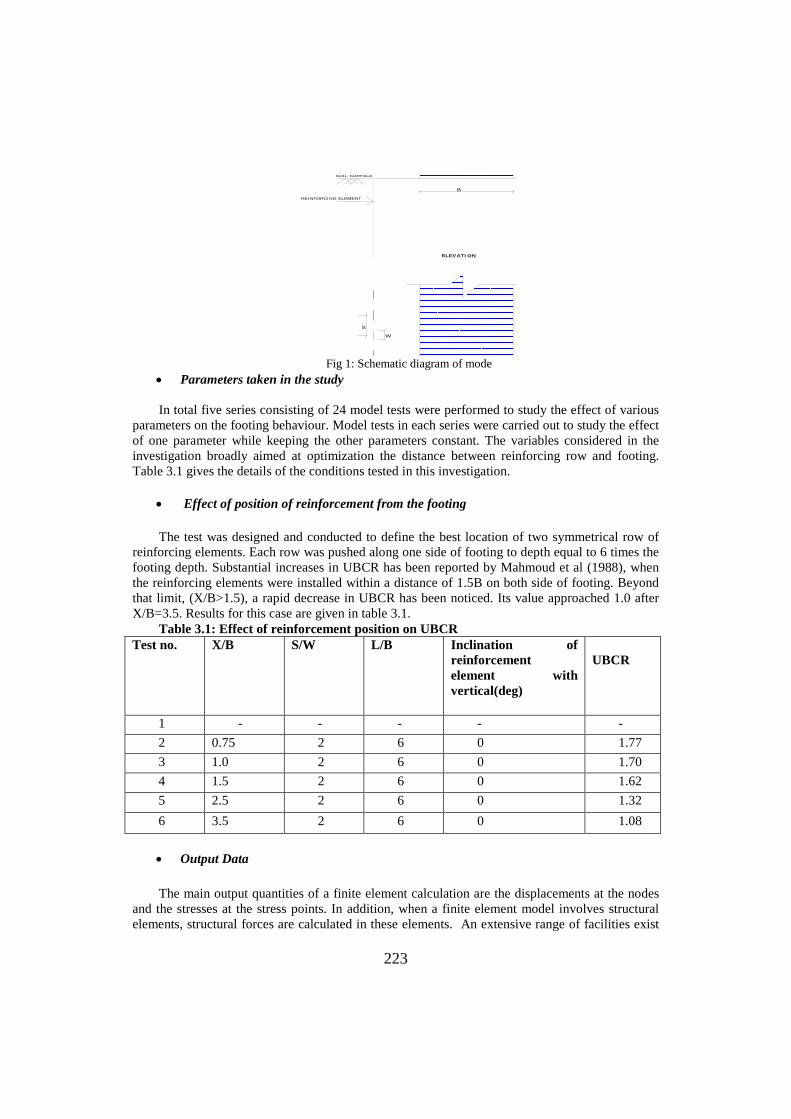
223
FOOTING
REINFORCING ELEMENT
REINFORCING STRIP
ELEVATION
PLAN
W
S
W
S
SOIL SURFACE
REINFORCING ELEMENT
L
B
X
Fig 1: Schematic diagram of mode
• Parameters taken in the study
In total five series consisting of 24 model tests were performed to study the effect of various parameters on the footing behaviour. Model tests in each series were carried out to study the effect of one parameter while keeping the other parameters constant. The variables considered in the investigation broadly aimed at optimization the distance between reinforcing row and footing. Table 3.1 gives the details of the conditions tested in this investigation.
• Effect of position of reinforcement from the footing
The test was designed and conducted to define the best location of two symmetrical row of reinforcing elements. Each row was pushed along one side of footing to depth equal to 6 times the footing depth. Substantial increases in UBCR has been reported by Mahmoud et al (1988), when the reinforcing elements were installed within a distance of 1.5B on both side of footing. Beyond that limit, (X/B>1.5), a rapid decrease in UBCR has been noticed. Its value approached 1.0 after X/B=3.5. Results for this case are given in table 3.1.
Table 3.1: Effect of reinforcement position on UBCR Test no. X/B S/W L/B Inclination of
reinforcement element with vertical(deg)
UBCR
1 - - - - - 2 0.75 2 6 0 1.77 3 1.0 2 6 0 1.70 4 1.5 2 6 0 1.62 5 2.5 2 6 0 1.32 6 3.5 2 6 0 1.08
• Output Data
The main output quantities of a finite element calculation are the displacements at the nodes and the stresses at the stress points. In addition, when a finite element model involves structural elements, structural forces are calculated in these elements. An extensive range of facilities exist
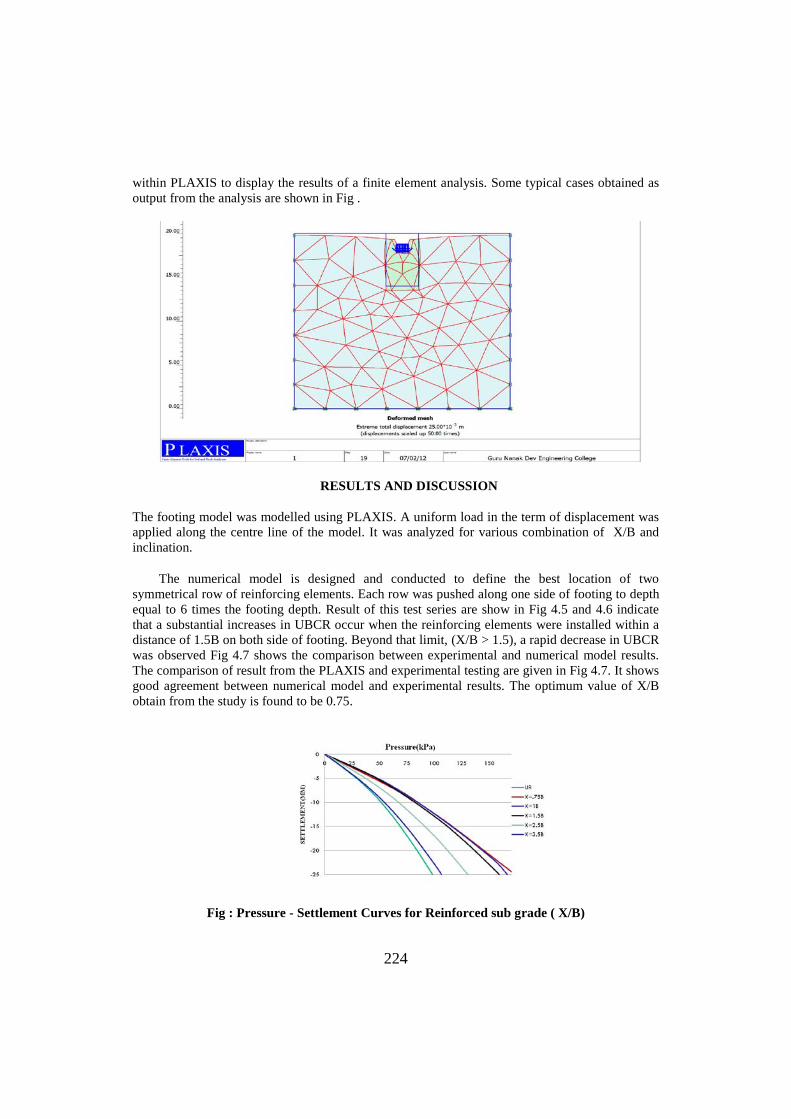
224
within PLAXIS to display the results of a finite element analysis. Some typical cases obtained as output from the analysis are shown in Fig .
RESULTS AND DISCUSSION
The footing model was modelled using PLAXIS. A uniform load in the term of displacement was applied along the centre line of the model. It was analyzed for various combination of X/B and inclination.
The numerical model is designed and conducted to define the best location of two symmetrical row of reinforcing elements. Each row was pushed along one side of footing to depth equal to 6 times the footing depth. Result of this test series are show in Fig 4.5 and 4.6 indicate that a substantial increases in UBCR occur when the reinforcing elements were installed within a distance of 1.5B on both side of footing. Beyond that limit, (X/B > 1.5), a rapid decrease in UBCR was observed Fig 4.7 shows the comparison between experimental and numerical model results. The comparison of result from the PLAXIS and experimental testing are given in Fig 4.7. It shows good agreement between numerical model and experimental results. The optimum value of X/B obtain from the study is found to be 0.75.
Fig : Pressure - Settlement Curves for Reinforced sub grade ( X/B)
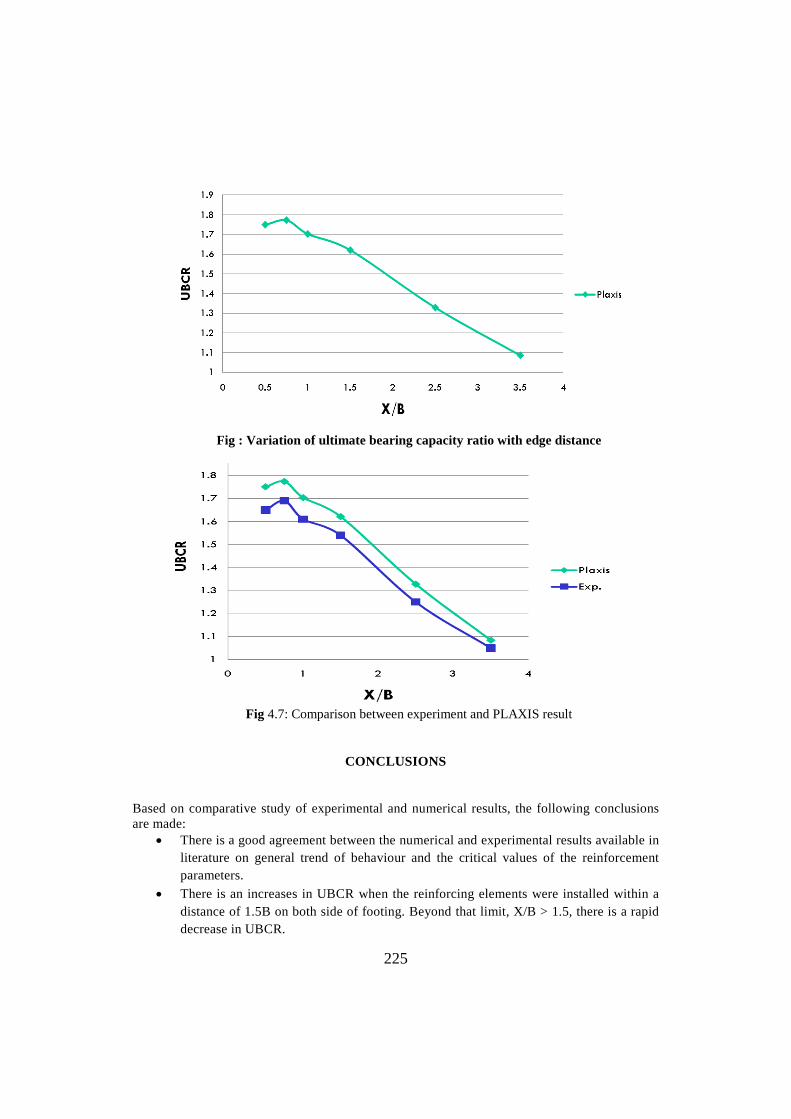
225
Fig : Variation of ultimate bearing capacity ratio with edge distance
Fig 4.7: Comparison between experiment and PLAXIS result
CONCLUSIONS
Based on comparative study of experimental and numerical results, the following conclusions are made:
• There is a good agreement between the numerical and experimental results available in literature on general trend of behaviour and the critical values of the reinforcement parameters.
• There is an increases in UBCR when the reinforcing elements were installed within a distance of 1.5B on both side of footing. Beyond that limit, X/B > 1.5, there is a rapid decrease in UBCR.
226
References
Alamshahi, S., Hataf, N. (2009), “Bearing capacity of strip footings on sand slopes reinforced with geogrid and grid anchors”, Geotextiles and Geomembranes Vol. 27, pp. 217–226. Babu, S. GL, Murthy, S. B. R., Murthy, D. S. N. and Nataraj, M. S. (2004) Bearing Capacity Improvement Using Micropiles a Case Study. Proceedings Geosupport 2004, drilled shafts, micropiling, deep mixing, remedial methods, and specialty foundation systems, Geotech. Spec. Pub. No: 124, Orlando, Florida, pp.692-699. Bathurst, R.J and Blatz, J. A. (2003), “Limit Equilibrium Analysis of Large Scale reinforced and Unreinforced Embankment Loaded by Strip Footing” Canadian Geotechnical Journal, Vol. 40, No. 6, pp. 1084-1092. Bathurst, R.J, Blatz, J. A. and Burger (2003), “Performance of Instrumented Large Scale Unreinforced and Reinforced Embankment Loaded by A Strip Footing to Failure”, Canadian Geotechnical Journal, Vol. 40, No. 6, pp. 1067-1083. Bhardwaj, D.K., Mandal, J.N. (2008), “Study on polypropylene fiber reinforced flyash slopes”, Proceedings of 12th International Conference of International Association for Computer Methods and Advances in Geomechanics, pp. 3778-3786. Choudhary A.K. and Verma B.P. (2004,), “Strength and Deformation Characteristics of Fibre Reinforced Flyash”, Proceedings of Recent Advances in Civil Engineering (RACE), CUSAT, pp. 234-242. Choudhary A.K., Jha J.N. and Gill K.S. (2010), “Laboratory investigation of bearing capacity behaviour of strip footing on reinforced flyash slope”, Geotextiles and Geomembranes, pp. 1-10. EI Sawwaf, M. A. (2007), “Behaviour of strip footing on geogrid- reinforced sand over a soft clay slope” Geotextiles and Geomembranes, Vol. 25, pp. 50-60. Jha J.N. (2007), “Effect of Vertical Reinforcement on Bearing Capacity of Footing and Sand”, Indian Geotechnical Journal 37(1) : 64-78. Lee, K.M., Manjunath, V.R. (2000), “Experimental and numerical studies of geosynthetic reinforced sand slopes loaded with footing” Canadian Geotechnical Journal Vol.37, pp. 828–842. Mahmoud M.A. and Abdrabbo, F.M. (1988), “Bearing Capacity Tests on Strip Footing Resting on Reinforced Sand Subgrades”, Canadian Geotechnical Journal, Vo. 26, pp. 154-159. Mendonca, A., Lopes, M. and Pinho-Lopes, M. (2003), “Construction and Post Construction Behaviour of Geogrid-Reinforced Steep Slope”, Journal of Geotechnical and Geological Engineering Vol. 21, pp. 129-147. Puri V.K., Hsiao J.K. and Chai J.A. (2005), “Effect of Vertical Reinforcement on Ultimate Bearing Capacity of Sand Subgrades”, Electronic Journal of Geotechnical Engineering. 10G. Purkayastha, R.D., Bhandari, G. And Gupta, S. (2006), “Failure Mechanism and Stability Analysis of Geosynthetic Reinforced Slopes,” Indian Geotechnical Conference, pp. 389-392. Satyendra and Bhattacharjee (2006), “Bearing Capacity Improvement Using Micropile”, IGC 2006, 14-16 December 2006, Chennai, India. Thanapalasingam, J. and Gnanendram, C. T. (2006), “Bearing Capacity of Foundations and near Slopes with Multi layers of Geosynthetic”, Indian Geotechnical Conference, pp. 601-604. Verma, B.P. and Char, A.N.R. (1986), “Bearing Capacity Tests on Reinforced Sand Subgrade”,
227
ENERGY SCENARIO AND OUR RESPONSIBILITY TOWARDS A
SUSTAINABLE WORLD: AN OVERVIEW
Ajay Goyal Baddi University of Emerging Sciences & Technology, Baddi, Distt Solan (H.P) - 173205
Abstract: Oil prices have broken record highs; booming growth in China, India and Brazil turns the energy world upside down, almost one out of every four people continues to live without access to modern energy; debate on use of nuclear energy as an alternate fuel; what all these make us to think? - Are we too selfish in consuming much more than we should; are we compromising with our future generations; or is it lack of awareness? We all need to cultivate, integrate and apply our knowledge about earth systems gained from holistic sciences, coordinated with knowledge about human interrelationship gained from the social sciences and humanities in order to mitigate and minimize the environmental impacts. This paper highlights some of the upfront environmental issues, issues concerned with green buildings and our role as academicians, technocrats, bureaucrats towards finding a solution and forming a sustainable society. Key Words: Energy, Sustainability, Cement and Concrete, Green Buildings
INTRODUCTION
Sustainable development is an emerging political and social issue of global significance which is necessary for three main reasons: a) to prepare ourselves for a more sustainable future; b) to meet the expectations of ultimate user; and c) to individually identify and capitalize on new market opportunities. It requires a long-term vision of industrial progress, preserving the foundations upon which human quality of life depends, respect for basic human needs and both local and global ecosystems. It becomes more significant when we see the rise in global population, which is putting increasing pressure on essential natural resources such as land and energy. All this makes imperative for us to find ways of using these resources more efficiently. The need for more environmentally and socially sustainable development has become a key agenda for governments, NGOs, businesses, society and for an individual too. The most important sectors that need attention in this regard are – Climate protection, Fuels and raw materials, Social health and safety and Reduction in emission of Green House Gases (GHG).
INTERNATIONAL CONFLICTS AND CONCERNS OVER GROWING ENERGY DEMANDS
Total world primary energy demand is projected to increase heavily over the coming decades (Fig. 1). According to International Energy Agency (IEA) forecasts, energy demand is set to rise by 60% in the period up to 2030 (Fig2). And consequently we are heading rapidly towards a point of irreversible, catastrophic climate change that could bring rising global sea levels. An end to the Gulf Stream and its benign warming effect on North America and Europe; an accelerating loss of biodiversity throughout the world; widespread drought and extreme weather turbulences are some
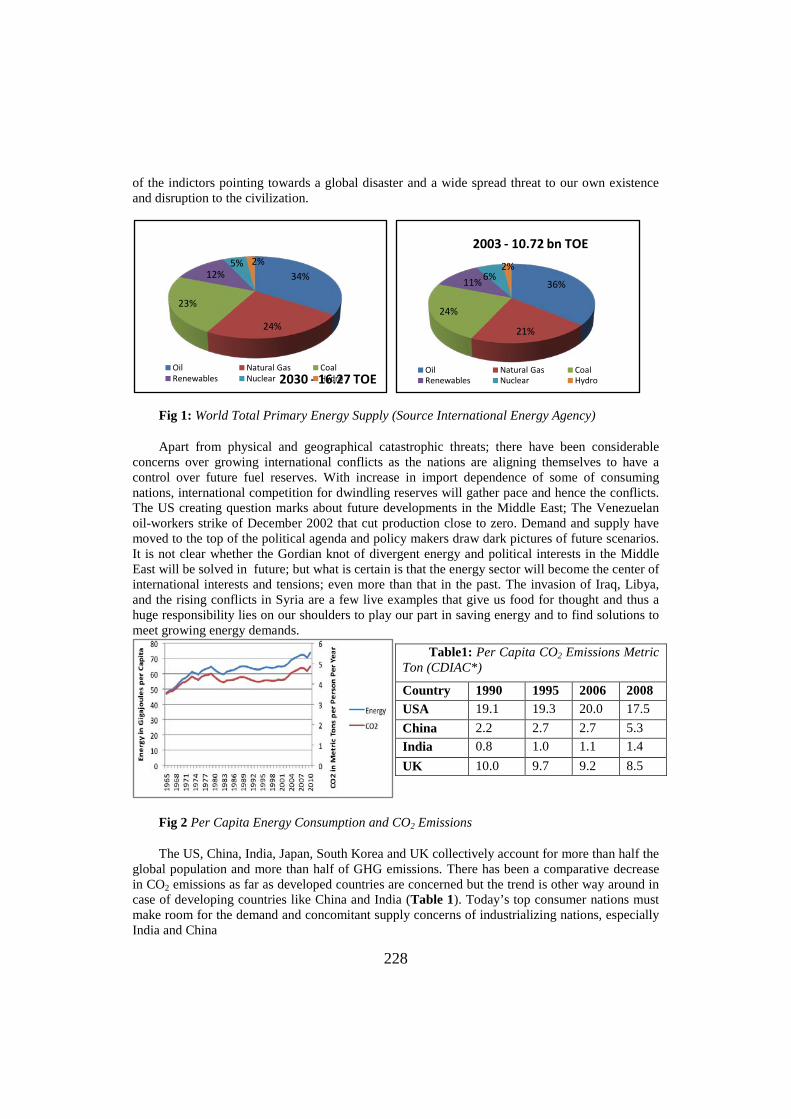
228
of the indictors pointing towards a global disaster and a wide spread threat to our own existence and disruption to the civilization.
Fig 1: World Total Primary Energy Supply (Source International Energy Agency)
Apart from physical and geographical catastrophic threats; there have been considerable concerns over growing international conflicts as the nations are aligning themselves to have a control over future fuel reserves. With increase in import dependence of some of consuming nations, international competition for dwindling reserves will gather pace and hence the conflicts. The US creating question marks about future developments in the Middle East; The Venezuelan oil-workers strike of December 2002 that cut production close to zero. Demand and supply have moved to the top of the political agenda and policy makers draw dark pictures of future scenarios. It is not clear whether the Gordian knot of divergent energy and political interests in the Middle East will be solved in future; but what is certain is that the energy sector will become the center of international interests and tensions; even more than that in the past. The invasion of Iraq, Libya, and the rising conflicts in Syria are a few live examples that give us food for thought and thus a huge responsibility lies on our shoulders to play our part in saving energy and to find solutions to meet growing energy demands.
Fig 2 Per Capita Energy Consumption and CO2 Emissions
The US, China, India, Japan, South Korea and UK collectively account for more than half the global population and more than half of GHG emissions. There has been a comparative decrease in CO2 emissions as far as developed countries are concerned but the trend is other way around in case of developing countries like China and India (Table 1). Today’s top consumer nations must make room for the demand and concomitant supply concerns of industrializing nations, especially India and China
34%
24%
23%
12%5% 2%
2030 - 16.27 TOE Oil Natural Gas CoalRenewables Nuclear Hydro
36%
21%
24%
11%6%2%
2003 - 10.72 bn TOE
Oil Natural Gas CoalRenewables Nuclear Hydro
Table1: Per Capita CO2 Emissions Metric Ton (CDIAC*)
Country 1990 1995 2006 2008 USA 19.1 19.3 20.0 17.5 China 2.2 2.7 2.7 5.3 India 0.8 1.0 1.1 1.4 UK 10.0 9.7 9.2 8.5
229
SUSTAINABLE SOCIETY THROUGH SUSTAINABLE CONSTRUCTION PRACTICES
Fossil fuel combustion is pouring carbon dioxide into the atmosphere at the rate of 25bn tons/year or 800 tons/sec – and this rate is not getting slowed by any means. Cement, an important material in the construction of the infrastructure and as a major constituent of concrete, forms a fundamental element of any housing or infrastructure development. The industry produces more than 2 billion tons of cement annually- a 'glue' which holds together much of our modern global infrastructure. But cement manufacture is an energy intensive process; consumes energy from fossil fuels releasing carbon dioxide (CO2); the most critical GHG into the atmosphere causing climate change. The world emission of CO2 from the combustion of fossil fuel and industrial processes has crossed 25 billion tons.
With each ton of cement produced, one ton of CO2 is released into atmosphere which in total accounts for about 7% of global man-made CO2 emissions, of which 50% is from the chemical process, and 40% from burning fuels. Also the burning of fossil fuels emits sulfur dioxide (SO2) and nitrogen oxides (NOx) that react in the atmosphere with water, oxygen and oxidants to form acidic compounds (sulfuric acid and nitric acid). Some of these compounds fall to earth in the form of acid rain, snow or fog. Acid rain increases acidity of lakes and streams and damages trees at high elevations and also accelerates the decay of building materials and paints. Aside from their contribution to acid rain, SO2 and NOx gases and their particulate matter derivatives (sulfates and nitrates) contribute to smog and endanger public health.
Use of Alternate and Supplementary Cementitious Materials -Cement industry has a huge potential, capacity and opportunity as well, in reducing the environmental impacts by utilizing the wastes produced out of various industries and agricultural sector, as supplementary cementitious material. After the enforcement of The Kyoto Protocol in February 2005, out of 48 approved methodologies under Clean Development mechanism (CDM); only one was concerned with blends in cement production. There are a number of mineral by-products produced by the mining and power generation industries that contain useful materials that can be extracted for use in cement production, or in making concrete. For some waste streams this has already been achieved, but for others, economically viable extraction methods still have to be developed.
A review of earlier research shows that industrial as well as other wastes were used in concrete-making to improve the properties of concrete and to reduce cost. Silica Fumes, fly-ash, GGBFS are already established supplementary cementitious materials. Inclusion of recycled tire rubber fibers in concrete was found to avoid the opening of cracks and increase energy absorption. Structural light weight concrete has been produced using oil palm shells and demolished masonry waste as aggregates in concrete. An improvement in the modulus of elasticity of concrete was observed with partial replacement of crushed stone coarse aggregate by crushed vitrified soil aggregate.
One of the most promising agri-waste is rice husk ash, an alternate pozzolan, which when combined with lime yields a hydraulic binder. Kaolin can be added to improve the binder quality. Portland cement can also be blended with finely ground rice husk ash to produce high strength and durable concrete when supplemented with a water reducing agent at low water to cement ratios. These alternative binders can be suitable for partial or even total substitution in many of the applications such as mortars, in walling blocks, roofing tiles and concrete and thus serving the advantage of energy saving, recycling of residues, local and small scale production, appropriate behavior and cost reduction.
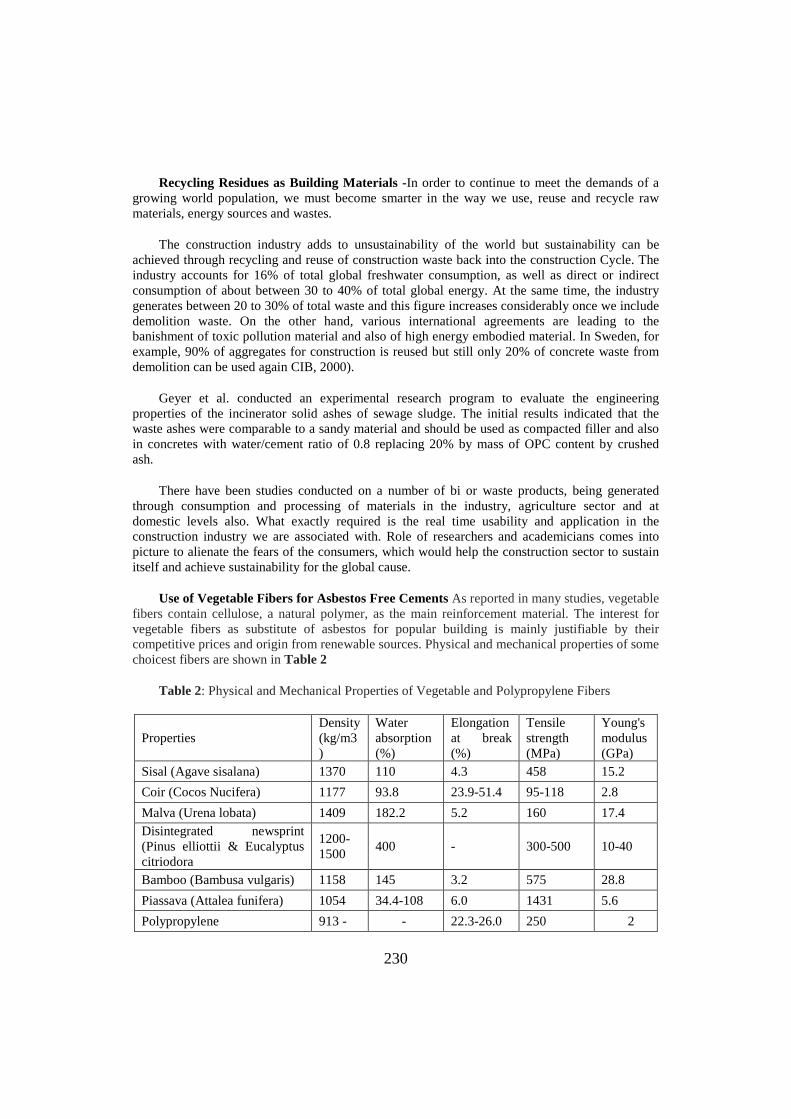
230
Recycling Residues as Building Materials -In order to continue to meet the demands of a growing world population, we must become smarter in the way we use, reuse and recycle raw materials, energy sources and wastes.
The construction industry adds to unsustainability of the world but sustainability can be achieved through recycling and reuse of construction waste back into the construction Cycle. The industry accounts for 16% of total global freshwater consumption, as well as direct or indirect consumption of about between 30 to 40% of total global energy. At the same time, the industry generates between 20 to 30% of total waste and this figure increases considerably once we include demolition waste. On the other hand, various international agreements are leading to the banishment of toxic pollution material and also of high energy embodied material. In Sweden, for example, 90% of aggregates for construction is reused but still only 20% of concrete waste from demolition can be used again CIB, 2000).
Geyer et al. conducted an experimental research program to evaluate the engineering properties of the incinerator solid ashes of sewage sludge. The initial results indicated that the waste ashes were comparable to a sandy material and should be used as compacted filler and also in concretes with water/cement ratio of 0.8 replacing 20% by mass of OPC content by crushed ash.
There have been studies conducted on a number of bi or waste products, being generated through consumption and processing of materials in the industry, agriculture sector and at domestic levels also. What exactly required is the real time usability and application in the construction industry we are associated with. Role of researchers and academicians comes into picture to alienate the fears of the consumers, which would help the construction sector to sustain itself and achieve sustainability for the global cause.
Use of Vegetable Fibers for Asbestos Free Cements As reported in many studies, vegetable fibers contain cellulose, a natural polymer, as the main reinforcement material. The interest for vegetable fibers as substitute of asbestos for popular building is mainly justifiable by their competitive prices and origin from renewable sources. Physical and mechanical properties of some choicest fibers are shown in Table 2
Table 2: Physical and Mechanical Properties of Vegetable and Polypropylene Fibers
Properties Density (kg/m3 )
Water absorption (%)
Elongation at break (%)
Tensile strength (MPa)
Young's modulus (GPa)
Sisal (Agave sisalana) 1370 110 4.3 458 15.2 Coir (Cocos Nucifera) 1177 93.8 23.9-51.4 95-118 2.8 Malva (Urena lobata) 1409 182.2 5.2 160 17.4 Disintegrated newsprint (Pinus elliottii & Eucalyptus citriodora
1200-1500 400 - 300-500 10-40
Bamboo (Bambusa vulgaris) 1158 145 3.2 575 28.8 Piassava (Attalea funifera) 1054 34.4-108 6.0 1431 5.6 Polypropylene 913 - - 22.3-26.0 250 2
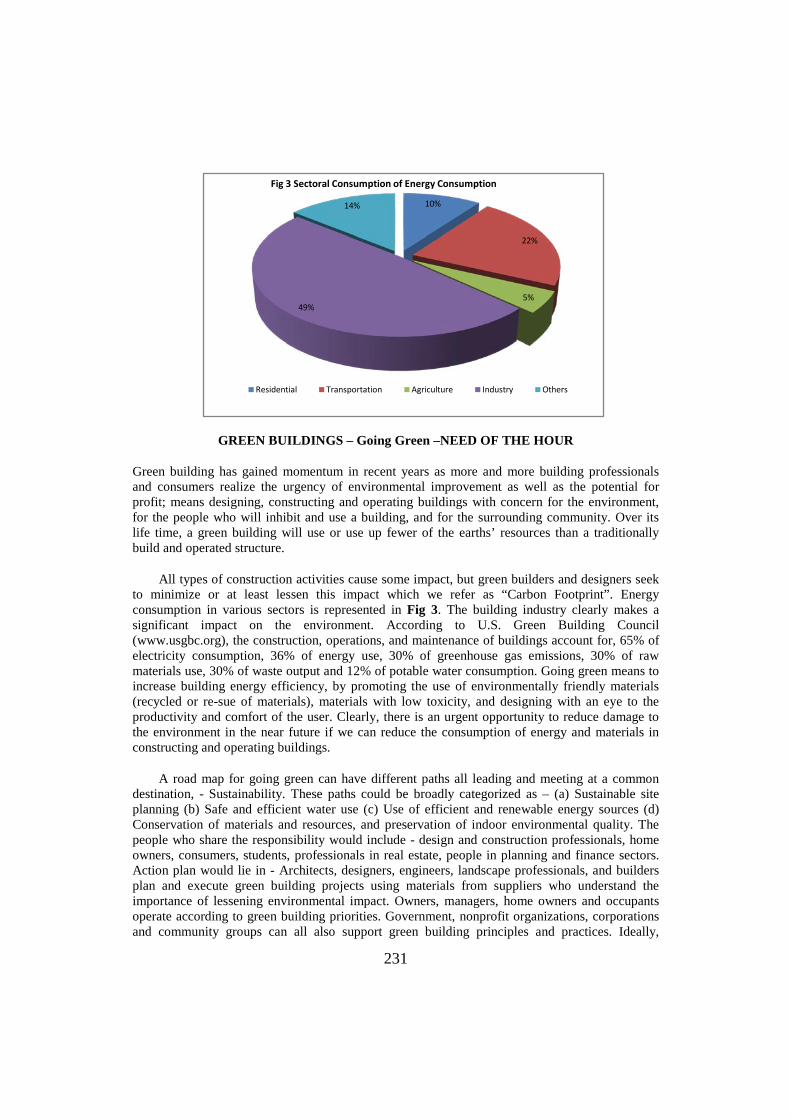
231
GREEN BUILDINGS – Going Green –NEED OF THE HOUR
Green building has gained momentum in recent years as more and more building professionals and consumers realize the urgency of environmental improvement as well as the potential for profit; means designing, constructing and operating buildings with concern for the environment, for the people who will inhibit and use a building, and for the surrounding community. Over its life time, a green building will use or use up fewer of the earths’ resources than a traditionally build and operated structure.
All types of construction activities cause some impact, but green builders and designers seek to minimize or at least lessen this impact which we refer as “Carbon Footprint”. Energy consumption in various sectors is represented in Fig 3. The building industry clearly makes a significant impact on the environment. According to U.S. Green Building Council (www.usgbc.org), the construction, operations, and maintenance of buildings account for, 65% of electricity consumption, 36% of energy use, 30% of greenhouse gas emissions, 30% of raw materials use, 30% of waste output and 12% of potable water consumption. Going green means to increase building energy efficiency, by promoting the use of environmentally friendly materials (recycled or re-sue of materials), materials with low toxicity, and designing with an eye to the productivity and comfort of the user. Clearly, there is an urgent opportunity to reduce damage to the environment in the near future if we can reduce the consumption of energy and materials in constructing and operating buildings.
A road map for going green can have different paths all leading and meeting at a common destination, - Sustainability. These paths could be broadly categorized as – (a) Sustainable site planning (b) Safe and efficient water use (c) Use of efficient and renewable energy sources (d) Conservation of materials and resources, and preservation of indoor environmental quality. The people who share the responsibility would include - design and construction professionals, home owners, consumers, students, professionals in real estate, people in planning and finance sectors. Action plan would lie in - Architects, designers, engineers, landscape professionals, and builders plan and execute green building projects using materials from suppliers who understand the importance of lessening environmental impact. Owners, managers, home owners and occupants operate according to green building priorities. Government, nonprofit organizations, corporations and community groups can all also support green building principles and practices. Ideally,
10%
22%
5%49%
14%
Fig 3 Sectoral Consumption of Energy Consumption
Residential Transportation Agriculture Industry Others
232
everyone is involved in green building because we all live and work in built spaces and we all have a stake in the health of the planet.
Benefits of Green Buildings - Green building benefits include - • Increased occupant health and comfort as well as cost savings. • Reduction of VOCs that can off-gas from materials into the air we breathe. • As energy prices increase and global warming trends become clearer, everyone involved
in the building industry can also agree that reducing energy usage and costs is an imperative. • Commercial and institutional buildings involve additional considerations of comfort that
relate to productivity • Absenteeism and employee turnover have also shown dramatic decreases in several
studies. • And many other benefits such as: Reduced health care costs, Increased recruitment
appeal to employees, Boost to reputation and public relations, Shortened project timeline, Increased rents/asset values, Longer tenant tenure, Longer asset life, Increased business traffic and purchasing, Regulatory approval streamlining, Remaining competitive as product and service providers, Better access to funds and financing, Emotional benefits from doing something good.
Barriers Ahead of Going Green - Even with documented savings and rapid growth, there are significant barriers to universal acceptance of green building practices. Besides the perception that green building is expensive, other barriers include demand confusion, concerns about the availability of materials, lack of experience with green practices and lack of information. Built with quality materials and designed to last, green buildings are more efficient and more profitable, sometimes within a surprisingly short amount of time. However, one of the biggest barriers to green building practices is a belief that green buildings are much expensive. Long-term analyses (lifecycle costs) reveal lower green operation and maintenance costs, yielding significant savings over the lifespan of the building if not sooner. Energy savings alone have been documented that can pay back additional premiums within 2 to 5 years.
Also the costs have rapidly decreased as designers and builders gain experience, in what is known as a ‘Learning Curve Effect’. Where Green building materials are priced at a premium, it is important to know what comparisons one is making. There are no costs or other benefits to using excess water, toxic materials, or inefficient equipment in construction. Many a times, lower up-front price tags can be deceiving as short-term savings can lead to higher long-term cost -for everyone. Thus Life-cycle costing has to be an important parameter while selecting materials and designing structures and thus having extended warranty for the structures to last longer.
Perhaps the biggest problem facing the green building field is the lack of widely available and accurate information and lack of experienced professionals; as many a time it becomes difficult as whom to believe. And these fears and an uncertainty, over how to verify, and also some negative experiences have led to a loss of trust among consumers. Associations exist for many industries, at the national, regional, and local levels. Government departments also provide green building information at state and local levels.
Where Do We Go From Here - As the green building movement gains momentum, sustainability leaders are demanding changes at universities, design and construction firms, businesses, branches of government, and neighborhoods. More resources, products and technologies have become available in recent years, making it possible to alter the way we plan and build. The more we work together, the better we all can do. Additionally and related to
233
teamwork; the entire green building industry needs more efficient ways of sharing information, especially about new products, systems and methods.
CONCLUSION
Although technology is spurring a growth in world population and energy consumption; yet the technological ingenuity that is propelling a world crisis can also be our salvation – if it is used wisely. Understanding Earth systems and applying the best possible technologies, based on local and global policies attuned to geo-ecological limitations, will require unprecedented success in educating all sectors of society, continuous effective communication with the public aided by informed media, and uncommon wisdom among policy makers. Effective education is the best treatment for blindness resulting from ignorance of the breadth and depth of the threats to sustainability. We must realize that the sciences and technologies in themselves are not enough, and that we need to think about what can motivate us to get off our addiction, to open our eyes, and to actually make use of science and technology to help us. Those tools are necessary, but willingness to accept policies that really address our needs is indispensable.
References
Agopyan, V and John V.M., (1989): Building panels made with natural fibers reinforced alternate cements, In Fiber reinforced Cements and Concretes, ed. Elsevier ( 296 -305), London,
Andre C., Mattes B (2006): The Future of Energy Today and Sustainability, World Energy Council (www.worldenergy.org) ISBN 0946 121 222.
Savastano J H. (2001): Sustainable cement based materials and techniques for rural construction, Agri-building 2001- Campinas, SP, Brazil.
Atchison, E.J. (1973): Present status and future potential for utilization of non-wood plant fibers- A world-wide review, TAPPI, non-wood plant fiber pulping progress report, TAPPI press, Atlanta, USA, 4: 68-69.
Aubert, J. E., Husson, B. and Vaquier, A. (2004): Use of municipal solid waste incineration fly ash in concrete, Cement and Concrete Research, 34(6): 957-963.
Baguant, K. (1995): Properties of concrete with bagasse ash as fine aggregate, In Proc 5th CANMET/ACI Intl. conf. on fly ash, silica fume, slag and natural pozzolans in concrete, Ed by Malhotra VM, USA, ACI SP,153(18): 315-337.
Bignozzi, M.C. and Sandrolini, F. (2006): Tyre rubber waste recycling in self-compacting conc., Cement and Concrete Research, 36(4): 735-739.
Carbon Dioxide Information Analysis Center (CDIAC): US department of Energy, www.cdiac.ornl.gov
Chandra, S. (1997): Waste materials used in concrete manufacturing- The use of rice husk ash in concrete, Noyes Publication, p. 198.
Gengying, Li. and Xiaohua, Z. (2003): Properties of concrete incorporating fly ash and ground granulated blast furnace slag, Cement concrete composite, 25: 293-299.
Goyal, Ajay, Hattori, K., Ogata, H., Muhammad A. and Anwar, A.M. (2007): Evaluation of various ashes obtained from agricultural and bio-wastes for their likely potential as pozzolanic materials, The Transactions of JSIDRE, 251(75-5): 477-484.
Guimaraes, S.S., (1984): Experimental mixing and moulding with vegetable fiber reinforced cement composites, In Proc. International conf, Development of Low –cost and Energy Saving materials and Applications, Rio de Janeriro ,Envo 1(1) 37-51.
International Energy Agency (IEA): www.iea.org/stats/index.asp Isaia, G.C., Gastaldini, A.L.G. and Moraes, R. (2001): Physical and pozzolanic action of mineral
additions on the mechanical strength of high-performance concrete, Cement and concrete composites, 25:69-76.
234
Pakhala, K., Mehta, Hakkola, T., Jarvi, H. A. and Virkajari, P. (1996): Production and use of agrofibre in Finland, Final report of the study, Part I: production of agro-fibre crops: agronomy and varieties. Agri. research centre of Finland, Jokioinen, Finland, p 84 110.
Paul H Reitan (2005): Sustainability science and beyond, Spring 1(1):77-80 Ryodholm, S.A. (1965): Pulping Process, Inter Science Publishers, New York, p 1049-1053. Malhotra, S.K. (1994): Cementitious binders from agro-industrial products, Basin News Journal,
U.K., Jan: 13-16. Sanjuán, M. A. and Tolêdo Filho, R. D. (1998): Effectiveness of crack control at early age on the
corrosion of steel bars in low modulus sisal and coconut fibre-reinforced mortars, Cement and Concrete Research, 28(4): 555-565.
Savastano, Jr. H. (2001): Sustainable cement based materials and techniques for rural construction. In Proc. International Symposium on Rural Construction– Agribuilding, ed. FB Fialho, p. 8-27.
Smith R. G. and Kamwanja, G.A. (1986): The use of rice husks for making a cementitious material, Use of vegetable plants and fibres as building materials, Joint symposium RILEM/CIB/NCCL, Baghdad, p. E85-94.
Stroven, P., Bui, D.D. and Ashof, E. Sabuni (1999): Vegetable waste used for economic production of low to high strength hydraulic binders, Fuel, 78: 153-159.
Toledo Filhi R.D. et al (2007): Potential for use of crushed waste calcined –clay brick as supplementary cementitious materials in Barzil, Cement Conc Res. 37(9):1357-1365.
Trinnaman, J. and Clarke, A. (2001): World Energy Council, Survey of Energy Resources, (Commentary): Biomass (other than Wood), Chapter 10: 227-241.
UNCHS (1993): Building Materials for housing, report of the executive director, United Nations Commission on Human settlements, Habitat International, 17(2): 1-20.
US Green Build (2008): Rate it Green ; US Green Build Council, Green Build 2008, Boston US. Yevich, R. and Loyan, J.A. (2003): An assessment of biofuel use and burning of agricultural
wastes in the world, Global Biogeochem Cycles, 17(4): 1095.
235
GEOTECHNICAL CHARACTERIZATION OF DREDGED MATERIAL AS
AN ENGINEERED MATERIAL
B. A. Mir and M. Y. Shah Department of Civil Engineering, N. I. T. Srinagar, J&K, India
Abstract: The Dal Lake has been the centre of Kashmir civilization and is among the most beautiful National heritages. But it has been estimated that large contribution of nutrients and on an average 80,000 ton’s of silt flows annually into the lake resulting in excessive growth of the weeds, unwanted aquatic life, large quantities of silt deposits and to reduce the depth of lake. The problems of Dal and its significance have been well recognized and efforts are on to save the lake. The scheme for shoreline dredging of Dal Lake has been formulated with the primary objective to increase the clear water expanse of the lake, improve water circulation and consequently help in Eco-regeneration of the lake. The dredging of Dal Lake generated the dredged material in large quantity posing serious disposal and environmental problems all-around the Dal Lake. Concern over environmental effects of dredging, disposal of dredged material, and the increasing unavailability of suitable disposal sites, has put pressure for characterization of this material as a resource for various beneficial uses/engineering applications. Its mineralogy and Geotechnical properties qualify it for use in the manufacture of high value, beneficial use products. In some parts of the world, dredging to obtain construction material is a common practice. Because of the growing demand for construction materials and dwindling inland resources, this may be an important beneficial use. In many cases, dredged material consists of a mixture of sand and clay fractions, which requires some type of separation process. Dewatering may also be required because of high water content. Depending on the sediment type and processing requirements, dredged material may be used as: concrete aggregates (sand or gravel); backfill material; raw material for brick manufacturing (clay with less than 30 percent sand); ceramics, such as tile (clay); pellets for insulation or lightweight backfill or aggregate (clay); and raw material for the production of riprap or blocks for the protection of dikes and slopes against erosion (rock, mixture). Dredged materials may also be used for environmental enhancement of wetlands, fisheries, and other habitats for wildlife utilization. The range of engineering applications for dredged material is diverse, being limited only by the ingenuity of the designer. For all above applications, a brief study about Geotechnical characterization of dredged material forms an important consideration, which will help in proper use of this unwanted material. Therefore, the main purpose of the study is to investigate the Dredged Material from engineering point of view. Hence, using dredged material as a resource has a two-fold advantage. First, to avoid the tremendous environmental problems caused by large scale dumping of dredged material and second, to use it for various Engineering Applications as a Construction Material.
INTRODUCTION ABOUT DAL LAKE
Dal Lake is situated in the state of Jammu and Kashmir (J&K) and located in the heart of Srinagar at an average altitude of 1,583m. The Lake is surrounded by mountains on its three sides. A large number of gardens and orchards, famous Moghal gardens, Nishat Bagh, Nehru Park and Botanical gardens are located around the lake. University of Kashmir, Centaur Hotel, Golf course, National
236
Institute of Technology and Hazratbal shrine are some of the other important places along the shores. There are more than 700 houseboats, which are serviced by Doonga Boats. There are more than 50,000 people living in Hamlets and Doonga Boats in the lake. Floating and Vegetable Gardens are also a part of the lake. With reference to the present studies and research undergoing, the Dal Lake has been classified into various basins. All the basins are interconnected with navigation routes in the shape of intertwined waterways. The Nehru Park Basin is one of the ecologically significant basins of Dal Lake because of the presence of houseboats, hamlets infested with habitation, floating gardens, agricultural lands with the water body and mushrooming of hotel complexes on the periphery. The outflow of the basin is through the exit gate by the name Dal Gate. The Nishat Basin near Shalimar is a portion of the Lokut Dal basin area, which has been designated as Nishat Basin for drawing the comparisons between the polluted parts of the lake with the unpolluted parts. In Nishat Basin (near Shalimar), some of the areas are under biotic stresses while other parts are having fresh waters fit for potable purposes.
The Hazratbal Basin is one of the ecologically important basins of the Dal Lake. Due to the inflow channel (Telbal Nallah) loaded with storm water and silt besides the effluents pouring into the lake, the highest rate of sedimentation is observed in this basin. The impact of silt is clearly visible in the north and northeast parts where appreciable reduction in water depth and the shrinkage of the area has taken place, more along Northern Foreshore Road rendering most of the inshore areas shallow and marshy. The Nagin Basin is regarded as a paradise for water sports like skiing and is comparatively deeper than the other basins. Due to the rapid urbanization and increasing settlements in the peripheral catchment area, besides increased agricultural activities within the lake body, the basin is under serious biotic stress. About 3/4th of the surface area of the lake near Sunderbal and Behrar has turned into marshes. The heavy pollution load and enrichment has not only impaired the water quality in these regions but has also resulted in serious weed infestation.
ONGOING RESTORATION WORKS
The Dal Lake has shrunk more than 15 km over the last 60 years. Since 1992, the lake has shown a ‘red bloom’, denoting eutrophication or Lake Death. Siltation, direct inflow of sewage, encroachment and stagnant water have led to gradual degradation. The problems of Dal Lake and its significance to Srinagar inhabitants, tourism and urban development in Srinagar have been well recognized. Efforts are on to save the lake, which has been seriously polluted as a consequence of the urbanization of Srinagar and the expansion of agriculture around the city. Several proposals in the past have been suggested for the restoration of the lake. The scheme for shoreline dredging of Dal Lake has been formulated with the primary objective to increase the clear water expanse of the lake, improve water circulation and consequently help in Eco-regeneration of the lake. But the dredging of Dal Lake generated the dredged material in large quantity posing serious disposal and environmental problems all-around the Dal Lake. Concern over environmental effects of dredging, disposal of dredged material, and the increasing unavailability of suitable disposal sites, has put pressure for characterization of this material as a resource for various beneficial uses/engineering applications. The scheme for shoreline dredging of Dal Lake has been formulated with the primary objective to increase the clear water expanse of the lake, improve water circulation and consequently help in Eco-regeneration of the lake.
• Shoreline Dredging
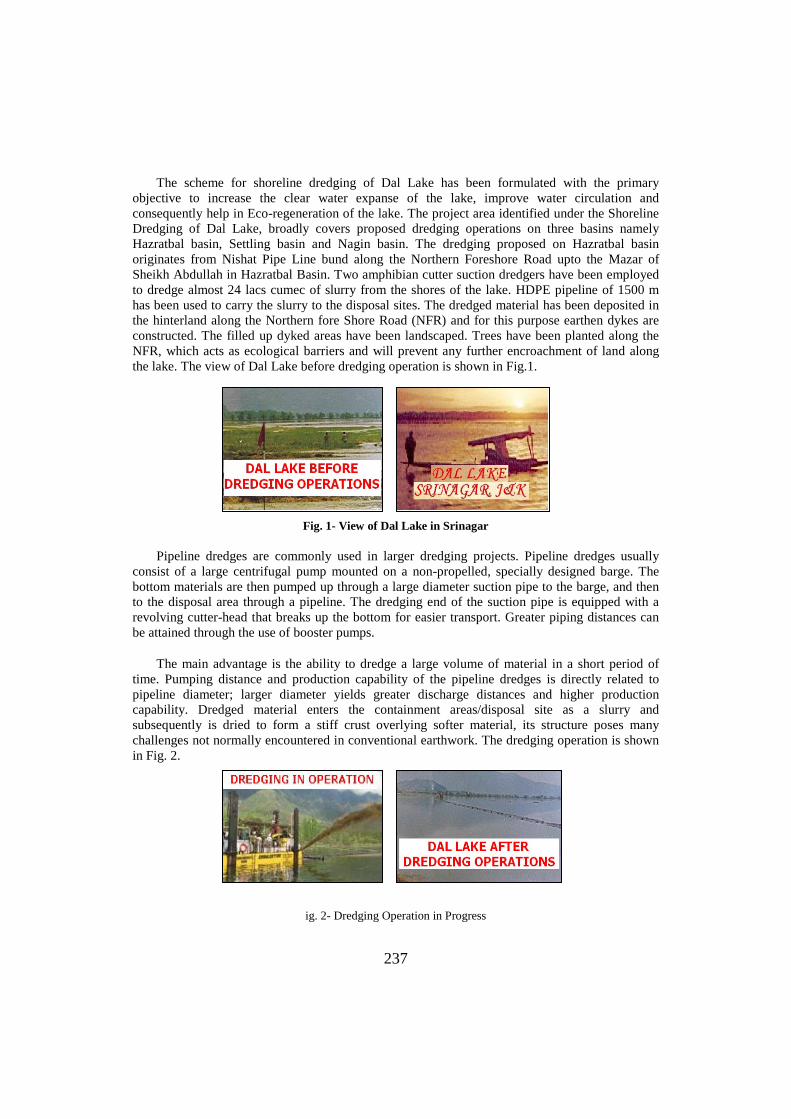
237
The scheme for shoreline dredging of Dal Lake has been formulated with the primary objective to increase the clear water expanse of the lake, improve water circulation and consequently help in Eco-regeneration of the lake. The project area identified under the Shoreline Dredging of Dal Lake, broadly covers proposed dredging operations on three basins namely Hazratbal basin, Settling basin and Nagin basin. The dredging proposed on Hazratbal basin originates from Nishat Pipe Line bund along the Northern Foreshore Road upto the Mazar of Sheikh Abdullah in Hazratbal Basin. Two amphibian cutter suction dredgers have been employed to dredge almost 24 lacs cumec of slurry from the shores of the lake. HDPE pipeline of 1500 m has been used to carry the slurry to the disposal sites. The dredged material has been deposited in the hinterland along the Northern fore Shore Road (NFR) and for this purpose earthen dykes are constructed. The filled up dyked areas have been landscaped. Trees have been planted along the NFR, which acts as ecological barriers and will prevent any further encroachment of land along the lake. The view of Dal Lake before dredging operation is shown in Fig.1.
Fig. 1- View of Dal Lake in Srinagar
Pipeline dredges are commonly used in larger dredging projects. Pipeline dredges usually consist of a large centrifugal pump mounted on a non-propelled, specially designed barge. The bottom materials are then pumped up through a large diameter suction pipe to the barge, and then to the disposal area through a pipeline. The dredging end of the suction pipe is equipped with a revolving cutter-head that breaks up the bottom for easier transport. Greater piping distances can be attained through the use of booster pumps.
The main advantage is the ability to dredge a large volume of material in a short period of time. Pumping distance and production capability of the pipeline dredges is directly related to pipeline diameter; larger diameter yields greater discharge distances and higher production capability. Dredged material enters the containment areas/disposal site as a slurry and subsequently is dried to form a stiff crust overlying softer material, its structure poses many challenges not normally encountered in conventional earthwork. The dredging operation is shown in Fig. 2.
ig. 2- Dredging Operation in Progress
238
DREDGED MATERIAL
Dredging is simply the removal of sediments from a body of water that have accumulated due to upland erosion in order to maintain a desired depth, as in a reservoir, lake, dam, shipping berth, navigation channel. Dredged materials exhibit properties similar to those of undisturbed native soil and rock materials in a subaqueous environment, but when excavated, removed, remoulded, or re-deposited, the properties change accordingly as the original material structure changes. High water contents, l o w dry densities, and l o w shear strengths typify remoulded and deposited fine-grained dredged materials (Bartos1977). Dredged material is categorised into various sediment types such as- Rock, gravel and sand, consolidated clay, silt or soft clay and a mixture of rock, sand silt and soft clay. Rock may range from soft marl like sandstone and coral to hard rock like granite and basalt. Depending on its size and quantity rock can be a valuable construction material. Gravel and sand are perhaps the most valuable resource and are routinely used for beach nourishment, wetland restoration and many other purposes. Consolidated clay, if the water content is low, can be used for engineering purposes. Silt and soft clay usually come from maintenance dredging, are rich in nutrients and thus are good for agricultural purposes such as topsoil and for wildlife habitat development. Mixed materials are somewhat more restricted in use options but may still be used for filling, and improvement and topsoil.
Using dredged material as a resource is important, one could almost say urgent, because use – rather than disposal has broad societal, environmental and financial benefits. It contributes to global sustainability. The potential uses for dredged material depend on the type of dredged material, where it is dredged, how it is dredged and its overall acceptability. Two broad categories of proposed uses are often distinguished: Engineering uses and environmental uses. Engineering uses of dredged material include: Construction including landfill and foundation materials; Isolation of contaminated sites; Flood and coastal protection, such as beach nourishment; Land improvement; and Placement on riverbanks. Environmental enhancement using dredged material includes: Habitant creation and improvement; Water quality improvement; Aquaculture; Agriculture; Recreation; Sustainable relocation; and pit filling. In both cases, criteria are to be established that ensure that extensive testing is done for suitability of materials, that the potential use site is in reasonable proximity to where the dredging is planned and that a thorough physical and chemical evaluation is done. Beneficial use of dredged material is an integral and necessary part of the dredge material management process. Dredged material can be beneficially used in upland, wetland, and aquatic environments (DOER 1999).
MATERIALS AND METHODS
For the present study, Disturbed and undisturbed samples of dredged materials from two Basins - Hazratbal Basin and Nishat Basin were for conduct of various field and lab. tests. All the tests were carried out as per the relevant Indian Standards. Standard Proctor compaction tests, consolidation tests and strength tests were carried out on the so obtained soil specimens. All the samples were prepared as per IS: 2720 (part-1) and compacted at 0.95γdmax and corresponding water content on the dry side of optimum.
RESULTS AND DISCUSSIONS
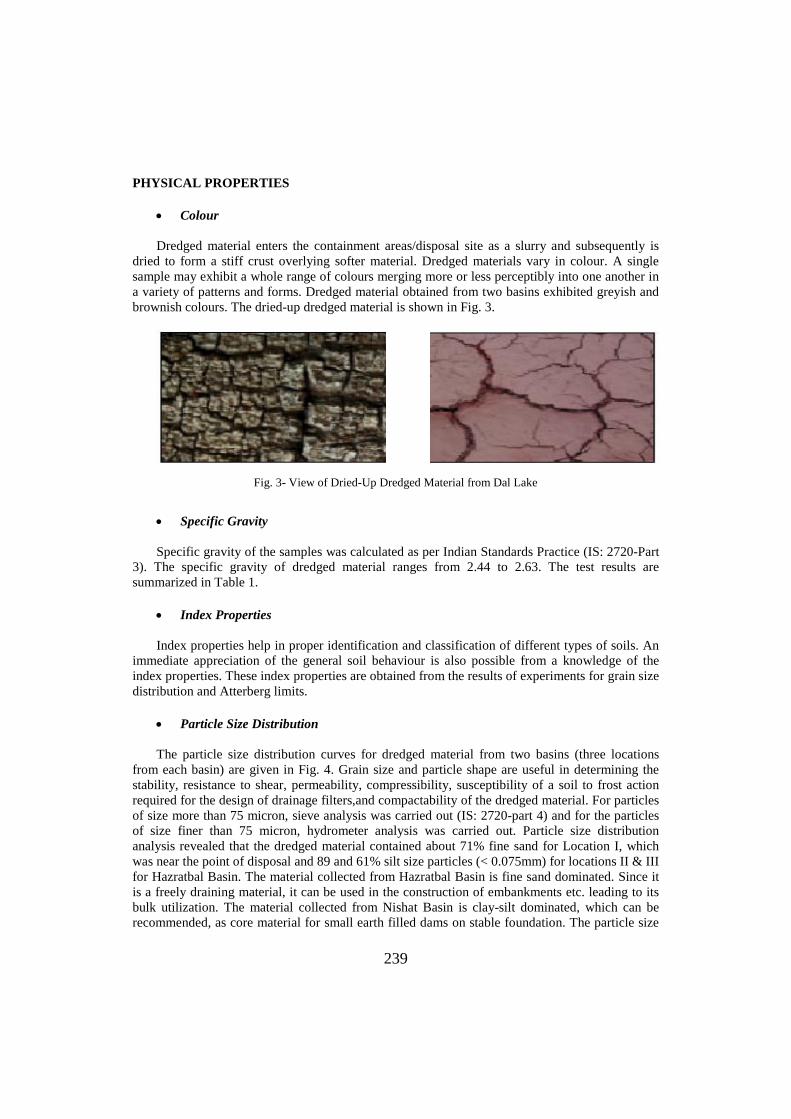
239
PHYSICAL PROPERTIES
• Colour
Dredged material enters the containment areas/disposal site as a slurry and subsequently is dried to form a stiff crust overlying softer material. Dredged materials vary in colour. A single sample may exhibit a whole range of colours merging more or less perceptibly into one another in a variety of patterns and forms. Dredged material obtained from two basins exhibited greyish and brownish colours. The dried-up dredged material is shown in Fig. 3.
Fig. 3- View of Dried-Up Dredged Material from Dal Lake
• Specific Gravity
Specific gravity of the samples was calculated as per Indian Standards Practice (IS: 2720-Part 3). The specific gravity of dredged material ranges from 2.44 to 2.63. The test results are summarized in Table 1.
• Index Properties
Index properties help in proper identification and classification of different types of soils. An immediate appreciation of the general soil behaviour is also possible from a knowledge of the index properties. These index properties are obtained from the results of experiments for grain size distribution and Atterberg limits.
• Particle Size Distribution
The particle size distribution curves for dredged material from two basins (three locations from each basin) are given in Fig. 4. Grain size and particle shape are useful in determining the stability, resistance to shear, permeability, compressibility, susceptibility of a soil to frost action required for the design of drainage filters,and compactability of the dredged material. For particles of size more than 75 micron, sieve analysis was carried out (IS: 2720-part 4) and for the particles of size finer than 75 micron, hydrometer analysis was carried out. Particle size distribution analysis revealed that the dredged material contained about 71% fine sand for Location I, which was near the point of disposal and 89 and 61% silt size particles (< 0.075mm) for locations II & III for Hazratbal Basin. The material collected from Hazratbal Basin is fine sand dominated. Since it is a freely draining material, it can be used in the construction of embankments etc. leading to its bulk utilization. The material collected from Nishat Basin is clay-silt dominated, which can be recommended, as core material for small earth filled dams on stable foundation. The particle size
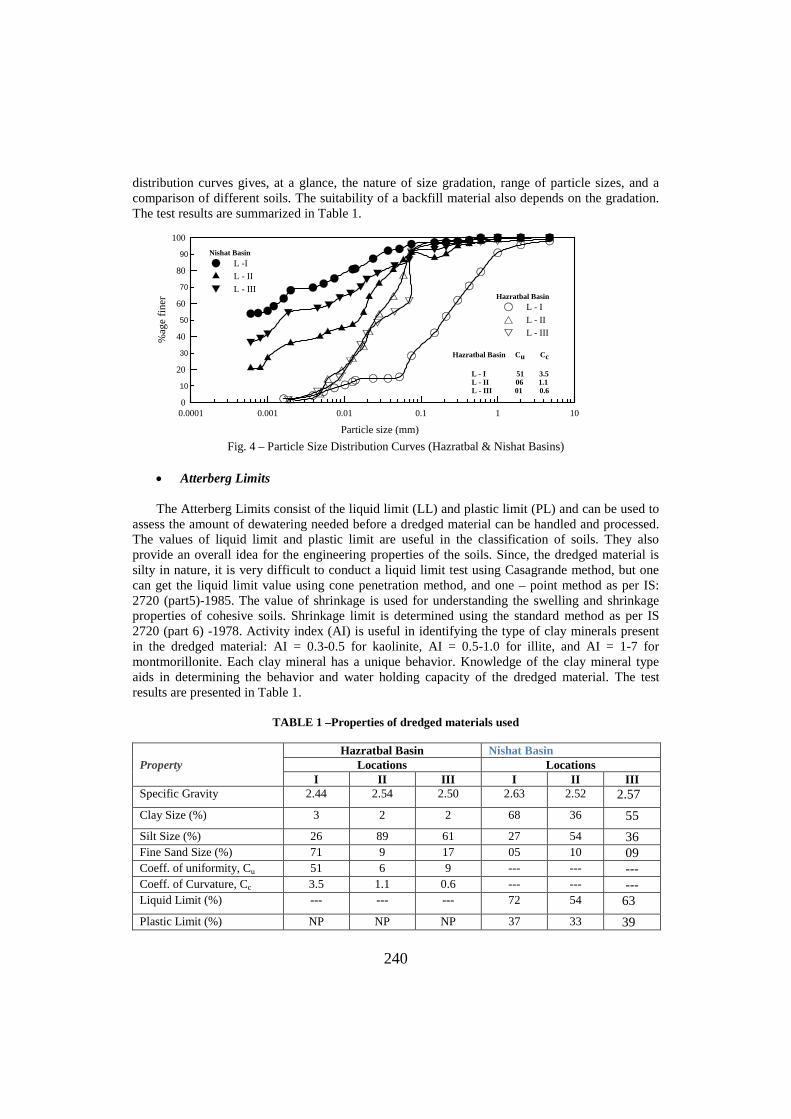
240
distribution curves gives, at a glance, the nature of size gradation, range of particle sizes, and a comparison of different soils. The suitability of a backfill material also depends on the gradation. The test results are summarized in Table 1.
Fig. 4 – Particle Size Distribution Curves (Hazratbal & Nishat Basins)
• Atterberg Limits
The Atterberg Limits consist of the liquid limit (LL) and plastic limit (PL) and can be used to assess the amount of dewatering needed before a dredged material can be handled and processed. The values of liquid limit and plastic limit are useful in the classification of soils. They also provide an overall idea for the engineering properties of the soils. Since, the dredged material is silty in nature, it is very difficult to conduct a liquid limit test using Casagrande method, but one can get the liquid limit value using cone penetration method, and one – point method as per IS: 2720 (part5)-1985. The value of shrinkage is used for understanding the swelling and shrinkage properties of cohesive soils. Shrinkage limit is determined using the standard method as per IS 2720 (part 6) -1978. Activity index (AI) is useful in identifying the type of clay minerals present in the dredged material: AI = 0.3-0.5 for kaolinite, AI = 0.5-1.0 for illite, and AI = 1-7 for montmorillonite. Each clay mineral has a unique behavior. Knowledge of the clay mineral type aids in determining the behavior and water holding capacity of the dredged material. The test results are presented in Table 1.
TABLE 1 –Properties of dredged materials used
Property Hazratbal Basin Nishat Basin
Locations Locations I II III I II III
Specific Gravity 2.44 2.54 2.50 2.63 2.52 2.57 Clay Size (%) 3 2 2 68 36 55 Silt Size (%) 26 89 61 27 54 36 Fine Sand Size (%) 71 9 17 05 10 09 Coeff. of uniformity, Cu 51 6 9 --- --- --- Coeff. of Curvature, Cc 3.5 1.1 0.6 --- --- --- Liquid Limit (%) --- --- --- 72 54 63 Plastic Limit (%) NP NP NP 37 33 39
0.0001 0.001 0.01 0.1 1 10
Particle size (mm)
0
20
40
60
80
100
10
30
50
70
90
%ag
e fin
er Hazratbal BasinL - IL - IIL - III
Nishat BasinL -IL - IIL - III
Hazratbal Basin Cu Cc
L - I 51 3.5 L - II 06 1.1 L - III 01 0.6
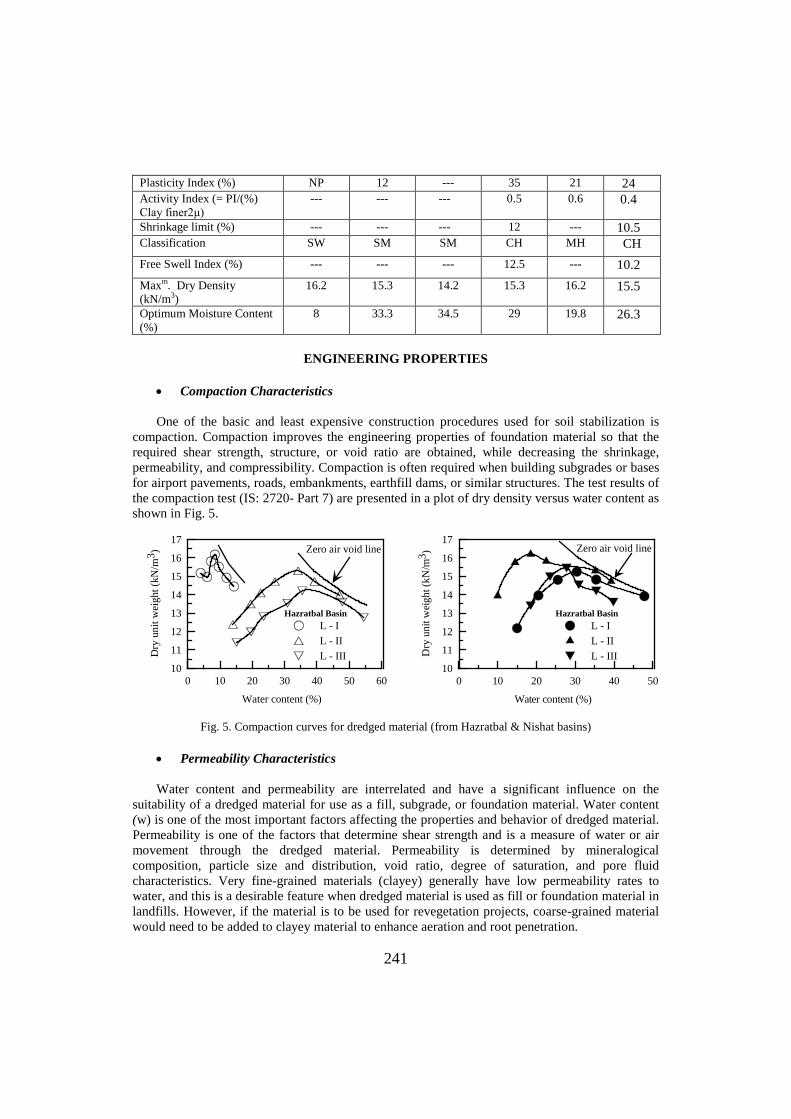
241
Plasticity Index (%) NP 12 --- 35 21 24 Activity Index (= PI/(%) Clay finer2μ)
--- --- --- 0.5 0.6 0.4
Shrinkage limit (%) --- --- --- 12 --- 10.5 Classification SW SM SM CH MH CH Free Swell Index (%) --- --- --- 12.5 --- 10.2 Maxm. Dry Density (kN/m3)
16.2 15.3 14.2 15.3 16.2 15.5
Optimum Moisture Content (%)
8 33.3 34.5 29 19.8 26.3
ENGINEERING PROPERTIES
• Compaction Characteristics
One of the basic and least expensive construction procedures used for soil stabilization is compaction. Compaction improves the engineering properties of foundation material so that the required shear strength, structure, or void ratio are obtained, while decreasing the shrinkage, permeability, and compressibility. Compaction is often required when building subgrades or bases for airport pavements, roads, embankments, earthfill dams, or similar structures. The test results of the compaction test (IS: 2720- Part 7) are presented in a plot of dry density versus water content as shown in Fig. 5.
Fig. 5. Compaction curves for dredged material (from Hazratbal & Nishat basins)
• Permeability Characteristics
Water content and permeability are interrelated and have a significant influence on the suitability of a dredged material for use as a fill, subgrade, or foundation material. Water content (w) is one of the most important factors affecting the properties and behavior of dredged material. Permeability is one of the factors that determine shear strength and is a measure of water or air movement through the dredged material. Permeability is determined by mineralogical composition, particle size and distribution, void ratio, degree of saturation, and pore fluid characteristics. Very fine-grained materials (clayey) generally have low permeability rates to water, and this is a desirable feature when dredged material is used as fill or foundation material in landfills. However, if the material is to be used for revegetation projects, coarse-grained material would need to be added to clayey material to enhance aeration and root penetration.
0 10 20 30 40 50 60
Water content (%)
10
11
12
13
14
15
16
17
Dry
uni
t wei
ght (
kN/m
3 )
Hazratbal BasinL - IL - IIL - III
Zero air void line
0 10 20 30 40 50
Water content (%)
10
11
12
13
14
15
16
17
Dry
uni
t wei
ght (
kN/m
3 )
Hazratbal BasinL - IL - IIL - III
Zero air void line
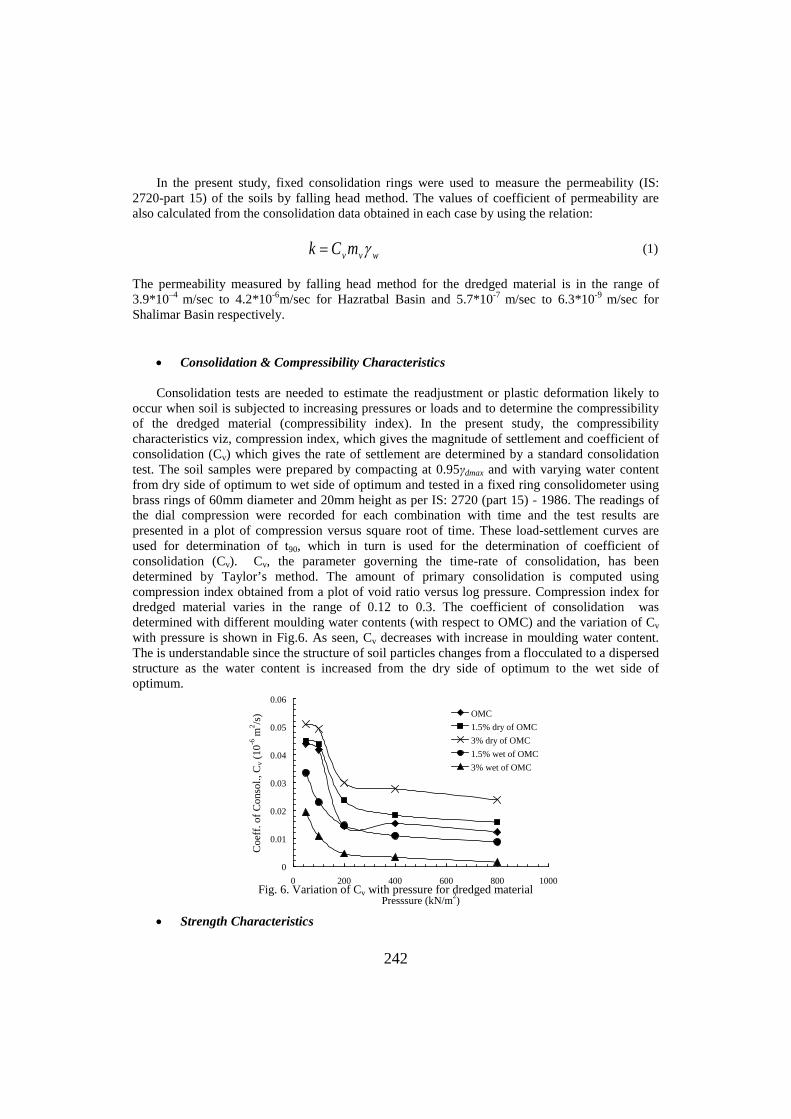
242
In the present study, fixed consolidation rings were used to measure the permeability (IS: 2720-part 15) of the soils by falling head method. The values of coefficient of permeability are also calculated from the consolidation data obtained in each case by using the relation: wvv mCk γ= (1) The permeability measured by falling head method for the dredged material is in the range of 3.9*10–4 m/sec to 4.2*10-6m/sec for Hazratbal Basin and 5.7*10-7 m/sec to 6.3*10-9 m/sec for Shalimar Basin respectively.
• Consolidation & Compressibility Characteristics
Consolidation tests are needed to estimate the readjustment or plastic deformation likely to occur when soil is subjected to increasing pressures or loads and to determine the compressibility of the dredged material (compressibility index). In the present study, the compressibility characteristics viz, compression index, which gives the magnitude of settlement and coefficient of consolidation (Cv) which gives the rate of settlement are determined by a standard consolidation test. The soil samples were prepared by compacting at 0.95γdmax and with varying water content from dry side of optimum to wet side of optimum and tested in a fixed ring consolidometer using brass rings of 60mm diameter and 20mm height as per IS: 2720 (part 15) - 1986. The readings of the dial compression were recorded for each combination with time and the test results are presented in a plot of compression versus square root of time. These load-settlement curves are used for determination of t90, which in turn is used for the determination of coefficient of consolidation (Cv). Cv, the parameter governing the time-rate of consolidation, has been determined by Taylor’s method. The amount of primary consolidation is computed using compression index obtained from a plot of void ratio versus log pressure. Compression index for dredged material varies in the range of 0.12 to 0.3. The coefficient of consolidation was determined with different moulding water contents (with respect to OMC) and the variation of Cv with pressure is shown in Fig.6. As seen, Cv decreases with increase in moulding water content. The is understandable since the structure of soil particles changes from a flocculated to a dispersed structure as the water content is increased from the dry side of optimum to the wet side of optimum.
Fig. 6. Variation of Cv with pressure for dredged material
• Strength Characteristics
0
0.01
0.02
0.03
0.04
0.05
0.06
0 200 400 600 800 1000
Presssure (kN/m2)
Coe
ff. o
f Con
sol.,
Cv (
10-6
m2 /s
) OMC1.5% dry of OMC3% dry of OMC1.5% wet of OMC3% wet of OMC
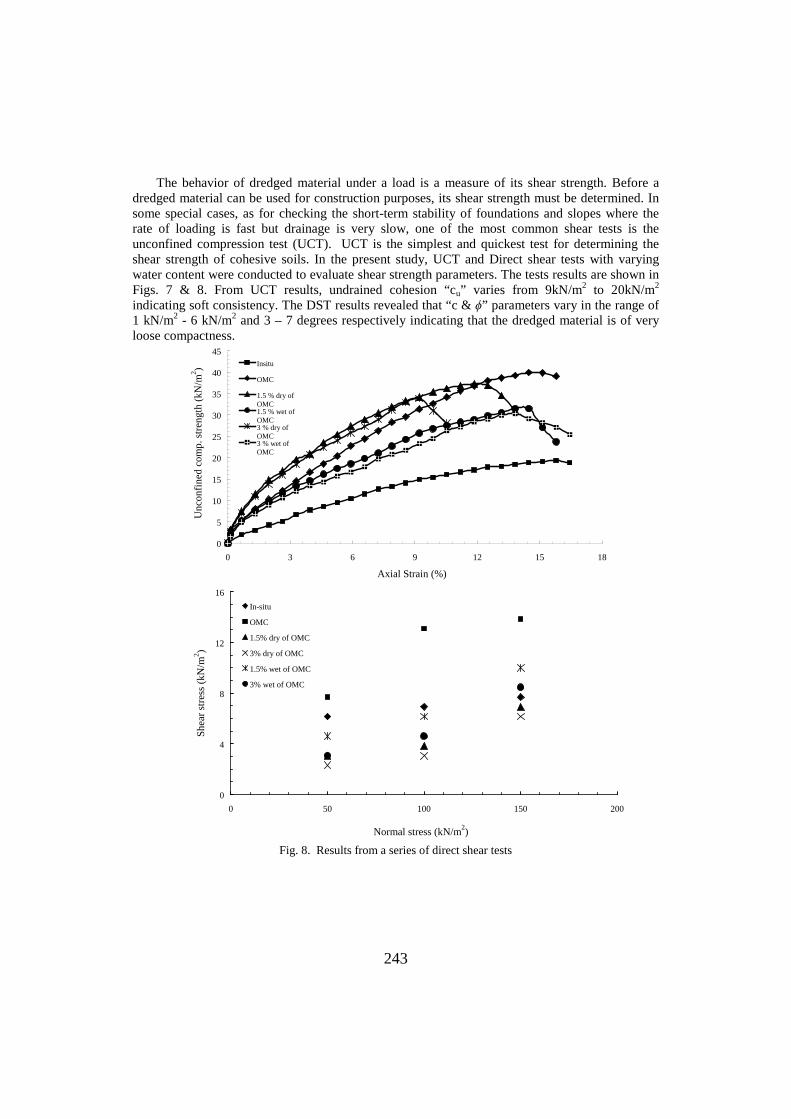
243
The behavior of dredged material under a load is a measure of its shear strength. Before a dredged material can be used for construction purposes, its shear strength must be determined. In some special cases, as for checking the short-term stability of foundations and slopes where the rate of loading is fast but drainage is very slow, one of the most common shear tests is the unconfined compression test (UCT). UCT is the simplest and quickest test for determining the shear strength of cohesive soils. In the present study, UCT and Direct shear tests with varying water content were conducted to evaluate shear strength parameters. The tests results are shown in Figs. 7 & 8. From UCT results, undrained cohesion “cu” varies from 9kN/m2 to 20kN/m2 indicating soft consistency. The DST results revealed that “c & ϕ” parameters vary in the range of 1 kN/m2 - 6 kN/m2 and 3 – 7 degrees respectively indicating that the dredged material is of very loose compactness.
Fig. 7. Stress-strain curves for dredged material
Fig. 8. Results from a series of direct shear tests
0
4
8
12
16
0 50 100 150 200
Normal stress (kN/m2)
Shea
r stre
ss (k
N/m
2 )
In-situ
OMC
1.5% dry of OMC
3% dry of OMC
1.5% wet of OMC
3% wet of OMC
0
5
10
15
20
25
30
35
40
45
0 3 6 9 12 15 18
Axial Strain (%)
Unc
onfin
ed c
omp.
stre
ngth
(kN
/m2 ) Insitu
OMC
1.5 % dry ofOMC1.5 % wet ofOMC3 % dry ofOMC3 % wet ofOMC
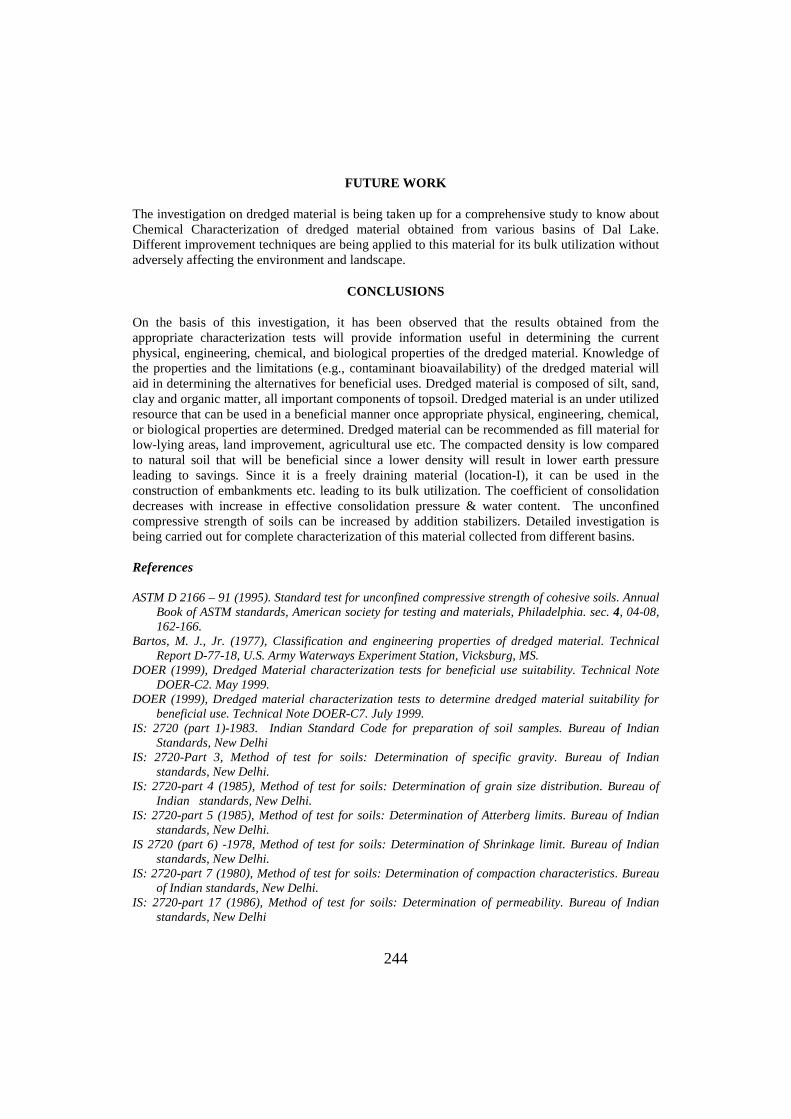
244
FUTURE WORK
The investigation on dredged material is being taken up for a comprehensive study to know about Chemical Characterization of dredged material obtained from various basins of Dal Lake. Different improvement techniques are being applied to this material for its bulk utilization without adversely affecting the environment and landscape.
CONCLUSIONS
On the basis of this investigation, it has been observed that the results obtained from the appropriate characterization tests will provide information useful in determining the current physical, engineering, chemical, and biological properties of the dredged material. Knowledge of the properties and the limitations (e.g., contaminant bioavailability) of the dredged material will aid in determining the alternatives for beneficial uses. Dredged material is composed of silt, sand, clay and organic matter, all important components of topsoil. Dredged material is an under utilized resource that can be used in a beneficial manner once appropriate physical, engineering, chemical, or biological properties are determined. Dredged material can be recommended as fill material for low-lying areas, land improvement, agricultural use etc. The compacted density is low compared to natural soil that will be beneficial since a lower density will result in lower earth pressure leading to savings. Since it is a freely draining material (location-I), it can be used in the construction of embankments etc. leading to its bulk utilization. The coefficient of consolidation decreases with increase in effective consolidation pressure & water content. The unconfined compressive strength of soils can be increased by addition stabilizers. Detailed investigation is being carried out for complete characterization of this material collected from different basins. References ASTM D 2166 – 91 (1995). Standard test for unconfined compressive strength of cohesive soils. Annual
Book of ASTM standards, American society for testing and materials, Philadelphia. sec. 4, 04-08, 162-166.
Bartos, M. J., Jr. (1977), Classification and engineering properties of dredged material. Technical Report D-77-18, U.S. Army Waterways Experiment Station, Vicksburg, MS.
DOER (1999), Dredged Material characterization tests for beneficial use suitability. Technical Note DOER-C2. May 1999.
DOER (1999), Dredged material characterization tests to determine dredged material suitability for beneficial use. Technical Note DOER-C7. July 1999.
IS: 2720 (part 1)-1983. Indian Standard Code for preparation of soil samples. Bureau of Indian Standards, New Delhi
IS: 2720-Part 3, Method of test for soils: Determination of specific gravity. Bureau of Indian standards, New Delhi.
IS: 2720-part 4 (1985), Method of test for soils: Determination of grain size distribution. Bureau of Indian standards, New Delhi.
IS: 2720-part 5 (1985), Method of test for soils: Determination of Atterberg limits. Bureau of Indian standards, New Delhi.
IS 2720 (part 6) -1978, Method of test for soils: Determination of Shrinkage limit. Bureau of Indian standards, New Delhi.
IS: 2720-part 7 (1980), Method of test for soils: Determination of compaction characteristics. Bureau of Indian standards, New Delhi.
IS: 2720-part 17 (1986), Method of test for soils: Determination of permeability. Bureau of Indian standards, New Delhi

245
IS: 2720-part 15 (1986), Method of test for soils: Determination of consolidation properties. Bureau of Indian standards, New Delhi.
IS: 2720-part 10 (1973), Method of test for soils: Determination of shear strength parameter by unconfined compression test. Bureau of Indian standards, New Delhi.
IS: 2720-part 39 (1977), , Method of test for soils: Determination of shear strength parameter by direct shear test. Bureau of Indian standards, New Delhi.
Sridharan, A., Murthy, N.S., and Prakash, K. (1987), Rectangular hyperbola method of consolidation analysis. Geotechnique, 37(3), 355-368
246
COMPARISION OF STABILIZATION OF SOIL BY ADDING ADDITIVES
Mahabir Dixit, Purabi Sen and Mukesh Ministry of Water Resources, Central Soil & Materials Research Station, New Delhi, India.
Abstract: Inadequate strength or inadequate deformation resistance is a problem of soil in many form of construction such as, buildings, airfields, tunnels, dams, roads, trafficked areas etc. and can lead to very serious economic loss, environmental hazards and great loss of human resources. In present study, effects of mixing of various locally available stabilizing agents like ordinary Portland cement, lime, fly ash in the clayey soil have been studied for variation in strength and plasticity behavior. It is well known that all these additives results in improvement/modification of strength and plasticity behaviour. The objective of the present study to assess relative improvement in strength and other properties with different additives so that economic viability of mixing additives in clayey soil could be assessed. Unconfined compression (UCC) strength and plasticity of the soil with and without additives after curing of specimens for 7 days and 21 days has been determined. Mineralogical behaviour of clayey samples with and without additives using XRD has also been studied. Keywords: UCC strength, plasticity, Additives, Pozzolanic materials, Clay mineralogy.
INTRODUCTION
A number of stabilization methods are available by which the durability, strength or deformation resistance of a soil may be increased. Lime, cement, fly ash and other chemical admixtures are being used to modify the properties of soil since ancient times. In present study, the stabilization of soil has been done by ordinary Portland cement (43 grades), lime and fly ash. Fly ash has been used as stabilizer considering its construction potential as a pozzolanic material as well as from the waste management and ecological balance point of view.
MATERIAL USED
• Soil Clayey soil from Punatsangchchu-I Project, Bhutan was selected for the investigations. The
geotechnical properties of the soil are given in Table 1.
METHODOLOGY
• Binding Materials Ordinary Portland Cement (OPC) of 43 grade, Lime and Fly ash were used as soil stabilizers.
These were procured from nearby locality/market.
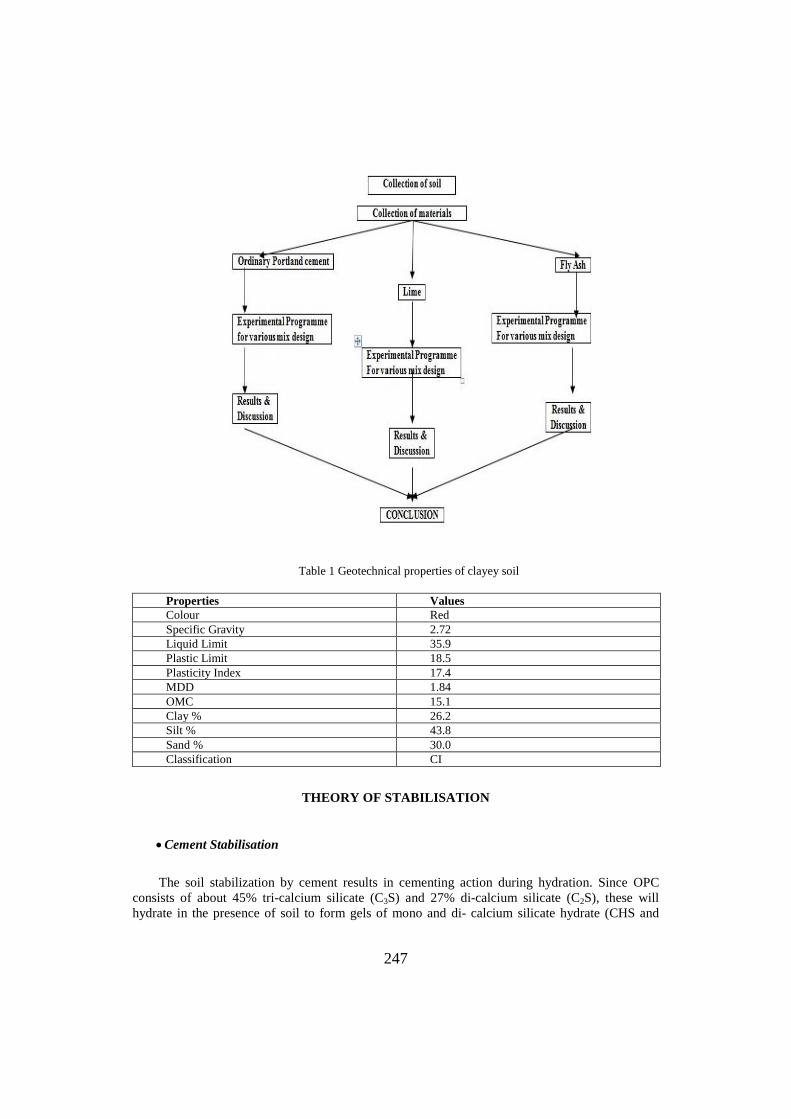
247
Table 1 Geotechnical properties of clayey soil
Properties Values Colour Red Specific Gravity 2.72 Liquid Limit 35.9 Plastic Limit 18.5 Plasticity Index 17.4 MDD 1.84 OMC 15.1 Clay % 26.2 Silt % 43.8 Sand % 30.0 Classification CI
THEORY OF STABILISATION
• Cement Stabilisation
The soil stabilization by cement results in cementing action during hydration. Since OPC consists of about 45% tri-calcium silicate (C3S) and 27% di-calcium silicate (C2S), these will hydrate in the presence of soil to form gels of mono and di- calcium silicate hydrate (CHS and
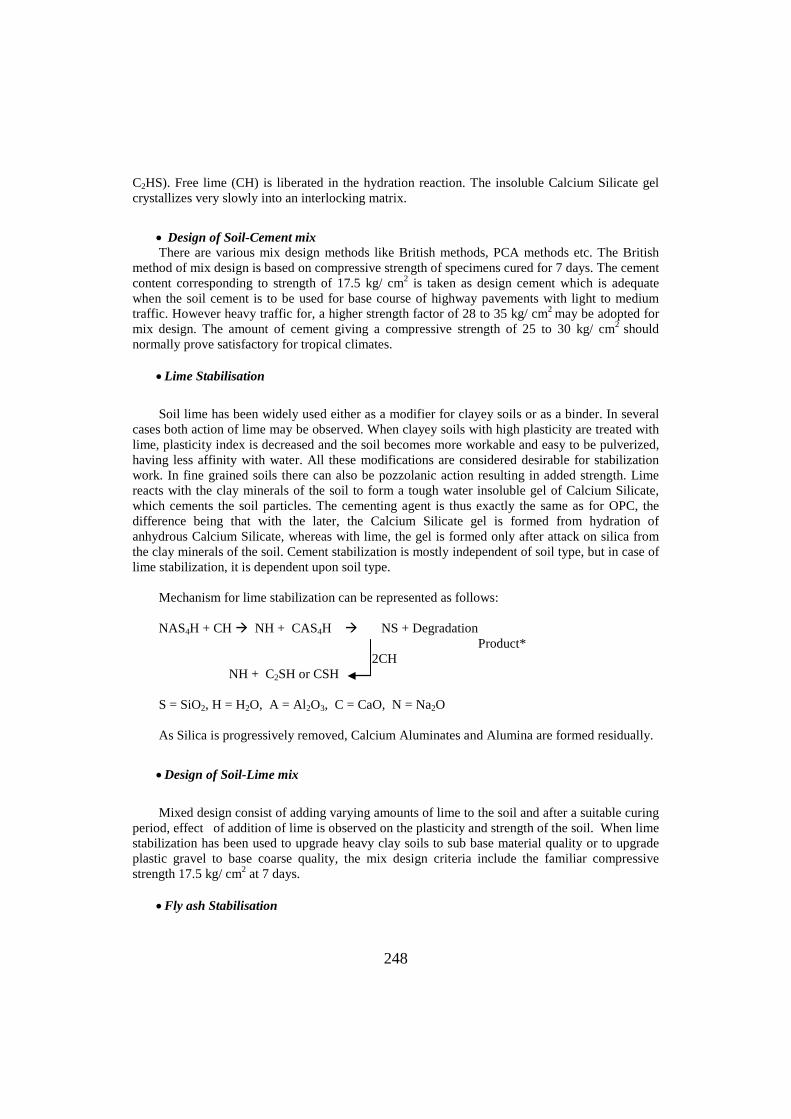
248
C2HS). Free lime (CH) is liberated in the hydration reaction. The insoluble Calcium Silicate gel crystallizes very slowly into an interlocking matrix.
• Design of Soil-Cement mix There are various mix design methods like British methods, PCA methods etc. The British
method of mix design is based on compressive strength of specimens cured for 7 days. The cement content corresponding to strength of 17.5 kg/ cm2 is taken as design cement which is adequate when the soil cement is to be used for base course of highway pavements with light to medium traffic. However heavy traffic for, a higher strength factor of 28 to 35 kg/ cm2 may be adopted for mix design. The amount of cement giving a compressive strength of 25 to 30 kg/ cm2 should normally prove satisfactory for tropical climates.
• Lime Stabilisation
Soil lime has been widely used either as a modifier for clayey soils or as a binder. In several cases both action of lime may be observed. When clayey soils with high plasticity are treated with lime, plasticity index is decreased and the soil becomes more workable and easy to be pulverized, having less affinity with water. All these modifications are considered desirable for stabilization work. In fine grained soils there can also be pozzolanic action resulting in added strength. Lime reacts with the clay minerals of the soil to form a tough water insoluble gel of Calcium Silicate, which cements the soil particles. The cementing agent is thus exactly the same as for OPC, the difference being that with the later, the Calcium Silicate gel is formed from hydration of anhydrous Calcium Silicate, whereas with lime, the gel is formed only after attack on silica from the clay minerals of the soil. Cement stabilization is mostly independent of soil type, but in case of lime stabilization, it is dependent upon soil type.
Mechanism for lime stabilization can be represented as follows: NAS4H + CH NH + CAS4H NS + Degradation Product* 2CH NH + C2SH or CSH S = SiO2, H = H2O, A = Al2O3, C = CaO, N = Na2O As Silica is progressively removed, Calcium Aluminates and Alumina are formed residually.
• Design of Soil-Lime mix
Mixed design consist of adding varying amounts of lime to the soil and after a suitable curing period, effect of addition of lime is observed on the plasticity and strength of the soil. When lime stabilization has been used to upgrade heavy clay soils to sub base material quality or to upgrade plastic gravel to base coarse quality, the mix design criteria include the familiar compressive strength 17.5 kg/ cm2 at 7 days.
• Fly ash Stabilisation
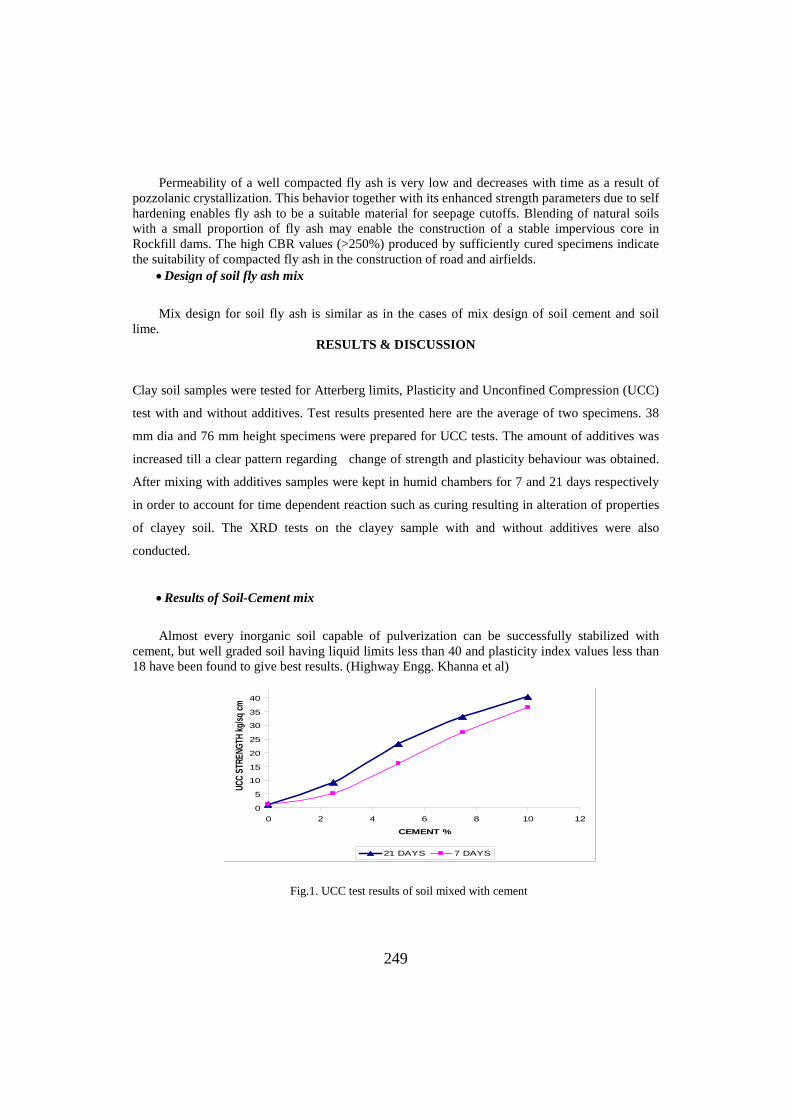
249
Permeability of a well compacted fly ash is very low and decreases with time as a result of pozzolanic crystallization. This behavior together with its enhanced strength parameters due to self hardening enables fly ash to be a suitable material for seepage cutoffs. Blending of natural soils with a small proportion of fly ash may enable the construction of a stable impervious core in Rockfill dams. The high CBR values (>250%) produced by sufficiently cured specimens indicate the suitability of compacted fly ash in the construction of road and airfields.
• Design of soil fly ash mix
Mix design for soil fly ash is similar as in the cases of mix design of soil cement and soil lime.
RESULTS & DISCUSSION
Clay soil samples were tested for Atterberg limits, Plasticity and Unconfined Compression (UCC)
test with and without additives. Test results presented here are the average of two specimens. 38
mm dia and 76 mm height specimens were prepared for UCC tests. The amount of additives was
increased till a clear pattern regarding change of strength and plasticity behaviour was obtained.
After mixing with additives samples were kept in humid chambers for 7 and 21 days respectively
in order to account for time dependent reaction such as curing resulting in alteration of properties
of clayey soil. The XRD tests on the clayey sample with and without additives were also
conducted.
• Results of Soil-Cement mix
Almost every inorganic soil capable of pulverization can be successfully stabilized with cement, but well graded soil having liquid limits less than 40 and plasticity index values less than 18 have been found to give best results. (Highway Engg. Khanna et al)
Fig.1. UCC test results of soil mixed with cement
UCC STRENGTH Vs CEMENT %
0
5
10
15
20
25
30
35
40
45
0 2 4 6 8 10 12
CEMENT %
UCC
STRE
NGTH
kg/sq
cm
21 DAYS 7 DAYS
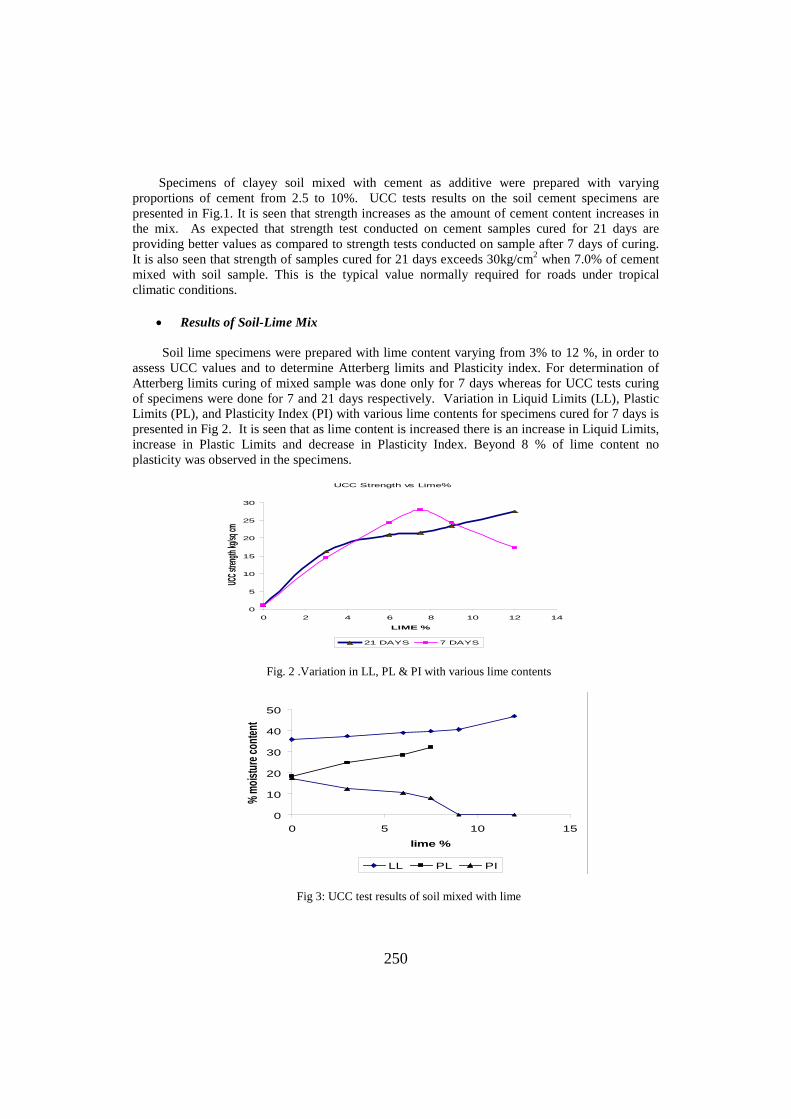
250
Specimens of clayey soil mixed with cement as additive were prepared with varying proportions of cement from 2.5 to 10%. UCC tests results on the soil cement specimens are presented in Fig.1. It is seen that strength increases as the amount of cement content increases in the mix. As expected that strength test conducted on cement samples cured for 21 days are providing better values as compared to strength tests conducted on sample after 7 days of curing. It is also seen that strength of samples cured for 21 days exceeds 30kg/cm2 when 7.0% of cement mixed with soil sample. This is the typical value normally required for roads under tropical climatic conditions.
• Results of Soil-Lime Mix Soil lime specimens were prepared with lime content varying from 3% to 12 %, in order to
assess UCC values and to determine Atterberg limits and Plasticity index. For determination of Atterberg limits curing of mixed sample was done only for 7 days whereas for UCC tests curing of specimens were done for 7 and 21 days respectively. Variation in Liquid Limits (LL), Plastic Limits (PL), and Plasticity Index (PI) with various lime contents for specimens cured for 7 days is presented in Fig 2. It is seen that as lime content is increased there is an increase in Liquid Limits, increase in Plastic Limits and decrease in Plasticity Index. Beyond 8 % of lime content no plasticity was observed in the specimens.
Fig. 2 .Variation in LL, PL & PI with various lime contents
Fig 3: UCC test results of soil mixed with lime
Variation in LL, PL and PI with lime %
0
10
20
30
40
50
0 5 10 15
lime %
% mo
isture
conte
nt
LL PL PI
UCC Strength vs Lime%
0
5
10
15
20
25
30
0 2 4 6 8 10 12 14
LIME %
UCC s
trength
kg/sq
cm
21 DAYS 7 DAYS
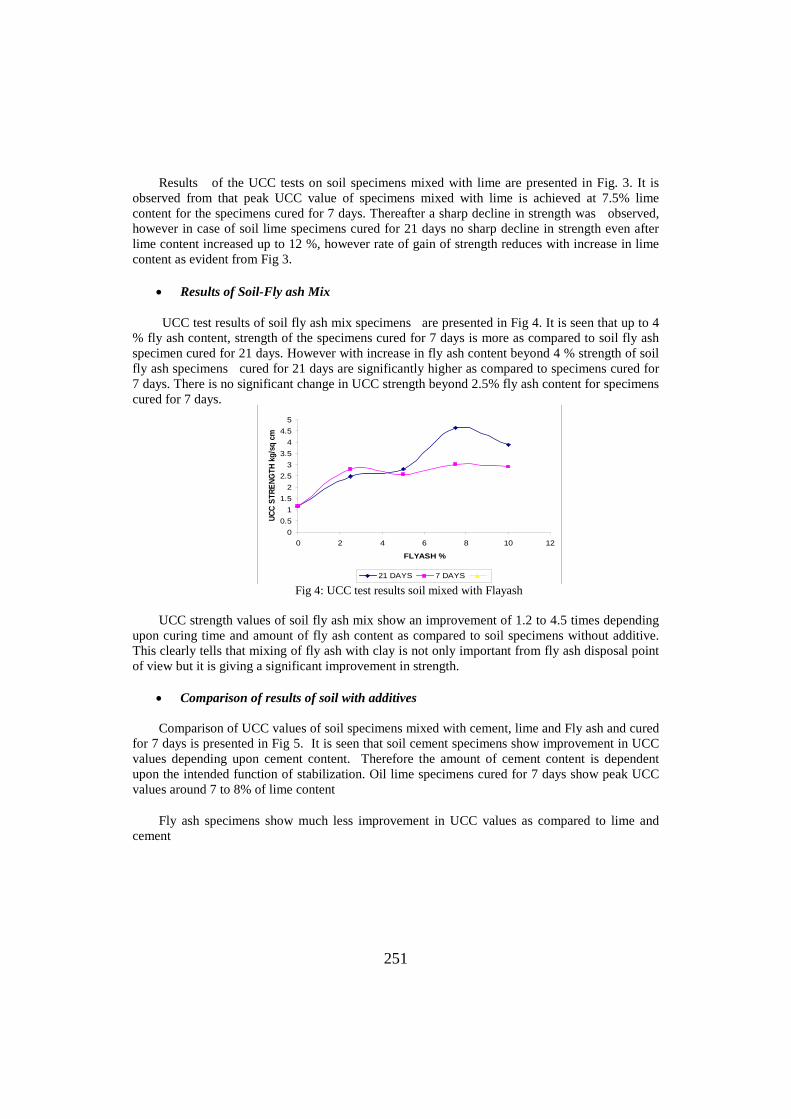
251
Results of the UCC tests on soil specimens mixed with lime are presented in Fig. 3. It is observed from that peak UCC value of specimens mixed with lime is achieved at 7.5% lime content for the specimens cured for 7 days. Thereafter a sharp decline in strength was observed, however in case of soil lime specimens cured for 21 days no sharp decline in strength even after lime content increased up to 12 %, however rate of gain of strength reduces with increase in lime content as evident from Fig 3.
• Results of Soil-Fly ash Mix
UCC test results of soil fly ash mix specimens are presented in Fig 4. It is seen that up to 4 % fly ash content, strength of the specimens cured for 7 days is more as compared to soil fly ash specimen cured for 21 days. However with increase in fly ash content beyond 4 % strength of soil fly ash specimens cured for 21 days are significantly higher as compared to specimens cured for 7 days. There is no significant change in UCC strength beyond 2.5% fly ash content for specimens cured for 7 days.
Fig 4: UCC test results soil mixed with Flayash
UCC strength values of soil fly ash mix show an improvement of 1.2 to 4.5 times depending
upon curing time and amount of fly ash content as compared to soil specimens without additive. This clearly tells that mixing of fly ash with clay is not only important from fly ash disposal point of view but it is giving a significant improvement in strength.
• Comparison of results of soil with additives Comparison of UCC values of soil specimens mixed with cement, lime and Fly ash and cured
for 7 days is presented in Fig 5. It is seen that soil cement specimens show improvement in UCC values depending upon cement content. Therefore the amount of cement content is dependent upon the intended function of stabilization. Oil lime specimens cured for 7 days show peak UCC values around 7 to 8% of lime content
Fly ash specimens show much less improvement in UCC values as compared to lime and cement
UCC STRENGTH Vs FLYASH %
00.5
11.5
22.5
33.5
44.5
5
0 2 4 6 8 10 12
FLYASH %
UCC
STRE
NGTH
kg/
sq c
m
21 DAYS 7 DAYS
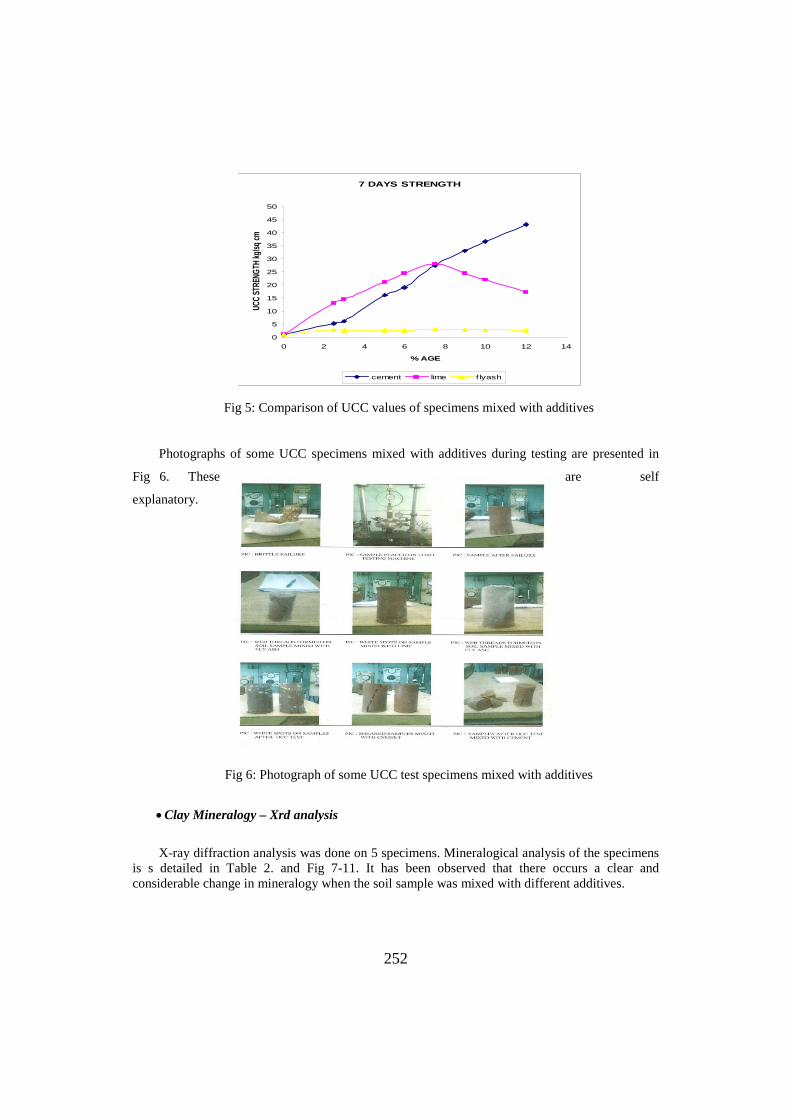
252
Fig 5: Comparison of UCC values of specimens mixed with additives
Photographs of some UCC specimens mixed with additives during testing are presented in
Fig 6. These are self
explanatory.
Fig 6: Photograph of some UCC test specimens mixed with additives
• Clay Mineralogy – Xrd analysis
X-ray diffraction analysis was done on 5 specimens. Mineralogical analysis of the specimens is s detailed in Table 2. and Fig 7-11. It has been observed that there occurs a clear and considerable change in mineralogy when the soil sample was mixed with different additives.
7 DAYS STRENGTH
0
5
10
15
20
25
30
35
40
45
50
0 2 4 6 8 10 12 14
% AGE
UCC S
TREN
GTH k
g/sq c
m
cement lime flyash
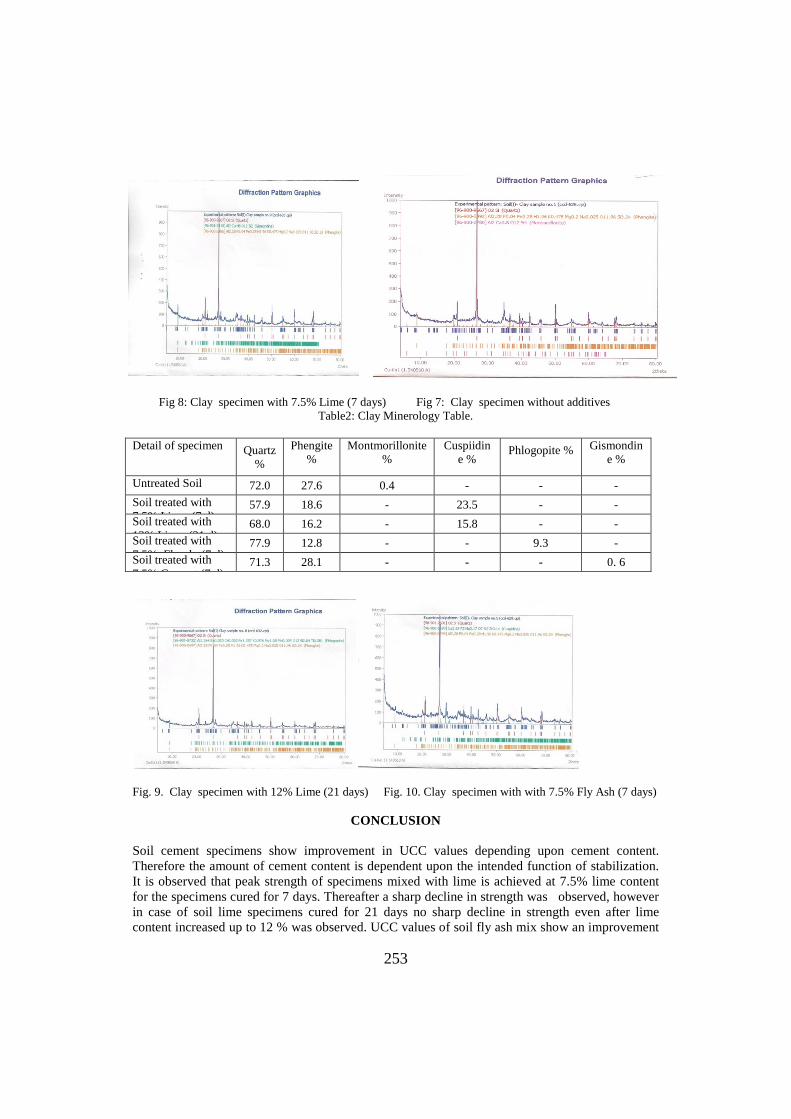
253
Fig 8: Clay specimen with 7.5% Lime (7 days) Fig 7: Clay specimen without additives
Table2: Clay Minerology Table.
Detail of specimen Quartz %
Phengite %
Montmorillonite %
Cuspiidine %
Phlogopite %
Gismondine %
Untreated Soil 72.0 27.6 0.4 - - - Soil treated with 7.5% Lime (7 d)
57.9 18.6 - 23.5 - - Soil treated with 12% Lime (21 d)
68.0 16.2 - 15.8 - - Soil treated with 7.5% Flyash (7 d)
77.9 12.8 - - 9.3 - Soil treated with 7.5% Cement (7 d)
71.3 28.1 - - - 0. 6
Fig. 9. Clay specimen with 12% Lime (21 days) Fig. 10. Clay specimen with with 7.5% Fly Ash (7 days)
CONCLUSION
Soil cement specimens show improvement in UCC values depending upon cement content. Therefore the amount of cement content is dependent upon the intended function of stabilization. It is observed that peak strength of specimens mixed with lime is achieved at 7.5% lime content for the specimens cured for 7 days. Thereafter a sharp decline in strength was observed, however in case of soil lime specimens cured for 21 days no sharp decline in strength even after lime content increased up to 12 % was observed. UCC values of soil fly ash mix show an improvement
254
of 1.2 to 4.5 times depending upon curing time and amount of fly ash content as compared to soil specimens without additive. This clearly tells that mixing of fly ash with clay is not only important from fly ash disposal point of view but it is giving a significant improvement in strength. Fly ash specimens show much less improvement in UCC values as compared to lime and cement. It is also known that most serious problem encountered in soil cement work is subsequent cracking. On the contrary, lime often causes rapid changes in plasticity which leads to drying out of soil which has an added benefit in handling and enhancing workability of soil. So for stabilization of clayey soils, it is desirable to use a mixture of lime and cement or pretreatment of soil with lime before use of cement or use of lime only if possible. References
B C Punmia & A K Jain “Soil Mechanics & Foundations” published by Laxmi Publications (P) Ltd, New Delhi.
Hillary I Inyang & K L Bergeron “Utilization of Waste Materials in Civil Engineering Construction”.
J M Kate, Proceedings, Vol-I, Contributory papers of IGC-2009, titled “Geotechniques in Infrastructure Development”.
O G Ingles & J P Metcalf “Soil Stabilization” Principles & Practice. Phani Kumar, B.R. and Sharma R.S. (2004). “Effect of Fly Ash on Engineering Properties of
Expensive Soils”, Journal of Geotechnical & Geoenvironmental Engineering, VOL. 130, pp. 764-767. S K Khanna & C E G Justo “Highway Engineering” published by Nem Chand & Bros; Roorkee.
AUTHOR INDEX
A Ashwani Jain, 57
Alok Rajan, 120
Archana M.R, 123
Aditya Kumar Anupam, 178
Ashutosh Trivedi, 196
A K Choudary, 206
Ajay Goyal, 227
B B. Janaki Ramaiah, 15
B. Munwar Basha, 15
B. Sultana, 34
B S Walia, 80
B A Mir, 235
C C. S. Gokhale, 25
D Dipika Devi, 139
Deepak Mittal, 191
G G. V. Ramana, 15
Gurdeep Singh, 43
Gurdeepak Singh, 80
J J N Jha, 206
K KS Bedi, 145
K.S.Gupta, 161
Kiranmaye Dasai, 170
K S Gill, 206
L Lakshmikanthan P, 6
Leena Garg, 88
M Manoj Dutta (Key Note Speaker)
Manpreet Kaur, 80
Mahadev P Anawkar, 161
Madhav Madhira, 170
M. Panda, 184
M.Muthukumar, 191
Manpreet Singh, 221
M.Y. Shah, 235
Mahabir Dixit, 246
Mukesh, 246
N Nitish Puri, 57
N. Monika Chanu, 214
P P. Y. Sarang, 25
P. P. Savoikar, 25
Parampreet Kaur, 43
Puneet Pal Singh Cheema, 88
Pradyut Kumar Muduli, 94
P. K. Sharma, 101
Parveen Jangra, 153
Praveen Kumar, 178
P. Padhy, 184
Prashant Garg, 221
Purabi Sen, 246
R RP Pathak, 49
R.K.Swami, 120
R, Gundappa K, 123
Ranjodh Singh, 145
Ransinchung R.N., 178
Rajiv Goel, 196
Raju Bansal, 206
S Sivakumar Babu G.L, 6
S. P. Singh, 34
Sanjeev Bajaj, 49
Swagatika Senapati, 94
Sarat Kumar Das, 94,114
Sujata Priyadarshini, 114
AUTHOR INDEX
Shovan Roy, 139
Sachin Dass, 153
Sameeuddin Sheikh, 161
Shivam Gupta, 191
S. Satyakumar Singh, 214
T Tufel Ahmed, 15
T. Sivaramakrishna Sharma, 114
Th. Kiranbala Devi, 214
T. Bishworjit Singh, 214
U U. Chattaraj, 184
V Vaishali Sahu, 1
V. Gayathri, 2
Vikramjit Singh, 43
V. M. Karpe, 68
V.A. Sawant, 101
Vijay Devar, 123
Z Zubair Khan, 101